MGIC INVESTMENT CORP
10-Ks and 10-Qs
|
|
|
|
|
|
|
|
|
|
|
|
|
|
|
|
|
|
|
|
|
|
|
|
|
|
|
|
|
|
|
|
|
|
|
|
|
|
|
|
|
|
|
|
|
|
|
|
|
|
UNITED STATES
SECURITIES AND EXCHANGE COMMISSION
WASHINGTON, D.C. 20549
FORM 10-K
☒
ANNUAL REPORT PURSUANT TO SECTION 13 OR 15(d) OF THE
SECURITIES EXCHANGE ACT OF 1934
For the fiscal year ended
December 31, 2016
OR
☐ TRANSITION REPORT PURSUANT TO SECTION 13 OR 15(d) OF THE
SECURITIES EXCHANGE ACT OF 1934
For the transition period from ____ to ____
Commission file number
1-10816
MGIC INVESTMENT CORPORATION
(Exact name of registrant as specified in its charter)
|
WISCONSIN
|
39-1486475
|
|
|
(State or other jurisdiction of incorporation or organization)
|
(I.R.S. Employer Identification No.)
|
|
|
MGIC PLAZA, 250 EAST KILBOURN AVENUE,
|
||
|
MILWAUKEE, WISCONSIN
|
53202
|
|
|
(Address of principal executive offices)
|
(Zip Code)
|
|
(414) 347-6480
(Registrant’s telephone number, including area code)
Securities Registered Pursuant to Section 12(b) of the Act:
|
Title of Each Class:
|
Common Stock, Par Value $1 Per Share
|
|
|
Common Share Purchase Rights
|
||
|
Name of Each Exchange on Which
|
||
|
Registered:
|
New York Stock Exchange
|
|
Securities Registered Pursuant to Section 12(g) of the Act:
|
Title of Class:
|
None
|
|
Indicate by check mark if the registrant is a well-known seasoned issuer, as defined in Rule 405 of the Securities Act.
☒Yes ☐No
Indicate by check mark if the registrant is not required to file reports pursuant to Section 13 or Section 15(d) of the Act.
☐ Yes ☒ No
Indicate by check mark whether the Registrant (1) has filed all reports required to be filed by Section 13 or 15(d) of the Securities Exchange Act of 1934 during the preceding 12 months (or for such shorter period that the Registrant was required to file such reports), and (2) has been subject to such filing requirements for the past 90 days. ☒Yes ☐ No
Indicate by check mark whether the registrant has submitted electronically and posted on its corporate Web site, if any, every Interactive Data File required to be submitted and posted pursuant to Rule 405 of Regulation S-T during the preceding 12 months (or for such shorter period that the registrant was required to submit and post such files).☒Yes ☐ No
Indicate by check mark if disclosure of delinquent filers pursuant to Item 405 of Regulation S-K is not contained herein, and will not be contained, to the best of Registrant’s knowledge, in definitive proxy or information statements incorporated by reference in Part III of this Form 10-K or any amendment to this Form 10-K. ☒
Indicate by check mark whether the registrant is a large accelerated filer, an accelerated filer, a non-accelerated filer, or a smaller reporting company. See the definitions of “large accelerated filer,” “accelerated filer” and “smaller reporting company” in Rule 12b-2 of the Exchange Act. (Check one):
|
Large accelerated filer ☒
|
Accelerated filer ☐
|
|
Non-accelerated filer ☐
|
Smaller reporting company ☐
|
Indicate by check mark whether the registrant is a shell company (as defined in Rule 12b-2 of the Act).
☐ Yes ☒No
State the aggregate market value of the voting common stock held by non-affiliates of the Registrant as of June 30, 2016: Approximately $2.0 billion*
* Solely for purposes of computing such value and without thereby admitting that such persons are affiliates of the Registrant, shares held by directors and executive officers of the Registrant are deemed to be held by affiliates of the Registrant. Shares held are those shares beneficially owned for purposes of Rule 13d-3 under the Securities Exchange Act of 1934 but excluding shares subject to stock options.
Indicate the number of shares outstanding of each of the Registrant’s classes of common stock as of February 15, 2017: 340,990,121
The following documents have been incorporated by reference in this Form 10-K, as indicated:
|
Document
|
Part and Item Number of Form 10-K Into Which Incorporated*
|
|
|
Proxy Statement for the 2017 Annual Meeting of Shareholders, provided such Proxy Statement is filed within 120 days after December 31, 2016. If not so filed, the information provided in Items 10 through 14 of Part III will be included in an amended Form 10-K filed within such 120 day period.
|
Items 10 through 14 of Part III
|
|
* In each case, to the extent provided in the Items listed.
|
TABLE OF CONTENTS
|
|||
|
Page No.
|
|||
|
PART I
|
|||
|
Item 1.
|
|||
|
Item 1A.
|
|||
|
Item 1B.
|
|||
|
Item 2.
|
|||
|
Item 3.
|
|||
|
Item 4.
|
|||
|
PART II
|
|||
|
Item 5.
|
|||
|
Item 6.
|
|||
|
Item 7.
|
|||
|
Item 7A.
|
|||
|
Item 8.
|
|||
|
Item 9.
|
|||
|
Item 9A.
|
|||
|
Item 9B.
|
|||
|
PART III
|
|||
|
Item 10.
|
|||
|
Item 11.
|
|||
|
Item 12.
|
|||
|
Item 13.
|
|||
|
Item 14.
|
|||
|
PART IV
|
|||
|
Item 15.
|
|||
|
Item 16.
|
|||
3
|
MGIC Investment Corporation 2016 Form 10-K
GLOSSARY OF TERMS AND ACRONYMS
/ A
ARMs
Adjustable rate mortgages
ABS
Asset-backed securities
ASC
Accounting Standards Codification
Available Assets
Assets, as designated under the PMIERs, that are readily available to pay claims, and include the most liquid investments
/ B
Book or book year
A group of loans insured in a particular calendar year
BPMI
Borrower-paid mortgage insurance
/ C
CECL
Current expected credit losses
CFPB
Consumer Financial Protection Bureau
CLO
Collateralized loan obligations
CMBS
Commercial mortgage-backed securities
/ D
DAC
Deferred insurance policy acquisition costs
/ E
ETFs
Exchange traded funds
Expense ratio
The ratio, expressed as a percentage, of the underwriting and operating expenses, net and amortization of DAC of our combined insurance operations (which excludes underwriting and operating expenses of our non-insurance operations) to NPW
/ F
Fannie Mae
Federal National Mortgage Association
FCRA
Fair Credit Reporting Act
FHA
Federal Housing Administration
FHFA
Federal Housing Finance Agency
FHLB
Federal Home Loan Bank of Chicago, of which MGIC is a member
FICO score
A measure of consumer credit risk provided by credit bureaus, typically produced from statistical models by Fair Isaac Corporation utilizing data collected by the credit bureaus
FOMC
Federal Open Market Committee
Freddie Mac
Federal Home Loan Mortgage Corporation
/ G
GAAP
Generally Accepted Accounting Principles in the United States
GSEs
Collectively, Fannie Mae and Freddie Mac
/ H
HAMP
Home Affordable Modification Program
MGIC Investment Corporation 2016 Form 10-K
|
4
|
Glossary of terms and acronyms
|
|||||
HARP
Home Affordable Refinance Program
HOPA
Homeowners Protection Act
/ I
IBNR
Losses incurred but not reported
IIF
Insurance in force, which for loans insured by us, is equal to the unpaid principal balance, as reported to us
/ J
JCT
Joint Committee on Taxation
/ L
LAE
Loss adjustment expenses
Legacy book
Mortgage insurance policies written prior to 2009
Loan-to-value ("LTV") ratio
The ratio, expressed as a percentage, of the dollar amount of the first mortgage loan to the value of the property at the time the loan became insured and does not reflect subsequent housing price appreciation or depreciation. Subordinate mortgages may also be present.
5.375% Notes
5.375% Senior Notes due on November 2, 2015, with interest payable semi-annually on May 1 and November 1 of each year.
5% Notes
5% Convertible Senior Notes due May 1, 2017, with interest payable semi-annually on May 1 and November 1 of each year
2% Notes
2% Convertible Senior Notes due on April 1, 2020, with interest payable semi-annually on April 1 and October 1 of each year
5.75% Notes
5.75% Senior Notes due on August 15, 2023, with interest payable semi-annually on February 15 and August 15 of each year
9% Debentures
9% Convertible Junior Subordinated Debentures due on April 1, 2063, with interest payable semi-annually on April 1 and October 1 of each year
FHLB Advance or the Advance
1.91% Fixed rate advance from the FHLB due on February 10, 2023, with interest payable monthly
Loss ratio
The ratio, expressed as a percentage, of the sum of incurred losses and loss adjustment expenses to NPE
Low down payment loans or mortgages
Loans with less than 20% down payments
LPMI
Lender-paid mortgage insurance
/ M
MBA
Mortgage Bankers Association
MBS
Mortgage-backed securities
MD&A
Management's discussion and analysis
MGIC
Mortgage Guaranty Insurance Corporation, a subsidiary of MGIC Investment Corporation
MIC
MGIC Indemnity Corporation
Minimum Required Assets
The greater of $400 million or the total of the minimum amount of Available Assets that must be held under the PMIERs based upon a percentage of RIF weighted by certain risk attributes
MPP
Minimum Policyholder Position, as required under certain state requirements. The “policyholder position” of a mortgage insurer is its net worth or surplus, contingency reserve and a portion of the reserves for unearned premiums
5
|
MGIC Investment Corporation 2016 Form 10-K
/ N
N/A
Not applicable for the period presented
NAIC
The National Association of Insurance Commissioners
NIW
New Insurance Written
N/M
Data, or calculation, deemed not meaningful for the period presented
NPE
The amount of premiums earned, net of premiums assumed and ceded under reinsurance agreements
NPL
Non-performing loan, which is a delinquent loan, at any stage in its delinquency
NPW
The amount of premiums written, net of premiums assumed and ceded under reinsurance agreements
/ O
OCI
Office of the Commissioner of Insurance of the State of Wisconsin
/ P
Persistency
The percentage of our insurance remaining in force from one year prior
PMI
Private Mortgage Insurance (as an industry or product type)
PMIERs
Private Mortgage Insurer Eligibility Requirements issued by the GSEs
Premium Yield
The ratio of NPE divided by the average IIF outstanding for the period measured
/ Q
QSR Transaction
Quota share reinsurance transaction
/ R
REMIC
Real Estate Mortgage Investment Conduit
RESPA
Real Estate Settlement Procedures Act
RIF
Risk in force, which for an individual loan insured by us, is equal to the unpaid loan principal balance, as reported to us, multiplied by the insurance coverage percentage. RIF is sometimes referred to as exposure
Risk-to-capital
Under certain state regulations, the ratio of RIF,
net of reinsurance and exposure on policies currently in default and for which loss reserves have been established,
to the level of statutory capital
RMBS
Residential mortgage-backed securities
/ S
SAP
Statutory accounting practices
/ U
Underwriting Expense Ratio
The ratio, expressed as a percentage, of the underwriting and operating expenses, net and amortization of DAC of our combined insurance operations (which excludes underwriting and operating expenses of our non-insurance subsidiaries) to NPW
Underwriting profit
NPE minus incurred losses
USDA
U.S. Department of Agriculture
/ V
VA
U.S. Department of Veterans Affairs
MGIC Investment Corporation 2016 Form 10-K
|
6
Item 1.
Business.
See the
"Glossary of terms and acronyms"
for definitions and descriptions of terms used throughout this annual report.
A. General
We are a holding company and through wholly-owned subsidiaries we provide private mortgage insurance and ancillary services. In 2016, our net premiums written were $1.0 billion and our primary NIW was $47.9 billion. As of December 31, 2016, our primary IIF was $182.0 billion and our direct primary RIF was $47.2 billion. For further information about our results of operations, see our consolidated financial statements in Item 8. As of December 31, 2016, our principal mortgage insurance subsidiary, MGIC, was licensed in all 50 states of the United States, the District of Columbia, Puerto Rico and Guam. During 2016, we wrote new insurance in each of those jurisdictions.
Business Strategies
Our 2017 business strategies are to 1) prudently grow IIF, 2) pursue new business opportunities that leverage our core competencies, 3) preserve and expand our role and that of the PMI industry in housing finance policy, 4) manage and deploy capital to optimize creation of shareholder value and 5) develop and diversify the talents of our co-workers.
Following are several of the accomplishments we achieved in 2016 that furthered our 2016 business strategies.
|
•
|
Increased NIW from $43.0 billion in 2015 to $47.9 billion in 2016 and increased IIF by more than 4% year-over-year. The NIW is consistent with the Company's risk and return goals.
|
|
•
|
Re-established the payment of dividends by MGIC to our holding company.
|
|
•
|
Continued to meet the financial requirements of the PMIERs with a comfortable cushion.
|
|
•
|
Maintained our traditionally low expense base.
|
|
•
|
MGIC upgraded to an investment grade rating by Moody's and Standards and Poor's.
|
|
•
|
Re-entered the senior debt markets for the first time in 10 years, issuing senior notes and using a portion of the proceeds to repurchase convertible notes.
|
|
•
|
Eliminated approximately 66 million potentially dilutive shares through the convertible notes repurchases listed above and other transactions during the year.
|
|
•
|
Negotiated a reinsurance agreement on 2017 NIW.
|
|
•
|
Continued to enhance the Company’s reputation as a key contributor to housing policy discussions.
|
|
•
|
Made significant contributions to the advancement of the NAIC Model Act.
|
Overview of the Private Mortgage Insurance Industry and its Operating Environment
We established the PMI industry in 1957 to provide a private market alternative to federal government insurance programs. PMI covers losses from homeowner defaults on residential mortgage loans, reducing, and in some instances eliminating, the loss to the insured institution.
Fannie Mae and Freddie Mac have been the major purchasers of the mortgage loans underlying new insurance written by private mortgage insurers. The GSEs purchase residential mortgages as part of their governmental mandate to provide liquidity in the secondary mortgage market. The GSEs cannot buy low down payment mortgage loans without certain forms of credit enhancement, the primary form of which is PMI. Therefore, PMI facilitates the sale of low down payment mortgages in the secondary mortgage market to the GSEs and plays an important role in the housing finance system by assisting consumers, especially first-time and lower net-worth homebuyers, to finance homes with low down payment mortgages. PMI also reduces the regulatory capital that depository institutions are required to hold against certain low down payment mortgages that they hold as assets.
Because the GSEs have been the major purchasers of the mortgages underlying new insurance written by private mortgage insurers, the PMI industry in the U.S. is defined in large part by the requirements and practices of the GSEs. These requirements and practices, as well as those of the federal regulators that oversee the GSEs and lenders, impact the operating results and financial performance of private mortgage insurers. In 2008, the federal government took control of the GSEs through a conservatorship process. The
7
|
MGIC Investment Corporation 2016 Form 10-K
FHFA is the conservator of the GSEs and has the authority to control and direct their operations. In the past, members of Congress have introduced several bills intended to change the business practices of the GSEs and the FHA, however, no legislation has been enacted. The new Presidential administration has indicated that the conservatorship of the GSEs should end; however, it is unclear whether and when that would occur and how that would impact us. As a result of the matters referred to above, it is uncertain what role the GSEs, FHA and private capital, including private mortgage insurance, will play in the domestic residential housing finance system in the future or the impact of any such changes on our business. In addition, the timing of the impact of any resulting changes on our business is uncertain. Most meaningful changes would require Congressional action to implement and it is difficult to estimate when Congressional action would be final and how long any associated phase-in period may last. See our risk factor titled “Changes in the business practices of the GSEs, federal legislation that changes their charters or a restructuring of the GSEs could reduce our revenues or increase our losses” in
Item 1A
.
The GSEs have private mortgage insurer eligibility requirements, or PMIERs, for private mortgage insurers that insure loans delivered to the GSEs. The GSEs each revised their PMIERs effective December 31, 2015. The financial requirements of the PMIERs require a mortgage insurer’s Available Assets to equal or exceed its Minimum Required Assets. While on an overall basis, the amount of Available Assets MGIC must hold in order to continue to insure GSE loans increased under the revised PMIERs over what state regulation currently requires, our reinsurance transaction mitigates the negative effect of the PMIERs on our returns. See "Regulation – Direct Regulation" below for information about our compliance with the financial requirements of the PMIERs.
The private mortgage insurance industry is greatly impacted by macroeconomic conditions that affect home loan originations and credit performance of home loans, including unemployment rates, housing prices, restrictions on mortgage credit due to underwriting standards, interest rates, the deductibility of mortgage interest or mortgage insurance premiums for income tax purposes, household formations and homeownership rates. The financial crisis and the downturn in the housing market that began in 2007 had a significant negative impact on the industry and our company. During the last several years preceding the financial crisis, the mortgage lending industry increasingly made home loans to individuals with higher risk credit profiles, at higher LTV ratios, and based on less documentation and verification of information regarding the borrower. Beginning in 2007, job creation slowed and the housing markets began slowing in certain areas, with declines in certain other areas. In 2008 and 2009,
employment in the U.S. decreased substantially and nearly all geographic areas in the U.S. experienced home price declines. Together, these conditions resulted in significant adverse developments for us and our industry and we reported a net loss in each of 2007 through 2013. The operating environment for private mortgage insurers has been improving in recent years as the economy has been recovering. For 2016, we reported net income of $342.5 million.
During 2016, $270 billion of mortgages were insured with primary coverage by private mortgage insurers, compared to $220 billion in 2015 and $178 billion in 2014. These figures include $2 billion, $4 billion and $8 billion of refinance transactions that were originated under HARP in 2016, 2015 and 2014, respectively. We do not include HARP transactions in our NIW total because we consider them a modification of the coverage on existing IIF. The volume of mortgages insured by private mortgage insurers increased in 2016 compared to 2015, as both purchase mortgage originations and refinance transactions increased. Although the 2016 volume was significantly greater than the recent low in 2010 of $70 billion, it remains significantly below the volumes of 2001 through 2007 when, on average, approximately $311 billion of mortgages were insured with primary coverage by private mortgage insurers.
For most of our business, we and other private mortgage insurers compete directly with federal and state governmental and quasi-governmental agencies that sponsor government-backed mortgage insurance programs, principally the FHA and the VA. The publication
Inside Mortgage Finance
estimates that in 2016, the FHA accounted for 36.4% of low down payment residential mortgages that were subject to FHA, VA or primary private mortgage insurance, down from 40.4% in 2015. In the past ten years, the FHA’s market share has been as low as 15.6% in 2006 and as high as 70.8% in 2009. Factors that influence the FHA’s market share include relative rates and fees, underwriting guidelines and loan limits of the FHA, VA, private mortgage insurers and the GSEs; lenders' perceptions of legal risks under FHA versus GSE programs; flexibility for the FHA to establish new products as a result of federal legislation and programs; returns obtained by lenders for Ginnie Mae securitization of FHA-insured loans compared to those obtained from selling loans to Fannie Mae or Freddie Mac for securitization; and differences in policy terms, such as the ability of a borrower to cancel insurance coverage under certain circumstances. We cannot predict how the factors listed above or the FHA’s share of NIW will change in the future.
Inside Mortgage Finance
estimates that in 2016, the VA accounted for 27.3% of all low down payment residential mortgages that were subject to FHA, the VA or primary private mortgage insurance, up from 24.6% in 2015 and its
MGIC Investment Corporation 2016 Form 10-K
|
8
highest level in the past ten years. In the past ten years, the VA's market share has been as low as 5.4% in 2007. We believe that the VA’s market share has generally been increasing because the VA offers 100% LTV loans and charges a one-time funding fee that can be included in the loan amount but no additional monthly expense, and because of an increase in the number of borrowers that are eligible for the VA’s program.
The private mortgage insurance industry also competes with alternatives to mortgage insurance, such as capital market transactions structured to transfer risk of default on residential mortgages, investors willing to hold credit risk on their own balance sheets without credit enhancement, and “piggyback loans,” which combine a first lien loan with a second lien loan.
In addition to the FHA, VA, other governmental agencies and the alternatives to mortgage insurance discussed above, we also compete with other mortgage insurers. The level of competition, including price competition, within the private mortgage insurance industry has intensified over the past several years and is not expected to diminish. See "Our Products and Services – Sales and Marketing and Competition – Competition" below for more information about the impact on our business of competition in the private mortgage insurance industry.
In addition to being subject to the requirements and practices of the GSEs, private mortgage insurers are subject to comprehensive, detailed regulation by state insurance departments. The insurance laws of 16 jurisdictions, including Wisconsin, MGIC's domiciliary state, require a mortgage insurer to maintain a minimum amount of statutory capital relative to the RIF (or a similar measure) in order for the mortgage insurer to continue to write new business. The NAIC plans to revise the minimum capital and surplus requirements for mortgage insurers that are provided for in its Mortgage Guaranty Insurance Model Act. In 2016, a working group of state regulators released an exposure draft of a risk-based capital framework to establish capital requirements for mortgage insurers, although no date has been established by which the NAIC must propose revisions to the capital requirements.
Due to the changing environment described above, as well as other factors discussed below, at this time we are facing the following significant challenges:
|
•
|
Whether competition from other mortgage insurers, the FHA and the VA will result in a loss of our market share, a decrease in our revenues as a result of price competition or an increase in our losses as a result of the effects of competition on underwriting guidelines.
|
|
•
|
Whether private mortgage insurance will remain a significant credit enhancement alternative for low down payment single family mortgages. An increase in the use of alternatives to private mortgage insurance, such as credit-linked note transactions executed in the capital markets, or a possible restructuring or change in the charters of the GSEs, could significantly affect our business.
|
For additional information about these uncertainties, see our risk factors titled “Competition or changes in our relationships with our customers could reduce our revenues, reduce our premium yields and/or increase our losses,” “The amount of insurance we write could be adversely affected if lenders and investors select alternatives to private mortgage insurance” and “Changes in the business practices of the GSEs, federal legislation that changes their charters or a restructuring of the GSEs could reduce our revenues or increase our losses” in
Item 1A
.
General Information About Our Company
We are a Wisconsin corporation organized in 1984. Our principal office is located at MGIC Plaza, 250 East Kilbourn Avenue, Milwaukee, Wisconsin 53202 (telephone number (414) 347-6480). As used in this annual report, “we,” “our” and “us” refer to MGIC Investment Corporation’s consolidated operations or to MGIC Investment Corporation, as a separate entity, as the context requires, and “MGIC” refers to Mortgage Guaranty Insurance Corporation.
Our revenues and losses may be materially affected by the risk factors applicable to us that are included in
Item 1A
of this annual report. These risk factors are an integral part of this annual report. These risk factors may also cause actual results to differ materially from the results contemplated by forward looking statements that we may make. Forward looking statements consist of statements which relate to matters other than historical fact. Among others, statements that include words such as we “believe,” “anticipate” or “expect,” or words of similar import, are forward looking statements. We are not undertaking any obligation to update any forward looking statements or other statements we may make even though these statements may be affected by events or circumstances occurring after the forward looking statements or other statements were made. No reader of this annual report should rely on these statements being current at any time other than the time at which this annual report was filed with the Securities and Exchange Commission.
9
|
MGIC Investment Corporation 2016 Form 10-K
B. Our Products and Services
Mortgage Insurance
In general, there are two principal types of private mortgage insurance: “primary” and “pool.”
Primary Insurance.
Primary insurance provides mortgage default protection on individual loans and covers a percentage of the unpaid loan principal, delinquent interest and certain expenses associated with the default and subsequent foreclosure or sale approved by us (collectively, the “claim amount”). In addition to the loan principal, the claim amount is affected by the mortgage note rate and the time necessary to complete the foreclosure or sale process, which over the past several years has increased, in part, due to new loss mitigation protocols established by servicers and to changes in some state foreclosure laws that may include, for example, a requirement for additional review and/or mediation processes. The insurer generally pays the coverage percentage of the claim amount specified in the primary policy, but has the option to pay 100% of the claim amount and acquire title to the property. Primary insurance is generally written on first mortgage loans secured by owner occupied "single-family" homes, which are one-to-four family homes and condominiums. Primary insurance can be written on first liens secured by non-owner occupied single-family homes, which are referred to in the home mortgage lending industry as investor loans, and on vacation or second homes. Primary coverage can be used on any type of residential mortgage loan instrument approved by the mortgage insurer.
References in this document to amounts of insurance written or in force, risk written or in force and other historical data related to our insurance refer only to direct (before giving effect to reinsurance) primary insurance, unless otherwise indicated. Primary insurance may be written on a flow basis, in which loans are insured in individual, loan-by-loan transactions, or may be written on a bulk basis, in which each loan in a portfolio of loans is individually insured in a single, bulk transaction. New primary insurance written was $47.9 billion in 2016, compared to $43.0 billion in 2015 and $33.4 billion in 2014. The 2016 increase compared to 2015 is primarily the result of an increase in purchase mortgage originations and refinance transactions.
The following table shows, on a direct basis, primary IIF and primary RIF for the MGIC Book as of the dates indicated.
|
Primary Insurance and Risk In Force
|
||||||||||||||||||||
|
December 31,
|
||||||||||||||||||||
|
(in billions)
|
2016
|
2015
|
2014
|
2013
|
2012
|
|||||||||||||||
|
Direct Primary IIF
|
$
|
182.0
|
|
$
|
174.5
|
|
$
|
164.9
|
|
$
|
158.7
|
|
$
|
162.1
|
|
|||||
|
Direct Primary RIF
|
$
|
47.2
|
|
$
|
45.5
|
|
$
|
42.9
|
|
$
|
41.1
|
|
$
|
41.7
|
|
|||||
For loans sold to Fannie Mae or Freddie Mac, the coverage percentage must comply with the requirements established by the particular GSE to which the loan is delivered. The GSEs have different loan purchase programs that allow different levels of mortgage insurance coverage. Under the “charter coverage” program, on certain loans lenders may choose a mortgage insurance coverage percentage that is less than the GSEs’ “standard coverage” and only the minimum required by the GSEs’ charters, with the GSEs paying a lower price for such loans. In 2016, nearly all of our volume was on loans with GSE standard or higher coverage.
For loans that are not sold to the GSEs, the lender determines the coverage percentage from those that we offer. Higher coverage percentages generally result in increased severity, which is the amount paid on a claim. We charge higher premium rates for higher coverage percentages. However, there can be no assurance that the higher premium rates adequately reflect the risks associated with higher coverage percentages. In accordance with GAAP for the mortgage insurance industry, reserves for losses are only established for loans in default. Because, historically, relatively few defaults occur in the early years of a book of business, the higher premium revenue from higher coverage has historically been recognized before any significant higher losses resulting from that higher coverage may be incurred. For more information, see “– Exposure to Catastrophic Loss; Defaults; Claims; Loss Mitigation – Claims.”
In general, mortgage insurance coverage cannot be terminated by the insurer. However, subject to certain restrictions as are specified in our master policy and our Gold Cert Endorsement, we may terminate or rescind coverage for, among other reasons, non-payment of premium, certain material misrepresentations made in connection with the application for the insurance policy or if the loan was never eligible for coverage under our policy. For more information including with regard to our Gold Cert Endorsement, see “– Exposure to Catastrophic Loss; Defaults; Claims; Loss Mitigation — Loss Mitigation.” Mortgage insurance coverage is renewable at the option of the insured lender, at the renewal rate fixed when the loan was initially insured. Lenders may cancel insurance written on a flow basis at any time at their option or because of mortgage repayment, which may be accelerated because of the refinancing of mortgages. In the case of a loan purchased by Freddie Mac or Fannie Mae, a borrower meeting certain conditions may require the mortgage servicer to cancel insurance upon the borrower’s request when the principal balance of the loan is 80% or less of the home’s current value.
Mortgage insurance for loans secured by one-family, primary residences can be canceled under HOPA. In general, HOPA requires a servicer to cancel the mortgage insurance
MGIC Investment Corporation 2016 Form 10-K
|
10
if a borrower requests cancellation when the principal balance of the loan is first scheduled to reach 80% of the original value, or reaches that percentage through payments, if 1) the borrower is current on the loan and has a “good payment history” (as defined by the HOPA), 2) the value of the property has not declined below the original value, and 3) if required by the mortgage owner, the borrower’s equity in the property is not subject to a subordinate lien. Additionally, the HOPA requires mortgage insurance to terminate automatically when the principal balance of the loan is first scheduled to reach 78% of the original value and the borrower is current on loan payments or thereafter becomes current. Annually, servicers must inform borrowers of their right to cancel or terminate mortgage insurance. The provisions of the HOPA described above apply only to borrower paid mortgage insurance, which is described below.
Coverage tends to continue for borrowers experiencing economic difficulties or living in areas experiencing housing price depreciation. The persistency of coverage for those borrowers coupled with cancellation of coverage for other borrowers can increase the percentage of an insurer’s portfolio comprised of loans with more credit risk. This development can also occur during periods of heavy mortgage refinancing because borrowers experiencing property value appreciation are less likely to require mortgage insurance at the time of refinancing, while borrowers not experiencing property value appreciation are more likely to continue to require mortgage insurance at the time of refinancing or not qualify for refinancing at all (including if they have experienced economic difficulties) and thus remain subject to the mortgage insurance coverage.
The percentage of NIW on loans representing refinances was 20% for 2016, compared to 19% for 2015 and 13% in 2014. When a borrower refinances a mortgage loan insured by us by paying it off in full with the proceeds of a new mortgage that is also insured by us, the insurance on that existing mortgage is cancelled, and insurance on the new mortgage is considered to be NIW. Therefore, continuation of our coverage from a refinanced loan to a new loan results in both a cancellation of insurance and NIW. When a lender and borrower modify a loan rather than replace it with a new one, or enter into a new loan pursuant to a loan modification program, our insurance continues without being cancelled, assuming that we consent to the modification or new loan. As a result, such modifications or new loans, including those modified under HARP, are not included in our NIW.
In addition to varying with the coverage percentage, our premium rates for insurance vary depending upon the perceived risk of a claim on the insured loan and thus take into account, among other things, the loan-to-value ratio, the borrower’s credit score, whether the loan is a fixed payment
loan or a non-fixed payment loan (a non-fixed payment loan is referred to in the home mortgage lending industry as an ARM), the mortgage term and whether the property is the borrower’s primary residence. We generally utilize a national, rather than a regional or local, premium rate policy. However, depending upon regional economic conditions, we have made, and may make, changes to our underwriting requirements to implement more restrictive standards in certain markets and for loan characteristics that we categorize as higher risk. Premium rates cannot be changed after the issuance of coverage.
The borrower’s mortgage loan instrument may require the borrower to pay the mortgage insurance premium. Our industry refers to the related mortgage insurance as “borrower-paid.” If the borrower is not required to pay the premium and mortgage insurance is required in connection with the origination of the loan, then the premium is paid by the lender, who may recover the premium through an increase in the note rate on the mortgage or higher origination fees. Our industry refers to mortgage insurance on such loans as “lender-paid.” Most of our primary IIF is borrower-paid mortgage insurance.
There are several payment plans available to the borrower, or lender, as the case may be. Under the single premium plan, the borrower or lender pays us in advance a single payment covering a specified term exceeding twelve months. Under the monthly premium plan, the borrower or lender pays us a monthly premium payment to provide only one month of coverage. Under the annual premium plan, an annual premium is paid to us in advance, with annual renewal premiums paid in advance thereafter.
During 2016, 2015 and 2014, the single premium plan represented approximately 19%, 20% and 15%, respectively, of our NIW. The monthly premium plan represented approximately 81%, 79% and 85%, respectively. The annual premium plan represented less than 1% of NIW in each of those years. Our single premium plan policies have increased in recent years in part as a result of the 2014 and 2013 reductions in our single premium rates and our selectively matching reduced rates on lender-paid single premium policies being offered by competitors. Depending on the actual life of a single premium policy and its premium rate relative to that of a monthly premium policy, a single premium policy may generate more or less premium than a monthly premium policy over its life.
Pool Insurance.
Pool insurance is generally used as an additional “credit enhancement” for certain secondary market mortgage transactions. Pool insurance generally covers the amount of the loss on a defaulted mortgage loan that exceeds the claim payment under the primary coverage, if primary insurance is required on that mortgage loan, as well as the total loss on a defaulted mortgage loan which
11
|
MGIC Investment Corporation 2016 Form 10-K
did not require primary insurance. Pool insurance may have a stated aggregate loss limit for a pool of loans and may also have a deductible under which no losses are paid by the insurer until losses on the pool of loans exceed the deductible.
We have written no new pool risk since 2009, however, for a variety of reasons, including responding to capital market alternatives to private mortgage insurance and customer demands, we may write pool risk in the future. At each of December 31, 2016 and 2015, approximately 99% of our RIF was primary insurance and the remaining RIF was pool insurance. Our direct pool RIF was $0.5 billion ($0.2 billion on pool policies with aggregate loss limits and $0.3 billion on pool policies without aggregate loss limits) at December 31, 2016, compared to $0.7 billion ($0.3 billion on pool policies with aggregate loss limits and $0.4 billion on pool policies without aggregate loss limits) at December 31, 2015, and $0.8 billion ($0.3 billion on pool policies with aggregate loss limits and $0.5 billion on pool policies without aggregate loss limits) at December 31, 2014. As noted in "Other Products and Services – Other" below, an insurance subsidiary of MGIC has provided an immaterial amount of credit insurance whose structure is equivalent to pool insurance. That credit insurance is not included in discussions of pool insurance contained in this annual report.
Geographic Dispersion
The following tables reflect the percentage of primary RIF in the top 10 jurisdictions and top 10 core-based statistical areas for the MGIC Book at December 31, 2016. We refer to the insurance that has been written by MGIC (including MIC for portions of 2012 and 2013) as the "MGIC Book."
Dispersion of Primary Risk in Force
|
Top 10 Jurisdictions
|
||
|
California
|
8.0
|
%
|
|
Florida
|
6.7
|
%
|
|
Texas
|
6.3
|
%
|
|
Pennsylvania
|
5.2
|
%
|
|
Ohio
|
4.8
|
%
|
|
Illinois
|
4.2
|
%
|
|
Michigan
|
3.5
|
%
|
|
New York
|
3.3
|
%
|
|
Georgia
|
3.3
|
%
|
|
Washington
|
3.2
|
%
|
|
Total
|
48.5
|
%
|
|
Top 10 Core-Based Statistical Areas
|
||
|
Chicago-Naperville-Arlington Heights
|
2.8
|
%
|
|
Atlanta-Sandy Springs-Roswell
|
2.4
|
%
|
|
Minneapolis-St. Paul-Bloomington
|
2.1
|
%
|
|
Washington-Arlington-Alexandria
|
2.1
|
%
|
|
Houston-Woodlands-Sugar Land
|
2.0
|
%
|
|
Philadelphia
|
1.9
|
%
|
|
Los Angeles-Long Beach-Glendale
|
1.8
|
%
|
|
Newark
|
1.7
|
%
|
|
Phoenix-Mesa-Scottsdale
|
1.6
|
%
|
|
Portland-Vancouver-Hillsboro
|
1.4
|
%
|
|
Total
|
19.8
|
%
|
The percentages shown above for various core-based statistical areas can be affected by changes, from time to time, in the federal government’s definition of a core-based statistical area.
Insurance In Force by Policy Year
The following table sets forth for the MGIC Book the dispersion of our primary IIF and RIF as of December 31, 2016, by year(s) of policy origination since we began operations in 1985.
|
Primary Insurance In Force and Risk In Force by Policy Year
|
|||||||||||||
|
Insurance in Force
|
Risk in Force
|
||||||||||||
|
Policy Year
|
Total
(In millions)
|
Percent of
Total
|
Total
(In millions)
|
Percent of
Total
|
|||||||||
|
2004 and prior
|
$
|
6,122
|
|
3.4
|
%
|
$
|
1,729
|
|
3.7
|
%
|
|||
|
2005
|
5,363
|
|
2.9
|
%
|
1,532
|
|
3.3
|
%
|
|||||
|
2006
|
9,334
|
|
5.1
|
%
|
2,564
|
|
5.4
|
%
|
|||||
|
2007
|
20,548
|
|
11.3
|
%
|
5,301
|
|
11.2
|
%
|
|||||
|
2008
|
10,075
|
|
5.5
|
%
|
2,559
|
|
5.4
|
%
|
|||||
|
2009
|
2,094
|
|
1.2
|
%
|
485
|
|
1.0
|
%
|
|||||
|
2010
|
1,776
|
|
1.0
|
%
|
487
|
|
1.0
|
%
|
|||||
|
2011
|
2,843
|
|
1.5
|
%
|
788
|
|
1.7
|
%
|
|||||
|
2012
|
8,792
|
|
4.8
|
%
|
2,435
|
|
5.2
|
%
|
|||||
|
2013
|
13,715
|
|
7.5
|
%
|
3,716
|
|
7.9
|
%
|
|||||
|
2014
|
21,211
|
|
11.7
|
%
|
5,518
|
|
11.7
|
%
|
|||||
|
2015
|
35,434
|
|
19.5
|
%
|
9,025
|
|
19.1
|
%
|
|||||
|
2016
|
44,733
|
|
24.6
|
%
|
11,056
|
|
23.4
|
%
|
|||||
|
Total
|
$
|
182,040
|
|
100.0
|
%
|
$
|
47,195
|
|
100.0
|
%
|
|||
MGIC Investment Corporation 2016 Form 10-K
|
12
Product Characteristics
The following table reflects, at the dates indicated and by the categories indicated, the total dollar amount of primary RIF for the MGIC Book and the percentage of that primary RIF, as determined on the basis of information available on the date of mortgage origination.
|
Characteristics of Primary Risk In Force
|
|||||||
|
December 31, 2016
|
December 31, 2015
|
||||||
|
Primary RIF
(In millions)
:
|
$
|
47,195
|
|
$
|
45,462
|
|
|
|
Loan-to-value ratios:
|
|||||||
|
95.01% and above
|
14.5
|
%
|
16.2
|
%
|
|||
|
90.01-95%
|
50.4
|
%
|
48.0
|
%
|
|||
|
85.01-90%
|
29.1
|
%
|
29.8
|
%
|
|||
|
80.01-85%
|
4.7
|
%
|
4.5
|
%
|
|||
|
80% and below
|
1.3
|
%
|
1.5
|
%
|
|||
|
Total
|
100.0
|
%
|
100.0
|
%
|
|||
|
Loan Type:
|
|||||||
|
Fixed
(1)
|
97.2
|
%
|
96.4
|
%
|
|||
|
ARMs
(2)
|
2.8
|
%
|
3.6
|
%
|
|||
|
Total
|
100.0
|
%
|
100.0
|
%
|
|||
|
Original Insured Loan Amount:
(3)
|
|||||||
|
Conforming loan limit and below
|
95.1
|
%
|
96.0
|
%
|
|||
|
Non-conforming
|
4.9
|
%
|
4.0
|
%
|
|||
|
Total
|
100.0
|
%
|
100.0
|
%
|
|||
|
Mortgage Term:
|
|||||||
|
15-years and under
|
2.5
|
%
|
2.7
|
%
|
|||
|
Over 15 years
|
97.5
|
%
|
97.3
|
%
|
|||
|
Total
|
100.0
|
%
|
100.0
|
%
|
|||
|
Property Type:
|
|||||||
|
Single-family detached
|
87.6
|
%
|
87.4
|
%
|
|||
|
Condominium/Townhouse/Other attached
|
11.7
|
%
|
11.9
|
%
|
|||
|
Other
(4)
|
0.7
|
%
|
0.7
|
%
|
|||
|
Total
|
100.0
|
%
|
100.0
|
%
|
|||
|
Occupancy Status:
|
|||||||
|
Owner occupied
|
97.1
|
%
|
96.8
|
%
|
|||
|
Second home
|
2.1
|
%
|
2.2
|
%
|
|||
|
Investor property
|
0.8
|
%
|
1.0
|
%
|
|||
|
Total
|
100.0
|
%
|
100.0
|
%
|
|||
|
Documentation:
|
|||||||
|
Reduced:
(5)
|
|||||||
|
Stated
|
2.5
|
%
|
3.1
|
%
|
|||
|
No
|
0.6
|
%
|
0.8
|
%
|
|||
|
Full documentation
|
96.9
|
%
|
96.1
|
%
|
|||
|
Total
|
100.0
|
%
|
100.0
|
%
|
|||
|
FICO Score:
(6)
|
|||||||
|
740 and greater
|
49.3
|
%
|
47.2
|
%
|
|||
|
700 - 739
|
24.3
|
%
|
23.8
|
%
|
|||
|
660 - 699
|
15.1
|
%
|
15.8
|
%
|
|||
|
659 and less
|
11.3
|
%
|
13.2
|
%
|
|||
|
Total
|
100.0
|
%
|
100.0
|
%
|
|||
13
|
MGIC Investment Corporation 2016 Form 10-K
|
(1)
|
Includes fixed rate mortgages with temporary buydowns (where in effect the applicable interest rate is typically reduced by one or two percentage points during the first two years of the loan), ARMs in which the initial interest rate is fixed for at least five years, and balloon payment mortgages (a loan with a maturity, typically five to seven years, that is shorter than the loan’s amortization period).
|
|
(2)
|
Includes ARMs where payments adjust fully with interest rate adjustments. Also includes pay option ARMs and other ARMs with negative amortization features, which collectively at December 31, 2016 and 2015, represented 0.6% and 0.7%, respectively, of primary RIF. As indicated in note (2), does not include ARMs in which the initial interest rate is fixed for at least five years. As of December 31, 2016 and 2015, ARMs with loan-to-value ratios in excess of 90% represented 0.5% and 0.7%, respectively, of primary RIF.
|
|
(3)
|
Loans within the conforming loan limit have an original principal balance that does not exceed the maximum original principal balance of loans that the GSEs are eligible to purchase. The conforming loan limit for one unit properties was $417,000 from 2007 through 2016 and is $424,100 for 2017. The limit for high cost communities has been higher and is $636,150 for 2017. Non-conforming loans are loans with an original principal balance above the conforming loan limit.
|
|
(4)
|
Includes cooperatives and manufactured homes deemed to be real estate.
|
|
(5)
|
Reduced documentation loans were originated under programs in which there was a reduced level of verification or disclosure compared to traditional mortgage loan underwriting, including programs in which the borrower’s income and/or assets were disclosed in the loan application but there was no verification of those disclosures ("stated" documentation) and programs in which there was no disclosure of income or assets in the loan application ("no" documentation). In accordance with industry practice, loans approved by GSE and other automated underwriting (AU) systems under “doc waiver” programs that did not require verification of borrower income are classified by us as “full documentation.” Based in part on information provided by the GSEs, we estimate full documentation loans of this type were approximately 4% of 2007 NIW. Information for other periods is not available. We understand these AU systems granted such doc waivers for loans they judged to have higher credit quality. We also understand that the GSEs terminated their “doc waiver” programs in the second half of 2008.
|
|
(6)
|
Represents the FICO score at loan origination. The weighted average “decision FICO score” at loan origination for NIW in 2016 and 2015 was 746 and 744, respectively. The FICO score for a loan with multiple borrowers is the lowest of the borrowers’ decision FICO scores. A borrower’s “decision FICO score” is determined as follows: if there are three FICO scores available, the middle FICO score is used; if two FICO scores are available, the lower of the two is used; if only one FICO score is available, it is used. A FICO score is a score based on a borrower’s credit history generated by a model developed by Fair Isaac Corporation.
|
Other Products and Services
Contract Underwriting
.
A non-insurance subsidiary of ours performs contract underwriting services for lenders. In performing those services, we underwrite loans to conform to prescribed guidelines. The guidelines might be the lender's own guidelines or the guidelines of Fannie Mae, Freddie Mac or a non-GSE investor. These services are provided for loans that require private mortgage insurance as well as for loans that do not require private mortgage insurance.
Under our contract underwriting agreements, we may be required to provide certain remedies to our customers if certain standards relating to the quality of our underwriting work are not met, and we have an established reserve for such future obligations. The related contract underwriting remedy expense for the years ended
December 31, 2016
,
2015
, and
2014
, respectively, was immaterial to our consolidated financial statements. Claims for remedies may be made a number of years after the underwriting work was performed.
Other
.
We provide various fee-based services for the mortgage finance industry, such as analysis of loan originations and portfolios, and mortgage lead generation. An insurance subsidiary of MGIC provides credit insurance for certain mortgages under Fannie Mae and Freddie Mac credit risk transfer programs. The structure of these programs is equivalent to pool insurance and the amount of our risk associated with them is immaterial.
Reinsurance Agreements
At December 31, 2016, approximately 78% of our IIF was subject to reinsurance agreements, compared to 76% at December 31, 2015. In 2016, approximately 89% of our NIW was subject to reinsurance agreements, compared to 91% in 2015.
External Reinsurance
. We have in place a QSR transaction that became effective July 1, 2015, with a group of unaffiliated reinsurers that covers most of our insurance written from 2013 through 2016, and a portion of our insurance written prior to 2013. The transaction covers incurred losses, with renewal premium through December 31, 2024. The structure of the transaction is a 30% quota
MGIC Investment Corporation 2016 Form 10-K
|
14
share for all policies covered, with a 20% ceding commission as well as a profit commission. Generally, under the transaction, we will receive a profit commission provided that the loss ratio on the loans covered under the agreement remains below 60%. We expect that in the first quarter of 2017, we will enter into a similar agreement covering most of our NIW in 2017. Although reinsuring against possible loan losses does not discharge us from liability to a policyholder, it reduces the amount of capital we are required to retain against potential future losses for the PMIERs, rating agency and insurance regulatory purposes. We are currently allowed full credit under the PMIERs for the risk ceded under the QSRs. However, the GSEs' ongoing approval of the transaction is subject to several conditions and it will be reviewed under the PMIERs at least annually by the GSEs. Early termination of the 2015 agreement can be elected by us effective December 31, 2018 for a fee, or under specified scenarios for no fee upon prior written notice. Further, at our sole discretion we may elect to terminate the 2015 agreement if we will receive less than 90% of the full PMIERs credit amount for the risk ceded under the agreement in any required calculation period. The 2017 transaction is expected to have similar termination provisions.
Captive Reinsurance
. In a captive reinsurance arrangement, the reinsurer is affiliated with the lender for whom MGIC provides mortgage insurance. Since June 2005, various state and federal regulators have conducted investigations or requested information regarding captive mortgage reinsurance arrangements in which we participated, in part, in order to consider compliance with RESPA. In 2013, we entered into a settlement agreement with the CFPB that resolved a federal investigation of MGIC’s participation in captive reinsurance arrangements without the CFPB or a court making any findings of wrongdoing. As part of the settlement, MGIC agreed that it would not enter into any new captive reinsurance agreement or reinsure any new loans under any existing captive reinsurance agreement for a period of ten years. In accordance with this settlement, all of our active captive arrangements have been placed into run-off.
For further information about our reinsurance agreements, see
Note 9 – “Reinsurance,”
to our consolidated financial statements in Item 8.
Customers
Originators of residential mortgage loans such as savings institutions, commercial banks, mortgage brokers, credit unions, mortgage bankers and other lenders have historically determined the placement of mortgage insurance written on a flow basis and as a result are our customers. To obtain primary insurance from us written on a flow basis, a mortgage lender must first apply for and receive a mortgage guaranty master policy from us. Our top
10 customers, none of whom represented more than 10% of our consolidated revenues, generated 24.1% of our NIW on a flow basis in 2016, compared to 23.4% in 2015 and 19.5% in 2014. Our largest customer accounted for approximately 5% of our flow NIW in each of 2015 and 2016. Our relationships with our customers could be adversely affected by a variety of factors, including premium rates higher than can be obtained from competitors, tightening of and adherence to our underwriting requirements, which may result in our declining to insure some of the loans originated by our customers and insurance rescissions and curtailments that affect the customer. Information about some of the other factors that can affect a mortgage insurer’s relationship with its customers can be found in our risk factor titled “Competition or changes in our relationships with our customers could reduce our revenues, reduce our premium yields and/or increase our losses” in
Item 1A
.
Sales and Marketing and Competition
Sales and Marketing.
Our employees sell our insurance products throughout all regions of the United States and in Puerto Rico and Guam.
Competition.
Our competition includes other mortgage insurers, governmental agencies and products designed to eliminate the need to purchase private mortgage insurance. For flow business, we and other private mortgage insurers compete directly with federal and state governmental and quasi-governmental agencies, principally the FHA and the VA. The FHA and the VA sponsor government-backed mortgage insurance programs, and it is estimated that during 2016, 2015 and 2014, they accounted for a combined approximately 63.7%, 65.0% and 59.3%, respectively, of the total low down payment residential mortgages which were subject to FHA, VA or primary private mortgage insurance. For more information about the market share of the FHA and the VA, see “Overview of the Private Mortgage Insurance Industry and its Operating Environment” above.
In addition to competition from the FHA and the VA, we and other private mortgage insurers face competition from state-supported mortgage insurance funds in several states. From time to time, other state legislatures and agencies consider expanding the authority of their state governments to insure residential mortgages.
The PMI industry is highly competitive. We believe that we currently compete with other private mortgage insurers based on pricing, underwriting requirements, financial strength (including contract underwriting services), customer relationships, name recognition, reputation, the strength of our management team and field organization, the ancillary products and services provided to lenders (including contract underwriting services), the depth of our databases covering insured loans and the effective use of
15
|
MGIC Investment Corporation 2016 Form 10-K
technology and innovation in the delivery and servicing of our mortgage insurance products.
The U.S. PMI industry currently consists of six active mortgage insurers and their affiliates. The names of these mortgage insurers can be found in our risk factor titled “Competition or changes in our relationships with our customers could reduce our revenues, reduce our premium yields and/or increase our losses” in Item 1A. Until 2010 the PMI industry had not had new entrants in many years. Since 2010, two public companies have been formed and begun writing business and a worldwide insurer and reinsurer with mortgage insurance operations in Europe completed the purchase of two competitors (one purchase closed at the end of 2016). Our market share (as measured by NIW) was 17.8% in 2016, compared to 19.9% in 2015 and 19.8% in 2014, in each case excluding HARP refinances.
The PMI industry historically viewed a financial strength rating of Aa3/AA- as critical to writing new business, in part because it was required in order to maintain the highest level of eligibility with the GSEs before the PMIERs were revised effective December 31, 2015. At the time that this annual report was finalized, the financial strength of MGIC was rated Baa3 (with a stable outlook) by Moody’s Investors Service and BBB+ (with a stable outlook) by Standard & Poor’s Rating Services. The revised PMIERs replaced the financial strength rating requirements with a requirement that a mortgage insurer’s “Available Assets” (generally only the most liquid assets of an insurer) equal or exceed its “Minimum Required Assets” (which are based on an insurer’s book and are calculated from tables of factors with several risk dimensions and are subject to a floor amount). For further information about the importance of MGIC’s capital, see our risk factor titled “We may not continue to meet the GSEs’ mortgage insurer eligibility requirements and our returns may decrease as we are required to maintain significantly more capital in order to maintain our eligibility” in
Item 1A
. Depending on the evolution of housing finance reform, the level of issuances of non-GSE MBS may increase in the future. Financial strength ratings may be considered by issuers of non-GSE MBS in determining whether to purchase private mortgage insurance for loans supporting such securities. In assigning financial strength ratings, in addition to considering the adequacy of the mortgage insurer’s capital to withstand very high claim scenarios under assumptions determined by the rating agency, we believe rating agencies review a mortgage insurer’s historical and projected operating performance, franchise risk, business outlook, competitive position, management, corporate strategy, and other factors. The rating agency issuing the financial strength rating can withdraw or change its rating at any time.
Risk Management
We believe that mortgage credit risk is materially affected by:
|
•
|
the condition of the economy, including the direction of change in housing values and employment, in the area in which the property is located;
|
|
•
|
the borrower’s credit profile, including the borrower’s credit history, debt-to-income ratios and cash reserves, and the willingness of a borrower with sufficient resources to make mortgage payments when the mortgage balance exceeds the value of the home;
|
|
•
|
the loan product, which encompasses the loan-to-value ratio, the type of loan instrument, including whether the instrument provides for fixed or variable payments and the amortization schedule, the type of property and the purpose of the loan;
|
|
•
|
origination practices of lenders and the percentage of coverage on insured loans; and
|
|
•
|
the size of insured loans.
|
We believe that, excluding other factors, claim incidence increases:
|
•
|
during periods of economic contraction and housing price depreciation, including when these conditions may not be nationwide, compared to periods of economic expansion and housing price appreciation;
|
|
•
|
for loans to borrowers with lower FICO scores compared to loans to borrowers with higher FICO scores;
|
|
•
|
for loans with less than full underwriting documentation compared to loans with full underwriting documentation;
|
|
•
|
for loans with higher loan-to-value ratios compared to loans with lower loan-to-value ratios;
|
|
•
|
for ARMs when the reset interest rate significantly exceeds the interest rate at the time of loan origination;
|
|
•
|
for loans that permit the deferral of principal amortization compared to loans that require principal amortization with each monthly payment;
|
|
•
|
for loans in which the original loan amount exceeds the conforming loan limit compared to loans below that limit; and
|
MGIC Investment Corporation 2016 Form 10-K
|
16
|
•
|
for cash out refinance loans compared to rate and term refinance loans.
|
Other types of loan characteristics relating to the individual loan or borrower may also affect the risk potential for a loan. The presence of a number of higher-risk characteristics in a loan materially increases the likelihood of a claim on such a loan unless there are other characteristics to lower the risk.
We charge higher premium rates to reflect the increased risk of claim incidence that we perceive is associated with a loan, although not all higher risk characteristics are reflected in the premium rate. There can be no assurance that our premium rates adequately reflect the increased risk, particularly in a period of economic recession, high unemployment, slowing home price appreciation or housing price declines. For additional information, see our risk factors in
Item 1A
, including the one titled “The premiums we charge may not be adequate to compensate us for our liabilities for losses and as a result any inadequacy could materially affect our financial condition and results of operations.”
Beginning in late 2007 and into 2008, we implemented a series of changes to our underwriting requirements that were designed to improve the risk profile of our new business. The changes primarily affected borrowers who had multiple risk factors such as a high loan-to-value ratio, a lower FICO score and limited documentation or those financing a home in a market we categorized as higher risk. The loans insured in the periods leading up to the effectiveness of the new requirements continue to experience significantly higher than historical lifetime claim rates and incurred losses. Beginning in September 2009, we have made changes to our underwriting requirements that have allowed certain loans to be eligible for insurance that were not eligible prior to those changes and we expect to continue to make changes in appropriate circumstances in the future.
Delegated Underwriting and Automated Underwriting.
In the past, we allowed approved lenders to commit us to insure loans originated through the flow channel using their own underwriting guidelines that we had pre-approved. Subsequently, some lenders developed their own automated underwriting systems. After we reviewed such systems, we agreed to allow certain lenders to commit us to insure loans that their systems approved. From 2000 through January 2007, the use of automated underwriting systems by the GSEs and lenders increased materially. During this same period, we allowed loans approved by the automated underwriting systems of the GSEs and certain approved lenders to be automatically approved for MGIC mortgage insurance. As a result, during this period, a substantial majority of the loans insured by us through the
flow channel were approved as a result of loan approvals by automated underwriting systems. Beginning in 2007 and continuing through 2012, loans would not automatically be insured by us even though the loans were approved by the underwriting systems described above. Beginning in 2013, we aligned most of our underwriting requirements with Fannie Mae and Freddie Mac for loans that receive and are processed in accordance with certain approval recommendations from a GSE automated underwriting system. As a result of the changes to our underwriting guidelines and requirements, and other factors, our business written beginning in the second half of 2013 is expected to have a somewhat higher claim incidence than business written 2009 through the first half of 2013. However, we believe this business presents an acceptable level of risk. Our underwriting requirements are available on our website at http://www.mgic.com/underwriting/index.html.
Applications for mortgage insurance are submitted to us through both our delegated and non-delegated options. Under the delegated option, applications are submitted to us electronically and we rely upon the lender’s representations and warranties that the data submitted is true and correct when making our insurance decision. If the loan data submitted meets the underwriting requirements, a commitment to insure the loan is immediately issued. If the requirements are not met, the loan is reviewed by one of our underwriters. Non-delegated applications are submitted with documents from the lender’s loan origination file. During loan set-up, data is entered from those application documents and electronically evaluated against our underwriting requirements. An internally generated feedback report guides the mortgage insurance review as a full review of the mortgage documents is performed by one of our underwriters. If the loan meets the underwriting requirements, a commitment to insure the loan is issued. Our underwriters are authorized to approve loans that do not meet all of our underwriting requirements provided appropriate offsetting factors can be identified. The number of loans for which underwriting exceptions were made accounted for fewer than 2% of the loans we insured in each of 2015 and 2016.
Exposure to Catastrophic Loss; Defaults; Claims; Loss Mitigation
Exposure to Catastrophic Loss.
The private PMI industry has from time to time experienced catastrophic losses similar to the losses we have experienced in 2007-2013. For background information about the current cycle of such losses, refer to “General – Overview of Private Mortgage Insurance Industry and its Operating Environment” above. To the extent our premium yield materially declines without either a corresponding decrease in our risk written or achieving other benefits, we become less likely to be able to withstand the occurrence of a catastrophic loss scenario.
17
|
MGIC Investment Corporation 2016 Form 10-K
Prior to the most recent cycle of such losses, the last time that private mortgage insurers experienced substantial losses was in the mid-to-late 1980s.
Defaults
. The claim cycle on PMI generally begins with the insurer’s receipt of notification of a default on an insured loan from the loan servicer. We consider a loan to be in default when it is two or more payments past due. Most servicers report delinquent loans to us within this two month period. The incidence of default is affected by a variety of factors, including the level of borrower income growth, unemployment, health issues, family status, the level of interest rates, rates of housing price appreciation or depreciation and general borrower creditworthiness. Defaults that are not cured result in a claim to us. See “– Claims.” Defaults may be cured by the borrower bringing current the delinquent loan payments or by a sale of the property and the satisfaction of all amounts due under the mortgage. In addition, when a policy is rescinded or a claim is denied we remove the default from our default inventory.
The following table shows the number of primary and pool loans insured in the MGIC Book, the related number of loans in default and the percentage of loans in default, or default rate, as of December 31, 2012-2016.
|
Default Statistics for the MGIC Book
|
|||||||||
|
December 31,
|
|||||||||
|
2016
|
2015
|
2014
|
2013
|
2012
|
|||||
|
Primary Insurance:
|
|||||||||
|
Insured loans in force
|
998,294
|
992,188
|
968,748
|
960,163
|
1,006,346
|
||||
|
Loans in default
|
50,282
|
62,633
|
79,901
|
103,328
|
139,845
|
||||
|
Default rate – all loans
|
5.0%
|
6.3%
|
8.3%
|
10.8%
|
13.9%
|
||||
|
Loans in default in our claims received inventory
|
1,385
|
2,769
|
4,746
|
6,948
|
11,731
|
||||
|
Pool Insurance:
|
|||||||||
|
Insured loans in force
|
39,071
|
52,189
|
62,869
|
87,584
|
119,061
|
||||
|
Loans in default
|
1,883
|
2,739
|
3,797
|
6,563
|
8,594
|
||||
|
Default rate
|
4.8%
|
5.3%
|
6.0%
|
7.5%
|
7.2%
|
||||
Different geographical areas may experience different default rates due to varying localized economic conditions from year to year. The following table shows the percentage of primary loans we insured that were in default as of December 31, 2016, 2015 and 2014 for the 15 jurisdictions for which we paid the most claims during 2016.
|
Jurisdiction Default Rates
|
||||||||
|
December 31,
|
||||||||
|
2016
|
2015
|
2014
|
||||||
|
Florida
|
6.6
|
%
|
10.1
|
%
|
17.7
|
%
|
||
|
New Jersey
|
11.3
|
|
15.6
|
|
18.7
|
|
||
|
Illinois
|
5.5
|
|
7.1
|
|
10.3
|
|
||
|
New York
|
10.5
|
|
12.7
|
|
15.0
|
|
||
|
Maryland
|
7.4
|
|
9.4
|
|
12.8
|
|
||
|
California
|
3.1
|
|
4.1
|
|
5.9
|
|
||
|
Pennsylvania
|
5.3
|
|
6.5
|
|
8.3
|
|
||
|
Ohio
|
4.2
|
|
5.2
|
|
6.5
|
|
||
|
Puerto Rico
|
10.7
|
|
12.0
|
|
12.3
|
|
||
|
Washington
|
2.9
|
|
4.0
|
|
5.6
|
|
||
|
Virginia
|
3.8
|
|
4.9
|
|
6.4
|
|
||
|
Michigan
|
3.4
|
|
4.1
|
|
5.5
|
|
||
|
Massachusetts
|
6.1
|
|
7.4
|
|
8.5
|
|
||
|
Connecticut
|
5.6
|
|
7.1
|
|
9.8
|
|
||
|
Georgia
|
5.5
|
|
6.5
|
|
8.2
|
|
||
|
All other jurisdictions
|
4.4
|
|
5.3
|
|
6.6
|
|
||
The primary default inventory in those same jurisdictions as of December 31, 2016, 2015 and 2014 appears in a table found in “Management’s Discussion and Analysis of Financial Condition and Results of Operations – Consolidated Results of Operations – Loss Reserves Continued to Decline on Lower Default Inventory,” in
Item 7
.
Claims.
Claims result from defaults that are not cured or a short sale that we approve. Whether a claim results from an uncured default depends, in large part, on the borrower’s equity in the home at the time of default, the borrower’s or the lender’s ability to sell the home for an amount sufficient to satisfy all amounts due under the mortgage and the willingness and ability of the borrower and lender to enter into a loan modification that provides for a cure of the default. Various factors affect the frequency and amount of claims, including local housing prices and employment levels, and interest rates. If a default goes to claim, any premium collected from the time of default to time of the claim payment is returned to the servicer along with the claim payment.
MGIC Investment Corporation 2016 Form 10-K
|
18
Under the terms of our master policy, the lender is required to file a claim for primary insurance with us within 60 days after it has acquired title to the underlying property (typically through foreclosure). Until a few years ago, it took, on average, approximately twelve months for a default that is not cured to develop into a paid claim. Over the past several years, the average time it takes to receive a claim associated with a default has increased. This is, in part, due to new loss mitigation protocols established by servicers and to changes in some state foreclosure laws that may include, for example, a requirement for additional review and/or mediation processes. It is difficult to estimate how long it may take for current and future defaults that do not cure to develop into paid claims.
Within 60 days after a claim has been filed and all documents required to be submitted to us have been delivered, we have the option of either (1) paying the coverage percentage specified for that loan, with the insured retaining title to the underlying property and receiving all proceeds from the eventual sale of the property (we have elected this option for the vast majority of claim payments in the recent past), or (2) paying 100% of the claim amount in exchange for the lender’s conveyance of good and marketable title to the property to us. After we receive title to properties, we sell them for our own account. If we fail to pay a claim timely, we would be subject to additional interest expense.
Claim activity is not evenly spread throughout the coverage period of a book of primary business. Relatively few claims are typically received during the first two years following issuance of coverage on a loan. This is typically followed by a period of rising claims which, based on industry experience, has historically reached its highest level in the third and fourth years after the year of loan origination. Thereafter, the number of claims typically received has historically declined at a gradual rate, although the rate of decline can be affected by conditions in the economy, including slowing home price appreciation or housing price depreciation. Moreover, when a loan is refinanced, because the new loan replaces, and is a continuation of, an earlier loan, the pattern of claims frequency for that new loan may be different from the historical pattern for other loans. Persistency, the condition of the economy, including unemployment, and other factors can affect the pattern of claim activity. For example, a weak economy can lead to claims from older books increasing, continuing at stable levels or experiencing a lower rate of decline. As of
December 31, 2016
,
54%
of our primary RIF was written subsequent to December 31, 2013,
62%
of our primary RIF was written subsequent to December 31, 2012, and
67%
of our primary RIF was written subsequent to December 31, 2011. See “Our Products and Services – Mortgage Insurance – Primary Insurance In Force and Risk In Force by Policy Year” above.
Another important factor affecting MGIC Book losses is the amount of the average claim size, which is generally referred to as claim severity. The main determinants of claim severity are the amount of the mortgage loan, the coverage percentage on the loan, loss mitigation efforts and local market conditions. For information about our primary average claim paid, see “Management’s Discussion and Analysis of Financial Condition and Results of Operations – Consolidated Results of Operations – Losses Incurred, Net Continued to Decline as Credit Quality Continued to Improve,” in
Item 7
.
Net losses paid and primary losses paid for the top 15 jurisdictions and all other jurisdictions for 2016, 2015 and 2014 appear in tables found in “Management’s Discussion and Analysis of Financial Condition and Results of Operations – Consolidated Results of Operations – Net Losses and LAE Paid Continued to Decline as Credit Improved on our Primary RIF,” in
Item 7
.
Loss Mitigation.
Before paying a claim, we review the loan and servicing files to determine the appropriateness of the claim amount. All of our insurance policies provide that we can reduce or deny a claim if the servicer did not comply with its obligations under our insurance policy, including the requirement to mitigate our loss by performing reasonable loss mitigation efforts or, for example, diligently pursuing a foreclosure or bankruptcy relief in a timely manner. We call such reduction of claims submitted to us “curtailments.” In each of 2016 and 2015, curtailments reduced our average claim paid by approximately 5.5% and 6.7%, respectively.
When reviewing the loan file associated with a claim, we may determine that we have the right to rescind coverage on the loan. In our SEC reports, we refer to insurance rescissions and denials of claims as “rescissions” and variations of this term. The circumstances in which we are entitled to rescind coverage have narrowed for insurance we have written in recent years. During the second quarter of 2012, we began writing a portion of our new insurance under the Gold Cert Endorsement, which limited our ability to rescind coverage compared to our master policy in effect at that time. Our rescission rights under our new master policy introduced in 2014 are comparable to those under our previous master policy, as modified by the Gold Cert Endorsement, but may be further narrowed if the GSEs permit modifications to them. In recent quarters, an immaterial percentage of claims received in a quarter have been resolved by rescissions, down from the peak of approximately 28% in the first half of 2009. We do not expect future rescissions will be a significant portion of the claims we resolve over the next few years.
Our loss reserving methodology incorporates our estimates of future rescissions, curtailments, and reversals of rescissions and curtailments. When we rescind coverage,
19
|
MGIC Investment Corporation 2016 Form 10-K
we return all premiums previously paid to us under the policy and are relieved of our obligation to pay a claim under the policy. A variance between ultimate actual rescission, curtailment or reversal rates and our estimates, as a result of the outcome of litigation, settlements or other factors, could materially affect our losses.
When the insured disputes our right to rescind coverage or curtail a claim, we generally engage in discussions in an attempt to settle the dispute. If we are unable to reach a settlement, the outcome of a dispute ultimately would be determined by legal proceedings. Under ASC 450-20, until a liability associated with settlement discussions or legal proceedings becomes probable and can be reasonably estimated, we consider our claim payment or rescission resolved for financial reporting purposes and do not accrue an estimated loss. Where we have determined that a loss is probable and can be reasonably estimated, we have recorded our best estimate of our probable loss. If we are not able to implement settlements we consider probable, we intend to defend MGIC vigorously against any related legal proceedings.
In addition to matters for which we have recorded a probable loss, we are involved in other discussions and/or proceedings with insureds with respect to our claims paying practices. Although it is reasonably possible that when these matters are resolved we will not prevail in all cases, we are unable to make a reasonable estimate or range of estimates of the potential liability. We estimate the maximum exposure associated with matters where a loss is reasonably possible to be approximately $295 million, although we believe (but can give no assurance that) we will ultimately resolve these matters for significantly less than this amount. This estimate of our maximum exposure does not include interest or consequential or exemplary damages.
Although loan modification programs continued to mitigate our losses in 2016, the impact of modifications has been decreasing.
During 2015 and 2016, we were notified of modifications that cured delinquencies that had they become paid claims would have resulted in approximately $0.6 billion and $0.5 billion, respectively, of estimated claim payments. These levels are down from a high of $3.2 billion in 2010.
Another loss mitigation technique available to us is obtaining a deficiency judgment against the borrower and attempting to recover some or all of the paid claim from the borrower. Various factors, including state laws that limit or eliminate our ability to pursue deficiency judgments and borrowers’ financial conditions, have limited our recoveries in recent years to less than one-half of 1% of our paid claims.
Loss Reserves and Premium Deficiency Reserve
A significant period of time typically elapses between the time when a borrower defaults on a mortgage payment, which is the event triggering a potential future claim payment by us, the reporting of the default to us, the acquisition of the property by the lender (typically through foreclosure) or the sale of the property with our approval, and the eventual payment of the claim related to the uncured default or a rescission. To recognize the estimated liability for losses related to outstanding reported defaults, or default inventory, we establish loss reserves. Loss reserves are established by estimating the number of loans in our default inventory that will result in a claim payment, which is referred to as the claim rate, and further estimating the amount of the claim payment, which is referred to as claim severity. Our loss reserve estimates are established based upon historical experience, including rescission and curtailment activity. In accordance with GAAP for the mortgage insurance industry, we generally do not establish loss reserves for future claims on insured loans that are not currently in default.
We also establish reserves to provide for the estimated costs of settling claims, general expenses of administering the claims settlement process, legal fees and other fees (“loss adjustment expenses”), and for losses and loss adjustment expenses from defaults that have occurred, but which have not yet been reported to us.
Our reserving process bases our estimates of future events on our past experience. However, estimation of loss reserves is inherently judgmental and conditions that have affected the development of the loss reserves in the past may not necessarily affect development patterns in the future, in either a similar manner or degree. For further information, see our risk factors in
Item 1A
, including the ones titled “Because we establish loss reserves only upon a loan default rather than based on estimates of our ultimate losses on risk in force, losses may have a disproportionate adverse effect on our earnings in certain periods,” and “Because loss reserve estimates are subject to uncertainties, paid claims may be substantially different than our loss reserves.”
Our losses incurred from our RIF have declined in recent years in part due to the improving economy and the run-off of the insurance policies we wrote before the financial crisis, both of which resulted in fewer defaulted loans, as well as an improved cure rate on defaulted loans. Our losses incurred were $240.2 million in 2016, compared to $343.5 million in 2015 and $496.1 million in 2014.
After our reserves are initially established, we perform premium deficiency tests using best estimate assumptions as of the testing date. We establish a premium deficiency reserve, if necessary, when the present value of expected
MGIC Investment Corporation 2016 Form 10-K
|
20
future losses and expenses exceeds the present value of expected future premiums and already established reserves. In the fourth quarter of 2007, we recorded a premium deficiency reserve of $1.2 billion relating to Wall Street bulk transactions remaining in our IIF. That premium deficiency reserve was eliminated in the second quarter of 2015.
C. Investment Portfolio
Policy and Strategy
At December 31, 2016, the fair value of our investment portfolio was approximately $4.7 billion. In addition, at December 31, 2016, our total assets included approximately $155 million of cash and cash equivalents. At December 31, 2016, of our portfolio plus cash and cash equivalents, approximately $283 million was held by our parent company and the remainder was held by our subsidiaries, primarily MGIC.
As of December 31, 2016, approximately 79% of our investment portfolio (excluding cash and cash equivalents) was managed by Wellington Management Company, LLP, although we maintain overall control of investment policy and strategy. We maintain direct management of the remainder of our investment portfolio. Unless otherwise indicated, the remainder of the discussion regarding our investment portfolio refers to our investment portfolio only and not to cash and cash equivalents.
Our current investment policy emphasizes preservation of capital. Therefore, our investment portfolio consists almost entirely of high-quality, investment grade, fixed income securities. Our investment portfolio strategy encompasses tax efficiency. The mix of tax-exempt municipal securities in our investment portfolio will be dependent upon their relative value, determined by federal statutory tax rates, to taxable equivalent securities. The goal is maintain or grow net investment income through a combination of investment income and tax advantages. Also, our investment policies and strategies are subject to change depending upon regulatory, economic and market conditions and our existing or anticipated financial condition and operating requirements.
Our investment policies in effect at December 31, 2016 limit investments in the securities of a single issuer, other than the U.S. government, and generally limit the purchase of fixed income securities to those that are rated investment grade by at least one rating agency. They also limit the amount of investment in foreign governments and foreign domiciled securities and in any individual foreign country.
The aggregate market value of the holdings of a single obligor, or type of investment, as applicable, is limited to:
|
U.S. government securities
|
No limit
|
|
|
Pre-refunded municipals escrowed in Treasury securities
|
No limit
|
|
|
U.S. government agencies (in total)
(1)
|
15% of portfolio market value
|
|
|
Securities rated “AA” or “AAA”
|
3% of portfolio market value
|
|
|
Securities rated “BBB” or “A”
|
2% of portfolio market value
|
|
|
Foreign governments & foreign domiciled securities (in total)
|
10% of portfolio market value
|
|
|
Individual AAA rated foreign countries
|
3% of portfolio market value
|
|
|
Individual below AAA rated foreign countries
|
1% of portfolio market value
|
|
|
(1)
|
As used with respect to our investment portfolio, U.S. government agencies include GSEs (which, in the sector table below are included as part of U.S. Treasuries) and Federal Home Loan Banks.
|
For information about the credit ratings of securities in our investment portfolio and the portion of our investment portfolio that is insured by financial guarantors, see “Management’s Discussion and Analysis of Financial Condition and Results of Operations – Balance Sheet Analysis” in
Item 7
.
Investment Operations
At
December 31, 2016
, the sectors of our investment portfolio were as shown in the table below:
|
Percentage of
Portfolio’s
Fair Value
|
|
|
1. Corporate
|
38.4%
|
|
2. Tax-Exempt Municipals
|
28.3
|
|
3. Taxable Municipals
|
14.4
|
|
4. Asset Backed
|
9.4
|
|
5. GNMA Pass-through Certificates
|
4.8
|
|
6. Escrowed/Prerefunded Municipals
|
3.0
|
|
7. U.S. Treasuries
|
1.6
|
|
8. Equities and Other
|
0.1
|
|
100.0%
|
|
We had no derivative financial instruments in our investment portfolio. Securities with stated maturities due within up to one year, after one year and up to five years, after five years and up to ten years, and after ten years, represented 9%, 26%, 24% and 25%, respectively, of the total fair value of our investment in fixed income debt securities. ABS, RMBS, CMBS and CLOs representing 16% of the total fair value of our investment portfolio are not included in these maturity categories as the expected maturities may differ to the stated maturities based on the periodic payments during the
21
|
MGIC Investment Corporation 2016 Form 10-K
life of the security. Our pre-tax yield was 2.6%, 2.5% and 2.2% for 2016, 2015 and 2014, respectively.
Our ten largest holdings at
December 31, 2016
appear in the table below:
|
Fair Value
(In thousands)
|
|
|
1. Commercial Mortgage Trust
|
$49,736
|
|
2. Metropolitan Trans Auth NY
|
47,763
|
|
3. New York St Dorm Auth Rev
|
47,275
|
|
4. JP Morgan Chase
|
43,789
|
|
5. New York City NY Transitional
|
41,341
|
|
6. Chicago Airport Revenue
|
40,139
|
|
7. GS Mortgage Securities Trust
|
39,294
|
|
8. AT&T Inc.
|
34,781
|
|
9. General Electric Capital Corp
|
33,036
|
|
10. Morgan Stanley BAML Trust
|
31,112
|
|
$408,266
|
|
Note: This table excludes securities issued by the U.S. government, U.S. government agencies, the GSEs and the Federal Home Loan Banks.
For further information concerning investment operations, see
Note 5 – “Investments,”
to our consolidated financial statements in Item 8.
D. Regulation
Direct Regulation
We are subject to comprehensive, detailed regulation by state insurance departments. These regulations are principally designed for the protection of our insured policyholders, rather than for the benefit of investors. Although their scope varies, state insurance laws generally grant broad supervisory powers to agencies or officials to examine insurance companies and enforce rules or exercise discretion affecting almost every significant aspect of the insurance business.
In general, regulation of our subsidiaries’ business relates to:
|
•
|
licenses to transact business;
|
|
•
|
policy forms;
|
|
•
|
premium rates;
|
|
•
|
insurable loans;
|
|
•
|
annual and other reports on financial condition;
|
|
•
|
the basis upon which assets and liabilities must be stated;
|
|
•
|
requirements regarding contingency reserves equal to 50% of premiums earned;
|
|
•
|
minimum capital levels and adequacy ratios;
|
|
•
|
reinsurance requirements;
|
|
•
|
limitations on the types of investment instruments which may be held in an investment portfolio;
|
|
•
|
the size of risks and limits on coverage of individual risks which may be insured;
|
|
•
|
deposits of securities;
|
|
•
|
transactions among affiliates;
|
|
•
|
limits on dividends payable; and
|
|
•
|
claims handling.
|
The insurance laws of 16 jurisdictions, including Wisconsin, our domiciliary state, require a mortgage insurer to maintain a minimum amount of statutory capital relative to the RIF (or a similar measure) in order for the mortgage insurer to continue to write new business. We refer to these requirements as the “State Capital Requirements.” While they vary among jurisdictions, currently the most common State Capital Requirements allow for a maximum risk-to-capital ratio of 25 to 1. Wisconsin does not regulate capital by using a risk-to-capital measure but instead requires a minimum policyholder position. The “policyholder position” of a mortgage insurer is its net worth or surplus, contingency reserve and a portion of the reserves for unearned premiums.
At December 31, 2016, MGIC’s risk-to-capital ratio was 10.7 to 1, below the maximum allowed by the jurisdictions with State Capital Requirements, and its policyholder position was $1.6 billion above the required MPP of $1.1 billion.
The NAIC plans to revise the minimum capital and surplus requirements for mortgage insurers that are provided for in its Mortgage Guaranty Insurance Model Act. In 2016, a working group of state regulators released an exposure draft of a risk-based framework to establish capital requirements for mortgage insurers, although no date has been established by which the NAIC must propose revisions to the capital requirements. See our risk factors “We may not continue to meet the GSEs’ mortgage insurer eligibility requirements and our returns may decrease as we are required to maintain significantly more capital in order to maintain our eligibility” and “State Capital requirements may prevent us from continuing to write new insurance on an uninterrupted basis” in
Item 1A,
for information about regulations governing our capital adequacy and our expectations regarding our future capital position. See "Management's Discussion and Analysis – Regulatory Capital Adequacy" in Item 7 for information about our current capital position.
MGIC Investment Corporation 2016 Form 10-K
|
22
Most states also regulate transactions between insurance companies and their parents or affiliates and have restrictions on transactions that have the effect of inducing lenders to place business with the insurer. For a description of limits on dividends payable to us from MGIC, see
Note 14 – “Statutory Information,”
to our consolidated financial statements in Item 8.
Mortgage insurance premium rates are also subject to state regulation to protect policyholders against the adverse effects of excessive, inadequate or unfairly discriminatory rates and to encourage competition in the insurance marketplace. Any increase in premium rates must be justified, generally on the basis of the insurer’s loss experience, expenses and future trend analysis. The general mortgage default experience may also be considered. Premium rates are subject to review and challenge by state regulators.
We are required to establish statutory accounting contingency loss reserves in an amount equal to 50% of net earned premiums. These amounts cannot be withdrawn for a period of 10 years, except as permitted by insurance regulations. With regulatory approval a mortgage guaranty insurance company may make early withdrawals from the contingency reserve when incurred losses exceed 35% of net premiums earned in a calendar year. For further information, see
Note 14 – “Statutory Information,”
to our consolidated financial statements in Item 8.
Mortgage insurers are generally single-line companies, restricted to writing residential mortgage insurance business only. Although we, as an insurance holding company, are prohibited from engaging in certain transactions with MGIC or our other insurance subsidiaries without submission to and, in some instances, prior approval by applicable insurance departments, we are not subject to insurance company regulation on our non-insurance businesses.
Wisconsin’s insurance regulations generally provide that no person may acquire control of us unless the transaction in which control is acquired has been approved by the OCI. The regulations provide for a rebuttable presumption of control when a person owns or has the right to vote more than 10% of the voting securities. In addition, the insurance regulations of other states in which MGIC is licensed require notification to the state’s insurance department a specified time before a person acquires control of us. If regulators in these states disapprove the change of control, our licenses to conduct business in the disapproving states could be terminated. For further information about regulatory proceedings applicable to us and our industry, see “We are involved in legal proceedings and are
subject to the risk of additional legal proceedings in the future” in
Item 1A
.
The CFPB was established by the Dodd-Frank Act to regulate the offering and provision of consumer financial products or services under federal law. The CFPB’s 2014 rules implementing laws that require mortgage lenders to make ability-to-pay determinations prior to extending credit affected the characteristics of loans being originated and the volume of loans available to be insured. We are uncertain whether the CFPB will issue any other rules or regulations that affect our business. Such rules and regulations could have a material adverse effect on us.
As the most significant purchasers and sellers of conventional mortgage loans and beneficiaries of private mortgage insurance, Freddie Mac and Fannie Mae impose financial and other requirements on private mortgage insurers in order for them to be eligible to insure loans sold to the GSEs (these requirements are referred to as the "PMIERs", as discussed above). These requirements are subject to change from time to time. Based on our interpretation of the financial requirements of the PMIERs, as of December 31, 2016, MGIC’s Available Assets are $4.7 billion and its Minimum Required Assets are $4.1 billion; and MGIC is in compliance with the requirements of the PMIERs and eligible to insure loans purchased by the GSEs. If MGIC ceases to be eligible to insure loans purchased by one or both of the GSEs, it would significantly reduce the volume of our new business writings. For information about matters that could be negatively affect our compliance with the PMIERs, see our risk factor titled “We may not continue to meet the GSEs’ mortgage insurer eligibility requirements and our returns may decrease as we are required to maintain significantly more capital in order to maintain our eligibility” in
Item 1A
.
The FHFA is the conservator of the GSEs and has the authority to control and direct their operations. The increased role that the federal government has assumed in the residential mortgage market through the GSE conservatorship may increase the likelihood that the business practices of the GSEs change in ways that have a material adverse effect on us. In addition, these factors may increase the likelihood that the charters of the GSEs are changed by new federal legislation. In the past, members of Congress introduced several bills intended to scale back the GSEs; however, no legislation has been enacted. The new Presidential administration has indicated that the conservatorship of the GSEs should end; however, it is unclear whether and when that would occur and how that would impact us. As a result of the matters referred to above, it is uncertain what role the GSEs, FHA and private capital, including private mortgage insurance, will play in the domestic residential housing finance system in the future or the impact of any such changes on our business. In addition, the timing of the impact of any resulting changes on our business is uncertain. Most meaningful changes would require Congressional action to implement and it is
23
|
MGIC Investment Corporation 2016 Form 10-K
difficult to estimate when Congressional action would be final and how long any associated phase-in period may last. For additional information about the potential impact that any such changes in the GSE’s roles may have on us, see the risk factor titled “Changes in the business practices of the GSEs, federal legislation that changes their charters or a restructuring of the GSEs could reduce our revenues or increase our losses” in
Item 1A
.
In December 2013, the U.S. Treasury Department’s Federal Insurance Office released a report that calls for federal standards and oversight for mortgage insurers to be developed and implemented. It is uncertain what form the standards and oversight will take and when and if they will become effective.
Indirect Regulation
We are also indirectly, but significantly, impacted by regulations affecting purchasers of mortgage loans, such as Freddie Mac and Fannie Mae, and regulations affecting governmental insurers, such as the FHA and the VA, and lenders. See our risk factor titled “Changes in the business practices of the GSEs, federal legislation that changes their charters or a restructuring of the GSEs could reduce our revenues or increase our losses” in Item 1A for a discussion of how potential changes in the GSEs’ business practices could affect us. Private mortgage insurers, including MGIC, are highly dependent upon federal housing legislation and other laws and regulations to the extent they affect the demand for private mortgage insurance and the housing market generally. From time to time, those laws and regulations have been amended to affect competition from government agencies. Proposals are discussed from time to time by Congress and certain federal agencies to reform or modify the FHA and the Government National Mortgage Association, which securitizes mortgages insured by the FHA.
Subject to certain exceptions, in general, RESPA prohibits any person from giving or receiving any “thing of value” pursuant to an agreement or understanding to refer settlement services.
The Office of the Comptroller of the Currency, the Federal Reserve Board, and the Federal Deposit Insurance Corporation have uniform guidelines on real estate lending by insured lending institutions under their supervision. The guidelines specify that a residential mortgage loan originated with a loan-to-value ratio of 90% or greater should have appropriate credit enhancement in the form of mortgage insurance or readily marketable collateral, although no depth of coverage percentage is specified in the guidelines.
Lenders are subject to various laws, including the Home Mortgage Disclosure Act, the Community Reinvestment Act and the Fair Housing Act, and Fannie Mae and Freddie Mac are subject to various laws, including laws relating to government sponsored enterprises, which may impose obligations or create incentives for increased lending to low and moderate income persons, or in targeted areas.
There can be no assurance that other federal laws and regulations affecting these institutions and entities will not change, or that new legislation or regulations will not be adopted which will adversely affect the private mortgage insurance industry. In this regard, see the risk factor titled “Changes in the business practices of the GSEs, federal legislation that changes their charters or a restructuring of the GSEs could reduce our revenues or increase our losses” in
Item 1A
.
E. Employees
At
December 31, 2016
, we had 823 full- and part-time employees, approximately 34% of whom were assigned to our field offices. The number of employees given above does not include “on-call” employees. The number of “on-call” employees can vary substantially, primarily as a result of changes in demand for contract underwriting services. In recent years, the number of “on-call” employees has ranged from fewer than 70 to more than 220.
F. Website Access
We make available, free of charge, through our Internet website our Annual Reports on Form 10-K, Quarterly Reports on Form 10-Q, Current Reports on Form 8-K, and amendments to those reports filed or furnished pursuant to Section 13(a) or 15(d) of the Securities Exchange Act of 1934 as soon as reasonably practicable after we electronically file these materials with the Securities and Exchange Commission. The address of our website is http://mtg.mgic.com, and such reports and amendments are accessible through the “Reports & Filings” link at such address. The inclusion of our website address in this report is an inactive textual reference only and is not intended to include or incorporate by reference the information on our website into this report.
MGIC Investment Corporation 2016 Form 10-K
|
24
|
Risk Factors
|
|||||
Item 1A.
Risk Factors
As used below, “we,” “our” and “us” refer to MGIC Investment Corporation’s consolidated operations or to MGIC Investment Corporation, as the context requires; “MGIC” refers to Mortgage Guaranty Insurance Corporation; and “MIC” refers to MGIC Indemnity Corporation.
Our actual results could be affected by the risk factors below. These risk factors are an integral part of this annual report. These risk factors may also cause actual results to differ materially from the results contemplated by forward looking statements that we may make. Forward looking statements consist of statements which relate to matters other than historical fact, including matters that inherently refer to future events. Among others, statements that include words such as “believe,” “anticipate,” “will” or “expect,” or words of similar import, are forward looking statements. We are not undertaking any obligation to update any forward looking statements or other statements we may make even though these statements may be affected by events or circumstances occurring after the forward looking statements or other statements were made. No reader of this annual report should rely on these statements being current at any time other than the time at which this annual report was filed with the Securities and Exchange Commission.
Competition or changes in our relationships with our customers could reduce our revenues, reduce our premium yields and / or increase our losses.
Our private mortgage insurance competitors include:
|
•
|
Arch Mortgage Insurance Company, which completed its acquisition of United Guaranty Residential Insurance Company in the fourth quarter of 2016,
|
|
•
|
Essent Guaranty, Inc.,
|
|
•
|
Genworth Mortgage Insurance Corporation,
|
|
•
|
National Mortgage Insurance Corporation, and
|
|
•
|
Radian Guaranty Inc.
|
The private mortgage insurance industry is highly competitive and is expected to remain so. We believe that we currently compete with other private mortgage insurers based on pricing, underwriting requirements, financial strength (including based on credit or financial strength ratings), customer relationships, name recognition, reputation, the strength of our management team and field
organization, the ancillary products and services provided to lenders (including contract underwriting services), the depth of our databases covering insured loans and the effective use of technology and innovation in the delivery and servicing of our mortgage insurance products.
Much of the competition in the industry has centered on pricing practices which, in the last few years included: (i) reductions in standard filed rates on borrower-paid policies, (ii) use by certain competitors of a spectrum of filed rates to allow for formulaic, risk-based pricing (commonly referred to as “black-box” pricing); and (iii) use of customized rates (discounted from published rates) on lender-paid, single premium policies. The willingness of mortgage insurers to offer reduced pricing (through filed or customized rates) has been met with an increased demand from various lenders for reduced rate products. There can be no assurance that pricing competition will not intensify further, which could result in a decrease in our new insurance written and/or returns.
In each of 2015 and 2016, approximately
5%
of our new insurance written was for loans for which one lender was the original insured. Our relationships with our customers could be adversely affected by a variety of factors, including if our premium rates are higher than those of our competitors, our underwriting requirements result in our declining to insure some of the loans originated by our customers, or our insurance rescissions and curtailments affect the customer.
Substantially all of our insurance written since 2008 has been for loans purchased by Fannie Mae and Freddie Mac (the "GSEs"). The current private mortgage insurer eligibility requirements ("PMIERs") of the GSEs require a mortgage insurer to maintain a minimum amount of assets to support its insured risk, as discussed in our risk factor titled
“We may not continue to meet the GSEs’ private mortgage insurer eligibility requirements and our returns may decrease as we are required to maintain more capital in order to maintain our eligibility.”
The PMIERs do not require an insurer to maintain minimum financial strength ratings; however, our financial strength ratings can affect us in the following ways:
|
•
|
A downgrade in our financial strength ratings could result in increased scrutiny of our financial condition by our customers, potentially resulting in a decrease in the amount of our new insurance written.
|
|
•
|
Our ability to participate in the non-GSE mortgage market (which has been limited since the financial crisis, but may grow in the future), could depend on our
|
25
|
MGIC Investment Corporation 2016 Form 10-K
ability to maintain and improve our investment grade ratings for our mortgage insurance subsidiaries. We could be competitively disadvantaged with some market participants because the financial strength ratings of our insurance subsidiaries are lower than those of some competitors. MGIC's financial strength rating from Moody’s is
Baa3
(with a
stable
outlook) and from Standard & Poor’s is BBB+ (with a
stable
outlook).
|
•
|
Financial strength ratings may also play a greater role if the GSEs no longer operate in their current capacities, for example, due to legislative or regulatory action. In addition, although the PMIERs do not require minimum financial strength ratings, the GSEs consider financial strength ratings to be important when utilizing forms of credit enhancement other than traditional mortgage insurance, including in the credit risk transfer offering discussed in our risk factor titled
"The amount of insurance we write could be adversely affected if lenders and investors select alternatives to private mortgage insurance."
If we are unable to compete effectively in the current or any future markets as a result of the financial strength ratings assigned to our insurance subsidiaries, our future new insurance written could be negatively affected.
|
The amount of insurance we write could be adversely affected if lenders and investors select alternatives to private mortgage insurance.
Alternatives to private mortgage insurance include:
|
•
|
lenders using FHA, VA and other government mortgage insurance programs,
|
|
•
|
lenders and other investors holding mortgages in portfolio and self-insuring,
|
|
•
|
investors using risk mitigation and credit risk transfer techniques other than private mortgage insurance, and
|
|
•
|
lenders originating mortgages using piggyback structures to avoid private mortgage insurance, such as a first mortgage with an 80% loan-to-value ratio and a second mortgage with a 10%, 15% or 20% loan-to-value ratio (referred to as 80-10-10, 80-15-5 or 80-20 loans, respectively) rather than a first mortgage with a 90%, 95% or 100% loan-to-value ratio that has private mortgage insurance.
|
Investors (including the GSEs) have used risk mitigation and credit risk transfer techniques other than private mortgage insurance, such as obtaining insurance from non-mortgage insurers, engaging in credit-linked note transactions executed in the capital markets, or using other forms of debt issuances or securitizations that transfer credit risk directly
to other investors; using other risk mitigation techniques in conjunction with reduced levels of private mortgage insurance coverage; or accepting credit risk without credit enhancement. Although the risk mitigation and credit risk transfer techniques used by the GSEs in the past several years have not displaced primary mortgage insurance, we cannot predict the impact of future transactions. In the second half of 2016, the GSEs each launched a new credit risk transfer offering that involved forward credit insurance policies written by a panel of mortgage insurance company affiliates, including an affiliate of MGIC. The policies provide additional coverage beyond the primary mortgage insurance on 30-year fixed-rate mortgages with 80-95% loan-to-value ratios ("LTVs"). It is difficult to predict the amount of risk that will be insured under such transactions in the future. The amount of capital we have allocated to this pilot program and the associated premiums are immaterial. Future participation in credit risk transfers will need to be evaluated based upon the terms offered and expected returns.
The FHA's share of the low down payment residential mortgages that were subject to FHA, VA or primary private mortgage insurance was an estimated 36.4% in 2016, compared to 40.4% in 2015 and 33.9% in 2014. In the past ten years, the FHA’s share has been as low as 15.5% in 2006 and as high as 70.8% in 2009. Factors that influence the FHA’s market share include relative rates and fees, underwriting guidelines and loan limits of the FHA, VA, private mortgage insurers and the GSEs; lenders' perceptions of legal risks under FHA versus GSE programs; flexibility for the FHA to establish new products as a result of federal legislation and programs; returns expected to be obtained by lenders for Ginnie Mae securitization of FHA-insured loans compared to those obtained from selling loans to Fannie Mae or Freddie Mac for securitization; and differences in policy terms, such as the ability of a borrower to cancel insurance coverage under certain circumstances. In January 2017, the FHA announced a significant premium reduction, however, the new Presidential administration suspended the rate reduction indefinitely. We cannot predict how the factors that affect the FHA’s share of new insurance written will change in the future.
The VA's share of the low down payment residential mortgages that were subject to FHA, VA or primary private mortgage insurance was an estimated 27.3% in 2016, compared to 24.6% in 2015 and 25.4% in 2014. The VA’s 2016 market share was its highest in the past ten years and its lowest market share in the past ten years was 5.4% in 2007. We believe that the VA’s market share has generally been increasing because the VA offers 100% LTV loans and charges a one-time funding fee that can be included in the loan amount but no additional monthly expense, and because of an increase in the number of borrowers who are eligible for the VA’s program.
MGIC Investment Corporation 2016 Form 10-K
|
26
|
Risk Factors
|
|||||
Changes in the business practices of the GSEs, federal legislation that changes their charters or a restructuring of the GSEs could reduce our revenues or increase our losses.
The GSEs’ charters generally require credit enhancement for a low down payment mortgage loan (a loan amount that exceeds 80% of a home’s value) in order for such loan to be eligible for purchase by the GSEs. Lenders generally have used private mortgage insurance to satisfy this credit enhancement requirement and low down payment mortgages purchased by the GSEs generally are insured with private mortgage insurance. As a result, the business practices of the GSEs greatly impact our business and include:
|
•
|
private mortgage insurer eligibility requirements of the GSEs (for information about the financial requirements included in the PMIERs, see our risk factor titled
“We may not continue to meet the GSEs’ private mortgage insurer eligibility requirements and our returns may decrease as we are required to maintain more capital in order to maintain our eligibility”
),
|
|
•
|
the level of private mortgage insurance coverage, subject to the limitations of the GSEs’ charters (which may be changed by federal legislation), when private mortgage insurance is used as the required credit enhancement on low down payment mortgages,
|
|
•
|
the amount of loan level price adjustments and guaranty fees (which result in higher costs to borrowers) that the GSEs assess on loans that require private mortgage insurance,
|
|
•
|
whether the GSEs influence the mortgage lender’s selection of the mortgage insurer providing coverage and, if so, any transactions that are related to that selection,
|
|
•
|
the underwriting standards that determine which loans are eligible for purchase by the GSEs, which can affect the quality of the risk insured by the mortgage insurer and the availability of mortgage loans,
|
|
•
|
the terms on which mortgage insurance coverage can be canceled before reaching the cancellation thresholds established by law,
|
|
•
|
the programs established by the GSEs intended to avoid or mitigate loss on insured mortgages and the circumstances in which mortgage servicers must implement such programs,
|
|
•
|
the terms that the GSEs require to be included in mortgage insurance policies for loans that they purchase,
|
|
•
|
the terms on which the GSEs offer lenders relief on their representations and warranties made at the time of sale of a loan to the GSEs, which creates pressure on mortgage insurers to limit their rescission rights to conform to such relief, and the extent to which the GSEs intervene in mortgage insurers’ rescission practices or rescission settlement practices with lenders,
and
|
|
•
|
the maximum loan limits of the GSEs in comparison to those of the FHA and other investors.
|
The Federal Housing Finance Agency (“FHFA”) has been the conservator of the GSEs since 2008 and has the authority to control and direct their operations. The increased role that the federal government has assumed in the residential housing finance system through the GSE conservatorship may increase the likelihood that the business practices of the GSEs change in ways that have a material adverse effect on us and that the charters of the GSEs are changed by new federal legislation. In the past, members of Congress have introduced several bills intended to change the business practices of the GSEs and the FHA; however, no legislation has been enacted. The new Presidential administration has indicated that the conservatorship of the GSEs should end; however, it is unclear whether and when that would occur and how that would impact us. As a result of the matters referred to above, it is uncertain what role the GSEs, FHA and private capital, including private mortgage insurance, will play in the residential housing finance system in the future or the impact of any such changes on our business. In addition, the timing of the impact of any resulting changes on our business is uncertain. Most meaningful changes would require Congressional action to implement and it is difficult to estimate when Congressional action would be final and how long any associated phase-in period may last.
We may not continue to meet the GSEs’ private mortgage insurer eligibility requirements and our returns may decrease as we are required to maintain more capital in order to maintain our eligibility.
We must comply with the PMIERs to be eligible to insure loans purchased by the GSEs. The PMIERs include financial requirements, as well as business, quality control and certain transaction approval requirements. The financial requirements of the PMIERs require a mortgage insurer’s “Available Assets” (generally only the most liquid assets of an insurer) to equal or exceed its “Minimum Required Assets” (which are based on an insurer’s book and are calculated from tables of factors with several risk dimensions and are subject to a floor amount). Based on our interpretation of the PMIERs, as of December 31, 2016, MGIC’s Available Assets are
$4.7 billion
and its Minimum Required Assets are
$4.1 billion
. MGIC is in compliance with the PMIERs and eligible to insure loans purchased by the GSEs.
27
|
MGIC Investment Corporation 2016 Form 10-K
If MGIC ceases to be eligible to insure loans purchased by one or both of the GSEs, it would significantly reduce the volume of our new business writings. Factors that may negatively impact MGIC’s ability to continue to comply with the financial requirements of the PMIERs include the following:
|
•
|
The GSEs could make the PMIERs more onerous in the future; in this regard, the PMIERs provide that the tables of factors that determine Minimum Required Assets will be updated every two years and may be updated more frequently to reflect changes in macroeconomic conditions or loan performance. The GSEs will provide notice 180 days prior to the effective date of table updates. In addition, the GSEs may amend the PMIERs at any time.
|
|
•
|
The GSEs may reduce the amount of credit they allow under the PMIERs for the risk ceded under our quota share reinsurance transaction. The GSEs’ ongoing approval of that transaction is subject to several conditions and the transaction will be reviewed under the PMIERs at least annually by the GSEs. For more information about the transaction, see our risk factor titled “
The mix of business we write affects our Minimum Required Assets under the PMIERs, our premium yields and the likelihood of losses occurring.”
|
|
•
|
Our future operating results may be negatively impacted by the matters discussed in the rest of these risk factors. Such matters could decrease our revenues, increase our losses or require the use of assets, thereby creating a shortfall in Available Assets.
|
|
•
|
Should capital be needed by MGIC in the future, capital contributions from our holding company may not be available due to competing demands on holding company resources, including for repayment of debt.
|
While on an overall basis, the amount of Available Assets MGIC must hold in order to continue to insure GSE loans increased under the PMIERs over what state regulation currently requires, our reinsurance transaction mitigates the negative effect of the PMIERs on our returns. In this regard, see the second bullet point above.
The benefit of our net operating loss carryforwards may become substantially limited.
As of December 31, 2016, we had approximately
$1.5 billion
of net operating losses for tax purposes that we can use in certain circumstances to offset future taxable income and thus reduce our federal income tax liability. Any unutilized carryforwards are scheduled to expire at the end of tax years 2030 through 2033. Our ability to utilize these net operating losses to offset future taxable income may be significantly
limited if we experience an “ownership change” as defined in Section 382 of the Internal Revenue Code of 1986, as amended (the “Code”). In general, an ownership change will occur if there is a cumulative change in our ownership by “5-percent shareholders” (as defined in the Code) that exceeds 50 percentage points over a rolling three-year period. A corporation that experiences an ownership change will generally be subject to an annual limitation on the corporation’s subsequent use of net operating loss carryovers that arose from pre-ownership change periods and use of losses that are subsequently recognized with respect to assets that had a built-in-loss on the date of the ownership change. The amount of the annual limitation generally equals the fair value of the corporation immediately before the ownership change multiplied by the long-term tax-exempt interest rate (subject to certain adjustments). To the extent that the limitation in a post-ownership-change year is not fully utilized, the amount of the limitation for the succeeding year will be increased.
While we have adopted our Amended and Restated Rights Agreement to minimize the likelihood of transactions in our stock resulting in an ownership change, future issuances of equity-linked securities or transactions in our stock and equity-linked securities that may not be within our control may cause us to experience an ownership change. If we experience an ownership change, we may not be able to fully utilize our net operating losses, resulting in additional income taxes and a reduction in our shareholders’ equity.
As of December 31, 2016, our deferred tax asset is recorded at $607.7 million, which relates primarily to the future tax effects of our prior year net operating losses expected to be carried forward to offset future taxable income. A decrease in the federal statutory income tax rate will result in a one-time reduction in the amount at which our deferred tax asset is recorded, thereby reducing our net income and book value in that period; however, such a decrease will also reduce our effective income tax rate, thereby increasing net income in future periods.
We are involved in legal proceedings and are subject to the risk of additional legal proceedings in the future.
Before paying an insurance claim, we review the loan and servicing files to determine the appropriateness of the claim amount. When reviewing the files, we may determine that we have the right to rescind coverage on the loan. In our SEC reports, we refer to insurance rescissions and denials of claims collectively as “rescissions” and variations of that term. In addition, all of our insurance policies provide that we can reduce or deny a claim if the servicer did not comply with its obligations under our insurance policy. We call such reduction of claims “curtailments.” In recent quarters, an immaterial percentage of claims received in a quarter have been resolved by rescissions. In 2015 and 2016,
MGIC Investment Corporation 2016 Form 10-K
|
28
|
Risk Factors
|
|||||
curtailments reduced our average claim paid by approximately 6.7% and
5.5%
, respectively.
Our loss reserving methodology incorporates our estimates of future rescissions, curtailments, and reversals of rescissions and curtailments. A variance between ultimate actual rescission, curtailment and reversal rates and our estimates, as a result of the outcome of litigation, settlements or other factors, could materially affect our losses.
When the insured disputes our right to rescind coverage or curtail claims, we generally engage in discussions in an attempt to settle the dispute. If we are unable to reach a settlement, the outcome of a dispute ultimately would be determined by legal proceedings.
Under ASC 450-20, until a liability associated with settlement discussions or legal proceedings becomes probable and can be reasonably estimated, we consider our claim payment or rescission resolved for financial reporting purposes and do not accrue an estimated loss. Where we have determined that a loss is probable and can be reasonably estimated, we have recorded our best estimate of our probable loss. If we are not able to implement settlements we consider probable, we intend to defend MGIC vigorously against any related legal proceedings.
In addition to matters for which we have recorded a probable loss, we are involved in other discussions and/or proceedings with insureds with respect to our claims paying practices. Although it is reasonably possible that when these matters are resolved we will not prevail in all cases, we are unable to make a reasonable estimate or range of estimates of the potential liability. We estimate the maximum exposure associated with matters where a loss is reasonably possible to be approximately
$295 million
, although we believe (but can give no assurance that) we will ultimately resolve these matters for significantly less than this amount. This estimate of our maximum exposure does not include interest or consequential or exemplary damages.
Mortgage insurers, including MGIC, have been involved in litigation and regulatory actions related to alleged violations of the anti-referral fee provisions of the Real Estate Settlement Procedures Act, which is commonly known as RESPA, and the notice provisions of the Fair Credit Reporting Act, which is commonly known as FCRA. While these proceedings in the aggregate have not resulted in material liability for MGIC, there can be no assurance that the outcome of future proceedings under these laws, if any, would not have a material adverse affect on us. In addition, various regulators, including the CFPB, state insurance commissioners and state attorneys general may bring other actions seeking various forms of relief in connection with
alleged violations of RESPA. The insurance law provisions of many states prohibit paying for the referral of insurance business and provide various mechanisms to enforce this prohibition. While we believe our practices are in conformity with applicable laws and regulations, it is not possible to predict the eventual scope, duration or outcome of any such reviews or investigations nor is it possible to predict their effect on us or the mortgage insurance industry.
In addition to the matters described above, we are involved in other legal proceedings in the ordinary course of business. In our opinion, based on the facts known at this time, the ultimate resolution of these ordinary course legal proceedings will not have a material adverse effect on our financial position or results of operations.
We are subject to comprehensive regulation and other requirements, which we may fail to satisfy.
We are subject to comprehensive, detailed regulation by state insurance departments. These regulations are principally designed for the protection of our insured policyholders, rather than for the benefit of investors. Although their scope varies, state insurance laws generally grant broad supervisory powers to agencies or officials to examine insurance companies and enforce rules or exercise discretion affecting almost every significant aspect of the insurance business. State insurance regulatory authorities could take actions, including changes in capital requirements, that could have a material adverse effect on us. For more information about state capital requirements, see our risk factor titled “
State capital requirements may prevent us from continuing to write new insurance on an uninterrupted basis.
”
To the extent that we are construed to make independent credit decisions in connection with our contract underwriting activities, we also could be subject to increased regulatory requirements under the Equal Credit Opportunity Act, commonly known as ECOA, the FCRA, and other laws. For more details about the various ways in which our subsidiaries are regulated, see “Regulation” in Item 1 of this Annual Report. In addition to regulation by state insurance regulators, the CFPB may issue additional rules or regulations, which may materially affect our business.
In December 2013, the U.S. Treasury Department’s Federal Insurance Office released a report that calls for federal standards and oversight for mortgage insurers to be developed and implemented. It is uncertain what form the standards and oversight will take and when they will become effective.
29
|
MGIC Investment Corporation 2016 Form 10-K
Resolution of our dispute with the Internal Revenue Service could adversely affect us.
The Internal Revenue Service (“IRS”) completed examinations of our federal income tax returns for the years 2000 through 2007 and issued proposed assessments for taxes, interest and penalties related to our treatment of the flow-through income and loss from an investment in a portfolio of residual interests of Real Estate Mortgage Investment Conduits (“REMICs”). The IRS indicated that it did not believe that, for various reasons, we had established sufficient tax basis in the REMIC residual interests to deduct the losses from taxable income. We appealed these assessments within the IRS and in August 2010, we reached a tentative settlement agreement with the IRS which was not finalized.
In 2014, we received Notices of Deficiency (commonly referred to as “90 day letters”) covering the 2000-2007 tax years. The Notices of Deficiency reflect taxes and penalties related to the REMIC matters of $197.5 million and at December 31, 2016, there would also be interest related to these matters of approximately
$200.6 million
. In 2007, we made a payment of $65.2 million to the United States Department of the Treasury which will reduce any amounts we would ultimately owe. The Notices of Deficiency also reflect additional amounts due of $261.4 million, which are primarily associated with the disallowance of the carryback of the 2009 net operating loss to the 2004-2007 tax years. We believe the IRS included the carryback adjustments as a precaution to keep open the statute of limitations on collection of the tax that was refunded when this loss was carried back, and not because the IRS actually intends to disallow the carryback permanently. Depending on the outcome of this matter, additional state income taxes and state interest may become due when a final resolution is reached. As of December 31, 2016, those state taxes and interest would approximate
$50.7 million
. In addition, there could also be state tax penalties. Our total amount of unrecognized tax benefits as of December 31, 2016 is
$108.2 million
, which represents the tax benefits generated by the REMIC portfolio included in our tax returns that we have not taken benefit for in our financial statements, including any related interest.
We filed a petition with the U.S. Tax Court contesting most of the IRS’ proposed adjustments reflected in the Notices of Deficiency and the IRS filed an answer to our petition which continued to assert their claim. The case has twice been scheduled for trial and in each instance, the parties jointly filed, and the U.S. Tax Court approved (most recently in February 2016), motions for continuance to postpone the trial date. Also in February 2016, the U.S. Tax Court approved a joint motion to consolidate for trial, briefing, and opinion, our case with similar cases of Radian Group, Inc., as successor to Enhance Financial Services Group, Inc., et al.
In January 2017, the parties informed the Tax Court that they had reached a basis for settlement of the major issues in the case. Any agreed settlement terms will ultimately be subject to review by the Joint Committee on Taxation (“JCT”) before a settlement can be completed and there is no assurance that a settlement will be completed. Based on information that we currently have regarding the status of our ongoing dispute, we expect to record a provision for additional taxes and interest of $15-25 million in the first quarter of 2017.
Should a settlement not be completed, ongoing litigation to resolve our dispute with the IRS could be lengthy and costly in terms of legal fees and related expenses. We would need to make further adjustments, which could be material, to our tax provision and liabilities if our view of the probability of success in this matter changes, and the ultimate resolution of this matter could have a material negative impact on our effective tax rate, results of operations, cash flows, available assets and statutory capital. In this regard, see our risk factors titled
“We may not continue to meet the GSEs’ private mortgage insurer eligibility requirements and our returns may decrease as we are required to maintain more capital in order to maintain our eligibility
” and “
State capital requirements may prevent us from continuing to write new insurance on an uninterrupted basis
.”
Because we establish loss reserves only upon a loan default rather than based on estimates of our ultimate losses on risk in force, losses may have a disproportionate adverse effect on our earnings in certain periods.
In accordance with accounting principles generally accepted in the United States, commonly referred to as GAAP, we establish reserves for insurance losses and loss adjustment expenses only when notices of default on insured mortgage loans are received and for loans we estimate are in default but for which notices of default have not yet been reported to us by the servicers (this is often referred to as “IBNR”). Because our reserving method does not take account of losses that could occur from loans that are not delinquent, such losses are not reflected in our financial statements, except in the case where a premium deficiency exists. As a result, future losses on loans that are not currently delinquent may have a material impact on future results as such losses emerge.
Because loss reserve estimates are subject to uncertainties, paid claims may be substantially different than our loss reserves.
When we establish reserves, we estimate the ultimate loss on delinquent loans using estimated claim rates and claim amounts. The estimated claim rates and claim amounts represent our best estimates of what we will actually pay on the loans in default as of the reserve date and incorporate
MGIC Investment Corporation 2016 Form 10-K
|
30
|
Risk Factors
|
|||||
anticipated mitigation from rescissions and curtailments. The establishment of loss reserves is subject to inherent uncertainty and requires judgment by management. The actual amount of the claim payments may be substantially different than our loss reserve estimates. Our estimates could be affected by several factors, including a change in regional or national economic conditions, and a change in the length of time loans are delinquent before claims are received. The change in conditions may include changes in unemployment, affecting borrowers’ income and thus their ability to make mortgage payments, and changes in housing values, which may affect borrower willingness to continue to make mortgage payments when the value of the home is below the mortgage balance. Changes to our estimates could have a material impact on our future results, even in a stable economic environment. In addition, historically, losses incurred have followed a seasonal trend in which the second half of the year has weaker credit performance than the first half, with higher new default notice activity and a lower cure rate.
We rely on our management team and our business could be harmed if we are unable to retain qualified personnel or successfully develop and/or recruit their replacements.
Our success depends, in part, on the skills, working relationships and continued services of our management team and other key personnel. The unexpected departure of key personnel could adversely affect the conduct of our business. In such event, we would be required to obtain other personnel to manage and operate our business. In addition, we will be required to replace the knowledge and expertise of our aging workforce as our workers retire. In either case, there can be no assurance that we would be able to develop or recruit suitable replacements for the departing individuals; that replacements could be hired, if necessary, on terms that are favorable to us; or that we can successfully transition such replacements in a timely manner. We currently have not entered into any employment agreements with our officers or key personnel. Volatility or lack of performance in our stock price may affect our ability to retain our key personnel or attract replacements should key personnel depart. Without a properly skilled and experienced workforce, our costs, including productivity costs and costs to replace employees may increase, and this could negatively impact our earnings.
Loan modification and other similar programs may not continue to provide substantial benefits to us.
The federal government, including through the U.S. Department of the Treasury and the GSEs, and several lenders have modification and refinance programs to make loans more affordable to borrowers with the goal of reducing the number of foreclosures. These programs include the Home Affordable Modification Program (“HAMP”) and the
Home Affordable Refinance Program (“HARP”). During 2015 and 2016, we were notified of modifications that cured delinquencies that had they become paid claims would have resulted in approximately $0.6 billion and
$0.5 billion
, respectively, of estimated claim payments. These levels are down from a high of $3.2 billion in 2010.
HAMP expired at the end of 2016 and although HARP has been extended through September 2017,we believe that we have realized the majority of the benefits from that program because the number of loans insured by us that we are aware are entering that program has decreased significantly. The GSEs have introduced the "Flex Modification" program to replace HAMP effective in October 2017. Until it becomes effective, loan servicers must still evaluate borrowers for other GSE modification programs.
We cannot determine the total benefit we may derive from loan modification programs, particularly given the uncertainty around the re-default rates for defaulted loans that have been modified. Our loss reserves do not account for potential re-defaults of current loans.
If the volume of low down payment home mortgage originations declines, the amount of insurance that we write could decline.
The factors that affect the volume of low down payment mortgage originations include:
|
•
|
restrictions on mortgage credit due to more stringent underwriting standards, liquidity issues or risk-retention and/or capital requirements affecting lenders,
|
|
•
|
the level of home mortgage interest rates and the deductibility of mortgage interest or mortgage insurance premiums for income tax purposes,
|
|
•
|
the health of the domestic economy as well as conditions in regional and local economies and the level of consumer confidence,
|
|
•
|
housing affordability,
|
|
•
|
population trends, including the rate of household formation,
|
|
•
|
the rate of home price appreciation, which in times of heavy refinancing can affect whether refinanced loans have loan-to-value ratios that require private mortgage insurance, and
|
|
•
|
government housing policy encouraging loans to first-time homebuyers.
|
31
|
MGIC Investment Corporation 2016 Form 10-K
A decline in the volume of low down payment home mortgage originations could decrease demand for mortgage insurance and decrease our new insurance written . For other factors that could decrease the demand for mortgage insurance, see our risk factor titled
“The amount of insurance we write could be adversely affected if lenders and investors select alternatives to private mortgage insurance.”
State capital requirements may prevent us from continuing to write new insurance on an uninterrupted basis.
The insurance laws of 16 jurisdictions, including Wisconsin, our domiciliary state, require a mortgage insurer to maintain a minimum amount of statutory capital relative to its risk in force (or a similar measure) in order for the mortgage insurer to continue to write new business. We refer to these requirements as the “State Capital Requirements.” While they vary among jurisdictions, the most common State Capital Requirements allow for a maximum risk-to-capital ratio of 25 to 1. A risk-to-capital ratio will increase if (i) the percentage decrease in capital exceeds the percentage decrease in insured risk, or (ii) the percentage increase in capital is less than the percentage increase in insured risk. Wisconsin does not regulate capital by using a risk-to-capital measure but instead requires a minimum policyholder position (“MPP”). The “policyholder position” of a mortgage insurer is its net worth or surplus, contingency reserve and a portion of the reserves for unearned premiums.
At December 31, 2016, MGIC’s risk-to-capital ratio was
10.7
to 1, below the maximum allowed by the jurisdictions with State Capital Requirements, and its policyholder position was
$1.6 billion
above the required MPP of
$1.1 billion
. In calculating our risk-to-capital ratio and MPP, we are allowed full credit for the risk ceded under our reinsurance transaction with a group of unaffiliated reinsurers. It is possible that under the revised State Capital Requirements discussed below, MGIC will not be allowed full credit for the risk ceded to the reinsurers. If MGIC is not allowed an agreed level of credit under either the State Capital Requirements or the PMIERs, MGIC may terminate the reinsurance transaction, without penalty. At this time, we expect MGIC to continue to comply with the current State Capital Requirements; however, you should read the rest of these risk factors for information about matters that could negatively affect such compliance.
At December 31, 2016, the risk-to-capital ratio of our combined insurance operations (which includes a reinsurance affiliate) was
12.0
to 1. Reinsurance transactions with our affiliate permit MGIC to write insurance with a higher coverage percentage than it could on its own under certain state-specific requirements. A higher risk-to-capital ratio on a combined basis may indicate
that, in order for MGIC to continue to utilize reinsurance arrangements with its reinsurance affiliate, additional capital contributions to the affiliate could be needed.
The NAIC it plans to revise the minimum capital and surplus requirements for mortgage insurers that are provided for in its Mortgage Guaranty Insurance Model Act. In May 2016, a working group of state regulators released an exposure draft of a risk-based capital framework to establish capital requirements for mortgage insurers, although no date has been established by which the NAIC must propose revisions to the capital requirements. We continue to evaluate the impact of the framework contained in the exposure draft, including the potential impact of certain items that have not yet been completely addressed by the framework which include: the treatment of ceded risk, minimum capital floors, and action level triggers. Currently we believe that the PMIERs contain the more restrictive capital requirements in most circumstances.
While MGIC currently meets the State Capital Requirements of Wisconsin and all other jurisdictions, it could be prevented from writing new business in the future in all jurisdictions if it fails to meet the State Capital Requirements of Wisconsin, or it could be prevented from writing new business in a particular jurisdiction if it fails to meet the State Capital Requirements of that jurisdiction, and in each case MGIC does not obtain a waiver of such requirements. It is possible that regulatory action by one or more jurisdictions, including those that do not have specific State Capital Requirements, may prevent MGIC from continuing to write new insurance in such jurisdictions. If we are unable to write business in all jurisdictions, lenders may be unwilling to procure insurance from us anywhere. In addition, a lender’s assessment of the future ability of our insurance operations to meet the State Capital Requirements or the PMIERs may affect its willingness to procure insurance from us. In this regard, see our risk factor titled
“Competition or changes in our relationships with our customers could reduce our revenues, reduce our premium yields and/or increase our losses.”
A possible future failure by MGIC to meet the State Capital Requirements or the PMIERs will not necessarily mean that MGIC lacks sufficient resources to pay claims on its insurance liabilities. While we believe MGIC has sufficient claims paying resources to meet its claim obligations on its insurance in force on a timely basis, you should read the rest of these risk factors for information about matters that could negatively affect MGIC’s claims paying resources.
MGIC Investment Corporation 2016 Form 10-K
|
32
|
Risk Factors
|
|||||
Downturns in the domestic economy or declines in the value of borrowers’ homes from their value at the time their loans closed may result in more homeowners defaulting and our losses increasing, with a corresponding decrease in our returns.
Losses result from events that reduce a borrower’s ability or willingness to continue to make mortgage payments, such as unemployment, health issues, family status, and whether the home of a borrower who defaults on his mortgage can be sold for an amount that will cover unpaid principal and interest and the expenses of the sale. In general, favorable economic conditions reduce the likelihood that borrowers will lack sufficient income to pay their mortgages and also favorably affect the value of homes, thereby reducing and in some cases even eliminating a loss from a mortgage default. A deterioration in economic conditions, including an increase in unemployment, generally increases the likelihood that borrowers will not have sufficient income to pay their mortgages and can also adversely affect housing values, which in turn can influence the willingness of borrowers with sufficient resources to make mortgage payments to do so when the mortgage balance exceeds the value of the home. Housing values may decline even absent a deterioration in economic conditions due to declines in demand for homes, which in turn may result from changes in buyers’ perceptions of the potential for future appreciation, restrictions on and the cost of mortgage credit due to more stringent underwriting standards, higher interest rates generally, changes to the deductibility of mortgage interest or mortgage insurance premiums for income tax purposes, or other factors. Changes in housing values and unemployment levels are inherently difficult to forecast given the uncertainty in the current market environment, including uncertainty about the effect of actions the federal government has taken and may take with respect to tax policies, mortgage finance programs and policies, and housing finance reform.
The mix of business we write affects our Minimum Required Assets under the PMIERs, our premium yields and the likelihood of losses occurring.
The Minimum Required Assets under the PMIERs are, in part, a function of the direct risk-in-force and the risk profile of the loans we insure, considering loan-to-value ratio, credit score, vintage, HARP status and delinquency status; and whether the loans were insured under lender-paid mortgage insurance policies or other policies that are not subject to automatic termination consistent with the Homeowners Protection Act requirements for borrower paid mortgage insurance. Therefore, if our direct risk-in-force increases through increases in new insurance written, or if our mix of business changes to include loans with higher loan-to-value ratios or lower FICO scores, for example, or if we insure more
loans under lender-paid mortgage insurance policies, all other things equal, we will be required to hold more Available Assets in order to maintain GSE eligibility.
The minimum capital required by the risk-based capital framework contained in the exposure draft released by the NAIC in May 2016 would be, in part, a function of certain loan factors, including property location, loan-to-value ratio and credit score; general underwriting quality in the market at the time of loan origination; the age of the loan; and the premium rate we charge. Depending on the provisions of the capital requirements when they are released in final form and become effective, our mix of business may affect the minimum capital we are required to hold under the new framework.
Beginning in 2014, we have increased the percentage of our business from lender-paid single premium policies. Depending on the actual life of a single premium policy and its premium rate relative to that of a monthly premium policy, a single premium policy may generate more or less premium than a monthly premium policy over its life.
We have in place a quota share reinsurance transaction with a group of unaffiliated reinsurers that covers most of our insurance written from 2013 through 2016, and a portion of our insurance written prior to 2013. We expect that in the first quarter of 2017, we will enter into a similar agreement covering most of our new insurance written in 2017. Although the transactions reduce our premiums, they have a lesser impact on our overall results, as losses ceded under the transactions reduce our losses incurred and the ceding commission we receive reduce our underwriting expenses. The net cost of reinsurance, with respect to a covered loan, is 6% (but can be lower if losses are materially higher than we expect). This cost is derived by dividing the reduction in our pre-tax net income from such loan with reinsurance by our direct (that is, without reinsurance) premiums from such loan. Although the net cost of the reinsurance is generally constant at 6%, the effect of the reinsurance on the various components of pre-tax income will vary from period to period, depending on the level of ceded losses.
In addition to the effect of reinsurance on our premiums, we expect a modest decline in our premium yield resulting from the premium rates themselves: the books we wrote before 2009, which have a higher average premium rate than subsequent books, are expected to continue to decline as a percentage of the insurance in force; and the average premium rate on these books is also expected to decline as the premium rates reset to lower levels at the time the loans reach the ten-year anniversary of their initial coverage date. However, for loans that have utilized HARP, the initial ten-year period was reset to begin as of the date of the HARP transaction. As of December 31, 2016, approximately
4%
and
2%
of our total primary insurance in force was written
33
|
MGIC Investment Corporation 2016 Form 10-K
in 2007 and 2008, respectively, has not been refinanced under HARP and is subject to a reset after ten years.
The circumstances in which we are entitled to rescind coverage have narrowed for insurance we have written in recent years. During the second quarter of 2012, we began writing a portion of our new insurance under an endorsement to our then existing master policy (the “Gold Cert Endorsement”), which limited our ability to rescind coverage compared to that master policy. To comply with requirements of the GSEs, we introduced our current master policy in 2014. Our rescission rights under our current master policy are comparable to those under our previous master policy, as modified by the Gold Cert Endorsement, but may be further narrowed if the GSEs permit modifications to them. Our current master policy is filed as Exhibit 99.19 to our quarterly report on Form 10-Q for the quarter ended September 30, 2014 (filed with the SEC on November 7, 2014). All of our primary new insurance on loans with mortgage insurance application dates on or after October 1, 2014, was written under our current master policy. As of December 31, 2016, approximately
63%
of our flow, primary insurance in force was written under our Gold Cert Endorsement or our current master policy.
From time to time, in response to market conditions, we change the types of loans that we insure and the requirements under which we insure them. We also change our underwriting guidelines, in part through aligning some of them with Fannie Mae and Freddie Mac for loans that receive and are processed in accordance with certain approval recommendations from a GSE automated underwriting system. As a result of changes to our underwriting guidelines and requirements and other factors, our business written beginning in the second half of 2013 is expected to have a somewhat higher claim incidence than business written in 2009 through the first half of 2013. However, we believe this business presents an acceptable level of risk. Our underwriting requirements are available on our website at http://www.mgic.com/underwriting/index.html. We monitor the competitive landscape and will make adjustments to our pricing and underwriting guidelines as warranted. We also make exceptions to our underwriting requirements on a loan-by-loan basis and for certain customer programs. Together, the number of loans for which exceptions were made accounted for fewer than
2%
of the loans we insured in each of 2015 and 2016.
Even when housing values are stable or rising, mortgages with certain characteristics have higher probabilities of claims. These characteristics include loans with higher loan-to-value ratios, lower FICO scores, limited underwriting, including limited borrower documentation, or higher total debt-to-income ratios, as well as loans having combinations of higher risk factors. As of December 31, 2016, approximately
14.4%
of our primary risk in force consisted
of loans with loan-to-value ratios greater than 95%,
3.8%
had FICO scores below 620, and
3.7%
had limited underwriting, including limited borrower documentation, each attribute as determined at the time of loan origination. A material number of these loans were originated in 2005 - 2007 or the first half of 2008. For information about our classification of loans by FICO score and documentation, see footnotes (6) and (7) to the Characteristics of Primary Risk in Force table under “Business – Our Products and Services” in Item 1.
As of December 31, 2016, approximately
2%
of our primary risk in force consisted of adjustable rate mortgages in which the initial interest rate may be adjusted during the five years after the mortgage closing (“ARMs”). We classify as fixed rate loans adjustable rate mortgages in which the initial interest rate is fixed during the five years after the mortgage closing. If interest rates should rise between the time of origination of such loans and when their interest rates may be reset, claims on ARMs and adjustable rate mortgages whose interest rates may only be adjusted after five years would be substantially higher than for fixed rate loans. In addition, we have insured “interest-only” loans, which may also be ARMs, and loans with negative amortization features, such as pay option ARMs. We believe claim rates on these loans will be substantially higher than on loans without scheduled payment increases that are made to borrowers of comparable credit quality.
If state or federal regulations or statutes are changed in ways that ease mortgage lending standards and/or requirements, it is possible that more mortgage loans could be originated with higher risk characteristics than are currently being originated such as loans with lower FICO scores, higher debt to income ratios and non-amortizing payments. Lenders could pressure mortgage insurers to insure such loans. Although we attempt to incorporate these higher expected claim rates into our underwriting and pricing models, there can be no assurance that the premiums earned and the associated investment income will be adequate to compensate for actual losses even under our current underwriting requirements. We do, however, believe that our insurance written beginning in the second half of 2008 will generate underwriting profits.
The premiums we charge may not be adequate to compensate us for our liabilities for losses and as a result any inadequacy could materially affect our financial condition and results of operations.
We set premiums at the time a policy is issued based on our expectations regarding likely performance of the insured risks over the long-term. Our premiums are subject to approval by state regulatory agencies, which can delay or limit our ability to increase our premiums. Generally, we cannot cancel mortgage insurance coverage or adjust
MGIC Investment Corporation 2016 Form 10-K
|
34
|
Risk Factors
|
|||||
renewal premiums during the life of a mortgage insurance policy. As a result, higher than anticipated claims generally cannot be offset by premium increases on policies in force or mitigated by our non-renewal or cancellation of insurance coverage. The premiums we charge, and the associated investment income, may not be adequate to compensate us for the risks and costs associated with the insurance coverage provided to customers. An increase in the number or size of claims, compared to what we anticipate, could adversely affect our results of operations or financial condition. Our premium rates are also based in part on the amount of capital we are required to hold against the insured risk. If the amount of capital we are required to hold increases from the amount we were required to hold when a policy was written, we cannot adjust premiums to compensate for this and our returns may be lower than we assumed.
The losses we have incurred on our 2005-2008 books have exceeded our premiums from those books. Our current expectation is that the incurred losses from those books, although declining, will continue to generate a material portion of our total incurred losses for a number of years. The ultimate amount of these losses will depend in part on general economic conditions, including unemployment, and the direction of home prices.
We are susceptible to disruptions in the servicing of mortgage loans that we insure.
We depend on reliable, consistent third-party servicing of the loans that we insure. Over the last several years, the mortgage loan servicing industry has experienced consolidation and an increase in the number of specialty servicers servicing delinquent loans. The resulting change in the composition of servicers could lead to disruptions in the servicing of mortgage loans covered by our insurance policies. Further changes in the servicing industry resulting in the transfer of servicing could cause a disruption in the servicing of delinquent loans which could reduce servicers’ ability to undertake mitigation efforts that could help limit our losses. Future housing market conditions could lead to additional increases in delinquencies and transfers of servicing.
Changes in interest rates, house prices or mortgage insurance cancellation requirements may change the length of time that our policies remain in force.
The premium from a single premium policy is collected upfront and generally earned over the estimated life of the policy. In contrast, premiums from a monthly premium policy are received and earned each month over the life of the policy. In each year, most of our premiums received are from insurance that has been written in prior years. As a result, the length of time insurance remains in force, which
is also generally referred to as persistency, is a significant determinant of our revenues. Future premiums on our monthly premium policies in force represent a material portion of our claims paying resources and a low persistency rate will reduce those future premiums. In contrast, a higher than expected persistency rate will decrease the profitability from single premium policies because they will remain in force longer than was estimated when the policies were written.
The monthly premium policies for the substantial majority of loans we insured provides that, for the first ten years of the policy, the premium is determined by the product of the premium rate and the initial loan balance; thereafter, a lower premium rate is applied to the initial loan balance. The initial ten-year period is reset when the loan is refinanced under HARP. The premiums on many of the policies in our 2006 book that were not refinanced under HARP reset in 2016. As of December 31, 2016, approximately
4%
and
2%
of our total primary insurance in force was written in 2007 and 2008, respectively, has not been refinanced under HARP, and is subject to a rate reset after ten years.
Our persistency rate was
76.9%
at December 31, 2016, compared to 79.7% at December 31, 2015 and 82.8% at December 31, 2014. Since 2000, our year-end persistency ranged from a high of 84.7% at December 31, 2009 to a low of 47.1% at December 31, 2003.
Our persistency rate is primarily affected by the level of current mortgage interest rates compared to the mortgage coupon rates on our insurance in force, which affects the vulnerability of the insurance in force to refinancing. Our persistency rate is also affected by mortgage insurance cancellation policies of mortgage investors along with the current value of the homes underlying the mortgages in the insurance in force.
Your ownership in our company may be diluted by additional capital that we raise or if the holders of our outstanding convertible debt convert that debt into shares of our common stock.
As noted above under our risk factor titled
“We may not continue to meet the GSEs’ private mortgage insurer eligibility requirements and our returns may decrease as we are required to maintain more capital in order to maintain our eligibility,
” although we are currently in compliance with the requirements of the PMIERs, there can be no assurance that we would not seek to issue non-dilutive debt capital or to raise additional equity capital to manage our capital position under the PMIERs or for other purposes. Any future issuance of equity securities may dilute your ownership interest in our company. In addition, the market price of our common stock could decline as a result of sales of a large number of shares
35
|
MGIC Investment Corporation 2016 Form 10-K
or similar securities in the market or the perception that such sales could occur.
At December 31, 2016, we had outstanding
$390 million
principal amount of 9% Convertible Junior Subordinated Debentures due in 2063 ("9% Debentures") (of which approximately
$133 million
was purchased by and is held by MGIC, and is eliminated on the consolidated balance sheet),
$145 million
principal amount of 5% Convertible Senior Notes due in 2017 ("5% Notes") and
$208 million
principal amount of 2% Convertible Senior Notes due in 2020 ("2% Notes"). The principal amount of the 9% Debentures is currently convertible, at the holder’s option, at an initial conversion rate, which is subject to adjustment, of 74.0741 common shares per $1,000 principal amount of debentures. This represents an initial conversion price of approximately $13.50 per share. We have the right, and may elect, to defer interest payable under the debentures in the future. If a holder elects to convert its debentures, the interest that has been deferred on the debentures being converted is also convertible into shares of our common stock. The conversion rate for such deferred interest is based on the average price that our shares traded at during a 5-day period immediately prior to the election to convert the associated debentures. We may elect to pay cash for some or all of the shares issuable upon a conversion of the debentures.
The 5% Notes are convertible, at the holder’s option, at an initial conversion rate, which is subject to adjustment, of 74.4186 shares per $1,000 principal amount at any time prior to the maturity date. This represents an initial conversion price of approximately $13.44 per share.
Prior to January 1, 2020, the 2% Notes are convertible only upon satisfaction of one or more conditions. One such condition is that conversion may occur during any calendar quarter commencing after March 31, 2014, if the last reported sale price of our common stock for each of at least 20 trading days during the 30 consecutive trading days ending on, and including, the last trading day of the immediately preceding calendar quarter is greater than or equal to 130% of the applicable conversion price on each applicable trading day. The notes are convertible at an initial conversion rate, which is subject to adjustment, of 143.8332 shares per $1,000 principal amount. This represents an initial conversion price of approximately $6.95 per share. 130% of such conversion price is $9.04. This condition was met for the quarter ended December 31, 2016, therefore, the 2% Notes are convertible in the first quarter of 2017. They will also be convertible in later quarters in which the stock price condition was met for the prior quarter. On or after January 1, 2020, holders may convert their notes irrespective of satisfaction of the conditions.
Beginning on April 10, 2017, we may redeem all or part of the 2% Notes if the last reported sale price of our common
stock was at least $9.04 for each of at least 20 trading days during the 30 consecutive trading days (including on the last trading day) preceding the date notice is provided to the holders of the notes that we intend to redeem the notes (the “Redemption Notice”). The Redemption Notice is irrevocable and must be given not less than 30 days and not more than 60 calendar days prior to the redemption date. Once the Redemption Notice is given, holders may convert their notes at any time before the redemption date specified in the Redemption Notice and we expect they will do so if the price of our common stock remains above the conversion price of $6.95
We do not have the right to defer interest on our 5% Notes or 2% Notes. For a discussion of the dilutive effects of our convertible securities on our earnings per share, see Note 6 – “Summary of Significant Accounting Policies Earnings per Share” to our consolidated financial statements in our Quarterly Report on Form 10-Q filed with the SEC on November 7, 2016.
Our holding company debt obligations materially exceed our holding company cash and investments.
At December 31, 2016, we had approximately
$283 million
in cash and investments at our holding company and our holding company’s debt obligations were
$1,168 million
in aggregate principal amount, consisting of
$145 million
of 5% Notes,
$208 million
of 2% Notes,
$425 million
of 5.75% Senior Notes due in 2023 ("5.75% Notes"), and
$390 million
of 9% Debentures (of which approximately
$133 million
was purchased by and is held by MGIC, and is eliminated on the consolidated balance sheet). Annual debt service on the outstanding holding company debt as of December 31, 2016, is approximately
$71 million
(of which approximately
$12 million
will be paid to MGIC and will be eliminated on the consolidated statement of operations). For more information about the purchase by MGIC of a portion of our outstanding 9% Convertible Junior Subordinated Debentures, see "Management's Discussion and Analysis – Debt at Our Holding Company and Holding Company Capital Resources" in our Annual Report on Form 10-K filed with the SEC on February 26, 2016. For information about our 2016 public offering of the 5.75% Notes and the use of proceeds from the offering to purchase a portion of the 2% Notes, see Note 3 – “Debt” to our consolidated financial statements in our Quarterly Report on Form 10-Q filed with the SEC on November 7, 2016. We may continue to purchase our debt securities in the future.
The Convertible Senior Notes, Senior Notes and Convertible Junior Subordinated Debentures are obligations of our holding company, MGIC Investment Corporation, and not of its subsidiaries. The payment of dividends from our insurance subsidiaries which, other than investment income and raising capital in the public markets, is the principal
MGIC Investment Corporation 2016 Form 10-K
|
36
|
Risk Factors
|
|||||
source of our holding company cash inflow, is restricted by insurance regulation. MGIC is the principal source of dividend-paying capacity. In 2016, MGIC paid a total of $64 million in dividends to our holding company, its first dividends since 2008, and we expect MGIC to continue to pay quarterly dividends. OCI authorization is sought before MGIC pays dividends and MGIC will pay a dividend of $20 million to our holding company in the first quarter of 2017. If any additional capital contributions to our subsidiaries were required, such contributions would decrease our holding company cash and investments. As described in our Current Report on Form 8-K filed on February 11, 2016, MGIC borrowed $155 million from the Federal Home Loan Bank of Chicago. This is an obligation of MGIC and not of our holding company.
We could be adversely affected if personal information on consumers that we maintain is improperly disclosed and our information technology systems may become outdated and we may not be able to make timely modifications to support our products and services.
We rely on the efficient and uninterrupted operation of complex information technology systems. All information technology systems are potentially vulnerable to damage or interruption from a variety of sources, including through the actions of third parties. Due to our reliance on our information technology systems, their damage or interruption could severely disrupt our operations, which could have a material adverse effect on our business, business prospects and results of operations. As part of our business, we maintain large amounts of personal information on consumers. While we believe we have appropriate information security policies and systems to prevent unauthorized disclosure, there can be no assurance that unauthorized disclosure, either through the actions of third parties or employees, will not occur. Unauthorized disclosure could adversely affect our reputation and expose us to material claims for damages.
In addition, we are in the process of upgrading certain of our information systems that have been in place for a number of years. The implementation of these technological improvements is complex, expensive and time consuming. If we fail to timely and successfully implement the new technology systems, or if the systems do not operate as expected, it could have an adverse impact on our business, business prospects and results of operations.
37
|
MGIC Investment Corporation 2016 Form 10-K
|
Unresolved Staff Comments, Properties, Legal Proceedings, Mine Safety Disclosures
|
|||||
Item 1B.
Unresolved Staff Comments.
None.
Item 2.
Properties
At
December 31, 2016
, we leased office space in various cities throughout the United States under leases expiring between 2017 and 2022 and which required monthly rental payments that in the aggregate are immaterial.
We own our headquarters facility and an additional office/warehouse facility, both located in Milwaukee, Wisconsin, which contain an aggregate of approximately 310,000 square feet of space.
Item 3.
Legal Proceedings.
The Internal Revenue Service (“IRS”) completed examinations of our federal income tax returns for the years 2000 through 2007 and issued proposed assessments for taxes, interest and penalties related to our treatment of the flow-through income and loss from an investment in a portfolio of REMIC residual interests. The IRS indicated that it did not believe that, for various reasons, we had established sufficient tax basis in the REMIC residual interests to deduct the losses from taxable income. We appealed these assessments within the IRS and in August 2010, we reached a tentative settlement agreement with the IRS which was not finalized.
In 2014, we received Notices of Deficiency (commonly referred to as “90 day letters”) covering the 2000-2007 tax years. The Notices of Deficiency reflect taxes and penalties related to the REMIC matters of $197.5 million and at December 31, 2016, there would also be interest related to these matters of approximately
$200.6 million
. In 2007, we made a payment of $65.2 million to the United States Department of the Treasury which will reduce any amounts we would ultimately owe. The Notices of Deficiency also reflect additional amounts due of $261.4 million, which are primarily associated with the disallowance of the carryback of the 2009 NOL to the 2004-2007 tax years. We believe the IRS included the carryback adjustments as a precaution to keep open the statute of limitations on collection of the tax that was refunded when this loss was carried back, and not because the IRS actually intends to disallow the carryback permanently. Depending on the outcome of this matter, additional state income taxes and state interest may become due when a final resolution is reached. As of December 31, 2016, those state taxes and interest would
approximate
$50.7 million
. In addition, there could also be state tax penalties. Our total amount of unrecognized tax benefits as of December 31, 2016 is
$108.2 million
, which represents the tax benefits generated by the REMIC portfolio included in our tax returns that we have not taken benefit for in our financial statements, including any related interest.
We filed a petition with the U.S. Tax Court contesting most of the IRS’ proposed adjustments reflected in the Notices of Deficiency and the IRS filed an answer to our petition which continued to assert their claim. The case has twice been scheduled for trial and in each instance, the parties jointly filed, and the U.S. Tax Court approved (most recently in February 2016), motions for continuance to postpone the trial date. Also in February 2016, the U.S. Tax Court approved a joint motion to consolidate for trial, briefing, and opinion, our case with similar cases of Radian Group, Inc., as successor to Enhance Financial Services Group, Inc., et al. In January 2017, the parties informed the Tax Court that they had reached a basis for settlement of the major issues in the case. Any agreed settlement terms will ultimately be subject to review by the JCT before a settlement can be completed and there is no assurance that a settlement will be completed. Based on information that we currently have regarding the status of our ongoing dispute, we expect to record a provision for additional taxes and interest of $15-25 million in the first quarter of 2017.
Should a settlement not be completed, ongoing litigation to resolve our dispute with the IRS could be lengthy and costly in terms of legal fees and related expenses. We would need to make further adjustments, which could be material, to our tax provision and liabilities if our view of the probability of success in this matter changes, and the ultimate resolution of this matter could have a material negative impact on our effective tax rate, results of operations, cash flows, available assets and statutory capital. In this regard, see our risk factors titled “We may not continue to meet the GSEs’ private mortgage insurer eligibility requirements and our returns may decrease as we are required to maintain more capital in order to maintain our eligibility” and “State capital requirements may prevent us from continuing to write new insurance on an uninterrupted basis.”
In addition to the above litigation, we face other litigation, regulatory risks and disputes. For additional information about such other litigation and regulatory risks, you should review our risk factors titled “We are involved in legal proceedings and are subject to the risk of additional legal proceedings in the future.”
Item 4.
Mine Safety Disclosures.
Not Applicable.
MGIC Investment Corporation 2016 Form 10-K
|
38
|
Executive Officers of the Registrant
|
|||||
Executive Officers of the Registrant
Certain information with respect to our executive officers as of
February 21, 2017
is set forth below:
|
Name and Age
|
Title
|
|
|
Patrick Sinks, 60
|
President and Chief Executive Officer of MGIC Investment Corporation and MGIC; Director of MGIC Investment Corporation and MGIC
|
|
|
Timothy J. Mattke, 41
|
Executive Vice President and Chief Financial Officer of MGIC Investment Corporation and MGIC
|
|
|
James J. Hughes, 54
|
Executive Vice President – Sales and Business Development of MGIC
|
|
|
Jeffrey H. Lane, 67
|
Executive Vice President, General Counsel and Secretary of MGIC Investment Corporation and MGIC
|
|
|
Stephen C. Mackey, 56
|
Executive Vice President and Chief Risk Officer of MGIC Investment Corporation and MGIC
|
|
|
Salvatore A. Miosi, 50
|
Executive Vice President - Business Strategy and Operations of MGIC
|
|
|
Gregory A. Chi, 57
|
Senior Vice President–Information Services and Chief Information Officer of MGIC
|
|
Mr. Sinks has served as our Chief Executive Officer since March 2015 and has been our and MGIC’s President since January 2006. He was Executive Vice President-Field Operations of MGIC from January 2004 to January 2006 and was Senior Vice President-Field Operations of MGIC from July 2002 to January 2004. From March 1985 to July 2002, he held various positions within MGIC’s finance and accounting organization, the last of which was Senior Vice President, Controller and Chief Accounting Officer. Mr. Sinks has been a director of MGIC Investment Corporation and MGIC since July 2014.
Mr. Mattke has been the Company’s Chief Financial Officer since March 2014. He served as the Company’s Controller from 2009 through March 2014. He joined the Company in 2006. Prior to his becoming Controller, he was Assistant Controller of MGIC beginning in August 2007 and prior to that was a manager in MGIC’s accounting department. Before joining MGIC, Mr. Mattke was an audit manager and an auditor with PricewaterhouseCoopers LLP, the Company’s independent registered accounting firm.
Mr. Hughes has served as Executive Vice President – Sales and Business Development of MGIC since January 2017. He served as Senior Vice President – Sales and Business Development of MGIC from 2015 to January 2017, and Vice President, Managing Director in the sales area from 2001 to 2015. He joined MGIC in 1987 and prior to becoming Vice President, Managing Director, he had been an Account Manager and a Sales Manager.
Mr. Lane has served as our and MGIC’s Executive Vice President, General Counsel and Secretary since January 2008 and prior thereto as our Senior Vice President, General Counsel and Secretary from August 1996 to January 2008. For more than five years prior to his joining us, Mr. Lane was a partner of Foley & Lardner, a law firm headquartered in Milwaukee, Wisconsin. In January 2017, Mr. Lane informed us that he plans to retire after his successor takes office and there is an appropriate transition period.
Mr. Mackey joined MGIC in June 2015 and has served as Executive Vice President and Chief Risk Officer since September 2015. Before joining MGIC, Mr. Mackey was with JP Morgan Chase & Company from March 2011 until June 2015, where he held a number of senior leadership positions, including Managing Director, Firmwide Market Risk, Senior Vice President and Risk Management Executive in Mortgage Banking and Senior Vice President and Controller in Mortgage Banking. He has a diverse professional background prior to JP Morgan that includes 13 years with Fannie Mae where he had been a Vice President
.
Mr. Miosi has served as Executive Vice President – Business Strategy and Operations since January 2017. He served as Senior Vice President – Business Strategy and Operations of MGIC from 2015 to January 2017, and Vice President - Marketing from 2004 to 2015. Mr. Miosi joined the company in 1988 and has also held a variety of leadership positions in the operations, technology and marketing divisions.
Mr. Chi joined MGIC in February 2012 and has served as MGIC’s Senior Vice President–Information Services and Chief Information Officer since March 2012. Prior to joining MGIC, Mr. Chi had been Senior Vice President of Enterprise Delivery Services with SunTrust Bank since 2008. Prior to joining SunTrust, Mr. Chi had been Vice President, Information Technology Development Application with MetLife, Inc. since 2005. Prior to that, Mr. Chi held various senior management positions in the financial services industry.
39
|
MGIC Investment Corporation 2016 Form 10-K
|
Market for Registrant's Common Equity, Related Stockholder Matters and Issuer Purchases of Equity Securities
|
|||||
Item 5.
Market for Registrant’s Common Equity, Related Stockholder Matters and Issuer Purchases of Equity Securities.
|
(a)
|
Our Common Stock is listed on the New York Stock Exchange under the symbol “MTG.” The following table sets forth for 2016 and 2015 by calendar quarter the high and low sales prices of our Common Stock on the New York Stock Exchange.
|
|
2016
|
2015
|
||||||||||||
|
Quarter
|
High
|
Low
|
High
|
Low
|
|||||||||
|
First
|
$
|
8.72
|
|
5.63
|
|
$
|
9.96
|
|
8.00
|
|
|||
|
Second
|
7.85
|
|
5.36
|
|
11.55
|
|
9.47
|
|
|||||
|
Third
|
8.23
|
|
5.45
|
|
11.72
|
|
9.07
|
|
|||||
|
Fourth
|
10.58
|
|
7.84
|
|
10.05
|
|
8.72
|
|
|||||
In October 2008, the Board suspended payment of our cash dividend. Accordingly, no cash dividends were paid in 2016 or 2015. The payment of future dividends is subject to the discretion of our Board and will depend on many factors, including our operating results, financial condition and capital position. See
Note 7 – “Debt,”
to our consolidated financial statements in Item 8 for dividend restrictions during interest deferral periods related to our 9% Debentures. We are a holding company and the payment of dividends from our insurance subsidiaries is restricted by insurance regulations. For a discussion of these restrictions, see “
Management’s Discussion and Analysis — Liquidity and Capital Resources
” in Item 7 of this annual report and
Note 14 – “Statutory Information,”
to our consolidated financial statements in Item 8.
As of February 3, 2017, the number of shareholders of record was 198. In addition, we estimate there are approximately 35,500 beneficial owners of shares held by brokers and fiduciaries.
Information regarding equity compensation plans is contained in
Item 12
.
|
(b)
|
Not applicable.
|
|
(c)
|
The following table sets forth information regarding repurchases made by or on behalf of us of our common stock during the periods indicated.
|
|
Period Beginning
|
Period Ending
|
Total number of shares purchased
|
Average price paid per share
|
Total number of shares purchased as part of publicly announced plans or programs
|
Maximum number of shares that may yet be purchased under the plans or programs
|
||||||||||
|
October 1, 2016
|
October 31, 2016
|
4,832,841
|
|
$
|
8.08
|
|
4,832,841
|
|
—
|
|
|||||
|
November 1, 2016
|
November 30, 2016
|
—
|
|
—
|
|
—
|
|
||||||||
|
December 1, 2016
|
December 31, 2016
|
—
|
|
—
|
|
—
|
|
||||||||
|
4,832,841
|
|
$
|
8.08
|
|
4,832,841
|
|
|||||||||
MGIC Investment Corporation 2016 Form 10-K
|
40
|
Selected Financial Data
|
|||||
Item 6.
Selected Financial Data
|
As of and for the Years Ended December 31,
|
||||||||||||||||||||
|
(In thousands, except per share data)
|
2016
|
2015
|
2014
|
2013
|
2012
|
|||||||||||||||
|
Summary of Operations
|
||||||||||||||||||||
|
Revenues:
|
||||||||||||||||||||
|
Net premiums written
|
$
|
975,091
|
|
$
|
1,020,277
|
|
$
|
881,962
|
|
$
|
923,481
|
|
$
|
1,017,832
|
|
|||||
|
Net premiums earned
|
925,226
|
|
896,222
|
|
844,371
|
|
943,051
|
|
1,033,170
|
|
||||||||||
|
Investment income, net
|
110,666
|
|
103,741
|
|
87,647
|
|
80,739
|
|
121,640
|
|
||||||||||
|
Realized investment gains, net including net impairment losses
|
8,932
|
|
28,361
|
|
1,357
|
|
5,731
|
|
195,409
|
|
||||||||||
|
Other revenue
|
17,659
|
|
12,964
|
|
9,259
|
|
9,914
|
|
28,145
|
|
||||||||||
|
Total revenues
|
1,062,483
|
|
1,041,288
|
|
942,634
|
|
1,039,435
|
|
1,378,364
|
|
||||||||||
|
Losses and expenses:
|
|
|
|
|
|
|
|
|
||||||||||||
|
Losses incurred, net
|
240,157
|
|
343,547
|
|
496,077
|
|
838,726
|
|
2,067,253
|
|
||||||||||
|
Change in premium deficiency reserve
|
—
|
|
(23,751
|
)
|
(24,710
|
)
|
(25,320
|
)
|
(61,036
|
)
|
||||||||||
|
Underwriting and other expenses
|
160,409
|
|
164,366
|
|
146,059
|
|
192,518
|
|
201,447
|
|
||||||||||
|
Interest expense
|
56,672
|
|
68,932
|
|
69,648
|
|
79,663
|
|
99,344
|
|
||||||||||
|
Loss on debt extinguishment
|
90,531
|
|
507
|
|
837
|
|
—
|
|
—
|
|
||||||||||
|
Total losses and expenses
|
547,769
|
|
553,601
|
|
687,911
|
|
1,085,587
|
|
2,307,008
|
|
||||||||||
|
Income (loss) before tax
|
514,714
|
|
487,687
|
|
254,723
|
|
(46,152
|
)
|
(928,644
|
)
|
||||||||||
|
Provision for (benefit from) income taxes
(1)
|
172,197
|
|
(684,313
|
)
|
2,774
|
|
3,696
|
|
(1,565
|
)
|
||||||||||
|
Net income (loss)
|
$
|
342,517
|
|
$
|
1,172,000
|
|
$
|
251,949
|
|
$
|
(49,848
|
)
|
$
|
(927,079
|
)
|
|||||
|
Weighted average common shares outstanding
(2)
|
431,992
|
|
468,039
|
|
413,547
|
|
311,754
|
|
201,892
|
|
||||||||||
|
Diluted income (loss) per share
|
$
|
0.86
|
|
$
|
2.60
|
|
$
|
0.64
|
|
$
|
(0.16
|
)
|
$
|
(4.59
|
)
|
|||||
|
Dividends per share
|
$
|
—
|
|
$
|
—
|
|
$
|
—
|
|
$
|
—
|
|
$
|
—
|
|
|||||
|
Balance sheet data
|
|
|
|
|
|
|
|
|
||||||||||||
|
Total investments
|
$
|
4,692,350
|
|
$
|
4,663,206
|
|
$
|
4,612,669
|
|
$
|
4,866,819
|
|
$
|
4,230,275
|
|
|||||
|
Cash and cash equivalents
|
155,410
|
|
181,120
|
|
197,882
|
|
332,692
|
|
1,027,625
|
|
||||||||||
|
Total assets
|
5,734,529
|
|
5,868,343
|
|
5,251,414
|
|
5,582,579
|
|
5,566,894
|
|
||||||||||
|
Loss reserves
|
1,438,813
|
|
1,893,402
|
|
2,396,807
|
|
3,061,401
|
|
4,056,843
|
|
||||||||||
|
Premium deficiency reserve
|
—
|
|
—
|
|
23,751
|
|
48,461
|
|
73,781
|
|
||||||||||
|
Short- and long-term debt
|
572,406
|
|
—
|
|
61,883
|
|
82,662
|
|
99,700
|
|
||||||||||
|
Convertible senior notes
|
349,461
|
|
822,301
|
|
830,015
|
|
826,300
|
|
338,419
|
|
||||||||||
|
Convertible junior subordinated debentures
|
256,872
|
|
389,522
|
|
389,522
|
|
389,522
|
|
378,970
|
|
||||||||||
|
Shareholders' equity
|
2,548,842
|
|
2,236,140
|
|
1,036,903
|
|
744,538
|
|
196,940
|
|
||||||||||
|
Book value per share
|
7.48
|
|
6.58
|
|
3.06
|
|
2.20
|
|
0.97
|
|
||||||||||
|
(1)
|
In the third quarter of 2015 we reversed the valuation allowance against our deferred tax assets. See
Note 12 – "Income Taxes"
to our consolidated financial statements in Item 8 for a discussion of the reversal of the valuation allowance and impact on our consolidated financial statements.
|
|
(2)
|
Includes dilutive shares in years with net income. See
Note 4 – "Earnings Per Share"
to our consolidated financial statements in Item 8 for a discussion of our Earnings Per Share.
|
41
|
MGIC Investment Corporation 2016 Form 10-K
|
Other data
|
||||||||||||||||||||
|
|
Years Ended December 31,
|
|||||||||||||||||||
|
|
2016
|
2015
|
2014
|
2013
|
2012
|
|||||||||||||||
|
New primary insurance written
($ millions)
|
$
|
47,875
|
|
$
|
43,031
|
|
$
|
33,439
|
|
$
|
29,796
|
|
$
|
24,125
|
|
|||||
|
New primary risk written
($ millions)
|
$
|
11,831
|
|
$
|
10,824
|
|
$
|
8,530
|
|
$
|
7,541
|
|
$
|
5,949
|
|
|||||
|
IIF (at year-end)
($ millions)
|
|
|
|
|
|
|
|
|
||||||||||||
|
Direct primary IIF
|
$
|
182,040
|
|
$
|
174,514
|
|
$
|
164,919
|
|
$
|
158,723
|
|
$
|
162,082
|
|
|||||
|
RIF (at year-end)
($ millions)
|
||||||||||||||||||||
|
Direct primary RIF
|
$
|
47,195
|
|
$
|
45,462
|
|
$
|
42,946
|
|
$
|
41,060
|
|
$
|
41,735
|
|
|||||
|
Direct pool RIF
|
|
|
|
|
|
|
|
|
||||||||||||
|
With aggregate loss limits
|
244
|
|
271
|
|
303
|
|
376
|
|
439
|
|
||||||||||
|
Without aggregate loss limits
|
303
|
|
388
|
|
505
|
|
636
|
|
879
|
|
||||||||||
|
Primary loans in default ratios
|
|
|
|
|
|
|
|
|
||||||||||||
|
Policies in force
|
998,294
|
|
992,188
|
|
968,748
|
|
960,163
|
|
1,006,346
|
|
||||||||||
|
Loans in default
|
50,282
|
|
62,633
|
|
79,901
|
|
103,328
|
|
139,845
|
|
||||||||||
|
Percentage of loans in default
|
5.04
|
%
|
6.31
|
%
|
8.25
|
%
|
10.76
|
%
|
13.90
|
%
|
||||||||||
|
Insurance operating ratios (GAAP)
|
|
|
||||||||||||||||||
|
Loss ratio
|
26.0
|
%
|
38.3
|
%
|
58.8
|
%
|
88.9
|
%
|
200.1
|
%
|
||||||||||
|
Expense ratio
|
15.3
|
%
|
14.9
|
%
|
14.7
|
%
|
18.6
|
%
|
15.2
|
%
|
||||||||||
|
Risk-to-capital ratio (statutory)
|
|
|
|
|
|
|
||||||||||||||
|
Mortgage Guaranty Insurance Corporation
|
10.7:1
|
|
12.1:1
|
|
14.6:1
|
|
15.8:1
|
|
44.7:1
|
|
||||||||||
|
Combined insurance companies
|
12.0:1
|
|
13.6:1
|
|
16.4:1
|
|
18.4:1
|
|
47.8:1
|
|
||||||||||
MGIC Investment Corporation 2016 Form 10-K
|
42
Item 7.
Management’s Discussion and Analysis of Financial Condition and Results of Operations.
Forward Looking and Other Statements
As discussed under “Forward Looking Statements and Risk Factors” in Item 1A of Part 1 of this Report, actual results may differ materially from the results contemplated by forward looking statements. We are not undertaking any obligation to update any forward looking statements or other statements we may make in the following discussion or elsewhere in this document even though these statements may be affected by events or circumstances occurring after the forward looking statements or other statements were made. Therefore no reader of this document should rely on these statements being current as of any time other than the time at which this document was filed with the Securities and Exchange Commission.
See the
"Glossary of terms and acronyms"
for definitions and descriptions of terms used throughout this annual report.
Introduction
Through our subsidiary, MGIC, we are a leading provider of PMI in the United States, as measured by
$182.0 billion
of primary IIF on a consolidated basis at
December 31, 2016
.
As used below, “we” and “our” refer to MGIC Investment Corporation’s consolidated operations or to MGIC Investment Corporation, as a separate entity, as the context requires. References to "we" and "our" in the context of debt obligations refer to MGIC Investment Corporation.
43
|
MGIC Investment Corporation 2016 Form 10-K
Overview
This Overview of the MD&A highlights selected information and may not contain all of the information that is important to readers of this Annual Report. Hence, this Overview is qualified by the information that appears elsewhere in this Annual Report, including the other portions of the MD&A.
|
Summary Financial Results of MGIC Investment Corporation
|
|||||||||||
|
Year Ended December 31,
|
|||||||||||
|
(In millions, except per share data, unaudited)
|
2016
|
2015
|
Change
|
||||||||
|
Selected statement of operations data
|
|||||||||||
|
Total revenues
|
$
|
1,062.5
|
|
$
|
1,041.3
|
|
2
|
%
|
|||
|
Losses incurred, net
|
240.2
|
|
343.5
|
|
(30
|
)%
|
|||||
|
Loss on debt extinguishment
|
90.5
|
|
0.5
|
|
N/M
|
|
|||||
|
Income before tax
|
514.7
|
|
487.7
|
|
6
|
%
|
|||||
|
Provision for (benefit from) income taxes
|
172.2
|
|
(684.3
|
)
|
N/M
|
|
|||||
|
Net income
|
342.5
|
|
1,172.0
|
|
(71
|
)%
|
|||||
|
Diluted income per share
|
$
|
0.86
|
|
$
|
2.60
|
|
(67
|
)%
|
|||
|
Non-GAAP Financial Measures
(1)
|
|||||||||||
|
Pretax operating income
|
$
|
596.3
|
|
$
|
459.8
|
|
30
|
%
|
|||
|
Net operating income
|
395.6
|
|
306.1
|
|
29
|
%
|
|||||
|
Net operating income per diluted share
|
$
|
0.99
|
|
$
|
0.75
|
|
32
|
%
|
|||
|
(1)
|
SUMMARY OF 2016 RESULTS
Net operating income for
2016
was
$395.6 million
(2015:
$306.1 million
) and net operating income per diluted share was
$0.99
(2015:
$0.75
). The
29%
increase in net operating income was driven primarily by lower losses incurred, net.
We recorded full-year
2016
net income of
$342.5 million
, and diluted income per share of
$0.86
. Net income
decreased
by
$829.5 million
compared with net income of
$1.2 billion
in
2015
, primarily due to the $847.8 million of tax benefits realized during 2015 from changes in our deferred tax asset valuation allowance, including its reversal in the third quarter of 2015; and the
$90.5 million
loss on debt extinguishment resulting from our debt transactions completed during 2016. The decline in net income was partially offset primarily by a decrease in losses incurred, net.
Losses incurred, net were
$240.2 million
, down
30%
as new delinquent notice activity declined and we experienced higher favorable reserve development on prior year delinquencies and on our IBNR when compared to the prior year.
The loss on debt extinguishment recorded during 2016 resulted from debt transactions in which we, or MGIC, repurchased portions of our outstanding long-term debt at amounts that in aggregate were in excess of our carrying values. In addition, we wrote-off unamortized debt issuance costs on the repurchased portions of some of our long-term debt. See
Note 7 - "Debt"
to our consolidated financial statements for further discussion of the accounting for these transactions. We will continue to assess opportunities to improve our debt profile and / or reduce potential dilution from our remaining outstanding convertible debt, which could result in additional debt extinguishment losses in the future.
The provision for (benefit from) income taxes in our 2016 results reflects a tax provision at the statutory rate while our prior year results reflect the impact of the changes in our valuation allowance against our deferred tax assets, including its reversal in that year.
Our operating results for 2016 reflect a larger mortgage origination market compared to the prior year and improved credit performance of our primary RIF. We grew our IIF to
$182.0 billion
, or
4.3%
, during 2016 and we wrote our highest annual level of new insurance since 2008. Importantly, the NIW in 2016 has, in our view, strong underlying credit characteristics. Our 2009 and later books continued to experience a low level of losses and accounted for
71%
of our total primary RIF as of December 31, 2016. Our legacy books, particularly those written in 2005-2008, continued to drive our new delinquent notice and claim activity, but they have experienced a continued decline in default inventory and paid claims.
In 2016, we completed a series of financing transactions that, in our view, improved our debt profile and reduced potentially dilutive shares, while maintaining strong levels of regulatory capital. Specifically, we issued senior notes in the third quarter, which allowed us to repurchase a significant portion of our 2% Notes, and in the first half of the year we repurchased a portion of our 5% Notes with cash on hand and MGIC purchased a portion of our 9% Debentures. In total, these transactions eliminated approximately 66 million potentially dilutive shares and reduced our annual consolidated interest expense.
MGIC's capital position in relation to the PMIERs requirements continued to strengthen as MGIC held over
$630 million
of Available Assets in excess of the Minimum Required Assets at December 31, 2016. Our current strategy is to maintain an excess of 10%-15% over the Minimum Required Assets. Our ability to manage to this range is primarily subject to OCI approval of dividends from MGIC to our holding company (which would reduce MGIC's Available
MGIC Investment Corporation 2016 Form 10-K
|
44
|
Management's Discussion and Analysis
|
|||||
|
Overview
|
Consolidated Results of Operations
|
Contractual Obligations
|
|||
|
Non-GAAP Financial Measures
|
Balance Sheet Analysis
|
Critical Accounting Policies
|
|||
|
Mortgage Insurance Portfolio
|
Liquidity and Capital Resources
|
Disclosures about Market Risk
|
|||
Assets), the credit performance of our RIF (which would increase or decrease its Minimum Required Assets), and any changes made to the PMIERs financial requirements (which could increase or decrease Available Assets and/or Minimum Required Assets). During 2016, MGIC distributed $64 million of its excess Available Assets as dividends to our holding company. These dividends were the first dividends from MGIC since 2008.
In the first half of 2016, the PMI industry broadly adopted new premium rates, we believe, primarily in response to operating under the financial requirements of the PMIERs, which first became effective on December 31, 2015. We revised both our BPMI and LPMI premium rates effective in April, which are competitively positioned within the industry, and are structured to generate comparable risk-adjusted returns across the spectrum of loans we insure. Premium rates within the marketplace, which includes PMI and government programs offered by the FHA and VA, have an impact on the PMI industry's total market share, as well as our share within the PMI industry from period to period. In 2016, PMI as an industry captured a greater share of mortgage originations having insurance, but our estimated market share within the PMI industry declined to 17.8% from 19.9% in 2015.
OUTLOOK FOR
2017
Our outlook for 2017 should be viewed against the backdrop of the U.S. economy, competition, mortgage origination levels, and regulatory and legislative developments. Each of these interrelated factors will affect our performance.
Our 2017 NIW is expected to be comparable to our 2016 NIW. Our NIW is affected by total mortgage originations, the percentage of total mortgage originations utilizing private mortgage insurance (the "PMI penetration rate") and our market share within the PMI industry. As of late January 2017, total mortgage originations are forecasted to decline in 2017 from 2016 levels due to declines in refinancing originations more than offsetting a small increase in purchase originations. We expect the PMI penetration rate to increase because historically PMI has captured a share of purchase originations that is estimated to be 3-4 times greater than that of refinancing originations. This increase in the PMI penetration rate should serve to mitigate the decline in total mortgage originations. Although we cannot predict our 2017 market share, recent industry consolidation may have a positive influence if lenders re-allocate the combined share of the consolidating companies among the remaining companies in the industry. Although our expectation is for our 2017 NIW to be comparable to that of 2016, this will be highly dependent on the actual mortgage origination market and competition. If pricing competition intensifies and customers can obtain lower prices elsewhere, our NIW may be lower than we expect.
Our book of IIF is the main driver of our revenues and earnings and its growth is driven by our ability to generate NIW and retain existing policies in force, as measured by our persistency. Interest rates influence both our NIW and persistency.
Since the Presidential election, mortgage rates, as reflected in the 30-year fixed rate, have risen. In a rising rate environment, we expect the level of cancellation activity to de
celerate, and in turn increase persistency, although the impact generally lags the change in interest rates. Higher interest rates could reduce affordability for borrowers, which could slow housing activity, and of particular importance to our industry, slow first time home buyer purchase activity resulting in less NIW. Historically however, purchase origination volume has not been significantly impacted by interest rate changes of less than 100 bps on a year-over-year basis.
We expect to face challenges growing our earned premium revenues in 2017 from 2016 levels, even with a larger book of IIF, as the impact of changing premium rates on our IIF continues to adversely impact our premium yield. Our premium yield is expected to decline in 2017 from the 2016 level as a greater percentage of our IIF will be from book years 2009 and later, which were generally written at lower premium rates than the earlier books. In addition, premium rates are resetting to lower rates on a substantial portion of our monthly and annual premium policies that have not been refinanced under HARP and remain in force on their ten year anniversary. The initial ten-year period is reset when a loan is refinanced under HARP. As of
December 31, 2016
, the 2007 book year IIF that is subject to premium rate resets during 2017 was approximately 4% of our total IIF. Counter to this trend, our net premiums earned may continue to benefit from cancellations on single premium policies in 2017, which increases our premium yield when persistency is less than was assumed when the policy was written, as the premium is generally non-refundable and becomes fully earned. Higher persistency on our monthly and annual premium business would also counteract the impact of lower premium rates.
Credit trends on our RIF continue to improve and we have experienced a declining level of new delinquent notices, losses paid and total delinquent notice inventory. We expect these trends to continue in 2017. Significant favorable reserve development due to lower claims rates on prior year delinquencies has occurred over the past two years, but this may not continue in 2017.
As of December 31, 2016, our PMIERs Available Assets were
16%
greater than our Minimum Required Assets. We believe that maintaining Available Assets at a level of 10-15% in excess of our Minimum Required Assets is prudent to preserve our ability to write new business, meet unexpected losses without the need to access the capital markets, pursue new business opportunities, and continually comply
45
|
MGIC Investment Corporation 2016 Form 10-K
with the PMIERs which are subject to change and the GSEs could make them more onerous in future periods, which could materially affect our Available Assets and/or Minimum Required Assets. We expect the GSEs to perform a comprehensive review of the PMIERs financial requirements and to update them in 2017 as the PMIERs provide that the tables of factors that determine Minimum Required Assets will be updated at least every two years. As part of the GSEs' comprehensive review, changes may also be made to provisions of the PMIERs that determine our Available Assets. As of December 31, 2016, we believe any reasonably foreseeable changes to the PMIERs financial requirements would not result in our failing to be in compliance with those new requirements.
In 2016, MGIC paid a total of $64 million in dividends to our holding company, its first dividends since 2008, and we expect MGIC to continue to pay quarterly dividends. OCI authorization is sought before MGIC pays dividends and MGIC will pay a dividend of $20 million to our holding company in the first quarter of 2017. Dividends from MGIC allow us to effectively utilize excess capital at MGIC to manage liquidity at our holding company, deploy capital to other business opportunities, or repurchase debt or shares of our common stock.
CAPITAL
GSEs
We must comply with the PMIERs to be eligible to insure loans purchased by the GSEs. In addition to their financial requirements, the PMIERs include business, quality control and certain transaction approval requirements. The financial requirements of the PMIERs require a mortgage insurer’s Available Assets to equal or exceed its Minimum Required Assets. Based on our interpretation of the PMIERs, as of
December 31, 2016
, MGIC’s Available Assets are
$4.7 billion
and its Minimum Required Assets are
$4.1 billion
; and MGIC is in compliance with the requirements of the PMIERs and eligible to insure loans purchased by the GSEs.
If MGIC ceases to be eligible to insure loans purchased by one or both of the GSEs, it would significantly reduce the volume of our NIW. Factors that may negatively impact MGIC’s ability to continue to comply with the PMIERs include the following:
|
•
|
The GSEs could make the PMIERs more onerous in the future; in this regard, the PMIERs provide that the tables of factors that determine Minimum Required Assets will be updated every two years and may be updated more frequently to reflect changes in macroeconomic conditions or loan performance. The GSEs will provide notice 180 days prior to the effective date of table updates. In addition, the GSEs may otherwise amend the PMIERs at any time.
|
|
•
|
The GSEs may reduce the amount of credit they allow under the PMIERs for the risk ceded under our quota share reinsurance transaction. The GSEs’ ongoing approval of that transaction is subject to several conditions and the transaction will be reviewed under the PMIERs at least annually by the GSEs. For more information about the transaction, see our risk factor titled “
The mix of business we write affects our Minimum Required Assets under the PMIERs, our premium yields and the likelihood of losses occurring.”
|
|
•
|
Our future operating results may be negatively impacted by the matters discussed in our risk factors. Such matters could decrease our revenues, increase our losses or require the use of liquid assets, thereby creating a shortfall in Available Assets.
|
|
•
|
Should capital be needed by MGIC in the future, capital contributions from our holding company may not be available due to competing demands on holding company resources, including for repayment of debt.
|
On an overall basis, the amount of Available Assets MGIC must hold in order to continue to insure GSE loans increased under the PMIERs over what state regulation currently requires.
State Regulations
The insurance laws of 16 jurisdictions, including Wisconsin, our domiciliary state, require a mortgage insurer to maintain a minimum amount of statutory capital relative to its RIF (or a similar measure) in order for the mortgage insurer to continue to write new business. We refer to these requirements as the “State Capital Requirements.” While they vary among jurisdictions, the most common State Capital Requirements allow for a maximum risk-to-capital ratio of 25 to 1. A risk-to-capital ratio will increase if (i) the percentage decrease in capital exceeds the percentage decrease in insured risk, or (ii) the percentage increase in capital is less than the percentage increase in insured risk. Wisconsin does not regulate capital by using a risk-to-capital measure but instead requires an MPP.
At
December 31, 2016
, MGIC’s risk-to-capital ratio was
10.7
to 1, below the maximum allowed by the jurisdictions with State Capital Requirements, and its policyholder position was $1.6 billion above the required MPP of $1.1 billion. In calculating our risk-to-capital ratio and MPP, we are allowed full credit for the risk ceded under our reinsurance transaction with a group of unaffiliated reinsurers. It is possible that under the revised State Capital Requirements discussed below, MGIC will not be allowed full credit for the risk ceded to the reinsurers. If MGIC is not allowed an agreed level of credit under either the State Capital Requirements or the PMIERs, MGIC may terminate the reinsurance transaction, without penalty. At this time, we expect MGIC
MGIC Investment Corporation 2016 Form 10-K
|
46
|
Management's Discussion and Analysis
|
|||||
|
Overview
|
Consolidated Results of Operations
|
Contractual Obligations
|
|||
|
Non-GAAP Financial Measures
|
Balance Sheet Analysis
|
Critical Accounting Policies
|
|||
|
Mortgage Insurance Portfolio
|
Liquidity and Capital Resources
|
Disclosures about Market Risk
|
|||
to continue to comply with the current State Capital Requirements; however, you should read our risk factors for information about matters that could negatively affect such compliance.
At
December 31, 2016
, the risk-to-capital ratio of our combined insurance operations (which includes a reinsurance affiliate) was
12.0
to 1. Reinsurance transactions with our affiliate permit MGIC to write insurance with a higher coverage percentage than it could on its own under certain state-specific requirements.
The NAIC previously announced that it plans to revise the minimum capital and surplus requirements for mortgage insurers that are provided for in its Mortgage Guaranty Insurance Model Act. In May 2016, a working group of state regulators released an exposure draft of a risk-based capital framework to establish capital requirements for mortgage insurers, although no date has been established by which the NAIC must propose revisions to the capital requirements. We continue to evaluate the impact of the framework contained in the exposure draft, including the potential impact of certain items that have not yet been completely addressed by the framework which include: the treatment of ceded risk, minimum capital floors, and action level triggers. Currently we believe that the PMIERs contain the more restrictive capital requirements in most circumstances.
GSE REFORM
The FHFA has been the conservator of the GSEs since 2008 and has the authority to control and direct their operations. The increased role that the federal government has assumed in the residential housing finance system through the GSE conservatorship may increase the likelihood that the business practices of the GSEs change in ways that have a material adverse effect on us and that the charters of the GSEs are changed by new federal legislation. In the past, members of Congress have introduced several bills intended to change the business practices of the GSEs and the FHA; however, no legislation has been enacted. The new Presidential administration has indicated that the conservatorship of the GSEs should end; however, it is unclear whether and when that would occur and how that would impact us. As a result of the matters referred to above, it is uncertain what role the GSEs, FHA and private capital, including PMI, will play in the residential housing finance system in the future or the impact of any such changes on our business. In addition, the timing of the impact of any resulting changes on our business is uncertain. Most meaningful changes would require Congressional action to implement and it is difficult to estimate when Congressional action would be final and how long any associated phase-in period may last.
For additional information about the business practices of the GSEs, see our risk factor titled “Changes in the business practices of the GSEs, federal legislation that changes their charters or a restructuring of the GSEs could reduce our revenues or increase our losses” in
Item 1A
.
LOAN MODIFICATIONS AND OTHER SIMILAR PROGRAMS
The federal government, including through the U.S. Department of the Treasury and the GSEs, and several lenders have modification and refinance programs to make outstanding loans more affordable to borrowers with the goal of reducing the number of foreclosures. These programs included HAMP and similar modification programs, and HARP. During 2015 and 2016, we were notified of modifications that cured delinquencies that had they become paid claims would have resulted in approximately $0.6 billion and $0.5 billion, respectively, of estimated claim payments. These levels are down from a high of $3.2 billion in 2010.
HAMP expired at the end of 2016 and although HARP has been extended through September 2017, we believe that we have realized the majority of the benefits from that program because the number of loans insured by us that we are aware are entering that program has decreased significantly. The GSEs have introduced the "Flex Modification" program to replace HAMP effective in October 2017. Until it becomes effective, loan servicers must still evaluate borrowers for other GSE modification programs.
We cannot determine the total benefit we may derive from loan modification programs, particularly given the uncertainty around the re-default rates for defaulted loans that have been modified. Our loss reserves do not account for potential re-defaults of current loans whose defaults were cured through modifications.
As shown in the following table, as of
December 31, 2016
approximately
19%
of our primary RIF has been modified:
|
Policy Year
|
HARP
(1)
Modifications
|
HAMP & Other Modifications
|
||
|
2003 and Prior
|
11.1%
|
36.0%
|
||
|
2004
|
18.1%
|
35.3%
|
||
|
2005
|
24.9%
|
35.7%
|
||
|
2006
|
27.8%
|
35.9%
|
||
|
2007
|
38.7%
|
29.5%
|
||
|
2008
|
53.0%
|
17.2%
|
||
|
2009
|
29.2%
|
3.5%
|
||
|
2010 - 2016
|
—%
|
0.1%
|
||
|
Total
|
10.3%
|
8.8%
|
||
|
(1)
|
Includes proprietary programs that are substantially the same as HARP.
|
47
|
MGIC Investment Corporation 2016 Form 10-K
As of
December 31, 2016
based on loan count, the loans associated with
97.5%
of all HARP modifications and 75.3% of HAMP and other modifications were current.
FACTORS AFFECTING OUR RESULTS
Our results of operations are affected by:
Premiums written and earned
Premiums written and earned in a year are influenced by:
|
•
|
NIW, which increases IIF, is the aggregate principal amount of the mortgages that are insured during a period. Many factors affect NIW, including the volume of low down payment home mortgage originations and competition to provide credit enhancement on those mortgages, including competition from the FHA, the VA, other mortgage insurers, GSE programs that may reduce or eliminate the demand for mortgage insurance and other alternatives to mortgage insurance. NIW does not include loans previously insured by us that are modified, such as loans modified under HARP.
|
|
•
|
Cancellations, which reduce IIF. Cancellations due to refinancings are affected by the level of current mortgage interest rates compared to the mortgage coupon rates throughout the in force book, current home values compared to values when the loans in the in force book were insured and the terms on which mortgage credit is available. Home price appreciation can give homeowners the right to cancel mortgage insurance on their loans if sufficient home equity is achieved. Cancellations also result from policy rescissions, which require us to return any premiums received on the rescinded policies and claim payments, which require us to return any premium received on the related policies from the date of default on the insured loans.
|
|
•
|
Premium rates, which are affected by product type, competitive pressures, the risk characteristics of the insured loans and the percentage of coverage on the insured loans. The substantial majority of our monthly and annual mortgage insurance premiums are under premium plans for which, for the first ten years of the policy, the amount of premium is determined by multiplying the initial premium rate by the original loan balance; thereafter, the premium resets and a lower premium rate is used for the remaining life of the policy. However, for loans that have utilized HARP, the initial ten-year period resets as of the date of the HARP transaction. The remainder of our monthly and annual premiums are under premium plans for which premiums are determined by a fixed percentage of the loan’s amortizing balance over the life of the policy.
|
|
•
|
Premiums ceded, net of a profit commission, under reinsurance agreements. See
Note 9 – “Reinsurance”
to our consolidated financial statements for a discussion of our reinsurance agreements.
|
Premiums are generated by the insurance that is in force during all or a portion of the period. A change in the average IIF in the current period compared to an earlier period is a factor that will increase (when the average in force is higher) or reduce (when it is lower) premiums written and earned in the current period, although this effect may be enhanced (or mitigated) by differences in the average premium rate between the two periods, as well as by premiums that are returned or expected to be returned in connection with claim payments and rescissions, and premiums ceded under reinsurance agreements. Also, NIW and cancellations during a period will generally have a greater effect on premiums written and earned in subsequent periods than in the period in which these events occur.
Investment income
Our investment portfolio is composed principally of investment grade fixed income securities. The principal factors that influence investment income are the size of the portfolio and its yield. As measured by amortized cost (which excludes changes in fair value, such as from changes in interest rates), the size of the investment portfolio is mainly a function of cash generated from (or used in) operations, such as NPW, investment income, net claim payments and expenses, and cash provided by (or used for) non-operating activities, such as debt or stock issuances or repurchases.
Losses incurred
Losses incurred are the current expense that reflects estimated payments that will ultimately be made as a result of delinquencies on insured loans. As explained under “
Critical Accounting Policies
” below, except in the case of a premium deficiency reserve, we recognize an estimate of this expense only for delinquent loans. The level of new delinquencies has historically followed a seasonal pattern, with new delinquencies in the first part of the year lower than new delinquencies in the latter part of the year, though this pattern can be affected by the state of the economy and local housing markets. Losses incurred are generally affected by:
|
•
|
The state of the economy, including unemployment and housing values, each of which affects the likelihood that loans will become delinquent and whether loans that are delinquent cure their delinquency. Changes in housing values also affect our ability to mitigate our losses through sales of properties we acquire after paying a claim as well as borrower willingness to continue to make mortgage payments when the value of the home is below the mortgage balance.
|
MGIC Investment Corporation 2016 Form 10-K
|
48
|
Management's Discussion and Analysis
|
|||||
|
Overview
|
Consolidated Results of Operations
|
Contractual Obligations
|
|||
|
Non-GAAP Financial Measures
|
Balance Sheet Analysis
|
Critical Accounting Policies
|
|||
|
Mortgage Insurance Portfolio
|
Liquidity and Capital Resources
|
Disclosures about Market Risk
|
|||
|
•
|
The product mix of the in force book, with loans having higher risk characteristics generally resulting in higher delinquencies and claims.
|
|
•
|
The size of loans insured, with higher average loan amounts tending to increase losses incurred.
|
|
•
|
The percentage of coverage on insured loans, with deeper average coverage tending to increase incurred losses.
|
|
•
|
The rate at which we rescind policies. Our estimated loss reserves reflect mitigation from rescissions of policies and denials of claims. We collectively refer to such rescissions and denials as “rescissions” and variations of this term.
|
|
•
|
The distribution of claims over the life of a book. Historically, the first few years after loans are originated are a period of relatively low claims, with claims increasing substantially for several years subsequent and then declining, although persistency, the condition of the economy, including unemployment and housing prices, and other factors can affect this pattern. For example, a weak economy or housing value declines can lead to claims from older books increasing, continuing at stable levels or experiencing a lower rate of decline. See further information under “Mortgage Insurance Earnings and Cash Flow Cycle” below.
|
|
•
|
Losses ceded under reinsurance agreements. See
Note 9 – “Reinsurance”
to our consolidated financial statements for a discussion of our reinsurance agreements.
|
Underwri
ti
ng and other expenses
The majority of our operating expenses are fixed, with some variability due to contract underwriting volume. Contract underwriting generates fee income included in “Other revenue.” Underwriting and other expenses are net of any ceding commission associated with our reinsurance agreements. See
Note 9 – “Reinsurance”
to our consolidated financial statements for a discussion of our reinsurance agreements.
Interest expense
Interest expense reflects the interest associated with our outstanding debt obligations discussed in
Note 7 – “Debt”
to our consolidated financial statements and under “
Liquidity and Capital Resources
” below.
Other
Certain activities that we do not consider to be part of our fundamental operating activities may also impact our results of operations and are described below.
Net realized investment gains (losses)
Realized gains and losses are a function of the difference between the amount received on the sale of a security and the security’s cost basis, as well as any OTTI recognized in earnings. The amount received on the sale of fixed income securities is affected by the coupon rate of the security compared to the yield of comparable securities at the time of sale.
Loss on debt extinguishment
At times, we may undertake activities to improve our debt profile and/or reduce potential dilution from our outstanding convertible debt. Extinguishing our outstanding debt obligations early through these discretionary activities may result in losses primarily driven by the payment of consideration in excess of our carrying value, and the write off of unamortized debt issuance costs on the extinguished portion of the long-term debt.
Refer to “
Explanation and reconciliation of our use of Non-GAAP financial measures
”
below to understand how these items impact our evaluation of our fundamental financial performance.
MORTGAGE INSURANCE EARNINGS AND CASH FLOW CYCLE
In general, the majority of any underwriting profit that a book generates occurs in the early years of the book, with the largest portion of any underwriting profit realized in the first year following the year the book was written. Subsequent years of a book generally result in either underwriting profit or underwriting losses. This pattern of results typically occurs because relatively few of the claims that a book will ultimately experience typically occur in the first few years of the book, when premium revenue is highest, while subsequent years are affected by declining premium revenues, as the number of insured loans decreases (primarily due to loan prepayments) and increasing losses. The typical pattern is also a function of premium rates generally resetting to lower levels after ten years.
49
|
MGIC Investment Corporation 2016 Form 10-K
Explanation and Reconciliation of our use of Non-GAAP Financial Measures
NON-GAAP FINANCIAL MEASURES
We believe that use of the Non-GAAP measures of pretax operating income (loss), net operating income (loss) and net operating income (loss) per diluted share facilitate the evaluation of the company's core financial performance thereby providing relevant information. These measures are not recognized in accordance with accounting principles generally accepted in the United States of America (GAAP) and should not be viewed as alternatives to GAAP measures of performance. The measures described below have been established to increase transparency for the purpose of evaluating our fundamental operating trends.
Pretax operating income (loss)
is defined as GAAP income (loss) before tax, excluding the effects of net realized investment gains (losses), gain (loss) on debt extinguishment, net impairment losses recognized in income (loss) and infrequent or unusual non-operating items, if any.
Net operating income (loss)
is defined as GAAP net income (loss) excluding the after-tax effects of net realized investment gains (losses), gain (loss) on debt extinguishment, net impairment losses recognized in income (loss), and infrequent or unusual non-operating items, and the effects of changes in our deferred tax valuation allowance. The amounts of adjustments to net income (loss) are tax effected using a federal statutory tax rate of 35%.
Net operating income (loss) per diluted share
is calculated by dividing (i) net operating income (loss) adjusted for interest expense on convertible debt, share dilution from convertible debt, and the impact of stock-based compensation arrangements consistent with the accounting standard regarding earnings per share, whenever the impact is dilutive, by (ii) diluted weighted average common shares outstanding.
Although pretax operating income (loss) and net operating income (loss) exclude certain items that have occurred in the past and are expected to occur in the future, the excluded items represent items that are: (1) not viewed as part of the operating performance of our primary activities; or (2) impacted by both discretionary and other economic factors and are not necessarily indicative of operating trends, or both. These adjustments, along with the reasons for their treatment, are described below. Other companies may calculate these measures differently. Therefore, their measures may not be comparable to those used by us.
|
(1)
|
Net realized investment gains (losses).
The recognition of net realized investment gains or losses can vary significantly across periods as the timing of individual securities sales is highly discretionary and is influenced by such factors as market opportunities, our tax and capital profile, and overall market cycles.
|
Trends in the profitability of our fundamental operating activities can be more clearly identified without the fluctuations of these realized investment gains and losses.
|
(2)
|
Gains and losses on debt extinguishment.
Gains and losses on debt extinguishment result from discretionary activities that are undertaken to enhance our capital position, improve our debt profile, and/or reduce potential dilution from our outstanding convertible debt.
|
|
(3)
|
Net impairment losses recognized in earnings.
The recognition of net impairment losses on investments can vary significantly in both size and timing, depending on market credit cycles, individual issuer performance, and general economic conditions.
|
|
(4)
|
Deferred tax asset valuation allowance.
The recognition, or reversal, of a valuation allowance against deferred tax assets is subject to significant management judgment and such recognition or reversal may significantly impact the discrete accounting period in which it is recorded.
|
MGIC Investment Corporation 2016 Form 10-K
|
50
|
Management's Discussion and Analysis
|
|||||
|
Overview
|
Consolidated Results of Operations
|
Contractual Obligations
|
|||
|
Non-GAAP Financial Measures
|
Balance Sheet Analysis
|
Critical Accounting Policies
|
|||
|
Mortgage Insurance Portfolio
|
Liquidity and Capital Resources
|
||||
|
Non-GAAP Reconciliations
|
||||||||||||
|
Reconciliation of Income before tax to pretax operating income and calculation of Net operating income
|
||||||||||||
|
Years Ended December 31,
|
||||||||||||
|
(In thousands)
|
2016
|
2015
|
2014
|
|||||||||
|
Income before tax per Statement of Operations
|
$
|
514,714
|
|
$
|
487,687
|
|
$
|
254,723
|
|
|||
|
Adjustments:
|
||||||||||||
|
Net realized investment gains
|
(8,932
|
)
|
(28,361
|
)
|
(1,357
|
)
|
||||||
|
Loss on debt extinguishment
|
90,531
|
|
507
|
|
837
|
|
||||||
|
Pretax operating income
|
596,313
|
|
459,833
|
|
254,203
|
|
||||||
|
Income taxes:
|
||||||||||||
|
Provision for income taxes
(1)
|
200,757
|
|
153,748
|
|
91,425
|
|
||||||
|
Net operating income
|
$
|
395,556
|
|
$
|
306,085
|
|
$
|
162,778
|
|
|||
|
(1)
Income before tax within operating income is tax effected at our effective tax rate. The effective tax rate for the years December 31, 2015 and 2014 exclude the effects of the change in our valuation allowance. Adjustments are tax effected at the federal statutory rate of 35%.
|
||||||||||||
|
Reconciliation of Net income to Net operating income
|
||||||||||||
|
Years Ended December 31,
|
||||||||||||
|
(In thousands)
|
2016
|
2015
|
2014
|
|||||||||
|
Net income
|
$
|
342,517
|
|
$
|
1,172,000
|
|
$
|
251,949
|
|
|||
|
Effect of change in deferred tax asset valuation allowance
|
—
|
|
(847,810
|
)
|
(88,833
|
)
|
||||||
|
Adjustments, net of tax
(1)
:
|
||||||||||||
|
Net realized investment gains
|
(5,806
|
)
|
(18,435
|
)
|
(882
|
)
|
||||||
|
Loss on debt extinguishment
|
58,845
|
|
330
|
|
544
|
|
||||||
|
Net operating income
|
$
|
395,556
|
|
$
|
306,085
|
|
$
|
162,778
|
|
|||
|
(1)
Adjustments are tax effected at the federal statutory rate of 35%.
|
||||||||||||
|
Reconciliation of Net operating income per diluted share to Net income per diluted share
|
||||||||||||
|
Years Ended December 31,
|
||||||||||||
|
2016
|
2015
|
2014
|
||||||||||
|
Net income per diluted share
|
$
|
0.86
|
|
$
|
2.60
|
|
$
|
0.64
|
|
|||
|
Effect of change in deferred tax asset valuation allowance
(1)
|
—
|
|
(1.81
|
)
|
(0.21
|
)
|
||||||
|
Net realized investment gains
|
(0.01
|
)
|
(0.04
|
)
|
—
|
|
||||||
|
Loss on debt extinguishment
|
0.14
|
|
—
|
|
—
|
|
||||||
|
Net operating income per diluted share
|
$
|
0.99
|
|
$
|
0.75
|
|
$
|
0.43
|
|
|||
|
(1)
The change in our deferred tax asset valuation allowance includes a $686.7 million reduction to our tax provision for amounts to be realized in future periods, or $1.47 per diluted share.
|
||||||||||||
51
|
MGIC Investment Corporation 2016 Form 10-K
Mortgage Insurance Portfolio
MORTGAGE ORIGINATIONS GREW AGAIN IN 2016; FORECASTED TO DECLINE IN 2017
(see chart
01
)
In 2016, the primary mortgage insurance market grew, driven by a larger mortgage origination market as solid housing fundamentals, such as household formations, an improved employment environment, and low interest rates supported housing activity. Mortgage origination estimates indicate that both purchase and refinance volume increased in 2016 compared to the prior year. The expected decline in mortgage originations in 2017 is based upon significantly lower refinancing originations as mortgage interest rates are anticipated to trend higher. Generally, the purchase origination market has a greater impact on the PMI industry as historically the industry's share is 3-4 times higher for purchase originations than refinancing originations. While a smaller mortgage origination market is expected to result in lower NIW for the overall PMI industry in 2017 recent industry consolidation is expected to result in lenders allocating NIW away from combining insurers to other private mortgage insurers. Competition from government mortgage insurance programs, discussed below, will also continue to impact the market share of PMI. In consideration of these factors, our 2017 NIW is expected to be comparable to that of 2016.
|
01
|
MORTGAGE ORIGINATIONS
IN BILLIONS
|
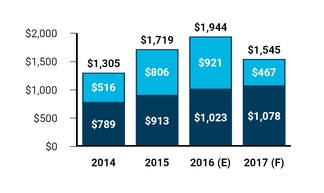
|
Purchase originations
|
Refinance originations
|
||
Source: GSEs and MBA estimates/forecasts as of January 2017. Amounts represent the average of all sources.
|
ESTIMATED TOTAL OF PMI, FHA, and VA PRIMARY MORTGAGE INSURANCE
IN BILLIONS
|
|||
|
2016
|
2015
|
2014
|
|
|
Primary mortgage insurance
|
$744
|
$628
|
$438
|
Source: Inside Mortgage Finance - February 16, 2017 (excluding USDA insured amounts), or SEC filings. Includes HARP NIW.
THE MORTGAGE INSURANCE INDUSTRY REMAINS INTENSELY COMPETITIVE
(see tables
02
and
03
)
We compete against five other private mortgage insurers, as well as government mortgage insurance programs such as the FHA and VA. There are various ways in which we compete with other mortgage insurers, including pricing, underwriting requirements, financial strength, customer relationships, reputation, and the strength of our management team and field organization. Competition in 2016 primarily centered on pricing practices in the market and included: (i) reductions in standard filed rates on BPMI policies, (ii) use by certain competitors of a spectrum of filed rates to allow for formulaic, risk-based pricing (commonly referred to as "black-box" pricing); and (iii) use of customized rates (discounted from published rates) on LPMI single premium policies. These pricing practices were driven by both the implementation of PMIERs at the end of 2015, as well as industry competition to maintain or grow market share. The result of the pricing changes, in which we participated, generally decreased filed premium rates on higher-FICO score loans and increased rates on lower-FICO score loans. We also continue to use authority set forth in our rate filings to provide customized LPMI single premium policy rates on a selective basis. We believe our current rates allow us to compete effectively across many FICO scores; however there is no guarantee that pricing competition will not intensify further, which could result in a decrease in our NIW and/or product-based returns.
The FHA offers fixed premium rates across all FICO scores and often has lower monthly premium rates across lower FICO business, which are effectively cross-subsidized by higher-FICO score premium rates. As a result, we have seen, and expect to continue to see some lenders utilize FHA insurance for the lower-FICO score business for which we compete. However, not all lower-FICO score business is migrating to the FHA because PMI may be cancelable when FHA insurance is not, lenders value our customer service, PMI continues to be an efficient and cost-effective alternative to the FHA for many borrowers, and some lenders perceive greater legal risks under FHA versus GSE programs. Any reduction in premium rates by the FHA that create a larger payment differential than at present could result in more business utilizing FHA mortgage insurance.
Even though the PMI industry's pricing changes raised premiums on lower-FICO score loans, the PMI industry captured a greater share of the total PMI and government insured volume in 2016. The increase in PMI share was due in part to new 97% LTV loan offerings from lenders that securitize loans with the GSEs, which provided an alternative to similar FHA loan programs for qualified borrowers, and
MGIC Investment Corporation 2016 Form 10-K
|
52
|
Management's Discussion and Analysis
|
|||||
|
Overview
|
Consolidated Results of Operations
|
Contractual Obligations
|
|||
|
Non-GAAP Financial Measures
|
Balance Sheet Analysis
|
Critical Accounting Policies
|
|||
|
Mortgage Insurance Portfolio
|
Liquidity and Capital Resources
|
Disclosures about Market Risk
|
|||
some lenders are shifting business away from the FHA due to perceived legal risks.
While our market share in 2016 declined from 2015 levels due to the overall competitive environment, we believe the decline is principally attributable to our maintaining greater pricing discipline than certain competitors in LPMI single premium policies. We plan to continue to focus on writing new insurance that meets our risk-adjusted return thresholds across the spectrum of loans we insure and provide market-leading customer service. Our market share in 2017 will again primarily be influenced by competitive pricing practices, but is also expected to be influenced by customer service, and changes in ownership of our competitors as lenders prefer to allocate business across a spectrum of mortgage insurers, with limitations on amounts allocated to any individual mortgage insurer.
|
02
|
ESTIMATED PRIMARY MI MARKET SHARE
% OF TOTAL PRIMARY MI VOLUME
|
|
2016
|
2015
|
2014
|
|
|
PMI
|
36.3%
|
35.0%
|
40.7%
|
|
FHA
|
36.4%
|
40.4%
|
33.9%
|
|
VA
|
27.3%
|
24.6%
|
25.4%
|
Source: Inside Mortgage Finance - February 16, 2017 (excluding USDA insured amounts). Includes HARP NIW.
|
03
|
ESTIMATED MGIC MARKET SHARE
% OF TOTAL PRIMARY PRIVATE MI VOLUME
|
|
2016
|
2015
|
2014
|
|
|
MGIC
|
17.8%
|
19.9%
|
19.8%
|
Source: Inside Mortgage Finance - February 16, 2017 or SEC filings. Excludes HARP NIW.
NEW INSURANCE WRITTEN INCREASED
11%
WITH STRONG UNDERLYING CREDIT CHARACTERISTICS
For the full-year 2016, NIW was higher than our initial expectations due to a stronger than expected mortgage origination market. From our perspective, the 2016 NIW has strong underlying credit characteristics as lenders maintained high underwriting standards and our pricing is competitive for higher-FICO score business
(see tables
04
and
05
)
. Our mix between policy payment types was relatively stable from the prior year, and we maintained a high mix of monthly premium business, which is almost exclusively BPMI
(see table
06
)
. Refinances were a larger percentage of our NIW in 2016
(see table
07
)
driven by a significant increase in refinancing activity in the second half of 2016 as average interest rates on 30-year fixed rate loans fell to multi-year lows in the third quarter following Britain's vote to exit the European Union. Across the spectrum of loan-to-value ratios, we had a greater increase in the
percentage of NIW from LTVs 95.01 and above, which was largely a function of new 97% LTV loan programs offered by lenders and a shift by lenders from the FHA to PMI. The percentage of NIW from LTVs 80.01% to 85% also increased for a number of reasons: our lowering of premiums in this LTV segment and for borrowers with higher FICO scores, and a higher amount of refinancing originations by borrowers whose home values increased but still were required to have PMI.
|
04
|
PRIMARY NIW BY FICO SCORE
IN BILLIONS
|
|
Years Ended December 31,
|
||||||||||||
|
2016
|
2015
|
2014
|
||||||||||
|
740 and greater
|
$
|
28.3
|
|
$
|
24.8
|
|
$
|
18.8
|
|
|||
|
700 - 739
|
12.2
|
|
10.8
|
|
8.6
|
|
||||||
|
660 - 699
|
5.9
|
|
5.8
|
|
4.8
|
|
||||||
|
659 and less
|
1.5
|
|
1.6
|
|
1.2
|
|
||||||
|
Total
|
$
|
47.9
|
|
$
|
43.0
|
|
$
|
33.4
|
|
|||
|
05
|
LOAN-TO-VALUE
% OF PRIMARY NIW
|
|
Years Ended December 31,
|
|||||||||
|
2016
|
2015
|
2014
|
|||||||
|
95.01% and above
|
5.8
|
%
|
4.4
|
%
|
1.8
|
%
|
|||
|
90.01% to 95.00%
|
47.8
|
%
|
50.1
|
%
|
55.5
|
%
|
|||
|
85.01% to 90.00%
|
31.7
|
%
|
33.1
|
%
|
31.5
|
%
|
|||
|
80.01% to 85%
|
14.7
|
%
|
12.4
|
%
|
11.2
|
%
|
|||
|
06
|
POLICY PAYMENT TYPE
% OF PRIMARY NIW
|
|
Years Ended December 31,
|
|||||||||
|
2016
|
2015
|
2014
|
|||||||
|
Monthly premiums
|
80.6
|
%
|
79.3
|
%
|
84.8
|
%
|
|||
|
Single premiums
|
19.1
|
%
|
20.4
|
%
|
14.9
|
%
|
|||
|
Annual Premiums
|
0.3
|
%
|
0.3
|
%
|
0.3
|
%
|
|||
|
07
|
TYPE OF MORTGAGE
% OF PRIMARY NIW
|
|
Years Ended December 31,
|
|||||||||
|
2016
|
2015
|
2014
|
|||||||
|
Purchases
|
80.4
|
%
|
81.3
|
%
|
86.6
|
%
|
|||
|
Refinances
|
19.6
|
%
|
18.7
|
%
|
13.4
|
%
|
|||
53
|
MGIC Investment Corporation 2016 Form 10-K
IIF INCREASED
4%
TO
$182B
; RIF INCREASED
4%
TO
$47.2B
(see table
08
)
The amount of our IIF and RIF is impacted by the amount of NIW and cancellations of primary IIF during the year. Although we wrote
$47.9 billion
of new insurance in
2016
, we experienced an increasing level of cancellation volume, which hindered our IIF growth from the prior year. Cancellation activity is primarily due to refinancing activity, but is also impacted by rescissions, cancellations due to claim payment, and policies cancelled when borrowers achieve the required amount of home equity. Refinancing activity has historically been affected by the level of mortgage interest rates and the level of home price appreciation. Cancellations generally move inversely to the change in the direction of interest rates, although they generally lag a change in direction.
Persistency
Our persistency at
December 31, 2016
was
76.9%
compared to
79.7%
at
December 31, 2015
. Since 2000, our year-end persistency ranged from a high of 84.7% at December 31, 2009 to a low of 47.1% at December 31, 2003. We expect our persistency to trend higher during 2017 from the level experienced at the end of 2016 because interest rates are forecasted to increase during 2017.
|
08
|
INSURANCE AND RISK IN FORCE
IN BILLIONS
|
|
Years Ended December 31,
|
||||||||||||
|
2016
|
2015
|
2014
|
||||||||||
|
NIW
|
$
|
47.9
|
|
$
|
43.0
|
|
$
|
33.4
|
|
|||
|
Cancellations
|
(40.4
|
)
|
(33.4
|
)
|
(27.2
|
)
|
||||||
|
Increase in primary IIF
|
$
|
7.5
|
|
$
|
9.6
|
|
$
|
6.2
|
|
|||
|
Direct primary IIF as of December 31,
|
$
|
182.0
|
|
$
|
174.5
|
|
$
|
164.9
|
|
|||
|
Direct primary RIF as of December 31,
|
$
|
47.2
|
|
$
|
45.5
|
|
$
|
42.9
|
|
|||
CREDIT PROFILE OF OUR PRIMARY RIF IS IMPROVING
(see table
09
)
The proportion of our total primary RIF written after 2008 has been steadily increasing in proportion to our total primary RIF. Our 2009 and later books possess significantly improved credit characteristics when compared to our 2005-2008 origination years. The loans we insured beginning in 2009, on average, have substantially higher FICO scores and lower LTVs than those insured in 2005-2008. The credit profile of our RIF has also benefited from programs such as HARP. HARP allows borrowers who are not delinquent, but who may not otherwise be able to refinance their loans under the current GSE underwriting standards due to, for example, the current LTV exceeding 100%, to refinance and lower their note rate. Loans
associated with
97.5%
of all of our HARP modifications were current as of
December 31, 2016
. The following chart shows the composition of our primary RIF as of
December 31, 2016
. As shown in the chart below, the aggregate of our 2009-2016 books and our HARP modifications accounted for approximately
81%
of our total primary RIF at
December 31, 2016
.
|
09
|
PRIMARY RISK IN FORCE
IN BILLIONS
|
|
December 31, 2016
|
December 31, 2015
|
December 31, 2014
|
||||||||||||||||
|
RIF
|
% of RIF
|
RIF
|
% of RIF
|
RIF
|
% of RIF
|
|||||||||||||
|
2009+
|
$
|
33,368
|
|
71
|
%
|
$
|
28,339
|
|
62
|
%
|
$
|
22,590
|
|
53
|
%
|
|||
|
2005 - 2008 (HARP)
|
4,489
|
|
9
|
%
|
5,237
|
|
12
|
%
|
5,758
|
|
13
|
%
|
||||||
|
Other years (HARP)
|
396
|
|
1
|
%
|
509
|
|
1
|
%
|
591
|
|
1
|
%
|
||||||
|
Subtotal
|
38,253
|
|
81
|
%
|
34,085
|
|
75
|
%
|
28,939
|
|
67
|
%
|
||||||
|
Other years (Non-HARP)
|
1,475
|
|
3
|
%
|
1,933
|
|
4
|
%
|
2,488
|
|
6
|
%
|
||||||
|
2005- 2008 (Non-HARP)
|
7,467
|
|
16
|
%
|
9,444
|
|
21
|
%
|
11,520
|
|
27
|
%
|
||||||
|
Subtotal
|
8,942
|
|
19
|
%
|
11,377
|
|
25
|
%
|
14,008
|
|
33
|
%
|
||||||
|
Total Primary RIF
|
$
|
47,195
|
|
100
|
%
|
$
|
45,462
|
|
100
|
%
|
$
|
42,947
|
|
100
|
%
|
|||
POOL AND OTHER INSURANCE
MGIC has written no new pool insurance since 2009, however, for a variety of reasons, including responding to capital market alternatives to private mortgage insurance and customer demands, MGIC may write pool risk in the future. Our direct pool RIF was
$547 million
(
$244 million
on pool policies with aggregate loss limits and
$303 million
on pool policies without aggregate loss limits) at
December 31, 2016
compared to
$659 million
(
$271 million
on pool policies with aggregate loss limits and
$388 million
on pool policies without aggregate loss limits) at
December 31, 2015
. If claim payments associated with a specific pool reach the aggregate loss limit, the remaining IIF within the pool would be cancelled and any remaining defaults under the pool would be removed from our default inventory.
In the second half of 2016 we participated in GSE credit risk transfer transactions through an affiliate of MGIC. Each GSE launched a new credit risk transfer offering that involved credit insurance policies with a pool structure that primarily covered loans to be delivered to the GSE in the future. The policies provide additional coverage beyond primary mortgage insurance on 30-year fixed-rate mortgages with 80.01-95% LTVs. These transactions were immaterial to our financial statements in 2016 and given the risk insured will remain immaterial to our financial statements in future periods. Future participation in GSE credit risk transfer transactions will need to be evaluated based upon the terms offered and expected returns.
MGIC Investment Corporation 2016 Form 10-K
|
54
|
Management's Discussion and Analysis
|
|||||
|
Overview
|
Consolidated Results of Operations
|
Contractual Obligations
|
|||
|
Non-GAAP Financial Measures
|
Balance Sheet Analysis
|
Critical Accounting Policies
|
|||
|
Mortgage Insurance Portfolio
|
Liquidity and Capital Resources
|
Disclosures about Market Risk
|
|||
Consolidated Results of Operations
The following section of the MD&A provides a comparative discussion of our Consolidated Results of Operations for the three-year period ended
December 31, 2016
. For a discussion of the Critical Accounting Policies used by us that affect the Consolidated Results of Operations, see
"Critical Accounting Policies"
below.
|
Revenues
|
||||||||||||
|
Year Ended December 31,
|
||||||||||||
|
(In millions)
|
2016
|
2015
|
2014
|
|||||||||
|
Net premiums written
|
$
|
975.1
|
|
$
|
1,020.3
|
|
$
|
882.0
|
|
|||
|
Net premiums earned
|
$
|
925.2
|
|
$
|
896.2
|
|
$
|
844.4
|
|
|||
|
Investment income, net of expenses
|
110.7
|
|
103.7
|
|
87.6
|
|
||||||
|
Net realized investment gains
|
8.9
|
|
28.4
|
|
1.4
|
|
||||||
|
Other revenue
|
17.7
|
|
13.0
|
|
9.3
|
|
||||||
|
Total revenues
|
$
|
1,062.5
|
|
$
|
1,041.3
|
|
$
|
942.6
|
|
|||
NPE INCREASED
3.2%
IN
2016
AND
6.1%
IN
2015
2016
compared to
2015
. NPW declined
4.4%
from the prior year, primarily because ceded premiums were lower in
2015
due to the commutation of our 2013 QSR Transaction in the third quarter, which was a non-recurring transaction. As part of the commutation, unearned ceded premiums were remitted back to us from the reinsurers, and we returned the related ceding commissions, which had the effect of increasing our profit commission. Partially offsetting the higher 2016 ceded premiums was an increase in new business premiums in 2016 and a reduction in premium refunds, and our related accrual, due to lower claim activity.
NPE increased
3.2%
from the prior year reflecting higher earned premiums from single premium policies and lower premium refunds and accruals. The increase in earned premiums on single premium policies was driven by refinance activity as single premium policies are generally non-refundable. The decrease in premium refund accruals was due to lower claim activity. The increase in net premiums earned was offset in part by the effects of our 2013 QSR Transaction commutation in 2015, which resulted in a non-recurring increase in our profit commission. See "
Overview – Factors Affecting Our Results
" above for additional factors that also influence the amount of net premiums written and earned in a year.
2015
compared to
2014
.
NPW
increased
15.7%
from the prior year. The increase reflects higher premiums from new business, as well as a reduction to our premium refund accruals. In addition, ceded premiums were lower in
2015
due to the commutation of our 2013 QSR Transaction in the third quarter.
NPE increased
6.1%
from the prior year reflecting higher profit commission and higher earned premiums on single premium policies. The higher profit commission was the result of the 2015 return of ceding commissions to reinsurers as part of the commutation of our 2013 QSR Transaction. The increase in earned premiums from single premium policies was driven by refinance activity as singles are generally non-refundable.
Premium Yield
(see table
10
)
Premium yield decreased to
51.9
basis points for 2016 (2015:
52.8
, 2014:
52.2
)
The amount of premiums earned from our average IIF during the year is important to understanding our consolidated results of operations and is influenced by a number of key drivers, which are described below. The impact each driver has from period to period will vary.
Change in premium rates
Changing premium rates have decreased our premium yield in 2016 primarily due to the following factors.
|
•
|
The books we wrote in 2009 and after were 72% of our IIF as of December 31, 2016, compared to 64% as of December 31, 2015 and these book years have a lower average premium rate than prior books due to several factors, including, lower risk characteristics.
|
|
•
|
The monthly premium program used for the substantial majority of loans we insured provides for a set premium rate for the first ten years of the policy and a lower premium rate thereafter. The initial ten-year period is reset when the loan is refinanced under HARP.
|
|
◦
|
As of December 31, 2016 approximately 4% and 2% of our total primary IIF was written in 2007 and 2008; respectively, was not refinanced under HARP and is subject to reset after ten years.
|
Change in premium refunds and premium refund accruals (excluding most single premium policies)
|
•
|
Premium refunds upon claim payment or rescission decrease our premium yield. Generally, the level of premiums we refund and our premium refund accrual are highly variable from period to period.
|
|
•
|
When a policy is cancelled for a reason other than rescission or claim payment, all premium that is non-refundable is immediately earned and any refundable premium from the cancellation date is returned to the servicer or borrower. Non-refundable premium is
|
55
|
MGIC Investment Corporation 2016 Form 10-K
primarily associated with our single premium policies, which are discussed below.
|
◦
|
When a policy is rescinded, all previously collected premium is returned to the servicer. When a policy is cancelled due to claim payment, we return any premium received since the date of default.
|
Single premium policy persistency
|
•
|
The recent decrease in single premium policy persistency has increased our premium yield, with an increasing impact in recent periods as single premium policies have become a larger portion of our IIF and mortgage interest rates have remained low resulting in greater cancellations of policies.
|
|
•
|
Generally, the premium on a single premium policy is not refundable and is earned over the estimated policy life. Therefore, if persistency is less than was assumed when the policy was written, the effective premium yield will increase.
|
Reinsurance
|
•
|
The use of reinsurance lowers our premium yield, however the magnitude of the impact varies from period to period due to the following considerations.
|
|
◦
|
The 2015 QSR Transaction increased the amount of our IIF covered by reinsurance and results in an increase in the amount of premiums and losses ceded. We cede 30% of earned and received premiums and losses incurred. The premiums we cede are reduced by a profit commission, which primarily varies by the level of losses we cede.
|
Our reinsurance affects premiums, underwriting expenses and losses incurred and should be analyzed by reviewing its total effect on our statements of operations, as discussed below under “
Reinsurance agreements
.”
2016
compared to
2015
. Our 2016 full-year premium yield declined when compared to full-year 2015
(see table
10
)
. As shown in the chart the decline in our premium yield was primarily due to a lower average premium rate on the 2016 average IIF. Our reinsurance reduced our premium yield an additional 1.5 basis points from 2015, which was in part due the commutation of our 2013 QSR Transaction in 2015 that resulted in a non-recurring increase in our profit commission and in turn reduced ceded premiums. These reductions were partially negated by a lower amount of premium refunds and a higher amount of earned premiums from single premium policies due to refinancings.
2015
compared to
2014
.
Our 2015 full-year premium yield increased when compared to full-year 2014
(see table
10
)
. As shown in the chart the increase in our premium yield was due to lower premium refunds, higher earned premiums
from single premium policies due to refinancings, and a less adverse impact from reinsurance due to the commutation of our 2013 QSR Transaction in 2015. These increases were offset in part by a lower average premium rate on the 2015 average IIF.
|
10
|
PREMIUM YIELD
IN BASIS POINTS
|
|
2016
|
2015
|
|||||
|
Prior year premium yield
|
52.8
|
|
52.2
|
|
||
|
Reconciliation:
|
||||||
|
change in premium rates
|
(3.0
|
)
|
(2.9
|
)
|
||
|
change in premium refunds and accruals
|
2.6
|
|
2.2
|
|
||
|
single premium policy persistency
|
1.0
|
|
0.7
|
|
||
|
reinsurance
|
(1.5
|
)
|
0.6
|
|
||
|
End of year premium yield
|
51.9
|
|
52.8
|
|
||
Reinsurance agreements
Our quota share reinsurance affects various lines of our statements of operations and therefore we believe it should be analyzed by reviewing its effect on our pre-tax net income, as described below.
|
•
|
We cede a fixed percentage of premiums earned and received on insurance covered by the agreement.
|
|
•
|
We receive the benefit of a profit commission through a reduction in the premiums we cede. The profit commission varies directly and inversely with the level of losses on a "dollar for dollar" basis and is eliminated at levels of losses that we do not expect to occur. This means that lower levels of losses result in a higher profit commission and less benefit from ceded losses; higher levels of losses result in more benefit from ceded losses and a lower profit commission (or for levels of losses we do not expect, its elimination).
|
|
•
|
We receive the benefit of a ceding commission through a reduction in underwriting expenses equal to 20% of premiums ceded (before the effect of the profit commission).
|
|
•
|
We cede a fixed percentage of losses incurred on insurance covered by the agreement.
|
The effects described above result in a net cost of the reinsurance, with respect to a covered loan, of 6% (but can be lower if losses are materially higher than we expect). This cost is derived by dividing the reduction in our pre-tax net income from such loans with reinsurance by our direct (that is, without reinsurance) premiums from such loans. Although the net cost of the reinsurance is generally constant at 6%, the effect of the reinsurance on the various components of pre-tax income discussed above will vary from period to period, depending on the level of ceded
MGIC Investment Corporation 2016 Form 10-K
|
56
|
Management's Discussion and Analysis
|
|||||
|
Overview
|
Consolidated Results of Operations
|
Contractual Obligations
|
|||
|
Non-GAAP Financial Measures
|
Balance Sheet Analysis
|
Critical Accounting Policies
|
|||
|
Mortgage Insurance Portfolio
|
Liquidity and Capital Resources
|
Disclosures about Market Risk
|
|||
losses. Because more of our IIF is covered under the 2015 QSR Transaction than was covered under the commuted 2013 QSR Transaction, the absolute dollar cost of the 2015 QSR Transaction will be higher than the cost of the 2013 QSR Transaction. Although the use of reinsurance reduces our pre-tax net income, we receive credit under the PMIERs for risk ceded under our 2015 QSR Transaction, which mitigates the negative effect of the PMIERs on our returns.
The following table provides additional information related to our premiums written and earned and RIF subject to reinsurance agreements for
2016
,
2015
, and
2014
.
|
As of and For the Years Ended December 31,
|
||||||||||||
|
(Dollars in thousands)
|
2016
|
2015
|
2014
|
|||||||||
|
NIW subject to quota share reinsurance agreements
|
89
|
%
|
91
|
%
|
90
|
%
|
||||||
|
IIF subject to quota share reinsurance agreements
|
76
|
%
|
73
|
%
|
56
|
%
|
||||||
|
IIF subject to captive reinsurance agreements
|
2
|
%
|
3
|
%
|
5
|
%
|
||||||
|
2015 QSR Transaction
(1)
|
||||||||||||
|
Ceded premiums written, net of profit commission
|
$
|
125,460
|
|
$
|
52,588
|
|
n/a
|
|
||||
|
% of direct premiums written
|
11
|
%
|
5
|
%
|
n/a
|
|
||||||
|
Ceded premiums earned, net of profit commission
|
$
|
125,460
|
|
$
|
52,588
|
|
n/a
|
|
||||
|
% of direct premiums earned
|
12
|
%
|
5
|
%
|
n/a
|
|
||||||
|
Ceding commissions
|
$
|
47,629
|
|
$
|
20,582
|
|
n/a
|
|
||||
|
Ceded RIF
|
$
|
10,763,637
|
|
$
|
9,886,952
|
|
n/a
|
|
||||
|
2013 QSR Transaction
(1)
|
||||||||||||
|
Ceded premiums written, net of profit commission
|
n/a
|
|
$
|
(11,355
|
)
|
$
|
100,031
|
|
||||
|
% of direct premiums written
|
n/a
|
|
(1
|
)%
|
10
|
%
|
||||||
|
Ceded premiums earned, net of profit commission
|
n/a
|
|
$
|
35,999
|
|
$
|
88,528
|
|
||||
|
% of direct premiums earned
|
n/a
|
|
4
|
%
|
9
|
%
|
||||||
|
Ceding commissions
|
n/a
|
|
$
|
10,234
|
|
$
|
37,833
|
|
||||
|
Ceded RIF
|
n/a
|
|
$
|
—
|
|
$
|
8,229,173
|
|
||||
|
Captives
|
||||||||||||
|
Ceded premiums written
|
$
|
7,987
|
|
$
|
13,547
|
|
$
|
18,794
|
|
|||
|
% of direct premiums written
|
1.0
|
%
|
1.3
|
%
|
1.9
|
%
|
||||||
|
Ceded premiums earned
|
$
|
8,090
|
|
$
|
13,650
|
|
$
|
18,917
|
|
|||
|
% of direct premiums earned
|
1.0
|
%
|
1.4
|
%
|
2.0
|
%
|
||||||
|
(1)
|
As discussed in
Note 9 - "Reinsurance"
to our consolidated financial statements, the 2013 QSR Transaction was commuted on July 1, 2015 and replaced with our 2015 QSR Transaction, which increased the IIF and corresponding RIF covered by reinsurance. Premiums are ceded on an earned and received basis under the 2015 QSR Transaction.
|
INVESTMENT INCOME INCREASED IN 2016 AND 2015 AS AVERAGE INVESTMENT YIELDS INCREASED
(see chart
11
)
2016
compared to
2015
.
Net investment income
increased
6.7%
to
$111 million
in
2016
compared to
$104 million
in
2015
. The increase in investment income was due to higher average investment yields, as well as a higher average investment portfolio balance.
2015
compared to
2014
.
Net investment income
increased
18.4%
to
$104M
in
2015
compared to
$88M
in
2014
. The increase in investment income was due to higher average investment yields.
See
"Balance Sheet Analysis"
in this MD&A for further discussion regarding our investment portfolio.
|
11
|
PORTFOLIO DURATION
IN YEARS
INVESTMENT YIELD
% OF AVERAGE INVESTMENT PORTFOLIO ASSETS
|
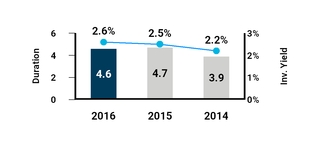
NET REALIZED INVESTMENT GAINS LOWER IN
2016
; 2015 GAINS REFLECT OPPORTUNISTIC SALES ACTIVITY
Net realized gains were
$9 million
in
2016
compared to
$28 million
in 2015 and
$1M
in
2014
. Net realized gains in 2015 were primarily taken from our fixed income portfolio as we sold securities to realize gains under favorable market conditions.
57
|
MGIC Investment Corporation 2016 Form 10-K
The net unrealized (losses) gains position of our investment portfolio
(see chart
12
)
as of December 31,
2016
,
2015
, and
2014
is as follows.
|
12
|
NET UNREALIZED INVESTMENT (LOSSES) GAINS
IN MILLIONS
|
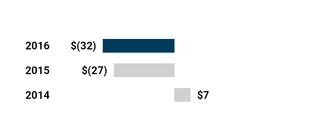
The net unrealized losses (gains) position of our investments as of
December 31, 2016
,
2015
,
2014
was primarily caused by changes in interest rates between the time of purchase and the respective year end. See
Note 5 - "Investments"
for additional information on our investment portfolio.
OTHER REVENUE INCREASED
IN 2016 ON FOREIGN CURRENCY GAINS AND 2015 ON CONTRACT UNDERWRITING ACTIVITY
2016
compared to
2015
.
Other revenue
increased
to
$18M
in
2016
from
$13M
in
2015
, primarily due to the substantial liquidation of our Australian operations for which we recognized approximately $4 million of gains related to changes in foreign currency exchange rates in the first quarter of 2016. Other revenue also increased compared to the prior year due to an increase in contract underwriting fees attributable to higher mortgage origination volumes.
2015
compared to
2014
.
Other revenue
increased
to
$13M
in
2015
from
$9 million
in
2014
primarily due to an increase in our contract underwriting fees attributable to higher mortgage origination volumes.
|
Losses and expenses
|
||||||||||||
|
Year Ended December 31,
|
||||||||||||
|
(In millions)
|
2016
|
2015
|
2014
|
|||||||||
|
Losses incurred, net
|
$
|
240.2
|
|
$
|
343.5
|
|
$
|
496.1
|
|
|||
|
Change in premium deficiency reserve
|
—
|
|
(23.8
|
)
|
(24.7
|
)
|
||||||
|
Amortization of deferred policy acquisition costs
|
9.6
|
|
8.8
|
|
7.6
|
|
||||||
|
Other underwriting and operating expenses, net
|
150.8
|
|
155.6
|
|
138.4
|
|
||||||
|
Interest expense
|
56.7
|
|
68.9
|
|
69.6
|
|
||||||
|
Loss on debt extinguishment
|
90.5
|
|
0.5
|
|
0.8
|
|
||||||
|
Total losses and expenses
|
$
|
547.8
|
|
$
|
553.6
|
|
$
|
687.9
|
|
|||
LOSSES INCURRED, NET CONTINUED TO DECLINE AS CREDIT QUALITY CONTINUED TO IMPROVE
As discussed in “Critical Accounting Policies” below and consistent with industry practices, we establish loss reserves for future claims only for loans that are currently delinquent. The terms “delinquent” and “default” are used interchangeably by us. We consider a loan in default when it is two or more payments past due. Loss reserves are established based on estimating the number of loans in our default inventory that will result in a claim payment, which is referred to as the claim rate, and further estimating the amount of the claim payment, which is referred to as claim severity.
Estimation of losses is inherently judgmental. The conditions that affect the claim rate and claim severity include the current and future state of the domestic economy, including unemployment and the current and future strength of local housing markets. The actual amount of the claim payments may be substantially different than our loss reserve estimates. Our estimates could be adversely affected by several factors, including a deterioration of regional or national economic conditions, including unemployment, leading to a reduction in borrower income and thus their ability to make mortgage payments, and a drop in housing values, that could result in, among other things, greater losses on loans, and may affect borrower willingness to continue to make mortgage payments when the value of the home is below the mortgage balance.
Historically, losses incurred have followed a seasonal trend in which the second half of the year has weaker credit performance than the first half, with higher new notice activity and a lower cure rate.
Our estimates are also affected by any agreements we enter into regarding our claims paying practices, such as the settlement agreements discussed in
Note 17 – “Litigation and Contingencies”
to our consolidated financial statements. Changes to our estimates could
MGIC Investment Corporation 2016 Form 10-K
|
58
|
Management's Discussion and Analysis
|
|||||
|
Overview
|
Consolidated Results of Operations
|
Contractual Obligations
|
|||
|
Non-GAAP Financial Measures
|
Balance Sheet Analysis
|
Critical Accounting Policies
|
|||
|
Mortgage Insurance Portfolio
|
Liquidity and Capital Resources
|
Disclosures about Market Risk
|
|||
result in a material impact to our consolidated results of operations and capital position, even in a stable economic environment.
Losses incurred, net
2016
compared to
2015
.
Losses incurred, net
decreased
30%
to
$240 million
compared to
$344 million
in
2015
. The decrease was primarily due to a decrease in losses and LAE incurred in respect to defaults reported in the current year and favorable development on defaults that occurred in prior years. Current year losses declined due to a
9%
reduction in new notices received and a lower claim rate applied to the new notices. The claim rate applied to new notices in each quarter of 2016 and 2015 generally ranged from 12% to 13% with the full-year 2016 claim rate on new notices declining by approximately 0.5 percentage points compared to the full-year 2015 claim rate. Favorable development on prior year defaults occurred in 2016 and 2015 due to a lower claim rate on previously reported defaults. In 2015, the amount of development was also favorably impacted by $21 million due to re-estimation of previously recorded reserves related to disputes on our claims paying practices and IBNR. T
he favorable development recognized in both
2016
and
2015
due to lower claim rates on prior year defaults was partially offset by increases in our expected severity assumption on prior year defaults. The increases in our severity assumption reflected a rising trend, following periods of relative stability, in our average claim paid, expressed as a percentage of our exposure (the unpaid principal balance of the loan times our insurance coverage percentage), from the first quarter of 2015 through the first quarter of 2016 (see table
17
). Our loss reserves estimates take into consideration trends over time, because the development of the delinquencies may vary from period to period without establishing a meaningful trend.
2015
compared to
2014
.
Losses incurred, net
decreased
31%
to
$344 million
compared to
$496 million
in
2014
. The
decrease
was primarily due to a decrease in losses and LAE incurred in respect to defaults reported in 2015 and favorable development on defaults that occurred in prior years. The 2015 current year losses declined due to a
16%
reduction in new notices received and a lower claim rate applied to the new notices. The claim rate applied to new notices in each quarter of 2015 and 2014 generally ranged from 12% to 16%, with the full-year 2015 claim rate on new notices declining by approximately 2 percentage points compared to the full-year 2014 claim rate. The claim rate declined due to improved housing and economic conditions. The favorable development recognized in
2015
resulting from lower claim rates on prior year defaults was partially offset by increases in our expected severity assumption on prior year's defaults. The increases in our severity assumption reflected a rising trend, following periods of relative stability, in our average paid claim expressed as a percentage of our exposure, throughout 2015
(see table
17
)
.
In 2014, the favorable development reflected a lower claim rate and a lower severity assumption on prior years defaults.
|
13
|
COMPOSITION OF LOSSES INCURRED
IN MILLIONS
|
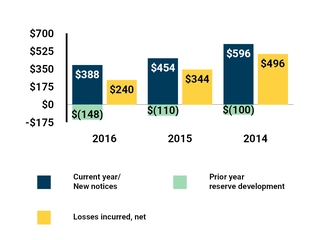
Loss Ratio
(see chart
14
)
The loss ratio is the ratio, expressed as a percentage, of the sum of incurred losses and LAE, net to net premiums earned. The decline in the loss ratio in 2016 when compared to 2015, and in 2015 when compared to 2014 was primarily due to a lower level of losses incurred, net.
|
14
|
LOSS RATIO
|
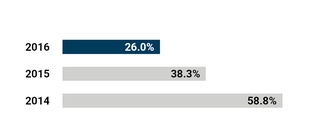
Claim Rate
(see chart
15
)
Loans insured in 2008 and prior continue to represent a substantial portion of our new default notices received each quarter, with many new default notices relating to loans that previously had been reported delinquent (see chart
16
). For 2016, loans insured in 2008 and prior represented approximately 87% of the new notices received and 90% of those notices related to loans that were previously delinquent. For 2015, loans insured in 2008 and prior represented approximately 92% of the new notices received and 88% of those notices related to loans that were previously delinquent. For 2014, loans insured in 2008 and
59
|
MGIC Investment Corporation 2016 Form 10-K
prior represented approximately 96% of new notices received and 86% of those notices related to loans that were previously delinquent (see chart
16
). As a result of this cycle (in which loans default, cure, and re-default, along with the duration that defaults may ultimately remain in our notice inventory), significant judgment is required in establishing the claim rate.
|
15
|
PRIMARY NEW NOTICES
IN VOLUME
NEW NOTICE CLAIM RATE
(1)
%
|
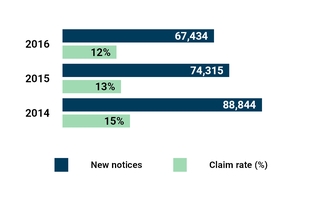
|
(1)
|
Claim rate is the respective full year weighted average rate and is rounded to nearest whole percent.
|
|
16
|
NEW NOTICES FROM BOOK YEARS 2008 AND PRIOR
IN VOLUME
PREVIOUSLY DELINQUENT
%
|
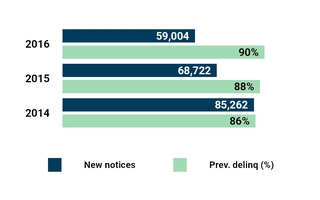
Claims Severity
(
see table
17
)
Factors that impact claim severity include the exposure on the loan, the amount of time between default and claim filing (which impacts the amount of interest and expenses) and curtailments. All else being equal, the longer the period between default and claim filing, the greater the severity. The majority of loans from 2005-2008 (which represent the majority of loans in the delinquent inventory) are covered by master policy terms that, except under certain circumstances, do not limit the number of years that an insured can include interest when filing a claim if they comply with their obligations under the terms of the master policy.
|
17
|
CLAIMS SEVERITY TREND
|
|
Note: Table excludes material settlements
(1)
.
|
||||||||||||||
|
Period
|
Average exposure on claim paid
|
Average claim paid
|
% Paid to exposure
|
Average number of missed payments at claim received date
|
||||||||||
|
Q4 2016
|
$
|
43,200
|
|
$
|
48,297
|
|
111.8
|
%
|
35
|
|
||||
|
Q3 2016
|
$
|
43,747
|
|
$
|
48,050
|
|
109.8
|
%
|
34
|
|
||||
|
Q2 2016
|
43,709
|
|
47,953
|
|
109.7
|
%
|
35
|
|
||||||
|
Q1 2016
|
44,094
|
|
49,281
|
|
111.8
|
%
|
34
|
|
||||||
|
Q4 2015
|
44,342
|
|
49,134
|
|
110.8
|
%
|
35
|
|
||||||
|
Q3 2015
|
44,159
|
|
48,156
|
|
109.1
|
%
|
33
|
|
||||||
|
Q2 2015
|
44,683
|
|
48,587
|
|
108.7
|
%
|
34
|
|
||||||
|
Q1 2015
|
44,403
|
|
47,366
|
|
106.7
|
%
|
33
|
|
||||||
|
Q4 2014
|
44,321
|
|
46,714
|
|
105.4
|
%
|
32
|
|
||||||
|
Q3 2014
|
43,769
|
|
45,849
|
|
104.8
|
%
|
30
|
|
||||||
|
Q2 2014
|
43,402
|
|
45,531
|
|
104.9
|
%
|
30
|
|
||||||
|
Q1 2014
|
43,711
|
|
45,897
|
|
105.0
|
%
|
28
|
|
||||||
|
(1)
- Settlements include amounts paid in settlement disputes for claims paying practices and NPL settlements.
|
||||||||||||||
See
Note 8 – “Loss Reserves”
to our consolidated financial statements and “
Critical Accounting Policies
” below for a discussion of our losses incurred and claims paying practices (including curtailments).
MGIC Investment Corporation 2016 Form 10-K
|
60
|
Management's Discussion and Analysis
|
|||||
|
Overview
|
Consolidated Results of Operations
|
Contractual Obligations
|
|||
|
Non-GAAP Financial Measures
|
Balance Sheet Analysis
|
Critical Accounting Policies
|
|||
|
Mortgage Insurance Portfolio
|
Liquidity and Capital Resources
|
Disclosures about Market Risk
|
|||
NET LOSSES AND LAE PAID CONTINUED TO DECLINE AS CREDIT IMPROVED ON OUR PRIMARY RIF
This section provides information on our claim payment trends and exposure on our outstanding RIF for the three years ending December 31,
2016
.
Net losses and LAE paid decreased
16%
in 2016 compared to
2015
driven by lower claim activity on our primary business as the credit profile of our RIF continued to improve and our delinquent inventory declined. This is a continuation of the trend experienced in
2015
as net losses and LAE paid decreased
28%
compared to
2014
. During 2016, there was an increase in loss payments from settlements of disputes for claims paying practices and NPL settlements increased, primarily due to NPL settlements with the GSEs to resolve legacy defaults. Pool losses paid included our 2011 settlement with Freddie Mac; our final payment under this settlement was made on December 1, 2016. We believe paid claims will continue to decline in 2017.
The following table presents our net losses and LAE paid for the years ended December 31,
2016
,
2015
and
2014
.
|
Net Losses and LAE Paid
|
||||||||||||
|
(In millions)
|
2016
|
2015
|
2014
|
|||||||||
|
Total primary (excluding settlements)
|
$
|
599
|
|
$
|
767
|
|
$
|
1,082
|
|
|||
|
Claims paying practices and NPL settlements
(1)
|
53
|
|
10
|
|
(8
|
)
|
||||||
|
Pool
(2)
|
56
|
|
68
|
|
84
|
|
||||||
|
Other
|
(1
|
)
|
5
|
|
1
|
|
||||||
|
Direct losses paid
|
707
|
|
850
|
|
1,159
|
|
||||||
|
Reinsurance
|
(23
|
)
|
(23
|
)
|
(34
|
)
|
||||||
|
Net losses paid
|
684
|
|
827
|
|
1,125
|
|
||||||
|
LAE
|
20
|
|
22
|
|
29
|
|
||||||
|
Net losses and LAE paid before terminations
|
704
|
|
849
|
|
1,154
|
|
||||||
|
Reinsurance terminations
|
(3
|
)
|
(15
|
)
|
—
|
|
||||||
|
Net losses and LAE paid
|
$
|
701
|
|
$
|
834
|
|
$
|
1,154
|
|
|||
|
(1)
|
See
Note 8 - "Loss Reserves"
for additional information on our settlements of disputes for claims paying practices and NPL settlements.
|
|
(2)
|
2016, 2015 and 2014 each include $42 million paid under the terms of our settlement with Freddie Mac as discussed in
Note 8 - "Loss Reserves"
to our consolidated financial statements.
|
Primary losses paid for the top 15 jurisdictions (based on
2016
losses paid, excluding settlement amounts) and all other jurisdictions for the years ended December 31,
2016
,
2015
and
2014
appears in the following table.
|
Paid Losses by Jurisdiction
|
||||||||||||
|
(In millions)
|
2016
|
2015
|
2014
|
|||||||||
|
Florida
|
$
|
85
|
|
$
|
154
|
|
$
|
256
|
|
|||
|
New Jersey
|
60
|
|
44
|
|
38
|
|
||||||
|
Illinois
|
43
|
|
60
|
|
91
|
|
||||||
|
New York
|
35
|
|
31
|
|
27
|
|
||||||
|
Maryland
|
29
|
|
45
|
|
49
|
|
||||||
|
California
|
27
|
|
38
|
|
55
|
|
||||||
|
Pennsylvania
|
26
|
|
33
|
|
42
|
|
||||||
|
Ohio
|
21
|
|
26
|
|
41
|
|
||||||
|
Puerto Rico
|
17
|
|
14
|
|
16
|
|
||||||
|
Washington
|
15
|
|
24
|
|
38
|
|
||||||
|
Virginia
|
15
|
|
16
|
|
18
|
|
||||||
|
Michigan
|
14
|
|
17
|
|
29
|
|
||||||
|
Massachusetts
|
14
|
|
15
|
|
12
|
|
||||||
|
Connecticut
|
14
|
|
18
|
|
18
|
|
||||||
|
Georgia
|
13
|
|
19
|
|
29
|
|
||||||
|
All other jurisdictions
|
171
|
|
213
|
|
323
|
|
||||||
|
Total primary (excluding settlements)
|
$
|
599
|
|
$
|
767
|
|
$
|
1,082
|
|
|||
Note: Jurisdictions in italics in the table above are those that predominately use a judicial foreclosure process, which generally increases the amount of time it takes for a foreclosure to be completed.
The primary average claim paid for the top 5 jurisdictions (based on
2016
losses paid, excluding settlement amounts) for the years ended December 31,
2016
,
2015
and
2014
appears in the table below. The primary average claim paid can vary materially from period to period based upon a variety of factors, including the local market conditions, average loan amount, average coverage percentage, and loss mitigation efforts on loans for which claims are paid.
|
Primary average claim paid
|
|||||||||||
|
2016
|
2015
|
2014
|
|||||||||
|
Florida
|
$
|
60,737
|
|
$
|
58,709
|
|
$
|
55,537
|
|
||
|
New Jersey
|
81,955
|
|
74,160
|
|
74,477
|
|
|||||
|
Illinois
|
50,047
|
|
49,673
|
|
48,278
|
|
|||||
|
New York
|
70,869
|
|
68,341
|
|
68,377
|
|
|||||
|
Maryland
|
72,396
|
|
77,404
|
|
66,270
|
|
|||||
|
All other jurisdictions
|
40,828
|
|
41,065
|
|
40,419
|
|
|||||
|
All jurisdictions
|
$
|
48,416
|
|
$
|
47,931
|
|
$
|
46,039
|
|
||
Note: Jurisdictions in italics in the table above are those that predominately use a judicial foreclosure process, which generally increases the amount of time it takes for a foreclosure to be completed.
61
|
MGIC Investment Corporation 2016 Form 10-K
The primary average exposure for the top 5 jurisdictions (based on
2016
losses paid, excluding settlement amounts) for the years ended December 31,
2016
,
2015
and
2014
appears in the table below.
|
Primary average exposure
|
|||||||||||
|
2016
|
2015
|
2014
|
|||||||||
|
Florida
|
$
|
49,908
|
|
$
|
49,095
|
|
$
|
47,487
|
|
||
|
New Jersey
|
63,351
|
|
62,496
|
|
61,484
|
|
|||||
|
Illinois
|
40,696
|
|
40,368
|
|
39,888
|
|
|||||
|
New York
|
52,006
|
|
50,964
|
|
50,042
|
|
|||||
|
Maryland
|
63,812
|
|
62,912
|
|
62,630
|
|
|||||
|
All other jurisdictions
|
46,481
|
|
44,887
|
|
43,301
|
|
|||||
|
All jurisdictions
|
47,276
|
|
45,820
|
|
44,332
|
|
|||||
LOSS RESERVES CONTINUED TO DECLINE ON LOWER DEFAULT INVENTORY
Our primary default rate at December 31,
2016
was
5.04%
(2015:
6.31%
, 2014:
8.25%
). Our primary default inventory was
50,282
loans at December 31,
2016
, representing a decrease of
20%
from 2015 and
37%
from 2014. The reduction in our primary default inventory is the result of the total number of defaulted loans: (1) that have cured; (2) for which claim payments have been made; or (3) that have resulted in rescission, claim denial, or removal from inventory due to NPL settlements, collectively exceeding the total number of new defaults on insured loans. In recent periods we have experienced improved cure rates and the overall mix of our default inventory, as represented by the number of missed payments, has improved compared to the prior years. As of December 31,
2016
, the percentage of our default inventory that has 12 or more missed payments was
38%
(2015:
43%
, 2014:
47%
). Generally, the fewer missed payments a defaulted loan has the lower the likelihood it will result in a claim. The NPL settlements were each completed at amounts approximating the loss reserves previously established on the defaulted loans. We expect our default inventory to continue to decline in 2017 from 2016 levels; however, the pace of decline is expected to moderate as our more recent book years naturally season.
The primary and pool loss reserves as of December 31,
2016
,
2015
and
2014
appear in the table below.
|
Gross Reserves
|
December 31,
|
|||||||||||||||||||
|
2016
|
2015
|
2014
|
||||||||||||||||||
|
Primary:
|
||||||||||||||||||||
|
Direct loss reserves
(in millions)
|
$
|
1,334
|
|
$
|
1,681
|
|
$
|
2,114
|
|
|||||||||||
|
IBNR and LAE
|
79
|
|
126
|
|
132
|
|
||||||||||||||
|
Total primary loss reserves
|
1,413
|
|
1,807
|
|
2,246
|
|
||||||||||||||
|
Ending default inventory
|
50,282
|
|
62,633
|
|
79,901
|
|
||||||||||||||
|
Percentage of loans delinquent (default rate)
|
5.04
|
%
|
6.31
|
%
|
8.25
|
%
|
||||||||||||||
|
Average direct reserve per default
|
$
|
28,104
|
|
$
|
28,859
|
|
$
|
28,107
|
|
|||||||||||
|
Primary claims received inventory included in ending default inventory
|
1,385
|
|
2,769
|
|
4,746
|
|
||||||||||||||
|
Pool
(1)
:
|
||||||||||||||||||||
|
Direct loss reserves
(in millions)
:
|
||||||||||||||||||||
|
With aggregate loss limits
|
18
|
|
34
|
|
53
|
|
||||||||||||||
|
Without aggregate loss limits
|
7
|
|
9
|
|
12
|
|
||||||||||||||
|
Reserves related to Freddie Mac settlement
(2)
|
—
|
|
42
|
|
84
|
|
||||||||||||||
|
Total pool direct loss reserves
|
25
|
|
85
|
|
|
149
|
|
|||||||||||||
|
Ending default inventory:
|
||||||||||||||||||||
|
With aggregate loss limits
|
1,382
|
|
2,126
|
|
3,020
|
|
||||||||||||||
|
Without aggregate loss limits
|
501
|
|
613
|
|
777
|
|
||||||||||||||
|
Total pool ending default inventory
|
|
|
1,883
|
|
|
|
2,739
|
|
|
|
3,797
|
|
||||||||
|
Pool claims received inventory included in ending default inventory
|
72
|
|
60
|
|
99
|
|
||||||||||||||
|
Other gross reserves
(in millions)
|
1
|
|
1
|
|
2
|
|
||||||||||||||
|
(1)
|
Since a number of our pool policies include aggregate loss limits and/or deductibles, we do not disclose an average direct reserve per default for our pool business.
|
MGIC Investment Corporation 2016 Form 10-K
|
62
|
Management's Discussion and Analysis
|
|||||
|
Overview
|
Consolidated Results of Operations
|
Contractual Obligations
|
|||
|
Non-GAAP Financial Measures
|
Balance Sheet Analysis
|
Critical Accounting Policies
|
|||
|
Mortgage Insurance Portfolio
|
Liquidity and Capital Resources
|
Disclosures about Market Risk
|
|||
|
(2)
|
See our Form 8-K filed with the Securities and Exchange Commission on November 30, 2012 for a discussion of our settlement with Freddie Mac regarding a pool policy. As of December 31, 2016 we had completed our obligation under this settlement agreement.
|
The primary default inventory for the top 15 jurisdictions (based on
2016
losses paid, excluding settlement amounts) at December 31,
2016
,
2015
and
2014
appears in the table below.
|
Primary Default Inventory by Jurisdiction
|
||||||||
|
|
2016
|
2015
|
2014
|
|||||
|
Florida
|
4,150
|
|
5,903
|
|
9,442
|
|
||
|
New Jersey
|
2,586
|
|
3,498
|
|
4,077
|
|
||
|
Illinois
|
2,649
|
|
3,301
|
|
4,481
|
|
||
|
New York
|
3,171
|
|
3,901
|
|
4,595
|
|
||
|
Maryland
|
1,312
|
|
1,609
|
|
2,119
|
|
||
|
California
|
1,590
|
|
2,019
|
|
2,777
|
|
||
|
Pennsylvania
|
2,984
|
|
3,574
|
|
4,480
|
|
||
|
Ohio
|
2,614
|
|
3,209
|
|
3,908
|
|
||
|
Puerto Rico
|
1,844
|
|
2,221
|
|
2,453
|
|
||
|
Washington
|
754
|
|
1,049
|
|
1,415
|
|
||
|
Virginia
|
885
|
|
1,109
|
|
1,355
|
|
||
|
Michigan
|
1,482
|
|
1,877
|
|
2,447
|
|
||
|
Massachusetts
|
1,108
|
|
1,390
|
|
1,631
|
|
||
|
Connecticut
|
690
|
|
832
|
|
1,095
|
|
||
|
Georgia
|
1,853
|
|
2,225
|
|
2,726
|
|
||
|
All other jurisdictions
|
20,610
|
|
24,916
|
|
30,900
|
|
||
|
Total
|
50,282
|
|
62,633
|
|
79,901
|
|
||
Note: Jurisdictions in italics in the table above are those that predominately use a judicial foreclosure process, which generally increases the amount of time it takes for a foreclosure to be completed.
The primary default inventory by policy year at December 31,
2016
,
2015
and
2014
appears in the table below.
|
Primary Default Inventory by Policy Year
|
||||||||
|
2016
|
2015
|
2014
|
||||||
|
2004 and prior
|
11,116
|
|
14,599
|
|
19,797
|
|
||
|
2005
|
5,826
|
|
7,890
|
|
10,630
|
|
||
|
2006
|
9,267
|
|
11,853
|
|
15,529
|
|
||
|
2007
|
15,816
|
|
20,000
|
|
25,232
|
|
||
|
2008
|
4,140
|
|
5,418
|
|
6,721
|
|
||
|
2009
|
421
|
|
515
|
|
648
|
|
||
|
2010
|
222
|
|
274
|
|
300
|
|
||
|
2011
|
246
|
|
246
|
|
260
|
|
||
|
2012
|
364
|
|
388
|
|
316
|
|
||
|
2013
|
686
|
|
615
|
|
335
|
|
||
|
2014
|
1,142
|
|
672
|
|
133
|
|
||
|
2015
|
814
|
|
163
|
|
—
|
|
||
|
2016
|
222
|
|
—
|
|
—
|
|
||
|
Total
|
50,282
|
|
62,633
|
|
79,901
|
|
||
Our results of operations continue to be negatively impacted by the mortgage insurance we wrote during 2005 through 2008 (see chart
18
). Although uncertainty remains with respect to the ultimate losses we will experience on these books of business, as we continue to write new insurance on mortgages, those books have become a smaller percentage of our total mortgage insurance portfolio. Our 2005 through 2008 books of business represented approximately
25%
and 32% of our total primary RIF at
December 31, 2016
and
2015
, respectively. Approximately
38%
of the remaining primary RIF on our 2005-2008 books of business benefited from HARP as of
December 31, 2016
, compared to 36% as of
December 31, 2015
.
63
|
MGIC Investment Corporation 2016 Form 10-K
|
18
|
DEFAULT INVENTORY MIX BY BOOK YEAR
% OF TOTAL INVENTORY
|
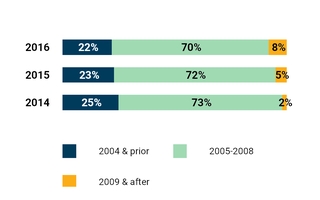
On our primary business, the highest claim frequency years have typically been the third and fourth year after the year of loan origination. However, the pattern of claims frequency can be affected by many factors, including persistency and deteriorating economic conditions. Low persistency can accelerate the period in the life of a book during which the highest claim frequency occurs. Deteriorating economic conditions can result in increasing claims following a period of declining claims. As of
December 31, 2016
,
54%
of our primary RIF was written subsequent to December 31, 2013,
62%
of our primary RIF was written subsequent to December 31, 2012, and
67%
of our primary RIF was written subsequent to December 31, 2011.
UNDERWRITING AND OTHER EXPENSES, NET AS A PERCENTAGE OF NPW REMAIN LOW
2016
compared to
2015
.
Underwriting and other expenses includes items such as employee compensation costs, fees for professional services, and premium taxes, and are reported net of ceding commissions. Underwriting and other expenses for
2016
decreased
when compared to
2015
due to an increase in ceding commissions from reinsurers, offset by increases in employee costs and professional services.
2015
compared to
2014
.
Underwriting and other expenses for
2015
increased
when compared to
2014
. The increase was primarily due to a return of ceding commissions to reinsurers as a result of commuting our 2013 QSR Transaction and an increase in employee costs.
Underwriting expense ratio
(
see chart
19
)
.
The underwriting expense ratio is the ratio, expressed as a percentage, of the underwriting and operating expenses, net and amortization of DAC of our combined insurance operations (which excludes underwriting and operating expenses of our non-insurance operations) to NPW. The increase in the underwriting expense ratio in 2016 when compared to 2015
was primarily due to a decrease in NPW. The increase in the underwriting expense ratio in 2015 when compared to 2014 was due to an increase in employee compensation expense and a decrease in ceding commissions, offset in part by an increase in NPW.
|
19
|
UNDERWRITING EXPENSE RATIO
|
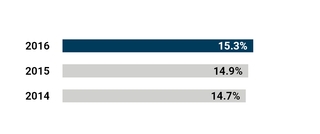
INTEREST EXPENSE IN 2016 DECLINED FROM 2015 AND 2014 LEVELS ON DEBT TRANSACTION ACTIVITY, WHICH ALSO RESULTED IN DEBT EXTINGUISHMENT LOSSES
2016
compared to
2015
.
Interest expense for
2016
decreased
when compared to
2015
reflecting the following activities.
Reductions to interest expense:
|
•
|
maturity of our 5.375% Notes;
|
|
•
|
repurchase of
$188.5 million
in par value of our 5% Notes in the first half of 2016;
|
|
•
|
purchase by MGIC of
$132.7 million
in par value of our 9% Debentures, which are eliminated in consolidation, in the first quarter of 2016;
|
|
•
|
repurchase of
$292.4 million
in par value of our 2% Notes in the third quarter of 2016.
|
Increases to interest expense:
|
•
|
MGIC borrowed
$155 million
in the form of a 1.91% fixed rate advance from the FHLB in the first quarter of 2016; and
|
|
•
|
we issued
$425 million
of 5.75% Senior Notes in the third quarter of 2016.
|
2015
compared to
2014
.
Interest expense for 2015
decreased
whe
n compared to 2014 due to the maturity of our 5.375% Notes on November 1, 2015, which were repaid with holding company cash on hand.
Loss on debt extinguishment
Loss on debt extinguishment in 2016 reflects our repurchases of a portion of our 2% Notes, 5% Notes, and MGIC's purchase of a portion of our 9% Debentures, which were all completed at amounts that were in excess of the purchased debt's carrying value. The loss also includes the
MGIC Investment Corporation 2016 Form 10-K
|
64
|
Management's Discussion and Analysis
|
|||||
|
Overview
|
Consolidated Results of Operations
|
Contractual Obligations
|
|||
|
Non-GAAP Financial Measures
|
Balance Sheet Analysis
|
Critical Accounting Policies
|
|||
|
Mortgage Insurance Portfolio
|
Liquidity and Capital Resources
|
Disclosures about Market Risk
|
|||
write-off of debt issuance costs on the extinguished portion of the outstanding 2% Notes. The 9% Debentures held by MGIC are eliminated in consolidation.
INCOME TAX EXPENSE (BENEFIT) REFLECTS THE CHANGE IN OUR TAX STATUS AND VALUATION ALLOWANCE REVERSAL
|
(In millions, except rate)
|
2016
|
2015
|
2014
|
|||||||||
|
Income before tax
|
$
|
514,714
|
|
$
|
487,687
|
|
$
|
254,723
|
|
|||
|
Provision for (benefit from) income taxes
|
172,197
|
|
(684,313
|
)
|
2,774
|
|
||||||
|
Effective tax provision (benefit) rate
|
33.5
|
%
|
(140.3
|
)%
|
1.1
|
%
|
||||||
2016
compared to
2015
.
Income tax expense for 2016 increased compared to 2015. This change is primarily due to the reversal of our deferred tax valuation allowance in 2015 and because we were required to establish a full tax provision for 2016. The difference between our statutory tax rate of 35% and our effective tax provision rate of 33.5% in 2016 was primarily due to the benefits of tax preferenced securities. The difference between our statutory tax rate of 35% and our effective tax (benefit) rate on our pre-tax income of (140.3%) in 2015 was primarily due to the impact of the changes in our valuation allowance against our deferred tax assets.
2015
compared to
2014
.
Income tax (benefit) for 2015 increased compared to 2014. This change is primarily due to the reversal of our deferred tax valuation allowance in 2015. During 2014, our effective tax rate provision was reduced by the change in the deferred tax asset valuation allowance. During 2015 and 2014, the difference between our statutory tax rate of 35% and our effective tax (benefit) provision rate was primarily due to the impact of the changes in our overall valuation allowance against our deferred tax assets.
See
Note 12 – “Income Taxes”
to our consolidated financial statements for a discussion of our tax position.
65
|
MGIC Investment Corporation 2016 Form 10-K
Assets
As of
December 31, 2016
total assets were
$5,735 million
compared to
$5,868 million
in the prior year. The investment portfolio
increased
to
$4,692 million
as of
December 31, 2016
(
2015
:
$4,663 million
). Deferred income tax assets
decreased
20%
to
$607.7 million
at the end of
December 31, 2016
(
2015
:
$762.1 million
) as our net income utilized a portion of our net operating loss carryforwards. The combined other assets increased to
$279 million
as of
December 31, 2016
(
2015
:
$262 million
), primarily due to increases in accrued investment income, reinsurance recoverables, and home office and equipment, net. These increases were offset in part by a decrease in the funded status of our defined pension plan resulting from an increase in the projected benefit obligation as the discount rate decreased from the prior year.
STRUCTURE OF BALANCE SHEET
% OF TOTAL ASSETS
|
(in thousands)
|
December 31, 2016
|
December 31, 2015
|
||||||
|
Assets
|
$
|
5,734,529
|
|
$
|
5,868,343
|
|
||
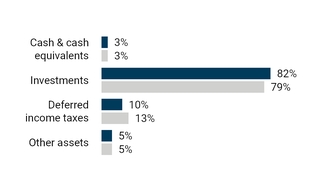
|
2016
|
2015
|
||||
Investments Analysis
The return we generate on our investment portfolio, which primarily consists of investment income, is an important component of our consolidated financial results and the protection of principal is an important component of our portfolio objectives. Our investment portfolio primarily consists of a diverse mix of highly rated fixed income securities
(see chart
20
)
and targets an intermediate 4 to 6 year duration that is designed to achieve the following main portfolio objectives:
|
•
|
protect principal;
|
|
•
|
preserve statutory capital;
|
|
•
|
minimize realized losses;
|
|
•
|
meet projected liabilities; and
|
|
•
|
maximize yield.
|
To achieve our portfolio objectives, we employ a strategic asset allocation approach which considers the risk and return parameters of the various asset classes in which we invest. This asset allocation is informed by, and based on the following factors:
|
•
|
our economic and market outlooks;
|
|
•
|
diversification effects;
|
|
•
|
security duration;
|
|
•
|
liquidity; and
|
|
•
|
capital considerations.
|
The credit risk of specific securities is evaluated through analysis of the underlying fundamentals that includes consideration of the issuer's sector, scale, profitability, debt coverage, and ratings. The investment policy guidelines limit the amount of our credit exposure to any one issue, issuer and type of instrument.
MGIC Investment Corporation 2016 Form 10-K
|
66
|
Management's Discussion and Analysis
|
|||||
|
Overview
|
Consolidated Results of Operations
|
Contractual Obligations
|
|||
|
Non-GAAP Financial Measures
|
Balance Sheet Analysis
|
Critical Accounting Policies
|
|||
|
Mortgage Insurance Portfolio
|
Liquidity and Capital Resources
|
Disclosures about Market Risk
|
|||
|
20
|
FIXED INCOME SECURITY RATINGS
(1)
% OF FIXED INCOME SECURITIES AT FAIR VALUE
|
|
December 31, 2016
|
|
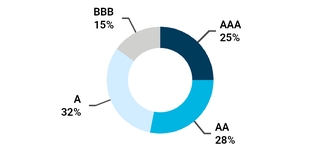
|
December 31, 2015
|
|
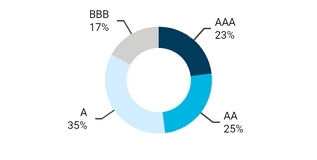
|
(1)
|
Ratings are provided by one or more of: Moody's, Standard & Poor's and Fitch Ratings. If three ratings are available, the middle rating is utilized; otherwise the lowest rating is utilized.
|
See
Note 5 – “Investments”
to our consolidated financial statements for additional disclosure on our investment portfolio.
Investments outlook
In the fourth quarter of 2016, the FOMC increased its benchmark interest rate 25 basis points, which was a highly anticipated move that had been signaled for months. At the time, the FOMC cited strong employment gains and other economic indicators as the reason for the increase. In conjunction with the most recent rate increase the FOMC indicated that increases will continue at a gradual pace. It is widely expected that further interest rate increases will take place in 2017 as the economy continues to add jobs and expand. Our investment portfolio of fixed income securities is subject to interest rate risk and fair values of fixed rate securities are likely to decline in a rising rate environment.
We seek to manage our exposure to interest rate risk and volatility by maintaining a diverse mix of high quality securities that have an intermediate duration profile. While higher interest rates may adversely impact the fair values of our fixed income securities from current levels,
they present an opportunity to reinvest investment income and proceeds from security maturities into higher yielding securities.
In addition to our interest rate exposure, the new Presidential administration could make policy changes that affect both economic and market conditions. A federal statutory tax rate reduction has been discussed, which could impact the relative value between taxable and tax-exempt fixed income securities, but we do not expect this to have a material impact on our investment portfolio if enacted. Other policy changes, which are uncertain at this time, could result in both market volatility and/or opportunity which we will monitor.
DEFERRED INCOME TAXES
Deferred income taxes primarily consist of net operating loss carryforwards from operating losses experienced in prior years that we expect to realize in future periods. During 2015, we reversed the valuation allowance that had been recorded against our deferred tax assets since 2009. The reversal of the valuation allowance was based on analysis that it was more likely than not that our deferred tax assets would be fully realizable.
The reversal of our valuation allowance against our deferred tax assets was a discrete period item and was recognized as a component of our tax provision in continuing operations during 2015. As a result, we received a benefit in our tax provision of approximately $687 million for the year ended
December 31, 2015
. As this benefit increased our net income, the benefit had the effect of substantially increasing our retained earnings as of
December 31, 2015
.
As of December 31, 2016, our deferred tax asset is recorded at $607.7 million. A decrease in the federal statutory rate will result in a one-time reduction in the amount at which our deferred tax asset is recorded, thereby reducing our net income and book value; however, such a decrease will also reduce our effective tax rate in future periods, thereby increasing net income. We estimate that every 1 percentage point reduction in the federal statutory rate would result in a one-time reduction in our deferred tax asset of $17.2 million.
Other tax matters
We continue to have unresolved tax matters primarily related to reviews of our 2000-2007 federal income tax returns by the IRS. In January 2017, we and the IRS informed the Tax Court that we had reached a basis for settlement of the major unresolved tax matters. Any agreed settlement terms will ultimately be subject to review by the Joint Committee on Taxation before a settlement can be completed and there is no assurance that a settlement will be completed. Our consolidated financial statements reflect our estimates of the tax contingencies discussed more fully
67
|
MGIC Investment Corporation 2016 Form 10-K
in
Note 12 - "Income Taxes"
to our consolidated financial statements. Based on information we have regarding the status of the dispute, we expect to record a provision for additional taxes and interest of $15-$25 million in the first quarter of 2017.
Liabilities and Shareholders' Equity
Total liabilities
decreased
12%
to
$3,186 million
as of
December 31, 2016
from
$3,632 million
in the prior year. Loss reserves, which represent our estimated liability for losses and settlement expenses under MGIC's mortgage guaranty insurance policies, net of reinsurance balances recoverable on our estimated losses and settlement expenses
decreased
,
25%
to
$1,388 million
as of
December 31, 2016
versus
$1,849 million
as of
December 31, 2015
. This
decrease
was driven by the payment of losses during
2016
and favorable development on delinquencies received in prior years, offset in part by losses incurred on new delinquency notices received in
2016
. Unearned premiums
increased
18%
to
$330 million
as of
December 31, 2016
(2015:
$280 million
), primarily due to an increase in the amount of NIW from LPMI single premium policies. Long-term debt is down
3%
to
$1,179 million
as of
December 31, 2016
versus
$1,212 million
as of
December 31, 2015
due to a net repayment of borrowings during 2016 through our various debt transactions, which also extended the maturity profile of our debt. See
Note 7 - "Debt"
for further discussion of these transactions. Other liabilities
decreased
3%
to
$238 million
as of
December 31, 2016
(2015:
$247 million
), primarily due to a decline in our premium refund accrual, offset in part by an increase in our interest payable.
Total equity
increased
14%
to
$2,549 million
as of
December 31, 2016
from
$2,236 million
as of
December 31, 2015
. This increase from the prior year was driven by net income generated during
2016
.
STRUCTURE OF BALANCE SHEET
% OF TOTAL LIABILITIES AND EQUITY
|
(in thousands)
|
December 31, 2016
|
December 31, 2015
|
||||||
|
Liabilities and equity
|
$
|
5,734,529
|
|
$
|
5,868,343
|
|
||
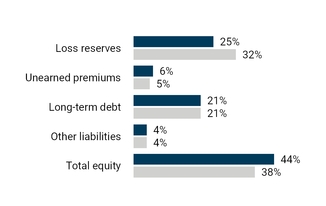
|
2016
|
2015
|
||||
BENEFIT PLANS
We have a non-contributory defined benefit pension plan covering substantially all domestic employees, as well as a supplemental executive retirement plan. Retirement benefits are based on compensation and years of service. We maintain plan assets to fund our benefit obligations. As of December 31, 2016 and 2015 our pension and post-retirement benefit plans have plan assets in excess of their projected obligations. The supplemental executive retirement plan benefits are paid from MGIC assets following employee retirements. Our projected benefit obligations under these plans are subject to numerous actuarial assumptions that may change in the future and as a result could substantially increase or decrease our obligations. Plan assets held to pay our obligations are primarily invested in a portfolio of debt securities to preserve capital and to provide monthly cash flows aligned with the liability component of our obligations, with a lesser allocation to a mix of equity securities. If the performance of our invested plan assets differs from our expectations, the funded status of the benefit plans may decline, even with no significant change in the obligations. See
Note 11 - "Benefit Plans"
to our consolidated financial statements for a complete discussion of these plans and their effect on the consolidated financial statements.
MGIC Investment Corporation 2016 Form 10-K
|
68
|
Management's Discussion and Analysis
|
|||||
|
Overview
|
Consolidated Results of Operations
|
Contractual Obligations
|
|||
|
Non-GAAP Financial Measures
|
Balance Sheet Analysis
|
Critical Accounting Policies
|
|||
|
Mortgage Insurance Portfolio
|
Liquidity and Capital Resources
|
Disclosures about Market Risk
|
|||
Liquidity and Capital Resources
Consolidated Cash Flow Analysis
We have three primary types of cash flows: (1) operating cash flows, which consist mainly of cash generated by our insurance operations and income earned on our investment portfolio, less amounts paid for claims, interest expense and operating expenses, (2) investing cash flows related to the purchase, sale and maturity of investments and (3) financing cash flows generally from activities that impact our capital structure, such as changes in debt and shares outstanding. The following table summarizes these three cash flows on a consolidated basis for the last three years.
|
|
Years ended December 31,
|
|||||||||||
|
(In thousands)
|
2016
|
2015
|
2014
|
|||||||||
|
Net cash and cash equivalents provided by (used in):
|
||||||||||||
|
Operating activities
|
$
|
219,663
|
|
$
|
152,036
|
|
$
|
(405,277
|
)
|
|||
|
Investing activities
|
(93,392
|
)
|
(96,958
|
)
|
292,234
|
|
||||||
|
Financing activities
|
(151,981
|
)
|
(71,840
|
)
|
(21,767
|
)
|
||||||
|
Decrease in cash and cash equivalents
|
$
|
(25,710
|
)
|
$
|
(16,762
|
)
|
$
|
(134,810
|
)
|
|||
Operating activities
The following list highlights the major sources and uses of cash flow from operating activities:
|
Sources
|
|
|
+
|
Premiums received
|
|
+
|
Loss payments from reinsurers
|
|
+
|
Investment income
|
|
Uses
|
|
|
-
|
Claim payments
|
|
-
|
Ceded premium to reinsurers
|
|
-
|
Interest expense
|
|
-
|
Operating expenses
|
Our largest source of cash is from premiums received from our insurance policies, which we receive on a monthly installment basis for most policies. Premiums are received at the beginning of the coverage period for single premium and annual premium policies. Our largest cash outflow is for claims that arise when a default results in an insured loss. Because the payment of claims occurs after the receipt of the premium, often years later, we invest the cash in various investment securities that earn interest. We also use cash to pay for our ongoing expenses such as salaries, debt interest, and rent. We also utilize reinsurance to manage the risk we take on our insurance policies. We cede, or pay out, part of the premiums we receive to our reinsurers and collect
cash back when losses subject to our reinsurance coverage are paid.
Net cash provided by operating activities in
2016
increased compared to
2015
primarily due to a lower level of losses paid. The increase was offset in part by the commutation of our 2013 QSR Transaction in 2015, which resulted in a return to us of unearned ceded premiums written and settlement of our profit commission accrued during the term of the agreement.
The increase in net cash from operating activities in 2015 compared to 2014 was primarily due to a lower level of losses paid and the result of commuting our 2013 QSR Transaction. Cash flows from operations in 2015 also increased compared to 2014 due to an increase in premiums collected as our mix of single premium policies written and our IIF increased, and also from a higher level of investment income.
Investing activities
The following list highlights the major sources and uses of cash flow from investing activities:
|
Sources
|
|
|
+
|
Proceeds from fixed income securities sold, called or matured
|
|
+
|
Decreases in restricted cash
|
|
Uses
|
|
|
-
|
Purchases of fixed income securities
|
|
-
|
Purchases of property and equipment
|
We maintain an investment portfolio that is primarily invested in a diverse mix of fixed income securities. As of
December 31, 2016
, our portfolio had a fair value of
$4.7 billion
. As of
December 31, 2016
the value of our investment portfolio
increased
by
$29.1 million
, or
0.6%
from
December 31, 2015
. In addition to investment portfolio activities, our investing activities included additions to property and equipment. In 2016, we began an initiative to update our corporate headquarters building and continued to invest in our technology infrastructure to enhance our ability to conduct business and execute our strategies.
Net cash flows used in investing activities in 2016 primarily reflect purchasing fixed income securities in an amount that exceeded our proceeds from sales and maturities of fixed income securities during the year. Investing cash flows also include an increase in amounts spent on property and equipment.
69
|
MGIC Investment Corporation 2016 Form 10-K
Net cash flows used in investing activities in 2015 primarily reflect purchasing investment securities in an amount that exceeded our proceeds from sales and maturities of fixed income securities during the year. This outflow was offset in part by a reduction of cash restricted in its use.
In 2014, net cash flows provided by investing activities primarily reflect proceeds from sales and maturities of our fixed income securities exceeding our investment purchases.
Financing activities
The following list highlights the major sources and uses of cash flow from financing activities:
|
Sources
|
|
|
+
|
Proceeds from debt and/or common stock issuances
|
|
Uses
|
|
|
-
|
Repayment/repurchase of debt
|
|
-
|
Repurchases of common stock
|
|
-
|
Payment of debt issuance costs
|
Net cash flows used in financing activities for 2016 primarily reflect the transactions in which we repurchased a portion of the outstanding principal on our 5% Notes and 2% Notes, and in which MGIC purchased a portion of the outstanding principal on our 9% Debentures. MGIC's ownership of our 9% Debentures by MGIC is eliminated in consolidation. These transactions were completed at amounts in excess of the carrying value of the debt obligations and the excess amount settled in cash is reflected in our financing activities. These transactions were offset in part by the issuance of long-term debt that included an FHLB borrowing and our 5.75% Notes offering, net of related issuance fees.
Net cash flows used in financing activities for 2015 reflect the repayment of our Senior Notes that matured on November 1, 2015 and repurchases of $11.5 million par value of our Convertible Senior Notes due in May 2017, offset in part by tax benefits related to share-based compensation.
Net cash flows used in financing activities for 2014 reflect the repurchase of $20.9 million of our Senior Notes due in November 2015.
* * *
For a further discussion of matters affecting our cash flows, see "
Balance Sheet Analysis
" and "Debt at our Holding Company" and Holding Company Liquidity" below.
Capitalization
Capital Risk
Capital risk is the risk that we have an insufficient level and composition of capital to comply with applicable requirements and to support our business activities and associated risks during normal economic environments and stressed conditions.
A strong capital position is essential to our business strategy and is important to maintain a competitive position in our industry. Our capital strategy focuses on long-term stability, which enables us to build and invest in our business, even in a stressed environment.
Our capital management objectives are to:
|
•
|
Cover claim obligations arising from our underlying mortgage insurance activities;
|
|
•
|
Maintain compliance with the financial requirements of PMIERs, and regulatory capital, and sizing the level of capital to balance competitive needs, handle contingencies, and create shareholder value;
|
|
•
|
Position our mix of debt, equity and/or reinsurance to support our business strategy while considering the competing needs of credit ratings, regulators, and shareholders;
|
|
•
|
Retain flexibility to pursue new business opportunities;
|
|
•
|
Provide additional holding company liquidity; and
|
|
•
|
Achieve our target leverage ratio over time.
|
These objectives are achieved through ongoing monitoring and management of our capital position, mortgage insurance portfolio stress modeling, and a capital governance framework. Capital management is intended to be flexible in order to react to a range of potential events.
Capital Structure
The following table summarizes our capital structure as of
December 31, 2016
,
2015
, and
2014
.
|
(In thousands, except ratio)
|
2016
|
2015
|
2014
|
|||||||||
|
Common stock, paid-in capital, retained earnings (deficit), less treasury stock
|
$
|
2,623,942
|
|
$
|
2,297,020
|
|
$
|
1,118,244
|
|
|||
|
Accumulated other comprehensive loss, net of tax
|
(75,100
|
)
|
(60,880
|
)
|
(81,341
|
)
|
||||||
|
Total shareholders' equity
|
2,548,842
|
|
2,236,140
|
|
1,036,903
|
|
||||||
|
Long-term debt, par value
|
1,189,472
|
|
1,223,025
|
|
1,296,475
|
|
||||||
|
Total capital resources
|
$
|
3,738,314
|
|
$
|
3,459,165
|
|
$
|
2,333,378
|
|
|||
|
Ratio of long-term debt to shareholders' equity
|
46.7
|
%
|
54.7
|
%
|
125.0
|
%
|
||||||
MGIC Investment Corporation 2016 Form 10-K
|
70
|
Management's Discussion and Analysis
|
|||||
|
Overview
|
Consolidated Results of Operations
|
Contractual Obligations
|
|||
|
Non-GAAP Financial Measures
|
Balance Sheet Analysis
|
Critical Accounting Policies
|
|||
|
Mortgage Insurance Portfolio
|
Liquidity and Capital Resources
|
Disclosures about Market Risk
|
|||
Net income in 2016 increased our total shareholders' equity from 2015. The increase was offset in part by the cost of repurchasing the shares issued in our 2% Notes repurchases and an increase in accumulated other comprehensive losses.
Net income and a decrease in accumulated other comprehensive losses in 2015 increased our total shareholders' equity from 2014. The net income generated in 2015 included a substantial tax benefit from the reversal of our valuation allowance on deferred tax assets.
DEBT AT OUR HOLDING COMPANY AND HOLDING COMPANY LIQUIDITY
Debt - holding company
(see charts
21
and
22
)
The 5.75% Notes, 2% Notes, 5% Notes, and 9% Debentures are obligations of our holding company, MGIC Investment Corporation, and not of its subsidiaries. In 2016, we accessed the senior debt market and issued
$425.0 million
aggregate principal amount of 5.75% Notes due in 2023 to simplify and lengthen our debt structure. The proceeds received were primarily used as (i) cash consideration to repurchase a portion of our 2% Notes, and (ii) to repurchase the shares issued as partial consideration in the repurchases of our 2% Notes. In total, we purchased
$292.4 million
in par value of our outstanding 2% Notes. In addition, during 2016 we repurchased
$188.5 million
of our 5% Notes with funds held at our holding company. MGIC's ownership of
$132.7 million
of our 9% Debentures is eliminated in consolidation, but they remain outstanding obligations owed by us to MGIC. The result of these transactions reduced our holding company's outstanding debt obligations by
5%
from the prior year to
$1,167.1 million
.
|
21
|
HOLDING COMPANY LONG-TERM DEBT
IN MILLIONS
|
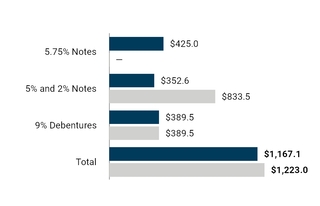
|
2016
|
2015
|
||||
|
22
|
REMAINING TIME TO MATURITY OF HOLDING COMPANY LONG-TERM DEBT
IN MILLIONS
|
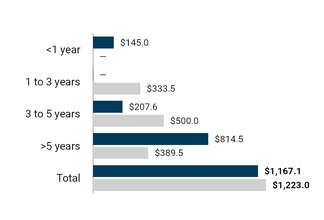
|
2016
|
2015
|
||||
Liquidity analysis - holding company
As of
December 31, 2016
, we had approximately
$283 million
in cash and investments at our holding company. These resources are maintained primarily to service our debt interest expense, pay debt maturities, repurchase outstanding debt obligations as opportunities arise, and to settle intercompany obligations. We may also use available holding company cash to repurchase shares of our common stock. While these assets are held, we generate investment income that serves to offset a portion of our interest expense. In addition to investment income, the payment of dividends from our insurance subsidiaries and/or raising capital in the public markets are the principal sources of holding company cash inflow. MGIC is the principal source of dividend-paying capacity, which is restricted by insurance regulation. The ability to raise capital in the public markets is subject to prevailing market conditions, investor demand for the securities to be issued, and our deemed creditworthiness.
In 2016, our holding company cash and investments
decreased
by
$119 million
, to
$283 million
as of December 31, 2016. Our holding company received
$418 million
in net proceeds from the issuance of our 5.75% Notes. The net proceeds were primarily used in the repurchases of our 2% Notes; this use consisted of approximately
$231 million
in cash consideration and $147 million for the repurchase of shares issued as consideration in the 2% Notes repurchases. Cash on hand at our holding company was used to repurchase a portion of our 5% Notes at a cost of
$196 million
. Our holding company made interest payments of approximately
$55 million
, of which approximately
$12 million
was paid to MGIC for the portion of our 9% Debentures owned by MGIC. Cash inflows to our holding
71
|
MGIC Investment Corporation 2016 Form 10-K
company included
an aggregate of $64 million of dividends received from MGIC, and we dissolved other insurance su
bsidiaries resulting in a net cash infusion to the holding company of approximately $16 million. Investment income was approximately $7 million and other net cash inflows were approximately $5 million.
The net unrealized losses on our holding company investment portfolio were approximately
$2.0 million
at
December 31, 2016
and the portfolio has a modified duration of approximately 1.5 years.
The dividends paid by MGIC to our holding company were the first since 2008. We expect MGIC to continue to pay quarterly dividends. OCI authorization is sought before MGIC pays dividends and MGIC will pay a dividend of $20 million to our holding company in the first quarter of 2017.
Over the next twelve months the principal demand on holding company resources will be the maturity of the remaining
$145 million
of 5% Notes outstanding that mature in May 2017. We currently hold sufficient cash and investments to repay the outstanding obligations at their maturity. Based on our holding company debt obligations at
December 31, 2016
, interest payments for 2017 are expected to approximate $68 million. Dividends from MGIC provide additional quarterly liquidity. We believe our holding company has sufficient liquidity to meet its payment obligations for the foreseeable future.
Scheduled debt maturities beyond the next twelve months include
$207.6 million
of our 2% Notes in 2020,
$425 million
of our 5.75% Notes in 2023, and
$389.5 million
of our 9% Debentures in 2063, of which MGIC owns
$132.7 million
. Both the 2% Notes and 9% Debentures are convertible debt issues. Subject to certain limitations and restrictions, holders of each of the convertible debt issues
may convert their notes into shares of our common stock at their option prior to certain dates prescribed under the terms of their issuance, in which case our corresponding obligation will be eliminated. The holders of the 2% Notes may convert all or part of their notes into shares of our common stock, at a rate of 143.8332 shares per $1,000 of notes, in any quarter following a quarter in which the closing price our common stock was at least $9.04 for at least 20 of the last 30 trading days of that quarter (the “Conversion Stock Price Condition”). The Conversion Stock Price Condition was met for the quarter ended December 31, 2016, therefore, the 2% Notes are convertible in the first quarter of 2017. They will also be convertible in later quarters in which the Conversion Stock Price Condition was met for the prior quarter.
In 2015, we purchased
$11.5 million
in aggregate principal of our
5%
Notes at a purchase price of
$12.0 million
, plus accrued interest using funds held at our holding company.
See
Note 7 – “Debt”
to our consolidated financial statements for additional information about the conversion terms of these issuances and the terms of our indebtedness, including our option to defer interest on our 9% Debentures. Any deferred interest compounds at the stated rate of 9%. The description in
Note 7 - “Debt"
to our consolidated financial statements is qualified in its entirety by the terms of the notes and debentures. The terms of our 5% Notes are contained in a Supplemental Indenture, dated as of April 26, 2010, between us and U.S. Bank National Association, as trustee, which is included as an exhibit to our 8-K filed with the SEC on April 30, 2010, and in the Indenture dated as of October 15, 2000, between us and the trustee ("2000 Indenture"). The terms of our 2% Notes are contained in a Second Supplemental Indenture, dated as of March 12, 2013, between us and U.S. Bank National Association, as trustee, which is included as an exhibit to our 8-K filed with the SEC on March 15, 2013, and the 2000 Indenture. The terms of our 9% Debentures are contained in the Indenture dated as of March 28, 2008, between us and U.S. Bank National Association filed as an exhibit to our Form 10-Q filed with the SEC on May 12, 2008.
Although not anticipated in the near term, we may also contribute funds to our insurance operations to comply with the PMIERs or the State Capital Requirements. See “Overview – Capital” above for a discussion of these requirements. See the discussion of our non-insurance contract underwriting services in
Note 17 – “Litigation and Contingencies”
to our consolidated financial statements for other possible uses of holding company resources.
We may from time to time continue to seek to acquire our debt obligations through cash purchases and/or exchanges for other securities. We may also from time to time seek to acquire our common stock through cash purchases, including with funds provided by debt. We may make such acquisitions in open market purchases, privately negotiated acquisitions or other transactions. The amounts involved may be material.
MGIC Investment Corporation 2016 Form 10-K
|
72
|
Management's Discussion and Analysis
|
|||||
|
Overview
|
Consolidated Results of Operations
|
Contractual Obligations
|
|||
|
Non-GAAP Financial Measures
|
Balance Sheet Analysis
|
Critical Accounting Policies
|
|||
|
Mortgage Insurance Portfolio
|
Liquidity and Capital Resources
|
Disclosures about Market Risk
|
|||
DEBT AT SUBSIDIARIES
During the third quarter of 2015, MGIC became a member of the FHLB. Membership in the FHLB provides MGIC access to an additional source of liquidity via a secured lending facility. In February 2016, MGIC borrowed $155.0 million in the form of a fixed rate advance from the FHLB. Interest on the Advance is payable monthly at an annual rate, fixed for the term of the Advance, of 1.91%. The principal of the Advance matures on February 10, 2023. MGIC may prepay the Advance at any time. Such prepayment would be below par if interest rates have risen after the Advance was originated, or above par if interest rates have declined. The Advance is secured by eligible collateral whose market value must be maintained at 102% of the principal balance of the Advance. MGIC provided eligible collateral from its investment portfolio.
Capital Adequacy
PMIERs
We operate under the PMIERs of the GSEs that became effective December 31, 2015. The PMIERS were most recently revised in December 2016, which had had no impact on our calculation of Available Assets or Minimum Required Assets, and did not impact our operations. The GSEs may further amend the PMIERs at any time, and they have broad discretion to interpret the requirements, which could impact the calculation of our Available Assets and/or Minimum Required Assets. The PMIERS specifically provided that the tables of factors used to determine Minimum Required Assets will be updated every two years following a minimum of 180 days' notice and may be updated more frequently to reflect changes in macroeconomic conditions or loan performance. We expect the GSEs to perform a more comprehensive review of the PMIERs, including their financial requirements, in 2017.
As of
December 31, 2016
, MGIC’s Available Assets under PMIERs totaled approximately
$4.7 billion
, an in excess of approximately
$630 million
over its Minimum Required Assets of approximately
$4.1 billion
; and MGIC is in compliance with the requirements of the PMIERs and eligible to insure loans purchased by the GSEs. Maintaining a sufficient level of excess Available Assets will allow MGIC to remain in compliance with the PMIERs financial requirements, including , we believe, to the extent they are modified further in the next scheduled review; and will also allow us flexibility to participate in additional business opportunities as they may arise. The 2015 QSR Transaction provided an aggregate of approximately
$730 million
of PMIERs capital credit as of
December 31, 2016
. Our 2017 QSR transaction terms are similar to our 2015 QSR transaction and will also provide PMIERs capital credit.
We plan to continuously comply with the PMIERs through our operational activities or through the contribution of funds from our holding company, subject to demands on the holding company's resources, as outlined above.
RISK-TO-CAPITAL
We compute our risk-to-capital ratio on a separate company statutory basis, as well as on a combined insurance operations basis. The risk-to-capital ratio is our net RIF divided by our policyholders’ position. Our net RIF includes both primary and pool RIF, and excludes risk on policies that are currently in default and for which loss reserves have been established and those covered by reinsurance. The risk amount includes pools of loans with contractual aggregate loss limits and without these limits. Policyholders’ position consists primarily of statutory policyholders’ surplus (which increases as a result of statutory net income and decreases as a result of statutory net loss and dividends paid), plus the statutory contingency reserve and a portion of the reserves for unearned premiums. The statutory contingency reserve is reported as a liability on the statutory balance sheet. A mortgage insurance company is required to make annual additions to the contingency reserve of approximately 50% of net earned premiums. These contributions must generally be maintained for a period of ten years. However, with regulatory approval a mortgage insurance company may make early withdrawals from the contingency reserve when incurred losses exceed 35% of net earned premiums in a calendar year.
MGIC’s separate company risk-to-capital calculation appears in the table below.
|
|
December 31,
|
|||||||
|
(In millions, except ratio)
|
2016
|
2015
|
||||||
|
RIF - net
(1)
|
$
|
28,668
|
|
$
|
27,301
|
|
||
|
Statutory policyholders' surplus
|
$
|
1,505
|
|
$
|
1,574
|
|
||
|
Statutory contingency reserve
|
1,181
|
|
691
|
|
||||
|
Statutory policyholders' position
|
$
|
2,686
|
|
$
|
2,265
|
|
||
|
Risk-to-capital
|
10.7:1
|
|
12.1:1
|
|
||||
|
(1)
|
RIF – net, as shown in the table above, is net of reinsurance and exposure on policies currently in default and for which loss reserves have been established.
|
73
|
MGIC Investment Corporation 2016 Form 10-K
Our combined insurance companies’ risk-to-capital calculation appears in the table below.
|
|
December 31,
|
|||||||
|
(In millions, except ratio)
|
2016
|
2015
|
||||||
|
RIF - net
(1)
|
$
|
34,465
|
|
$
|
33,072
|
|
||
|
Statutory policyholders' surplus
|
$
|
1,507
|
|
$
|
1,608
|
|
||
|
Statutory contingency reserve
|
1,360
|
|
827
|
|
||||
|
Statutory policyholders' position
|
$
|
2,867
|
|
$
|
2,435
|
|
||
|
Risk-to-capital
|
12.0:1
|
|
13.6:1
|
|
||||
|
(1)
|
RIF – net, as shown in the table above, is net of reinsurance and exposure on policies currently in default ($2.6 billion at
December 31, 2016
and $3.2 billion at
December 31, 2015
) and for which loss reserves have been established.
|
The reductions in MGIC's and our combined insurance companies risk-to-capital in 2016 were primarily due to an increase in statutory policyholders' position due to an increase in statutory contingency reserves, partially offset by an increase in net RIF in both calculations. Our RIF, net of reinsurance, increased in 2016, due to an increase in our IIF. Our risk-to-capital ratio will decrease if the percentage increase in capital exceeds the percentage increase in insured risk.
For additional information regarding regulatory capital see
Note 14 – “Statutory Information”
to our consolidated financial statements as well as our risk factor titled “State capital requirements may prevent us from continuing to write new insurance on an uninterrupted basis” in
Item IA
.
Financial Strength Ratings
The financial strength of MGIC, is as follows:
|
Rating Agency
|
Rating
|
Outlook
|
|
Moody's Investor Services
|
Baa3
|
Stable
|
|
Standard and Poor's Rating Services'
|
BBB+
|
Stable
|
For further information about the importance of MGIC’s ratings, see our risks factor titled “We may not continue to meet the GSEs’ private mortgage insurer eligibility requirements and our returns may decrease as we are required to maintain more capital in order to maintain our eligibility” and “Competition or changes in our relationships with our customers could reduce our revenues, reduce our premium yields and/or increase our losses” in
Item 1A
.
MGIC Investment Corporation 2016 Form 10-K
|
74
|
Management's Discussion and Analysis
|
|||||
|
Overview
|
Consolidated Results of Operations
|
Contractual Obligations
|
|||
|
Non-GAAP Measures
|
Balance Sheet Analysis
|
Critical Accounting Policies
|
|||
|
Mortgage Insurance Portfolio
|
Liquidity and Capital Resources
|
Disclosures about Market Risk
|
|||
Contractual Obligations
As of
December 31, 2016
, the approximate future payments under our contractual obligations of the type described in the table below are as follows:
|
Contractual Obligations:
|
Payments due by period
|
|||||||||||||||||||
|
Less than
|
More than
|
|||||||||||||||||||
|
(In millions)
|
Total
|
1 year
|
1-3 years
|
3-5 years
|
5 years
|
|||||||||||||||
|
Long-term debt obligations
|
$
|
2,472.7
|
|
$
|
204.0
|
|
$
|
109.4
|
|
$
|
310.8
|
|
$
|
1,848.5
|
|
|||||
|
Operating lease obligations
|
2.6
|
|
0.7
|
|
1.4
|
|
0.5
|
|
—
|
|
||||||||||
|
Tax obligations
|
44.0
|
|
44.0
|
|
—
|
|
—
|
|
—
|
|
||||||||||
|
Purchase obligations
|
11.6
|
|
10.4
|
|
1.2
|
|
—
|
|
—
|
|
||||||||||
|
Pension, SERP and other post-retirement benefit plans
|
287.1
|
|
22.7
|
|
52.4
|
|
57.0
|
|
155.0
|
|
||||||||||
|
Other long-term liabilities
|
1,438.8
|
|
676.2
|
|
575.5
|
|
187.1
|
|
—
|
|
||||||||||
|
Total
|
$
|
4,256.8
|
|
958.0
|
|
$
|
739.9
|
|
$
|
555.4
|
|
$
|
2,003.5
|
|
||||||
Our long-term debt obligations as of
December 31, 2016
include their related interest and are discussed in
Note 7 – “Debt”
to our consolidated financial statements and under “
Liquidity and Capital Resources
” above. Our operating lease obligations include operating leases on certain office space, data processing equipment and autos, as discussed in
Note 16 – “Leases”
to our consolidated financial statements. Tax obligations consist primarily of amounts related to our current dispute with the IRS, as discussed in
Note 12 – “Income Taxes”
to our consolidated financial statements. Purchase obligations consist primarily of agreements to purchase items related to our ongoing infrastructure projects and information technology investments in the normal course of business. See
Note 11 - “Benefit Plans”
to our consolidated financial statements for discussion of expected benefit payments under our benefit plans.
Our other long-term liabilities represent the loss reserves established to recognize the liability for losses and LAE related to existing defaults on insured mortgage loans. The timing of the future claim payments associated with the established loss reserves was determined primarily based on two key assumptions: the length of time it takes for a notice of default to develop into a received claim and the length of time it takes for a received claim to be ultimately paid. The future claim payment periods are estimated based on historical experience, and could emerge significantly different than this estimate. Due to the uncertainty regarding how certain factors, such as loss mitigation protocols established by servicers and changes in some state foreclosure laws that may include, for example, a requirement for additional review and/or mediation process, will affect our future paid claims it is difficult to estimate the amount and timing of future claim payments. See
Note 8 – “Loss Reserves”
to our consolidated financial statements and “Critical Accounting
Policies” below. In accordance with GAAP for the mortgage insurance industry, we establish loss reserves only for loans in default. Because our reserving method does not take account of the impact of future losses that could occur from loans that are not delinquent, our obligation for ultimate losses that we expect to occur under our policies in force at any period end is not reflected in our consolidated financial statements or in the table above.
75
|
MGIC Investment Corporation 2016 Form 10-K
Critical Accounting Policies
The accounting policies described below require significant judgments and estimates in the preparation of our consolidated financial statements.
Loss reserves
Reserves are established for reported insurance losses and LAE based on when notices of default on insured mortgage loans are received. For reporting purposes, we consider a loan in default when it is two or more payments past due. Even though the accounting standard, ASC 944, regarding accounting and reporting by insurance entities specifically excluded mortgage insurance from its guidance relating to loss reserves, we establish loss reserves using the general principles contained in the insurance standard. However, consistent with industry standards for mortgage insurers, we do not establish loss reserves for future claims on insured loans which are not currently in default.
We establish reserves using estimated claim rates and claim severities in estimating the ultimate loss. The liability for reinsurance assumed is based on information provided by the ceding companies.
The estimated claim rates and claim severities represent what we estimate will actually be paid on the loans in default as of the reserve date. If a policy is rescinded we do not expect that it will result in a claim payment and thus the rescission generally reduces the historical claim rate used in establishing reserves. In addition, if a loan cures its delinquency, including successful loan modifications that result in a cure being reported to us, the cure reduces the historical claim rate used in establishing reserves. Our methodology to estimate claim rates and claim amounts is based on our review of recent trends in the default inventory. To establish reserves we utilize a reserving model that continually incorporates historical data into the estimated claim rate. The model also incorporates an estimate for the amount of the claim we will pay, or severity. The severity is estimated using the historical percentage of our claim paid compared to our loan exposure, as well as the RIF of the loans currently in default. We do not utilize an explicit rescission rate in our reserving methodology, but rather our reserving methodology incorporates the effects rescission activity has had on our historical claim rate and claim severities. We review recent trends in the claim rate, severity, levels of defaults by geography and average loan exposure. As a result, the process to determine reserves does not include quantitative ranges of outcomes that are reasonably likely to occur.
The claim rates and claim severities are likely to be affected by external events, including actual economic conditions such as changes in unemployment rate, interest rate or
housing values. Our estimation process does not include a correlation between claim rates and claim amounts to projected economic conditions such as changes in unemployment rate, interest rate or housing values. Our experience is that analysis of that nature would not produce reliable results. The results would not be reliable as the change in one economic condition cannot be isolated to determine its sole effect on our ultimate paid losses as our ultimate paid losses are also influenced at the same time by other economic conditions. Additionally, the changes and interaction of these economic conditions are not likely homogeneous throughout the regions in which we conduct business. Each economic environment influences our ultimate paid losses differently, even if apparently similar in nature. Furthermore, changes in economic conditions may not necessarily be reflected in our loss development in the quarter or year in which the changes occur. Actual claim results often lag changes in economic conditions by at least nine to twelve months.
In considering the potential sensitivity of the factors underlying our estimate of loss reserves, it is possible that even a relatively small change in our estimated claim rate or severity could have a material impact on reserves and, correspondingly, on our consolidated results of operations even in a stable economic environment. For example, assuming all other factors remain constant, a $1,000 increase/decrease in the average severity reserve factor would change the reserve amount by approximately +/- $27 million. A 1 percentage point increase/decrease in the average claim rate reserve factor would change the reserve amount by approximately +/- $28 million as of December 31, 2016. Historically, it has not been uncommon for us to experience variability in the development of the loss reserves through the end of the following year at this level or higher, as shown by the historical development of our loss reserves in the table below:
|
(In thousands)
|
Losses incurred related to prior years
(1)
|
Reserve at end of prior year
|
||||||
|
2016
|
$
|
(147,658
|
)
|
$
|
1,893,402
|
|
||
|
2015
|
(110,302
|
)
|
2,396,807
|
|
||||
|
2014
|
(100,359
|
)
|
3,061,401
|
|
||||
|
2013
|
(59,687
|
)
|
4,056,843
|
|
||||
|
2012
|
573,120
|
|
4,557,512
|
|
||||
|
(1)
|
A negative number for a prior year indicates a redundancy of loss reserves, and a positive number for a prior year indicates a deficiency of loss reserves.
|
See
Note 8 – “Loss Reserves”
to our consolidated financial statements for a discussion of recent loss development.
MGIC Investment Corporation 2016 Form 10-K
|
76
|
Management's Discussion and Analysis
|
|||||
|
Overview
|
Consolidated Results of Operations
|
Contractual Obligations
|
|||
|
Non-GAAP Financial Measures
|
Balance Sheet Analysis
|
Critical Accounting Policies
|
|||
|
Mortgage Insurance Portfolio
|
Liquidity and Capital Resources
|
Disclosures about Market Risk
|
|||
IBNR Reserves
Reserves are also established for estimated IBNR, which results from defaults occurring prior to the close of an accounting period, but which have not been reported to us. Consistent with reserves for reported defaults, IBNR reserves are established using estimated claim rates and claim severities for the estimated number of defaults not reported. As of
December 31, 2016
and
2015
, we had IBNR reserves of approximately $54 million and $98 million, respectively.
LAE
Reserves also provide for the estimated costs of settling claims, including legal and other expenses and general expenses of administering the claims settlement process.
The actual amount of the claim payments may be substantially different than our loss reserve estimates. Our estimates could be adversely affected by several factors, including a deterioration of regional or national economic conditions, including unemployment, leading to a reduction in borrower income and thus their ability to make mortgage payments, and a drop in housing values, that could result in, among other things, greater losses on loans, and may affect borrower willingness to continue to make mortgage payments when the value of the home is below the mortgage balance. Our estimates are also affected by any agreements we enter into regarding our claims paying practices, such as the settlement agreements discussed in
Note 17 – “Litigation and Contingencies”
to our consolidated financial statements.
Revenue recognition
When a policy term ends, the primary mortgage insurance written by us is renewable at the insured’s option through continued payment of the premium in accordance with the schedule established at the inception of the policy life. We have no ability to reunderwrite or reprice these policies after issuance. Premiums written under policies having single and annual premium payments are initially deferred as unearned premium reserve and earned over the policy life. Premiums written on policies covering more than one year are amortized over the policy life in relationship to the anticipated incurred loss pattern based on historical experience. Premiums written on annual policies are earned on a monthly pro rata basis. Premiums written on monthly policies are earned as the monthly coverage is provided. When a policy is cancelled, all premium that is non-refundable is immediately earned. Any refundable premium is returned to the servicer or borrower. Cancellations also include rescissions and policies cancelled due to claim payment. When a policy is rescinded, all previously collected premium is returned to the servicer and when a claim is paid we return any premium received since the date of default. The liability associated with our estimate of premium to be
returned is accrued for separately and this liability is included in “Other liabilities” on our consolidated balance sheets. Changes in these liabilities affect premiums written and earned and change in premium deficiency reserve, respectively. The actual return of premium affects premium written and earned. Policy cancellations also lower the persistency rate which is a variable used in calculating the rate of amortization of deferred policy acquisition costs discussed below.
Fee income of our non-insurance subsidiaries is earned and recognized as the services are provided and the customer is obligated to pay.
Deferred insurance policy acquisition costs
Costs directly associated with the successful acquisition of mortgage insurance business, consisting of employee compensation and other policy issuance and underwriting expenses, are initially deferred and reported as deferred insurance policy acquisition costs ("DAC"). The deferred costs are net of any ceding commissions received associated with our reinsurance agreements. For each underwriting year of business, these costs are amortized to income in proportion to estimated gross profits over the estimated life of the policies. We utilize anticipated investment income in our calculation. This includes accruing interest on the unamortized balance of DAC. The estimates for each underwriting year are reviewed quarterly and updated when necessary to reflect actual experience and any changes to key variables such as persistency or loss development.
Because our insurance premiums are earned over time, changes in persistency result in DAC being amortized against revenue over a comparable period of time. At
December 31, 2016
, the persistency rate of our primary mortgage insurance was
76.9%
, compared to
79.7%
at
December 31, 2015
. This change did not significantly affect the amortization of deferred insurance policy acquisition costs for the period ended
December 31, 2016
. A 10% change in persistency would not have a material effect on the amortization of DAC in the subsequent year.
Fair Value Measurements
Investment Portfolio
Our entire investment portfolio is classified as available-for-sale and is reported at fair value or, for certain equity securities carried at cost, amounts that approximate fair value. The related unrealized investment gains or losses are, after considering the related tax expense or benefit, recognized as a component of accumulated other comprehensive income in shareholders' equity. Realized investment gains and losses on investments are recognized in income based upon specific identification of securities sold.
77
|
MGIC Investment Corporation 2016 Form 10-K
To determine the fair value of securities available-for-sale in Level 1 and Level 2 of the fair value hierarchy, independent pricing sources have been utilized. One price is provided per security based on observable market data. To ensure securities are appropriately classified in the fair value hierarchy, we review the pricing techniques and methodologies of the independent pricing sources and believe that their policies adequately consider market activity, either based on specific transactions for the issue valued or based on modeling of securities with similar credit quality, duration, yield and structure that were recently traded. A variety of inputs are utilized by the independent pricing sources including benchmark yields, reported trades, non-binding broker/dealer quotes, issuer spreads, two sided markets, benchmark securities, bids, offers and reference data including data published in market research publications. Inputs may be weighted differently for any security, and not all inputs are used for each security evaluation.
Market indicators, industry and economic events are also considered. This information is evaluated using a multidimensional pricing model. This model combines all inputs to arrive at a value assigned to each security. Quality controls are performed by the independent pricing sources throughout this process, which include reviewing tolerance reports, trading information, data changes, and directional moves compared to market moves. In addition, on a quarterly basis, we perform quality controls over values received from the pricing sources which also include reviewing tolerance reports, trading information, data changes, and directional moves compared to market moves. We have not made any adjustments to the prices obtained from the independent pricing sources.
In accordance with fair value guidance, we applied the following fair value hierarchy in order to measure fair value for assets and liabilities:
Level 1 - Quoted prices for identical instruments in active markets that we can access. Financial assets utilizing Level 1 inputs primarily include U.S. Treasury securities, equity securities, and Australian government and semi government securities.
Level 2 - Quoted prices for similar instruments in active markets; quoted prices for identical or similar instruments in markets that are not active; and inputs, other than quoted prices, that are observable in the marketplace for the financial instrument. The observable inputs are used in valuation models to calculate the fair value of the financial instruments. Financial assets utilizing Level 2 inputs primarily include obligations of U.S. government corporations and agencies, corporate bonds, mortgage-backed securities, and certain municipal bonds.
The independent pricing sources used for our Level 2 investments varies by type of investment See
Note 3 - "Significant Accounting Policies"
for further information on the independent pricing sources used.
Level 3 - Valuations derived from valuation techniques in which one or more significant inputs or value drivers are unobservable or from par values for equity securities restricted in their ability to be redeemed or sold. Level 3 inputs reflect our own assumptions about the assumptions a market participant would use in pricing an asset or liability. Financial assets utilizing Level 3 inputs primarily include equity securities that can only be redeemed or sold at their par value and only to the security issuer and certain state premium tax credit investments. Our non-financial assets that are classified as Level 3 securities consist of real estate acquired through claim settlement. The fair value of real estate acquired is the lower of our acquisition cost or a percentage of the appraised value. The percentage applied to the appraised value is based upon our historical sales experience adjusted for current trends.
Unrealized losses and other-than-temporary impairment ("OTTI")
Each quarter we perform reviews of our investments in order to determine whether declines in fair value below amortized cost were considered other-than-temporary. In evaluating whether a decline in fair value is other-than-temporary, we consider several factors including, but not limited to:
|
▪
|
our intent to sell the security or whether it is more likely than not that we will be required to sell the security before recovery of its amortized cost basis;
|
|
▪
|
the present value of the discounted cash flows we expect to collect compared to the amortized cost basis of the security;
|
|
▪
|
extent and duration of the decline;
|
|
▪
|
failure of the issuer to make scheduled interest or principal payments;
|
|
▪
|
change in rating below investment grade; and
|
|
▪
|
adverse conditions specifically related to the security, an industry, or a geographic area.
|
Based on our evaluation, we will record an OTTI adjustment on a security if we intend to sell the impaired security, if it is more likely than not that we will be required to sell the impaired security prior to recovery of its amortized cost basis, or if the present value of the discounted cash flows we expect to collect is less than the amortized costs basis of the security. If the fair value of a security is below its amortized cost at the time of our intent to sell, the security is classified as other-than-temporarily impaired and the full amount of the impairment is recognized as a loss in the
MGIC Investment Corporation 2016 Form 10-K
|
78
|
Management's Discussion and Analysis
|
|||||
|
Overview
|
Consolidated Results of Operations
|
Contractual Obligations
|
|||
|
Non-GAAP Financial Measures
|
Balance Sheet Analysis
|
Critical Accounting Policies
|
|||
|
Mortgage Insurance Portfolio
|
Liquidity and Capital Resources
|
Disclosures about Market Risk
|
|||
statement of operations. Otherwise, when a security is considered to be other-than-temporarily impaired, the losses are separated into the portion of the loss that represents the credit loss; and the portion that is due to other factors. The credit loss portion is recognized as a loss in the statement of operations, while the loss due to other factors is recognized in accumulated other comprehensive income (loss), net of taxes. A credit loss is determined to exist if the present value of the discounted cash flows, using the security’s original yield, expected to be collected from the security is less than the cost basis of the security.
Fair Value Option
For the years ended
December 31, 2016
,
2015
, and
2014
, we did not elect the fair value option for any financial instruments acquired, or issued, such as our outstanding debt obligations, for which the primary basis of accounting is not fair value.
Item 7A.
Quantitative and Qualitative Disclosures About Market Risk.
Our investment portfolio is essentially a fixed income portfolio and is exposed to market risk. Important drivers of the market risk are credit spread risk and interest rate risk.
Credit spread risk
is the risk that we will incur a loss due to adverse changes in credit spreads. Credit spread is the additional yield on fixed income securities above the risk-free rate (typically referenced as the yield on U.S. Treasury securities) that market participants require to compensate them for assuming credit, liquidity and/or prepayment risks.
We manage credit risk via our investment policy guidelines which primarily place our investments in investment grade securities and limit the amount of our credit exposure to any one issue, issuer and type of instrument. Guideline and investment portfolio detail is available in "Business – Section C, Investment Portfolio" in
Item 1
.
Interest rate risk
is the risk that we will incur a loss due to adverse changes in interest rates relative to the characteristics of our interest bearing assets.
One of the measures used to quantify interest rate this exposure is modified duration. Modified duration measures the price sensitivity of the assets to the changes in spreads. At December 31, 2016, the modified duration of our fixed income investment portfolio was 4.6 years, which means that an instantaneous parallel shift in the yield curve of 100 basis points would result in a change of 4.6% in the fair value of our fixed income portfolio. For an upward shift in the yield curve, the fair value of our portfolio would decrease and for a downward shift in the yield curve, the fair value would increase. A discussion of portfolio strategy appears in "Management's Discussion and Analysis – Balance Sheet Analysis– Investments" in
Item 7
.
79
|
MGIC Investment Corporation 2016 Form 10-K
Item 8.
Financial Statements and Supplementary Data.
The following consolidated financial statements are filed pursuant to this Item 8:
|
Index to Consolidated Financial Statements
|
|
|
Page No.
|
|
80
|
MGIC Investment Corporation 2016 Form 10-K
MGIC INVESTMENT CORPORATION AND SUBSIDIARIES
CONSOLIDATED BALANCE SHEETS
|
December 31,
|
|||||||||
|
(In thousands)
|
Note
|
2016
|
2015
|
||||||
|
ASSETS
|
|||||||||
|
Investment portfolio:
|
|||||||||
|
Securities, available-for-sale, at fair value:
|
|||||||||
|
Fixed income (amortized cost, 2016 - $4,717,211; 2015 - $4,684,148)
|
$
|
4,685,222
|
|
$
|
4,657,561
|
|
|||
|
Equity securities
|
7,128
|
|
5,645
|
|
|||||
|
Total investment portfolio
|
4,692,350
|
|
4,663,206
|
|
|||||
|
Cash and cash equivalents
|
155,410
|
|
181,120
|
|
|||||
|
Accrued investment income
|
44,073
|
|
40,224
|
|
|||||
|
Reinsurance recoverable on loss reserves
|
50,493
|
|
44,487
|
|
|||||
|
Reinsurance recoverable on paid losses
|
4,964
|
|
3,319
|
|
|||||
|
Premiums receivable
|
52,392
|
|
48,469
|
|
|||||
|
Home office and equipment, net
|
36,088
|
|
30,095
|
|
|||||
|
Deferred insurance policy acquisition costs
|
17,759
|
|
15,241
|
|
|||||
|
Deferred income taxes, net
|
607,655
|
|
762,080
|
|
|||||
|
Other assets
|
73,345
|
|
80,102
|
|
|||||
|
Total assets
|
$
|
5,734,529
|
|
$
|
5,868,343
|
|
|||
|
LIABILITIES AND SHAREHOLDERS' EQUITY
|
|||||||||
|
Liabilities:
|
|||||||||
|
Loss reserves
|
$
|
1,438,813
|
|
$
|
1,893,402
|
|
|||
|
Unearned premiums
|
329,737
|
|
279,973
|
|
|||||
|
FHLB Advance
|
155,000
|
|
—
|
|
|||||
|
Senior notes
|
417,406
|
|
—
|
|
|||||
|
Convertible senior notes
|
349,461
|
|
822,301
|
|
|||||
|
Convertible junior subordinated debentures
|
256,872
|
|
389,522
|
|
|||||
|
Other liabilities
|
238,398
|
|
247,005
|
|
|||||
|
Total liabilities
|
3,185,687
|
|
3,632,203
|
|
|||||
|
Contingencies
|
|
|
|
|
|||||
|
Shareholders' equity:
|
|||||||||
|
Common stock (one dollar par value, shares authorized 1,000,000; shares issued 2016 - 359,400; 2015 - 340,097; outstanding 2016 -
340,663; 2015 - 339,657)
|
359,400
|
|
340,097
|
|
|||||
|
Paid-in capital
|
1,782,337
|
|
1,670,238
|
|
|||||
|
Treasury stock (shares at cost 2016 - 18,737; 2015 - 440)
|
(150,359
|
)
|
(3,362
|
)
|
|||||
|
Accumulated other comprehensive loss, net of tax
|
(75,100
|
)
|
(60,880
|
)
|
|||||
|
Retained earnings
|
632,564
|
|
290,047
|
|
|||||
|
Total shareholders' equity
|
2,548,842
|
|
2,236,140
|
|
|||||
|
Total liabilities and shareholders' equity
|
$
|
5,734,529
|
|
$
|
5,868,343
|
|
|||
See accompanying notes to consolidated financial statements.
81
|
MGIC Investment Corporation 2016 Form 10-K
MGIC INVESTMENT CORPORATION AND SUBSIDIARIES
CONSOLIDATED STATEMENTS OF OPERATIONS
|
Years Ended December 31,
|
|||||||||||||
|
(In thousands, except per share data)
|
Note
|
2016
|
2015
|
2014
|
|||||||||
|
Revenues:
|
|||||||||||||
|
Premiums written:
|
|||||||||||||
|
Direct
|
$
|
1,107,923
|
|
$
|
1,074,490
|
|
$
|
999,943
|
|
||||
|
Assumed
|
1,053
|
|
1,178
|
|
1,653
|
|
|||||||
|
Ceded
|
(133,885
|
)
|
(55,391
|
)
|
(119,634
|
)
|
|||||||
|
Net premiums written
|
975,091
|
|
1,020,277
|
|
881,962
|
|
|||||||
|
Increase in unearned premiums
|
(49,865
|
)
|
(124,055
|
)
|
(37,591
|
)
|
|||||||
|
Net premiums earned
|
925,226
|
|
896,222
|
|
844,371
|
|
|||||||
|
Investment income, net of expenses
|
110,666
|
|
103,741
|
|
87,647
|
|
|||||||
|
Net realized investment gains (losses):
|
|
|
|
|
|
|
|||||||
|
Total other-than-temporary impairment losses
|
—
|
|
—
|
|
(144
|
)
|
|||||||
|
Portion of losses recognized in other comprehensive income (loss), before taxes
|
—
|
|
—
|
|
—
|
|
|||||||
|
Net impairment losses recognized in earnings
|
—
|
|
—
|
|
(144
|
)
|
|||||||
|
Other realized investment gains
|
8,932
|
|
28,361
|
|
1,501
|
|
|||||||
|
Net realized investment gains
|
8,932
|
|
28,361
|
|
1,357
|
|
|||||||
|
Other revenue
|
17,659
|
|
12,964
|
|
9,259
|
|
|||||||
|
Total revenues
|
1,062,483
|
|
1,041,288
|
|
942,634
|
|
|||||||
|
Losses and expenses:
|
|
|
|
|
|
|
|||||||
|
Losses incurred, net
|
240,157
|
|
343,547
|
|
496,077
|
|
|||||||
|
Change in premium deficiency reserve
|
—
|
|
(23,751
|
)
|
(24,710
|
)
|
|||||||
|
Amortization of deferred policy acquisition costs
|
9,646
|
|
8,789
|
|
7,618
|
|
|||||||
|
Other underwriting and operating expenses, net
|
150,763
|
|
155,577
|
|
138,441
|
|
|||||||
|
Interest expense
|
56,672
|
|
68,932
|
|
69,648
|
|
|||||||
|
Loss on debt extinguishment
|
90,531
|
|
507
|
|
837
|
|
|||||||
|
Total losses and expenses
|
547,769
|
|
553,601
|
|
687,911
|
|
|||||||
|
Income before tax
|
514,714
|
|
487,687
|
|
254,723
|
|
|||||||
|
Provision for (benefit from) income taxes
|
172,197
|
|
(684,313
|
)
|
2,774
|
|
|||||||
|
Net income
|
$
|
342,517
|
|
$
|
1,172,000
|
|
$
|
251,949
|
|
||||
|
Earnings per share:
|
|
|
|
|
|
|
|||||||
|
Basic
|
$
|
1.00
|
|
$
|
3.45
|
|
$
|
0.74
|
|
||||
|
Diluted
|
$
|
0.86
|
|
$
|
2.60
|
|
$
|
0.64
|
|
||||
|
Weighted average common shares outstanding - basic
|
342,890
|
|
339,552
|
|
338,523
|
|
|||||||
|
Weighted average common shares outstanding - diluted
|
431,992
|
|
468,039
|
|
413,522
|
|
|||||||
|
Dividends per share
|
$
|
—
|
|
$
|
—
|
|
$
|
—
|
|
||||
See accompanying notes to consolidated financial statements.
MGIC Investment Corporation 2016 Form 10-K
|
82
MGIC INVESTMENT CORPORATION AND SUBSIDIARIES
CONSOLIDATED STATEMENTS OF COMPREHENSIVE INCOME
|
Years Ended December 31,
|
|||||||||||||
|
(In thousands)
|
Note
|
2016
|
2015
|
2014
|
|||||||||
|
Net income
|
$
|
342,517
|
|
$
|
1,172,000
|
|
$
|
251,949
|
|
||||
|
Other comprehensive (loss) income, net of tax:
|
|||||||||||||
|
Change in unrealized investment gains and losses
|
(3,649
|
)
|
40,403
|
|
91,139
|
|
|||||||
|
Benefit plans adjustment
|
(9,620
|
)
|
(15,714
|
)
|
(52,112
|
)
|
|||||||
|
Foreign currency translation adjustment
|
(951
|
)
|
(4,228
|
)
|
(2,642
|
)
|
|||||||
|
Other comprehensive (loss) income, net of tax
|
(14,220
|
)
|
20,461
|
|
36,385
|
|
|||||||
|
Comprehensive income
|
$
|
328,297
|
|
$
|
1,192,461
|
|
$
|
288,334
|
|
||||
See accompanying notes to consolidated financial statements.
83
|
MGIC Investment Corporation 2016 Form 10-K
MGIC INVESTMENT CORPORATION AND SUBSIDIARIES
CONSOLIDATED STATEMENTS OF SHAREHOLDERS' EQUITY
|
|
Years Ended December 31,
|
||||||||||||
|
(In thousands)
|
Note
|
2016
|
2015
|
2014
|
|||||||||
|
Common stock
|
|||||||||||||
|
Balance, beginning of year
|
$
|
340,097
|
|
$
|
340,047
|
|
$
|
340,047
|
|
||||
|
Common stock issuance
|
18,313
|
|
—
|
|
—
|
|
|||||||
|
Net common stock issued under share-based compensation plans
|
990
|
|
50
|
|
—
|
|
|||||||
|
Balance, end of year
|
359,400
|
|
340,097
|
|
340,047
|
|
|||||||
|
Paid-in capital
|
|
|
|
|
|||||||||
|
Balance, beginning of year
|
1,670,238
|
|
1,663,592
|
|
1,661,269
|
|
|||||||
|
Common stock issuance
|
113,146
|
|
—
|
|
—
|
|
|||||||
|
Net common stock issued under share-based compensation plans
|
(6,020
|
)
|
(478
|
)
|
—
|
|
|||||||
|
Reissuance of treasury stock, net
|
(130
|
)
|
(6,894
|
)
|
(6,680
|
)
|
|||||||
|
Tax benefit from share-based compensation
|
67
|
|
2,116
|
|
—
|
|
|||||||
|
Equity compensation
|
11,373
|
|
11,902
|
|
9,003
|
|
|||||||
|
Reacquisition of convertible junior subordinated debentures-equity component
|
(6,337
|
)
|
—
|
|
—
|
|
|||||||
|
Balance, end of year
|
1,782,337
|
|
1,670,238
|
|
1,663,592
|
|
|||||||
|
Treasury stock
|
|
|
|
|
|||||||||
|
Balance, beginning of year
|
(3,362
|
)
|
(32,937
|
)
|
(64,435
|
)
|
|||||||
|
Purchases of common stock
|
(147,127
|
)
|
—
|
|
—
|
|
|||||||
|
Reissuance of treasury stock, net
|
130
|
|
29,575
|
|
31,498
|
|
|||||||
|
Balance, end of year
|
(150,359
|
)
|
(3,362
|
)
|
(32,937
|
)
|
|||||||
|
Accumulated other comprehensive loss
|
|
|
|
|
|||||||||
|
Balance, beginning of year
|
(60,880
|
)
|
(81,341
|
)
|
(117,726
|
)
|
|||||||
|
Other comprehensive (loss) income
|
(14,220
|
)
|
20,461
|
|
36,385
|
|
|||||||
|
Balance, end of year
|
(75,100
|
)
|
(60,880
|
)
|
(81,341
|
)
|
|||||||
|
Retained earnings (deficit)
|
|
|
|
|
|||||||||
|
Balance, beginning of year
|
290,047
|
|
(852,458
|
)
|
(1,074,617
|
)
|
|||||||
|
Net income
|
342,517
|
|
1,172,000
|
|
251,949
|
|
|||||||
|
Reissuance of treasury stock, net
|
—
|
|
(29,495
|
)
|
(29,790
|
)
|
|||||||
|
Balance, end of year
|
632,564
|
|
290,047
|
|
(852,458
|
)
|
|||||||
|
Total shareholders' equity
|
$
|
2,548,842
|
|
$
|
2,236,140
|
|
$
|
1,036,903
|
|
||||
See accompanying notes to consolidated financial statements.
MGIC Investment Corporation 2016 Form 10-K
|
84
MGIC INVESTMENT CORPORATION AND SUBSIDIARIES
CONSOLIDATED STATEMENTS OF CASH FLOWS
|
Years Ended December 31,
|
||||||||||||
|
(In thousands)
|
2016
|
2015
|
2014
|
|||||||||
|
Cash flows from operating activities:
|
||||||||||||
|
Net income
|
$
|
342,517
|
|
$
|
1,172,000
|
|
$
|
251,949
|
|
|||
|
Adjustments to reconcile net income to net cash provided by (used in) operating activities:
|
||||||||||||
|
Depreciation and other amortization
|
61,342
|
|
52,559
|
|
48,861
|
|
||||||
|
Deferred tax expense (benefit)
|
162,356
|
|
(692,810
|
)
|
312
|
|
||||||
|
Net realized investment gains
|
(8,932
|
)
|
(28,361
|
)
|
(1,357
|
)
|
||||||
|
Loss on debt extinguishment
|
90,531
|
|
507
|
|
837
|
|
||||||
|
Excess tax benefits related to share-based compensation
|
(67
|
)
|
(2,117
|
)
|
—
|
|
||||||
|
Change in certain assets and liabilities:
|
|
|
|
|
|
|
||||||
|
Accrued investment income
|
(3,849
|
)
|
(9,706
|
)
|
1,142
|
|
||||||
|
Prepaid reinsurance premium
|
101
|
|
47,457
|
|
(11,380
|
)
|
||||||
|
Reinsurance recoverable on loss reserves
|
(6,006
|
)
|
13,354
|
|
6,244
|
|
||||||
|
Reinsurance recoverable on paid losses
|
(1,645
|
)
|
3,105
|
|
4,001
|
|
||||||
|
Premiums receivable
|
(3,923
|
)
|
8,973
|
|
4,859
|
|
||||||
|
Deferred insurance policy acquisition costs
|
(2,518
|
)
|
(3,001
|
)
|
(2,519
|
)
|
||||||
|
Profit commission receivable
|
(747
|
)
|
64,525
|
|
(89,132
|
)
|
||||||
|
Loss reserves
|
(454,589
|
)
|
(503,405
|
)
|
(664,594
|
)
|
||||||
|
Premium deficiency reserve
|
—
|
|
(23,751
|
)
|
(24,710
|
)
|
||||||
|
Unearned premiums
|
49,764
|
|
76,559
|
|
48,935
|
|
||||||
|
Return premium accrual
|
(18,800
|
)
|
(9,600
|
)
|
22,200
|
|
||||||
|
Income taxes payable - current
|
1,123
|
|
2,518
|
|
(674
|
)
|
||||||
|
Other, net
|
13,005
|
|
(16,770
|
)
|
(251
|
)
|
||||||
|
Net cash provided by (used in) operating activities
|
219,663
|
|
152,036
|
|
(405,277
|
)
|
||||||
|
Cash flows from investing activities:
|
||||||||||||
|
Purchases of investments:
|
||||||||||||
|
Fixed income
|
(1,360,386
|
)
|
(2,462,844
|
)
|
(1,979,917
|
)
|
||||||
|
Equity securities
|
(3,197
|
)
|
(2,623
|
)
|
(94
|
)
|
||||||
|
Proceeds from sales of fixed income
|
728,042
|
|
1,796,153
|
|
1,147,624
|
|
||||||
|
Proceeds from maturity of fixed income
|
547,444
|
|
559,774
|
|
1,129,087
|
|
||||||
|
Proceeds from sale of equity securities
|
5,257
|
|
—
|
|
—
|
|
||||||
|
Net decrease in payables for securities
|
—
|
|
—
|
|
13
|
|
||||||
|
Net decrease in restricted cash
|
—
|
|
17,212
|
|
228
|
|
||||||
|
Additions to property and equipment
|
(10,552
|
)
|
(4,630
|
)
|
(4,707
|
)
|
||||||
|
Net cash (used in) provided by investing activities
|
(93,392
|
)
|
(96,958
|
)
|
292,234
|
|
||||||
|
Cash flows from financing activities:
|
||||||||||||
|
Proceeds from issuance of long-term debt
|
573,094
|
|
—
|
|
—
|
|
||||||
|
Repayment of long-term debt
|
—
|
|
(61,953
|
)
|
(20,772
|
)
|
||||||
|
Repurchase of convertible senior notes
|
(363,778
|
)
|
(11,152
|
)
|
—
|
|
||||||
|
Payment of original issue discount - convertible senior notes
|
(11,250
|
)
|
(345
|
)
|
(158
|
)
|
||||||
|
Purchase of convertible junior subordinated debentures
|
(100,860
|
)
|
—
|
|
—
|
|
||||||
|
Payment of original issue discount-convertible junior subordinated debentures
|
(41,540
|
)
|
—
|
|
—
|
|
||||||
|
Cash portion of loss on debt extinguishment
|
(59,460
|
)
|
(507
|
)
|
(837
|
)
|
||||||
|
Repurchase of common stock
|
(147,127
|
)
|
—
|
|
—
|
|
||||||
|
Payment of debt issuance costs
|
(1,127
|
)
|
—
|
|
—
|
|
||||||
|
Excess tax benefits related to share-based compensation
|
67
|
|
2,117
|
|
—
|
|
||||||
|
Net cash used in financing activities
|
(151,981
|
)
|
(71,840
|
)
|
(21,767
|
)
|
||||||
|
Net decrease in cash and cash equivalents
|
(25,710
|
)
|
(16,762
|
)
|
(134,810
|
)
|
||||||
|
Cash and cash equivalents at beginning of year
|
181,120
|
|
197,882
|
|
332,692
|
|
||||||
|
Cash and cash equivalents at end of year
|
$
|
155,410
|
|
$
|
181,120
|
|
$
|
197,882
|
|
|||
See accompanying notes to consolidated financial statements.
85
|
MGIC Investment Corporation 2016 Form 10-K
MGIC INVESTMENT CORPORATION AND SUBSIDIARIES
NOTES TO CONSOLIDATED FINANCIAL STATEMENTS
December 31, 2016
,
2015
and
2014
MGIC Investment Corporation is a holding company which, through Mortgage Guaranty Insurance Corporation ("MGIC"), is principally engaged in the mortgage insurance business. We provide mortgage insurance to lenders throughout the United States and to government sponsored entities to protect against loss from defaults on low down payment residential mortgage loans. Our principal product is primary mortgage insurance. Primary insurance provides mortgage default protection on individual loans and covers unpaid loan principal, delinquent interest and certain expenses associated with the default and subsequent foreclosure or sale approved by us. Through certain other non-insurance subsidiaries, we also provide various services for the mortgage finance industry, such as contract underwriting, analysis of loan originations and portfolios, and mortgage lead generation. An insurance subsidiary of MGIC provides credit insurance for certain mortgages under Fannie Mae and Freddie Mac (the "GSEs") credit risk transfer programs.
At
December 31, 2016
, our direct domestic primary insurance in force ("IIF") was
$182.0 billion
, which represents the principal balance in our records of all mortgage loans that we insure, and our direct domestic primary risk in force ("RIF") was
$47.2 billion
, which represents the insurance in force multiplied by the insurance coverage percentage.
Substantially all of our insurance written since 2008 has been for loans purchased by the GSEs. We operate under the Private Mortgage Insurer Eligibility Requirements ("PMIERs") of the GSEs that became effective December 31, 2015, and were most recently revised in December 2016. The financial requirements of the PMIERs require a mortgage insurer’s "Available Assets" (generally only the most liquid assets of an insurer) to equal or exceed its "Minimum Required Assets" (which are based on an insurer's book and are calculated from tables of factors with several risk dimensions and are subject to a floor amount). Based on our interpretation of the PMIERs, as of
December 31, 2016
, MGIC’s Available Assets are in excess of its Minimum Required Assets; and MGIC is in compliance with the requirements of the PMIERs and eligible to insure loans purchased by the GSEs. The revisions to the PMIERs in December 2016 had no impact on our calculation of Available Assets or Minimum Required Assets, and did not impact our operations.
Basis of presentation
The accompanying consolidated financial statements have been prepared in accordance with accounting principles generally accepted in the United States of America ("GAAP"), as codified in the Accounting Standards Codification ("ASC"). Our consolidated financial statements include the accounts of MGIC Investment Corporation and its majority-owned subsidiaries. Intercompany transactions and balances have been eliminated. In accordance with GAAP, we are required to make estimates and assumptions that affect the reported amounts of assets and liabilities and disclosure of contingent assets and liabilities at the date of the consolidated financial statements and the reported amounts of revenues and expenses during the reporting periods. Actual results could differ from those estimates. We have considered subsequent events through the date of this filing.
Reclassifications
Certain reclassifications to
2015
and
2014
amounts have been made in the accompanying consolidated financial statements to conform to the
2016
presentation. See
Note 3 - "Significant Accounting Policies"
for a discussion of our adoption of accounting guidance in 2016 related to: (1) the presentation of debt issuance costs in the first quarter of 2016, and (2) clarification of certain cash receipts and cash payments. Both of the adopted accounting updates were retrospectively applied to all periods presented, as applicable.
Cash and Cash Equivalents
We consider money market funds and investments with original maturities of three months or less to be cash equivalents.
Fair value measurements
The authoritative guidance around fair value established a framework for measuring fair value. Fair value is disclosed using a fair value hierarchy that prioritizes the inputs to valuation techniques used to measure fair value and includes Levels 1, 2, and 3. To determine the fair value of securities available-for-sale in Level 1 and Level 2 of the fair value hierarchy, independent pricing sources have been utilized. One price is provided per security based on observable market data. To ensure securities are appropriately classified in the fair value hierarchy, we review the pricing techniques and methodologies of the
MGIC Investment Corporation 2016 Form 10-K
|
86
independent pricing sources and believe that their policies adequately consider market activity, either based on specific transactions for the issue valued or based on modeling of securities with similar credit quality, duration, yield and structure that were recently traded. A variety of inputs are utilized by the independent pricing sources including benchmark yields, reported trades, non-binding broker/dealer quotes, issuer spreads, two sided markets, benchmark securities, bids, offers and reference data including data published in market research publications. Inputs may be weighted differently for any security, and not all inputs are used for each security evaluation.
Market indicators, industry and economic events are also considered. This information is evaluated using a multidimensional pricing model. This model combines all inputs to arrive at a value assigned to each security. Quality controls are performed by the independent pricing sources throughout this process, which include reviewing tolerance reports, trading information, data changes, and directional moves compared to market moves. In addition, on a quarterly basis, we perform quality controls over values received from the pricing sources which also include reviewing tolerance reports, trading information, data changes, and directional moves compared to market moves. We have not made any adjustments to the prices obtained from the independent pricing sources.
In accordance with fair value accounting guidance, we applied the following fair value hierarchy in order to measure fair value for assets and liabilities:
Level 1 - Quoted prices for identical instruments in active markets that we can access. Financial assets utilizing Level 1 inputs primarily include U.S. Treasury securities, equity securities, and Australian government and semi government securities.
Level 2 - Quoted prices for similar instruments in active markets that we can access; quoted prices for identical or similar instruments in markets that are not active; and inputs, other than quoted prices, that are observable in the marketplace for the instrument. The observable inputs are used in valuation models to calculate the fair value of the instruments. Financial assets utilizing Level 2 inputs primarily include obligations of U.S. government corporations and agencies, corporate bonds, mortgage-backed securities, asset-backed securities, and most municipal bonds.
The independent pricing sources utilize these approaches to determine the fair value of the instruments in Level 2 of the fair value hierarchy based on type of instrument:
Corporate Debt & U.S. Government and Agency Bonds
are evaluated by surveying the dealer community, obtaining
relevant trade data, benchmark quotes and spreads and incorporating this information into the evaluation process.
Obligations of U.S. States & Political Subdivisions
are evaluated by tracking, capturing, and analyzing quotes for active issues and trades reported via the Municipal Securities Rulemaking Board records. Daily briefings and reviews of current economic conditions, trading levels, spread relationships, and the slope of the yield curve provide further data for evaluation.
Residential Mortgage-Backed Securities ("RMBS")
are evaluated by monitoring interest rate movements, and other pertinent data daily. Incoming market data is enriched to derive spread, yield and/or price data as appropriate, enabling known data points to be extrapolated for valuation application across a range of related securities.
Commercial Mortgage-Backed Securities ("CMBS")
are evaluated using valuation techniques that reflect market participants’ assumptions and maximize the use of relevant observable inputs including quoted prices for similar assets, benchmark yield curves and market corroborated inputs. Evaluation utilizes regular reviews of the inputs for securities covered, including executed trades, broker quotes, credit information, collateral attributes and/or cash flow waterfall as applicable.
Asset-Backed Securities ("ABS")
are evaluated using spreads and other information solicited from market buy-and-sell-side sources, including primary and secondary dealers, portfolio managers, and research analysts. Cash flows are generated for each tranche, benchmark yields are determined, and deal collateral performance and tranche level attributes including trade activity, bids, and offers are applied, resulting in tranche specific prices.
Collateralized loan obligations ("CLO")
Collateralized Loan Obligations are evaluated by manager rating, seniority in the capital structure, assumptions about prepayment, default and recovery and their impact on cash flow generation. Loan level net asset values are determined and aggregated for tranches and as a final step prices are checked against available recent trade activity.
Level 3 - Valuations derived from valuation techniques in which one or more significant inputs or value drivers are unobservable or from par values for equity securities restricted in their ability to be redeemed or sold. The inputs used to derive the fair value of Level 3 securities reflect our own assumptions about the assumptions a market participant would use in pricing an asset or liability. Financial assets utilizing Level 3 inputs primarily include equity
87
|
MGIC Investment Corporation 2016 Form 10-K
securities that can only be redeemed or sold at their par value and only to the security issuer and certain state premium tax credit investments. Our non-financial assets that are classified as Level 3 securities consist of real estate acquired through claim settlement. The fair value of real estate acquired is the lower of our acquisition cost or a percentage of the appraised value. The percentage applied to the appraised value is based upon our historical sales experience adjusted for current trends.
Investments
Our entire investment portfolio is classified as available-for-sale and is reported at fair value or, for certain equity securities carried at cost, amounts that approximate fair value. The related unrealized investment gains or losses are, after considering the related tax expense or benefit, recognized as a component of accumulated other comprehensive income (loss) in shareholders' equity. Realized investment gains and losses are reported in income based upon specific identification of securities sold. (See
Note 5 – “Investments.”
)
Each quarter we perform reviews of our investments in order to determine whether declines in fair value below amortized cost were considered other-than-temporary. In evaluating whether a decline in fair value is other-than-temporary, we consider several factors including, but not limited to:
|
▪
|
our intent to sell the security or whether it is more likely than not that we will be required to sell the security before recovery of its amortized cost basis;
|
|
▪
|
the present value of the discounted cash flows we expect to collect compared to the amortized cost basis of the security;
|
|
▪
|
extent and duration of the decline;
|
|
▪
|
failure of the issuer to make scheduled interest or principal payments;
|
|
▪
|
change in rating below investment grade; and
|
|
▪
|
adverse conditions specifically related to the security, an industry, or a geographic area.
|
Based on our evaluation, we will record an other-than-temporary impairment ("OTTI") adjustment on a security if we intend to sell the impaired security, if it is more likely than not that we will be required to sell the impaired security prior to recovery of its amortized cost basis, or if the present value of the discounted cash flows we expect to collect is less than the amortized cost basis of the security. If the fair value of a security is below its amortized cost at the time of our intent to sell, the security is classified as other-than-temporarily impaired and the full amount of the impairment is recognized as a loss in the statement of operations. Otherwise, when a security is considered to be other-than-temporarily impaired, the losses are separated into the portion of the loss that represents the credit loss and the
portion that is due to other factors. The credit loss portion is recognized as a loss in the statement of operations, while the loss due to other factors is recognized in accumulated other comprehensive loss, net of taxes. A credit loss is determined to exist if the present value of the discounted cash flows, using the security’s original yield, expected to be collected from the security is less than the cost basis of the security.
Home office and equipment
Home office and equipment is carried at cost net of depreciation. For financial reporting purposes, depreciation is determined on a straight-line basis for the home office and equipment over estimated lives ranging from
3
to
45
years. For income tax purposes, we use accelerated depreciation methods.
Home office and equipment is shown net of accumulated depreciation of
$30.6 million
,
$26.1 million
and
$54.9 million
as of
December 31, 2016
,
2015
and
2014
, respectively. Depreciation expense for the years ended
December 31, 2016
,
2015
and
2014
was
$4.6 million
,
$3.2 million
and
$2.2 million
, respectively.
Deferred Insurance Policy Acquisition Costs
Costs directly associated with the successful acquisition of mortgage insurance business, consisting of employee compensation and other policy issuance and underwriting expenses, are initially deferred and reported as deferred insurance policy acquisition costs ("DAC"). The deferred costs are net of any ceding commissions received associated with our reinsurance agreements. For each underwriting year of business, these costs are amortized to income in proportion to estimated gross profits over the estimated life of the policies. We utilize anticipated investment income in our calculation. This includes accruing interest on the unamortized balance of DAC. The estimates for each underwriting year are reviewed quarterly and updated when necessary to reflect actual experience and any changes to key variables such as persistency or loss development. If a premium deficiency exists (in other words, no gross profit is expected), we reduce the related DAC by the amount of the deficiency or to zero through a charge to current period earnings. If the deficiency is more than the related DAC balance, we then establish a premium deficiency reserve equal to the excess, through a charge to current period earnings.
Loss Reserves
Reserves are established for insurance losses and loss adjustment expenses ("LAE") when we receive notices of default on insured mortgage loans. We consider a loan in default when it is
two
or more payments past due. Even though the accounting standard, ASC 944, regarding accounting and reporting by insurance entities specifically
MGIC Investment Corporation 2016 Form 10-K
|
88
excludes mortgage insurance from its guidance relating to loss reserves, we establish loss reserves using the general principles contained in the insurance standard. However, consistent with industry standards for mortgage insurers, we do not establish loss reserves for future claims on insured loans which are not currently in default. Loss reserves are established by estimating the number of loans in our inventory of delinquent loans that will result in a claim payment, which is referred to as the claim rate, and further estimating the amount of the claim payment, which is referred to as claim severity. Our loss estimates are established based upon historical experience, including rescission and loan modification activity. Adjustments to reserve estimates are reflected in the financial statements in the years in which the adjustments are made. The liability for reinsurance assumed is based on information provided by the ceding companies.
Reserves are also established for estimated losses from defaults occurring prior to the close of an accounting period on notices of default not yet reported to us. These incurred but not reported ("IBNR") reserves are also established using estimated claim rates and claim severities.
Reserves are also established for the estimated costs of settling claims, including legal and other expenses and general expenses of administering the claims settlement process. Reserves are also ceded to reinsurers under our reinsurance agreements. (See
Note 8 – “Loss Reserves”
and
Note 9 – “Reinsurance.”
)
Premium Deficiency Reserve
After our loss reserves are initially established, we perform premium deficiency tests using our best estimate assumptions as of the testing date. Premium deficiency reserves are established, if necessary, when the present value of expected future losses and expenses exceeds the present value of expected future premium and already established reserves. The discount rate used in the calculation of the premium deficiency reserve is based upon our pre-tax investment yield at year-end. Products are grouped for premium deficiency testing purposes based on similarities in the way the products are acquired, serviced and measured for profitability.
The calculation of premium deficiency reserves requires the use of significant judgments and estimates to determine the present value of future premium and present value of expected losses and expenses on our business. The calculation of future premium depends on, among other things, assumptions about persistency and repayment patterns on underlying loans. The calculation of expected losses and expenses depends on assumptions relating to severity of claims and claim rates on current defaults, and expected defaults in future periods. These assumptions also include an estimate of expected rescission activity.
Similar to our loss reserve estimates, our estimates for premium deficiency reserves could be adversely affected by several factors, including a deterioration of regional or economic conditions leading to a reduction in borrowers' income and thus their ability to make mortgage payments, and a drop in housing values can influence the willingness of borrowers with sufficient resources to make mortgage payments to do so when the mortgage balance exceeds the value of the home, which could expose us to greater losses. Assumptions used in calculating the deficiency reserves can also be affected by volatility in the current housing and mortgage lending industries. To the extent premium patterns and actual loss experience differ from the assumptions used in calculating the premium deficiency reserves, the differences between the actual results and our estimate will affect future period earnings and could be material.
We previously established a premium deficiency reserve in 2007 on our Wall Street Bulk business, which we also ceased writing in that year. As of December 31, 2015 a premium deficiency reserve was no longer required. Changes in the premium deficiency reserve from period to period were primarily due to the recognition of previously estimated premiums, losses, and expenses, and changes in our assumptions relating to the present value of expected future premiums, losses, and expenses on the remaining Wall Street Bulk IIF. Our consolidated statements of operations for the years ended December 31, 2015 and 2014 were affected by decreases in our premium deficiency reserves of
$24 million
and
$25 million
, respectively. The decreases represented the net result of actual premiums, losses and expenses as well as a net change in assumptions for these periods.
Revenue Recognition
We write policies which are guaranteed renewable contracts at the insured's option on a monthly, single, or annual premium basis. We have no ability to reunderwrite or reprice these contracts. Premiums written on monthly premium policies are earned as coverage is provided. Premiums written on single premium policies and annual premium policies are initially deferred as unearned premium reserve and earned over the estimated policy life. Premiums written on policies covering more than
one
year are amortized over the policy life in relationship to the anticipated incurred loss pattern based on historical experience. Premiums written on annual premium policies are earned on a monthly pro rata basis. When a policy is cancelled for a reason other than rescission or claim payment, all premium that is non-refundable is immediately earned. Any refundable premium is returned to the servicer or borrower. When a policy is cancelled due to rescission, all previously collected premium is returned to the servicer and when a policy is cancelled because a claim is paid, we return any premium received since the date of default. The liability associated
89
|
MGIC Investment Corporation 2016 Form 10-K
with our estimate of premium to be returned is accrued for separately and included in "Other liabilities" on our consolidated balance sheets. When a premium deficiency exists the premium refund liability is included in “Premium deficiency reserves” on our consolidated balance sheets. Changes in these liabilities affect premiums written and earned and change in premium deficiency reserve, respectively. The actual return of premium for all periods affects premiums written and earned. Policy cancellations also lower the persistency rate which is a variable used in calculating the rate of amortization of deferred insurance policy acquisition costs.
Fee income of our non-insurance subsidiaries is earned and recognized as the services are provided and the customer is obligated to pay. Fee income consists primarily of contract underwriting and related fee-based services provided to lenders and is included in “Other revenue” on the consolidated statements of operations.
Income Taxes
Deferred income taxes are provided under the liability method, which recognizes the future tax effects of temporary differences between amounts reported in the consolidated financial statements and the tax bases of these items. The expected tax effects are computed at the enacted regular federal statutory tax rate. Using this method, we have recorded a net deferred tax asset primarily due to net operating losses incurred in prior years. On a quarterly basis, we review the need to maintain a deferred tax asset valuation allowance as an offset to the net deferred tax asset, before valuation allowance. We analyze several factors, among which are the severity and frequency of operating losses, our capacity for the carryback or carryforward of any losses, the existence and current level of taxable operating income, operating results on a three year cumulative basis, the expected occurrence of future income or loss, the expiration dates of the carryforwards, the cyclical nature of our operating results, and available tax planning strategies. Based on our analysis, we reduced our benefit from income tax through the recognition of a valuation allowance from the first quarter of 2009 through the second quarter of 2015. In the third quarter of 2015, as discussed in
Note 12 –“Income Taxes,”
we concluded that it was more likely than not that our deferred tax assets would be fully realizable and we reversed the valuation allowance.
We provide for uncertain tax positions and the related interest and penalties based on our assessment of whether a tax benefit is more likely than not to be sustained under any examination by taxing authorities.
Benefit Plans
We have a non-contributory defined benefit pension plan covering substantially all employees, as well as a supplemental executive retirement plan. Retirement benefits are based on compensation and years of service.
We recognize these retirement benefit costs over the period during which employees render the service that qualifies them for benefits. Our policy is to fund pension cost as required under the Employee Retirement Income Security Act of 1974.
We offer both medical and dental benefits for retired domestic employees, their eligible spouses and dependents until the retiree reaches the age of
65
. Under the plan retirees pay a premium for these benefits. We accrue the estimated costs of retiree medical and dental benefits over the period during which employees render the service that qualifies them for benefits. (See
Note 11 – “Benefit Plans.”
)
Reinsurance
Loss reserves and unearned premiums are reported before taking credit for amounts ceded under reinsurance agreements. Ceded loss reserves are reflected as "Reinsurance recoverable on loss reserves." Ceded unearned premiums are included in “Other assets.” Amounts due from reinsurers on paid claims are reflected as “Reinsurance recoverable on paid losses.” Ceded premiums payable are included in “Other liabilities.” Any profit commissions are included with “Premiums written – Ceded” and any ceding commissions are included with “Other underwriting and operating expenses, net.” We remain liable for all insurance ceded. (See
Note 9 – “Reinsurance.”
)
Share-Based Compensation
We have certain share-based compensation plans. Under the fair value method, compensation cost is measured at the grant date based on the fair value of the award and is recognized over the service period which generally corresponds to the vesting period. The fair value of awards classified as liabilities is remeasured at each reporting period until the award is settled. Awards under our plans generally vest over periods ranging from
one
to
three
years. (See
Note 15 – “Share-based Compensation Plans.”
)
Earnings per Share
Basic earnings per share ("EPS") is calculated by dividing net income by the weighted average number of shares of common stock outstanding. Diluted EPS includes the components of basic EPS and also gives effect to dilutive common stock equivalents. We calculate diluted EPS using the treasury stock method and if-converted method. Under the treasury stock method, diluted EPS reflects the potential dilution that could occur if our unvested restricted stock units result in the issuance of common stock. Under the if-converted method, diluted EPS reflects the potential dilution that could occur if our convertible debt instruments result in the issuance of common stock. The determination of potentially issuable shares does not consider the satisfaction of the conversion requirements and the shares are included in the determination of diluted EPS as of the
MGIC Investment Corporation 2016 Form 10-K
|
90
beginning of the period, if dilutive. We have several debt issuances that could result in contingently issuable shares and consider each potential issuance of shares separately to reflect the maximum potential dilution. Nonetheless, our dilutive common stock equivalents may not reflect all of the contingently issuable shares that could be required to be issued upon any debt conversion. For purposes of calculating basic and diluted EPS, vested restricted stock and restricted stock units ("RSUs") are considered outstanding.
Related party transactions
There were
no
related party transactions during
2016
,
2015
or
2014
.
Recent accounting and reporting developments
|
Standard
|
Summary of guidance
|
Effects on financial statements and/or disclosures
|
||||
|
Presentation of Debt Issuance Costs
|
•
|
Requires the presentation of debt issuance costs in the balance sheet as a deduction from the carrying amount of the related debt liability instead of as a deferred charge.
|
•
|
Adopted March 31, 2016 with retrospective application to prior periods.
|
||
|
•
|
Does not impact the amortization method for these costs.
|
•
|
There was no material impact on the consolidated balance sheets, and no impact on our statements of operations.
|
|||
|
•
|
For further information, see
Note 7. "Debt."
|
|||||
|
Accounting for Share-Based Compensation When the Terms of an Award Provide That a Performance Target Could Be Achieved after the Requisite Service Period
|
•
|
Requires that a performance target that affects vesting and that can be achieved after the requisite service period be treated as a performance condition.
|
•
|
Adopted March 31, 2016 with application to performance based awards granted in 2016.
|
||
|
•
|
Compensation cost should be recognized in the period in which it become probable that the performance target will be achieved and should represent the compensation cost attributable to the periods for which service has been rendered.
|
•
|
There was no material impact on our consolidated financial statements.
|
|||
|
•
|
If the performance target becomes probable of being achieved before the end of the service period, the remaining unrecognized compensation cost for which requisite service has not yet been rendered is recognized prospectively over the remaining service period.
|
•
|
For further information, see
Note 15. "Share-based Compensation Plans"
.
|
|||
|
Disclosures about Short-Duration Contracts
|
•
|
Requires expanded disclosures designed to provide additional insight into an insurance entity's ability to underwrite and anticipate costs associated with claims.
|
•
|
This standard is not considered applicable to our business and therefore we have not adopted these disclosure requirements.
|
||
|
•
|
Disclosures include information about incurred and paid claims development, on a net of reinsurance basis, for the number of years claims incurred typically remain outstanding not to exceed ten years.
|
|||||
|
•
|
Expanded disclosures also include more transparent information about significant changes in methodologies and assumptions used to estimate claims, and the timing, frequency, and severity of claims.
|
|||||
|
Classification of Certain Cash Receipts and Cash Payments
|
•
|
Provides specific guidance on the presentation of certain cash flow items including, but not limited to, debt prepayment and debt issuance costs and proceeds from the settlement of insurance claims.
|
•
|
Adopted December 31, 2016 with application to prior periods.
|
||
|
•
|
Cash flows related to debt prepayment and debt issuance transactions have been reclassified as financing activities from operating activities.
|
|||||
|
•
|
For further information on the impact our transactions had on our cash and cash equivalents see our
consolidated statements of cash flows
.
|
|||||
91
|
MGIC Investment Corporation 2016 Form 10-K
|
Financial Accounting Standards Board ("FASB") Standards Issued but not yet Adopted
|
||||||
|
Standard
|
Summary of guidance
|
Effects on financial statements and/or disclosures
|
||||
|
Recognition and Measurement of Financial Assets and Financial Liabilities
Issued January 2016
|
•
|
Requires equity investments, except those accounted for under the equity method of accounting that have a readily determinable fair value to be measured at fair value with changes in fair value recognized in earnings.
|
•
|
Required effective date: January 1, 2018.
|
||
|
•
|
Equity investments that do not have readily determinable fair values may be remeasured at fair value either upon the occurrence of an observable price change or upon identification of an impairment. A qualitative assessment for impairment is required for equity investments without readily determinable fair values.
|
•
|
The potential impact from the adoption of this guidance is not expected to have a material impact our consolidated balance sheets, consolidated statements of operations, or liquidity.
|
|||
|
•
|
Requires recognition of a cumulative effect adjustment to retained earnings as of the beginning of the reporting period of adoption.
|
•
|
For further information on our current equity investments see
Note 5. "Investments."
|
|||
|
Improvements to Employee Share-Based Compensation Accounting
Issued March 2016
|
•
|
Requires that, prospectively, all tax effects related to share-based compensation be made through the statement of operations at the time of settlement, rather than recognizing excess tax benefits within paid-in capital.
|
•
|
Required effective date: January 1, 2017.
|
||
|
•
|
Removes the requirement to delay recognition of a tax benefit until it reduces current taxes payable. This change is required to be applied on a modified retrospective basis.
|
•
|
We are currently evaluating the impacts the adoption of this guidance will have on our consolidated financial statements.
|
|||
|
•
|
Requires all tax related cash flows resulting from share-based compensation to be reported as operating activities, a change from the existing requirement to present tax benefits as an inflow from financing activities and an outflow from operating activities.
|
|||||
|
•
|
Entities, for tax withholding purposes, will be allowed to withhold an amount of shares up to an employee's maximum individual tax rate (as opposed to the minimum statutory tax rate) in the relevant jurisdiction without resulting in liability classification of the award.
|
|||||
|
Measurement of Credit Losses on Financial Statements
Issued June 2016
|
•
|
Requires immediate recognition of estimated credit losses expected to occur over the remaining life of many financial instruments. Entities are required to use a current expected credit loss ("CECL") methodology that incorporates their forecasts of future economic conditions, unless such forecast is not reasonable or supportable, in which case the entity will revert to historical loss experience.
|
•
|
Required effective date: January 1, 2020.
|
||
|
•
|
Amends existing guidance for available-for-sale fixed income securities to incorporate an allowance, rather than a write-down of the asset, with the amount of the allowance limited to the amount by which the fair value is less than amortized cost. The guidance will allow for reversals of impairment losses in the event that the credit of an issuer improves. The length of time a security has been in an unrealized loss position will no longer impact the determination of whether a credit loss exists.
|
•
|
We are currently evaluating the impacts the adoption of this guidance will have on our consolidated financial statements, but do not expect it to have a material impact.
|
|||
|
•
|
Updated guidance is not prescriptive about certain aspects of estimating expected credit losses, including the specific methodology to use, and therefore will require significant judgment in application.
|
|||||
MGIC Investment Corporation 2016 Form 10-K
|
92
The computation of basic EPS includes as "participating securities" unvested share-based compensation awards that contain non-forfeitable rights to dividends or dividend equivalents, whether paid or unpaid, under the "two-class" method. Our participating securities are composed of vested restricted stock and restricted stock units with non-forfeitable rights to dividends (of which none have been declared since the issuance of these participating securities). For each of the years ended
December 31, 2016
,
2015
, and
2014
, participating securities of
0.1 million
have been included in basic EPS.
The computation of diluted EPS for the years ended
December 31, 2016
,
2015
, and
2014
includes weighted average unvested restricted stock units outstanding of
1.5 million
,
2.1 million
, and
3.1 million
, respectively.
For the years ended
December 31, 2016
and
2015
, all of our outstanding Convertible Senior Notes and Convertible Junior Subordinated Debentures are reflected in diluted earnings per share using the “if-converted” method. Under this method, if dilutive, the common stock related to the outstanding Convertible Senior Notes and/or Convertible Junior Debentures is assumed issued as of the beginning of the reporting period and the related interest expense, net of tax, is added back to earnings in calculating diluted EPS. For the year ended December 31, 2014 our
5%
Notes and
9%
Debentures were not included in calculating diluted EPS as the result was anti-dilutive under the "if-converted" method.
The following table reconciles basic and diluted EPS amounts:
|
(In thousands, except per share data)
|
Years Ended December 31,
|
|||||||||||
|
2016
|
2015
|
2014
|
||||||||||
|
Basic earnings per share:
|
||||||||||||
|
Net income
|
$
|
342,517
|
|
$
|
1,172,000
|
|
$
|
251,949
|
|
|||
|
Weighted average common shares outstanding
|
342,890
|
|
339,552
|
|
338,523
|
|
||||||
|
Basic income per share
|
$
|
1.00
|
|
$
|
3.45
|
|
$
|
0.74
|
|
|||
|
Diluted earnings per share:
|
||||||||||||
|
Net income
|
$
|
342,517
|
|
$
|
1,172,000
|
|
$
|
251,949
|
|
|||
|
Interest expense, net of tax
(1)
:
|
||||||||||||
|
2% Notes
|
6,111
|
|
7,928
|
|
12,197
|
|
||||||
|
5% Notes
|
6,362
|
|
12,228
|
|
—
|
|
||||||
|
9% Debentures
|
15,893
|
|
22,786
|
|
—
|
|
||||||
|
Diluted income available to common shareholders
|
$
|
370,883
|
|
$
|
1,214,942
|
|
$
|
264,146
|
|
|||
|
Weighted-average shares - Basic
|
342,890
|
|
339,552
|
|
338,523
|
|
||||||
|
Effect of dilutive securities:
|
||||||||||||
|
Unvested restricted stock units
|
1,470
|
|
2,113
|
|
3,082
|
|
||||||
|
2% Notes
|
54,450
|
|
71,917
|
|
71,917
|
|
||||||
|
5% Notes
|
13,107
|
|
25,603
|
|
—
|
|
||||||
|
9% Debentures
|
20,075
|
|
28,854
|
|
—
|
|
||||||
|
Weighted-average shares - Diluted
|
431,992
|
|
468,039
|
|
413,522
|
|
||||||
|
Diluted earnings per share
|
$
|
0.86
|
|
$
|
2.60
|
|
$
|
0.64
|
|
|||
|
Anti-dilutive securities (in millions)
|
—
|
|
—
|
|
54.5
|
|
||||||
|
(1)
|
Interest expense for the years ended
December 31, 2016
and
December 31, 2015
has been tax effected at a rate of
35%
. Due to the valuation allowance recorded against deferred tax assets, interest expense for the year ended December 31, 2014 was not tax effected.
|
93
|
MGIC Investment Corporation 2016 Form 10-K
The amortized cost, gross unrealized gains and losses and fair value of the investment portfolio as of
December 31, 2016
and
2015
are shown below:
|
December 31, 2016
|
||||||||||||||||
|
(In thousands)
|
Amortized Cost
|
Gross Unrealized Gains
|
Gross Unrealized Losses
(1)
|
Fair Value
|
||||||||||||
|
U.S. Treasury securities and obligations of U.S. government corporations and agencies
|
$
|
73,847
|
|
$
|
407
|
|
$
|
(724
|
)
|
$
|
73,530
|
|
||||
|
Obligations of U.S. states and political subdivisions
|
2,147,458
|
|
20,983
|
|
(25,425
|
)
|
2,143,016
|
|
||||||||
|
Corporate debt securities
|
1,756,461
|
|
6,059
|
|
(18,610
|
)
|
1,743,910
|
|
||||||||
|
ABS
|
59,519
|
|
74
|
|
(28
|
)
|
59,565
|
|
||||||||
|
RMBS
|
231,733
|
|
102
|
|
(7,626
|
)
|
224,209
|
|
||||||||
|
CMBS
|
327,042
|
|
769
|
|
(7,994
|
)
|
319,817
|
|
||||||||
|
CLOs
|
121,151
|
|
226
|
|
(202
|
)
|
121,175
|
|
||||||||
|
Total debt securities
|
4,717,211
|
|
28,620
|
|
(60,609
|
)
|
4,685,222
|
|
||||||||
|
Equity securities
|
7,144
|
|
8
|
|
(24
|
)
|
7,128
|
|
||||||||
|
Total investment portfolio
|
$
|
4,724,355
|
|
$
|
28,628
|
|
$
|
(60,633
|
)
|
$
|
4,692,350
|
|
||||
|
December 31, 2015
|
||||||||||||||||
|
(In thousands)
|
Amortized Cost
|
Gross Unrealized Gains
|
Gross Unrealized Losses
(1)
|
Fair Value
|
||||||||||||
|
U.S. Treasury securities and obligations of U.S. government corporations and agencies
|
$
|
160,393
|
|
$
|
2,133
|
|
$
|
(1,942
|
)
|
$
|
160,584
|
|
||||
|
Obligations of U.S. states and political subdivisions
|
1,766,407
|
|
33,410
|
|
(7,290
|
)
|
1,792,527
|
|
||||||||
|
Corporate debt securities
|
2,046,697
|
|
2,836
|
|
(44,770
|
)
|
2,004,763
|
|
||||||||
|
ABS
|
116,764
|
|
56
|
|
(203
|
)
|
116,617
|
|
||||||||
|
RMBS
|
265,879
|
|
161
|
|
(8,392
|
)
|
257,648
|
|
||||||||
|
CMBS
|
237,304
|
|
162
|
|
(3,975
|
)
|
233,491
|
|
||||||||
|
CLOs
|
61,345
|
|
3
|
|
(1,148
|
)
|
60,200
|
|
||||||||
|
Debt securities issued by foreign sovereign governments
|
29,359
|
|
2,474
|
|
(102
|
)
|
31,731
|
|
||||||||
|
Total debt securities
|
4,684,148
|
|
41,235
|
|
(67,822
|
)
|
4,657,561
|
|
||||||||
|
Equity securities
|
5,625
|
|
38
|
|
(18
|
)
|
5,645
|
|
||||||||
|
Total investment portfolio
|
$
|
4,689,773
|
|
$
|
41,273
|
|
$
|
(67,840
|
)
|
$
|
4,663,206
|
|
||||
|
(1)
|
There were no OTTI losses recorded in other comprehensive (loss) income as of
December 31, 2016
and
2015
.
|
During the first quarter of 2016 we substantially liquidated our Australian entities and repatriated most assets, including proceeds from the monetization of our Australian investment portfolio. As of
December 31, 2016
we held no investments in foreign sovereign governments. As of
December 31, 2015
our foreign investments primarily consisted of Australian government and semi government securities.
As discussed in
Note 7 - "Debt"
we are required to maintain collateral of at least
102%
of the outstanding principal balance of the FHLB Advance. As of December 31, 2016 that
collateral is included in our total investment portfolio amount shown above with a total fair value of
$164.4 million
.
The amortized cost and fair values of debt securities as of
December 31, 2016
, by contractual maturity, are shown below. Expected maturities will differ from contractual maturities because borrowers may have the right to call or prepay obligations with or without call or prepayment penalties. Because most asset-backed and mortgage-backed securities and collateralized loan obligations provide for periodic payments throughout their lives, they are listed below in separate categories.
MGIC Investment Corporation 2016 Form 10-K
|
94
|
December 31, 2016
|
||||||||
|
(In thousands)
|
Amortized Cost
|
Fair Value
|
||||||
|
Due in one year or less
|
$
|
433,464
|
|
$
|
433,770
|
|
||
|
Due after one year through five years
|
1,211,034
|
|
1,212,650
|
|
||||
|
Due after five years through ten years
|
1,157,091
|
|
1,139,552
|
|
||||
|
Due after ten years
|
1,176,177
|
|
1,174,484
|
|
||||
|
3,977,766
|
|
3,960,456
|
|
|||||
|
ABS
|
59,519
|
|
59,565
|
|
||||
|
RMBS
|
231,733
|
|
224,209
|
|
||||
|
CMBS
|
327,042
|
|
319,817
|
|
||||
|
CLOs
|
121,151
|
|
121,175
|
|
||||
|
Total as of December 31, 2016
|
$
|
4,717,211
|
|
$
|
4,685,222
|
|
||
At
December 31, 2016
and
2015
, the investment portfolio had gross unrealized losses of
$61 million
and
$68 million
, respectively. For those securities in an unrealized loss position, the length of time the securities were in such a position, as measured by their month-end fair values, is as follows:
|
December 31, 2016
|
Less Than 12 Months
|
12 Months or Greater
|
Total
|
|||||||||||||||||||||
|
(In thousands)
|
Fair Value
|
Unrealized Losses
|
Fair Value
|
Unrealized Losses
|
Fair Value
|
Unrealized Losses
|
||||||||||||||||||
|
U.S. Treasury securities and obligations of U.S. government corporations and agencies
|
$
|
48,642
|
|
$
|
(724
|
)
|
$
|
—
|
|
$
|
—
|
|
$
|
48,642
|
|
$
|
(724
|
)
|
||||||
|
Obligations of U.S. states and political subdivisions
|
1,136,676
|
|
(24,918
|
)
|
13,681
|
|
(507
|
)
|
1,150,357
|
|
(25,425
|
)
|
||||||||||||
|
Corporate debt securities
|
915,777
|
|
(16,771
|
)
|
35,769
|
|
(1,839
|
)
|
951,546
|
|
(18,610
|
)
|
||||||||||||
|
ABS
|
3,366
|
|
(28
|
)
|
656
|
|
—
|
|
4,022
|
|
(28
|
)
|
||||||||||||
|
RMBS
|
46,493
|
|
(857
|
)
|
171,326
|
|
(6,769
|
)
|
217,819
|
|
(7,626
|
)
|
||||||||||||
|
CMBS
|
205,545
|
|
(7,529
|
)
|
38,587
|
|
(465
|
)
|
244,132
|
|
(7,994
|
)
|
||||||||||||
|
CLOs
|
13,278
|
|
(73
|
)
|
34,760
|
|
(129
|
)
|
48,038
|
|
(202
|
)
|
||||||||||||
|
Equity securities
|
568
|
|
(15
|
)
|
137
|
|
(9
|
)
|
705
|
|
(24
|
)
|
||||||||||||
|
Total investment portfolio
|
$
|
2,370,345
|
|
$
|
(50,915
|
)
|
$
|
294,916
|
|
$
|
(9,718
|
)
|
$
|
2,665,261
|
|
$
|
(60,633
|
)
|
||||||
|
December 31, 2015
|
Less Than 12 Months
|
12 Months or Greater
|
Total
|
|||||||||||||||||||||
|
(In thousands)
|
Fair Value
|
Unrealized Losses
|
Fair Value
|
Unrealized Losses
|
Fair Value
|
Unrealized Losses
|
||||||||||||||||||
|
U.S. Treasury securities and obligations of U.S. government corporations and agencies
|
$
|
60,548
|
|
$
|
(1,467
|
)
|
$
|
1,923
|
|
$
|
(475
|
)
|
$
|
62,471
|
|
$
|
(1,942
|
)
|
||||||
|
Obligations of U.S. states and political subdivisions
|
417,615
|
|
(6,404
|
)
|
37,014
|
|
(886
|
)
|
454,629
|
|
(7,290
|
)
|
||||||||||||
|
Corporate debt securities
|
1,470,628
|
|
(38,519
|
)
|
114,982
|
|
(6,251
|
)
|
1,585,610
|
|
(44,770
|
)
|
||||||||||||
|
ABS
|
86,604
|
|
(173
|
)
|
5,546
|
|
(30
|
)
|
92,150
|
|
(203
|
)
|
||||||||||||
|
RMBS
|
35,064
|
|
(312
|
)
|
209,882
|
|
(8,080
|
)
|
244,946
|
|
(8,392
|
)
|
||||||||||||
|
CMBS
|
134,488
|
|
(2,361
|
)
|
69,927
|
|
(1,614
|
)
|
204,415
|
|
(3,975
|
)
|
||||||||||||
|
CLOs
|
—
|
|
—
|
|
51,750
|
|
(1,148
|
)
|
51,750
|
|
(1,148
|
)
|
||||||||||||
|
Debt securities issued by foreign sovereign governments
|
4,463
|
|
(102
|
)
|
—
|
|
—
|
|
4,463
|
|
(102
|
)
|
||||||||||||
|
Equity securities
|
355
|
|
(8
|
)
|
171
|
|
(10
|
)
|
526
|
|
(18
|
)
|
||||||||||||
|
Total investment portfolio
|
$
|
2,209,765
|
|
$
|
(49,346
|
)
|
$
|
491,195
|
|
$
|
(18,494
|
)
|
$
|
2,700,960
|
|
$
|
(67,840
|
)
|
||||||
95
|
MGIC Investment Corporation 2016 Form 10-K
The unrealized losses in all categories of our investments as of
December 31, 2016
and
2015
were primarily caused by changes in interest rates between the time of purchase and the respective year end. There were
607
and
303
securities in an unrealized loss position as of
December 31, 2016
and
2015
, respectively. As of
December 31, 2016
, the fair value as a percent of amortized cost of the securities in an unrealized loss position was
98%
and approximately
14%
of the securities in an unrealized loss position were backed by the U.S. Government.
There were
no
OTTI losses in earnings during
2016
and
2015
. We recognized OTTI losses of
$0.1 million
during
2014
.
For the years ended
December 31, 2016
,
2015
, and
2014
, there were no credit losses recognized in earnings for which a portion of an OTTI loss was recognized in accumulated other comprehensive loss.
The source of net investment income is as follows:
|
(In thousands)
|
2016
|
2015
|
2014
|
|||||||||
|
Fixed income
|
$
|
112,513
|
|
$
|
105,882
|
|
$
|
89,437
|
|
|||
|
Equity securities
|
182
|
|
208
|
|
227
|
|
||||||
|
Cash equivalents
|
754
|
|
191
|
|
179
|
|
||||||
|
Other
|
433
|
|
455
|
|
711
|
|
||||||
|
Investment income
|
113,882
|
|
106,736
|
|
90,554
|
|
||||||
|
Investment expenses
|
(3,216
|
)
|
(2,995
|
)
|
(2,907
|
)
|
||||||
|
Net investment income
|
$
|
110,666
|
|
$
|
103,741
|
|
$
|
87,647
|
|
|||
The net realized investment gains, including impairment losses, and change in net unrealized gains (losses) of investments are as follows:
|
(In thousands)
|
2016
|
2015
|
2014
|
|||||||||
|
Net realized investment gains on investments:
|
||||||||||||
|
Fixed income
|
$
|
5,310
|
|
$
|
28,335
|
|
$
|
1,000
|
|
|||
|
Equity securities
|
3,622
|
|
26
|
|
356
|
|
||||||
|
Other
|
—
|
|
—
|
|
1
|
|
||||||
|
Total net realized investment gains
|
$
|
8,932
|
|
$
|
28,361
|
|
$
|
1,357
|
|
|||
|
Change in net unrealized gains (losses):
|
||||||||||||
|
Fixed income
|
$
|
(5,403
|
)
|
$
|
(33,687
|
)
|
$
|
91,718
|
|
|||
|
Equity securities
|
(36
|
)
|
(32
|
)
|
66
|
|
||||||
|
Other
|
14
|
|
1
|
|
(4
|
)
|
||||||
|
Total (decrease) increase in net unrealized gains/losses
|
$
|
(5,425
|
)
|
$
|
(33,718
|
)
|
$
|
91,780
|
|
|||
The gross realized gains, gross realized losses and impairment losses are as follows:
|
(In thousands)
|
2016
|
2015
|
2014
|
|||||||||
|
Gross realized gains
|
$
|
11,909
|
|
$
|
30,039
|
|
$
|
4,966
|
|
|||
|
Gross realized losses
|
(2,977
|
)
|
(1,678
|
)
|
(3,465
|
)
|
||||||
|
Other-than-temporary-impairment losses
|
—
|
|
—
|
|
(144
|
)
|
||||||
|
Net realized gains on securities
|
$
|
8,932
|
|
$
|
28,361
|
|
$
|
1,357
|
|
|||
We had
$13.6 million
and
$18.9 million
of investments at fair value on deposit with various states as of
December 31, 2016
and
2015
, respectively, due to regulatory requirements of those state insurance departments.
MGIC Investment Corporation 2016 Form 10-K
|
96
Assets measured at fair value included those listed, by hierarchy level, in the following tables as of
December 31, 2016
and
2015
:
|
December 31, 2016
|
||||||||||||||||
|
(In thousands)
|
Fair Value
|
Quoted Prices in Active
Markets for Identical Assets
(Level 1)
|
Significant Other
Observable Inputs
(Level 2)
|
Significant Unobservable
Inputs
(Level 3)
|
||||||||||||
|
U.S. Treasury securities and obligations of U.S. government corporations and agencies
|
$
|
73,530
|
|
$
|
30,690
|
|
$
|
42,840
|
|
$
|
—
|
|
||||
|
Obligations of U.S. states and political subdivisions
|
2,143,016
|
|
—
|
|
2,142,325
|
|
691
|
|
||||||||
|
Corporate debt securities
|
1,743,910
|
|
—
|
|
1,743,910
|
|
—
|
|
||||||||
|
ABS
|
59,565
|
|
—
|
|
59,565
|
|
—
|
|
||||||||
|
RMBS
|
224,209
|
|
—
|
|
224,209
|
|
—
|
|
||||||||
|
CMBS
|
319,817
|
|
—
|
|
319,817
|
|
—
|
|
||||||||
|
CLOs
|
121,175
|
|
—
|
|
121,175
|
|
—
|
|
||||||||
|
Total debt securities
|
4,685,222
|
|
30,690
|
|
4,653,841
|
|
691
|
|
||||||||
|
Equity securities
(1)
|
7,128
|
|
2,860
|
|
—
|
|
4,268
|
|
||||||||
|
Total investments
|
$
|
4,692,350
|
|
$
|
33,550
|
|
$
|
4,653,841
|
|
$
|
4,959
|
|
||||
|
Real estate acquired
(2)
|
$
|
11,748
|
|
$
|
—
|
|
$
|
—
|
|
$
|
11,748
|
|
||||
|
December 31, 2015
|
||||||||||||||||
|
(In thousands)
|
Fair Value
|
Quoted Prices in Active
Markets for Identical Assets
(Level 1)
|
Significant Other
Observable Inputs
(Level 2)
|
Significant Unobservable
Inputs
(Level 3)
|
||||||||||||
|
U.S. Treasury securities and obligations of U.S. government corporations and agencies
|
$
|
160,584
|
|
$
|
46,197
|
|
$
|
114,387
|
|
$
|
—
|
|
||||
|
Obligations of U.S. states and political subdivisions
|
1,792,527
|
|
—
|
|
1,791,299
|
|
1,228
|
|
||||||||
|
Corporate debt securities
|
2,004,763
|
|
—
|
|
2,004,763
|
|
—
|
|
||||||||
|
ABS
|
116,617
|
|
—
|
|
116,617
|
|
—
|
|
||||||||
|
RMBS
|
257,648
|
|
—
|
|
257,648
|
|
—
|
|
||||||||
|
CMBS
|
233,491
|
|
—
|
|
233,491
|
|
—
|
|
||||||||
|
CLOs
|
60,200
|
|
—
|
|
60,200
|
|
—
|
|
||||||||
|
Debt securities issued by foreign sovereign governments
|
31,731
|
|
31,731
|
|
—
|
|
—
|
|
||||||||
|
Total debt securities
|
4,657,561
|
|
77,928
|
|
4,578,405
|
|
1,228
|
|
||||||||
|
Equity securities
(1)
|
5,645
|
|
2,790
|
|
—
|
|
2,855
|
|
||||||||
|
Total investments
|
$
|
4,663,206
|
|
$
|
80,718
|
|
$
|
4,578,405
|
|
$
|
4,083
|
|
||||
|
Real estate acquired
(2)
|
$
|
12,149
|
|
$
|
—
|
|
$
|
—
|
|
$
|
12,149
|
|
||||
|
(1)
|
Equity securities in Level 3 are carried at cost, which approximates fair value.
|
|
(2)
|
Real estate acquired through claim settlement, which is held for sale, is reported in other assets on the consolidated balance sheets.
|
97
|
MGIC Investment Corporation 2016 Form 10-K
For assets and liabilities measured at fair value using significant unobservable inputs (Level 3), a reconciliation of the beginning and ending balances for the years ended
December 31, 2016
,
2015
, and
2014
is shown in the following tables. There were no transfers into or out of Level 3 in those years and there we no losses included in earnings for those years attributable to the change in unrealized losses on assets still held at the end of each applicable year.
|
Level 3 reconciliations:
|
||||||||||||||||
|
(In thousands)
|
Obligations of U.S. States and
Political Subdivisions
|
Equity Securities
|
Total Investments
|
Real Estate Acquired
|
||||||||||||
|
Balance at December 31, 2015
|
$
|
1,228
|
|
$
|
2,855
|
|
$
|
4,083
|
|
$
|
12,149
|
|
||||
|
Total realized/unrealized gains (losses):
|
||||||||||||||||
|
Included in earnings and reported as net realized investment gains
|
—
|
|
3,579
|
|
3,579
|
|
—
|
|
||||||||
|
Included in earnings and reported as losses incurred, net
|
—
|
|
—
|
|
—
|
|
(1,142
|
)
|
||||||||
|
Purchases
|
—
|
|
4,258
|
|
4,258
|
|
36,859
|
|
||||||||
|
Sales
|
(537
|
)
|
(6,424
|
)
|
(6,961
|
)
|
(36,118
|
)
|
||||||||
|
Balance at December 31, 2016
|
$
|
691
|
|
$
|
4,268
|
|
$
|
4,959
|
|
$
|
11,748
|
|
||||
|
(In thousands)
|
Obligations of U.S. States and
Political Subdivisions
|
Equity Securities
|
Total Investments
|
Real Estate Acquired
|
||||||||||||
|
Balance at December 31, 2014
|
$
|
1,846
|
|
$
|
321
|
|
$
|
2,167
|
|
$
|
12,658
|
|
||||
|
Total realized/unrealized gains (losses):
|
|
|
|
|
|
|
|
|
||||||||
|
Included in earnings and reported as losses incurred, net
|
—
|
|
—
|
|
—
|
|
(2,322
|
)
|
||||||||
|
Purchases
|
7
|
|
2,534
|
|
2,541
|
|
34,624
|
|
||||||||
|
Sales
|
(625
|
)
|
—
|
|
(625
|
)
|
(32,811
|
)
|
||||||||
|
Balance at December 31, 2015
|
$
|
1,228
|
|
$
|
2,855
|
|
$
|
4,083
|
|
$
|
12,149
|
|
||||
|
(In thousands)
|
Obligations of U.S. States and
Political Subdivisions
|
Equity Securities
|
Total Investments
|
Real Estate Acquired
|
||||||||||||
|
Balance at December 31, 2013
|
$
|
2,423
|
|
$
|
321
|
|
$
|
2,744
|
|
$
|
13,280
|
|
||||
|
Total realized/unrealized gains (losses):
|
||||||||||||||||
|
Included in earnings and reported as losses incurred, net
|
—
|
|
—
|
|
—
|
|
(4,129
|
)
|
||||||||
|
Purchases
|
30
|
|
—
|
|
30
|
|
42,247
|
|
||||||||
|
Sales
|
(607
|
)
|
—
|
|
(607
|
)
|
(38,740
|
)
|
||||||||
|
Balance at December 31, 2014
|
$
|
1,846
|
|
$
|
321
|
|
$
|
2,167
|
|
$
|
12,658
|
|
||||
Authoritative guidance over disclosures about the fair value of financial instruments requires additional disclosure for financial instruments not measured at fair value. Certain financial instruments, including insurance contracts, are excluded from these fair value disclosure requirements. The carrying values of cash and cash equivalents (Level 1) and accrued investment income (Level 2) approximated their fair values.
As of
December 31, 2016
, the majority of the
$5.0 million
balance of Level 3 securities are equity securities that can only be redeemed or sold at their par value and only to the security issuer, with the remainder of the balance held in a state premium tax credit investment. The state premium tax credit investment has an average maturity of less than
3 years
and a credit rating of AAA, and its balance reflects its remaining scheduled payments discounted at an average annual rate of
7.1%
. As of
December 31, 2015
our Level 3 securities were equity securities that can only be redeemed or sold at their par value and only to the security issuer and state premium tax credit investments. As of December 31,
MGIC Investment Corporation 2016 Form 10-K
|
98
2014 the majority of our Level 3 securities were state premium tax credit investments.
Additional fair value disclosures related to our investment portfolio are included in
Note 5 – “Investments.
”
We incur financial liabilities in the normal course of our business. The following table presents the carrying value and fair value of our financial liabilities disclosed, but not carried, at fair value at
December 31, 2016
and
2015
. The fair values of our
5%
Notes,
2%
Notes,
5.75%
Notes, and
9%
Debentures were based on observable market prices and the fair value of the FHLB Advance was estimated using discounted cash flows on current incremental borrowing rates for similar borrowing arrangements, and in all cases they are categorized as Level 2. See
Note 7 - "Debt"
for a description of the financial liabilities in the table below.
|
December 31, 2016
|
December 31, 2015
|
|||||||||||||||
|
(In thousands)
|
Carrying Value
|
Fair Value
|
Carrying Value
|
Fair Value
|
||||||||||||
|
Financial liabilities:
|
||||||||||||||||
|
FHLB Advance
|
$
|
155,000
|
|
$
|
151,905
|
|
n/a
|
|
n/a
|
|
||||||
|
5% Notes
|
144,789
|
|
147,679
|
|
331,546
|
|
345,616
|
|
||||||||
|
2% Notes
|
204,672
|
|
308,605
|
|
490,755
|
|
701,955
|
|
||||||||
|
5.75% Notes
|
417,406
|
|
445,987
|
|
n/a
|
|
n/a
|
|
||||||||
|
9% Debentures
|
256,872
|
|
323,040
|
|
389,522
|
|
455,067
|
|
||||||||
|
Total financial liabilities
|
$
|
1,178,739
|
|
$
|
1,377,216
|
|
$
|
1,211,823
|
|
$
|
1,502,638
|
|
||||
The
5%
Notes,
2%
Notes,
5.75%
Notes, and
9%
Debentures are obligations of our holding company, MGIC Investment Corporation, and not of its subsidiaries.
Accounting standard update
As of March 31, 2016 we adopted the accounting update related to the presentation of debt issuance costs in the consolidated financial statements. The change in accounting guidance has been applied retrospectively to prior periods. As a result, a reclassification of approximately
$11.2 million
of debt issuance costs was made on our December 31, 2015 balance sheet, resulting in a reduction to other assets and a reduction to long-term debt; there was no impact on our consolidated statements of operations or retained earnings.
The impact of the reclassification of debt issuance costs on our outstanding debt obligations as of December 31, 2015 is as follows.
|
December 31, 2015
|
||||||||||||
|
(In millions)
|
As previously reported
|
Adjustment
|
As Adjusted
|
|||||||||
|
5% Notes
|
$
|
333.5
|
|
$
|
(2.0
|
)
|
$
|
331.5
|
|
|||
|
2% Notes
|
500.0
|
|
(9.2
|
)
|
490.8
|
|
||||||
|
9% Debentures
|
389.5
|
|
—
|
|
389.5
|
|
||||||
|
Total long-term debt
|
$
|
1,223.0
|
|
$
|
(11.2
|
)
|
$
|
1,211.8
|
|
|||
Long-term debt
Long-term debt as of
December 31, 2016
and
2015
consisted of the following obligations.
|
December 31,
|
||||||||
|
(In millions)
|
2016
|
2015
|
||||||
|
FHLB Advance
|
$
|
155.0
|
|
$
|
—
|
|
||
|
5% Notes
|
145.0
|
|
333.5
|
|
||||
|
2% Notes
|
207.6
|
|
500.0
|
|
||||
|
5.75% Notes
|
425.0
|
|
—
|
|
||||
|
9% Debentures
|
256.9
|
|
389.5
|
|
||||
|
Long-term debt, par value
|
1,189.5
|
|
1,223.0
|
|
||||
|
Less: debt issuance costs
|
10.8
|
|
11.2
|
|
||||
|
Long-term debt, carrying value
|
$
|
1,178.7
|
|
$
|
1,211.8
|
|
||
Interest payments, on a consolidated basis, for our debt obligations existing during
2016
and
2015
appear below.
|
Years Ended December 31,
|
||||||||
|
(In millions)
|
2016
|
2015
|
||||||
|
5.375% Notes
|
$
|
—
|
|
$
|
3.3
|
|
||
|
FHLB Advance
|
2.4
|
|
—
|
|
||||
|
5% Notes
|
10.6
|
|
17.3
|
|
||||
|
2% Notes
|
9.1
|
|
10.0
|
|
||||
|
5.75% Notes
|
—
|
|
—
|
|
||||
|
9% Debentures
|
27.4
|
|
35.1
|
|
||||
|
Total interest payments
|
$
|
49.5
|
|
$
|
65.7
|
|
||
5.75%
Notes
In August 2016, we issued
$425 million
aggregate principal amount of
5.75%
Senior Notes due in 2023 ("
5.75%
Notes") and received net proceeds, after the deduction of underwriting fees, of
$418.1 million
. Interest on the
5.75%
Notes is payable semi-annually on February 15 and August 15 of each year, commencing on February 15, 2017. We have the option to redeem these notes, in whole or in part, at any time or from time to time prior to maturity at a redemption price equal to the greater of (i)
100%
of the aggregate principal amount of the notes to be redeemed and (ii) the make-whole amount, which is the sum of the present values
99
|
MGIC Investment Corporation 2016 Form 10-K
of the remaining scheduled payments of principal and interest discounted at the treasury rate defined in the notes plus 50 basis points, plus, in each case, accrued interest thereon to, but excluding, the redemption date. In addition to underwriting fees, we incurred approximately
$1.2 million
of other expenses associated with the issuance of these notes.
The 5.75% Notes have covenants customary for securities of this nature, including customary events of default and further provide that the trustee or holders of at least 25% in aggregate principal amount of the outstanding 5.75% Notes may declare them immediately due and payable upon the occurrence of certain events of default after the expiration of the applicable grace period. In addition, in the case of an event of default arising from certain events of bankruptcy, insolvency or reorganization relating to the Company or any of its significant subsidiaries, the 5.75% Notes will become due and payable immediately. This description is not intended to be complete in all respects and is qualified in its entirety by the terms of the 5.75% Notes, including their covenants and events of default.
The net proceeds from the 5.75% Notes issuance were primarily used as (i) cash consideration to repurchase a portion of our 2% Notes, and (ii) to repurchase the shares issued as partial consideration in the repurchases of our 2% Notes, as further described below. The remaining proceeds are being held for general corporate purposes.
FHLB Advance
In February 2016, MGIC borrowed
$155.0 million
in the form of a fixed rate advance from the Federal Home Loan Bank of Chicago ("FHLB Advance"). Interest on the Advance is payable monthly at an annual rate, fixed for the term of the Advance, of
1.91%
. The principal of the Advance matures on
February 10, 2023
. MGIC may prepay the Advance at any time. Such prepayment would be below par if interest rates have risen after the Advance was originated, or above par if interest rates have declined. The Advance is secured by eligible collateral whose market value must be maintained at
102%
of the principal balance of the Advance. MGIC provided eligible collateral from its investment portfolio.
5.375%
Notes
We repaid the outstanding
5.375%
Notes with cash at the holding company on November 2, 2015. Interest on these notes was payable semi-annually in arrears on
May 1
and
November 1
each year. The repayment of our Senior Notes had no material impact on our financial position or liquidity.
5%
Notes
As of
December 31, 2016
and
2015
we had outstanding
$145.0 million
and
$333.5 million
, respectively, principal amount of
5%
Notes due in 2017 ("
5%
Notes"). In 2016, we repurchased
$188.5 million
in aggregate principal of our
5%
Notes at a purchase price of
$195.5 million
, plus accrued interest using funds held at our holding company. In 2015, we purchased
$11.5 million
in aggregate principal of our
5%
Notes at a purchase price of
$12.0 million
, plus accrued interest, using funds held at our holding company. In each of 2016 and 2015, the excess of the purchase price over carrying value, plus the write-off of unamortized issuance costs on the par value repurchased, is reflected as a loss on debt extinguishment on our consolidated statements of operations. Our
5%
Notes repurchase in 2015 reduced our potentially dilutive shares by approximately
0.9 million
shares, and our 2016
5%
Notes repurchases reduced our potentially dilutive shares by approximately
14.0 million
shares.
Interest on the
5%
Notes is payable semi-annually in arrears on
May 1
and
November 1
of each year. The
5%
Notes will mature on
May 1, 2017
. The
5%
Notes are convertible, at the holder's option, at an initial conversion rate, which is subject to adjustment, of
74.4186
shares per
$1,000
principal amount at any time prior to the maturity date. This represents an initial conversion price of approximately
$13.44
per share. These
5%
Notes will be equal in right of payment to our other senior debt and will be senior in right of payment to our
9%
Debentures. Debt issuance costs are being amortized to interest expense over the contractual life of the
5%
Notes. We have
10.8 million
authorized shares reserved for conversion under our
5%
Notes.
The provisions of the
5%
Notes are complex. Covenants in the
5%
Notes include a requirement to notify holders in advance of certain events and that we and the designated subsidiaries preserve our corporate existence, rights and franchises unless we or any such subsidiary determines that such preservation is no longer necessary in the conduct of its business and that the loss thereof is not disadvantageous to the holders of the
5%
Notes. A designated subsidiary is any of our consolidated subsidiaries which has shareholders' equity of at least
15%
of our consolidated shareholders' equity. Further, the notes are subject to the indenture between us and the trustee that, among other terms, includes provisions that would constitute an event of default under the indenture. Upon such a default, the trustee could accelerate the maturity of the notes independent of any action by holders of the
5%
Notes. This description is not intended to be complete in all respect and is qualified in its entirety by the terms of the
5%
Notes, including their covenants and events of default. We were in compliance with all covenants at
December 31, 2016
.
MGIC Investment Corporation 2016 Form 10-K
|
100
2%
Notes
As of
December 31, 2016
and
2015
, we had outstanding
$207.6 million
and
$500.0 million
, respectively, principal amount of our
2%
Notes due in 2020 ("
2%
Notes"). In the third quarter of 2016, we entered into privately negotiated agreements to repurchase
$292.4 million
in aggregate principal of our outstanding
2%
Notes at a purchase price of
$362.1 million
, plus accrued interest. We funded the purchases with
$230.7 million
in cash, using proceeds from the issuance of our
5.75%
Notes, and by issuing to certain sellers approximately
18.3 million
shares of our common stock. The excess of the purchase price over carrying value, plus the write-off of unamortized issuance costs on the par value repurchased, is reflected as a loss on debt extinguishment on our consolidated statements of operations for the year ended
December 31, 2016
. The shares issued as consideration for the notes repurchases have been repurchased as of
December 31, 2016
using cash from our
5.75%
Notes issuance. The repurchases of the
2%
Notes reduced potentially dilutive shares by approximately
42.1 million
shares, without considering the shares issued as partial consideration in the purchases of the
2%
Notes or the repurchase of shares to offset such shares issued.
Interest on the
2%
Notes is payable semi-annually in arrears on
April 1
and October 1 of each year. Debt issuance costs are being amortized to interest expense over the contractual life of the
2%
Notes. The
2%
Notes will mature on
April 1, 2020
, unless earlier repurchased by us or converted.
Prior to January 1, 2020, the
2%
Convertible Senior Notes are convertible only upon satisfaction of one or more conditions. One such condition is that during any calendar quarter commencing after March 31, 2014, the last reported sale price of our common stock for each of at least
20
trading days during the
30
consecutive trading days ending on, and including, the last trading day of the immediately preceding calendar quarter be greater than or equal to
130%
of the applicable conversion price on each applicable trading day. This condition was met for the quarter ended December 31, 2016. The
2%
Notes are convertible at an initial conversion rate, which is subject to adjustment, of
143.8332
shares per
$1,000
principal amount. This represents an initial conversion price of approximately
$6.95
per share.
130%
of such conversion price is approximately
$9.04
. On or after January 1, 2020, holders may convert their notes irrespective of satisfaction of the conditions.
Prior to April 10, 2017, the notes will not be redeemable. On any business day on or after April 10, 2017 we may redeem for cash all or part of the notes, at our option, at a redemption price equal to
100%
of the principal amount of the notes being redeemed, plus any accrued and unpaid interest, if the closing sale price of our common stock exceeds
130%
of the then prevailing conversion price of the notes for at least
20
of the
30
trading days preceding notice of the redemption. We have
29.9 million
authorized shares reserved for conversion under our
2%
Notes.
The provisions of the
2%
Notes are complex. Covenants in the
2%
Notes include a requirement to notify holders in advance of certain events and that we and the designated subsidiaries (defined above) preserve our corporate existence, rights and franchises unless we or any such subsidiary determines that such preservation is no longer necessary in the conduct of its business and that the loss thereof is not disadvantageous to holders of the
2%
Notes. Further, the notes are subject to the indenture between us and the trustee that, among other terms, includes provisions that would constitute an event of default under the indenture. Upon such a default, the trustee could accelerate the maturity of the notes independent of any action by holders of the
2%
Notes. This description is not intended to be complete in all respect and is qualified in its entirety by the terms of the
2%
Notes, including their covenants and events of default. We were in compliance with all covenants at
December 31, 2016
. These
2%
Notes will be equal in right of payment to our other senior debt and will be senior in right of payment to our
9%
Debentures.
9%
Debentures
As of
December 31, 2016
and
2015
we had outstanding
$256.9 million
and
$389.5 million
, respectively, principal amount of our
9%
Debentures due in 2063 ("
9%
Debentures"). In February 2016, MGIC purchased
$132.7 million
in aggregate principal of our outstanding
9%
Debentures at a purchase price of
$150.7 million
, plus accrued interest. The
9%
Debentures include a conversion feature that allows us, at our option, to make a cash payment to converting holders in lieu of issuing shares of common stock upon conversion of the
9%
Debentures. The accounting standards applicable to extinguishment of debt with a cash conversion feature require the consideration paid to be allocated between the extinguishment of the liability component and reacquisition of the equity component. The purchase of the
9%
Debentures resulted in an
$8.3 million
loss on debt extinguishment on the consolidated statement of operations for the year ended
December 31, 2016
, which represents the difference between the fair value and the carrying value of the liability component on the purchase date. In addition, our shareholders’ equity was separately reduced by
$6.3 million
related to the reacquisition of the equity component. For GAAP accounting purposes, the
9%
Debentures owned by MGIC are considered retired and are eliminated in our consolidated financial statements and the underlying common stock equivalents, approximately
9.8 million
shares, are not included in the computation of diluted shares.
The
9%
Debentures are currently convertible, at the holder's option, at an initial conversion rate, which is subject to
101
|
MGIC Investment Corporation 2016 Form 10-K
adjustment, of
74.0741
common shares per
$1,000
principal amount of the
9%
Debentures at any time prior to the maturity date. This represents an initial conversion price of approximately
$13.50
per share. If a holder elects to convert their
9%
Debentures, deferred interest owed on the
9%
Debentures being converted is also converted into shares of our common stock. The conversion rate for any deferred interest is based on the average price that our shares traded at during a
5
-day period immediately prior to the election to convert. In lieu of issuing shares of common stock upon conversion of the
9%
Debentures, we may, at our option, make a cash payment to converting holders for all or some of the shares of our common stock otherwise issuable upon conversion. We have
19.0 million
authorized shares reserved for conversion under our
9%
debentures.
We may redeem the
9%
Debentures in whole or in part from time to time, at our option, at a redemption price equal to
100%
of the principal amount of the
9%
Debentures being redeemed, plus any accrued and unpaid interest, if the closing sale price of our common stock exceeds
130%
of the then prevailing conversion price of the
9%
Debentures for at least
20
of the
30
trading days preceding notice of the redemption.
130%
of such conversion price is
$17.55
.
Interest on the
9%
Debentures is payable semi-annually in arrears on
April 1
and October 1 of each year. As long as no event of default with respect to the debentures has occurred and is continuing, we may defer interest, under an optional deferral provision, for
one
or more consecutive interest periods up to
10 years
without giving rise to an event of default. Deferred interest will accrue additional interest at the rate then applicable to the debentures. During an optional deferral period we may not pay or declare dividends on our common stock.
When interest on the 9% Debentures is deferred, we are required, not later than a specified time, to use reasonable commercial efforts to begin selling qualifying securities to persons who are not our affiliates. The specified time is one business day after we pay interest on the 9% Debentures that was not deferred, or if earlier, the fifth anniversary of the scheduled interest payment date on which the deferral started. Qualifying securities are common stock, certain warrants and certain non-cumulative perpetual preferred stock. The requirement to use such efforts to sell such securities is called the Alternative Payment Mechanism.
The net proceeds of Alternative Payment Mechanism sales are to be applied to the payment of deferred interest, including the compound portion. We cannot pay deferred interest other than from the net proceeds of Alternative Payment Mechanism sales, except at the final maturity of the debentures or at the
ten
th anniversary of the start of the interest deferral. The Alternative Payment Mechanism does not require us to sell common stock or warrants before the
fifth anniversary of the interest payment date on which that deferral started if the net proceeds (counting any net proceeds of those securities previously sold under the Alternative Payment Mechanism) would exceed the
2%
cap. The
2%
cap is
2%
of the average closing price of our common stock times the number of our outstanding shares of common stock. The average price is determined over a specified period ending before the issuance of the common stock or warrants being sold, and the number of outstanding shares is determined as of the date of our most recent publicly released financial statements.
We are not required to issue under the Alternative Payment Mechanism a total of more than
10 million
shares of common stock, including shares underlying qualifying warrants. In addition, we may not issue under the Alternative Payment Mechanism qualifying preferred stock if the total net proceeds of all issuances would exceed
25%
of the aggregate principal amount of the debentures.
The Alternative Payment Mechanism does not apply during any period between scheduled interest payment dates if there is a “market disruption event” that occurs over a specified portion of such period. Market disruption events include any material adverse change in domestic or international economic or financial conditions.
The provisions of the
9%
Debentures are complex. The description above is not intended to be complete in all respects. Moreover, that description is qualified in its entirety by the terms of the
9%
Debentures, including their covenants and events of default. We were in compliance with all covenants at
December 31, 2016
. The
9%
Debentures rank junior to all of our existing and future senior indebtedness.
As described in
Note 3 – “Summary of Significant Accounting Policies – Loss Reserves,”
we establish reserves to recognize the estimated liability for losses and LAE related to defaults on insured mortgage loans. Loss reserves are established by estimating the number of loans in our inventory of delinquent loans that will result in a claim payment, which is referred to as the claim rate, and further estimating the amount of the claim payment, which is referred to as claim severity.
Estimation of losses is inherently judgmental. The conditions that affect the claim rate and claim severity include the current and future state of the domestic economy, including unemployment, the current and future strength of local housing markets; exposure on insured loans; the amount of time between default and claim filing, and curtailments and rescissions. The actual amount of the claim payments may be substantially different than our loss
MGIC Investment Corporation 2016 Form 10-K
|
102
reserve estimates. Our estimates could be adversely affected by several factors, including a deterioration of regional or national economic conditions, including unemployment, leading to a reduction in borrowers’ income and thus their ability to make mortgage payments, and a drop in housing values which may affect borrower willingness to continue to make mortgage payments when the value of the home is below the mortgage balance. Changes to our estimates could result in a material impact to our results of operations and capital position, even in a stable economic environment.
The “Losses incurred” section of the table below shows losses incurred on defaults that occurred in the current year and in prior years. The amount of losses incurred relating to defaults that occurred in the current year represents the estimated amount to be ultimately paid on such defaults. The amount of losses incurred relating to defaults that occurred in prior years represents the actual claim rate and severity associated with those defaults resolved in the current year differing from the estimated liability at the prior year-end, as well as a re-estimation of amounts to be ultimately paid on defaults continuing from the end of the prior year. This re-estimation of the claim rate and severity is the result of our review of current trends in the default inventory, such as percentages of defaults that have resulted in a claim, the amount of the claims relative to the average loan exposure, changes in the relative level of defaults by geography and changes in average loan exposure.
Losses incurred on default notices received in the current year decreased in
2016
compared to
2015
, and in
2015
compared to
2014
, primarily due to a decrease in the number of new defaults, net of cures, as well as a decrease in the estimated claim rate on recently reported defaults.
The “Losses paid” section of the table below shows the breakdown between claims paid on new default notices in the current year, and claims paid on defaults from prior years. Until a few years ago, it took, on average, approximately twelve months for a default that is not cured to develop into a paid claim. Over the past several years, the average time it takes to receive a claim associated with a default has increased. This is, in part, due to new loss mitigation protocols established by servicers and to changes in some state foreclosure laws that may include, for example, a requirement for additional review and/or mediation processes. It is difficult to estimate how long it may take for current and future defaults that do not cure to develop into paid claims.
During 2016, our losses paid included
$53 million
associated with settlements for claims paying practices and NPL settlements. These settlements reduced our delinquent inventory by
1,273
notices. During 2015, our
losses paid included $
10 million
associated with settlements for claim paying practices. These settlements reduced our delinquent inventory by
1,121
notices. These settlements had no material impact on our losses incurred in either year.
The liability associated with our estimate of premiums to be refunded on expected claim payments is accrued for separately at
December 31, 2016
and
2015
and approximated
$85 million
and
$102 million
, respectively. This liability was included in "Other liabilities" on our consolidated balance sheets.
In each of 2016, 2015, and 2014, we paid
$42 million
in connection with a 2012 settlement agreement with Freddie Mac regarding the aggregate loss limit under certain pool insurance policies. The final payment under that settlement agreement was made on December 1, 2016.
The following table provides a reconciliation of beginning and ending loss reserves for each of the past three years:
|
(In thousands)
|
2016
|
2015
|
2014
|
|||||||||
|
Reserve at beginning of year
|
$
|
1,893,402
|
|
$
|
2,396,807
|
|
$
|
3,061,401
|
|
|||
|
Less reinsurance recoverable
|
44,487
|
|
57,841
|
|
64,085
|
|
||||||
|
Net reserve at beginning of year
|
1,848,915
|
|
2,338,966
|
|
2,997,316
|
|
||||||
|
Losses incurred:
|
||||||||||||
|
Losses and LAE incurred in respect of default notices received in:
|
||||||||||||
|
Current year
|
387,815
|
|
453,849
|
|
596,436
|
|
||||||
|
Prior years
(1)
|
(147,658
|
)
|
(110,302
|
)
|
(100,359
|
)
|
||||||
|
Total losses incurred
|
240,157
|
|
343,547
|
|
496,077
|
|
||||||
|
Losses paid:
|
||||||||||||
|
Losses and LAE paid in respect of default notices received in:
|
||||||||||||
|
Current year
|
14,823
|
|
25,980
|
|
32,919
|
|
||||||
|
Prior years
|
689,258
|
|
823,058
|
|
1,121,508
|
|
||||||
|
Reinsurance terminations
(2)
|
(3,329
|
)
|
(15,440
|
)
|
—
|
|
||||||
|
Total losses paid
|
700,752
|
|
833,598
|
|
1,154,427
|
|
||||||
|
Net reserve at end of year
|
1,388,320
|
|
1,848,915
|
|
2,338,966
|
|
||||||
|
Plus reinsurance recoverables
|
50,493
|
|
44,487
|
|
57,841
|
|
||||||
|
Reserve at end of year
|
$
|
1,438,813
|
|
$
|
1,893,402
|
|
$
|
2,396,807
|
|
|||
|
(1)
|
A negative number for prior year losses incurred indicates a redundancy of prior year loss reserves. See table below for more information about prior year loss development.
|
|
(2)
|
In a termination, the reinsurance agreement is cancelled, with no future premium ceded and funds for any incurred but unpaid losses transferred to us. The transferred funds result in an increase in our investment portfolio (including cash and cash equivalents) and a decrease in net losses paid (reduction to losses incurred). In addition, there is an offsetting decrease in the reinsurance recoverable (increase in losses incurred), and thus there is no net impact to losses incurred. (See
Note 9 – “Reinsurance”
)
|
103
|
MGIC Investment Corporation 2016 Form 10-K
For the years ended
December 31, 2016
,
2015
and
2014
we experienced favorable prior year loss reserve development. This development was, in part, due to the resolution of approximately
63%
,
60%
and
58%
for the years ended
December 31, 2016
,
2015
and
2014
, respectively, of the prior year default inventory. In
2016
, 2015, and 2014 we experienced improved cure rates on prior year defaults. Additionally, during 2015 the claim rate development was favorably impacted by re-estimations of previously recorded reserves relating to disputes on our claims paying practices and adjustments to IBNR. The favorable development for the years ended 2016 and 2015 was offset, in part, by an increase in the estimated severity on prior year defaults remaining in the delinquent inventory. The decrease in the estimated severity in
2014
was based on the resolution of the prior year default inventory.
The prior year development of the reserves in
2016
,
2015
and
2014
is reflected in the table below.
|
(In millions)
|
2016
|
2015
|
2014
|
|||||||||
|
Decrease in estimated claim rate on primary defaults
|
$
|
(148
|
)
|
$
|
(141
|
)
|
$
|
(43
|
)
|
|||
|
Increase (decrease) in estimated severity on primary defaults
|
9
|
|
43
|
|
(35
|
)
|
||||||
|
Change in estimates related to pool reserves, LAE reserves, reinsurance and other
|
(9
|
)
|
(12
|
)
|
(22
|
)
|
||||||
|
Total prior year loss development
(1)
|
$
|
(148
|
)
|
$
|
(110
|
)
|
$
|
(100
|
)
|
|||
|
(1)
|
A negative number for prior year loss development indicates a redundancy of prior year loss reserves.
|
Default Inventory
A rollforward of our primary default inventory for the years ended
December 31, 2016
,
2015
and
2014
appears in the table below. The information concerning new notices and cures is compiled from monthly reports received from loan servicers. The level of new notice and cure activity reported in a particular month can be influenced by, among other things, the date on which a servicer generates its report, the number of business days in a month and transfers of servicing between loan servicers.
|
2016
|
2015
|
2014
|
||||||
|
Default inventory at beginning of year
|
62,633
|
|
79,901
|
|
103,328
|
|
||
|
New Notices
|
67,434
|
|
74,315
|
|
88,844
|
|
||
|
Cures
|
(65,516
|
)
|
(73,610
|
)
|
(87,278
|
)
|
||
|
Paids (including those charged to a deductible or captive)
|
(12,367
|
)
|
(16,004
|
)
|
(23,494
|
)
|
||
|
Rescissions and denials
|
(629
|
)
|
(848
|
)
|
(1,306
|
)
|
||
|
Other items removed from inventory
|
(1,273
|
)
|
(1,121
|
)
|
(193
|
)
|
||
|
Default inventory at end of year
|
50,282
|
|
62,633
|
|
79,901
|
|
||
The decrease in the primary default inventory experienced during
2016
and
2015
was generally across all markets and all book years prior to 2013. In
2016
and
2015
, the percentage of loans in the inventory that had been in default for 12 or more consecutive months had decreased compared to the respective prior years. Historically as a default ages it becomes more likely to result in a claim. The percentage of loans that have been in default for 12 or more consecutive months and the number of loans in our primary claims received inventory have been affected by our suspended rescissions and the resolution of certain of those rescissions discussed below and in
Note 17 - "Litigation and Contingencies"
.
The number of consecutive months that a borrower has been delinquent is shown in the table below.
|
Consecutive months in default
|
|||||||||||||||||
|
December 31,
|
|||||||||||||||||
|
2016
|
2015
|
2014
|
|||||||||||||||
|
3 months or less
|
12,194
|
|
24
|
%
|
13,053
|
|
21
|
%
|
15,319
|
|
19
|
%
|
|||||
|
4 - 11 months
|
13,450
|
|
27
|
%
|
15,763
|
|
25
|
%
|
19,710
|
|
25
|
%
|
|||||
|
12 months or more
(1)
|
24,638
|
|
49
|
%
|
33,817
|
|
54
|
%
|
44,872
|
|
56
|
%
|
|||||
|
Total primary default inventory
|
50,282
|
|
100
|
%
|
62,633
|
|
100
|
%
|
79,901
|
|
100
|
%
|
|||||
|
Primary claims received inventory included in ending default inventory
|
1,385
|
|
3
|
%
|
2,769
|
|
4
|
%
|
4,746
|
|
6
|
%
|
|||||
|
(1)
|
Approximately
47%
,
50%
and
53%
of the primary default inventory in default for 12 consecutive months or more has been in default for at least 36 consecutive months as of
December 31, 2016
,
2015
and
2014
, respectively.
|
MGIC Investment Corporation 2016 Form 10-K
|
104
The length of time a loan is in the default inventory can differ from the number of payments that the borrower has not made or is considered delinquent. These differences typically result from a borrower making monthly payments that do not result in the loan becoming fully current. The number of payments that a borrower is delinquent is shown in the table below.
|
Number of payments delinquent
|
|||||||||||||||||
|
December 31,
|
|||||||||||||||||
|
2016
|
2015
|
2014
|
|||||||||||||||
|
3 payments or less
|
18,419
|
|
36
|
%
|
20,360
|
|
33
|
%
|
23,253
|
|
29
|
%
|
|||||
|
4 - 11 payments
|
12,892
|
|
26
|
%
|
15,092
|
|
24
|
%
|
19,427
|
|
24
|
%
|
|||||
|
12 payments or more
|
18,971
|
|
38
|
%
|
27,181
|
|
43
|
%
|
37,221
|
|
47
|
%
|
|||||
|
Total primary default inventory
|
50,282
|
|
100
|
%
|
62,633
|
|
100
|
%
|
79,901
|
|
100
|
%
|
|||||
Pool insurance default inventory decreased to
1,883
at
December 31, 2016
from
2,739
at
December 31, 2015
and
3,797
at
December 31, 2014
.
Claims paying practices
Our loss reserving methodology incorporates our estimates of future rescissions. A variance between ultimate actual rescission rates and our estimates, as a result of the outcome of litigation, settlements or other factors, could materially affect our losses.
The liability associated with our estimate of premiums to be refunded on expected future rescissions is accrued for separately. At
December 31, 2016
and
2015
the estimate of this liability totaled
$5 million
and
$7 million
, respectively. This liability was included in "Other liabilities" on our consolidated balance sheets.
For information about discussions and legal proceedings with customers with respect to our claims paying practices, including settlements that we believe are probable, as defined in ASC 450-20, see
Note 17 – “Litigation and Contingencies.”
Our consolidated financial statements reflect the effects of assumed and ceded reinsurance transactions. Assumed reinsurance refers to the acceptance of certain insurance risks that other insurance companies have underwritten. Ceded reinsurance involves transferring certain insurance risks (along with the related earned premiums) we have underwritten to other insurance companies who agree to share these risks. The primary purpose of ceded reinsurance is to protect us, at a cost, against a fixed percentage of losses arising from policies covered by the agreement;
however we also utilize reinsurance to manage our capital requirements under PMIERs. Reinsurance is currently placed on a quota-share basis, but we also have captive reinsurance agreements that remain in effect. The reinsurance agreements we have entered into are discussed below.
The effect of all reinsurance agreements on premiums earned and losses incurred, which is reflected in the consolidated statements of operations, is as follows:
|
Years ended December 31,
|
||||||||||||
|
(In thousands)
|
2016
|
2015
|
2014
|
|||||||||
|
Premiums earned:
|
||||||||||||
|
Direct
|
$
|
1,058,545
|
|
$
|
997,892
|
|
$
|
950,973
|
|
|||
|
Assumed
|
662
|
|
1,178
|
|
1,653
|
|
||||||
|
Ceded
|
(133,981
|
)
|
(102,848
|
)
|
(108,255
|
)
|
||||||
|
Net premiums earned
|
$
|
925,226
|
|
$
|
896,222
|
|
$
|
844,371
|
|
|||
|
Losses incurred:
|
||||||||||||
|
Direct
|
$
|
273,207
|
|
$
|
369,680
|
|
$
|
524,051
|
|
|||
|
Assumed
|
1,138
|
|
1,552
|
|
2,012
|
|
||||||
|
Ceded
|
(34,188
|
)
|
(27,685
|
)
|
(29,986
|
)
|
||||||
|
Net losses incurred
|
$
|
240,157
|
|
$
|
343,547
|
|
$
|
496,077
|
|
|||
Quota share reinsurance
2015 QSR Transaction
We utilize a quota-share reinsurance agreement with a group of unaffiliated reinsurers, each with an insurer financial strength rating of A- or better by Standard and Poor's Rating Services, A.M. Best, or both, to manage our exposure to losses resulting from our mortgage guaranty policies and to provide reinsurance capital credit under the PMIERs. Our 2015 quota share reinsurance agreement("2015 QSR Transaction"), which became effective July 1, 2015 provides coverage on policies that were in the 2013 quota share reinsurance agreement ("2013 QSR Transaction"); additional qualifying in force policies as of the agreement effective date which either had no history of defaults, or where a single default had been cured for twelve or more months at the agreement effective date; and all qualifying new insurance written through December 31, 2016. The agreement cedes losses incurred and premiums on or after the effective date through December 31, 2024, at which time the agreement expires. Early termination of the agreement can be elected by us effective December 31, 2018 for a fee, or under specified scenarios for
no
fee upon prior written notice, including if we will receive less than
90%
of the full credit amount under the PMIERs for the risk ceded in any required calculation period.
The 2015 QSR Transaction increased the amount of our IIF covered by reinsurance and will increase the amount of
105
|
MGIC Investment Corporation 2016 Form 10-K
premiums and losses ceded. A higher level of losses ceded will reduce our profit commission. The structure of the 2015 QSR Transaction is a
30%
quota share for all policies covered, with a
20%
ceding commission as well as a profit commission. Generally, under the 2015 QSR Transaction, we will receive a profit commission provided that the loss ratio on the loans covered under the agreement remains below
60%
.
2013 QSR Transaction
Effective
July 1, 2015
, we settled our 2013 QSR Transaction by commutation. The settlement included unearned premiums, loss reserves, and profit commission. The commutation resulted in an increase in net premiums written and earned of
$69.4 million
and
$11.6 million
, respectively, and a decrease in ceding commissions of
$11.6 million
in the third quarter of 2015. Receipt of our profit commission of
$142.5 million
, in addition to other premium and loss amounts, was also completed as part of the settlement.
2017 QSR Transaction
We have agreed to terms on a quota-share reinsurance agreement for 2017 ("2017 QSR Transaction") with a group of unaffiliated reinsurers, each with an insurer financial strength rating of A- or better by Standard and Poor's, A.M. Best or both, to manage our exposure to losses resulting from our mortgage guaranty policies and to provide reinsurance capital credit under the PMIERs. The GSEs have approved the terms of our proposed 2017 QSR Transaction. The 2017 QSR Transaction is expected to be executed during the first quarter of 2017 with an effective date retroactive to January 1, 2017, and will provide coverage on new business written January 1, 2017 through December 29, 2017 that meets certain eligibility requirements. Under the agreed upon terms, the 2017 QSR Transaction will cede losses incurred and premiums on or after the effective date through December 31, 2028, at which time the agreement expires. Early termination of the agreement can be elected by us effective December 31, 2021 for a fee, or under specified scenarios for
no
fee upon prior written notice, including if we will receive less than
90%
of the full credit amount under the PMIERs for the risk ceded in any required calculation period.
The agreed upon structure of the 2017 QSR Transaction is a
30%
quota share for all policies covered, with a
20%
ceding commission as well as a profit commission. Generally, under the 2017 QSR Transaction, we will receive a profit commission provided that the loss ratio on the loans covered under the agreement remains below
60%
.
Following is a summary of our quota share reinsurance agreements, excluding captive agreements, for
2016
,
2015
and
2014
.
|
Years ended December 31,
|
||||||||||||
|
(In thousands)
|
2016
|
2015
|
2014
|
|||||||||
|
2015 QSR Transaction (Effective July 1, 2015)
|
||||||||||||
|
Ceded premiums written, net of profit commission
(1)
|
$
|
125,460
|
|
$
|
52,588
|
|
n/a
|
|
||||
|
Ceded premiums earned, net of profit commission
(1)
|
125,460
|
|
52,588
|
|
n/a
|
|
||||||
|
Ceded losses incurred
|
30,201
|
|
11,424
|
|
n/a
|
|
||||||
|
Ceding commissions
(2)
|
47,629
|
|
20,582
|
|
n/a
|
|
||||||
|
Profit commission
|
112,685
|
|
50,322
|
|
n/a
|
|
||||||
|
2013 QSR Transaction
|
|
|||||||||||
|
Ceded premiums written, net of profit commission
|
n/a
|
|
$
|
(11,355
|
)
|
(3)
|
$
|
100,031
|
|
|||
|
Ceded premiums earned, net of profit commission
|
n/a
|
|
35,999
|
|
(3)
|
88,528
|
|
|||||
|
Ceded losses incurred
|
n/a
|
|
6,060
|
|
15,163
|
|
||||||
|
Ceding commissions
(2)
|
n/a
|
|
10,235
|
|
(3)
|
37,833
|
|
|||||
|
Profit commission
|
n/a
|
|
62,525
|
|
(3)
|
89,133
|
|
|||||
|
(1)
|
As of July 1, 2015, premiums are ceded on an earned and received basis as defined in our 2015 QSR Transaction.
|
|
(2)
|
Ceding commissions are reported within Other underwriting and operating expenses, net on the consolidated statements of operations.
|
|
(3)
|
The year ended December 31, 2015 includes the non-recurring impact of commuting our 2013 QSR Transaction. The commutation had no impact on ceded losses incurred.
|
Under the terms of 2015 QSR Transaction, reinsurance premiums, ceding commission and profit commission are settled net on a quarterly basis. The reinsurance premium due after deducting the related ceding commission and profit commission is reported within "Other liabilities" on the consolidated balance sheets.
The reinsurance recoverable on loss reserves related to our 2015 QSR Transaction was
$31.8 million
as of
December 31, 2016
and
$10.9 million
as of
December 31, 2015
. The reinsurance recoverable balance is secured by funds on deposit from the reinsurers which are based on the funding requirements of PMIERs that address ceded risk.
MGIC Investment Corporation 2016 Form 10-K
|
106
Captive reinsurance
In the past, MGIC also obtained captive reinsurance. In a captive reinsurance arrangement, the reinsurer is affiliated with the lender for whom MGIC provides mortgage insurance. As part of our settlement with the CFPB in 2013 and with the Minnesota Department of Commerce in 2015, MGIC has agreed to not enter into any new captive reinsurance agreement or reinsure any new loans under any existing captive reinsurance agreement for a period of
ten
years subsequent to the respective settlements. In accordance with the CFPB settlement, all of our active captive arrangements were placed into run-off. In addition, the GSEs will not approve any future reinsurance or risk sharing transaction with a mortgage enterprise or an affiliate of a mortgage enterprise.
The reinsurance recoverable on loss reserves related to captive agreements was
$19 million
at
December 31, 2016
which was supported by
$91 million
of trust assets, while at
December 31, 2015
the reinsurance recoverable on loss reserves related to captive agreements was
$34 million
which was supported by
$137 million
of trust assets. Each captive reinsurer is required to maintain a separate trust account to support its combined reinsured risk on all annual books. MGIC is the sole beneficiary of the trusts.
The pretax components of our other comprehensive (loss) income and related income tax benefit (expense) for the years ended
December 31, 2016
,
2015
and
2014
are included in the table below:
|
(In thousands)
|
2016
|
2015
|
2014
|
|||||||||
|
Net unrealized investment (losses) gains arising during the year
|
$
|
(5,425
|
)
|
$
|
(33,718
|
)
|
$
|
91,782
|
|
|||
|
Income tax benefit (expense)
|
1,776
|
|
11,738
|
|
(32,017
|
)
|
||||||
|
Valuation allowance
(1)
|
—
|
|
62,383
|
|
31,374
|
|
||||||
|
Net of taxes
|
(3,649
|
)
|
40,403
|
|
91,139
|
|
||||||
|
Net changes in benefit plan assets and obligations
|
(14,799
|
)
|
(12,818
|
)
|
(52,112
|
)
|
||||||
|
Income tax benefit
|
5,179
|
|
4,487
|
|
18,239
|
|
||||||
|
Valuation allowance
(1)
|
—
|
|
(7,383
|
)
|
(18,239
|
)
|
||||||
|
Net of taxes
|
(9,620
|
)
|
(15,714
|
)
|
(52,112
|
)
|
||||||
|
Net changes in unrealized foreign currency translation adjustment
|
(1,463
|
)
|
(5,699
|
)
|
(4,067
|
)
|
||||||
|
Income tax benefit
|
512
|
|
2,000
|
|
1,425
|
|
||||||
|
Valuation allowance
(1)
|
—
|
|
(529
|
)
|
—
|
|
||||||
|
Net of taxes
|
(951
|
)
|
(4,228
|
)
|
(2,642
|
)
|
||||||
|
Total other comprehensive (loss) income
|
(21,687
|
)
|
(52,235
|
)
|
35,603
|
|
||||||
|
Total income tax benefit, net of valuation allowance
|
7,467
|
|
72,696
|
|
782
|
|
||||||
|
Total other comprehensive (loss) income, net of tax
|
$
|
(14,220
|
)
|
$
|
20,461
|
|
$
|
36,385
|
|
|||
|
(1)
|
See
Note 12 – “Income Taxes”
for a discussion of the valuation allowance recorded against deferred tax assets.
|
107
|
MGIC Investment Corporation 2016 Form 10-K
The pretax and related income tax (expense) benefit components of the amounts reclassified from our accumulated other comprehensive loss to our consolidated statements of operations for the years ended
December 31, 2016
,
2015
and
2014
are included in the table below:
|
(In thousands)
|
2016
|
2015
|
2014
|
|||||||||
|
Reclassification adjustment for net realized gains (losses) included in net income
(1)
|
$
|
6,207
|
|
$
|
11,693
|
|
$
|
(6,816
|
)
|
|||
|
Income tax (expense) benefit
|
(2,050
|
)
|
(4,076
|
)
|
2,402
|
|
||||||
|
Valuation allowance
(2)
|
—
|
|
3,635
|
|
(2,502
|
)
|
||||||
|
Net of taxes
|
4,157
|
|
11,252
|
|
(6,916
|
)
|
||||||
|
Reclassification adjustment related to benefit plan assets and obligations
(3)
|
1,480
|
|
2,184
|
|
6,930
|
|
||||||
|
Income tax expense
|
(518
|
)
|
(764
|
)
|
(2,425
|
)
|
||||||
|
Valuation allowance
(2)
|
—
|
|
574
|
|
2,425
|
|
||||||
|
Net of taxes
|
962
|
|
1,994
|
|
6,930
|
|
||||||
|
Reclassification adjustment related to foreign currency
(4)
|
1,467
|
|
—
|
|
—
|
|
||||||
|
Income tax expense
|
(513
|
)
|
—
|
|
—
|
|
||||||
|
Net of taxes
|
954
|
|
—
|
|
—
|
|
||||||
|
Total reclassifications
|
9,154
|
|
13,877
|
|
114
|
|
||||||
|
Total income tax expense, net of valuation allowance
|
(3,081
|
)
|
(631
|
)
|
(100
|
)
|
||||||
|
Total reclassifications, net of tax
|
$
|
6,073
|
|
$
|
13,246
|
|
$
|
14
|
|
|||
|
(1)
|
Increases (decreases) Net realized investment gains on the consolidated statements of operations.
|
|
(2)
|
See
Note 12 – “Income Taxes”
for a discussion of the valuation allowance recorded against deferred tax assets.
|
|
(3)
|
Decreases (increases) Other underwriting and operating expenses, net on the consolidated statements of operations.
|
|
(4)
|
Increases (decreases) Other revenue on the consolidated statements of operations.
|
A rollforward of accumulated other comprehensive loss ("AOCL") for the years ended
December 31, 2016
,
2015
, and
2014
, including amounts reclassified from accumulated other comprehensive loss, are included in the table below.
|
(In thousands)
|
Net unrealized gains and losses on available-for-sale securities
|
|
Net benefit plan assets and obligations recognized in shareholders' equity
|
Net unrealized foreign currency translation
|
Total AOCL
|
|||||||||||
|
Balance, December 31, 2013, net of tax
|
$
|
(148,690
|
)
|
$
|
23,174
|
|
$
|
7,790
|
|
$
|
(117,726
|
)
|
||||
|
Other comprehensive income (loss) before reclassifications
|
84,223
|
|
(45,182
|
)
|
(2,642
|
)
|
36,399
|
|
||||||||
|
Less: Amounts reclassified from AOCL
|
(6,916
|
)
|
6,930
|
|
—
|
|
14
|
|
||||||||
|
Balance, December 31, 2014, net of tax
|
(57,551
|
)
|
(28,938
|
)
|
5,148
|
|
(81,341
|
)
|
||||||||
|
Other comprehensive income (loss) before reclassifications
|
51,655
|
|
(13,720
|
)
|
(4,228
|
)
|
33,707
|
|
||||||||
|
Less: Amounts reclassified from AOCL
|
11,252
|
|
1,994
|
|
—
|
|
13,246
|
|
||||||||
|
Balance, December 31, 2015, net of tax
|
(17,148
|
)
|
(44,652
|
)
|
920
|
|
(60,880
|
)
|
||||||||
|
Other comprehensive income (loss) before reclassifications
|
508
|
|
(8,658
|
)
|
3
|
|
(8,147
|
)
|
||||||||
|
Less: Amounts reclassified from AOCL
|
4,157
|
|
962
|
|
954
|
|
6,073
|
|
||||||||
|
Balance, December 31, 2016, net of tax
|
$
|
(20,797
|
)
|
$
|
(54,272
|
)
|
$
|
(31
|
)
|
(75,100
|
)
|
|||||
MGIC Investment Corporation 2016 Form 10-K
|
108
We have a non-contributory defined benefit pension plan covering substantially all domestic employees, as well as a supplemental executive retirement plan. We also offer both medical and dental benefits for retired domestic employees and their eligible spouses under a postretirement benefit plan. The following tables provide the components of aggregate annual net periodic benefit cost for each of the years ended
December 31, 2016
,
2015
, and
2014
and changes in the benefit obligation and the funded status of the pension, supplemental executive retirement and other postretirement benefit plans as recognized in the consolidated balance sheets as of
December 31, 2016
and
2015
.
|
Components of Net Periodic Benefit Cost
|
||||||||||||||||||||||||
|
|
Pension and Supplemental Executive Retirement Plans
|
Other Postretirement Benefits
|
||||||||||||||||||||||
|
(In thousands)
|
12/31/2016
|
12/31/2015
|
12/31/2014
|
12/31/2016
|
12/31/2015
|
12/31/2014
|
||||||||||||||||||
|
1. Company Service Cost
|
$
|
9,130
|
|
$
|
10,256
|
|
$
|
8,565
|
|
$
|
751
|
|
$
|
833
|
|
$
|
659
|
|
||||||
|
2. Interest Cost
|
15,906
|
|
15,847
|
|
15,987
|
|
704
|
|
697
|
|
653
|
|
||||||||||||
|
3. Expected Return on Assets
|
(19,508
|
)
|
(21,109
|
)
|
(21,030
|
)
|
(4,886
|
)
|
(4,991
|
)
|
(4,648
|
)
|
||||||||||||
|
4. Other Adjustments
|
—
|
|
—
|
|
—
|
|
—
|
|
—
|
|
—
|
|
||||||||||||
|
Subtotal
|
5,528
|
|
4,994
|
|
3,522
|
|
(3,431
|
)
|
(3,461
|
)
|
(3,336
|
)
|
||||||||||||
|
5. Amortization of :
|
|
|
|
|
|
|
|
|
|
|
|
|
||||||||||||
|
a. Net Transition Obligation/(Asset)
|
—
|
|
—
|
|
—
|
|
—
|
|
—
|
|
—
|
|
||||||||||||
|
b. Net Prior Service Cost/(Credit)
|
(687
|
)
|
(845
|
)
|
(930
|
)
|
(6,649
|
)
|
(6,649
|
)
|
(6,649
|
)
|
||||||||||||
|
c. Net Losses/(Gains)
|
5,856
|
|
5,485
|
|
1,083
|
|
—
|
|
(175
|
)
|
(435
|
)
|
||||||||||||
|
Total Amortization
|
5,169
|
|
4,640
|
|
153
|
|
(6,649
|
)
|
(6,824
|
)
|
(7,084
|
)
|
||||||||||||
|
6. Net Periodic Benefit Cost
|
10,697
|
|
9,634
|
|
3,675
|
|
(10,080
|
)
|
(10,285
|
)
|
(10,420
|
)
|
||||||||||||
|
7. Cost of settlements or curtailments
|
1,277
|
|
3,172
|
|
302
|
|
—
|
|
—
|
|
—
|
|
||||||||||||
|
8. Total Expense for Year
|
$
|
11,974
|
|
$
|
12,806
|
|
$
|
3,977
|
|
$
|
(10,080
|
)
|
$
|
(10,285
|
)
|
$
|
(10,420
|
)
|
||||||
|
Development of Funded Status
|
||||||||||||||||
|
|
Pension and Supplemental Executive Retirement Plans
|
Other Postretirement Benefits
|
||||||||||||||
|
(In thousands)
|
12/31/2016
|
12/31/2015
|
12/31/2016
|
12/31/2015
|
||||||||||||
|
Actuarial Value of Benefit Obligations
|
||||||||||||||||
|
1. Measurement Date
|
12/31/2016
|
|
12/31/2015
|
|
12/31/2016
|
|
12/31/2015
|
|
||||||||
|
2. Accumulated Benefit Obligation
|
$
|
360,423
|
|
$
|
338,450
|
|
$
|
17,378
|
|
$
|
16,423
|
|
||||
|
Funded Status/Asset (Liability) on the Consolidated Balance Sheet
|
||||||||||||||||
|
1. Projected Benefit Obligation
|
$
|
(369,808
|
)
|
$
|
(349,483
|
)
|
$
|
(17,378
|
)
|
$
|
(16,423
|
)
|
||||
|
2. Plan Assets at Fair Value
|
360,900
|
|
350,107
|
|
70,408
|
|
65,568
|
|
||||||||
|
3. Funded Status - Overfunded/Asset
|
N/A
|
|
$
|
624
|
|
$
|
53,030
|
|
$
|
49,145
|
|
|||||
|
4. Funded Status - Underfunded/Liability
|
(8,908
|
)
|
N/A
|
|
N/A
|
|
N/A
|
|
||||||||
|
Accumulated Other Comprehensive Income (Loss)
|
||||||||||||||||
|
|
Pension and Supplemental Executive Retirement Plans
|
Other Postretirement Benefits
|
||||||||||||||
|
(In thousands)
|
12/31/2016
|
12/31/2015
|
12/31/2016
|
12/31/2015
|
||||||||||||
|
1. Net Actuarial (Gain)/Loss
|
$
|
103,861
|
|
$
|
95,636
|
|
$
|
(6,088
|
)
|
$
|
(5,311
|
)
|
||||
|
2. Net Prior Service Cost/(Credit)
|
(2,286
|
)
|
(2,989
|
)
|
(11,991
|
)
|
(18,640
|
)
|
||||||||
|
3. Net Transition Obligation/(Asset)
|
—
|
|
—
|
|
—
|
|
—
|
|
||||||||
|
4. Total at Year End
|
$
|
101,575
|
|
$
|
92,647
|
|
$
|
(18,079
|
)
|
$
|
(23,951
|
)
|
||||
109
|
MGIC Investment Corporation 2016 Form 10-K
The amortization of gains and losses resulting from actual experience different from assumed experience or changes in assumptions including discount rates is included as a component of Net Periodic Benefit Cost/(Income) for the year. The gain or loss in excess of a
10%
corridor is amortized by the average remaining service period of participating employees expected to receive benefits under the plan.
The changes in the projected benefit obligation are as follows:
|
Change in Projected Benefit/Accumulated Benefit Obligation
|
||||||||||||||||
|
|
Pension and Supplemental Executive Retirement Plans
|
Other Postretirement Benefits
|
||||||||||||||
|
(In thousands)
|
12/31/2016
|
12/31/2015
|
12/31/2016
|
12/31/2015
|
||||||||||||
|
1. Benefit Obligation at Beginning of Year
|
$
|
349,483
|
|
$
|
379,324
|
|
$
|
16,423
|
|
$
|
18,225
|
|
||||
|
2. Company Service Cost
|
9,130
|
|
10,256
|
|
751
|
|
833
|
|
||||||||
|
3. Interest Cost
|
15,906
|
|
15,847
|
|
704
|
|
697
|
|
||||||||
|
4. Plan Participants' Contributions
|
—
|
|
—
|
|
408
|
|
361
|
|
||||||||
|
5. Net Actuarial (Gain)/Loss due to Assumption Changes
|
14,450
|
|
(24,118
|
)
|
497
|
|
(2,083
|
)
|
||||||||
|
6. Net Actuarial (Gain)/Loss due to Plan Experience
|
5,428
|
|
7,155
|
|
357
|
|
(397
|
)
|
||||||||
|
7. Benefit Payments from Fund
(1)
|
(21,831
|
)
|
(32,646
|
)
|
(1,678
|
)
|
(1,147
|
)
|
||||||||
|
8. Benefit Payments Directly by Company
|
(2,669
|
)
|
(7,661
|
)
|
—
|
|
—
|
|
||||||||
|
9. Plan Amendments
|
16
|
|
19
|
|
—
|
|
—
|
|
||||||||
|
10. Other Adjustment
|
(105
|
)
|
1,307
|
|
(84
|
)
|
(66
|
)
|
||||||||
|
11. Benefit Obligation at End of Year
|
$
|
369,808
|
|
$
|
349,483
|
|
$
|
17,378
|
|
$
|
16,423
|
|
||||
|
(1)
|
Includes lump sum payments of
$11.2 million
and
$22.4 million
in 2016 and 2015, respectively, from our pension plan to eligible participants, which were former employees with vested benefits.
|
The increase in our pension and supplemental executive retirement plans obligation in 2016 compare to 2015 was primarily due to a decrease in the discount rate used to calculate the obligation and a lower amount of benefits paid from the fund. The increase in our other postretirement plan obligation was primarily due a decrease in the discount rate used to calculate the obligation.
The changes in the fair value of the net assets available for plan benefits are as follows:
|
Change in Plan Assets
|
||||||||||||||||
|
|
Pension and Supplemental Executive Retirement Plans
|
Other Postretirement Benefits
|
||||||||||||||
|
(In thousands)
|
12/31/2016
|
12/31/2015
|
12/31/2016
|
12/31/2015
|
||||||||||||
|
1. Fair Value of Plan Assets at Beginning of Year
|
$
|
350,107
|
|
$
|
378,701
|
|
$
|
65,568
|
|
$
|
66,940
|
|
||||
|
2. Company Contributions
|
11,369
|
|
17,311
|
|
—
|
|
—
|
|
||||||||
|
3. Plan Participants' Contributions
|
—
|
|
—
|
|
408
|
|
361
|
|
||||||||
|
4. Benefit Payments from Fund
|
(21,831
|
)
|
(32,646
|
)
|
(1,678
|
)
|
(1,147
|
)
|
||||||||
|
5. Benefit Payments paid directly by Company
|
(2,669
|
)
|
(7,661
|
)
|
—
|
|
—
|
|
||||||||
|
6. Actual Return on Assets
|
23,924
|
|
(5,094
|
)
|
6,518
|
|
(225
|
)
|
||||||||
|
7. Other Adjustment
|
—
|
|
(504
|
)
|
(408
|
)
|
(361
|
)
|
||||||||
|
8. Fair Value of Plan Assets at End of Year
|
$
|
360,900
|
|
$
|
350,107
|
|
$
|
70,408
|
|
$
|
65,568
|
|
||||
MGIC Investment Corporation 2016 Form 10-K
|
110
|
Change in Accumulated Other Comprehensive Income (Loss) ("AOCI")
|
||||||||||||||||
|
|
Pension and Supplemental Executive Retirement Plans
|
Other Postretirement Benefits
|
||||||||||||||
|
(In thousands)
|
12/31/2016
|
12/31/2015
|
12/31/2016
|
12/31/2015
|
||||||||||||
|
1. AOCI in Prior Year
|
$
|
92,647
|
|
$
|
89,390
|
|
$
|
(23,951
|
)
|
$
|
(33,511
|
)
|
||||
|
2. Increase/(Decrease) in AOCI
|
|
|
|
|
|
|
|
|
||||||||
|
a. Recognized during year - Prior Service (Cost)/Credit
|
687
|
|
845
|
|
6,649
|
|
6,649
|
|
||||||||
|
b. Recognized during year - Net Actuarial (Losses)/Gains
|
(5,856
|
)
|
(5,485
|
)
|
—
|
|
175
|
|
||||||||
|
c. Occurring during year - Prior Service Cost
|
16
|
|
19
|
|
—
|
|
—
|
|
||||||||
|
d. Occurring during year - Net Actuarial Losses/(Gains)
|
15,358
|
|
11,050
|
|
(777
|
)
|
2,736
|
|
||||||||
|
e. Occurring during year - Net Settlement Losses/(Gains)
|
(1,277
|
)
|
(3,172
|
)
|
—
|
|
—
|
|
||||||||
|
f. Other adjustments
|
—
|
|
—
|
|
—
|
|
—
|
|
||||||||
|
3. AOCI in Current Year
|
$
|
101,575
|
|
$
|
92,647
|
|
$
|
(18,079
|
)
|
$
|
(23,951
|
)
|
||||
|
Amortizations Expected to be Recognized During Next Fiscal Year Ending
|
||||||||
|
Pension and Supplemental Executive Retirement Plans
|
Other Postretirement Benefits
|
|||||||
|
(In thousands)
|
12/31/2017
|
12/31/2017
|
||||||
|
1. Amortization of Net Transition Obligation/(Asset)
|
$
|
—
|
|
$
|
—
|
|
||
|
2. Amortization of Prior Service Cost/(Credit)
|
(428
|
)
|
(6,649
|
)
|
||||
|
3. Amortization of Net Losses/(Gains)
|
6,141
|
|
—
|
|
||||
The projected benefit obligations, net periodic benefit costs and accumulated postretirement benefit obligation for the plans were determined using the following weighted average assumptions.
|
Actuarial Assumptions
|
|||||||||||
|
|
Pension and Supplemental Executive Retirement Plans
|
Other Postretirement Benefits
|
|||||||||
|
|
12/31/2016
|
12/31/2015
|
12/31/2016
|
12/31/2015
|
|||||||
|
Weighted-Average Assumptions Used to Determine
|
|||||||||||
|
Benefit Obligations at year end
|
|||||||||||
|
1. Discount Rate
|
4.30
|
%
|
4.65
|
%
|
3.95
|
%
|
4.30
|
%
|
|||
|
2. Rate of Compensation Increase
|
3.00
|
%
|
3.00
|
%
|
N/A
|
|
N/A
|
|
|||
|
Weighted-Average Assumptions Used to Determine
|
|
|
|
|
|
|
|
|
|||
|
Net Periodic Benefit Cost for Year
|
|
|
|
|
|
|
|
|
|||
|
1. Discount Rate
|
4.65
|
%
|
4.25
|
%
|
4.30
|
%
|
4.00
|
%
|
|||
|
2. Expected Long-term Return on Plan Assets
|
5.75
|
%
|
5.75
|
%
|
7.50
|
%
|
7.50
|
%
|
|||
|
3. Rate of Compensation Increase
|
3.00
|
%
|
3.00
|
%
|
N/A
|
|
N/A
|
|
|||
|
Assumed Health Care Cost Trend Rates at year end
|
|
|
|
|
|
|
|
|
|||
|
1. Health Care Cost Trend Rate Assumed for Next Year
|
N/A
|
|
N/A
|
|
6.50
|
%
|
7.00
|
%
|
|||
|
2. Rate to Which the Cost Trend Rate is Assumed to Decline (Ultimate Trend Rate)
|
N/A
|
|
N/A
|
|
5.00
|
%
|
5.00
|
%
|
|||
|
3. Year That the Rate Reaches the Ultimate Trend Rate
|
N/A
|
|
N/A
|
|
2020
|
|
2020
|
|
|||
111
|
MGIC Investment Corporation 2016 Form 10-K
In selecting a discount rate, we performed a hypothetical cash flow bond matching exercise, matching our expected pension plan and postretirement medical plan cash flows, respectively, against a selected portfolio of high quality corporate bonds. The modeling was performed using a bond portfolio of noncallable bonds with at least
$50 million
outstanding. The average yield of these hypothetical bond portfolios was used as the benchmark for determining the discount rate. In selecting the expected long-term rate of return on assets, we considered the average rate of earnings expected on the classes of funds invested or to be invested to provide for the benefits of these plans. This included considering the trusts' targeted asset allocation for the year and the expected returns likely to be earned over the next
20 years
.
The year-end asset allocations of the plans are as follows:
|
Plan Assets
|
|||||||||||
|
|
Pension Plan
|
Other Postretirement Benefits
|
|||||||||
|
|
12/31/2016
|
12/31/2015
|
12/31/2016
|
12/31/2015
|
|||||||
|
1. Equity Securities
|
23
|
%
|
20
|
%
|
100
|
%
|
100
|
%
|
|||
|
2. Debt Securities
|
77
|
%
|
80
|
%
|
—
|
%
|
—
|
%
|
|||
|
3. Total
|
100
|
%
|
100
|
%
|
100
|
%
|
100
|
%
|
|||
In accordance with fair value guidance, we applied the following fair value hierarchy in order to measure fair value of our benefit plan assets:
Level 1 – Quoted prices for identical instruments in active markets that we can access. Financial assets utilizing Level 1 inputs include equity securities, mutual funds, money market funds, certain U.S. Treasury securities and exchange traded funds ("ETFs").
Level 2 – Quoted prices for similar instruments in active markets; quoted prices for identical or similar instruments in markets that are not active; and inputs, other than quoted prices, that are observable in the marketplace for the instrument. The observable inputs are used in valuation models to calculate the fair value of the instruments. Financial assets utilizing Level 2 inputs include certain municipal, corporate and foreign bonds, obligations of U.S. government corporations and agencies, and pooled equity accounts.
To determine the fair value of securities in Level 1 and Level 2 of the fair value hierarchy, independent pricing sources have been utilized. One price is provided per security based on observable market data. To ensure securities are appropriately classified in the fair value hierarchy, we review the pricing techniques and methodologies of the independent pricing sources and believe that their policies adequately consider market activity, either based on
specific transactions for the issue valued or based on modeling of securities with similar credit quality, duration, yield and structure that were recently traded. A variety of inputs are utilized by the independent pricing sources including benchmark yields, reported trades, non-binding broker/dealer quotes, issuer spreads, two sided markets, benchmark securities, bids, offers and reference data including market research publications. Inputs may be weighted differently for any security, and not all inputs are used for each security evaluation. Market indicators, industry and economic events are also considered. This information is evaluated using a multidimensional pricing model. In addition, on a quarterly basis, we perform quality controls over values received from the pricing source (the “Trustee”) which include comparing values to other independent pricing sources. In addition, we review annually the Trustee’s auditor’s report on internal controls in order to determine that their controls around valuing securities are operating effectively. We have not made any adjustments to the prices obtained from the independent sources.
The following table sets forth by level, within the fair value hierarchy, the pension plan assets at fair value as of
December 31, 2016
and
2015
. There were no securities that utilized Level 3 inputs.
|
Pension Plan
|
||||||||||||
|
Assets at Fair Value as of December 31, 2016
|
||||||||||||
|
(In thousands)
|
Level 1
|
Level 2
|
Total
|
|||||||||
|
Domestic Mutual Funds
|
$
|
11,805
|
|
$
|
—
|
|
$
|
11,805
|
|
|||
|
Corporate Bonds
|
—
|
|
178,412
|
|
178,412
|
|
||||||
|
U.S. Government Securities
|
6,761
|
|
354
|
|
7,115
|
|
||||||
|
Municipal Bonds
|
—
|
|
63,492
|
|
63,492
|
|
||||||
|
Foreign Bonds
|
—
|
|
27,917
|
|
27,917
|
|
||||||
|
ETFs
|
5,694
|
|
—
|
|
5,694
|
|
||||||
|
Pooled Equity Accounts
|
—
|
|
66,465
|
|
66,465
|
|
||||||
|
Total Assets at fair value
|
$
|
24,260
|
|
$
|
336,640
|
|
$
|
360,900
|
|
|||
|
Pension Plan
|
||||||||||||
|
Assets at Fair Value as of December 31, 2015
|
||||||||||||
|
(In thousands)
|
Level 1
|
Level 2
|
Total
|
|||||||||
|
Domestic Mutual Funds
|
$
|
1,442
|
|
$
|
—
|
|
$
|
1,442
|
|
|||
|
Corporate Bonds
|
—
|
|
188,332
|
|
188,332
|
|
||||||
|
U.S. Government Securities
|
3,133
|
|
497
|
|
3,630
|
|
||||||
|
Municipal Bonds
|
—
|
|
61,206
|
|
61,206
|
|
||||||
|
Foreign Bonds
|
—
|
|
25,251
|
|
25,251
|
|
||||||
|
ETFs
|
5,676
|
|
—
|
|
5,676
|
|
||||||
|
Pooled Equity Accounts
|
—
|
|
64,570
|
|
64,570
|
|
||||||
|
Total Assets at fair value
|
$
|
10,251
|
|
$
|
339,856
|
|
$
|
350,107
|
|
|||
MGIC Investment Corporation 2016 Form 10-K
|
112
The pension plan has implemented a strategy to reduce risk through the use of a targeted funded ratio. The liability driven component is key to the asset allocation. The liability driven component seeks to align the duration of the fixed income asset allocation with the expected duration of the plan liabilities or benefit payments. Overall asset allocation is dynamic and specifies target allocation weights and ranges based on the funded status.
An improvement in funded status results in the de-risking of the portfolio, allocating more funds to fixed income and less to equity. A decline in funded status would result in a higher allocation to equity. The maximum equity allocation is
40%
.
The equity investments utilize combinations of mutual funds, ETFs, and pooled equity account structures focused on the following strategies:
|
Strategy
|
Objective
|
Investment types
|
|||
|
Return seeking growth
|
Funded ratio improvement over the long term
|
●
|
Global quality growth
|
||
|
●
|
Global low volatility
|
||||
|
Return seeking bridge
|
Downside protection in the event of a declining equity market
|
●
|
Enduring asset
|
||
|
●
|
Durable company
|
||||
The fixed income objective is to preserve capital and to provide monthly cash flows for the payment of plan liabilities. Fixed income investments can include government, government agency, corporate, mortgage-backed, asset-backed, and municipal securities, and other classes of bonds. The duration of the fixed income portfolio has an objective of being within
one year
of the duration of the accumulated benefit obligation. The fixed income investments have an objective of a weighted average credit of A3/A-/A- by Moody’s, S&P, and Fitch, respectively.
The following table sets forth the other postretirement benefits plan assets at fair value as of
December 31, 2016
and
2015
. All are Level 1 assets.
|
Other Postretirement Benefits Plan
|
||||||||
|
Assets at Fair Value as of December 31, 2016
|
||||||||
|
(In thousands)
|
Level 1
|
Total
|
||||||
|
Domestic Mutual Funds
|
$
|
54,426
|
|
$
|
54,426
|
|
||
|
International Mutual Funds
|
15,982
|
|
15,982
|
|
||||
|
Total Assets at fair value
|
$
|
70,408
|
|
$
|
70,408
|
|
||
|
Other Postretirement Benefits Plan
|
||||||||
|
Assets at Fair Value as of December 31, 2015
|
||||||||
|
(In thousands)
|
Level 1
|
Total
|
||||||
|
Domestic Mutual Funds
|
$
|
49,887
|
|
$
|
49,887
|
|
||
|
International Mutual Funds
|
15,681
|
|
15,681
|
|
||||
|
Total Assets at fair value
|
$
|
65,568
|
|
$
|
65,568
|
|
||
Our postretirement plan portfolio is designed to achieve the following objectives over each market cycle and for at least 5 years:
|
•
|
Total return should exceed growth in the Consumer Price Index by
5.75%
annually
|
|
•
|
Achieve competitive investment results
|
The primary focus in developing asset allocation ranges for the portfolio is the assessment of the portfolio's investment objectives and the level of risk that is acceptable to obtain those objectives. To achieve these goals the minimum and maximum allocation ranges for fixed income securities and equity securities are:
|
|
Minimum
|
Maximum
|
|||
|
Equities (long only)
|
70
|
%
|
100
|
%
|
|
|
Real estate
|
0
|
%
|
15
|
%
|
|
|
Commodities
|
0
|
%
|
10
|
%
|
|
|
Fixed income/Cash
|
0
|
%
|
10
|
%
|
|
Given the long term nature of this portfolio and the lack of any immediate need for significant cash flow, it is anticipated that the equity investments will consist of growth stocks and will typically be at the higher end of the allocation ranges above.
Investment in international mutual funds is limited to a maximum of
30%
of the equity range. The allocation as of
December 31, 2016
included
3%
that was primarily invested in equity securities of emerging market countries and another
20%
was invested in securities of companies primarily based in Europe and the Pacific Basin.
The following tables show the current and estimated future contributions and benefit payments.
|
Company Contributions
|
||||||||
|
|
Pension and Supplemental Executive Retirement Plans
|
Other Postretirement Benefits
|
||||||
|
(In thousands)
|
12/31/2016
|
12/31/2016
|
||||||
|
Company Contributions for the Year Ending:
|
||||||||
|
1. Current
|
$
|
11,369
|
|
$
|
—
|
|
||
|
2. Current + 1
|
9,500
|
|
—
|
|
||||
113
|
MGIC Investment Corporation 2016 Form 10-K
|
Benefit Payments (Total)
|
||||||||
|
|
Pension and Supplemental Executive Retirement Plans
|
Other Postretirement Benefits
|
||||||
|
(In thousands)
|
12/31/2016
|
12/31/2016
|
||||||
|
Actual Benefit Payments for the Year Ending:
|
||||||||
|
1. Current
|
$
|
24,500
|
|
$
|
1,355
|
|
||
|
Expected Benefit Payments for the Year Ending:
|
|
|
|
|
||||
|
2. Current + 1
|
21,831
|
|
847
|
|
||||
|
3. Current + 2
|
23,439
|
|
978
|
|
||||
|
4. Current + 3
|
26,927
|
|
1,068
|
|
||||
|
5. Current + 4
|
27,199
|
|
1,257
|
|
||||
|
6. Current + 5
|
27,151
|
|
1,410
|
|
||||
|
7. Current + 6 - 10
|
146,471
|
|
8,574
|
|
||||
Health care sensitivities
For measurement purposes, a
7.0%
health care trend rate was used for benefits for retirees before they reach age
65 years
for 2016. In 2017, the rate is assumed to be
6.5%
, decreasing to
5.0%
by 2020 and remaining at this level beyond.
Assumed health care cost trend rates have a significant effect on the amounts reported for the other postretirement benefits plan. A
1 percentage
point change in the health care trend rate assumption would have the following effects on other postretirement benefits:
|
(In thousands)
|
1-Percentage
Point Increase
|
1-Percentage
Point Decrease
|
||||||
|
Effect on total service and interest cost components
|
$
|
237
|
|
$
|
(205
|
)
|
||
|
Effect on postretirement benefit obligation
|
2,382
|
|
(2,102
|
)
|
||||
Profit sharing and 401(k)
We have a profit sharing and 401(k) savings plan for employees. At the discretion of the Board of Directors, we may make a contribution of up to
5%
of each participant's eligible compensation. We provide a matching 401(k) savings contribution for employees on their before-tax contributions at a rate of
80%
of the first
$1,000
contributed and
40%
of the next
$2,000
contributed. For employees hired after January 1, 2014, the match is
100%
up to
4%
contributed. We recognized expenses related to these plans of
$5.9 million
,
$5.1 million
and
$5.0 million
in
2016
,
2015
and
2014
, respectively.
Net deferred tax assets and liabilities as of
December 31, 2016
and
2015
are as follows:
|
(In thousands)
|
2016
|
2015
|
||||||
|
Total deferred tax assets
|
$
|
636,449
|
|
$
|
791,286
|
|
||
|
Total deferred tax liabilities
|
(28,794
|
)
|
(29,206
|
)
|
||||
|
Net deferred tax asset
|
$
|
607,655
|
|
$
|
762,080
|
|
||
The components of the net deferred tax asset as of
December 31, 2016
and
2015
are as follows:
|
(In thousands)
|
2016
|
2015
|
||||||
|
Unearned premium reserves
|
$
|
40,153
|
|
$
|
33,262
|
|
||
|
Benefit plans
|
(12,350
|
)
|
(14,283
|
)
|
||||
|
Federal net operating loss
|
520,812
|
|
680,975
|
|
||||
|
Loss reserves
|
10,883
|
|
15,536
|
|
||||
|
Unrealized depreciation in investments
|
11,211
|
|
8,904
|
|
||||
|
Mortgage investments
|
17,751
|
|
17,386
|
|
||||
|
Deferred compensation
|
12,517
|
|
12,927
|
|
||||
|
Other, net
|
6,678
|
|
7,373
|
|
||||
|
Net deferred tax asset
|
607,655
|
|
762,080
|
|
||||
We review the need to maintain a deferred tax asset valuation allowance on a quarterly basis. We analyze several factors, among which are the severity and frequency of operating losses, our capacity for the carryback or carryforward of any losses, the existence and current level of taxable operating income, operating results on a three year cumulative basis, the expected occurrence of future income or loss, the expiration dates of the carryforwards, the cyclical nature of our operating results, and available tax planning strategies. Based on our analysis, we reduced our benefit from income tax through the recognition of a valuation allowance from the first quarter of 2009 through the second quarter of 2015.
In the third quarter of 2015, we concluded that it was more likely than not that our deferred tax assets would be fully realizable and that the valuation allowance was no longer necessary and we reversed the valuation allowance. For the year ended December 31, 2015, we reversed
$161.1 million
of our valuation allowance based on income from 2015. The portion of the valuation allowance reversed related to deferred tax assets that are expected to be realized in future years, totaling
$747.5 million
, is treated as a discrete period item and is recognized as a component of the tax provision in continuing operations in the period of release. Furthermore, in determining the discrete period impact from the reversal, we removed the prior period disproportionate tax effects that had arisen in other comprehensive income because of the valuation allowance. This reduced the amount of tax benefit included in net income and resulted
MGIC Investment Corporation 2016 Form 10-K
|
114
in an allocation of tax benefit of
$60.8 million
to components of other comprehensive income.
The following table provides a rollforward of our deferred tax asset valuation allowance for the year ended December 31, 2015.
|
(In millions)
|
For the year ended December 31, 2015
|
|||
|
Balance at December 31, 2014
|
$
|
902.3
|
|
|
|
Reduction in tax provision in current year
|
(161.1
|
)
|
||
|
Amounts recorded in other comprehensive income in the current year
|
6.3
|
|
||
|
Change in valuation allowance for deferred tax assets in the current year
|
(154.8
|
)
|
||
|
Reduction in tax provision for amounts to be realized in future years
|
(686.7
|
)
|
||
|
Amounts recorded in other comprehensive income to be realized in future years
|
(60.8
|
)
|
||
|
Change in valuation allowance for deferred tax assets realizable in future years
|
(747.5
|
)
|
||
|
Balance at December 31, 2015
|
$
|
—
|
|
|
The effect of the change in valuation allowance on the provision for (benefit from) income taxes was as follows:
|
(In thousands)
|
2016
|
2015
|
2014
|
|||||||||
|
Provision for income taxes before valuation allowance
|
$
|
172,197
|
|
$
|
163,497
|
|
$
|
91,607
|
|
|||
|
Change in valuation allowance
|
—
|
|
(161,158
|
)
|
(88,833
|
)
|
||||||
|
Reversal of the valuation allowance
|
—
|
|
(686,652
|
)
|
—
|
|
||||||
|
Provision for (benefit from) income taxes
|
$
|
172,197
|
|
$
|
(684,313
|
)
|
$
|
2,774
|
|
|||
The total valuation allowance as of December 31, 2014 was
$902.3 million
. The remaining valuation allowance was reversed in the third quarter of 2015. The change in the valuation allowance that was included in other comprehensive income was a decrease of
$54.5 million
, and
$13.1 million
for the years ended December 31,
2015
and
2014
, respectively.
Giving full effect to the carryback of net operating losses for federal income tax purposes, we have approximately
$1,489 million
of net operating loss ("NOL") carryforwards on a regular tax basis and
$589 million
of net operating loss carryforwards for computing the alternative minimum tax as of
December 31, 2016
. Any unutilized carryforwards are scheduled to expire at the end of tax years 2030 through 2033.
The following summarizes the components of the provision for (benefit from) income taxes:
|
(In thousands)
|
2016
|
2015
|
2014
|
|||||||||
|
Current Federal
|
$
|
9,470
|
|
$
|
8,067
|
|
$
|
2,391
|
|
|||
|
Deferred Federal
|
160,657
|
|
(686,652
|
)
|
1
|
|
||||||
|
Other
|
2,070
|
|
(5,728
|
)
|
382
|
|
||||||
|
Provision for (benefit from) income taxes
|
$
|
172,197
|
|
$
|
(684,313
|
)
|
$
|
2,774
|
|
|||
We paid
$4.5 million
,
$5.4 million
, and
$1.3 million
in federal income tax in
2016
,
2015
and
2014
, respectively.
The reconciliation of the federal statutory income tax rate to the effective tax provision (benefit) rate is as follows:
|
|
2016
|
2015
|
2014
|
|||||
|
Federal statutory income tax rate
|
35.0
|
%
|
35.0
|
%
|
35.0
|
%
|
||
|
Valuation allowance
|
—
|
%
|
(173.8
|
)%
|
(34.9
|
)%
|
||
|
Tax exempt municipal bond interest
|
(1.9
|
)%
|
(0.8
|
)%
|
(0.4
|
)%
|
||
|
Other, net
|
0.4
|
%
|
(0.7
|
)%
|
1.4
|
%
|
||
|
Effective tax provision (benefit) rate
|
33.5
|
%
|
(140.3
|
)%
|
1.1
|
%
|
||
As previously disclosed, the Internal Revenue Service ("IRS") completed examinations of our federal income tax returns for the years 2000 through 2007 and issued proposed assessments for taxes, interest and penalties related to our treatment of the flow-through income and loss from an investment in a portfolio of residual interests of Real Estate Mortgage Investment Conduits ("REMICs"). The IRS indicated that it did not believe that, for various reasons, we had established sufficient tax basis in the REMIC residual interests to deduct the losses from taxable income. We appealed these assessments within the IRS and in August 2010, we reached a tentative settlement agreement with the IRS which was not finalized.
In 2014, we received Notices of Deficiency (commonly referred to as “
90 day letters
”) covering the 2000-2007 tax years. The Notices of Deficiency reflect taxes and penalties related to the REMIC matters of
$197.5 million
and at
December 31, 2016
, there would also be interest related to these matters of approximately
$200.6 million
. In 2007, we made a payment of
$65.2 million
to the United States Department of the Treasury which will reduce any amounts we would ultimately owe. The Notices of Deficiency also reflect additional amounts due of
$261.4 million
, which are primarily associated with the disallowance of the carryback of the 2009 net operating loss to the 2004-2007 tax years. We believe the IRS included the carryback adjustments as a precaution to keep open the statute of limitations on collection of the tax that was refunded when this loss was
115
|
MGIC Investment Corporation 2016 Form 10-K
carried back, and not because the IRS actually intends to disallow the carryback permanently. Depending on the outcome of this matter, additional state income taxes and state interest may become due when a final resolution is reached. As of
December 31, 2016
, those state taxes and interest would approximate
$50.7 million
. In addition, there could also be state tax penalties. Our total amount of unrecognized tax benefits as of
December 31, 2016
is
$108.2 million
, which represents the tax benefits generated by the REMIC portfolio included in our tax returns that we have not taken benefit for in our financial statements, including any related interest.
We filed a petition with the U.S. Tax Court contesting most of the IRS’ proposed adjustments reflected in the Notices of Deficiency and the IRS filed an answer to our petition which continued to assert their claim. The case has twice been scheduled for trial and in each instance, the parties jointly filed, and the U.S. Tax Court approved (most recently in February 2016), motions for continuance to postpone the trial date. Also in February 2016, the U.S. Tax Court approved a joint motion to consolidate for trial, briefing, and opinion, our case with similar cases of Radian Group, Inc., as successor to Enhance Financial Services Group, Inc., et al. In January 2017, the parties informed the Tax Court that they had reached a basis for settlement of the major issues in the case. Any agreed settlement terms will ultimately be subject to review by the Joint Committee on Taxation ("JCT") before a settlement can be completed and there is no assurance that a settlement will be completed. Based on information that we currently have regarding the status of our ongoing dispute, we expect to record a provision for additional taxes and interest of
$15
to
$25 million
in the first quarter of 2017.
Should a settlement not be completed, ongoing litigation to resolve our dispute with the IRS could be lengthy and costly in terms of legal fees and related expenses. We would need to make further adjustments, which could be material, to our tax provision and liabilities if our view of the probability of success in this matter changes, and the ultimate resolution of this matter could have a material negative impact on our effective tax rate, results of operations, cash flows, available assets and statutory capital. In this regard, see Note 14 - "Statutory Information."
In October 2014, we received a Revenue Agent’s Report from the IRS related to the examination of our federal income tax returns for the years 2011 and 2012. The result of this examination had no material effect on the financial statements.
Under current guidance, when evaluating a tax position for recognition and measurement, an entity shall presume that the tax position will be examined by the relevant taxing authority that has full knowledge of all relevant information. The interpretation adopts a benefit recognition model with
a two-step approach, a more-likely-than-not threshold for recognition and derecognition, and a measurement attribute that is the greatest amount of benefit that is cumulatively greater than
50%
likely of being realized. A reconciliation of the beginning and ending amount of unrecognized tax benefits is as follows:
|
(In thousands)
|
2016
|
2015
|
2014
|
|||||||||
|
Balance at beginning of year
|
$
|
107,120
|
|
$
|
106,230
|
|
$
|
105,366
|
|
|||
|
Additions based on tax positions related to the current year
|
—
|
|
—
|
|
—
|
|
||||||
|
Additions for tax positions of prior years
|
1,125
|
|
890
|
|
864
|
|
||||||
|
Reductions for tax positions of prior years
|
—
|
|
—
|
|
—
|
|
||||||
|
Settlements
|
—
|
|
—
|
|
—
|
|
||||||
|
Balance at end of year
|
$
|
108,245
|
|
$
|
107,120
|
|
$
|
106,230
|
|
|||
The total amount of the unrecognized tax benefits, related to our aforementioned REMIC issue, which would affect our effective tax rate, is
$94.6 million
. We recognize interest accrued and penalties related to unrecognized tax benefits in income taxes. During 2016, we recognized
$1.1 million
in interest. As of
December 31, 2016
and
2015
, we had
$28.9 million
and
$27.8 million
of accrued interest related to uncertain tax positions, respectively. The statute of limitations related to the consolidated federal income tax return is closed for all years prior to 2000. It is reasonably possible that our 2000-2007 federal tax case will be resolved, other than through litigation. If it is resolved under the basis of settlement as disclosed above, our total unrecognized tax benefits would be reduced by
$108.2 million
during 2017. After taking into account prior payments and the effect of available net operating loss carrybacks, any net cash outflows would approximate
$52 million
.
As described in
Note 7 - "Debt"
, we entered into privately negotiated agreements to repurchase, for cash, together with, in certain cases, shares of our common stock,
$292.4 million
aggregate principal amount of our outstanding
2%
Notes. We issued approximately
18.3 million
shares of our common stock as partial consideration under these agreements. As of
December 31, 2016
we have repurchased all of the shares issued as partial consideration for our
2%
Notes repurchases. The weighted average price paid for the share repurchases was
$8.03
, which includes commissions, and the aggregate purchase amount was
$147.1 million
.
As described in
Note 7 - "Debt"
the purchase of a portion of our
9%
Debentures by MGIC, and corresponding elimination of the purchased
9%
Debentures in consolidation, resulted in a reduction to our consolidated shareholders' equity of
MGIC Investment Corporation 2016 Form 10-K
|
116
approximately
$6.3 million
as of
December 31, 2016
. This reduction represents the allocated portion of the consideration paid to reacquire the equity component of the
9%
Debentures, net of tax. The reduction was recognized in paid-in capital and was less than the amount ascribed to paid-in capital at original issuance of the
9%
Debentures.
Our Amended and Restated Rights Agreement dated
July 23, 2015
seeks to diminish the risk that our ability to use our NOLs to reduce potential future federal income tax obligations may become substantially limited and to deter certain abusive takeover practices. The benefit of the NOLs would be substantially limited, and the timing of the usage of the NOLs could be substantially delayed, if we were to experience an “ownership change” as defined by Section 382 of the Internal Revenue Code.
Under the Agreement each outstanding share of our Common Stock is accompanied by
one
Right. The Distribution Date occurs on the earlier of
ten
days after a public announcement that a person has become an Acquiring Person, or
ten
business days after a person announces or begins a tender offer in which consummation of such offer would result in a person becoming an Acquiring Person. An Acquiring Person is any person that becomes, by itself or together with its affiliates and associates, a beneficial owner of
5%
or more of the shares of our Common Stock then outstanding, but excludes, among others, certain exempt and grandfathered persons as defined in the Agreement. The Rights are not exercisable until the Distribution Date. Each Right will initially entitle shareholders to buy one-tenth of one share of our Common Stock at a Purchase Price of
$45
per full share (equivalent to
$4.50
for each one-tenth share), subject to adjustment. Each exercisable Right (subject to certain limitations) will entitle its holder to purchase, at the Rights’ then-current Purchase Price, a number of our shares of Common Stock (or if after the Shares Acquisition Date, we are acquired in a business combination, common shares of the acquiror) having a market value at the time equal to twice the Purchase Price. The Rights will expire on
August 1, 2018
, or earlier as described in the Agreement. The Rights are redeemable at a price of
$0.001
per Right at any time prior to the time a person becomes an Acquiring Person. Other than certain amendments, the Board of Directors may amend the Rights in any respect without the consent of the holders of the Rights.
Statutory Accounting Principles
The statutory financial statements of our insurance companies are presented on the basis of accounting practices prescribed or permitted by the Office of the Commissioner of Insurance of the State of Wisconsin (the "OCI"), which has adopted the National Association of
Insurance Commissioners ("NAIC") statutory accounting practices as the basis of its statutory accounting practices ("SSAP"). In converting from statutory to GAAP, typical adjustments include deferral of policy acquisition costs, the inclusion of net unrealized holding gains or losses in shareholders' equity relating to fixed maturities and the inclusion of statutory non-admitted assets.
In addition to the typical adjustments from statutory to GAAP, mortgage insurance companies are required to maintain contingency loss reserves equal to
50%
of premiums earned under SSAP and practices prescribed by the OCI, Such amounts cannot be withdrawn for a period of
ten years
except as permitted by insurance regulations. With regulatory approval a mortgage guaranty insurance company may make early withdrawals from the contingency reserve when incurred losses exceed
35%
of net premiums earned in a calendar year. For the year ended
2016
, MGIC's losses incurred were
26%
of net premiums earned. Changes in contingency loss reserves impact the statutory statement of operations. Contingency loss reserves are not reflected as liabilities under GAAP and changes in contingency loss reserves do not impact the GAAP statements of operations. A premium deficiency reserve that may be recorded on a GAAP basis when the present value of expected future losses and expenses exceeds the present value of expected future premiums and already established loss reserves, may not be recorded on a statutory basis if the present value of expected future premiums and already established loss reserves and statutory contingency reserves, exceeds the present value of expected future losses and expenses. On a GAAP basis, when calculating a premium deficiency reserve policies are grouped based on how they are acquired, serviced and measured. On a statutory basis, a premium deficiency reserve is calculated on all policies in force.
The statutory net income (loss), policyholders' surplus and contingency reserve liability of the insurance subsidiaries of our holding company are show in the following table. The statutory net loss in 2015 was driven by the dissolution of an MGIC non-insurance subsidiary. The surplus amounts included in the following table are the combined policyholders' surplus of our insurance operations as utilized in our risk-to-capital calculations.
|
As of and for the Years Ended December 31,
|
||||||||||||
|
(In thousands)
|
2016
|
2015
|
2014
|
|||||||||
|
Statutory net income (loss)
|
$
|
106,326
|
|
$
|
(72,767
|
)
|
(1)
|
$
|
13,203
|
|
||
|
Statutory policyholders' surplus
|
1,506,475
|
|
1,608,214
|
|
(1)
|
1,585,164
|
|
|||||
|
Contingency reserve
|
1,360,088
|
|
826,706
|
|
318,247
|
|
||||||
|
(1)
|
The dissolution of an MGIC non-insurance subsidiary in 2015 had no impact on statutory surplus as the equity value
|
117
|
MGIC Investment Corporation 2016 Form 10-K
of the investment was fully reflected in surplus as an unrealized loss prior to 2015.
The surplus contributions made to MGIC and dividends paid by MGIC and distributions from other insurance subsidiaries to us, are shown in the table below.
|
Years Ended December 31,
|
||||||||||
|
(In thousands)
|
2016
|
2015
|
2014
|
|||||||
|
Additions to the surplus of MGIC from parent company funds
|
$
|
36,025
|
|
—
|
|
—
|
|
|||
|
Dividends paid by MGIC to the parent company
|
$
|
64,000
|
|
—
|
|
—
|
|
|||
|
Distributions from other insurance subsidiaries to the parent company
|
$
|
52,001
|
|
38,500
|
|
—
|
|
|||
Statutory Capital Requirements
The insurance laws of
16
jurisdictions, including Wisconsin, our domiciliary state, require a mortgage insurer to maintain a minimum amount of statutory capital relative to the RIF (or a similar measure) in order for the mortgage insurer to continue to write new business. We refer to these requirements as the “State Capital Requirements” and, together with the GSE Financial Requirements, the “Financial Requirements.” While they vary among jurisdictions, the most common State Capital Requirements allow for a maximum risk-to-capital ratio of
25 to 1
. A risk-to-capital ratio will increase if (i) the percentage decrease in capital exceeds the percentage decrease in insured risk, or (ii) the percentage increase in capital is less than the percentage increase in insured risk. Wisconsin does not regulate capital by using a risk-to-capital measure but instead requires a minimum policyholder position ("MPP"). The “policyholder position” of a mortgage insurer is its net worth or surplus, contingency reserve and a portion of the reserves for unearned premiums.
At
December 31, 2016
, MGIC’s risk-to-capital ratio was
10.7 to 1
, below the maximum allowed by the jurisdictions with State Capital Requirements and its policyholder position was
$1.6 billion
above the required MPP of
$1.1 billion
. In calculating our risk-to-capital ratio and MPP, we are allowed full credit for the risk ceded under our reinsurance transaction with a group of unaffiliated reinsurers. It is possible that under the revised State Capital Requirements discussed below, MGIC will not be allowed full credit for the risk ceded to the reinsurers. If MGIC is not allowed an agreed level of credit under either the State Capital Requirements or the PMIERs, MGIC may terminate the reinsurance agreement, without penalty. At this time, we expect MGIC to continue to comply with the current State Capital Requirements; however, you should read the rest of these financial statement footnotes for information about matters that could negatively affect such compliance.
At
December 31, 2016
, the risk-to-capital ratio of our combined insurance operations (which includes a reinsurance affiliate) was
12.0 to 1
. Reinsurance transactions with our affiliate permit MGIC to write insurance with a higher coverage percentage than it could on its own under certain state-specific requirements. A higher risk-to-capital ratio on a combined basis may indicate that, in order for MGIC to continue to utilize reinsurance arrangements with its reinsurance affiliate, additional capital contributions to the affiliate could be needed.
The NAIC previously announced that it plans to revise the minimum capital and surplus requirements for mortgage insurers that are provided for in its Mortgage Guaranty Insurance Model Act. In May 2016, a working group of state regulators released an exposure draft of a risk-based capital framework to establish capital requirements for mortgage insurers, although no date has been established by which the NAIC must propose revisions to the capital requirements. We continue to evaluate the impact of the framework contained in the exposure draft, including the potential impact of certain items that have not yet been completely addressed by the framework which include: the treatment of ceded risk, minimum capital floors, and action level triggers. Currently we believe that the PMIERs contain the more restrictive capital requirements in most circumstances.
While MGIC currently meets the State Capital Requirements of Wisconsin and all other jurisdictions, it could be prevented from writing new business in the future in all jurisdictions if it fails to meet the State Capital Requirements of Wisconsin, or it could be prevented from writing new business in a particular jurisdiction if it fails to meet the State Capital Requirements of that jurisdiction and in each case MGIC does not obtain a waiver of such requirements. It is possible that regulatory action by one or more jurisdictions, including those that do not have specific State Capital Requirements, may prevent MGIC from continuing to write new insurance in such jurisdictions. If we are unable to write business in all jurisdictions, lenders may be unwilling to procure insurance from us anywhere. In addition, a lender’s assessment of the future ability of our insurance operations to meet the State Capital Requirements or the PMIERs may affect its willingness to procure insurance from us. A possible future failure by MGIC to meet the State Capital Requirements or the PMIERs will not necessarily mean that MGIC lacks sufficient resources to pay claims on its insurance liabilities. While we believe MGIC has sufficient claims paying resources to meet its claim obligations on its IIF on a timely basis, you should read the rest of these financial statement footnotes for information about matters that could negatively affect MGIC’s claims paying resources.
MGIC Investment Corporation 2016 Form 10-K
|
118
Dividend restrictions
In 2016, MGIC paid a total of
$64 million
in dividends to our holding company, its first dividends since 2008, and we expect MGIC to continue to pay quarterly dividends. During 2016, distributions of
$52 million
were paid to our holding company from other insurance subsidiaries. These distributions were completed in conjunction with the transfer of risk and the final dissolution of those insurance entities during 2016. Our holding company subsequently contributed the majority of the funds to MGIC in relation to the transfer of risk. During 2015, distributions of
$38.5 million
were paid to our holding company from other insurance subsidiaries.
MGIC is subject to statutory regulations as to payment of dividends.
The maximum amount of dividends that MGIC may pay in any twelve-month period without regulatory approval by the OCI is the lesser of adjusted statutory net income or
10%
of statutory policyholders' surplus as of the preceding calendar year end.
Adjusted statutory net income is defined for this purpose to be the greater of statutory net income, net of realized investment gains, for the calendar year preceding the date of the dividend or statutory net income, net of realized investment gains, for the
three
calendar years preceding the date of the dividend less dividends paid within the first
two
of the preceding
three
calendar years. The OCI recognizes only statutory accounting practices prescribed or permitted by the State of Wisconsin for determining and reporting the financial condition and results of operations of an insurance company. The OCI has adopted certain prescribed accounting practices that differ from those found in other states. Specifically, Wisconsin domiciled companies record changes in the contingency reserves through the income statement as a change in underwriting deduction. As a result, in periods in which MGIC is increasing contingency reserves, statutory net income is lowered. For the year ended
December 31, 2016
, MGIC’s statutory net income was reduced by
$490 million
to account for the increase in contingency reserves.
We have certain share-based compensation plans. Under the fair value method, compensation cost is measured at the grant date based on the fair value of the award and is recognized over the service period which generally corresponds to the vesting period. The fair value of awards classified as liabilities is remeasured at each reporting period until the award is settled. Awards under our plans generally vest over periods ranging from
one
to
three years
.
We have an omnibus incentive plan that was adopted on April 23, 2015. When the 2015 plan was adopted, no further awards could be made under our previous 2011 plan. The purpose of the 2015 plan is to motivate and incent performance by, and to retain the services of, key employees
and non-employee directors through receipt of equity-based and other incentive awards under the plan. The maximum number of shares of stock that can be awarded under the 2015 plan is
10.0 million
. Awards issued under the plan that are subsequently forfeited will not count against the limit on the maximum number of shares that may be issued under the plan. The 2015 plan provides for the award of stock options, stock appreciation rights, restricted stock and restricted stock units, as well as cash incentive awards. No awards may be granted after April 23, 2025 under the 2015 plan. The vesting provisions of options, restricted stock and restricted stock units are determined at the time of grant. Shares issued under the 2015 plan will be newly issued shares.
The compensation cost that has been charged against income for share-based plans was
$11.4 million
,
$11.9 million
, and
$9.2 million
for the years ended
December 31, 2016
,
2015
and
2014
, respectively. The related income tax benefit recognized for share-based plans was
$4.0 million
and
$4.2 million
for the years ended
December 31, 2016
and 2015, respectively. The related income tax benefit, before valuation allowance, recognized for share-based plans was, and
$3.2 million
for the year ended December 31,
2014
.
A summary of restricted stock or restricted stock unit (collectively called “restricted stock”) activity during
2016
is as follows:
|
|
Weighted Average Grant Date Fair Market Value
|
Shares
|
||||
|
Restricted stock outstanding at December 31, 2015
|
$
|
7.97
|
|
3,319,467
|
|
|
|
Granted
|
5.66
|
|
1,689,300
|
|
||
|
Vested
|
7.00
|
|
(1,707,711
|
)
|
||
|
Forfeited
|
4.24
|
|
(154,384
|
)
|
||
|
Restricted stock outstanding at December 31, 2016
|
$
|
7.44
|
|
3,146,672
|
|
|
At
December 31, 2016
, the
3.1 million
shares of restricted stock outstanding consisted of
2.3 million
shares that are subject to performance conditions (“performance shares”) and
0.8 million
shares that are subject only to service conditions (“time vested shares”). The weighted-average grant date fair value of restricted stock granted during
2015
and
2014
was
$9.03
and
$8.43
, respectively. The fair value of restricted stock granted is the closing price of the common stock on the New York Stock Exchange on the date of grant. The total fair value of restricted stock vested during
2016
,
2015
and
2014
was
$12.2 million
,
$17.2 million
, and
$12.1 million
, respectively.
As of
December 31, 2016
, there was
$11.7 million
of total unrecognized compensation cost related to non-vested share-based compensation agreements granted under the
119
|
MGIC Investment Corporation 2016 Form 10-K
plans. Of this total,
$8.9 million
of unrecognized compensation costs relate to performance shares and
$2.8 million
relates to time vested shares. A portion of the unrecognized costs associated with the performance shares may or may not be recognized in future periods, depending upon whether or not the performance and service conditions are met. The cost associated with the time vested shares is expected to be recognized over a weighted-average period of
1.3 years
.
At
December 31, 2016
,
8.3 million
shares were available for future grant under the 2015 omnibus incentive plan.
We lease certain office space as well as data processing equipment and autos under operating leases that expire during the next
five years
. Generally, rental payments are fixed.
Total rental expense under operating leases was
$2.1 million
in
2016
,
$2.2 million
in
2015
, and
$2.8 million
in
2014
.
At
December 31, 2016
, minimum future operating lease payments are as follows (in thousands):
|
2017
|
$
|
665
|
|
|
2018
|
676
|
|
|
|
2019
|
688
|
|
|
|
2020
|
490
|
|
|
|
2021 and thereafter
|
46
|
|
|
|
Total
|
$
|
2,565
|
|
Before paying an insurance claim, we review the loan and servicing files to determine the appropriateness of the claim amount. When reviewing the files, we may determine that we have the right to rescind coverage on the loan. We refer to insurance rescissions and denials of claims collectively as “rescissions” and variations of that term. In addition, all of our insurance policies provide that we can reduce or deny a claim if the servicer did not comply with its obligations under our insurance policy. We call such reduction of claims “curtailments.” In
2015
and
2016
, curtailments reduced our average claim paid by approximately
6.7%
and
5.5%
, respectively.
Our loss reserving methodology incorporates our estimates of future rescissions, curtailments, and reversals of rescissions and curtailments. A variance between ultimate actual rescission, curtailment, and reversal rates and our estimates, as a result of the outcome of litigation, settlements or other factors, could materially affect our losses.
When the insured disputes our right to rescind coverage or curtail claims, we generally engage in discussions in an attempt to settle the dispute. If we are unable to reach a settlement, the outcome of a dispute ultimately would be determined by legal proceedings.
Under ASC 450-20, until a liability associated with settlement discussions or legal proceedings becomes probable and can be reasonably estimated, we consider our claim payment or rescission resolved for financial reporting purposes and do not accrue an estimated loss. Where we determine that a loss is probable and can be reasonably estimated we have recorded our best estimate of our probable loss. If we are not able to implement settlements we consider probable, we intend to defend MGIC vigorously against any related legal proceedings.
In addition to matters for which we have recorded a probable loss, we are involved in other discussions and/or proceedings with insureds with respect to our claims paying practices. Although it is reasonably possible that when these matters are resolved we will not prevail in all cases, we are unable to make a reasonable estimate or range of estimates of the potential liability. We estimate the maximum exposure associated with matters where a loss is reasonably possible to be approximately
$295 million
, although we believe (but can give no assurance that) we will ultimately resolve these matters for significantly less than this amount. This estimate of our maximum exposure does not include interest or consequential or exemplary damages.
Mortgage insurers, including MGIC, have been involved in litigation and regulatory actions related to alleged violations of the anti-referral fee provisions of RESPA, and the notice provisions of the FCRA.
While these proceedings in the aggregate have not resulted in material liability for MGIC, there can be no assurance that the outcome of future proceedings under these laws, if any, would have a material adverse affect on us. In addition, various regulators, including the CFPB, state insurance commissioners and state attorneys general may bring other actions seeking various forms of relief in connection with alleged violations of RESPA. The insurance law provisions of many states prohibit paying for the referral of insurance business and provide various mechanisms to enforce this prohibition. While we believe our practices are in conformity
MGIC Investment Corporation 2016 Form 10-K
|
120
with applicable laws and regulations, it is not possible to predict the eventual scope, duration or outcome of any such reviews or investigations nor is it possible to predict their effect on us or the mortgage insurance industry.
Through a non-insurance subsidiary, we utilize our underwriting skills to provide an outsourced underwriting service to our customers known as contract underwriting. As part of the contract underwriting activities, that subsidiary is responsible for the quality of the underwriting decisions in accordance with the terms of the contract underwriting agreements with customers. That subsidiary may be required to provide certain remedies to its customers if certain standards relating to the quality of our underwriting work are not met, and we have an established reserve for such future obligations. Claims for remedies may be made a number of years after the underwriting work was performed. Beginning in the second half of 2009, our subsidiary experienced an increase in claims for contract underwriting remedies, which continued throughout 2012. The related contract underwriting remedy expense for the years ended
December 31, 2016
,
2015
, and
2014
, respectively, was immaterial to our consolidated financial statements.
In addition to the matters described above, we are involved in other legal proceedings in the ordinary course of business. In our opinion, based on the facts known at this time, the ultimate resolution of these ordinary course legal proceedings will not have a material adverse effect on our financial position or consolidated results of operations.
See
Note 12 – “Income Taxes”
for a description of federal income tax contingencies.
121
|
MGIC Investment Corporation 2016 Form 10-K
|
2016:
|
Quarter
|
Full
|
||||||||||||||||||
|
(In thousands, except per share data)
|
First
|
Second
|
Third
|
Fourth
|
Year
|
|||||||||||||||
|
Net premiums earned
|
$
|
221,341
|
|
$
|
231,456
|
|
$
|
237,376
|
|
$
|
235,053
|
|
$
|
925,226
|
|
|||||
|
Investment income, net of expenses
|
27,809
|
|
27,248
|
|
27,515
|
|
28,094
|
|
110,666
|
|
||||||||||
|
Realized gains
|
3,056
|
|
836
|
|
5,092
|
|
(52
|
)
|
8,932
|
|
||||||||||
|
Other revenue
|
6,373
|
|
3,994
|
|
3,867
|
|
3,425
|
|
17,659
|
|
||||||||||
|
Loss incurred, net
|
85,012
|
|
46,590
|
|
60,897
|
|
47,658
|
|
240,157
|
|
||||||||||
|
Underwriting and other expenses, net
|
56,439
|
|
49,837
|
|
53,981
|
|
56,824
|
|
217,081
|
|
||||||||||
|
Loss on debt extinguishment
|
13,440
|
|
1,868
|
|
75,223
|
|
—
|
|
90,531
|
|
||||||||||
|
Provision for income tax
|
34,497
|
|
56,018
|
|
27,131
|
|
54,551
|
|
172,197
|
|
||||||||||
|
Net income
|
69,191
|
|
109,221
|
|
56,618
|
|
107,487
|
|
342,517
|
|
||||||||||
|
Income per share
(a) (b)
:
|
|
|
|
|
|
|
|
|
|
|
||||||||||
|
Basic
|
0.20
|
|
0.32
|
|
0.16
|
|
0.31
|
|
1.00
|
|
||||||||||
|
Diluted
|
0.17
|
|
0.26
|
|
0.14
|
|
0.28
|
|
0.86
|
|
||||||||||
|
2015:
|
Quarter
|
Full
|
||||||||||||||||||
|
(In thousands, except per share data)
|
First
|
Second
|
Third
|
Fourth
|
Year
|
|||||||||||||||
|
Net premiums earned
|
$
|
217,288
|
|
$
|
213,508
|
|
$
|
239,234
|
|
$
|
226,192
|
|
$
|
896,222
|
|
|||||
|
Investment income, net of expenses
|
24,120
|
|
25,756
|
|
25,939
|
|
27,926
|
|
103,741
|
|
||||||||||
|
Realized (losses) gains
|
26,327
|
|
166
|
|
640
|
|
1,228
|
|
28,361
|
|
||||||||||
|
Other revenue
|
2,480
|
|
3,699
|
|
3,698
|
|
3,087
|
|
12,964
|
|
||||||||||
|
Loss incurred, net
|
81,785
|
|
90,238
|
|
76,458
|
|
95,066
|
|
343,547
|
|
||||||||||
|
Underwriting and other expenses, net
|
51,969
|
|
37,915
|
|
65,805
|
|
53,858
|
|
209,547
|
|
||||||||||
|
Loss on debt extinguishment
|
—
|
|
—
|
|
—
|
|
507
|
|
507
|
|
||||||||||
|
Provision for (benefit from) income tax
|
3,385
|
|
1,322
|
|
(695,604
|
)
|
6,584
|
|
(684,313
|
)
|
||||||||||
|
Net income
|
133,076
|
|
113,654
|
|
822,852
|
|
102,418
|
|
1,172,000
|
|
||||||||||
|
Income per share
(a) (b)
:
|
|
|
|
|
|
|
|
|
|
|
||||||||||
|
Basic
|
0.39
|
|
0.33
|
|
2.42
|
|
0.30
|
|
3.45
|
|
||||||||||
|
Diluted
|
0.32
|
|
0.28
|
|
1.78
|
|
0.24
|
|
2.60
|
|
||||||||||
|
(a)
|
Due to the use of weighted average shares outstanding when calculating earnings per share, the sum of the quarterly per share data may not equal the per share data for the year.
|
|
(b)
|
In periods where convertible debt instruments are dilutive to earnings per share the “if-converted” method of computing diluted EPS requires an interest expense adjustment, net of tax, to net income available to shareholders. The interest expense adjustment was not tax effected for the first and second quarter of 2015 due to our valuation allowance on deferred tax assets. See
Note 4 – “Earnings Per Share”
for further discussion on our calculation of diluted EPS.
|
MGIC Investment Corporation 2016 Form 10-K
|
122
Report of Independent Registered Public Accounting Firm
To the Board of Directors and Shareholders of
MGIC Investment Corporation:
In our opinion, the accompanying consolidated balance sheets and the related consolidated statements of operations, comprehensive income, shareholders’ equity and of cash flows present fairly, in all material respects, the financial position of MGIC Investment Corporation and its subsidiaries (the “Company”) at December 31, 2016 and 2015, and the results of their operations and their cash flows for each of the three years in the period ended December 31, 2016 in conformity with accounting principles generally accepted in the United States of America. Also in our opinion, the Company maintained, in all material respects, effective internal control over financial reporting as of December 31, 2016, based on criteria established in
Internal Control - Integrated Framework
(2013) issued by the Committee of Sponsoring Organizations of the Treadway Commission (COSO). The Company's management is responsible for these financial statements, for maintaining effective internal control over financial reporting and for its assessment of the effectiveness of internal control over financial reporting, included in Management's Report on Internal Control over Financial Reporting appearing under Item 9A. Our responsibility is to express opinions on these financial statements, and on the Company's internal control over financial reporting based on our integrated
audits. We conducted our audits in accordance with the standards of the Public Company Accounting Oversight Board (United States). Those standards require that we plan and perform the audits to obtain reasonable assurance about whether the financial statements are free of material misstatement and whether effective internal control over financial reporting was maintained in all material respects. Our audits of the financial statements included examining, on a test basis, evidence supporting the amounts and disclosures in the financial statements, assessing the accounting principles used and significant estimates made by management, and evaluating the overall financial statement presentation. Our audit of internal control over financial reporting included obtaining an understanding of internal control over financial reporting, assessing the risk that a material weakness exists, and testing and evaluating the design and operating effectiveness of internal control based on the assessed risk. Our audits also included performing such other procedures as we considered necessary in the circumstances. We believe that our audits provide a reasonable basis for our opinions.
A company’s internal control over financial reporting is a process designed to provide reasonable assurance regarding the reliability of financial reporting and the preparation of financial statements for external purposes in accordance with generally accepted accounting principles. A company’s internal control over financial reporting includes those policies and procedures that (i) pertain to the maintenance of records that, in reasonable detail, accurately and fairly reflect the transactions and dispositions of the assets of the company; (ii) provide reasonable assurance that transactions are recorded as necessary to permit preparation of financial statements in accordance with generally accepted accounting principles, and that receipts and expenditures of the company are being made only in accordance with authorizations of management and directors of the company; and (iii) provide reasonable assurance regarding prevention or timely detection of unauthorized acquisition, use, or disposition of the company’s assets that could have a material effect on the financial statements.
Because of its inherent limitations, internal control over financial reporting may not prevent or detect misstatements. Also, projections of any evaluation of effectiveness to future periods are subject to the risk that controls may become inadequate because of changes in conditions, or that the degree of compliance with the policies or procedures may deteriorate.
/s/ PricewaterhouseCoopers LLP
Milwaukee, Wisconsin
February 21, 2017
123
|
MGIC Investment Corporation 2016 Form 10-K
|
Changes in and Disagreements with Accountants on Accounting and Financial Disclosure, Controls and Procedures, Other information
|
|||
Item 9.
Changes in and Disagreements with Accountants on Accounting and Financial Disclosure.
None.
Item 9A.
Controls and Procedures.
Management’s Conclusion Regarding the Effectiveness of Disclosure Controls
Our management, with the participation of our principal executive officer and principal financial officer, has evaluated our disclosure controls and procedures (as defined in Rule 13a-15(e) under the Securities Exchange Act of 1934, as amended), as of the end of the period covered by this annual report. Based on such evaluation, our principal executive officer and principal financial officer concluded that such controls and procedures were effective as of the end of such period.
Management’s Report on Internal Control Over Financial Reporting
Our management is responsible for establishing and maintaining adequate internal control over financial reporting (as defined in Exchange Act Rule 13a-15(f)). Our internal control over financial reporting is designed to provide reasonable assurance regarding the reliability of financial reporting and the preparation of financial statements for external purposes in accordance with generally accepted accounting principles. Because of its inherent limitations, however, internal control over financial reporting may not prevent or detect misstatements. Also, projections of any evaluation of effectiveness to future periods are subject to the risk that controls may become inadequate because of changes in conditions, or that the degree of compliance with the policies or procedures may deteriorate.
Our management, with the participation of our principal executive officer and principal financial officer, has evaluated the effectiveness of our internal control over financial reporting using the framework in
Internal Control – Integrated Framework (2013)
issued by the Committee of Sponsoring Organizations of the Treadway Commission. Based on such evaluation, our management concluded that our internal control over financial reporting was effective as of
December 31, 2016
.
PricewaterhouseCoopers LLP, an independent registered public accounting firm, has audited the consolidated
financial statements and effectiveness of internal control over financial reporting as of
December 31, 2016
, as stated in their report which appears herein.
Changes in Internal Control during the Fourth Quarter
There was no change in our internal control over financial reporting that occurred during the fourth quarter of
2016
that materially affected, or is reasonably likely to materially affect, our internal control over financial reporting.
Item 9B.
Other Information.
None.
MGIC Investment Corporation 2016 Form 10-K
|
124
|
Directors, Executive Officers and Corporate Governance, Executive Compensation, Security Ownership of Certain Beneficial Owners and Management and Related Stockholder Matters, Certain Relationships and Related Transactions, and Director Independence, Principal Accountant Fees and Services
|
|||
Item 10.
Directors, Executive Officers and Corporate Governance.
This information (other than on the executive officers) will be included in our Proxy Statement for the 2017 Annual Meeting of Shareholders, and is hereby incorporated by reference, provided such Proxy Statement is filed within 120 days after December 31, 2016. If not so filed, such information will be included in an amended Form 10-K filed within such 120 day period. The information on the executive officers appears at the end of Part I of this Form 10-K.
Our Code of Business Conduct is available on our website (http://mtg.mgic.com) under the “Investor Information; Corporate Governance” links. Written copies of our Code of Business Conduct are available to any shareholder who submits a written request to our Secretary, addressed to: MGIC Investment Corporation, Secretary, P.O. Box 488, Milwaukee, WI 53201. We intend to disclose on our website any waivers and amendments to our Code of Business Conduct that are required to be disclosed under Item 5.05 of Form 8-K.
Item 11.
Executive Compensation.
This information will be included in our Proxy Statement for the 2017 Annual Meeting of Shareholders and is hereby incorporated by reference, provided such Proxy Statement is filed within 120 days after December 31, 2016. If not so filed, such information will be included in an amended Form 10-K filed within such 120 day period.
Item 12.
Security Ownership of Certain Beneficial Owners and Management and Related Stockholder Matters.
This information, other than information regarding equity compensation plans required by Item 201(d) of Regulation S-K of the Securities and Exchange Commission which appears below, will be included in our Proxy Statement for the 2017 Annual Meeting of Shareholders, and is hereby incorporated by reference, provided such Proxy Statement is filed within 120 days after December 31, 2016. If not so filed, such information will be included in an amended Form 10-K filed within such 120 day period.
The table below sets forth certain information, as of December 31, 2016, about the number of securities remaining available for future issuance under our equity compensation plans. No options, warrants or rights were outstanding at that date under any compensation plan or individual compensation arrangement with us. We have no compensation plan under which our equity securities may be issued that has not been approved by shareholders. Share units or phantom shares, which have no voting power and can be settled only in cash, are not considered to be equity securities for this purpose.
|
(a)
|
|
(b)
|
(c)
|
|
||||||
|
Plan Category
|
Number of Securities to be Issued Upon Exercise of Outstanding Options, Warrants and Rights
|
|
Weighted Average Exercise Price of Outstanding Options, Warrants and Rights
|
Number of Securities Remaining Available For Future Issuance Under Equity Compensation Plans (Excluding Securities Reflected in Column (a))
|
|
|||||
|
Equity compensation plans approved by security holders
|
3,137,939
|
|
(1)
|
$
|
—
|
|
8,324,700
|
|
(2)
|
|
|
Equity compensation plans not approved by security holders
|
—
|
|
|
—
|
|
—
|
|
|
||
|
Total
|
3,137,939
|
|
(1)
|
$
|
—
|
|
8,324,700
|
|
(2)
|
|
|
(1)
|
Includes 1,665,300 restricted stock units (RSUs) granted under our 2015 Omnibus Incentive Plan (the “2015 Plan”) for which shares will be issued if certain criteria are met. Of the RSUs granted under the 2015 Plan, 1,251,980 are subject to performance conditions and the remaining RSUs are subject to service conditions. Includes 1,446,770 RSUs granted under our 2011 Omnibus Incentive Plan (the “2011 Plan”) for which shares will be issued if certain criteria are met. Of the RSUs granted under the 2011 Plan, 1,046,744 RSUs are subject to performance conditions and the remaining RSUs are subject to service conditions. Also includes 25,869 vested RSUs granted under our 2002 Stock Incentive Plan for which shares will be issued in the future.
|
|
(2)
|
Reflects shares available for granting. All of these shares are available under our 2015 Plan.
|
125
|
MGIC Investment Corporation 2016 Form 10-K
Item 13.
Certain Relationships and Related Transactions, and Director Independence.
To the extent applicable, this information will be included in our Proxy Statement for the 2017 Annual Meeting of Shareholders, and is hereby incorporated by reference, provided such Proxy Statement is filed within 120 days after December 31, 2016. If not so filed, such information will be included in an amended Form 10-K filed within such 120 day period.
Item 14.
Principal Accountant Fees and Services.
This information will be included in our Proxy Statement for the 2017 Annual Meeting of Shareholders, and is hereby incorporated by reference, provided such Proxy Statement is filed within 120 days after December 31, 2016. If not so filed, such information will be included in an amended Form 10-K filed within such 120 day period.
MGIC Investment Corporation 2016 Form 10-K
|
126
|
Exhibits and Financial Statement Schedules and Form 10-K Summary
|
|||
Item 15.
Exhibits and Financial Statement Schedules.
(a)
|
1.
|
Financial statements. The following financial statements are filed in Item 8 of this annual report:
|
|
|
Consolidated balance sheets at December 31, 2016 and 2015
|
|
|
Consolidated statements of operations for each of the three years in the period ended December 31, 2016
|
|
|
Consolidated statements of comprehensive income for each of the three years in the period ended December 31, 2016
|
|
|
Consolidated statements of shareholders’ equity for each of the three years in the period ended December 31, 2016
|
|
|
Consolidated statements of cash flows for each of the three years in the period ended December 31, 2016
|
|
|
Notes to consolidated financial statements
|
|
|
Report of independent registered public accounting firm
|
|
2.
|
Financial statement schedules. The following financial statement schedules are filed as part of this Form 10-K and appear immediately following the signature page:
|
|
|
Report of independent registered public accounting firm on financial statement schedules
|
|
|
Schedules at and for the specified years in the three-year period ended December 31, 2016:
|
|
|
Schedule I - Summary of investments, other than investments in related parties
|
|
|
Schedule II - Condensed financial information of Registrant
|
|
|
Schedule IV – Reinsurance
|
|
|
All other schedules are omitted since the required information is not present or is not present in amounts sufficient to require submission of the schedules, or because the information required is included in the consolidated financial statements and notes thereto.
|
|
3.
|
Exhibits. The accompanying Index to Exhibits is incorporated by reference in answer to this portion of this Item and, except as otherwise indicated in the next sentence, the Exhibits listed in such Index are filed as part of this Form 10-K. Exhibit 32 is not filed as part of this Form 10-K but accompanies this Form 10-K.
|
Item 16.
Form 10-K Summary.
Not applicable.
127
|
MGIC Investment Corporation 2016 Form 10-K
SIGNATURES
Pursuant to the requirements of Section 13 or 15(d) of the Securities Exchange Act of 1934, the registrant has duly caused this report to be signed on its behalf by the undersigned, thereunto duly authorized, on
February 21, 2017
.
MGIC INVESTMENT CORPORATION
|
/s/ Patrick Sinks
|
|
|
Patrick Sinks
|
|
|
President, Chief Executive Officer and Director
|
|
Pursuant to the requirements of the Securities Exchange Act of 1934, this report has been signed below as of the date set forth above by the following persons on behalf of the registrant and in the capacities indicated.
Name and Title
|
/s/ Patrick Sinks
|
|
/s/ C. Edward Chaplin
|
|
Patrick Sinks
|
|
C. Edward Chaplin, Director
|
|
President, Chief Executive Officer and Director
|
|
|
|
|
|
|
|
|
|
/s/ Curt S. Culver
|
|
/s/ Timothy J. Mattke
|
|
Curt S. Culver, Director
|
|
Timothy J. Mattke
|
|
|
|
Executive Vice President and
|
|
|
|
Chief Financial Officer
|
|
/s/ Timothy A. Holt
|
|
(Principal Financial Officer)
|
|
Timothy A. Holt, Director
|
|
|
|
|
|
|
|
|
|
/s/ Julie K. Sperber
|
|
/s/ Kenneth M. Jastrow, II
|
|
Julie K. Sperber
|
|
Kenneth M. Jastrow, II, Director
|
|
Vice President, Controller and
|
|
|
|
Chief Accounting Officer
|
|
|
|
(Principal Accounting Officer)
|
|
/s/ Michael E. Lehman
|
|
|
|
Michael E. Lehman, Director
|
|
|
|
|
|
/s/ Daniel A. Arrigoni
|
|
|
|
Daniel A. Arrigoni, Director
|
|
/s/ Gary A. Poliner
|
|
|
|
Gary A. Poliner, Director
|
|
|
|
|
|
/s/ Cassandra C. Carr
|
|
|
|
Cassandra C. Carr, Director
|
|
/s/ Mark M. Zandi
|
|
|
|
Mark M. Zandi, Director
|
|
|
|
|
MGIC Investment Corporation 2016 Form 10-K
|
128
Report of Independent Registered Public Accounting Firm on
Financial Statement Schedules
To the Board of Directors and Shareholders of
MGIC Investment Corporation:
Our audits of the consolidated financial statements and of the effectiveness of internal control over financial reporting referred to in our report dated February 21, 2017
(the report is included under Item 8 in this Annual Report on Form 10-K) also included an audit of the financial statement schedules listed in the index appearing under Item 15(a)(2) of this Form 10-K. In our opinion, these financial statement schedules present fairly, in all material respects, the information set forth therein when read in conjunction with the related consolidated financial statements.
/s/ PricewaterhouseCoopers LLP
Milwaukee, Wisconsin
February 21, 2017
129
|
MGIC Investment Corporation 2016 Form 10-K
MGIC INVESTMENT CORPORATION
SCHEDULE I — SUMMARY OF INVESTMENTS -
OTHER THAN INVESTMENTS IN RELATED PARTIES
December 31, 2016
|
(In thousands)
Type of Investment
|
Amortized Cost
|
Fair Value
|
Amount at which shown in the balance sheet
|
|||||||||
|
Fixed income:
|
||||||||||||
|
Bonds:
|
||||||||||||
|
United States Government and government agencies and authorities
|
$
|
73,847
|
|
$
|
73,530
|
|
$
|
73,530
|
|
|||
|
States, municipalities and political subdivisions
|
2,147,458
|
|
2,143,016
|
|
2,143,016
|
|
||||||
|
Foreign governments
|
—
|
|
—
|
|
—
|
|
||||||
|
Public utilities
|
176,184
|
|
175,084
|
|
175,084
|
|
||||||
|
Asset-backed securities
|
59,519
|
|
59,565
|
|
59,565
|
|
||||||
|
Collateralized loan obligations
|
121,151
|
|
121,174
|
|
121,174
|
|
||||||
|
Mortgage-backed
|
558,775
|
|
544,026
|
|
544,026
|
|
||||||
|
All other corporate bonds
|
1,580,278
|
|
1,568,827
|
|
1,568,827
|
|
||||||
|
Total fixed income
|
4,717,212
|
|
4,685,222
|
|
4,685,222
|
|
||||||
|
Equity securities:
|
|
|
|
|
|
|
||||||
|
Common stocks:
|
|
|
|
|
|
|
||||||
|
Industrial, miscellaneous and all other
|
7,144
|
|
7,128
|
|
7,128
|
|
||||||
|
Total equity securities
|
7,144
|
|
7,128
|
|
7,128
|
|
||||||
|
Total investments
|
$
|
4,724,356
|
|
$
|
4,692,350
|
|
$
|
4,692,350
|
|
|||
MGIC Investment Corporation 2016 Form 10-K
|
130
MGIC INVESTMENT CORPORATION
SCHEDULE II - CONDENSED FINANCIAL INFORMATION OF REGISTRANT
CONDENSED BALANCE SHEETS
PARENT COMPANY ONLY
|
December 31,
|
||||||||
|
(In thousands)
|
2016
|
2015
|
||||||
|
ASSETS
|
||||||||
|
Fixed income (amortized cost, 2016 – $247,396; 2015 – $385,281)
|
$
|
245,435
|
|
$
|
382,565
|
|
||
|
Cash and cash equivalents
|
37,666
|
|
19,417
|
|
||||
|
Investment in subsidiaries, at equity in net assets
|
3,150,671
|
|
2,903,944
|
|
||||
|
Accounts receivable - affiliates
|
780
|
|
938
|
|
||||
|
Income taxes - current and deferred
|
289,703
|
|
151,318
|
|
||||
|
Accrued investment income
|
1,749
|
|
3,700
|
|
||||
|
Other assets
|
80
|
|
123
|
|
||||
|
Total assets
|
$
|
3,726,084
|
|
$
|
3,462,005
|
|
||
|
LIABILITIES AND SHAREHOLDERS' EQUITY
|
|
|
|
|
||||
|
Liabilities:
|
|
|
|
|
||||
|
Senior notes
|
$
|
417,406
|
|
$
|
—
|
|
||
|
Convertible senior notes
|
349,461
|
|
822,301
|
|
||||
|
Convertible junior subordinated debentures
|
389,522
|
|
389,522
|
|
||||
|
Accrued interest
|
20,853
|
|
14,042
|
|
||||
|
Total liabilities
|
1,177,242
|
|
1,225,865
|
|
||||
|
Shareholders’ equity:
|
|
|
|
|
||||
|
Common stock, (one dollar par value, shares authorized 1,000,000; shares issued 2016 – 359,400; 2015 – 340,097; outstanding 2016 – 340,663; 2015 – 339,657)
|
359,400
|
|
340,097
|
|
||||
|
Paid-in capital
|
1,782,337
|
|
1,670,238
|
|
||||
|
Treasury stock (shares at cost 2016 – 18,737; 2015 – 440)
|
(150,359
|
)
|
(3,362
|
)
|
||||
|
Accumulated other comprehensive loss, net of tax
|
(75,100
|
)
|
(60,880
|
)
|
||||
|
Retained earnings
|
632,564
|
|
290,047
|
|
||||
|
Total shareholders’ equity
|
2,548,842
|
|
2,236,140
|
|
||||
|
Total liabilities and shareholders’ equity
|
$
|
3,726,084
|
|
$
|
3,462,005
|
|
||
See accompanying supplementary notes to Parent Company condensed financial statements.
131
|
MGIC Investment Corporation 2016 Form 10-K
MGIC INVESTMENT CORPORATION
SCHEDULE II - CONDENSED FINANCIAL INFORMATION OF REGISTRANT
PARENT COMPANY ONLY
|
Years Ended December 31,
|
||||||||||||
|
(In thousands)
|
2016
|
2015
|
2014
|
|||||||||
|
Revenues:
|
||||||||||||
|
Investment income, net of expenses
|
$
|
3,807
|
|
$
|
7,586
|
|
$
|
6,985
|
|
|||
|
Net realized investment gains
|
646
|
|
357
|
|
395
|
|
||||||
|
Total revenues
|
4,453
|
|
7,943
|
|
7,380
|
|
||||||
|
Expenses:
|
|
|
|
|
|
|
||||||
|
Operating expenses
|
1,409
|
|
582
|
|
546
|
|
||||||
|
Interest expense
|
64,598
|
|
68,932
|
|
69,648
|
|
||||||
|
Loss on debt extinguishment
|
82,234
|
|
507
|
|
837
|
|
||||||
|
Total expenses
|
148,241
|
|
70,021
|
|
71,031
|
|
||||||
|
Loss before tax
|
(143,788
|
)
|
(62,078
|
)
|
(63,651
|
)
|
||||||
|
Benefit from income taxes
|
(52,575
|
)
|
(125,487
|
)
|
—
|
|
||||||
|
Equity in net income of subsidiaries
|
433,730
|
|
1,108,591
|
|
315,600
|
|
||||||
|
Net income
|
342,517
|
|
1,172,000
|
|
251,949
|
|
||||||
|
Other comprehensive (loss) income, net of tax
|
(14,220
|
)
|
20,461
|
|
36,385
|
|
||||||
|
Comprehensive income
|
$
|
328,297
|
|
$
|
1,192,461
|
|
$
|
288,334
|
|
|||
See accompanying supplementary notes to Parent Company condensed financial statements.
MGIC Investment Corporation 2016 Form 10-K
|
132
MGIC INVESTMENT CORPORATION
SCHEDULE II - CONDENSED FINANCIAL INFORMATION OF REGISTRANT
PARENT COMPANY ONLY
|
Years Ended December 31,
|
||||||||||||
|
(In thousands)
|
2016
|
2015
|
2014
|
|||||||||
|
Cash flows from operating activities:
|
||||||||||||
|
Net income
|
$
|
342,517
|
|
$
|
1,172,000
|
|
$
|
251,949
|
|
|||
|
Adjustments to reconcile net income to net cash provided by (used in) operating activities:
|
|
|
|
|
|
|
||||||
|
Equity in net income of subsidiaries
|
(433,730
|
)
|
(1,108,591
|
)
|
(315,600
|
)
|
||||||
|
Dividends received from subsidiaries
|
64,000
|
|
6,500
|
|
—
|
|
||||||
|
Deferred tax benefit
|
(55,988
|
)
|
(125,532
|
)
|
—
|
|
||||||
|
Loss on debt extinguishment
|
82,234
|
|
507
|
|
837
|
|
||||||
|
Other
|
11,625
|
|
22,342
|
|
14,025
|
|
||||||
|
Change in certain assets and liabilities:
|
|
|
|
|
|
|
||||||
|
Accounts receivable - affiliates
|
158
|
|
(626
|
)
|
68
|
|
||||||
|
Income taxes receivable
|
3,602
|
|
(8,308
|
)
|
480
|
|
||||||
|
Accrued investment income
|
1,951
|
|
(265
|
)
|
194
|
|
||||||
|
Accrued interest
|
6,811
|
|
(652
|
)
|
(188
|
)
|
||||||
|
Net cash provided by (used in) operating activities
|
23,180
|
|
(42,625
|
)
|
(48,235
|
)
|
||||||
|
Cash flows from investing activities:
|
|
|
|
|
|
|
||||||
|
Capital distributions from subsidiaries
|
51,987
|
|
32,000
|
|
—
|
|
||||||
|
Capital contributions to subsidiaries
|
(36,025
|
)
|
—
|
|
—
|
|
||||||
|
Purchase of fixed income
|
(194,751
|
)
|
(295,010
|
)
|
(553,538
|
)
|
||||||
|
Sale of fixed income
|
330,142
|
|
386,385
|
|
613,322
|
|
||||||
|
Net cash provided by investing activities
|
151,353
|
|
123,375
|
|
59,784
|
|
||||||
|
Cash flows from financing activities:
|
|
|
|
|
|
|
||||||
|
Net proceeds from issuance of long-term debt
|
416,967
|
|
—
|
|
—
|
|
||||||
|
Repayment of long-term debt
|
—
|
|
(61,953
|
)
|
(21,767
|
)
|
||||||
|
Repurchase of convertible senior notes
|
(426,191
|
)
|
(12,004
|
)
|
—
|
|
||||||
|
Repurchase of common stock
|
(147,127
|
)
|
—
|
|
—
|
|
||||||
|
Excess tax benefits related to share-based compensation
|
67
|
|
2,117
|
|
—
|
|
||||||
|
Net cash used in financing activities
|
(156,284
|
)
|
(71,840
|
)
|
(21,767
|
)
|
||||||
|
Net increase (decrease) in cash and cash equivalents
|
18,249
|
|
8,910
|
|
(10,218
|
)
|
||||||
|
Cash and cash equivalents at beginning of year
|
19,417
|
|
10,507
|
|
20,725
|
|
||||||
|
Cash and cash equivalents at end of year
|
$
|
37,666
|
|
$
|
19,417
|
|
$
|
10,507
|
|
|||
See accompanying supplementary notes to Parent Company condensed financial statements.
133
|
MGIC Investment Corporation 2016 Form 10-K
SCHEDULE II — CONDENSED FINANCIAL INFORMATION OF REGISTRANT
PARENT COMPANY ONLY
SUPPLEMENTARY NOTES
Note A
The accompanying Parent Company financial statements should be read in conjunction with the consolidated financial statements and notes to consolidated financial statements appearing this annual report.
Note B
Our insurance subsidiaries are subject to statutory regulations as to maintenance of policyholders’ surplus and payment of dividends. The maximum amount of dividends that the insurance subsidiaries may pay in any twelve-month period without regulatory approval by the OCI is the lesser of adjusted statutory net income or
10%
of statutory policyholders’ surplus as of the preceding calendar year end. Adjusted statutory net income is defined for this purpose to be the greater of statutory net income, net of realized investment gains, for the calendar year preceding the date of the dividend or statutory net income, net of realized investment gains, for the
three
calendar years preceding the date of the dividend less dividends paid within the first
two
of the preceding
three
calendar years.
The payment of dividends from our insurance subsidiaries is the principal source of cash inflow for MGIC Investment Corporation, our holding company, other than investment income and raising capital in the public markets. The payment of dividends by our insurance subsidiaries is restricted by insurance regulation as discussed above. MGIC is the principal source of dividend-paying capacity and, in 2016, it paid a total of
$64 million
in dividends to our holding company, its first dividends since 2008, and we expect MGIC to continue to pay quarterly dividends. During 2016, distributions of
$52 million
were paid to our holding company from other insurance subsidiaries. These distributions were completed in conjunction with the transfer of risk and the final dissolution of those insurance entities during 2016. Our holding company subsequently contributed the majority of the funds, approximately
$36 million
, to MGIC in relation to the transfer of risk. During 2015, distributions of
$38.5 million
, which includes dividends of
$6.5 million
, were paid to the holding company from other insurance subsidiaries.
No
dividends were paid to the holding company by our insurance subsidiaries in 2014 and
no
contributions were made to our insurance subsidiaries in 2015 or 2014.
Note C
The senior notes, convertible senior notes and convertible junior subordinated debentures ("
9%
Debentures"), discussed in
Note 7 – “Debt”
to our consolidated financial statements, are obligations of MGIC Investment Corporation, our holding company, and not of its subsidiaries. In February 2016, MGIC purchased
$132.7 million
in aggregate principal of the
9%
Debentures. The details of this transaction are discussed in
Note 7 – “Debt”
to our consolidated financial statements. The
9%
Debentures owned by MGIC remain obligations of our holding company. The carrying amount outstanding of the
9%
Debentures of
$389.5 million
is reported on the Parent Company only condensed balance sheet. For GAAP accounting purposes, the
9%
Debentures owned by MGIC are eliminated in our consolidated financial statements.
MGIC Investment Corporation 2016 Form 10-K
|
134
MGIC INVESTMENT CORPORATION
SCHEDULE IV — REINSURANCE
MORTGAGE INSURANCE PREMIUMS EARNED
Years Ended December 31, 2016, 2015 and 2014
|
(Dollars in thousands)
|
Gross Amount
|
Ceded to Other Companies
|
Assumed From Other Companies
|
Net Amount
|
Percentage of Amount Assumed to Net
|
||||||||||||||
|
Years ended December 31,
|
|||||||||||||||||||
|
2016
|
$
|
1,058,545
|
|
$
|
133,981
|
|
$
|
662
|
|
$
|
925,226
|
|
0.1
|
%
|
|||||
|
2015
|
997,892
|
|
102,848
|
|
1,178
|
|
896,222
|
|
0.1
|
%
|
|||||||||
|
2014
|
950,973
|
|
108,255
|
|
1,653
|
|
844,371
|
|
0.2
|
%
|
|||||||||
135
|
MGIC Investment Corporation 2016 Form 10-K
INDEX TO EXHIBITS
The agreements included as exhibits to this report are included to provide information regarding their terms and are not intended to provide any other factual or disclosure information about the Company or any of its subsidiaries or the other parties to the agreements. The agreements contain representations and warranties by each of the parties to the applicable agreement. These representations and warranties have been made solely for the benefit of the other parties to the applicable agreement and:
|
•
|
should not in all instances be treated as categorical statements of fact, but rather as a way of allocating the risk to one of the parties if those statements provide to be inaccurate;
|
|
•
|
have been qualified by disclosures that were made to the other party in connection with the negotiation of the applicable agreement, which disclosures are not necessarily reflected in the agreement;
|
|
•
|
may apply standards of materiality in a way that is different from what may be viewed as material to you or other investors; and
|
|
•
|
were made only as of the date of the applicable agreement or such other date or dates as may be specified in the agreement and are subject to more recent developments.
|
Accordingly, these representations and warranties may not describe the actual state of affairs as of the date they were made or at any other time. Additional information about the Company and its subsidiaries may be found elsewhere in this report and the Company’s other public filings, which are available without charge through the SEC’s website at http://www.sec.gov or on the Company's website. See Item 1 “Business – Website Address.”
|
|
|
Incorporated by Reference
|
||||||
|
Exhibit
Number
|
Description of Exhibit
|
Form
|
Exhibit(s)
|
Filing Date
|
||||
|
3.1
|
Articles of Incorporation, as amended.
|
10-Q
|
3.1
|
August 8, 2013
|
||||
|
3.2
|
Amended and Restated Bylaws, as amended.
|
8-K
|
3.2
|
July 25, 2014
|
||||
|
4.1
|
Articles of Incorporation (included within Exhibit 3.1).
|
10-Q
|
3.1
|
August 8, 2013
|
||||
|
4.2
|
Amended and Restated Bylaws (included as Exhibit 3.2).
|
8-K
|
3.2
|
July 25, 2014
|
||||
|
4.3
|
Amended and Restated Rights Agreement, dated as of July 23, 2015, between MGIC Investment Corporation and Wells Fargo Bank, National Association, which includes as Exhibit A thereto the Form of Right Certificate, as Exhibit B thereto the Summary of Rights to Purchase Common Shares, and as Exhibit C thereto the Form of Representation and Request Letter.
|
8-A/A
|
4.1
|
July 24, 2015
|
||||
|
4.4
|
Indenture, dated as of October 15, 2000, between the MGIC Investment Corporation and Bank One Trust Company, National Association, as Trustee. [File 001-10816]
|
8-K
|
4.1
|
October 19, 2000
|
||||
|
4.5
|
Supplemental Indenture, dated as of April 26, 2010, between MGIC Investment Corporation and U.S. Bank National Association (as successor to Bank One Trust Company, National Association), as Trustee, under the Indenture, dated as of October 15, 2000, between the Company and the Trustee.
|
8-K
|
4.1
|
April 30, 2010
|
||||
|
4.6
|
Indenture, dated as of March 28, 2008, between U.S. Bank National Association, as trustee, and MGIC Investment Corporation. [File 001‑10816]
|
10-Q
|
4.6
|
May 12, 2008
|
||||
MGIC Investment Corporation 2016 Form 10-K
|
136
|
|
|
Incorporated by Reference
|
||||||
|
Exhibit
Number
|
Description of Exhibit
|
Form
|
Exhibit(s)
|
Filing Date
|
||||
|
4.7
|
Second Supplemental Indenture, dated as of March 15, 2013, between MGIC Investment Corporation and U.S. Bank National Association (as successor to Bank One Trust Company, National Association), as Trustee, under the Indenture, dated as of October 15, 2000, between the Company and the Trustee.
|
8-K
|
4.1
|
March 15, 2013
|
||||
|
4.8
|
Third Supplemental Indenture, dated as of August 5, 2016, between MGIC Investment Corporation and U.S. Bank National Association (as successor to Bank One Trust Company, National Association), as Trustee, under the Indenture, dated as of October 15, 2000, between the Company and the Trustee.
|
8-K
|
4.1
|
August 5, 2016
|
||||
|
|
[We are a party to various other agreements with respect to our long-term debt. These agreements are not being filed pursuant to Reg. S-K Item 601(b) (4) (iii) (A). We hereby agree to furnish a copy of such agreements to the Commission upon its request.]
|
|
|
|
||||
|
10.2.4
|
Form of Restricted Stock and Restricted Stock Unit Agreement (for Directors) under 2002 Stock Incentive Plan. [File 001‑10816] *
|
10-K
|
10.2.4
|
March 16, 2005
|
||||
|
10.2.5
|
Form of Incorporated Terms to Restricted Stock and Restricted Stock Unit Agreement (for Directors) under 2002 Stock Incentive Plan. [File 001‑10816] *
|
10-K
|
10.2.5
|
March 16, 2005
|
||||
|
10.2.12
|
Form of Restricted Stock Unit Agreement under 2011 Omnibus Incentive Plan (Adopted January 2014). *
|
10-K
|
10.2.12
|
February 27, 2015
|
||||
|
10.2.13
|
Form of Incorporated Terms to Restricted Stock Unit Agreement under 2011 Omnibus Incentive Plan (Adopted January 2014). *
|
10-K
|
10.2.13
|
February 27, 2015
|
||||
|
10.2.14
|
Form of Restricted Stock Unit Agreement under 2011 Omnibus Incentive Plan (Adopted January 2015). *
|
10-K
|
10.2.14
|
February 26, 2016
|
||||
|
10.2.15
|
Form of Incorporated Terms to Restricted Stock Unit Agreement under 2011 Omnibus Incentive Plan (Adopted January 2015). *
|
10-K
|
10.2.15
|
February 26, 2016
|
||||
|
10.2.16
|
Form of Restricted Stock Unit Agreement under 2015 Omnibus Incentive Plan (Adopted January 2016). * †
|
|||||||
|
10.2.17
|
Form of Incorporated Terms to Restricted Stock Unit Agreement under 2015 Omnibus Incentive Plan (Adopted January 2016). * †
|
|||||||
|
10.3
|
MGIC Investment Corporation 1991 Stock Incentive Plan. [File 001‑10816] *
|
10-K
|
10.7
|
March 29, 2000
|
||||
|
10.3.1
|
MGIC Investment Corporation 2002 Stock Incentive Plan, as amended. *
|
10-K
|
10/3/2001
|
March 1, 2011
|
||||
|
10.3.2
|
MGIC Investment Corporation 2011 Omnibus Incentive Plan. *
|
DEF 14A
|
App. B
|
March 31, 2011
|
||||
|
10.3.3
|
MGIC Investment Corporation 2015 Omnibus Incentive Plan *
|
DEF 14A
|
App. A
|
March 24, 2015
|
||||
|
10.5
|
Two Forms of Restricted Stock Award Agreement under 1991 Stock Incentive Plan. [File 001‑10816] *
|
10-K
|
10.10
|
March 29, 2000
|
||||
137
|
MGIC Investment Corporation 2016 Form 10-K
|
|
|
Incorporated by Reference
|
||||||
|
Exhibit
Number
|
Description of Exhibit
|
Form
|
Exhibit(s)
|
Filing Date
|
||||
|
10.6
|
Executive Bonus Plan. * †
|
|
|
|
||||
|
10.7
|
Supplemental Executive Retirement Plan. *
|
8-K
|
10.7
|
January 29, 2014
|
||||
|
10.8
|
MGIC Investment Corporation Deferred Compensation Plan for Non-Employee Directors, as amended.*
|
10-K
|
10.8
|
February 27, 2015
|
||||
|
10.9
|
MGIC Investment Corporation 1993 Restricted Stock Plan for Non-Employee Directors. [File 001‑10816] *
|
10-K
|
10.24
|
March 25, 1994
|
||||
|
10.10
|
Two Forms of Award Agreement under MGIC Investment Corporation 1993 Restricted Stock Plan for Non-Employee Directors.*
|
10-Q
|
10.27 and 10.28
|
August 12, 1994
|
||||
|
10.11.1
|
Form of Key Executive Employment and Severance Agreement. *
|
10-K
|
10.11.1
|
February 27, 2015
|
||||
|
10.11.2
|
Form of Incorporated Terms to Key Executive Employment and Severance Agreement. *
|
10-K
|
10.11.2
|
February 27, 2015
|
||||
|
10.12
|
Form of Agreement Not to Compete. *
|
10-K
|
10.12
|
March 1, 2013
|
||||
|
10.14
|
Confidential Settlement Agreement and Release dated as of April 19, 2013 (“BANA Agreement”), by and between Mortgage Guaranty Insurance Corporation and Bank of America, N.A. (as a successor to BAC Home Loans Servicing f/k/a Countrywide Home Loans Servicing LP), on its own behalf and as successor in interest by
de jure
merger to Countrywide Bank FSB, formerly Treasury Bank. Countrywide Home Loans, Inc. is also a party to the BANA Agreement solely to the extent specified in BANA Agreement. **
|
8-K
|
10.1
|
April 25, 2013
|
||||
|
10.15
|
Confidential Settlement Agreement and Release dated as of April 19, 2013 (“CHL Agreement”), by and between Mortgage Guaranty Insurance Corporation, Countrywide Home Loans, Inc. and Bank of America, N.A., in its capacity as master servicer or servicer of Subject Loans (as defined in the CHL Agreement). **
|
8-K
|
10.2
|
April 25, 2013
|
||||
|
10.16
|
Form of Amendment to Restricted Stock Unit Agreement under 2011 Omnibus Incentive Plan. *
|
10-Q
|
10.2
|
May 6, 2016
|
||||
|
10.17
|
Amended & Restated Confidential Settlement Agreement and Release dated as of March 2, 2015 (“A&R Agreement”), by and among Mortgage Guaranty Insurance Corporation, Countrywide Home Loans, Inc. and Bank of America, N.A., in its capacity as master servicer or servicer of Subject Loans (as defined in the A&R Agreement) **
|
8-K
|
10.1
|
March 5, 2015
|
||||
|
12
|
Ratio of Earnings to Fixed Charges. †
|
|||||||
|
21
|
Direct and Indirect Subsidiaries. †
|
|
|
|
||||
|
23
|
Consent of Independent Registered Public Accounting Firm. †
|
|
|
|
||||
MGIC Investment Corporation 2016 Form 10-K
|
138
|
|
|
Incorporated by Reference
|
||||||
|
Exhibit
Number
|
Description of Exhibit
|
Form
|
Exhibit(s)
|
Filing Date
|
||||
|
31.1
|
Certification of CEO under Section 302 of the Sarbanes-Oxley Act of 2002. †
|
|
|
|
||||
|
31.2
|
Certification of CFO under Section 302 of the Sarbanes-Oxley Act of 2002. †
|
|
|
|
||||
|
32
|
Certification of CEO and CFO under Section 906 of the Sarbanes-Oxley Act of 2002 (as indicated in Item 15 of this Annual Report on Form 10-K, this Exhibit is not being “filed”). ††
|
|
|
|
||||
|
99.1
|
Mortgage Guaranty Insurance Corporation’s “Flow” Master Insurance Policy and Declaration Page, Restated to Include Selected Endorsements.
|
10-K
|
99.1
|
March 2, 2009
|
||||
|
99.2
|
Endorsement to Mortgage Guaranty Insurance Corporation’s “Flow” Master Insurance Policy Applicable to Lenders with Delegated Underwriting Authority.
|
10-K
|
99.2
|
March 2, 2009
|
||||
|
99.7
|
Specimen Gold Cert Endorsement
|
10-Q
|
99.7
|
May 10, 2012
|
||||
|
99.8
|
Amendment to BANA Confidential Settlement Agreement and Release made as of September 24, 2013 by and between Mortgage Guaranty Insurance Corporation and Bank of America, N.A. (as a successor to BAC Home Loans Servicing f/k/a Countrywide Home Loans Servicing LP), on its own behalf and as successor in interest by de jure merger to Countrywide Bank FSB, formerly Treasury Bank. Countrywide Home Loans, Inc. is also a party to the settlement agreement only to the extent specified in the settlement agreement. **
|
10-Q
|
10.14.1
|
November 8, 2013
|
||||
|
99.9
|
Amendment to Confidential Settlement Agreement and Release made as of September 24, 2013 by and between Mortgage Guaranty Insurance Corporation, Countrywide Home Loans, Inc. and Bank of America, N.A., in its capacity as master servicer or servicer of Subject Loans (as defined in the settlement agreement) **
|
10-Q
|
10.14.1
|
November 8, 2013
|
||||
|
99.10
|
Letter Agreement dated October 9, 2013 among Fannie Mae, Bank of America, N.A., Countrywide Home Loans, Inc. and Mortgage Guaranty Insurance Corporation. **
|
10-K
|
99.10
|
February 28, 2014
|
||||
|
99.11
|
Letter Agreement October 9, 2013 among Bank of America, N.A., Countrywide Home Loans, Inc. and Mortgage Guaranty Insurance Corporation. **
|
10-K
|
99.11
|
February 28, 2014
|
||||
|
99.12
|
Second Amendment to Confidential Settlement Agreement and Release made as of November 8, 2013 by and among Mortgage Guaranty Insurance Corporation, Countrywide Home Loans, Inc. and Bank of America, N.A., in its capacity as master servicer or servicer of Subject Loans (as defined in the settlement agreement)
|
10-K
|
99.12
|
February 28, 2014
|
||||
|
99.13
|
Third Amendment to Confidential Settlement Agreement and Release made as of March 13, 2014 by and among Mortgage Guaranty Insurance Corporation, Countrywide Home Loans, Inc. and Bank of America, N.A., in its capacity as master servicer or servicer of Subject Loans (as defined in the settlement agreement)
|
10-Q
|
99.13
|
May 9, 2014
|
||||
|
99.14
|
Second Amendment to BANA Confidential Settlement Agreement and Release made as of June 5, 2014 by and between Mortgage Guaranty Insurance Corporation and Bank of America, N.A. (as a successor to BAC Home Loans Servicing f/k/a Countrywide Home Loans Servicing LP), on its own behalf and as successor in interest by de jure merger to Countrywide Bank FSB, formerly Treasury Bank. Countrywide Home Loans, Inc. is also a party to the settlement agreement only to the extent specified in the settlement agreement. **
|
10-Q
|
99.14
|
August 8, 2014
|
||||
139
|
MGIC Investment Corporation 2016 Form 10-K
|
|
|
Incorporated by Reference
|
||||||
|
Exhibit
Number
|
Description of Exhibit
|
Form
|
Exhibit(s)
|
Filing Date
|
||||
|
99.15
|
Fourth Amendment to Confidential Settlement Agreement and Release made as of May 19, 2014 by and among Mortgage Guaranty Insurance Corporation, Countrywide Home Loans, Inc. and Bank of America, N.A., in its capacity as master servicer or servicer of Subject Loans (as defined in the settlement agreement)
|
10-Q
|
99.15
|
August 8, 2014
|
||||
|
99.16
|
Fifth Amendment to Confidential Settlement Agreement and Release made as of June 5, 2014 by and among Mortgage Guaranty Insurance Corporation, Countrywide Home Loans, Inc. and Bank of America, N.A., in its capacity as master servicer or servicer of Subject Loans (as defined in the settlement agreement) **
|
10-Q
|
99.16
|
August 8, 2014
|
||||
|
99.17
|
Sixth Amendment to Confidential Settlement Agreement and Release made as of August 31, 2014 by and among Mortgage Guaranty Insurance Corporation, Countrywide Home Loans, Inc. and Bank of America, N.A., in its capacity as master servicer or servicer of Subject Loans (as defined in the settlement agreement)
|
10-Q
|
99.17
|
November 7, 2014
|
||||
|
99.18
|
Seventh Amendment to Confidential Settlement Agreement and Release made as of September 11, 2014 by and among Mortgage Guaranty Insurance Corporation, Countrywide Home Loans, Inc. and Bank of America, N.A., in its capacity as master servicer or servicer of Subject Loans (as defined in the settlement agreement)
|
10-Q
|
99.18
|
November 7, 2014
|
||||
|
99.19
|
Mortgage Guaranty Insurance Corporation’s “Flow” Master Insurance Policy for loans with a mortgage insurance application date on or after October 1, 2014
|
10-Q
|
99.19
|
November 7, 2014
|
||||
|
99.20
|
Eighth Amendment to Confidential Settlement Agreement and Release made as of October 30, 2014 by and among Mortgage Guaranty Insurance Corporation, Countrywide Home Loans, Inc. and Bank of America, N.A., in its capacity as master servicer or servicer of Subject Loans (as defined in the settlement agreement) †
|
10-K
|
99.20
|
February 27, 2015
|
||||
|
99.21
|
Ninth Amendment to Confidential Settlement Agreement and Release made as of November 30, 2014 by and among Mortgage Guaranty Insurance Corporation, Countrywide Home Loans, Inc. and Bank of America, N.A., in its capacity as master servicer or servicer of Subject Loans (as defined in the settlement agreement) †
|
10-K
|
99.21
|
February 27, 2015
|
||||
|
99.22
|
Tenth Amendment to Confidential Settlement Agreement and Release made as of January 29, 2015 by and among Mortgage Guaranty Insurance Corporation, Countrywide Home Loans, Inc. and Bank of America, N.A., in its capacity as master servicer or servicer of Subject Loans (as defined in the settlement agreement) †
|
10-K
|
99.22
|
February 27, 2015
|
||||
|
99.23
|
Eleventh Amendment to Confidential Settlement Agreement and Release made as of February 6, 2015 by and among Mortgage Guaranty Insurance Corporation, Countrywide Home Loans, Inc. and Bank of America, N.A., in its capacity as master servicer or servicer of Subject Loans (as defined in the settlement agreement) †
|
10-K
|
99.23
|
February 27, 2015
|
||||
|
99.24
|
Twelfth Amendment to Confidential Settlement Agreement and Release made as of February 13, 2015 by and among Mortgage Guaranty Insurance Corporation, Countrywide Home Loans, Inc. and Bank of America, N.A., in its capacity as master servicer or servicer of Subject Loans (as defined in the settlement agreement) †
|
10-K
|
99.24
|
February 27, 2015
|
||||
|
99.25
|
Endorsement to Mortgage Guaranty Insurance Corporation’s “Flow” Master Insurance Policy Applicable to Lenders with Delegated Underwriting Authority, for loans with a mortgage insurance application date on or after October 1, 2014
|
10-Q
|
99.3
|
May 7, 2015
|
||||
MGIC Investment Corporation 2016 Form 10-K
|
140
|
|
|
Incorporated by Reference
|
||||||
|
Exhibit
Number
|
Description of Exhibit
|
Form
|
Exhibit(s)
|
Filing Date
|
||||
|
99.26
|
Advances, Collateral Pledge, and Security Agreement dated as of July 21, 2015 between the Federal Home Loan Bank of Chicago and Mortgage Guaranty Insurance Corporation.
|
10-K
|
10.2.15
|
February 26, 2016
|
||||
|
101.INS
|
XBRL Instance Document
|
|||||||
|
101.SCH
|
XBRL Taxonomy Extension Schema Document
|
|||||||
|
101.CAL
|
XBRL Taxonomy Extension Calculation Linkbase Document
|
|||||||
|
101.DEF
|
XBRL Taxonomy Extension Definition Linkbase Document
|
|||||||
|
101.LAB
|
XBRL Taxonomy Extension Label Linkbase Document
|
|||||||
|
101.PRE
|
XBRL Taxonomy Extension Presentation Linkbase Document
|
|||||||
|
*
|
Denotes a management contract or compensatory plan.
|
|
**
|
Certain portions of these Exhibits are redacted and covered by a confidential treatment request that has been granted. Omitted portions have been filed separately with the Securities and Exchange Commission.
|
|
†
|
Filed herewith.
|
|
††
|
Furnished herewith.
|
141
|
MGIC Investment Corporation 2016 Form 10-K
TABLE OF CONTENTS
Part IPart IINote 1. Nature Of BusinessNote 2. Basis Of PresentationNote 3. Significant Accounting PoliciesNote 4. Earnings Per ShareNote 5. InvestmentsNote 6. Fair Value MeasurementsNote 7. DebtNote 8. Loss ReservesNote 9. ReinsuranceNote 10. Other Comprehensive (loss) IncomeNote 11. Benefit PlansNote 12. Income TaxesNote 13. Shareholders' EquityNote 14. Statutory InformationNote 15. Share-based Compensation PlansNote 16. LeasesNote 17. Litigation and ContingenciesNote 18. Unaudited Quarterly Financial DataPart IIIPart IVItem 15(a)3