MGIC INVESTMENT CORP
10-Ks and 10-Qs
|
|
|
|
|
|
|
|
|
|
|
|
|
|
|
|
|
|
|
|
|
|
|
|
|
|
|
|
|
|
|
|
|
|
|
|
|
|
|
|
|
|
|
|
|
|
|
|
|
|
FORM 10-Q
UNITED STATES SECURITIES AND EXCHANGE COMMISSION
WASHINGTON, D.C. 20549
|
x
|
QUARTERLY REPORT PURSUANT TO SECTION 13 OR 15(d) OF THE SECURITIES EXCHANGE ACT OF 1934
|
||
|
For the quarterly period ended
|
September 30, 2018
|
||
|
o
|
TRANSITION REPORT PURSUANT TO SECTION 13 OR 15(d) OF THE SECURITIES EXCHANGE ACT OF 1934
|
||
|
For the transition period from ______ to ______
|
|||
|
Commission file number 1-10816
|
|||
MGIC Investment Corporation
(Exact name of registrant as specified in its charter)
|
WISCONSIN
|
39-1486475
|
|
|
(State or other jurisdiction of incorporation or organization)
|
(I.R.S. Employer Identification No.)
|
|
|
|
|
|
|
250 E. KILBOURN AVENUE
|
53202
|
|
|
MILWAUKEE, WISCONSIN
|
(Zip Code)
|
|
|
(Address of principal executive offices)
|
|
|
(414) 347-6480
(Registrant’s telephone number, including area code)
Indicate by check mark whether the registrant (1) has filed all reports required to be filed by Section 13 or 15(d) of the Securities Exchange Act of 1934 during the preceding 12 months (or for such shorter period that the registrant was required to file such reports), and (2) has been subject to such filing requirements for the past 90 days.
|
YES
x
|
NO
o
|
Indicate by check mark whether the registrant has submitted electronically every Interactive Data File required to be submitted pursuant to Rule 405 of Regulation S-T during the preceding 12 months (or for such shorter period that the registrant was required to submit such files).
|
YES
x
|
NO
o
|
Indicate by check mark whether the registrant is a large accelerated filer, an accelerated filer, a non-accelerated filer, or a smaller reporting company. See the definitions of “large accelerated filer,” “accelerated filer,” “smaller reporting company,” and “emerging growth company” in Rule 12b-2 of the Exchange Act. (Check one):
|
Large accelerated filer
x
|
Accelerated filer
o
|
Non-accelerated filer
o
|
Smaller reporting company
o
|
(Do not check if a smaller reporting company)
|
|
Emerging growth company
o
|
If an emerging growth company, indicate by check mark if the registrant has elected not to use the extended transition period for complying with any new or revised financial accounting standards provided pursuant to Section 13(a) of the Exchange Act.
o
|
|||
Indicate by check mark whether the registrant is a shell company (as defined in Rule 12b-2 of the Exchange Act).
|
YES
o
|
NO
x
|
Indicate the number of shares outstanding of each of the issuer’s classes of common stock, as of the latest practicable date.
|
CLASS OF STOCK
|
PAR VALUE
|
DATE
|
NUMBER OF SHARES
|
|||
|
Common stock
|
$1.00
|
October 31, 2018
|
361,589,994
|
|||
Forward Looking and Other Statements
All statements in this report that address events, developments or results that we expect or anticipate may occur in the future are “forward looking statements.” Forward looking statements consist of statements that relate to matters other than historical fact. In most cases, forward looking statements may be identified by words such as “believe,” “anticipate” or “expect,” or words of similar import. The risk factors referred to in “Forward Looking Statements and Risk Factors – Location of Risk Factors” in Management’s Discussion and Analysis of Financial Condition and Results of Operations below, may cause our actual results to differ materially from the results contemplated by forward looking statements that we may make. We are not undertaking any obligation to update any forward looking statements or other statements we may make in this document even though these statements may be affected by events or circumstances occurring after the forward looking statements or other statements were made. Therefore no reader of this document should rely on these statements being current as of any time other than the time at which this document was filed with the Securities and Exchange Commission.
MGIC INVESTMENT CORPORATION AND SUBSIDIARIES
FORM 10-Q
FOR THE QUARTER ENDED SEPTEMBER 30, 2018
|
Table of contents
|
|||
|
Page
|
|||
Glossary of terms and acronyms
/ A
ARMs
Adjustable rate mortgages
ABS
Asset-backed securities
ASC
Accounting Standards Codification
Available Assets
Assets, as designated under the PMIERs, that are readily available to pay claims, and include the most liquid investments
/ B
Book or book year
A group of loans insured in a particular calendar year
BPMI
Borrower-paid mortgage insurance
/ C
CECL
Current expected credit losses
CFPB
Consumer Financial Protection Bureau
CLO
Collateralized loan obligations
CMBS
Commercial mortgage-backed securities
/ D
DAC
Deferred insurance policy acquisition costs
Debt-to-income (“DTI”) ratio
The ratio, expressed as a percentage, of a borrowers’ total debt payments to gross income
Direct
When referring to insurance or risk written or in force, “direct” means before giving effect to reinsurance
/ F
Fannie Mae
Federal National Mortgage Association
FCRA
Fair Credit Reporting Act
FEMA
Federal Emergency Management Agency
FHA
Federal Housing Administration
FHFA
Federal Housing Finance Agency
FHLB
Federal Home Loan Bank of Chicago, of which MGIC is a member
FICO score
A measure of consumer credit risk provided by credit bureaus, typically produced from statistical models by Fair Isaac Corporation utilizing data collected by the credit bureaus
Freddie Mac
Federal Home Loan Mortgage Corporation
/ G
GAAP
Generally Accepted Accounting Principles in the United States
GSEs
Collectively, Fannie Mae and Freddie Mac
/ H
HAMP
Home Affordable Modification Program
HARP
Home Affordable Refinance Program
Home Re
Home Re 2018-1, Ltd., an unaffiliated special purpose insurer domiciled in Bermuda
HOPA
Homeowners Protection Act
MGIC Investment Corporation - Q3 2018 |
4
/ I
IADA
Individual Assistance Disaster Area
IBNR
Losses incurred but not reported
IIF
Insurance in force, which for loans insured by us, is equal to the unpaid principal balance, as reported to us
/ J
JCT
Joint Committee on Taxation
/ L
LAE
Loss adjustment expenses
Legacy book
Mortgage insurance policies written prior to 2009
Loan-to-value ("LTV") ratio
The ratio, expressed as a percentage, of the dollar amount of the first mortgage loan to the value of the property at the time the loan became insured and does not reflect subsequent housing price appreciation or depreciation. Subordinate mortgages may also be present.
5.75% Notes
5.75% Senior Notes due on August 15, 2023, with interest payable semi-annually on February 15 and August 15 of each year
9% Debentures
9% Convertible Junior Subordinated Debentures due on April 1, 2063, with interest payable semi-annually on April 1 and October 1 of each year
FHLB Advance or the Advance
1.91% Fixed rate advance from the FHLB due on February 10, 2023, with interest payable monthly
Loss ratio
The ratio, expressed as a percentage, of the sum of incurred losses and loss adjustment expenses to NPE
Low down payment loans or mortgages
Loans with less than 20% down payments
LPMI
Lender-paid mortgage insurance
/ M
MBS
Mortgage-backed securities
MD&A
Management's discussion and analysis of financial condition and results of operations
MGIC
Mortgage Guaranty Insurance Corporation, a subsidiary of MGIC Investment Corporation
MAC
MGIC Assurance Corporation, a subsidiary of MGIC
Minimum Required Assets
The greater of $400 million or the total of the minimum amount of Available Assets that must be held under the PMIERs based upon a percentage of RIF weighted by certain risk attributes
MPP
Minimum Policyholder Position, as required under certain state requirements. The “policyholder position” of a mortgage insurer is its net worth or surplus, contingency reserve and a portion of the reserves for unearned premiums
/ N
N/A
Not applicable for the period presented
NAIC
The National Association of Insurance Commissioners
NIW
New Insurance Written, is the aggregate original principal amount of the mortgages that are insured during a period
MGIC Investment Corporation - Q3 2018 |
5
N/M
Data, or calculation, deemed not meaningful for the period presented
NPE
The amount of premiums earned, net of premiums assumed and ceded under reinsurance agreements
NPL
Non-performing loan, which is a delinquent loan, at any stage in its delinquency
NPW
The amount of premiums written, net of premiums assumed and ceded under reinsurance agreements
/ O
OCI
Office of the Commissioner of Insurance of the State of Wisconsin
/ P
Persistency
The percentage of our insurance remaining in force from one year prior
PMI
Private Mortgage Insurance (as an industry or product type)
PMIERs
Private Mortgage Insurer Eligibility Requirements issued by the GSEs
Premium Yield
The ratio of NPE divided by the average IIF outstanding for the period measured
/ Q
QSR Transaction
Quota share reinsurance transaction
/ R
REMIC
Real Estate Mortgage Investment Conduit
RESPA
Real Estate Settlement Procedures Act
RIF
Risk in force, which for an individual loan insured by us, is equal to the unpaid loan principal balance, as reported to us, multiplied by the insurance coverage percentage. RIF is sometimes referred to as exposure.
Risk-to-capital
Under certain state regulations, the ratio of RIF,
net of reinsurance and exposure on policies currently in default and for which loss reserves have been established,
to the level of statutory capital
RMBS
Residential mortgage-backed securities
/ S
State Capital Requirements
Under certain state regulations, the minimum amount of statutory capital relative to risk in force (or similar measure)
/ T
Tax Act
The U.S. tax reform enacted on December 22, 2017 and commonly referred to as the “Tax Cuts and Jobs Act”
/ U
Underwriting expense ratio
The ratio, expressed as a percentage, of the underwriting and operating expenses, net and amortization of DAC of our combined insurance operations (which excludes underwriting and operating expenses of our non-insurance subsidiaries) to NPW
Underwriting profit
NPE minus incurred losses and underwriting expenses
USDA
U.S. Department of Agriculture
/ V
VA
U.S. Department of Veterans Affairs
VIE
Variable interest entity
MGIC Investment Corporation - Q3 2018 |
6
|
MGIC INVESTMENT CORPORATION AND SUBSIDIARIES
|
||||||||||||
|
CONSOLIDATED BALANCE SHEETS
|
||||||||||||
|
(In thousands)
|
Note
|
September 30,
2018 |
December 31,
2017 |
|||||||||
|
ASSETS
|
(Unaudited)
|
|||||||||||
|
Investment portfolio:
|
||||||||||||
|
Fixed income, available for sale, at fair value (amortized cost, 2018 - $5,042,011; 2017 - $4,946,278)
|
$
|
4,969,612
|
|
$
|
4,983,315
|
|
||||||
|
Equity securities, at fair value (cost, 2018 - $4,134; 2017 - $7,223)
|
7,720
|
|
7,246
|
|
||||||||
|
Other invested assets, at cost
|
3,100
|
|
—
|
|
||||||||
|
Total investment portfolio
|
4,980,432
|
|
4,990,561
|
|
||||||||
|
Cash and cash equivalents
|
266,997
|
|
99,851
|
|
||||||||
|
Accrued investment income
|
45,366
|
|
46,060
|
|
||||||||
|
Reinsurance recoverable on loss reserves
|
33,281
|
|
48,474
|
|
||||||||
|
Reinsurance recoverable on paid losses
|
3,111
|
|
3,872
|
|
||||||||
|
Premiums receivable
|
51,640
|
|
54,045
|
|
||||||||
|
Home office and equipment, net
|
50,055
|
|
44,936
|
|
||||||||
|
Deferred insurance policy acquisition costs
|
18,665
|
|
18,841
|
|
||||||||
|
Deferred income taxes, net
|
111,613
|
|
234,381
|
|
||||||||
|
Other assets
|
95,948
|
|
78,478
|
|
||||||||
|
Total assets
|
$
|
5,657,108
|
|
$
|
5,619,499
|
|
||||||
|
LIABILITIES AND SHAREHOLDERS’ EQUITY
|
||||||||||||
|
Liabilities:
|
||||||||||||
|
Loss reserves
|
$
|
721,046
|
|
$
|
985,635
|
|
||||||
|
Unearned premiums
|
407,614
|
|
392,934
|
|
||||||||
|
Federal Home Loan Bank advance
|
155,000
|
|
155,000
|
|
||||||||
|
Senior notes
|
419,425
|
|
418,560
|
|
||||||||
|
Convertible junior subordinated debentures
|
256,872
|
|
256,872
|
|
||||||||
|
Other liabilities
|
207,620
|
|
255,972
|
|
||||||||
|
Total liabilities
|
2,167,577
|
|
2,464,973
|
|
||||||||
|
Contingencies
|
|
|
|
|
||||||||
|
Shareholders’ equity:
|
||||||||||||
|
Common stock (one dollar par value, shares authorized 1,000,000; shares issued 2018 - 371,353; 2017 - 370,567; shares outstanding 2018 - 362,155; 2017 - 370,567)
|
371,353
|
|
370,567
|
|
||||||||
|
Paid-in capital
|
1,857,639
|
|
1,850,582
|
|
||||||||
|
Treasury stock at cost (shares 2018 - 9,198)
|
(100,059
|
)
|
—
|
|
||||||||
|
Accumulated other comprehensive loss, net of tax
|
(128,931
|
)
|
(43,783
|
)
|
||||||||
|
Retained earnings
|
1,489,529
|
|
977,160
|
|
||||||||
|
Total shareholders’ equity
|
3,489,531
|
|
3,154,526
|
|
||||||||
|
Total liabilities and shareholders’ equity
|
$
|
5,657,108
|
|
$
|
5,619,499
|
|
||||||
See accompanying notes to consolidated financial statements.
MGIC Investment Corporation - Q3 2018 |
7
|
MGIC INVESTMENT CORPORATION AND SUBSIDIARIES
|
||||||||||||||||||||
|
CONSOLIDATED STATEMENTS OF OPERATIONS (Unaudited)
|
||||||||||||||||||||
|
Three Months Ended September 30,
|
Nine Months Ended September 30,
|
|||||||||||||||||||
|
(In thousands, except per share data)
|
Note
|
2018
|
2017
|
2018
|
2017
|
|||||||||||||||
|
Revenues:
|
||||||||||||||||||||
|
Premiums written:
|
||||||||||||||||||||
|
Direct
|
$
|
280,229
|
|
$
|
287,918
|
|
$
|
824,989
|
|
$
|
828,986
|
|
||||||||
|
Assumed
|
(3,020
|
)
|
(91
|
)
|
(843
|
)
|
1,882
|
|
||||||||||||
|
Ceded
|
(25,326
|
)
|
(31,931
|
)
|
(79,921
|
)
|
(92,436
|
)
|
||||||||||||
|
Net premiums written
|
251,883
|
|
255,896
|
|
744,225
|
|
738,432
|
|
||||||||||||
|
Increase in unearned premiums, net
|
(1,457
|
)
|
(18,813
|
)
|
(14,728
|
)
|
(41,110
|
)
|
||||||||||||
|
Net premiums earned
|
250,426
|
|
237,083
|
|
729,497
|
|
697,322
|
|
||||||||||||
|
Investment income, net of expenses
|
36,380
|
|
30,402
|
|
103,003
|
|
89,595
|
|
||||||||||||
|
Net realized investment gains (losses)
|
1,114
|
|
(50
|
)
|
(1,112
|
)
|
(227
|
)
|
||||||||||||
|
Other revenue
|
2,525
|
|
2,925
|
|
6,827
|
|
7,862
|
|
||||||||||||
|
Total revenues
|
290,445
|
|
270,360
|
|
838,215
|
|
794,552
|
|
||||||||||||
|
Losses and expenses:
|
||||||||||||||||||||
|
Losses incurred, net
|
(1,518
|
)
|
29,747
|
|
8,877
|
|
84,705
|
|
||||||||||||
|
Amortization of deferred policy acquisition costs
|
3,156
|
|
2,985
|
|
8,573
|
|
7,799
|
|
||||||||||||
|
Other underwriting and operating expenses, net
|
43,655
|
|
39,888
|
|
131,587
|
|
119,164
|
|
||||||||||||
|
Interest expense
|
13,258
|
|
13,273
|
|
39,737
|
|
43,779
|
|
||||||||||||
|
Loss on debt extinguishment
|
—
|
|
—
|
|
—
|
|
65
|
|
||||||||||||
|
Total losses and expenses
|
58,551
|
|
85,893
|
|
188,774
|
|
255,512
|
|
||||||||||||
|
Income before tax
|
231,894
|
|
184,467
|
|
649,441
|
|
539,040
|
|
||||||||||||
|
Provision for income taxes
|
49,994
|
|
64,440
|
|
137,090
|
|
210,593
|
|
||||||||||||
|
Net income
|
$
|
181,900
|
|
$
|
120,027
|
|
$
|
512,351
|
|
$
|
328,447
|
|
||||||||
|
Earnings per share:
|
||||||||||||||||||||
|
Basic
|
$
|
0.50
|
|
$
|
0.32
|
|
$
|
1.40
|
|
$
|
0.91
|
|
||||||||
|
Diluted
|
$
|
0.49
|
|
$
|
0.32
|
|
$
|
1.36
|
|
$
|
0.86
|
|
||||||||
|
Weighted average common shares outstanding - basic
|
362,180
|
|
370,586
|
|
367,190
|
|
359,613
|
|
||||||||||||
|
Weighted average common shares outstanding - diluted
|
382,905
|
|
391,087
|
|
387,765
|
|
395,870
|
|
||||||||||||
See accompanying notes to consolidated financial statements.
MGIC Investment Corporation - Q3 2018 |
8
|
MGIC INVESTMENT CORPORATION AND SUBSIDIARIES
|
|||||||||||||||||||
|
CONSOLIDATED STATEMENTS OF COMPREHENSIVE INCOME (Unaudited)
|
|||||||||||||||||||
|
Three Months Ended September 30,
|
Nine Months Ended September 30,
|
||||||||||||||||||
|
(In thousands)
|
Note
|
2018
|
2017
|
2018
|
2017
|
||||||||||||||
|
Net income
|
$
|
181,900
|
|
$
|
120,027
|
|
$
|
512,351
|
|
$
|
328,447
|
|
|||||||
|
Other comprehensive (loss) income, net of tax:
|
|||||||||||||||||||
|
Change in unrealized investment gains and losses
|
(12,077
|
)
|
11,544
|
|
(86,452
|
)
|
49,414
|
|
|||||||||||
|
Benefit plan adjustments
|
440
|
|
(147
|
)
|
1,322
|
|
(442
|
)
|
|||||||||||
|
Foreign currency translation adjustment
|
—
|
|
—
|
|
—
|
|
31
|
|
|||||||||||
|
Other comprehensive (loss) income, net of tax
|
(11,637
|
)
|
11,397
|
|
(85,130
|
)
|
49,003
|
|
|||||||||||
|
Comprehensive income
|
$
|
170,263
|
|
$
|
131,424
|
|
$
|
427,221
|
|
$
|
377,450
|
|
|||||||
See accompanying notes to consolidated financial statements.
MGIC Investment Corporation - Q3 2018 |
9
|
MGIC INVESTMENT CORPORATION AND SUBSIDIARIES
|
|||||||||||
|
CONSOLIDATED STATEMENTS OF SHAREHOLDERS' EQUITY (Unaudited)
|
|||||||||||
|
Nine Months Ended September 30,
|
|||||||||||
|
(In thousands)
|
Note
|
2018
|
2017
|
||||||||
|
Common stock
|
|||||||||||
|
Balance, beginning of period
|
$
|
370,567
|
|
$
|
359,400
|
|
|||||
|
Net common stock issued under share-based compensation plans
|
786
|
|
776
|
|
|||||||
|
Issuance of common stock
|
—
|
|
10,386
|
|
|||||||
|
Balance, end of period
|
371,353
|
|
370,562
|
|
|||||||
|
Paid-in capital
|
|||||||||||
|
Balance, beginning of period
|
1,850,582
|
|
1,782,337
|
|
|||||||
|
Net common stock issued under share-based compensation plans
|
(8,917
|
)
|
(7,558
|
)
|
|||||||
|
Issuance of common stock
|
—
|
|
60,903
|
|
|||||||
|
Equity compensation
|
15,974
|
|
10,578
|
|
|||||||
|
Balance, end of period
|
1,857,639
|
|
1,846,260
|
|
|||||||
|
Treasury stock
|
|||||||||||
|
Balance, beginning of period
|
—
|
|
(150,359
|
)
|
|||||||
|
Repurchase of common stock
|
(100,059
|
)
|
—
|
|
|||||||
|
Reissuance of treasury stock, net
|
—
|
|
150,359
|
|
|||||||
|
Balance, end of period
|
(100,059
|
)
|
—
|
|
|||||||
|
Accumulated other comprehensive (loss) income
|
|||||||||||
|
Balance, beginning of period
|
(43,801
|
)
|
(75,100
|
)
|
|||||||
|
Other comprehensive (loss) income, net of tax
|
(85,130
|
)
|
49,003
|
|
|||||||
|
Balance, end of period
|
(128,931
|
)
|
(26,097
|
)
|
|||||||
|
Retained earnings
|
|||||||||||
|
Balance, beginning of period
|
977,178
|
|
632,717
|
|
|||||||
|
Net income
|
512,351
|
|
328,447
|
|
|||||||
|
Reissuance of treasury stock, net
|
—
|
|
(21,740
|
)
|
|||||||
|
Balance, end of period
|
1,489,529
|
|
939,424
|
|
|||||||
|
Total shareholders’ equity
|
$
|
3,489,531
|
|
$
|
3,130,149
|
|
|||||
See accompanying notes to consolidated financial statements.
MGIC Investment Corporation - Q3 2018 |
10
|
MGIC INVESTMENT CORPORATION AND SUBSIDIARIES
|
|||||||||
|
CONSOLIDATED STATEMENTS OF CASH FLOWS (Unaudited)
|
|||||||||
|
Nine Months Ended September 30,
|
|||||||||
|
(In thousands)
|
2018
|
2017
|
|||||||
|
Cash flows from operating activities:
|
|||||||||
|
Net income
|
$
|
512,351
|
|
$
|
328,447
|
|
|||
|
Adjustments to reconcile net income to net cash provided by operating activities:
|
|||||||||
|
Depreciation and amortization
|
45,267
|
|
48,882
|
|
|||||
|
Deferred tax expense
|
145,397
|
|
165,250
|
|
|||||
|
Net realized investment losses
|
1,112
|
|
227
|
|
|||||
|
Loss on debt extinguishment
|
—
|
|
65
|
|
|||||
|
Change in certain assets and liabilities:
|
|||||||||
|
Accrued investment income
|
694
|
|
1,145
|
|
|||||
|
Reinsurance recoverable on loss reserves
|
15,193
|
|
4,615
|
|
|||||
|
Reinsurance recoverable on paid losses
|
761
|
|
326
|
|
|||||
|
Premium receivable
|
2,405
|
|
(1,546
|
)
|
|||||
|
Deferred insurance policy acquisition costs
|
176
|
|
(1,265
|
)
|
|||||
|
Profit commission receivable
|
(9,098
|
)
|
(3,899
|
)
|
|||||
|
Loss reserves
|
(264,589
|
)
|
(333,662
|
)
|
|||||
|
Unearned premiums
|
14,680
|
|
41,079
|
|
|||||
|
Return premium accrual
|
(18,600
|
)
|
(18,000
|
)
|
|||||
|
Current income taxes
|
(75,393
|
)
|
34,974
|
|
|||||
|
Other, net
|
13,191
|
|
(10,282
|
)
|
|||||
|
Net cash provided by operating activities
|
383,547
|
|
256,356
|
|
|||||
|
Cash flows from investing activities:
|
|||||||||
|
Purchases of investments
|
(1,074,849
|
)
|
(775,043
|
)
|
|||||
|
Proceeds from sales of investments
|
338,939
|
|
233,198
|
|
|||||
|
Proceeds from maturity of fixed income securities
|
594,679
|
|
547,699
|
|
|||||
|
Net increase in payable for securities
|
43,679
|
|
3,738
|
|
|||||
|
Additions to property and equipment
|
(10,659
|
)
|
(12,121
|
)
|
|||||
|
Net cash used in investing activities
|
(108,211
|
)
|
(2,529
|
)
|
|||||
|
Cash flows from financing activities:
|
|||||||||
|
Proceeds from revolving credit facility
|
—
|
|
150,000
|
|
|||||
|
Repayment of revolving credit facility
|
—
|
|
(150,000
|
)
|
|||||
|
Purchase or repayment of convertible senior notes
|
—
|
|
(145,620
|
)
|
|||||
|
Payment of original issue discount - convertible senior notes
|
—
|
|
(4,504
|
)
|
|||||
|
Repurchase of common stock
|
(100,059
|
)
|
—
|
|
|||||
|
Payment of debt issuance costs
|
—
|
|
(1,630
|
)
|
|||||
|
Payment of withholding taxes related to share-based compensation net share settlement
|
(8,131
|
)
|
(6,782
|
)
|
|||||
|
Net cash used in financing activities
|
(108,190
|
)
|
(158,536
|
)
|
|||||
|
Net increase in cash and cash equivalents
|
167,146
|
|
95,291
|
|
|||||
|
Cash and cash equivalents at beginning of period
|
99,851
|
|
155,410
|
|
|||||
|
Cash and cash equivalents at end of period
|
$
|
266,997
|
|
$
|
250,701
|
|
|||
See accompanying notes to consolidated financial statements.
MGIC Investment Corporation - Q3 2018 |
11
MGIC INVESTMENT CORPORATION AND SUBSIDIARIES
NOTES TO CONSOLIDATED FINANCIAL STATEMENTS
September 30, 2018
(Unaudited)
MGIC Investment Corporation is a holding company which, through Mortgage Guaranty Insurance Corporation (“MGIC”), is principally engaged in the mortgage insurance business. We provide mortgage insurance to lenders throughout the United States and to government sponsored entities to protect against loss from defaults on low down payment residential mortgage loans. MGIC Assurance Corporation (“MAC”), an insurance subsidiary of MGIC, provides insurance for certain mortgages under Fannie Mae and Freddie Mac (the “GSEs”) credit risk transfer programs and is a participant in the Fannie Mae Enterprise-Paid Mortgage Insurance pilot.
The accompanying unaudited consolidated financial statements of MGIC Investment Corporation and its wholly-owned subsidiaries have been prepared in accordance with the instructions to Form 10-Q as prescribed by the Securities and Exchange Commission (“SEC”) for interim reporting and do not include all of the other information and disclosures required by accounting principles generally accepted in the United States of America (“GAAP”). These statements should be read in conjunction with the consolidated financial statements and notes thereto for the year ended
December 31, 2017
included in our 2017 Annual Report on Form 10-K. As used below, “we,” “our” and “us” refer to MGIC Investment Corporation’s consolidated operations or to MGIC Investment Corporation, as the context requires.
In the opinion of management, the accompanying financial statements include all adjustments, consisting primarily of normal recurring accruals, necessary to fairly state our consolidated financial position and consolidated results of operations for the periods indicated. The consolidated results of operations for the interim period may not be indicative of the results that may be expected for the year ending
December 31, 2018
.
Substantially all of our insurance written since 2008 has been for loans purchased by the GSEs. We operate under the Private Mortgage Insurer Eligibility Requirements ("PMIERs") of the GSEs that became effective December 31, 2015 and which have been amended from time to time. The financial requirements of the PMIERs require a mortgage insurer’s "Available Assets" (generally only the most liquid assets of an insurer) to equal or exceed its "Minimum Required Assets" (which are based on an insurer's book of insurance in force, calculated from tables of factors with several risk dimensions and subject to a floor amount). Based on our interpretation of the PMIERs, as of
September 30, 2018
, MGIC’s Available Assets are in excess of its Minimum Required Assets; and MGIC is in compliance with the financial requirements of the PMIERs and eligible to insure loans purchased by the GSEs.
Reclassifications
Certain reclassifications to
2017
amounts have been made in the accompanying financial statements to conform to the
2018
presentation.
Subsequent events
We have considered subsequent events through the date of this filing. Refer to
Note 16 - “Subsequent Events”
for information regarding MGIC’s execution of a fully collateralized excess of loss reinsurance agreement.
MGIC Investment Corporation - Q3 2018 |
12
Accounting standards effective in 2018, or early adopted, and relevant to our financial statements
Table
2.1
shows the relevant amendments to accounting standards that we implemented for the year beginning January 1, 2018; none had a material impact on our consolidated financial statements or disclosures.
|
Table
|
2.1
|
||||
|
Standard / Interpretation
|
|||||
|
Amended Standards
|
Effective date
|
||||
|
ASC 718
|
Compensation - Stock Compensation
|
||||
|
•
|
ASU 2017-09 - Scope of Modification Accounting
|
January 1, 2018
|
|||
|
ASC 310
|
Receivables - Nonrefundable Fees and Other Costs
|
||||
|
•
|
ASU 2017-08 - Premium Amortization on Purchased Callable Debt Securities
|
January 1, 2019
|
|||
|
ASC 715
|
Compensation - Retirement Benefits
|
||||
|
•
|
ASU 2017-07 - Improving the Presentation of Net Periodic Pension Cost and Net Periodic Postretirement Benefit Cost
|
January 1, 2018
|
|||
|
ASC 825
|
Financial Instruments - Overall
|
||||
|
•
|
ASU 2016-01 - Recognition and Measurement of Financial Assets and Financial Liabilities
|
January 1, 2018
|
|||
Stock Compensation - Scope of Modification Accounting
In May 2017, the FASB issued updated guidance related to a change in the terms or conditions (modification) of a share-based award. The updated guidance provides that an entity should account for the effects of a modification unless the fair value and vesting conditions of the modified award and the classification of the award (equity or liability instrument) are the same as the original award immediately before the modification. The updated guidance is effective for annual periods beginning after December 15, 2017, including interim periods within those annual periods.
|
◦
|
Adoption impact: The adoption of this guidance had no impact on our consolidated financial statements or disclosures.
|
Premium Amortization on Purchased Callable Debt Securities
In March 2017, the FASB issued updated guidance to amend the amortization period for certain purchased callable debt securities held at a premium, shortening the amortization period to the earliest call date. This updated guidance aligns with how callable debt securities, in the United States, are generally quoted, priced, and traded, which incorporates consideration of calls (also referred to as “yield-to-worst” pricing). The updated guidance is effective for annual periods beginning after December 15, 2018, including interim periods within those annual periods, but allows for early adoption.
|
◦
|
Adoption impact: We adopted this guidance as of January 1, 2018 with no impact to our consolidated financial statements or disclosures as our accounting policy adhered to the updated guidance.
|
Improving the Presentation of Net Periodic Pension Cost and Net Periodic Postretirement Benefit Cost
In March 2017, the FASB issued updated guidance intended to improve the reporting of net benefit cost in the financial statements. The updated guidance requires that an employer report the service cost component of pension and post-retirement benefit costs in the same financial statement caption as other compensation costs arising from services rendered by employees during the period. The other components of net benefit cost are required to be presented in the statement of operations separately from the service cost component and outside a subtotal of income from operations, if one is presented. Previous guidance did not prescribe where the amount of net benefit cost should be presented in an employer’s statement of operations and did not require entities to disclose by line item the amount of net benefit cost that is included in the statement of operations. The updated guidance is effective for annual periods beginning after December 15, 2017, including interim periods within those annual periods.
MGIC Investment Corporation - Q3 2018 |
13
|
◦
|
Adoption impact: The adoption of this guidance had no impact on our consolidated financial statements or disclosures as the service cost component is reported in the same financial statement caption as other compensation costs and we do not present a subtotal of income outside of income from operations. The service cost component of our benefit plans is disclosed in
Note 10 - “Benefit Plans”
to our consolidated financial statements.
|
Recognition and Measurement of Financial Assets and Financial Liabilities
In January 2016, the FASB issued updated guidance to address the recognition, measurement, presentation, and disclosure of certain financial instruments. The updated guidance requires equity investments, except those accounted for under the equity method of accounting, that have a readily determinable fair value to be measured at fair value with changes in fair value recognized in net income. Equity investments that do not have readily determinable fair values may be remeasured at fair value either upon the occurrence of an observable price change or upon identification of an impairment. A qualitative assessment for impairment is required for equity investments without readily determinable fair values. The updated guidance also eliminates the requirement to disclose the method and significant assumptions used to estimate the fair value of financial instruments measured at amortized cost on the balance sheet. Further, the updated guidance clarifies that entities should evaluate the need for a valuation allowance on a deferred tax asset related to available-for-sale securities in combination with the entities’ other deferred tax assets. The updated guidance is effective for annual periods beginning after December 15, 2017, including interim periods within those annual periods and requires recognition of a cumulative effect adjustment at adoption.
|
◦
|
Adoption impact: The adoption of this guidance resulted in an immaterial cumulative effect adjustment to our 2018 beginning accumulated other comprehensive (loss) income and retained earnings to recognize unrealized gains on equity investments. At December 31, 2017, equity investments were classified as available-for-sale on the consolidated balance sheet. Upon adoption, the updated guidance eliminated the available-for-sale balance sheet classification for equity securities.
|
In February 2018, the FASB issued a separate update for technical corrections and improvements to clarify certain aspects of the guidance described above. This update clarifies the presentation of investments in, among other things, Federal Home Loan Bank stock and prohibits those investments from being shown with equity securities.
|
◦
|
Adoption impact: At March 31, 2018, and periods subsequent, the value of our investment in Federal Home Loan Bank of Chicago (“FHLB”) stock, which is carried at cost, is presented within “Other invested assets” on our consolidated balance sheet.
|
Prospective Accounting Standards
Table
2.2
shows the relevant new amendments to accounting standards, which are not yet effective or adopted.
|
Table
|
2.2
|
||||
|
Standard / Interpretation
|
Effective date
|
||||
|
Amended Standards
|
|||||
|
ASC 326
|
Financial Instruments - Credit Losses
|
||||
|
•
|
ASU 2016-13 - Measurement of Credit Losses on Financial Instruments
|
January 1, 2020
|
|||
|
ASC 820
|
Fair Value Measurement
|
||||
|
•
|
ASU 2018-13 - Changes to the Disclosure Requirements for Fair Value Measurements
|
January 1, 2020
|
|||
|
ASC 715
|
Compensation - Retirement Benefits
|
||||
|
•
|
ASU 2018-14 - Changes to the Disclosure Requirements for Defined Benefit Plans
|
January 1, 2021
|
|||
Measurement of Credit Losses on Financial Instruments
In June 2016, the FASB issued updated guidance that requires immediate recognition of estimated credit losses expected to occur over the remaining life of many financial instruments. Entities will be required to utilize a current expected credit losses (“CECL”) methodology that incorporates their forecast of future
MGIC Investment Corporation - Q3 2018 |
14
economic conditions into their loss estimate unless such forecast is not reasonable and supportable, in which case the entity will revert to historical loss experience. Any allowance for CECL reduces the amortized cost basis of the financial instrument to the amount an entity expects to collect. Credit losses relating to available-for-sale fixed maturity securities are to be recorded through an allowance for credit losses, rather than a write-down of the asset, with the amount of the allowance limited to the amount by which fair value is less than amortized cost. In addition, the length of time a security has been in an unrealized loss position will no longer impact the determination of whether a credit loss exists. The updated guidance is not prescriptive about certain aspects of estimating expected credit losses, including the specific methodology to use, and therefore will require significant judgment in application. The updated guidance is effective for annual periods beginning after December 15, 2019, including interim periods within those annual periods. Early adoption is permitted for annual and interim periods in fiscal years beginning after December 15, 2018. We are currently evaluating the impacts the adoption of this guidance will have on our consolidated financial statements, but do not expect it to have a material impact on our consolidated financial statements or disclosures.
Changes to the Disclosure Requirements for Fair Value Measurement
In August 2018, the FASB issued updated guidance that changes the disclosure requirements for fair value measurements. The updated guidance removed the requirement to disclose the amount of and reasons for transfers between Level 1 and Level 2 of the fair value hierarchy; the policy for timing of transfers between levels; and the valuation processes for Level 3 fair value measurements. The updated guidance clarifies that the measurement uncertainty disclosure is to communicate information about the uncertainty in measurements as of the reporting date. Further, the updated guidance will require disclosure of changes in unrealized gains and losses for the period included in other comprehensive income for recurring Level 3 fair value measurements held at the end of the reporting period; and the range and weighted average of significant unobservable inputs used to develop Level 3 fair value measurements. The updated guidance is effective for annual periods beginning after December 15, 2019, including interim periods within those annual periods. Early adoption was permitted upon issuance of this update. An entity is permitted to early adopt any guidance that removed or modified disclosures upon issuance of this update and to delay adoption of the additional disclosures until its effective date. We are currently evaluating the impacts the adoption of this guidance will have on our consolidated financial statement disclosures, but do not expect it to have a material impact.
Changes to the Disclosure Requirements for Defined Benefit Plans
In August 2018, the FASB issued amendments to modify the disclosure requirements for defined benefit plans. The updated guidance removed the requirements to identify amounts that are expected to be reclassified out of accumulated other comprehensive income and recognized as components of net periodic benefit cost in the coming year and the effects of a one-percentage-point change in assumed health care cost trend rates on service and interest cost and on the postretirement benefit obligation. The updated guidance added disclosures for the weighted-average interest crediting rates for cash balance plans and other plans with interest crediting rates and explanations for significant gains and losses related to changes in the benefit obligation for the period. The updated guidance is effective for annual periods beginning after December 15, 2020. Early adoption is permitted. An entity should apply the amendments on a retrospective basis to all periods presented. We are currently evaluating the impacts the adoption of this guidance will have on our consolidated financial statement disclosures, but do not expect it to have a material impact.
MGIC Investment Corporation - Q3 2018 |
15
Debt obligations
The par value of our long-term debt obligations and their aggregate carrying values as of
September 30, 2018
and
December 31, 2017
are presented in table
3.1
below.
|
Table
|
3.1
|
|||||||||
|
Long-term debt obligations
|
(In millions)
|
September 30,
2018 |
December 31,
2017 |
|||||||
|
FHLB Advance
|
$
|
155.0
|
|
$
|
155.0
|
|
||||
|
5.75% Senior Notes
|
425.0
|
|
425.0
|
|
||||||
|
9% Convertible Junior Subordinated Debentures
(1)
|
256.9
|
|
256.9
|
|
||||||
|
Long-term debt, par value
|
836.9
|
|
836.9
|
|
||||||
|
Debt issuance costs
|
(5.6
|
)
|
(6.5
|
)
|
||||||
|
Long-term debt, carrying value
|
$
|
831.3
|
|
$
|
830.4
|
|
||||
|
(1)
|
Convertible at any time prior to maturity at the holder’s option, at an initial conversion rate, which is subject to adjustment, of
74.0741
shares per
$1,000
principal amount, representing an initial conversion price of approximately
$13.50
per share. If a holder elects to convert its debentures, deferred interest owed on the debentures being converted is also converted into shares of our common stock. The conversion rate for any deferred interest is based on the average price that our shares traded at during a
5
-day period immediately prior to the election to convert. In lieu of issuing shares of common stock upon conversion of the debentures, we may, at our option, make a cash payment to converting holders for all or some of the shares of our common stock otherwise issuable upon conversion.
|
The
5.75%
Senior Notes,
9%
Convertible Junior Subordinated Debentures, and any amounts drawn on our revolving credit facility, are obligations of our holding company, MGIC Investment Corporation, and not of its subsidiaries. In addition to interest on amounts drawn, the unused portion of our revolving credit facility is subject to recurring commitment fees, which are reflected in interest payments. The Federal Home Loan Bank Advance (the “FHLB Advance”) is an obligation of MGIC.
Table
3.2
below presents interest payments on our debt obligations.
|
Table
|
3.2
|
|||||||||
|
Interest payments on debt obligations
|
Nine Months Ended September 30,
|
|||||||||
|
(In millions)
|
2018
|
2017
|
||||||||
|
Revolving credit facility
|
$
|
0.5
|
|
$
|
0.5
|
|
||||
|
FHLB Advance
|
2.3
|
|
2.2
|
|
||||||
|
5% Convertible Senior Notes
|
—
|
|
3.6
|
|
||||||
|
2% Convertible Senior Notes
|
—
|
|
2.1
|
|
||||||
|
5.75% Senior Notes
|
24.4
|
|
25.1
|
|
||||||
|
9% Convertible Junior Subordinated Debentures
|
11.6
|
|
11.6
|
|
||||||
|
Total interest payments
|
$
|
38.8
|
|
$
|
45.1
|
|
||||
MGIC Investment Corporation - Q3 2018 |
16
The reinsurance agreements to which we are a party, excluding captive agreements (which were immaterial), are discussed below. The effect of all of our reinsurance agreements on premiums earned and losses incurred is shown in table
4.1
below.
|
Table
|
4.1
|
|||||||||||||||||
|
Effect of Reinsurance
|
|
Three Months Ended September 30,
|
Nine Months Ended September 30,
|
|||||||||||||||
|
(In thousands)
|
2018
|
2017
|
2018
|
2017
|
||||||||||||||
|
Premiums earned:
|
||||||||||||||||||
|
Direct
|
$
|
275,044
|
|
$
|
268,709
|
|
$
|
808,531
|
|
$
|
789,317
|
|
||||||
|
Assumed
|
709
|
|
312
|
|
936
|
|
472
|
|
||||||||||
|
Ceded
|
(25,327
|
)
|
(31,938
|
)
|
(79,970
|
)
|
(92,467
|
)
|
||||||||||
|
Net premiums earned
|
$
|
250,426
|
|
$
|
237,083
|
|
$
|
729,497
|
|
$
|
697,322
|
|
||||||
|
Losses incurred:
|
||||||||||||||||||
|
Direct
|
$
|
(2,081
|
)
|
$
|
35,313
|
|
$
|
12,642
|
|
$
|
99,122
|
|
||||||
|
Assumed
|
55
|
|
(97
|
)
|
45
|
|
69
|
|
||||||||||
|
Ceded
|
508
|
|
(5,469
|
)
|
(3,810
|
)
|
(14,486
|
)
|
||||||||||
|
Losses incurred, net
|
$
|
(1,518
|
)
|
$
|
29,747
|
|
$
|
8,877
|
|
$
|
84,705
|
|
||||||
Quota share reinsurance
We utilize quota share reinsurance to manage our exposure to losses resulting from our mortgage guaranty insurance policies and to provide reinsurance capital credit under the PMIERs.
Each of the reinsurers under our QSR Transactions has an insurer financial strength rating of A- or better by Standard and Poor’s Rating Services, A.M. Best or both.
2018 QSR Transaction.
We entered into a QSR transaction with a group of unaffiliated reinsurers with an effective date of January 1, 2018 (“2018 QSR Transaction”), which provides coverage on eligible new business written in 2018. Under the 2018 QSR Transaction, we will cede losses incurred and premiums on or after the effective date through December 31, 2029, at which time the agreement expires. Early termination of the agreement can be elected by us effective December 31, 2021, and annually thereafter, for a fee, or under specified scenarios for
no
fee upon prior written notice, including if we will receive less than
90%
of the full credit amount under the PMIERs for the risk ceded in any required calculation period.
The structure of the 2018 QSR Transaction is a
30%
quota share for all policies covered, with a
20%
ceding commission as well as a profit commission. Generally, under the 2018 QSR Transaction, we will receive a profit commission provided that the loss ratio on the loans covered under the agreement remains below
62%
.
2017 and 2015 QSR Transactions.
Our 2017 quota share reinsurance agreement (“2017 QSR Transaction”) provides coverage on eligible new business written January 1, 2017 through December 29, 2017. Under the 2017 QSR Transaction we cede losses incurred and premiums on or after the effective date through December 31, 2028, at which time the agreement expires. Early termination of the agreement can be elected by us effective December 31, 2021 for a fee, or under specified scenarios for
no
fee upon prior written notice, including if we will receive less than
90%
of the full credit amount under the PMIERs for the risk ceded in any required calculation period.
Our 2015 quota share reinsurance agreement (“2015 QSR Transaction”) provides coverage on eligible business written before 2017. Under the 2015 QSR Transaction cedes losses incurred and premiums through December 31, 2024, at which time the agreement expires. Early termination of the agreement can be elected by us effective December 31, 2018 for a fee, or bi-annually thereafter, or under specified scenarios for
no
fee upon prior written notice, including if we will receive less than
90%
of the full credit amount under the PMIERs for the risk ceded in any required calculation period.
MGIC Investment Corporation - Q3 2018 |
17
The structure of both the 2017 QSR Transaction and 2015 QSR Transaction is a
30%
quota share for all policies covered, with a
20%
ceding commission as well as a profit commission. Generally, under the 2017 and 2015 QSR Transactions, we will receive a profit commission provided that the loss ratio on the loans covered under the agreement remains below
60%
.
Table
4.2
below presents a summary of our quota share reinsurance agreements, excluding captive agreements (which were immaterial), for the
three and nine
months ended
September 30,
2018
and
2017
.
|
Table
|
4.2
|
|||||||||||||||||
|
Quota share reinsurance
|
|
Three Months Ended September 30,
|
Nine Months Ended September 30,
|
|||||||||||||||
|
(In thousands)
|
2018
|
2017
|
2018
|
2017
|
||||||||||||||
|
Ceded premiums written and earned, net of profit commission
(1)
|
$
|
25,248
|
|
$
|
30,880
|
|
$
|
79,716
|
|
$
|
88,692
|
|
||||||
|
Ceded losses incurred
|
(522
|
)
|
5,879
|
|
3,531
|
|
14,990
|
|
||||||||||
|
Ceding commissions
(2)
|
12,983
|
|
12,500
|
|
38,268
|
|
36,751
|
|
||||||||||
|
Profit commission
|
39,664
|
|
31,621
|
|
111,622
|
|
95,063
|
|
||||||||||
|
(1)
|
Under our QSR Transactions, premiums are ceded on an earned and received basis as defined in the agreements.
|
|
(2)
|
Ceding commissions are reported within Other underwriting and operating expenses, net on the consolidated statements of operations.
|
Under the terms of the QSR Transactions, ceded premiums, ceding commission and profit commission are settled net on a quarterly basis. The ceded premiums due after deducting the related ceding commission and profit commission is reported within “Other liabilities” on the consolidated balance sheets.
The reinsurance recoverable on loss reserves related to our QSR Transactions was
$33.1 million
as of
September 30, 2018
and
$39.3 million
as of
December 31, 2017
. The reinsurance recoverable balance is secured by funds on deposit from the reinsurers which are based on the funding requirements of PMIERs that address ceded risk.
Excess of Loss reinsurance
Refer to
Note 16 - “Subsequent Events,”
for further information about our excess of loss reinsurance agreement entered into in October 2018. The excess of loss reinsurance agreement covers losses beginning August 1, 2018, but had no material impact on our consolidated financial statements as of and for the three and nine months ended September 30, 2018.
Before paying an insurance claim, we review the loan and servicing files to determine the appropriateness of the claim amount. When reviewing the files, we may determine that we have the right to rescind coverage on the loan. We refer to insurance rescissions and denials of claims collectively as “rescissions” and variations of that term. In addition, our insurance policies generally provide that we can reduce or deny a claim if the servicer did not comply with its obligations under our insurance policy. We call such reduction of claims “curtailments.” In recent quarters, an immaterial percentage of claims received in a quarter have been resolved by rescissions. In each of 2017 and the first nine months of 2018, curtailments reduced our average claim paid by approximately
5.6%
and
6.3%
, respectively.
Our loss reserving methodology incorporates our estimates of future rescissions, curtailments, and reversals of rescissions and curtailments. A variance between ultimate actual rescission, curtailment and reversal rates and our estimates, as a result of the outcome of litigation, settlements or other factors, could materially affect our losses.
When the insured disputes our right to rescind coverage or curtail claims, we generally engage in discussions in an attempt to settle the dispute. If we are unable to reach a settlement, the outcome of a dispute ultimately may be determined by legal proceedings.
MGIC Investment Corporation - Q3 2018 |
18
Under ASC 450-20, until a liability associated with settlement discussions or legal proceedings becomes probable and can be reasonably estimated, we consider our claim payment or rescission resolved for financial reporting purposes and do not accrue an estimated loss. Where we have determined that a loss is probable and can be reasonably estimated, we have recorded our best estimate of our probable loss.
In addition to matters for which we have recorded a probable loss, we are involved in other discussions and/or proceedings with insureds with respect to our claims paying practices. Although it is reasonably possible that when these matters are resolved we will not prevail in all cases, we are unable to make a reasonable estimate or range of estimates of the potential liability. We estimate the maximum exposure associated with matters where a loss is reasonably possible to be approximately
$286 million
. This estimate of maximum exposure is based upon currently available information and is subject to significant judgment, numerous assumptions and known and unknown uncertainties. The matters underlying the estimate of maximum exposure will change from time to time. This estimate of our maximum exposure does not include interest or consequential or exemplary damages.
Mortgage insurers, including MGIC, have been involved in litigation and regulatory actions related to alleged violations of the anti-referral fee provisions of the Real Estate Settlement Procedures Act, which is commonly known as RESPA, and the notice provisions of the Fair Credit Reporting Act, which is commonly known as FCRA. While these proceedings in the aggregate have not resulted in material liability for MGIC, there can be no assurance that the outcome of future proceedings, if any, under these laws would not have a material adverse affect on us. In addition, various regulators, including the CFPB, state insurance commissioners and state attorneys general may bring other actions seeking various forms of relief in connection with alleged violations of RESPA. The insurance law provisions of many states prohibit paying for the referral of insurance business and provide various mechanisms to enforce this prohibition. While we believe our practices are in conformity with applicable laws and regulations, it is not possible to predict the eventual scope, duration or outcome of any such reviews or investigations nor is it possible to predict their effect on us or the mortgage insurance industry.
Through a non-insurance subsidiary, we utilize our underwriting skills to provide an outsourced underwriting service to our customers known as contract underwriting. As part of the contract underwriting activities, that subsidiary is responsible for the quality of the underwriting decisions in accordance with the terms of the contract underwriting agreements with customers. That subsidiary may be required to provide certain remedies to its customers if certain standards relating to the quality of our underwriting work are not met, and we have an established reserve for such future obligations. Claims for remedies may be made a number of years after the underwriting work was performed. The underwriting remedy expense for 2017 and the first nine months of 2018 was immaterial to our consolidated financial statements.
In addition to the matters described above, we are involved in other legal proceedings in the ordinary course of business. In our opinion, based on the facts known at this time, the ultimate resolution of these ordinary course legal proceedings will not have a material adverse effect on our financial position or consolidated results of operations.
See
Note 11 – “Income Taxes”
for a description of federal income tax contingencies.
MGIC Investment Corporation - Q3 2018 |
19
Basic earnings per share (“EPS”) is calculated by dividing net income by the weighted average number of shares of common stock outstanding. For purposes of calculating basic EPS, vested restricted stock and restricted stock units (“RSUs”) are considered outstanding. Diluted EPS includes the components of basic EPS and also gives effect to dilutive common stock equivalents. We calculate diluted EPS using the treasury stock method and if-converted method. Under the treasury stock method, diluted EPS reflects the potential dilution that could occur if unvested RSUs result in the issuance of common stock. Under the if-converted method, diluted EPS reflects the potential dilution that could occur if our convertible debt instruments result in the issuance of common stock. The determination of potentially issuable shares does not consider the satisfaction of the conversion requirements and the shares are included in the determination of diluted EPS as of the beginning of the period, if dilutive. During the three and nine months ended
September 30, 2018
, we had
9%
Debentures outstanding that could result in potentially issuable shares.
Table
6.1
reconciles the numerators and denominators used to calculate basic and diluted EPS.
|
Table
|
6.1
|
|||||||||||||||||
|
Earnings per share
|
|
Three Months Ended September 30,
|
Nine Months Ended September 30,
|
|||||||||||||||
|
(In thousands, except per share data)
|
2018
|
2017
|
2018
|
2017
|
||||||||||||||
|
Basic earnings per share:
|
||||||||||||||||||
|
Net income
|
$
|
181,900
|
|
$
|
120,027
|
|
$
|
512,351
|
|
$
|
328,447
|
|
||||||
|
Weighted average common shares outstanding - basic
|
362,180
|
|
370,586
|
|
367,190
|
|
359,613
|
|
||||||||||
|
Basic earnings per share
|
$
|
0.50
|
|
$
|
0.32
|
|
$
|
1.40
|
|
$
|
0.91
|
|
||||||
|
Diluted earnings per share:
|
||||||||||||||||||
|
Net income
|
$
|
181,900
|
|
$
|
120,027
|
|
$
|
512,351
|
|
$
|
328,447
|
|
||||||
|
Interest expense, net of tax
(1)
:
|
||||||||||||||||||
|
2% Convertible Senior Notes
|
—
|
|
—
|
|
—
|
|
907
|
|
||||||||||
|
5% Convertible Senior Notes
|
—
|
|
—
|
|
—
|
|
1,709
|
|
||||||||||
|
9% Convertible Junior Subordinated Debentures
|
4,566
|
|
3,757
|
|
13,698
|
|
11,270
|
|
||||||||||
|
Diluted income available to common shareholders
|
$
|
186,466
|
|
$
|
123,784
|
|
$
|
526,049
|
|
$
|
342,333
|
|
||||||
|
Weighted average common shares outstanding - basic
|
362,180
|
|
370,586
|
|
367,190
|
|
359,613
|
|
||||||||||
|
Effect of dilutive securities:
|
||||||||||||||||||
|
Unvested RSUs
|
1,697
|
|
1,473
|
|
1,547
|
|
1,367
|
|
||||||||||
|
2% Convertible Senior Notes
|
—
|
|
—
|
|
—
|
|
11,119
|
|
||||||||||
|
5% Convertible Senior Notes
|
—
|
|
—
|
|
—
|
|
4,743
|
|
||||||||||
|
9% Convertible Junior Subordinated Debentures
|
19,028
|
|
19,028
|
|
19,028
|
|
19,028
|
|
||||||||||
|
Weighted average common shares outstanding - diluted
|
382,905
|
|
391,087
|
|
387,765
|
|
395,870
|
|
||||||||||
|
Diluted earnings per share
|
$
|
0.49
|
|
$
|
0.32
|
|
$
|
1.36
|
|
$
|
0.86
|
|
||||||
|
(1)
|
The periods ended
September 30,
2018
and
2017
were tax-effected at a rate of 21% and
35%
, respectively.
|
MGIC Investment Corporation - Q3 2018 |
20
Fixed income securities
The amortized cost, gross unrealized gains and losses, and fair value of investments in fixed income securities classified as available-for-sale at
September 30, 2018
and
December 31, 2017
are shown in tables
7.1a
and
7.1b
below.
|
Table
|
7.1a
|
|||||||||||||||||
|
Details of fixed income securities by category - current year
|
September 30, 2018
|
|||||||||||||||||
|
(In thousands)
|
Amortized Cost
|
Gross Unrealized Gains
|
Gross Unrealized (Losses)
(1)
|
Fair Value
|
||||||||||||||
|
U.S. Treasury securities and obligations of U.S. government corporations and agencies
|
$
|
179,395
|
|
$
|
174
|
|
$
|
(3,353
|
)
|
$
|
176,216
|
|
||||||
|
Obligations of U.S. states and political subdivisions
|
1,738,417
|
|
17,797
|
|
(21,608
|
)
|
1,734,606
|
|
||||||||||
|
Corporate debt securities
|
2,296,218
|
|
1,152
|
|
(42,305
|
)
|
2,255,065
|
|
||||||||||
|
Asset backed securities (“ABS”)
|
71,481
|
|
—
|
|
(546
|
)
|
70,935
|
|
||||||||||
|
Residential mortgage backed securities (“RMBS”)
|
166,522
|
|
35
|
|
(11,594
|
)
|
154,963
|
|
||||||||||
|
Commercial mortgage backed securities (“CMBS”)
|
281,980
|
|
214
|
|
(11,974
|
)
|
270,220
|
|
||||||||||
|
Collateralized loan obligations (“CLO”)
|
307,998
|
|
67
|
|
(458
|
)
|
307,607
|
|
||||||||||
|
Total fixed income securities
|
5,042,011
|
|
19,439
|
|
(91,838
|
)
|
4,969,612
|
|
||||||||||
|
Table
|
7.1b
|
|||||||||||||||||
|
Details of fixed income securities by category - prior year-end
|
December 31, 2017
|
|||||||||||||||||
|
(In thousands)
|
Amortized Cost
|
Gross Unrealized Gains
|
Gross Unrealized (Losses)
(1)
|
Fair Value
|
||||||||||||||
|
U.S. Treasury securities and obligations of U.S. government corporations and agencies
|
$
|
179,850
|
|
$
|
274
|
|
$
|
(1,278
|
)
|
$
|
178,846
|
|
||||||
|
Obligations of U.S. states and political subdivisions
|
2,105,063
|
|
56,210
|
|
(8,749
|
)
|
2,152,524
|
|
||||||||||
|
Corporate debt securities
|
2,065,475
|
|
10,532
|
|
(9,169
|
)
|
2,066,838
|
|
||||||||||
|
ABS
|
4,925
|
|
—
|
|
(2
|
)
|
4,923
|
|
||||||||||
|
RMBS
|
189,153
|
|
60
|
|
(7,364
|
)
|
181,849
|
|
||||||||||
|
CMBS
|
301,014
|
|
1,204
|
|
(4,906
|
)
|
297,312
|
|
||||||||||
|
CLOs
|
100,798
|
|
304
|
|
(79
|
)
|
101,023
|
|
||||||||||
|
Total fixed income securities
|
4,946,278
|
|
68,584
|
|
(31,547
|
)
|
4,983,315
|
|
||||||||||
|
(1)
|
At
September 30, 2018
and
December 31, 2017
, there were no other-than-temporary impairment losses recorded in other comprehensive income.
|
We had
$13.4 million
and
$13.6 million
of investments at fair value on deposit with various states as of September 30, 2018 and December 31, 2017, respectively, due to regulatory requirements of those state insurance departments.
MGIC Investment Corporation - Q3 2018 |
21
The amortized cost and fair values of fixed income securities at
September 30, 2018
, by contractual maturity, are shown in table
7.2
below. Expected maturities will differ from contractual maturities because borrowers may have the right to call or prepay obligations with or without call or prepayment penalties. Because most ABS, RMBS, CMBS, and CLOs provide for periodic payments throughout their lives, they are listed in separate categories.
|
Table
|
7.2
|
|||||||||
|
Fixed income securities maturity schedule
|
September 30, 2018
|
|||||||||
|
(In thousands)
|
Amortized Cost
|
Fair Value
|
||||||||
|
Due in one year or less
|
$
|
511,087
|
|
$
|
509,952
|
|
||||
|
Due after one year through five years
|
1,552,123
|
|
1,526,802
|
|
||||||
|
Due after five years through ten years
|
940,185
|
|
918,757
|
|
||||||
|
Due after ten years
|
1,210,635
|
|
1,210,376
|
|
||||||
|
$
|
4,214,030
|
|
$
|
4,165,887
|
|
|||||
|
ABS
|
71,481
|
|
70,935
|
|
||||||
|
RMBS
|
166,522
|
|
154,963
|
|
||||||
|
CMBS
|
281,980
|
|
270,220
|
|
||||||
|
CLOs
|
307,998
|
|
307,607
|
|
||||||
|
Total as of September 30, 2018
|
$
|
5,042,011
|
|
$
|
4,969,612
|
|
||||
Proceeds from sales of fixed income securities classified as available-for-sale were
$338.9 million
and
$233.2 million
during the nine months ended
September 30, 2018
and
2017
, respectively. Gross gains of
$0.4 million
and
$0.9 million
and gross losses of
$3.3 million
and
$1.1 million
were realized on those sales during the nine months ended
September 30, 2018
and
2017
, respectively.
During the three and nine months ended September 30, 2018, we recorded other-than-temporary impairment (“OTTI”) losses of
$0.5 million
and
$1.8 million
, respectively, due to our intent to sell certain investments. During each of the
three and nine
months ended
September 30,
2017
, there were no OTTI losses recognized.
Equity securities
The cost and fair value of investments in equity securities at
September 30, 2018
and
December 31, 2017
are shown in tables
7.3a
and
7.3b
below. As described in
Note 2 - “New Accounting Pronouncements,”
under updated guidance regarding the “
Recognition and Measurement of Financial Assets and Financial Liabilities”
which
became effective on January 1, 2018, the
amount of our FHLB stock investment has been reclassified and presented in
“Other invested assets”
on our consolidated balance sheet as of September 30, 2018.
|
Table
|
7.3a
|
|||||||||||||||||
|
Details of equity security investments - current year
|
September 30, 2018
|
|||||||||||||||||
|
(In thousands)
|
Cost
|
Gross Gains
|
Gross Losses
|
Fair Value
|
||||||||||||||
|
Equity securities
|
$
|
4,134
|
|
$
|
3,667
|
|
$
|
(81
|
)
|
$
|
7,720
|
|
||||||
|
Table
|
7.3b
|
|||||||||||||||||
|
Details of equity security investments - prior year-end
|
December 31, 2017
|
|||||||||||||||||
|
(In thousands)
|
Cost
|
Gross Gains
|
Gross Losses
|
Fair Value
|
||||||||||||||
|
Equity securities
|
$
|
7,223
|
|
$
|
39
|
|
$
|
(16
|
)
|
$
|
7,246
|
|
||||||
For the nine months ended
September 30, 2018
, we recognized
$3.6 million
of net gains on equity securities still held as of
September 30, 2018
. The net gains reflect the fair value increase in certain equity securities of a privately held entity that were re-valued in the third quarter by independent parties and subsequently sold in a transaction completed in October 2018. The net gains are reported in Net realized investment gains (losses) on our consolidated statement of operations for the three and nine months ended September 30, 2018.
MGIC Investment Corporation - Q3 2018 |
22
Other invested assets
Other invested assets include an investment in FHLB stock that is carried at cost, which due to its nature approximates fair value. Ownership of FHLB stock provides access to a secured lending facility, and our current FHLB Advance amount is secured by eligible collateral whose fair value is maintained at a minimum of
102%
of the outstanding principal balance. As of
September 30, 2018
, that collateral consisted of fixed income securities included in our total investment portfolio, and cash and cash equivalents, with a total fair value of
$166.1 million
.
Unrealized investment losses
Tables
7.4a
and
7.4b
below summarize, for all available-for-sale investments in an unrealized loss position at
September 30, 2018
and
December 31, 2017
, the aggregate fair value and gross unrealized loss by the length of time those securities have been continuously in an unrealized loss position. The fair value amounts reported in tables
7.4a
and
7.4b
are estimated using the process described in
Note 8 - “Fair Value Measurements”
to these consolidated financial statements and in Note 3 - “Significant Accounting Policies” of the notes to the consolidated financial statements in our 2017 Annual Report on Form 10-K.
|
Table
|
7.4a
|
|||||||||||||||||||||||||
|
Investments unrealized losses - current year
|
September 30, 2018
|
|||||||||||||||||||||||||
|
Less Than 12 Months
|
12 Months or Greater
|
Total
|
||||||||||||||||||||||||
|
(In thousands)
|
Fair Value
|
Unrealized Losses
|
Fair Value
|
Unrealized Losses
|
Fair Value
|
Unrealized Losses
|
||||||||||||||||||||
|
U.S. Treasury securities and obligations of U.S. government corporations and agencies
|
$
|
89,759
|
|
$
|
(583
|
)
|
$
|
78,769
|
|
$
|
(2,770
|
)
|
$
|
168,528
|
|
$
|
(3,353
|
)
|
||||||||
|
Obligations of U.S. states and political subdivisions
|
643,147
|
|
(12,356
|
)
|
245,763
|
|
(9,252
|
)
|
888,910
|
|
(21,608
|
)
|
||||||||||||||
|
Corporate debt securities
|
1,782,640
|
|
(29,184
|
)
|
299,549
|
|
(13,121
|
)
|
2,082,189
|
|
(42,305
|
)
|
||||||||||||||
|
ABS
|
70,935
|
|
(546
|
)
|
—
|
|
—
|
|
70,935
|
|
(546
|
)
|
||||||||||||||
|
RMBS
|
4,930
|
|
(183
|
)
|
149,648
|
|
(11,411
|
)
|
154,578
|
|
(11,594
|
)
|
||||||||||||||
|
CMBS
|
81,972
|
|
(1,763
|
)
|
160,039
|
|
(10,211
|
)
|
242,011
|
|
(11,974
|
)
|
||||||||||||||
|
CLOs
|
201,700
|
|
(458
|
)
|
—
|
|
—
|
|
201,700
|
|
(458
|
)
|
||||||||||||||
|
Total
|
$
|
2,875,083
|
|
$
|
(45,073
|
)
|
$
|
933,768
|
|
$
|
(46,765
|
)
|
$
|
3,808,851
|
|
$
|
(91,838
|
)
|
||||||||
|
Table
|
7.4b
|
|||||||||||||||||||||||||
|
Investments unrealized losses - prior year-end
|
December 31, 2017
|
|||||||||||||||||||||||||
|
Less Than 12 Months
|
12 Months or Greater
|
Total
|
||||||||||||||||||||||||
|
(In thousands)
|
Fair Value
|
Unrealized
Losses
|
Fair Value
|
Unrealized
Losses
|
Fair Value
|
Unrealized
Losses
|
||||||||||||||||||||
|
U.S. Treasury securities and obligations of U.S. government corporations and agencies
|
$
|
144,042
|
|
$
|
(796
|
)
|
$
|
31,196
|
|
$
|
(482
|
)
|
$
|
175,238
|
|
$
|
(1,278
|
)
|
||||||||
|
Obligations of U.S. states and political subdivisions
|
505,311
|
|
(3,624
|
)
|
211,684
|
|
(5,125
|
)
|
716,995
|
|
(8,749
|
)
|
||||||||||||||
|
Corporate debt securities
|
932,350
|
|
(4,288
|
)
|
200,716
|
|
(4,881
|
)
|
1,133,066
|
|
(9,169
|
)
|
||||||||||||||
|
ABS
|
4,923
|
|
(2
|
)
|
—
|
|
—
|
|
4,923
|
|
(2
|
)
|
||||||||||||||
|
RMBS
|
14,979
|
|
(280
|
)
|
166,329
|
|
(7,084
|
)
|
181,308
|
|
(7,364
|
)
|
||||||||||||||
|
CMBS
|
51,096
|
|
(358
|
)
|
138,769
|
|
(4,548
|
)
|
189,865
|
|
(4,906
|
)
|
||||||||||||||
|
CLOs
|
14,243
|
|
(7
|
)
|
3,568
|
|
(72
|
)
|
17,811
|
|
(79
|
)
|
||||||||||||||
|
Equity securities
|
226
|
|
(2
|
)
|
431
|
|
(14
|
)
|
657
|
|
(16
|
)
|
||||||||||||||
|
Total
|
$
|
1,667,170
|
|
$
|
(9,357
|
)
|
$
|
752,693
|
|
$
|
(22,206
|
)
|
$
|
2,419,863
|
|
$
|
(31,563
|
)
|
||||||||
The unrealized losses in all categories of our investments at
September 30, 2018
and
December 31, 2017
were primarily caused by changes in interest rates between the time of purchase and the respective fair value measurement date. There were
810
and
586
securities in an unrealized loss position at
September 30, 2018
and
December 31, 2017
, respectively.
MGIC Investment Corporation - Q3 2018 |
23
Recurring fair value measurements
In accordance with fair value accounting guidance, we applied the following fair value hierarchy to measure fair value for assets and liabilities:
Level 1 - Quoted prices for identical instruments in active markets that we can access. Financial assets utilizing Level 1 inputs primarily include U.S. Treasury securities and equity securities.
Level 2 - Quoted prices for similar instruments in active markets that we can access; quoted prices for identical or similar instruments in markets that are not active; and inputs, other than quoted prices, that are observable in the marketplace for the instrument. The observable inputs are used in valuation models to calculate the fair value based on the type of instrument. Financial assets utilizing Level 2 inputs primarily include obligations of U.S. government corporations and agencies, corporate bonds, mortgage-backed securities, asset-backed securities, and most municipal bonds.
Level 3 - Valuations derived from valuation techniques in which one or more significant inputs or value drivers are unobservable. The inputs used to derive the fair value of Level 3 securities reflect our own assumptions about the assumptions a market participant would use in pricing an asset or liability, or for certain of our equity securities, independent fair market valuations provided to us. Our non-financial assets that are classified as Level 3 securities consist of real estate acquired through claim settlement. The fair value of real estate acquired is the lower of our acquisition cost or a percentage of the appraised value. The percentage applied to the appraised value is based upon our historical sales experience adjusted for current trends.
Assets measured at fair value, by hierarchy level, as of
September 30, 2018
and
December 31, 2017
are shown in tables
8.1a
and
8.1b
below. The fair value of the assets is estimated using the process described above, and more fully in Note 3 - “Significant Accounting Policies” of the notes to the consolidated financial statements in our 2017 Annual Report on Form 10-K.
|
Table
|
8.1a
|
|||||||||||||||||
|
Fair value hierarchy - current year
|
September 30, 2018
|
|||||||||||||||||
|
(In thousands)
|
Total Fair Value
|
Quoted Prices in Active Markets for Identical Assets
(Level 1)
|
Significant Other Observable Inputs
(Level 2)
|
Significant Unobservable Inputs
(Level 3)
|
||||||||||||||
|
U.S. Treasury securities and obligations of U.S. government corporations and agencies
|
$
|
176,216
|
|
$
|
29,584
|
|
$
|
146,632
|
|
$
|
—
|
|
||||||
|
Obligations of U.S. states and political subdivisions
|
1,734,606
|
|
—
|
|
1,734,529
|
|
77
|
|
||||||||||
|
Corporate debt securities
|
2,255,065
|
|
—
|
|
2,255,065
|
|
—
|
|
||||||||||
|
ABS
|
70,935
|
|
—
|
|
70,935
|
|
—
|
|
||||||||||
|
RMBS
|
154,963
|
|
—
|
|
154,963
|
|
—
|
|
||||||||||
|
CMBS
|
270,220
|
|
—
|
|
270,220
|
|
—
|
|
||||||||||
|
CLOs
|
307,607
|
|
—
|
|
307,607
|
|
—
|
|
||||||||||
|
Total fixed income securities
|
4,969,612
|
|
29,584
|
|
4,939,951
|
|
77
|
|
||||||||||
|
Equity securities
|
7,720
|
|
2,889
|
|
—
|
|
4,831
|
|
||||||||||
|
Total investments at fair value
|
$
|
4,977,332
|
|
$
|
32,473
|
|
$
|
4,939,951
|
|
$
|
4,908
|
|
||||||
|
Real estate acquired
(1)
|
$
|
12,339
|
|
$
|
—
|
|
$
|
—
|
|
$
|
12,339
|
|
||||||
MGIC Investment Corporation - Q3 2018 |
24
|
Table
|
8.1b
|
|||||||||||||||||
|
Fair value hierarchy - prior year-end
|
December 31, 2017
|
|||||||||||||||||
|
(In thousands)
|
Total Fair Value
|
Quoted Prices in Active Markets for Identical Assets
(Level 1)
|
Significant Other Observable Inputs
(Level 2)
|
Significant Unobservable Inputs
(Level 3)
|
||||||||||||||
|
U.S. Treasury securities and obligations of U.S. government corporations and agencies
|
$
|
178,846
|
|
$
|
81,598
|
|
$
|
97,248
|
|
$
|
—
|
|
||||||
|
Obligations of U.S. states and political subdivisions
|
2,152,524
|
|
—
|
|
2,152,253
|
|
271
|
|
||||||||||
|
Corporate debt securities
|
2,066,838
|
|
—
|
|
2,066,838
|
|
—
|
|
||||||||||
|
ABS
|
4,923
|
|
—
|
|
4,923
|
|
—
|
|
||||||||||
|
RMBS
|
181,849
|
|
—
|
|
181,849
|
|
—
|
|
||||||||||
|
CMBS
|
297,312
|
|
—
|
|
297,312
|
|
—
|
|
||||||||||
|
CLOs
|
101,023
|
|
—
|
|
101,023
|
|
—
|
|
||||||||||
|
Total fixed income securities
|
4,983,315
|
|
81,598
|
|
4,901,446
|
|
271
|
|
||||||||||
|
Equity securities
(2)
|
7,246
|
|
2,978
|
|
—
|
|
4,268
|
|
||||||||||
|
Total investments at fair value
|
$
|
4,990,561
|
|
$
|
84,576
|
|
$
|
4,901,446
|
|
$
|
4,539
|
|
||||||
|
Real estate acquired
(1)
|
$
|
12,713
|
|
$
|
—
|
|
$
|
—
|
|
$
|
12,713
|
|
||||||
|
(1)
|
Real estate acquired through claim settlement, which is held for sale, is reported in Other assets on the consolidated balance sheets.
|
|
(2)
|
Equity securities in Level 3 are carried at cost, which approximates fair value. See
“Reconciliations of Level 3 assets”
below for information regarding a change in presentation of amounts previously included in Level 3 Equity securities.
|
Reconciliations of Level 3 assets
For assets measured at fair value using significant unobservable inputs (Level 3), a reconciliation of the beginning and ending balances for the
three and nine
months ended
September 30, 2018
and
2017
is shown in tables
8.2a
and
8.2b
and
8.3a
and
8.3b
below. As described in Note 2 - “New Accounting Pronouncements,” under updated guidance regarding the
Recognition and Measurement of Financial Assets and Financial Liabilities
which became effective on January 1, 2018, our investment in FHLB stock is no longer presented with
equity securities. Prior to the updated guidance, our FHLB stock was included in our Level 3 equity securities. As shown in table
8.3a
below, for the
nine
months ended
September 30, 2018
, we have transferred our FHLB stock out of Level 3 assets, and it is carried at cost, which approximates fair value, on our consolidated balance sheet in
“Other invested assets”
as of
September 30, 2018
. There were no losses included in earnings for those periods attributable to the change in unrealized losses on assets still held at the end of the applicable period.
|
Table
|
8.2a
|
|||||||||||||||||
|
Development of assets and liabilities classified within level 3 - current year quarter
|
Three Months Ended September 30, 2018
|
|||||||||||||||||
|
(In thousands)
|
Debt Securities
|
Equity Securities
|
Total Investments
|
Real Estate Acquired
|
||||||||||||||
|
Balance at June 30, 2018
|
$
|
192
|
|
$
|
1,168
|
|
$
|
1,360
|
|
$
|
13,321
|
|
||||||
|
Total realized gains (losses):
|
|
|
|
|
|
|
|
|
||||||||||
|
Included in earnings and reported as net realized investment gains
|
—
|
|
3,663
|
|
3,663
|
|
—
|
|
||||||||||
|
Included in earnings and reported as losses incurred, net
|
—
|
|
—
|
|
—
|
|
(450
|
)
|
||||||||||
|
Purchases
|
—
|
|
—
|
|
—
|
|
7,979
|
|
||||||||||
|
Sales
|
(115
|
)
|
—
|
|
(115
|
)
|
(8,511
|
)
|
||||||||||
|
Balance at September 30, 2018
|
$
|
77
|
|
$
|
4,831
|
|
$
|
4,908
|
|
$
|
12,339
|
|
||||||
MGIC Investment Corporation - Q3 2018 |
25
|
Table
|
8.2b
|
|||||||||||||||||
|
Development of assets and liabilities classified within level 3 - prior year quarter
|
Three Months Ended September 30, 2017
|
|||||||||||||||||
|
(In thousands)
|
Debt
Securities |
Equity
Securities |
Total
Investments |
Real Estate
Acquired |
||||||||||||||
|
Balance at June 30, 2017
|
$
|
577
|
|
$
|
4,268
|
|
$
|
4,845
|
|
$
|
10,271
|
|
||||||
|
Total realized gains (losses):
|
|
|
|
|
|
|
|
|
||||||||||
|
Included in earnings and reported as losses incurred, net
|
—
|
|
—
|
|
—
|
|
(592
|
)
|
||||||||||
|
Purchases
|
—
|
|
—
|
|
—
|
|
8,881
|
|
||||||||||
|
Sales
|
(197
|
)
|
—
|
|
(197
|
)
|
(6,832
|
)
|
||||||||||
|
Balance at September 30, 2017
|
$
|
380
|
|
$
|
4,268
|
|
$
|
4,648
|
|
$
|
11,728
|
|
||||||
|
Table
|
8.3a
|
|||||||||||||||||
|
Development of assets and liabilities classified within level 3 - current year to date
|
Nine Months Ended September 30, 2018
|
|||||||||||||||||
|
(In thousands)
|
Debt Securities
|
Equity Securities
|
Total Investments
|
Real Estate Acquired
|
||||||||||||||
|
Balance at December 31, 2017
|
$
|
271
|
|
$
|
4,268
|
|
$
|
4,539
|
|
$
|
12,713
|
|
||||||
|
Transfers out of Level 3
|
—
|
|
(3,100
|
)
|
(3,100
|
)
|
—
|
|
||||||||||
|
Total realized gains (losses):
|
|
|
|
|
|
|
|
|
||||||||||
|
Included in earnings and reported as net realized investment gains
|
—
|
|
3,663
|
|
3,663
|
|
—
|
|
||||||||||
|
Included in earnings and reported as losses incurred, net
|
—
|
|
—
|
|
—
|
|
(1,104
|
)
|
||||||||||
|
Purchases
|
—
|
|
—
|
|
—
|
|
24,742
|
|
||||||||||
|
Sales
|
(194
|
)
|
—
|
|
(194
|
)
|
(24,012
|
)
|
||||||||||
|
Balance at September 30, 2018
|
$
|
77
|
|
$
|
4,831
|
|
$
|
4,908
|
|
$
|
12,339
|
|
||||||
|
Table
|
8.3b
|
|||||||||||||||||
|
Development of assets and liabilities classified within level 3 - prior year to date
|
Nine Months Ended September 30, 2017
|
|||||||||||||||||
|
(In thousands)
|
Debt
Securities |
Equity
Securities |
Total
Investments |
Real Estate
Acquired |
||||||||||||||
|
Balance at December 31, 2016
|
$
|
691
|
|
$
|
4,268
|
|
$
|
4,959
|
|
$
|
11,748
|
|
||||||
|
Total realized gains (losses):
|
|
|
|
|
|
|
|
|
||||||||||
|
Included in earnings and reported as losses incurred, net
|
—
|
|
—
|
|
—
|
|
(818
|
)
|
||||||||||
|
Purchases
|
—
|
|
—
|
|
—
|
|
26,985
|
|
||||||||||
|
Sales
|
(311
|
)
|
—
|
|
(311
|
)
|
(26,187
|
)
|
||||||||||
|
Balance at September 30, 2017
|
$
|
380
|
|
$
|
4,268
|
|
$
|
4,648
|
|
$
|
11,728
|
|
||||||
Certain financial instruments, including insurance contracts, are excluded from these fair value disclosure requirements. The carrying values of cash and cash equivalents (Level 1) and accrued investment income (Level 2) approximated their fair values. Additional fair value disclosures related to our investment portfolio are included in
Note 7 – “Investments.”
Financial liabilities not measured at fair value
We incur financial liabilities in the normal course of our business. Table
8.4
presents the carrying value and fair value of our financial liabilities disclosed, but not carried, at fair value at
September 30, 2018
and
December 31, 2017
. The fair values of our
5.75%
Senior Notes and
9%
Convertible Junior Subordinated Debentures were based on observable market prices. The fair value of the FHLB Advance was estimated using cash flows discounted at current incremental borrowing rates for similar borrowing arrangements. In all cases the fair values of the financial liabilities below are categorized as Level 2.
MGIC Investment Corporation - Q3 2018 |
26
|
Table
|
8.4
|
|||||||||||||||||
|
Fair value measurements - liabilities
|
September 30, 2018
|
December 31, 2017
|
||||||||||||||||
|
(In thousands)
|
Carrying Value
|
Fair Value
|
Carrying Value
|
Fair Value
|
||||||||||||||
|
FHLB Advance
|
$
|
155,000
|
|
$
|
148,288
|
|
$
|
155,000
|
|
$
|
152,124
|
|
||||||
|
5.75% Senior Notes
|
419,425
|
|
445,430
|
|
418,560
|
|
465,473
|
|
||||||||||
|
9% Convertible Junior Subordinated Debentures
|
256,872
|
|
347,458
|
|
256,872
|
|
353,507
|
|
||||||||||
|
Total financial liabilities
|
$
|
831,297
|
|
$
|
941,176
|
|
$
|
830,432
|
|
$
|
971,104
|
|
||||||
The pretax and related income tax (expense) benefit components of our other comprehensive income (loss) for the
three and nine
months ended
September 30, 2018
and
2017
are included in table
9.1
below.
|
Table
|
9.1
|
|||||||||||||||||
|
Components of other comprehensive (loss) income
|
Three Months Ended September 30,
|
Nine Months Ended September 30,
|
||||||||||||||||
|
(In thousands)
|
2018
|
2017
|
2018
|
2017
|
||||||||||||||
|
Net unrealized investment (losses) gains arising during the period
|
$
|
(15,288
|
)
|
$
|
17,761
|
|
$
|
(109,433
|
)
|
$
|
76,022
|
|
||||||
|
Income tax benefit (expense)
|
3,211
|
|
(6,217
|
)
|
22,981
|
|
(26,608
|
)
|
||||||||||
|
Net of taxes
|
(12,077
|
)
|
11,544
|
|
(86,452
|
)
|
49,414
|
|
||||||||||
|
Net changes in benefit plan assets and obligations
|
558
|
|
(226
|
)
|
1,674
|
|
(680
|
)
|
||||||||||
|
Income tax (expense) benefit
|
(118
|
)
|
79
|
|
(352
|
)
|
238
|
|
||||||||||
|
Net of taxes
|
440
|
|
(147
|
)
|
1,322
|
|
(442
|
)
|
||||||||||
|
Net changes in unrealized foreign currency translation adjustment
|
—
|
|
—
|
|
—
|
|
45
|
|
||||||||||
|
Income tax (expense)
|
—
|
|
—
|
|
—
|
|
(14
|
)
|
||||||||||
|
Net of taxes
|
—
|
|
—
|
|
—
|
|
31
|
|
||||||||||
|
Total other comprehensive (loss) income
|
(14,730
|
)
|
17,535
|
|
(107,759
|
)
|
75,387
|
|
||||||||||
|
Total income tax benefit (expense)
|
3,093
|
|
(6,138
|
)
|
22,629
|
|
(26,384
|
)
|
||||||||||
|
Total other comprehensive (loss) income, net of tax
|
$
|
(11,637
|
)
|
$
|
11,397
|
|
$
|
(85,130
|
)
|
$
|
49,003
|
|
||||||
MGIC Investment Corporation - Q3 2018 |
27
The pretax and related income tax benefit (expense) components of the amounts reclassified from our accumulated other comprehensive loss (“AOCL”) to our consolidated statements of operations for the
three and nine
months ended
September 30, 2018
and
2017
are included in table
9.2
below.
|
Table
|
9.2
|
|||||||||||||||||
|
Reclassifications from AOCL
|
Three Months Ended September 30,
|
Nine Months Ended September 30,
|
||||||||||||||||
|
(In thousands)
|
2018
|
2017
|
2018
|
2017
|
||||||||||||||
|
Reclassification adjustment for net realized (losses)
(1)
|
$
|
(2,567
|
)
|
$
|
(427
|
)
|
$
|
(6,279
|
)
|
$
|
(2,566
|
)
|
||||||
|
Income tax benefit
|
539
|
|
150
|
|
1,318
|
|
898
|
|
||||||||||
|
Net of taxes
|
(2,028
|
)
|
(277
|
)
|
(4,961
|
)
|
(1,668
|
)
|
||||||||||
|
Reclassification adjustment related to benefit plan assets and obligations
(2)
|
(558
|
)
|
226
|
|
(1,674
|
)
|
680
|
|
||||||||||
|
Income tax benefit (expense)
|
118
|
|
(79
|
)
|
352
|
|
(238
|
)
|
||||||||||
|
Net of taxes
|
(440
|
)
|
147
|
|
(1,322
|
)
|
442
|
|
||||||||||
|
Total reclassifications
|
(3,125
|
)
|
(201
|
)
|
(7,953
|
)
|
(1,886
|
)
|
||||||||||
|
Total income tax benefit
|
657
|
|
71
|
|
1,670
|
|
660
|
|
||||||||||
|
Total reclassifications, net of tax
|
$
|
(2,468
|
)
|
$
|
(130
|
)
|
$
|
(6,283
|
)
|
$
|
(1,226
|
)
|
||||||
|
(1)
|
Increases (decreases) Net realized investment (losses) gains on the consolidated statements of operations.
|
|
(2)
|
Decreases (increases) Other underwriting and operating expenses, net on the consolidated statements of operations.
|
A rollforward of AOCL for the
nine
months ended
September 30, 2018
, including amounts reclassified from AOCL, are included in table
9.3
below.
|
Table
|
9.3
|
|||||||||||||
|
Rollforward of AOCL
|
Nine Months Ended September 30, 2018
|
|||||||||||||
|
(In thousands)
|
Net unrealized gains and losses on available-for-sale securities
|
|
Net benefit plan assets and obligations recognized in shareholders' equity
|
Total AOCL
|
||||||||||
|
Balance, December 31, 2017, net of tax
|
$
|
29,257
|
|
$
|
(73,058
|
)
|
$
|
(43,801
|
)
|
|||||
|
Other comprehensive income before reclassifications
|
(91,413
|
)
|
—
|
|
(91,413
|
)
|
||||||||
|
Less: Amounts reclassified from AOCL
|
(4,961
|
)
|
(1,322
|
)
|
(6,283
|
)
|
||||||||
|
Balance, September 30, 2018, net of tax
|
$
|
(57,195
|
)
|
$
|
(71,736
|
)
|
$
|
(128,931
|
)
|
|||||
MGIC Investment Corporation - Q3 2018 |
28
Tables
10.1
and 10.2 provide the components of net periodic benefit cost for our pension, supplemental executive retirement and other postretirement benefit plans for the
three and nine
months ended
September 30, 2018
and
2017
.
|
Table
|
10.1
|
|||||||||||||||||
|
Components of net periodic benefit cost
|
Three Months Ended September 30,
|
|||||||||||||||||
|
Pension and Supplemental Executive Retirement Plans
|
Other Postretirement Benefit Plans
|
|||||||||||||||||
|
(In thousands)
|
2018
|
2017
|
2018
|
2017
|
||||||||||||||
|
Service cost
|
$
|
2,633
|
|
$
|
2,389
|
|
$
|
290
|
|
$
|
203
|
|
||||||
|
Interest cost
|
3,774
|
|
3,869
|
|
208
|
|
176
|
|
||||||||||
|
Expected return on plan assets
|
(5,563
|
)
|
(5,025
|
)
|
(1,590
|
)
|
(1,312
|
)
|
||||||||||
|
Amortization of net actuarial losses/(gains)
|
1,734
|
|
1,543
|
|
(62
|
)
|
—
|
|
||||||||||
|
Amortization of prior service cost/(credit)
|
(88
|
)
|
(107
|
)
|
(1,026
|
)
|
(1,662
|
)
|
||||||||||
|
Net periodic benefit cost (benefit)
|
$
|
2,490
|
|
$
|
2,669
|
|
$
|
(2,180
|
)
|
$
|
(2,595
|
)
|
||||||
|
Table
|
10.2
|
|||||||||||||||||
|
Components of net periodic benefit cost
|
Nine Months Ended September 30,
|
|||||||||||||||||
|
Pension and Supplemental Executive Retirement Plans
|
Other Postretirement Benefit Plans
|
|||||||||||||||||
|
(In thousands)
|
2018
|
2017
|
2018
|
2017
|
||||||||||||||
|
Service cost
|
$
|
7,898
|
|
$
|
7,167
|
|
$
|
870
|
|
$
|
610
|
|
||||||
|
Interest cost
|
11,321
|
|
11,606
|
|
625
|
|
529
|
|
||||||||||
|
Expected return on plan assets
|
(16,688
|
)
|
(15,074
|
)
|
(4,769
|
)
|
(3,936
|
)
|
||||||||||
|
Amortization of net actuarial losses/(gains)
|
5,203
|
|
4,627
|
|
(187
|
)
|
—
|
|
||||||||||
|
Amortization of prior service cost/(credit)
|
(263
|
)
|
(320
|
)
|
(3,078
|
)
|
(4,987
|
)
|
||||||||||
|
Net periodic benefit cost (benefit)
|
$
|
7,471
|
|
$
|
8,006
|
|
$
|
(6,539
|
)
|
$
|
(7,784
|
)
|
||||||
We currently intend to make contributions totaling
$11 million
to our qualified pension plan and supplemental executive retirement plan in 2018.
MGIC Investment Corporation - Q3 2018 |
29
We have approximately
$153.5 million
of net operating loss (“NOL”) carryforwards as of
September 30, 2018
. Any unutilized carryforwards are scheduled to expire at the end of tax years 2032 through 2033.
We evaluate the realizability of our deferred tax assets including our NOL carryforwards on a quarterly basis. Based on our analysis, we have concluded that all of our deferred tax assets are fully realizable and therefore no valuation allowance existed at September 30, 2018 and December 31, 2017.
Tax Contingencies
As previously disclosed, the Internal Revenue Service (“IRS”) completed examinations of our federal income tax returns for the years 2000 through 2007 and issued proposed assessments for taxes, interest and penalties related to our treatment of the flow-through income and loss from an investment in a portfolio of residual interests of Real Estate Mortgage Investment Conduits.
In July 2018, we finalized an agreement with the IRS to settle all issues in the examination and related U.S. Tax Court case; the settlement has been approved by the U.S. Tax Court. The expected impact of the agreed upon settlement was previously reflected in our consolidated statements of operations
.
With the approval of our settlement by the U.S. Tax Court, our unrecognized tax benefits have been reduced by
$144.9 million
in the third quarter of 2018. As of September 30, 2018, we have no unrecognized tax benefits.
We establish reserves to recognize the estimated liability for losses and loss adjustment expenses (“LAE”) related to defaults on insured mortgage loans. Loss reserves are established by estimating the number of loans in our inventory of delinquent loans that will result in a claim payment, which is referred to as the claim rate, and further estimating the amount of the claim payment, which is referred to as claim severity.
Estimation of losses is inherently judgmental. The conditions that affect the claim rate and claim severity include the current and future state of the domestic economy, including unemployment and the current and future strength of local housing markets; exposure on insured loans; the amount of time between default and claim filing; and curtailments and rescissions. The actual amount of the claim payments may be substantially different than our loss reserve estimates. Our estimates could be adversely affected by several factors, including a deterioration of regional or national economic conditions, including unemployment, leading to a reduction in borrowers’ income and thus their ability to make mortgage payments, and a drop in housing values which may affect borrower willingness to continue to make mortgage payments when the value of the home is below the mortgage balance. Changes to our estimates could result in a material impact to our consolidated results of operations and financial position, even in a stable economic environment.
The “Losses incurred” section of table
12.1
below shows losses incurred on delinquencies that occurred in the current year and in prior years. The amount of losses incurred relating to delinquencies that occurred in the current year represents the estimated amount to be ultimately paid on such delinquencies. The amount of losses incurred relating to delinquencies that occurred in prior years represents the difference between the actual claim rate and severity associated with those delinquencies resolved in the current year compared to the estimated claim rate and severity at the prior year-end, as well as a re-estimation of amounts to be ultimately paid on delinquencies continuing from the end of the prior year. This re-estimation of the claim rate and severity is the result of our review of current trends in the delinquent inventory, such as percentages of delinquencies that have resulted in a claim, the amount of the claims relative to the average loan exposure, changes in the relative level of delinquencies by geography and changes in average loan exposure.
Losses incurred on delinquencies that occurred in the current year decreased in the first
nine
months of
2018
compared to the same period in
2017
, primarily due to a decrease in the number of new delinquencies, net of related cures and a decrease in the estimated claim rate on delinquencies that occurred in the current year.
For the
nine
months ended
September 30, 2018
and
2017
, we experienced favorable loss reserve development on previously received delinquencies. This was, in large part, due to the resolution of approximately
65%
and
MGIC Investment Corporation - Q3 2018 |
30
59%
, respectively, of the prior year delinquent inventory, with lower claim rates due to improved cure rates. The favorable loss reserve development resulting from a reduction in the estimated claim rate was partially offset in the nine months ended
September 30, 2018
by an increase in our severity assumption on previously received delinquencies.
The “Losses paid” section of table
12.1
below shows the amount of losses paid on delinquencies that occurred in the current year and losses paid on delinquencies that occurred in prior years. For several years, the average time it took to receive a claim associated with a delinquency had increased significantly from our historical experience of approximately
twelve
months. This was, in part, due to new loss mitigation protocols established by servicers and to changes in some state foreclosure laws that may include, for example, a requirement for additional review and/or mediation processes. In recent quarters, we have experienced a decline in the average time servicers are utilizing to process foreclosures, which has reduced the average time to receive a claim associated with new delinquent notices that do not cure. All else being equal, the longer the period between delinquency and claim filing, the greater the severity.
During the first nine months of 2018 and 2017, our losses paid included amounts paid upon commutation of coverage of pools of non-performing loans (“NPLs”) and/or amounts paid in connection with disputes concerning our claims paying practices. The impacts of these payments were as follows:
|
•
|
2018 -
1,243
items were removed from the delinquent inventory with an amount paid of
$40 million
.
|
|
•
|
2017 -
1,337
items were removed from the delinquent inventory with amount paid of
$54 million
.
|
Our estimate of premiums to be refunded on expected claim payments is accrued for separately in “Other Liabilities” on our consolidated balance sheets and approximated
$44 million
and
$61 million
at
September 30, 2018
and
December 31, 2017
, respectively.
Table
12.1
provides a reconciliation of beginning and ending loss reserves as of and for the
nine
months ended
September 30, 2018
and
2017
.
|
Table
|
12.1
|
|||||||||
|
Development of reserves for losses and loss adjustment expenses
|
Nine months ended September 30,
|
|||||||||
|
(In thousands)
|
2018
|
2017
|
||||||||
|
Reserve at beginning of period
|
$
|
985,635
|
|
$
|
1,438,813
|
|
||||
|
Less reinsurance recoverable
|
48,474
|
|
50,493
|
|
||||||
|
Net reserve at beginning of period
|
937,161
|
|
1,388,320
|
|
||||||
|
Losses incurred:
|
||||||||||
|
Losses and LAE incurred in respect of delinquency notices received in:
|
||||||||||
|
Current year
|
155,808
|
|
219,485
|
|
||||||
|
Prior years
(1)
|
(146,931
|
)
|
(134,780
|
)
|
||||||
|
Total losses incurred
|
8,877
|
|
84,705
|
|
||||||
|
Losses paid:
|
||||||||||
|
Losses and LAE paid in respect of delinquency notices received in:
|
||||||||||
|
Current year
|
2,449
|
|
5,474
|
|
||||||
|
Prior years
|
257,808
|
|
407,977
|
|
||||||
|
Reinsurance terminations
|
(1,984
|
)
|
301
|
|
||||||
|
Total losses paid
|
258,273
|
|
413,752
|
|
||||||
|
Net reserve at end of period
|
687,765
|
|
1,059,273
|
|
||||||
|
Plus reinsurance recoverables
|
33,281
|
|
45,878
|
|
||||||
|
Reserve at end of period
|
$
|
721,046
|
|
$
|
1,105,151
|
|
||||
|
(1)
|
A negative number for prior year losses incurred indicates a redundancy of prior year loss reserves. See the following table for more information about prior year loss development.
|
MGIC Investment Corporation - Q3 2018 |
31
The prior year development of the reserves in the first
nine
months of
2018
and
2017
is reflected in table
12.2
below.
|
Table
|
12.2
|
|||||||||
|
Reserve development on previously received delinquencies
|
Nine months ended September 30,
|
|||||||||
|
(in millions)
|
2018
|
2017
|
||||||||
|
Decrease in estimated claim rate on primary defaults
|
$
|
(184
|
)
|
$
|
(138
|
)
|
||||
|
Increase in estimated severity on primary defaults
|
22
|
|
(2
|
)
|
||||||
|
Change in estimates related to pool reserves, LAE reserves and reinsurance
|
15
|
|
5
|
|
||||||
|
Total prior year loss development
(1)
|
$
|
(147
|
)
|
$
|
(135
|
)
|
||||
|
(1)
|
A negative number for prior year loss development indicates a redundancy of prior year loss reserves.
|
Delinquent inventory
A rollforward of our primary delinquent inventory for the
three and nine
months ended
September 30, 2018
and
2017
appears in table
12.3
below. The information concerning new notices and cures is compiled from monthly reports received from loan servicers. The level of new notice and cure activity reported in a particular month can be influenced by, among other things, the date on which a servicer generates its report, the accuracy of the data provided by servicers, the number of business days in a month, transfers of servicing between loan servicers and whether all servicers have provided the reports in a given month.
|
Table
|
12.3
|
|||||||||||||
|
Delinquent inventory rollforward
|
Three Months Ended September 30,
|
Nine Months Ended September 30,
|
||||||||||||
|
2018
|
2017
|
2018
|
2017
|
|||||||||||
|
Delinquent inventory at beginning of period
|
36,037
|
|
41,317
|
|
46,556
|
|
50,282
|
|
||||||
|
New notices
|
13,569
|
|
15,950
|
|
40,351
|
|
45,352
|
|
||||||
|
Cures
|
(14,197
|
)
|
(13,546
|
)
|
(47,620
|
)
|
(45,382
|
)
|
||||||
|
Paids (including those charged to a deductible or captive)
|
(1,374
|
)
|
(2,195
|
)
|
(4,446
|
)
|
(7,403
|
)
|
||||||
|
Rescissions and denials
|
(56
|
)
|
(82
|
)
|
(200
|
)
|
(277
|
)
|
||||||
|
Other items removed from inventory
|
(581
|
)
|
(209
|
)
|
(1,243
|
)
|
(1,337
|
)
|
||||||
|
Delinquent inventory at end of period
|
33,398
|
|
41,235
|
|
33,398
|
|
41,235
|
|
||||||
The decrease in the primary delinquent inventory experienced during
2018
and
2017
was generally across all markets and primarily in book years 2008 and prior. Historically as a default ages it becomes more likely to result in a claim.
Hurricane activity
New delinquent notice activity increased in the fourth quarter of 2017 because of hurricane activity that primarily impacted Puerto Rico, Texas, and Florida in the third quarter of 2017. As a result, the number of loans delinquent three months or less was a higher percentage of our total inventory as of December 31, 2017 than it had been as of
September 30, 2017
.
MGIC Investment Corporation - Q3 2018 |
32
Table
12.4
below shows the number of consecutive months a borrower is delinquent.
|
Table
|
12.4
|
||||||||||||||||||
|
Delinquent inventory - consecutive months in default
|
September 30, 2018
|
December 31, 2017
|
September 30, 2017
|
||||||||||||||||
|
3 months or less
|
9,484
|
|
28
|
%
|
17,119
|
|
37
|
%
|
11,331
|
|
27
|
%
|
|||||||
|
4-11 months
|
9,564
|
|
29
|
%
|
12,050
|
|
26
|
%
|
11,092
|
|
27
|
%
|
|||||||
|
12 months or more
(1) (2)
|
14,350
|
|
43
|
%
|
17,387
|
|
37
|
%
|
18,812
|
|
46
|
%
|
|||||||
|
Total primary delinquent inventory
|
33,398
|
|
100
|
%
|
46,556
|
|
100
|
%
|
41,235
|
|
100
|
%
|
|||||||
|
Primary claims received inventory included in ending delinquent inventory:
|
766
|
|
2
|
%
|
954
|
|
2
|
%
|
1,063
|
|
3
|
%
|
|||||||
|
(1)
|
Approximately
39%
,
45%
, and
45%
of the primary delinquent inventory delinquent for 12 consecutive months or more has been delinquent for at least 36 consecutive months as of
September 30, 2018
,
December 31, 2017
, and
September 30, 2017
, respectively.
|
|
(2)
|
The majority of items removed from our delinquent inventory due to commutations of NPLs during the nine months ended
September 30, 2018
were delinquent for 12 consecutive months or more as of December 31, 2017.
|
The number of months a loan is in the delinquent inventory can differ from the number of payments that the borrower has not made or is considered delinquent. These differences typically result from a borrower making monthly payments that do not result in the loan becoming fully current. Table
12.5
below shows the number of payments that a borrower is delinquent.
|
Table
|
12.5
|
||||||||||||||||||
|
Delinquent inventory - number of payments delinquent
|
September 30, 2018
|
December 31, 2017
|
September 30, 2017
|
||||||||||||||||
|
3 payments or less
|
14,813
|
|
44
|
%
|
21,678
|
|
46
|
%
|
16,916
|
|
41
|
%
|
|||||||
|
4-11 payments
|
9,156
|
|
28
|
%
|
12,446
|
|
27
|
%
|
10,583
|
|
26
|
%
|
|||||||
|
12 payments or more
(1) (2)
|
9,429
|
|
28
|
%
|
12,432
|
|
27
|
%
|
13,736
|
|
33
|
%
|
|||||||
|
Total primary delinquent inventory
|
33,398
|
|
100
|
%
|
46,556
|
|
100
|
%
|
41,235
|
|
100
|
%
|
|||||||
|
(1)
|
Approximately
39%
,
43%
, and
43%
of the primary delinquent inventory with 12 payments or more delinquent has at least 36 payments delinquent as of
September 30, 2018
,
December 31, 2017
, and
September 30, 2017
, respectively.
|
|
(2)
|
The majority of items removed from our delinquent inventory due to commutations of NPLs during the nine months ended
September 30, 2018
had 12 or more payments delinquent as of December 31, 2017.
|
Pool insurance delinquent inventory decreased to
1,032
at
September 30, 2018
from
1,309
at
December 31, 2017
, and
1,426
at
September 30, 2017
.
Claims paying practices
Our loss reserving methodology incorporates our estimates of future rescissions and curtailments. A variance between ultimate actual rescission and curtailment rates and our estimates, as a result of the outcome of litigation, settlements or other factors, could materially affect our losses. Our estimate of premiums to be refunded on expected future rescissions is accrued for separately and is included in “Other liabilities” on our consolidated balance sheets. For information about discussions and legal proceedings with customers with respect to our claims paying practices see
Note 5 – “Litigation and Contingencies.”
MGIC Investment Corporation - Q3 2018 |
33
Share repurchase program
On April 26, 2018, our Board of Directors authorized a share repurchase program under which we may repurchase up to
$200 million
of our common stock through the end of 2019. Repurchases may be made from time to time on the open market or through privately negotiated transactions. The repurchase program may be suspended for periods or discontinued at any time.
During the second quarter of 2018, we repurchased approximately
9.2 million
shares of our common stock at a weighted average price per share of
$10.88
, which included commissions.
Change in accounting principle
As described in
Note 2 - “New Accounting Pronouncements,”
during the first quarter of 2018 the updated guidance of
“Recognition and Measurement of Financial Assets and Financial Liabilities”
became effective. The application of this guidance resulted in an immaterial cumulative effect adjustment to our 2018 beginning accumulated other comprehensive (loss) income and retained earnings to recognize unrealized gains on equity securities.
Shareholders Rights Agreement
Our Amended and Restated Rights Agreement dated August 1, 2018 (“the 2018 Agreement”) seeks to diminish the risk that our ability to use our NOLs to reduce potential future federal income tax obligations may become substantially limited and to deter certain abusive takeover practices. The benefit of the NOLs would be substantially limited, and the timing of the usage of the NOLs could be substantially delayed, if we were to experience an “ownership change” as defined by Section 382 of the Internal Revenue Code.
Under the 2018 Agreement, each outstanding share of our Common Stock is accompanied by
one
Right. The “Distribution Date” occurs on the earlier of
ten days
after a public announcement that a person has become an “Acquiring Person,” or
ten
business days after a person announces or begins a tender offer in which consummation of such offer would result in a person becoming an “Acquiring Person.” An “Acquiring Person” is any person that becomes, by itself or together with its affiliates and associates, a beneficial owner of
5%
or more of the shares of our Common Stock then outstanding, but excludes, among others, certain exempt and grandfathered persons as defined in the Agreement. The Rights are not exercisable until the Distribution Date. Each Right will initially entitle shareholders to buy
one-tenth
of
one
share of our Common Stock at a Purchase Price of
$45
per full share (equivalent to
$4.50
for each one-tenth share), subject to adjustment. Each exercisable Right (subject to certain limitations) will entitle its holder to purchase, at the Rights’ then-current Purchase Price, a number of our shares of Common Stock (or if after the Shares Acquisition Date, we are acquired in a business combination, common shares of the acquiror) having a market value at the time equal to twice the Purchase Price. The Rights will expire on March 1, 2020, or earlier as described in the 2018 Agreement. The Rights are redeemable at a price of
$0.001
per Right at any time prior to the time a person becomes an Acquiring Person. Other than certain amendments, the Board of Directors may amend the Rights in any respect without the consent of the holders of the Rights.
MGIC Investment Corporation - Q3 2018 |
34
We have certain share-based compensation plans. Under the fair value method, compensation cost is measured at the grant date based on the fair value of the award and is recognized over the service period which generally corresponds to the vesting period. Awards under our plans generally vest over periods ranging from
one
to
three years
.
Table
14.1
shows the number of shares granted to employees and the weighted average fair value per share during the periods presented (shares in thousands).
|
Table
|
14.1
|
||||||||||||||
|
Restricted stock grants
|
Nine months ended September 30,
|
||||||||||||||
|
2018
|
2017
|
||||||||||||||
|
Shares
Granted
|
Weighted Average Share Fair Value
|
Shares
Granted
|
Weighted Average Share Fair Value
|
||||||||||||
|
RSUs subject to performance conditions
|
1,239
|
|
$
|
15.80
|
|
1,237
|
|
$
|
10.41
|
|
|||||
|
RSUs subject only to service conditions
|
447
|
|
15.39
|
|
395
|
|
10.41
|
|
|||||||
Statutory Capital Requirements
The insurance laws of
16
jurisdictions, including Wisconsin, our domiciliary state, require a mortgage insurer to maintain a minimum amount of statutory capital relative to the risk in force (or a similar measure) in order for the mortgage insurer to continue to write new business. We refer to these requirements as the “State Capital Requirements.” While they vary among jurisdictions, the most common State Capital Requirements allow for a maximum risk-to-capital ratio of
25 to 1
. A risk-to-capital ratio will increase if (i) the percentage decrease in capital exceeds the percentage decrease in insured risk, or (ii) the percentage increase in capital is less than the percentage increase in insured risk. Wisconsin does not regulate capital by using a risk-to-capital measure but instead requires a minimum policyholder position (“MPP”). The “policyholder position” of a mortgage insurer is its net worth or surplus, contingency reserve and a portion of the reserves for unearned premiums.
At
September 30, 2018
, MGIC’s risk-to-capital ratio was
9.0 to 1
, below the maximum allowed by the jurisdictions with State Capital Requirements, and its policyholder position was
$2.5 billion
above the required MPP of
$1.3 billion
. In calculating our risk-to-capital ratio and MPP, we are allowed full credit for the risk ceded under our reinsurance transactions with a group of unaffiliated reinsurers. It is possible that under the revised State Capital Requirements discussed below, MGIC will not be allowed full credit for the risk ceded to the reinsurers. If MGIC is not allowed an agreed level of credit under either the State Capital Requirements or the financial requirements of the PMIERs, MGIC may terminate the reinsurance transactions, without penalty. At this time, we expect MGIC to continue to comply with the current State Capital Requirements; however, matters that could negatively affect such compliance are discussed in the rest of these consolidated financial statement footnotes.
At
September 30, 2018
, the risk-to-capital ratio of our combined insurance operations (which includes a reinsurance affiliate) was
9.8 to 1
. Reinsurance agreements with an affiliate permit MGIC to write insurance with a higher coverage percentage than it could on its own under certain state-specific requirements. A higher risk-to-capital ratio on a combined basis may indicate that, in order for MGIC to continue to utilize reinsurance agreements with its affiliate, additional capital contributions to the reinsurance affiliate could be needed.
The NAIC plans to revise the minimum capital and surplus requirements for mortgage insurers that are provided for in its Mortgage Guaranty Insurance Model Act. In May 2016, a working group of state regulators released an exposure draft of a risk-based capital framework to establish capital requirements for mortgage insurers, although no date has been established by which the NAIC must propose revisions to the capital requirements and certain items have not yet been completely addressed by the framework, including the treatment of ceded risk, minimum capital floors, and action level triggers. Currently, we believe that the
MGIC Investment Corporation - Q3 2018 |
35
PMIERs contain more restrictive capital requirements than the draft Mortgage Guaranty Insurance Model Act in most circumstances.
While MGIC currently meets the State Capital Requirements of Wisconsin and all other jurisdictions, it could be prevented from writing new business in the future in all jurisdictions if it fails to meet the State Capital Requirements of Wisconsin, or it could be prevented from writing new business in a particular jurisdiction if it fails to meet the State Capital Requirements of that jurisdiction, and in each case MGIC does not obtain a waiver of such requirements. It is possible that regulatory action by one or more jurisdictions, including those that do not have specific State Capital Requirements, may prevent MGIC from continuing to write new insurance in such jurisdictions.
If we are unable to write business in a particular jurisdiction, lenders may be unwilling to procure insurance from us anywhere. In addition, a lender’s assessment of the future ability of our insurance operations to meet the State Capital Requirements or the PMIERs may affect its willingness to procure insurance from us. A possible future failure by MGIC to meet the State Capital Requirements or the PMIERs will not necessarily mean that MGIC lacks sufficient resources to pay claims on its insurance liabilities. While we believe MGIC has sufficient claims paying resources to meet its claim obligations on its insurance in force on a timely basis, matters that could negatively affect MGIC’s claims paying resources are discussed in the rest of these consolidated financial statement footnotes.
Dividend restrictions
In the third quarter of 2018, MGIC paid a
$60 million
dividend to our holding company. MGIC is subject to statutory regulations as to payment of dividends. The maximum amount of dividends that MGIC may pay in any twelve-month period without such dividends being subject to regulatory disapproval by the OCI is the lesser of adjusted statutory net income or
10%
of statutory policyholders’ surplus as of the preceding calendar year end. Adjusted statutory net income is defined for this purpose to be the greater of statutory net income, net of realized investment gains, for the calendar year preceding the date of the dividend or statutory net income, net of realized investment gains, for the
three
calendar years preceding the date of the dividend less dividends paid within the first
two
of the preceding three calendar years. The OCI recognizes only statutory accounting principles prescribed, or practices permitted by the State of Wisconsin for determining and reporting the financial condition and results of operations of an insurance company. The OCI has adopted certain prescribed accounting practices that differ from those found in other states. Specifically, Wisconsin domiciled companies record changes in their contingency reserves through their income statement as a change in underwriting deduction. As a result, in periods in which MGIC is increasing contingency reserves, statutory net income is lowered. For the year ended
December 31, 2017
, MGIC’s increase in contingency reserves was
$473 million
and statutory net income was
$272 million
.
On October 30, 2018, MGIC entered into a fully collateralized reinsurance agreement with Home Re 2018-1 Ltd. (“Home Re”), an unaffiliated special purpose insurer domiciled in Bermuda, that provides for up to
$318.6 million
of aggregate excess-of-loss reinsurance coverage as of August 1, 2018 on a portfolio of mortgage insurance policies having an insurance coverage in force date on or after July 1, 2016 and before January 1, 2018. For the reinsurance coverage period, MGIC will retain the first layer of
$168.7 million
of aggregate losses, and Home Re will then provide second layer coverage up to the outstanding reinsurance coverage amount. The reinsurance coverage premium due to Home Re is calculated by multiplying the outstanding reinsurance coverage amount at the beginning of a period by a coupon rate, which is the sum of one-month LIBOR plus a spread for each class of notes, and then subtracting actual investment income collected on the assets in the reinsurance trust during that period. The aggregate excess of loss reinsurance coverage decreases over a ten-year period, subject to certain conditions, as the underlying covered mortgages amortize, principal is prepaid, or mortgage insurance losses are paid. MGIC has rights to terminate the reinsurance agreement, which includes an option to terminate after seven years from the closing date. Home Re financed the coverage by issuing mortgage insurance-linked notes in an aggregate amount of
$318.6 million
to unaffiliated investors. The notes have ten-year legal maturities and are non-recourse to any assets of MGIC or its affiliates. The proceeds of the notes were deposited into a reinsurance trust for the benefit of MGIC that will be the source of reinsurance claim payments to MGIC and principal repayments on the mortgage insurance-linked notes.
MGIC Investment Corporation - Q3 2018 |
36
In connection with entering into the reinsurance agreement with Home Re, we concluded that the risk transfer requirements for reinsurance accounting were met as Home Re is assuming significant insurance risk and a reasonable possibility of significant loss. In addition, we assessed whether Home Re was a variable interest entity (“VIE”). A VIE is a legal entity that does not have sufficient equity at risk to finance its activities without additional subordinated financial support or is structured such that equity investors lack the ability to make sufficient decisions relating to the entity’s operations through voting rights or do not substantively participate in gains and losses of the entity. We concluded that Home Re is a VIE. However, given that MGIC (1) does not have the unilateral power to direct the activities that most significantly affect Home Re’s economic performance and (2) does not have the obligation to absorb losses or the right to receive benefits that could be potentially significant to Home Re, consolidation of Home Re is not required.
MGIC Investment Corporation - Q3 2018 |
37
Introduction
The following is management’s discussion and analysis of the financial condition and results of operations of MGIC Investment Corporation for the
third
quarter and first
nine
months of
2018
. As used below, “we” and “our” refer to MGIC Investment Corporation’s consolidated operations. This form 10-Q should be read in conjunction with “Management’s Discussion and Analysis of Financial Condition and Results of Operations” in our Annual Report on Form 10-K for the year ended
December 31, 2017
. See the
“Glossary of terms and acronyms”
for definitions and descriptions of terms used throughout this MD&A. The Risk Factors referred to under “Forward Looking Statements and Risk Factors” below, discuss trends and uncertainties affecting us and are an integral part of the MD&A.
Forward Looking and Other Statements
As discussed under “Forward Looking Statements and Risk Factors” below, actual results may differ materially from the results contemplated by forward looking statements. We are not undertaking any obligation to update any forward looking statements or other statements we may make in the following discussion or elsewhere in this document even though these statements may be affected by events or circumstances occurring after the forward looking statements or other statements were made. Therefore no reader of this document should rely on these statements being current as of any time other than the time at which this document was filed with the Securities and Exchange Commission.
MGIC Investment Corporation - Q3 2018 |
38
Overview
|
Summary financial results of MGIC Investment Corporation
|
Three Months Ended September 30,
|
Nine Months Ended September 30, 2018
|
||||||||||||||||||||||
|
(In millions, except per share data, unaudited)
|
2018
|
2017
|
% Change
|
2018
|
2017
|
% Change
|
||||||||||||||||||
|
Selected statement of operations data
|
||||||||||||||||||||||||
|
Total revenues
|
$
|
290.4
|
|
$
|
270.4
|
|
7
|
|
$
|
838.2
|
|
$
|
794.6
|
|
5
|
|
||||||||
|
Losses incurred, net
|
(1.5
|
)
|
29.7
|
|
(105
|
)
|
8.9
|
|
84.7
|
|
(90
|
)
|
||||||||||||
|
Other underwriting and operating expenses, net
|
43.7
|
|
39.9
|
|
10
|
|
131.6
|
|
119.2
|
|
10
|
|
||||||||||||
|
Income before tax
|
231.9
|
|
184.5
|
|
26
|
|
649.4
|
|
539.0
|
|
20
|
|
||||||||||||
|
Provision for income taxes
|
50.0
|
|
64.4
|
|
(22
|
)
|
137.1
|
|
210.6
|
|
(35
|
)
|
||||||||||||
|
Net income
|
181.9
|
|
120.0
|
|
52
|
|
512.4
|
|
328.4
|
|
56
|
|
||||||||||||
|
Diluted income per share
|
$
|
0.49
|
|
$
|
0.32
|
|
53
|
|
$
|
1.36
|
|
$
|
0.86
|
|
58
|
|
||||||||
|
Non-GAAP Financial Measures
(1)
|
||||||||||||||||||||||||
|
Adjusted pre-tax operating income
|
$
|
230.8
|
|
$
|
184.5
|
|
25
|
|
$
|
650.6
|
|
$
|
539.3
|
|
21
|
|
||||||||
|
Adjusted net operating income
|
180.9
|
|
120.7
|
|
50
|
|
514.7
|
|
357.0
|
|
44
|
|
||||||||||||
|
Adjusted net operating income per diluted share
|
$
|
0.48
|
|
$
|
0.32
|
|
50
|
|
$
|
1.36
|
|
$
|
0.93
|
|
46
|
|
||||||||
Summary of third quarter and year to date 2018 results
Comparative quarterly results
We recorded
third
quarter
2018
net income of
$181.9 million
, or
$0.49
per diluted share. Net income
increased
by
$61.9 million
compared with net income of
$120.0 million
in the prior year, primarily reflecting decreases in our losses incurred, net and our provision for income taxes. The decline in our losses incurred, net also had the effect of reducing our ceded premiums due to an increase in our reinsurance profit commission. That, and an increase in investment income, resulted in an increase in revenues. In addition, our diluted weighted average shares outstanding decreased from the prior year. These factors contributed to a
53%
increase in diluted income per share.
Adjusted net operating income for the
third
quarter
2018
was
$180.9 million
(
Q3
2017
:
$120.7 million
) and adjusted net operating income per diluted share was
$0.48
(
Q3
2017
:
$0.32
). The
50%
increase in adjusted net operating income primarily reflects the increase in net income. The increase in adjusted net operating income and decrease in diluted weighted average shares outstanding resulted in a
50%
increase in adjusted net operating income per diluted share.
Losses incurred, net
for the
third
quarter of 2018 were
$(1.5) million
, a $
31.3 million
improvement compared to the prior year, primarily due to 15% fewer new delinquent notices received in the current year period and a decline in the estimated claim rate on those notices, to 9% from 11% in the prior year period. Our estimated claim rate on new notices reflects the current economic environment and anticipated cure activity on the notices received. In addition, favorable development on previously received delinquencies was higher in the current year period.
Other underwriting and operating expenses, net were
$43.7 million
, an increase of
10%
compared to the prior year primarily driven by higher share-based compensation expenses, which resulted from a higher stock price at the grant date, and non-executive compensation.
The decrease in our provision for income taxes in the
third
quarter of 2018 as compared to the same period in the prior year was due to the decrease in the statutory income tax rate, offset in part by an increase in income before tax.
MGIC Investment Corporation - Q3 2018 |
39
In September 2018, MGIC paid a dividend of $60 million to our holding company and we expect MGIC to continue to pay quarterly dividends of at least that amount.
Comparative year to date results
We recorded net income of
$512.4 million
, or
$1.36
per diluted share, during the first
nine
months of
2018
. Net income
increased
by
$183.9 million
compared with net income of
$328.4 million
in the prior year, primarily reflecting decreases in our losses incurred, net and our provision for income taxes. The decline in our losses incurred, net also had the effect of reducing our ceded premiums due to an increase in our reinsurance profit commission. That, and an increase in investment income, resulted in an increase in revenues. In addition, our diluted weighted average shares outstanding decreased from the prior year. These factors contributed to a
58%
increase in diluted income per share.
Adjusted net operating income for the first
nine
months of
2018
was
$514.7 million
(YTD 2017:
$357.0 million
) and adjusted net operating income per diluted share was
$1.36
(YTD 2017:
$0.93
). The
44%
increase in adjusted net operating income primarily reflects the increase in net income in the current year period. The increase in adjusted net operating income and decrease in diluted weighted average shares outstanding resulted in a
46%
increase in adjusted net operating income per diluted share.
Losses incurred, net
for the first
nine
months of 2018 were
$8.9 million
, down
90%
compared to the prior year due to 11% fewer new delinquent notices received in the current year period and a decrease in the estimated claim rate of on those notices, to 9% from 11% in the prior year period. Our estimated claim rate on new notices reflects the current economic environment and anticipated cure activity on the notices received. In addition, favorable development on previously received delinquencies was higher in the current year period.
Other underwriting and operating expenses, net were
$131.6 million
, an increase of
10%
compared to the prior year primarily driven by higher share-based compensation expenses, which resulted from a higher stock price at the grant date, and non-executive compensation.
The decrease in our provision for income taxes in the first
nine
months of 2018 as compared to the same period in the prior year was due in part to the decrease in the statutory income tax rate, offset in part by an increase in income before tax. In addition, the provision for income tax in the prior year period included an additional provision of $28.4 million for the expected settlement of our IRS litigation, compared to an additional provision of
$1.5 million
in the current year period.
See
“Consolidated Results of Operations”
below for additional discussion of our results for the
three and nine
months ended
September 30, 2018
compared to the respective prior year periods.
Capital
Share repurchase program
On April 26, 2018, our board of directors authorized a share repurchase program under which we may repurchase up to $200 million of our common stock through the end of 2019. Repurchases may be made from time to time on the open market or through privately negotiated transactions. The repurchase program may be suspended for periods or discontinued at any time. During the second quarter of 2018, we utilized approximately $100.1 million of cash at our holding company to repurchase approximately
9.2 million
shares of our common stock. As of
September 30, 2018
, we had approximately 362.2 million shares of common stock outstanding. During the fourth quarter of 2018, through November 2, 2018, we used approximately
$6.6 million
of holding company cash to repurchase approximately 565 thousand shares of our common stock.
GSEs
We must comply with the PMIERs to be eligible to insure loans delivered to or purchased by the GSEs. In addition to their financial requirements, the PMIERs include business, quality control and certain transaction approval requirements.
MGIC Investment Corporation - Q3 2018 |
40
Revised PMIERs were published in September 2018 and will become effective March 31, 2019. Refer to
“Liquidity and Capital Resources - Capital Adequacy - PMIERs”
of this MD&A for additional information regarding the changes made to the financial requirements under the revised PMIERs.
If MGIC ceases to be eligible to insure loans purchased by one or both of the GSEs, it would significantly reduce the volume of our new business writings. Factors that may negatively impact MGIC’s ability to continue to comply with the financial requirements of the PMIERs include the following:
|
•
|
The GSEs may amend the PMIERs at any time and may make the PMIERs more onerous in the future. In June 2018, the FHFA issued a proposed rule on regulatory capital requirements for the GSEs ("Enterprise Capital Requirements"), which included a framework for determining the capital relief allowed to the GSEs for loans with private mortgage insurance. The GSEs have indicated that there may be potential future implications for PMIERs based upon feedback the FHFA receives on its proposed rule on Enterprise Capital Requirements. In addition, the PMIERs provide that the factors that determine Minimum Required Assets will be updated every two years and may be updated more frequently to reflect changes in macroeconomic conditions or loan performance. The GSEs have indicated that they will generally provide notice 180 days prior to the effective date of such updates.
|
|
•
|
Our future operating results may be negatively impacted by the matters discussed in our risk factors. Such matters could decrease our revenues, increase our losses or require the use of assets, thereby creating a shortfall in Available Assets.
|
|
•
|
Should capital be needed by MGIC in the future, capital contributions from our holding company may not be available due to competing demands on holding company resources, including for repayment of debt.
|
While on an overall basis, the amount of Available Assets MGIC must hold in order to continue to insure GSE loans is greater under the PMIERs than what state regulation currently requires, our reinsurance transactions mitigate the negative effect of the PMIERs on our returns. However, reinsurance may not always be available to us or available on similar terms, it subjects us to counterparty credit risk and the GSEs may change the credit they allow under the PMIERs for risk ceded under our reinsurance transactions.
State Regulations
The insurance laws of 16 jurisdictions, including Wisconsin, MGIC’s domiciliary state, require a mortgage insurer to maintain a minimum amount of statutory capital relative to its RIF (or a similar measure) in order for the mortgage insurer to continue to write new business. We refer to these requirements as the “State Capital Requirements.” While they vary among jurisdictions, the most common State Capital Requirements allow for a maximum risk-to-capital ratio of 25 to 1. A risk-to-capital ratio will increase if (i) the percentage decrease in capital exceeds the percentage decrease in insured risk, or (ii) the percentage increase in capital is less than the percentage increase in insured risk. Wisconsin does not regulate capital by using a risk-to-capital measure but instead requires an MPP.
At
September 30, 2018
, MGIC’s risk-to-capital ratio was
9.0
to 1, below the maximum allowed by the jurisdictions with State Capital Requirements, and its policyholder position was
$2.5 billion
above the required MPP of
$1.3 billion
. In calculating our risk-to-capital ratio and MPP, we are allowed full credit for the risk ceded under our reinsurance transactions with a group of unaffiliated reinsurers. It is possible that under the revised State Capital Requirements discussed below, MGIC will not be allowed full credit for the risk ceded to the reinsurers. If MGIC is not allowed an agreed level of credit under either the State Capital Requirements or the PMIERs, MGIC may terminate the reinsurance transactions, without penalty. At this time, we expect MGIC to continue to comply with the current State Capital Requirements; however, refer to our risk factor titled “State capital requirements may prevent us from continuing to write new insurance on an uninterrupted basis” for more information about matters that could negatively affect such compliance.
At
September 30, 2018
, the risk-to-capital ratio of our combined insurance operations (which includes a reinsurance affiliate) was
9.8
to 1. Reinsurance transactions with our affiliate permit MGIC to write insurance with a higher coverage percentage than it could on its own under certain state-specific requirements.
MGIC Investment Corporation - Q3 2018 |
41
The NAIC plans to revise the minimum capital and surplus requirements for mortgage insurers that are provided for in its Mortgage Guaranty Insurance Model Act. In May 2016, a working group of state regulators released an exposure draft of a risk-based capital framework to establish capital requirements for mortgage insurers, although no date has been established by which the NAIC must propose revisions to the capital requirements and certain items have not yet been completely addressed by the framework, including the treatment of ceded risk, minimum capital floors, and action level triggers. Currently we believe that the PMIERs contain the more restrictive capital requirements in most circumstances.
GSE reform
The FHFA has been the conservator of the GSEs since 2008 and has the authority to control and direct their operations. The increased role that the federal government has assumed in the residential housing finance system through the GSE conservatorship may increase the likelihood that the business practices of the GSEs change in ways that have a material adverse effect on us and that the charters of the GSEs are changed by new federal legislation. In the past, members of Congress have introduced several bills intended to change the business practices of the GSEs and the FHA; however, no legislation has been enacted.
The Administration issued a June 2018 report indicating that the conservatorship of the GSEs should end and that the GSEs should transition to fully private entities, competing on a level playing field with private issuers of MBS (such issuers, collectively with the GSEs, referred to in the report as the "guarantors"). The report further indicated that a federal entity should regulate the guarantors, including their capital adequacy, and that guarantors should have access to an explicit federal guarantee on the MBS that is only exposed after substantial losses are incurred by the private market, including the guarantors. The report also indicated that a fee on the outstanding volume of MBS would be transferred to the Department of Housing and Urban Development (of which the FHA is a part) to be used for affordable housing purposes. As a result of the matters referred to above, it is uncertain what role the GSEs, FHA and private capital, including PMI, will play in the residential housing finance system in the future or the impact of any such changes on our business. In addition, the timing of the impact of any resulting changes on our business is uncertain. Most meaningful changes would require Congressional action to implement and it is difficult to estimate when Congressional action would be final and how long any associated phase-in period may last.
For additional information about the business practices of the GSEs, see our risk factor titled “Changes in the business practices of the GSEs, federal legislation that changes their charters or a restructuring of the GSEs could reduce our revenues or increase our losses.”
Loan modifications and other similar programs
The federal government, including through the U.S. Department of the Treasury and the GSEs, and several lenders have modification and refinance programs to make outstanding loans more affordable to borrowers with the goal of reducing the number of foreclosures. These programs included HAMP, which expired at the end of 2016, and HARP, which is scheduled to expire at the end of 2018. The GSEs have introduced other loan modifications programs to replace HAMP.
From 2008 through 2012, we were notified of modifications that cured delinquencies that, had they become paid claims, would have resulted in a material increase in our incurred losses. More recently, the number of modifications has decreased significantly. Nearly all of the reported loan modifications were for loans insured in 2009 and prior.
We cannot determine the total benefit we may derive from loan modification programs, particularly given the uncertainty around the re-default rates for defaulted loans that have been modified. Our loss reserves do not account for potential re-defaults of current loans.
MGIC Investment Corporation - Q3 2018 |
42
As shown in the following table, as of
September 30, 2018
approximately
13%
of our primary RIF has been modified.
|
Modifications
|
Policy year
|
HARP Modifications
(1)
|
HAMP & Other Modifications
|
|||||
|
2003 and prior
|
10.8
|
%
|
43.8
|
%
|
||||
|
2004
|
18.5
|
%
|
47.2
|
%
|
||||
|
2005
|
25.3
|
%
|
45.6
|
%
|
||||
|
2006
|
28.7
|
%
|
42.4
|
%
|
||||
|
2007
|
40.5
|
%
|
32.9
|
%
|
||||
|
2008
|
56.6
|
%
|
20.1
|
%
|
||||
|
2009
|
40.6
|
%
|
7.0
|
%
|
||||
|
2010 - Q3 2018
|
—
|
%
|
0.5
|
%
|
||||
|
Total
|
6.6
|
%
|
6.7
|
%
|
||||
|
(1)
|
Includes proprietary programs that are substantially the same as HARP.
|
As of
September 30, 2018
, based on loan count, the loans associated with
97.6%
of HARP modifications and
79.8%
of HAMP and other modifications were current.
Factors affecting our results
Our results of operations are affected by:
Premiums written and earned
Premiums written and earned in a year are influenced by:
|
•
|
NIW, which increases IIF. Many factors affect NIW, including the volume of low down payment home mortgage originations and competition to provide credit enhancement on those mortgages from the FHA, the VA, other mortgage insurers, and other alternatives to mortgage insurance, including GSE programs that may reduce or eliminate the demand for mortgage insurance. NIW does not include loans previously insured by us that are modified, such as loans modified under HARP.
|
|
•
|
Cancellations, which reduce IIF. Cancellations due to refinancings are affected by the level of current mortgage interest rates compared to the mortgage coupon rates throughout the in force book, current home values compared to values when the loans in the in force book were insured and the terms on which mortgage credit is available. Home price appreciation can give homeowners the right to cancel mortgage insurance on their loans if sufficient home equity is achieved. Cancellations also result from policy rescissions, which require us to return any premiums received on the rescinded policies and claim payments, which require us to return any premium received on the related policies from the date of default on the insured loans. Cancellations of single premium policies, which are generally non-refundable, result in immediate recognition of any remaining unearned premium.
|
|
•
|
Premium rates, which are affected by product type, competitive pressures, the risk characteristics of the insured loans, the percentage of coverage on the insured loans, and PMIERs capital requirements. The substantial majority of our monthly and annual mortgage insurance premiums are under premium plans for which, for the first ten years of the policy, the amount of premium is determined by multiplying the initial premium rate by the original loan balance; thereafter, the premium rate resets to a lower rate used for the remaining life of the policy. However, for loans that have utilized HARP, the initial ten-year period resets as of the date of the HARP transaction. The remainder of our monthly and annual premiums are under premium plans for which premiums are determined by a fixed percentage of the loan’s amortizing balance over the life of the policy.
|
|
•
|
Premiums ceded, net of a profit commission, under reinsurance agreements. See
Note 4 - “Reinsurance”
to our consolidated financial statements for a discussion of our reinsurance agreements.
|
MGIC Investment Corporation - Q3 2018 |
43
Premiums are generated by the insurance that is in force during all or a portion of the period. A change in the average IIF in the current period compared to an earlier period is a factor that will increase (when the average in force is higher) or reduce (when it is lower) premiums written and earned in the current period, although this effect may be enhanced (or mitigated) by differences in the average premium rate between the two periods as well as by premiums that are returned or expected to be returned in connection with claim payments and rescissions, and premiums ceded under reinsurance agreements. Also, NIW and cancellations during a period will generally have a greater effect on premiums written and earned in subsequent periods than in the period in which these events occur.
Investment income
Our investment portfolio is composed principally of investment grade fixed income securities. The principal factors that influence investment income are the size of the portfolio and its yield. As measured by amortized cost (which excludes changes in fair value, such as from changes in interest rates), the size of the investment portfolio is mainly a function of cash generated from (or used in) operations, such as NPW, investment income, net claim payments and expenses, and cash provided by (or used for) non-operating activities, such as debt or stock issuances or repurchases.
Losses incurred
Losses incurred are the current expense that reflects estimated payments that will ultimately be made as a result of delinquencies on insured loans. As explained under “Critical Accounting Policies” in our 2017 10-K MD&A, except in the case of a premium deficiency reserve, we recognize an estimate of this expense only for delinquent loans. The level of new delinquencies has historically followed a seasonal pattern, with new delinquencies in the first part of the year lower than new delinquencies in the latter part of the year, though this pattern can be affected by the state of the economy and local housing markets. Losses incurred are generally affected by:
|
•
|
The state of the economy, including unemployment and housing values, each of which affects the likelihood that loans will become delinquent and whether loans that are delinquent cure their delinquency.
|
|
•
|
The product mix of the in force book, with loans having higher risk characteristics generally resulting in higher delinquencies and claims.
|
|
•
|
The size of loans insured, with higher average loan amounts tending to increase losses incurred.
|
|
•
|
The percentage of coverage on insured loans, with deeper average coverage tending to increase losses incurred.
|
|
•
|
The rate at which we rescind policies or curtail claims. Our estimated loss reserves incorporate our estimates of future rescissions of policies and curtailments of claims, and reversals of rescissions and curtailments. We collectively refer to rescissions and denials as “rescissions” and variations of this term. We call reductions to claims “curtailments.”
|
|
•
|
The distribution of claims over the life of a book. Historically, the first few years after loans are originated are a period of relatively low claims, with claims increasing substantially for several years subsequent and then declining, although persistency, the condition of the economy, including unemployment and housing prices, and other factors can affect this pattern. For example, a weak economy or housing value declines can lead to claims from older books increasing, continuing at stable levels or experiencing a lower rate of decline. See further information under “Mortgage insurance earnings and cash flow cycle” below.
|
|
•
|
Losses ceded under reinsurance agreements. See
Note 4 - “Reinsurance”
to our consolidated financial statements for a discussion of our reinsurance agreements.
|
Underwriting and other expenses
Most of our operating expenses are fixed, with some variability due to contract underwriting volume. Contract underwriting generates fee income included in “Other revenue.” Underwriting and other expenses are net of
MGIC Investment Corporation - Q3 2018 |
44
any ceding commission associated with our reinsurance agreements. See
Note 4 - “Reinsurance”
to our consolidated financial statements for a discussion of our reinsurance agreements.
Interest expense
Interest expense primarily reflects the interest associated with our outstanding debt obligations discussed in
Note 3 - “Debt”
to our consolidated financial statements and under
“Liquidity and Capital Resources”
below.
Other
Certain activities that we do not consider part of our fundamental operating activities may also impact our results of operations and are described below.
Net realized investment gains (losses)
Fixed income securities.
Realized investment gains and losses are a function of the difference between the amount received on the sale of a fixed income security and the fixed income security’s cost basis, as well as any “other than temporary” impairments (“OTTI”) recognized in earnings. The amount received on the sale of fixed income securities is affected by the coupon rate of the security compared to the yield of comparable securities at the time of sale.
Equity securities.
Effective January 1, 2018, realized investment gains and losses are a function of the periodic change in fair value. For 2017, realized investment gains and losses were a function of the difference between the amount received on the sale of an equity security and the equity security’s cost basis, as well as any “other than temporary” impairments (“OTTI”) recognized in earnings.
Loss on debt extinguishment
At times, we may undertake activities to enhance our capital position, improve our debt profile and/or reduce potential dilution from our outstanding convertible debt. Extinguishing our outstanding debt obligations early through these discretionary activities may result in losses primarily driven by the payment of consideration in excess of our carrying value.
Refer to
“Explanation and reconciliation of our use of Non-GAAP financial measures”
below
to understand how these items impact our evaluation of our core financial performance.
Mortgage insurance earnings and cash flow cycle
In general, the majority of any underwriting profit that a book generates occurs in the early years of the book, with the largest portion of any underwriting profit realized in the first year following the year the book was written. Subsequent years of a book may result in either underwriting profit or underwriting losses. This pattern of results typically occurs because relatively few of the incurred losses on delinquencies that a book will ultimately experience typically occur in the first few years of the book, when premium revenue is highest, while subsequent years are affected by declining premium revenues, as the number of insured loans decreases (primarily due to loan prepayments) and increasing losses. The typical pattern is also a function of premium rates generally resetting to lower levels after ten years.
MGIC Investment Corporation - Q3 2018 |
45
Explanation and reconciliation of our use of non-GAAP financial measures
Non-GAAP financial measures
We believe that use of the Non-GAAP measures of adjusted pre-tax operating income (loss), adjusted net operating income (loss) and adjusted net operating income (loss) per diluted share facilitate the evaluation of the company's core financial performance thereby providing relevant information to investors. These measures are not recognized in accordance with GAAP and should not be viewed as alternatives to GAAP measures of performance.
Adjusted pre-tax operating income (loss)
is defined as GAAP income (loss) before tax, excluding the effects of net realized investment gains (losses), gain (loss) on debt extinguishment, net impairment losses recognized in income (loss) and infrequent or unusual non-operating items where applicable.
Adjusted net operating income (loss)
is defined as GAAP net income (loss) excluding the after-tax effects of net realized investment gains (losses), gain (loss) on debt extinguishment, net impairment losses recognized in income (loss), and infrequent or unusual non-operating items where applicable. The amounts of adjustments to components of pre-tax operating income (loss) are tax-effected using a federal statutory tax rate of 21% for 2018 and 35% for 2017.
Adjusted net operating income (loss) per diluted share
is calculated in a manner consistent with the accounting standard regarding earnings per share by dividing (i) adjusted net operating income (loss) after making adjustments for interest expense on convertible debt, whenever the impact is dilutive by (ii) diluted weighted average common shares outstanding, which reflects share dilution from unvested restricted stock units and from convertible debt when dilutive under the “if-converted” method.
Although adjusted pre-tax operating income (loss) and adjusted net operating income (loss) exclude certain items that have occurred in the past and are expected to occur in the future, the excluded items represent items that are: (1) not viewed as part of the operating performance of our primary activities; or (2) impacted by both discretionary and other economic or regulatory factors and are not necessarily indicative of operating trends, or both. These adjustments, along with the reasons for their treatment, are described below. Trends in the profitability of our fundamental operating activities can be more clearly identified without the fluctuations of these adjustments. Other companies may calculate these measures differently. Therefore, their measures may not be comparable to those used by us.
|
(1)
|
Net realized investment gains (losses).
The recognition of net realized investment gains or losses can vary significantly across periods as the timing of individual securities sales is highly discretionary and is influenced by such factors as market opportunities, our tax and capital profile, and overall market cycles.
|
|
(2)
|
Gains and losses on debt extinguishment.
Gains and losses on debt extinguishment result from discretionary activities that are undertaken to enhance our capital position, improve our debt profile, and/or reduce potential dilution from our outstanding convertible debt.
|
|
(3)
|
Net impairment losses recognized in earnings.
The recognition of net impairment losses on investments can vary significantly in both size and timing, depending on market credit cycles, individual issuer performance, and general economic conditions.
|
|
(4)
|
Infrequent or unusual non-operating items.
Income tax expense related to our IRS dispute is related to past transactions which are non-recurring in nature and are not part of our primary operating activities.
|
MGIC Investment Corporation - Q3 2018 |
46
|
Non-GAAP reconciliations
|
Reconciliation of Income before tax / Net income to Adjusted pre-tax operating income / Adjusted net operating income
|
||||||||||||||||||||||||
|
Three Months Ended September 30,
|
|||||||||||||||||||||||||
|
2018
|
2017
|
||||||||||||||||||||||||
|
(In thousands, except per share amounts)
|
Pre-tax
|
Tax effect
|
Net
(after-tax) |
Pre-tax
|
Tax effect
|
Net
(after-tax) |
|||||||||||||||||||
|
Income before tax / Net income
|
$
|
231,894
|
|
$
|
49,994
|
|
$
|
181,900
|
|
$
|
184,467
|
|
$
|
64,440
|
|
$
|
120,027
|
|
|||||||
|
Adjustments:
|
|||||||||||||||||||||||||
|
Additional income tax benefit (provision) related to IRS litigation
|
—
|
|
154
|
|
(154
|
)
|
—
|
|
(619
|
)
|
619
|
|
|||||||||||||
|
Net realized investment (gains) losses
|
(1,114
|
)
|
(234
|
)
|
(880
|
)
|
50
|
|
18
|
|
32
|
|
|||||||||||||
|
Adjusted pre-tax operating income / Adjusted net operating income
|
$
|
230,780
|
|
$
|
49,914
|
|
$
|
180,866
|
|
$
|
184,517
|
|
$
|
63,839
|
|
$
|
120,678
|
|
|||||||
|
Reconciliation of Net income per diluted share to Adjusted net operating income per diluted share
|
|||||||||||||||||||||||||
|
Weighted average diluted shares outstanding
|
382,905
|
|
391,087
|
|
|||||||||||||||||||||
|
Net income per diluted share
|
$
|
0.49
|
|
$
|
0.32
|
|
|||||||||||||||||||
|
Additional income tax provision related to IRS litigation
|
—
|
|
—
|
|
|||||||||||||||||||||
|
Net realized investment (gains) losses
|
—
|
|
—
|
|
|||||||||||||||||||||
|
Adjusted net operating income per diluted share
|
$
|
0.48
|
|
(1)
|
$
|
0.32
|
|
||||||||||||||||||
|
(1)
For the three months ended September 30, 2018, the Reconciliation of Net Income per diluted share to Adjusted net operating income per diluted share does not foot due to rounding of the adjustments.
|
|||||||||||||||||||||||||
|
Reconciliation of Income before tax / Net income to Adjusted pre-tax operating income / Adjusted net operating income
|
|||||||||||||||||||||||||
|
Nine Months Ended September 30,
|
|||||||||||||||||||||||||
|
2018
|
2017
|
||||||||||||||||||||||||
|
(In thousands, except per share amounts)
|
Pre-tax
|
Tax effect
|
Net
(after-tax) |
Pre-tax
|
Tax effect
|
Net
(after-tax) |
|||||||||||||||||||
|
Income before tax / Net income
|
$
|
649,441
|
|
$
|
137,090
|
|
$
|
512,351
|
|
$
|
539,040
|
|
$
|
210,593
|
|
$
|
328,447
|
|
|||||||
|
Adjustments:
|
|||||||||||||||||||||||||
|
Additional income tax provision related to IRS litigation
|
—
|
|
(1,477
|
)
|
1,477
|
|
—
|
|
(28,402
|
)
|
28,402
|
|
|||||||||||||
|
Net realized investment losses
|
1,112
|
|
234
|
|
878
|
|
227
|
|
79
|
|
148
|
|
|||||||||||||
|
Loss on debt extinguishment
|
—
|
|
—
|
|
—
|
|
65
|
|
23
|
|
42
|
|
|||||||||||||
|
Adjusted pre-tax operating income / Adjusted net operating income
|
$
|
650,553
|
|
$
|
135,847
|
|
$
|
514,706
|
|
$
|
539,332
|
|
$
|
182,293
|
|
$
|
357,039
|
|
|||||||
|
Reconciliation of Net income per diluted share to Adjusted net operating income per diluted share
|
|||||||||||||||||||||||||
|
Weighted average diluted shares outstanding
|
387,765
|
|
395,870
|
|
|||||||||||||||||||||
|
Net income per diluted share
|
$
|
1.36
|
|
$
|
0.86
|
|
|||||||||||||||||||
|
Additional income tax provision related to IRS litigation
|
—
|
|
0.07
|
|
|||||||||||||||||||||
|
Net realized investment losses
|
—
|
|
—
|
|
|||||||||||||||||||||
|
Loss on debt extinguishment
|
—
|
|
—
|
|
|||||||||||||||||||||
|
Adjusted net operating income per diluted share
|
$
|
1.36
|
|
$
|
0.93
|
|
|||||||||||||||||||
MGIC Investment Corporation - Q3 2018 |
47
Mortgage Insurance Portfolio
New insurance written
According to
Inside Mortgage Finance
and GSE estimates
,
total mortgage originations for the third quarter and first nine months of 2018 decreased from the respective prior year period primarily due to a decline in refinance transactions. The total amount of mortgage originations is generally influenced by the level of new and existing home sales, the percentage of homes purchased for cash, and the level of refinance activity. PMI market share of total mortgage originations is influenced by the mix of purchase and refinance originations as PMI market share is 3-4 times higher for purchase originations than refinance originations. PMI market share is also impacted by the market share of total originations of the FHA, VA, USDA, and other alternatives to mortgage insurance, including GSE programs that may reduce or eliminate the demand for mortgage insurance.
NIW for the
third
quarter of
2018
was
$14.5 billion
(
Q3
2017
:
$14.1 billion
) and for the first
nine
months of
2018
was
$38.3 billion
(YTD
2017
:
$36.3 billion
) and continued to have what we believe are favorable underlying risk characteristics. Although the percentage of NIW with DTI ratios greater than 45% was approximately 20% during the third quarter of 2018, and 20% for the first nine months of 2018, up significantly from approximately 9% in the third quarter of 2017, and 10% in the first nine months of 2017. Under our 2018 QSR Transactions, we may cede risk associated with NIW with DTI ratios between 45% and 50%; however, the amount of risk we may cede in connection with such NIW in any quarter is limited to a percentage of all risk written and that percentage is materially below the percentage of risk written represented by such loans in the third quarter and first nine months of 2018, respectively. To mitigate our risk from the increase in NIW written on loans with DTI ratios greater than 45%, effective in March 2018 we changed our underwriting guidelines to generally require loans with DTI ratios greater than 45% to have a FICO score of at least 700. Further, effective in July 2018, we added risk-based adjustments to our premium rates for loans with DTI ratios greater than 45%. We are continuing to monitor our exposure to such loans and may take further action. The percentage of purchase mortgages insured increased in the
three and nine
months ended
September 30, 2018
compared to the same periods of the prior year because the level of refinance transactions declined as mortgage interest rates, on average, have increased during the first nine months of 2018.
The following tables present characteristics of our primary NIW for the three and
nine months ended September 30, 2018
and
2017
.
|
Primary NIW by FICO score
|
Three Months Ended September 30,
|
Nine Months Ended September 30,
|
||||||||||||
|
(% of primary NIW)
|
2018
|
2017
|
2018
|
2017
|
||||||||||
|
760 and greater
|
42.1
|
%
|
41.5
|
%
|
42.3
|
%
|
42.2
|
%
|
||||||
|
740 - 759
|
17.0
|
%
|
17.1
|
%
|
17.2
|
%
|
16.6
|
%
|
||||||
|
720 - 739
|
14.4
|
%
|
13.9
|
%
|
14.6
|
%
|
14.1
|
%
|
||||||
|
700 - 719
|
12.2
|
%
|
11.9
|
%
|
11.9
|
%
|
11.9
|
%
|
||||||
|
680 - 699
|
7.2
|
%
|
8.2
|
%
|
7.2
|
%
|
8.0
|
%
|
||||||
|
660 - 679
|
3.8
|
%
|
4.0
|
%
|
3.7
|
%
|
4.0
|
%
|
||||||
|
640 - 659
|
2.3
|
%
|
2.4
|
%
|
2.2
|
%
|
2.3
|
%
|
||||||
|
639 and less
|
1.0
|
%
|
1.0
|
%
|
1.0
|
%
|
0.9
|
%
|
||||||
|
Primary NIW by loan-to-value
|
Three Months Ended September 30,
|
Nine Months Ended September 30,
|
||||||||||||
|
(% of primary NIW)
|
2018
|
2017
|
2018
|
2017
|
||||||||||
|
95.01% and above
|
17.4
|
%
|
11.6
|
%
|
15.5
|
%
|
10.0
|
%
|
||||||
|
90.01% to 95.00%
|
43.1
|
%
|
46.4
|
%
|
43.7
|
%
|
47.2
|
%
|
||||||
|
85.01% to 90.00%
|
28.4
|
%
|
29.3
|
%
|
28.7
|
%
|
29.8
|
%
|
||||||
|
80.01% to 85%
|
11.1
|
%
|
12.7
|
%
|
12.1
|
%
|
13.0
|
%
|
||||||
MGIC Investment Corporation - Q3 2018 |
48
|
Primary NIW by debt-to-income ratio
|
Three Months Ended September 30,
|
Nine Months Ended September 30,
|
||||||||||||
|
(% of primary NIW)
|
2018
|
2017
|
2018
|
2017
|
||||||||||
|
45.01% and above
|
19.5
|
%
|
9.1
|
%
|
19.7
|
%
|
10.4
|
%
|
||||||
|
45.00% and below
|
80.5
|
%
|
90.9
|
%
|
80.3
|
%
|
89.6
|
%
|
||||||
|
Primary NIW by policy payment type
|
Three Months Ended September 30,
|
Nine Months Ended September 30,
|
||||||||||||
|
(% of primary NIW)
|
2018
|
2017
|
2018
|
2017
|
||||||||||
|
Monthly premiums
|
83.9
|
%
|
80.3
|
%
|
82.9
|
%
|
81.6
|
%
|
||||||
|
Single premiums
|
15.9
|
%
|
19.5
|
%
|
16.9
|
%
|
18.2
|
%
|
||||||
|
Annual premiums
|
0.2
|
%
|
0.2
|
%
|
0.2
|
%
|
0.2
|
%
|
||||||
|
Primary NIW by type of mortgage
|
Three Months Ended September 30,
|
Nine Months Ended September 30,
|
||||||||||||
|
(% of primary NIW)
|
2018
|
2017
|
2018
|
2017
|
||||||||||
|
Purchases
|
95.2
|
%
|
90.7
|
%
|
92.9
|
%
|
89.0
|
%
|
||||||
|
Refinances
|
4.8
|
%
|
9.3
|
%
|
7.1
|
%
|
11.0
|
%
|
||||||
Insurance and risk in force
The amount of our IIF and RIF is impacted by the amount of NIW and cancellations of primary IIF during the period. Cancellation activity is primarily due to refinancing activity, but is also impacted by rescissions, cancellations due to claim payment, and policies cancelled when borrowers achieve the required amount of home equity. Refinancing activity has historically been affected by the level of mortgage interest rates and the level of home price appreciation. Cancellations generally move inversely to the change in the direction of interest rates, although they generally lag a change in direction.
Persistency
Our persistency was
81.0%
at
September 30, 2018
compared to 80.1% at
December 31, 2017
and 78.8% at
September 30, 2017
. Since 2000, our year-end persistency ranged from a high of 84.7% at December 31, 2009 to a low of 47.1% at December 31, 2003.
|
IIF and RIF
|
Three Months Ended September 30,
|
Nine Months Ended September 30,
|
||||||||||||||||
|
(In billions)
|
2018
|
2017
|
2018
|
2017
|
||||||||||||||
|
NIW
|
$
|
14.5
|
|
$
|
14.1
|
|
$
|
38.3
|
|
$
|
36.3
|
|
||||||
|
Cancellations
|
(9.4
|
)
|
(10.4
|
)
|
(27.4
|
)
|
(27.3
|
)
|
||||||||||
|
Increase in primary IIF
|
$
|
5.1
|
|
$
|
3.7
|
|
$
|
10.9
|
|
$
|
9.0
|
|
||||||
|
(In billions)
|
2018
|
2017
|
||||||||||||||||
|
Direct primary IIF as of September 30,
|
$
|
205.8
|
|
$
|
191.0
|
|
||||||||||||
|
Direct primary RIF as of September 30,
|
$
|
53.1
|
|
$
|
49.4
|
|
||||||||||||
Credit profile of our primary RIF
The proportion of our total primary RIF that was written after 2008 has been steadily increasing. Our 2009 and later books possess significantly improved risk characteristics when compared to our 2005-2008 origination years. The loans we insured beginning in 2009, on average, have substantially higher FICO scores and lower LTVs than those insured in 2005-2008. The credit profile of our pre-2009 RIF has benefited from programs such as HARP. HARP allows borrowers who are not delinquent, but who may not otherwise be able to refinance their loans under the current GSE underwriting standards due to, for example, the current LTV exceeding 100%, to refinance and lower their note rate. Loans associated with
97.6%
of all of our HARP modifications were current as of
September 30, 2018
. The aggregate of our 2009-2018 books and our HARP modifications accounted for approximately
89%
of our total primary RIF at
September 30, 2018
.
MGIC Investment Corporation - Q3 2018 |
49
|
Primary RIF
|
($ in millions)
|
September 30, 2018
|
December 31, 2017
|
September 30, 2017
|
||||||||||||||||
|
Policy Year
|
RIF
|
% of RIF
|
RIF
|
% of RIF
|
RIF
|
% of RIF
|
||||||||||||||
|
2009+
|
$
|
43,670
|
|
82
|
%
|
$
|
39,248
|
|
78
|
%
|
$
|
37,700
|
|
76
|
%
|
|||||
|
2005 - 2008 (HARP)
|
3,245
|
|
6
|
%
|
3,773
|
|
7
|
%
|
3,957
|
|
8
|
%
|
||||||||
|
Other years (HARP)
|
246
|
|
1
|
%
|
308
|
|
1
|
%
|
328
|
|
1
|
%
|
||||||||
|
Subtotal
|
47,161
|
|
89
|
%
|
43,330
|
|
86
|
%
|
41,985
|
|
85
|
%
|
||||||||
|
2005- 2008 (Non-HARP)
|
5,011
|
|
9
|
%
|
5,894
|
|
12
|
%
|
6,219
|
|
13
|
%
|
||||||||
|
Other years (Non-HARP)
|
892
|
|
2
|
%
|
1,095
|
|
2
|
%
|
1,177
|
|
2
|
%
|
||||||||
|
Subtotal
|
5,903
|
|
11
|
%
|
6,989
|
|
14
|
%
|
7,396
|
|
15
|
%
|
||||||||
|
Total Primary RIF
|
$
|
53,064
|
|
100
|
%
|
$
|
50,319
|
|
100
|
%
|
$
|
49,381
|
|
100
|
%
|
|||||
Pool and other insurance
MGIC has written no new pool insurance since 2008; however, for a variety of reasons, including responding to capital market alternatives to PMI and customer demands, MGIC may write pool risk in the future. Our direct pool risk in force was
$431 million
(
$232 million
on pool policies with aggregate loss limits and
$199 million
on pool policies without aggregate loss limits) at
September 30, 2018
compared to $471 million ($236 million on pool policies with aggregate loss limits and $235 million on pool policies without aggregate loss limits) at
December 31, 2017
. If claim payments associated with a specific pool reach the aggregate loss limit, the remaining IIF within the pool would be cancelled and any remaining delinquencies under the pool would be removed from our delinquent inventory.
In connection with the GSEs credit risk transfer programs, MAC, a subsidiary of MGIC provided insurance relating to RIF on loans in reference pools acquired by the GSEs covering approximately $42 million of risk as reported to us as of
September 30, 2018
. Our original participation in these transactions is an aggregate of approximately $68 million of risk.
MGIC Investment Corporation - Q3 2018 |
50
Consolidated Results of Operations
The following section of the MD&A provides a comparative discussion of MGIC Investment Corporation’s Consolidated Results of Operations for the
three and nine
months ended
September 30,
2018
and
2017
.
Revenues
|
Revenues
|
Three Months Ended September 30,
|
Nine Months Ended September 30,
|
||||||||||||||||||||||
|
(in millions)
|
2018
|
2017
|
% Change
|
2018
|
2017
|
% Change
|
||||||||||||||||||
|
Net premiums written
|
$
|
251.9
|
|
$
|
255.9
|
|
(2
|
)
|
$
|
744.2
|
|
$
|
738.4
|
|
1
|
|
||||||||
|
|
|
|||||||||||||||||||||||
|
Net premiums earned
|
$
|
250.4
|
|
$
|
237.1
|
|
6
|
|
$
|
729.5
|
|
$
|
697.3
|
|
5
|
|
||||||||
|
Investment income, net of expenses
|
36.4
|
|
30.4
|
|
20
|
|
103.0
|
|
89.6
|
|
15
|
|
||||||||||||
|
Net realized investment gains (losses)
|
1.1
|
|
—
|
|
N/M
|
|
(1.1
|
)
|
(0.2
|
)
|
N/M
|
|
||||||||||||
|
Other revenue
|
2.5
|
|
2.9
|
|
(14
|
)
|
6.8
|
|
7.9
|
|
(13
|
)
|
||||||||||||
|
Total revenues
|
$
|
290.4
|
|
$
|
270.4
|
|
7
|
|
$
|
838.2
|
|
$
|
794.6
|
|
5
|
|
||||||||
Net premiums written and earned
Comparative quarterly and year to date results
NPE for the three and nine months ended
September 30, 2018
each increased from the prior year periods primarily due to lower ceded premiums, net, as the increase in profit commission more than offset the increase in gross ceded premiums. The profit commission increased due to a decrease in ceded losses, driven by primary loss reserve development. The increase in gross ceded premiums resulted from a higher percentage of our covered NIW having LTVs 95% or greater and/or DTI ratios greater than 45%, both of which have higher premiums. The increases in NPE also reflect an increase in our IIF compared to the prior year, however this impact is being offset in part by a lower premium yield.
See
“Overview - Factors Affecting Our Results”
above for additional factors that influenced the amount of net premiums written and earned during the periods.
Premium yield
Premium yield (NPE divided by average IIF) decreased from the prior year periods to
49.3
basis points and
48.9
basis points for
Q3
and YTD 2018, respectively, (
Q3
2017
:
50.1
basis points, YTD 2017
49.8
basis points) and is influenced by a number of key drivers, which have a varying impact from period to period.
The decline in our premium yield compared to the prior year periods reflects:
|
•
|
A larger percentage of our IIF from book years with lower premium rates due to a decline in premium rates in recent periods and certain policies undergoing premium rate resets on their ten-year anniversaries; offset in part by,
|
|
•
|
less of an adverse impact from our reinsurance driven by favorable primary loss reserve development, which resulted in a higher profit commission, and
|
|
•
|
less of an adverse impact from premium refunds primarily due to lower claim activity.
|
In 2018, we continued to evolve our pricing from a standard rate card approach, where prices are based on relatively few attributes, to a more granular approach, where more attributes are considered. We reduced certain of our rates in the second through fourth quarters of 2018. Those changes will reduce our premium yield over time as older insurance policies with higher premium rates run off and new insurance policies with lower premium rates are written. We continue to develop our loan-level pricing system and expect to release it in 2019. These systems allow for formulaic, risk-based pricing that may be adjusted more frequently.
MGIC Investment Corporation - Q3 2018 |
51
The following table reconciles our premium yield for the
three and nine
months ended
September 30,
2018
from the respective prior year periods.
|
Premium yield
|
(in basis points)
|
Three Months Ended
|
Nine Months Ended
|
|||||
|
Premium yield - September 30, 2017
|
50.1
|
|
49.8
|
|
||||
|
Reconciliation:
|
||||||||
|
Change in premium rates
|
(2.6
|
)
|
(2.9
|
)
|
||||
|
Change in premium refunds and accruals
|
0.5
|
|
0.9
|
|
||||
|
Single premium policy persistency
|
(0.6
|
)
|
(0.2
|
)
|
||||
|
Reinsurance
|
1.9
|
|
1.3
|
|
||||
|
Premium yield - September 30, 2018
|
49.3
|
|
48.9
|
|
||||
Reinsurance agreements
Our quota share reinsurance affects various lines of our statements of operations and therefore we believe it should be analyzed by reviewing its total effect on our pre-tax income, described as follows.
|
•
|
We cede a fixed percentage of premiums on insurance covered by the agreements.
|
|
•
|
We receive the benefit of a profit commission through a reduction in the premiums we cede. The profit commission varies directly and inversely with the level of losses on a “dollar for dollar” basis and is eliminated at levels of losses that we do not expect to occur. As a result, lower levels of losses result in a higher profit commission and less benefit from ceded losses; higher levels of losses result in more benefit from ceded losses and a lower profit commission (or for levels of losses we do not expect, its elimination).
|
|
•
|
We receive the benefit of a ceding commission through a reduction in underwriting expenses equal to 20% of premiums ceded (before the effect of the profit commission).
|
|
•
|
We cede a fixed percentage of losses incurred on insurance covered by the agreements.
|
The blended pre-tax cost of reinsurance under our different transactions is less than 6% (but will decrease if losses are materially higher than we expect). This blended pre-tax cost is derived by dividing the reduction in our pre-tax net income on loans covered by reinsurance by our direct (that is, without reinsurance) premiums from such loans. Although the pre-tax cost of the reinsurance under each transaction is generally constant, the effect of the reinsurance on the various components of pre-tax income discussed above will vary from period to period, depending on the level of ceded losses.
The amount of our NIW subject to our QSR Transactions as shown in table below will vary from period to period in part due to coverage limits that may be triggered depending on the mix of our risk written during the period. For example, our 2018 QSR Transaction excludes loans with LTV ratios of 85% and below, but increases the coverage limit for risk written with the following loan level characteristics when compared to our 2017 QSR Transaction: (1) LTV ratios of 95% and greater, and (2) DTI ratios greater than 45%. The number of loans we insured with DTI ratios greater than 45% increased in the second half of 2017 after the requirements of the GSE underwriting guidelines were made more liberal, and remained elevated through the first nine months of 2018. Despite the increased coverage limit in our 2018 QSR Transaction, the risk written in the first nine months of 2018 on loans with DTI ratios greater than 45% exceeded the coverage limit under our 2018 QSR Transaction which contributed to the decline in the percentage of NIW covered in first nine months of 2018 compared with the prior year period.
MGIC Investment Corporation - Q3 2018 |
52
Our excess of loss reinsurance entered into October 30, 2018, which covers losses beginning August 1, 2018, provides up to
$318.6 million
of loss coverage on an existing portfolio of inforce policies having an inforce date on or after July 1, 2016 and before January 1, 2018. The initial aggregate exposed principal balance was approximately $7.5 billion, which takes into account the mortgage insurance coverage percentage, net retained quota share percentage, and the reinsurance inclusion percentage of the unpaid principal balance. The excess of loss reinsurance had no material impact on our statements of operations for the three and nine months ended September 30, 2018.
The following tables provide information related to our quota share and captive reinsurance agreements for
2018
and
2017
.
|
Quota share reinsurance
|
As of and For the Nine Months Ended September 30,
|
|||||||||
|
($ in thousands, unless otherwise stated)
|
2018
|
2017
|
||||||||
|
NIW subject to quota share reinsurance agreements
|
75
|
%
|
87
|
%
|
||||||
|
IIF subject to quota share reinsurance agreements
|
78
|
%
|
78
|
%
|
||||||
|
Statements of operations:
|
||||||||||
|
Ceded premiums written, net
|
$
|
79,716
|
|
$
|
88,692
|
|
||||
|
% of direct premiums written
|
10
|
%
|
11
|
%
|
||||||
|
Ceded premiums earned, net
|
$
|
79,716
|
|
$
|
88,692
|
|
||||
|
% of direct premiums earned
|
10
|
%
|
11
|
%
|
||||||
|
Profit commission
|
$
|
111,622
|
|
$
|
95,063
|
|
||||
|
Ceding commissions
|
$
|
38,268
|
|
$
|
36,751
|
|
||||
|
Ceded losses incurred
|
$
|
3,531
|
|
$
|
14,990
|
|
||||
|
Mortgage insurance portfolio:
|
|
|
||||||||
|
Ceded RIF
(in millions)
|
$
|
12,581
|
|
$
|
11,619
|
|
||||
|
Captive reinsurance
|
As of and For the Nine Months Ended September 30,
|
|||||||||
|
($ in thousands)
|
2018
|
2017
|
||||||||
|
IIF subject to captive reinsurance agreements
|
1.0
|
%
|
1
|
%
|
||||||
|
Statements of operations:
|
||||||||||
|
Ceded premiums written
|
$
|
102
|
|
$
|
3,516
|
|
||||
|
% of direct premiums written
|
—
|
%
|
0.4
|
%
|
||||||
|
Ceded premiums earned
|
$
|
150
|
|
$
|
3,545
|
|
||||
|
% of direct premiums earned
|
—
|
%
|
0.4
|
%
|
||||||
|
Ceded losses incurred
|
$
|
278
|
|
$
|
(519
|
)
|
||||
Investment income
Comparative quarterly and year to date results
Net investment income in the
third
quarter and first
nine
months of
2018
was
$36.4 million
and
$103.0 million
, respectively, up from
$30.4 million
and
$89.6 million
in the respective prior year periods. The increases in investment income were due to an increase in the average balance of the investment portfolio along with higher investment yields over the periods.
Other revenue
Comparative quarterly and year to date results
Other revenue for the
third
quarter and first
nine
months of
2018
was
$2.5 million
and
$6.8 million
, respectively, down from
$2.9 million
and
$7.9 million
in the respective prior year periods primarily due to a decline in contract underwriting fees.
MGIC Investment Corporation - Q3 2018 |
53
Losses and expenses
|
Losses and expenses
|
Three Months Ended September 30,
|
Nine Months Ended September 30,
|
||||||||||||||||
|
(in millions)
|
2018
|
2017
|
2018
|
2017
|
||||||||||||||
|
Losses incurred, net
|
$
|
(1.5
|
)
|
$
|
29.7
|
|
$
|
8.9
|
|
$
|
84.7
|
|
||||||
|
Amortization of deferred policy acquisition costs
|
3.2
|
|
3.0
|
|
8.6
|
|
7.8
|
|
||||||||||
|
Other underwriting and operating expenses, net
|
43.7
|
|
39.9
|
|
131.6
|
|
119.2
|
|
||||||||||
|
Interest expense
|
13.3
|
|
13.3
|
|
39.7
|
|
43.8
|
|
||||||||||
|
Loss on debt extinguishment
|
—
|
|
—
|
|
—
|
|
0.1
|
|
||||||||||
|
Total losses and expenses
|
$
|
58.5
|
|
$
|
85.9
|
|
$
|
188.8
|
|
$
|
255.5
|
|
||||||
Losses incurred, net
As discussed in “Critical Accounting Policies” in our 2017 10-K MD&A and consistent with industry practices, we establish loss reserves for future claims only for loans that are currently delinquent. The terms “delinquent” and “default” are used interchangeably by us. We consider a loan to be delinquent when it is two or more payments past due. Loss reserves are established based on estimating the number of loans in our delinquent inventory that will result in a claim payment, which is referred to as the claim rate, and further estimating the amount of the claim payment, which is referred to as claim severity.
Estimation of losses is inherently judgmental. The conditions that affect the claim rate and claim severity include the current and future state of the domestic economy, including unemployment, and the current and future strength of local housing markets. The actual amount of the claim payments may be substantially different than our loss reserve estimates. Our estimates could be adversely affected by several factors, including a deterioration of regional or national economic conditions, including unemployment, leading to a reduction in borrower income and thus their ability to make mortgage payments, and a drop in housing values that could result in, among other things, greater losses on loans, and may affect borrower willingness to continue to make mortgage payments when the value of the home is below the mortgage balance. Historically, losses incurred have followed a seasonal trend in which the second half of the year has weaker credit performance than the first half, with higher new notice activity and a lower cure rate. Our estimates are also affected by any agreements we enter into regarding our claims paying practices, such as the settlement agreements discussed in
Note 5 – “Litigation and Contingencies”
to our consolidated financial statements. Changes to our estimates could result in a material impact to our consolidated results of operations and financial position, even in a stable economic environment.
Comparative quarterly results
Losses incurred, net in the
third
quarter of
2018
were
($1.5) million
compared to
$29.7 million
in the prior year period. The decrease was primarily due to an increase in favorable development on delinquencies previously reported in prior years. Favorable development in each of the three months ended September 30, 2018 and 2017 was primarily due to a lower claim rate. In addition, losses incurred on current year defaults declined due to 15% fewer new delinquent notices received and a lower estimated claim rate on those notices compared to the prior year period.
Comparative year to date results
Losses incurred, net in the
nine months ended
September 30, 2018
were
$8.9 million
compared to
$84.7 million
in the prior year period. The decrease was primarily due to a decrease in losses and LAE incurred on defaults reported in the current year. Losses incurred on current year defaults declined due to 11% fewer new delinquent notices received and a lower estimated claim rate on those notices compared to the prior year period. Favorable development on prior year defaults occurred in each of the first
nine
months of 2018 and 2017 primarily due to a lower claim rate on previously received delinquencies.
MGIC Investment Corporation - Q3 2018 |
54
|
Composition of losses incurred
|
Three Months Ended September 30,
|
Nine Months Ended September 30,
|
||||||||||||||||||||||
|
2018
|
2017
|
% Change
|
2018
|
2017
|
% Change
|
|||||||||||||||||||
|
Current year / New notices
|
$
|
47.4
|
|
$
|
60.6
|
|
(22
|
)
|
$
|
155.8
|
|
$
|
219.5
|
|
(29
|
)
|
||||||||
|
Prior year reserve development
|
(49.0
|
)
|
(30.8
|
)
|
59
|
|
(146.9
|
)
|
(134.8
|
)
|
9
|
|
||||||||||||
|
Losses incurred, net
|
$
|
(1.5
|
)
|
$
|
29.7
|
|
(105
|
)
|
$
|
8.9
|
|
$
|
84.7
|
|
(89
|
)
|
||||||||
|
Loss ratio
|
Three Months Ended September 30,
|
Nine Months Ended September 30,
|
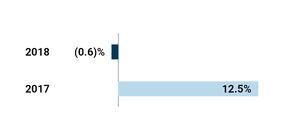
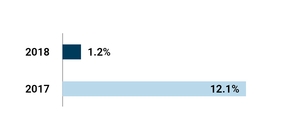
The loss ratio is the ratio, expressed as a percentage, of the sum of incurred losses and loss adjustment expenses to net premiums earned. The decline in the loss ratio in the
three and nine
months ended
September 30, 2018
compared to the respective prior year periods was primarily due to a lower level of losses incurred, net.
|
New notice claim rate - total
|
Three Months Ended September 30,
|
Nine Months Ended September 30,
|
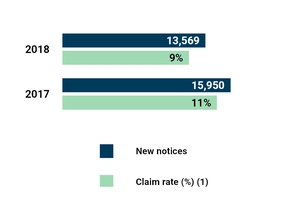
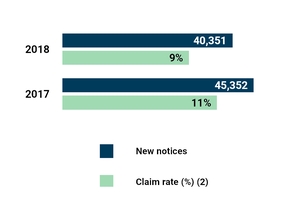
|
(1)
|
Claim rate is the approximate quarterly rate.
|
|
(2)
|
Claim rate is the approximate year-to-date rate.
|
MGIC Investment Corporation - Q3 2018 |
55
|
New notice claim rate - loans insured 2008 and prior
|
Three Months Ended September 30,
|
Nine Months Ended September 30,
|
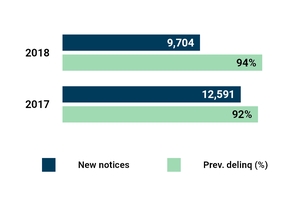
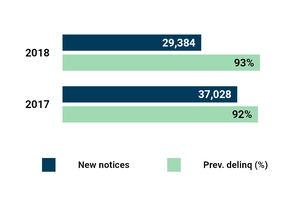
New notice activity continues to be primarily driven by loans insured in 2008 and prior, which continue to experience a cycle whereby many loans default, cure, and re-default. This cycle, along with the duration that defaults may ultimately remain in our notice inventory, results in significant judgment in establishing the estimated claim rate.
Claim severity
Factors that impact claim severity include the exposure on the loan (the unpaid principal balance of the loan multiplied by our insurance coverage percentage), the amount of time between delinquency and claim filing (which impacts the amount of interest and expenses, with a longer period between delinquency and claim filing generally increasing severity), and curtailments. As discussed in
Note 12 - “Loss Reserves,”
the average time for servicers to process foreclosures has recently shortened. Therefore, we expect the average number of missed payments at the time a claim is received to be approximately 18 to 24 for new notices received, compared to an average of 35 to 42 missed payments for claims received in recent periods. Our loss reserves estimates take into consideration trends over time, because the development of the delinquencies may vary from period to period without establishing a meaningful trend.
Under our current master policy terms, an insured may include accumulated interest when filing a claim only for the first three years the loan is delinquent. However, the majority of loans insured prior to 2009 (which represent the majority of loans in the delinquent inventory) are not subject to that same limitation. In each case, the insured must comply with its obligations under the terms of the applicable master policy.
MGIC Investment Corporation - Q3 2018 |
56
|
Claims severity trend
|
Period
|
Average exposure on claim paid
|
Average claim paid
|
% Paid to exposure
|
Average number of missed payments at claim received date
|
|||||||||||
|
Q3 2018
|
$
|
43,290
|
|
$
|
47,230
|
|
109.1
|
%
|
42
|
|
||||||
|
Q2 2018
|
44,522
|
|
50,175
|
|
112.7
|
%
|
39
|
|
||||||||
|
Q1 2018
|
45,597
|
|
51,069
|
|
112.0
|
%
|
38
|
|
||||||||
|
Q4 2017
|
44,437
|
|
49,177
|
|
110.7
|
%
|
36
|
|
||||||||
|
Q3 2017
|
43,313
|
|
46,389
|
|
107.1
|
%
|
35
|
|
||||||||
|
Q2 2017
|
44,747
|
|
49,105
|
|
109.7
|
%
|
35
|
|
||||||||
|
Q1 2017
|
44,238
|
|
49,110
|
|
111.0
|
%
|
35
|
|
||||||||
|
Q4 2016
|
43,200
|
|
48,297
|
|
111.8
|
%
|
35
|
|
||||||||
|
Q3 2016
|
43,747
|
|
48,050
|
|
109.8
|
%
|
34
|
|
||||||||
|
Q2 2016
|
43,709
|
|
47,953
|
|
109.7
|
%
|
35
|
|
||||||||
|
Q1 2016
|
44,094
|
|
49,281
|
|
111.8
|
%
|
34
|
|
||||||||
|
Note: Table excludes material settlements. Settlements include amounts paid in settlement disputes for claims paying practices and commutations of pools of NPLs.
|
||||||||||||||||
In considering the potential sensitivity of the factors underlying our estimate of loss reserves, it is possible that even a relatively small change in our estimated claim rate or severity could have a material impact on reserves and, correspondingly, on our consolidated results of operations even in a stable economic environment. For example, as of
September 30, 2018
, assuming all other factors remain constant, a $1,000 increase/decrease in the average severity reserve factor would change the reserve amount by approximately +/- $13 million. A 1 percentage point increase/decrease in the average claim rate reserve factor would change the reserve amount by approximately +/- $19 million.
See
Note 12 – “Loss Reserves”
to our consolidated financial statements for a discussion of our losses incurred and claims paying practices (including curtailments).
Net losses and LAE paid
Net losses and LAE paid in the
three and nine
months ended
September 30, 2018
declined
23%
and
38%
, respectively, compared to the same periods in the prior year primarily due to lower claim activity on our primary business. We believe losses and LAE paid will continue to decline as the credit profile of our RIF continues to improve and our delinquent inventory declines.
The following table presents our net losses and LAE paid for the
three and nine
months ended
September 30, 2018
and
2017
.
|
Net losses and LAE paid
|
Three Months Ended September 30,
|
Nine Months Ended September 30,
|
||||||||||||||||
|
(In millions)
|
2018
|
2017
|
2018
|
2017
|
||||||||||||||
|
Total primary (excluding settlements)
|
$
|
65
|
|
$
|
101
|
|
$
|
220
|
|
$
|
357
|
|
||||||
|
Claims paying practices and NPL settlements
(1)
|
19
|
|
9
|
|
40
|
|
54
|
|
||||||||||
|
Pool
|
2
|
|
2
|
|
5
|
|
8
|
|
||||||||||
|
Direct losses paid
|
86
|
|
112
|
|
265
|
|
419
|
|
||||||||||
|
Reinsurance
|
(3
|
)
|
(3
|
)
|
(17
|
)
|
(18
|
)
|
||||||||||
|
Net losses paid
|
83
|
|
109
|
|
248
|
|
401
|
|
||||||||||
|
LAE
|
4
|
|
4
|
|
12
|
|
13
|
|
||||||||||
|
Net losses and LAE paid before terminations
|
87
|
|
113
|
|
260
|
|
414
|
|
||||||||||
|
Reinsurance terminations
|
—
|
|
—
|
|
(2
|
)
|
—
|
|
||||||||||
|
Net losses and LAE paid
|
$
|
87
|
|
$
|
113
|
|
$
|
258
|
|
$
|
414
|
|
||||||
|
(1)
|
See
Note 12 - “Loss Reserves”
for additional information on our settlements of disputes for claims paying practices and commutations of NPLs.
|
MGIC Investment Corporation - Q3 2018 |
57
Primary claims paid for the top 15 jurisdictions (based on
2018
losses paid) and all other jurisdictions for the
three and nine
months ended
September 30, 2018
and
2017
appears in the following table.
|
Paid losses by jurisdiction
|
Three Months Ended September 30,
|
Nine Months Ended September 30,
|
||||||||||||||||
|
(In millions)
|
2018
|
2017
|
2018
|
2017
|
||||||||||||||
|
New Jersey
|
$
|
8
|
|
$
|
12
|
|
$
|
34
|
|
$
|
47
|
|
||||||
|
New York
|
7
|
|
8
|
|
25
|
|
29
|
|
||||||||||
|
Florida
|
8
|
|
10
|
|
22
|
|
40
|
|
||||||||||
|
Illinois
|
4
|
|
7
|
|
15
|
|
22
|
|
||||||||||
|
Maryland
|
3
|
|
5
|
|
13
|
|
19
|
|
||||||||||
|
California
|
3
|
|
5
|
|
9
|
|
15
|
|
||||||||||
|
Pennsylvania
|
3
|
|
4
|
|
9
|
|
18
|
|
||||||||||
|
Ohio
|
2
|
|
4
|
|
7
|
|
12
|
|
||||||||||
|
Massachusetts
|
2
|
|
2
|
|
6
|
|
10
|
|
||||||||||
|
Puerto Rico
|
2
|
|
5
|
|
5
|
|
15
|
|
||||||||||
|
Connecticut
|
1
|
|
3
|
|
5
|
|
9
|
|
||||||||||
|
Virginia
|
1
|
|
2
|
|
5
|
|
8
|
|
||||||||||
|
Texas
|
1
|
|
2
|
|
4
|
|
6
|
|
||||||||||
|
Georgia
|
1
|
|
2
|
|
4
|
|
8
|
|
||||||||||
|
North Carolina
|
1
|
|
2
|
|
4
|
|
5
|
|
||||||||||
|
All other jurisdictions
|
18
|
|
28
|
|
53
|
|
94
|
|
||||||||||
|
Total primary (excluding settlements)
|
$
|
65
|
|
$
|
101
|
|
$
|
220
|
|
357
|
|
|||||||
The primary average claim paid for the top 5 states (based on
2018
losses paid) for the
three and nine
months ended
September 30, 2018
and
2017
appears in the following table.
|
Primary average claim paid
|
Three Months Ended September 30,
|
Nine Months Ended September 30,
|
|||||||||||||||
|
2018
|
2017
|
2018
|
2017
|
||||||||||||||
|
New Jersey*
|
$
|
80,806
|
|
$
|
84,426
|
|
$
|
89,236
|
|
$
|
85,868
|
|
|||||
|
New York*
|
106,604
|
|
73,285
|
|
99,603
|
|
80,077
|
|
|||||||||
|
Florida*
|
56,753
|
|
56,482
|
|
58,131
|
|
63,121
|
|
|||||||||
|
Illinois*
|
41,458
|
|
45,750
|
|
43,569
|
|
46,276
|
|
|||||||||
|
Maryland
|
62,619
|
|
72,153
|
|
73,039
|
|
76,864
|
|
|||||||||
|
All other jurisdictions
|
37,777
|
|
38,882
|
|
38,127
|
|
39,124
|
|
|||||||||
|
All jurisdictions
|
47,230
|
|
46,389
|
|
49,581
|
|
48,302
|
|
|||||||||
Note: Asterisk denotes jurisdictions in the table above that predominately use a judicial foreclosure process, which generally increases the amount of time it takes for a foreclosure to be completed
.
The primary average claim paid can vary materially from period to period based upon a variety of factors, including the local market conditions, average loan amount, average coverage percentage, the amount of time between delinquency and claim filing, and our loss mitigation efforts on loans for which claims are paid.
MGIC Investment Corporation - Q3 2018 |
58
The primary average RIF on delinquent loans at
September 30, 2018
,
December 31, 2017
and
September 30, 2017
and for the top 5 jurisdictions (based on
2018
losses paid) appears in the following table.
|
Primary average RIF - delinquent loans
|
September 30, 2018
|
December 31, 2017
|
September 30, 2017
|
||||||||||
|
New Jersey
|
$
|
65,948
|
|
$
|
65,684
|
|
$
|
65,301
|
|
||||
|
New York
|
71,475
|
|
71,260
|
|
71,046
|
|
|||||||
|
Florida
|
54,483
|
|
54,872
|
|
53,484
|
|
|||||||
|
Illinois
|
40,465
|
|
40,794
|
|
40,967
|
|
|||||||
|
Maryland
|
64,635
|
|
66,266
|
|
67,071
|
|
|||||||
|
All other jurisdictions
|
40,060
|
|
39,848
|
|
39,732
|
|
|||||||
|
All jurisdictions
|
44,810
|
|
45,153
|
|
44,663
|
|
|||||||
The primary average RIF on all loans was $50,629, $49,142, and $48,694 at
September 30, 2018
,
December 31, 2017
and
September 30, 2017
, respectively.
Loss reserves
Our primary delinquency rate at
September 30, 2018
was
3.19%
(YE 2017:
4.55%
,
September 30, 2017
:
4.07%
). Our primary delinquent inventory was
33,398
loans at
September 30, 2018
, representing a decrease of
28%
from December 31, 2017 and
19%
from
September 30, 2017
. The reduction in our primary delinquent inventory is the result of the total number of delinquent loans: (1) that have cured; (2) for which claim payments have been made; or (3) that have resulted in rescission, claim denial, or removal from inventory due to settlements of claims paying disputes or commutations of coverage of pools of NPLs, collectively, exceeding the total number of new delinquencies on insured loans. In recent periods, we have experienced improved cure rates and the number of delinquencies in inventory with twelve or more missed payments has been declining. Generally, a defaulted loan with fewer missed payments is less likely to result in a claim.
MGIC Investment Corporation - Q3 2018 |
59
The gross reserves at
September 30, 2018
,
December 31, 2017
, and
September 30, 2017
appear in the table below.
|
Gross reserves
|
September 30, 2018
|
December 31, 2017
|
September 30, 2017
|
||||||||||||||||||
|
Primary:
|
|||||||||||||||||||||
|
Direct loss reserves (in millions)
|
$
|
652
|
|
$
|
913
|
|
$
|
1,026
|
|
||||||||||||
|
IBNR and LAE
|
55
|
|
58
|
|
64
|
|
|||||||||||||||
|
Total primary loss reserves
|
$
|
707
|
|
$
|
971
|
|
$
|
1,090
|
|
||||||||||||
|
Ending delinquent inventory
|
33,398
|
|
46,556
|
|
41,235
|
|
|||||||||||||||
|
Percentage of loans delinquent (delinquency rate)
|
3.19
|
%
|
4.55
|
%
|
4.07
|
%
|
|||||||||||||||
|
Average total primary loss reserves per delinquency
|
$
|
21,184
|
|
$
|
20,851
|
|
$
|
26,430
|
|
||||||||||||
|
Primary claims received inventory included in ending delinquent inventory
|
766
|
|
954
|
|
1,063
|
|
|||||||||||||||
|
Pool
(1)
:
|
|
|
|
|
|
|
|||||||||||||||
|
Direct loss reserves (in millions):
|
|
|
|||||||||||||||||||
|
With aggregate loss limits
|
$
|
9
|
|
$
|
10
|
|
$
|
10
|
|
||||||||||||
|
Without aggregate loss limits
|
4
|
|
4
|
|
5
|
|
|||||||||||||||
|
Total pool direct loss reserves
|
$
|
13
|
|
$
|
14
|
|
$
|
15
|
|
||||||||||||
|
Ending default inventory:
|
|
|
|
|
|
|
|||||||||||||||
|
With aggregate loss limits
|
752
|
|
952
|
|
1,057
|
|
|||||||||||||||
|
Without aggregate loss limits
|
280
|
|
357
|
|
369
|
|
|||||||||||||||
|
Total pool ending delinquent inventory
|
1,032
|
|
1,309
|
|
1,426
|
|
|||||||||||||||
|
Pool claims received inventory included in ending delinquent inventory
|
43
|
|
42
|
|
42
|
|
|||||||||||||||
|
Other gross reserves (in millions)
|
$
|
1
|
|
$
|
1
|
|
$
|
—
|
|
||||||||||||
|
(1)
|
Since a number of our pool policies include aggregate loss limits and/or deductibles, we do not disclose an average direct reserve per delinquency for our pool business.
|
Hurricane activity
2017 hurricanes.
Hurricane activity primarily impacting Texas, Florida, and Puerto Rico in the third quarter of 2017 increased the number of new notices of delinquency reported to us in the fourth quarter of 2017. Consistent with our analysis and past experience, the majority of the delinquent notices in the hurricane affected areas that we estimated to be caused by the hurricanes have cured and did not result in a material increase in our incurred losses or losses paid. Paid losses on all loans in those jurisdictions decreased when compared to the respective prior year periods in part because foreclosure moratoriums in the Texas and Florida IADAs through December 31, 2017 and Puerto Rico through May 31, 2018, impacted all delinquent loans in those areas, including those not affected by hurricanes. For those notices we estimated to be caused by the hurricanes, we established our loss reserves with a lower estimated claim rate than the claim rate we applied to other notices in our delinquent inventory. The decline in the average total primary reserves per delinquency as of
December 31, 2017
, when compared to
September 30, 2017
, was due in part to the reserving on the estimated hurricane notices. When excluding the impact of those notices we estimated to be caused by the hurricanes, the average total primary loss reserves per delinquency was approximately $24,000 at
December 31, 2017
. The notices we estimated to be caused by the hurricanes remaining in our inventory had no material impact on the average total primary loss reserve per delinquency at September 30, 2018.
2018 hurricanes.
Hurricane activity primarily impacting North Carolina, South Carolina, and Florida in the third quarter of 2018 is expected to result in some additional new notice activity in the hurricane impacted areas in the fourth quarter of 2018. Based on our analysis and past experience, we would expect the majority of the delinquent notices in the hurricane affected areas that may be caused by the hurricanes to cure and not result in a material increase in our incurred losses or losses paid. Less than 1 percent of our total risk in force is for loans in areas impacted by these hurricanes.
MGIC Investment Corporation - Q3 2018 |
60
See our risk factors titled “
Our financial results may be adversely impacted by natural disasters; certain hurricanes may impact our incurred losses, the amount and timing of paid claims, our inventory of notices of default and our Minimum Required Assets under PMIERs.
” and
“Downturns in the domestic economy or declines in the value of borrowers’ homes from their value at the time their loans closed may result in more homeowners defaulting and our losses increasing, with a corresponding decrease in our returns”
for factors that could cause our actual results to differ from our expectations expressed in this paragraph.
The primary delinquent inventory for the top 15 jurisdictions (based on
2018
losses paid) at
September 30, 2018
,
December 31, 2017
and
September 30, 2017
appears in the following table.
|
Primary delinquent inventory by jurisdiction
|
September 30, 2018
|
December 31, 2017
|
September 30, 2017
|
|||||||
|
New Jersey*
|
1,212
|
|
1,749
|
|
1,917
|
|
||||
|
New York*
|
1,934
|
|
2,387
|
|
2,519
|
|
||||
|
Florida*
|
3,088
|
|
6,501
|
|
3,379
|
|
||||
|
Illinois*
|
1,836
|
|
2,136
|
|
2,203
|
|
||||
|
Maryland
|
864
|
|
1,026
|
|
1,067
|
|
||||
|
California
|
1,235
|
|
1,402
|
|
1,394
|
|
||||
|
Pennsylvania*
|
1,971
|
|
2,403
|
|
2,478
|
|
||||
|
Ohio*
|
1,658
|
|
2,025
|
|
2,038
|
|
||||
|
Massachusetts
|
601
|
|
759
|
|
840
|
|
||||
|
Puerto Rico*
|
1,725
|
|
3,761
|
|
1,558
|
|
||||
|
Connecticut*
|
491
|
|
574
|
|
589
|
|
||||
|
Virginia
|
587
|
|
731
|
|
729
|
|
||||
|
Texas
|
2,402
|
|
3,975
|
|
2,990
|
|
||||
|
Georgia
|
1,205
|
|
1,550
|
|
1,519
|
|
||||
|
North Carolina
|
979
|
|
1,189
|
|
1,201
|
|
||||
|
All other jurisdictions
|
11,610
|
|
14,388
|
|
14,814
|
|
||||
|
Total primary delinquent inventory
|
33,398
|
|
46,556
|
|
41,235
|
|
||||
Note: Asterisk denotes jurisdictions in the table above that predominately use a judicial foreclosure process, which generally increases the amount of time it takes for a foreclosure to be completed
.
MGIC Investment Corporation - Q3 2018 |
61
The primary delinquent inventory by policy year at
September 30, 2018
,
December 31, 2017
and
September 30, 2017
appears in the following table.
|
Primary delinquent inventory by policy year
|
September 30, 2018
|
December 31, 2017
|
September 30, 2017
|
|||||||
|
Policy year:
|
||||||||||
|
2004 and prior
|
6,408
|
|
8,739
|
|
8,859
|
|
||||
|
2005
|
3,559
|
|
4,916
|
|
4,678
|
|
||||
|
2006
|
5,617
|
|
7,719
|
|
7,289
|
|
||||
|
2007
|
9,008
|
|
12,807
|
|
12,383
|
|
||||
|
2008
|
2,431
|
|
3,455
|
|
3,179
|
|
||||
|
2009
|
199
|
|
315
|
|
298
|
|
||||
|
2010
|
126
|
|
199
|
|
176
|
|
||||
|
2011
|
176
|
|
266
|
|
194
|
|
||||
|
2012
|
308
|
|
549
|
|
339
|
|
||||
|
2013
|
595
|
|
957
|
|
623
|
|
||||
|
2014
|
1,182
|
|
1,757
|
|
1,179
|
|
||||
|
2015
|
1,338
|
|
1,992
|
|
11
64
|
|
||||
|
2016
|
1,308
|
|
1,930
|
|
745
|
|
||||
|
2017
|
1,007
|
|
955
|
|
129
|
|
||||
|
2018
|
136
|
|
—
|
|
—
|
|
||||
|
Total primary delinquent inventory
|
33,398
|
|
46,556
|
|
41,235
|
|
||||
The delinquent inventory for most policy years includes delinquencies from hurricane impacted areas that have not cured. As a result, delinquencies, including in our most recent policy years, were greater than they otherwise would have been as of
September 30, 2018
and
December 31, 2017
. Within the hurricane impacted areas, there were 5,823, 12,446, and 6,144 loans in our ending primary delinquent inventory as of
September 30, 2018
,
December 31, 2017
, and
September 30, 2017
, respectively.
|
Delinquent inventory mix by book year
|
|
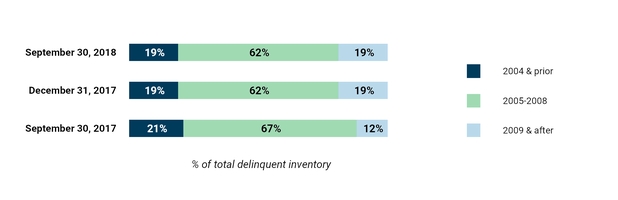
The losses we have incurred on our 2005 through 2008 books have exceeded our premiums from those books. Although uncertainty remains with respect to the ultimate losses we may experience on those books, as we continue to write new insurance, those books have become a smaller percentage of our total mortgage insurance portfolio. Our 2005 through 2008 books represented approximately
15%
and 19% of our total primary RIF at
September 30, 2018
and
December 31, 2017
, respectively. Approximately
39%
of the remaining primary RIF on our 2005 through 2008 books of business benefited from HARP as of both
September 30, 2018
and
December 31, 2017
.
MGIC Investment Corporation - Q3 2018 |
62
On our primary business, the highest claim frequency years have typically been the third and fourth year after loan origination. However, the pattern of claim frequency can be affected by many factors, including persistency and deteriorating economic conditions. Deteriorating economic conditions can result in increasing claims following a period of declining claims. As of
September 30, 2018
,
55%
of our primary RIF was written subsequent to December 31, 2015,
68%
of our primary RIF was written subsequent to December 31, 2014, and
74%
of our primary RIF was written subsequent to December 31, 2013.
Underwriting and other expenses, net
Underwriting and other expenses includes items such as employee compensation costs, fees for professional services, depreciation and maintenance expense, and premium taxes, and are reported net of ceding commissions.
Comparative quarterly and year to date results
Underwriting and other expenses, net for the
three and nine
months ended
September 30, 2018
were
$43.7 million
and
$131.6 million
, respectively, up from
$39.9 million
and
$119.2 million
in the respective prior year periods. The increase was primarily due to higher share-based compensation, due to a higher share price on the grant date, and non-executive compensation.
|
Underwriting expense ratio
|
Three Months Ended September 30,
|
Nine Months Ended September 30,
|
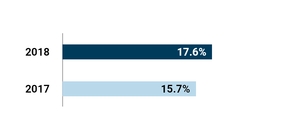
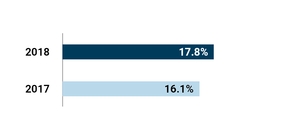
The underwriting expense ratio is the ratio, expressed as a percentage, of the underwriting and operating expenses, net and amortization of DAC of our combined insurance operations (which excludes underwriting and operating expenses of our non-insurance subsidiaries) to NPW. The underwriting expense ratio in the
three and nine
months ended
September 30, 2018
increased compared to the respective prior year periods. The increase in the ratio for the three months ended
September 30, 2018
was primarily due to higher compensation expenses and a decrease in NPW compared to the same period in the prior year. The increase in the ratio for the nine months ended
September 30, 2018
was primarily due to higher compensation expenses, offset in part by higher NPW in the current year period.
Interest expense
Comparative quarterly and year to date results
Interest expense for the three and
nine
months ended
September 30, 2018
was
$13.3 million
and
$39.7 million
, respectively, compared to
$13.3 million
and
$43.8 million
in the respective prior year periods. The decrease in the comparative year to date results was due to the maturity of the 5% Notes and conversion of the 2% Notes in 2017.
Provision for income taxes and effective tax rate
|
Income tax provision and effective tax rate
|
Three Months Ended September 30,
|
Nine Months Ended September 30,
|
||||||||||||||||||||||
|
(in millions, except rate)
|
2018
|
2017
|
% Change
|
2018
|
2017
|
% Change
|
||||||||||||||||||
|
Income before tax
|
$
|
231.9
|
|
$
|
184.5
|
|
26
|
|
$
|
649.4
|
|
$
|
539.0
|
|
20
|
|
||||||||
|
Provision for income taxes
|
$
|
50.0
|
|
$
|
64.4
|
|
(22
|
)
|
$
|
137.1
|
|
$
|
210.6
|
|
(35
|
)
|
||||||||
|
Effective tax rate
|
21.6
|
%
|
34.9
|
%
|
N/M
|
|
21.1
|
%
|
39.1
|
%
|
N/M
|
|
||||||||||||
MGIC Investment Corporation - Q3 2018 |
63
The decrease in the effective tax rate for the third quarter of 2018 and for the
nine
months ended
September 30, 2018
as compared to the same periods in the prior year is primarily due to the decrease in the statutory income tax rate to 21% in 2018 from 35% in 2017. The
nine
months ended
September 30, 2018
also included an additional provision for the expected settlement of our IRS litigation.
See
Note 11 – “Income Taxes”
to our consolidated financial statements for a discussion of our tax position.
MGIC Investment Corporation - Q3 2018 |
64
Total assets, liabilities, and shareholders’ equity
As of
September 30, 2018
, total assets were
$5.7 billion
, approximately the same as year-end 2017, and total liabilities were
$2.2 billion
, down approximately
$0.3 billion
from year-end 2017. Shareholders’ equity increased approximately
$0.3 billion
primarily due to net income in the first
nine
months of 2018, offset in part by repurchases of shares of our common stock and a decrease in the fair value of our investment portfolio.
The following sections mainly focus on our cash and cash equivalents, deferred income taxes, net, loss reserves, and other liabilities as these reflect the major developments in our assets and liabilities since
December 31, 2017
.
Consolidated balance sheets - Assets
as of September 30, 2018
(In thousands)

|
●
|
Cash and cash equivalents
|
$
|
266,997
|
|
|
●
|
Investments
|
4,980,432
|
|
|
|
●
|
Premiums receivable
|
51,640
|
|
|
|
●
|
Deferred income taxes, net
|
111,613
|
|
|
|
●
|
Other assets
|
246,426
|
|
|
Cash and cash equivalents
- Our cash and cash equivalents balance increased to
$267 million
as of September 30, 2018, from $100 million as of December 31, 2017, as net cash generated from operating activities was only partly offset by net cash used in investing and financing activities.
Deferred income taxes, net
-
The decrease in our deferred income taxes, net, to
$112 million
as of September 30, 2018, from $234 million as of December 31, 2017, was primarily due to the utilization of federal net operating loss carryforwards as we generated net income during the first nine months of 2018.
Consolidated balance sheets - Liabilities and equity
as of September 30, 2018
(In thousands)

|
●
|
Loss reserves
|
$
|
721,046
|
|
|
●
|
Unearned premiums
|
407,614
|
|
|
|
●
|
Long-term debt
|
831,297
|
|
|
|
●
|
Other liabilities
|
207,620
|
|
|
|
●
|
Shareholders’ equity
|
3,489,531
|
|
|
Loss reserves
- Our loss reserves include: (1) reserves representing estimates of losses and settlement expenses on reported delinquencies and (2) IBNR. Our gross reserves are reduced by reinsurance recoverable on our estimated losses and settlement expenses to calculate a net reserve balance. The net reserve balance decreased by
27%
to
$688 million
as of
September 30, 2018
, from
$937 million
as of
December 31, 2017
. Reinsurance recoverables on our estimated losses and settlement expenses were
$33 million
and
$48 million
as of
September 30, 2018
and
December 31, 2017
, respectively. The overall decrease in our loss reserves during the first nine months of
2018
was due to a higher level of losses paid relative to losses incurred.
Other liabilities
- The decrease in our other liabilities to
$208 million
as of September 30, 2018, from
$256 million
as of December 31, 2017 was primarily due to our tax settlement payment.
MGIC Investment Corporation - Q3 2018 |
65
Investment portfolio
The average duration and investment yield of our investment portfolio as of
September 30, 2018
,
December 31, 2017
, and
September 30, 2017
are shown in the table below.
|
Portfolio duration and embedded investment yield
|
September 30, 2018
|
December 31, 2017
|
September 30, 2017
|
|||||
|
Duration (in years)
|
4.2
|
4.3
|
4.5
|
|||||
|
Pre-tax yield
(1)
(% of average investment portfolio assets)
|
3.0%
|
2.7%
|
2.7%
|
|||||
|
After-tax yield
(1)
(% of average investment portfolio assets)
|
2.5%
|
2.0%
|
2.0%
|
|||||
|
(1)
|
Embedded investment yield is calculated on a yield-to-worst basis.
|
The increase in our investment yield is due to an increase in the proportion of corporate and CLO fixed income securities, higher yields on new investments, and a decrease in the statutory tax rate.
The security ratings of our fixed income investments as of
September 30, 2018
,
December 31, 2017
, and
September 30, 2017
are shown in the table below.
|
Fixed income security ratings
|
Security Ratings
(1)
|
|||||
|
Period
|
AAA
|
AA
|
A
|
BBB
|
||
|
September 30, 2018
|
20%
|
23%
|
35%
|
22%
|
||
|
December 31, 2017
|
21%
|
26%
|
36%
|
17%
|
||
|
September 30, 2017
|
22%
|
27%
|
36%
|
15%
|
||
|
(1)
|
Ratings are provided by one or more of: Moody's, Standard & Poor's and Fitch Ratings. If three ratings are available, the middle rating is utilized; otherwise the lowest rating is utilized.
|
Off-Balance Sheet Arrangements
Home Re 2018-1 Ltd. is a special purpose variable interest entity that is not consolidated in our consolidated financial statements because we do not have the unilateral power to direct those activities that are significant to its economic performance. See
Note 16 - “Subsequent Events,”
to our consolidated financial statements for additional information.
MGIC Investment Corporation - Q3 2018 |
66
Liquidity and Capital Resources
Consolidated Cash Flow Analysis
We have three primary types of cash flows: (1) operating cash flows, which consist mainly of cash generated by our insurance operations and income earned on our investment portfolio, less amounts paid for claims, interest expense and operating expenses, (2) investing cash flows related to the purchase, sale and maturity of investments and purchases of property and equipment and (3) financing cash flows generally from activities that impact our capital structure, such as changes in debt and shares outstanding. The following table summarizes our consolidated cash flows from operating, investing and financing activities:
|
Summary of consolidated cash flows
|
Nine Months Ended September 30,
|
|||||||||
|
(In thousands)
|
2018
|
2017
|
||||||||
|
Total cash provided by (used in):
|
||||||||||
|
Operating activities
|
$
|
383,547
|
|
$
|
256,356
|
|
||||
|
Investing activities
|
(108,211
|
)
|
(2,529
|
)
|
||||||
|
Financing activities
|
(108,190
|
)
|
(158,536
|
)
|
||||||
|
Increase in cash and cash equivalents
|
$
|
167,146
|
|
$
|
95,291
|
|
||||
Net cash provided by operating activities for the
nine months ended September 30, 2018
increased compared to the same period of 2017 primarily due to a lower level of losses paid, net.
Net cash used in investing activities for the
nine months ended September 30, 2018
reflects purchases of fixed income securities in an amount that exceeded our proceeds from sales and maturities of fixed income securities during the period as cash from operations was available for additional investment, as well as amounts spent on property and equipment, offset in part by unsettled investment activity.
Net cash used in investing activities for the
nine months ended
September 30, 2017
reflects amounts spent on property and equipment, offset in part by proceeds from the sales and maturity of fixed income securities in excess of purchases of fixed income securities and unsettled investment activity.
Net cash used in financing activities for the
nine months ended September 30, 2018
reflects repurchases of our common stock during the second quarter and the payment of withholding taxes related to share-based compensation net share settlement during the period.
Net cash used in financing activities for the
nine months ended
September 30, 2017
includes the repayment at maturity of our 5% Convertible Senior Notes and redemption of a portion of our 2% Convertible Senior Notes, as well as, expenses paid to establish the revolving credit facility and the payment of withholding taxes related to share-based compensation net share settlement.
Capitalization
Debt at our holding company and holding company liquidity
Debt - holding company
As of
September 30, 2018
, our holding company’s debt obligations were
$814.5 million
in aggregate principal consisting of our 5.75% Notes and 9% Debentures. MGIC’s ownership of $132.7 million of our holding company’s 9% Debentures is eliminated in consolidation, but they remain outstanding obligations owed by our holding company to MGIC.
Liquidity analysis - holding company
As of
September 30, 2018
, we had approximately
$261 million
in cash and investments at our holding company. These resources are maintained primarily to service our debt interest expense, pay debt maturities, and to settle intercompany obligations. While these assets are held, we generate investment income that serves to offset a portion of our interest expense. Investment income and the payment of dividends from our
MGIC Investment Corporation - Q3 2018 |
67
insurance subsidiaries are the principal sources of holding company cash inflow. MGIC is the principal source of dividends, and their payment is restricted by insurance regulation. See
Note 15 - “Statutory Information”
to our consolidated financial statement for additional information about MGIC’s dividend restrictions. The payment of dividends from MGIC is also influenced by our view of the appropriate level of PMIERs Available Assets to maintain an excess over Minimum Required Assets. Other sources of holding company liquidity include any unused capacity on our unsecured revolving credit facility ($175 million) and raising capital in the public markets. The ability to raise capital in the public markets is subject to prevailing market conditions, investor demand for the securities to be issued, and our deemed creditworthiness.
During the second quarter of 2018, we used approximately $100.1 million of available holding company cash to repurchase shares of our common stock. During the fourth quarter of 2018, through November 2, 2018, we used approximately
$6.6 million
of available holding company cash to repurchase shares of our common stock. We may use additional holding company cash to repurchase additional shares or to repurchase our outstanding debt obligations. Such repurchases may be material, may be made for cash (funded by debt) and/or exchanges for other securities, and may be made in open market purchases, privately negotiated acquisitions or other transactions. See
“Overview - Capital”
of this MD&A for a discussion of the share repurchase program authorized on April 26, 2018.
In the first nine months of 2018, our holding company cash and investments increased by
$45 million
, to
$261 million
as of
September 30, 2018
. Cash inflows during the first nine months included $160 million of dividends received from MGIC, $16 million for net tax settlements, and other inflows of $11 million. Cash outflows during the first nine months at our holding company included $100 million of share repurchases and $42 million of interest payments on our 5.75% Notes and 9% Debentures. We expect MGIC to continue to pay quarterly dividends of at least the $60 million amount paid in the third quarter of 2018.
The net unrealized
losses
on our holding company investment portfolio were approximately
$3 million
at
September 30, 2018
and the portfolio had a modified duration of approximately
1.2
years.
Subject to certain limitations and restrictions, holders of each of the 9% Debentures may convert their notes into shares of our common stock at their option prior to certain dates under the terms of their issuance, in which case our corresponding obligation will be eliminated.
See Note 7 – “Debt” to our consolidated financial statements in our Annual Report on Form 10-K for the year ended December 31, 2017 for additional information about the conversion terms of our 9% Debentures and the terms of our indebtedness, including our option to defer interest on our 9% Debentures. The description in Note 7 - “Debt” to our consolidated financial statements in our Annual Report on Form 10-K is qualified in its entirety by the terms of the notes and debentures.
Although not anticipated in the near term, we may also contribute funds to our insurance operations to comply with the PMIERs or the State Capital Requirements. See
“Overview - Capital”
above for a discussion of these requirements. See discussion of our non-insurance contract underwriting services in
Note 5 – “Litigation and Contingencies”
to our consolidated financial statements for other possible uses of holding company resources.
Debt at subsidiaries
MGIC is a member of the FHLB, which provides MGIC access to an additional source of liquidity via a secured lending facility. MGIC has $155.0 million of debt outstanding in the form of a fixed rate advance from the FHLB. Interest on the Advance is payable monthly at an annual rate, fixed for the term of the Advance, of 1.91%. The principal of the Advance matures on February 10, 2023. MGIC may prepay the Advance at any time. Such prepayment would be below par if interest rates have risen after the Advance was originated, or above par if interest rates have declined. The Advance is secured by eligible collateral whose fair value is maintained at a minimum of 102% of the outstanding principal balance. MGIC provided eligible collateral from its investment portfolio.
MGIC Investment Corporation - Q3 2018 |
68
Capital Adequacy
PMIERs
We operate under the PMIERs of the GSEs that became effective December 31, 2015. Revised PMIERs were published in September 2018 and will become effective March 31, 2019. Refer to
“Overview - Capital - GSEs”
of this MD&A for further discussion of PMIERs.
As of
September 30, 2018
, MGIC’s Available Assets under PMIERs totaled approximately
$4.8 billion
, an excess of approximately
$1.0 billion
over its Minimum Required Assets; and MGIC is in compliance with the requirements of the PMIERs and eligible to insure loans delivered to or purchased by the GSEs. Maintaining a sufficient level of Available Assets will allow MGIC to remain in compliance with the PMIERs financial requirements, including, we believe, to the extent they are revised. Our QSR Transactions provided an aggregate of approximately
$0.9 billion
of PMIERs capital credit as of
September 30, 2018
. Refer to
Note 4 - “Reinsurance”
to our consolidated financial statements for additional information on our QSR Transactions.
If the revised PMIERs had been effective as of September 30, 2018, we estimate that MGIC’s pro forma excess of Available Assets over Minimum Required Assets would have been approximately $600 million. The decrease in the pro forma excess from the reported excess of
$1.0 billion
is primarily due to the elimination of any credit for future premiums that had previously been allowed for pre-2009 business. The pro forma excess above does not include consideration of any capital credit expected to be received under our excess of loss reinsurance entered into in October 2018, which covers losses beginning August 1, 2018. Refer to
Note 16 - “Subsequent Events”
to our consolidated financial statements for additional information on our excess of loss reinsurance transaction.
We plan to continuously comply with the PMIERs through our operational activities or through the contribution of funds from our holding company, subject to demands on the holding company's resources, as outlined above.
Risk-to-capital
We compute our risk-to-capital ratio on a separate company statutory basis, as well as on a combined insurance operation basis. The risk-to-capital ratio is our net RIF divided by our policyholders’ position. Our net RIF includes both primary and pool risk in force, and excludes risk on policies that are currently in default and for which loss reserves have been established, and those covered by reinsurance. The risk amount includes pools of loans with contractual aggregate loss limits and without these limits. Policyholders’ position consists primarily of statutory policyholders’ surplus (which increases as a result of statutory net income and decreases as a result of statutory net loss and dividends paid), plus the statutory contingency reserve, and a portion of the reserves for unearned premiums. The statutory contingency reserve is reported as a liability on the statutory balance sheet. A mortgage insurance company is required to make annual additions to the contingency reserve of approximately 50% of net earned premiums. These contributions must generally be maintained for a period of ten years. However, with regulatory approval a mortgage insurance company may make early withdrawals from the contingency reserve when incurred losses exceed 35% of net earned premiums in a calendar year.
MGIC’s separate company risk-to-capital calculation is shown in the table below.
|
Risk-to-capital - MGIC separate company
|
(In millions, except ratio)
|
September 30, 2018
|
December 31, 2017
|
|||||||
|
RIF - net
(1)
|
$
|
33,573
|
|
$
|
31,144
|
|
||||
|
Statutory policyholders’ surplus
|
1,700
|
|
1,620
|
|
||||||
|
Statutory contingency reserve
|
2,016
|
|
1,654
|
|
||||||
|
Statutory policyholders’ position
|
$
|
3,716
|
|
$
|
3,274
|
|
||||
|
Risk-to-capital
|
9.0:1
|
|
9.5:1
|
|
||||||
|
(1)
|
RIF – net, as shown in the table above is net of reinsurance and exposure on policies currently delinquent for which loss reserves have been established.
|
MGIC Investment Corporation - Q3 2018 |
69
Our combined insurance companies’ risk-to-capital calculation (which includes a reinsurance affiliate) is shown in the table below. Reinsurance transactions with our affiliate permit MGIC to write insurance with a higher coverage percentage than it could on its own under certain state-specific requirements.
|
Risk-to-capital - Combined insurance companies
|
(In millions, except ratio)
|
September 30, 2018
|
December 31, 2017
|
|||||||
|
RIF - net
(1)
|
$
|
39,449
|
|
$
|
36,818
|
|
||||
|
Statutory policyholders’ surplus
|
1,702
|
|
1,622
|
|
||||||
|
Statutory contingency reserve
|
2,305
|
|
1,897
|
|
||||||
|
Statutory policyholders’ position
|
$
|
4,007
|
|
$
|
3,519
|
|
||||
|
Risk-to-capital
|
9.8:1
|
|
10.5:1
|
|
||||||
|
(1)
|
RIF – net, as shown in the table above, is net of reinsurance and exposure on policies currently delinquent ($1.6 billion at
September 30, 2018
and $2.3 billion at December 31,
2017
) for which loss reserves have been established.
|
The reductions in MGIC's and our combined insurance companies’ risk-to-capital in the first
nine
months of
2018
were primarily due to an increase in statutory policyholders’ position due to an increase in statutory contingency reserves, partially offset by an increase in net RIF in both calculations. Our RIF, net of reinsurance, increased in the first
nine
months of
2018
, due to an increase in our IIF. Our risk-to-capital ratio will decrease if the percentage increase in capital exceeds the percentage increase in insured risk.
For additional information regarding regulatory capital see
Note 15 – “Statutory Information”
to our consolidated financial statements as well as our risk factor titled “State Capital requirements may prevent us from continuing to write new insurance on an uninterrupted basis.”
Financial Strength Ratings
|
MGIC financial strength ratings
|
Rating Agency
|
Rating
|
Outlook
|
|||
|
Moody’s Investor Services
|
Baa2
|
Stable
|
||||
|
Standard and Poor’s Rating Services
|
BBB+
|
Stable
|
||||
|
A.M. Best
|
A-
|
Stable
|
||||
For further information about the importance of MGIC’s ratings, see our risk factor titled “Competition or changes in our relationships with our customers could reduce our revenues, reduce our premium yields and / or increase our losses.”
|
MAC financial strength ratings
|
Rating Agency
|
Rating
|
Outlook
|
|||
|
A.M. Best
|
A-
|
Stable
|
||||
MGIC Investment Corporation - Q3 2018 |
70
Contractual Obligations
At
September 30, 2018
, the approximate future payments under our contractual obligations of the type described in the table below are as follows:
|
Contractual obligations
|
Payments due by period
|
|||||||||||||||||||||
|
(In millions)
|
Total
|
Less than 1 year
|
1-3 years
|
3-5 years
|
More than 5 years
|
|||||||||||||||||
|
Long-term debt obligations
|
$
|
2,013.6
|
|
$
|
51.3
|
|
$
|
101.5
|
|
$
|
679.2
|
|
$
|
1,181.6
|
|
|||||||
|
Operating lease obligations
|
2.3
|
|
0.8
|
|
1.4
|
|
0.1
|
|
—
|
|
||||||||||||
|
Tax obligations
|
6.0
|
|
6.0
|
|
—
|
|
—
|
|
—
|
|
||||||||||||
|
Purchase obligations
|
13.7
|
|
10.1
|
|
3.4
|
|
0.2
|
|
—
|
|
||||||||||||
|
Pension, SERP and other post-retirement plans
|
326.1
|
|
29.8
|
|
65.9
|
|
67.0
|
|
163.4
|
|
||||||||||||
|
Other long-term liabilities
|
721.1
|
|
270.4
|
|
327.4
|
|
123.3
|
|
—
|
|
||||||||||||
|
Total
|
$
|
3,082.8
|
|
$
|
368.4
|
|
$
|
499.6
|
|
$
|
869.8
|
|
$
|
1,345.0
|
|
|||||||
Our long-term debt obligations as of
September 30, 2018
include their related interest and are discussed in
Note 3 - “Debt”
to our consolidated financial statements and under
“Liquidity and Capital Resources”
above. Our operating lease obligations include operating leases on certain office space, data processing equipment and autos, as discussed in Note 16 – “Leases” to our consolidated financial statements in our Annual Report on Form 10-K for the year ended December 31, 2017. Tax obligations primarily relate to our tax settlement with the IRS, as discussed in
Note 11 – “Income Taxes.”
Purchase obligations consist primarily of agreements to purchase items related to our ongoing infrastructure projects and information technology investments in the normal course of business. See Note 11 – “Benefit Plans” to our consolidated financial statements in our Annual Report on Form 10-K for the year ended December 31, 2017 for a discussion of expected benefit payments under our benefit plans.
Our other long-term liabilities represent the loss reserves established to recognize the liability for losses and LAE related to existing delinquencies on insured mortgage loans. The timing of the future claim payments associated with the established loss reserves was determined primarily based on two key assumptions: the length of time it takes for a notice of delinquency to develop into a received claim and the length of time it takes for a received claim to be ultimately paid. The future claim payment periods are estimated based on historical experience, and could emerge differently than this estimate, in part, due to uncertainty regarding the impact of certain factors, such as loss mitigation protocols established by servicers and changes in some state foreclosure laws that may include, for example, a requirement for additional review and/or mediation process.
See
Note 12 – “Loss Reserves”
to our consolidated financial statements. In accordance with GAAP for the mortgage insurance industry, we establish loss reserves only for delinquent loans. Because our reserving method does not take account of the impact of future losses that could occur from loans that are not delinquent, our obligation for ultimate losses that we expect to occur under our policies in force at any period end is not reflected in our consolidated financial statements or in the table above.
MGIC Investment Corporation - Q3 2018 |
71
Forward Looking Statements and Risk Factors
General
: Our business, results of operations, and financial condition could be affected by the risk factors referred to under “Location of Risk Factors” below. These risk factors are an integral part of Management’s Discussion and Analysis.
These factors may also cause actual results to differ materially from the results contemplated by forward looking statements that we may make. Forward looking statements consist of statements which relate to matters other than historical fact. Among others, statements that include words such as we “believe,” “anticipate” or “expect,” or words of similar import, are forward looking statements. We are not undertaking any obligation to update any forward looking statements we may make even though these statements may be affected by events or circumstances occurring after the forward looking statements were made. Therefore no reader of this document should rely on these statements being current as of any time other than the time at which this document was filed with the Securities and Exchange Commission.
While we communicate with security analysts from time to time, it is against our policy to disclose to them any material non-public information or other confidential information. Accordingly, investors should not assume that we agree with any statement or report issued by any analyst irrespective of the content of the statement or report, and such reports are not our responsibility.
Location of Risk Factors: The risk factors are in Item 1 A of our Annual Report on Form 10-K for the year ended December 31, 2017, as supplemented by Part II, Item 1 A of our Quarterly Report on Form 10-Q for the quarters ended March 31, 2018 and June 30, 2018, and by Part II, Item 1 A of this Quarterly Report on Form 10-Q. The risk factors in the 10-K, as supplemented by those 10‑Qs and through updating of various statistical and other information, are reproduced in Exhibit 99 to this Quarterly Report on Form 10-Q.
Our investment portfolio is essentially a fixed income portfolio and is exposed to market risk. Important drivers of the market risk are credit spread risk and interest rate risk.
Credit spread risk
is the risk that we will incur a loss due to adverse changes in credit spreads. Credit spread is the additional yield on fixed income securities above the risk-free rate (typically referenced as the yield on U.S. Treasury securities) that market participants require to compensate them for assuming credit, liquidity and/or prepayment risks.
We manage credit risk via our investment policy guidelines which primarily place our investments in investment grade securities and limit the amount of our credit exposure to any one issue, issuer and type of instrument. Guideline and investment portfolio detail is available in "Business – Section C, Investment Portfolio" in Item 1 of our Annual Report on Form 10-K for the year ended
December 31, 2017
.
Interest rate risk
is the risk that we will incur a loss due to adverse changes in interest rates relative to the characteristics of our interest bearing assets.
One of the measures used to quantify this exposure is modified duration. Modified duration measures the price sensitivity of the assets to the changes in spreads. At
September 30, 2018
, the modified duration of our fixed income investment portfolio was
4.2
years, which means that an instantaneous parallel shift in the yield curve of 100 basis points would result in a change of
4.2%
in the fair value of our fixed income portfolio. For an upward shift in the yield curve, the fair value of our portfolio would decrease and for a downward shift in the yield curve, the fair value would increase. See
Note 7 – “Investments
” to our consolidated financial statements for additional disclosure surrounding our investment portfolio.
Our management, with the participation of our principal executive officer and principal financial officer, has evaluated our disclosure controls and procedures (as defined in Rule 13a-15(e) under the Securities Exchange Act of 1934, as amended), as of the end of the period covered by this Quarterly Report on Form 10-Q. Based on such evaluation, our principal executive officer and principal financial officer concluded that such controls and procedures were effective as of the end of such period. There was no change in our internal control over
MGIC Investment Corporation - Q3 2018 |
72
financial reporting that occurred during the
third
quarter of
2018
that materially affected, or is reasonably likely to materially affect, our internal control over financial reporting.
MGIC Investment Corporation - Q3 2018 |
73
As previously disclosed, the Internal Revenue Service (“IRS”) completed examinations of our federal income tax returns for the years 2000 through 2007 and issued proposed assessments for taxes, interest and penalties related to our treatment of the flow-through income and loss from an investment in a portfolio of residual interests of Real Estate Mortgage Investment Conduits.
In 2014, we received Notices of Deficiency (commonly referred to as “90 day letters”) from the IRS. We filed a petition with the U.S. Tax Court contesting most of the IRS’ proposed adjustments reflected in the Notices of Deficiency. In July 2018, we finalized an agreement with the IRS to settle all issues in the examinations and related U.S. Tax Court case; the settlement was approved by the U.S. Tax Court on July 26, 2018. The expected impact of the agreed upon settlement was previously reflected in our consolidated financial statements
.
With the exception of the changes described and set forth below, there have been no material changes in our risk factors from the risk factors disclosed in the Company’s Annual Report on Form 10-K for the year ended December 31, 2017, as supplemented by Part II, Item I A of our Quarterly Reports on Form 10-Q for the Quarters ended March 31, 2018 and June 30, 2018. The risk factors in the 10-K, as supplemented by those 10-Qs and this 10-Q, and through updating of various statistical and other information, are reproduced in their entirety in Exhibit 99 to this Quarterly Report on Form 10-Q.
Competition or changes in our relationships with our customers could reduce our revenues, reduce our premium yields and / or increase our losses.
Our private mortgage insurance competitors include:
|
•
|
Arch Mortgage Insurance Company,
|
|
•
|
Essent Guaranty, Inc.,
|
|
•
|
Genworth Mortgage Insurance Corporation,
|
|
•
|
National Mortgage Insurance Corporation, and
|
|
•
|
Radian Guaranty Inc.
|
The private mortgage insurance industry is highly competitive and is expected to remain so. We believe that we currently compete with other private mortgage insurers based on pricing, underwriting requirements, financial strength (including based on credit or financial strength ratings), customer relationships, name recognition, reputation, the strength of our management team and field organization, the ancillary products and services provided to lenders and the effective use of technology and innovation in the delivery and servicing of our mortgage insurance products.
Much of the competition in the industry in the last few years has centered on pricing practices which have included: (i) reductions in standard filed rates for borrower-paid mortgage insurance policies ("BPMI"); (ii) use by certain competitors of a spectrum of filed rates to allow for formulaic, risk-based pricing that may be adjusted more frequently within certain parameters (referred to as "loan level pricing systems"); and (iii) use of customized rates (discounted from standard rates) that are made available to many, but not all, lenders. Because the industry is currently experiencing relatively low levels of mortgage insurance losses and acceptable returns on new business, we expect price competition to remain strong.
We monitor various competitive and economic factors while seeking to balance both profitability and market share considerations in developing our pricing strategies. In 2018, we continued to evolve our pricing from a
MGIC Investment Corporation - Q3 2018 |
74
standard rate card approach, where prices vary based on relatively few attributes, to a more granular approach, where more attributes are considered. We reduced certain of our rates in the second through fourth quarters of 2018. Those changes will reduce our premium yield (net premiums earned divided by the average insurance in force) over time as older insurance policies with higher premium rates run off and new insurance policies with lower premium rates are written. We continue to develop our loan-level pricing system and expect to release it in 2019. As noted above, these systems allows for formulaic, risk-based pricing that may be adjusted more frequently.
There can be no assurance that our premium rates adequately reflect the risk associated with the underlying mortgage insurance policies. For additional information, see our risk factors titled “
The premiums we charge may not be adequate to compensate us for our liabilities for losses and as a result any inadequacy could materially affect our financial condition and results of operations" and "If our risk management programs are not effective in identifying, or adequate in controlling or mitigating, the risks we face, or if the models used in our businesses are inaccurate, it could have a material adverse impact on our business, results of operations and financial condition."
Our relationships with our customers, which may affect the amount of our new business written, could be adversely affected by a variety of factors, including if our premium rates are higher than those of our competitors, our underwriting requirements result in our declining to insure some of the loans originated by our customers, or our insurance policy rescissions and claim curtailments affect the customer. Regarding the concentration of our new business, our largest customer accounted for approximately
4%
of our new insurance written in each of 2017 and the first nine months of 2018.
Certain of our competitors have access to capital at a lower cost of capital than we do (including, as a result of off-shore reinsurance vehicles, which are also tax-advantaged). As a result, they may be better positioned to compete outside of traditional mortgage insurance, including by participating in the pilot programs referred to above and other alternative forms of credit enhancement pursued by the GSEs. In addition, because of their tax advantages, certain competitors may be able to achieve higher after-tax rates of return on their new insurance written ("NIW") compared to us, which could allow them to leverage reduced pricing to gain market share.
Substantially all of our insurance written since 2008 has been for loans purchased by the GSEs. The current private mortgage insurer eligibility requirements ("PMIERs") of the GSEs require a mortgage insurer to maintain a minimum amount of assets to support its insured risk, as discussed in our risk factor titled
“We may not continue to meet the GSEs’ private mortgage insurer eligibility requirements and our returns may decrease as we are required to maintain more capital in order to maintain our eligibility.”
The PMIERs do not require an insurer to maintain minimum financial strength ratings; however, our financial strength ratings can affect us in the following ways:
|
•
|
A downgrade in our financial strength ratings could result in increased scrutiny of our financial condition by the GSEs and/or our customers, potentially resulting in a decrease in the amount of our new insurance written.
|
|
•
|
Our ability to participate in the non-GSE mortgage market (which has been limited since 2008, but may grow in the future), could depend on our ability to maintain and improve our investment grade ratings for our mortgage insurance subsidiaries. We could be competitively disadvantaged with some market participants because the financial strength ratings of our insurance subsidiaries are lower than those of some competitors. MGIC's financial strength rating from Moody’s is
Baa2
(with a
stable
outlook) , from Standard & Poor’s is
BBB+
(with a
stable
outlook) and from A.M. Best is A- (with a stable outlook).
|
|
•
|
Financial strength ratings may also play a greater role if the GSEs no longer operate in their current capacities, for example, due to legislative or regulatory action. In addition, although the PMIERs do not require minimum financial strength ratings, the GSEs consider financial strength ratings to be important when utilizing forms of credit enhancement other than traditional mortgage insurance, including the pilot programs referred to above, and as discussed in our risk factor titled
"The amount of insurance we write could be adversely affected if lenders and investors select alternatives to private mortgage insurance."
|
MGIC Investment Corporation - Q3 2018 |
75
If we are unable to compete effectively in the current or any future markets as a result of the financial strength ratings assigned to our insurance subsidiaries, our future new insurance written could be negatively affected.
We may not continue to meet the GSEs’ private mortgage insurer eligibility requirements and our returns may decrease as we are required to maintain more capital in order to maintain our eligibility.
We must comply with the PMIERs to be eligible to insure loans delivered to or purchased by the GSEs. The PMIERs include financial requirements, as well as business, quality control and certain transaction approval requirements. The financial requirements of the PMIERs require a mortgage insurer’s “Available Assets” (generally only the most liquid assets of an insurer) to equal or exceed its “Minimum Required Assets” (which are based on an insurer’s book of insurance in force and are calculated from tables of factors with several risk dimensions and are subject to a floor amount). Based on our interpretation of the PMIERs, as of September 30, 2018, MGIC’s Available Assets totaled
$4.8 billion
, or
$1.0 billion
in excess of its Minimum Required Assets. MGIC is in compliance with the PMIERs and eligible to insure loans purchased by the GSEs.
Revised PMIERs were published in September 2018 and will become effective March 31, 2019. If the revised PMIERs had been effective as of September 30, 2018, we estimate that MGIC’s pro forma excess of Available Assets over Minimum Required Assets would have been approximately $600 million. The decrease in the pro forma excess from the reported excess of
$1.0 billion
is primarily due to the elimination of any credit for future premiums that had previously been allowed for certain insurance policies. The pro forma excess above does not include consideration of any capital credit expected to be received under our excess of loss reinsurance entered into in October 2018 and discussed in our Risk Factor titled "
The mix of business we write affects our Minimum Required Assets under the PMIERs, our premium yields and the likelihood of losses occurring
." Although MGIC’s excess Minimum Required Assets will decrease when the revised PMIERs become effective, we do not expect the revised PMIERs to impact MGIC’s current plans to pay quarterly dividends to our holding company, subject to any necessary approvals by its Board of Directors and the Wisconsin Office of the Commissioner of Insurance.
If MGIC ceases to be eligible to insure loans purchased by one or both of the GSEs, it would significantly reduce the volume of our new business writings. Factors that may negatively impact MGIC’s ability to continue to comply with the financial requirements of the PMIERs include the following:
|
•
|
The GSEs may amend the PMIERs at any time and may make the PMIERs more onerous in the future. In June 2018, the FHFA issued a proposed rule on regulatory capital requirements for the GSEs ("Enterprise Capital Requirements"), which included a framework for determining the capital relief allowed to the GSEs for loans with private mortgage insurance. The GSEs have indicated that there may be potential future implications for PMIERs based upon feedback the FHFA receives on its proposed rule on Enterprise Capital Requirements. In addition, the PMIERs provide that the factors that determine Minimum Required Assets will be updated every two years and may be updated more frequently to reflect changes in macroeconomic conditions or loan performance. The GSEs have indicated that they will generally provide notice 180 days prior to the effective date of such updates.
|
|
•
|
Our future operating results may be negatively impacted by the matters discussed in the rest of these risk factors. Such matters could decrease our revenues, increase our losses or require the use of assets, thereby creating a shortfall in Available Assets.
|
|
•
|
Should capital be needed by MGIC in the future, capital contributions from our holding company may not be available due to competing demands on holding company resources, including for repayment of debt.
|
While on an overall basis, the amount of Available Assets MGIC must hold in order to continue to insure GSE loans is greater under the PMIERs than what state regulation currently requires, our reinsurance transactions mitigate the negative effect of the PMIERs on our returns. However, reinsurance may not always be available to us or available on similar terms, it subjects us to counterparty credit risk and the GSEs may change the credit they allow under the PMIERs for risk ceded under our reinsurance transactions.
MGIC Investment Corporation - Q3 2018 |
76
The mix of business we write affects our Minimum Required Assets under the PMIERs, our premium yields and the likelihood of losses occurring.
The Minimum Required Assets under the PMIERs are, in part, a function of the direct risk-in-force and the risk profile of the loans we insure, considering loan-to-value ratio, credit score, vintage, Home Affordable Refinance Program ("HARP") status and delinquency status; and whether the loans were insured under lender-paid mortgage insurance policies or other policies that are not subject to automatic termination consistent with the Homeowners Protection Act requirements for borrower paid mortgage insurance. Therefore, if our direct risk-in-force increases through increases in new insurance written, or if our mix of business changes to include loans with higher loan-to-value ratios or lower FICO scores, for example, or if we insure a higher percentage of loans under lender-paid mortgage insurance policies, all other things equal, we will be required to hold more Available Assets in order to maintain GSE eligibility.
The minimum capital required by the risk-based capital framework contained in the exposure draft released by the NAIC in May 2016 would be, in part, a function of certain loan and economic factors, including property location, loan-to-value ratio and credit score; general underwriting quality in the market at the time of loan origination; the age of the loan; and the premium rate we charge. Depending on the provisions of the capital requirements when they are released in final form and become effective, our mix of business may affect the minimum capital we are required to hold under the new framework.
The percentage of our new insurance written from all single-premium policies (LPMI and BPMI, combined) has ranged from approximately 10% in 2013 to 19% in 2017 and was 17% in the first nine months of 2018. Depending on the actual life of a single premium policy and its premium rate relative to that of a monthly premium policy, a single premium policy may generate more or less premium than a monthly premium policy over its life.
We have in place quota share reinsurance ("QSR") transactions with a group of unaffiliated reinsurers that cover most of our insurance written from 2013 through 2018, and a portion of our insurance written prior to 2013. Although the transactions reduce our premiums, they have a lesser impact on our overall results, as losses ceded under the transactions reduce our losses incurred and the ceding commissions we receive reduce our underwriting expenses. The blended pre-tax cost of reinsurance under our different transactions is less than 6% (but will decrease if losses are materially higher than we expect). This blended pre-tax cost is derived by dividing the reduction in our pre-tax income on loans covered by reinsurance by our direct (that is, without reinsurance) premiums from such loans. Although the pre-tax cost of the reinsurance under each transaction is generally constant, the effect of the reinsurance on the various components of pre-tax income will vary from period to period, depending on the level of ceded losses. Although the GSEs have approved the terms of our QSR transactions, they will be reviewed under the PMIERs at least annually. We may not receive full credit under the PMIERs in future periods for the risk ceded under our QSR transactions.
On October 30, 2018, MGIC entered into a reinsurance agreement that provides for up to $318.6 million of aggregate excess-of-loss reinsurance coverage for a portion of the risk associated with certain mortgage insurance policies having an insurance coverage in force date on or after July 1, 2016 and before January 1, 2018. For the reinsurance coverage period, MGIC will retain the first layer of $168.7 million of aggregate losses, and the reinsurer will provide second layer coverage up to the outstanding reinsurance coverage amount. The reinsurance coverage premium paid to the reinsurer will decrease our premiums.
In addition to the effect of reinsurance on our premiums, we expect a decline in our premium yield resulting from the premium rates themselves. An increasing percentage of our insurance in force is from book years with lower premium rates because premium rates have trended lower in recent periods (and will continue to do so after the 2018 changes to our premium rates).
The circumstances in which we are entitled to rescind coverage have narrowed for insurance we have written in recent years. During the second quarter of 2012, we began writing a portion of our new insurance under an endorsement to our then existing master policy (the “Gold Cert Endorsement”), which limited our ability to rescind coverage compared to that master policy. To comply with requirements of the GSEs, we introduced our current master policy in 2014. Our rescission rights under our current master policy are comparable to
MGIC Investment Corporation - Q3 2018 |
77
those under our previous master policy, as modified by the Gold Cert Endorsement, but may be further narrowed if the GSEs permit modifications to them. Our current master policy is filed as Exhibit 99.19 to our quarterly report on Form 10-Q for the quarter ended September 30, 2014 (filed with the SEC on November 7, 2014). All of our primary new insurance on loans with mortgage insurance application dates on or after October 1, 2014, was written under our current master policy. As of September 30, 2018, approximately
80%
of our flow, primary insurance in force was written under our Gold Cert Endorsement or our current master policy. The FHFA and the GSEs have issued revised GSE rescission relief principles to, among other things, further limit the circumstances under which mortgage insurers may rescind coverage. It has been proposed that these principles be incorporated into new master policies which the GSEs have indicated should be effective for new business written in 2019, subject to state regulatory approvals. These proposed principles are likely to further reduce our ability to rescind insurance coverage in the future, potentially resulting in higher losses than would be the case under our existing master insurance policies.
From time to time, in response to market conditions, we change the types of loans that we insure and the requirements under which we insure them. We also change our underwriting guidelines, in part through aligning some of them with Fannie Mae and Freddie Mac for loans that receive and are processed in accordance with certain approval recommendations from a GSE automated underwriting system. We also make exceptions to our underwriting requirements on a loan-by-loan basis and for certain customer programs. As a result of changes to our underwriting guidelines and requirements (including those related to debt to income ("DTI") ratios, credit scores, and the manner in which income levels and property values are determined) and other factors, our business written beginning in the second half of 2013 is expected to have a somewhat higher claim incidence than business written in 2009 through the first half of 2013, but materially below that on business written in 2005-2008. However, we believe this business presents an acceptable level of risk. Our underwriting requirements are available on our website at
http://www.mgic.com/underwriting/index.html
.
Even when home prices are stable or rising, mortgages with certain characteristics have higher probabilities of claims. These characteristics include higher LTV ratios, lower FICO scores, limited underwriting, including limited borrower documentation, or higher DTI ratios, as well as loans having combinations of higher risk factors. As of September 30, 2018, mortgages with these characteristics in our primary risk in force included mortgages with LTV ratios greater than 95% (
14.5%
), loans with borrowers having FICO scores below 620 (
2.5%
), mortgages with borrowers having FICO scores of 620-679 (
10.5%
), mortgages with limited underwriting, including limited borrower documentation (
2.3%
), and mortgages with borrowers having DTI ratios greater than 45% (or where no ratio is available) (
13.9%
), each attribute as determined at the time of loan origination. An individual loan may have more than one of these attributes. A material number of these loans were originated in 2005 - 2007 or the first half of 2008. Beginning in 2017, the percentage of NIW that we have written on mortgages with LTV ratios greater than 95% and mortgages with DTI ratios greater than 45% have increased. For information about our classification of loans by FICO score and documentation, see footnotes (5) and (6) to the Characteristics of Primary Risk in Force table under “Business - Our Products and Services” in Item 1 of our Annual Report on Form 10-K filed with the SEC on February 23, 2018.
We are unable to adjust our prices as quickly as those competitors using loan level pricing systems, which are discussed in our Risk Factor titled
"Competition or changes in our relationships with our customers could reduce our revenues, reduce our premium yields and / or increase our losses."
The use of loan level pricing systems by an increasing number of our competitors increases the risk that we are adversely selected by lenders to insure certain loans, which may result in an increase in the credit risk we bear and/or a decrease in the volume of loans we insure, before we implement our loan level pricing system.
As of September 30, 2018, approximately
1%
of our primary risk in force consisted of adjustable rate mortgages which allow for adjustment of the initial interest rate during the five years after the mortgage closing (“ARMs”). We classify as fixed rate loans adjustable rate mortgages with an initial interest rate that is fixed during the five years after the mortgage closing and loans with temporary interest rate adjustments during the initial five years, commonly referred to as "buydowns," that convert to a fixed rate for the duration of the loan term. If interest rates should rise between the time of origination of such loans and when their interest rates may be reset, claim rates on such loans may be substantially higher than for loans without variable interest rate features. In addition, prior to 2011, we insured “interest-only” loans, which may also be
MGIC Investment Corporation - Q3 2018 |
78
ARMs, and loans with negative amortization features, such as pay option ARMs. We believe claim rates on these loans will be substantially higher than on loans without scheduled payment increases that are made to borrowers of comparable credit quality.
If state or federal regulations or statutes are changed in ways that ease mortgage lending standards and/or requirements, or if lenders seek ways to replace business in times of lower mortgage originations, it is possible that more mortgage loans could be originated with higher risk characteristics than are currently being originated, such as loans with lower FICO scores and higher DTIs. Lenders could pressure mortgage insurers to insure such loans, which are expected to experience higher claim rates. Although we attempt to incorporate these higher expected claim rates into our underwriting and pricing models, there can be no assurance that the premiums earned and the associated investment income will be adequate to compensate for actual losses even under our current underwriting requirements. We do, however, believe that our insurance written beginning in the second half of 2008 will generate underwriting profits.
Changes in interest rates, house prices or mortgage insurance cancellation requirements may change the length of time that our policies remain in force.
The premium from a single premium policy is collected upfront and generally earned over the estimated life of the policy. In contrast, premiums from a monthly premium policy are received and earned each month over the life of the policy. In each year, most of our premiums earned are from insurance that has been written in prior years. As a result, the length of time insurance remains in force, which is generally measured by persistency (the percentage of our insurance remaining in force from one year prior), is a significant determinant of our revenues. Future premiums on our monthly premium policies in force represent a material portion of our claims paying resources and a low persistency rate will reduce those future premiums. In contrast, a higher than expected persistency rate will decrease the profitability from single premium policies because they will remain in force longer than was estimated when the policies were written.
Our persistency rate was
81.0%
at September 30, 2018, 80.1% at December 31, 2017 and 76.9% at December 31, 2016. Since 2000, our year-end persistency ranged from a high of 84.7% at December 31, 2009 to a low of 47.1% at December 31, 2003.
Our persistency rate is primarily affected by the level of current mortgage interest rates compared to the mortgage coupon rates on our insurance in force, which affects the vulnerability of the insurance in force to refinancing. Our persistency rate is also affected by the mortgage insurance cancellation policies of mortgage investors along with the current value of the homes underlying the mortgages in the insurance in force. In 2018, the GSEs announced changes to various mortgage insurance termination requirements that are intended to further simplify the process of evaluating borrower-initiated requests for mortgage insurance termination and may reduce our persistency rate in the future.
MGIC Investment Corporation - Q3 2018 |
79
The accompanying Index to Exhibits is incorporated by reference in answer to this portion of this Item, and except as otherwise indicated in the next sentence, the Exhibits listed in such Index are filed as part of this Form 10-Q. Exhibit 32 is not filed as part of this Form 10-Q but accompanies this Form 10-Q.
(Part II, Item 6)
Index to exhibits
|
Exhibit Number
|
Description of Exhibit
|
||
|
Consulting Agreement between Jeffrey H. Lane and Mortgage Guaranty Insurance Corporation dated as of August 29, 2018 *, **, †
|
|||
|
Ratio of Earnings to Fixed Charges †
|
|||
|
Certification of CEO under Section 302 of Sarbanes-Oxley Act of 2002 †
|
|||
|
Certification of CFO under Section 302 of Sarbanes-Oxley Act of 2002 †
|
|||
|
Certification of CEO and CFO under Section 906 of Sarbanes-Oxley Act of 2002 (as indicated in Item 6 of Part II, this Exhibit is not being “filed”) ††
|
|||
|
Risk Factors included in Item 1A of our Annual Report on Form 10-K for the year ended December 31, 2017, as supplemented by Part II, Item 1A of our Quarterly Report on Form 10-Q for the quarters ended March 31, 2018, June 30, 2018, and September 30, 2018, and through updating of various statistical and other information †
|
|||
|
XBRL Instance Document
|
|||
|
101.SCH
|
XBRL Taxonomy Extension Schema Document
|
||
|
XBRL Taxonomy Extension Calculation Linkbase Document
|
|||
|
XBRL Taxonomy Extension Definition Linkbase Document
|
|||
|
XBRL Taxonomy Extension Label Linkbase Document
|
|||
|
XBRL Taxonomy Extension Presentation Linkbase Document
|
|||
* Denotes a management contract or compensatory plan.
|
**
|
Confidential treatment has been requested with respect to certain portions of this exhibit. This exhibit omits the information subject to this confidentiality request. Omitted portions have been filed separately with the Securities and Exchange Commission.
|
† Filed herewith.
†† Furnished herewith.
MGIC Investment Corporation - Q3 2018 |
80
SIGNATURES
Pursuant to the requirements of the Securities Exchange Act of 1934, the registrant has duly caused this report to be signed on its behalf by the undersigned thereunto duly authorized, on
November 7, 2018
.
|
MGIC INVESTMENT CORPORATION
|
|
|
|
|
|
/s/ Timothy J. Mattke
|
|
|
Timothy J. Mattke
|
|
|
Executive Vice President and
|
|
|
Chief Financial Officer
|
|
|
|
|
|
/s/ Julie K. Sperber
|
|
|
Julie K. Sperber
|
|
|
Vice President, Controller and Chief Accounting Officer
|
|
MGIC Investment Corporation - Q3 2018 |
81
TABLE OF CONTENTS
Part I. Financial InformationItem 1. Financial StatementsNote 1. Nature Of Business and Basis Of PresentationNote 2. New Accounting PronouncementsNote 3. DebtNote 4. ReinsuranceNote 5. Litigation and ContingenciesNote 6. Earnings Per ShareNote 7. InvestmentsNote 8. Fair Value MeasurementsNote 9. Other Comprehensive IncomeNote 10. Benefit PlansNote 11. Income TaxesNote 12. Loss ReservesNote 13. Shareholders EquityNote 14. Share-based CompensationNote 15. Statutory InformationNote 16. Subsequent EventsItem 2. Management S Discussion and Analysis Of Financial Condition and Results Of OperationsItem 3. Quantitative and Qualitative Disclosures About Market RiskItem 4. Controls and ProceduresPart II. Other InformationItem 1. Legal ProceedingsItem 1 A. Risk FactorsItem 6. Exhibits