VAIL RESORTS INC
10-Ks and 10-Qs
|
|
|
|
|
|
|
|
|
|
|
|
|
|
|
|
|
|
|
|
|
|
|
|
|
|
|
|
|
|
|
|
|
|
|
|
|
|
|
|
|
|
|
|
|
|
|
|
|
|
|
|
|
UNITED STATES
SECURITIES AND EXCHANGE COMMISSION
WASHINGTON, D.C. 20549
FORM 10-K
ý
ANNUAL REPORT PURSUANT TO SECTION 13 OR 15(d) OF THE SECURITIES EXCHANGE ACT OF 1934
For the fiscal year ended July 31, 2016
or
¨
TRANSITION REPORT PURSUANT TO SECTION 13 OR 15(d) OF THE SECURITIES EXCHANGE ACT OF 1934
For the transition period from to
Commission File Number: 001-09614
Vail Resorts, Inc.
(Exact name of registrant as specified in its charter)
|
Delaware
|
|
51-0291762
|
|
(State or other jurisdiction of incorporation or organization)
|
|
(I.R.S. Employer Identification No.)
|
|
390 Interlocken Crescent
Broomfield, Colorado
|
|
80021
|
|
(Address of principal executive offices)
|
|
(Zip Code)
|
|
(303) 404-1800
|
|
(Registrant’s telephone number, including area code)
|
Securities registered pursuant to Section 12(b) of the Act:
|
Title of each class
|
|
Name of each exchange on which registered
|
|
Common Stock, $0.01 par value
|
|
New York Stock Exchange
|
Securities registered pursuant to Section 12(g) of the Act:
|
None
|
|
(Title of class)
|
Indicate by check mark if the registrant is a well-known seasoned issuer, as defined in Rule 405 of the Securities Act.
x
Yes
¨
No
Indicate by check mark if the registrant is not required to file reports pursuant to Section 13 or Section 15(d) of the Act.
¨
Yes
x
No
Indicate by check mark whether the registrant (1) has filed all reports required to be filed by Section 13 or 15(d) of the Securities Exchange Act of 1934 during the preceding 12 months (or for such shorter period that the registrant was required to file such reports) and (2) has been subject to such filing requirements for the past 90 days.
x
Yes
¨
No
Indicate by check mark whether the registrant has submitted electronically and posted on its corporate Website, if any, every Interactive Data File required to be submitted and posted pursuant to Rule 405 of Regulation S-T during the preceding 12 months (or for such shorter period that the registrant was required to submit and post such files).
x
Yes
¨
No
Indicate by check mark if disclosure of delinquent filers pursuant to Item 405 of Regulation S-K is not contained herein, and will not be contained, to the best of registrant’s knowledge, in definitive proxy or information statements incorporated by reference in Part III of this Form 10-K or any amendment to this Form 10-K.
x
Indicate by check mark whether the registrant is a large accelerated filer, an accelerated filer, a non-accelerated filer, or a smaller reporting company. See the definitions of “large accelerated filer,” “accelerated filer” and “smaller reporting company” in Rule 12b-2 of the Exchange Act.
|
Large accelerated filer
|
x
|
|
Accelerated filer
|
¨
|
|
|
Non-accelerated filer
|
¨
|
(Do not check if a smaller reporting company)
|
|
Smaller reporting company
|
¨
|
Indicate by check mark whether the registrant is a shell company (as defined in Rule 12b-2 of the Act).
¨
Yes
x
No
The aggregate market value of the voting and non-voting common equity held by non-affiliates of the registrant, based on the closing price of $125.00 per share as reported on the New York Stock Exchange Composite Tape on January 29, 2016 (the last business day of the registrant’s most recently completed second fiscal quarter) was $4,480,036,250.
As of September 21, 2016, 36,179,664 shares of Common Stock were outstanding.
DOCUMENTS INCORPORATED BY REFERENCE
Portions of the registrant’s definitive Proxy Statement for its 2016 Annual Meeting of Stockholders to be filed with the Securities and Exchange Commission within 120 days of July 31, 2016 are incorporated by reference herein into Part III, Items 10 through 14, of this Annual Report.
Table of Contents
|
Item 1.
|
||
|
Item 1A.
|
||
|
Item 1B.
|
||
|
Item 2.
|
||
|
Item 3.
|
||
|
Item 4.
|
||
|
Item 5.
|
||
|
Item 6.
|
||
|
Item 7.
|
||
|
Item 7A.
|
||
|
Item 8.
|
||
|
Item 9.
|
||
|
Item 9A.
|
||
|
Item 9B.
|
||
|
Item 10.
|
||
|
Item 11.
|
||
|
Item 12.
|
||
|
Item 13.
|
||
|
Item 14.
|
||
|
Item 15.
|
||
1
FORWARD-LOOKING STATEMENTS
Except for any historical information contained herein, the matters discussed in this Annual Report on Form 10-K (this “Form 10-K”) contain certain forward-looking statements within the meaning of the Private Securities Litigation Reform Act of 1995. These statements relate to analyses and other information, which are based on forecasts of future results and estimates of amounts not yet determinable. These statements also relate to our future prospects, developments and business strategies.
These forward-looking statements are identified by their use of terms and phrases such as “anticipate,” “believe,” “could,” “estimate,” “expect,” “intend,” “may,” “plan,” “predict,” “project,” “will” and similar terms and phrases, including references to assumptions. Although we believe that our plans, intentions and expectations reflected in or suggested by such forward-looking statements are reasonable, we cannot assure you that such plans, intentions or expectations will be achieved. Important factors that could cause actual results to differ materially from our forward-looking statements include, but are not limited to:
|
•
|
prolonged weakness in general economic conditions, including adverse effects on the overall travel and leisure related industries;
|
|
•
|
unfavorable weather conditions or natural disasters;
|
|
•
|
willingness of our guests to travel due to terrorism, the uncertainty of military conflicts or outbreaks of contagious diseases, the cost and availability of travel options and changing consumer preferences;
|
|
•
|
the seasonality of our business combined with adverse events that occur during our peak operating periods;
|
|
•
|
competition in our mountain and lodging businesses;
|
|
•
|
high fixed cost structure of our business;
|
|
•
|
our ability to fund resort capital expenditures;
|
|
•
|
our reliance on government permits or approvals for our use of public land or to make operational and capital improvements;
|
|
•
|
risks related to a disruption in our water supply that would impact our snowmaking capabilities;
|
|
•
|
risks related to federal, state, local and foreign government laws, rules and regulations;
|
|
•
|
risks related to our reliance on information technology, including our failure to maintain the integrity of our customer or employee data;
|
|
•
|
adverse consequences of current or future legal claims;
|
|
•
|
a deterioration in the quality or reputation of our brands, including our ability to protect our intellectual property and the risk of accidents at our mountain resorts;
|
|
•
|
our ability to hire and retain a sufficient seasonal workforce;
|
|
•
|
risks related to our workforce, including increased labor costs;
|
|
•
|
loss of key personnel;
|
|
•
|
our ability to successfully integrate acquired businesses, or that acquired businesses may fail to perform in accordance with expectations,
including Whistler Blackcomb or future acquisitions;
|
|
•
|
whether the Whistler Blackcomb transaction will be consummated, including the ability and timing to obtain required regulatory approvals and approval by Whistler Blackcomb shareholders and to satisfy other closing conditions, and our ability to obtain the required financing for the cash portion of the consideration for the Whistler Blackcomb transaction;
|
|
•
|
our ability to realize anticipated financial benefits from Park City;
|
|
•
|
risks associated with international operations;
|
|
•
|
fluctuations in foreign currency exchange rates;
|
|
•
|
changes in accounting estimates and judgments, accounting principles, policies or guidelines;
|
|
•
|
a materially adverse change in our financial condition; and
|
|
•
|
other risks and uncertainties included under “Risk Factors” in this document.
|
All forward-looking statements attributable to us or any persons acting on our behalf are expressly qualified in their entirety by these cautionary statements.
If one or more of these risks or uncertainties materialize, or if underlying assumptions prove incorrect, our actual results may vary materially from those expected, estimated or projected. Given these uncertainties, users of the information included in this Form 10-K, including investors and prospective investors, are cautioned not to place undue reliance on such forward-looking statements. Actual results may differ materially from those suggested by the forward-looking statements that we make for a number of reasons including those described above and in Part I, Item 1A, “Risk Factors” of this Form 10-K. All forward-looking statements are made only as of the date hereof. Except as may be required by law, we do not intend to update these forward-looking statements, even if new information, future events or other circumstances have made them incorrect or misleading.
2
|
ITEM 1.
|
BUSINESS
|
General
Vail Resorts, Inc., together with its subsidiaries, is referred to throughout this document as “we,” “us,” “our” or the “Company.”
Vail Resorts, Inc., a Delaware corporation, was organized as a holding company in 1997 and operates through various subsidiaries. Our operations are grouped into three business segments: Mountain, Lodging and Real Estate, which represented approximately 82%, 17% and 1%, respectively, of our net revenue for our fiscal year ended July 31, 2016 (“Fiscal 2016”).
As of July 31, 2016, our Mountain segment operates nine world-class mountain resort properties and three urban ski areas, as well as ancillary services, primarily including:
|
•
|
ski school,
|
|
•
|
dining, and
|
|
•
|
retail/rental operations.
|
Our Lodging segment includes the following:
|
•
|
owned and/or managed luxury hotels under our RockResorts brand, as well as other strategic lodging properties,
|
|
•
|
owned and/or managed condominiums located in proximity to our mountain resorts,
|
|
•
|
certain National Park Service (“NPS”) concessionaire properties, including Grand Teton Lodge Company (“GTLC”), which operates destination resorts at Grand Teton National Park,
|
|
•
|
Colorado Mountain Express (“CME”), a Colorado resort ground transportation company, and
|
|
•
|
Mountain resort golf courses.
|
Collectively, the Mountain and Lodging segments are considered the Resort segment. Our Real Estate segment owns, develops and sells real estate in and around our resort communities.
For financial information and other information about the Company’s segments, see Item 7. “Management’s Discussion and Analysis of Financial Condition and Results of Operations” and Item 8. “Financial Statements and Supplementary Data” below.
Whistler Blackcomb Acquisition
On August 5, 2016, we entered into an arrangement agreement to acquire all of the outstanding common shares of Whistler Blackcomb Holdings, Inc. (“Whistler Blackcomb”). Whistler Blackcomb owns a 75% interest in each of Whistler Mountain Resort Limited Partnership and Blackcomb Skiing Enterprises Limited Partnership, which together operate Whistler Blackcomb resort, a year round mountain resort with a comprehensive offering of recreational activities, including both snow sports and summer activities. Whistler Blackcomb shareholders will receive total consideration equal to (i) C$17.50 per share in cash, and (ii) 0.0998 shares (the “Consideration Shares”), subject to a currency exchange rate adjustment to be determined based on the applicable exchange rate as of the sixth business day prior to the closing date. The estimated consideration to be paid to Whistler Blackcomb shareholders is approximately $1.1 billion as of August 5, 2016, based on the closing currency exchange rate and Vail Resorts common stock as of that day. Completion of this acquisition is subject to certain closing conditions, including the approval by Whistler Blackcomb shareholders and the British Columbia Supreme Court, and regulatory approvals, as well as other customary closing conditions. For additional information, see the Notes to Consolidated Financial Statements.
3
Mountain Segment
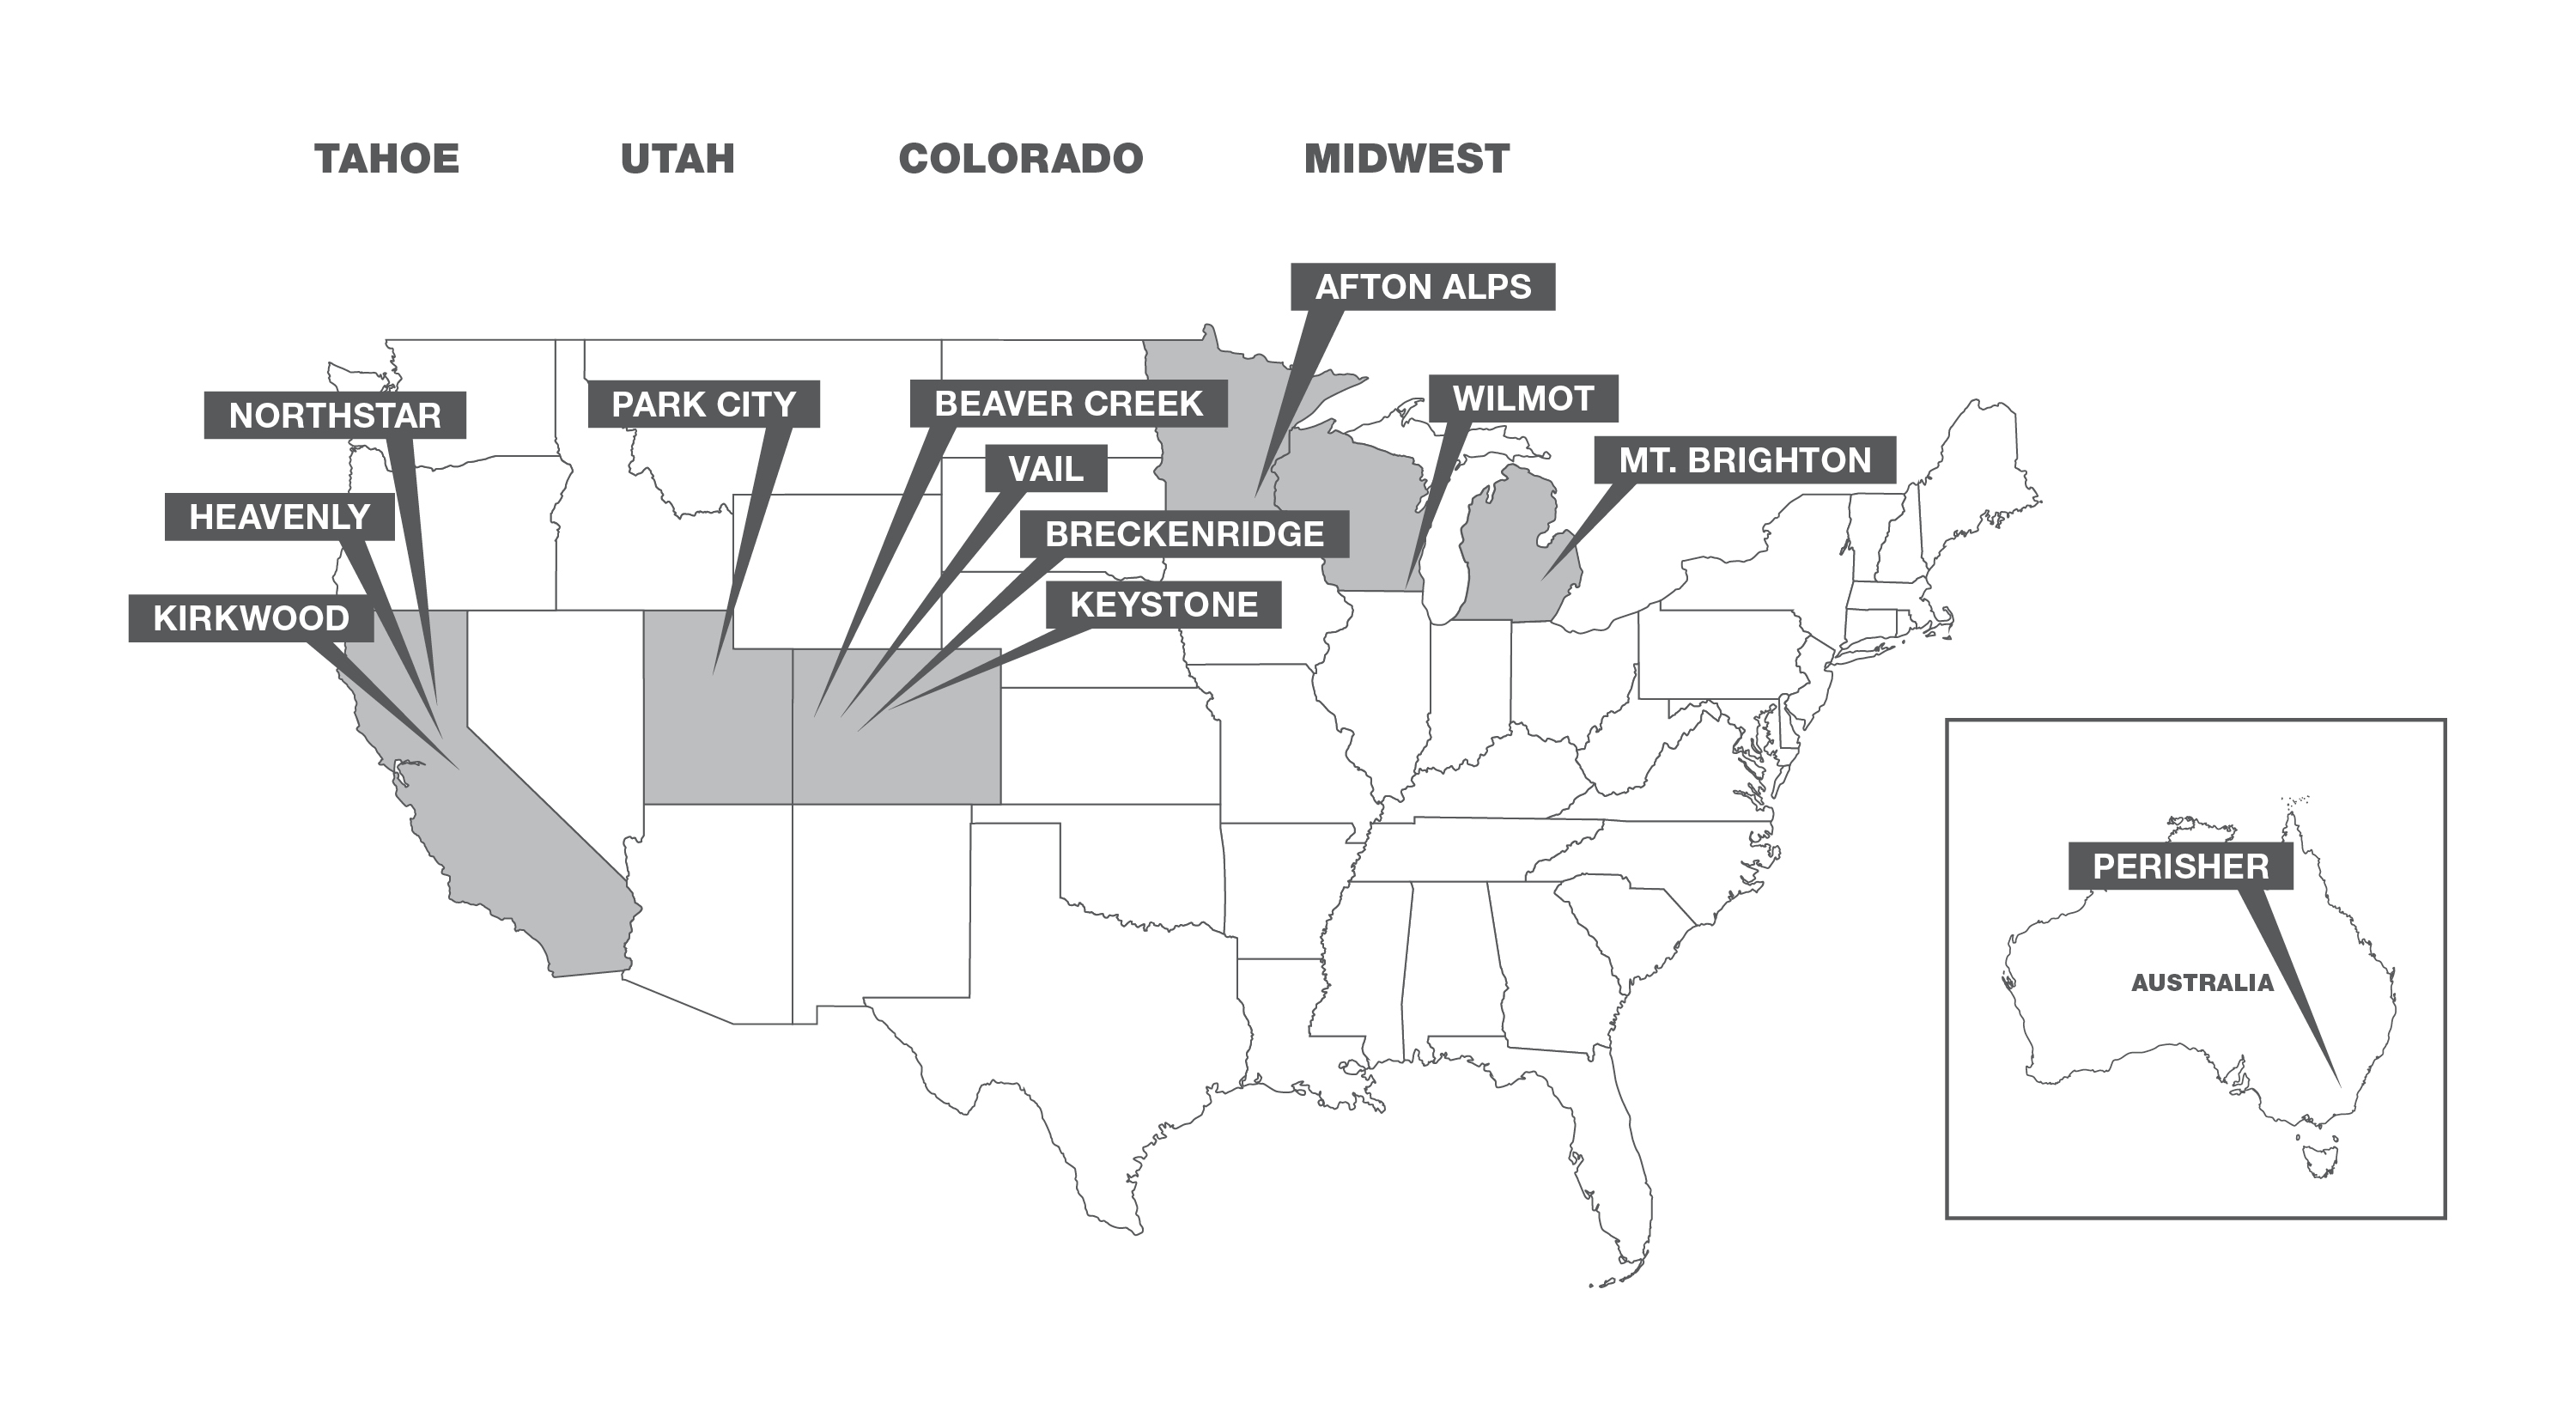
Our portfolio of world-class mountain resorts and urban ski areas includes:
Colorado and Utah Resorts (Rocky Mountain Region)
|
•
|
Breckenridge Ski Resort (“Breckenridge”) - the single most visited mountain resort in the United States (“U.S.”) for the 2015/2016 ski season with five interconnected peaks offering an expansive variety of terrain for every skill level, including access to above tree line intermediate and expert terrain, and progressive and award-winning terrain parks.
|
|
•
|
Vail Mountain (“Vail Mountain”) - the second most visited mountain resort in the U.S. for the 2015/2016 ski season. Vail Mountain offers some of the most expansive and varied terrain in North America with approximately 5,300 skiable acres including seven world renowned back bowls and the resort’s rustic Blue Sky Basin.
|
|
•
|
Park City Resort (“Park City”) - the third most visited mountain resort in the U.S. for the 2015/2016 ski season. The 2015/2016 season marked the unveiling of the newly transformed Park City, which was the result of a $50 million investment that connected the former Park City Mountain Resort and the former Canyons Resort (“Canyons”). Park City, now the largest ski resort in the U.S., offers 7,300 acres of skiable terrain for every type of skier and snowboarder and offers guests an outstanding ski experience with fine dining, ski school, retail and lodging.
|
|
•
|
Keystone Resort (“Keystone”) - the fourth most visited mountain resort in the U.S. for the 2015/2016 ski season and home to the highly renowned A51 Terrain Park, as well as the largest area of night skiing in Colorado. Keystone also offers guests a unique skiing opportunity through guided snow cat ski tours accessing five bowls. Keystone is a premier destination for families with its “Kidtopia” program focused on providing activities for kids on and off the mountain.
|
|
•
|
Beaver Creek Resort (“Beaver Creek”) - the seventh most visited mountain resort in the U.S. for the 2015/2016 ski season. Beaver Creek is a European-style resort with multiple villages and also includes a world renowned children’s ski school program focused on providing a first-class experience with unique amenities such as a dedicated children’s gondola. Beaver Creek also annually hosts the only North American men’s World Cup downhill races.
|
4
Lake Tahoe Resorts
|
•
|
Heavenly Mountain Resort (“Heavenly”) - the eleventh most visited mountain resort in the U.S. for the 2015/2016 ski season. Heavenly is located near the South Shore of Lake Tahoe with over 4,800 skiable acres, straddling the border of California and Nevada, offers unique and spectacular views of Lake Tahoe and boasts the largest snowmaking capacity in the Lake Tahoe region. Heavenly offers great nightlife, including its proximity to several casinos.
|
|
•
|
Northstar Resort (“Northstar”) - the thirteenth most visited mountain resort in the U.S. for the 2015/2016 ski season. Northstar is the premier luxury mountain resort destination near Lake Tahoe which offers premium lodging, a vibrant base area and over 3,000 skiable acres. Northstar’s village features high-end shops and restaurants, a conference center and a 9,000 square-foot skating rink.
|
|
•
|
Kirkwood Mountain Resort (“Kirkwood”) - located southwest of Lake Tahoe, offering a unique location atop the Sierra Crest. Kirkwood is recognized for offering some of the best high alpine advanced terrain in North America with 2,000 feet of vertical drop and over 2,300 acres of terrain.
|
Urban Ski Areas
|
•
|
Urban Ski Areas - Afton Alps Ski Area (“Afton Alps”), located near the Minneapolis/St. Paul metropolitan area, is the largest ski area near a major city in the Midwest and offers 48 trails, with night skiing, riding and tubing. Mount Brighton Ski Area (“Mt. Brighton”), located near Detroit, offers 26 trails with night skiing and riding. Wilmot Mountain (“Wilmot,” acquired in January 2016), located in southern Wisconsin, is near the Chicago metropolitan area and offers 25 trails, four terrain parks, a ski and snowboard school, a ski racing program and a tubing hill. We have made significant upgrades at both Afton Alps and Mt. Brighton to enhance the ski and base area experience for skiers and riders in each market and plan to complete similar investments at Wilmot for the upcoming 2016/2017 ski season.
|
Australia
|
•
|
Perisher Ski Resort (“Perisher”) - acquired in June 2015, is located in New South Wales, Australia and is the largest and most visited ski resort in Australia and the Southern Hemisphere. Perisher provides accessibility, significant lodging and the market’s most skiable acreage for the country’s largest cities, including Sydney, Melbourne, Adelaide, Canberra and Brisbane. Perisher offers over 3,000 skiable acres on seven peaks and includes the resort areas known as Perisher Valley, Smiggin Holes, Blue Cow and Guthega, along with ski school, lodging, food and beverage, retail/rental and transportation operations.
|
Our resorts in Colorado, Utah and Lake Tahoe are year-round mountain resorts that provide a comprehensive resort experience to a diverse clientele with an attractive demographic profile. Our resorts offer a broad complement of winter and summer recreational activities, including skiing, snowboarding, snowshoeing, snowtubing, sightseeing, mountain biking, guided hiking, zip lines, challenge ropes courses, alpine slides and mountain coasters, children’s activities and other recreational activities.
Our Mountain segment derives revenue through the sale of lift tickets, including season passes, as well as a comprehensive offering of amenities available to guests, including ski and snowboard lessons, equipment rentals and retail merchandise sales, a variety of dining venues, private club operations and other winter and summer recreational activities. In addition to providing extensive guest amenities, we also lease some of our owned and leased commercial space to third party operators to add unique restaurants and retail stores to the mix of amenities at the base of our resorts.
Ski Industry/Market
There are approximately 760 ski areas in North America and approximately 460 in the U.S., ranging from small ski area operations that service day skiers to large resorts that attract both day skiers and destination resort guests looking for a comprehensive vacation experience. One of the primary ski industry statistics for measuring performance is “skier visit,” which represents a person utilizing a ticket or pass to access a mountain resort for any part of one day during a winter ski season, and includes both paid and complimentary access. During the 2015/2016 U.S. ski season, combined skier visits for all ski areas in the U.S. were approximately 52.8 million and all North American skier visits were approximately 68.6 million. Our U.S. mountain resorts and urban ski areas had approximately 9.3 million skier visits during the 2015/2016 ski season, or approximately 17.6% of U.S. skier visits, and approximately 13.6% of North American skier visits. Our largest presence is in the Rocky Mountain region, which includes our Colorado and Utah mountain resorts, and the Lake Tahoe region.
Our Rocky Mountain region mountain resorts appeal to both day skiers and destination guests due to our Colorado resorts’ proximity to Colorado’s Front Range (Denver, Colorado Springs and Boulder) metropolitan areas and Park City’s proximity to the Salt Lake City metropolitan area. The Colorado Front Range has a population of approximately 4.8 million and is within approximately 100
5
miles from each of our Colorado resorts, with access via a major highway. Additionally, the Salt Lake City metropolitan area has a population of over 1.2 million and is approximately 30 miles from Park City. These resorts are also accessible from several airports, including Denver International Airport and Eagle County Airport in Colorado and the Salt Lake City International Airport in Utah and have a wide range of amenities available at each resort, as well as within the proximate base areas, villages and towns. The Rocky Mountain region has 93 ski areas. All ski areas within the Rocky Mountain region combined recorded approximately 22.3 million skier visits for the 2015/2016 ski season with skier visits at our Rocky Mountain region mountain resorts totaling 7.2 million, or approximately 32.3% of total Rocky Mountain region skier visits for the 2015/2016 ski season.
Lake Tahoe, which straddles the border of California and Nevada, is a major skiing destination less than 100 miles from Sacramento and Reno and approximately 200 miles from San Francisco, drawing skiers from the entirety of California and Nevada and making it a convenient destination for both day skiers and destination guests. Heavenly, located near the South Shore of Lake Tahoe; Northstar, located near the North Shore of Lake Tahoe; and Kirkwood, located about 35 miles southwest of South Lake Tahoe, are popular year-round vacation destinations, featuring outstanding winter sports offerings and extensive summer attractions. Heavenly, Northstar and Kirkwood are proximate to both the Reno/Tahoe International Airport and the Sacramento International Airport. California and Nevada collectively have 33 ski areas. Our Lake Tahoe resorts had 1.8 million skier visits for the 2015/2016 ski season, which was approximately 25.4% of the approximately 7.1 million total California and Nevada skier visits for the 2015/2016 ski season.
Afton Alps and Mt. Brighton are located within 50 miles of Minneapolis/St. Paul and Detroit, respectively. Wilmot is located in Wisconsin near the Illinois state line, approximately 65 miles north of Chicago. This close proximity to major Midwestern skier markets allows guests to visit regularly during the week, including popular night skiing, or on the weekends. Additionally, these cities offer major airports with routine direct flights to Denver, San Francisco and Salt Lake City.
Competition
There is limited opportunity for development of new ski areas due to the limited private lands on which ski areas can be built, the difficulty in obtaining the appropriate governmental approvals to build on public lands and the significant capital needed to construct the necessary infrastructure. As such, there have been virtually no new major resorts in North America for over 30 years, which has and should continue to allow the best positioned resorts to benefit from future industry growth. Our resorts compete with other major destination mountain resorts, including, among others, Aspen Snowmass, Copper Mountain, Deer Valley, Snowbird, Squaw Valley USA, Sierra at Tahoe, Steamboat, Whistler Blackcomb and Winter Park, as well as other ski areas in Colorado, California, Nevada, Utah, the Pacific Northwest and Southwest, and other destination ski areas in North America and worldwide as well as non-ski related vacation options and destinations.
While the ski industry has performed well in recent years in terms of number of skier visits, with the five best seasons occurring in the past ten years for U.S. visitation, a particular ski area’s growth is also largely dependent on either attracting skiers away from other resorts, generating more revenue per skier visit or generating more visits from each skier. The better capitalized mountain resorts operators, including Vail Resorts, are expanding their offerings, as well as enhancing the quality and experience by adding new high speed chairlifts, gondolas, terrain parks, state of the art grooming machines, expanded terrain, on-mountain dining venues, as well as amenities at the base areas of the resorts, including dining, retail and lodging, all of which are aimed at increasing guest visitation and revenue per skier visit.
Our premier resorts and business model differentiate our Company from the rest of the ski industry. We have iconic, branded mountain resorts in three important ski destinations in Colorado, Utah and Lake Tahoe. Through our sales of season passes, we provide our guests with a strong value proposition in return for guests committing to ski at our resorts prior to, or very early into the ski season, which we believe attracts more guests to our resorts. We believe we invest in more capital improvements than our competitors and we create synergies by operating multiple resorts, which enhances our profitability. Additionally, our mountain resorts located in the U.S., with the exception of Kirkwood, typically rank in the most visited ski resorts in the U.S., and most of our mountain resorts consistently rank in the top ranked ski resorts in North America according to industry surveys, which we attribute to our mountain resorts’ ability to provide a high-quality experience.
Summer tourism in Colorado, Utah and Lake Tahoe exceeds winter tourism, which provides for a strong summer business opportunity. Our mountain resorts offer non-ski related attractions such as sightseeing, mountain biking, guided hiking, 4x4 Jeep tours, zip line tours, challenge ropes courses, alpine slides and coasters, children’s activities and other recreational activities. In the fall of 2011, the Ski Area Recreational Opportunities Enhancement Act was enacted into law which allows our mountain resorts on USDA Forest Service (“Forest Service”) land to offer more summer-season recreational opportunities. The first year of Epic Discovery, our comprehensive summer activities program, launched at both Vail Mountain and Heavenly in June 2016 and included a number of new activities, including zip lines, challenge ropes courses, tubing, mountain excursions, canopy tours and Forest Flyers (i.e. alpine coasters). A similar launch of Epic Discovery is planned for Breckenridge in the summer of calendar year 2017.
6
Additionally, our summer business at Park City is robust and offers guests a number of activities including biking, zip lines, an alpine coaster and an alpine slide. These new activities are already popular with summer travelers and will introduce a new guest demographic to our mountain resorts.
The ski industry statistics stated in this section have been derived from data published by Colorado Ski Country USA, Canadian Ski Council, Kottke National End of Season Survey 2015/2016 (the “Kottke Survey”) and other industry publications.
Our Competitive Strengths
All of our mountain resorts maintain the distinction of competing effectively as both market leaders and quality leaders. The following factors contribute directly to each resort’s success:
Exceptional mountain experience
|
•
|
World-Class Mountain Resorts and Integrated Base Resort Areas
|
Our mountain resorts offer a multitude of skiing and snowboarding experiences for the beginner, intermediate, advanced and expert levels. Each mountain resort is fully integrated into expansive resort base areas offering a broad array of lodging, dining, retail, nightlife and other amenities, some of which we own or manage, to our guests.
|
•
|
Snow Conditions
|
Our mountain resorts are located in areas that generally receive significantly higher than average snowfall compared to most other U.S. ski resort locations. Our resorts in the Rocky Mountain region of Colorado and Utah and the Sierra Nevada Mountains in Lake Tahoe receive average yearly snowfall between 20 and 39 feet. Average yearly snowfall in Australia is significantly lower than in the U.S., although Perisher generally receives higher average yearly snowfall compared to other Australian alpine ski resorts due to its location in the Australian Alps and the elevation of its terrain. Even in these abundant snowfall areas, we have significant snowmaking systems that can help provide a more consistent experience, especially in the early season. Additionally, we provide several hundred acres of groomed terrain at each of our mountain resorts with extensive fleets of snow grooming equipment.
|
•
|
Lift Service
|
We systematically upgrade our lifts and put in new lifts to increase uphill capacity and streamline skier traffic to maximize the guest experience. In the past several years, we have installed several high-speed chairlifts and gondolas across our mountain resorts, including an eight-passenger gondola connecting Park City and Canyons, a new high-speed, state-of-the-art combination gondola and chairlift replacing the Centennial Express Lift at Beaver Creek; a new high-speed, six-passenger chairlift replacing the Colorado SuperChair at Breckenridge, which is the primary chairlift serving the critical Peak 8 base area; a new high-speed, six-passenger chairlift and a new four-passenger chairlift to access the Peak 6 area in Breckenridge; a state-of-the-art ten passenger gondola (Gondola 1) at Vail, replacing a four-passenger high-speed chairlift; a new high-speed, six-passenger chairlift servicing mid-Vail, replacing a four-passenger chairlift; and, a four-passenger high-speed chairlift servicing Vail Mountain's back bowls. For the 2016/2017 ski season, we are making substantial replacements and improvements to the lifts at Wilmot as a part of the approximate $13 million investment to enhance the ski and base area. Additionally, we are upgrading the Sun Up chairlift at Vail Mountain (Chair 17) from a fixed-grip triple to a high-speed four-passenger chairlift.
|
•
|
Terrain Parks
|
Our mountain resorts and urban ski areas are committed to leading the industry in terrain park design, education and events for the growing segment of freestyle skiers and snowboarders. Each of our mountain resorts has multiple terrain parks that include progressively-challenging features. These park structures, coupled with freestyle ski school programs, promote systematic learning from basic to professional skills.
7
Extraordinary service and amenities
|
•
|
Commitment to the Guest Experience
|
Our focus is to provide quality service at every level of the guest experience. Prior to arrival at our mountain resorts, guests can receive personal assistance through our full-service, in-house travel center and through our comprehensive websites to book desired lodging accommodations, lift tickets, ski school lessons, equipment rentals and travel arrangements. Upon arrival, our resort staff serve as ambassadors to engage guests, answer questions and create a customer focused environment. In addition, we offer guests what we believe is the industry leading EpicMix application. EpicMix is an online and mobile application that, through radio frequency technology, captures a guest’s activity on the mountain (e.g. number of ski days, vertical feet skied and chairlift activity) and allows a guest to share his or her experience and accomplishments with family and friends on social networks. Since the initial launch of our EpicMix technology, we have expanded EpicMix to include additional offerings such as EpicMix Time, which allows guests to access real time lift line wait times; EpicMix Academy, which allows our ski school instructors to certify the attainment of certain skills and ski levels; EpicMix Photo, which provides professional photos and allows guests to share photos on social networks; and EpicMix Guide, which uses guest input to provide a customized, step-by-step navigational guide to experience our mountains in Colorado, Utah and Tahoe.
We also solicit guest feedback through a variety of surveys and results, which are used to ensure high levels of customer satisfaction, understand trends and develop future resort programs and amenities.
|
•
|
Season Pass Products
|
We offer a variety of season pass products for all of our mountain resorts and urban ski areas that are marketed towards both out-of-state and international (“Destination”) guests and in-state and local (“Local”) guests. Our season pass products are available for purchase predominately during the period prior to the start of the ski season, offering our guests a better value in exchange for their commitment to ski at our resorts before the season begins. As such, our season pass program drives strong customer loyalty, mitigates exposure to more weather sensitive guests leading to greater revenue stability and allows us to capture valuable guest data. Additionally, our season pass customers typically ski more days each season than those guests who do not buy season passes, which leads to additional ancillary spending. Season pass products generated approximately 40% of our total lift revenue for Fiscal 2016. In addition, our season pass products attract new guests to our mountain resorts and urban ski areas. Sales of season pass products are a key component of our overall Mountain segment revenue and helps create strong synergies among our mountain resorts and urban ski areas. Our season pass products range from providing access to one or a combination of our mountain resorts and urban ski areas to our Epic Pass which provides unrestricted access to all our mountain resorts and urban ski areas. All of our various season pass options can be found on our consumer website www.snow.com.
As part of our continued strategy to drive season pass sales and create a stronger connection between key skier markets and our iconic destination mountain resorts, we expanded our portfolio of properties to include our urban ski areas as well as our Australian resort. Australia is an important international market for ski resorts across the Northern Hemisphere, generating an estimated more than 1.0 million skier visits annually to resorts in North America, Japan and Europe. As a result, in June 2015, we acquired Perisher in New South Wales, Australia. In addition, in December 2012, we acquired Afton Alps in Minnesota and Mt. Brighton in Michigan, which serve major snow sports markets in the Midwest with more than 468,000 active skiers and snowboarders in the Minneapolis-St. Paul and Detroit metropolitan areas. Additionally, in January 2016, we acquired Wilmot in Wisconsin, which serves the Chicago and Milwaukee metropolitan areas and has more than 800,000 active skiers and snowboarders. We believe our strategy increases the value of our season pass products and dramatically enhances the connection between our destination mountain resorts and these key skier markets.
|
•
|
Premier Ski Schools
|
Our mountain resorts are home to some of the highest quality and most widely recognized ski and snowboard schools in the industry. Through a combination of outstanding training and abundant work opportunities, our ski schools have become home to many of the most experienced and credentialed professionals in the business. We complement our instructor staff with state-of-the-art facilities and extensive learning terrain, all with a keen attention to guest needs. We offer a wide variety of adult and child group and private lesson options with a goal of creating lifelong skiers and riders and showcasing to our guests all the terrain our resorts have to offer.
8
|
•
|
Dining
|
Our resorts provide a variety of quality on-mountain and base village dining venues, ranging from top-rated fine dining restaurants to trailside express food service outlets. We operate approximately 150 dining venues at our mountain resorts and urban ski areas.
|
•
|
Retail/Rental
|
We have approximately 200 retail/rental locations specializing in sporting goods including ski, snowboard, golf and cycling equipment. In addition to providing a major retail/rental presence at each of our mountain resorts, we also have retail/rental locations throughout the Colorado Front Range and at other Colorado and California ski resorts, as well as the San Francisco Bay Area, Salt Lake City and Minneapolis. Many of the locations in the Colorado Front Range and in the San Francisco Bay Area also offer prime venues for selling our season pass products.
|
•
|
On-Mountain Activities and Epic Discovery
|
We are a ski industry leader in providing comprehensive destination vacation experiences, including on-mountain activities designed to appeal to a broad range of interests. In addition to our exceptional ski experiences, guests can choose from a variety of non-ski related activities such as snowtubing, snowshoeing, guided snowmobile and scenic cat tours, backcountry expeditions, horse-drawn sleigh rides and high altitude dining. During the summer, on-mountain recreational activities provide guests with a wide array of options including scenic chairlift and gondola rides; mountain biking; horseback riding; hiking; 4x4 Jeep tours; and our Epic Discovery program at Vail Mountain and Heavenly. The Epic Discovery program, which was introduced at Vail and Heavenly in Fiscal 2016, encourages “learn through play” by featuring extensive environmental educational elements interspersed between numerous new fun activities, which consists of zip lines, children’s activities, challenge ropes courses, tubing, mountain excursions, an alpine slide and an alpine coaster.
|
•
|
Lodging and Real Estate
|
Quality lodging options are an integral part of providing a complete resort experience. Our owned or managed hotels and resorts proximate to our mountain resorts, including five RockResorts branded properties and a significant inventory of managed condominium units, provide numerous accommodation options for our mountain resort guests. More recently, our real estate efforts have focused on the potential to expand our destination bed base and upgrade our resorts through the sale of land parcels to third-party developers which in turn provides opportunity for the development of condominiums, luxury hotels, parking and commercial space for restaurants and retail shops. Our Lodging and Real Estate segments have and continue to invest in resort related assets and amenities or seek opportunities to expand and enhance the overall resort experience.
Lodging Segment
Our Lodging segment includes the following operations:
|
•
|
RockResorts -- a luxury hotel management company with a current portfolio of five properties in Colorado, including four Company-owned hotels and one managed resort property;
|
|
•
|
Five additional Company-owned hotels, management of the Vail Marriott Mountain Resort & Spa (“Vail Marriott”), Mountain Thunder Lodge, Crystal Peak Lodge, Austria Haus Hotel, Grand Summit Hotel, Silverado Lodge, Sundial Lodge, DoubleTree by Hilton Park City - The Yarrow, and condominium management operations, which are in and around our mountain resorts in the Colorado, Lake Tahoe and Utah regions;
|
|
•
|
Two NPS concessionaire properties - GTLC, a summer destination resort with three resort properties in Grand Teton National Park, and Headwaters Lodge & Cabins at Flagg Ranch (“Flagg Ranch”) located between Yellowstone National Park and Grand Teton National Park in Wyoming;
|
|
•
|
CME -- a resort ground transportation company in Colorado; and
|
|
•
|
Five Company-owned mountain resort golf courses in Colorado, one owned in Wyoming and one operated in Lake Tahoe, California.
|
The Lodging segment currently includes approximately 4,500 owned and managed hotel rooms and condominium units. Our resort hotels collectively offer a wide range of services to guests.
9
Our portfolio of owned or managed luxury resort hotels and other hotels and properties currently includes:
|
Name
|
Location
|
Own/Manage
|
Rooms/Units*
|
|
RockResorts:
|
|||
|
The Lodge at Vail
|
Vail, CO
|
Own
|
166**
|
|
The Arrabelle at Vail Square
|
Vail, CO
|
Own
|
92**
|
|
The Pines Lodge
|
Beaver Creek, CO
|
Own
|
72**
|
|
The Osprey at Beaver Creek
|
Beaver Creek, CO
|
Own
|
48**
|
|
One Ski Hill Place
|
Breckenridge, CO
|
Manage
|
59***
|
|
Other Hotels and Properties:
|
|||
|
DoubleTree by Hilton Breckenridge
|
Breckenridge, CO
|
Own
|
208
|
|
The Keystone Lodge
|
Keystone, CO
|
Own
|
152
|
|
Inn at Keystone
|
Keystone, CO
|
Own
|
103
|
|
Village Hotel
|
Breckenridge, CO
|
Own
|
60
|
|
Ski Tip Lodge
|
Keystone, CO
|
Own
|
10
|
|
Jackson Lake Lodge
|
Grand Teton Nat’l Pk.,
WY
|
Concessionaire Contract
|
385
|
|
Colter Bay Village
|
Grand Teton Nat’l Pk.,
WY
|
Concessionaire Contract
|
166
|
|
Jenny Lake Lodge
|
Grand Teton Nat’l Pk.,
WY
|
Concessionaire Contract
|
37
|
|
Headwaters Lodge & Cabins at Flagg Ranch
|
Moran, WY
|
Concessionaire Contract
|
92
|
|
Vail Marriott Mountain Resort & Spa
|
Vail, CO
|
Manage
|
347
|
|
Mountain Thunder Lodge
|
Breckenridge, CO
|
Manage
|
80
|
|
Crystal Peak Lodge
|
Breckenridge, CO
|
Manage
|
27
|
|
Austria Haus Hotel
|
Vail, CO
|
Manage
|
25
|
|
Grand Summit Hotel
|
Park City, UT
|
Manage
|
282
|
|
Silverado Lodge
|
Park City, UT
|
Manage
|
139
|
|
Sundial Lodge
|
Park City, UT
|
Manage
|
114
|
|
DoubleTree by Hilton Park City - The Yarrow
|
Park City, UT
|
Manage
|
182
|
|
*Rooms/Units excludes approximately 1,700 managed condominium units.
|
|||
|
**Includes individual owner units that are in a rental program managed by us.
|
|||
|
***Includes owned and managed whole ownership units that are in a rental program managed by us.
|
|||
Our lodging strategy seeks to complement and enhance our mountain resort operations through our ownership or management of lodging properties and condominiums proximate to our mountain resorts and selective management of luxury resorts in premier destination locations.
In addition to our portfolio of owned or managed luxury resort hotels and other hotels and properties, our lodging business also features a Colorado ground transportation company, CME, which represents the first point of contact with many of our guests when they arrive by air to Colorado. CME offers year-round ground transportation from Denver International Airport and Eagle County Airport to the Vail Valley (locations in and around Vail, Beaver Creek, Avon and Edwards), Aspen (locations in and around Aspen and Snowmass) and Summit County (which includes Keystone, Breckenridge, Copper Mountain, Frisco and Silverthorne). CME offers four primary types of services: door-to-door shuttle business; point-to-point shuttle business with centralized drop-off at transportation hubs; private chartered vans; and premier luxury charter vehicles. CME’s vehicle fleet consists of approximately 250 vans and luxury SUVs.
10
Lodging Industry/Market
Hotels are categorized by Smith Travel Research, a leading lodging industry research firm, as luxury, upper upscale, upscale, mid-price and economy. The service quality and level of accommodations of our RockResorts’ hotels place them in the luxury segment, which represents hotels achieving the highest average daily rates (“ADR”) in the industry, and includes such brands as the Four Seasons, Ritz-Carlton and Starwood’s Luxury Collection hotels. Our other hotels are categorized in the upper upscale and upscale segments of the hotel market. The luxury and upper upscale segments consist of approximately 700,000 rooms at approximately 2,000 properties in the U.S. as of July 2016. For Fiscal 2016, our owned hotels, which include a combination of certain RockResort hotels, as well as other hotels in proximity to our mountain resorts, had an overall ADR of $227.27, a paid occupancy rate of 67.4% and revenue per available room (“RevPAR”) of $153.13, as compared to the upper upscale segment’s ADR of $177.88, a paid occupancy rate of 74.2% and RevPAR of $131.96. We believe that this comparison to the upper upscale segment is appropriate as our mix of owned hotels include those in the luxury and upper upscale segments, as well as certain of our hotels that fall in the upscale segment. The highly seasonal nature of our lodging properties generally results in lower average occupancy as compared to the upper upscale segment of the lodging industry as a whole.
Competition
Competition in the hotel industry is generally based on quality and consistency of rooms, restaurants, meeting facilities and services, attractiveness of locations, availability of a global distribution system and price. Our properties compete within their geographic markets with hotels and resorts that include locally-owned independent hotels, as well as facilities owned or managed by national and international chains, including such brands as Four Seasons, Hilton, Hyatt, Marriott, Ritz-Carlton, Starwood’s Luxury Collection and Westin. Our properties also compete for convention and conference business across the national market. We believe we are highly competitive in the resort hotel niche for the following reasons:
|
•
|
All of our hotels are located in unique highly desirable resort destinations;
|
|
•
|
Our hotel portfolio has achieved some of the most prestigious hotel designations in the world, including two properties in our portfolio that are currently rated as AAA 4-Diamond;
|
|
•
|
Many of our hotels (both owned and managed) are designed to provide a look that feels indigenous to their surroundings, enhancing the guest’s vacation experience;
|
|
•
|
Each of our RockResorts hotels provides the same high level of quality and services, while still providing unique characteristics which distinguish the resorts from one another. This appeals to travelers looking for consistency in quality and service offerings together with an experience more unique than typically offered by larger luxury hotel chains, which has resulted in all five of our RockResort properties being recognized with the
TripAdvisor
Certificate of Excellence in recent years;
|
|
•
|
Many of the hotels in our portfolio provide a wide array of amenities available to the guest such as access to world-class ski and golf resorts, spa and fitness facilities, water sports and a number of other outdoor activities, as well as highly acclaimed dining options;
|
|
•
|
Conference space with the latest technology is available at most of our hotels. In addition, guests at Keystone can use our company-owned Keystone Conference Center, the largest conference facility in the Colorado Rocky Mountain region with more than 100,000 square feet of meeting, exhibit and function space;
|
|
•
|
We have a central reservations system that leverages off of our mountain resort reservations system and has an online planning and booking platform, offering our guests a seamless and useful way to make reservations at our resorts; and
|
|
•
|
We actively upgrade the quality of the accommodations and amenities available at our hotels through capital improvements. Capital funding for third-party owned properties is provided by the owners of those properties to maintain standards required by our management contracts. Projects at our owned properties completed over the past several years include extensive refurbishments and upgrades to the DoubleTree by Hilton Breckenridge, renovations of guest rooms and the front lobby at The Lodge at Vail, pool and restaurant (Elway’s) upgrades to The Lodge at Vail, guest room renovations at the Keystone Lodge, a restaurant renovation at The Arrabelle at Vail Square and guest room upgrades at The Pines Lodge.
|
11
National Park Concessionaire Properties
We own GTLC, which is based in the Jackson Hole area in Wyoming and operates within Grand Teton National Park under a 15-year concessionaire agreement with the NPS that expires December 31, 2021. We also own Flagg Ranch, located in Moran, Wyoming and is centrally located between Yellowstone National Park and Grand Teton National Park on the John D. Rockefeller, Jr. Memorial Parkway (the “Parkway”). Flagg Ranch operates under a 15-year concessionaire agreement with the NPS that expires October 31, 2026. GTLC also owns Jackson Hole Golf & Tennis Club (“JHG&TC”), located outside Grand Teton National Park near Jackson, Wyoming. GTLC’s operations within Grand Teton National Park and JHG&TC have operating seasons that generally run from June through the end of September.
There are 410 areas within the National Park System covering approximately 84 million acres across the U.S. and its territories. Of the 410 areas, 59 are classified as National Parks. While there are more than 500 NPS concessionaires, ranging from small, privately-held businesses to large corporate conglomerates, we primarily compete with such companies as Aramark Parks & Resorts, Delaware North Companies Parks & Resorts, Forever Resorts and Xanterra Parks & Resorts in retaining and obtaining NPS concessionaire agreements. The NPS uses “recreation visits” to measure visitation within the National Park System. In calendar year 2015, areas designated as National Parks received approximately 75.3 million recreation visits. Grand Teton National Park, which spans approximately 310,000 acres, had approximately 3.1 million recreation visits during calendar year 2015, or approximately 4.1% of total National Park recreation visits. Four full service concessionaires provide accommodations within Grand Teton National Park, including GTLC. GTLC offers three lodging options within Grand Teton National Park: Jackson Lake Lodge, a full-service, 385-room resort with 17,000 square feet of conference facilities which can accommodate up to 600 people; Jenny Lake Lodge, a small, rustically elegant retreat with 37 cabins; and Colter Bay Village, a facility with 166 log cabins, 66 tent cabins, 337 campsites and a 112-space RV park. GTLC offers dining options as extensive as its lodging options, with cafeterias, casual eateries and fine dining establishments. GTLC’s resorts provide a wide range of activities for guests to enjoy, including cruises on Jackson Lake, boat rentals, horseback riding, guided fishing, float trips, golf and guided Grand Teton National Park tours. As a result of the extensive amenities offered, as well as the tremendous popularity of the National Park System, GTLC’s accommodations within Grand Teton National Park operate near full capacity during their operating season.
Flagg Ranch features a range of lodging options from 92 standard, deluxe and premium cabins and 40 camper cabins, to a 97-space RV park and 34 campsites. Flagg Ranch also offers additional amenities including dining, retail and activities for our guests to enjoy, including horseback riding, guided fishing, float trips and guided Yellowstone National Park and Grand Teton National Park tours. In addition to these summer offerings, Flagg Ranch provides limited winter operations to support Yellowstone National Park snowmobile tours.
Real Estate Segment
We have extensive holdings of real property at our mountain resorts primarily throughout Summit and Eagle Counties in Colorado. Our real estate operations, through Vail Resorts Development Company (“VRDC”), a wholly-owned subsidiary, include planning, oversight, infrastructure improvement, development, marketing and sale of our real property holdings. In addition to the cash flow generated from real estate development sales, these development activities benefit our Mountain and Lodging segments by (1) creating additional resort lodging and other resort related facilities and venues (primarily restaurants, spas, commercial space, private mountain clubs, skier services facilities and parking structures) that provide us with the opportunity to create new sources of recurring revenue, enhance the guest experience and expand our destination bed base; (2) controlling the architectural themes of our resorts; and (3) expanding our property management and commercial leasing operations.
The principal activities of our Real Estate segment include the marketing and selling of remaining condominium units available for sale, which primarily relate to The Ritz-Carlton Residences, Vail, and One Ski Hill Place in Breckenridge; the sale of land parcels to third-party developers; planning for future real estate development projects, including zoning and acquisition of applicable permits; and the occasional purchase of selected strategic land parcels for future development. We continue undertaking preliminary planning and design work on future projects and are pursuing opportunities with third-party developers rather than undertaking our own significant vertical development projects. We believe that, due to our low carrying cost of real estate land investments, we are well situated to promote future projects with third-party developers while limiting our financial risk.
12
Marketing and Sales
Our Mountain segment’s marketing and sales efforts are increasingly oriented around data analytics to drive targeted and personalized marketing to our existing and prospective guests. We capture guest data on the vast majority of guest transactions through our season pass program, e-commerce platforms including mobile lift ticket sales, the EpicMix application and operational processes at our lift ticket windows. We promote our resorts through customer relationship marketing to targeted audiences via email and direct mail, promotional programs, digital marketing (including social, search and display) and traditional media advertising where appropriate (e.g. targeted print, TV, radio). Additionally, our resorts and the snowsports industry are frequently featured through our OnTheSnow.com and Skiinfo.com websites, which are two of the world’s most visited online snowsports portals. We also have marketing programs directed at attracting groups, corporate meetings and convention business. Most marketing efforts drive traffic to our websites, where we provide our guests with information regarding each of our resorts, including services and amenities, reservations information, virtual tours and the opportunity to book/purchase multiple products for their vacations or other visits. We also enter into strategic alliances with companies to enhance the guest in-resort experience and to create opportunities for cross-marketing.
For our Lodging segment, we promote our hotels and lodging properties through marketing and sales programs, which include marketing directly to many of our guests through our digital channels (search, social and display), promotional programs and print media advertising. We also promote comprehensive vacation experiences through various package offerings and promotions (combining lodging, lift tickets, ski school lessons, ski rental equipment, transportation and dining), all of which are designed to drive traffic to our websites and central reservations call center. Where appropriate, we market our resort properties in conjunction with our mountain resort marketing efforts. Additionally, our individual hotels have active sales forces to generate conference and group business.
Seasonality
Ski resort operations are highly seasonal in nature, with a typical ski season in North America beginning in mid-November and running through mid-April. In an effort to partially mitigate the concentration of our revenue in the winter months in the U.S., we offer several non-ski related activities in the summer months such as sightseeing, mountain biking, guided hiking, 4x4 Jeep tours, golf (included in the operations of the Lodging segment) and our Epic Discovery program. These activities also help attract destination conference and group business to our resorts in our off-season. In addition, the operating results of Perisher, with its ski season from June through early October, partially counterbalance the concentration of our revenues during this seasonally low period.
Our lodging business is also highly seasonal in nature, with peak seasons primarily in the winter months (with the exception of GTLC, Flagg Ranch, certain managed properties and mountain resort golf operations). We actively promote our extensive conference facilities and have added more off-season activities to help offset the seasonality of our lodging business. Additionally, we operate eight golf courses: The Canyons Golf Course at Park City, The Beaver Creek Golf Club, The Keystone Ranch Golf Course, The River Course at Keystone, JHG&TC near Jackson, Wyoming, The Northstar Resort Golf Course and the Tom Fazio and Greg Norman courses at Red Sky Ranch near the Beaver Creek Resort.
Environmental Stewardship and Social Responsibility
Environmental and community stewardship is a core philosophy for us. Our resorts operate in some of the world’s greatest natural environments, and we believe it is our responsibility to care for and conserve these environments. Our environmental stewardship efforts are diverse and touch nearly every area of our operations. Through our sustainability program, EpicPromise, we focus on reducing our impact through resource conservation, protecting forest health and watersheds, and building stronger local communities through contributions to local non-profits. One of the most encompassing programs is our commitment to energy reduction. After reaching an initial goal to reduce our energy consumption by 10% in 2012, we have set a new goal of another 10% reduction by 2020, and we are on track to achieve this goal. We also have an extensive on-mountain recycling program that diverted approximately 45% of our total waste in recent years. In addition, we have partnered with several organizations to help raise resources for local environment programs, including the National Forest Foundation, the Tahoe Fund and Mountain Trails Foundation in Park City. We encourage our employees to help protect the environment and build strong communities with over 20,000 volunteer hours donated annually. Our charitable giving focuses on supporting education and youth programs that encourage environmental stewardship and enhance the quality of life in the communities in which we operate.
Finally, our EpicPromise Foundation (the “Foundation”), which was established in 2015, is a private charitable foundation funded by the Company’s annual contribution of $500,000 and additional contributions from employees. The Foundation supports all
13
Vail Resorts’ employees and their families via grants for emergency relief and scholarships. For more information, visit www.EpicPromise.com.
Employees
At fiscal year end, we employed approximately 5,200 year-round employees. During the height of our operating seasons, we employ approximately 21,800 additional seasonal employees. In addition, we employ approximately 300 year-round employees and 100 seasonal employees on behalf of the owners of our managed hotel properties. We consider our employee relations to be good.
Intellectual Property
The development of intellectual property is part of our overall business strategy, and we regard our intellectual property as an important element of our success. Accordingly, we protect our intellectual property rights and seek to protect against its unauthorized use through international, national and state laws and common law rights. We file applications for and obtain trademark registrations and have filed for patents to protect inventions and will continue to do so where appropriate. We also seek to maintain our trade secrets and confidential information by nondisclosure policies and through the use of appropriate confidentiality agreements and contractual provisions.
In the highly competitive industry in which we operate, trademarks, service marks, trade names and logos are very important in the sales and marketing of our mountain resorts and urban ski areas, lodging properties and services. We seek to register and protect our trademarks, service marks, trade names and logos and have obtained a significant number of registrations for those trademarks, which we believe have become synonymous in the travel and leisure industry with a reputation for excellence in service and authentic hospitality. Among other national and international trademark registrations, the Company owns U.S. federal registrations for
Epic
®
,
Epic Pass
®
,
Vail Resorts
®
,
Vail
®
,
Beaver Creek
®
,
Breckenridge
®
, and
Heavenly
®
. The Company licenses the right to use the federally registered trademark
Northstar California
®
from CLP Northstar LLC.
Regulation and Legislation
U.S. Forest Service Resorts
Federal Regulation
The operations of Breckenridge, Vail Mountain, Keystone, Beaver Creek, Heavenly and Kirkwood are conducted primarily on land under the jurisdiction of the Forest Service (collectively, the “Forest Service Resorts”). The 1986 Ski Area Permit Act (the “1986 Act”) allows the Forest Service to grant Term Special Use Permits (each, a “SUP”) for the operation of ski areas and construction of related facilities on National Forest lands. In November 2011, the 1986 Act was amended by the Ski Area Recreational Opportunity Enhancement Act (the “Enhancement Act”) to clarify the Forest Service’s authority to approve facilities primarily for year-round recreation. Under the 1986 Act, the Forest Service has the authority to review and approve the location, design and construction of improvements in the permit area and many operational matters.
Each individual national forest is required by the National Forest Management Act to develop and maintain a Land and Resource Management Plan (a “Forest Plan”), which establishes standards and guidelines for the Forest Service to follow and consider in reviewing and approving our proposed actions.
Special Use Permits
Each of the Forest Service Resorts operates under a SUP, and the acreage and expiration date information for each SUP is as follows:
|
Forest Service Resort
|
Acres
|
Expiration Date
|
|
Breckenridge
|
5,702
|
December 31, 2029
|
|
Vail Mountain
|
12,353
|
December 1, 2031
|
|
Keystone
|
8,376
|
December 31, 2032
|
|
Beaver Creek
|
3,849
|
November 8, 2039
|
|
Heavenly
|
7,050
|
May 1, 2042
|
|
Kirkwood
|
2,330
|
March 1, 2052
|
14
We anticipate requesting a new SUP for each resort prior to its expiration date as provided by Forest Service regulations and the terms of each existing SUP. We are not aware of the Forest Service refusing to issue a new SUP to replace an expiring SUP for a ski resort in operation at the time of expiration. The Forest Service can also terminate a SUP if it determines that termination is required in the public interest. However, to our knowledge, no SUP has ever been terminated by the Forest Service over the opposition of the permit holder.
Each SUP contains a number of requirements, including indemnifying the Forest Service from third-party claims arising out of our operation under the SUP and compliance with applicable laws, such as those relating to water quality and endangered or threatened species. For use of the land authorized by the SUPs, we pay a fee to the Forest Service ranging from 1.5% to 4.0% of adjusted gross revenue for activities authorized by the SUPs. Included in the calculation are sales from, among other things, lift tickets, season passes, ski school lessons, food and beverage, certain summer activities, equipment rentals and retail merchandise.
The SUPs may be revised or amended to accommodate changes initiated by us or by the Forest Service to change the permit area or permitted uses. The Forest Service may amend a SUP if it determines that such amendment is in the public interest. While the Forest Service is required to seek the permit holder’s consent to any amendment, an amendment can be finalized over a permit holder’s objection. Permit amendments must be consistent with the Forest Plan and are subject to the provisions of the National Environmental Policy Act (“NEPA”), both of which are discussed below.
Master Development Plans
The 1986 Act requires a Master Development Plan (“MDP”) for each ski area that is granted a SUP, and all improvements that we propose to make on National Forest System lands under any of our SUPs must be included in a MDP. MDPs describe the existing and proposed facilities, developments and area of activity within the permit area. We prepare MDPs, which set forth a conceptual overview of all potential projects at each resort. The MDPs are reviewed by the Forest Service for compliance with the Forest Plan and other applicable laws and, if found to be compliant, are accepted by the Forest Service. Notwithstanding acceptance by the Forest Service of the conceptual MDPs, individual projects still require separate applications and compliance with NEPA and other applicable laws before the Forest Service will approve such projects. We update or amend our MDPs for our Forest Service Resorts from time to time. For example, in February 2016, the Forest Service approved construction of a new restaurant to be located on National Forest System lands at Peak 7 in Breckenridge by a Supplemental Information Report. Construction of the new project commenced in June 2016 and construction is expected to be completed in December 2016, with operation of the restaurant anticipated during the 2016/2017 U.S. ski season.
Forest Plans
Operational and development activities on National Forest System lands at our four Colorado mountain resorts are subject to the additional regulatory and planning requirements set forth in the April 2002 Record of Decision (the “2002 ROD”) for the White River National Forest Land and Resources Management Plan (the “White River Forest Plan”). At Heavenly, operational and development activities on National Forest System lands are subject to the Lake Tahoe Basin Management Unit (“LTBMU”) Land and Resources Management Plan, which was adopted in 1988. We have been working with the LTBMU for the past several years as it revises the 1988 Plan. That process was concluded this year and a new plan became effective in August of 2016. At Kirkwood, operational and development activities on National Forest System lands are subject to the Eldorado National Forest Land and Resources Management Plan, which was adopted in 1989. When approving our application for development, area expansion or other activities on National Forest System lands, the Forest Service must adhere to the applicable Forest Plan. Any such decision may be subject to judicial review in federal court if a party, with standing, challenges a Forest Service decision that applies the requirements of a Forest Plan at one of our six mountain resorts located on Forest Service lands.
Private Land Resorts
The operations of Park City, Northstar, Afton Alps, Mt. Brighton and Wilmot are conducted primarily on private land and are not under the jurisdiction of the Forest Service (collectively, the “Private Land Resorts”). While Beaver Creek also operates on Forest Service land, a significant portion of the skiable terrain, primarily in the lower main mountain, Western Hillside, Bachelor Gulch and Arrowhead Mountain areas, is located on land that we own.
15
Although not governed by federal regulation, the Private Land Resorts may be governed by local laws and regulations. For example, specific projects and master development plans at Northstar require approval by Placer County, California, and site specific projects at Wilmot Mountain are approved by local townships and Kenosha County, Wisconsin pursuant to a conditional use permit and other operational licenses. Additionally, a portion of Park City is part of the Canyons Specially Planned Area (“SPA”) pursuant to a Summit County, Utah ordinance adopted in 1998, and a Development Agreement and Master Development Plan with affected property owners, developers and the county, the most recent versions of which were adopted in 1999. Other land use within the SPA is within the jurisdiction of Summit County. Land use at Park City is within the jurisdiction of Summit County and Park City Municipal Corporation. The portions of the resort located within Park City Municipal Corporation are subject to a Development Agreement with the municipality, the most recent version of which was entered into in 1998.
Perisher Regulatory Matters
Perisher is located in the Kosciuszko National Park, the largest national park in New South Wales, Australia. The resort includes four villages (Perisher Valley, Smiggin Holes, Guthega and Blue Cow) and their associated ski fields, as well as the site of the Skitube Alpine Railway at Bullock’s Flat, which is accredited in accordance with the Rail Safety National Law (NSW) No.82a. The Office of Environment and Heritage (“OEH”), an agency of the New South Wales government, which is part of the Department of Planning and Environment, is responsible for the protection and conservation of the Kosciuszko National Park. The National Parks and Wildlife Act 1974 (NSW) (“NPW Act”) establishes the National Parks and Wildlife Service and is responsible for the control and management of the Kosciusko National Park.
The NPW Act requires the Kosciuszko National Park to be managed in accordance with the principles specified in that legislation, including the provision for sustainable visitor or tourist use and enjoyment that is compatible with the conservation of the national park’s natural and cultural values. The legislation also authorizes the Minister for the Environment and the Minister for Heritage (the “Minister”) to grant leases and licenses of land within the Kosciuszko National Park for various purposes, including for purposes related to sustainable visitor or tourist use and enjoyment. Under this power, the Minister has granted to Perisher a lease and a license of specified land within the Kosciusko National Park until June 30, 2048, each with an option to renew for an additional period of 20 years. The Minister has also granted Perisher a lease of the parking lot at Perisher Valley that expires on December 31, 2025. Subject to certain conditions being met, the lease for the Perisher Valley parking lot can be extended until June 30, 2048, with an option to renew for a further 20 years. The lease and license provide for the payment of a minimum annual base rent with periodic increases in base rent over the term, turnover rent payments based on 2.0% of certain gross revenue, remittance of park user fees and certain other charges, also subject to periodic increases over the term.
Concessionaire Agreements
GTLC operates three lodging properties, food and beverage services, retail, camping and other services within the Grand Teton National Park under a concessionaire agreement with the NPS. Our concessionaire agreement with the NPS for GTLC expires on December 31, 2021, and we pay a fee of 8.01% to the NPS on the majority of our sales occurring in Grand Teton National Park.
In August 2011, the NPS selected Flagg Ranch Company, a wholly-owned subsidiary, to provide lodging, food and beverage services, retail, service station, recreation and other services on the Parkway located between Grand Teton National Park and Yellowstone National Park. Our concession contract with the NPS for the Parkway expires on October 31, 2026, and we pay a fee of 5.3% to the NPS on the majority of our sales occurring in the Parkway.
Upon expiration of these concession contracts, we will have to bid against other prospective concessionaires for award of a new contract. The NPS may suspend operations under the concession contract at any time if the NPS determines it is necessary to protect visitors or resources within the Grand Teton National Park or during a Federal Government shutdown. NPS may also terminate the concession contract for breach, following notice and a 15 day cure period or if it believes termination is necessary to protect visitors or resources within the Grand Teton National Park.
Environmental Regulations
National Environmental Policy Act; California Environmental Quality Act
NEPA requires an assessment of the environmental impacts of “significant” proposed actions on National Forest land, such as expansion of a ski area, installation of new lifts or snowmaking facilities or construction of new trails or buildings. We must comply with NEPA when seeking Forest Service approval of such improvements, except in limited cases where projects are not expected to have environmental impacts, which can be submitted to a Categorical Exclusion. The Forest Service is responsible for preparing and compiling the required environmental studies, usually through third-party consultants. NEPA allows for different types of environmental studies, depending on, among other factors, the scope and size of the expected impact of the proposed project. An
16
Environmental Assessment (“EA”) is typically used for projects where the environmental impacts are expected to be limited. For projects with more significant expected impacts, an Environmental Impact Statement (“EIS”) is more commonly required. An EIS is more detailed and broader in scope than an EA.
During the requisite environmental study, the Forest Service is required to analyze alternatives to the proposed action (including not taking the proposed action), as well as impacts that may be unavoidable. Following completion of the requisite environmental study, the Forest Service may decide not to approve the proposed action or may decide to approve an alternative. In either case, we may be forced to abandon or alter our development or expansion plans.
In January 2015, after our submission of a proposal for summer recreation activities at Breckenridge, the Forest Service released a draft EIS related to such summer activities, including zip lines, canopy tours, ropes challenge courses and new mountain biking and hiking trails. The draft EIS analyzed environmental affects and alternatives included in our proposal. In August 2015, the Forest Service released its final EIS and draft record of decision approving various new facilities and summer recreation activities at Breckenridge, and final Forest Service approval for summer activities at Breckenridge was obtained in November 2015. Construction for many of the approved summer activities occurred during the summer of 2016.
California Environmental Quality Act
Proposed actions at Kirkwood, Northstar and certain portions of Heavenly may also be subject to the California Environmental Quality Act (“CEQA”), which is similar to NEPA in that it requires the California governmental entity approving any proposed action at Kirkwood, Northstar, or on the California portion of Heavenly to study potential environmental impacts. Projects with significant expected impacts require an Environmental Impact Report while more limited projects may be approved based on a Mitigated Negative Declaration.
Environmental Planning and Assessment Act 1979 (NSW, Australia)
The Environmental Planning and Assessment Act 1979 (NSW) (“EPA Act”) is the principal legislation regulating land use and development in New South Wales, Australia. Perisher relies on a suite of planning approvals (and existing use rights) granted under the EPA Act to operate the resort. Various types of development that facilitate commercial ski resort operations are also permitted to be carried out without planning approval pursuant to the State Environmental Planning Policy (Kosciusko National Park - Alpine Resorts) 2007 and the Snowy River Local Environmental Plan 2013. Strategic planning documents have been adopted to provide a framework for the assessment and approval of future development at the resort, including the Perisher Range Resorts Master Plan, Perisher Blue Ski Resort Ski Slope Master Plan and Kosciuszko National Park Plan of Management. Perisher holds a number of environmental approvals to regulate its operations, including an environment protection license for the sewage treatment plant at Bullock’s Flat and a suite of licenses for the storage of diesel, heating oil and propane in storage tanks across the resort. Perisher implemented an Environmental Management System to manage compliance with the environmental regulatory framework, and mitigate potential environmental risks arising from its operations.
State and Local Land Use Regulations
In addition to federal and environmental regulations, each resort is subject to and must comply with state, county, regional and local government land use regulations and restrictions, including, for example, employee housing ordinances, zoning and density restrictions, noise ordinances, and wildlife, water and air quality regulations.
Water and Snowmaking
We rely on a supply of water for operation of our ski areas for domestic and snowmaking purposes and for real estate development. Availability of water depends on existence of adequate water rights, as well as physical delivery of the water when and where it is needed.
To provide a level of predictability in dates of operation and favorable snow surface conditions at our ski areas, we rely on snowmaking, which requires a significant volume of water, most of which is viewed as a non-consumptive use. Approximately 80% of the water is returned to the watershed at spring runoff.
In Colorado, we own or have ownership interests in water rights in reservoir companies, reservoirs, groundwater wells and other sources. The primary source of water for Keystone and Breckenridge is the Clinton Reservoir, in which we own a non-controlling interest. For Vail Mountain and Beaver Creek, the primary water source is Eagle Park Reservoir, in which we own a controlling interest.
17
Park City receives water for snowmaking from the Park City Municipal Corporation and Summit Water Distribution Company pursuant to various long-term agreements. Park City’s water is stored in retention ponds located at the Park City Golf Club, a retention pond located at the resort, and at facilities owned or operated by Summit Water Distribution Company.
Heavenly’s primary sources of water purchased for domestic and snowmaking uses are the South Tahoe Public Utility District and Kingsbury General Improvement District, which are California and Nevada utilities, respectively. The delivery systems of each utility are limited and may not be able to provide the immediate physical supply of water needed for optimal snowmaking. These sources are augmented by on-mountain underground wells that provide water for domestic uses at on-mountain lodges and for snowmaking. The underground water rights that are used for the East Peak Lake snowmaking well are held jointly with the Forest Service.
Northstar obtains water through a cooperative arrangement with the Northstar Community Services District (“NCSD”). Together with NCSD, we, through our lease with affiliates of CNL Lifestyles Properties, Inc., control surface water rights that we use for snowmaking. In addition, we have contractual rights to ground water from NCSD and from the adjacent Martis Camp residential development. We receive domestic water from NCSD and, for on-mountain facilities, from on-mountain wells and a series of significant near-surface springs.
Kirkwood co-owns with the Forest Service surface water rights sufficient for current and planned snowmaking at the resort. Kirkwood’s water is stored in nearby Caples Lake under contract with its owner/operator. Afton Alps, Mt. Brighton and Wilmot rely on on-site water wells and reservoirs for snowmaking. Perisher is subject to the Water Act of 1912 (NSW) (“NSW Water Act”), which regulates the use of water sources (such as rivers, lakes and groundwater aquifers) in the Kosciuszko National Park. Perisher relies on six water licenses issued under the NSW Water Act and a water extraction agreement with an independent third party for the purposes of extracting water for snowmaking.
Available Information
We file with or furnish to the Securities and Exchange Commission (“SEC”) reports, including our annual report on Form 10-K, quarterly reports on Form 10-Q, current reports on Form 8-K and amendments to those reports pursuant to Section 13(a) or 15(d) of the Securities Exchange Act of 1934. These reports, proxy statements and other information are available free of charge on our corporate website
www.vailresorts.com
as soon as reasonably practicable after they are electronically filed with or furnished to the SEC. Materials filed with or furnished to the SEC are also made available on its website at
www.sec.gov
. Copies of any materials we file with the SEC can be obtained at
www.sec.gov
or at the SEC’s public reference room at 100 F Street, N.E., Washington, D.C. 20549. Information on the operation of the public reference room is available by calling the SEC at 1-800-SEC-0330.
|
ITEM 1A.
|
RISK FACTORS.
|
Our operations and financial results are subject to various risks and uncertainties that could adversely affect our financial position, results of operations and cash flows. The risks described below should carefully be considered together with the other information contained in this report.
Risks Related to Our Business
We are subject to the risk of prolonged weakness in general economic conditions including adverse effects on the overall travel and leisure related industries.
Economic conditions currently present or recently present in the U.S., Europe and parts of the rest of the world, including high unemployment, erosion of consumer confidence, sovereign debt issues and financial instability in the global markets, may potentially have negative effects on the travel and leisure industry and on our results of operations. As a result of these and other economic uncertainties, we have experienced and may experience in the future, among other items, a change in booking trends such that guest reservations are made much closer to the actual date of stay, a decrease in the length of stay and a decrease in group bookings. We cannot predict what impact these uncertainties may have on overall travel and leisure or more specifically, on our guest visitation, guest spending or other related trends and the ultimate impact it will have on our results of operations.
Additionally, the actual or perceived fear of weakness in the economy could also lead to decreased spending by our guests. Skiing, travel and tourism are discretionary recreational activities that can entail a relatively high cost of participation and are adversely affected by economic slowdown or recession. This could further be exacerbated by the fact that we charge some of the highest prices for our lift tickets and ancillary services in the ski industry. In the event of a decrease in visitation and overall guest spending we may be required to offer a higher amount of discounts and incentives than we have historically, which would adversely impact our operating results. Our resorts also serve as a destination for international guests. To the extent there are material changes in exchange rates relative to the U.S. dollar, it could impact the volume of international visitation.
18
We are vulnerable to unfavorable weather conditions and the impact of natural disasters.
Our ability to attract guests to our resorts is influenced by weather conditions and by the amount and timing of snowfall during the ski season. Unfavorable weather conditions can adversely affect skier visits and our revenue and profits. Unseasonably warm weather may result in inadequate natural snowfall and reduce skiable terrain, which increases the cost of snowmaking and could render snowmaking, wholly or partially, ineffective in maintaining quality skiing conditions, including in areas which are not accessible by snowmaking equipment. In addition, a severe and prolonged drought could affect our otherwise adequate snowmaking water supplies or increase the cost of snowmaking. Excessive natural snowfall may significantly increase the costs incurred to groom trails and may make it difficult for guests to obtain access to our mountain resorts. In the past 20 years, our U.S. mountain resorts have averaged between 20 and 39 feet of annual snowfall, which is significantly in excess of the average for U.S. ski resorts. However, there can be no assurance that our resorts will receive seasonal snowfalls near their historical average in the future. For example, we experienced very poor conditions in the Lake Tahoe region during the 2012/2013, 2013/2014 and 2014/2015 U.S. ski seasons and experienced historic low snowfall across all our resorts during the 2011/2012 ski season. Past snowfall levels or consistency of snow conditions can impact the levels of sales of season passes. Additionally, the early season snow conditions and skier perceptions of early season snow conditions can influence the momentum and success of the overall ski season. Unfavorable weather conditions can adversely affect our resorts and lodging properties as guests tend to delay or postpone vacations if conditions differ from those that typically prevail at such resorts for a given season. Although we have created geographic diversification to help mitigate the impact of weather variability, there is no way for us to predict future weather patterns or the impact that weather patterns may have on our results of operations or visitation.
A severe natural disaster, such as a forest fire, may interrupt our operations, damage our properties, reduce the number of guests who visit our resorts in affected areas and negatively impact our revenue and profitability. Damage to our properties could take a long time to repair and there is no guarantee that we would have adequate insurance to cover the costs of repair and recoup lost profits. Furthermore, such a disaster may interrupt or impede access to our affected properties or require evacuations and may cause visits to our affected properties to decrease for an indefinite period. The ability to attract visitors to our resorts is also influenced by the aesthetics and natural beauty of the outdoor environment where our resorts are located. A severe forest fire or other severe impacts from naturally occurring events could negatively impact the natural beauty of our resorts and have a long-term negative impact on our overall guest visitation as it would take several years for the environment to recover.
Leisure and business travel are particularly susceptible to various factors outside of our control, including terrorism, the uncertainty of military conflicts, outbreaks of contagious diseases, the cost and availability of travel options and change in consumer preferences.
Our business is sensitive to the willingness of our guests to travel. Acts of terrorism, the spread of contagious diseases, political events and developments in military conflicts in areas of the world from which we draw our guests could depress the public’s propensity to travel and cause severe disruptions in both domestic and international air travel and consumer discretionary spending, which could reduce the number of visitors to our resorts and have an adverse effect on our results of operations. Many of our guests travel by air and the impact of higher prices for commercial airline services and availability of air services could cause a decrease in visitation by Destination guests to our resorts. A significant portion of our guests also travel by vehicle and higher gasoline prices could adversely impact our guests’ willingness to travel to our resorts. Higher cost of travel may also affect the amount that guests are willing to spend at our resorts and could negatively impact our revenue particularly for lodging, ski school, dining and retail/rental.
Additionally, our success depends on our ability to attract visitors to our ski resorts. Changes in consumer tastes and preferences, particularly those affecting the popularity of skiing and snowboarding, and other social and demographic trends could adversely affect the number of skier visits during a ski season. A significant decline in skier visits compared to historical levels would have a material adverse effect on our business, prospects, financial condition, results of operations and cash flows.
19
Our business is highly seasonal.
Our mountain and lodging operations are highly seasonal in nature. In particular, revenue and profits from our mountain and most of our lodging operations are substantially lower and historically result in losses from late spring to late fall. Conversely, peak operating seasons for Perisher, GTLC and Flagg Ranch, mountain summer activities (including our Epic Discovery program), sightseeing and our golf courses generally occur from June to the end of September while the remainder of the year results in operating losses. Revenue and profits generated by Perisher, GTLC and Flagg Ranch, mountain summer activities/sightseeing and golf peak season operations are not nearly sufficient to fully offset our off-season losses from our other mountain and lodging operations. For Fiscal 2016, 79% of total combined Mountain and Lodging segment net revenue (excluding Lodging segment revenue associated with reimbursement of payroll costs) was earned during our second and third fiscal quarters. This seasonality is partially mitigated by the sale of season passes (which for Fiscal 2016 accounted for approximately 40% of the total lift revenue) predominately occurring during the period prior to the start of the ski season as the cash from those sales is collected in advance and revenue is mostly recognized in the second and third quarters. In addition, the timing of major holidays and school breaks can impact vacation patterns and therefore visitation at our mountain resorts and urban ski areas. If we were to experience an adverse event or realize a significant deterioration in our operating results during our peak periods (our fiscal second and third quarters) we would be unable to fully recover any significant declines due to the seasonality of our business. Operating results for any three-month period are not necessarily indicative of the results that may be achieved for any subsequent quarter or for a full fiscal year (see Notes to Consolidated Financial Statements).
In the fall of 2011, the Ski Area Recreational Opportunity Enhancement Act was enacted into law which clarifies that the Forest Service is authorized to permit year-round recreational activities on land owned by the Forest Service. As such, this allows and will continue to allow our mountain resorts on Forest Service land to offer more summer-season recreational opportunities. We anticipate that if our proposed plans are approved and implemented, that once these summer activities mature, we could realize substantial incremental summer guest visitation and revenue. However, our summer activities may not generate the projected revenue and profit margins we expect, and even if our future plans are successful, we do not expect that these enhanced summer operations will fully mitigate the seasonal losses that our mountain operations experience from late spring to late fall.
We face significant competition.
The ski resort and lodging industries are highly competitive. The number of people who ski in the U.S. (as measured in skier visits) has generally ranged between 51 million and 61 million annually over the last decade, with approximately 52.8 million visits for the 2015/2016 ski season. There are approximately 460 ski areas in the U.S. that serve local and destination guests, and these ski areas can be more or less impacted by weather conditions based on their location and snowmaking capabilities. The factors that we believe are important to customers include:
|
•
|
proximity to population centers;
|
|
•
|
availability and cost of transportation to ski areas;
|
|
•
|
availability and quality of lodging options in resort areas;
|
|
•
|
ease of travel to ski areas (including direct flights by major airlines);
|
|
•
|
pricing of lift tickets and/or season passes and the magnitude, quality and price of related ancillary services (ski school, dining and retail/rental), amenities and lodging;
|
|
•
|
snowmaking facilities;
|
|
•
|
type and quality of skiing and snowboarding offered;
|
|
•
|
duration of the ski season;
|
|
•
|
weather conditions; and
|
|
•
|
reputation.
|
We have many competitors for our guests, including other major resorts in Colorado, Utah, California, Nevada, the Pacific Northwest and Southwest and other major destination ski areas worldwide. Our guests can choose from any of these alternatives, as well as non-skiing vacation options and destinations around the world. In addition, other forms of leisure such as sporting events and participation in other competing indoor and outdoor recreational activities are available to potential guests.
RockResorts hotels, our other hotels and our property management business compete with numerous other hotel and property management companies that may have greater financial resources than we do and they may be able to adapt more quickly to changes in customer requirements or devote greater resources to promotion of their offerings than us. We believe that developing and maintaining a competitive advantage will require us to make continued capital investments in our resorts. We cannot assure that we will have sufficient resources to make the necessary capital investments to do so, and we cannot assure that we will be able to compete successfully in this market or against such competitors.
20
The high fixed cost structure of mountain resort operations can result in significantly lower margins if revenues decline.
The cost structure of our mountain resort operations has a significant fixed component with variable expenses including, but not limited to, Forest Service fees, other resort related fees, credit card fees, retail/rental cost of sales and labor, ski school labor and dining operations. Any material declines in the economy, elevated geopolitical uncertainties and/or significant changes in historical snowfall patterns, as well as other risk factors discussed herein, could adversely affect revenue. As such, our margins, profits and cash flows may be materially reduced due to declines in revenue given our relatively high fixed cost structure. In addition, increases in wages and other labor costs, energy, healthcare, insurance, transportation and fuel, property taxes, minimum lease payments and other expenses included in our fixed cost structure may also reduce our margin, profits and cash flows.
We may not be able to fund resort capital expenditures.
We regularly expend capital to construct, maintain and renovate our mountain resorts and properties in order to remain competitive, maintain the value and brand standards of our mountain resorts and properties and comply with applicable laws and regulations. We cannot always predict where capital will need to be expended in a given fiscal year and capital expenditures can increase due to forces beyond our control. We anticipate that resort capital expenditures will be approximately $100 million for calendar year 2016, which excludes any capital expenditures for our Epic Discovery program and investments at Wilmot. In addition, we expect to spend approximately $14 million on new summer activities related to our Epic Discovery program at Vail, Breckenridge and Heavenly and approximately $13 million on improvements at Wilmot. We anticipate future annual capital expenditures to be approximately $100 million, in addition to adjustments for inflation, the growth in our resorts and future acquisitions. This amount excludes any investment we plan to make in our Epic Discovery program and summer related projects, some of which are subject to regulatory approval. Our ability to fund capital expenditures will depend on our ability to generate sufficient cash flow from operations and/or to borrow from third parties in the debt or equity markets. We cannot provide assurances that our operations will be able to generate sufficient cash flow to fund such costs, or that we will be able to obtain sufficient financing on adequate terms, or at all. Our ability to generate cash flow and to obtain third-party financing will depend upon many factors, including:
|
•
|
our future operating performance;
|
|
•
|
general economic conditions and economic conditions affecting the resort industry, the ski industry and the capital markets;
|
|
•
|
competition; and
|
|
•
|
legislative and regulatory matters affecting our operations and business;
|
Any inability to generate sufficient cash flows from operations or to obtain adequate third-party financing could cause us to delay or abandon certain projects and/or plans.
21
We rely on government permits and landlord approvals.
Our resort operations require permits and approvals from certain federal, state, local and foreign authorities, including the Forest Service, U.S. Army Corps of Engineers, NPS and the OEH, an agency of the New South Wales government. Virtually all of our ski trails and related activities, including our current and proposed comprehensive summer activities plan, at Vail Mountain, Breckenridge, Keystone, Heavenly, Kirkwood and a majority of Beaver Creek are located on National Forest land. The Forest Service has granted us permits to use these lands, but maintains the right to review and approve many operational matters, as well as the location, design and construction of improvements in these areas. Currently, our permits expire December 31, 2029 for Breckenridge; December 1, 2031 for Vail Mountain; December 31, 2032 for Keystone; November 8, 2039 for Beaver Creek; May 1, 2042 for Heavenly; and, March 1, 2052 for Kirkwood. The Forest Service can terminate or amend these permits if, in its opinion, such termination is required in the public interest. A termination or amendment of any of our permits could have a materially adverse effect on our business and operations. In order to undertake improvements and new development, we must apply for permits and other approvals. These efforts, if unsuccessful, could impact our expansion efforts. Furthermore, Congress may materially increase the fees we pay to the Forest Service for use of these National Forest lands. Additionally, our operations at our Northstar and Park City resorts are conducted pursuant to long-term leases with third parties who require us to operate the resorts in accordance with the terms of the leases and seek certain approvals from the respective landlords for improvements made to the resorts. The initial lease term for Northstar with affiliates of CNL Lifestyle Properties, Inc. expires in January 2027 and allows for three 10-year renewal options. We entered into a transaction agreement, master lease agreement and ancillary transaction documents with affiliate companies of Talisker Corporation (“Talisker”), and the initial lease term for our Park City resort with Talisker expires in May 2063 and allows for six 50-year renewal options. We have a lease and a license for Perisher within the Kosciusko National Park which expires in June 2048, with an option to renew for an additional period of 20 years. Perisher relies on a suite of planning approvals (and existing use rights) granted under the Australian EPA Act to operate the resort. Strategic planning documents have been adopted to provide a framework for the assessment and approval of future development at the resort. Perisher also holds a number of environmental approvals to regulate its operations, including an environment protection license and a suite of dangerous goods licenses related to the storage of diesel, heating oil and propane in storage tanks across the resort. Additionally, GTLC and Flagg Ranch operate under concessionaire agreements with the NPS that expire on December 31, 2021 and October 31, 2026, respectively. There is no guarantee that at the end of the initial lease/license or agreements under which we operate our resorts we will renew or, if desired, be able to negotiate new terms that are favorable to us. Additionally, our resorts that operate on privately-owned land are subject to local land use regulation and oversight by county and/or town government and may not be able to obtain the requisite approvals needed for resort improvements or expansions. Failure to comply with the provisions, obligations and terms (including renewal requirements and deadlines) of our material permits and leases could adversely impact our operating results.
A disruption in our water supply would impact our snowmaking capabilities and operations
.
Our operations are heavily dependent upon our access to adequate supplies of water for snowmaking and to otherwise conduct our operations. Our mountain resorts are subject to federal, state, provincial and local laws and regulations relating to water rights. Changes in these laws and regulations may adversely affect our operations. For example, the Forest Service could develop new SUP language that could potentially affect our water rights, and recently the Forest Service finalized a new national water clause for all ski area SUPs. Although the recent change will not require any private water rights to be transferred to the Forest Service, future modified language could have an effect on our water rights. In addition, drought conditions may adversely affect our water supply. A significant change in law or policy or any other interference with our access to adequate supplies of water to support our current operations or an expansion of our operations would have a material adverse effect on our business, prospects, financial position, results of operations and cash flows.
22
We are subject to extensive environmental and health and safety laws and regulations in the ordinary course of business.
Our operations are subject to a variety of federal, state, local and foreign environmental laws and regulations including those relating to air emissions, discharges to water, storage, treatment and disposal of wastes and other liquids, land use, remediation of contaminated sites, protection of natural resources such as wetlands and sustainable visitor or tourist use and enjoyment. For example, future expansions of certain of our mountain facilities must comply with applicable forest plans approved under the National Forest Management Act, federal, state and foreign wildlife protection laws or local zoning requirements. In addition, most projects to improve, upgrade or expand our ski areas are subject to environmental review under the NEPA, the CEQA, the Australian NPW Act or the Australian EPA Act, as applicable. The NEPA and CEQA require the Forest Service, or other governmental entities, to study any proposal for potential environmental impacts and include various alternatives in its analysis. Our ski area improvement proposals may not be approved or may be approved with modifications that substantially increase the cost or decrease the desirability of implementing the project. Our facilities are subject to risks associated with mold and other indoor building contaminants. From time to time our operations are subject to inspections by environmental regulators or other regulatory agencies. We are also subject to worker health and safety requirements. We believe our operations are in substantial compliance with applicable material environmental, health and safety requirements. However, our efforts to comply do not eliminate the risk that we may be held liable, incur fines or be subject to claims for damages, and that the amount of any liability, fines, damages or remediation costs may be material for, among other things, the presence or release of regulated materials at, on or emanating from properties we now or formerly owned or operated, newly discovered environmental impacts or contamination at or from any of our properties, or changes in environmental laws and regulations or their enforcement.
We rely on information technology to operate our businesses and maintain our competitiveness, and any failure to adapt to technological developments or industry trends could harm our business.
We depend on the use of sophisticated information technology and systems for central reservations, point of sale, marketing, procurement, administration and technologies we make available to our guests. We must continuously improve and upgrade our systems and infrastructure to offer enhanced products, services, features and functionality, while maintaining the reliability and integrity of our systems and infrastructure. Our future success also depends on our ability to adapt our infrastructure to meet rapidly evolving consumer trends and demands and to respond to competitive service and product offerings.
In addition, we may not be able to maintain our existing systems or replace or introduce new technologies and systems as quickly as we would like or in a cost-effective manner. Delays or difficulties implementing new or enhanced systems may keep us from achieving the desired results in a timely manner, to the extent anticipated, or at all. Any interruptions, outages or delays in our systems, or deterioration in their performance, could impair our ability to process transactions and could decrease the quality of service we offer to our guests. Also, we may be unable to devote financial resources to new technologies and systems in the future. If any of these events occur, our business and financial performance could suffer.
Failure to maintain the integrity of internal or guest data could result in damages to our reputation and/or subject us to costs, fines or lawsuits.
We collect and retain guest data, including credit card numbers and other personally identifiable information, for various business purposes, including transactional marketing and promotional purposes. We also maintain personally identifiable information about our employees. The integrity and privacy of our guest and employee information is very important to us, and our guests and employees have a high expectation that we will adequately protect their personal information. The regulatory environment, as well as the requirements imposed on us by the payment card industry, governing information, security and privacy laws is increasingly demanding and continue to evolve and on occasion may be inconsistent from one jurisdiction to another. Maintaining compliance with applicable security and privacy regulations may increase our operating costs and/or impact our ability to market our products, properties and services to our guests.
Despite our efforts, information networks and systems are vulnerable to service interruptions or to security breaches from inadvertent or intentional actions by our employees or vendors, or from attacks by malicious third parties. In recent years, there has been a rise in the number of sophisticated cyber-attacks on network and information systems, and as a result, the risks associated with such an event continue to increase. We have experienced, and expect to continue to be subject to, cybersecurity threats and incidents, none of which has been material to us to date. Although we have taken, and continue to take steps to address these concerns by implementing network security and internal controls, there can be no assurance that a system interruption, security breach or unauthorized access will not occur. Any such interruption, breach or unauthorized access to our network or systems could adversely affect our business operations and/or result in the loss of critical or sensitive confidential information or intellectual property, and could result in financial, legal, business and reputational harm to us.
We are subject to litigation in the ordinary course of business.
We are, from time to time, subject to various asserted or unasserted legal proceedings and claims. Any such claims, regardless of merit, could be time consuming and expensive to defend and could divert management’s attention and resources. While we believe we have adequate insurance coverage and/or accrue for loss contingencies for all known matters that are probable and can be reasonably estimated, we cannot assure you that the outcome of all current or future litigation will not have a material adverse effect on us and our results of operations.
23
Our business depends on the quality and reputation of our brands, and any deterioration in the quality or reputation of these brands could have an adverse impact on our business.
A negative public image or other adverse events could affect the reputation of one or more of our mountain resorts, other destination resorts, hotel properties and other businesses or more generally impact the reputation of our brands. If the reputation or perceived quality of our brands declines, our market share, reputation, business, financial condition or results of operations could be adversely impacted. Additionally, our intellectual property, including our trademarks, domain names and other proprietary rights, constitutes a significant part of our value. Any misappropriation, infringement or violation of our intellectual property rights could also diminish the value of our brands and their market acceptance, competitive advantages or goodwill, which could adversely affect our business.
There is a risk of accidents occurring at our mountain resorts or competing mountain resorts which may reduce visitation and negatively impact our operations.
Our ability to attract and retain guests depends, in part, upon the external perceptions of the Company, the quality and safety of our resorts, services and activities, including summer activities, and our corporate and management integrity. While we maintain and promote an on-mountain safety program, there are inherent risks associated with our resort activities. An accident or an injury at any of our resorts or at resorts operated by competitors, particularly an accident or injury involving the safety of guests and employees that receives media attention, could negatively impact our brand or reputation, cause loss of consumer confidence in us, reduce visitation at our resorts, and negatively impact our results of operations. The considerable expansion in the use of social media over recent years has compounded the impact of negative publicity. If any such incident occurs during a time of high seasonal demand, the effect could disproportionately impact our results of operations.
We depend on a seasonal workforce.
Our mountain and lodging operations are highly dependent on a large seasonal workforce. We recruit year-round to fill thousands of seasonal staffing needs each season and work to manage seasonal wages and the timing of the hiring process to ensure the appropriate workforce is in place. We cannot guarantee that material increases in the cost of securing our seasonal workforce will not be necessary in the future. Furthermore, we cannot guarantee that we will be able to recruit and hire adequate seasonal personnel as the business requires. Immigration law reform could also impact our workforce because we recruit and hire foreign nationals as part of our seasonal workforce. Increased seasonal wages or an inadequate workforce could have an adverse impact on our results of operations.
We are subject to risks associated with our workforce, including increased labor costs.
We are subject to various federal, state and foreign laws governing matters such as minimum wage requirements, overtime compensation and other working conditions, work authorization requirements, discrimination and family and medical leave. Labor costs and labor-related benefits are primary components in the cost of our operations. Labor shortages, increased employee turnover and health care mandates could also increase our labor costs. As minimum wage rates increase, including further potential federal and state legislative changes to the minimum wage rate (for example, the recent California legislation increasing minimum wage), we may need to increase not only the wages of our minimum wage employees but also the wages paid to employees at wage rates that are above the minimum wage. Additionally, the Department of Labor recently released updated rules on overtime for salaried employees, and we may incur additional costs to comply with the revised rules. From time to time, we have also experienced non-union employees attempting to unionize. While only a very small portion of our employees are unionized at present, we may experience additional union activity in the future, which could lead to disruptions in our business, increases in our operating costs and/or constraints on our operating flexibility. These potential labor impacts could adversely impact our results of operations.
If we do not retain our key personnel, our business may suffer.
The success of our business is heavily dependent on the leadership of key management personnel, including our senior executive officers. If any of these persons were to leave, it could be difficult to replace them, and our business could be harmed. We do not maintain “key-man” life insurance on any of our employees.
Our acquisitions, including Whistler Blackcomb or future acquisitions, might not be successful.
We have acquired certain mountain resorts, hotel properties and other businesses complementary to our own, as well as developable land in proximity to our resorts. Acquisitions are complex to evaluate, execute and integrate. We cannot assure you that we will be able to accurately evaluate or successfully integrate and manage acquired mountain resorts, properties and businesses and increase our profits from these operations. We continually evaluate potential acquisitions both domestically and internationally and intend to actively pursue acquisition opportunities, some of which could be significant. As a result, we face various risks from acquisitions, including:
|
•
|
our evaluation of the synergies and/or long-term benefits of an acquired business;
|
|
•
|
our inability to integrate acquired businesses into our operations as planned;
|
|
•
|
diversion of our management’s attention;
|
|
•
|
increased expenditures (including legal, accounting and due diligence expenses, higher administrative costs to support the acquired entities, information technology, personnel and other integration expenses);
|
|
•
|
potential increased debt leverage;
|
24
|
•
|
potential issuance of dilutive equity securities;
|
|
•
|
litigation arising from acquisition activity;
|
|
•
|
potential goodwill or other intangible asset impairments; and
|
|
•
|
unanticipated problems or liabilities.
|
In addition, we run the risk that any new acquisitions may fail to perform in accordance with expectations, and that estimates of the costs of improvements and integration for such properties may prove inaccurate.
Our pending acquisition of Whistler Blackcomb may not be consummated, and failure to complete the Whistler Blackcomb acquisition could impact our stock price and financial results.
On August 5, 2016, we entered into an arrangement agreement to acquire Whistler Blackcomb. Completion of this acquisition is subject to certain closing conditions, including the approval by Whistler Blackcomb shareholders and the British Columbia Supreme Court, regulatory approvals, including approval under the Competition Act (Canada) and the Investment Canada Act, and other customary closing conditions, including the absence of a material adverse effect with respect to either Whistler Blackcomb or the Company. The arrangement agreement provides for customary representations, warranties and covenants, and provides for the payment of fees upon the termination of the agreement under certain circumstances, including Whistler Blackcomb obtaining a superior proposal and failure to obtain certain regulatory approvals.
We expect the transaction to close in the fall of calendar year 2016. There can be no assurance, however, that all closing conditions for the acquisition will be satisfied and, if they are satisfied, that they will be satisfied in time for the closing to occur during the period noted. We intend to finance the cash portion of the consideration for the acquisition with a combination of cash and cash equivalents on hand, available revolving borrowing capacity under our Seventh Amended and Restated Credit Agreement (the “Credit Agreement”), as well as an incremental term loan facility to be incurred through an amendment to the Credit Agreement. We have received an executed commitment letter whereas certain lenders have committed to provide a new $360 million incremental term loan. We believe the net proceeds of the new incremental term loan, our available revolving borrowing capacity under our Credit Agreement and cash on hand will be sufficient to fund the cash portion of the consideration. However, our ability to obtain financing under the financing commitment and the new incremental term loan is subject to certain conditions that may not be satisfied at the closing of the acquisition.
If the acquisition of Whistler Blackcomb is not completed or our financing for the acquisition becomes unavailable, our ongoing business and financial results may be adversely affected and we will be subject to a number of risks, including the following:
|
•
|
depending on the reasons for the failure to complete the Whistler Blackcomb acquisition we could be liable to Whistler Blackcomb for termination fees or other damages in connection with the termination or breach of the arrangement agreement;
|
|
•
|
we have dedicated and we expect we will continue to commit significant time and resources, financial and otherwise, in planning for the acquisition and the associated integration;
|
|
•
|
we are responsible for certain transaction costs relating to the Whistler Blackcomb acquisition, whether or not the acquisition is completed;
|
|
•
|
while the arrangement agreement is in effect prior to closing the transaction, we are subject to certain restrictions on the conduct of our business, which may adversely affect our ability to execute certain of our business strategies;
|
In addition, if the Whistler Blackcomb acquisition is not completed, we may experience negative reactions from the financial markets and from our guests and employees. If the acquisition is not completed, these risks may materialize and may adversely affect our business, results of operations, cash flows, as well as the price of our common stock.
We may not realize all the anticipated financial benefits from Park City.
In May 2013, we entered into a long-term lease to assume the resort operations of Canyons, including its ski area and related amenities, and the ski terrain of Park City Mountain Resort (excluding the base area), which was subject to litigation. In September 2014, we acquired the resort operations of Park City Mountain Resort (including the base area) and entered into ancillary transaction documents that provided for, among other things, the settlement of the litigation related to the ski terrain of Park City Mountain Resort. Following the acquisition, the Park City Mountain Resort ski terrain, which was previously subject to litigation, was incorporated into the Canyons lease under the existing terms of the lease. The Canyons lease has an initial term of 50 years with six 50-year renewal options and annual payments of $25 million. The lease payment is subject to annual increases based upon the increase in the CPI index less 1%, with a floor of 2% per year. As lease payments increase annually, we may be adversely impacted to the extent these increases are not offset by increases in cash flow generated from operations. We also anticipate realizing significant tax benefits which are subject to examination by the Internal Revenue Service. Additionally, we record liabilities for uncertain tax positions that may be inadequate.
25
In addition, the Canyons lease requires us to pay participating contingent payments to Talisker equal to 42% of the amount by which EBITDA for the resort operations of Park City exceeds $35 million, which increases annually based upon the increase in the CPI index plus a 10% adjustment for any capital improvements or investments made under the lease by us, including the purchase price for Park City Mountain Resort. We are required to measure at each reporting period the fair value of the future estimated participating contingent payments and record the change in fair value in our income from operations. This change in fair value of participating contingent payments could provide significant fluctuations in our operating results in a particular period.
Our international operations subject us to additional risks.
As a result of the acquisition of Perisher, the pending acquisition of Whistler Blackcomb and potential future acquisitions, we have larger operations outside of the United States. We are accordingly subject to a number of risks relating to doing business internationally, any of which could significantly harm our business. These risks include:
|
•
|
restriction on the transfer of funds to and from foreign countries, including potentially negative tax consequences;
|
|
•
|
currency exchange rates;
|
|
•
|
increased exposure to general market and economic conditions outside the United States;
|
|
•
|
additional political risk;
|
|
•
|
compliance with international laws and regulations (including anti-corruption regulations, such as the U.S. Foreign Corrupt Practices Act);
|
|
•
|
data security; and
|
|
•
|
foreign tax treaties and policies.
|
Exchange rate fluctuations could result in significant foreign currency gains and losses and affect our business results.
In June 2015, we acquired Perisher in Australia. We are exposed to currency translation risk because the results of Perisher are reported in local currency, which we then translate to U.S. dollars for inclusion in our consolidated financial statements. As a result, changes between the foreign exchange rates, in particular the Australian dollar and the U.S. dollar, affect the amounts we record for our foreign assets, liabilities, revenues and expenses, and could have a negative effect on our financial results. We currently do not enter into hedging arrangements to minimize the impact of foreign currency fluctuations. We expect that our exposure to foreign currency exchange rate fluctuations will increase as Perisher grows and with the pending acquisition of Whistler Blackcomb.
We are subject to accounting regulations and use certain accounting estimates and judgments that may differ significantly from actual results.
Implementation of existing and future legislation, rulings, standards and interpretations from the Financial Accounting Standards Board (“FASB”) or other regulatory bodies could affect the presentation of our financial statements and related disclosures. Future regulatory requirements could significantly change our current accounting practices and disclosures. Such changes in the presentation of our financial statements and related disclosures could change an investor’s interpretation or perception of our financial position and results of operations.
We use many methods, estimates and judgments in applying our accounting policies (see “Critical Accounting Policies” in Item 7 of this Form 10-K). Such methods, estimates and judgments are, by their nature, subject to substantial risks, uncertainties and assumptions, and factors may arise over time that lead us to change our methods, estimates and judgments. Changes in those methods, estimates and judgments could significantly affect our results of operations.
Risks Relating to Our Capital Structure
Our stock price is highly volatile.
The market price of our stock is highly volatile and subject to wide fluctuations in response to factors such as the following, some of which are beyond our control:
|
•
|
quarterly variations in our operating results;
|
|
•
|
operating results that vary from the expectations of securities analysts and investors;
|
|
•
|
change in valuations, including our real estate held for sale;
|
|
•
|
changes in the overall travel, gaming, hospitality and leisure industries;
|
|
•
|
changes in expectations as to our future financial performance, including financial estimates by securities analysts and investors or such guidance provided by us;
|
|
•
|
announcements by us or companies in the travel, gaming, hospitality and leisure industries of significant contracts, acquisitions, dispositions, strategic partnerships, joint ventures, capital commitments, plans, prospects, service offerings or operating results;
|
|
•
|
additions or departures of key personnel;
|
|
•
|
future sales of our securities;
|
|
•
|
trading and volume fluctuations;
|
|
•
|
other risk factors as discussed above; and
|
26
|
•
|
other unforeseen events.
|
Stock markets in the U.S. have often experienced extreme price and volume fluctuations. Market fluctuations, as well as general political and economic conditions including acts of terrorism, military conflicts, prolonged economic uncertainty, a recession or interest rate or currency rate fluctuations, could adversely affect the market price of our stock.
We cannot provide assurance that we will continue to increase dividend payments and/or pay dividends.
In fiscal 2011, our Board of Directors approved the commencement of a regular quarterly cash dividend on our common stock at an annual rate of $0.60 per share, subject to quarterly declaration. Since the initial commencement of a regular quarterly cash dividend, our Board of Directors has annually approved an increase to our cash dividend on our common stock. On March 9, 2016, our Board of Directors approved an increase to our quarterly cash dividend to $0.81 per share, subject to quarterly declaration. This dividend is anticipated to be funded through cash flow from operations, available cash on hand and borrowings under the revolver portion of our Credit Agreement. Although we anticipate paying regular quarterly dividends on our common stock for the foreseeable future, the declaration of dividends is subject to the discretion of our Board of Directors, and is limited by applicable state law concepts of available funds for distribution, as well as contractual restrictions. As a result, the amount, if any, of the dividends to be paid in the future will depend upon a number of factors, including our available cash on hand, anticipated cash needs, overall financial condition, restrictions contained in our senior credit facility, the Seventh Amended and Restated Credit Agreement (“Credit Agreement”), any future contractual restrictions, future prospects for earnings and cash flows, as well as other factors considered relevant by our Board of Directors. In addition, our Board of Directors may also suspend the payment of dividends at any time if it deems such action to be in the best interests of the Company and its stockholders. If we do not pay dividends, the price of our common stock must appreciate for investors to realize a gain on their investment in Vail Resorts, Inc. This appreciation may not occur and our stock may in fact depreciate in value.
Anti-takeover provisions affecting us could prevent or delay a change of control that is beneficial to our stockholders.
Provisions of our certificate of incorporation and bylaws, provisions of our debt instruments and other agreements and provisions of applicable Delaware law and applicable federal and state regulations may discourage, delay or prevent a merger or other change of control that holders of our securities may consider favorable. These provisions could:
|
•
|
delay, defer or prevent a change in control of our Company;
|
|
•
|
discourage bids for our securities at a premium over the market price;
|
|
•
|
adversely affect the market price of, and the voting and other rights of the holders of our securities; or
|
|
•
|
impede the ability of the holders of our securities to change our management.
|
Our indebtedness could adversely affect our financial health and prevent us from fulfilling our obligations.
As of July 31, 2016, we had $702.3 million of outstanding indebtedness. This amount includes $323.1 million for the Canyons Lease obligation. This amount also consists of $240.6 million of borrowings from the term loan facility under our Credit Agreement used to redeem the outstanding aggregate principal amounts of our 6.50% Senior Subordinated Notes due 2019 (“6.50% Notes”) and Industrial Development Bonds in May 2015, as well as $75.0 million borrowings under the revolver portion of our Credit Agreement. Our borrowings under our Credit Agreement are subject to interest rate changes substantially increasing our risk to changes in interest rates. Borrowings under the Credit Agreement, including the term loan facility, currently bear interest at a rate of LIBOR plus 1.125% on an annual basis. Interest rate margins may fluctuate based upon the ratio of our Net Funded Debt to Adjusted EBITDA on a trailing four-quarter basis. We also have, on a cumulative basis, minimum lease payment obligations under operating leases of approximately
$302.4 million
as of July 31, 2016. Our level of indebtedness and minimum lease payment obligations could have important consequences. For example, it could:
|
•
|
make it more difficult for us to satisfy our obligations;
|
|
•
|
increase our vulnerability to general adverse economic and industry conditions;
|
|
•
|
require us to dedicate a substantial portion of our cash flow from operations to payments on our indebtedness, including the annual payments under the Canyons lease, thereby reducing the availability of our cash flow to fund working capital, capital expenditures, real estate developments, marketing efforts and other general corporate purposes;
|
|
•
|
limit our flexibility in planning for, or reacting to, changes in our business and the industry in which we operate;
|
|
•
|
place us at a competitive disadvantage compared to our competitors that have less debt; and
|
|
•
|
limit our ability to borrow additional funds.
|
We may be able to incur substantial additional indebtedness in the future. The terms of our senior credit facility do not fully prohibit us from doing so. If we incur additional debt, the related risks that we face could intensify.
27
There are restrictions imposed by the terms of our indebtedness.
The operating and financial restrictions and covenants in our senior credit facility may adversely affect our ability to finance future operations or capital needs or to engage in other business activities and strategic initiatives that may be in our long-term best interests. For example, the senior credit facility contains a number of restrictive covenants that impose significant operating and financial restrictions on us, including restrictions on our ability to, among other things:
|
•
|
incur additional debt or sell preferred stock;
|
|
•
|
pay dividends, repurchase our stock and make other restricted payments;
|
|
•
|
create liens;
|
|
•
|
make certain types of investments;
|
|
•
|
engage in sales of assets and subsidiary stock;
|
|
•
|
enter into sales-leaseback transactions;
|
|
•
|
enter into transactions with affiliates;
|
|
•
|
issue guarantees of debt;
|
|
•
|
transfer all or substantially all of our assets or enter into merger or consolidation transactions; and
|
|
•
|
make capital expenditures.
|
In addition, there can be no assurance that we will meet the financial covenants contained in our senior credit facility. If we breach any of these restrictions or covenants, or suffer a material adverse change which restricts our borrowing ability under our senior credit facility, we would not be able to borrow funds thereunder without a waiver. Any inability to borrow could have an adverse effect on our business, financial condition and results of operations. In addition, a breach, if uncured, could cause a default under the senior credit facility and our other debt. Our indebtedness may then become immediately due and payable. We may not have or be able to obtain sufficient funds to make these accelerated payments.
We cannot guarantee that we will repurchase our common stock pursuant to our share repurchase program or that our share repurchase program will enhance long-term stockholder value. Share repurchases could also increase the volatility of the price of our common stock and could diminish our cash reserves
.
In March 2006, our Board of Directors approved a share repurchase program, authorizing the Company to repurchase up to 3,000,000 shares of common stock. In July 2008, the Board of Directors increased the authorization by an additional 3,000,000 shares, and in December 2015, the Board increased the authorization by an additional 1,500,000 shares for a total authorization to repurchase shares of up to 7,500,000 shares. Since inception of its share repurchase program through July 31, 2016, the Company has repurchased 5,434,977 shares at a cost of approximately $247.0 million. As of July 31, 2016, 2,065,023 shares remained available to repurchase under the existing share repurchase program which has no expiration date.
Although our Board of Directors has approved a share repurchase program, the share repurchase program does not obligate us to repurchase any specific dollar amount or to acquire any specific number of shares. The timing and amount of repurchases, if any, will depend upon several factors, including market and business conditions, the trading price of our common stock and the nature of other investment opportunities. The repurchase program may be limited, suspended or discontinued at any time without prior notice. In addition, repurchases of our common stock pursuant to our share repurchase program could cause our stock price to be higher than it would be in the absence of such a program and could potentially reduce the market liquidity for our stock. Additionally, our share repurchase program could diminish our cash reserves, which may impact our ability to finance future growth and to pursue possible future strategic opportunities and acquisitions. There can be no assurance that any share repurchases will enhance stockholder value because the market price of our common stock may decline below levels at which we repurchased shares of stock. Although our share repurchase program is intended to enhance long-term stockholder value, there is no assurance that it will do so and short-term stock price fluctuations could reduce the program's effectiveness.
|
ITEM 1B.
|
UNRESOLVED STAFF COMMENTS.
|
None.
28
|
ITEM 2.
|
PROPERTIES.
|
The following table sets forth the principal properties that we own or lease for use in our operations at fiscal year-end:
|
Location
|
Ownership
|
Use
|
|
Afton Alps, MN
|
Owned
|
Ski resort operations, including ski lifts, ski trails, golf course, clubhouse, buildings, commercial space and other improvements
|
|
Arrowhead Mountain, CO
|
Owned
|
Ski resort operations, including ski lifts, ski trails, buildings and other improvements, property management and commercial space
|
|
BC Housing Riveredge, CO
|
26% Owned
|
Employee housing facilities
|
|
Bachelor Gulch Village, CO
|
Owned
|
Ski resort operations, including ski lifts, ski trails, buildings and other improvements, property management and commercial space
|
|
Beaver Creek Resort, CO
|
Owned
|
Ski resort operations, including ski lifts, ski trails, buildings and other improvements, property management, commercial space and real estate held for sale or development
|
|
Beaver Creek Mountain, CO (3,849
acres)
|
SUP
|
Ski trails, ski lifts, buildings and other improvements
|
|
Beaver Creek Mountain Resort, CO
|
Owned
|
Golf course, clubhouse, commercial space and residential condominium units
|
|
Breckenridge Ski Resort, CO
|
Owned
|
Ski resort operations, including ski lifts, ski trails, buildings and other improvements, property management, commercial space and real estate held for sale or development
|
|
Breckenridge Mountain, CO (5,702
acres)
|
SUP
|
Ski trails, ski lifts, buildings and other improvements
|
|
Breckenridge Terrace, CO
|
50% Owned
|
Employee housing facilities
|
|
Broomfield, CO
|
Leased
|
Corporate offices
|
|
Colter Bay Village, WY
|
Concessionaire contract
|
Lodging and dining facilities
|
|
Eagle-Vail, CO
|
Owned
|
Warehouse facility
|
|
Edwards, CO
|
Leased
|
Administrative offices
|
|
DoubleTree by Hilton Breckenridge, CO
|
Owned
|
Lodging, dining and conference facilities
|
|
Headwaters Lodge & Cabins, WY
|
Concessionaire contract
|
Lodging and dining facilities
|
|
Heavenly Mountain Resort, CA & NV
|
Owned
|
Ski resort operations, including ski lifts, ski trails, buildings and other improvements and commercial space
|
|
Heavenly Mountain, CA & NV
(7,050 acres)
|
SUP
|
Ski trails, ski lifts, buildings and other improvements
|
|
Inn at Keystone, CO
|
Owned
|
Lodging, dining, parking and conference facilities
|
|
Jackson Hole Golf & Tennis Club,
WY
|
Owned
|
Golf course, clubhouse, tennis facilities, dining and real estate held for sale or development
|
|
Jackson Lake Lodge, WY
|
Concessionaire contract
|
Lodging, dining and conference facilities
|
|
Jenny Lake Lodge, WY
|
Concessionaire contract
|
Lodging and dining facilities
|
|
Keystone Conference Center, CO
|
Owned
|
Conference facility
|
|
Keystone Lodge, CO
|
Owned
|
Lodging, spa, dining and conference facilities
|
|
Keystone Resort, CO
|
Owned
|
Ski resort operations, including ski lifts, ski trails, buildings and other improvements, commercial space, property management, dining and real estate held for sale or development
|
|
Keystone Mountain, CO (8,376 acres)
|
SUP
|
Ski trails, ski lifts, buildings and other improvements
|
29
|
Location
|
Ownership
|
Use
|
|
Keystone Ranch, CO
|
Owned
|
Golf course, clubhouse and dining facilities
|
|
Kirkwood Mountain Resort, CA
|
Owned
|
Ski resort operations, including ski lifts, ski trails, buildings and other improvements, property management and commercial space
|
|
Kirkwood Mountain, CA (2,330 acres)
|
SUP
|
Ski trails, ski lifts, buildings and other improvements
|
|
Mt. Brighton, MI
|
Owned
|
Ski resort operations, including ski lifts, ski trails, golf course, clubhouse, buildings, commercial space and other improvements
|
|
Northstar California Resort, CA**
(7,200 acres)
|
Leased**
|
Ski trails, ski lifts, golf course, commercial space, dining facilities, buildings and other improvements
|
|
Northstar Village, CA**
|
Leased**
|
Commercial space, ski resort operations, dining facilities, buildings, property management and other improvements
|
|
Park City Mountain, UT
(8,900 acres)
|
Leased*
|
Ski resort operations including ski lifts, ski trails, buildings, commercial space, dining facilities, property management, conference facilities and other improvements (including areas previously referred to as Canyons Resort, UT)
|
|
Park City Mountain, UT
(220 acres)
|
Owned
|
Ski trails, ski lifts, dining facilities, commercial space, buildings, real estate held for sale or development and other improvements
|
|
Perisher Ski Resort, NSW, Australia
(3,335 acres)
|
Owned/Leased/Licensed***
|
Ski trails, ski lifts, dining facilities, commercial space, railway, buildings, lodging, conference facilities and other improvements
|
|
Red Cliffs Lodge, CA
|
Leased
|
Dining facilities, ski resort operations, commercial space, administrative offices
|
|
Red Sky Ranch, CO
|
Owned
|
Golf courses, clubhouses, dining facilities and real estate held for sale or development
|
|
River Course at Keystone, CO
|
Owned
|
Golf course and clubhouse
|
|
Seasons at Avon, CO
|
Leased/50% Owned
|
Administrative offices, commercial space
|
|
SSI Venture, LLC (“VRR”) Properties; CO, CA, NV, UT & MN
|
Owned/Leased
|
Approximately 180 retail stores (of which 115 stores are currently held under lease) for recreational products, and 4 leased warehouses
|
|
Ski Tip Lodge, CO
|
Owned
|
Lodging and dining facilities
|
|
The Arrabelle at Vail Square, CO
|
Owned
|
Lodging, spa, dining and conference facilities
|
|
The Lodge at Vail, CO
|
Owned
|
Lodging, spa, dining and conference facilities
|
|
The Osprey at Beaver Creek, CO
|
Owned
|
Lodging, dining and conference facilities
|
|
The Tarnes at Beaver Creek, CO
|
31% Owned
|
Employee housing facilities
|
|
Tenderfoot Housing, CO
|
50% Owned
|
Employee housing facilities
|
|
The Pines Lodge at Beaver Creek, CO
|
Owned
|
Lodging, dining and conference facilities
|
|
The Village Hotel, Breckenridge, CO
|
Owned
|
Lodging, dining, conference facilities and commercial space
|
|
Vail Mountain, CO
|
Owned
|
Ski resort operations, including ski lifts, ski trails, buildings and other improvements, property management, commercial space and real estate held for sale or development
|
|
Vail Mountain, CO (12,353 acres)
|
SUP
|
Ski trails, ski lifts, buildings and other improvements
|
|
Wilmot Mountain, WI
|
Owned
|
Ski trails, ski lifts, buildings and other improvements
|
Many of our properties are used across all segments in complementary and interdependent ways.
* The operations of portions of Park City are conducted pursuant to a long-term lease on land and with certain operating assets owned by TCFC LeaseCo, LLC and TCFC PropCo, LLC. The lease provides for the payment of a minimum annual base rent with periodic increases in base rent over the lease term and participating contingent payments of a percentage of the amount by which EBITDA for resort operations exceeds certain thresholds, also subject to periodic increases over the lease term. The initial term of the lease expires in fiscal 2063 and is subject to six 50-year renewal options. Additionally, in connection with the lease, we entered into certain ancillary agreements with third parties, including leases and easements, allowing for various resort operations.
30
** The operations of Northstar are conducted on land and with operating assets owned by affiliates of CNL Lifestyle Properties, Inc. under operating leases which were assumed by us. The leases provide for the payment of a minimum annual base rent with periodic increases in base rent over the lease term. In addition, the leases provide for the payment of percentage rent based on a percentage of gross revenues generated at the property over certain thresholds. The initial term of the leases expires in fiscal 2027, and is subject to three 10-year renewal options.
***The operations of Perisher are conducted pursuant to a long-term lease and license of land and certain improvements owned by the government of New South Wales within Kosciuszko National Park pursuant to the National Parks and Wildlife Act of 1974. The lease and license provide for the payment of a minimum annual base rent with periodic increases in base rent over the term, turnover rent payments of a percentage of certain gross revenue, remittance of park user fees and certain other charges, also subject to periodic increases over the term. The initial term of the lease and license expires in 2048 and is subject to one 20-year renewal option.
|
ITEM 3.
|
LEGAL PROCEEDINGS.
|
In May 2016, Kirkwood received a Notice of Violation (NOV) from the State of California Central Valley Regional Water Quality Control Board regarding the disposition of asphalt grindings used in parking lot surfacing in and around Kirkwood Creek. We are in the information gathering stage and are cooperating with the Central Valley board staff and the California Department of Fish and Wildlife to satisfactorily resolve the matters identified in the NOV. It is anticipated that this process will continue into calendar year 2017.
In the first quarter of calendar year 2014, we received a Compliance Advisory from the Colorado Department of Public Health & Environment (“CDPHE”), advising of potential violations of the Colorado Air Pollution Prevention and Control Act at Breckenridge. We subsequently conducted voluntary self-audits at each of our four Colorado resorts and continue to cooperate with CDPHE after receipt of additional Compliance Advisories for each of the four resorts. The violations include permitting violations that we are working to correct as we discuss a compliance order with CDPHE to settle the violations. It is anticipated that this process will continue into calendar year 2017.
We do not expect the resolution of the above items to have a material impact on our results of operations or cash flows.
We are a party to various lawsuits arising in the ordinary course of business. We believe that we have adequate insurance coverage and/or have accrued for loss contingencies for all known matters and that, although the ultimate outcome of such claims cannot be ascertained, current pending and threatened claims are not expected to have a material, individually and in the aggregate, adverse impact on our financial position, results of operations and cash flows.
|
ITEM 4.
|
MINE SAFETY DISCLOSURES.
|
Not applicable.
31
|
ITEM 5.
|
MARKET FOR REGISTRANT’S COMMON EQUITY, RELATED STOCKHOLDER MATTERS AND ISSUER PURCHASES OF EQUITY SECURITIES.
|
Market Information and Dividend Policy
Our common stock is traded on the New York Stock Exchange under the symbol “MTN.” As of September 21, 2016, 36,179,664 shares of common stock were outstanding, held by approximately 303 holders of record.
The following table sets forth information on the high and low sales prices of our common stock on the New York Stock Exchange and the quarterly cash dividends declared per share of common stock for each quarterly period for the two most recently completed fiscal years.
|
Quarter Ended
|
|
|
Cash
Dividends
Declared
Per Share
|
|||||||||
|
Market Price Per Share
|
||||||||||||
|
High
|
Low
|
|||||||||||
|
Fiscal Year 2016
|
||||||||||||
|
July 31,
|
$
|
145.38
|
|
$
|
124.00
|
|
$
|
0.8100
|
|
|||
|
April 30,
|
$
|
135.98
|
|
$
|
114.86
|
|
$
|
0.8100
|
|
|||
|
January 31,
|
$
|
133.59
|
|
$
|
112.75
|
|
$
|
0.6225
|
|
|||
|
October 31,
|
$
|
116.52
|
|
$
|
100.50
|
|
$
|
0.6225
|
|
|||
|
Fiscal Year 2015
|
||||||||||||
|
July 31,
|
$
|
112.34
|
|
$
|
98.45
|
|
$
|
0.6225
|
|
|||
|
April 30,
|
$
|
108.29
|
|
$
|
84.55
|
|
$
|
0.6225
|
|
|||
|
January 31,
|
$
|
94.16
|
|
$
|
83.72
|
|
$
|
0.4150
|
|
|||
|
October 31,
|
$
|
89.99
|
|
$
|
73.94
|
|
$
|
0.4150
|
|
|||
In fiscal 2011, our Board of Directors approved the commencement of a regular quarterly cash dividend on our common stock at an annual rate of $0.60 per share, subject to quarterly declaration. Since the initial commencement of a regular quarterly cash dividend, our Board of Directors has annually approved an increase to our cash dividend on our common stock and on March 9, 2016, our Board of Directors approved a 30% increase to our quarterly cash dividend to an annual rate of $3.24 per share, subject to quarterly declaration. This dividend is anticipated to be funded through cash flow from operations, available cash on hand and borrowings under the revolver portion of our senior credit facility. Subject to the discretion of our Board of Directors, applicable law and contractual restrictions, we anticipate paying regular quarterly dividends on our common stock for the foreseeable future. The amount, if any, of the dividends to be paid in the future will depend upon our available cash on hand, anticipated cash needs, overall financial condition, restrictions contained in our senior credit facility, future prospects for earnings and cash flows, as well as other factors considered relevant by our Board of Directors.
Repurchase of Equity Securities
The Company did not repurchase any shares of common stock during the fourth quarter of the year ended July 31, 2016 (“Fiscal 2016”). The share repurchase program is conducted under authorizations made from time to time by our Board of Directors. On March 9, 2006, the Company’s Board of Directors approved a share repurchase program, authorizing the Company to repurchase up to 3,000,000 shares of common stock. On July 16, 2008, the Company’s Board of Directors increased the authorization by an additional 3,000,000 shares, and on December 4, 2015, the Company’s Board of Directors increased the authorization by an additional 1,500,000 shares for a total authorization to repurchase shares of up to 7,500,000 shares. Since inception of this stock repurchase program through July 31, 2016, the Company has repurchased 5,434,977 shares at a cost of approximately $247.0 million. As of July 31, 2016, 2,065,023 shares remained available to repurchase under the existing repurchase authorization. Repurchases under these authorizations may be made from time to time at prevailing prices as permitted by applicable laws, and subject to market conditions and other factors. These authorizations have no expiration date.
32
Performance Graph
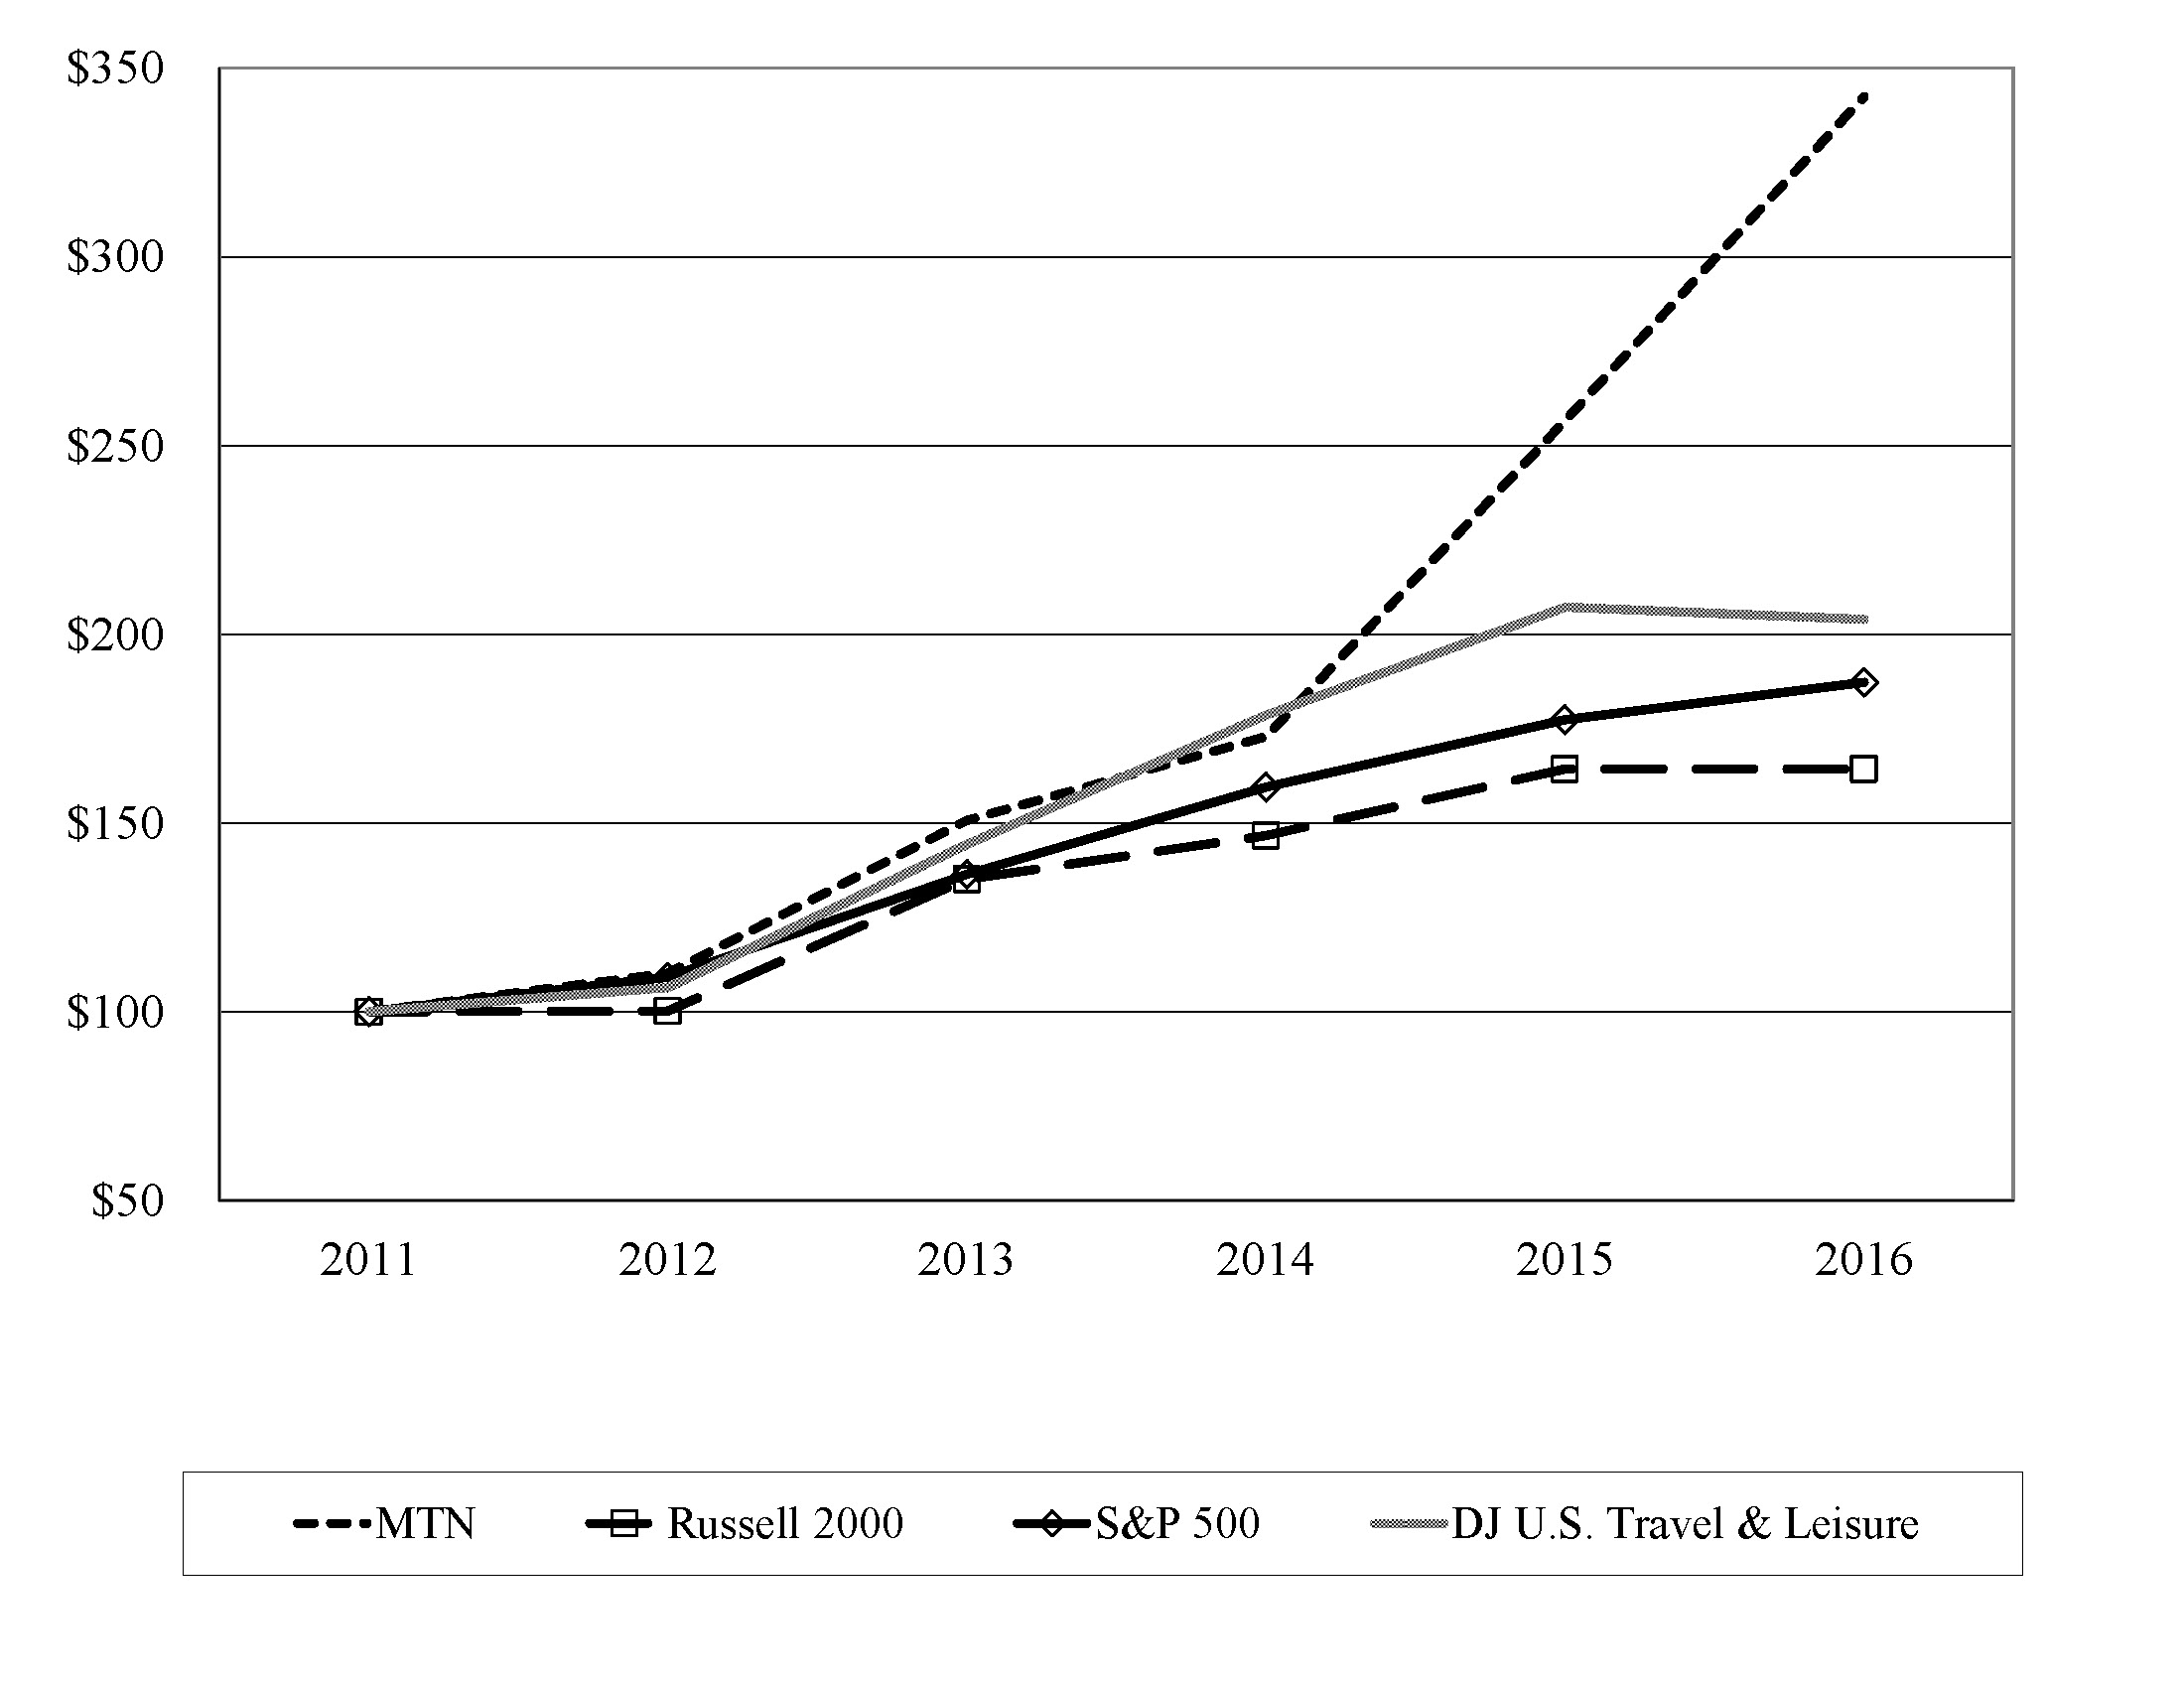
The total return graph above is presented for the period from the end of our 2011 fiscal year through the end of Fiscal 2016. The comparison assumes that $100 was invested at the beginning of the period in our common stock (“MTN”), The Russell 2000, The Standard & Poor’s 500 Stock Index and the Dow Jones U.S. Travel and Leisure Stock Index, with dividends reinvested where applicable. We include the Dow Jones U.S. Travel and Leisure Index as we believe we compete in the travel and leisure industry.
The performance graph is not deemed filed with the Securities and Exchange Commission (“SEC”) and is not to be incorporated by reference into any of our filings under the Securities Act of 1933 or the Securities Exchange Act of 1934, unless such filings specifically incorporate the performance graph by reference therein.
|
ITEM 6.
|
SELECTED FINANCIAL DATA.
|
The following table presents selected historical consolidated financial data derived from our Consolidated Financial Statements for the periods indicated. The financial data for Fiscal 2016, the year ended July 31, 2015 (“Fiscal 2015”) and the year ended July 31, 2014 (“Fiscal 2014”) and as of July 31, 2016 and 2015 should be read in conjunction with the Consolidated Financial Statements, related notes thereto and Management’s Discussion and Analysis of Financial Condition and Results of Operations contained elsewhere in this Form 10-K. The table presented below is unaudited. The data presented below is in thousands, except for diluted net income per share attributable to Vail Resorts, Inc., cash dividends declared per share, effective ticket price (“ETP”), ADR and RevPAR amounts.
33
|
|
Year Ended July 31,
|
||||||||||||||||||
|
|
2016
(1)
|
2015
(1)
|
2014
(1)
|
2013
(1)
|
2012
(1)
|
||||||||||||||
|
Statement of Operations Data:
|
|||||||||||||||||||
|
Net revenue:
|
|||||||||||||||||||
|
Mountain
|
$
|
1,304,604
|
|
$
|
1,104,029
|
|
$
|
963,573
|
|
$
|
867,514
|
|
$
|
766,608
|
|
||||
|
Lodging
|
274,554
|
|
254,553
|
|
242,287
|
|
210,974
|
|
210,623
|
|
|||||||||
|
Real estate
|
22,128
|
|
41,342
|
|
48,786
|
|
42,309
|
|
47,163
|
|
|||||||||
|
Total net revenue
|
$
|
1,601,286
|
|
$
|
1,399,924
|
|
$
|
1,254,646
|
|
$
|
1,120,797
|
|
$
|
1,024,394
|
|
||||
|
Segment operating expense:
|
|||||||||||||||||||
|
Mountain
|
881,472
|
|
777,147
|
|
712,785
|
|
639,706
|
|
568,578
|
|
|||||||||
|
Lodging
|
246,385
|
|
232,877
|
|
225,563
|
|
198,813
|
|
204,270
|
|
|||||||||
|
Real estate
|
24,639
|
|
48,408
|
|
55,826
|
|
58,090
|
|
63,170
|
|
|||||||||
|
Total segment operating expense
|
$
|
1,152,496
|
|
$
|
1,058,432
|
|
$
|
994,174
|
|
$
|
896,609
|
|
$
|
836,018
|
|
||||
|
Depreciation and amortization
|
$
|
(161,488
|
)
|
$
|
(149,123
|
)
|
$
|
(140,601
|
)
|
$
|
(132,688
|
)
|
$
|
(127,581
|
)
|
||||
|
Gain on sale of real property
|
$
|
5,295
|
|
$
|
151
|
|
$
|
—
|
|
$
|
6,675
|
|
$
|
—
|
|
||||
|
Gain on litigation settlement
|
$
|
—
|
|
$
|
16,400
|
|
$
|
—
|
|
$
|
—
|
|
$
|
—
|
|
||||
|
Change in fair value of contingent consideration
|
$
|
(4,200
|
)
|
$
|
3,650
|
|
$
|
(1,400
|
)
|
$
|
—
|
|
$
|
—
|
|
||||
|
Mountain equity investment income, net
|
$
|
1,283
|
|
$
|
822
|
|
$
|
1,262
|
|
$
|
891
|
|
$
|
878
|
|
||||
|
Interest expense, net
|
$
|
(42,366
|
)
|
$
|
(51,241
|
)
|
$
|
(63,997
|
)
|
$
|
(38,966
|
)
|
$
|
(33,586
|
)
|
||||
|
Loss on extinguishment of debt
|
$
|
—
|
|
$
|
(11,012
|
)
|
$
|
(10,831
|
)
|
$
|
—
|
|
$
|
—
|
|
||||
|
Income before provision for income taxes
|
$
|
242,619
|
|
$
|
149,328
|
|
$
|
44,072
|
|
$
|
59,229
|
|
$
|
27,092
|
|
||||
|
Net income
|
$
|
149,454
|
|
$
|
114,610
|
|
$
|
28,206
|
|
$
|
37,610
|
|
$
|
16,391
|
|
||||
|
Net loss attributable to noncontrolling interests
|
300
|
|
144
|
|
272
|
|
133
|
|
62
|
|
|||||||||
|
Net income attributable to Vail Resorts, Inc.
|
$
|
149,754
|
|
$
|
114,754
|
|
$
|
28,478
|
|
$
|
37,743
|
|
$
|
16,453
|
|
||||
|
Diluted net income per share attributable to Vail Resorts, Inc.
|
$
|
4.01
|
|
$
|
3.07
|
|
$
|
0.77
|
|
$
|
1.03
|
|
$
|
0.45
|
|
||||
|
Cash dividends declared per share
|
$
|
2.865
|
|
$
|
2.075
|
|
$
|
1.245
|
|
$
|
0.790
|
|
$
|
0.675
|
|
||||
|
Other Data:
|
|||||||||||||||||||
|
Mountain
|
|||||||||||||||||||
|
Skier visits
(2)
|
10,032
|
|
8,466
|
|
7,688
|
|
6,977
|
|
6,144
|
|
|||||||||
|
ETP
(3)
|
$
|
65.59
|
|
$
|
63.37
|
|
$
|
58.18
|
|
$
|
56.02
|
|
$
|
55.75
|
|
||||
|
Lodging
|
|||||||||||||||||||
|
ADR
(4)
|
$
|
280.38
|
|
$
|
270.84
|
|
$
|
257.14
|
|
$
|
253.91
|
|
$
|
255.21
|
|
||||
|
RevPAR
(5)
|
$
|
122.61
|
|
$
|
112.67
|
|
$
|
100.57
|
|
$
|
91.76
|
|
$
|
88.68
|
|
||||
|
Real Estate
|
|||||||||||||||||||
|
Real estate held for sale and investment
(6)
|
$
|
111,088
|
|
$
|
129,825
|
|
$
|
157,858
|
|
$
|
195,230
|
|
$
|
237,668
|
|
||||
|
Other Balance Sheet Data
|
|||||||||||||||||||
|
Cash and cash equivalents
(7)
|
$
|
67,897
|
|
$
|
35,459
|
|
$
|
44,406
|
|
$
|
138,604
|
|
$
|
46,053
|
|
||||
|
Total assets
(8) (9)
|
$
|
2,482,018
|
|
$
|
2,487,292
|
|
$
|
2,169,552
|
|
$
|
2,300,617
|
|
$
|
1,918,794
|
|
||||
|
Long-term debt (including long-term debt due within one year)
(8)
|
$
|
700,263
|
|
$
|
814,501
|
|
$
|
622,325
|
|
$
|
789,242
|
|
$
|
481,945
|
|
||||
|
Net Debt
(8) (10)
|
$
|
632,366
|
|
$
|
779,042
|
|
$
|
577,919
|
|
$
|
650,638
|
|
$
|
435,892
|
|
||||
|
Total Vail Resorts, Inc. stockholders’ equity
|
$
|
874,540
|
|
$
|
866,568
|
|
$
|
820,843
|
|
$
|
823,868
|
|
$
|
802,311
|
|
||||
(footnotes to selected financial data appear on following page)
34
Footnotes to Selected Financial Data:
|
(1)
|
We have made several acquisitions which impact comparability between years during the past five years. The more significant of those include: Wilmot (acquired in January 2016); Perisher (acquired in June 2015); Park City Mountain Resort (acquired in September 2014); Canyons (transaction entered into in May 2013); Mt. Brighton and Afton Alps (acquired in December 2012); and Kirkwood (acquired in April 2012).
|
|
(2)
|
A skier visit represents a person utilizing a ticket or pass to access a mountain resort or Urban ski area for any part of one day during a winter ski season and includes both paid and complimentary access.
|
|
(3)
|
ETP is calculated by dividing lift revenue by total skier visits during the respective periods.
|
|
(4)
|
ADR is calculated by dividing total room revenue (includes both owned room and managed condominium unit revenue) by the number of occupied rooms during the respective periods.
|
|
(5)
|
RevPAR is calculated by dividing total room revenue (includes both owned room and managed condominium unit revenue) by the number of rooms that are available to guests during the respective periods.
|
|
(6)
|
Real estate held for sale and investment includes all land, development costs and other improvements associated with real estate held for sale and investment.
|
|
(7)
|
Cash and cash equivalents exclude restricted cash.
|
|
(8)
|
We adopted new accounting pronouncements as of July 31, 2016, which alter the presentation of debt issuance costs (see Item 8). Prior periods have been adjusted for this change in accounting standards, which was immaterial for all periods presented.
|
|
(9)
|
We adopted a new accounting pronouncement as of July 31, 2016, which requires that deferred tax assets and liabilities be classified as noncurrent on the balance sheet. This adoption was applied prospectively and, as such, prior periods have not been adjusted (see Item 8).
|
|
(10)
|
Net Debt, a non-GAAP financial measure, is defined as long-term debt plus long-term debt due within one year less cash and cash equivalents.
|
35
|
ITEM 7.
|
MANAGEMENT’S DISCUSSION AND ANALYSIS OF FINANCIAL CONDITION AND RESULTS OF OPERATIONS.
|
The following Management’s Discussion and Analysis of Financial Condition and Results of Operations (“MD&A”) should be read in conjunction with the Consolidated Financial Statements and notes related thereto included in this Form 10-K. To the extent that the following MD&A contains statements which are not of a historical nature, such statements are forward-looking statements which involve risks and uncertainties. These risks include, but are not limited to, those discussed in Item 1A, “Risk Factors” in this Form 10-K. The following discussion and analysis should be read in conjunction with the Forward-Looking Statements section and Item 1A, “Risk Factors” each included in this Form 10-K.
The MD&A includes discussion of financial performance within each of our three segments. We have chosen to specifically include Reported EBITDA (defined as segment net revenue less segment operating expense, plus or minus segment equity investment income or loss, plus gain on litigation settlement and for the Real Estate segment, plus gain on sale of real property) and Net Debt (defined as long-term debt plus long-term debt due within one year less cash and cash equivalents), in the following discussion because we consider these measurements to be significant indications of our financial performance and available capital resources. Reported EBITDA and Net Debt are not measures of financial performance or liquidity under generally accepted accounting principles (“GAAP”). We utilize Reported EBITDA in evaluating our performance and in allocating resources to our segments. Refer to the end of the Results of Operations section for a reconciliation of Reported EBITDA to net income attributable to Vail Resorts, Inc. We also believe that Net Debt is an important measurement as it is an indicator of our ability to obtain additional capital resources for our future cash needs. Refer to the end of the Results of Operations section for a reconciliation of Net Debt to long-term debt.
Items excluded from Reported EBITDA and Net Debt are significant components in understanding and assessing financial performance or liquidity. Reported EBITDA and Net Debt should not be considered in isolation or as an alternative to, or substitute for, net income, net change in cash and cash equivalents or other financial statement data presented in the Consolidated Financial Statements as indicators of financial performance or liquidity. Because Reported EBITDA and Net Debt are not measurements determined in accordance with GAAP and are thus susceptible to varying calculations, Reported EBITDA and Net Debt, as presented herein, may not be comparable to other similarly titled measures of other companies.
Overview
Our operations are grouped into three integrated and interdependent segments: Mountain, Lodging and Real Estate. Resort is the combination of the Mountain and Lodging segments. The Mountain, Lodging and Real Estate segments represented approximately 82%, 17% and 1%, respectively, of our net revenue for Fiscal 2016.
Whistler Blackcomb Acquisition
On August 5, 2016, we entered into an arrangement agreement (the “Whistler Agreement”) to acquire all of the outstanding common shares of Whistler Blackcomb Holdings, Inc. (“Whistler Blackcomb”). Whistler Blackcomb owns a 75% interest in each of Whistler Mountain Resort Limited Partnership and Blackcomb Skiing Enterprises Limited Partnership, which together operate Whistler Blackcomb resort, a year round mountain resort with a comprehensive offering of recreational activities, including both snow sports and summer activities. Whistler Blackcomb shareholders will receive total consideration consisting of (i) C$17.50 per share in cash, and (ii) 0.0998 shares (the “Consideration Shares”), subject to a currency exchange rate adjustment to be determined based on the applicable exchange rate as of the sixth business day prior to the closing date. The estimated total consideration to be paid to Whistler Blackcomb shareholders is approximately $1.1 billion as of August 5, 2016, based on the closing currency exchange rate and price of Vail Resorts common stock as of that day. Completion of this acquisition is subject to certain closing conditions, including the approval by Whistler Blackcomb shareholders and the British Columbia Supreme Court, and regulatory approvals, as well as other customary closing conditions. For additional information, see the Notes to Consolidated Financial Statements.
36
Mountain Segment
During Fiscal 2016, the Mountain segment was comprised of the operations of nine mountain resort properties including Vail, Breckenridge, Keystone and Beaver Creek mountain resorts in Colorado (“Colorado” resorts); Park City mountain resort in Utah (comprised of the former Park City Mountain Resort acquired in September 2014 and the former Canyons Resort in Park City, Utah); Heavenly, Northstar and Kirkwood mountain resorts in the Lake Tahoe area of California and Nevada (“Tahoe” resorts); Perisher Ski Resort in New South Wales, Australia (“Perisher,” acquired in June 2015); and the urban ski areas of Wilmot Mountain in Wisconsin (acquired in January 2016), Afton Alps in Minnesota and Mount Brighton in Michigan (“Urban” ski areas); as well as ancillary services, primarily including ski school, dining and retail/rental operations, and for Perisher, including lodging and transportation operations. Our mountain resorts located in the U.S. were open for business for the 2015/2016 ski season primarily from mid-November through mid-April, which is the peak operating season for the Mountain segment. Our single largest source of Mountain segment revenue is the sale of lift tickets (including season passes), which represented approximately 50%, 49% and 46% of Mountain segment net revenue for Fiscal 2016, Fiscal 2015 and Fiscal 2014, respectively.
Lift revenue is driven by volume and pricing. Pricing is impacted by both absolute pricing, as well as the demographic mix of guests, which impacts the price points at which various products are purchased. The demographic mix of guests to our U.S. mountain resorts is divided into two primary categories: (1) out-of-state and international (“Destination”) guests and (2) in-state and local (“Local”) guests. For the 2015/2016 U.S. ski season, Destination guests comprised approximately 58% of our mountain resort skier visits, while Local guests comprised approximately 42% of our mountain resort skier visits, which compares to approximately 59% and 41%, respectively, for the 2014/2015 U.S. ski season and 56% and 44%, respectively, for the 2013/2014 U.S. ski season.
Destination guests generally purchase our higher-priced lift ticket products and utilize more ancillary services such as ski school, dining and retail/rental, as well as lodging at or around our mountain resorts. Destination guest visitation is less likely to be impacted by changes in the weather, but may be more impacted by adverse economic conditions or the global geopolitical climate. Local guests tend to be more value-oriented and weather sensitive. We offer a variety of season pass products for all of our mountain resorts and Urban ski areas (collectively, “Resorts”), marketed towards both Destination and Local guests. Our season pass product offerings range from providing access to one or a combination of our Resorts to our Epic Season Pass, which allows pass holders unlimited and unrestricted access to all of Resorts. Our season pass program provides a compelling value proposition to our guests, which in turn assists us in developing a loyal base of customers who commit to ski at our Resorts generally in advance of the ski season and typically ski more days each season at our Resorts than those guests who do not buy season passes. As such, our season pass program drives strong customer loyalty; mitigates exposure to more weather sensitive guests; and, generates additional ancillary spending. In addition, our season pass program attracts new guests to our Resorts. All of our season pass products, including the Epic Pass, are predominately sold prior to the start of the ski season. Season pass revenue, although primarily collected prior to the ski season, is recognized in the Consolidated Statement of Operations ratably throughout the ski season. Approximately 40% of total lift revenue was derived from season pass revenue for each of Fiscal 2016, Fiscal 2015 and Fiscal 2014.
The cost structure of our mountain resort operations has a significant fixed component with variable expenses including, but not limited to, Forest Service fees, credit card fees, retail/rental cost of sales and labor, ski school labor and dining operations; as such, profit margins can fluctuate greatly based on the level of revenues.
Lodging Segment
Operations within the Lodging segment include (i) ownership/management of a group of luxury hotels through the RockResorts brand proximate to our Colorado mountain resorts; (ii) ownership/management of non-RockResorts branded hotels and condominiums proximate to our U.S. mountain resorts; (iii) NPS concessionaire properties including GTLC; (iv) CME, a Colorado resort ground transportation company; and, (v) mountain resort golf courses.
The performance of our lodging properties (including managed condominium units) proximate to our mountain resorts as well as CME is closely aligned with the performance of the Mountain segment and generally experiences similar seasonal trends, particularly with respect to visitation by Destination guests, and represented approximately 69%, 70% and 71% of Lodging segment net revenue (excluding Lodging segment revenue associated with reimbursement of payroll costs) for Fiscal 2016, Fiscal 2015 and Fiscal 2014, respectively. Management primarily focuses on Lodging net revenue excluding payroll cost reimbursements and Lodging operating expense excluding reimbursed payroll costs (which are not measures of financial performance under GAAP) as the reimbursements are made based upon the costs incurred with no added margin, as such the revenue and corresponding expense have no effect on our Lodging Reported EBITDA which we use to evaluate Lodging segment performance. Revenue of the Lodging segment during our first and fourth fiscal quarters is generated primarily by the operations of our NPS concessionaire properties (as their operating season generally occurs from June to the end of September); mountain resort golf operations and seasonally lower volume from our other owned and managed properties and businesses.
37
Real Estate Segment
The principal activities of our Real Estate segment include the marketing and selling of remaining condominium units that are available for sale, which primarily relate to The Ritz-Carlton Residences in Vail and One Ski Hill Place in Breckenridge; the sale of land parcels to third-party developers; planning for future real estate development projects, including zoning and acquisition of applicable permits; and the occasional purchase of selected strategic land parcels for future development. Revenue from vertical development projects is not recognized until closing of individual units within a project, which occurs after substantial completion of the project. Additionally, our real estate development projects most often result in the creation of certain resort assets that provide additional benefit to the Mountain and Lodging segments. We continue undertaking preliminary planning and design work on future projects and are pursuing opportunities with third-party developers rather than undertaking our own significant vertical development projects. We believe that, due to our low carrying cost of real estate land investments, we are well situated to promote future projects with third-party developers while limiting our financial risk. Our revenue from the Real Estate segment, and associated expense, can fluctuate significantly based upon the timing of closings and the type of real estate being sold, causing volatility in the Real Estate segment’s operating results from period to period.
Recent Trends, Risks and Uncertainties
We have identified the following important factors (as well as uncertainties associated with such factors) that could impact our future financial performance:
|
•
|
The timing and amount of snowfall can have an impact on Mountain and Lodging revenue particularly with regard to skier visits and the duration and frequency of guest visitation. To help mitigate this impact, we sell a variety of season pass products prior to the beginning of the ski season resulting in a more stabilized stream of lift revenue. Additionally, our season pass products provide a compelling value proposition to our guests, which in turn creates a guest commitment predominantly prior to the start of the ski season. In March 2016, we began our pre-season pass sales program for the 2016/2017 U.S. ski season. Through September 18, 2016, pre-season pass sales for the upcoming 2016/2017 U.S. ski season have increased approximately 24% in units and increased approximately 29% in sales dollars, compared to the prior year period ended September 20, 2015. We cannot predict if this favorable trend will continue through the fall 2016 U.S pass sales campaign, nor can we predict the overall impact that season pass sales will have on lift revenue for the 2016/2017 U.S. ski season.
|
|
•
|
In Fiscal 2016, our lift revenue was favorably impacted by non-season pass price increases at our mountain resorts that were implemented for the 2015/2016 U.S. ski season. Non-season pass prices for the 2016/2017 U.S. ski season have not yet been finalized; and, as such, there can be no assurances as to the level of price increases, if any, which will occur and the impact that pricing may have on visitation or revenue.
|
|
•
|
Our Fiscal 2016 results for our Mountain and Lodging segments showed strong improvement over Fiscal 2015 largely due to strong pass sales growth for the 2015/2016 U.S. ski season, an increase in overall visitation at our Colorado, Park City and Tahoe resorts, and improved ancillary guest spend in our ski school, dining and retail/rental operations. We cannot predict whether our Colorado, Tahoe and Park City resorts will experience normal snowfall conditions for the upcoming 2016/2017 U.S. ski season nor can we estimate the impact there may be to advance bookings, guest travel, season pass sales, lift revenue (excluding season passes), retail/rental sales or other ancillary services revenue next ski season as a result of past snowfall conditions.
|
|
•
|
Key U.S. economic indicators have remained steady in 2016, including strong consumer confidence and declines in the unemployment rate. However, the growth in the U.S. economy may be impacted by economic challenges in the U.S. or declining or slowing growth in economies outside of the U.S., accompanied by devaluation of currencies and lower commodity prices. Given these economic uncertainties, we cannot predict what the impact will be on overall travel and leisure spending or more specifically, on our guest visitation, guest spending or other related trends for the upcoming 2016/2017 U.S. ski season.
|
|
•
|
We expect the Whistler Blackcomb transaction to close in fall 2016. The transaction has been unanimously approved by the board of directors of Whistler Blackcomb, and shareholders representing 25% of Whistler Blackcomb's common shares have entered into voting support agreements in connection with the transaction. The transaction has also been unanimously approved by our board of directors. The Whistler Agreement provides for customary representations, warranties and covenants, and provides for the payment of fees upon the termination of the Whistler Agreement under certain circumstances, including Whistler Blackcomb obtaining a superior proposal and failure to obtain certain regulatory approvals. We also expect that Whistler Blackcomb will significantly contribute to our results of operations; however; we cannot predict whether we will realize all of the synergies expected from the operations of Whistler Blackcomb nor can we predict all the resources required to integrate Whistler Blackcomb operations and the ultimate impact Whistler Blackcomb will have on our future results of operations.
|
38
We intend to finance the cash portion of the consideration for the Whistler Blackcomb transaction of approximately $513 million, subject to adjustment for currency exchange rates, with a combination of cash and cash equivalents on hand, available revolving borrowing capacity under the Seventh Amended and Restated Credit Agreement, dated as of May 1, 2015, among Vail Holdings, Inc., as the borrower, Bank of America, N.A., as administrative agent, and the lenders party thereto (the “Credit Agreement”), and an incremental term loan facility to be incurred through an amendment to the Credit Agreement. We have received an executed commitment letter from U.S. Bank, National Association (“U.S. Bank”) and Wells Fargo Bank, National Association (“Wells Fargo”) whereby U.S. Bank and Wells Fargo have committed to provide a $360 million incremental term loan. Additionally, we intend to assume or refinance Whistler Blackcomb’s existing C$300 million revolving credit facility as part of the transaction. As of June 30, 2016, Whistler Blackcomb’s credit facility had debt outstanding of C$185.8 million, or $143.8 million. In addition, Whistler Blackcomb’s credit facility contains a change in control provision pursuant to which the lenders can elect to require repayment of the entire outstanding balance upon closing. We intend to obtain a waiver of the change in control provision in order to maintain the existing facility or to refinance Whistler Blackcomb’s existing credit facility if a waiver cannot be obtained.
|
•
|
As of July 31, 2016, we had $67.9 million in cash and cash equivalents, as well as $252.8 million available under the revolver component of our Credit Agreement (which represents the total commitment of $400.0 million less outstanding borrowings of $75.0 million and certain letters of credit outstanding of $72.2 million). We believe that the terms of our Credit Agreement, in addition to the incremental term loan for the proposed Whistler Blackcomb transaction and our expectation to obtain a waiver or to refinance the existing credit facility as discussed above, allow for sufficient flexibility in our ability to make future acquisitions, including Whistler Blackcomb, investments, distributions to stockholders and incur additional debt. This, combined with the continued positive cash flow from operating activities of our Mountain and Lodging segments less resort capital expenditures, has and is anticipated to continue to provide us with significant liquidity. We believe our liquidity will allow us to consider strategic investments and other forms of returning value to our stockholders including additional share repurchases and the continued payment of a quarterly cash dividend.
|
|
•
|
Real Estate Reported EBITDA is highly dependent on, among other things, the timing of closings on condominium units available for sale, which determines when revenue and associated cost of sales is recognized. Changes to the anticipated timing or mix of closing on one or more real estate projects, or unit closings within a real estate project, could materially impact Real Estate Reported EBITDA for a particular quarter or fiscal year. As of July 31, 2016, we had four units at The Ritz-Carlton Residences, Vail and two units at One Ski Hill Place in Breckenridge available for sale with a remaining book value of approximately $13.6 million for both projects as of July 31, 2016. We cannot predict the ultimate number of units that we will sell, the ultimate price we will receive, or when the units will sell, although we currently anticipate the selling process will take less than two years to complete assuming continued stability in resort real estate markets.
|
39
Results of Operations
Summary
Shown below is a summary of operating results for Fiscal 2016, Fiscal 2015 and Fiscal 2014 (in thousands):
|
|
Year Ended July 31,
|
||||||||||
|
|
2016
|
2015
|
2014
|
||||||||
|
Mountain Reported EBITDA
|
$
|
424,415
|
|
$
|
344,104
|
|
$
|
252,050
|
|
||
|
Lodging Reported EBITDA
|
28,169
|
|
21,676
|
|
16,724
|
|
|||||
|
Resort Reported EBITDA
|
$
|
452,584
|
|
$
|
365,780
|
|
$
|
268,774
|
|
||
|
Real Estate Reported EBITDA
|
$
|
2,784
|
|
$
|
(6,915
|
)
|
$
|
(7,040
|
)
|
||
|
Income before provision for income taxes
|
$
|
242,619
|
|
$
|
149,328
|
|
$
|
44,072
|
|
||
|
Net income attributable to Vail Resorts, Inc.
|
$
|
149,754
|
|
$
|
114,754
|
|
$
|
28,478
|
|
||
40
Mountain Segment
Mountain segment operating results for Fiscal 2016, Fiscal 2015 and Fiscal 2014 are presented by category as follows (in thousands, except ETP):
|
|
|
|
|
Percentage
|
|||||||||||||
|
|
Year Ended July 31,
|
Increase/(Decrease)
|
|||||||||||||||
|
|
2016
|
2015
|
2014
|
2016/2015
|
2015/2014
|
||||||||||||
|
Mountain net revenue:
|
|||||||||||||||||
|
Lift
|
$
|
658,047
|
|
$
|
536,458
|
|
$
|
447,271
|
|
22.7
|
%
|
19.9
|
%
|
||||
|
Ski school
|
143,249
|
|
126,206
|
|
109,442
|
|
13.5
|
%
|
15.3
|
%
|
|||||||
|
Dining
|
121,008
|
|
101,010
|
|
89,892
|
|
19.8
|
%
|
12.4
|
%
|
|||||||
|
Retail/rental
|
241,134
|
|
219,153
|
|
210,387
|
|
10.0
|
%
|
4.2
|
%
|
|||||||
|
Other
|
141,166
|
|
121,202
|
|
106,581
|
|
16.5
|
%
|
13.7
|
%
|
|||||||
|
Total Mountain net revenue
|
1,304,604
|
|
1,104,029
|
|
963,573
|
|
18.2
|
%
|
14.6
|
%
|
|||||||
|
Mountain operating expense:
|
|||||||||||||||||
|
Labor and labor-related benefits
|
338,250
|
|
291,582
|
|
266,411
|
|
16.0
|
%
|
9.4
|
%
|
|||||||
|
Retail cost of sales
|
93,946
|
|
87,817
|
|
88,291
|
|
7.0
|
%
|
(0.5
|
)%
|
|||||||
|
Resort related fees
|
68,890
|
|
59,685
|
|
49,168
|
|
15.4
|
%
|
21.4
|
%
|
|||||||
|
General and administrative
|
167,480
|
|
143,772
|
|
125,678
|
|
16.5
|
%
|
14.4
|
%
|
|||||||
|
Other
|
212,906
|
|
194,291
|
|
183,237
|
|
9.6
|
%
|
6.0
|
%
|
|||||||
|
Total Mountain operating expense
|
881,472
|
|
777,147
|
|
712,785
|
|
13.4
|
%
|
9.0
|
%
|
|||||||
|
Gain on litigation settlement
|
—
|
|
16,400
|
|
—
|
|
(100.0
|
)%
|
nm
|
|
|||||||
|
Mountain equity investment income, net
|
1,283
|
|
822
|
|
1,262
|
|
56.1
|
%
|
(34.9
|
)%
|
|||||||
|
Mountain Reported EBITDA
|
$
|
424,415
|
|
$
|
344,104
|
|
$
|
252,050
|
|
23.3
|
%
|
36.5
|
%
|
||||
|
Total skier visits
|
10,032
|
|
8,466
|
|
7,688
|
|
18.5
|
%
|
10.1
|
%
|
|||||||
|
ETP
|
$
|
65.59
|
|
$
|
63.37
|
|
$
|
58.18
|
|
3.5
|
%
|
8.9
|
%
|
||||
Mountain Reported EBITDA includes $13.4 million, $11.8 million and $10.3 million of stock-based compensation expense for Fiscal 2015, Fiscal 2014 and Fiscal 2013, respectively.
Fiscal 2016 compared to Fiscal 2015
Fiscal 2016 results reflect an increase in Mountain Reported EBITDA of $80.3 million, or 23.3%, compared to Fiscal 2015. This increase was primarily due to strong U.S. pass sales growth for the 2015/2016 U.S. ski season; a strong rebound at our Tahoe resorts; continued growth at our Colorado resorts and Park City; strong ancillary guest spending for ski school, dining and retail/rental operations; as well as the addition of a full year of Perisher results (acquired in June 2015). Our Tahoe resorts saw a significant increase in skier visitation during the 2015/2016 U.S. ski season, primarily as a result of improved weather conditions and snowfall in the Tahoe region compared to the same period in the prior year. Our Colorado resorts and Park City realized strong increases in skier visitation during Fiscal 2016 compared to the same period in the prior year. We believe the increase at Park City is due in part to the significant capital improvements we made at the resort, including connecting Park City Mountain Resort and Canyons into the largest resort in the U.S., and our marketing efforts surrounding the investments and connection. Mountain Reported EBITDA for Fiscal 2016 was also positively impacted by the addition of Perisher (acquired in June 2015), which has its operating season from June through early October; increased summer activities revenue; and the lack of transaction, duties, integration and litigation expenses incurred during Fiscal 2015 related to Park City and Perisher. These favorable impacts were partially offset by a modest decline in international visitation to our U.S. mountain resorts during the 2015/2016 U.S. ski season and the $16.4 million non-cash gain on the Park City litigation settlement recognized during Fiscal 2015. The non-cash gain on the Park City litigation (which was recorded separately from our acquisition of Park City Mountain Resort) represents the estimated fair value of the settlement, which we obtained the right to in the acquisition of Canyons resort in fiscal 2013 (the “Canyons transaction”), from the Canyons transaction date of May 29, 2013 to the Park City Mountain Resort acquisition date.
Lift revenue consists primarily of season pass lift revenue (“pass revenue”) and non-season pass lift revenue (“non-pass revenue”). Lift revenue increased $121.6 million, or 22.7%, compared to the same period in the prior year, which includes $24.0 million of
41
incremental lift revenue from Perisher. U.S. non-pass revenue increased $58.7 million, or 18.9%, and U.S. pass revenue increased $38.9 million, or 18.1%. The increase in U.S. non-pass revenue was primarily the result of an increase in the ETP excluding season pass holders of 9.8%, along with higher visitation at our Tahoe resorts and Park City. The increase in U.S. pass revenue was due to a combination of both an increase in units sold and pricing, and was favorably impacted by increased pass sales to Destination guests. Total ETP increased $2.22, or 3.5%, due primarily to price increases in both our lift ticket products and season pass products, partially offset by higher average visitation by season pass holders during the 2015/2016 ski season as compared with the 2014/2015 ski season.
Ski school revenue increased $17.0 million, or 13.5%, for Fiscal 2016 compared to Fiscal 2015, primarily as a result of increases in ski school revenue at our Colorado, Tahoe and Park City resorts, which were attributable to overall increases in skier visitation and pricing. Additionally, Perisher contributed $4.2 million of incremental ski school revenue during Fiscal 2016.
Dining revenue increased $20.0 million, or 19.8%, for Fiscal 2016 compared to Fiscal 2015, which was primarily attributable to overall increases in skier and summer visitation at our U.S. mountain resorts combined with incremental Perisher dining revenue of $3.3 million. Additionally, dining revenue benefited from the earlier opening of terrain and on-mountain dining facilities at our Tahoe resorts compared to the prior year, and from both the opening of a new on-mountain dining venue and upgrades of existing on-mountain dining venues at Park City.
Retail/rental revenue increased $22.0 million, or 10.0%, for Fiscal 2016 compared to Fiscal 2015 due to an increase in retail sales of $13.0 million, or 8.2%, and an increase in rental revenue of $9.0 million, or 15.3%. The increase in retail revenue was primarily attributable to an increase in sales volume at stores proximate to our Tahoe resorts and in the San Francisco Bay Area due to improved weather conditions and snowfall in the Tahoe region and incremental retail revenue from Perisher. The increase in rental revenue was primarily due to stores proximate to our mountain resorts in Tahoe and Colorado which experienced higher volumes due to increased overall skier visitation and incremental rental revenue from Perisher.
Other revenue mainly consists of summer visitation and mountain activities revenue, employee housing revenue, guest services revenue, commercial leasing revenue, marketing and internet advertising revenue, private club revenue (which includes both club dues and amortization of initiation fees), municipal services revenue and other recreation activity revenue. Other revenue also is comprised of Perisher lodging and transportation revenue. For Fiscal 2016, other revenue increased $20.0 million, or 16.5%, compared to Fiscal 2015, primarily attributable to incremental revenue from Perisher of $7.3 million; increases in summer activities revenue from improved summer visitation at both our Colorado and Tahoe mountain resorts, including the expansion of our on-mountain Epic Discovery summer activities offerings; increases in marketing revenue due to higher revenue from our strategic partner; and higher base area services and parking revenue due to increased visitation.
Operating expense for Fiscal 2016 increased $104.3 million, or 13.4%, compared to Fiscal 2015, which includes incremental operating expenses from Perisher of $34.0 million. Additionally, current year operating expenses were favorably impacted by the lack of transaction, duties, integration and litigation expenses of $11.2 million incurred in Fiscal 2015 related to Park City and Perisher. Excluding Perisher incremental operating expenses and transaction, duties, integration and litigation expenses related to Park City and Perisher, operating expenses increased $81.5 million, or 10.7%. Labor and labor-related benefits (excluding Perisher) increased $33.1 million, or 11.5%, due to wage adjustments; increased staffing levels to support higher volumes primarily in ski school, mountain operations and on-mountain dining; and increased variable compensation. Retail cost of sales increased $6.1 million, or 7.0%, compared to an increase in retail revenue of $13.0 million, or 8.2%. Resort related fees increased $9.2 million, or 15.4%, due to overall increases in revenue upon which those fees are based. General and administrative expense (excluding Perisher) increased $19.4 million, or 13.6%, primarily due to higher Mountain segment component of allocated corporate costs, including increased sales and marketing expense and variable compensation. Other expense (excluding Perisher expenses and Park City and Perisher transaction, duties, integration and litigation expenses from the prior year) increased $14.1 million, or 7.8%, primarily due to increases in repairs and maintenance, supplies, food and beverage cost of sales commensurate with increases in dining revenue, and rent expense, partially offset by lower fuel expense.
Mountain equity investment income, net primarily includes our share of income from the operations of a real estate brokerage joint venture.
42
Fiscal 2015 compared to Fiscal 2014
Fiscal 2015 results reflect an increase in Mountain Reported EBITDA of $92.1 million, or 36.5%, compared to Fiscal 2014. This increase was primarily due to pass sales growth for the 2014/2015 U.S. ski season, improved results at our Colorado resorts, which recorded increases in overall visitation, ancillary guest spend and yields for ski school, dining and retail/rental operations, as well as the addition of Park City Mountain Resort (acquired September 2014) and Perisher. Perisher provided $7.4 million of incremental EBITDA, which includes $5.7 million of transaction, duties and transition costs, from one month of peak season operations. Additionally, our results for Fiscal 2015 were also positively impacted by the $16.4 million non-cash gain on the Park City litigation settlement. However, our results were negatively impacted by a challenging ski season for our Tahoe resorts, which experienced unseasonably warm temperatures and very low snowfall levels during the 2014/2015 U.S. ski season, adversely impacting skier visitation and guest spending. These poor conditions in the Tahoe region resulted in a 16.4% decline in overall skier visitation at our Tahoe resorts for the 2014/2015 U.S. ski season compared to the 2013/2014 U.S. ski season, which also was impacted by challenging conditions.
Lift revenue increased $89.2 million, or 19.9%, from Fiscal 2014, attributable to a $49.2 million, or 18.2%, increase in non-pass revenue, as well as a $40.0 million, or 22.6%, increase in pass revenue. The increase in non-pass revenue was due to an increase in ETP excluding season pass holders of 7.2%, along with incremental non-pass revenue of $29.4 million from Park City Mountain Resort and $9.0 million from Perisher, partially offset by lower non-pass revenue at our Tahoe resorts, resulting from a decline in visitation excluding season pass holders. The increase in pass revenue was due to a combination of both an increase in units sold and pricing, along with incremental Perisher pass revenue of $2.9 million. Total ETP increased $5.19, or 8.9%, due primarily to a combination of price increases in both lift ticket products and season pass products and lower average visitation by season pass holders during the 2014/2015 U.S. ski season, compared to the same period in Fiscal 2014.
Ski school revenue increased $16.8 million, or 15.3%, for Fiscal 2015 compared to Fiscal 2014, with ski school revenue increasing at our Colorado resorts primarily due to an increase in yield per skier visit; incremental revenue of $9.1 million and $2.7 million from Park City Mountain Resort and Perisher, respectively; partially offset by declines in ski school revenue at our Tahoe resorts, due to a decline in skier visitation as discussed above.
Dining revenue increased $11.1 million, or 12.4%, for Fiscal 2015 compared to Fiscal 2014, and was primarily attributable to an increase in revenue at our Colorado resorts primarily due to higher yields per skier visit and improved summer visitation; as well as incremental revenue from Park City Mountain Resort of $5.7 million and Perisher of $1.9 million; partially offset by modest declines in dining revenue at our Tahoe resorts primarily due to decreased skier visitation.
Retail/rental revenue increased $8.8 million, or 4.2%, for Fiscal 2015 compared to Fiscal 2014 due to an increase in rental revenue of $5.9 million, or 10.7%, and an increase in retail sales of $2.9 million, or 1.8%. The increase in rental revenue was largely due to stores in Colorado and the addition of Park City Mountain Resort and Perisher. Retail revenue was favorably impacted by an increase in sales volume at our stores in Colorado (including strong sales at pre-ski season sales events) and incremental revenue from Park City Mountain Resort and Perisher. The increases in retail sales were partially offset by the elimination of online retail sales in Fiscal 2015 due to the discontinuation of our online retail platform in Fiscal 2014 and declines in sales volume at stores proximate to our Tahoe resorts.
Other revenue mainly consists of summer visitation and mountain activities revenue, employee housing revenue, guest services revenue, commercial leasing revenue, marketing and internet advertising revenue, private club revenue (which includes both club dues and amortization of initiation fees), municipal services revenue and other recreation activity revenue. Other revenue also is comprised of Perisher lodging and transportation revenue. For Fiscal 2015, other revenue increased $14.6 million, or 13.7%, compared to Fiscal 2014, primarily due incremental revenue from Park City Mountain Resort and Perisher, and increases in summer activities revenue and municipal services revenue.
Operating expense for Fiscal 2015 increased $64.4 million, or 9.0%, compared to Fiscal 2014, which includes incremental operating expense from Park City Mountain Resort of $38.5 million (including Fiscal 2015 Park City litigation, integration and transaction costs of $5.5 million) and incremental operating expense from Perisher of $14.4 million (including transaction, duties and transition costs of $5.7 million). Operating expense in Fiscal 2014 included $9.8 million of Canyons integration and Park City litigation related expenses. Excluding Park City Mountain Resort and Perisher related expenses and Canyons integration expense, operating expense increased $21.3 million, or 3.0%. Labor and labor-related benefits (excluding Park City Mountain Resort and Perisher) increased $7.0 million, or 2.6%, primarily due to normal wage adjustments. Retail cost of sales decreased $0.5 million, or 0.5%, as a result of improvement in the gross profit margin percentage at our retail outlets combined with no online retail sales in Fiscal 2015 due to the shutdown of our online retail platform in Fiscal 2014 (as discussed above), which had associated lower gross profit margins. Resort related fees (excluding Park City Mountain Resort and Perisher) increased $4.8 million, or 9.8%, due to overall increases in revenue upon which those fees are based. General and administrative expense (excluding Park City Mountain Resort and Perisher) increased $13.9 million, or 11.0%, primarily due to higher Mountain segment component of allocated corporate
43
costs including increased information and technology expense, increased sales and marketing expense, increased human resources expense and increased legal costs. Other expense (excluding expenses related to Park City Mountain Resort and Perisher, and Canyons integration expense) decreased $2.7 million, or 1.5%, primarily due to lower fuel and supplies expense, partially offset by higher operating expenses including food and beverage cost of sales commensurate with increased dining revenue.
Mountain equity investment income, net primarily includes our share of income from the operations of a real estate brokerage joint venture. The decrease in equity investment income for Fiscal 2015 is primarily due to decreased commissions earned by the brokerage due to a lower level of real estate closures compared to Fiscal 2014.
Lodging Segment
Lodging segment operating results for Fiscal 2016, Fiscal 2015 and Fiscal 2014 are presented by category as follows (in thousands, except ADR and RevPAR):
|
|
|
|
|
Percentage
|
|||||||||||||
|
|
Year Ended July 31,
|
Increase/(Decrease)
|
|||||||||||||||
|
|
2016
|
2015
|
2014
|
2016/2015
|
2015/2014
|
||||||||||||
|
Lodging net revenue:
|
|||||||||||||||||
|
Owned hotel rooms
|
$
|
63,520
|
|
$
|
57,916
|
|
$
|
53,199
|
|
9.7
|
%
|
8.9
|
%
|
||||
|
Managed condominium rooms
|
61,934
|
|
58,936
|
|
55,214
|
|
5.1
|
%
|
6.7
|
%
|
|||||||
|
Dining
|
49,225
|
|
46,209
|
|
44,023
|
|
6.5
|
%
|
5.0
|
%
|
|||||||
|
Transportation
|
22,205
|
|
23,079
|
|
22,006
|
|
(3.8
|
)%
|
4.9
|
%
|
|||||||
|
Golf
|
17,519
|
|
16,340
|
|
15,410
|
|
7.2
|
%
|
6.0
|
%
|
|||||||
|
Other
|
47,833
|
|
41,760
|
|
42,204
|
|
14.5
|
%
|
(1.1
|
)%
|
|||||||
|
262,236
|
|
244,240
|
|
232,056
|
|
7.4
|
%
|
5.3
|
%
|
||||||||
|
Payroll cost reimbursements
|
12,318
|
|
10,313
|
|
10,231
|
|
19.4
|
%
|
0.8
|
%
|
|||||||
|
Total Lodging net revenue
|
274,554
|
|
254,553
|
|
242,287
|
|
7.9
|
%
|
5.1
|
%
|
|||||||
|
Lodging operating expense:
|
|||||||||||||||||
|
Labor and labor-related benefits
|
114,404
|
|
110,168
|
|
105,504
|
|
3.8
|
%
|
4.4
|
%
|
|||||||
|
General and administrative
|
35,351
|
|
32,481
|
|
30,022
|
|
8.8
|
%
|
8.2
|
%
|
|||||||
|
Other
|
84,312
|
|
79,915
|
|
79,806
|
|
5.5
|
%
|
0.1
|
%
|
|||||||
|
234,067
|
|
222,564
|
|
215,332
|
|
5.2
|
%
|
3.4
|
%
|
||||||||
|
Reimbursed payroll costs
|
12,318
|
|
10,313
|
|
10,231
|
|
19.4
|
%
|
0.8
|
%
|
|||||||
|
Total Lodging operating expense
|
246,385
|
|
232,877
|
|
225,563
|
|
5.8
|
%
|
3.2
|
%
|
|||||||
|
Lodging Reported EBITDA
|
$
|
28,169
|
|
$
|
21,676
|
|
$
|
16,724
|
|
30.0
|
%
|
29.6
|
%
|
||||
|
Owned hotel statistics:
|
|||||||||||||||||
|
ADR
|
$
|
227.27
|
|
$
|
216.76
|
|
$
|
205.59
|
|
4.8
|
%
|
5.4
|
%
|
||||
|
RevPar
|
$
|
153.13
|
|
$
|
140.28
|
|
$
|
131.04
|
|
9.2
|
%
|
7.1
|
%
|
||||
|
Managed condominium statistics:
|
|||||||||||||||||
|
ADR
|
$
|
325.38
|
|
$
|
316.32
|
|
$
|
301.03
|
|
2.9
|
%
|
5.1
|
%
|
||||
|
RevPar
|
$
|
109.68
|
|
$
|
101.19
|
|
$
|
88.60
|
|
8.4
|
%
|
14.2
|
%
|
||||
|
Owned hotel and managed condominium statistics (combined):
|
|||||||||||||||||
|
ADR
|
$
|
280.38
|
|
$
|
270.84
|
|
$
|
257.14
|
|
3.5
|
%
|
5.3
|
%
|
||||
|
RevPar
|
$
|
122.61
|
|
$
|
112.67
|
|
$
|
100.57
|
|
8.8
|
%
|
12.0
|
%
|
||||
Lodging Reported EBITDA includes $3.1 million, $2.6 million and $2.2 million of stock-based compensation expense for Fiscal 2016, Fiscal 2015 and Fiscal 2014, respectively.
44
Fiscal 2016 compared to Fiscal 2015
Total Lodging net revenue (excluding payroll cost reimbursements) for Fiscal 2016 increased $18.0 million, or 7.4%, as compared to Fiscal 2015. Included in net revenue for Fiscal 2016 was the recognition of a $3.5 million termination fee (included in other revenue) associated with the termination of the management agreement at Half Moon in Montego Bay, Jamaica. Excluding this termination fee, Lodging net revenue (excluding payroll costs reimbursements) increased $14.5 million, or 5.9%, which was primarily due to increased visitation to our lodging properties and managed condominium rooms at or proximate to our mountain resorts. The increase in visitation was primarily due to increased skier visitation during the 2015/2016 U.S. ski season compared to the prior season, as well as increased summer visitation at our mountain resorts compared to Fiscal 2015 (discussed in the Mountain section). Additionally, revenue at GTLC improved for Fiscal 2016 compared to Fiscal 2015 primarily as the result of increases in transient guest visitation, which drove higher guest spending on ancillary activities and services, and higher ADR.
Revenue from owned hotel rooms increased $5.6 million, or 9.7%, for Fiscal 2016 compared to Fiscal 2015, and was positively impacted by increases in ADR and transient visitation at GTLC, which generated an increase of $3.2 million compared to the prior year. Additionally, revenue at our Colorado lodging properties increased $2.4 million compared to the prior year as a result of improved transient guest visitation and an increase in ADR. The increase in visitation to our Colorado lodging properties was primarily attributable to increased skier visitation and improved summer visitation at our Colorado mountain resorts compared to the same period in Fiscal 2015. Revenue from managed condominium rooms increased $3.0 million, or 5.1%, for Fiscal 2016 compared to Fiscal 2015, primarily as the result of increased ADR at our managed condominium rooms in Colorado and Tahoe, which contributed to an 8.4% increase in managed condominium RevPAR.
Dining revenue for Fiscal 2016 increased $3.0 million, or 6.5%, compared to Fiscal 2015, primarily due to increased dining revenue generated at GTLC, Keystone and Breckenridge. Transportation revenue decreased $0.9 million, or 3.8%, for Fiscal 2016 compared to Fiscal 2015, primarily due to decreased passenger volume. Golf revenue increased $1.2 million, or 7.2%, compared to Fiscal 2015 primarily due to incremental revenue from reimbursable expenses for managing the Canyons golf course, which began operations in the summer of 2015, as well as increased revenue at our Colorado golf courses. Excluding the $3.5 million Half Moon termination fee, other revenue for Fiscal 2016 increased $2.6 million, or 6.2%, as compared to Fiscal 2015, primarily due to an increase in ancillary revenue from improved visitation at GTLC, an increase in revenue from conference services provided to our group business at our Colorado lodging properties and an increase in revenue from our central reservations booking services, partially offset by a reduction in management fees due to the termination of the management agreement at Half Moon.
Operating expense (excluding reimbursed payroll costs) increased $11.5 million, or 5.2%, for Fiscal 2016 compared to Fiscal 2015. Labor and labor-related benefits increased $4.2 million, or 3.8%, resulting from wage adjustments and higher staffing levels associated with increased overall occupancy. General and administrative expense increased $2.9 million, or 8.8%, for Fiscal 2016 compared to Fiscal 2015 due to higher allocated corporate costs, including increased variable compensation. Other expense increased $4.4 million, or 5.5%, for Fiscal 2016 compared with Fiscal 2015, primarily due to higher operating expenses (such as repairs and maintenance expense, supplies expense, food and beverage cost of sales, and credit card fees) and higher advertising expenses.
Revenue from payroll cost reimbursements and the corresponding reimbursed payroll costs relates to payroll costs at managed hotel properties where we are the employer and all payroll costs are reimbursed by the owners of the properties under contractual arrangements. Since the reimbursements are made based upon the costs incurred with no added margin, the revenue and corresponding expense have no effect on our Lodging Reported EBITDA.
Fiscal 2015 compared to Fiscal 2014
Total Lodging net revenue (excluding payroll cost reimbursements) for Fiscal 2015 increased $12.2 million, or 5.3%, as compared to Fiscal 2014, primarily due to an increase in transient guest visitation to our Colorado lodging properties due to increased skier visitation during the 2014/2015 U.S. ski season (discussed in the Mountain section); an increase in revenue at our mountain properties from improved summer visitation; and, an increase in revenue at GTLC. Improved results at GTLC for Fiscal 2015 compared to Fiscal 2014 were primarily due to increased occupancy, ADR and guest spending on ancillary activities and services during the fourth quarter of Fiscal 2015 combined with the improved results for the first quarter of Fiscal 2015 which were partially attributable to reduced operations for the first quarter of Fiscal 2014 due to the government shutdown in October 2013 and the early closure of the Colter Bay Marina in August 2013 due to low water levels.
Revenue from owned hotel rooms increased $4.7 million, or 8.9%, for Fiscal 2015 compared to Fiscal 2014. Owned room revenue was positively impacted by GTLC and Flagg Ranch, which revenue increased $2.5 million, resulting from increased ADR and group visitation; and, an increase in revenue at our Colorado lodging properties, which revenue increased $2.2 million, due to an increase in transient guest visitation attributable to increased skier visits at our Colorado mountain resorts, improved summer visitation and an increase in ADR. Revenue from managed condominium rooms increased $3.7 million, or 6.7%, for Fiscal 2015
45
compared to Fiscal 2014, and was attributable to an increase in transient guest visitation at our managed condominium rooms in Colorado due to increased skier visitation and increased summer visitation and an increase in ADR.
Dining revenue for Fiscal 2015 increased $2.2 million, or 5.0%, compared to Fiscal 2014, primarily due to increased dining revenue generated at GTLC, Flagg Ranch and Canyons. Transportation revenue increased $1.1 million, or 4.9%, for Fiscal 2015 compared to Fiscal 2014 primarily due to an increase in total passengers. Golf revenue increased $0.9 million, or 6.0%, compared to Fiscal 2014 primarily due to incremental revenue from reimbursable expenses for managing the Canyons golf course beginning in the summer of 2015. Other revenue for Fiscal 2015 decreased $0.4 million, or 1.1%, as compared to Fiscal 2014, primarily due to a decrease of revenue from conference services at Canyons and a decrease in other ancillary services revenue.
Operating expense (excluding reimbursed payroll costs) increased $7.2 million, or 3.4%, for Fiscal 2015 compared to Fiscal 2014. Labor and labor-related benefits increased $4.7 million, or 4.4%, resulting from normal wage adjustments, higher staffing levels associated with increased occupancy and increased variable compensation. General and administrative expense increased $2.5 million, or 8.2%, for Fiscal 2015 compared to Fiscal 2014 due to higher allocated corporate costs, including increased sales and marketing expense and information and technology expense. Other expense increased $0.1 million, or 0.1%, for Fiscal 2015 compared with Fiscal 2014, primarily due to higher food and beverage cost of sales, partially offset by lower fuel costs.
Real Estate Segment
Real Estate segment operating results for Fiscal 2016, Fiscal 2015 and Fiscal 2014 are presented by category as follows (in thousands):
|
|
|
|
|
Percentage
|
|||||||||||||
|
|
Year Ended July 31,
|
Increase/(Decrease)
|
|||||||||||||||
|
|
2016
|
2015
|
2014
|
2016/2015
|
2015/2014
|
||||||||||||
|
Total Real Estate net revenue
|
$
|
22,128
|
|
$
|
41,342
|
|
$
|
48,786
|
|
(46.5
|
)%
|
(15.3
|
)%
|
||||
|
Real Estate operating expense:
|
|||||||||||||||||
|
Cost of sales (including sales commissions)
|
17,682
|
|
34,765
|
|
41,274
|
|
(49.1
|
)%
|
(15.8
|
)%
|
|||||||
|
Other
|
6,957
|
|
13,643
|
|
14,552
|
|
(49.0
|
)%
|
(6.2
|
)%
|
|||||||
|
Total Real Estate operating expense
|
24,639
|
|
48,408
|
|
55,826
|
|
(49.1
|
)%
|
(13.3
|
)%
|
|||||||
|
Gain on sale of real property
|
5,295
|
|
151
|
|
—
|
|
nm
|
|
nm
|
|
|||||||
|
Real Estate Reported EBITDA
|
$
|
2,784
|
|
$
|
(6,915
|
)
|
$
|
(7,040
|
)
|
140.3
|
%
|
1.8
|
%
|
||||
Real Estate Reported EBITDA includes $0.5 million, $1.3 million and $1.7 million of stock-based compensation expense for Fiscal 2016, Fiscal 2015 and Fiscal 2014, respectively.
Our Real Estate operating revenue is primarily determined by the timing of closings and the mix of real estate sold in any given period. Different types of projects have different revenue and profit margins; therefore, as the real estate inventory mix changes it can greatly impact Real Estate segment net revenue, operating expense and Real Estate Reported EBITDA.
Fiscal 2016
Real Estate segment net revenue for Fiscal 2016 was driven primarily by the closing of five condominium units at The Ritz-Carlton Residences, Vail ($15.6 million of revenue with an average selling price per unit of $3.1 million and an average price per square foot of $1,421); two condominium units at One Ski Hill Place in Breckenridge ($2.5 million of revenue with an average selling price per unit of $1.2 million and an average price per square foot of $1,129); and the three remaining condominium units at Crystal Peak Lodge, in Breckenridge ($2.4 million of revenue with an average selling price of $0.8 million and an average price per square foot of $707). The average price per square foot for all three projects is primarily due to their premier locations and the comprehensive and exclusive amenities related to these projects. Additionally, we recorded a gain on sale of real property of $5.3 million (net of $2.1 million in related land basis and cost) for various land parcels which sold for $7.4 million.
Operating expense for Fiscal 2016 included cost of sales of $15.6 million primarily resulting from the closing of five condominium units at The Ritz-Carlton Residences, Vail (average cost per square foot of $1,075); two condominium units at One Ski Hill Place (average cost per square foot of $931); and three condominium units at Crystal Peak Lodge (average cost per square foot of $513). The cost per square foot for the One Ski Hill Place and The Ritz-Carlton Residences, Vail projects is reflective of the high-end features and amenities and high construction costs associated with mountain resort development. Additionally, sales commissions of approximately $1.4 million were incurred commensurate with revenue recognized. Other operating expense of $7.0 million
46
(including $0.5 million of stock-based compensation expense) was primarily comprised of general and administrative costs which includes marketing expense for the real estate available for sale (including those units that have not yet closed), carrying costs for units available for sale and overhead costs, such as labor and labor-related benefits and allocated corporate costs.
Fiscal 2015
Real Estate segment net revenue for Fiscal 2015 was driven primarily by the closing of fourteen condominium units at One Ski Hill Place ($17.1 million of revenue with an average selling price per unit of $1.2 million and an average price per square foot of $1,145) and five condominium units at The Ritz-Carlton Residences, Vail ($13.7 million of revenue with an average selling price per unit of $2.7 million and an average price per square foot of $1,438). Real Estate net revenue also included $8.5 million of revenue from the sale of a development land parcel in Vail and $0.6 million of rental revenue from placing unsold units into our rental program.
Operating expense for Fiscal 2015 included cost of sales of $32.1 million primarily resulting from the closing of fourteen condominium units at One Ski Hill Place (average cost per square foot of $927), five condominium units at The Ritz-Carlton Residences, Vail (average cost per square foot of $1,129) and the sale of a development land parcel in Vail. Additionally, sales commissions of approximately $2.1 million were incurred commensurate with revenue recognized. Other operating expense of $13.6 million (including $1.3 million of stock-based compensation expense) was primarily comprised of general and administrative costs which includes marketing expense for the real estate available for sale (including those units that have not yet closed), carrying costs for units available for sale and overhead costs, such as labor and labor-related benefits and allocated corporate costs.
Fiscal 2014
Real Estate segment net revenue for Fiscal 2014 was driven primarily by the closing of eight condominium units at The Ritz-Carlton Residences, Vail ($32.7 million of revenue with an average selling price per unit of $4.1 million and an average price per square foot of $1,367) and eleven condominium units at One Ski Hill Place ($13.9 million of revenue with an average selling price per unit of $1.3 million and an average price per square foot of $988). In addition, Real Estate net revenue included $1.4 million of rental revenue from placing certain of our unsold units into our rental program.
Operating expense for Fiscal 2014 included cost of sales of $38.5 million resulting from the closing of eight condominium units at The Ritz-Carlton Residences, Vail (average cost per square foot of $1,120) and from the closing of eleven condominium units at One Ski Hill Place (average cost per square foot of $831). Additionally, sales commissions of approximately $2.6 million were incurred commensurate with revenue recognized. Other operating expense of $14.6 million (including $1.7 million of stock-based compensation expense) was primarily comprised of general and administrative costs which includes marketing expense for the real estate available for sale (including those units that have not yet closed), carrying costs for units available for sale and overhead costs, such as labor and labor-related benefits and allocated corporate costs. In addition, other segment operating expense includes $3.8 million (recorded as a credit to other expense) for the recovery of project costs on previously sold units.
Other Items
In addition to segment operating results, the following material items contribute to our overall financial position.
Depreciation and amortization
. Depreciation and amortization expense for both Fiscal 2016 and Fiscal 2015 increased over the applicable prior fiscal year primarily due to an increase in the fixed asset base due to incremental capital expenditures and assets acquired in the Perisher acquisition and the Park City transformation project.
Loss on disposal of fixed assets and other, net
. Loss on disposal of fixed assets and other, net for Fiscal 2016 increased from Fiscal 2015 primarily due to an increase in asset disposals at Park City and Wilmot as a result of significant capital improvements at these resorts.
Change in fair value of contingent consideration
. A loss of $4.2 million was recorded during Fiscal 2016 related to an increase in the estimated fair value of the participating contingent payments to Talisker under the lease for Park City. The fair value of contingent consideration is based on assumptions for EBITDA of Park City, on which participating contingent payments are made, and increases the EBITDA threshold before which participating contingent payments are made by 10% of future capital expenditures associated with Park City. A gain of $3.6 million was recorded during Fiscal 2015 related to a decrease in the estimated fair value of the participating contingent payments to Talisker under the lease for Park City. A loss of $1.4 million was recorded during Fiscal 2014 and was related to an increase in the estimated fair value of the participating contingent payments to Talisker under the lease for Park City. The estimated fair value of the contingent consideration was $11.1 million and $6.9 million as of July 31, 2016 and 2015, respectively.
47
Loss on extinguishment of debt.
In May 2015, we redeemed the remaining $215.0 million of our 6.50% Senior Subordinated Notes (“6.50% Notes”) outstanding and the entire $41.2 million of our Industrial Development Bonds outstanding. As a result, we recorded a loss on extinguishment of debt of $11.0 million in Fiscal 2015 in connection with the redemptions. The loss included early redemption premiums of 3.25% for the 6.50% Notes and 4.00% for the Industrial Development Bonds, or $8.6 million in total, and a $2.4 million write-off of associated unamortized debt issuance costs. There were no amounts outstanding for the 6.50% Notes or Industrial Development Bonds as of July 31, 2015.
In Fiscal 2014 we redeemed $175.0 million of our 6.50% Notes outstanding. As a result, we recorded a loss on extinguishment of debt of $10.8 million in Fiscal 2014 in connection with the redemption. The loss included an early redemption premium of 4.875%, or $8.5 million, for the portion of the principal redeemed, and a $2.3 million write-off of associated unamortized debt issuance costs.
Interest expense.
Interest expense for Fiscal 2016 decreased from Fiscal 2015 primarily due to the redemption of the remaining $215.0 million of our 6.50% Notes outstanding and $41.2 million of our Industrial Development Bonds outstanding, both in May 2015. Interest expense for Fiscal 2015 decreased from Fiscal 2014 primarily due to the redemption of $175.0 million of our 6.50% Notes outstanding in July 2014; redemption of $215.0 million of our 6.50% Notes outstanding; and redemption of the entire $41.2 million of our Industrial Development Bonds outstanding in May 2015; partially offset by interest expense on the borrowings incurred under the Credit Agreement to fund the Park City Mountain Resort and Perisher acquisitions and the $250.0 million term loan facility used to fund the redemption of the 6.50% Notes and Industrial Development Bonds in May 2015.
Income taxes.
Our effective tax rate was 38.4%, 23.2% and 36.0% in Fiscal 2016, Fiscal 2015 and Fiscal 2014, respectively. Our tax provision and effective tax rate are driven primarily by the amount of pre-tax income, which is adjusted for items that are deductible/non-deductible for tax purposes only (i.e. permanent items) and taxable income generated by state jurisdictions that varies from the consolidated pre-tax income. The income tax provision recorded for Fiscal 2015 reflects $23.8 million of income tax benefits due to the reversal of income tax contingencies, including accrued interest and penalties, resulting from a settlement with the Internal Revenue Service (“IRS”) on the utilization of certain net operating losses (“NOLs”), as discussed below.
In 2005, we amended previously filed tax returns (for the tax years from 1997 through 2002) in an effort to remove restrictions under Section 382 of the Internal Revenue Code on approximately $73.8 million of NOLs relating to fresh start accounting from our reorganization in 1992. As a result, we requested a refund related to the amended returns in the amount of $6.2 million and reduced our Federal tax liability in the amount of $19.6 million in subsequent tax returns. In 2006, the IRS completed its examination of our filing position in our amended returns and disallowed our request for refund and our position to remove the restriction on the NOLs. We appealed the examiner’s disallowance of the NOLs to the Office of Appeals. In December 2008, the Office of Appeals denied our appeal, as well as a request for mediation. We disagreed with the IRS interpretation disallowing the utilization of the NOLs and in August 2009, filed a complaint in the United States District Court for the District of Colorado seeking recovery of $6.2 million in over payments that were previously denied by the IRS, plus interest. On July 1, 2011, the District Court granted us summary judgment, concluding that the IRS’s decision disallowing the utilization of the NOLs was inappropriate. The District Court proceedings were stayed pending settlement discussions between the parties. We also filed two related tax proceedings in the United States Tax Court regarding calculation of NOL carryover deductions for tax years 2006, 2007 and 2008. The two proceedings involve substantially the same issues as the litigation in the District Court wherein we disagreed with the IRS as to the utilization of NOLs. The Tax Court proceedings were continued pending settlement discussions between the parties.
In January 2015, the parties completed the execution of a comprehensive settlement agreement resolving all issues and computations in the above mentioned pending proceedings, which allowed us to utilize a significant portion of the NOLs. As a result, we reversed $27.7 million of other long-term liabilities related to uncertain tax benefits, and recorded income tax benefits of $23.8 million for the utilization of the NOLs, including the reversal of accrued interest and penalties, within our Consolidated Statements of Operations for Fiscal 2015.
48
Reconciliation of Segment Earnings
The following table reconciles from segment Reported EBITDA to net income attributable to Vail Resorts, Inc. (in thousands):
|
|
Year Ended July 31,
|
||||||||||
|
|
2016
|
2015
|
2014
|
||||||||
|
Mountain Reported EBITDA
|
$
|
424,415
|
|
$
|
344,104
|
|
$
|
252,050
|
|
||
|
Lodging Reported EBITDA
|
28,169
|
|
21,676
|
|
16,724
|
|
|||||
|
Resort Reported EBITDA
|
452,584
|
|
365,780
|
|
268,774
|
|
|||||
|
Real Estate Reported EBITDA
|
2,784
|
|
(6,915
|
)
|
(7,040
|
)
|
|||||
|
Total Reported EBITDA
|
455,368
|
|
358,865
|
|
261,734
|
|
|||||
|
Depreciation and amortization
|
(161,488
|
)
|
(149,123
|
)
|
(140,601
|
)
|
|||||
|
Loss on disposal of fixed assets and other, net
|
(5,418
|
)
|
(2,057
|
)
|
(1,208
|
)
|
|||||
|
Change in fair value of contingent consideration
|
(4,200
|
)
|
3,650
|
|
(1,400
|
)
|
|||||
|
Investment income, net
|
723
|
|
246
|
|
375
|
|
|||||
|
Interest expense
|
(42,366
|
)
|
(51,241
|
)
|
(63,997
|
)
|
|||||
|
Loss on extinguishment of debt
|
—
|
|
(11,012
|
)
|
(10,831
|
)
|
|||||
|
Income before provision for income taxes
|
242,619
|
|
149,328
|
|
44,072
|
|
|||||
|
Provision for income taxes
|
(93,165
|
)
|
(34,718
|
)
|
(15,866
|
)
|
|||||
|
Net income
|
149,454
|
|
114,610
|
|
28,206
|
|
|||||
|
Net loss attributable to noncontrolling interests
|
300
|
|
144
|
|
272
|
|
|||||
|
Net income attributable to Vail Resorts, Inc.
|
$
|
149,754
|
|
$
|
114,754
|
|
$
|
28,478
|
|
||
The following table reconciles Net Debt (defined as long-term debt plus long-term debt due within one year less cash and cash equivalents) to long-term debt (in thousands):
|
|
July 31,
|
||||||
|
|
2016
|
2015
|
|||||
|
Long-term debt
(1)
|
$
|
686,909
|
|
$
|
804,347
|
|
|
|
Long-term debt due within one year
|
13,354
|
|
10,154
|
|
|||
|
Total debt
|
700,263
|
|
814,501
|
|
|||
|
Less: cash and cash equivalents
|
67,897
|
|
35,459
|
|
|||
|
Net Debt
|
$
|
632,366
|
|
$
|
779,042
|
|
|
|
(1) The Company adopted ASU 2015-03 and ASU 2015-15 as of July 31, 2016, which alters the presentation of debt issuance costs (see Item 8, Note 2). As a result, $2.1 million and $2.3 million of debt issuance costs have been reclassified to Long-term debt as of July 31, 2016 and 2015, respectively.
|
|||||||
Liquidity and Capital Resources
Significant Sources of Cash
Historically, we have lower cash available at our fiscal year-end (as well as at the end of our first fiscal quarter of each year) as compared to our second and third fiscal quarter-ends primarily due to the seasonality of our Mountain segment operations. We had $67.9 million of cash and cash equivalents as of July 31, 2016, compared to $35.5 million as of July 31, 2015. We generated $426.8 million of cash from operating activities during Fiscal 2016 compared to $303.7 million and $245.9 million generated during Fiscal 2015 and Fiscal 2014, respectively. We currently anticipate that our Mountain and Lodging segment operating results will continue to provide a significant source of future operating cash flows (primarily those generated in our second and third fiscal quarters) combined with proceeds from the sale of remaining inventory of real estate available for sale and occasional land sales.
In addition to our $67.9 million of cash and cash equivalents at July 31, 2016, we have $252.8 million available under our Credit Agreement as of July 31, 2016 (which represents the total commitment of $400.0 million less outstanding borrowing of $75.0 million and certain letters of credit outstanding of $72.2 million). We expect that our liquidity needs in the near term will be met
49
by continued use of operating cash flows, borrowings under the Credit Agreement, including the incremental term loan for the Whistler Blackcomb transaction, and proceeds from future real estate closings. We believe the Credit Agreement, which matures in 2020, provides adequate flexibility and is priced favorably with any new borrowings currently being priced at LIBOR plus 1.125%.
Fiscal 2016 compared to Fiscal 2015
We generated $426.8 million of cash from operating activities during Fiscal 2016, an increase of $123.1 million when compared to $303.7 million of cash generated during Fiscal 2015. The increase in operating cash flows was primarily a result of improved Mountain and Lodging segment operating results in Fiscal 2016 compared to Fiscal 2015, excluding the non-cash gain on litigation settlement of $16.4 million recorded in Fiscal 2015; an increase in season pass sales during Fiscal 2016 compared to Fiscal 2015, including a full season of Perisher season pass sales; decreased cash interest payments during Fiscal 2016 compared to Fiscal 2015, primarily as a result from the pay-down and refinancing of our 6.50% Notes and the payment of $8.6 million for the redemption tender premium in Fiscal 2015; a $10.0 million Park City litigation payment to Talisker during Fiscal 2015; and receipt of a $4.5 million key money deposit related to the termination of the Half Moon management agreement during Fiscal 2016. These increases in operating cash inflows were partially offset by a net increase in cash outflows of $26.4 million from the combination of estimated income tax payments made during Fiscal 2016 and the receipt of an income tax refund during Fiscal 2015 in conjunction with the settlement reached with the IRS regarding the utilization of Federal NOLs, and receipt of a $12.5 million legal settlement during Fiscal 2015. Additionally, we generated $19.7 million in proceeds from real estate development project closings (net of sales commissions and deposits previously received) during Fiscal 2016, which is a decrease of $18.0 million as compared to $37.7 million in proceeds (net of sales commissions and deposits previously received) from real estate closings that occurred in Fiscal 2015.
Cash used in investing activities decreased by $303.1 million during Fiscal 2016 compared to Fiscal 2015, primarily due to the acquisitions of Park City Mountain Resort for $182.5 million and Perisher for $124.6 million (net of cash acquired) during Fiscal 2015 as compared to the acquisition of Wilmot for $20.2 million during Fiscal 2016. Additionally, resort capital expenditures during Fiscal 2016 decreased $14.6 million as compared to Fiscal 2015.
Cash used in financing activities increased $386.5 million during Fiscal 2016 compared to Fiscal 2015, primarily due to the net payoff of borrowings under the revolver portion of our Credit Agreement primarily associated with the Perisher acquisition in Fiscal 2015; increased borrowings under the revolver portion of our Credit Agreement primarily for off-season Mountain and Lodging operations and payments on our Credit Agreement term loan; repurchases of our common stock of $53.8 million during Fiscal 2016; and an increase in dividends paid of $28.3 million during Fiscal 2016 compared to Fiscal 2015.
Fiscal 2015 compared to Fiscal 2014
We generated $303.7 million of cash from operating activities in Fiscal 2015, an increase of $57.8 million when compared to the $245.9 million of cash generated in Fiscal 2014. The increase in operating cash flows was primarily a result of improved Mountain (including Park City Mountain Resort and Perisher) and Lodging segment operating results in Fiscal 2015 compared to Fiscal 2014, excluding the non-cash gain on litigation settlement of $16.4 million recorded in Fiscal 2015; receipt of a $12.5 million legal settlement during Fiscal 2015; and lower interest payments of $10.7 million, primarily as a result from the pay-down and refinancing of our 6.50% Notes. These operating cash inflows were partially offset by a $10.0 million Park City litigation payment to Talisker during Fiscal 2015 and a decrease in the growth of accounts payable. Additionally, we generated $37.7 million in proceeds from real estate development project closings (net of sales commissions and deposits previously received) in Fiscal 2015 compared to $42.9 million in proceeds (net of sales commissions and deposits previously received) from real estate development project closings that occurred in Fiscal 2014.
Cash used in investing activities increased by $309.2 million in Fiscal 2015 compared to Fiscal 2014, due to the acquisition of Park City Mountain Resort for $182.5 million and Perisher for $124.6 million (net of cash acquired) during Fiscal 2015 and a $5.6 million increase in resort capital expenditures during Fiscal 2015 compared to Fiscal 2014, partially offset by cash received from the sale of real property.
Cash provided by financing activities increased $337.5 million in Fiscal 2015 compared to Fiscal 2014, primarily due to $185.0 million of net borrowings under the revolving portion of our Credit Agreement to fund the Perisher acquisition and off-season Mountain and Lodging operations, the early redemption of $175.0 million of principal under our 6.50% Notes in Fiscal 2014, an increase in the tax benefit realized for the exercise of stock appreciation rights and options of $8.3 million and a decrease in payments for commitments in conjunction with the Canyons transaction of $5.7 million. These net inflows were partially offset by an increase in the amount of cash dividends paid on our common stock of $30.5 million during Fiscal 2015 compared to Fiscal 2014.
50
Significant Uses of Cash
Capital Expenditures
We have historically invested significant amounts of cash in capital expenditures for our resort operations, and we expect to continue to do so subject to operating performance particularly as it relates to discretionary projects. Current planned capital expenditures primarily include investments that will allow us to maintain our high quality standards, as well as certain incremental discretionary improvements at our mountain resorts and Urban ski areas and throughout our owned hotels. We evaluate additional discretionary capital improvements based on an expected level of return on investment. We currently anticipate we will spend approximately $100 million on resort capital expenditures for calendar year 2016, excluding capital expenditures for summer-related activities of approximately $14 million and one-time transformational investments at Wilmot of approximately $13 million. Included in these estimated capital expenditures is approximately $60 million of maintenance capital expenditures, which are necessary to maintain appearance and level of service appropriate to our resort operations. Discretionary expenditures for calendar year 2016 include, among other projects, a new 500-seat restaurant at the top of Peak 7 in Breckenridge, upgrading the Sun Up chairlift at Vail Mountain (Chair 17) from a fixed-grip triple to a high-speed four-passenger chairlift, renovation of the Pines Lodge in Beaver Creek, revamping our primary websites to a single ‘responsive’ desktop/mobile platform which will be integrated with our data-based and personalized marketing technology, and further upgrading our customer database and our call center technology. Approximately $31 million was spent for capital expenditures in calendar year 2016 as of July 31, 2016, leaving approximately $69 million to spend in the remainder of calendar year 2016, excluding capital expenditures for summer-related activities and one-time transformational investments at Wilmot. We currently plan to utilize cash on hand, borrowings available under our Credit Agreement and/or cash flow generated from future operations to provide the cash necessary to complete our capital plans.
Whistler Blackcomb Acquisition
On August 5, 2016, the Company entered into the Whistler Agreement to acquire all of the outstanding common shares of Whistler Blackcomb. Whistler Blackcomb shareholders will receive total consideration equal to (i) C$17.50 per share in cash, and (ii) 0.0998 shares, subject to a currency exchange rate adjustment to be determined based on the applicable exchange rate as of the sixth business day prior to the closing date. The estimated consideration to be paid to Whistler Blackcomb shareholders is approximately $1.1 billion as of August 5, 2016, based on the closing currency exchange rate and the Company’s common stock as of that day. The Company will finance the cash portion of the consideration of approximately $513 million, subject to adjustment for currency exchange rates, for the Acquisition with a combination of cash and cash equivalents on hand, available revolving borrowing capacity under our Credit Agreement as well as an incremental term loan facility to be incurred through an amendment to the Credit Agreement. The Company has received an executed commitment letter from U.S. Bank, National Association (“U.S. Bank”) and Wells Fargo Bank, National Association (“Wells Fargo”) whereby U.S. Bank and Wells Fargo have committed to provide a $360 million incremental term loan.
Debt
Principal payments on the vast majority of our long-term debt ($662.1 million of the total $702.3 million debt outstanding as of July 31, 2016) are not due until fiscal 2020 and beyond. As of July 31, 2016 and 2015, total long-term debt (including long-term debt due within one year) was $700.3 million and $814.5 million, respectively. Net Debt (defined as long-term debt plus long-term debt due within one year less cash and cash equivalents) decreased from $779.0 million as of July 31, 2015 to $632.4 million as of July 31, 2016, primarily due to payoff of borrowings under the revolving portion of our Credit Agreement.
Our debt service requirements can be impacted by changing interest rates as we had $368.2 million of variable-rate debt outstanding as of July 31, 2016. A 100-basis point change in LIBOR would cause our annual interest payments to change by approximately $3.7 million. Additionally, the annual payments associated with the financing of the Canyons transaction increase by the greater of CPI less 1%, or 2%. The fluctuation in our debt service requirements, in addition to interest rate and inflation changes, may be impacted by future borrowings under our Credit Agreement or other alternative financing arrangements we may enter into. Our long term liquidity needs depend upon operating results that impact the borrowing capacity under the Credit Agreement, which can be mitigated by adjustments to capital expenditures, flexibility of investment activities and the ability to obtain favorable future financing. We can respond to liquidity impacts of changes in the business and economic environment by managing our capital expenditures and the timing of new real estate development activity.
Share Repurchase Program
Our share repurchase program is conducted under authorizations made from time to time by our Board of Directors. Our Board of Directors initially authorized the repurchase of up to 3,000,000 shares of common stock (March 9, 2006) and later authorized additional repurchases of up to 3,000,000 additional shares (July 16, 2008) and 1,500,000 shares (December 4, 2015), for a total authorization to repurchase shares of up to 7,500,000 shares. During Fiscal 2016, we repurchased 485,866 shares of common stock at a cost of $53.8 million. Since inception of this stock repurchase program through July 31, 2016, we have repurchased 5,434,977 shares at a cost of approximately $247.0 million. As of July 31, 2016, 2,065,023 shares remained available to repurchase under
51
the existing repurchase authorization. Shares of common stock purchased pursuant to the repurchase program will be held as treasury shares and may be used for the issuance of shares under the Company’s share award plan. Repurchases under the program may be made from time to time at prevailing prices as permitted by applicable laws, and subject to market conditions and other factors. The timing as well as the number of shares that may be repurchased under the program will depend on several factors, including our future financial performance, our available cash resources and competing uses for cash that may arise in the future, the restrictions in our Credit Agreement, prevailing prices of our common stock and the number of shares that become available for sale at prices that we believe are attractive. The share repurchase program has no expiration date.
Dividend Payments
In fiscal 2011, our Board of Directors approved the commencement of a regular quarterly cash dividend on our common stock at an annual rate of $0.60 per share, subject to quarterly declaration. Since the initial commencement of a regular quarterly cash dividend, our Board of Directors has annually approved an increase to our cash dividend on our common stock and on March 9, 2016, our Board of Directors approved an approximate 30% increase to our quarterly cash dividend to $0.81 per share (or approximately $29.3 million per quarter based upon shares outstanding as of July 31, 2016). For the year ended July 31, 2016, we paid cash dividends of $2.865 per share ($103.8 million in the aggregate.) These dividends were funded through available cash on hand and borrowing under the revolving portion of our Credit Agreement. In conjunction with our pending acquisition of Whistler Blackcomb, which is expected to close in the fall of calendar year 2016, we will be issuing additional shares of Vail Resorts common stock for every share of Whistler Blackcomb common stock outstanding, subject to certain adjustments as contemplated in the Whistler Agreement, which will therefore increase our quarterly dividend payments by an estimated $3.1 million based on a quarterly cash dividend of $0.81 per share. Subject to the discretion of our Board of Directors, applicable law and contractual restrictions, we anticipate paying regular quarterly cash dividends on our common stock for the foreseeable future. The amount, if any, of the dividends to be paid in the future will depend on our available cash on hand, anticipated cash needs, overall financial condition, restrictions contained in our Credit Agreement, future prospects for earnings and cash flows, as well as other factors considered relevant by our Board of Directors.
Covenants and Limitations
We must abide by certain restrictive financial covenants under our Credit Agreement. The most restrictive of those covenants include the following Credit Agreement covenants: Net Funded Debt to Adjusted EBITDA ratio and the Interest Coverage ratio (each as defined in the Credit Agreement). In addition, our Credit Agreement limits our ability to incur certain indebtedness, make certain restricted payments, enter into certain investments, make certain affiliate transfers and may limit our ability to enter into certain mergers, consolidations or sales of assets. Our borrowing availability under the Credit Agreement is primarily determined by the Net Funded Debt to Adjusted EBITDA ratio, which is based on our segment operating performance, as defined in the Credit Agreement.
We were in compliance with all restrictive financial covenants in our debt instruments as of July 31, 2016. We expect that we will continue to meet all applicable financial maintenance covenants in our Credit Agreement, including the Net Funded Debt to Adjusted EBITDA ratio throughout the year ending July 31, 2017. However, there can be no assurance that we will continue to meet such financial covenants. If such covenants are not met, we would be required to seek a waiver or amendment from the banks who are parties to the Credit Agreement. There can be no assurance that such waiver or amendment would be granted, which could have a material adverse impact on our liquidity.
52
Contractual Obligations
As part of our ongoing operations, we enter into arrangements that obligate us to make future payments under contracts such as debt agreements, lease agreements and construction agreements in conjunction with our resort capital expenditures. Debt obligations, which total
$702.3 million
as of July 31, 2016, are recognized as liabilities in our Consolidated Balance Sheet. Obligations under construction contracts are not recognized as liabilities in our Consolidated Balance Sheet until services and/or goods are received which is in accordance with GAAP. Additionally, operating lease and service contract obligations, which total
$312.6 million
as of July 31, 2016, are not recognized as liabilities in our Consolidated Balance Sheet, which is in accordance with GAAP. A summary of our contractual obligations as of July 31, 2016 is presented below (in thousands):
|
|
|
Payments Due by Period
|
|||||||||||||||||
|
|
|
Fiscal
|
2-3
|
4-5
|
More than
|
||||||||||||||
|
Contractual Obligations
|
Total
|
2017
|
years
|
years
|
5 years
|
||||||||||||||
|
Long-Term Debt (Outstanding Principal)
(1)
|
$
|
702,320
|
|
$
|
13,354
|
|
$
|
26,852
|
|
$
|
280,221
|
|
$
|
381,893
|
|
||||
|
Fixed Rate Interest
(1)
|
1,976
|
|
255
|
|
468
|
|
406
|
|
847
|
|
|||||||||
|
Canyons Obligation
(2)
|
1,710,455
|
|
26,632
|
|
54,872
|
|
57,089
|
|
1,571,862
|
|
|||||||||
|
Operating Leases and Service Contracts
(3)
|
312,571
|
|
46,211
|
|
59,885
|
|
48,911
|
|
157,564
|
|
|||||||||
|
Purchase Obligations and Other
(4)
|
439,582
|
|
344,393
|
|
76,604
|
|
6,005
|
|
12,580
|
|
|||||||||
|
Total Contractual Cash Obligations
|
$
|
3,166,904
|
|
$
|
430,845
|
|
$
|
218,681
|
|
$
|
392,632
|
|
$
|
2,124,746
|
|
||||
|
(1)
|
The fixed-rate interest payments, as well as long-term debt payments, included in the table above assume that all debt outstanding as of July 31, 2016 will be held to maturity. Interest payments associated with variable-rate debt have not been included in the table. Assuming that our $368.2 million of variable-rate long-term debt as of July 31, 2016 is held to maturity and utilizing interest rates in effect at July 31, 2016, our annual interest payments (including commitment fees and letter of credit fees) on variable rate long-term debt as of July 31, 2016 is anticipated to be approximately $5.9 million for Fiscal 2017, $5.7 million for Fiscal 2018 and $5.3 million for at least each of the next three years subsequent to Fiscal 2018. The future annual interest obligations noted herein are estimated only in relation to debt outstanding as of July 31, 2016 and do not reflect interest obligations on potential future debt.
|
|
(2)
|
Reflects interest expense payments associated with the remaining lease term of the Canyons obligation, initially 50 years, assuming a 2% per annum (floor) increase in payments. Any potential increases to the annual fixed payment above the 2% floor due to inflation linked index of CPI less 1% have been excluded.
|
|
(3)
|
The payments under noncancelable operating leases included in the table above reflect the applicable minimum lease payments and exclude any potential contingent rent payments.
|
|
(4)
|
Purchase obligations and other primarily include amounts which are classified as trade payables, accrued payroll and benefits, accrued fees and assessments, contingent consideration liability, accrued taxes (including taxes for uncertain tax positions) on our Consolidated Balance Sheet as of July 31, 2016; and, other commitments for goods and services not yet received, including construction contracts, not included on our Consolidated Balance Sheet as of July 31, 2016 in accordance with GAAP.
|
Off Balance Sheet Arrangements
We do not have off balance sheet transactions that are expected to have a material effect on our financial condition, revenue, expenses, results of operations, liquidity, capital expenditures or capital resources.
Critical Accounting Policies
The preparation of Consolidated Financial Statements in conformity with GAAP requires us to select appropriate accounting policies and to make judgments and estimates affecting the application of those accounting policies. In applying our accounting policies, different business conditions or the use of different assumptions may result in materially different amounts reported in the Consolidated Financial Statements.
We have identified the most critical accounting policies which were determined by considering accounting policies that involve the most complex or subjective decisions or assessments. We also have other policies considered key accounting policies; however, these policies do not meet the definition of critical accounting policies because they do not generally require us to make estimates
53
or judgments that are complex or subjective. We have reviewed these critical accounting policies and related disclosures with our Audit Committee of the Board of Directors.
Goodwill and Intangible Assets
Description
The carrying value of goodwill and indefinite-lived intangible assets are evaluated for possible impairment on an annual basis or between annual tests if an event occurs or circumstances change that would more likely than not reduce the estimated fair value of a reporting unit or indefinite-lived intangible asset below its carrying value. Other intangible assets are evaluated for impairment only when there is evidence that events or changes in circumstances indicate that the carrying amount of these assets may not be recoverable. We determine goodwill impairment using a two-step process. The first step is used to identify potential impairment by comparing the estimated fair value of a reporting unit with its carrying amount. If the carrying amount of a reporting unit exceeds its estimated fair value, the second step of the impairment test is performed to measure the amount of impairment loss, if any. If the carrying amount of the reporting unit’s goodwill exceeds the implied estimated fair value of that goodwill, an impairment loss is recognized in an amount equal to that excess. The impairment test for indefinite-lived intangible assets consists of a comparison of the estimated fair value of the intangible asset with its carrying value. If the carrying value of the intangible asset exceeds its estimated fair value, an impairment loss is recognized in an amount equal to that excess.
Judgments and Uncertainties
Application of the goodwill and indefinite-lived intangible asset impairment test requires judgment, including the identification of reporting units, assignment of assets and liabilities to reporting units, assignment of goodwill to reporting units and determination of the estimated fair value of reporting units and indefinite-lived intangible assets. We determine the estimated fair value of our reporting units using a discounted cash flow analysis. The estimated fair value of indefinite-lived intangible assets is primarily determined using the income approach based upon estimated future revenue streams. These analyses require significant judgments, including estimation of future cash flows, which is dependent on internal forecasts, available industry/market data (to the extent available), estimation of the long-term rate of growth for our business including expectations and assumptions regarding the impact of general economic conditions on our business, estimation of the useful life over which cash flows will occur (including terminal multiples), determination of the respective weighted average cost of capital and market participant assumptions. Changes in these estimates and assumptions could materially affect the determination of estimated fair value and impairment for each reporting unit or indefinite-lived intangible asset. We evaluate our reporting units on an annual basis and allocate goodwill to our reporting units based on the reporting units expected to benefit from the acquisition generating the goodwill.
Effect if Actual Results Differ From Assumptions
Goodwill and indefinite-lived intangible assets are tested for impairment at least annually as of May 1
st
. Based upon our annual impairment test performed during the fourth fiscal quarter of Fiscal 2016 the estimated fair value of our reporting units and indefinite-lived intangible assets were in excess of their respective carrying values, and as such no impairment of goodwill or indefinite-lived intangible assets existed and the second step of the goodwill impairment test was not required.
Fair value determinations require considerable judgment and are sensitive to changes in underlying assumptions and factors. As a result, there can be no assurance that the estimates and assumptions made for purposes of the annual goodwill impairment test will prove to be an accurate prediction of the future. Examples of events or circumstances that could reasonably be expected to negatively affect the underlying key assumptions and ultimately impact the estimated fair value of our reporting units may include such items as: (1) prolonged adverse weather conditions resulting in a sustained decline in guest visitation; (2) a prolonged weakness in the general economic conditions in which guest visitation and spending is adversely impacted; and, (3) volatility in the equity and debt markets which could result in a higher discount rate.
While historical performance and current expectations have resulted in estimated fair values of our reporting units in excess of carrying values, if our assumptions are not realized, it is possible that an impairment charge may need to be recorded in the future. However, it is not possible at this time to determine if an impairment charge would result or if such a charge would be material. As of July 31, 2016, we have
$509.0 million
of goodwill and $
80.5 million
of indefinite-lived intangible assets recorded on our Consolidated Balance Sheets. There can be no assurance that the estimates and assumptions made for purposes of the annual goodwill impairment tests for goodwill will prove to be an accurate prediction of the future.
54
Tax Contingencies
Description
We must make certain estimates and judgments in determining income tax expense for financial statement purposes. These estimates and judgments occur in the calculation of tax credits and deductions and in the calculation of certain tax assets and liabilities, which arise from differences in the timing of recognition of revenue and expense for tax and financial statement purposes, as well as the interest and penalties relating to uncertain tax positions. The calculation of our tax liabilities involves dealing with uncertainties in the application of complex tax regulations. We recognize liabilities for uncertain tax positions based on a two-step process. The first step is to evaluate the tax position for recognition by determining if the weight of available evidence indicates that it is more likely than not that the position will be sustained on audit, including resolution of related appeals or litigation processes, if any. The second step requires us to estimate and measure the largest tax benefit that is cumulatively greater than 50% likely of being realized upon ultimate settlement. It is inherently difficult and subjective to estimate such amounts, as this requires us to determine the probability of various possible outcomes. This evaluation is based on factors including, but not limited to, changes in facts or circumstances, changes in tax law, interpretation of tax law, effectively settled issues under audit and new audit activity. A significant amount of time may pass before a particular matter, for which we may have established a reserve, is audited and fully resolved.
Judgments and Uncertainties
The estimates of our tax contingencies reserve contains uncertainty because management must use judgment to estimate the potential exposure associated with our various filing positions.
Effect if Actual Results Differ From Assumptions
We believe the estimates and judgments discussed herein are reasonable and we have adequate reserves for our tax contingencies for uncertain tax positions. Our reserves for uncertain tax positions, including any income tax related interest and penalties ($58.6 million as of July 31, 2016), relate to the treatment of the Talisker lease payments as payments of debt obligations and that the tax basis in Canyons goodwill is deductible. Actual results could differ and we may be exposed to increases or decreases in those reserves and tax provisions that could be material.
An unfavorable tax settlement could require the use of cash and could possibly result in increased tax expense and effective tax rate and/or adjustments to our deferred tax assets and deferred tax liabilities in the year of resolution. A favorable tax settlement could possibly result in a reduction in our tax expense, effective tax rate, income taxes payable, other long-term liabilities and/or adjustments to our deferred tax assets and deferred tax liabilities in the year of settlement or in future years.
Depreciable Lives of Assets
Description
Mountain and lodging operational assets, furniture and fixtures, computer equipment, software, vehicles and leasehold improvements are primarily depreciated using the straight-line method over the estimated useful life of the asset. Assets may become obsolete or require replacement before the end of their useful life in which the remaining book value would be written-off or we could incur costs to remove or dispose of assets no longer in use.
Judgments and Uncertainties
The estimates of our useful lives of the assets contain uncertainty because management must use judgment to estimate the useful life of the asset.
Effect if Actual Results Differ From Assumptions
Although we believe the estimates and judgments discussed herein are reasonable, actual results could differ, and we may be exposed to increased expense related to depreciable assets disposed of, removed or taken out of service prior to its originally estimated useful life, which may be material. A 10% decrease in the estimated useful lives of depreciable assets would have increased depreciation expense by approximately $6.5 million for Fiscal 2016.
55
Business Combinations
Description
A component of our growth strategy has been to acquire and integrate businesses that complement our existing operations. We account for business combinations in accordance with the guidance for business combinations and related literature. Accordingly, we allocate the purchase price of acquired businesses to the identifiable tangible and intangible assets acquired and liabilities assumed based upon their estimated fair values at the date of acquisition. The difference between the purchase price and the estimated fair value of the net assets acquired or the excess of the aggregate estimated fair values of assets acquired and liabilities assumed is recorded as goodwill. In determining the estimated fair values of assets acquired and liabilities assumed in a business combination, we use various recognized valuation methods including present value modeling and referenced market values (where available). Valuations are performed by management or independent valuation specialists under management’s supervision, where appropriate.
Judgments and Uncertainties
Accounting for business combinations requires our management to make significant estimates and assumptions, especially at the acquisition date including our estimates for intangible assets, contractual obligations assumed and contingent consideration, where applicable. Although we believe the assumptions and estimates we have made in the past have been reasonable and appropriate, they are based in part on historical experience and information obtained from the management of the acquired companies and are inherently uncertain. Examples of critical estimates in valuing certain of the intangible assets we have acquired include but are not limited to determination of weighted average cost of capital, market participant assumptions, royalty rates, terminal multiples and estimates of future cash flows to be generated by the acquired assets. In addition to the estimates and assumptions applied to valuing intangible assets acquired, the determination of the estimated fair value of contingent consideration, including estimating the likelihood and timing of achieving the relevant thresholds for contingent consideration payments, requires the use of subjective judgments. We estimate the fair value of the Canyons contingent consideration payments using an option pricing valuation model which incorporates, among other factors, projected achievement of specified financial performance measures, discounts rates, volatility, credit risk and estimation of the long-term rate of growth for the respective business.
Effect if Actual Results Differ From Assumptions
We believe that the estimated fair values assigned to the assets acquired and liabilities assumed are based on reasonable assumptions that a marketplace participant would use. While we use our best estimates and assumptions to accurately value assets acquired and liabilities assumed at the acquisition date our estimates are inherently uncertain and subject to refinement. As a result, during the measurement period, which may be up to one year from the acquisition date, we may record adjustments to the assets acquired and liabilities assumed with the corresponding offset to goodwill. Upon the conclusion of the measurement period or final determination of the estimated fair values of assets acquired or liabilities assumed, whichever comes first, any subsequent adjustments would be recorded in our Consolidated Statements of Operations.
We recognize the fair value of contingent consideration at the date of acquisition as part of the consideration transferred to acquire a business. The liability associated with contingent consideration is remeasured to fair value at each reporting period subsequent to the date of acquisition taking into consideration changes in financial projections and long-term growth rates, among other factors, that may impact the timing and amount of contingent consideration payments until the term of the agreement has expired or the contingency is resolved. Increases in the fair value of contingent consideration are recorded as losses in our Consolidated Statements of Operations, while decreases in fair value are recorded as gains.
New Accounting Standards
Refer to Note 2, Summary of Significant Accounting Policies, of the Notes to Consolidated Financial Statements for a discussion of new accounting standards.
Inflation
Although we cannot accurately determine the precise effect of inflation on our operations, management does not believe inflation has had a material effect on the results of operations in the last three fiscal years. When the costs of operating resorts increase, we generally have been able to pass the increase on to our customers. However, there can be no assurance that increases in labor and other operating costs due to inflation will not have an impact on our future profitability.
In May 2013, we entered into a long-term lease pursuant to which we assumed the operations of Canyons which includes the ski terrain and related amenities. The lease has an initial term of 50 years with six 50-year renewal options. The lease provides for $25 million in annual payments, which increase each year by an inflation linked index of CPI less 1%, with a floor of 2% per annum. As lease payments increase annually, there can be no assurance that these increases will be off-set by increased cash flow generated from operations at Park City.
56
Seasonality and Quarterly Results
Our mountain and lodging operations are seasonal in nature. In particular, revenue and profits for our U.S. mountain and most of our lodging operations are substantially lower and historically result in losses from late spring to late fall. Conversely, peak operating seasons for our NPS concessionaire properties, our mountain resort golf courses and Perisher’s ski season occur during the U.S. summer months while the U.S. winter months result in operating losses. Revenue and profits generated by NPS concessionaire properties summer operations, golf operations and Perisher’s ski operations are not sufficient to fully offset our off-season losses from our U.S. mountain and other lodging operations. During Fiscal 2016, 79% of total combined Mountain and Lodging segment net revenue (excluding Lodging segment revenue associated with reimbursement of payroll costs) was earned during the second and third fiscal quarters. Therefore, the operating results for any three-month period are not necessarily indicative of the results that may be achieved for any subsequent quarter or for a full year (see Notes to Consolidated Financial Statements).
Interest Rate Risk.
Our exposure to market risk is limited primarily to the fluctuating interest rates associated with variable rate indebtedness. At July 31, 2016, we had $368.2 million of variable rate indebtedness, representing approximately 52.6% of our total debt outstanding, at an average interest rate during Fiscal 2016 of 1.5%. Based on variable-rate borrowings outstanding as of July 31, 2016, a 100-basis point (or 1.0%) change in LIBOR would result in our annual interest payments changing by $3.7 million. Our market risk exposure fluctuates based on changes in underlying interest rates.
Foreign Currency Exchange Rate Risk.
We are exposed to currency translation risk because the results of our international entities are reported in local currency, which we then translate to U.S. dollars for inclusion in our consolidated financial statements. As a result, changes between the foreign exchange rates, in particular the Australian dollar and the U.S. dollar, affect the amounts we record for our foreign assets, liabilities, revenues and expenses, and could have a negative effect on our financial results. We currently do not enter into hedging arrangements to minimize the impact of foreign currency fluctuations.
The following table summarizes the amounts of foreign currency translation income (losses) (in thousands):
|
Year Ended July 31,
|
||||||
|
2016
|
2015
|
|||||
|
Foreign currency translation adjustments and other, net of tax
|
$
|
3,363
|
|
$
|
(4,714
|
)
|
57
|
ITEM 8.
|
FINANCIAL STATEMENTS AND SUPPLEMENTARY DATA.
|
Vail Resorts, Inc.
Consolidated Financial Statements for the Years Ended July 31, 2016, 2015 and 2014
|
Consolidated Financial Statements
|
|
58
Management’s Report on Internal Control over Financial Reporting
Management of Vail Resorts, Inc. (the “Company”) is responsible for establishing and maintaining adequate internal control over financial reporting, as such term is defined in Rules 13a-15(f) and 15d-15(f) of the Securities Exchange Act of 1934. The Company’s internal control over financial reporting is designed to provide reasonable assurance regarding the reliability of financial reporting and the preparation of financial statements for external purposes in accordance with generally accepted accounting principles in the United States of America.
Because of its inherent limitations, internal control over financial reporting may not prevent or detect misstatements. Also, projections of any evaluation of the effectiveness of internal control over financial reporting to future periods are subject to the risk that the controls may become inadequate because of changes in conditions, or that the degree of compliance with the policies or procedures may deteriorate.
Management, including the Company’s Chief Executive Officer and Chief Financial Officer, assessed the effectiveness of the Company’s internal control over financial reporting as of July 31, 2016. In making this assessment, management used the criteria established in
Internal Control-Integrated Framework
issued by the Committee of Sponsoring Organizations of the Treadway Commission in 2013. Based on this assessment, management concluded that, as of July 31, 2016, the Company’s internal control over financial reporting was effective.
The Company’s independent registered public accounting firm, PricewaterhouseCoopers LLP, has issued an attestation report on the effectiveness of the Company’s internal control over financial reporting as of July 31, 2016, as stated in the Report of Independent Registered Public Accounting Firm on the following page.
59
Report of Independent Registered Public Accounting Firm
To Board of Directors and Shareholders
of Vail Resorts, Inc.:
In our opinion, the consolidated financial statements listed in the accompanying index present fairly, in all material respects, the financial position of Vail Resorts, Inc.
and its subsidiaries
at July 31, 2016
and 2015, and the results of their operations and their cash flows for each of the three years in the period ended July 31, 2016
in conformity with accounting principles generally accepted in the United States of America. Also in our opinion, the Company maintained, in all material respects, effective internal control over financial reporting as of July 31, 2016, based on criteria established in
Internal Control - Integrated Framework
issued by the Committee of Sponsoring Organizations of the Treadway Commission in 2013. The Company's management is responsible for these financial statements, for maintaining effective internal control over financial reporting and for its assessment of the effectiveness of internal control over financial reporting, included in the accompanying Management's Report on Internal Control over Financial Reporting. Our responsibility is to express opinions on these financial statements and on the Company's internal control over financial reporting based on our integrated audits. We conducted our audits in accordance with the standards of the Public Company Accounting Oversight Board (United States). Those standards require that we plan and perform the audits to obtain reasonable assurance about whether the financial statements are free of material misstatement and whether effective internal control over financial reporting was maintained in all material respects. Our audits of the financial statements included examining, on a test basis, evidence supporting the amounts and disclosures in the financial statements, assessing the accounting principles used and significant estimates made by management, and evaluating the overall financial statement presentation. Our audit of internal control over financial reporting included obtaining an understanding of internal control over financial reporting, assessing the risk that a material weakness exists, and testing and evaluating the design and operating effectiveness of internal control based on the assessed risk. Our audits also included performing such other procedures as we considered necessary in the circumstances. We believe that our audits provide a reasonable basis for our opinions.
As discussed in Note 2 to the consolidated financial statements, the Company changed the manner in which it classifies deferred income taxes in fiscal 2016.
A company’s internal control over financial reporting is a process designed to provide reasonable assurance regarding the reliability of financial reporting and the preparation of financial statements for external purposes in accordance with generally accepted accounting principles. A company’s internal control over financial reporting includes those policies and procedures that (i) pertain to the maintenance of records that, in reasonable detail, accurately and fairly reflect the transactions and dispositions of the assets of the company; (ii) provide reasonable assurance that transactions are recorded as necessary to permit preparation of financial statements in accordance with generally accepted accounting principles, and that receipts and expenditures of the company are being made only in accordance with authorizations of management and directors of the company; and (iii) provide reasonable assurance regarding prevention or timely detection of unauthorized acquisition, use, or disposition of the company’s assets that could have a material effect on the financial statements.
Because of its inherent limitations, internal control over financial reporting may not prevent or detect misstatements. Also, projections of any evaluation of effectiveness to future periods are subject to the risk that controls may become inadequate because of changes in conditions, or that the degree of compliance with the policies or procedures may deteriorate.
/s/ PricewaterhouseCoopers LLP
Denver, Colorado
September 25, 2016
60
Vail Resorts, Inc.
(In thousands, except share and per share amounts)
|
|
July 31,
|
|||||
|
|
2016
|
2015
|
||||
|
Assets
|
||||||
|
Current assets:
|
||||||
|
Cash and cash equivalents
|
$
|
67,897
|
|
$
|
35,459
|
|
|
Restricted cash
|
6,046
|
|
13,012
|
|
||
|
Trade receivables, net of allowances of $616 and $746, respectively
|
147,113
|
|
113,990
|
|
||
|
Inventories, net of reserves of $1,713 and $1,915, respectively
|
74,589
|
|
73,485
|
|
||
|
Deferred income taxes (Note 10)
|
—
|
|
27,962
|
|
||
|
Other current assets
|
27,220
|
|
24,235
|
|
||
|
Total current assets
|
322,865
|
|
288,143
|
|
||
|
Property, plant and equipment, net (Note 6)
|
1,363,814
|
|
1,386,275
|
|
||
|
Real estate held for sale and investment
|
111,088
|
|
129,825
|
|
||
|
Deferred charges and other assets
|
35,207
|
|
38,467
|
|
||
|
Goodwill, net (Note 6)
|
509,037
|
|
500,433
|
|
||
|
Intangible assets, net (Note 6)
|
140,007
|
|
144,149
|
|
||
|
Total assets
|
$
|
2,482,018
|
|
$
|
2,487,292
|
|
|
Liabilities and Stockholders’ Equity
|
||||||
|
Current liabilities:
|
||||||
|
Accounts payable and accrued liabilities (Note 6)
|
$
|
397,488
|
|
$
|
331,299
|
|
|
Income taxes payable
|
95,639
|
|
57,194
|
|
||
|
Long-term debt due within one year (Note 4)
|
13,354
|
|
10,154
|
|
||
|
Total current liabilities
|
506,481
|
|
398,647
|
|
||
|
Long-term debt (Note 4)
|
686,909
|
|
804,347
|
|
||
|
Other long-term liabilities (Note 6)
|
270,168
|
|
255,916
|
|
||
|
Deferred income taxes (Note 10)
|
129,994
|
|
147,796
|
|
||
|
Total liabilities
|
1,593,552
|
|
1,606,706
|
|
||
|
Commitments and contingencies (Note 12)
|
|
|
|
|
||
|
Stockholders’ equity:
|
||||||
|
Preferred stock, $0.01 par value, 25,000,000 shares authorized, no shares issued and outstanding
|
—
|
|
—
|
|
||
|
Common stock, $0.01 par value, 100,000,000 shares authorized and 41,614,432 and 41,462,941 shares issued, respectively
|
416
|
|
415
|
|
||
|
Additional paid-in capital
|
635,986
|
|
623,510
|
|
||
|
Accumulated other comprehensive loss
|
(1,550
|
)
|
(4,913
|
)
|
||
|
Retained earnings
|
486,667
|
|
440,748
|
|
||
|
Treasury stock, at cost; 5,434,977 and 4,949,111 shares, respectively (Note 15)
|
(246,979
|
)
|
(193,192
|
)
|
||
|
Total Vail Resorts, Inc. stockholders’ equity
|
874,540
|
|
866,568
|
|
||
|
Noncontrolling interests
|
13,926
|
|
14,018
|
|
||
|
Total stockholders’ equity
|
888,466
|
|
880,586
|
|
||
|
Total liabilities and stockholders’ equity
|
$
|
2,482,018
|
|
$
|
2,487,292
|
|
The accompanying Notes are an integral part of these consolidated financial statements.
61
Vail Resorts, Inc.
(In thousands, except per share amounts)
|
|
Year Ended July 31,
|
||||||||
|
|
2016
|
2015
|
2014
|
||||||
|
Net revenue:
|
|||||||||
|
Mountain
|
$
|
1,304,604
|
|
$
|
1,104,029
|
|
$
|
963,573
|
|
|
Lodging
|
274,554
|
|
254,553
|
|
242,287
|
|
|||
|
Real Estate
|
22,128
|
|
41,342
|
|
48,786
|
|
|||
|
Total net revenue
|
1,601,286
|
|
1,399,924
|
|
1,254,646
|
|
|||
|
Segment operating expense (exclusive of depreciation and amortization shown separately below):
|
|||||||||
|
Mountain
|
881,472
|
|
777,147
|
|
712,785
|
|
|||
|
Lodging
|
246,385
|
|
232,877
|
|
225,563
|
|
|||
|
Real Estate
|
24,639
|
|
48,408
|
|
55,826
|
|
|||
|
Total segment operating expense
|
1,152,496
|
|
1,058,432
|
|
994,174
|
|
|||
|
Other operating (expense) income:
|
|||||||||
|
Depreciation and amortization
|
(161,488
|
)
|
(149,123
|
)
|
(140,601
|
)
|
|||
|
Gain on sale of real property
|
5,295
|
|
151
|
|
—
|
|
|||
|
Gain on litigation settlement (Note 5)
|
—
|
|
16,400
|
|
—
|
|
|||
|
Change in fair value of contingent consideration (Note 9)
|
(4,200
|
)
|
3,650
|
|
(1,400
|
)
|
|||
|
Loss on disposal of fixed assets and other, net
|
(5,418
|
)
|
(2,057
|
)
|
(1,208
|
)
|
|||
|
Income from operations
|
282,979
|
|
210,513
|
|
117,263
|
|
|||
|
Mountain equity investment income, net
|
1,283
|
|
822
|
|
1,262
|
|
|||
|
Investment income, net
|
723
|
|
246
|
|
375
|
|
|||
|
Interest expense
|
(42,366
|
)
|
(51,241
|
)
|
(63,997
|
)
|
|||
|
Loss on extinguishment of debt (Note 4)
|
—
|
|
(11,012
|
)
|
(10,831
|
)
|
|||
|
Income before provision for income taxes
|
242,619
|
|
149,328
|
|
44,072
|
|
|||
|
Provision for income taxes (Note 10)
|
(93,165
|
)
|
(34,718
|
)
|
(15,866
|
)
|
|||
|
Net income
|
$
|
149,454
|
|
$
|
114,610
|
|
$
|
28,206
|
|
|
Net loss attributable to noncontrolling interests
|
300
|
|
144
|
|
272
|
|
|||
|
Net income attributable to Vail Resorts, Inc.
|
$
|
149,754
|
|
$
|
114,754
|
|
$
|
28,478
|
|
|
Per share amounts (Note 3):
|
|||||||||
|
Basic net income per share attributable to Vail Resorts, Inc.
|
$
|
4.13
|
|
$
|
3.16
|
|
$
|
0.79
|
|
|
Diluted net income per share attributable to Vail Resorts, Inc.
|
$
|
4.01
|
|
$
|
3.07
|
|
$
|
0.77
|
|
|
Cash dividends declared per share
|
$
|
2.865
|
|
$
|
2.075
|
|
$
|
1.245
|
|
The accompanying Notes are an integral part of these consolidated financial statements.
62
Vail Resorts, Inc.
Consolidated Statements of Comprehensive Income
(In thousands)
|
Year Ended July 31,
|
|||||||||
|
|
2016
|
2015
|
2014
|
||||||
|
Net income
|
$
|
149,454
|
|
$
|
114,610
|
|
$
|
28,206
|
|
|
Foreign currency translation adjustments and other (net of tax of ($1,905), $2,578 and $82, respectively)
|
3,363
|
|
(4,714
|
)
|
(132
|
)
|
|||
|
Comprehensive income
|
152,817
|
|
109,896
|
|
28,074
|
|
|||
|
Comprehensive loss attributable to noncontrolling interests
|
300
|
|
144
|
|
272
|
|
|||
|
Comprehensive income attributable to Vail Resorts, Inc.
|
$
|
153,117
|
|
$
|
110,040
|
|
$
|
28,346
|
|
The accompanying Notes are an integral part of these consolidated financial statements.
63
Vail Resorts, Inc.
Consolidated Statements of Stockholders’ Equity
(In thousands, except share amounts)
|
|
Common Stock
|
Additional
Paid in
Capital
|
Retained
Earnings
|
Treasury
Stock
|
Accumulated Other Comprehensive Loss
|
Total Vail
Resorts, Inc.
Stockholders’
Equity
|
Noncontrolling
Interests
|
Total
Stockholders’
Equity
|
||||||||||||||||||
|
|
Shares
|
Amount
|
|
|
|
|
|
|
||||||||||||||||||
|
Balance, July 31, 2013
|
40,903,731
|
|
$
|
409
|
|
$
|
598,675
|
|
$
|
418,043
|
|
$
|
(193,192
|
)
|
$
|
(67
|
)
|
$
|
823,868
|
|
$
|
14,001
|
|
$
|
837,869
|
|
|
Comprehensive income (loss):
|
||||||||||||||||||||||||||
|
Net income (loss)
|
—
|
|
—
|
|
—
|
|
28,478
|
|
—
|
|
—
|
|
28,478
|
|
(272
|
)
|
28,206
|
|
||||||||
|
Foreign currency translation adjustments, net of tax
|
—
|
|
—
|
|
—
|
|
—
|
|
—
|
|
(132
|
)
|
(132
|
)
|
—
|
|
(132
|
)
|
||||||||
|
Total comprehensive income (loss)
|
28,346
|
|
(272
|
)
|
28,074
|
|
||||||||||||||||||||
|
Stock-based compensation (Note 16)
|
—
|
|
—
|
|
14,224
|
|
—
|
|
—
|
|
—
|
|
14,224
|
|
—
|
|
14,224
|
|
||||||||
|
Issuance of shares under share award plan net of shares withheld for taxes (Note 16)
|
249,069
|
|
3
|
|
(4,738
|
)
|
—
|
|
—
|
|
—
|
|
(4,735
|
)
|
—
|
|
(4,735
|
)
|
||||||||
|
Tax benefit from share award plan
|
—
|
|
—
|
|
4,161
|
|
—
|
|
—
|
|
—
|
|
4,161
|
|
—
|
|
4,161
|
|
||||||||
|
Dividends
|
—
|
|
—
|
|
—
|
|
(45,021
|
)
|
—
|
|
—
|
|
(45,021
|
)
|
—
|
|
(45,021
|
)
|
||||||||
|
Contributions from noncontrolling interests, net
|
—
|
|
—
|
|
—
|
|
—
|
|
—
|
|
—
|
|
—
|
|
228
|
|
228
|
|
||||||||
|
Balance, July 31, 2014
|
41,152,800
|
|
412
|
|
612,322
|
|
401,500
|
|
(193,192
|
)
|
(199
|
)
|
820,843
|
|
13,957
|
|
834,800
|
|
||||||||
|
Comprehensive income (loss):
|
||||||||||||||||||||||||||
|
Net income (loss)
|
—
|
|
—
|
|
—
|
|
114,754
|
|
—
|
|
—
|
|
114,754
|
|
(144
|
)
|
114,610
|
|
||||||||
|
Foreign currency translation adjustments, net of tax
|
—
|
|
—
|
|
—
|
|
—
|
|
—
|
|
(4,714
|
)
|
(4,714
|
)
|
—
|
|
(4,714
|
)
|
||||||||
|
Total comprehensive income (loss)
|
110,040
|
|
(144
|
)
|
109,896
|
|
||||||||||||||||||||
|
Stock-based compensation (Note 16)
|
—
|
|
—
|
|
15,753
|
|
—
|
|
—
|
|
—
|
|
15,753
|
|
—
|
|
15,753
|
|
||||||||
|
Issuance of shares under share award plan net of shares withheld for taxes (Note 16)
|
310,141
|
|
3
|
|
(17,189
|
)
|
—
|
|
—
|
|
—
|
|
(17,186
|
)
|
—
|
|
(17,186
|
)
|
||||||||
|
Tax benefit from share award plan
|
—
|
|
—
|
|
12,624
|
|
—
|
|
—
|
|
—
|
|
12,624
|
|
—
|
|
12,624
|
|
||||||||
|
Dividends
|
—
|
|
—
|
|
—
|
|
(75,506
|
)
|
—
|
|
—
|
|
(75,506
|
)
|
—
|
|
(75,506
|
)
|
||||||||
|
Contributions from noncontrolling interests, net
|
—
|
|
—
|
|
—
|
|
—
|
|
—
|
|
—
|
|
—
|
|
205
|
|
205
|
|
||||||||
|
Balance, July 31, 2015
|
41,462,941
|
|
415
|
|
623,510
|
|
440,748
|
|
(193,192
|
)
|
(4,913
|
)
|
866,568
|
|
14,018
|
|
880,586
|
|
||||||||
|
Comprehensive income (loss):
|
||||||||||||||||||||||||||
|
Net income (loss)
|
—
|
|
—
|
|
—
|
|
149,754
|
|
—
|
|
—
|
|
149,754
|
|
(300
|
)
|
149,454
|
|
||||||||
|
Foreign currency translation adjustments and other, net of tax
|
—
|
|
—
|
|
—
|
|
—
|
|
—
|
|
3,363
|
|
3,363
|
|
—
|
|
3,363
|
|
||||||||
|
Total comprehensive income (loss)
|
153,117
|
|
(300
|
)
|
152,817
|
|
||||||||||||||||||||
|
Stock-based compensation (Note 16)
|
—
|
|
—
|
|
17,025
|
|
—
|
|
—
|
|
—
|
|
17,025
|
|
—
|
|
17,025
|
|
||||||||
|
Issuance of shares under share award plan net of shares withheld for taxes (Note 16)
|
151,491
|
|
1
|
|
(10,216
|
)
|
—
|
|
—
|
|
—
|
|
(10,215
|
)
|
—
|
|
(10,215
|
)
|
||||||||
|
Tax benefit from share award plan
|
—
|
|
—
|
|
5,667
|
|
—
|
|
—
|
|
—
|
|
5,667
|
|
—
|
|
5,667
|
|
||||||||
|
Repurchases of common stock
|
—
|
|
—
|
|
—
|
|
—
|
|
(53,787
|
)
|
—
|
|
(53,787
|
)
|
—
|
|
(53,787
|
)
|
||||||||
|
Dividends
|
—
|
|
—
|
|
—
|
|
(103,835
|
)
|
—
|
|
—
|
|
(103,835
|
)
|
—
|
|
(103,835
|
)
|
||||||||
|
Contributions from noncontrolling interests, net
|
—
|
|
—
|
|
—
|
|
—
|
|
—
|
|
—
|
|
—
|
|
208
|
|
208
|
|
||||||||
|
Balance, July 31, 2016
|
41,614,432
|
|
$
|
416
|
|
$
|
635,986
|
|
$
|
486,667
|
|
$
|
(246,979
|
)
|
$
|
(1,550
|
)
|
$
|
874,540
|
|
$
|
13,926
|
|
$
|
888,466
|
|
The accompanying Notes are an integral part of these consolidated financial statements.
64
Vail Resorts, Inc.
(In thousands)
|
|
Year Ended July 31,
|
||||||||
|
|
2016
|
2015
|
2014
|
||||||
|
Cash flows from operating activities:
|
|||||||||
|
Net income
|
$
|
149,454
|
|
$
|
114,610
|
|
$
|
28,206
|
|
|
Adjustments to reconcile net income to net cash provided by operating activities:
|
|||||||||
|
Depreciation and amortization
|
161,488
|
|
149,123
|
|
140,601
|
|
|||
|
Cost of real estate sales
|
15,724
|
|
32,190
|
|
37,400
|
|
|||
|
Stock-based compensation expense
|
17,025
|
|
15,753
|
|
14,224
|
|
|||
|
Deferred income taxes, net
|
7,626
|
|
12,968
|
|
6,219
|
|
|||
|
Canyons obligation accreted interest expense
|
5,644
|
|
5,596
|
|
5,544
|
|
|||
|
Change in fair value of contingent consideration
|
4,200
|
|
(3,650
|
)
|
1,400
|
|
|||
|
Gain on litigation settlement
|
—
|
|
(16,400
|
)
|
—
|
|
|||
|
Park City litigation settlement payment
|
—
|
|
(10,000
|
)
|
—
|
|
|||
|
Gain on sale of real property
|
(5,295
|
)
|
(151
|
)
|
—
|
|
|||
|
Loss on extinguishment of debt
|
—
|
|
11,012
|
|
10,831
|
|
|||
|
Payment of tender premium
|
—
|
|
(8,636
|
)
|
(8,531
|
)
|
|||
|
Other non-cash income, net
|
(8,044
|
)
|
(6,930
|
)
|
(8,570
|
)
|
|||
|
Changes in assets and liabilities, net of effects of acquisitions:
|
|||||||||
|
Restricted cash
|
6,966
|
|
162
|
|
(559
|
)
|
|||
|
Accounts receivable, net
|
(32,991
|
)
|
(15,350
|
)
|
(17,007
|
)
|
|||
|
Inventories, net
|
(843
|
)
|
(1,304
|
)
|
1,332
|
|
|||
|
Accounts payable and accrued liabilities
|
42,367
|
|
4,498
|
|
20,724
|
|
|||
|
Income taxes payable
|
56,553
|
|
41,783
|
|
12,198
|
|
|||
|
Other assets and liabilities, net
|
6,888
|
|
(21,614
|
)
|
1,866
|
|
|||
|
Net cash provided by operating activities
|
426,762
|
|
303,660
|
|
245,878
|
|
|||
|
Cash flows from investing activities:
|
|||||||||
|
Capital expenditures
|
(109,237
|
)
|
(123,884
|
)
|
(118,305
|
)
|
|||
|
Acquisition of businesses, net of cash acquired
|
(20,245
|
)
|
(307,051
|
)
|
—
|
|
|||
|
Cash received from sale of real property
|
7,386
|
|
2,541
|
|
—
|
|
|||
|
Other investing activities, net
|
(1,920
|
)
|
1,326
|
|
399
|
|
|||
|
Net cash used in investing activities
|
(124,016
|
)
|
(427,068
|
)
|
(117,906
|
)
|
|||
|
Cash flows from financing activities:
|
|||||||||
|
Proceeds from borrowings under Credit Facility Term Loan
|
—
|
|
250,000
|
|
—
|
|
|||
|
Proceeds from borrowings under Credit Facility Revolver
|
210,000
|
|
438,000
|
|
—
|
|
|||
|
Payments on tender of 6.50% Notes
|
—
|
|
(215,000
|
)
|
(175,000
|
)
|
|||
|
Payments on tender of Industrial Development Bonds
|
—
|
|
(41,200
|
)
|
—
|
|
|||
|
Payments on Credit Facility Revolver
|
(320,000
|
)
|
(253,000
|
)
|
—
|
|
|||
|
Payments on Credit Facility Term Loan
|
(9,375
|
)
|
—
|
|
—
|
|
|||
|
Payments of other long-term debt
|
(266
|
)
|
(1,022
|
)
|
(998
|
)
|
|||
|
Repurchases of common stock
|
(53,787
|
)
|
—
|
|
—
|
|
|||
|
Dividends paid
|
(103,835
|
)
|
(75,506
|
)
|
(45,021
|
)
|
|||
|
Other financing activities, net
|
6,046
|
|
12,979
|
|
(1,193
|
)
|
|||
|
Net cash (used in) provided by financing activities
|
(271,217
|
)
|
115,251
|
|
(222,212
|
)
|
|||
|
Effect of exchange rate changes on cash and cash equivalents
|
909
|
|
(790
|
)
|
42
|
|
|||
|
Net increase (decrease) in cash and cash equivalents
|
32,438
|
|
(8,947
|
)
|
(94,198
|
)
|
|||
|
Cash and cash equivalents:
|
|||||||||
|
Beginning of period
|
$
|
35,459
|
|
$
|
44,406
|
|
$
|
138,604
|
|
|
End of period
|
$
|
67,897
|
|
$
|
35,459
|
|
$
|
44,406
|
|
|
Cash paid for interest
|
$
|
33,243
|
|
$
|
46,483
|
|
$
|
57,217
|
|
|
Taxes paid (refunded), net
|
$
|
21,994
|
|
$
|
(4,421
|
)
|
$
|
(6,787
|
)
|
|
Non-cash investing activities:
|
|||||||||
|
Accrued capital expenditures
|
$
|
16,267
|
|
$
|
6,267
|
|
$
|
12,254
|
|
|
Capital expenditures made under long-term financing
|
$
|
—
|
|
$
|
7,037
|
|
$
|
—
|
|
The accompanying Notes are an integral part of these consolidated financial statements.
65
Notes to Consolidated Financial Statements
1.
Organization and Business
Vail Resorts, Inc. (“Vail Resorts”) is organized as a holding company and operates through various subsidiaries. Vail Resorts and its subsidiaries (collectively, the “Company”) operate in three business segments: Mountain, Lodging and Real Estate.
In the Mountain segment, the Company operates nine world-class mountain resort properties including Vail, Breckenridge, Keystone and Beaver Creek mountain resorts in Colorado; Park City mountain resort in Utah (“Park City” comprised of the former Park City Mountain Resort acquired in September 2014 and the former Canyons Resort (“Canyons”) in Park City, Utah); Heavenly, Northstar and Kirkwood mountain resorts in the Lake Tahoe area of California and Nevada; Perisher Ski Resort (“Perisher,” acquired in June 2015) in New South Wales, Australia; and the ski areas of Wilmot Mountain in Wisconsin (“Wilmot,” acquired in January 2016), Afton Alps in Minnesota and Mount Brighton in Michigan (“Urban” ski areas); as well as ancillary services, primarily including ski school, dining and retail/rental operations, and for Perisher including lodging and transportation operations. The resorts located in the United States (“U.S.”), except for Northstar, Park City and the Urban ski areas, operate primarily on federal land under the terms of Special Use Permits granted by the United States Department of Agriculture Forest Service (the “Forest Service”). The operations of Perisher are conducted pursuant to a long-term lease and license on land owned by the government of New South Wales, Australia.
In the Lodging segment, the Company owns and/or manages a collection of luxury hotels and condominiums under its RockResorts brand, as well as other strategic lodging properties and a large number of condominiums located in proximity to the Company’s U.S. mountain resorts, National Park Service (“NPS”) concessionaire properties including the Grand Teton Lodge Company (“GTLC”), which operates destination resorts in Grand Teton National Park, Colorado Mountain Express (“CME”), a Colorado resort ground transportation company, and mountain resort golf courses.
Vail Resorts Development Company (“VRDC”), a wholly-owned subsidiary, conducts the operations of the Company’s Real Estate segment, which owns, develops and sells real estate in and around the Company’s resort communities.
The Company’s mountain business and its lodging properties at or around the Company’s mountain resorts are seasonal in nature with peak operating seasons primarily from mid-November through mid-April in the U.S. The Company’s operating season at Perisher, its NPS concessionaire properties and its golf courses generally occur from June to early October. The Company also has non-majority owned investments in various other entities, some of which are consolidated (see Note 8, Variable Interest Entities).
|
2.
|
Summary of Significant Accounting Policies
|
Principles of Consolidation--
The accompanying Consolidated Financial Statements include the accounts of the Company, its majority-owned subsidiaries and all variable interest entities for which the Company is the primary beneficiary. Investments in which the Company does not have a controlling interest or is not the primary beneficiary are accounted for under the equity method. All significant intercompany transactions have been eliminated in consolidation.
Cash and Cash Equivalents--
The Company considers all highly liquid investments with maturities of three months or less at the date of purchase to be cash equivalents.
Trade Receivables
-- The Company records trade accounts receivable in the normal course of business related to the sale of products or services. The Company generally charges interest on past due accounts at a rate of
18%
per annum. The allowance for doubtful accounts is based on a specific reserve analysis and on a percentage of accounts receivable, and takes into consideration such factors as historical write-offs, the economic climate and other factors that could affect collectability. Write-offs are evaluated on a case by case basis.
Inventories--
The Company’s inventories consist primarily of purchased retail goods, food and beverage items and spare parts. Inventories are stated at the lower of cost or fair value, determined using primarily an average weighted cost method. The Company records a reserve for estimated shrinkage and obsolete or unusable inventory.
66
Property, Plant and Equipment--
Property, plant and equipment is carried at cost net of accumulated depreciation. Repairs and maintenance are expensed as incurred. Expenditures that improve the functionality of the related asset or extend the useful life are capitalized. When property, plant and equipment is retired or otherwise disposed of, the related gain or loss is included in operating income. Leasehold improvements are amortized on the straight-line method over the shorter of the remaining lease term or estimated useful life of the asset. Depreciation is calculated on the straight-line method, including property, plant and equipment under capital leases, generally based on the following useful lives:
|
|
Estimated Life
in Years
|
|
Land improvements
|
10-35
|
|
Buildings and building improvements
|
7-30
|
|
Machinery and equipment
|
2-30
|
|
Furniture and fixtures
|
3-10
|
|
Software
|
3
|
|
Vehicles
|
3-10
|
Real Estate Held for Sale and Investment
-- The Company capitalizes as real estate held for sale and investment the original land acquisition cost, direct construction and development costs, property taxes, interest recorded on costs related to real estate under development and other related costs. Additionally, the Company records depreciation on completed condominium units that are placed in rental programs until such units are sold. Sales and marketing expenses are charged against income in the period incurred. Sales commission expenses are charged against income in the period that the related revenue from real estate sales is recorded. The Company records capitalized interest once construction activities commence and real estate deposits have been utilized in construction. The Company did not capitalize interest on real estate development projects, as it had no projects under construction during the years ended
July 31, 2016
,
2015
and
2014
.
Deferred Financing Costs--
Certain costs incurred with the issuance of debt securities are capitalized and included as a reduction in the net carrying value of long-term debt, net of accumulated amortization, with the exception of costs incurred related to line-of-credit arrangements, which are included in deferred charges and other assets, net of accumulated amortization. Amortization is charged to interest expense over the respective term of the applicable debt issues. When debt is extinguished prior to its maturity date, the amortization of the remaining unamortized deferred financing costs, or pro-rata portion thereof, is charged to loss on extinguishment of debt.
Goodwill and Intangible Assets
-- The Company has classified as goodwill the cost in excess of estimated fair value of the net assets of businesses acquired in purchase transactions. The Company’s major intangible asset classes are trademarks, water rights, customer lists, property management contracts, Forest Service permits and excess reorganization value. Goodwill and various indefinite-lived intangible assets, including excess reorganization value and certain trademarks and water rights, are not amortized, but are subject to at least annual impairment testing. The Company tests annually (or more often, if necessary) for impairment as of May 1. Amortizable intangible assets are amortized over the shorter of their contractual terms or estimated useful lives.
The testing for impairment consists of a comparison of the estimated fair value of the assets with their net carrying values. If the net carrying amount of the assets exceed its estimated fair value, an impairment will be recognized for indefinite-lived intangibles, excluding goodwill, in an amount equal to that excess. To the extent the net carrying amount of goodwill assigned to a reporting unit exceeds its estimated fair value, an impairment may be recognized based on a hypothetical purchase price allocation of the estimated fair value to the underlying assets and liabilities of the reporting unit. If the net carrying amount of the assets does not exceed the estimated fair value, no impairment loss is recognized. For the testing of goodwill for impairment, the Company determines the estimated fair value of its reporting units using discounted cash flow analyses. The estimated fair value of indefinite-lived intangible assets is estimated using an income approach. The Company determined that there was
no
impairment to goodwill or significant definite or indefinite-lived intangible assets for the years ended
July 31, 2016
,
2015
and
2014
.
Long-lived Assets--
The Company evaluates potential impairment of long-lived assets and long-lived assets to be disposed of whenever events or changes in circumstances indicate that the net carrying amount of an asset may not be fully recoverable. If the sum of the expected cash flows, on an undiscounted basis, is less than the net carrying amount of the asset, an impairment loss is recognized in the amount by which the net carrying amount of the asset exceeds its estimated fair value. The Company does not believe any events or changes in circumstances indicating an impairment of the net carrying amount of a long-lived asset occurred during the years ended
July 31, 2016
,
2015
and
2014
.
67
Revenue Recognition--
The following describes the composition of revenues for the Company:
|
•
|
Mountain revenue is derived from a wide variety of sources, including, among other things, sales of lift tickets (including season passes), ski school operations, other on-mountain activities, dining operations, retail sales, equipment rentals, private ski club amortized initiation fees and dues, marketing and internet advertising, commercial leasing, employee housing, municipal services and lodging and transportation operations at Perisher, and is recognized as products are delivered or services are performed. The Company records deferred revenue related to the sale of season ski passes. The number of season pass holder visits is estimated based on historical data and the deferred revenue is recognized throughout the ski season based on this estimate, or on a straight-line basis if usage patterns cannot be determined based on available historical data.
|
|
•
|
Lodging revenue is derived from a wide variety of sources, including, among other things, hotel operations, dining operations, property management services, managed hotel property payroll cost reimbursements, private golf club amortized initiation fees and dues, transportation services and golf course greens fees, and is recognized as products are delivered or services are performed. Revenue from payroll cost reimbursements relates to payroll costs of managed hotel properties where the Company is the employer. The reimbursements are based upon the costs incurred with no added margin; therefore, these revenues and corresponding expenses have no net effect on the Company’s operating income or net income.
|
|
•
|
Revenue from non-refundable private club initiation fees is recognized over the estimated life of the facilities on a straight-line basis upon inception of the club. As of
July 31, 2016
, the weighted average remaining period over which the private club initiation fees will be recognized is approximately
14 years
. Additionally, certain club initiation fees are refundable in
30 years
after the date of acceptance of a member. Under these memberships, the difference between the amount paid by the member and the present value of the refund obligation is recorded as deferred initiation fee revenue in the Company’s Consolidated Balance Sheets and recognized as revenue on a straight-line basis over
30 years
. The present value of the refund obligation is recorded as an initiation deposit liability and accretes over the nonrefundable term using the effective interest method. The accretion is included in interest expense.
|
|
•
|
Real estate revenue primarily includes the sale of condominium units and land parcels and is recorded primarily using the full accrual method and occurs only upon the following: (i) substantial completion of the entire development project, (ii) receipt of certificates of occupancy or temporary certificates of occupancy from local governmental agencies, if applicable, (iii) closing of the sales transaction including receipt of all, or substantially all, sales proceeds (including any deposits previously received) and (iv) transfer of ownership.
|
Real Estate Cost of Sales--
Costs of real estate transactions include direct project costs, common cost allocations (primarily determined on relative sales value) and sales commission expense. The Company utilizes the relative sales value method to determine cost of sales for condominium units sold within a project, when specific identification of costs cannot be reasonably determined.
Foreign Currency Translation --
The functional currency of the Company’s entities operating outside of the United States is the principal currency of the economic environment in which the entity primarily generates and expends cash, which is the local currency. The assets and liabilities of these foreign operations are translated at the exchange rate in effect as of the balance sheet dates. Income and expense items are translated using the weighted average exchange rate for the period. Translation adjustments from currency exchange are recorded in accumulated other comprehensive income (loss) as a separate component of stockholders’ equity.
Reserve Estimates--
The Company uses estimates to record reserves for certain liabilities, including medical claims, workers’ compensation claims, third-party loss contingencies, property taxes and loyalty reward programs among other items. The Company estimates the probable costs related to these liabilities that will be incurred and records that amount as a liability in its consolidated financial statements. Additionally, the Company records, as applicable, receivables related to insurance recoveries for loss contingencies if deemed probable of recovery. These estimates are reviewed and adjusted as the facts and circumstances change. The Company records legal costs related to defending claims as incurred.
Advertising Costs
-- Advertising costs are expensed at the time such advertising commences. Advertising expense for the years ended
July 31, 2016
,
2015
and
2014
was
$32.3 million
,
$27.5 million
and
$25.7 million
, respectively. Prepaid advertising costs as of both
July 31, 2016
and
2015
was
$0.3 million
and is reported within “other current assets” in the Company’s Consolidated Balance Sheets.
Income Taxes--
The Company’s provision for income taxes is based on current pre-tax income, changes in deferred tax assets and liabilities and changes in estimates with regard to uncertain tax positions. Deferred tax assets and liabilities are recorded for the
68
estimated future tax effects of temporary differences between the tax bases of assets and liabilities and amounts reported in the accompanying Consolidated Balance Sheets and for operating loss and tax credit carryforwards. The change in deferred tax assets and liabilities for the period measures the deferred tax provision or benefit for the period. Effects of changes in enacted tax laws on deferred tax assets and liabilities are reflected as adjustments to the tax provision or benefit in the period of enactment. The Company provides for taxes that may be payable if undistributed earnings of foreign subsidiaries were to be remitted to the U.S. The Company’s deferred tax assets have been reduced by a valuation allowance to the extent it is deemed to be more likely than not that some or all of the deferred tax assets will not be realized. The Company recognizes liabilities for uncertain tax positions based on a two-step process. The first step is to evaluate the tax position for recognition by determining if the weight of available evidence indicates that it is “more-likely-than-not” to be sustained, on audit, including resolution of related appeals or litigation processes, if any. The second step requires the Company to estimate and measure the largest tax benefit that is cumulatively greater than
50%
likely of being realized upon ultimate settlement. Interest and penalties accrued in connection with uncertain tax positions are recognized as a component of income tax expense (see Note 10, Income Taxes, for more information).
Fair Value of Financial Instruments
-- The recorded amounts for cash and cash equivalents, receivables, other current assets and accounts payable and accrued liabilities approximate fair value due to their short-term nature. The fair value of amounts outstanding under Credit Facility Revolver, Credit Facility Term Loan and the Employee Housing Bonds (as defined in Note 8, Variable Interest Entities) approximate book value due to the variable nature of the interest rate associated with the debt.
Stock-Based Compensation--
Stock-based compensation expense is measured at the grant date based upon the estimated fair value of the portion of the award that is ultimately expected to vest and is recognized as expense over the applicable vesting period of the award generally using the straight-line method (see Note 16, Stock Compensation Plan for more information). The following table shows total stock-based compensation expense for the years ended
July 31, 2016
,
2015
and
2014
included in the Consolidated Statements of Operations (in thousands):
|
|
Year Ended July 31,
|
||||||||
|
|
2016
|
2015
|
2014
|
||||||
|
Mountain stock-based compensation expense
|
$
|
13,404
|
|
$
|
11,841
|
|
$
|
10,292
|
|
|
Lodging stock-based compensation expense
|
3,094
|
|
2,621
|
|
2,203
|
|
|||
|
Real Estate stock-based compensation expense
|
527
|
|
1,291
|
|
1,729
|
|
|||
|
Pre-tax stock-based compensation expense
|
17,025
|
|
15,753
|
|
14,224
|
|
|||
|
Less: benefit from income taxes
|
6,057
|
|
6,026
|
|
5,435
|
|
|||
|
Net stock-based compensation expense
|
$
|
10,968
|
|
$
|
9,727
|
|
$
|
8,789
|
|
Concentration of Credit Risk--
The Company’s financial instruments that are exposed to concentrations of credit risk consist primarily of cash and cash equivalents and restricted cash. The Company places its cash and temporary cash investments in high quality credit institutions, but these investments may be in excess of FDIC insurance limits. The Company does not enter into financial instruments for hedging, trading or speculative purposes. Concentration of credit risk with respect to trade and notes receivables is limited due to the wide variety of customers and markets in which the Company transacts business, as well as their dispersion across many geographical areas. The Company performs ongoing credit evaluations of its customers and generally does not require collateral, but does require advance deposits on certain transactions.
Use of Estimates--
The preparation of financial statements in conformity with accounting principles generally accepted in the United States of America (“GAAP”) requires management to make estimates and assumptions that affect the reported amounts of assets and liabilities, the disclosure of contingent assets and liabilities at the balance sheet date and the reported amounts of revenue and expenses during the reporting period. Actual results could differ from those estimates.
New Accounting Standards
-- In April 2015, the Financial Accounting Standards Board (“FASB”) issued Accounting Standards Update (“ASU”) No. 2015-03, “Interest - Imputation of Interest (Subtopic 835-30): Simplifying the Presentation of Debt Issuance Costs.” The new standard requires that debt issuance costs related to a recognized debt liability be presented in the balance sheet as a direct deduction from the carrying amount of that debt liability, consistent with debt discounts. The guidance in the new standard is limited to the presentation of debt issuance costs and does not affect the recognition and measurement of debt issuance costs. In June 2015, the FASB issued ASU No. 2015-15, “Interest - Imputation of Interest (Subtopic 835-30): Presentation and Subsequent Measurement of Debt Issuance Costs Associated with Line-of-Credit Arrangements.” The guidance in ASU No. 2015-03 does not address presentation or subsequent measurement of debt issuance costs related to line-of-credit arrangements. Given the absence of authoritative guidance within ASU No. 2015-03 for debt issuance costs related to line-of-credit arrangements, the SEC staff stated that they would not object to an entity deferring and presenting debt issuance costs as an asset and subsequently amortizing the deferred debt issuance costs ratably over the term of the line-of-credit arrangement, regardless of whether there are any outstanding borrowings on the line-of-credit arrangement. The standard will be effective for the first interim period within
69
fiscal years beginning after December 15, 2015 (the Company’s first quarter of fiscal 2017) and early adoption is permitted for financial statements that have not been previously issued. The standard should be applied on a retrospective basis. As such, the Company adopted these new accounting standards as of July 31, 2016, which amended presentation and disclosure requirements concerning debt issuance costs but did not affect the Company’s overall financial position or results of operations and cash flows. As a result, the Company reclassified $2.1 million and $2.3 million of debt issuance costs from deferred charges and other assets to long-term debt as of July 31, 2016 and 2015, respectively.
In July 2015, the FASB issued ASU No. 2015-11, “Inventory (Topic 330): Simplifying the Measurement of Inventory.” This standard provides guidance on the measurement of inventory that is measured using first-in, first-out or average cost. An entity should measure in scope inventory at the lower of cost and net realizable value. Net realizable value is the estimated selling prices in the ordinary course of business, less reasonably predictable costs of completion, disposal and transportation. The standard will be effective for the first interim period within fiscal years beginning after December 15, 2016 (the Company’s first quarter of fiscal 2018) and is required to be adopted prospectively and early adoption is permitted. The Company adopted this standard as of July 31, 2016 which did not have a material impact on the Company’s financial position or results of operations and cash flows.
In September 2015, the FASB issued ASU No. 2015-16, “Simplifying the Accounting for Measurement-Period Adjustments.” The standard requires that adjustments to provisional amounts identified during the measurement period of a business combination be recognized in the reporting period in which those adjustments are determined, including the effect on earnings, if any, calculated as if the accounting had been completed at the acquisition date. The standard eliminates the previous requirement to retrospectively account for such adjustments but requires additional disclosures related to the income statement effects of adjustments to provisional amounts identified during the measurement period. The standard is effective for the annual period beginning after December 15, 2015 and interim periods within those annual periods (the Company’s first quarter of fiscal 2017), with early adoption permitted, and is to be applied prospectively. The Company has adopted this standard and will apply this standard, as applicable, on any future measurement period adjustments.
In November 2015, the FASB issued ASU No. 2015-17, “Income Taxes (Topic 740): Balance Sheet Classification of Deferred Taxes.” The standard changes how deferred taxes are classified on an entity’s balance sheets. The standard eliminates the current requirement for entities to present deferred tax liabilities and assets as current and noncurrent in a classified balance sheet. Instead, entities will be required to classify all deferred tax assets and liabilities as noncurrent, on a jurisdiction by jurisdiction basis. The standard is effective for financial statements issued for annual periods beginning after December 15, 2016 (the Company’s first quarter of fiscal 2018), with early adoption permitted, and may be applied prospectively or retrospectively. As such, the Company adopted this new accounting standard as of July 31, 2016 which amended presentation requirements, but did not affect the Company’s overall financial position or results of operations and cash flows. The Company adopted this standard on a prospective basis, which reclassified the current deferred income tax asset to the noncurrent deferred income tax liability. Accordingly, prior periods have not been retrospectively adjusted in the accompanying financial statements.
In May 2014, the FASB issued ASU No. 2014-09, “Revenue from Contracts with Customers (Topic 606),” which supersedes the revenue recognition requirements in Accounting Standards Codification (“ASC”) 605, “Revenue Recognition.” This ASU is based on the principle that revenue is recognized to depict the transfer of goods or services to customers in an amount that reflects the consideration to which the entity expects to be entitled in exchange for those goods or services. The ASU also requires additional disclosure about the nature, amount, timing and uncertainty of revenue and cash flows arising from customer contracts, including significant judgments and changes in judgments and assets recognized from costs incurred to obtain or fulfill a contract. In August 2015, the FASB issued ASU No. 2015-14, which defers the effective date of the new revenue standard by one year, and would allow entities the option to early adopt the new revenue standard as of the original effective date. This standard will be effective for the first interim period within fiscal years beginning after December 15, 2017 (the Company’s first quarter of fiscal 2019 if it does not early adopt), using one of two retrospective application methods. The Company is evaluating the impacts, if any, the adoption of this accounting standard will have on the Company’s financial position or results of operations and cash flows and related disclosures and is determining the appropriate transition method.
In February 2015, the FASB issued ASU No. 2015-02, “Consolidation (Topic 810): Amendments to the Consolidation Analysis,” which amends the consolidation requirements in ASC 810, “Consolidation.” This ASU affects reporting entities that are required to evaluate whether they should consolidate certain legal entities. All legal entities are subject to reevaluation under the revised consolidation model. Specifically, the amendments: (i) modify the evaluation of whether limited partnerships and similar legal entities are variable interest entities (“VIEs”) or voting interest entities, (ii) eliminate the presumption that a general partner should consolidate a limited partnership, (iii) affect the consolidated analysis of reporting entities that are involved with VIEs, particularly those that have fee arrangements and related party relationships and (iv) provide a scope exception for certain entities. The standard will be effective for the first interim period within fiscal years beginning after December 15, 2015 (the Company’s first quarter of fiscal 2017). The standard may be applied retrospectively or through a cumulative effect adjustment to retained earnings as of
70
the beginning of the fiscal year of adoption. The adoption of this accounting standard will not have a material impact on the Company’s financial position or results of operations and cash flows.
In April 2015, the FASB issued ASU No. 2015-05, “Intangibles - Goodwill and Other - Internal-Use Software (Subtopic 350-40): Customer’s Accounting for Fees Paid in a Cloud Computing Arrangement.” The standard provides guidance about whether a cloud computing arrangement includes a software license. If a cloud computing arrangement includes a software license, then the software license element of the arrangement should be accounted for as an acquisition of a software license. If a cloud computing arrangement does not include a software license, it should be accounted for as a service contract. The standard will be effective for the first interim period within fiscal years beginning after December 15, 2015 (the Company’s first quarter of fiscal 2017) and may be adopted either retrospectively or prospectively. The adoption of this accounting standard is not expected to have a material impact on the Company’s financial position or results of operations and cash flows.
In February 2016, the FASB issued ASU No. 2016-02, “Leases (Topic 842),” which supersedes “Leases (Topic 840).” The standard requires lessees to recognize the assets and liabilities arising from all leases, including those classified as operating leases under previous accounting guidance, on the balance sheet and disclose key information about leasing arrangements. The standard also allows for an accounting policy election not to recognize on the balance sheet lease assets and liabilities for leases with a term of 12 months or less. Under the new guidance, lessees will be required to recognize a lease liability and a right-of-use asset on their balance sheets, while lessor accounting will be largely unchanged. The standard will be effective for fiscal years beginning after December 15, 2018, including interim periods within those years (the Company’s first quarter of fiscal 2020), and must be applied using a modified retrospective transition approach to leases existing at, or entered into after, the beginning of the earliest comparative period presented in the financial statements, with early adoption permitted. The Company is currently evaluating the impacts the adoption of this accounting standard will have on the Company’s financial position or results of operations and cash flows and related disclosures.
In March 2016, the FASB issued ASU No. 2016-09, “Compensation - Stock Compensation (Topic 718): Improvements to Employee Share-Based Payment Accounting.” The new guidance requires entities to record all excess tax benefits and tax deficiencies as income tax expense or benefit in the income statement when the awards vest or are settled. The guidance also requires entities to present excess tax benefits as an operating activity and cash paid to a taxing authority to satisfy statutory withholding as a financing activity on the statement of cash flows. Additionally, the guidance allows entities to make a policy election to account for forfeitures either upon occurrence or by estimating forfeitures. The standard is effective for financial statements issued for fiscal years beginning after December 15, 2016 (the Company’s first quarter of fiscal 2018), with early adoption permitted. The Company is currently evaluating the impacts the adoption of this accounting standard will have on the Company’s financial position or results of operations and cash flows.
In August 2016, the FASB issued ASU No. 2016-15, “Statement of Cash Flows (Topic 230): Classification of Certain Cash Receipts and Cash Payments.” The standard provides guidance for eight targeted changes with respect to how cash receipts and cash payments are classified in the statements of cash flows, with the objective of reducing diversity in practice. The standard is effective for financial statements issued for fiscal years beginning after December 15, 2017 (the Company’s first quarter of fiscal 2019), with early adoption permitted. The Company is currently evaluating the impacts the adoption of this accounting standard will have on the Company's cash flows.
71
|
3.
|
Net Income Per Common Share
|
Basic earnings per share (“EPS”) excludes dilution and is computed by dividing net income attributable to Vail Resorts stockholders by the weighted-average shares outstanding during the period. Diluted EPS reflects the potential dilution that could occur if securities or other contracts to issue common stock were exercised, resulting in the issuance of shares of common stock that would then share in the earnings of Vail Resorts. Presented below is basic and diluted EPS for the years ended
July 31, 2016
,
2015
and
2014
(in thousands, except per share amounts):
|
|
Year Ended July 31,
|
|||||||||||||||||
|
|
2016
|
2015
|
2014
|
|||||||||||||||
|
|
Basic
|
Diluted
|
Basic
|
Diluted
|
Basic
|
Diluted
|
||||||||||||
|
Net income per share:
|
||||||||||||||||||
|
Net income attributable to Vail Resorts
|
$
|
149,754
|
|
$
|
149,754
|
|
$
|
114,754
|
|
$
|
114,754
|
|
$
|
28,478
|
|
$
|
28,478
|
|
|
Weighted-average shares outstanding
|
36,276
|
|
36,276
|
|
36,342
|
|
36,342
|
|
36,127
|
|
36,127
|
|
||||||
|
Effect of dilutive securities
|
—
|
|
1,036
|
|
—
|
|
1,064
|
|
—
|
|
930
|
|
||||||
|
Total shares
|
36,276
|
|
37,312
|
|
36,342
|
|
37,406
|
|
36,127
|
|
37,057
|
|
||||||
|
Net income per share attributable to Vail Resorts
|
$
|
4.13
|
|
$
|
4.01
|
|
$
|
3.16
|
|
$
|
3.07
|
|
$
|
0.79
|
|
$
|
0.77
|
|
The Company computes the effect of dilutive securities using the treasury stock method and average market prices during the period. The number of shares issuable on the exercise of share based awards that were excluded from the calculation of diluted net income per share because the effect of their inclusion would have been anti-dilutive totaled approximately
18,000
,
11,000
and
17,000
for the years ended
July 31, 2016
,
2015
and
2014
, respectively.
In fiscal 2011, the Company’s Board of Directors approved the commencement of a regular quarterly cash dividend on the Company’s common stock at an annual rate of
$0.60
per share, subject to quarterly declaration. Since the initial commencement of a regular quarterly cash dividend, the Company’s Board of Directors has annually approved an increase to the cash dividend on the Company’s common stock and on March 9, 2016, the Company’s Board of Directors approved an increase of approximately
30%
in the annual cash dividend to an annual rate of
$3.24
per share, subject to quarterly declaration. For the year ended
July 31, 2016
, the Company paid cash dividends of
$2.865
per share (
$103.8 million
in the aggregate). On September 23, 2016 the Company’s Board of Directors approved a quarterly cash dividend of
$0.81
per share payable on
October 25, 2016
to stockholders of record as of
October 7, 2016
.
Long-term debt as of
July 31, 2016
and
2015
is summarized as follows (in thousands):
|
Fiscal Year
Maturity (a)
|
July 31,
2016 |
July 31,
2015 |
|||||
|
Credit Facility Revolver (b)
|
2020
|
$
|
75,000
|
|
$
|
185,000
|
|
|
Credit Facility Term Loan (b)
|
2020
|
240,625
|
|
250,000
|
|
||
|
Employee Housing Bonds (c)
|
2027-2039
|
52,575
|
|
52,575
|
|
||
|
Canyons obligation (d)
|
2063
|
323,099
|
|
317,455
|
|
||
|
Other (e)
|
2017-2029
|
11,021
|
|
11,800
|
|
||
|
Total debt
|
702,320
|
|
816,830
|
|
|||
|
Less: Unamortized debt issuance costs
|
2,057
|
|
2,329
|
|
|||
|
Less: Current maturities (f)
|
|
13,354
|
|
10,154
|
|
||
|
Long-term debt
|
|
$
|
686,909
|
|
$
|
804,347
|
|
|
(a)
|
Maturities are based on the Company’s July 31 fiscal year end.
|
|
(b)
|
On May 1, 2015, Vail Holdings, Inc. (“VHI”), a wholly-owned subsidiary of the Company, amended and restated its senior credit facility. Key modifications to the senior credit facility included, among other things, the extension of the maturity on the revolving credit facility from March 2019 to
May 2020
and increases in certain baskets for and improved flexibility to incur debt and make distributions.
|
72
The Seventh Amended and Restated Credit Agreement (the “Credit Agreement”) with VHI, as borrower, the Company and certain subsidiaries of the Company, as guarantors, Bank of America, N.A., as administrative agent, and the other Lenders party thereto, and consists of a
$400 million
revolving credit facility. The Credit Agreement also provides for a term loan facility in an aggregate principal amount of
$250.0 million
, which on May 1, 2015, the Company utilized to redeem its 6.50% Notes and Industrial Development Bonds. VHI’s obligations under the Credit Agreement are guaranteed by the Company and certain of its subsidiaries and are collateralized by a pledge of all the capital stock of VHI and substantially all of its subsidiaries (with certain additional exceptions for the pledge of the capital stock of foreign subsidiaries).
In addition, pursuant to the terms of the Credit Agreement, VHI has the ability to increase availability (under the revolver or in the form of term loans) to an aggregate principal amount not to exceed the greater of (i) $950.0 million and (ii) the product of 2.75 and the trailing twelve-month Adjusted EBITDA, as defined in the Credit Agreement. The term loan facility is subject to quarterly amortization of principal, which began on January 31, 2016, in equal installments, with five percent payable in each year and the final payment of all amounts outstanding, plus accrued and unpaid interest due on May 1, 2020. The proceeds of the loans made under the Credit Agreement may be used to fund the Company’s working capital needs, capital expenditures, acquisitions, investments and other general corporate purposes, including the issuance of letters of credit. The Credit Agreement matures in May 2020. Borrowings under the Credit Agreement, including the term loan facility, bear interest annually at the Company's option at the rate of (i) LIBOR plus 1.125% as of July 31, 2016 (1.62% as of July 31, 2016) or (ii) the Agent's prime lending rate plus a margin (3.75% as of July 31, 2016)
. Interest rate margins may fluctuate based upon the ratio of the Company’s Net Funded Debt to Adjusted EBITDA on a trailing four-quarter basis. The Credit Agreement also includes a quarterly unused commitment fee, which is equal to a percentage determined by the Net Funded Debt to Adjusted EBITDA ratio, as each such term is defined in the Credit Agreement, times the daily amount by which the Credit Agreement commitment exceeds the total of outstanding loans and outstanding letters of credit. The unused amounts are accessible to the extent that the Net Funded Debt to Adjusted EBITDA ratio does not exceed the maximum ratio allowed at quarter-ends and the Adjusted EBITDA to interest on Funded Debt (as defined in the Credit Agreement) ratio does not fall below the minimum ratio allowed at quarter-ends. The Credit Agreement provides for affirmative and negative covenants that restrict, among other things, the Company’s ability to incur indebtedness, dispose of assets, make capital expenditures, make distributions and make investments. In addition, the Credit Agreement includes the following restrictive financial covenants: Net Funded Debt to Adjusted EBITDA ratio and Adjusted EBITDA to interest on Funded Debt ratio.
|
(c)
|
The Company has recorded for financial reporting purposes the outstanding debt of four Employee Housing Entities (each an “Employee Housing Entity” and collectively the “Employee Housing Entities”): Breckenridge Terrace, Tarnes, BC Housing and Tenderfoot. The proceeds of the Employee Housing Bonds were used to develop apartment complexes designated primarily for use by the Company’s seasonal employees at its mountain resorts. The Employee Housing Bonds are variable rate, interest-only instruments with interest rates tied to
LIBOR plus 0% to 0.05%
(
0.50%
to
0.55%
as of
July 31, 2016
).
|
Interest on the Employee Housing Bonds is paid monthly in arrears and the interest rate is adjusted weekly. No principal payments are due on the Employee Housing Bonds until maturity. Each Employee Housing Entity’s bonds were issued in two series. The bonds for each Employee Housing Entity are backed by letters of credit issued under the Credit Agreement. The table below presents the principal amounts outstanding for the Employee Housing Bonds as of
July 31, 2016
(in thousands):
|
Maturity (a)
|
Tranche A
|
Tranche B
|
Total
|
|||||||
|
Breckenridge Terrace
|
2039
|
$
|
14,980
|
|
$
|
5,000
|
|
$
|
19,980
|
|
|
Tarnes
|
2039
|
8,000
|
|
2,410
|
|
10,410
|
|
|||
|
BC Housing
|
2027
|
9,100
|
|
1,500
|
|
10,600
|
|
|||
|
Tenderfoot
|
2035
|
5,700
|
|
5,885
|
|
11,585
|
|
|||
|
Total
|
|
$
|
37,780
|
|
$
|
14,795
|
|
$
|
52,575
|
|
|
(d)
|
On
May 24, 2013
, VR CPC Holdings, Inc. (“VR CPC”), a wholly-owned subsidiary of the Company, entered into a transaction agreement (the “Transaction Agreement”) with affiliate companies of Talisker Corporation (“Talisker”) pursuant to which the parties entered into a master lease agreement (the “Lease”) and certain ancillary transaction documents on May 29, 2013 related to the Canyons, pursuant to which the Company assumed the resort operations of the Canyons. The Lease between VR CPC and Talisker has an initial term of
50 years
with
six 50-year renewal options
. The Lease provides for
$25 million
in annual payments, which increase each year by an
inflation linked index of CPI less 1%, with a floor of 2% per annum
. Vail Resorts has guaranteed the payments under the Lease. The obligation at
July 31, 2016
represents future lease payments for the remaining initial lease term of
50 years
(including annual increases
|
73
at the floor of 2%) discounted using an interest rate of
10%
, and includes accumulated accreted interest expense of
$17.8 million
.
|
(e)
|
Other obligations primarily consist of a
$4.7 million
note outstanding to the Colorado Water Conservation Board, which matures on
September 16, 2028
and other financing arrangements. Other obligations, including the Colorado Water Conservation Board note, bear interest at rates ranging from
0.2%
to
5.5%
and have maturities ranging from in the year ending
July 31, 2017
to the year ending
July 31, 2029
.
|
|
(f)
|
Current maturities represent principal payments due in the next
12 months
.
|
Aggregate maturities for debt outstanding, including capital lease obligations, as of
July 31, 2016
reflected by fiscal year are as follows (in thousands):
|
|
Total
|
||
|
2017
|
$
|
13,354
|
|
|
2018
|
13,397
|
|
|
|
2019
|
13,455
|
|
|
|
2020
|
279,141
|
|
|
|
2021
|
1,080
|
|
|
|
Thereafter
|
381,893
|
|
|
|
Total debt
|
$
|
702,320
|
|
The Company recorded gross interest expense of
$42.4 million
,
$51.2 million
and
$64.0 million
for the years ended
July 31, 2016
,
2015
and
2014
, respectively, of which
$1.0 million
,
$1.3 million
and
$1.9 million
was amortization of deferred financing costs. The Company was in compliance with all of its financial and operating covenants required to be maintained under its debt instruments for all periods presented.
The Company recorded a loss on extinguishment of debt of
$11.0 million
for the year ended July 31, 2015 in connection with redemptions of the remaining
$215.0 million
of its 6.50% Senior Subordinated Notes (“6.50% Notes”) outstanding and the entire
$41.2 million
of its Industrial Development Bonds outstanding. The loss included early redemption premiums of
3.25%
for the 6.50% Notes and
4.00%
for the Industrial Development Bonds, or
$8.6 million
in total, and a
$2.4 million
write-off of associated unamortized debt issuance costs. The Company recorded a loss on extinguishment of debt of
$10.8 million
for the year ended July 31, 2014 in connection with the
$175.0 million
partial redemption of its 6.50% Notes outstanding. The loss included an early redemption premium of
4.875%
, or
$8.5 million
, for the portion of the principal redeemed, and a
$2.3 million
write-off of associated unamortized debt issuance costs.
|
5.
|
Acquisitions
|
Wilmot Mountain
On
January 19, 2016
, the Company, through a wholly-owned subsidiary, acquired all of the assets of Wilmot, a ski area located in Wisconsin near the Illinois state line, for total cash consideration of
$20.2 million
. The purchase price was allocated to identifiable tangible and intangible assets acquired and liabilities assumed based on their estimated fair value at the acquisition date. The Company has completed its purchase price allocation and has recorded
$12.5 million
in property, plant and equipment,
$0.2 million
in other assets,
$0.4 million
in other intangible assets (with a weighted-average amortization period of
10 years
at the date of acquisition) and
$0.3 million
of assumed liabilities on the date of acquisition. The excess of the purchase price over the aggregate fair value of assets acquired and liabilities assumed was
$7.4 million
and was recorded as goodwill. The goodwill recognized is attributable primarily to expected synergies, the assembled workforce of Wilmot and other factors. The goodwill is expected to be deductible for income tax purposes. The operating results of Wilmot are reported within the Mountain segment.
Perisher Ski Resort
On
June 30, 2015
, the Company, through a wholly-owned subsidiary, acquired all of the entities that operate Perisher in New South Wales, Australia for total cash consideration of
$124.6 million
, net of cash acquired. The Company funded the cash purchase price through borrowings under the revolver portion of its Credit Agreement. Perisher holds a long-term lease and license with the New South Wales Government under the National Parks and Wildlife Act, which expires in
2048
with a
20-year renewal option
. The Company acquired the entities that hold the assets and conduct operations, including the long-term lease and license with the New South Wales government for the ski area and related amenities of Perisher, as well as assumed liabilities.
74
The following summarizes the estimated fair values of the identifiable assets acquired and liabilities assumed at the date the transaction was effective (in thousands).
|
Acquisition Date Estimated Fair Value
|
|||
|
Accounts receivable
|
$
|
1,494
|
|
|
Inventory
|
4,859
|
|
|
|
Property, plant and equipment
|
126,287
|
|
|
|
Intangible assets
|
5,458
|
|
|
|
Other assets
|
525
|
|
|
|
Goodwill
|
31,657
|
|
|
|
Total identifiable assets acquired
|
$
|
170,280
|
|
|
Accounts payable and accrued liabilities
|
$
|
11,394
|
|
|
Deferred revenue
|
15,906
|
|
|
|
Deferred income tax liability, net
|
18,429
|
|
|
|
Total liabilities assumed
|
$
|
45,729
|
|
|
Total purchase price, net of cash acquired
|
$
|
124,551
|
|
The excess of the purchase price over the aggregate estimated fair values of assets acquired and liabilities assumed was recorded as goodwill. The goodwill recognized is attributable primarily to expected synergies, the assembled workforce of Perisher and other factors. None of the goodwill is expected to be deductible for income tax purposes under Australian tax law. The intangible assets primarily consist of trademarks and customer lists. The definite-lived intangible assets have a weighted-average amortization period of approximately
4 years
at the date of acquisition. The operating results of Perisher, which are recorded in the Mountain segment, contributed
$21.8 million
of net revenue for the year ended July 31, 2015. The Company has recognized
$5.2 million
of transaction related expenses, including duties, in Mountain operating expense in the Consolidated Statements of Operations for the year ended July 31, 2015.
Park City Mountain Resort
On
September 11, 2014
, VR CPC Holdings, Inc. (“VR CPC”), a wholly-owned subsidiary of the Company, and Greater Park City Company, Powdr Corp., Greater Properties, Inc., Park Properties, Inc. and Powdr Development Company (collectively, “Park City Sellers”) entered into a Purchase and Sale Agreement (the “Purchase Agreement”) providing for the acquisition of substantially all of the assets related to Park City Mountain Resort in Park City, Utah. The cash purchase price was
$182.5 million
and was funded through borrowings under the revolver portion of the Company’s senior credit facility.
As provided under the Purchase Agreement, the Company acquired the property, assets and operations of Park City Mountain Resort, which includes the ski area and related amenities, from Park City Sellers and assumed leases of certain realty, acquired certain assets and assumed certain liabilities of Park City Sellers relating to Park City Mountain Resort. In addition to the Purchase Agreement, the parties settled the litigation related to the validity of a lease of certain land owned by Talisker Land Holdings, LLC under the ski terrain of Park City Mountain Resort (the “Park City Litigation”). In connection with settling the Park City Litigation, the Company recorded a non-cash gain of
$16.4 million
in the Mountain segment for the year ended July 31, 2015. The gain on litigation settlement represents the estimated fair value of the rents (including damages and interest) due the Company from the Park City Sellers for their use of land and improvements from the Canyons transaction date of May 29, 2013 to the Park City Mountain Resort acquisition date. Additionally, the Company assigned a fair value of
$10.1 million
to the settlement of the Park City Litigation that applied to the period prior to the Canyons transaction. The combined estimated fair value of the Park City Litigation settlement of
$26.5 million
was determined by applying market capitalization rates to the estimated fair market value of the land and improvements, plus an estimate of statutory damages and interest. The estimated fair value of the Park City Litigation settlement was not received in cash, but was instead reflected as part of the cash price negotiated for the Park City Mountain Resort acquisition. Accordingly, the estimated fair value of the Park City Litigation settlement was included in the total consideration for the acquisition of Park City Mountain Resort. However, the gain on the Park City Litigation settlement was recorded as a separate transaction, as discussed above. Under an agreement entered into in conjunction with the Canyons transaction, the Company made a
$10.0 million
payment to Talisker in the year ended July 31, 2015, resulting from the settlement of the Park City Litigation.
75
The following summarizes the estimated fair values of the identifiable assets acquired and liabilities assumed at the date the transaction was effective (in thousands).
|
Acquisition Date Estimated Fair Value
|
|||
|
Accounts receivable
|
$
|
930
|
|
|
Other assets
|
3,075
|
|
|
|
Property, plant and equipment
|
76,605
|
|
|
|
Deferred income tax assets, net
|
7,428
|
|
|
|
Real estate held for sale and investment
|
7,000
|
|
|
|
Intangible assets
|
27,650
|
|
|
|
Goodwill
|
92,516
|
|
|
|
Total identifiable assets acquired
|
$
|
215,204
|
|
|
Accounts payable and accrued liabilities
|
$
|
1,935
|
|
|
Deferred revenue
|
4,319
|
|
|
|
Total liabilities assumed
|
$
|
6,254
|
|
|
Total purchase price
|
$
|
208,950
|
|
During the year ended July 31, 2015, the Company recorded an adjustment in the measurement period to its purchase price allocation of
$13.0 million
, which reduced real estate held for sale and investment with a corresponding increase to goodwill.
The excess of the purchase price over the aggregate estimated fair values of assets acquired and liabilities assumed was recorded as goodwill. The goodwill recognized is attributable primarily to expected synergies, the assembled workforce of Park City Mountain Resort and other factors. The majority of goodwill is expected to be deductible for income tax purposes. The intangible assets primarily consist of trademarks, water rights and customer lists. The intangible assets have a weighted-average amortization period of approximately
46 years
at the date of acquisition. The operating results of Park City Mountain Resort, which are recorded in the Mountain segment, contributed
$67.1 million
of net revenue (including an allocation of season pass revenue) for the year ended July 31, 2015. The Company recognized
$0.8 million
of transaction related expenses in Mountain operating expense in the Consolidated Statements of Operations for the year ended July 31, 2015.
Certain land and improvements in the Park City Mountain Resort ski area (excluding the base area) were part of the Talisker leased premises to Park City Mountain Resort and was subject to the Park City Litigation as of the Canyons transaction date, and as such, was recorded as a deposit (“Park City Deposit”) for the potential future interests in the land and associated improvements at its estimated fair value in conjunction with the Canyons Transaction Agreement. Upon settlement of the Park City Litigation, the land and improvements associated with the Talisker leased premises became subject to the Canyons lease, and as a result, the Company reclassified the Park City Deposit to the respective assets within property, plant and equipment in the year ended July 31, 2015. The inclusion of the land and certain land improvements that was subject to the Park City Litigation and now included in the Canyons lease requires no additional consideration from the Company to Talisker, but the financial contribution from the operations of Park City Mountain Resort will be included as part of the calculation of EBITDA for the resort operations, and as a result, factor into the participating contingent payments (see Note 9, Fair Value Measurements). The majority of the assets acquired under the Park City Mountain Resort acquisition, although not under lease, are subject to the terms and conditions of the Canyons lease.
76
Perisher and Park City Mountain Resort Pro Forma Financial Information
The following presents the unaudited pro forma consolidated financial information of the Company as if the acquisitions of Perisher and Park City Mountain Resort were completed on August 1, 2013. The following unaudited pro forma financial information includes adjustments for (i) depreciation on acquired property, plant and equipment; (ii) amortization of intangible assets recorded at the date of the transactions; (iii) related-party land leases; and (iv) transaction and business integration related costs. This unaudited pro forma financial information is presented for informational purposes only and does not purport to be indicative of the results of future operations or the results that would have occurred had the transaction taken place on August 1, 2013 (in thousands, except per share amounts).
|
Year Ended July 31,
|
|||||||
|
2015
|
2014
|
||||||
|
Pro forma net revenue
|
$
|
1,452,542
|
|
$
|
1,383,141
|
|
|
|
Pro forma net income attributable to Vail Resorts, Inc.
|
$
|
120,201
|
|
$
|
35,367
|
|
|
|
Pro forma basic net income per share attributable to Vail Resorts, Inc.
|
$
|
3.31
|
|
$
|
0.98
|
|
|
|
Pro forma diluted net income per share attributable to Vail Resorts, Inc.
|
$
|
3.21
|
|
$
|
0.95
|
|
|
|
6.
|
Supplementary Balance Sheet Information
|
The composition of property, plant and equipment, including capital lease assets, follows (in thousands):
|
|
July 31,
|
|||||
|
|
2016
|
2015
|
||||
|
Land and land improvements
|
$
|
440,300
|
|
$
|
431,854
|
|
|
Buildings and building improvements
|
1,025,515
|
|
1,006,821
|
|
||
|
Machinery and equipment
|
866,008
|
|
815,946
|
|
||
|
Furniture and fixtures
|
284,959
|
|
286,863
|
|
||
|
Software
|
103,754
|
|
106,433
|
|
||
|
Vehicles
|
58,159
|
|
61,036
|
|
||
|
Construction in progress
|
39,396
|
|
53,158
|
|
||
|
Gross property, plant and equipment
|
2,818,091
|
|
2,762,111
|
|
||
|
Accumulated depreciation
|
(1,454,277
|
)
|
(1,375,836
|
)
|
||
|
Property, plant and equipment, net
|
$
|
1,363,814
|
|
$
|
1,386,275
|
|
During the year ended July 31, 2016, the Company recorded the disposal of gross property, plant and equipment of
$67.4 million
from prior years, which had been fully depreciated resulting in a corresponding reduction to accumulated depreciation and no net effect to the net carrying value of Property, plant and equipment, net. Depreciation expense, which included depreciation of assets recorded under capital leases, for the years ended
July 31, 2016
,
2015
and
2014
totaled
$156.8 million
,
$144.0 million
and
$136.6 million
, respectively.
77
The following table shows the composition of property, plant and equipment recorded under capital leases as of
July 31, 2016
and
2015
(in thousands):
|
July 31,
|
||||||
|
2016
|
2015
|
|||||
|
Land
|
$
|
31,818
|
|
$
|
31,818
|
|
|
Land improvements
|
49,228
|
|
49,228
|
|
||
|
Buildings and building improvements
|
42,910
|
|
42,910
|
|
||
|
Machinery and equipment
|
61,175
|
|
61,175
|
|
||
|
Gross property, plant and equipment
|
185,131
|
|
185,131
|
|
||
|
Accumulated depreciation
|
(27,110
|
)
|
(17,212
|
)
|
||
|
Property, plant and equipment, net
|
$
|
158,021
|
|
$
|
167,919
|
|
The composition of goodwill and intangible assets follows (in thousands):
|
|
July 31,
|
|||||
|
|
2016
|
2015
|
||||
|
Goodwill
|
||||||
|
Goodwill
|
$
|
526,391
|
|
$
|
517,787
|
|
|
Accumulated amortization
|
(17,354
|
)
|
(17,354
|
)
|
||
|
Goodwill, net
|
509,037
|
|
500,433
|
|
||
|
Indefinite-lived intangible assets
|
||||||
|
Gross indefinite-lived intangible assets
|
105,253
|
|
105,150
|
|
||
|
Accumulated amortization
|
(24,713
|
)
|
(24,713
|
)
|
||
|
Indefinite-lived intangible assets, net
|
80,540
|
|
80,437
|
|
||
|
Amortizable intangible assets
|
||||||
|
Gross amortizable intangible assets
|
79,524
|
|
118,482
|
|
||
|
Accumulated amortization
|
(20,057
|
)
|
(54,770
|
)
|
||
|
Amortizable intangible assets, net
|
59,467
|
|
63,712
|
|
||
|
Total gross intangible assets
|
184,777
|
|
223,632
|
|
||
|
Total accumulated amortization
|
(44,770
|
)
|
(79,483
|
)
|
||
|
Total intangible assets, net
|
$
|
140,007
|
|
$
|
144,149
|
|
During the year ended July 31, 2016, the Company recorded the disposal of gross amortizable intangible assets of
$39.4 million
from prior years, which had been fully amortized resulting in a corresponding reduction to accumulated amortization and no net effect to the net carrying value of intangible assets, net. Amortization expense for intangible assets subject to amortization for the years ended
July 31, 2016
,
2015
and
2014
totaled
$4.7 million
,
$5.1 million
and
$4.0 million
, respectively, and is estimated to be approximately
$2.4 million
annually, on average, for the next five fiscal years.
78
The changes in the net carrying amount of goodwill allocated between the Company’s segments for the years ended
July 31, 2016
and
2015
are as follows (in thousands):
|
Mountain
|
Lodging
|
Goodwill, net
|
|||||||
|
Balance at July 31, 2014
|
$
|
310,249
|
|
$
|
67,899
|
|
$
|
378,148
|
|
|
Acquisitions
|
124,173
|
|
—
|
|
124,173
|
|
|||
|
Effects of changes in foreign currency exchange rates
|
(1,888
|
)
|
—
|
|
(1,888
|
)
|
|||
|
Balance at July 31, 2015
|
432,534
|
|
67,899
|
|
500,433
|
|
|||
|
Acquisition
|
7,400
|
|
—
|
|
7,400
|
|
|||
|
Effects of changes in foreign currency exchange rates
|
1,204
|
|
—
|
|
1,204
|
|
|||
|
Balance at July 31, 2016
|
$
|
441,138
|
|
$
|
67,899
|
|
$
|
509,037
|
|
The composition of accounts payable and accrued liabilities follows (in thousands):
|
|
July 31,
|
|||||
|
|
2016
|
2015
|
||||
|
Trade payables
|
$
|
72,658
|
|
$
|
62,099
|
|
|
Deferred revenue
|
182,506
|
|
145,949
|
|
||
|
Accrued salaries, wages and deferred compensation
|
43,086
|
|
33,461
|
|
||
|
Accrued benefits
|
29,175
|
|
24,436
|
|
||
|
Deposits
|
23,307
|
|
19,336
|
|
||
|
Other accruals
|
46,756
|
|
46,018
|
|
||
|
Total accounts payable and accrued liabilities
|
$
|
397,488
|
|
$
|
331,299
|
|
The composition of other long-term liabilities follows (in thousands):
|
|
July 31,
|
|||||
|
|
2016
|
2015
|
||||
|
Private club deferred initiation fee revenue
|
$
|
121,750
|
|
$
|
126,104
|
|
|
Unfavorable lease obligation, net
|
27,322
|
|
29,997
|
|
||
|
Other long-term liabilities
|
121,096
|
|
99,815
|
|
||
|
Total other long-term liabilities
|
$
|
270,168
|
|
$
|
255,916
|
|
|
7.
|
Investments in Affiliates
|
The Company held the following investments in equity method affiliates as of
July 31, 2016
:
|
Equity Method Affiliates
|
Ownership
Interest
|
|
Slifer, Smith, and Frampton/Vail Associates Real Estate, LLC (“SSF/VARE”)
|
50%
|
|
KRED
|
50%
|
|
Clinton Ditch and Reservoir Company
|
43%
|
The Company had total net investments in equity method affiliates of
$7.5 million
and
$7.4 million
as of
July 31, 2016
and
2015
, respectively, classified as “deferred charges and other assets” in the accompanying Consolidated Balance Sheets. The amount of retained earnings that represent undistributed earnings of
50-percent-or-less-owned
entities accounted for by the equity method was
$4.2 million
and
$4.1 million
as of
July 31, 2016
and
2015
, respectively. During the years ended
July 31, 2016
,
2015
and
2014
, distributions in the amounts of
$1.3 million
,
$1.0 million
and
$1.0 million
, respectively, were received from equity method affiliates.
SSF/VARE is a real estate brokerage with multiple locations in Eagle and Summit Counties, Colorado in which the Company has a
50%
ownership interest. SSF/VARE has been the broker for several of the Company’s developments. SSF/VARE leases space
79
for real estate offices from the Company. The Company recognized approximately
$0.4 million
,
$0.5 million
and
$0.5 million
in revenue related to these leases, respectively, for the years ended
July 31, 2016
,
2015
and
2014
.
8.
Variable Interest Entities
The Company is the primary beneficiary of the Employee Housing Entities, which are Variable Interest Entities (“VIEs”), and has consolidated them in its Consolidated Financial Statements. As a group, as of
July 31, 2016
, the Employee Housing Entities had total assets of
$23.7 million
(primarily recorded in property, plant and equipment, net) and total liabilities of
$63.0 million
(primarily recorded in long-term debt as “Employee Housing Bonds”). The Company has issued under its Credit Agreement
$53.4 million
letters of credit related to Employee Housing Bonds. The letters of credit would be triggered in the event that one of the entities defaults on required payments. The letters of credit have no default provisions.
The Company is the primary beneficiary of Avon Partners II, LLC (“APII”), which is a VIE. APII owns commercial space and the Company currently leases substantially all of that space. APII had total assets of
$4.3 million
(primarily recorded in property, plant and equipment) and
no
debt as of
July 31, 2016
.
|
9.
|
Fair Value Measurements
|
The FASB issued fair value guidance that establishes how reporting entities should measure fair value for measurement and disclosure purposes. The guidance establishes a common definition of fair value applicable to all assets and liabilities measured at fair value and prioritizes the inputs into valuation techniques used to measure fair value. Accordingly, the Company uses valuation techniques which maximize the use of observable inputs and minimize the use of unobservable inputs when determining fair value. The three levels of the hierarchy are as follows:
Level 1: Inputs that reflect unadjusted quoted prices in active markets that are accessible to the Company for identical assets or liabilities;
Level 2: Inputs include quoted prices for similar assets and liabilities in active and inactive markets or that are observable for the asset or liability either directly or indirectly; and
Level 3: Unobservable inputs which are supported by little or no market activity.
The table below summarizes the Company’s cash equivalents and Contingent Consideration measured at fair value (all other assets and liabilities measured at fair value are immaterial) (in thousands):
|
|
Fair Value Measurement as of July 31, 2016
|
|||||||||||
|
Description
|
Balance at July 31, 2016
|
Level 1
|
Level 2
|
Level 3
|
||||||||
|
Assets:
|
||||||||||||
|
Commercial Paper
|
$
|
2,401
|
|
$
|
—
|
|
$
|
2,401
|
|
$
|
—
|
|
|
Certificates of Deposit
|
$
|
2,403
|
|
$
|
—
|
|
$
|
2,403
|
|
$
|
—
|
|
|
Liabilities:
|
||||||||||||
|
Contingent Consideration
|
$
|
11,100
|
|
$
|
—
|
|
$
|
—
|
|
$
|
11,100
|
|
|
|
Fair Value Measurement as of July 31, 2015
|
|||||||||||
|
Description
|
Balance at July 31, 2015
|
Level 1
|
Level 2
|
Level 3
|
||||||||
|
Assets:
|
||||||||||||
|
Money Market
|
$
|
7,577
|
|
$
|
7,577
|
|
$
|
—
|
|
$
|
—
|
|
|
Commercial Paper
|
$
|
2,401
|
|
$
|
—
|
|
$
|
2,401
|
|
$
|
—
|
|
|
Certificates of Deposit
|
$
|
2,651
|
|
$
|
—
|
|
$
|
2,651
|
|
$
|
—
|
|
|
Liabilities:
|
||||||||||||
|
Contingent Consideration
|
$
|
6,900
|
|
$
|
—
|
|
$
|
—
|
|
$
|
6,900
|
|
80
The Company’s cash equivalents are measured utilizing quoted market prices or pricing models whereby all significant inputs are either observable or corroborated by observable market data.
The following change in Contingent Consideration during the years ended
July 31, 2016
and
2015
were as follows (in thousands):
|
Balance at July 31, 2014
|
$
|
10,500
|
|
|
Change in fair value
|
(3,600
|
)
|
|
|
Balance at July 31, 2015
|
6,900
|
|
|
|
Change in fair value
|
4,200
|
|
|
|
Balance at July 31, 2016
|
$
|
11,100
|
|
The lease for Canyons provides for participating contingent payments to Talisker of
42% of the amount by which EBITDA for the resort operations, as calculated under the Lease, exceed approximately $35 million, as established at the transaction date, with such threshold amount subsequently increased annually by an inflation linked index and a 10% adjustment for any capital improvements or investments made under the Lease by the Company.
The estimated fair value of Contingent Consideration includes the resort operations of Park City Mountain Resort, following completion of the acquisition, in the calculation of EBITDA on which participating contingent payments are made, and increases the EBITDA threshold before which participating contingent payments are made by 10% of the purchase price paid by the Company for Park City Mountain Resort along with all future capital expenditures associated with Park City. The Company estimated the fair value of the Contingent Consideration payments using an option pricing valuation model. Key assumptions included a discount rate of 11.0%, volatility of 20.0% and credit risk of 2.5%. The model also incorporates assumptions for EBITDA and capital expenditures, which are unobservable inputs and thus are considered Level 3 inputs.
As Contingent Consideration is classified as a liability, the liability is remeasured to an estimate of fair value at each reporting date until the contingency is resolved. During the year ended
July 31, 2016
, the Company recorded an increase of
$4.2 million
in the estimated fair value of the participating contingent payments, and recorded the related loss in income from operations. The estimated fair value of the contingent consideration is
$11.1 million
as of
July 31, 2016
and this liability is recorded in other long-term liabilities in the Consolidated Balance Sheets.
|
10.
|
Income Taxes
|
U.S. and foreign components of income before provision for income taxes is as follows (in thousands):
|
Year Ended July 31,
|
|||||||||
|
2016
|
2015
|
2014
|
|||||||
|
U.S.
|
$
|
231,756
|
|
$
|
142,190
|
|
$
|
45,895
|
|
|
Foreign
|
10,863
|
|
7,138
|
|
(1,823
|
)
|
|||
|
Income before income taxes
|
$
|
242,619
|
|
$
|
149,328
|
|
$
|
44,072
|
|
The Company has NOL carryforwards totaling
$34.1 million
which are primarily comprised of state net operating loss (“NOL”) carryforwards that expire by the year ending July 31, 2031. As of
July 31, 2016
, the Company recorded a valuation allowance on
$29.2 million
of these NOL carryforwards as the Company has determined that it is more likely than not that these NOL carryforwards will not be realized. Additionally, the Company has foreign tax credit carryforwards of
$0.9 million
which expire by the year ending July 31, 2026. As of July 31, 2016, the Company has recorded a valuation allowance of
$0.9 million
on foreign tax credit carryforwards as the Company has determined that it is more likely than not that these foreign tax credit carryforwards will not be realized.
81
Deferred income taxes reflect the net tax effects of temporary differences between the carrying amounts of assets and liabilities for financial reporting purposes and income tax purposes. Significant components of the Company’s deferred tax liabilities and assets are as follows (in thousands):
|
|
July 31,
|
|||||
|
|
2016
|
2015
|
||||
|
Deferred income tax liabilities:
|
||||||
|
Fixed assets
|
$
|
180,267
|
|
$
|
173,908
|
|
|
Intangible assets
|
59,009
|
|
53,654
|
|
||
|
Total
|
239,276
|
|
227,562
|
|
||
|
Deferred income tax assets:
|
||||||
|
Canyons obligation
|
18,984
|
|
18,687
|
|
||
|
Deferred private club membership revenue
|
16,247
|
|
18,085
|
|
||
|
Deferred compensation and other accrued benefits
|
17,426
|
|
12,590
|
|
||
|
Stock-based compensation
|
17,287
|
|
15,896
|
|
||
|
Unfavorable lease obligation, net
|
10,904
|
|
11,510
|
|
||
|
Real estate and other investments
|
7,987
|
|
7,771
|
|
||
|
Net operating loss carryforwards and other tax credits
|
3,779
|
|
3,610
|
|
||
|
Other, net
|
20,309
|
|
23,066
|
|
||
|
Total
|
112,923
|
|
111,215
|
|
||
|
Valuation allowance for deferred income taxes
|
(3,641
|
)
|
(3,487
|
)
|
||
|
Deferred income tax assets, net of valuation allowance
|
109,282
|
|
107,728
|
|
||
|
Net deferred income tax liability
|
$
|
129,994
|
|
$
|
119,834
|
|
Significant components of the provision (benefit) for income taxes are as follows (in thousands):
|
|
Year Ended July 31,
|
||||||||
|
|
2016
|
2015
|
2014
|
||||||
|
Current:
|
|||||||||
|
Federal
|
$
|
70,553
|
|
$
|
12,668
|
|
$
|
8,082
|
|
|
State
|
10,555
|
|
5,501
|
|
1,565
|
|
|||
|
Foreign
|
4,431
|
|
3,581
|
|
—
|
|
|||
|
Total current
|
85,539
|
|
21,750
|
|
9,647
|
|
|||
|
Deferred:
|
|||||||||
|
Federal
|
7,603
|
|
11,534
|
|
5,470
|
|
|||
|
State
|
1,051
|
|
1,623
|
|
749
|
|
|||
|
Foreign
|
(1,028
|
)
|
(189
|
)
|
—
|
|
|||
|
Total deferred
|
7,626
|
|
12,968
|
|
6,219
|
|
|||
|
Provision for income taxes
|
$
|
93,165
|
|
$
|
34,718
|
|
$
|
15,866
|
|
82
A reconciliation of the income tax provision from continuing operations and the amount computed by applying the United States federal statutory income tax rate to income before income taxes is as follows:
|
|
Year Ended July 31,
|
|||||
|
|
2016
|
2015
|
2014
|
|||
|
At U.S. federal income tax rate
|
35.0
|
%
|
35.0
|
%
|
35.0
|
%
|
|
State income tax, net of federal benefit
|
3.1
|
%
|
3.2
|
%
|
3.4
|
%
|
|
Nondeductible meals or entertainment
|
0.1
|
%
|
0.2
|
%
|
0.7
|
%
|
|
General business credits
|
(0.4
|
)%
|
(0.5
|
)%
|
(1.7
|
)%
|
|
IRS settlement on NOL utilization
|
—
|
%
|
(16.0
|
)%
|
—
|
%
|
|
Domestic production deduction
|
(0.4
|
)%
|
(0.7
|
)%
|
(1.4
|
)%
|
|
Change in valuation allowance
|
0.1
|
%
|
0.5
|
%
|
—
|
%
|
|
Other
|
0.9
|
%
|
1.5
|
%
|
—
|
%
|
|
Effective tax rate
|
38.4
|
%
|
23.2
|
%
|
36.0
|
%
|
A reconciliation of the beginning and ending amount of unrecognized tax benefits associated with uncertain tax positions, excluding associated deferred tax benefits and accrued interest and penalties, if applicable, is as follows (in thousands):
|
Year Ended July 31,
|
|||||||||
|
|
2016
|
2015
|
2014
|
||||||
|
Balance, beginning of year
|
$
|
38,572
|
|
$
|
46,973
|
|
$
|
26,205
|
|
|
Additions based on tax positions related to the current year
|
—
|
|
—
|
|
21,082
|
|
|||
|
Additions for tax positions of prior years
|
18,460
|
|
17,443
|
|
—
|
|
|||
|
Reductions for tax positions of prior years
|
—
|
|
(21,574
|
)
|
—
|
|
|||
|
Lapse of statute of limitations
|
—
|
|
—
|
|
(314
|
)
|
|||
|
Settlements
|
—
|
|
(4,270
|
)
|
—
|
|
|||
|
Balance, end of year
|
$
|
57,032
|
|
$
|
38,572
|
|
$
|
46,973
|
|
As of July 31, 2016, the Company’s unrecognized tax benefits associated with uncertain tax positions relate to the treatment of the Talisker lease payments as payments of debt obligations and that the tax basis in Canyons goodwill is deductible, and are included within “other long-term liabilities” in the accompanying Consolidated Balance Sheets.
The Company had federal NOL carryforwards that expired in the year ended July 31, 2008 and were limited in deductibility each year under Section 382 of the Internal Revenue Code. The Company had only been able to use these NOL carryforwards to the extent of approximately
$8.0 million
per year through December 31, 2007. However, during the year ended July 31, 2005, the Company amended previously filed tax returns (for tax years 1997-2002) in an effort to remove the restrictions under Section 382 of the Internal Revenue Code on approximately
$73.8 million
of NOL carryforwards to reduce future taxable income. As a result, the Company requested a refund related to the amended returns in the amount of
$6.2 million
and reduced its federal tax liability in the amount of
$19.6 million
in subsequent returns. These NOL carryforwards relate to fresh start accounting from the Company’s reorganization in 1992. During the year ended July 31, 2006, the Internal Revenue Service (“IRS”) completed its examination of the Company’s filing position in these amended returns and disallowed the Company’s request for refund and its position to remove the restrictions under Section 382 of the Internal Revenue Code. The Company appealed the examiner’s disallowance of these NOL carryforwards to the Office of Appeals. In December 2008, the Office of Appeals denied the Company’s appeal, as well as a request for mediation. The Company disagreed with the IRS interpretation disallowing the utilization of the NOL’s and in August 2009, the Company filed a complaint in the United States District Court for the District of Colorado against the United States of America seeking a refund of approximately
$6.2 million
in federal income taxes paid, plus interest. On July 1, 2011, the District Court granted the Company summary judgment, concluding that the IRS’s decision disallowing the utilization of the NOLs was inappropriate. The computations themselves, however, remained in dispute, and the District Court’s ruling was subject to appeal by the IRS. Subsequently, the District Court proceedings were continued pending settlement discussions between the parties.
The Company also filed two related tax proceedings in the United States Tax Court regarding calculation of NOL carryover deductions for tax years 2006, 2007 and 2008. The two proceedings involved substantially the same issues as the litigation in the District Court for tax years 2000 and 2001 in which the Company disagreed with the IRS as to the utilization of NOLs. Like the District Court proceedings, the Tax Court proceedings were continued pending settlement discussions between the parties.
83
On January 29, 2015, the parties completed the execution of a comprehensive settlement agreement resolving all issues and computations in the above mentioned pending proceedings, which allowed the Company to utilize a significant portion of the NOLs. As a result, the Company reversed
$27.7 million
of other long-term liabilities related to uncertain tax benefits, and recorded income tax benefits of
$23.8 million
for the utilization of the NOLs, including the reversal of accrued interest and penalties, within its Consolidated Statements of Operations for the year ended July 31, 2015.
The Company does not anticipate a significant change to its unrecognized tax benefits recorded as of July 31, 2016 during the twelve months ending July 31, 2017. As of
July 31, 2016
and
2015
, accrued interest and penalties, net of tax, was
$1.6 million
and
$0.5 million
, respectively. For the years ended
July 31, 2016
,
2015
and
2014
, the Company recognized as income tax expense (benefit)
$1.1 million
,
$(1.4) million
and
$0.1 million
of interest expense (income) and penalties, net of tax, respectively.
The Company’s major tax jurisdictions in which it files income tax returns is the U.S. federal jurisdiction, various state jurisdictions and Australia. As discussed above, on January 29, 2015, all issues and computations were resolved upon the completion of a comprehensive settlement agreement with the IRS in regards to the federal NOL carryforward dispute. The Company is no longer subject to U.S. federal examinations for tax years prior to 2013. With few exceptions, the Company is no longer subject to examination by various state jurisdictions for tax years prior to 2011.
11.
Related Party Transactions
The Company has the right to appoint
four
of
nine
directors of the Beaver Creek Resort Company of Colorado (“BCRC”), a non-profit entity formed for the benefit of property owners and certain others in Beaver Creek. The Company has a management agreement with the BCRC, renewable for
one-year
periods, to provide management services on a fixed fee basis. Management fees and reimbursement of operating expenses paid to the Company under its agreement with the BCRC during the years ended
July 31, 2016
,
2015
and
2014
were
$8.4 million
,
$7.1 million
and
$7.0 million
, respectively.
|
12.
|
Commitments and Contingencies
|
Metropolitan Districts
The Company credit-enhances
$8.0 million
of bonds issued by Holland Creek Metropolitan District (“HCMD”) through an
$8.1 million
letter of credit issued under the Company’s Credit Agreement. HCMD’s bonds were issued and used to build infrastructure associated with the Company’s Red Sky Ranch residential development. The Company has agreed to pay capital improvement fees to Red Sky Ranch Metropolitan District (“RSRMD”) until RSRMD’s revenue streams from property taxes are sufficient to meet debt service requirements under HCMD’s bonds, and the Company has recorded a liability of
$2.0 million
and
$1.8 million
, respectively, primarily within “other long-term liabilities” in the accompanying Consolidated Balance Sheets as of
July 31, 2016
and
2015
, with respect to the estimated present value of future RSRMD capital improvement fees. The Company estimates that it will make capital improvement fee payments under this arrangement through the year ending
July 31, 2031
.
Guarantees/Indemnifications
As of
July 31, 2016
, the Company had various other letters of credit in the amount of
$64.2 million
, consisting primarily of
$53.4 million
in support of the Employee Housing Bonds and
$10.8 million
for workers’ compensation, general liability construction related deductibles and other activities. The Company also had surety bonds of
$9.3 million
as of July 31, 2016, primarily to provide collateral for its workers compensation self-insurance programs.
In addition to the guarantees noted above, the Company has entered into contracts in the normal course of business that include certain indemnifications under which it could be required to make payments to third parties upon the occurrence or non-occurrence of certain future events. These indemnities include indemnities related to licensees in connection with third-parties’ use of the Company’s trademarks and logos, liabilities associated with the infringement of other parties’ technology and software products, liabilities associated with the use of easements, liabilities associated with employment of contract workers and the Company’s use of trustees, and liabilities associated with the Company’s use of public lands and environmental matters. The duration of these indemnities generally is indefinite and generally do not limit the future payments the Company could be obligated to make.
As permitted under applicable law, the Company and certain of its subsidiaries have agreed to indemnify their directors and officers over their lifetimes for certain events or occurrences while the officer or director is, or was, serving the Company or its subsidiaries in such a capacity. The maximum potential amount of future payments the Company could be required to make under these
84
indemnification agreements is unlimited; however, the Company has a director and officer insurance policy that should enable the Company to recover a portion of any future amounts paid.
Unless otherwise noted, the Company has not recorded any significant liabilities for the letters of credit, indemnities and other guarantees noted above in the accompanying Consolidated Financial Statements, either because the Company has recorded on its Consolidated Balance Sheets the underlying liability associated with the guarantee, the guarantee is with respect to the Company’s own performance and is therefore not subject to the measurement requirements as prescribed by GAAP, or because the Company has calculated the estimated fair value of the indemnification or guarantee to be immaterial based upon the current facts and circumstances that would trigger a payment under the indemnification clause. In addition, with respect to certain indemnifications it is not possible to determine the maximum potential amount of liability under these potential obligations due to the unique set of facts and circumstances likely to be involved in each particular claim and indemnification provision. Historically, payments made by the Company under these obligations have not been material.
As noted above, the Company makes certain indemnifications to licensees for their use of the Company’s trademarks and logos. The Company does not record any liabilities with respect to these indemnifications.
Commitments
The operations of Northstar are conducted on land and with operating assets owned by affiliates of CNL Lifestyle Properties, Inc., a real-estate investment trust, primarily under operating leases which were assumed in the acquisition of Northstar by the Company. The leases provide for the payment of a minimum annual base rent with a rate of
10.25%
increasing to
11%
of assets under lease over the lease term which is recognized on a straight-line basis over the remaining lease term from the date of assumption. In addition, beginning in fiscal 2013 the leases provide for the payment of percentage rent at a rate of
11.5%
of certain gross revenues generated at the property over a revenue threshold which is incrementally adjusted annually. The initial term of the leases expires in fiscal
2027
and allows for
three
10
-year extensions at the Company’s option. The operations of Perisher are conducted on land under a license and lease granted by the Office of Environment and Heritage, an agency of the New South Wales government, that initially commenced in 2008, which the Company assumed in its acquisition of Perisher. The lease and license has a term that expires in fiscal
2048
and allows for an option to renew for an additional
20 years
. The lease and license provide for the payment of an initial minimum annual base rent of AUS
$1.8 million
, with annual CPI increases, and percentage rent at a rate of
2% of certain gross revenue
generated at the property.
In addition, the Company has executed or assumed as lessee other operating leases for the rental of office and commercial space, employee residential units and land primarily through fiscal
2079
. Certain of these leases have renewal terms at the Company’s option, escalation clauses, rent holidays and leasehold improvement incentives.
Rent holidays and rent escalation clauses are recognized on a straight-line basis over the lease term. Leasehold improvement incentives are recorded as leasehold improvements and amortized over the shorter of their economic lives or the term of the lease. For the years ended
July 31, 2016
,
2015
and
2014
, the Company recorded lease expense (including Northstar and Perisher), excluding executory costs, related to these agreements of
$44.4 million
,
$39.5 million
and
$37.3 million
, respectively, which is included in the accompanying Consolidated Statements of Operations.
As of
July 31, 2016
, the Canyons obligation was
$323.1 million
, which represents the estimated annual lease payments for the remaining initial 50 year term of the lease assuming annual increases at the floor of 2% and discounted using an interest rate of
10%
.
85
Future minimum operating lease payments under the above leases and future minimum capital lease payments under the Canyons obligation as of
July 31, 2016
reflected by fiscal year are as follows (in thousands):
|
Operating Leases
|
Capital Leases
|
||||||
|
2017
|
$
|
36,024
|
|
$
|
26,623
|
|
|
|
2018
|
31,642
|
|
27,156
|
|
|||
|
2019
|
28,223
|
|
27,699
|
|
|||
|
2020
|
25,448
|
|
28,253
|
|
|||
|
2021
|
23,458
|
|
28,818
|
|
|||
|
Thereafter
|
157,564
|
|
1,895,005
|
|
|||
|
Total future minimum lease payments
|
$
|
302,359
|
|
$
|
2,033,554
|
|
|
|
Less amount representing interest
|
(1,710,455
|
)
|
|||||
|
Net future minimum lease payments
|
$
|
323,099
|
|
||||
Self Insurance
The Company in the U.S. is self-insured for claims under its health benefit plans and for the majority of workers’ compensation claims. Workers compensation claims are subject to stop loss policies. The self-insurance liability related to workers’ compensation is determined actuarially based on claims filed. The self-insurance liability related to claims under the Company’s health benefit plans is determined based on analysis of actual claims. The amounts related to these claims are included as a component of accrued benefits in accounts payable and accrued liabilities (see Note 6, Supplementary Balance Sheet Information).
Legal
The Company is a party to various lawsuits arising in the ordinary course of business. Management believes the Company has adequate insurance coverage and/or has accrued for loss contingencies for all known matters that are deemed to be probable losses and estimable. As of
July 31, 2016
and
2015
, the accrual for loss contingencies was not material individually and in the aggregate.
|
13.
|
Segment Information
|
The Company has three reportable segments: Mountain, Lodging and Real Estate. The Mountain segment includes the operations of the Company’s mountain resorts/ski areas and related ancillary activities. The Lodging segment includes the operations of the Company’s owned hotels, RockResorts, NPS concessionaire properties, condominium management, CME and mountain resort golf operations. The Real Estate segment owns, develops and sells real estate in and around the Company’s resort communities. The Company’s reportable segments, although integral to the success of the others, offer distinctly different products and services and require different types of management focus. As such, these segments are managed separately.
The Company reports its segment results using Reported EBITDA (defined as segment net revenue less segment operating expenses, plus or minus segment equity investment income or loss, plus gain on litigation settlement and for the Real Estate segment, plus gain on sale of real property). The Company reports segment results in a manner consistent with management’s internal reporting of operating results to the chief operating decision maker (Chief Executive Officer) for purposes of evaluating segment performance.
Items excluded from Reported EBITDA are significant components in understanding and assessing financial performance. Reported EBITDA should not be considered in isolation or as an alternative to, or substitute for, net income, net change in cash and cash equivalents or other financial statement data presented in the consolidated financial statements as indicators of financial performance or liquidity.
The Company utilizes Reported EBITDA in evaluating performance of the Company and in allocating resources to its segments. Mountain Reported EBITDA consists of Mountain net revenue less Mountain operating expense plus or minus Mountain equity investment income or loss plus gain on litigation settlement. Lodging Reported EBITDA consists of Lodging net revenue less Lodging operating expense. Real Estate Reported EBITDA consists of Real Estate net revenue less Real Estate operating expense plus gain on sale of real property. All segment expenses include an allocation of corporate administrative expense. Assets are not allocated between segments, or used to evaluate performance, except as shown in the table below. The accounting policies specific to each segment are the same as those described in Note 2, Summary of Significant Accounting Policies.
86
Following is key financial information by reportable segment which is used by management in evaluating performance and allocating resources (in thousands):
|
|
Year Ended July 31,
|
||||||||
|
|
2016
|
2015
|
2014
|
||||||
|
Net revenue:
|
|||||||||
|
Lift tickets
|
$
|
658,047
|
|
$
|
536,458
|
|
$
|
447,271
|
|
|
Ski school
|
143,249
|
|
126,206
|
|
109,442
|
|
|||
|
Dining
|
121,008
|
|
101,010
|
|
89,892
|
|
|||
|
Retail/rental
|
241,134
|
|
219,153
|
|
210,387
|
|
|||
|
Other
|
141,166
|
|
121,202
|
|
106,581
|
|
|||
|
Total Mountain net revenue
|
1,304,604
|
|
1,104,029
|
|
963,573
|
|
|||
|
Lodging
|
274,554
|
|
254,553
|
|
242,287
|
|
|||
|
Resort
|
1,579,158
|
|
1,358,582
|
|
1,205,860
|
|
|||
|
Real Estate
|
22,128
|
|
41,342
|
|
48,786
|
|
|||
|
Total net revenue
|
$
|
1,601,286
|
|
$
|
1,399,924
|
|
$
|
1,254,646
|
|
|
Segment operating expense:
|
|||||||||
|
Mountain
|
$
|
881,472
|
|
$
|
777,147
|
|
$
|
712,785
|
|
|
Lodging
|
246,385
|
|
232,877
|
|
225,563
|
|
|||
|
Resort
|
1,127,857
|
|
1,010,024
|
|
938,348
|
|
|||
|
Real Estate
|
24,639
|
|
48,408
|
|
55,826
|
|
|||
|
Total segment operating expense
|
$
|
1,152,496
|
|
$
|
1,058,432
|
|
$
|
994,174
|
|
|
Gain on litigation settlement
|
$
|
—
|
|
$
|
16,400
|
|
$
|
—
|
|
|
Gain on sale of real property
|
$
|
5,295
|
|
$
|
151
|
|
$
|
—
|
|
|
Mountain equity investment income, net
|
$
|
1,283
|
|
$
|
822
|
|
$
|
1,262
|
|
|
Reported EBITDA:
|
|||||||||
|
Mountain
|
$
|
424,415
|
|
$
|
344,104
|
|
$
|
252,050
|
|
|
Lodging
|
28,169
|
|
21,676
|
|
16,724
|
|
|||
|
Resort
|
452,584
|
|
365,780
|
|
268,774
|
|
|||
|
Real Estate
|
2,784
|
|
(6,915
|
)
|
(7,040
|
)
|
|||
|
Total Reported EBITDA
|
$
|
455,368
|
|
$
|
358,865
|
|
$
|
261,734
|
|
|
Real estate held for sale and investment
|
$
|
111,088
|
|
$
|
129,825
|
|
$
|
157,858
|
|
|
Reconciliation to net income attributable to Vail Resorts, Inc.:
|
|
|
|
||||||
|
Total Reported EBITDA
|
$
|
455,368
|
|
$
|
358,865
|
|
$
|
261,734
|
|
|
Depreciation and amortization
|
(161,488
|
)
|
(149,123
|
)
|
(140,601
|
)
|
|||
|
Change in fair value of contingent consideration
|
(4,200
|
)
|
3,650
|
|
(1,400
|
)
|
|||
|
Loss on disposal of fixed assets and other, net
|
(5,418
|
)
|
(2,057
|
)
|
(1,208
|
)
|
|||
|
Investment income, net
|
723
|
|
246
|
|
375
|
|
|||
|
Interest expense
|
(42,366
|
)
|
(51,241
|
)
|
(63,997
|
)
|
|||
|
Loss on extinguishment of debt
|
—
|
|
(11,012
|
)
|
(10,831
|
)
|
|||
|
Income before provision for income taxes
|
242,619
|
|
149,328
|
|
44,072
|
|
|||
|
Provision for income taxes
|
(93,165
|
)
|
(34,718
|
)
|
(15,866
|
)
|
|||
|
Net income
|
149,454
|
|
114,610
|
|
28,206
|
|
|||
|
Net loss attributable to noncontrolling interests
|
300
|
|
144
|
|
272
|
|
|||
|
Net income attributable to Vail Resorts, Inc.
|
$
|
149,754
|
|
$
|
114,754
|
|
$
|
28,478
|
|
87
14.
Selected Quarterly Financial Data (Unaudited--in thousands, except per share amounts)
|
|
2016
|
||||||||||||||
|
Year Ended July 31, 2016
|
Quarter Ended, July 31, 2016
|
Quarter Ended, April 30, 2016
|
Quarter Ended, January 31, 2016
|
Quarter Ended, October 31, 2015
|
|||||||||||
|
Mountain revenue
|
$
|
1,304,604
|
|
$
|
97,994
|
|
$
|
572,805
|
|
$
|
532,872
|
|
$
|
100,933
|
|
|
Lodging revenue
|
274,554
|
|
74,528
|
|
72,933
|
|
62,807
|
|
64,286
|
|
|||||
|
Real Estate revenue
|
22,128
|
|
7,362
|
|
1,734
|
|
3,684
|
|
9,348
|
|
|||||
|
Total net revenue
|
$
|
1,601,286
|
|
$
|
179,884
|
|
$
|
647,472
|
|
$
|
599,363
|
|
$
|
174,567
|
|
|
Income (loss) from operations
|
$
|
282,979
|
|
$
|
(93,776
|
)
|
$
|
263,380
|
|
$
|
200,064
|
|
$
|
(86,689
|
)
|
|
Net income (loss)
|
$
|
149,454
|
|
$
|
(65,284
|
)
|
$
|
157,537
|
|
$
|
116,871
|
|
$
|
(59,670
|
)
|
|
Net income (loss) attributable to Vail Resorts, Inc.
|
$
|
149,754
|
|
$
|
(65,273
|
)
|
$
|
157,632
|
|
$
|
116,982
|
|
$
|
(59,587
|
)
|
|
Basic net income (loss) per share attributable to Vail Resorts, Inc.
|
$
|
4.13
|
|
$
|
(1.80
|
)
|
$
|
4.35
|
|
$
|
3.23
|
|
$
|
(1.63
|
)
|
|
Diluted net income (loss) per share attributable to Vail Resorts, Inc.
|
$
|
4.01
|
|
$
|
(1.80
|
)
|
$
|
4.23
|
|
$
|
3.14
|
|
$
|
(1.63
|
)
|
|
|
2015
|
||||||||||||||
|
Year Ended July 31, 2015
|
Quarter Ended, July 31, 2015
|
Quarter Ended, April 30, 2015
|
Quarter Ended, January 31, 2015
|
Quarter Ended, October 31, 2014
|
|||||||||||
|
Mountain revenue
|
$
|
1,104,029
|
|
$
|
81,061
|
|
$
|
499,551
|
|
$
|
463,031
|
|
$
|
60,386
|
|
|
Lodging revenue
|
254,553
|
|
69,373
|
|
67,323
|
|
59,364
|
|
58,493
|
|
|||||
|
Real Estate revenue
|
41,342
|
|
11,648
|
|
12,469
|
|
7,842
|
|
9,383
|
|
|||||
|
Total net revenue
|
$
|
1,399,924
|
|
$
|
162,082
|
|
$
|
579,343
|
|
$
|
530,237
|
|
$
|
128,262
|
|
|
Income (loss) from operations
|
$
|
210,513
|
|
$
|
(88,478
|
)
|
$
|
227,752
|
|
$
|
160,071
|
|
$
|
(88,832
|
)
|
|
Net income (loss)
|
$
|
114,610
|
|
$
|
(70,168
|
)
|
$
|
133,402
|
|
$
|
115,700
|
|
$
|
(64,324
|
)
|
|
Net income (loss) attributable to Vail Resorts, Inc.
|
$
|
114,754
|
|
$
|
(70,142
|
)
|
$
|
133,410
|
|
$
|
115,762
|
|
$
|
(64,276
|
)
|
|
Basic net income (loss) per share attributable to Vail Resorts, Inc.
|
$
|
3.16
|
|
$
|
(1.92
|
)
|
$
|
3.67
|
|
$
|
3.19
|
|
$
|
(1.77
|
)
|
|
Diluted net income (loss) per share attributable to Vail Resorts, Inc.
|
$
|
3.07
|
|
$
|
(1.92
|
)
|
$
|
3.56
|
|
$
|
3.10
|
|
$
|
(1.77
|
)
|
|
15.
|
Share Repurchase Plan
|
On March 9, 2006, the Company’s Board of Directors approved a share repurchase program, authorizing the Company to repurchase up to
3,000,000
shares of common stock. On July 16, 2008, the Company’s Board of Directors increased the authorization by an additional
3,000,000
shares, and on December 4, 2015, the Company’s Board of Directors increased the authorization by an additional
1,500,000
shares for a total authorization to repurchase shares of up to
7,500,000
shares. During the year ended
July 31, 2016
, the Company repurchased
485,866
shares (at a total cost of
$53.8 million
). The Company did not repurchase any shares of common stock during the years ended
July 31, 2015
or
2014
. Since inception of this stock repurchase program through
July 31, 2016
, the Company has repurchased
5,434,977
shares at a cost of approximately
$247.0 million
. As of
July 31, 2016
,
2,065,023
shares remained available to repurchase under the existing repurchase authorization. These authorizations have no expiration date. Shares of common stock purchased pursuant to the repurchase program will be held as treasury shares and may be used for issuance under the Company’s employee share award plan.
88
|
16.
|
Stock Compensation Plan
|
The Company has a share award plan (the “Plan”) which has been approved by the Company’s stockholders. Under the Plan, up to
4.4 million
shares of common stock could be issued in the form of options, stock appreciation rights, restricted shares, restricted share units, performance shares, performance share units, dividend equivalents or other share-based awards to employees, directors or consultants of the Company or its subsidiaries or affiliates. The terms of awards granted under the Plan, including exercise price, vesting period and life, are set by the Compensation Committee of the Board of Directors. All share-based awards (except for restricted shares and restricted share units) granted under the Plan have a life of
ten
years. Most awards vest ratably over
three years
; however, some have been granted with different vesting schedules. Of the awards outstanding, none have been granted to non-employees (except those granted to non-employee members of the Board of Directors of the Company) under the Plan. At
July 31, 2016
, approximately
4.4 million
share based awards were available to be granted under the Plan.
The fair value of stock-settled stock appreciation rights (“SARs”) granted in the years ended
July 31, 2016
,
2015
and
2014
were estimated on the date of grant using a lattice-based option valuation model that applies the assumptions noted in the table below. A lattice-based model considers factors such as exercise behavior, and assumes employees will exercise equity awards at different times over the contractual life of the equity awards. As a lattice-based model considers these factors, and is more flexible, the Company considers it to be a better method of valuing equity awards than a closed-form Black-Scholes model. Because lattice-based option valuation models incorporate ranges of assumptions for inputs, those ranges are disclosed. Expected volatility is based on historical volatility of the Company’s stock. The Company uses historical data to estimate equity award exercises and employee terminations within the valuation model; separate groups of employees that have similar historical exercise behavior are considered separately for valuation purposes. The expected term of equity awards granted is derived from the output of the option valuation model and represents the period of time that equity awards granted are expected to be outstanding; the range given below results from certain groups of employees exhibiting different behavior. The risk-free rate for periods within the contractual life of the equity award is based on the United States Treasury yield curve in effect at the time of grant.
|
|
Year Ended July 31,
|
||
|
|
2016
|
2015
|
2014
|
|
Expected volatility
|
40.4%
|
40.6%
|
41.2%
|
|
Expected dividends
|
2.2%
|
1.9%
|
1.2%
|
|
Expected term (average in years)
|
5.3-5.9
|
4.9-5.6
|
5.5-5.9
|
|
Risk-free rate
|
0.3-2.2%
|
0.1-2.6%
|
0.1-2.8%
|
The Company has estimated forfeiture rates that range from
0.0%
to
21.6%
based upon the class of employees receiving stock-based compensation in its calculation of stock-based compensation expense for the year ended
July 31, 2016
. These estimates are based on historical forfeiture behavior exhibited by employees of the Company.
89
A summary of aggregate option and SARs award activity under the Plan as of
July 31, 2014
,
2015
and
2016
, and changes during the years then ended is presented below (in thousands, except exercise price and contractual term):
|
Awards
|
Weighted-Average
Exercise Price
|
Weighted-Average
Remaining
Contractual Term
|
Aggregate
Intrinsic
Value
|
||||||
|
Outstanding at August 1, 2013
|
2,753
|
|
$
|
37.63
|
|
||||
|
Granted
|
352
|
|
73.13
|
|
|||||
|
Exercised
|
(321
|
)
|
37.62
|
|
|||||
|
Forfeited or expired
|
(28
|
)
|
48.87
|
|
|
|
|||
|
Outstanding at July 31, 2014
|
2,756
|
|
$
|
42.06
|
|
||||
|
Granted
|
242
|
|
91.64
|
|
|||||
|
Exercised
|
(575
|
)
|
36.20
|
|
|||||
|
Forfeited or expired
|
(38
|
)
|
75.99
|
|
|
|
|||
|
Outstanding at July 31, 2015
|
2,385
|
|
$
|
47.96
|
|
||||
|
Granted
|
198
|
|
113.67
|
|
|||||
|
Exercised
|
(180
|
)
|
49.79
|
|
|||||
|
Forfeited or expired
|
(22
|
)
|
80.42
|
|
|
|
|||
|
Outstanding at July 31, 2016
|
2,381
|
|
$
|
52.98
|
|
5.0 years
|
$
|
214,483
|
|
|
Vested and expected to vest at July 31, 2016
|
2,355
|
|
$
|
52.54
|
|
5.0 years
|
$
|
213,231
|
|
|
Exercisable at July 31, 2016
|
1,940
|
|
$
|
42.92
|
|
4.3 years
|
$
|
194,282
|
|
The weighted-average grant-date fair value of SARs granted during the years ended
July 31, 2016
,
2015
and
2014
was
$35.20
,
$29.12
and
$23.60
, respectively. The total intrinsic value of options and SARs exercised during the years ended
July 31, 2016
,
2015
and
2014
was
$13.1 million
,
$37.4 million
and
$10.8 million
, respectively. The Company had
302,000
,
420,000
and
421,000
SARs that vested during the years ended
July 31, 2016
,
2015
and
2014
, respectively. These awards had a total estimated fair value of
$10.8 million
,
$13.6 million
and
$9.8 million
at the date of vesting for the years ended
July 31, 2016
,
2015
and
2014
, respectively.
A summary of the status of the Company’s nonvested SARs as of
July 31, 2016
and changes during the year then ended is presented below (in thousands, except fair value amounts):
|
Awards
|
Weighted-Average
Grant-Date
Fair Value
|
|||
|
Outstanding at July 31, 2015
|
567
|
$
|
24.56
|
|
|
Granted
|
198
|
35.20
|
|
|
|
Vested
|
(302)
|
22.77
|
|
|
|
Forfeited
|
(22)
|
27.87
|
|
|
|
Nonvested at July 31, 2016
|
441
|
$
|
30.39
|
|
A summary of the status of the Company’s nonvested restricted share units as of
July 31, 2016
and changes during the year then ended is presented below (in thousands, except fair value amounts):
|
Awards
|
Weighted-Average
Grant-Date
Fair Value
|
|||
|
Outstanding at July 31, 2015
|
271
|
$
|
72.10
|
|
|
Granted
|
142
|
102.20
|
|
|
|
Vested
|
(134)
|
66.69
|
|
|
|
Forfeited
|
(18)
|
85.79
|
|
|
|
Nonvested at July 31, 2016
|
261
|
$
|
90.54
|
|
90
The Company granted
142,000
restricted share units during the year ended
July 31, 2016
with a weighted-average grant-date estimated fair value of
$102.20
. The Company granted
143,000
restricted share units during the year ended
July 31, 2015
with a weighted-average grant-date estimated fair value of
$83.50
. The Company granted
152,000
restricted share units during the year ended
July 31, 2014
with a weighted-average grant-date estimated fair value of
$67.48
. The Company had
134,000
,
113,000
and
166,000
restricted share units that vested during the years ended
July 31, 2016
,
2015
and
2014
, respectively. These units had a total estimated fair value of
$14.6 million
,
$9.9 million
and
$6.9 million
at the date of vesting for the years ended
July 31, 2016
,
2015
and
2014
, respectively.
As of
July 31, 2016
, there was
$19.7 million
of total unrecognized compensation expense related to nonvested share-based compensation arrangements granted under the Plan, of which
$12.0 million
,
$6.8 million
and
$0.9 million
of expense is expected to be recognized in the years ending
July 31, 2017
,
2018
and
2019
, respectively, assuming no future share-based awards are granted.
Cash received from options exercised under all share-based payment arrangements was
zero
,
$1.1 million
and
$1.8 million
for the years ended
July 31, 2016
,
2015
and
2014
, respectively. The tax benefit realized or to be realized from options/SARs exercised and restricted stock units vested was
$10.3 million
,
$18.1 million
and
$8.5 million
for the years ended
July 31, 2016
,
2015
and
2014
, respectively.
The Company has a policy of using either authorized and unissued shares or treasury shares, including shares acquired by purchase in the open market, to satisfy equity award exercises.
|
17.
|
Retirement and Profit Sharing Plans
|
The Company maintains a defined contribution retirement plan (the “Retirement Plan”), qualified under Section 401(k) of the Internal Revenue Code, for its employees. Under this Retirement Plan, employees are eligible to make before-tax contributions on the first day of the calendar month following the later of: (i) their employment commencement date or (ii) the date they turn
21
. Participants may contribute up to
100%
of their qualifying annual compensation up to the annual maximum specified by the Internal Revenue Code. The Company matches an amount equal to
50%
of each participant’s contribution up to
6%
of a participant’s bi-weekly qualifying compensation upon obtaining the later of: (i)
12
consecutive months of employment and
1,000
service hours or (ii)
1,500
service hours since the employment commencement date. The Company’s matching contribution is entirely discretionary and may be reduced or eliminated at any time.
Total Retirement Plan expense recognized by the Company for the years ended
July 31, 2016
,
2015
and
2014
was
$5.3 million
,
$4.5 million
and
$4.1 million
, respectively.
91
|
18.
|
Subsequent Event
|
On
August 5, 2016
, the Company entered into an Arrangement Agreement (the “Whistler Agreement”) to acquire all of the outstanding common shares of Whistler Blackcomb Holdings, Inc. (“Whistler Blackcomb”). Whistler Blackcomb owns a
75%
interest in each of Whistler Mountain Resort Limited Partnership and Blackcomb Skiing Enterprises Limited Partnership, which together operate Whistler Blackcomb resort, a year round mountain resort with a comprehensive offering of recreational activities, including both snow sports and summer activities. Whistler Blackcomb shareholders will receive total consideration equal to (i)
C$17.50
per share in cash, and (ii)
0.0998
shares (the “Consideration Shares”), subject to a currency exchange rate adjustment to be determined based on the applicable exchange rate as of the sixth business day prior to the closing date. The estimated consideration to be paid to Whistler Blackcomb shareholders is approximately
$1.1 billion
as of August 5, 2016, based on the closing currency exchange rate and Vail Resorts common stock as of that day.
The Company expects the Whistler Blackcomb transaction to close in fall 2016. The transaction has been unanimously approved by the board of directors of Whistler Blackcomb, and shareholders representing
25%
of Whistler Blackcomb's common shares have entered into voting support agreements in connection with the transaction. The transaction has also been unanimously approved by the board of directors of the Company. The Whistler Agreement provides for customary representations, warranties and covenants, and provides for the payment of fees upon the termination of the Whistler Agreement under certain circumstances, including Whistler Blackcomb obtaining a superior proposal and failure to obtain certain regulatory approvals. Completion of this acquisition is subject to certain closing conditions, including the approval by Whistler Blackcomb shareholders and the British Columbia Supreme Court, and regulatory approvals, as well as other customary closing conditions.
The Company intends to finance the cash portion of the consideration for the Whistler Blackcomb transaction with a combination of cash and cash equivalents on hand, available revolving borrowing capacity under the Credit Agreement, and an incremental term loan facility to be incurred through an amendment to the Credit Agreement. The Company has received an executed commitment letter from U.S. Bank, National Association (“U.S. Bank”) and Wells Fargo Bank, National Association (“Wells Fargo”) whereby U.S. Bank and Wells Fargo have committed to provide a
$360 million
incremental term loan. Additionally, the Company intends to assume or refinance Whistler Blackcomb’s existing
C$300 million
revolving credit facility as part of the transaction. As of June 30, 2016, Whistler Blackcomb disclosed
C$185.8 million
of debt outstanding under its credit facility (
$143.8 million
based on closing exchange rate as of June 30, 2016). In addition, Whistler Blackcomb’s credit facility contains a change in control provision pursuant to which the lenders can elect to require repayment of the entire outstanding balance upon closing.
|
ITEM 9.
|
CHANGES IN AND DISAGREEMENTS WITH ACCOUNTANTS ON ACCOUNTING AND FINANCIAL DISCLOSURE.
|
None.
|
ITEM 9A.
|
CONTROLS AND PROCEDURES.
|
Disclosure Controls and Procedures
Management of the Company, including the Chief Executive Officer (“CEO”) and Chief Financial Officer (“CFO”), have evaluated the effectiveness of the Company’s disclosure controls and procedures as of the end of the period covered by this Form 10-K. The term “disclosure controls and procedures” means controls and other procedures established by the Company that are designed to ensure that information required to be disclosed by the Company in the reports that it files or submits under the Act is recorded, processed, summarized and reported within the time periods specified in the SEC’s rules and forms. Disclosure controls and procedures include, without limitation, controls and procedures designed to ensure that information required to be disclosed by the Company in the reports that it files or submits under the Act is accumulated and communicated to the Company’s management, including its CEO and CFO, as appropriate, to allow timely decisions regarding required disclosure.
Based upon their evaluation of the Company’s disclosure controls and procedures, the CEO and the CFO concluded that, as of the end of the period covered by this Form 10-K, the disclosure controls are effective to provide reasonable assurance that information required to be disclosed by the Company in the reports that it files or submits under the Act is accumulated and communicated to management, including the CEO and CFO, as appropriate, to allow timely decisions regarding required disclosure and are effective to provide reasonable assurance that such information is recorded, processed, summarized and reported within the time periods specified by the SEC’s rules and forms.
92
The Company, including its CEO and CFO, does not expect that the Company’s controls and procedures will prevent or detect all error and all fraud. A control system, no matter how well conceived or operated, can provide only reasonable, not absolute, assurance that the objectives of the control system are met.
Management’s Annual Report on Internal Control Over Financial Reporting
The report of management required under this Item 9A is contained in Item 8 of this Form 10-K under the caption “Management’s Report on Internal Control over Financial Reporting.”
Attestation Report of the Independent Registered Public Accounting Firm
The attestation report required under this Item 9A is contained in Item 8 of this Form 10-K under the caption “Report of Independent Registered Public Accounting Firm.”
Changes in Internal Control Over Financial Reporting
There were no changes in the Company’s internal control over financial reporting during the quarter ended July 31, 2016 that have materially affected, or are reasonably likely to materially affect, the Company’s internal control over financial reporting.
|
ITEM 9B.
|
OTHER INFORMATION.
|
None.
|
ITEM 10.
|
DIRECTORS, EXECUTIVE OFFICERS AND CORPORATE GOVERNANCE.
|
The information required by this item is incorporated herein by reference from the Company’s definitive Proxy Statement for the 2016 annual meeting of stockholders.
|
ITEM 11.
|
EXECUTIVE COMPENSATION.
|
The information required by this item is incorporated herein by reference from the Company’s definitive Proxy Statement for the 2016 annual meeting of stockholders.
|
ITEM 12.
|
SECURITY OWNERSHIP OF CERTAIN BENEFICIAL OWNERS AND MANAGEMENT AND RELATED STOCKHOLDER MATTERS.
|
The information required by this item is incorporated herein by reference from the Company’s definitive Proxy Statement for the 2016 annual meeting of stockholders.
|
ITEM 13.
|
CERTAIN RELATIONSHIPS AND RELATED TRANSACTIONS, AND DIRECTOR INDEPENDENCE.
|
The information required by this item is incorporated herein by reference from the Company’s definitive Proxy Statement for the 2016 annual meeting of stockholders.
|
ITEM 14.
|
PRINCIPAL ACCOUNTING FEES AND SERVICES.
|
The information required by this item is incorporated herein by reference from the Company’s definitive Proxy Statement for the 2016 annual meeting of stockholders.
93
|
ITEM 15.
|
EXHIBITS, FINANCIAL STATEMENT SCHEDULES.
|
|
a)
|
Index to Financial Statements.
|
|
(1)
|
See “Item 8. Financial Statements and Supplementary Data” for the index to the Financial Statements.
|
|
(2)
|
Schedules have been omitted because they are not required or not applicable, or the required information is shown in the financial statements or notes to the financial statements.
|
|
(3)
|
See the Index to Exhibits below.
|
The following exhibits are either filed herewith or, if so indicated, incorporated by reference to the documents indicated in parentheses, which have previously been filed with the Securities and Exchange Commission.
|
Posted
Exhibit
Number
|
Description
|
|
2.1
|
Transaction Agreement, dated as of May 24, 2013, between VR CPC Holdings, Inc. and ASC Utah LLC, Talisker Land Holdings, LLC, Talisker Canyons Lands LLC, Talisker Canyons Leaseco LLC, American Skiing Company Resort Properties LLC, Talisker Canyons Propco LLC and Talisker Canyons Finance Co LLC. (Incorporated by reference to Exhibit 2.1 on Form 8-K of Vail Resorts, Inc. filed on May 30, 2013) (File No. 001-09614).
|
|
2.2
|
Purchase and Sale Agreement, dated as of September 11, 2014, between VR CPC Holdings, Inc. and Greater Park City Company, Powdr Corp., Greater Properties, Inc., Park Properties, Inc. and Powdr Development Company. (Incorporated by reference to Exhibit 2.1 on Form 10-Q of Vail Resorts, Inc. for the quarter ended October 31, 2014) (File No. 001-09614).
|
|
2.3
|
Arrangement Agreement, dated as of August 5, 2016, between Vail Resorts, Inc., 1068877 B.C. Ltd. and Whistler Blackcomb Holdings Inc. (Incorporated by reference to Exhibit 2.1 on Form 8-K of Vail Resorts, Inc. filed on August 8, 2016) (File No. 001-09614).
|
|
3.1
|
Amended and Restated Certificate of Incorporation of Vail Resorts, Inc., dated January 5, 2005. (Incorporated by reference to Exhibit 3.1 on Form 10-Q of Vail Resorts, Inc. for the quarter ended January 31, 2005)(File No. 001-09614).
|
|
3.2
|
Certificate of Amendment of Amended and Restated Certificate of Incorporation of Vail Resorts, Inc., dated December 7, 2011. (Incorporated by reference to Exhibit 3.1 on Form 8-K of Vail Resorts, Inc. filed on December 8, 2011) (File No. 001-09614).
|
|
3.3
|
Amended and Restated Bylaws of Vail Resorts, Inc. , dated December 7, 2011. (Incorporated by reference to Exhibit 3.2 on Form 8-K of Vail Resorts, Inc. filed on December 8, 2011) (File No. 001-09614).
|
|
10.1
|
Forest Service Unified Permit for Heavenly ski area, dated April 29, 2002. (Incorporated by reference to Exhibit 99.13 of the report on Form 10-Q of Vail Resorts, Inc. for the quarter ended April 30, 2002) (File No. 001-09614).
|
|
10.2(a)
|
Forest Service Unified Permit for Keystone ski area, dated December 30, 1996. (Incorporated by reference to Exhibit 99.2(a) on Form 10-Q of Vail Resorts, Inc. for the quarter ended October 31, 2002) (File No. 001-09614).
|
|
10.2(b)
|
Amendment No. 2 to Forest Service Unified Permit for Keystone ski area. (Incorporated by reference to Exhibit 99.2(b) on Form 10-Q of Vail Resorts, Inc. for the quarter ended October 31, 2002) (File No. 001-09614).
|
94
|
Posted
Exhibit
Number
|
Description
|
|
10.2(c)
|
Amendment No. 3 to Forest Service Unified Permit for Keystone ski area. (Incorporated by reference to Exhibit 10.3 (c) on Form 10-K of Vail Resorts, Inc. for the year ended July 31, 2005) (File No. 001-09614).
|
|
10.2(d)
|
Amendment No. 4 to Forest Service Unified Permit for Keystone ski area. (Incorporated by reference to Exhibit 10.3 (d) on Form 10-K of Vail Resorts, Inc. for the year ended July 31, 2005) (File No. 001-09614).
|
|
10.2(e)
|
Amendment No. 5 to Forest Service Unified Permit for Keystone ski area. (Incorporated by reference to Exhibit 10.3 (e) on Form 10-K of Vail Resorts, Inc. for the year ended July 31, 2005) (File No. 001-09614).
|
|
10.3(a)
|
Forest Service Unified Permit for Breckenridge ski area, dated December 30, 1996. (Incorporated by reference to Exhibit 99.3(a) on Form 10-Q of Vail Resorts, Inc. for the quarter ended October 31, 2002) (File No. 001-09614).
|
|
10.3(b)
|
Amendment No. 1 to Forest Service Unified Permit for Breckenridge ski area. (Incorporated by reference to Exhibit 99.3(b) on Form 10-Q of Vail Resorts, Inc. for the quarter ended October 31, 2002) (File No. 001-09614).
|
|
10.3(c)
|
Amendment No. 2 to Forest Service Unified Permit for Breckenridge ski area. (Incorporated by reference to Exhibit 10.4 (c) on Form 10-K of Vail Resorts, Inc. for the year ended July 31, 2005) (File No. 001-09614).
|
|
10.3(d)
|
Amendment No. 3 to Forest Service Unified Permit for Breckenridge ski area. (Incorporated by reference to Exhibit 10.4 (d) on Form 10-K of Vail Resorts, Inc. for the year ended July 31, 2005) (File No. 001-09614).
|
|
10.3(e)
|
Amendment No. 4 to Forest Service Unified Permit for Breckenridge ski area. (Incorporated by reference to Exhibit 10.4 (e) on Form 10-K of Vail Resorts, Inc. for the year ended July 31, 2005) (File No. 001-09614).
|
|
10.3(f)
|
Amendment No. 5 to Forest Service Unified Permit for Breckenridge ski area. (Incorporated by reference to Exhibit 10.4(f) on Form 10-Q of Vail Resorts, Inc. for the quarter ended January 31, 2006) (File No. 001-09614).
|
|
10.4(a)
|
Forest Service Unified Permit for Beaver Creek ski area. (Incorporated by reference to Exhibit 99.4(a) on Form 10-Q of Vail Resorts, Inc. for the quarter ended October 31, 2002) (File No. 001-09614).
|
|
10.4(b)
|
Exhibits to Forest Service Unified Permit for Beaver Creek ski area. (Incorporated by reference to Exhibit 99.4(b) on Form 10-Q of Vail Resorts, Inc. for the quarter ended October 31, 2002) (File No. 001-09614).
|
|
10.4(c)
|
Amendment No. 1 to Forest Service Unified Permit for Beaver Creek ski area. (Incorporated by reference to Exhibit 10.5(c) on Form 10-K of Vail Resorts, Inc. for the year ended July 31, 2005) (File No. 001-09614).
|
|
10.4(d)
|
Amendment No. 2 to Forest Service Unified Permit for Beaver Creek ski area. (Incorporated by reference to Exhibit 10.5(d) on Form 10-K of Vail Resorts, Inc. for the year ended July 31, 2005) (File No. 001-09614).
|
|
10.4(e)
|
Amendment to Forest Service Unified Permit for Beaver Creek ski area. (Incorporated by reference to Exhibit 10.5(e) on Form 10-K of Vail Resorts, Inc. for the year ended July 31, 2005) (File No. 001-09614).
|
|
10.4(f)
|
Amendment No. 3 to Forest Service Unified Permit for Beaver Creek ski area. (Incorporated by reference to Exhibit 10.4(f) on Form 10-K of Vail Resorts, Inc. for the year ended July 31, 2008) (File No. 001-09614).
|
|
10.5(a)
|
Forest Service Unified Permit for Vail ski area, dated November 23, 1993. (Incorporated by reference to Exhibit 99.5(a) on Form 10-Q of Vail Resorts, Inc. for the quarter ended October 31, 2002) (File No. 001-09614).
|
95
|
Posted
Exhibit
Number
|
Description
|
|
10.5(b)
|
Exhibits to Forest Service Unified Permit for Vail ski area. (Incorporated by reference to Exhibit 99.5(b) on Form 10-Q of Vail Resorts, Inc. for the quarter ended October 31, 2002) (File No. 001-09614).
|
|
10.5(c)
|
Amendment No. 2 to Forest Service Unified Permit for Vail ski area. (Incorporated by reference to Exhibit 99.5(c) on Form 10-Q of Vail Resorts, Inc. for the quarter ended October 31, 2002) (File No. 001-09614).
|
|
10.5(d)
|
Amendment No. 3 to Forest Service Unified Permit for Vail ski area. (Incorporated by reference to Exhibit 10.6 (d) on Form 10-K of Vail Resorts, Inc. for the year ended July 31, 2005) (File No. 001-09614).
|
|
10.5(e)
|
Amendment No. 4 to Forest Service Unified Permit for Vail ski area. (Incorporated by reference to Exhibit 10.6 (e) on Form 10-K of Vail Resorts, Inc. for the year ended July 31, 2005) (File No. 001-09614).
|
|
10.6(a)
|
Sports and Housing Facilities Financing Agreement between the Vail Corporation (d/b/a “Vail Associates, Inc.”) and Eagle County, Colorado, dated April 1, 1998. (Incorporated by reference to Exhibit 10 on Form 10-Q of Vail Resorts, Inc. for the quarter ended April 30, 1998) (File No. 001-09614).
|
|
10.6(b)
|
Trust Indenture, dated as of April 1, 1998 securing Sports and Housing Facilities Revenue Refunding Bonds by and between Eagle County, Colorado and U.S. Bank, N.A., as Trustee. (Incorporated by reference to Exhibit 10.1 on Form 10-Q of Vail Resorts, Inc. for the quarter ended April 30, 1998) (File No. 001-09614).
|
|
10.7*
|
Vail Resorts, Inc. Amended and Restated 2002 Long Term Incentive and Share Award Plan. (Incorporated by reference to Exhibit 99.1 on Form 8-K of Vail Resorts, Inc. filed on December 10, 2009) (File No. 001-09614).
|
|
10.8*
|
Form of Stock Option Agreement. (Incorporated by reference to Exhibit 10.20 of Form 10-K of Vail Resorts, Inc. for the year ended July 31, 2007) (File No. 001-09614).
|
|
10.9*
|
Form of Restricted Share Unit Agreement. (Incorporated by reference to Exhibit 10.2 on Form 8-K of Vail Resorts, Inc. filed on December 7, 2015) (File Number 001-09614).
|
|
10.10*
|
Form of Share Appreciation Rights Agreement. (Incorporated by reference to Exhibit 10.3 on Form 8-K of Vail Resorts, Inc. filed on December 7, 2015) (File Number 001-09614)
|
|
10.11*
|
Vail Resorts Deferred Compensation Plan, effective as of January 1, 2005. (Incorporated by reference to Exhibit 10.22 on Form 10-K of Vail Resorts, Inc. for the year ended July 31, 2009) (File No. 001-09614).
|
|
10.12(a)*
|
Executive Employment Agreement made and entered into October 15, 2008 by and between Vail Resorts, Inc. and Robert A. Katz. (Incorporated by reference to Exhibit 10.1 of the report on Form 10-Q of Vail Resorts, Inc. for the quarter ended October 31, 2008) (File No. 001-09614).
|
|
10.12(b)*
|
First Amendment to Employment Agreement, dated September 30, 2011, by and between Vail Resorts, Inc. and Robert A. Katz (Incorporated by reference to Exhibit 10.1 on Form 8-K of Vail Resorts, Inc. filed September 30, 2011) (File No. 001-09614).
|
|
10.12(c)*
|
Amendment to Executive Employment Agreement, dated April 11, 2013, by and between Vail Resorts, Inc. and Robert A. Katz. (Incorporated by reference to Exhibit 10.1 on Form 10-Q of Vail Resorts, Inc. for the quarter ended April 30, 2013) (File No. 001-09614).
|
|
10.13*
|
Form of Indemnification Agreement. (Incorporated by reference to Exhibit 10.8 of the report on Form 10-Q of Vail Resorts, Inc. for the quarter ended October 31, 2008) (File No. 001-09614).
|
96
|
Posted
Exhibit
Number
|
Description
|
|
10.14
|
Master Agreement of Lease, dated May 29, 2013, between VR CPC Holdings, Inc. and Talisker Canyons Leaseco LLC. (Incorporated by reference to Exhibit 10.1 on Form 8-K of Vail Resorts, Inc. filed on May 30, 2013) (File No. 001-09614).
|
|
10.15
|
Guaranty of Vail Resorts, Inc., dated May 29, 2013, in connection with the Master Agreement of Lease between VR CPC Holdings, Inc. and Talisker Canyons Leaseco LLC. (Incorporated by reference to Exhibit 10.2 on Form 8-K of Vail Resorts, Inc. filed on May 30, 2013) (File No. 001-09614).
|
|
10.16*
|
Vail Resorts, Inc. Management Incentive Plan. (Incorporated by reference to Exhibit 10.1 on Form 10-Q of Vail Resorts, Inc. for the quarter ended October 31, 2015) (File No. 001-09614).
|
|
10.17*
|
Vail Resorts, Inc. 2015 Omnibus Incentive Plan (Incorporated by reference to Exhibit 10.1 on Form 8-K of Vail Resorts, Inc. filed on December 7, 2015) (File Number 001-09614).
|
|
10.18
|
Seventh Amended and Restated Credit Agreement, Annex A to that certain Amendment Agreement, dated as of May 1, 2015, among Vail Holdings, Inc., as borrower, Bank of America, N.A., as administrative agent, U.S. Bank National Association and Wells Fargo Bank, National Association, as co-syndication agents, BBVA Compass, as documentation agent, and the Lenders party thereto. (Incorporated by reference to Exhibit 10.1 on Form 10-Q of Vail Resorts, Inc. for the quarter ended April 30, 2015) (File No. 001-09614).
|
|
10.19
|
First Amendment to Seventh Amended and Restated Credit Agreement dated as of December 4, 2015, among Vail Holdings, Inc., as borrower, Bank of America N.A., as administrative agent, and the Lenders party thereto (Incorporated by reference to Exhibit 10.2 on Form 10-Q of Vail Resorts, Inc. for the quarter ended October 31, 2015) (File Number 001-09614).
|
|
21
|
Subsidiaries of Vail Resorts, Inc.
|
|
23
|
Consent of Independent Registered Public Accounting Firm.
|
|
24
|
Power of Attorney. Included on signature pages hereto.
|
|
31.1
|
Certification of Chief Executive Officer pursuant to Section 302 of the Sarbanes-Oxley Act of 2002.
|
|
31.2
|
Certification of Chief Financial Officer pursuant to Section 302 of the Sarbanes-Oxley Act of 2002.
|
|
32
|
Certifications of Chief Executive Officer and Chief Financial Officer pursuant to 18 U.S.C. Section 1350 as adopted pursuant to Section 906 of the Sarbanes-Oxley Act of 2002.
|
|
101
|
The following information from the Company’s Year End Report on Form 10-K for the year ended July 31, 2016 formatted in eXtensible Business Reporting Language: (i) Consolidated Balance Sheets as of July 31, 2016 and July 31, 2015; (ii) Consolidated Statements of Operations as of July 31, 2016, July 31, 2015 and July 31, 2014; (iii) Consolidated Statements of Comprehensive Income as of July 31, 2016, July 31, 2015 and July 31, 2014; (iv) Consolidated Statements of Stockholders’ Equity as of July 31, 2016, July 31, 2015 and July 31, 2014 (v) Consolidated Statements of Cash Flows as of July 31, 2016, July 31, 2015 and July 31, 2014; and (vi) Notes to the Consolidated Financial Statements.
|
*Management contracts and compensatory plans and arrangements.
97
SIGNATURES
Pursuant to the requirements of Section 13 or 15(d) of the Securities Exchange Act of 1934, the registrant has duly caused this report to be signed on its behalf by the undersigned, thereunto duly authorized.
|
Date: September 26, 2016
|
Vail Resorts, Inc.
|
|
|
By:
|
/s/ Michael Z. Barkin
|
|
|
Michael Z. Barkin
|
||
|
Executive Vice President and Chief Financial Officer
(Principal Financial Officer)
|
||
|
Date: September 26, 2016
|
Vail Resorts, Inc.
|
|
|
By:
|
/s/ Ryan H. Siurek
|
|
|
Ryan H. Siurek
|
||
|
Vice President, Controller and
Chief Accounting Officer
(Principal Accounting Officer)
|
||
POWER OF ATTORNEY
Each person whose signature appears below hereby constitutes and appoints Michael Z. Barkin or Ryan H. Siurek his or her true and lawful attorney-in-fact and agent, with full power of substitution and resubstitution, for him or her and in his or her name, place and stead, in any and all capacities, to sign any or all amendments or supplements to this Form 10-K and to file the same with all exhibits thereto and other documents in connection therewith, with the Securities and Exchange Commission, granting unto said attorney-in-fact and agent full power and authority to do and perform each and every act and thing necessary or appropriate to be done with this Form 10-K and any amendments or supplements hereto, as fully to all intents and purposes as he or she might or could do in person, hereby ratifying and confirming all that said attorney-in-fact and agent, or their substitute or substitutes, may lawfully do or cause to be done by virtue hereof.
Pursuant to the requirements of the Securities Exchange Act of 1934, this report has been signed below by the following persons on behalf of the Registrant and in the capacities indicated on September 26, 2016.
98
|
/s/ Robert A. Katz
|
Chief Executive Officer and Chairman of the Board
|
|
Robert A. Katz
|
(Principal Executive Officer)
|
|
/s/ Michael Z. Barkin
|
Executive Vice President and Chief Financial Officer
|
|
Michael Z. Barkin
|
(Principal Financial Officer)
|
|
/s/ Ryan H. Siurek
|
Vice President, Controller and Chief Accounting Officer
|
|
Ryan H. Siurek
|
(Principal Accounting Officer)
|
|
/s/ Susan L. Decker
|
|
|
Susan L. Decker
|
Director
|
|
/s/ Roland A. Hernandez
|
|
|
Roland A. Hernandez
|
Director
|
|
/s/ John T. Redmond
|
|
|
John T. Redmond
|
Director
|
|
/s/ Hilary A. Schneider
|
|
|
Hilary A. Schneider
|
Director
|
|
/s/ D. Bruce Sewell
|
|
|
D. Bruce Sewell
|
Director
|
|
/s/ John F. Sorte
|
|
|
John F. Sorte
|
Director
|
|
/s/ Peter A. Vaughn
|
|
|
Peter A. Vaughn
|
Director
|
99
TABLE OF CONTENTS
Part IItem 1. BusinessItem 1A. Risk FactorsItem 1B. Unresolved Staff CommentsItem 2. PropertiesItem 3. Legal ProceedingsItem 4. Mine Safety DisclosuresPart IIItem 5. Market For Registrant S Common Equity, Related Stockholder Matters and Issuer Purchases Of Equity SecuritiesItem 6. Selected Financial DataItem 7. Management S Discussion and Analysis Of Financial Condition and Results Of OperationsItem 7A. Quantitative and Qualitative Disclosures About Market RiskItem 8. Financial Statements and Supplementary DataItem 9. Changes in and Disagreements with Accountants on Accounting and Financial DisclosureItem 9A. Controls and ProceduresItem 9B. Other InformationPart IIIItem 10. Directors, Executive Officers and Corporate GovernanceItem 11. Executive CompensationItem 12. Security Ownership Of Certain Beneficial Owners and Management and Related Stockholder MattersItem 13. Certain Relationships and Related Transactions, and Director IndependenceItem 14. Principal Accounting Fees and ServicesPart IVItem 15. Exhibits, Financial Statement Schedules