TIMKENSTEEL CORP
10-Ks and 10-Qs
|
|
|
|
|
|
|
|
|
|
|
|
|
|
|
|
|
|
|
|
|
|
|
|
|
|
|
|
|
|
|
|
|
|
|
|
|
|
|
|
|
UNITED STATES
SECURITIES AND EXCHANGE COMMISSION
WASHINGTON, D.C. 20549
|
FORM 10-Q
|
|
ý
|
QUARTERLY REPORT PURSUANT TO SECTION 13 OR 15(d) OF THE SECURITIES EXCHANGE ACT OF 1934
|
For the quarterly period ended
March 31, 2019
OR
|
o
|
TRANSITION REPORT PURSUANT TO SECTION 13 OR 15(d) OF THE SECURITIES EXCHANGE ACT OF 1934
|
For the transition period from
to
Commission file number: 1-36313

|
TIMKENSTEEL CORPORATION
(Exact name of registrant as specified in its charter)
|
|
Ohio
|
46-4024951
|
|
|
(State or other jurisdiction of
incorporation or organization)
|
(I.R.S. Employer
Identification No.)
|
|
|
1835 Dueber Avenue SW, Canton, OH
|
|
44706
|
|
(Address of principal executive offices)
|
|
(Zip Code)
|
330.471.7000
(Registrant’s telephone number, including area code)
Indicate by check mark whether the registrant (1) has filed all reports required to be filed by Section 13 or 15(d) of the Securities Exchange Act of 1934 during the preceding 12 months (or for such shorter period that the registrant was required to file such reports), and (2) has been subject to such filing requirements for the past 90 days. Yes
ý
No
¨
Indicate by check mark whether the registrant has submitted electronically and posted on its corporate Web site, if any, every Interactive Data File required to be submitted and posted pursuant to Rule 405 of Regulation S-T during the preceding 12 months (or for such shorter period that the registrant was required to submit and post such files). Yes
ý
No
¨
Indicate by check mark whether the registrant is a large accelerated filer, an accelerated filer, a non-accelerated filer, or a smaller reporting company. See the definitions of “large accelerated filer,” “accelerated filer” and “smaller reporting company” in Rule 12b-2 of the Exchange Act
|
Large accelerated filer
|
o
|
|
Accelerated filer
|
ý
|
||
|
Non-accelerated filer
|
|
o
|
(Do not check if smaller reporting company)
|
Smaller reporting company
|
o
|
|
|
Emerging growth company
|
o
|
|||||
If an emerging growth company, indicate by check mark if the registrant has elected not to use the extended transition period for complying with any new or revised financial reporting accounting standards provided pursuant to Section 13(a) of the Exchange Act.
¨
Indicate by check mark whether the registrant is a shell company (as defined in Rule 12b-2 of the Exchange Act). Yes
¨
No
ý
Indicate the number of shares outstanding of each of the issuer’s classes of common stock, as of the latest practicable date.
|
Class
|
Outstanding at April 15, 2019
|
|||
|
Common Shares, without par value
|
44,765,909
|
|||
TimkenSteel Corporation
Table of Contents
|
|
|
PAGE
|
|
Item 1A
.
|
||
PART I. FINANCIAL INFORMATION
ITEM 1. FINANCIAL STATEMENTS
TimkenSteel Corporation
Consolidated Statements of Operations (Unaudited)
|
Three Months Ended March 31,
|
|||||||
|
2019
|
2018
|
||||||
|
(Dollars in millions, except per share data)
|
|||||||
|
Net sales
|
|
$371.0
|
|
|
$380.8
|
|
|
|
Cost of products sold
|
341.9
|
|
359.7
|
|
|||
|
Gross Profit
|
29.1
|
|
21.1
|
|
|||
|
Selling, general and administrative expenses
|
23.3
|
|
24.7
|
|
|||
|
Operating Income (Loss)
|
5.8
|
|
(3.6
|
)
|
|||
|
Interest expense
|
4.2
|
|
4.6
|
|
|||
|
Other income, net
|
2.7
|
|
6.4
|
|
|||
|
Income (Loss) Before Income Taxes
|
4.3
|
|
(1.8
|
)
|
|||
|
Provision for income taxes
|
0.1
|
|
0.1
|
|
|||
|
Net Income (Loss)
|
|
$4.2
|
|
|
|
($1.9
|
)
|
|
Per Share Data:
|
|||||||
|
Basic earnings (loss) per share
|
|
$0.09
|
|
|
($0.04
|
)
|
|
|
Diluted earnings (loss) per share
|
|
$0.09
|
|
|
($0.04
|
)
|
|
See accompanying Notes to the Unaudited Consolidated Financial Statements.
2
TimkenSteel Corporation
Consolidated Statement of Comprehensive Income (Loss) (Unaudited)
|
Three Months Ended March 31,
|
|||||||
|
2019
|
2018
|
||||||
|
(Dollars in millions)
|
|||||||
|
Net income (loss)
|
|
$4.2
|
|
|
($1.9
|
)
|
|
|
Other comprehensive income, net of tax:
|
|||||||
|
Foreign currency translation adjustments
|
0.4
|
|
0.8
|
|
|||
|
Pension and postretirement liability adjustments
|
0.1
|
|
0.1
|
|
|||
|
Other comprehensive income, net of tax
|
0.5
|
|
0.9
|
|
|||
|
Comprehensive Income (Loss), net of tax
|
|
$4.7
|
|
|
($1.0
|
)
|
|
See accompanying Notes to the Unaudited Consolidated Financial Statements.
3
TimkenSteel Corporation
Consolidated Balance Sheets (Unaudited)
|
March 31,
2019 |
December 31,
2018 |
||||||
|
(Dollars in millions)
|
|||||||
|
ASSETS
|
|||||||
|
Current Assets
|
|||||||
|
Cash and cash equivalents
|
|
$7.8
|
|
|
$21.6
|
|
|
|
Accounts receivable, net of allowances (2019 - $1.5 million; 2018 - $1.7 million)
|
151.3
|
|
163.4
|
|
|||
|
Inventories, net
|
324.3
|
|
296.8
|
|
|||
|
Deferred charges and prepaid expenses
|
3.4
|
|
3.5
|
|
|||
|
Other current assets
|
7.4
|
|
6.1
|
|
|||
|
Total Current Assets
|
494.2
|
|
491.4
|
|
|||
|
Property, plant and equipment, net
|
661.1
|
|
674.4
|
|
|||
|
Operating lease right-of-use assets
|
15.9
|
|
—
|
|
|||
|
Pension assets
|
12.7
|
|
10.5
|
|
|||
|
Intangible assets, net
|
17.7
|
|
17.8
|
|
|||
|
Other non-current assets
|
3.1
|
|
3.5
|
|
|||
|
Total Assets
|
|
$1,204.7
|
|
|
$1,197.6
|
|
|
|
LIABILITIES AND SHAREHOLDERS’ EQUITY
|
|||||||
|
Current Liabilities
|
|||||||
|
Accounts payable
|
|
$129.9
|
|
|
$160.6
|
|
|
|
Salaries, wages and benefits
|
26.6
|
|
36.8
|
|
|||
|
Accrued pension and postretirement costs
|
3.0
|
|
3.0
|
|
|||
|
Current operating lease liabilities
|
5.9
|
|
—
|
|
|||
|
Other current liabilities
|
20.3
|
|
20.4
|
|
|||
|
Total Current Liabilities
|
185.7
|
|
220.8
|
|
|||
|
Convertible notes, net
|
75.2
|
|
74.1
|
|
|||
|
Credit Agreement
|
140.0
|
|
115.0
|
|
|||
|
Non-current operating lease liabilities
|
10.0
|
|
—
|
|
|||
|
Accrued pension and postretirement costs
|
241.3
|
|
240.0
|
|
|||
|
Deferred income taxes
|
0.6
|
|
0.8
|
|
|||
|
Other non-current liabilities
|
10.6
|
|
11.7
|
|
|||
|
Total Liabilities
|
663.4
|
|
662.4
|
|
|||
|
Shareholders’ Equity
|
|||||||
|
Preferred shares, without par value; authorized 10.0 million shares, none issued
|
—
|
|
—
|
|
|||
|
Common shares, without par value; authorized 200.0 million shares;
issued 2019 and 2018 - 45.7 million shares
|
—
|
|
—
|
|
|||
|
Additional paid-in capital
|
841.2
|
|
846.3
|
|
|||
|
Retained deficit
|
(265.0
|
)
|
(269.2
|
)
|
|||
|
Treasury shares - 2019 - 1.0 million; 2018 - 1.1 million
|
(26.5
|
)
|
(33.0
|
)
|
|||
|
Accumulated other comprehensive loss
|
(8.4
|
)
|
(8.9
|
)
|
|||
|
Total Shareholders’ Equity
|
541.3
|
|
535.2
|
|
|||
|
Total Liabilities and Shareholders’ Equity
|
|
$1,204.7
|
|
|
$1,197.6
|
|
|
See accompanying Notes to the Unaudited Consolidated Financial Statements.
4
TimkenSteel Corporation
Consolidated Statements of Shareholders’ Equity (Unaudited)
|
(Dollars in millions)
|
Common Shares Outstanding
|
Additional Paid-in Capital
|
Retained Deficit
|
Treasury Shares
|
Accumulated Other Comprehensive Loss
|
Total
|
||||||||||||||||
|
Balance as of December 31, 2018
|
44,584,668
|
|
|
$846.3
|
|
|
($269.2
|
)
|
|
($33.0
|
)
|
|
($8.9
|
)
|
|
$535.2
|
|
|||||
|
Net income
|
—
|
|
—
|
|
4.2
|
|
—
|
|
—
|
|
4.2
|
|
||||||||||
|
Other comprehensive income
|
—
|
|
—
|
|
—
|
|
—
|
|
0.5
|
|
0.5
|
|
||||||||||
|
Stock-based compensation expense
|
—
|
|
2.2
|
|
—
|
|
—
|
|
—
|
|
2.2
|
|
||||||||||
|
Stock option activity
|
—
|
|
0.2
|
|
—
|
|
—
|
|
—
|
|
0.2
|
|
||||||||||
|
Issuance of treasury shares
|
261,130
|
|
(7.5
|
)
|
—
|
|
7.5
|
|
—
|
|
—
|
|
||||||||||
|
Shares surrendered for taxes
|
(79,889
|
)
|
—
|
|
—
|
|
(1.0
|
)
|
—
|
|
(1.0
|
)
|
||||||||||
|
Balance of March 31, 2019
|
44,765,909
|
|
|
|
$841.2
|
|
|
|
($265.0
|
)
|
|
|
($26.5
|
)
|
|
|
($8.4
|
)
|
|
$541.3
|
|
|
|
Common Shares Outstanding
|
Additional Paid-in Capital
|
Retained Deficit
|
Treasury Shares
|
Accumulated Other Comprehensive Loss
|
Total
|
|||||||||||||||||
|
Balance at December 31, 2017
|
44,445,747
|
|
|
$843.7
|
|
|
($238.0
|
)
|
|
($37.4
|
)
|
|
($7.6
|
)
|
|
$560.7
|
|
|||||
|
Net loss
|
—
|
|
—
|
|
(1.9
|
)
|
—
|
|
—
|
|
(1.9
|
)
|
||||||||||
|
Other comprehensive income
|
—
|
|
—
|
|
—
|
|
—
|
|
0.9
|
|
0.9
|
|
||||||||||
|
Revenue recognition accounting standard adoption
|
—
|
|
—
|
|
0.7
|
|
—
|
|
—
|
|
0.7
|
|
||||||||||
|
Stock-based compensation expense
|
—
|
|
2.2
|
|
—
|
|
—
|
|
—
|
|
2.2
|
|
||||||||||
|
Stock option activity
|
—
|
|
0.1
|
|
—
|
|
—
|
|
—
|
|
0.1
|
|
||||||||||
|
Issuance of treasury shares
|
121,012
|
|
(3.4
|
)
|
(0.1
|
)
|
3.5
|
|
—
|
|
—
|
|
||||||||||
|
Shares surrendered for taxes
|
(37,533
|
)
|
—
|
|
—
|
|
(0.7
|
)
|
—
|
|
(0.7
|
)
|
||||||||||
|
Balance at March 31, 2018
|
44,529,226
|
|
|
$842.6
|
|
|
($239.3
|
)
|
|
($34.6
|
)
|
|
($6.7
|
)
|
|
$562.0
|
|
|||||
5
TimkenSteel Corporation
Consolidated Statements of Cash Flows (Unaudited)
|
Three Months Ended March 31,
|
|||||||
|
2019
|
2018
|
||||||
|
(Dollars in millions)
|
|||||||
|
CASH PROVIDED (USED)
|
|||||||
|
Operating Activities
|
|||||||
|
Net income (loss)
|
|
$4.2
|
|
|
($1.9
|
)
|
|
|
Adjustments to reconcile net income (loss) to net cash provided by operating activities:
|
|||||||
|
Depreciation and amortization
|
17.8
|
|
18.5
|
|
|||
|
Amortization of deferred financing fees and debt discount
|
1.3
|
|
1.8
|
|
|||
|
Deferred income taxes
|
(0.2
|
)
|
(0.3
|
)
|
|||
|
Stock-based compensation expense
|
2.2
|
|
2.2
|
|
|||
|
Pension and postretirement expense (benefit), net
|
1.8
|
|
(1.4
|
)
|
|||
|
Pension and postretirement contributions and payments
|
(2.4
|
)
|
(2.5
|
)
|
|||
|
Changes in operating assets and liabilities:
|
|||||||
|
Accounts receivable, net
|
12.1
|
|
(31.3
|
)
|
|||
|
Inventories, net
|
(27.5
|
)
|
(28.8
|
)
|
|||
|
Accounts payable
|
(30.7
|
)
|
35.7
|
|
|||
|
Other accrued expenses
|
(11.4
|
)
|
(13.2
|
)
|
|||
|
Deferred charges and prepaid expenses
|
0.1
|
|
0.4
|
|
|||
|
Other, net
|
(0.9
|
)
|
1.4
|
|
|||
|
Net Cash Used by Operating Activities
|
(33.6
|
)
|
(19.4
|
)
|
|||
|
Investing Activities
|
|||||||
|
Capital expenditures
|
(4.4
|
)
|
(2.2
|
)
|
|||
|
Net Cash Used by Investing Activities
|
(4.4
|
)
|
(2.2
|
)
|
|||
|
Financing Activities
|
|||||||
|
Proceeds from exercise of stock options
|
0.2
|
|
0.1
|
|
|||
|
Shares surrendered for employee taxes on stock compensation
|
(1.0
|
)
|
(0.7
|
)
|
|||
|
Refunding Bonds repayments
|
—
|
|
(30.2
|
)
|
|||
|
Repayments on credit agreements
|
(5.0
|
)
|
(65.0
|
)
|
|||
|
Borrowings on credit agreements
|
30.0
|
|
130.0
|
|
|||
|
Debt issuance costs
|
—
|
|
(1.7
|
)
|
|||
|
Net Cash Provided by Financing Activities
|
24.2
|
|
32.5
|
|
|||
|
Effect of exchange rate changes on cash
|
—
|
|
—
|
|
|||
|
Decrease (Increase) In Cash and Cash Equivalents
|
(13.8
|
)
|
10.9
|
|
|||
|
Cash and cash equivalents at beginning of period
|
21.6
|
|
24.5
|
|
|||
|
Cash and Cash Equivalents at End of Period
|
|
$7.8
|
|
|
$35.4
|
|
|
See accompanying Notes to the Unaudited Consolidated Financial Statements.
6
TimkenSteel Corporation
Notes to Unaudited Consolidated Financial Statements
(dollars in millions, except per share data)
Note
1
-
Basis of Presentation
The accompanying Unaudited Consolidated Financial Statements have been prepared by TimkenSteel Corporation (the Company or TimkenSteel) in accordance with generally accepted accounting principles in the United States (U.S. GAAP) for interim financial information. Accordingly, they do not include all of the information and footnotes required by U.S. GAAP for complete financial statements. In the opinion of management, all adjustments (consisting of normal recurring accruals) and disclosures considered necessary for a fair presentation have been included. For further information, refer to TimkenSteel’s Audited Consolidated Financial Statements and Notes included in its Annual Report on Form 10-K for the year ended December 31, 2018.
Note
2
-
Recent Accounting Pronouncements
Adoption of New Accounting Standards
The Company adopted the following Accounting Standard Updates (ASU) in the first quarter of 2019, all of which were effective as of January 1, 2019. The adoption of these standards had no impact on the Unaudited Consolidated Financial Statements or the related Notes to the Unaudited Consolidated Financial Statements.
|
Standards Adopted
|
Description
|
|
ASU 2018-07, Compensation - Stock Compensation (Topic 718): Improvements to Nonemployee Share-Based Payment Accounting
|
The standard provides an expanded scope of Topic 718, to include share-based payment transactions for acquiring goods and services from nonemployees.
|
|
ASU 2018-02, Reporting Comprehensive Income: Reclassification of Certain Tax Effects from Accumulated Other Comprehensive Income
|
The standard permits entities to reclassify tax effects stranded in accumulated other comprehensive income as a result of tax reform to retained earnings.
|
|
ASU 2017-11, Distinguishing Liabilities from Equity; Derivatives and Hedging
|
The standard eliminates the requirement to consider “down round” features when determining whether certain equity-linked financial instruments or embedded features are indexed to an entity’s own stock.
|
On January 1, 2019, the Company adopted ASU 2016-02, “Leases (Topics 842),” which requires lessees to recognize lease liabilities and right-of-use assets on the balance sheet for not only finance (previously capital) leases but also operating leases. The standard also requires additional quantitative and qualitative disclosures. The Company adopted the standard using the modified retrospective transition approach without adjusting comparative periods.
The Company elected certain of the practical expedients permitted under the transition guidance within the new standard as follows:
|
•
|
A package of practical expedients to not reassess:
|
|
◦
|
Whether a contract is or contains a lease
|
|
◦
|
Lease classification
|
|
◦
|
Initial direct costs
|
|
•
|
A practical expedient to not reassess certain land easements
|
The Company has implemented internal controls and lease accounting software to enable the quantification of the expected impact on the Unaudited Consolidated Balance Sheets and to facilitate the calculations of the related accounting entries and disclosures. Adoption of the lease standard resulted in recognition of right-to-use assets and lease liabilities of
$16.0 million
as of January 1, 2019. Adoption of the lease standard had no impact on the Company’s debt-covenant compliance under its current agreements. Also, the standard did not materially affect the Company’s results of operations or its cash flows. Refer to “
Note 9 - Leases
” for additional information.
7
Accounting Standards Issued But Not Yet Adopted
The Company has considered the recent ASUs issued by the Financial Accounting Standards Board summarized below:
|
Standard Pending Adoption
|
Description
|
Effective Date
|
Anticipated Impact
|
|
ASU 2018-15, Intangibles - Goodwill and Other - Internal-Use Software (Subtopic 350-40)
|
The standard aligns the requirements for capitalizing implementation costs in cloud computing software arrangements with the requirements for capitalizing implementation costs incurred to develop or obtain internal-use software.
|
January 1, 2020
|
The Company is currently evaluating the impact of the adoption of this ASU on its results of operations and financial condition.
|
|
ASU 2018-14, Compensation - Retirement Benefits - Defined Benefit Plans - General (Subtopic 715-20)
|
The standard eliminates, modifies and adds disclosure requirements for employers that sponsor defined benefit pension or other postretirement plans.
|
January 1, 2021
|
The Company is currently evaluating the impact of the adoption of this ASU on its results of operations and financial condition.
|
|
ASU 2018-13, Fair Value Measurement (Topic 820)
|
The standard eliminates, modifies and adds disclosure requirements for fair value measurements.
|
January 1, 2020
|
The Company is currently evaluating the impact of the adoption of this ASU on its results of operations and financial condition.
|
|
ASU 2016-13, Measurement of Credit Losses on Financial Instruments
|
The standard changes how entities will measure credit losses for most financial assets, including trade and other receivables and replaces the current incurred loss approach with an expected loss model.
|
January 1, 2020
|
The Company is currently evaluating the impact of the adoption of this ASU on its results of operations and financial condition.
|
Note
3
-
Inventories
The components of inventories, net of reserves as of
March 31, 2019
and
December 31, 2018
were as follows:
|
March 31,
2019 |
December 31,
2018 |
||||||
|
Manufacturing supplies
|
|
$52.5
|
|
|
$46.9
|
|
|
|
Raw materials
|
51.8
|
|
35.2
|
|
|||
|
Work in process
|
170.6
|
|
155.7
|
|
|||
|
Finished products
|
132.5
|
|
142.8
|
|
|||
|
Gross inventory
|
407.4
|
|
380.6
|
|
|||
|
Allowance for surplus and obsolete inventory
|
(5.1
|
)
|
(5.1
|
)
|
|||
|
LIFO reserve
|
(78.0
|
)
|
(78.7
|
)
|
|||
|
Total Inventories, net
|
|
$324.3
|
|
|
$296.8
|
|
|
Inventories are valued at the lower of cost or market, with approximately
74%
valued by the last in, first out (LIFO) method, and the remaining inventories, including manufacturing supplies inventory as well as international (outside the United States) inventories, valued by first-in, first-out, average cost or specific identification methods.
An actual valuation of the inventory under the LIFO method can be made only at the end of each year based on the inventory levels and costs at that time. Accordingly, interim LIFO calculations must be based on management’s estimates of expected year-end inventory levels and costs. Because these calculations are subject to many factors beyond management’s control, annual results may differ from interim results as they are subject to the final year-end LIFO inventory valuation.
TimkenSteel projects its LIFO reserve will decrease for the year ending December 31, 2019 due primarily to lower anticipated manufacturing costs.
8
Note
4
-
Property, Plant and Equipment
The components of property, plant and equipment, net as of
March 31, 2019
and
December 31, 2018
were as follows:
|
March 31,
2019 |
December 31,
2018 |
||||||
|
Land
|
|
$14.1
|
|
|
$14.1
|
|
|
|
Buildings and improvements
|
426.0
|
|
424.4
|
|
|||
|
Machinery and equipment
|
1,414.1
|
|
1,404.2
|
|
|||
|
Construction in progress
|
18.8
|
|
28.5
|
|
|||
|
Subtotal
|
1,873.0
|
|
1,871.2
|
|
|||
|
Less allowances for depreciation
|
(1,211.9
|
)
|
(1,196.8
|
)
|
|||
|
Property, Plant and Equipment, net
|
|
$661.1
|
|
|
$674.4
|
|
|
Total depreciation expense was
$16.4 million
and
$17.0 million
for the
three months ended
March 31, 2019
and
2018
, respectively.
Note
5
-
Intangible Assets
The components of intangible assets, net as of
March 31, 2019
and
December 31, 2018
were as follows:
|
March 31, 2019
|
December 31, 2018
|
||||||||||||||||||||||
|
Gross Carrying Amount
|
Accumulated Amortization
|
Net Carrying Amount
|
Gross Carrying Amount
|
Accumulated Amortization
|
Net Carrying Amount
|
||||||||||||||||||
|
Customer relationships
|
|
$6.3
|
|
|
$4.7
|
|
|
$1.6
|
|
|
$6.3
|
|
|
$4.6
|
|
|
$1.7
|
|
|||||
|
Technology use
|
9.0
|
|
6.7
|
|
2.3
|
|
9.0
|
|
6.5
|
|
2.5
|
|
|||||||||||
|
Capitalized software
|
62.6
|
|
48.8
|
|
13.8
|
|
61.6
|
|
48.0
|
|
13.6
|
|
|||||||||||
|
Total Intangible Assets
|
|
$77.9
|
|
|
$60.2
|
|
|
$17.7
|
|
|
$76.9
|
|
|
$59.1
|
|
|
$17.8
|
|
|||||
Intangible assets subject to amortization are amortized on a straight-line method over their legal or estimated useful lives. Amortization expense for intangible assets for the
three months ended
March 31, 2019
and
2018
was
$1.4 million
and
$1.5 million
, respectively.
Note
6
-
Financing Arrangements
For a detailed discussion of the Company's long-term debt and credit arrangements, refer to “
Note 6 - Financing Arrangements
” in the Company’s Annual Report on Form 10-K for the fiscal year ended December 31, 2018.
Convertible Notes
The components of the Convertible Notes as of
March 31, 2019
and
December 31, 2018
were as follows:
|
March 31,
2019 |
December 31,
2018 |
||||||
|
Principal
|
|
$86.3
|
|
|
$86.3
|
|
|
|
Less: Debt issuance costs, net of amortization
|
(1.1
|
)
|
(1.2
|
)
|
|||
|
Less: Debt discount, net of amortization
|
(10.0
|
)
|
(11.0
|
)
|
|||
|
Convertible notes, net
|
|
$75.2
|
|
|
$74.1
|
|
|
The initial value of the principal amount recorded as a liability at the date of issuance was
$66.9 million
, using an effective interest rate of
12.0%
. The remaining
$19.4 million
of principal amount was allocated to the conversion feature and recorded as a component of shareholders’ equity at the date of issuance. This amount represents a discount to the debt to be amortized through interest expense using the effective interest method through the maturity of the Convertible Notes.
9
Transaction costs were allocated to the liability and equity components based on their relative values. Transaction costs attributable to the liability component of
$2.4 million
are amortized to interest expense over the term of the Convertible Notes, and transaction costs attributable to the equity component of
$0.7 million
are included in shareholders’ equity.
The following table sets forth total interest expense recognized related to the Convertible Notes:
|
Three Months Ended March 31,
|
|||||||
|
2019
|
2018
|
||||||
|
Contractual interest expense
|
|
$1.3
|
|
|
$1.3
|
|
|
|
Amortization of debt issuance costs
|
0.1
|
|
0.1
|
|
|||
|
Amortization of debt discount
|
1.0
|
|
0.9
|
|
|||
|
Total
|
|
$2.4
|
|
|
$2.3
|
|
|
Credit Agreement
On January 26, 2018, the Company, as borrower, and certain domestic subsidiaries, as subsidiary guarantors, entered into the Second Amended and Restated Credit Agreement (Credit Agreement), with JPMorgan Chase Bank, N.A., as administrative agent, Bank of America, N.A., as syndication agent, and the other lenders party thereto, which amended and restated the Company’s Credit Agreement. The interest rate under the Credit Agreement was
4.5%
as of
March 31, 2019
. The amount available under the Credit Agreement as of
March 31, 2019
was
$157.4 million
. As of
March 31, 2019
, the Company was in compliance with all covenants.
Refunding Bonds
In connection with amending the Credit Agreement, on January 23, 2018, the Company redeemed in full
$12.2 million
of Ohio Water Development Revenue Refunding Bonds (originally due on November 1, 2025),
$9.5 million
of Ohio Air Quality Development Revenue Refunding Bonds (originally due on November 1, 2025) and
$8.5 million
of Ohio Pollution Control Revenue Refunding Bonds (originally due on June 1, 2033).
Fair Value Measurement
The fair value of the Convertible Notes was approximately
$102.3 million
as of March 31, 2019. The fair value of the Convertible Notes, which falls within Level 1 of the fair value hierarchy as defined by Accounting Standards Codification (ASC) 820, Fair Value Measurements, is based on the last price traded in March 2019.
TimkenSteel’s Credit Agreement is variable-rate debt. As such, the carrying value is a reasonable estimate of fair value as interest rates on these borrowings approximate current market rates. This valuation falls within Level 2 of the fair value hierarchy and is based on quoted prices for similar assets and liabilities in active markets that are observable either directly or indirectly.
Interest Paid
The total cash interest paid for the
three months ended
March 31, 2019
and
2018
was
$1.8 million
and
$0.9 million
, respectively.
10
Note
7
-
Accumulated Other Comprehensive Loss
Changes in accumulated other comprehensive loss for the
three months ended
March 31, 2019
and
2018
by component were as follows:
|
Foreign Currency Translation Adjustments
|
Pension and Postretirement Liability Adjustments
|
Total
|
|||||||||
|
Balance as of December 31, 2018
|
|
($7.3
|
)
|
|
($1.6
|
)
|
|
($8.9
|
)
|
||
|
Other comprehensive income before reclassifications, before income tax
|
0.4
|
|
—
|
|
0.4
|
|
|||||
|
Amounts reclassified from accumulated other comprehensive loss, before income tax
|
—
|
|
0.1
|
|
0.1
|
|
|||||
|
Income tax
|
—
|
|
—
|
|
—
|
|
|||||
|
Net current period other comprehensive income, net of income taxes
|
0.4
|
|
0.1
|
|
0.5
|
|
|||||
|
Balance as of March 31, 2019
|
|
($6.9
|
)
|
|
($1.5
|
)
|
|
($8.4
|
)
|
||
|
Foreign Currency Translation Adjustments
|
Pension and Postretirement Liability Adjustments
|
Total
|
|||||||||
|
Balance at December 31, 2017
|
|
($5.9
|
)
|
|
($1.7
|
)
|
|
($7.6
|
)
|
||
|
Other comprehensive income before reclassifications, before income tax
|
0.8
|
|
—
|
|
0.8
|
|
|||||
|
Amounts reclassified from accumulated other comprehensive loss, before income tax
|
—
|
|
0.1
|
|
0.1
|
|
|||||
|
Income tax
|
—
|
|
—
|
|
—
|
|
|||||
|
Net current period other comprehensive income, net of income taxes
|
0.8
|
|
0.1
|
|
0.9
|
|
|||||
|
Balance as of March 31, 2018
|
|
($5.1
|
)
|
|
($1.6
|
)
|
|
($6.7
|
)
|
||
The amount reclassified from accumulated other comprehensive loss for the pension and postretirement liability adjustment was included in other income, net in the Unaudited Consolidated Statements of Operations. These accumulated other comprehensive loss components are components of net periodic benefit cost. See “
Note 8 - Retirement and Postretirement Plans
” for additional information.
Note
8
-
Retirement and Postretirement Plans
The components of net periodic benefit cost (income) for the
three months ended
March 31, 2019
and
2018
were as follows:
|
Three Months Ended
March 31, 2019 |
Three Months Ended
March 31, 2018 |
||||||||||||||
|
Pension
|
Postretirement
|
Pension
|
Postretirement
|
||||||||||||
|
Service cost
|
|
$4.3
|
|
|
$0.3
|
|
|
$4.3
|
|
|
$0.4
|
|
|||
|
Interest cost
|
12.2
|
|
2.0
|
|
11.4
|
|
1.9
|
|
|||||||
|
Expected return on plan assets
|
(16.2
|
)
|
(0.9
|
)
|
(18.4
|
)
|
(1.2
|
)
|
|||||||
|
Amortization of prior service cost
|
0.1
|
|
—
|
|
0.1
|
|
0.1
|
|
|||||||
|
Net Periodic Benefit Cost (Income)
|
|
$0.4
|
|
|
$1.4
|
|
|
($2.6
|
)
|
|
$1.2
|
|
|||
11
Note 9 - Leases
The Company has operating leases for office space, warehouses, land, machinery and equipment, vehicles and certain information technology equipment. These leases have remaining lease terms of
one year
to
six years
, some of which may include options to extend the leases for
one
or more years. Certain leases also include options to purchase the leased property. As of
March 31, 2019
, the Company has no financing leases and no material leases that have not yet commenced. The weighted average remaining lease term for our operating leases as of
March 31, 2019
was
3.0 years
.
Leases with an initial term of 12 months or less (short-term leases) are not recorded on the balance sheet; the Company recognizes lease expense for these leases on a straight-line basis over the lease term. For lease agreements entered into after the adoption of ASC 842, the Company combines lease and non-lease components. The Company’s lease agreements do not contain material residual value guarantees or material restrictive covenants.
The Company recorded lease cost for the
three months ended
March 31, 2019
as follows:
|
Three Months Ended March 31, 2019
|
|||
|
Operating lease cost
|
|
$1.8
|
|
|
Short-term lease cost
|
0.5
|
|
|
|
Total lease cost
|
|
$2.3
|
|
When available, the rate implicit in the lease is used to discount lease payments to present value; however, the Company’s leases generally do not provide a readily determinable implicit rate. Therefore, the incremental borrowing rate to discount the lease payments is estimated using market-based information available at lease commencement. The weighted average discount rate used to measure our operating lease liabilities as of
March 31, 2019
was
4.7%
.
Supplemental cash flow information related to leases was as follows:
|
Three Months Ended March 31, 2019
|
|||
|
Cash paid for amounts included in the measurement of operating lease liabilities
|
|
$1.8
|
|
|
Right-of-use assets obtained in exchange for operating lease obligations
|
|
$1.6
|
|
Future minimum lease payments under non-cancellable leases as of
March 31, 2019
were as follows:
|
2019 (excluding the three months ended March 31, 2019)
|
|
$5.0
|
|
|
2020
|
5.8
|
|
|
|
2021
|
3.8
|
|
|
|
2022
|
1.6
|
|
|
|
2023
|
0.8
|
|
|
|
After 2023
|
0.1
|
|
|
|
Total future minimum lease payments
|
17.1
|
|
|
|
Less amount of lease payment representing interest
|
(1.2
|
)
|
|
|
Total present value of lease payments
|
|
$15.9
|
|
12
Future minimum lease payments under non-cancellable leases as of
December 31, 2018
were as follows:
|
2019
|
|
$6.3
|
|
|
2020
|
5.2
|
|
|
|
2021
|
3.3
|
|
|
|
2022
|
1.0
|
|
|
|
2023
|
0.6
|
|
|
|
After 2023
|
—
|
|
|
|
Total future minimum lease payments
|
|
$16.4
|
|
Note
10
-
Revenue Recognition
TimkenSteel recognizes revenue from contracts at a point in time when it has satisfied its performance obligation and the customer obtains control of the goods, at the amount that reflects the consideration the Company expects to receive for those goods. The Company receives and acknowledges purchase orders from its customers which define the quantity, pricing, payment and other applicable terms and conditions. In some cases, the Company receives a blanket purchase order from its customer, which includes pricing, payment and other terms and conditions, with quantities defined at the time the customer issues periodic releases against the blanket purchase order. Certain contracts contain variable consideration, which primarily consists of rebates that are accounted for in net sales and accrued based on the estimated probability of the requirements being met. Amounts billed to customers related to shipping and handling costs are included in net sales and related costs are included in costs of products sold in the Unaudited Consolidated Financial Statements.
The following table provides the major sources of revenue by end-market sector for the
three months ended
March 31, 2019
and
2018
:
|
Three Months Ended March 31,
|
|||||||
|
2019
|
2018
|
||||||
|
Mobile
|
|
$144.2
|
|
|
$142.5
|
|
|
|
Industrial
|
147.0
|
|
147.7
|
|
|||
|
Energy
|
60.8
|
|
49.1
|
|
|||
|
Other
(1)
|
19.0
|
|
41.5
|
|
|||
|
Total Net Sales
|
|
$371.0
|
|
|
$380.8
|
|
|
(1)
“Other” for sales by end-market sector includes the Company’s scrap and OCTG billet sales.
The following table provides the major sources of revenue by product type for the
three months ended
March 31, 2019
and
2018
:
|
Three Months Ended March 31,
|
|||||||
|
2019
|
2018
|
||||||
|
Bar
|
|
$239.9
|
|
|
$234.4
|
|
|
|
Tube
|
49.6
|
|
63.7
|
|
|||
|
Value-add
|
73.7
|
|
72.7
|
|
|||
|
Other
(2)
|
7.8
|
|
10.0
|
|
|||
|
Total Net Sales
|
|
$371.0
|
|
|
$380.8
|
|
|
(2)
“Other” for sales by product type includes the Company’s scrap sales.
13
Note 11 - Earnings Per Share
Basic earnings (loss) per share is computed based upon the weighted average number of common shares outstanding. Diluted earnings (loss) per share is computed based upon the weighted average number of common shares outstanding plus the dilutive effect of common share equivalents calculated using the treasury stock method or if-converted method. For the Convertible Notes, the Company utilizes the if-converted method to calculate diluted earnings (loss) per share. Under the if-converted method, the Company adjusts net earnings to add back interest expense (including amortization of debt discount) recognized on the Convertible Notes and includes the number of shares potentially issuable related to the Convertible Notes in the weighted average shares outstanding. Treasury stock is excluded from the denominator in calculating both basic and diluted earnings (loss) per share.
For the three months ended March 31, 2019 and 2018,
2.3 million
and
3.4 million
shares issuable for equity-based awards, respectively, were excluded from the computation of diluted loss per share because the effect of their inclusion would have been anti-dilutive. In periods in which a net loss has occurred, as is the case for the three months ended March 31, 2018, the dilutive effect of equity-based awards is not recognized and thus not utilized in the calculation of diluted loss per share, because the effect of their inclusion would have been anti-dilutive. The shares potentially issuable of
6.9 million
, related to the Convertible Notes, were also anti-dilutive for the three months ended March 31, 2019 and 2018, respectively.
The following table sets forth the reconciliation of the numerator and the denominator of basic and diluted earnings (loss) per share for the three months ended
March 31, 2019
and
2018
:
|
Three Months Ended March 31,
|
|||||||
|
2019
|
2018
|
||||||
|
Numerator:
|
|||||||
|
Net income (loss)
|
|
$4.2
|
|
|
($1.9
|
)
|
|
|
Denominator:
|
|||||||
|
Weighted average shares outstanding, basic
|
44.7
|
|
44.5
|
|
|||
|
Dilutive effect of stock-based awards
|
0.5
|
|
—
|
|
|||
|
Weighted average shares outstanding, diluted
|
45.2
|
|
44.5
|
|
|||
|
Basic earnings (loss) per share
|
|
$0.09
|
|
|
($0.04
|
)
|
|
|
Diluted earnings (loss) per share
|
|
$0.09
|
|
|
($0.04
|
)
|
|
Note
12
-
Income Tax Provision
TimkenSteel’s provision for income taxes in interim periods is computed by applying the appropriate estimated annual effective tax rates to income or loss before income taxes for the period. In addition, non-recurring or discrete items, including interest on prior-year tax liabilities, are recorded during the periods in which they occur.
|
Three Months Ended March 31,
|
|||||||
|
2019
|
2018
|
||||||
|
Provision for incomes taxes
|
|
$0.1
|
|
|
|
$0.1
|
|
|
Effective tax rate
|
1.1
|
%
|
(5.6
|
)%
|
|||
In light of TimkenSteel’s recent operating performance in the U.S. and current industry conditions, the Company assessed, based upon all available evidence, and concluded that it was more likely than not that it would not realize its U.S. deferred tax assets. As a result, the Company will maintain a full valuation allowance against its deferred tax assets in the U.S. and applicable foreign countries until sufficient positive evidence exists to conclude that a valuation allowance is not necessary. Going forward, the need to maintain valuation allowances against deferred tax assets in the U.S. and other affected countries will cause variability in the Company’s effective tax rate.
14
Note
13
-
Contingencies
TimkenSteel has a number of loss exposures incurred in the ordinary course of business, such as environmental claims, product warranty claims, and litigation. Establishing loss reserves for these matters requires management’s estimate and judgment regarding risk exposure and ultimate liability or realization. These loss reserves are reviewed periodically and adjustments are made to reflect the most recent facts and circumstances. As of
March 31, 2019
and
December 31, 2018
, TimkenSteel had a
$1.3 million
and a
$1.5 million
contingency reserve, respectively, related to loss exposures incurred in the ordinary course of business.
Note 14 - Other Income, net
The following table provides the components of other income, net for the
three months ended
March 31, 2019
and
2018
:
|
Three Months Ended March 31,
|
|||||||
|
2019
|
2018
|
||||||
|
Pension and postretirement non-service benefit income
|
|
$2.8
|
|
|
$6.3
|
|
|
|
Foreign currency exchange (loss) gain
|
(0.1
|
)
|
0.1
|
|
|||
|
Total other income, net
|
|
$2.7
|
|
|
|
$6.4
|
|
Non-service benefit income is derived from the Company’s pension and other postretirement plans. The Company’s expected return on assets has exceeded the interest cost component, resulting in income for the three months ended March 31, 2019 and 2018. Foreign currency exchange loss (gain) is due to exchange-rate fluctuations on the Company’s various foreign-currency denominated transactions.
Note
15
-
Subsequent Event
After reviewing the TimkenSteel retiree group health plan in comparison to health insurance options available in the individual market, TimkenSteel announced on April 9, 2019 that it would be moving Medicare-eligible union retirees to an individual plan on a Medicare healthcare exchange. The plans on the exchange offer more options and flexibility than these retirees currently have, and typically cost them less for comparable or better health and prescription drug coverage. The Company is providing these retirees access to a personal benefits advisor as well as additional informational resources to assist with the transition by July 31, 2019.
The Company will continue to provide financial support for eligible premiums and expenses through the payment of subsidies ranging from
$1,200
to
$1,800
annually into the retirees’ Health Reimbursement Accounts (HRAs). The Company concluded this plan change will be accounted for as a plan amendment in the Company’s second quarter of 2019. The Company estimates it will recognize a reduction in the accumulated postretirement benefit obligation (APBO) of approximately
$65
to
$70
million. The reduction in the APBO will be recognized in Other Comprehensive Income and subsequently amortized as an offset to postretirement benefit cost over a period of approximately
12 years
(average remaining service period). Excluding the impact of the mark-to-market adjustment, which cannot be determined at this time, will reduce the Company’s expected 2019 postretirement benefit cost by approximately
$5 million
. The Company will perform a remeasurement at April 30, 2019.
15
ITEM 2. MANAGEMENT’S DISCUSSION AND ANALYSIS OF
FINANCIAL CONDITION AND RESULTS OF OPERATIONS
(dollars in millions, except per share data)
Business Overview
TimkenSteel Corporation (we, us, our, the Company or Timkensteel) manufactures alloy steel, as well as carbon and micro-alloy steel, with an annual melt capacity of approximately
2 million
tons and shipment capacity of
1.5 million
tons. Our portfolio includes special bar quality (SBQ) bars, seamless mechanical tubing (tubes), value-add solutions such as precision steel components, and billets. In addition, we supply machining and thermal treatment services and manage raw material recycling programs, which are used as a feeder system for our melt operations. Our products and services are used in a diverse range of demanding applications in the following market sectors: oil and gas; OCTG; automotive; industrial equipment; mining; construction; rail; aerospace and defense; heavy truck; agriculture; and power generation.
Based on our knowledge of the steel industry, we believe we are the only focused SBQ steel producer in North America and have the largest SBQ steel large bar (6-inch diameter and greater) production capacity among North American steel producers. In addition, we are the only steel manufacturer able to produce rolled SBQ steel large bars up to 16-inches in diameter. SBQ steel is made to restrictive chemical compositions and high internal purity levels and is used in critical mechanical applications. We make these products from nearly all recycled steel, using our expertise in raw materials to create custom steel products. We focus on creating tailored products and services for our customers’ most demanding applications. Our engineers are experts in both materials and applications, so we can work closely with each customer to deliver flexible solutions related to our products as well as to their applications and supply chains. We believe our unique operating model and production assets give us a competitive advantage in our industry.
The SBQ bar, tube, and billet production processes take place at our Canton, Ohio manufacturing location. This location accounts for all of the SBQ bars, seamless mechanical tubes and billets we produce and includes
three
manufacturing facilities: the Faircrest, Harrison, and Gambrinus facilities. Our value-add solutions production processes take place at
three
downstream manufacturing facilities: TimkenSteel Material Services (Houston, Texas), Tryon Peak (Columbus, North Carolina), and St. Clair (Eaton, Ohio). Many of the production processes are integrated, and the manufacturing facilities produce products that are sold in all of our market sectors. As a result, investments in our facilities and resource allocation decisions affecting our operations are designed to benefit the overall business, not any specific aspect of the business.
We conduct our business activities and report financial results as one business segment. The presentation of financial results as one reportable segment is consistent with the way we operate our business and is consistent with the manner in which the Chief Operating Decision Maker (CODM) evaluates performance and makes resource and operating decisions for the business as described above. Furthermore, the Company notes that monitoring financial results as one reportable segment helps the CODM manage costs on a consolidated basis, consistent with the integrated nature of our operations.
Impact of Raw Material Prices and LIFO
In the ordinary course of business, we are exposed to the volatility of the costs of our raw materials. Whenever possible, we manage our exposure to commodity risks primarily through the use of supplier pricing agreements that enable us to establish the purchase prices for certain inputs that are used in our manufacturing process. We utilize a raw material surcharge mechanism when pricing products to our customers which is designed to mitigate the impact of increases or decreases in raw material costs, although generally with a lag effect. This timing effect can result in raw material spread whereby costs can be over- or under-recovered in certain periods. While the surcharge generally protects gross profit, it has the effect of diluting gross margin as a percent of sales.
We value a majority of our inventory utilizing the LIFO inventory valuation method. Changes in the cost of raw materials and production activities are recognized in cost of products sold in the current period even though these materials and other costs may have been incurred in different periods at significantly different values due to the length of time of our production cycle. In periods of rising inventories and deflating raw material prices, the likely result will be a positive impact to net income. Conversely, in periods of rising inventories and increasing raw materials prices, the likely result will be a negative impact to net income.
16
Results of Operations
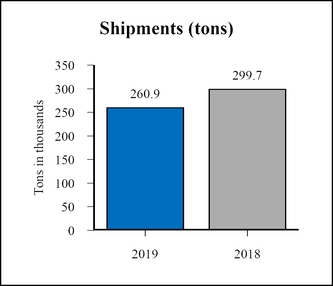
Net Sales
The charts below present net sales and shipments for the three months ended
March 31, 2019
and
2018
.
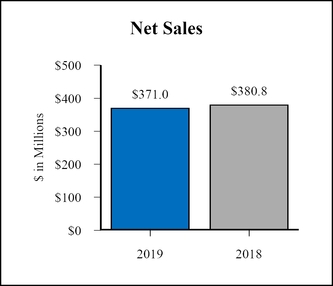
Net sales for the three months ended
March 31, 2019
were
$371.0 million
, a decrease of
$9.8 million
or
2.6%
compared to the three months ended
March 31, 2018
. The decrease was due to a reduction in volume of
39 thousand
ship tons, resulting in a decrease of
$38.4 million
of net sales. The primary driver in the decrease in volume was the planned reduction of OCTG billet shipments for the three months ended March 31, 2019 compared to 2018. This was partially offset by favorable price/mix of approximately
$29.5 million
, as we realized the benefit of price increases and continue focused efforts to sell our higher margin products. This resulted in net sales per ton increasing
11.9%
from 2018. Excluding surcharges, net sales decreased
$8.8 million
, or
3.0%
. The decrease in surcharges from the prior-year quarter was primarily from lower volumes.
17
Gross Profit
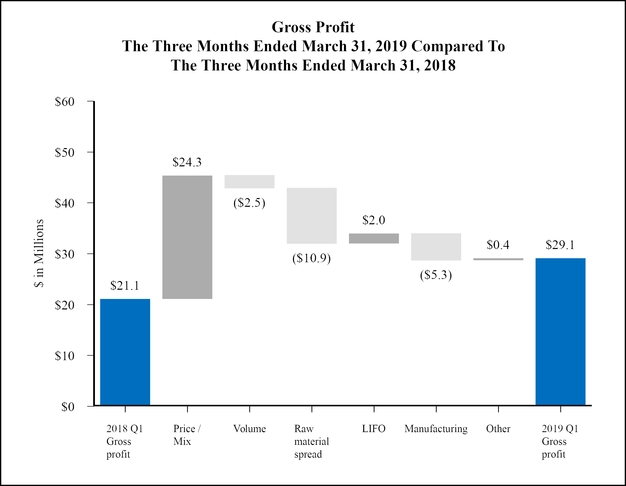
Gross profit for the three months ended
March 31, 2019
increased
$8.0 million
, or
37.9%
, compared to the three months ended
March 31, 2018
. The increase was driven primarily by favorable price/mix due to increased demand for higher margin products and increased pricing. The favorable price/mix was partially offset by increased manufacturing costs. Higher manufacturing costs in 2019 were driven primarily by planned production downtime resulting in lower fixed-cost leverage. Additionally, raw material spread was a headwind due to a decline in the No.1 busheling scrap index during first-quarter 2019.
18
Selling, General and Administrative Expenses
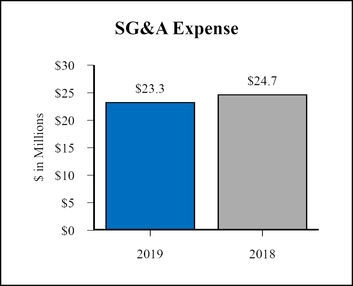
Selling, general and administrative (SG&A) expense for the three months ended
March 31, 2019
decreased by
$1.4 million
, or
5.7%
, compared to the three months ended
March 31, 2018
, due primarily to a decrease in variable compensation.
Interest Expense
|
Three Months Ended March 31,
|
|||||||||||
|
2019
|
2018
|
$ Change
|
|||||||||
|
Cash interest paid
|
|
$1.8
|
|
|
$0.9
|
|
|
$0.9
|
|
||
|
Accrued interest
|
1.1
|
|
1.9
|
|
(0.8
|
)
|
|||||
|
Amortization of deferred financing fees and debt discount
|
1.3
|
|
1.8
|
|
(0.5
|
)
|
|||||
|
Total interest expense
|
|
$4.2
|
|
|
$4.6
|
|
|
($0.4
|
)
|
||
Interest expense for the three months ended
March 31, 2019
was
$4.2 million
, a decrease of
$0.4 million
compared to the three months ended
March 31, 2018
. The decrease is due to the write-off of $0.7 million in deferred financing costs in the first-quarter of 2018, associated with amending the Credit Agreement and redeeming the Refunding Bonds, partially offset by higher average borrowings on the Credit Agreement to support working capital needs during the three months ended
March 31, 2019
. Refer to “
Note 6 - Financing Arrangements
” in the Notes to the Unaudited Consolidated Financial Statements for additional information.
Other Income, net
|
Three Months Ended March 31,
|
|||||||||||
|
|
2019
|
2018
|
$ Change
|
||||||||
|
Pension and postretirement non-service benefit income
|
|
$2.8
|
|
|
$6.3
|
|
|
($3.5
|
)
|
||
|
Foreign currency exchange gain (loss)
|
(0.1
|
)
|
0.1
|
|
(0.2
|
)
|
|||||
|
Total other income, net
|
|
$2.7
|
|
|
$6.4
|
|
|
($3.7
|
)
|
||
Non-service benefit income is derived from the Company’s pension and other postretirement plans. The Company’s expected return on assets has exceeded the interest cost component, resulting in income for the three months ended March 31, 2019 and 2018. Foreign currency exchange loss (gain) is due to exchange-rate fluctuations on the Company’s various foreign-currency denominated transactions.
19
Provision for Income Taxes
|
Three Months Ended March 31,
|
||||||||||||||
|
2019
|
2018
|
$ Change
|
% Change
|
|||||||||||
|
Provision for income taxes
|
|
$0.1
|
|
|
$0.1
|
|
|
$—
|
|
—
|
|
|||
|
Effective tax rate
|
1.1
|
%
|
(5.6
|
)%
|
NM
|
|
670
|
bps
|
||||||
The effective tax rate for the three months ended
March 31, 2019
increased from the same period in
2018
, primarily due to the increase of approximately $6 million in net income year-over-year. The majority of our taxes are derived from foreign operations. We remain in a full valuation for the U.S. jurisdiction for the three months ended March 31, 2019.
20
NON-GAAP FINANCIAL MEASURES
Net Sales, Excluding Surcharges
The table below presents net sales by end market sector, adjusted to exclude raw material surcharges, which represents a financial measure that has not been determined in accordance with accounting principles generally accepted in the United States (U.S. GAAP). We believe presenting net sales by end market sector adjusted to exclude raw material surcharges provides additional insight into key drivers of net sales such as base price and product mix.
|
Net Sales adjusted to exclude surcharges
|
||||||||||||||||
|
(dollars in millions, tons in thousands)
|
||||||||||||||||
|
Three Months Ended March 31, 2019
|
||||||||||||||||
|
Mobile
|
Industrial
|
Energy
|
Other
|
Total
|
||||||||||||
|
Tons
|
112.8
|
|
102.5
|
|
31.4
|
|
14.2
|
|
260.9
|
|
||||||
|
Net Sales
|
|
$144.2
|
|
|
$147.0
|
|
|
$60.8
|
|
|
$19.0
|
|
|
$371.0
|
|
|
|
Less: Surcharges
|
37.5
|
|
35.1
|
|
12.5
|
|
4.6
|
|
89.7
|
|
||||||
|
Base Sales
|
|
$106.7
|
|
|
$111.9
|
|
|
$48.3
|
|
|
$14.4
|
|
|
$281.3
|
|
|
|
Net Sales / Ton
|
|
$1,278
|
|
|
$1,434
|
|
|
$1,936
|
|
|
$1,338
|
|
|
$1,422
|
|
|
|
Base Sales / Ton
|
|
$946
|
|
|
$1,092
|
|
|
$1,538
|
|
|
$1,014
|
|
|
$1,078
|
|
|
|
Three Months Ended March 31, 2018
|
||||||||||||||||
|
Mobile
|
Industrial
|
Energy
|
Other
|
Total
|
||||||||||||
|
Tons
|
110.4
|
|
113.7
|
|
29.0
|
|
46.6
|
|
299.7
|
|
||||||
|
Net Sales
|
|
$142.5
|
|
|
$147.7
|
|
|
$49.1
|
|
|
$41.5
|
|
|
$380.8
|
|
|
|
Less: Surcharges
|
31.3
|
|
35.2
|
|
11.0
|
|
13.2
|
|
90.7
|
|
||||||
|
Base Sales
|
|
$111.2
|
|
|
$112.5
|
|
|
$38.1
|
|
|
$28.3
|
|
|
$290.1
|
|
|
|
Net Sales / Ton
|
|
$1,291
|
|
|
$1,299
|
|
|
$1,693
|
|
|
$891
|
|
|
$1,271
|
|
|
|
Base Sales / Ton
|
|
$1,007
|
|
|
$989
|
|
|
$1,314
|
|
|
$607
|
|
|
$968
|
|
|
21
LIQUIDITY AND CAPITAL RESOURCES
Convertible Notes
In May 2016, we issued
$75.0 million
aggregate principal amount of Convertible Notes, plus an additional
$11.3 million
principal amount to cover over-allotments. The Convertible Notes bear cash interest at a rate of 6.0% per year, payable semiannually on June 1 and December 1, beginning on December 1, 2016. The Convertible Notes will mature on June 1, 2021, unless earlier repurchased or converted. The net proceeds received from the offering were
$83.2 million
, after deducting the initial underwriters’ discount and fees and paying the offering expenses. We used the net proceeds to repay a portion of the amounts outstanding under our Credit Agreement.
Credit Agreement
On January 26, 2018, we as borrower, and certain domestic subsidiaries, as subsidiary guarantors, entered into the Second Amended and Restated Credit Agreement (Credit Agreement), with JPMorgan Chase Bank, N.A., as administrative agent, Bank of America, N.A., as syndication agent, and the other lenders party thereto, which amended and restated the Company’s existing Credit Agreement. The Credit Agreement matures on January 26, 2023. Prior to the maturity date, amounts outstanding are required to be repaid (without reduction of the commitments thereunder) from mandatory prepayment events from the proceeds of certain asset sales, equity or debt issuances or casualty events.
Refunding Bonds
In connection with amending the Credit Agreement, on January 23, 2018, we redeemed in full $12.2 million of Ohio Water Development Revenue Refunding Bonds (originally due on November 1, 2025), $9.5 million of Ohio Air Quality Development Revenue Refunding Bonds (originally due on November 1, 2025) and $8.5 million of Ohio Pollution Control Revenue Refunding Bonds (originally due on June 1, 2033).
Additional Liquidity Considerations
The following represents a summary of key liquidity measures under the Credit Agreement as of
March 31, 2019
and
December 31, 2018
:
|
March 31,
2019 |
December 31,
2018 |
|||||
|
Cash and cash equivalents
|
|
$7.8
|
|
|
$21.6
|
|
|
Credit Agreement:
|
||||||
|
Maximum availability
|
|
$300.0
|
|
|
$300.0
|
|
|
Amount borrowed
|
140.0
|
|
115.0
|
|
||
|
Letter of credit obligations
|
2.6
|
|
2.6
|
|
||
|
Availability not borrowed
|
157.4
|
|
182.4
|
|
||
|
Total liquidity
|
|
$165.2
|
|
|
$204.0
|
|
Our principal sources of liquidity are cash and cash equivalents, cash flows from operations and available borrowing capacity under our Credit Agreement. We currently expect that our cash and cash equivalents on hand, expected cash flows from operations and borrowings available under the Credit Agreement will be sufficient to meet liquidity needs; however, these plans rely on certain underlying assumptions and estimates that may differ from actual results. Such assumptions include growing market demand, lower operating costs and continued working capital management.
As of
March 31, 2019
, taking into account the foregoing, as well as our view of industrial, energy, and automotive market demands for our products, our
2019
operating plan and our long-range plan, we believe that our cash balance as of
March 31, 2019
, projected cash generated from operations, and borrowings available under the Credit Agreement, will be sufficient to satisfy our working capital needs, capital expenditures and other liquidity requirements associated with our operations, including servicing our debt obligations, for at least the next twelve months and through January 26, 2023, the maturity date of our Credit Agreement.
22
To the extent our liquidity needs prove to be greater than expected or cash generated from operations is less than anticipated, and cash on hand or credit availability is insufficient, we would seek additional financing to provide additional liquidity. We regularly evaluate our potential access to the equity and debt capital markets as sources of liquidity and we believe additional financing would likely be available if necessary, although we can make no assurance as to the form or terms of any such financing. We would also consider additional cost reductions and further reductions of capital expenditures. Regardless, we will continue to evaluate additional financing or may seek to refinance outstanding borrowings under the Credit Agreement to provide us with additional flexibility and liquidity. Any additional financing beyond that incurred to refinance existing debt would increase our overall debt and could increase interest expense.
For additional details regarding the Credit Agreement, the Credit Agreement and the Convertible Notes, please refer to “
Note 6 - Financing Arrangements
” in the Notes to the Unaudited Consolidated Financial Statements and for our discussion regarding risk factors related to our business and our debt, see Risk Factors in our Annual Report on Form 10-K for the year ended December 31, 2018.
Cash Flows
The following table reflects the major categories of cash flows for the three months ended
March 31, 2019
and
2018
. For additional details, please refer to the Unaudited Consolidated Statements of Cash Flows included in this quarterly report.
|
Three Months Ended March 31,
|
|||||||
|
2019
|
2018
|
||||||
|
Net cash used by operating activities
|
|
($33.6
|
)
|
|
($19.4
|
)
|
|
|
Net cash used by investing activities
|
(4.4
|
)
|
(2.2
|
)
|
|||
|
Net cash provided by financing activities
|
24.2
|
|
32.5
|
|
|||
|
(Decrease) Increase in Cash and Cash Equivalents
|
|
($13.8
|
)
|
|
$10.9
|
|
|
Operating activities
Net cash used by operating activities for the three months ended
March 31, 2019
was
$33.6 million
compared to
$19.4 million
for the three months ended
March 31, 2018
. The
decrease
of
$14.2 million
was primarily due to timing of payments to suppliers at the end of the first-quarter 2019, partially offset by the reduction of accounts receivable and improved operating income. Refer to the Unaudited Consolidated Statements of Cash Flows for additional information,
Investing activities
Net cash used by investing activities for the three months ended
March 31, 2019
and
2018
was
$4.4 million
and
$2.2 million
, respectively. Cash used for investing activities primarily relates to capital investments in our manufacturing facilities.
Our business requires capital investments to maintain our plants and equipment to remain competitive and ensure we can implement strategic initiatives. Our construction in progress balance of
$18.8 million
as of
March 31, 2019
includes: (a) $5.1 million relating to growth initiatives (e.g. new product offerings, additional capacity and new capabilities) and continuous improvement projects; and (b) $13.7 million relating primarily to routine capital costs to maintain the reliability, integrity and safety of our manufacturing equipment and facilities. In the next one to three years, we expect to spend approximately $28 million to complete existing ongoing projects (made up of approximately $21 million relating to additional growth initiatives and approximately $7 million related to continuous improvement) to complete existing ongoing projects.
Financing activities
Net cash provided by financing activities for the three months ended
March 31, 2019
was
$24.2 million
compared to
$32.5 million
for the three months ended
March 31, 2018
. The change was mainly due to net borrowings on the Credit Agreement during the three months ended
March 31, 2019
of
$25.0 million
as compared to
$34.8 million
during the three months ended
March 31, 2018
.
23
CRITICAL ACCOUNTING POLICIES AND ESTIMATES
Our financial statements are prepared in accordance with U.S. GAAP. The preparation of these financial statements requires management to make estimates and assumptions that affect the reported amounts of assets and liabilities at the date of the financial statements and the reported amounts of revenues and expenses during the periods presented. We review our critical accounting policies throughout the year.
On January 1, 2018, TimkenSteel adopted ASU 2014-09 “Revenue from Contracts with Customers.” Refer to
Note 2 - Recent Accounting Pronouncements
and
Note 10 - Revenue Recognition
for additional information.
On January 1, 2019, TimkenSteel adopted ASU 2016-02 “Leases” and ASU 2018-11 “Leases - Targeted Improvements”. Refer to
Note 2 - Recent Accounting Pronouncements
and
Note 9 - Leases
for additional information.
New Accounting Guidance
See
Note 2 - Recent Accounting Pronouncements
in the Notes to the Unaudited Consolidated Financial Statements.
24
FORWARD-LOOKING STATEMENTS
Certain statements set forth in this Quarterly Report on Form 10-Q (including our forecasts, beliefs and expectations) that are not historical in nature are “forward-looking” statements within the meaning of the Private Securities Litigation Reform Act of 1995. In particular, Management’s Discussion and Analysis of Financial Condition and Results of Operations contains numerous forward-looking statements. Forward-looking statements generally will be accompanied by words such as “anticipate,” “believe,” “could,” “estimate,” “expect,” “forecast,” “outlook,” “intend,” “may,” “plan,” “possible,” “potential,” “predict,” “project,” “seek,” “should,” “target,” “will,” “would,” or other similar words, phrases or expressions that convey the uncertainty of future events or outcomes. You are cautioned not to place undue reliance on forward-looking statements, which speak only as of the date of this Form 10-K. We caution readers that actual results may differ materially from those expressed or implied in forward-looking statements made by or on behalf of us due to a variety of factors, such as:
|
•
|
deterioration in world economic conditions, or in economic conditions in any of the geographic regions in which we conduct business, including additional adverse effects from global economic slowdown, terrorism or hostilities. This includes: political risks associated with the potential instability of governments and legal systems in countries in which we or our customers conduct business, and changes in currency valuations;
|
|
•
|
the effects of fluctuations in customer demand on sales, product mix and prices in the industries in which we operate. This includes: our ability to respond to rapid changes in customer demand; the effects of customer bankruptcies or liquidations; the impact of changes in industrial business cycles; and whether conditions of fair trade exist in the U.S. markets;
|
|
•
|
competitive factors, including changes in market penetration; increasing price competition by existing or new foreign and domestic competitors; the introduction of new products by existing and new competitors; and new technology that may impact the way our products are sold or distributed;
|
|
•
|
changes in operating costs, including the effect of changes in our manufacturing processes; changes in costs associated with varying levels of operations and manufacturing capacity; availability of raw materials and energy; our ability to mitigate the impact of fluctuations in raw materials and energy costs and the effectiveness of our surcharge mechanism; changes in the expected costs associated with product warranty claims; changes resulting from inventory management, cost reduction initiatives and different levels of customer demands; the effects of unplanned work stoppages; and changes in the cost of labor and benefits;
|
|
•
|
the success of our operating plans, announced programs, initiatives and capital investments; the ability to integrate acquired companies; the ability of acquired companies to achieve satisfactory operating results, including results being accretive to earnings; and our ability to maintain appropriate relations with unions that represent our associates in certain locations in order to avoid disruptions of business;
|
|
•
|
unanticipated litigation, claims or assessments, including claims or problems related to intellectual property, product liability or warranty, and environmental issues and taxes, among other matters;
|
|
•
|
the availability of financing and interest rates, which affect our cost of funds and/or ability to raise capital; our pension obligations and investment performance; and/or customer demand and the ability of customers to obtain financing to purchase our products or equipment that contain our products; and the amount of any dividend declared by our Board of Directors on our common shares;
|
|
•
|
The overall impact of the pension and postretirement mark-to-market accounting; and
|
|
•
|
Those items identified under the caption Risk Factors in our Annual Report on Form 10-K for the year ended December 31, 2018.
|
You are cautioned that it is not possible to predict or identify all of the risks, uncertainties and other factors that may affect future results, and that the above list should not be considered to be a complete list. Except as required by the federal securities laws, we undertake no obligation to publicly update or revise any forward-looking statement, whether as a result of new information, future events or otherwise.
25
ITEM 3. QUANTITATIVE AND QUALITATIVE DISCLOSURES ABOUT MARKET RISK
Interest Rate Risk
Our borrowings include both fixed and variable-rate debt. The variable debt consists principally of borrowings under our Credit Agreement. We are exposed to the risk of rising interest rates to the extent we fund our operations with these variable-rate borrowings. As of
March 31, 2019
, we have
$215.2 million
of aggregate debt outstanding, of which
$140.0 million
consists of debt with variable interest rates. Based on the amount of debt with variable-rate interest outstanding, a 1% rise in interest rates would result in an increase in interest expense of $1.4 million annually.
Foreign Currency Exchange Rate Risk
Fluctuations in the value of the U.S. dollar compared to foreign currencies may impact our earnings. Geographically, our sales are primarily made to customers in the United States. Currency fluctuations could impact us to the extent they impact the currency or the price of raw materials in foreign countries in which our competitors operate or have significant sales.
Commodity Price Risk
In the ordinary course of business, we are exposed to market risk with respect to commodity price fluctuations, primarily related to our purchases of raw materials and energy, principally scrap steel, other ferrous and non-ferrous metals, alloys, natural gas and electricity. Whenever possible, we manage our exposure to commodity risks primarily through the use of supplier pricing agreements that enable us to establish the purchase prices for certain inputs that are used in our manufacturing business. We utilize a raw material surcharge as a component of pricing steel to pass through the cost increases of scrap, alloys and other raw materials, as well as natural gas. From time to time, we may use financial instruments to hedge a portion of our exposure to price risk related to natural gas and electricity purchases. In periods of stable demand for our products, the surcharge mechanism has worked effectively to reduce the normal time lag in passing through higher raw material costs so that we can maintain our gross margins. When demand and cost of raw materials are lower, however, the surcharge impacts sales prices to a lesser extent.
ITEM 4. CONTROLS AND PROCEDURES
(a) Disclosure Controls and Procedures
As of the end of the period covered by this quarterly report, we carried out an evaluation, under the supervision and with the participation of our management, including our principal executive officer and principal financial officer, of the effectiveness of the design and operation of our disclosure controls and procedures (as defined in Exchange Act Rule 13a-15(e)). Based upon that evaluation, the principal executive officer and principal financial officer concluded that our disclosure controls and procedures were effective as of the end of the period covered by this quarterly report.
(b) Changes in Internal Control Over Financial Reporting
During the Company’s most recent fiscal quarter, there have been no changes in the Company’s internal control over financial reporting that have materially affected, or are reasonably likely to materially affect, the Company’s internal control over financial reporting.
26
PART II. OTHER INFORMATION
ITEM 1. LEGAL PROCEEDINGS
We are involved in various claims and legal actions arising in the ordinary course of business. In the opinion of our management, the ultimate disposition of these matters will not have a material adverse effect on our consolidated financial position, results of operations or cash flows.
Canton, Ohio U.S. Environmental Protection Agency Notice of Violation.
The U.S. Environmental Protection Agency (EPA) issued two related Notices of Violation (NOV) to TimkenSteel on August 5, 2014 and November 2, 2015. The EPA alleges violations under the Clean Air Act based on alleged violations of permitted emission limits and engineering requirements at TimkenSteel’s Faircrest and Harrison Steel Plants in Canton, Ohio. TimkenSteel disputes many of EPA’s allegations but is working cooperatively with EPA and the U.S. Department of Justice to resolve the government’s claims. Negotiations to resolve the NOVs are ongoing, but it is not anticipated that the ultimate resolution of the NOVs will have a material adverse effect on our consolidated financial position, results of operations or cash flows.
ITEM 1A. RISK FACTORS
We are subject to various risks and uncertainties in the course of our business. The discussion of such risks and uncertainties may be found under Risk Factors in our Annual Report on Form 10-K for the year ended December 31, 2018 filed with the SEC. There have been no material changes to such risk factors.
Item 2. UNREGISTERED SALES OF EQUITY SECURITIES AND USE OF PROCEEDS
None.
27
ITEM 6. EXHIBITS
|
Exhibit Number
|
Exhibit Description
|
|
|
10.1*
|
||
|
10.2*
|
||
|
10.3*
|
||
|
10.4*
|
||
|
10.5*
|
||
|
31.1*
|
||
|
31.2*
|
||
|
32.1**
|
||
|
101.INS*
|
XBRL Instance Document.
|
|
|
101.SCH*
|
XBRL Taxonomy Extension Schema Document.
|
|
|
101.PRE*
|
XBRL Taxonomy Extension Presentation Linkbase Document.
|
|
|
101.CAL*
|
XBRL Taxonomy Extension Calculation Linkbase Document.
|
|
|
101.LAB*
|
XBRL Taxonomy Extension Label Linkbase Document.
|
|
|
101.DEF*
|
XBRL Taxonomy Extension Definition Linkbase Document.
|
|
* Filed herewith.
** Furnished herewith.
28
SIGNATURES
Pursuant to the requirements of the Securities Exchange Act of 1934, the registrant has duly caused this report to be signed on its behalf by the undersigned thereunto duly authorized.
|
TIMKENSTEEL CORPORATION
|
||
|
Date:
|
May 2, 2019
|
/s/ Kristopher R. Westbrooks
|
|
Kristopher R. Westbrooks
Executive Vice President and Chief Financial Officer (Principal Financial Officer) |
||
29
INDEX TO EXHIBITS
|
Exhibit Number
|
Exhibit Description
|
|
|
10.1
|
||
|
10.2
|
||
|
10.3
|
||
|
10.4
|
||
|
10.5
|
||
|
31.1
|
||
|
31.2
|
||
|
32.1
|
||
|
101.INS
|
XBRL Instance Document.
|
|
|
101.SCH
|
XBRL Taxonomy Extension Schema Document.
|
|
|
101.PRE
|
XBRL Taxonomy Extension Presentation Linkbase Document.
|
|
|
101.CAL
|
XBRL Taxonomy Extension Calculation Linkbase Document.
|
|
|
101.LAB
|
XBRL Taxonomy Extension Label Linkbase Document.
|
|
|
101.DEF
|
XBRL Taxonomy Extension Definition Linkbase Document.
|
|
30
TABLE OF CONTENTS
Part I. Financial InformationItem 1. Financial StatementsNote 1 - Basis Of PresentationNote 2 - Recent Accounting PronouncementsNote 9 - LeasesNote 3 - InventoriesNote 4 - Property, Plant and EquipmentNote 5 - Intangible AssetsNote 6 - Financing ArrangementsNote 7 - Accumulated Other Comprehensive LossNote 8 - Retirement and Postretirement PlansNote 10 - Revenue RecognitionNote 11 - Earnings Per ShareNote 12 - Income Tax ProvisionNote 13 - ContingenciesNote 14 - Other Income, NetNote 15 - Subsequent EventItem 2. Management S Discussion and Analysis OfItem 3. Quantitative and Qualitative Disclosures About Market RiskItem 4. Controls and ProceduresPart II. Other InformationItem 1. Legal ProceedingsItem 1A. Risk FactorsItem 2. Unregistered Sales Of Equity Securities and Use Of ProceedsItem 6. Exhibits