MANITOWOC CO INC
10-Ks and 10-Qs
|
|
|
|
|
|
|
|
|
|
|
|
|
|
|
|
|
|
|
|
|
|
|
|
|
|
|
|
|
|
|
|
|
|
|
|
|
|
|
|
|
|
|
|
|
|
|
|
|
|
|
|
|
|
|
|
UNITED STATES
SECURITIES AND EXCHANGE COMMISSION
Washington, D.C. 20549
FORM 10-K
|
ý
|
Annual Report Pursuant to Section 13 or 15(d) of the Securities Exchange Act of 1934
|
For the fiscal year ended
December 31, 2014
or
|
o
|
Transition Report Pursuant to Section 13 or 15(d) of the Securities Exchange Act of 1934
|
For the transition period from to
Commission File Number
1-11978

The Manitowoc Company, Inc.
(Exact name of registrant as specified in its charter)
|
Wisconsin
|
|
39-0448110
|
|
(State or other jurisdiction
|
|
(I.R.S. Employer
|
|
of incorporation)
|
|
Identification Number)
|
|
|
|
|
|
2400 South 44th Street,
|
|
|
|
Manitowoc, Wisconsin
|
|
54221-0066
|
|
(Address of principal executive offices)
|
|
(Zip Code)
|
(920) 684-4410
(Registrant’s telephone number, including area code)
Securities Registered Pursuant to Section 12(b) of the Act:
|
Title of each class
|
|
Name of each exchange on which registered
|
|
Common Stock, $.01 Par Value
|
|
New York Stock Exchange
|
|
Common Stock Purchase Rights
|
|
|
Securities Registered Pursuant to Section 12(g) of the Act:
None
Indicate by check mark if the registrant is a well-known seasoned issuer, as defined in Rule 405 of the Securities Act. Yes
ý
No
o
Indicate by check mark if the Registrant is not required to file reports pursuant to Section 13 or 15(d) of the Act. Yes
o
No
ý
Indicate by check mark whether the Registrant: (1) has filed all reports required to be filed by Section 13 or 15(d) of the Securities Exchange Act of 1934 during the preceding 12 months (or for such shorter period that the Registrant was required to file such reports), and (2) has been subject to such filing requirements for the past 90 days. Yes
ý
No
o
Indicate by check mark whether the registrant has submitted electronically and posted on its corporate website, if any, every Interactive Data File required to be submitted and posted pursuant to Rule 405 of Regulation S-T (§232.405 of this chapter) during the preceding 12 months (or for such shorter period that the registrant was required to submit and post such files). Yes
ý
No
o
Indicate by check mark if disclosure of delinquent filers pursuant to Item 405 of Regulation S-K is not contained herein, and will not be contained, to the best of registrant’s knowledge, in definitive proxy or information statements incorporated by reference in Part III of this Form 10-K or any amendment to this Form 10-K.
o
Indicate by check mark whether the registrant is a large accelerated filer, an accelerated filer, a non-accelerated filer or a smaller reporting company. See the definitions of “large accelerated filer, accelerated filer, and smaller reporting company” in Rule 12b-2 of the Exchange Act.
|
Large accelerated filer
x
|
|
Accelerated filer
o
|
|
Non-accelerated filer
o
(Do not check if a smaller reporting company)
|
|
Smaller reporting company
o
|
Indicate by check mark whether the Registrant is a shell company (as defined in Rule 12b-2 of the Act). Yes
o
No
ý
The Aggregate Market Value on June 30, 2014, of the registrant’s Common Stock held by non-affiliates of the registrant was $4,395.9 million based on the closing per share price of $32.86 on that date.
The number of shares outstanding of the registrant’s Common Stock as of January 30, 2015, the most recent practicable date, was 135,624,916.
DOCUMENTS INCORPORATED BY REFERENCE
Portions of the registrant’s Proxy Statement, to be prepared and filed for the Annual Meeting of Shareholders, dated March 20, 2015 (the “2015 Proxy Statement”), are incorporated by reference in Part III of this report.
See Index to Exhibits immediately following the signature page of this report, which is incorporated herein by reference.
THE MANITOWOC COMPANY, INC.
Index to Annual Report on Form 10-K
For the Year Ended
December 31, 2014
|
|
|
PAGE
|
|
|
|
|
|
|
PART I
|
|
|
|
|
|
|
|
||
|
|
|
|
|
|
PART II
|
|
|
|
|
|
|
|
|
|
|
|
PART III
|
|
|
|
|
|
|
|
|
|
|
|
PART IV
|
|
|
|
|
|
2
GENERAL
The Manitowoc Company, Inc. (referred to as the company, MTW, Manitowoc, we, our, and us) was founded in 1902. We are a multi-industry, capital goods manufacturer operating in two principal markets: Cranes and Related Products (Crane) and Foodservice Equipment (Foodservice). Crane is recognized as one of the world’s leading providers of engineered lifting equipment for the global construction industry, including lattice-boom cranes, tower cranes, mobile telescopic cranes, and boom trucks. Foodservice is one of the world’s leading innovators and manufacturers of commercial foodservice equipment serving the ice, beverage, refrigeration, food-preparation, holding and cooking needs of restaurants, convenience stores, hotels, healthcare, and institutional applications. We have over a 110-year tradition of providing high-quality, customer-focused products and support services to our markets. For the year ended
December 31, 2014
, we had net sales of approximately
$3.9 billion
.
Our Crane business is a global provider of engineered lift solutions, offering one of the broadest product lines of lifting equipment in our industry. We design, manufacture, market, and support a comprehensive line of lattice-boom crawler cranes, mobile telescopic cranes, tower cranes, and boom trucks. Our Crane products are principally marketed under the Manitowoc, Grove, Potain, National Crane, Shuttlelift, and Manitowoc Crane Care brand names and are used in a wide variety of applications, including energy and utilities, petrochemical and industrial projects, infrastructure applications, such as road, bridge and airport construction, and commercial and residential construction.
Our Foodservice business is among the world’s leading designers and manufacturers of commercial foodservice equipment. Our Foodservice capabilities span refrigeration, ice-making, cooking, holding, food-preparation, and beverage-dispensing technologies, and allow us to be able to equip entire commercial kitchens and serve the world’s growing demand for food prepared away from home. Our Foodservice products, services and solutions are marketed under the following brands: Cleveland, Convotherm, Dean, Delfield, Fabristeel, Frymaster, Garland, Inducs, Koolaire, Kolpak, Kysor Panel Systems, Lincoln, Manitowoc Ice, Merco, Merrychef, Multiplex, Servend, and U.S. Range, and all are supported by Manitowoc KitchenCare.
During the first quarter of 2014, the company sold its
50%
interest in Manitowoc Dong Yue Heavy Machinery Co., Ltd. (“Manitowoc Dong Yue” or the “joint venture”), which produces mobile and truck-mounted hydraulic cranes in China, to its joint venture partner, Tai’an Taishan Heavy Industry Investment Co., Ltd., for a nominal amount. Consequently, the joint venture has been classified as discontinued operations in the company’s financial statements. See Note 4, “Discontinued Operations,” for further details concerning this transaction.
During the first quarter of 2013, the company sold its warewashing equipment business, which operated under the brand name Jackson, to Hoshizaki USA Holdings, Inc. for approximately $39.2 million, including post-closing adjustments. Net proceeds were used to reduce ratably the then-outstanding balances of Term Loans A and B. This business has been classified as discontinued operations in the company's financial statements.
During the first quarter of 2011, the company sold its Kysor/Warren and Kysor/Warren de Mexico businesses to Lennox International for approximately $145 million. The net proceeds were used to pay down outstanding debt. This business has been classified as discontinued operations in the company's financial statements.
We are a Wisconsin corporation, and our principal executive offices are located at 2400 South 44th Street, Manitowoc, Wisconsin 54220.
RECENT DEVELOPMENTS
On January 29, 2015, Manitowoc announced that its Board of Directors has approved a plan to pursue a separation of the company’s Crane and Foodservice businesses into two independent, publicly-traded companies. The company currently anticipates effecting the separation through a tax-free spin-off of the Foodservice business and expects the spin-off to be completed in the first quarter of 2016; however, there can be no assurance regarding the ultimate timing of the proposed transaction or that the transaction will be completed.
3
FINANCIAL INFORMATION ABOUT BUSINESS SEGMENTS
The following is financial information about the Crane and Foodservice segments for the years ended
December 31, 2014
,
2013
and
2012
. The accounting policies of the segments are the same as those described in the summary of significant accounting policies of the Notes to the Consolidated Financial Statements included in Part II, Item 8 of this Form 10-K, except that certain expenses are not allocated to the segments. These unallocated expenses are corporate overhead, stock-based compensation expense, amortization expense of intangible assets with definite lives, goodwill impairment, intangible asset impairment, asset impairment expense, restructuring expense, and other non-operating expenses. The company evaluates segment performance based upon profit and loss before the aforementioned expenses. Amounts are shown in millions of dollars.
|
(in millions)
|
2014
|
2013
|
2012
|
||||||||
|
Net sales from continuing operations:
|
|
|
|
|
|
|
|||||
|
Crane
|
$
|
2,305.2
|
|
$
|
2,506.3
|
|
$
|
2,427.1
|
|
||
|
Foodservice
|
1,581.3
|
|
1,541.8
|
|
1,486.2
|
|
|||||
|
Total
|
$
|
3,886.5
|
|
$
|
4,048.1
|
|
$
|
3,913.3
|
|
||
|
Operating earnings from continuing operations:
|
|
|
|
|
|
|
|||||
|
Crane
|
$
|
163.9
|
|
$
|
218.8
|
|
$
|
170.5
|
|
||
|
Foodservice
|
234.0
|
|
250.3
|
|
238.6
|
|
|||||
|
Corporate
|
(53.4
|
)
|
(64.9
|
)
|
(63.7
|
)
|
|||||
|
Asset impairment expense
|
(1.1
|
)
|
—
|
|
—
|
|
|||||
|
Amortization expense
|
(35.1
|
)
|
(35.3
|
)
|
(36.5
|
)
|
|||||
|
Restructuring expense
|
(9.0
|
)
|
(4.8
|
)
|
(9.5
|
)
|
|||||
|
Other (expense) income
|
(0.5
|
)
|
0.3
|
|
(2.5
|
)
|
|||||
|
Total
|
$
|
298.8
|
|
$
|
364.4
|
|
$
|
296.9
|
|
||
|
Capital expenditures:
|
|
|
|
|
|
|
|||||
|
Crane
|
$
|
57.3
|
|
$
|
69.3
|
|
$
|
52.7
|
|
||
|
Foodservice
|
25.3
|
|
33.6
|
|
17.4
|
|
|||||
|
Corporate
|
2.2
|
|
7.8
|
|
2.8
|
|
|||||
|
Total
|
$
|
84.8
|
|
$
|
110.7
|
|
$
|
72.9
|
|
||
|
Total depreciation:
|
|
|
|
|
|
|
|||||
|
Crane
|
$
|
45.7
|
|
$
|
46.9
|
|
$
|
43.5
|
|
||
|
Foodservice
|
21.2
|
|
20.1
|
|
22.3
|
|
|||||
|
Corporate
|
1.5
|
|
1.5
|
|
2.3
|
|
|||||
|
Total
|
$
|
68.4
|
|
$
|
68.5
|
|
$
|
68.1
|
|
||
|
Total assets:
|
|
|
|
|
|
|
|||||
|
Crane
|
$
|
1,742.3
|
|
$
|
1,900.4
|
|
$
|
1,903.3
|
|
||
|
Foodservice
|
1,902.0
|
|
1,904.3
|
|
1,956.8
|
|
|||||
|
Corporate
|
172.3
|
|
171.9
|
|
197.2
|
|
|||||
|
Total
|
$
|
3,816.6
|
|
$
|
3,976.6
|
|
$
|
4,057.3
|
|
||
4
PRODUCTS AND SERVICES
We sell our products categorized in the following business segments:
|
Business Segment
|
Percentage of
2014 Net Sales
|
Key Products
|
Key Brands
|
|||
|
Cranes and Related Products
|
59%
|
Lattice-boom Cranes: which include crawler and truck mounted lattice-boom cranes, and crawler crane attachments; Tower Cranes: which include top-slewing, luffing jib, topless, and self-erecting tower cranes; Mobile Telescopic Cranes: which include rough-terrain, all-terrain, truck-mounted and industrial cranes; Boom Trucks: which include telescopic boom trucks; and Parts and Service: which include replacement parts, product services and crane rebuilding and remanufacturing services.
|
Manitowoc
Potain
Grove
National Crane
Shuttlelift
Manitowoc Crane Care
|
|||
|
Foodservice Equipment
|
41%
|
Primary cooking and warming equipment; ice machines and storage bins; refrigerator and freezer equipment; beverage dispensers and related products; serving and storage equipment; and parts aftermarket service and solutions.
|
Cleveland
Convotherm
Dean
Delfield
Fabristeel
Frymaster
Garland
Inducs
KitchenCare
Koolaire
Kolpak
Kysor Panel Systems
Lincoln
Manitowoc Ice
Merco
Merrychef
Multiplex
Servend
U.S. Range
|
|||
Cranes and Related Products
Our Crane segment designs, manufactures and distributes a diversified line of crawler-mounted lattice-boom cranes, which we sell under the Manitowoc brand name. Our Crane segment also designs and manufactures a diversified line of top-slewing and self-erecting tower cranes, which we sell under the Potain brand name. We design and manufacture mobile telescopic cranes, which we sell under the Grove and Shuttlelift brand names, and a comprehensive line of hydraulically powered telescopic boom trucks, which we sell under the National Crane brand name. We also provide crane product parts and services, and crane rebuilding, remanufacturing, and training services, which are delivered under the Manitowoc Crane Care brand name. In some cases our products are manufactured for us or distributed for us under strategic alliances. Our crane products are used in a wide variety of applications throughout the world, including energy production/distribution and utilities, petrochemical and industrial projects, infrastructure applications, such as road, bridge and airport construction, plus commercial and residential construction. Many of our customers purchase one or more cranes together with several attachments to permit use of the crane in a broader range of lifting applications and other operations. Our largest crane model combined with available options has a lifting capacity up to 2,500 U.S. tons. We believe our primary near-term growth drivers are the relative strength in the energy, infrastructure, and construction-related end markets.
Lattice-boom cranes.
Under the Manitowoc brand name we design, manufacture and distribute lattice-boom crawler cranes. Lattice-boom cranes consist of a lattice-boom, which is a fabricated, high-strength steel structure that has four chords and tubular lacings, mounted on a base which is either crawler or truck mounted. Lattice-boom cranes weigh less and provide higher lifting capacities than a mobile telescopic crane of similar boom length. The lattice-boom cranes are the only category of crane that can pick and move simultaneously with a full-rated load. The lattice-boom sections, together with the crane base, are transported to and erected at a project site.
We currently offer models of lattice-boom cranes with lifting capacities up to 2,500 U.S. tons, which are used to lift material and equipment in a wide variety of applications and end markets, including heavy construction, bridge and highway, duty cycle and infrastructure and energy-related projects. These cranes are also used by the value-added crane rental industry, which serves all of the above end markets.
5
Lattice-boom crawler cranes may be classified according to their lift capacity — low capacity and high capacity. Low-capacity crawler cranes with 150 U.S. ton capacity or less are often utilized for general construction and duty-cycle applications. High-capacity crawler cranes with greater than 150 U.S. ton capacity are used to lift materials in a wide variety of applications and are often used in heavy construction, energy-related, stadium construction, petrochemical work, and dockside applications. We offer ten low-capacity models and nine high-capacity models.
In 2014, we introduced the Variable Position Counterweight (VPC) system. The VPC system automatically positions the counterweight, which is suspended above the ground, to fit a required lift by automatically positioning the counterweight based on changes in boom angle and lifted load. This results in reduced ground preparation, lower ground-bearing pressure and less counterweights needed for a lift, all without sacrificing capacity. With the VPC system, customers will not have to buy, transport or install as much counterweight as compared with traditional configurations, and the counterweight boxes are designed to be used across multiple crane platforms. The enhanced crane capacities and reduced mobilization time on job sites means customers may save significant amounts of time and money.
We also offer our lattice-boom crawler crane customers various attachments that provide our cranes with greater capacity in terms of height, movement and lifting. Our principal attachments are: MAX-ER™ attachments, luffing jibs, and RINGER™ attachments. The MAX-ER™ is a trailing counterweight, heavy-lift attachment that dramatically improves the reach, capacity and lift dynamics of the basic crane to which it is mounted. It can be transferred between cranes of the same model for maximum economy and occupies less space than competitive heavy-lift systems. A luffing jib is a fabricated structure similar to, but smaller than, a lattice-boom. Mounted at the tip of a lattice-boom, a luffing jib easily adjusts its angle of operation permitting one crane with a luffing jib to make lifts at additional locations on the project site. It can be transferred between cranes of the same model to maximize utilization. A RINGER™ attachment is a high-capacity lift attachment that distributes load reactions over a large area to minimize ground-bearing pressure. It can also be more economical than transporting and setting up a larger crane.
Tower cranes
. Under the Potain brand name, we design and manufacture tower cranes utilized primarily in the energy, building and construction industries. Tower cranes offer the ability to lift and distribute material at the point of use more quickly and accurately than other types of lifting machinery without utilizing substantial square footage on the ground. Tower cranes include a stationary vertical mast and a horizontal jib with a counterweight, which is placed near the vertical mast. A cable runs through a trolley which is mounted on the jib, enabling the load to move along the jib. The jib rotates 360 degrees, thus increasing the crane’s work area. Unless using a remote control device, operators occupy a cabin, located where the jib and mast meet, which provides superior visibility above the worksite. We offer a complete line of tower crane products, including top slewing, luffing jib, topless, self-erecting, and special cranes for dams, harbors and other large building projects. Top-slewing cranes are the most traditional form of tower cranes. Self-erecting cranes are bottom-slewing cranes which have a counterweight located at the bottom of the mast and are able to be erected, used and dismantled on job sites without assist cranes.
Top-slewing tower cranes have a tower and multi-sectioned horizontal jib. These cranes rotate from the top of their mast and can increase in height with the project. Top-slewing cranes are transported in separate pieces and assembled at the construction site in one to three days depending on the height. We offer 23 models of top-slewing tower cranes with maximum jib lengths of 80 meters and lifting capabilities ranging between 3 and 80 metric tons. These cranes are generally sold to medium to large energy, building and construction groups, as well as to rental companies.
Topless tower cranes are a type of top-slewing crane and, unlike all others, have no cathead or jib tie-bars on the top of the mast. The cranes are utilized primarily when overhead height is constrained or in situations where several cranes are installed close together. We currently offer 19 models of topless tower cranes with maximum jib lengths of 75 meters and lifting capabilities ranging between 1.1 and 16 metric tons.
Luffing jib tower cranes, which are a type of top-slewing crane, have an angled rather than horizontal jib. Unlike other tower cranes which have a trolley that controls the lateral movement of the load, luffing jib cranes move their load by changing the angle of the jib. The cranes are utilized primarily in urban areas where space is constrained or in situations where several cranes are installed close together. We currently offer 11 models of luffing jib tower cranes with maximum jib lengths of 60 meters and lifting capabilities ranging between 1.6 and 32 metric tons.
Self-erecting tower cranes are mounted on axles or transported on a trailer. The lower segment of the range (Igo cranes up to Igo50) unfolds in four sections, two for the mast and two for the jib. The smallest of our models unfolds in less than eight minutes; larger models erect in a few hours. Self-erecting cranes rotate from the bottom of their mast. We offer 20 models of
6
self-erecting cranes with maximum jib lengths of 50 meters and lifting capacities ranging between .65 and 8 metric tons, which are utilized primarily in low to medium rise construction and residential applications.
Mobile telescopic cranes
. Under the Grove brand name we design and manufacture 34 models of mobile telescopic cranes utilized primarily in industrial, commercial and construction applications, as well as in maintenance applications to lift and move material at job sites. Mobile telescopic cranes consist of a telescopic boom mounted on a wheeled carrier. Mobile telescopic cranes are similar to lattice-boom cranes in that they are designed to lift heavy loads using a mobile carrier as a platform, enabling the crane to move on and around a job site without typically having to re-erect the crane for each particular job. Additionally, many mobile telescopic cranes have the ability to drive between sites, and some are permitted on public roadways. We currently offer the following four types of mobile telescopic cranes capable of reaching tip heights of up to 446 feet with lifting capacities up to 550 U.S. tons: rough-terrain, all-terrain, truck-mounted, and industrial.
Rough-terrain cranes are designed to lift materials and equipment on rough or uneven terrain. These cranes cannot be driven on public roadways, and, accordingly, must be transported by truck to a work site. We produce, under the Grove brand name, 10 models of rough-terrain cranes capable of tip heights of up to 312 feet and maximum load capacities of up to 150 U.S. tons.
All-terrain cranes are versatile cranes designed to lift materials and equipment on rough or uneven terrain and yet are highly maneuverable and capable of highway speeds. We produce, under the Grove brand name, 14 models of all-terrain cranes capable of tip heights of up to 449 feet and maximum load capacities of up to 550 U.S. tons.
Truck-mounted cranes are designed to provide simple set-up and long reach high capacity booms and are capable of traveling from site to site at highway speeds. These cranes are suitable for urban and suburban uses. We produce, under the Grove brand name, three models of truck mounted cranes capable of tip heights of up to 237 feet and maximum load capacities of up to 110 U.S. tons.
Industrial cranes are designed primarily for plant maintenance, storage yard and material handling jobs. We manufacture, under the Grove and Shuttlelift brand names, eight models of industrial cranes. We produce industrial cranes with up to 25 U.S. ton capacity and tip heights of up to 86 feet.
Boom trucks.
We offer our hydraulic boom truck products under the National Crane product line. A boom truck is a hydraulically powered telescopic crane mounted on a conventional truck chassis. Telescopic boom trucks are used primarily for lifting material on a job site and are mostly deployed by end users in the North American market. We currently offer, under the National Crane brand name, 22 models of telescoping boom trucks. The largest capacity cranes of this type are capable of reaching maximum heights of 205 feet and have lifting capacity up to 60 U.S. tons.
Backlog
. The year-end backlog of crane products includes accepted orders that have been placed on a production schedule that we expect to be shipped and billed primarily during the next year. Manitowoc’s backlog of unfilled orders for the Crane segment at
December 31, 2014
,
2013
and
2012
was
$738.0 million
,
$574.0 million
and
$755.8 million
, respectively. Our backlog at the end of 2014 was higher than the end of 2013 as a result of the large number of orders received for our two new crawler models, MLC300 and MLC650, which use the VPC technology. In addition, our All-Terrain crane orders are much higher than last year due to the success of our new 6-axle cranes.
Foodservice Equipment
Our Foodservice Equipment business designs, manufactures and sells primary cooking and warming equipment; ice machines and storage bins; refrigerator and freezer equipment; beverage dispensers and related products; and serving and storage equipment. Our suite of products is used by commercial and institutional foodservice operators such as full service restaurants, quick-service restaurant (QSR) chains, hotels, caterers, supermarkets, convenience stores, business and industry, hospitals, schools and other institutions. We have a presence throughout the world’s most significant markets in the following product groups:
Primary cooking and warming equipment.
We design, manufacture and sell a broad array of ranges, griddles, grills, combination ovens, convection ovens, conveyor ovens, induction cookers, broilers, tilt fry pans/kettles/skillets, braising pans, cheese melters/salamanders, cook stations, table top and counter top cooking/frying systems, fryers, steam jacketed kettles, and steamers. We sell traditional oven, combi oven, convection oven, conveyor oven, rapid cooking ovens, range and grill products under the Convotherm, Garland, Lincoln, Merrychef, U.S. Range, and other brand names. Fryers and frying systems are marketed under the Frymaster and Dean brand names, while steam equipment is manufactured and sold under the Cleveland brand. In addition to cooking, we provide a range of warming, holding, and serving equipment under the Delfield, Fabristeel, Frymaster, Merco, and other brand names.
7
Ice-cube machines, ice flaker machines, nugget ice machines, ice dispensers and storage bins.
We design, manufacture and sell ice machines under the Manitowoc and Koolaire brand names, serving the foodservice, convenience store, healthcare, restaurant, lodging and other markets. Our ice machines make ice in cube, nugget and flake form, and range in daily production capacities. The ice-cube machines are either self-contained units, which make and store ice, or modular units, which make, but do not store ice.
Refrigerator and freezer equipment.
We design, manufacture and sell commercial upright and undercounter refrigerators and freezers, blast freezers, blast chillers and cook-chill systems under the Delfield, McCall, Koolaire and other brand names. We manufacture under the brand names Kolpak and Kysor Panel Systems modular and fully assembled walk-in refrigerators, coolers and freezers and prefabricated cooler and freezer panels for use in the construction of refrigerated storage rooms and environmental systems. We also design and manufacture customized refrigeration systems under the RDI brand name.
Beverage dispensers and related products.
We produce beverage dispensers, blended ice machines, ice/beverage dispensers, beer coolers, post-mix dispensing valves, backroom equipment and support system components and related equipment for use by QSR chains, convenience stores, bottling operations, movie theaters, and the soft-drink industry. Our beverage and related products are sold under the Servend, Multiplex, TruPour, Manitowoc Beverage Systems and McCann’s brand names.
Serving and storage equipment.
We design, manufacture and sell a range of cafeteria/buffet equipment stations, bins, boxes, warming cabinets, display and deli cases, insulated and refrigerated salad/food bars, and warmers. Our equipment stations, cases, food bars and food serving lines are marketed under the Delfield and other brand names.
Parts, aftermarket service and solutions
. We provide parts and aftermarket service as well as provide a wide variety of solutions under the KitchenCare brand name.
The end-customer base for the Foodservice segment is comprised of a wide variety of foodservice providers, including, but not limited to, large multinational and regional chain restaurants, convenience stores and retail stores; chain and independent casual and family dining restaurants; independent restaurants and caterers; lodging, resort, leisure and convention facilities; health care facilities; schools and universities; large business and industrial customers; and many other foodservice outlets. We cater to some of the largest and most widely recognized multinational and regional businesses in the foodservice and hospitality industries. We do not typically have long-term contracts with our customers; however, large chains frequently authorize specific foodservice equipment manufacturers as approved vendors for particular products, and thereafter, sales are made locally or regionally to end customers via kitchen equipment suppliers, dealers or distributors. Many large QSR chains refurbish or open a large number of outlets, or implement menu changes requiring investment in new equipment, over a short period of time. When this occurs, these customers often choose a small number of manufacturers whose approved products may or must be purchased by restaurant operators. We work closely with our customers to develop the products they need and to become the approved vendors for these products.
Our end-customers often need equipment upgrades that enable them to improve productivity and food safety, reduce labor costs, respond to enhanced hygiene, environmental and menu requirements or reduce energy consumption. These changes often require customized cooking and cooling and freezing equipment. In addition, many restaurants, especially QSRs, seek to differentiate their products by changing their menu and format. We believe that product development is important to our success because a supplier’s ability to provide customized or innovative foodservice equipment is a primary factor when customers are making their purchasing decisions. Recognizing the importance of providing innovative products to our customers, we invest significant time and resources into new product research and development.
The Manitowoc Education and Technology Centers (“ETC”) in New Port Richey, Florida and Hangzhou, China contain computer-assisted design platforms, a model shop for on-site development of prototypes, a laboratory for product testing and various display areas for new products. Our test kitchen, flexible demonstration areas and culinary team enable us to demonstrate a wide range of equipment in realistic operating environments, and also support a wide range of menu ideation, food development and sensory testing with our customers and food partners. We also use the ETC to provide training for our customers, marketing representatives, service providers, industry consultants, dealers and distributors.
Backlog
. The backlog for unfilled orders for our Foodservice segment at
December 31, 2014
,
2013
and
2012
was not significant because orders are generally filled shortly after receiving the customer order.
8
Raw Materials and Supplies
The primary raw materials that we use are structural and rolled steel, aluminum, and copper, which are purchased from various domestic and international sources. We also purchase engines and electrical equipment and other semi- and fully-processed materials. Our policy is to maintain, wherever possible, alternate sources of supply for our important materials and parts. We maintain inventories of steel and other purchased material. We have been successful in our goal to maintain alternative sources of raw materials and supplies, and therefore are not dependent on a single source for any particular raw material or supply.
Patents, Trademarks, and Licenses
We hold numerous patents pertaining to our Crane and Foodservice products, and have presently pending applications for additional patents in the United States and foreign countries. In addition, we have various registered and unregistered trademarks and licenses that are of material importance to our business and we believe our ownership of this intellectual property is adequately protected in customary fashions under applicable laws. No single patent, trademark or license is critical to our overall business.
Seasonality
Typically, the second and third quarters represent the best quarters for our consolidated financial results. More recently, the traditional seasonality for our Crane and Foodservice segments has been slightly muted due to more diversified product and geographic end markets. In our Crane segment, the northern hemisphere summer represents the main construction season. Customers require new machines, parts, and service during that season. Since the summer brings warmer weather, there is also an increase in the use and replacement of ice machines, as well as new construction and remodeling within the foodservice industry. As a result, distributors build inventories during the second quarter to prepare for increased demand.
9
Competition
We sell all of our products in highly competitive industries. We compete in each of our industries based on product design, quality of products and aftermarket support services, product performance, maintenance costs, energy and resource saving, other contributions to sustainability, and price. Some of our competitors may have greater financial, marketing, manufacturing or distribution resources than we do. We believe that we benefit from the following competitive advantages: strong brand names, which create customer loyalty and facilitate strong resale values, a reputation for quality products and aftermarket support and solution services, an established network of global distributors and customer relationships, broad product line offerings in the markets we serve, and a commitment to engineering design and product innovation. However, we cannot be certain that our products and services will continue to compete successfully or that we will be able to retain our customer base or improve or maintain our profit margins on sales to our customers. The following table sets forth our primary competitors in each of our business segments:
|
Business Segment
|
Products
|
Primary Competitors
|
||
|
Cranes and Related Products
|
Lattice-boom Cranes
|
Hitachi Sumitomo; Kobelco; Liebherr; Sumitomo/Link-Belt; Terex; XCMG; Fushun; Zoomlion; Fuwa; and Sany
|
||
|
|
|
|
||
|
|
Tower Cranes
|
Comansa; Terex Comedil/Peiner; Liebherr; FM Gru; Jaso; Raimondi; Viccario; Saez; Benezzato; Cattaneo; Sichuan Construction Machinery; Shenyang; Zoomlion; Jianglu; and Yongmao
|
||
|
|
|
|
||
|
|
Mobile Telescopic Cranes
|
Liebherr; Link-Belt; Terex; Tadano; XCMG; Kato; Locatelli; Marchetti; Luna; Broderson; Valla; Ormig; Bencini; Sany; and Zoomlion
|
||
|
|
|
|
||
|
|
Boom Trucks
|
Terex; Manitex; Altec; Elliott; Tadano; Fassi; Palfinger; Furukawa; and Hiab
|
||
|
|
|
|
||
|
Foodservice Equipment
|
Ice-Cube Machines, Ice Flaker Machines and Storage Bins
|
Hoshizaki; Scotsman; Follet; Ice-O-Matic; Brema; Aucma; and Vogt
|
||
|
|
|
|
||
|
|
Beverage Dispensers and Related Products
|
Automatic Bar Controls; Celli; Cornelius; Hoshizaki/Lancer Corporation; Taylor; and Vin Service
|
||
|
|
|
|
||
|
|
Refrigerator and Freezer Equipment
|
American Panel; ICS; Nor-Lake; Master-Bilt; Thermo-Kool; Bally; Arctic; Beverage Air; Traulsen; True Foodservice; TurboAir; Masterbilt; and Hoshizaki
|
||
|
|
|
|
||
|
|
Primary Cooking Equipment
|
Ali Group; Electrolux; Dover Industries; Duke; Henny Penny; ITW; Middleby; Rational; and Taylor
|
||
|
|
|
|
||
|
|
Serving, Warming and Storage Equipment
|
Alto Shaam; Cambro; Duke; Hatco; ITW; Middleby; Standex; and Vollrath
|
||
|
|
|
|
||
|
|
Food Preparation Equipment
|
Ali Group; Bizerba; Electrolux; German Knife; Globe; ITW; and Univex
|
||
10
Engineering, Research and Development
We believe our extensive engineering, research and development capabilities have been key drivers of our success. We engage in research and development activities at dedicated locations within both of our segments. We have a staff of in-house engineers and technicians on three continents, supplemented with external engineering resources, who are responsible for improving existing products and developing new products. We incurred research and development costs of
$87.4 million
in
2014
,
$86.4 million
in
2013
and
$87.7 million
in
2012
.
Our team of engineers focuses on developing innovative, high performance, low maintenance products that are intended to create significant brand loyalty among customers. Design engineers work closely with our manufacturing and marketing staff, enabling us to identify changing end-user requirements, implement new technologies and effectively introduce product innovations. Close, carefully managed relationships with dealers, distributors and end users help us identify their needs, not only for products, but for the service and support that are critical to their profitable operations. As part of our ongoing commitment to provide superior products, we intend to continue our efforts to design products that meet evolving customer demands and reduce the period from product conception to product introduction.
Employee Relations
As of
December 31, 2014
, we employed approximately 12,300 people and had labor agreements with 13 local unions in North America. A large majority of our European employees belong to European trade unions. We have three trade unions in China and one trade union in India. During 2014, four of our union contracts expired at various times. All four of the contracts that expired in 2014 were successfully renegotiated without incident.
Geographic Areas
Net sales from continuing operations and long-lived asset information by geographic area as of and for the years ended December 31 are included below. Long-lived assets are defined as property, plant and equipment-net, goodwill, other intangible assets-net and other non-current assets, excluding deferred tax assets.
|
|
Net Sales
|
Long-Lived Assets
|
|||||||||||||||||
|
(in millions)
|
2014
|
2013
|
2012
|
2014
|
2013
|
||||||||||||||
|
United States
|
$
|
1,977.4
|
|
$
|
1,978.0
|
|
$
|
1,833.0
|
|
$
|
1,880.8
|
|
$
|
1,888.4
|
|
||||
|
Other North America
|
238.3
|
|
292.1
|
|
278.2
|
|
12.4
|
|
13.6
|
|
|||||||||
|
Europe
|
821.2
|
|
937.6
|
|
788.0
|
|
478.9
|
|
530.0
|
|
|||||||||
|
Asia
|
377.6
|
|
364.5
|
|
354.0
|
|
189.7
|
|
203.0
|
|
|||||||||
|
Middle East
|
223.2
|
|
174.2
|
|
161.6
|
|
1.5
|
|
1.6
|
|
|||||||||
|
Central and South America
|
106.9
|
|
166.9
|
|
243.0
|
|
30.0
|
|
36.0
|
|
|||||||||
|
Africa
|
56.7
|
|
30.0
|
|
110.8
|
|
—
|
|
—
|
|
|||||||||
|
South Pacific and Caribbean
|
13.3
|
|
12.6
|
|
10.6
|
|
4.0
|
|
4.1
|
|
|||||||||
|
Australia
|
71.9
|
|
92.2
|
|
134.1
|
|
3.0
|
|
4.7
|
|
|||||||||
|
Total
|
$
|
3,886.5
|
|
$
|
4,048.1
|
|
$
|
3,913.3
|
|
$
|
2,600.3
|
|
$
|
2,681.4
|
|
||||
Available Information
We make available, free of charge at our internet site (www.manitowoc.com), our annual reports on Form 10-K, quarterly reports on Form 10-Q, current reports on Form 8-K, our proxy statements and any amendments to those reports, as soon as reasonably practicable after we electronically file such material with, or furnish it to, the Securities and Exchange Commission (SEC). Our SEC reports can be accessed through the investor relations section of our website. Although some documents available on our website are filed with the SEC, the information generally found on our website is not part of this or any other report we file with or furnish to the SEC.
The public may read and copy any materials that we file with the SEC at the SEC’s Public Reference Room located at 100 F Street NE, Washington, DC 20549. The public may obtain information on the operation of the Public Reference Room by calling the SEC at 1-800-SEC-0330. The SEC also maintains electronic versions of our reports on its website at www.sec.gov.
11
The following are risk factors identified by management that if any events contemplated by the following risks actually occur, then our business, financial condition or results of operations could be materially adversely affected.
RISKS RELATING TO OUR PROPOSED SEPARATION OF OUR CRANES AND FOODSERVICE BUSINESSES BY SPIN-OFF
The proposed separation of our cranes business and foodservice business is contingent upon the satisfaction of a number of conditions, may require significant time and attention of our management, and may have a material adverse effect on us whether or not it is completed.
On January 29, 2015, we disclosed that our board of directors approved a plan to pursue a separation of our cranes business and foodservice business into two independent, publicly-traded companies through a spin-off. The proposed separation is subject to customary conditions, including, but not limited to, the receipt of legal opinions concerning the tax-free nature of the transaction, effectiveness of appropriate filings with the Securities and Exchange Commission and final approval by our board of directors. In addition, unanticipated developments or changes in the macroeconomic environment, credit markets and equity markets, as well as other market conditions, may impact the plan to effect the proposed spin-off. For these and other reasons, we may not complete the spin-off as expected during the first quarter of 2016, or at all.
Whether or not we complete the spin-off, our ongoing businesses may be adversely affected and we may be subject to certain risks and consequences as a result of pursuing the spin-off, including, among others, the following:
|
•
|
execution of the proposed spin-off will require significant time and attention from management, which may distract management from the operation of our businesses and the execution of other initiatives that may have been beneficial to us;
|
|
•
|
our employees may be distracted due to uncertainty about their future roles with each of the separate companies pending the completion of the spin-off;
|
|
•
|
we will be required to pay significant costs and expenses relating to the spin-off, such as legal, accounting and other professional fees, whether or not it is completed; and
|
|
•
|
we may experience negative reactions from the financial markets if we fail to complete the spin-off or fail to complete it on a timely basis.
|
Any of these factors could have a material adverse effect on our business, financial condition, results of operations, cash flows or the price of our common stock.
We may be unable to achieve some or all of the benefits that we expect to achieve from the spin-off.
Although we believe that separating our foodservice business from our cranes business by means of the spin-off will provide financial, operational, managerial and other benefits to us and our shareholders, the spin-off may not provide such results on the scope or scale we anticipate, and we may not realize any or all of the intended benefits. In addition, we will incur one-time costs and ongoing costs in connection with, or as a result of, the spin-off, including costs of operating as independent, publicly-traded companies that the two businesses will no longer be able to share. Those costs may exceed our estimates or could negate some of the benefits we expect to realize. If we do not realize the intended benefits of the spin-off or if our costs exceed our estimates, the company or the business that is spun off could suffer a material adverse effect on its business, financial condition, results of operations and cash flows.
If the proposed spin-off of our foodservice business is completed, the trading price of our common stock will decline.
We expect the trading price of our common stock immediately following the spin-off, which will only represent the value of our cranes business, to be significantly lower than immediately prior to the spin-off because the trading price for our common stock will no longer reflect the value of our foodservice business.
Following the spin-off, the aggregate value of your common stock of (a) the company and (b) the business that is spun off may be less than the aggregate value at which the company's common stock might have traded had the spin-off not occurred.
The common stock of (a) the company and (b) the business that is spun off that you may hold following the spin-off may collectively trade at an aggregate value less than the value at which the company's common stock might have traded had the spin-off not occurred due to, among other factors, the expected or actual future performance of either the company or the business that is spun off as a separate, independent company and the future shareholder base and market for the company's common stock and the
12
shares of the business that is spun off.
The proposed spin-off could result in substantial tax liability to us and our shareholders.
The spin-off is conditioned on our receipt of an opinion of tax counsel that neither the company nor our shareholders will recognize any taxable income, gain or loss for U.S. federal income tax purposes as a result of the spin-off. However, this opinion will not be binding on the IRS. Accordingly, the IRS or the courts may reach conclusions with respect to the spin-off that are different from the conclusions reached in the opinion of counsel. Moreover, the opinion of counsel will be based on certain statements and representations made by us, which, if incomplete or inaccurate in any material respect, could invalidate the opinion of counsel. Additionally, certain internal restructuring transactions necessary to accomplish the spin-off may result in adverse tax consequences to the company.
If the spin-off and certain related transactions were determined to be taxable, the company would be subject to a substantial tax liability that would have a material adverse effect on our financial condition, results of operations and cash flows. In addition, if the spin-off were taxable, each holder of our common stock who receives shares of the new spin-off company would generally be treated as receiving a taxable distribution of property in an amount equal to the fair market value of the shares received.
RISKS RELATING TO OUR BUSINESS
Sales of our products are cyclical and/or are otherwise sensitive to volatile or variable factors. A downturn or weakness in overall economic activity or fluctuations in those other factors can have a material adverse effect on us.
Historically, sales of products that we manufacture and sell have been subject to cyclical variations caused by changes in general economic conditions and other factors. In particular, the demand for our Crane products is cyclical and is impacted by the strength of the economy generally, the availability of financing and other factors, including crude oil prices, that may have an effect on the level of construction activity on an international, national or regional basis. During periods of expansion in construction activity, we generally have benefited from increased demand for our products. Conversely, during recessionary periods, we have been adversely affected by reduced demand for our products. In addition, the strength of the economy generally may affect the rates of expansion, consolidation, renovation and equipment replacement within the restaurant, lodging, convenience store and healthcare industries, which may affect the performance of our Foodservice segment. Furthermore, any future economic recession may impact leveraged companies, such as Manitowoc, more than competing companies with less leverage and may have a material adverse effect on our financial condition, results of operations and cash flows.
Products in our Crane segment also depend in part on federal, state, local and foreign governmental spending and appropriations, including infrastructure, security and defense outlays. Reductions in governmental spending can reduce demand for our products, which in turn can affect our performance. Weather conditions can substantially affect our Foodservice segment, as relatively cool summer weather and cooler-than-normal weather in hot climates tend to decrease sales of ice and beverage dispensers. Our sales depend in part upon our customers’ replacement or repair cycles. Adverse economic conditions may cause customers to forego or postpone new purchases in favor of repairing existing machinery.
If we are unable to sufficiently adjust to market conditions, among other potential adverse effects on our financial condition, results of operations and cash flows, we could fail to deliver on planned results, fall short of analyst and investor expectations, incur high fixed costs, and/or fail to benefit from higher than expected customer demand resulting in loss of market share.
Price increases in some materials and sources of supply could affect our profitability.
We use large amounts of steel, stainless steel, aluminum, copper and electronic controls, among other items, in the manufacture of our products. Occasionally, market prices of some of our key raw materials increase significantly. If in the future we are not able to reduce product costs in other areas or pass raw material price increases on to our customers, our margins could be adversely affected. In addition, because we maintain limited raw material and component inventories, even brief unanticipated delays in delivery by suppliers — including those due to capacity constraints, labor disputes, impaired financial condition of suppliers, weather emergencies or other natural disasters — may impair our ability to satisfy our customers and could adversely affect our financial performance.
To better manage our exposures to certain commodity price fluctuations, we regularly hedge our commodity exposures through financial markets. Through this hedging program we fix the future price for a portion of these commodities utilized in the production of our products. To the extent that our hedging is not successful in fixing commodity prices that are favorable in comparison to market prices at the time of purchase, we would experience a negative impact on our profit margins compared to the margins we would have realized if these price commitments were not in place, which may adversely affect our results of
13
operations, financial condition and cash flows in future periods.
Because we participate in industries that are intensely competitive, our net sales and profits could decline as we respond to competition.
We sell most of our products in highly competitive industries. We compete in each of those industries based on product design, quality of products, quality and responsiveness of product support services, product performance, maintenance costs and price. Some of our competitors may have greater financial, marketing, manufacturing and distribution resources than we do. We cannot be certain that our products and services will continue to compete successfully with those of our competitors or that we will be able to retain our customer base or improve or maintain our profit margins on sales to our customers, any of which could materially and adversely affect our financial condition, results of operations and cash flows.
If we fail to develop new and innovative products or if customers in our markets do not accept them, our results would be negatively affected.
Our products must be kept current to meet our customers’ needs. To remain competitive, we therefore must develop new and innovative products on an on-going basis. If we fail to make innovations, or the market does not accept our new products, our sales and results would suffer.
We invest significantly in the research and development of new products. These expenditures do not always result in products that will be accepted by the market. To the extent they do not, whether as a function of the product or the business cycle, we will have increased expenses without significant sales to benefit us. Failure to develop successful new products may also cause potential customers to choose to purchase used equipment or competitors’ products, rather than invest in new products manufactured by us.
We depend on our key personnel and the loss of these personnel could have an adverse effect on our business.
Our success depends to a large extent upon the continued services of our key executives, managers and skilled personnel. Generally, these employees are not bound by employment or non-competition agreements, and we cannot be sure that we will be able to retain our key officers and employees. We could be seriously harmed by the loss of key personnel if it were to occur in the future.
We have significant manufacturing and sales of our products outside of the United States, which may present additional risks to our business.
For the years ended
December 31, 2014
,
2013
and
2012
, approximately 49%, 51% and 53%, respectively, of our net sales were attributable to products sold outside of the United States. Expanding the company’s international sales is part of our growth strategy. International operations generally are subject to various risks, including political, military, religious and economic instability, local labor market conditions, the imposition of foreign tariffs, the impact of foreign government regulations, the effects of income and withholding tax, governmental expropriation, and differences in business practices. We may incur increased costs and experience delays or disruptions in product deliveries and payments in connection with our international sales, manufacturing and the integration of new facilities that could cause loss of revenue or increased cost. Unfavorable changes in the political, regulatory and business climate and currency devaluations of various foreign jurisdictions could have a material adverse effect on our financial condition, results of operations and cash flows.
A failure to meet customers’ product quality and reliability standards/expectations may lead to increased or unexpected product warranty claims and other adverse consequences to our business.
Product quality and reliability are significant factors influencing customers' decisions to purchase our products. Inability to maintain the high quality of our products relative to the perceived or actual quality of similar products offered by competitors could result in the loss of market share or sales, an increase in warranty costs and/or damage to our reputation. We provide our customers a warranty covering workmanship, and in some cases materials, on products we manufacture. Our warranty generally provides that products will be free from defects for periods ranging from 12 months to 60 months with certain equipment having longer term warranties. If a product fails to comply with the warranty, we may be obligated, at our expense, to correct any defect by repairing or replacing the defective product. Although we maintain warranty reserves in an amount based primarily on the number of units shipped and on historical and anticipated warranty claims, there can be no assurance that future warranty claims will follow historical patterns or that we can accurately anticipate the level of future warranty claims. An increase in the rate of warranty claims or the occurrence of unexpected warranty claims could materially and adversely affect our financial condition, results of operations and cash flows.
14
Some of our customers rely on financing with third parties to purchase our products, and we may incur expenses associated with our assistance to customers in securing third party financing.
A portion of our sales is financed by third-party finance companies on behalf of our customers. The availability of financing from third parties is affected by general economic conditions, the credit worthiness of our customers and the estimated residual value of our equipment. In certain transactions we provide residual value guarantees and buyback commitments to our customers or the third-party financial institutions. Deterioration in the credit quality of our customers or the overall health of the banking industry could negatively impact our customer’s ability to obtain the resources needed to make purchases of our equipment or their ability to obtain third-party financing. In addition, if the actual value of the equipment for which we have provided a residual value guaranty declines below the amount of our guaranty, we may incur additional costs, which may negatively impact our financial condition, results of operations and cash flows.
Our operations and profitability could suffer if we experience problems with labor relations.
As of
December 31, 2014
, we employed approximately 12,300 people and had labor agreements with 13 local unions in North America. A large majority of our European employees belong to European trade unions. We have three trade unions in China and one trade union in India. During 2014, four of our union contracts expired at various times. All four of the contracts that expired in 2014 were successfully renegotiated without incident. Any significant labor relations issues could have a material adverse effect on our results of operations and financial condition. In 2015 we have two union contracts that expire. Any significant labor relations issues could have a material adverse effect on our reputation, results of operations and financial condition.
Our leverage may impair our operations and financial condition.
As of
December 31, 2014
, our total consolidated debt was
$1,523.5 million
as compared to consolidated debt of
$1,526.8 million
as of
December 31, 2013
, including the value of related interest rate hedging instruments. Our debt could have important consequences, including increasing our vulnerability to general adverse economic and industry conditions; requiring a substantial portion of our cash flows from operations be used for the payment of interest rather than to fund working capital, capital expenditures, acquisitions and general corporate requirements; limiting our ability to obtain additional financing; and limiting our flexibility in planning for, or reacting to, changes in our business and the industries in which we operate.
The agreements governing our debt include covenants that restrict, among other matters, our ability to incur additional debt; pay dividends on or repurchase our equity; make investments; and consolidate, merge or transfer all or substantially all of our assets. In addition, our Senior Credit Facility requires us to maintain specified financial ratios and satisfy certain financial condition tests. Our ability to comply with these covenants may be affected by events beyond our control, including prevailing economic, financial and industry conditions. These covenants may also require that we take action to reduce our debt or to act in a manner contrary to our business objectives. We cannot be certain that we will meet any future financial tests or that the lenders will waive any failure to meet those tests. See additional discussion in Note 11, “Debt,” to our Consolidated Financial Statements.
If we default under our debt agreements, our lenders could elect to declare all amounts outstanding under our debt agreements to be immediately due and payable and could proceed against any collateral securing the debt. Under those circumstances, in the absence of readily-available refinancing on favorable terms, we might elect or be compelled to enter bankruptcy proceedings, in which case our shareholders could lose the entire value of their investment in our common stock.
An inability to successfully manage the implementation of a global enterprise resource planning (
“
ERP
”
) system in our Crane segment could adversely affect our operating results.
We are in the process of implementing a new global ERP system in the Crane segment. This system will replace many of our existing operating and financial systems. Such an implementation is a major undertaking both financially and from a management and personnel perspective. Should the system not be implemented successfully and within budget, or if the system does not perform in a satisfactory manner, it could be disruptive and adversely affect our operations and results of operations, including the ability of the company to report accurate and timely financial results.
Our results of operations may be negatively impacted by product liability lawsuits.
Our business exposes us to potential product liability risks that are inherent in the design, manufacture, sale and use of our products, especially our crane products. Certain of our businesses also have experienced claims relating to past asbestos
15
exposure. Neither we nor our affiliates have to date incurred material costs related to these asbestos claims. We vigorously defend ourselves against current claims and intend to do so against future claims. However, a substantial increase in the number of claims that are made against us or the amounts of any judgments or settlements could materially and adversely affect our reputation and our financial condition, results of operations and cash flows.
If we fail to protect our intellectual property rights or maintain our rights to use licensed intellectual property, our business could be adversely affected.
Our patents, trademarks and licenses are important in the operation of our businesses. Although we intend to protect our intellectual property rights vigorously, we cannot be certain that we will be successful in doing so. Third parties may assert or prosecute infringement claims against us in connection with the services and products that we offer, and we may or may not be able to successfully defend these claims. Litigation, either to enforce our intellectual property rights or to defend against claimed infringement of the rights of others, could result in substantial costs and in a diversion of our resources. In addition, if a third party would prevail in an infringement claim against us, then we would likely need to obtain a license from the third party on commercial terms, which would likely increase our costs. Our failure to maintain or obtain necessary licenses or an adverse outcome in any litigation relating to patent infringement or other intellectual property matters could have a material adverse effect on our financial condition, results of operations and cash flows.
Strategic divestitures could negatively affect our results.
We regularly review our business units and evaluate them against our core business strategies. In addition to strategic divestiture decisions, at times we may be required by regulatory authorities to make business divestitures as a result of acquisition transactions. As a result, we regularly consider the divestiture of non-core and non-strategic, or acquisition-related operations or facilities. Depending upon the circumstances and terms, the divestiture of an operation or facility could negatively affect our earnings from continuing operations.
We are exposed to the risk of foreign currency fluctuations.
Some of our operations are or will be conducted by subsidiaries in foreign countries. The results of the operations and the financial position of these subsidiaries will be reported in the relevant foreign currencies and then translated into U.S. dollars at the applicable exchange rates for inclusion in our consolidated financial statements, which are stated in U.S. dollars. The exchange rates between many of these currencies and the U.S. dollar have fluctuated significantly in recent years and may continue to fluctuate significantly in the future. Such fluctuations may have a material effect on our results of operations and financial position and may significantly affect the comparability of our results between financial periods.
In addition, we incur currency transaction risk whenever one of our operating subsidiaries enters into a transaction using a different currency than its functional currency. We attempt to reduce currency transaction risk whenever one of our operating subsidiaries enters into a material transaction using a different currency than its functional currency by:
• matching cash flows and payments in the same currency;
• direct foreign currency borrowing; and
• entering into foreign exchange contracts for hedging purposes.
However, we may not be able to hedge this risk completely or at an acceptable cost, which may adversely affect our results of operations, financial condition and cash flows in future periods.
Our income tax returns are subject to review by taxing authorities, and the final determination of our tax liability with respect to tax audits and any related litigation could adversely affect our financial results.
Although we believe that our tax estimates are reasonable and that we prepare our tax filings in accordance with all applicable tax laws, the final determination with respect to any tax audits, and any related litigation, could be materially different from our estimates or from our historical income tax provisions and accruals. The results of an audit or litigation could have a material effect on operating results and/or cash flows in the periods for which that determination is made. In addition, future period earnings may be adversely impacted by litigation costs, settlements, penalties, and/or interest assessments. We are undergoing tax audits in various jurisdictions and we regularly assess the likelihood of an adverse outcome resulting from such examinations to determine the adequacy of our tax reserves.
16
Our business and/or reputation could be negatively affected as a result of actions of activist shareholders, and such activism could impact the trading value of our securities.
Certain of our shareholders have publicly or privately expressed views with respect to the operation of our business, our business strategy, corporate governance considerations or other matters that may not be fully aligned with our own. Responding to actions by activist shareholders can be costly and time-consuming, disrupt our operations and divert the attention of management and our employees. Perceived uncertainties as to our future direction may result in the loss of potential business opportunities, damage to our reputation, and may make it more difficult to attract and retain qualified directors, personnel and business partners. These actions could also cause our stock price to experience periods of volatility.
Activist shareholders have made, and may in the future make, strategic proposals, suggestions, or requests for changes concerning the operation of our business, our business strategy, corporate governance considerations, or other matters. We cannot predict, and no assurances can be given, as to the outcome or timing of any consequences arising from these actions, and any such consequences may impact the value of our securities.
Environmental liabilities that may arise in the future could be material to us.
Our operations, facilities and properties are subject to extensive and evolving laws and regulations pertaining to air emissions, wastewater discharges, the handling and disposal of solid and hazardous materials and wastes, the remediation of contamination, and otherwise relating to health, safety and the protection of the environment. As a result, we are involved from time to time in administrative or legal proceedings relating to environmental and health and safety matters, and have in the past and will continue to incur capital costs and other expenditures relating to such matters.
Based on current information, we believe that any costs we may incur relating to environmental matters will not be material, although we can give no assurances. We also cannot be certain that identification of presently unidentified environmental conditions, more vigorous enforcement by regulatory authorities, or other unanticipated events will not arise in the future and give rise to additional environmental liabilities, compliance costs and/or penalties that could be material. Further, environmental laws and regulations are constantly evolving and it is impossible to predict accurately the effect they may have upon our financial condition, results of operations or cash flows.
Security breaches and other disruptions could compromise our information and expose us to liability, which would cause our business and reputation to suffer.
In the ordinary course of our business, we collect and store sensitive data, including our proprietary business information and that of our customers, suppliers and business partners, as well as personally identifiable information of our customers and employees, in our internal and external data centers, cloud services, and on our networks. The secure processing, maintenance and transmission of this information is critical to our operations and business strategy. Despite our security measures, our information technology and infrastructure, and that of our partners, may be vulnerable to malicious attacks or breached due to employee error, malfeasance or other disruptions, including as a result of rollouts of new systems. Any such breach or operational failure would compromise our networks and/or that of our partners and the information stored there could be accessed, publicly disclosed, lost or stolen. Any such access, disclosure or other loss of information could result in legal claims or proceedings and/or regulatory penalties, disrupt our operations, damage our reputation, and/or cause a loss of confidence in our products and services, which could adversely affect our business.
Our inability to recover from natural or man-made disasters could adversely affect our business.
Our business and financial results may be affected by certain events that we cannot anticipate or that are beyond our control, such as natural or man-made disasters, national emergencies, significant labor strikes, work stoppages, political unrest, war or terrorist activities that could curtail production at our facilities and cause delayed deliveries and canceled orders. In addition, we purchase components and raw materials and information technology and other services from numerous suppliers, and, even if our facilities were not directly affected by such events, we could be affected by interruptions at such suppliers. Such suppliers may be less likely than our own facilities to be able to quickly recover from such events and may be subject to additional risks such as financial problems that limit their ability to conduct their operations. We cannot assure you that we will have insurance to adequately compensate us for any of these events.
Our international sales and operations are subject to applicable laws relating to trade, export controls and foreign corrupt practices, the violation of which could adversely affect our operations.
We must comply with all applicable international trade, customs, export controls and economic sanctions laws and regulations
17
of the United States and other countries. We are also subject to the Foreign Corrupt Practices Act and other anti-bribery laws that generally bar bribes or unreasonable gifts to foreign governments or officials. Changes in trade sanctions laws may restrict our business practices, including cessation of business activities in sanctioned countries or with sanctioned entities, and may result in modifications to compliance programs. Violation of these laws or regulations could result in sanctions or fines and could have a material adverse effect on our financial condition, results of operations and cash flows.
Compliance with regulations related to conflict minerals may force us to incur additional expenses and affect the manufacturing and sale of our products.
The Securities and Exchange Commission (“SEC”) rules require disclosures related to the use of certain minerals sourced from the Democratic Republic of Congo and surrounding countries (“conflict minerals”) that are necessary to the functionality of a product manufactured, or contracted to be manufactured, by an SEC reporting company. The metals covered by the rules, are commonly referred to as “3TG” and include tin, tantalum, tungsten and gold. The disclosure requirements could affect the sourcing and availability of some of the minerals used in the manufacture of our products. Our supply chain is complex, and if we are not able to conclusively verify the origins for all conflict minerals used in our products or that our products are “conflict free,” we may face reputational challenges with our customers or investors. Furthermore, we may also encounter challenges to satisfy customers who require that our products be certified as “conflict free,” which could place us at a competitive disadvantage if we are unable to do so. Additionally, as there may be only a limited number of suppliers offering “conflict free” metals, we cannot be sure that we will be able to obtain necessary metals from such suppliers in sufficient quantities or at competitive prices. We could incur significant costs related to the compliance process, and face costs in satisfying the disclosure requirements.
The company has received no written comments regarding its periodic or current reports from the staff of the Securities and Exchange Commission (SEC) that were issued 180 days or more preceding the end of our fiscal year
2014
that remain unresolved.
18
The following table outlines the principal facilities we own or lease as of
December 31, 2014
.
|
Facility Location
|
Type of Facility
|
Approximate
Square Footage
|
Owned/Leased
|
|||
|
Cranes and Related Products
|
|
|
|
|||
|
Europe/Asia/Middle East
|
|
|
|
|||
|
Wilhelmshaven, Germany
|
Manufacturing/Office and Storage
|
410,000
|
Owned/Leased
|
|||
|
Presov, Slovak Republic
|
Manufacturing/Office
|
295,300
|
Owned
|
|||
|
Zhangjiagang, China
|
Manufacturing
|
800,000
|
Owned
|
|||
|
Fanzeres, Portugal
|
Manufacturing
|
177,300
|
Owned/Leased
|
|||
|
Baltar, Portugal
|
Manufacturing
|
98,400
|
Owned
|
|||
|
Pune, India
|
Manufacturing
|
190,000
|
Leased
|
|||
|
Niella Tanaro, Italy
|
Manufacturing
|
370,016
|
Owned
|
|||
|
Langenfeld, Germany
|
Office/Storage and Field Testing
|
80,300
|
Leased
|
|||
|
Moulins, France
|
Manufacturing/Office
|
355,000
|
Owned
|
|||
|
Charlieu, France
|
Manufacturing/Office
|
323,000
|
Owned
|
|||
|
Dardilly, France
|
Office
|
82,000
|
Leased
|
|||
|
Osny, France
|
Office/Storage/Repair
|
43,000
|
Owned
|
|||
|
Vitrolles, France
|
Office
|
16,000
|
Owned
|
|||
|
Dry, France
|
Office
|
93,100
|
Leased
|
|||
|
Buckingham, United Kingdom
|
Office/Storage
|
78,000
|
Leased
|
|||
|
Lusigny, France
|
Crane Testing Site
|
10,000
|
Owned
|
|||
|
Baudemont, France
|
Office & Training Center
|
8,000
|
Owned
|
|||
|
Saint Pierre de Chandieu, France
|
Manufacturing/Office
|
434,565
|
Leased
|
|||
|
Saint Ouen l’Aumone, France
|
Office
|
7,800
|
Leased
|
|||
|
Singapore (1)
|
Office/Storage
|
54,000
|
Leased
|
|||
|
Sydney, Australia (1)
|
Office/Storage/Workshop
|
61,000
|
Leased
|
|||
|
Dubai, United Arab Emirates
|
Office/Workshop
|
10,000
|
Leased
|
|||
|
Shirwal, India
|
Land
|
1,560,700
|
Owned
|
|||
|
Americas
|
|
|
|
|||
|
Shady Grove, Pennsylvania
|
Manufacturing/Office
|
1,330,000
|
Owned
|
|||
|
Manitowoc, Wisconsin
|
Manufacturing/Office
|
570,000
|
Owned
|
|||
|
Manitowoc, Wisconsin (1)
|
Office
|
17,175
|
Leased
|
|||
|
Manitowoc, Wisconsin
|
Land
|
250,200
|
Leased
|
|||
|
Passo Fundo, Brazil
|
Manufacturing/Office
|
300,000
|
Owned
|
|||
|
Quincy, Pennsylvania
|
Manufacturing
|
21,000
|
Owned
|
|||
|
Bauxite, Arkansas
|
Manufacturing/Office
|
36,000
|
Owned
|
|||
|
Port Washington, Wisconsin
|
Manufacturing
|
81,000
|
Owned
|
|||
19
Foodservice Equipment
|
Europe/Asia
|
|
|
|
|||
|
Hangzhou, China
|
Manufacturing/Office
|
260,000
|
Owned/Leased
|
|||
|
Eglfing, Germany
|
Manufacturing/Office/Warehouse
|
130,000
|
Leased
|
|||
|
Herisau, Switzerland
|
Manufacturing/Office
|
26,974
|
Leased
|
|||
|
Halesowen, United Kingdom(1)
|
Manufacturing/Office
|
86,000
|
Leased
|
|||
|
Sheffield, United Kingdom
|
Manufacturing/Office
|
100,000
|
Leased
|
|||
|
Guildford, United Kingdom
|
Office
|
12,500
|
Leased
|
|||
|
Shanghai, China
|
Office/Warehouse
|
28,933
|
Leased
|
|||
|
Foshan, China
|
Manufacturing/Office/Warehouse
|
40,000
|
Leased
|
|||
|
Singapore (1)
|
Manufacturing/Office/Warehouse
|
45,335
|
Leased
|
|||
|
Prachinburi, Thailand (Joint Venture)
|
Manufacturing/Office/Warehouse
|
80,520
|
Owned
|
|||
|
Samutprakarn, Thailand (Joint Venture)
|
Office
|
4,305
|
Leased
|
|||
|
North America
|
|
|
|
|||
|
Manitowoc, Wisconsin
|
Manufacturing/Office
|
376,000
|
Owned
|
|||
|
Parsons, Tennessee (1)
|
Manufacturing
|
120,000
|
Owned
|
|||
|
Sellersburg, Indiana
|
Manufacturing/Office
|
146,000
|
Owned
|
|||
|
La Mirada, California
|
Manufacturing/Office
|
15,000
|
Leased
|
|||
|
Tijuana, Mexico (1)
|
Manufacturing
|
111,000
|
Leased
|
|||
|
New Port Richey, Florida
|
Office/Technology Center
|
42,000
|
Owned
|
|||
|
Goodyear, Arizona
|
Manufacturing/Office
|
75,000
|
Leased
|
|||
|
Shreveport, Louisiana (1)
|
Manufacturing/Office
|
435,000
|
Owned
|
|||
|
Mt. Pleasant, Michigan
|
Manufacturing/Office
|
345,000
|
Owned
|
|||
|
Baltimore, Maryland
|
Manufacturing/Office
|
16,000
|
Leased
|
|||
|
Cleveland, Ohio
|
Manufacturing/Office
|
224,000
|
Owned
|
|||
|
Covington, Tennessee
|
Manufacturing/Office
|
186,000
|
Owned
|
|||
|
Piney Flats, Tennessee
|
Manufacturing/Office
|
131,000
|
Leased
|
|||
|
Fort Worth, Texas
|
Manufacturing/Office
|
182,000
|
Leased
|
|||
|
Concord, Ontario, Canada
|
Manufacturing/Office
|
116,000
|
Leased
|
|||
|
Mississauga, Ontario, Canada
|
Manufacturing/Office
|
155,000
|
Leased
|
|||
|
Monterrey, Mexico
|
Manufacturing/Office
|
303,750
|
Leased
|
|||
|
Corporate
|
|
|
|
|||
|
Manitowoc, Wisconsin
|
Office
|
34,000
|
Owned
|
|||
|
Manitowoc, Wisconsin
|
Office
|
5,000
|
Leased
|
|||
|
Manitowoc, Wisconsin
|
Hangar Ground Lease
|
31,320
|
Leased
|
|||
(1) There are multiple separate facilities within these locations.
In addition, we lease sales office and warehouse space for our Crane segment in Breda, The Netherlands; Begles, France; Dole, France; Nantes, France; Toulouse, France; Nice, France; Lainate, Italy; Lagenfeld, Germany; Warsaw, Poland; Melbourne, Australia; Brisbane, Australia; Beijing, China; Chengdu, China; Guangzhou, China; Shanghai, China; Dubai, UAE; Makati City, Philippines; Cavite, Philippines; Ahmedabad, India; Chennai, India; Hyderabad, India; Gurgaon, India; Kolkatta, India; Moscow, Russia; Jeffersonville, Indiana; Manitowoc, Wisconsin; Monterrey, Mexico; Sao Paulo, Brazil; Recife, Brazil;
20
Santiago, Chile; Johannesburg, South Africa; Ellis Ras, South Africa; Rio de Janeiro, Brazil; and Vitoria, Brazil. We lease office and warehouse space for our Foodservice segment in Salem, Virginia; Irwindale, California; Goodyear, Arizona; Miami, Florida; Odessa, Florida; Tampa, Florida; Fort Wayne, Indiana; Jeffersonville, Indiana; Cleveland, Ohio; Herborn, Germany; Kuala Lumpur, Malaysia; Barcelona, Spain; Naucalpan de Juarez, Mexico; and Mexico City, Mexico.
See Note 21, “Leases,” to the Consolidated Financial Statements included in Part II, Item 8 of this Form 10-K for additional information regarding leases.
Our global operations are governed by laws addressing the protection of the environment and employee safety and health. Under various circumstances, these laws impose civil and criminal penalties and fines, as well as injunctive and remedial relief, for noncompliance. They also may require remediation at sites where company related substances have been released into the environment.
We have expended substantial resources globally, both financial and managerial, to comply with the applicable laws and regulations, and to protect the environment and our workers. We believe we are in substantial compliance with such laws and regulations and we maintain procedures designed to foster and ensure compliance. However, we have been and may in the future be subject to formal or informal enforcement actions or proceedings regarding noncompliance with such laws or regulations, whether or not determined to be ultimately responsible in the normal course of business. Historically, these actions have been resolved in various ways with the regulatory authorities without material commitments or penalties to the company.
For information concerning other contingencies and uncertainties, see Note 17, “Contingencies and Significant Estimates,” to the Consolidated Financial Statements included in Part II, Item 8 of this Form 10-K.
Not Applicable.
21
EXECUTIVE OFFICERS OF THE REGISTRANT
Each of the following officers of the company has been elected by the Board of Directors. The information presented is as of
February 20, 2015
.
|
Name
|
Age
|
Position With The Registrant
|
Principal
Position Held
Since
|
|||
|
Glen E. Tellock
|
54
|
Chairman and Chief Executive Officer
|
2009
|
|||
|
Carl J. Laurino
|
53
|
Senior Vice President and Chief Financial Officer
|
2004
|
|||
|
Thomas G. Musial
|
63
|
Senior Vice President of Human Resources and Administration
|
2000
|
|||
|
Maurice D. Jones
|
55
|
Senior Vice President, General Counsel and Secretary
|
2004
|
|||
|
Eric P. Etchart
|
58
|
Senior Vice President, Business Development
|
2015
|
|||
|
Robert M. Hund
|
50
|
Senior Vice President of the Company and President Foodservice Segment
|
2013
|
|||
|
Therese C. Houlahan
|
37
|
Treasurer
|
2014
|
|||
|
Larry J. Weyers
|
52
|
Senior Vice President of the Company and President Crane Segment
|
2015
|
|||
Glen E. Tellock has been the company’s chief executive officer since 2007 and has served as chairman of the board since 2009. He previously served as the senior vice president of The Manitowoc Company, Inc. and president of the Crane segment since 2002. Earlier, he served as the company’s senior vice president and chief financial officer (1999), vice president of finance and treasurer (1998), corporate controller (1992) and director of accounting (1991). Prior to joining the company, Mr. Tellock served as financial planning manager with the Denver Post Corporation, and as an audit manager for Ernst & Whinney.
Carl J. Laurino was named senior vice president and chief financial officer in 2004. He had served as treasurer since 2001. Mr. Laurino joined the company in 2000 as assistant treasurer and served in that capacity until his promotion to treasurer. Previously, Mr. Laurino spent 15 years in the commercial banking industry with Firstar Bank (n/k/a US Bank), Norwest Bank (n/k/a Wells Fargo), and Associated Bank.
Thomas G. Musial has been senior vice president of human resources and administration since 2000. Previously, he was vice president of human resources and administration (1995), manager of human resources (1987), and personnel/industrial relations specialist (1976).
Maurice D. Jones has been general counsel and secretary since 1999 and was elected vice president in 2002 and a senior vice president in 2004. Prior to joining the company, Mr. Jones was a shareholder in the law firm of Davis and Kuelthau, S.C., and served as legal counsel for Banta Corporation.
Eric P. Etchart was named senior vice president, business development, of The Manitowoc Company, Inc. in January 2015. Prior to that time, he served as senior vice president of The Manitowoc Company, Inc. and president of the Manitowoc Crane segment since 2007. Mr. Etchart previously served as executive vice president of the Crane segment for the Asia/Pacific region since 2002. Prior to joining the company, Mr. Etchart served as managing director in the Asia/Pacific region for Potain S.A., as managing director in Italy for Potain S.P.A. and as vice president of international sales and marketing for PPM.
Robert M. Hund was named senior vice president of The Manitowoc Company, Inc. and president of the Manitowoc Foodservice segment in 2013. Mr. Hund previously served as executive vice president of the Cranes segment’s Crane Care aftermarket services department since 2009. Prior to this, Mr. Hund was Vice President Worldwide Marketing for the Crane segment since 2007. Before joining Manitowoc, Mr. Hund held a variety of technical and marketing positions at Caterpillar Inc. since 1988 in Asia, Europe, and the United States.
Therese C. Houlahan was named treasurer of the company in March 2014. Previously she served as treasurer of Kaydon Corporation, a diversified manufacturer, in Michigan. Prior to that she held progressive leadership positions at Alberto Culver Company and Hayes Lemmerz International, Inc., as well as at the Comptroller of the Currency.
22
Larry J. Weyers was named senior vice president of The Manitowoc Company, Inc. and president of the Manitowoc Crane segment in January 2015. Mr. Weyers previously served as executive vice president of Cranes America from 2007 to 2014. He has held various other executive management positions with the company’s Crane segment since joining the company in 1998, including executive vice president of Crane Care from 2004 to 2007. Prior to joining the company, Mr. Weyers was General Manager Sales and Marketing for Woods Equipment Company (IL) and held various positions in Kubata Tractor Corporation (CA).
23
The company
’
s common stock is traded on the New York Stock Exchange under the symbol MTW. At
December 31, 2014
, the approximate number of record shareholders of common stock was 2,052.
The amount and timing of the annual dividend are determined by the Board of Directors at its regular meetings each year, subject to limitations within the company’s Senior Credit Facility described below. In each of the years ended
December 31, 2014
,
December 31, 2013
and
December 31, 2012
, the company paid an annual dividend of $0.08 per share in the fourth quarter.
The high and low sales prices of the common stock were as follows for
2014
,
2013
and
2012
:
|
Year Ended
|
2014
|
2013
|
2012
|
||||||||||||||||||||||||||||||||
|
December 31
|
High
|
Low
|
Close
|
High
|
Low
|
Close
|
High
|
Low
|
Close
|
||||||||||||||||||||||||||
|
1st Quarter
|
$
|
32.80
|
|
$
|
22.68
|
|
$
|
31.45
|
|
$
|
21.35
|
|
$
|
15.90
|
|
$
|
20.56
|
|
$
|
16.97
|
|
$
|
9.45
|
|
$
|
13.86
|
|
||||||||
|
2nd Quarter
|
33.46
|
|
26.87
|
|
32.86
|
|
21.50
|
|
16.18
|
|
17.91
|
|
15.11
|
|
9.60
|
|
11.70
|
|
|||||||||||||||||
|
3rd Quarter
|
33.50
|
|
23.42
|
|
23.45
|
|
21.87
|
|
17.93
|
|
19.56
|
|
15.44
|
|
9.90
|
|
13.34
|
|
|||||||||||||||||
|
4th Quarter
|
23.36
|
|
16.24
|
|
22.10
|
|
23.68
|
|
18.12
|
|
23.32
|
|
16.03
|
|
12.82
|
|
15.68
|
|
|||||||||||||||||
Under our Senior Credit Facility, we are limited on the amount of dividends we may pay in any one year. The amount of dividend payments is restricted based on our consolidated total leverage ratio as defined in the credit agreement and is limited along with other restricted payments in aggregate. If the consolidated total leverage ratio is less than 3.50 to 1.00, total restricted payments are not limited in any given year. If the consolidated total leverage ratio is less than 4.25 to 1.00 but greater than or equal to 3.50 to 1.00, restricted payments may not exceed $50.0 million per year. If the consolidated total leverage ratio is less than 5.00 to 1.00 but greater than or equal to 4.25 to 1.00, restricted payments may not exceed $40.0 million per year. Lastly, if the consolidated total leverage ratio is greater than or equal to 5.00 to 1.00, total restricted payments are limited to $30.0 million per year.
24
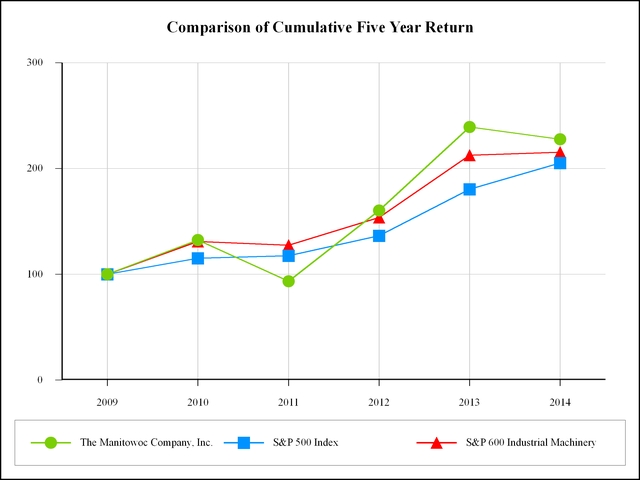
Total Return to Shareholders
(Includes reinvestment of dividends)
|
|
Annual Return Percentages
|
|||||||||||||
|
|
Years Ending December 31,
|
|||||||||||||
|
|
2010
|
2011
|
2012
|
2013
|
2014
|
|||||||||
|
The Manitowoc Company, Inc.
|
32.30
|
%
|
(29.39
|
)%
|
71.53
|
%
|
49.30
|
%
|
(4.86
|
)%
|
||||
|
S&P 500 Index
|
15.06
|
%
|
2.11
|
%
|
16.00
|
%
|
32.39
|
%
|
13.69
|
%
|
||||
|
S&P 600 Industrial Machinery
|
31.01
|
%
|
(2.67
|
)%
|
20.56
|
%
|
38.22
|
%
|
1.36
|
%
|
||||
|
|
Indexed Returns
|
||||||||||||||||
|
|
Years Ending December 31,
|
||||||||||||||||
|
|
2009
|
2010
|
2011
|
2012
|
2013
|
2014
|
|||||||||||
|
The Manitowoc Company, Inc.
|
100.00
|
|
132.30
|
|
93.41
|
|
160.23
|
|
239.22
|
|
227.61
|
|
|||||
|
S&P 500 Index
|
100.00
|
|
115.06
|
|
117.49
|
|
136.30
|
|
180.44
|
|
205.14
|
|
|||||
|
S&P 600 Industrial Machinery
|
100.00
|
|
131.01
|
|
127.51
|
|
153.73
|
|
212.48
|
|
215.37
|
|
|||||
25
The following selected historical financial data have been derived from the Consolidated Financial Statements of The Manitowoc Company, Inc. The data should be read in conjunction with these financial statements and “Management’s Discussion and Analysis of Financial Condition and Results of Operations.” Results of the Manitowoc Dong Yue business, the Jackson business, and the Kysor/Warren business in the years presented have been classified as discontinued operations to exclude those results from continuing operations. In addition, the earnings (loss) from discontinued operations include the impact of adjustments to certain retained liabilities for operations sold or closed in periods prior to those presented. For businesses acquired during the time periods presented, results are included in the table from their acquisition date. Amounts are in millions except share and per share data.
|
|
2014
|
2013
|
2012
|
2011
|
2010
|
||||||||||||||
|
Net Sales
|
|
|
|
|
|
|
|
|
|
|
|||||||||
|
Cranes and Related Products
|
$
|
2,305.2
|
|
$
|
2,506.3
|
|
$
|
2,427.1
|
|
$
|
2,134.7
|
|
$
|
1,707.5
|
|
||||
|
Foodservice Equipment
|
1,581.3
|
|
1,541.8
|
|
1,486.2
|
|
1,454.6
|
|
1,362.9
|
|
|||||||||
|
Total
|
3,886.5
|
|
4,048.1
|
|
3,913.3
|
|
3,589.3
|
|
3,070.4
|
|
|||||||||
|
Gross Profit
|
986.1
|
|
1,021.8
|
|
943.0
|
|
832.9
|
|
759.1
|
|
|||||||||
|
Earnings (Loss) from Operations
|
|
|
|
|
|
|
|
|
|
|
|||||||||
|
Cranes and Related Products
|
163.9
|
|
218.8
|
|
170.5
|
|
118.8
|
|
93.8
|
|
|||||||||
|
Foodservice Equipment
|
234.0
|
|
250.3
|
|
238.6
|
|
214.4
|
|
201.9
|
|
|||||||||
|
Corporate
|
(53.4
|
)
|
(64.9
|
)
|
(63.7
|
)
|
(61.3
|
)
|
(42.0
|
)
|
|||||||||
|
Asset impairment expense
|
(1.1
|
)
|
—
|
|
—
|
|
—
|
|
—
|
|
|||||||||
|
Amortization expense
|
(35.1
|
)
|
(35.3
|
)
|
(36.5
|
)
|
(37.4
|
)
|
(36.8
|
)
|
|||||||||
|
Restructuring expense
|
(9.0
|
)
|
(4.8
|
)
|
(9.5
|
)
|
(5.5
|
)
|
(3.8
|
)
|
|||||||||
|
Other (expense) income
|
(0.5
|
)
|
0.3
|
|
(2.5
|
)
|
0.5
|
|
(2.3
|
)
|
|||||||||
|
Total
|
298.8
|
|
364.4
|
|
296.9
|
|
229.5
|
|
210.8
|
|
|||||||||
|
Interest expense
|
(94.0
|
)
|
(128.4
|
)
|
(135.6
|
)
|
(145.4
|
)
|
(173.8
|
)
|
|||||||||
|
Amortization of deferred financing fees
|
(4.4
|
)
|
(7.0
|
)
|
(8.2
|
)
|
(10.4
|
)
|
(22.0
|
)
|
|||||||||
|
Loss on debt extinguishment
|
(25.5
|
)
|
(3.0
|
)
|
(6.3
|
)
|
(29.7
|
)
|
(44.0
|
)
|
|||||||||
|
Other (expense) income - net
|
(5.5
|
)
|
(0.8
|
)
|
0.1
|
|
2.3
|
|
(9.0
|
)
|
|||||||||
|
Earnings (loss) from continuing operations before income taxes
|
169.4
|
|
225.2
|
|
146.9
|
|
46.3
|
|
(38.0
|
)
|
|||||||||
|
Provision for taxes on income
|
8.6
|
|
36.1
|
|
38.0
|
|
13.6
|
|
26.2
|
|
|||||||||
|
Earnings (loss) from continuing operations
|
160.8
|
|
189.1
|
|
108.9
|
|
32.7
|
|
(64.2
|
)
|
|||||||||
|
Discontinued operations:
|
|
|
|
|
|
|
|
|
|
|
|||||||||
|
Loss from discontinued operations, net of income taxes
|
(1.4
|
)
|
(18.8
|
)
|
(16.3
|
)
|
(15.8
|
)
|
(13.1
|
)
|
|||||||||
|
Loss on sale of discontinued operations, net of income taxes
|
(11.0
|
)
|
(2.7
|
)
|
—
|
|
(34.6
|
)
|
—
|
|
|||||||||
|
Net earnings (loss)
|
148.4
|
|
167.6
|
|
92.6
|
|
(17.7
|
)
|
(77.3
|
)
|
|||||||||
|
Less: Net earnings (loss) attributable to noncontrolling interest, net of tax
|
3.9
|
|
25.8
|
|
(9.1
|
)
|
(6.5
|
)
|
(2.7
|
)
|
|||||||||
|
Net earnings (loss) attributable to Manitowoc
|
$
|
144.5
|
|
$
|
141.8
|
|
$
|
101.7
|
|
$
|
(11.2
|
)
|
$
|
(74.6
|
)
|
||||
|
Amounts attributable to the Manitowoc common shareholders:
|
|
|
|
|
|
|
|
|
|
|
|||||||||
|
Earnings (loss) from continuing operations
|
$
|
156.5
|
|
$
|
154.8
|
|
$
|
109.7
|
|
$
|
33.0
|
|
$
|
(64.0
|
)
|
||||
|
Loss from discontinued operations, net of income taxes
|
(1.0
|
)
|
(10.3
|
)
|
(8.0
|
)
|
(9.6
|
)
|
(10.6
|
)
|
|||||||||
|
Loss on sale of discontinued operations, net of income taxes
|
(11.0
|
)
|
(2.7
|
)
|
—
|
|
(34.6
|
)
|
—
|
|
|||||||||
|
Net earnings (loss) attributable to Manitowoc
|
$
|
144.5
|
|
$
|
141.8
|
|
$
|
101.7
|
|
$
|
(11.2
|
)
|
$
|
(74.6
|
)
|
||||
26
|
Cash Flows
|
|
|
|
|
|
|
|
|
|
|
|||||||||
|
Cash flow from operations
|
$
|
98.3
|
|
$
|
323.1
|
|
$
|
162.4
|
|
$
|
17.1
|
|
$
|
207.7
|
|
||||
|
Identifiable Assets
|
|
|
|
|
|
|
|
|
|
|
|||||||||
|
Cranes and Related Products
|
$
|
1,742.3
|
|
$
|
1,900.4
|
|
$
|
1,903.3
|
|
$
|
1,760.8
|
|
$
|
1,659.3
|
|
||||
|
Foodservice Equipment
|
1,902.0
|
|
1,904.3
|
|
1,956.8
|
|
2,192.6
|
|
2,193.4
|
|
|||||||||
|
Corporate
|
172.3
|
|
171.9
|
|
197.2
|
|
69.2
|
|
219.6
|
|
|||||||||
|
Total
|
$
|
3,816.6
|
|
$
|
3,976.6
|
|
4,057.3
|
|
$
|
4,022.6
|
|
$
|
4,072.3
|
|
|||||
|
Long-term Obligations
|
$
|
1,523.5
|
|
$
|
1,526.8
|
|
1,801.0
|
|
$
|
1,866.4
|
|
$
|
1,982.3
|
|
|||||
|
Depreciation
|
|
|
|
|
|
|
|
|
|
|
|||||||||
|
Cranes and Related Products
|
$
|
45.7
|
|
$
|
46.9
|
|
$
|
43.5
|
|
$
|
52.9
|
|
$
|
55.3
|
|
||||
|
Foodservice Equipment
|
21.2
|
|
20.1
|
|
22.3
|
|
24.5
|
|
27.1
|
|
|||||||||
|
Corporate
|
1.5
|
|
1.5
|
|
2.3
|
|
2.8
|
|
2.9
|
|
|||||||||
|
Total
|
$
|
68.4
|
|
$
|
68.5
|
|
68.1
|
|
$
|
80.2
|
|
$
|
85.3
|
|
|||||
|
Capital Expenditures
|
|
|
|
|
|
|
|
|
|
|
|||||||||
|
Cranes and Related Products
|
$
|
57.3
|
|
$
|
69.3
|
|
$
|
52.7
|
|
$
|
52.0
|
|
$
|
20.6
|
|
||||
|
Foodservice Equipment
|
25.3
|
|
33.6
|
|
17.4
|
|
11.9
|
|
12.0
|
|
|||||||||
|
Corporate
|
2.2
|
|
7.8
|
|
2.8
|
|
0.7
|
|
2.0
|
|
|||||||||
|
Total
|
$
|
84.8
|
|
$
|
110.7
|
|
$
|
72.9
|
|
$
|
64.6
|
|
$
|
34.6
|
|
||||
|
Per Share
|
|
|
|
|
|
|
|
|
|
|
|||||||||
|
Basic earnings (loss) per common share:
|
|
|
|
|
|
|
|
|
|
|
|||||||||
|
Earnings (loss) from continuing operations attributable to Manitowoc common shareholders
|
$
|
1.16
|
|
$
|
1.16
|
|
$
|
0.83
|
|
$
|
0.25
|
|
$
|
(0.49
|
)
|
||||
|
Loss from discontinued operations attributable to Manitowoc common shareholders
|
(0.01
|
)
|
(0.08
|
)
|
(0.06
|
)
|
(0.07
|
)
|
(0.08
|
)
|
|||||||||
|
Loss on sale of discontinued operations, net of income taxes
|
(0.08
|
)
|
(0.02
|
)
|
—
|
|
(0.27
|
)
|
—
|
|
|||||||||
|
Earnings (loss) per share attributable to Manitowoc common shareholders
|
$
|
1.07
|
|
$
|
1.07
|
|
$
|
0.77
|
|
$
|
(0.09
|
)
|
$
|
(0.57
|
)
|
||||
|
Diluted earnings (loss) per common share:
|
|
|
|
|
|
|
|||||||||||||
|
Earnings (loss) from continuing operations attributable to Manitowoc common shareholders
|
$
|
1.14
|
|
$
|
1.14
|
|
$
|
0.82
|
|
$
|
0.25
|
|
$
|
(0.49
|
)
|
||||
|
Loss from discontinued operations attributable to Manitowoc common shareholders
|
(0.01
|
)
|
(0.08
|
)
|
(0.06
|
)
|
(0.07
|
)
|
(0.08
|
)
|
|||||||||
|
Loss on sale of discontinued operations, net of income taxes
|
(0.08
|
)
|
(0.02
|
)
|
—
|
|
(0.26
|
)
|
—
|
|
|||||||||
|
Earnings (loss) per share attributable to Manitowoc common shareholders
|
$
|
1.05
|
|
$
|
1.05
|
|
$
|
0.76
|
|
$
|
(0.08
|
)
|
$
|
(0.57
|
)
|
||||
|
Avg Shares Outstanding
|
|
|
|
|
|
||||||||||||||
|
Basic
|
134,934,892
|
|
132,894,179
|
|
131,447,895
|
|
130,481,436
|
|
130,581,040
|
|
|||||||||
|
Diluted
|
137,351,309
|
|
135,330,193
|
|
133,317,050
|
|
133,377,109
|
|
130,581,040
|
|
|||||||||
|
(1)
|
Discontinued operations represent the results of operations and gain or loss on sale of Kysor/Warren, Jackson and our Chinese joint venture, Manitowoc Dong Yue, which either qualified for discontinued operations treatment or were sold or closed during 2010 through 2014.
|
|
(2)
|
We acquired Appliance Scientific, Inc. in 2010 and Inducs, AG in the fourth quarter of 2013.
|
|
(3)
|
Cash dividends for each year from 2010 through 2014 were $0.08 per share.
|
27
Item 7.
MANAGEMENT’S DISCUSSION AND ANALYSIS OF FINANCIAL CONDITION AND RESULTS OF OPERATIONS
The following discussion and analysis should be read in conjunction with the consolidated financial statements and related notes appearing in Part II, Item 8 of the Annual Report on Form 10-K.
Overview
The Manitowoc Company, Inc. is a multi-industry, capital goods manufacturer in two principal markets: Cranes and Related Products (Crane) and Foodservice Equipment (Foodservice). Crane is recognized as one of the world’s leading providers of lifting equipment for the global construction industry, including lattice-boom cranes, tower cranes, mobile telescopic cranes, and boom trucks. Foodservice is one of the world
’
s leading innovators and manufacturers of commercial foodservice equipment serving the ice, beverage, refrigeration, food preparation, and cooking needs of restaurants, convenience stores, hotels, healthcare, and institutional applications.
On January 29, 2015, Manitowoc announced that its Board of Directors has approved a plan to pursue a separation of the company’s Crane and Foodservice businesses into two independent, publicly-traded companies. The company currently anticipates effecting the separation through a tax-free spin-off of the Foodservice business and expects the spin-off to be completed in the first quarter of 2016; however, there can be no assurance regarding the ultimate timing of the proposed transaction or that the transaction will be completed. Subsequent to the separation, the historical results of our Foodservice business will be presented as discontinued operations.
During the first quarter of 2014, the company sold its
50%
interest in Manitowoc Dong Yue Heavy Machinery Co., Ltd. (“Manitowoc Dong Yue” or the “joint venture”), which produces mobile and truck-mounted hydraulic cranes in China, to its joint venture partner, Tai’an Taishan Heavy Industry Investment Co., Ltd., for a nominal amount. Consequently, the joint venture has been classified as discontinued operations in the company’s financial statements. See Note 4, “Discontinued Operations,” for further details of this transaction.
During the first quarter of 2013, the company sold its warewashing equipment business, which operated under the brand name Jackson, to Hoshizaki USA Holdings, Inc. for approximately $39.2 million, including post-closing adjustments. Net proceeds were used to reduce ratably the then-outstanding balances of Term Loans A and B. This business has been classified as discontinued operations in the company's financial statements.
The following discussion and analysis covers key drivers behind our results for
2012
through
2014
and is broken down into three major sections. First, we provide an overview of our results of operations for the years
2012
through
2014
on a consolidated basis and by business segment. Next we discuss our market conditions, liquidity and capital resources, off-balance sheet arrangements, and obligations and commitments. Finally, we provide a discussion of risk management techniques, contingent liability issues, critical accounting policies, impacts of future accounting changes, and cautionary statements.
All dollar amounts, except per share amounts, are in millions of dollars throughout the tables included in this Management’s Discussion and Analysis of Financial Conditions and Results of Operations unless otherwise indicated.
28
Results of Consolidated Operations
|
Millions of dollars
|
2014
|
2013
|
2012
|
||||||||
|
Operations
|
|
|
|
|
|
|
|||||
|
Net sales
|
$
|
3,886.5
|
|
$
|
4,048.1
|
|
$
|
3,913.3
|
|
||
|
Cost of sales
|
2,900.4
|
|
3,026.3
|
|
2,970.3
|
|
|||||
|
Gross Profit
|
986.1
|
|
1,021.8
|
|
943.0
|
|
|||||
|
Operating expenses:
|
|
|
|
|
|
|
|||||
|
Engineering, selling and administrative expenses
|
641.6
|
|
617.6
|
|
597.6
|
|
|||||
|
Asset impairment expense
|
1.1
|
|
—
|
|
—
|
|
|||||
|
Amortization expense
|
35.1
|
|
35.3
|
|
36.5
|
|
|||||
|
Restructuring expense
|
9.0
|
|
4.8
|
|
9.5
|
|
|||||
|
Other expenses (income)
|
0.5
|
|
(0.3
|
)
|
2.5
|
|
|||||
|
Total operating expenses
|
687.3
|
|
657.4
|
|
646.1
|
|
|||||
|
Operating earnings from continuing operations
|
298.8
|
|
364.4
|
|
296.9
|
|
|||||
|
Other (expenses) income:
|
|
|
|
|
|
|
|||||
|
Interest expense
|
(94.0
|
)
|
(128.4
|
)
|
(135.6
|
)
|
|||||
|
Amortization of deferred financing fees
|
(4.4
|
)
|
(7.0
|
)
|
(8.2
|
)
|
|||||
|
Loss on debt extinguishment
|
(25.5
|
)
|
(3.0
|
)
|
(6.3
|
)
|
|||||
|
Other (expense) income - net
|
(5.5
|
)
|
(0.8
|
)
|
0.1
|
|
|||||
|
Total other expenses
|
(129.4
|
)
|
(139.2
|
)
|
(150.0
|
)
|
|||||
|
Earnings from continuing operations before taxes on earnings
|
169.4
|
|
225.2
|
|
146.9
|
|
|||||
|
Provision for taxes on earnings
|
8.6
|
|
36.1
|
|
38.0
|
|
|||||
|
Earnings from continuing operations
|
160.8
|
|
189.1
|
|
108.9
|
|
|||||
|
Discontinued operations:
|
|
|
|
|
|
|
|||||
|
Loss from discontinued operations, net of income taxes
|
(1.4
|
)
|
(18.8
|
)
|
(16.3
|
)
|
|||||
|
Loss on sale of discontinued operations, net of income taxes
|
(11.0
|
)
|
(2.7
|
)
|
—
|
|
|||||
|
Net earnings
|
148.4
|
|
167.6
|
|
92.6
|
|
|||||
|
Less: Net earnings (loss) attributable to noncontrolling interest, net of tax
|
3.9
|
|
25.8
|
|
(9.1
|
)
|
|||||
|
Net earnings attributable to Manitowoc
|
$
|
144.5
|
|
$
|
141.8
|
|
$
|
101.7
|
|
||
|
Amounts attributable to the Manitowoc common shareholders:
|
|
|
|
|
|
|
|||||
|
Earnings from continuing operations
|
$
|
156.5
|
|
$
|
154.8
|
|
$
|
109.7
|
|
||
|
Loss from discontinued operations, net of income taxes
|
(1.0
|
)
|
(10.3
|
)
|
(8.0
|
)
|
|||||
|
Loss on sale of discontinued operations, net of income taxes
|
(11.0
|
)
|
(2.7
|
)
|
—
|
|
|||||
|
Net earnings attributable to Manitowoc
|
$
|
144.5
|
|
$
|
141.8
|
|
$
|
101.7
|
|
||
Year Ended
December 31, 2014
Compared to
2013
Net Sales
|
(in millions)
|
2014
|
2013
|
Change
|
||||||||
|
Net Sales
|
$
|
3,886.5
|
|
$
|
4,048.1
|
|
(4.0
|
)%
|
|||
Consolidated net sales decreased
4.0%
in
2014
to
$3.9 billion
from
$4.0 billion
in
2013
. The decrease in net sales was driven by the year-over-year decrease in the Crane segment, partially offset by the modest year-over-year increase in the Foodservice segment. Crane segment sales decreased
8.0%
for the year ended
December 31, 2014
compared to
2013
. The overall decrease in the Crane segment was primarily due to weaker demand in the Americas region for rough terrain and boom truck cranes. Foodservice segment sales increased
2.6%
for the year ended
December 31, 2014
compared to
2013
. Foodservice segment sales increased in the Americas region across both cold-side and hot-side brands from the prior year due to volume increases primarily driven by new product roll outs. Consolidated net sales were unfavorably impacted by approximately
$0.2 million
from foreign currency volatility in relation to the U.S. Dollar for the year ended
December 31, 2014
compared with the year ended
December 31, 2013
. Further analysis of the changes in sales by segment is presented in the “Sales and Operating Earnings by Segment” section below.
29
Gross Profit
|
(in millions)
|
2014
|
2013
|
Change
|
||||||||
|
Gross Profit
|
$
|
986.1
|
|
$
|
1,021.8
|
|
(3.5
|
)%
|
|||
|
Gross Margin
|
25.4
|
%
|
25.2
|
%
|
|||||||
Gross profit for the year ended
December 31, 2014
decreased to
$986.1 million
compared to
$1,021.8 million
for the year ended
December 31, 2013
, a decrease of
3.5%
. The decrease in consolidated gross profit was attributable primarily to the decrease in Crane segment gross profit due to the decrease in sales volume discussed above and unfavorable absorption given the lower sales volumes, partially offset by manufacturing cost reduction initiatives. Gross profit for the Foodservice segment decreased modestly, primarily due to unfavorable product mix, higher discounts and rebates, and higher warranty costs, partially offset by manufacturing cost reduction initiatives. Gross margin increased modestly in
2014
to
25.4%
from
25.2%
in
2013
. The increase in gross margin was primarily due to pricing actions and manufacturing cost reduction initiatives.
Engineering, Selling and Administrative Expenses
|
(in millions)
|
2014
|
2013
|
Change
|
||||||||
|
Engineering, selling and administrative expenses
|
$
|
641.6
|
|
$
|
617.6
|
|
3.9
|
%
|
|||
Engineering, selling and administrative (ES&A) expenses for the year ended
December 31, 2014
increased
$24.0 million
to
$641.6 million
compared to
$617.6 million
for the year ended
December 31, 2013
. Crane segment ES&A expenses increased
$21.9 million
, or
7.6%
, for the year ended
December 31, 2014
compared to the same period in
2013
. This increase was driven by increased levels of engineering and product development costs and an increase in enterprise resource planning system implementation costs. Foodservice segment ES&A expenses increased
$13.6 million
, or
5.2%
, for the year ended
December 31, 2014
compared to
2013
. This increase was primarily driven by non-recurring legal settlements benefiting fiscal 2013 and an increase in sales commissions and marketing costs. Corporate ES&A decreased $11.5 million, or 17.7%, for the year ended
December 31, 2014
compared to the same period in
2013
. This decrease was primarily due to decreases in employee health expense, short-term incentive compensation, and stock-based compensation.
Asset Impairment Expense
|
(in millions)
|
2014
|
2013
|
Change
|
|||||||
|
Asset impairment expense
|
$
|
1.1
|
|
$
|
—
|
|
*
|
|||
* Measure not meaningful
Asset impairment expense for the year ended
December 31, 2014
was
$1.1 million
; there was not any impairment expense for the year ended December 31,
2013
. This relates to the write-down to fair value of the land, building, and building improvements for a Foodservice segment facility which is currently held for sale.
Amortization Expense
|
(in millions)
|
2014
|
2013
|
Change
|
||||||||
|
Amortization expense
|
$
|
35.1
|
|
$
|
35.3
|
|
(0.6
|
)%
|
|||
Amortization expense for the year ended
December 31, 2014
was
$35.1 million
compared to
$35.3 million
for
2013
. See further detail related to intangible assets at Note 9, “Goodwill and Other Intangible Assets.”
Restructuring Expense
|
(in millions)
|
2014
|
2013
|
Change
|
||||||||
|
Restructuring expense
|
$
|
9.0
|
|
$
|
4.8
|
|
87.5
|
%
|
|||
Restructuring expenses for the year ended
December 31, 2014
totaled
$9.0 million
compared to
$4.8 million
in
2013
. Crane segment restructuring expenses totaled
$6.6 million
and Foodservice segment restructuring expenses totaled
$2.4 million
. Crane segment expenses related to restructuring plans to reduce the cost structure of crane operations through site closings, consolidations, and reductions in workforce across the globe. Foodservice segment restructuring expenses related primarily to employee termination benefits due to the movement of certain Ice manufacturing activities from Manitowoc, Wisconsin, to Monterrey, Mexico. See further detail at Note 19, “Restructuring.”
30
Interest Expense & Amortization of Deferred Financing Fees
|
(in millions)
|
2014
|
2013
|
Change
|
||||||||
|
Interest expense
|
$
|
94.0
|
|
$
|
128.4
|
|
(26.8
|
)%
|
|||
|
Amortization of deferred financing fees
|
$
|
4.4
|
|
$
|
7.0
|
|
(37.1
|
)%
|
|||
Interest expense for the year ended
December 31, 2014
totaled
$94.0 million
versus
$128.4 million
for the year ended
December 31, 2013
. The decrease in interest expense of
$34.4 million
for the year ended
December 31, 2014
compared to the prior year was a result of the company’s refinancing of its Senior Credit Facility during the first quarter of 2014, as well as its debt reduction efforts and accelerated amortization of the swap monetization gain of $8.3 million resulting from the redemption of the 2018 Notes, which was presented as a reduction to interest expense for this period. Amortization expense for deferred financing fees was
$4.4 million
for the year ended
December 31, 2014
as compared to
$7.0 million
in
2013
. The decrease in amortization expense for deferred financing fees of
$2.6 million
was related to the lower balance of deferred financing fees as a result of the redemption of the 2018 Notes and the company's debt reduction efforts. See further detail at Note 11, “Debt.”
|
(in millions)
|
2014
|
2013
|
Change
|
|||||||
|
Loss on debt extinguishment
|
$
|
25.5
|
|
$
|
3.0
|
|
*
|
|||
* Measure not meaningful
Loss on debt extinguishment for the year ended
December 31, 2014
totaled
$25.5 million
, compared to
$3.0 million
in
2013
. The loss on debt extinguishment in
2014
consisted of $23.3 million related to the February 2014 redemption of the 2018 Notes, of which $19.0 million related to the redemption premium and $4.3 million related to the write-off of deferred financing fees. A $2.0 million loss related to the write-off of deferred financing fees as a result of the Senior Credit Facility refinancing, and $0.2 million loss related to the accelerated paydown of Term Loan B associated with our New Senior Credit Facility. The loss on debt extinguishment in
2013
was attributable to the accelerated paydown of Term Loans A and B associated with our Prior Senior Credit Facility.
Other Expense - Net
|
(in millions)
|
2014
|
2013
|
Change
|
|||||||
|
Other expense - net
|
$
|
(5.5
|
)
|
$
|
(0.8
|
)
|
*
|
|||
* Measure not meaningful
Other expense, net for the year ended
December 31, 2014
was
$5.5 million
compared to
$0.8 million
for the prior year. Other expense primarily consists of foreign exchanges losses.
Income Taxes
|
(in millions)
|
2014
|
2013
|
Change
|
|||||||
|
Effective annual tax rate
|
5.1
|
%
|
16.0
|
%
|
||||||
|
Provision for taxes on earnings
|
$
|
8.6
|
|
$
|
36.1
|
|
*
|
|||
* Measure not meaningful
The effective tax rate for the year ended
December 31, 2014
was
5.1%
compared to
16.0%
for the year ended
December 31, 2013
. The 2014 effective rate was favorably impacted by an election with the Internal Revenue Service to treat Enodis Holdings Ltd, the company’s UK Holding Company, as a partnership for U.S. federal income tax purposes. As a result of this status change, the company realized a $25.6 million capital loss tax benefit. This transaction resulted in an effective tax rate benefit of 15.1%. The 2014 and 2013 effective tax rates were also favorably impacted by income earned in jurisdictions where the statutory tax rates were less than 35%.
The company was under examination by the Internal Revenue Service for the calendar years 2007 through 2011. The examination of the company’s 2007 through 2009 U.S. tax returns was closed during the third quarter of 2014 as the Joint Committee on Taxation concurred with the previously reached tentative resolution of the Appeals division, which was in the company’s favor. The 2010 and 2011 U.S. tax return examination was closed in the fourth quarter of 2014. The adjustments did not have a material impact on the financial statements. There have been no significant developments with respect to the company’s ongoing tax audits in other jurisdictions. See further detail at Note 13, “Income Taxes.”
31
Loss from Discontinued Operations
|
(in millions)
|
2014
|
2013
|
Change
|
||||||||
|
Loss from discontinued operations
|
$
|
1.4
|
|
$
|
18.8
|
|
(92.6
|
)%
|
|||
The results from discontinued operations were losses of
$1.4 million
and
$18.8 million
, net of income taxes, for the years ended
December 31, 2014
and
2013
, respectively. The loss from discontinued operations in 2014 relates primarily to administrative costs of various businesses disposed of in prior years. The loss from discontinued operations in 2013 relates primarily to Manitowoc Dong Yue, which was classified as discontinued operations in the fourth quarter of 2013. See additional discussion at Note 4, “Discontinued Operations.”
Loss on Sale of Discontinued Operations
|
(in millions)
|
2014
|
2013
|
Change
|
|||||||
|
Loss on sale of discontinued operations
|
$
|
11.0
|
|
$
|
2.7
|
|
*
|
|||
* Measure not meaningful
Loss on sale of discontinued operations was
$11.0 million
for the year ended
December 31, 2014
. This was attributable to the sale of Manitowoc Dong Yue for a loss of $9.9 million in the first quarter of 2014 and the settlement of a pension obligation related to a previously disposed entity for a loss of $1.1 million in the third quarter of 2014. Loss on sale of discontinued operations in 2013 was attributable to the sale of the Jackson business in the first quarter of 2013. See additional discussion at Note 4, “Discontinued Operations.”
Net Earnings Attributable to Noncontrolling Interest
|
(in millions)
|
2014
|
2013
|
Change
|
|||||||
|
Net earnings attributable to noncontrolling interest
|
$
|
3.9
|
|
$
|
25.8
|
|
*
|
|||
* Measure not meaningful
For the year ended
December 31, 2014
, net earnings attributable to a noncontrolling interest of
$3.9 million
was recorded in relation to the minority partner's portion of the income from our former Chinese joint venture, Manitowoc Dong Yue, which was disposed of in January 2014. There were net earnings of
$25.8 million
attributable to the minority partner in connection with Manitowoc Dong Yue for
2013
. This was primarily due to loan forgiveness resulting in income of
$35.6 million
by the joint venture partner shown as part of net earnings attributable to noncontrolling interest, net of income taxes, which effectively reduced net earnings attributable to Manitowoc shareholders. See Note 4, “Discontinued Operations,” for further details on this transaction.
Year Ended
December 31, 2013
Compared to
2012
Net Sales
|
(in millions)
|
2013
|
2012
|
Change
|
||||||||
|
Net Sales
|
$
|
4,048.1
|
|
$
|
3,913.3
|
|
3.4
|
%
|
|||
Consolidated net sales increased
3.4%
in 2013 to
$4.0 billion
from
$3.9 billion
in 2012. The increase was driven by modest year-over-year increases in both the Crane and Foodservice segments. Crane segment sales increased 3.3% for the year ended December 31, 2013 compared to 2012. The overall increase in the Crane segment was primarily due to higher demand in the Americas region and in certain emerging markets driven by energy and infrastructure projects as well as steady growth in the product aftermarket support business. Foodservice sales increased 3.7% for the year ended December 31, 2013 compared to 2012. Foodservice sales increased in the Americas region and the Europe, Middle East and Africa (EMEA) region from 2012 due to volume increases primarily driven by new product roll outs. Consolidated net sales were favorably impacted by approximately $26.5 million, or 0.7%, from foreign currency volatility in relation to the U.S. Dollar for the year ended December 31, 2013 compared with the year ended December 31, 2012. Further analysis of the changes in sales by segment is presented in the “Sales and Operating Earnings by Segment” section below.
32
Gross Profit
|
(in millions)
|
2013
|
2012
|
Change
|
||||||||
|
Gross Profit
|
$
|
1,021.8
|
|
$
|
943.0
|
|
8.4
|
%
|
|||
|
Gross Margin
|
25.2
|
%
|
24.1
|
%
|
|||||||
Gross profit for the year ended December 31, 2013 increased
8.4%
to
$1,021.8 million
compared to
$943.0 million
for the year ended December 31, 2012. The increase in Crane segment gross profit was primarily attributable to manufacturing cost reduction initiatives and pricing actions, partially offset by less favorable product mix. The increase in gross profit for the Foodservice segment was primarily attributable to sales volume increases coupled with pricing actions and manufacturing cost reduction initiatives, partially offset by increases in rebates and sales discounts. Gross margin increased in 2013 to 25.2% from 24.1% in 2012. The increase in gross margin was primarily due to pricing actions and manufacturing cost reduction initiatives.
Engineering, Selling and Administrative Expenses
|
(in millions)
|
2013
|
2012
|
Change
|
||||||||
|
Engineering, selling and administrative expenses
|
$
|
617.6
|
|
$
|
597.6
|
|
3.3
|
%
|
|||
ES&A expenses for the year ended December 31, 2013 increased $20.0 million to $617.6 million compared to $597.6 million for the year ended December 31, 2012. Crane segment ES&A increased $7.6 million, or 2.7%, for the year ended December 31, 2013 compared to 2012. This increase was driven by increased levels of engineering and product development costs, higher legal expenses and an increase of enterprise resource planning system implementation costs. Foodservice ES&A increased $11.2 million, or 4.4%, for the year ended December 31, 2013 compared to 2012. This increase was primarily driven by an increase in headcount, increased investments in strategic projects, and an increase in sales related costs.
Amortization Expense
|
(in millions)
|
2013
|
2012
|
Change
|
||||||||
|
Amortization expense
|
$
|
35.3
|
|
$
|
36.5
|
|
(3.3
|
)%
|
|||
Amortization expense for the year ended December 31, 2013 was $35.3 million compared to $36.5 million for 2012. See further detail related to intangible assets at Note 9, “Goodwill and Other Intangible Assets.”
Restructuring Expense
|
(in millions)
|
2013
|
2012
|
Change
|
|||||||
|
Restructuring expense
|
$
|
4.8
|
|
$
|
9.5
|
|
*
|
|||
* Measure not meaningful
Restructuring expenses for the year ended December 31, 2013 totaled $4.8 million compared to $9.5 million in 2012. Crane segment restructuring expenses totaled $1.9 million and Foodservice restructuring expenses totaled $2.9 million. These expenses primarily related to workforce reductions in Europe. Crane segment restructuring expenses totaled $7.2 million for the year ended December 31, 2012. These expenses primarily related to workforce reductions at our operations in France. Foodservice segment restructuring expenses totaled $2.3 million for the year ended December 31, 2012. These expenses primarily related to plant consolidation efforts in the Americas region and workforce reductions in Europe. See further detail at Note 19, “Restructuring.”
Interest Expense & Amortization of Deferred Financing Fees
|
(in millions)
|
2013
|
2012
|
Change
|
||||||||
|
Interest expense
|
$
|
128.4
|
|
$
|
135.6
|
|
(5.3
|
)%
|
|||
|
Amortization of deferred financing fees
|
$
|
7.0
|
|
$
|
8.2
|
|
(14.6
|
)%
|
|||
Interest expense for the year ended December 31, 2013 totaled $128.4 million versus $135.6 million for the year ended December 31, 2012. The decrease in interest expense of $7.2 million for the year ended December 31, 2013 compared to the year ended December 31, 2012 was due to debt reduction in 2013 and 2012. Amortization expense for deferred financing fees was $7.0 million for the year ended December 31, 2013 as compared to $8.2 million in 2012. The decrease in amortization expense for deferred financing fees of $1.2 million was attributable to the write-off of a portion of the deferred financing fees
33
associated with the debt reductions at the end of 2012, partially offset by the amortization of new fees associated with the issuance of the Senior Notes due 2022. See further detail at Note 11, “Debt.”
Loss on Debt Extinguishment
|
(in millions)
|
2013
|
2012
|
Change
|
|||||||
|
Loss on debt extinguishment
|
$
|
3.0
|
|
$
|
6.3
|
|
*
|
|||
* Measure not meaningful
Loss on debt extinguishment for the year ended December 31, 2013 totaled $3.0 million, compared to $6.3 million in 2012. The loss on debt extinguishment in 2013 was attributable to the accelerated paydown of Term Loans A and B associated with our Prior Senior Credit Facility. The loss on debt extinguishment in 2012 was attributable to accelerated paydown of Term Loans A and B associated with our Senior Credit Facility and the redemption of our 7.125% Senior Notes due 2013.
Other (Expense) Income - Net
|
(in millions)
|
2013
|
2012
|
Change
|
|||||||
|
Other (expense) income - net
|
$
|
(0.8
|
)
|
$
|
0.1
|
|
*
|
|||
* Measure not meaningful
Other (expense) income, net for the year ended December 31, 2013 was expense of $0.8 million versus income of $0.1 million for the prior year.
Income Taxes
|
(in millions)
|
2013
|
2012
|
Change
|
|||||||
|
Effective annual tax rate
|
16.0
|
%
|
25.9
|
%
|
||||||
|
Provision for taxes on earnings
|
$
|
36.1
|
|
$
|
38.0
|
|
*
|
|||
* Measure not meaningful
The effective tax rate for the year ended December 31, 2013 was 16.0% compared to 25.9% for the year ended December 31, 2012. The effective tax rates in 2013 and 2012 were favorably impacted by the release of reserves of $9.4 million and $11.6 million, respectively resulting from favorable audit outcomes and other settlements. The 2013 and 2012 effective tax rates were also favorably impacted by income earned in jurisdictions where the statutory tax rates were less than 35%.
Tax expense for the year ended December 31, 2013 was favorably impacted by valuation allowance adjustments on deferred tax assets totaling $2.3 million compared to an unfavorable impact of $13.5 million in 2012. The company recorded valuation allowance adjustments related to 2013 earnings and income tax rate changes in jurisdictions with valuation allowances established in prior years. See further detail at Note 13, “Income Taxes.”
Loss from Discontinued Operations
|
(in millions)
|
2013
|
2012
|
Change
|
||||||||
|
Loss from discontinued operations
|
$
|
18.8
|
|
$
|
16.3
|
|
15.3
|
%
|
|||
The results from discontinued operations were losses of $18.8 million and $16.3 million, net of income taxes, for the years ended December 31, 2013 and 2012, respectively. The loss from discontinued operations in both years relates primarily to the Manitowoc Dong Yue business, which was classified as discontinued operations in the fourth quarter of 2013. See additional discussion at Note 4, “Discontinued Operations.”
Loss on Sale of Discontinued Operations
|
(in millions)
|
2013
|
2012
|
Change
|
|||||||
|
Loss on sale of discontinued operations
|
$
|
2.7
|
|
$
|
—
|
|
N/A
|
|||
Loss on sale of discontinued operations was $2.7 million for the year ended December 31, 2013. The loss was primarily attributable to tax expense of $4.4 million on the sale of the Jackson business in January 2013. See additional discussion at Note 4, “Discontinued Operations.”
34
Net Earnings (Loss) Attributable to Noncontrolling Interest
|
(in millions)
|
2013
|
2012
|
Change
|
|||||||
|
Net earnings (loss) attributable to noncontrolling interest
|
$
|
25.8
|
|
$
|
(9.1
|
)
|
*
|
|||
* Measure not meaningful
For the year ended December 31, 2013, net earnings attributable to a noncontrolling interest of $25.8 million was recorded in relation to the minority partner's portion of the full year income from our former Chinese joint venture, Manitowoc Dong Yue. This was primarily due to loan forgiveness resulting in income of $35.6 million by the joint venture partner shown as part of net earnings attributable to noncontrolling interest, net of income taxes, which effectively reduced net earnings attributable to Manitowoc shareholders. See Note 4, “Discontinued Operations,” for further details on this transaction. There was a net loss of $9.1 million attributable to the minority partner in connection with Manitowoc Dong Yue for 2012.
Sales and Operating Earnings by Segment
Cranes and Related Products Segment
|
(in millions)
|
2014
|
2013
|
2012
|
|||||||||
|
Net sales
|
$
|
2,305.2
|
|
$
|
2,506.3
|
|
$
|
2,427.1
|
|
|||
|
Operating earnings
|
$
|
163.9
|
|
$
|
218.8
|
|
$
|
170.5
|
|
|||
|
Operating margin
|
7.1
|
%
|
8.7
|
%
|
7.0
|
%
|
||||||
Year Ended
December 31, 2014
Compared to
2013
Crane segment net sales for the year ended
December 31, 2014
decreased to
$2.3 billion
versus
$2.5 billion
for the year ended
December 31, 2013
, primarily as a result of volume decreases which were most pronounced in the rough-terrain and boom truck categories, as well as the unfavorable impact of approximately $4.9 million from foreign currency volatility in relation to the U.S. Dollar as compared with the year ended
December 31, 2013
. As of
December 31, 2014
, total Crane segment backlog was
$738.0 million
, an increase from the
December 31, 2013
backlog of
$574.0 million
.
For the year ended
December 31, 2014
, the Crane segment reported operating earnings of
$163.9 million
compared to
$218.8 million
for the year ended
December 31, 2013
. Operating earnings for the Crane segment decreased primarily due to the volume decreases discussed above and unfavorable absorption as a result of lower production levels. These decreases in operating earnings were partially offset by manufacturing and purchasing cost savings. Operating margin for the year ended
December 31, 2014
was
7.1%
versus
8.7%
for the year ended
December 31, 2013
. The Crane segment's operating margin decreased primarily due to unfavorable absorption given the lower sales volumes.
Year Ended
December 31, 2013
Compared to
2012
Crane segment net sales for the year ended December 31, 2013 increased to $2.5 billion versus $2.4 billion for the year ended December 31, 2012, primarily as a result of product mix, pricing actions, and the favorable impact of approximately $26.0 million from foreign currency volatility in relation to the U.S. Dollar as compared with the year ended December 31, 2012. As of December 31, 2013, total Crane segment backlog was $574.2 million, a decrease from the December 31, 2012 backlog of $755.8 million.
For the year ended December 31, 2013, the Crane segment reported operating earnings of $218.8 million compared to $170.5 million for the year ended December 31, 2012. Operating earnings for the Crane segment increased primarily due to manufacturing cost reduction initiatives and pricing actions. These increases in operating earnings were partially offset by increased levels of engineering and product development costs, higher legal expenses and an increase in enterprise resource planning system implementation costs. Operating margin for the year ended December 31, 2013 was 8.7% versus 7.0% for the year ended December 31, 2012. The Crane segment’s operating margin increased primarily due to the manufacturing cost reduction initiatives and pricing actions noted above.
35
Foodservice Equipment Segment
|
(in millions)
|
2014
|
2013
|
2012
|
|||||||||
|
Net sales
|
$
|
1,581.3
|
|
$
|
1,541.8
|
|
$
|
1,486.2
|
|
|||
|
Operating earnings
|
$
|
234.0
|
|
$
|
250.3
|
|
$
|
238.6
|
|
|||
|
Operating margin
|
14.8
|
%
|
16.2
|
%
|
16.1
|
%
|
||||||
Year Ended
December 31, 2014
Compared to
2013
Foodservice segment net sales increased
$39.5 million
to
$1,581.3 million
for the year ended
December 31, 2014
compared to
$1,541.8 million
the prior year. The sales increase during
2014
was primarily driven by volume increases in the Americas region across both cold-side and hot-side brands as a result of new product roll outs, coupled with pricing actions and a favorable impact of approximately $4.7 million from foreign currency volatility in relation to the U.S. Dollar as compared with the year ended
December 31, 2013
. The increase was partially offset by increases in rebates as a result of higher sales through certain market channels and increased sales discounts.
For the year ended
December 31, 2014
, the Foodservice segment reported operating earnings of
$234.0 million
compared to
$250.3 million
for the year ended
December 31, 2013
. The
2014
operating earnings decrease, and the operating margin decrease to
14.8%
from
16.2%
in
2013
, were primarily due to unfavorable mix, higher discounts and rebates, and increases in warranty costs, partially offset by manufacturing cost savings. In addition, approximately $1.0 million of the decrease in earnings was offset by favorable foreign currency volatility in relation to the U.S. Dollar for the year ended
December 31, 2014
compared to the year ended
December 31, 2013
.
Year Ended
December 31, 2013
Compared to
2012
Foodservice segment net sales increased $55.6 million to $1,541.8 million for the year ended December 31, 2013 compared to 2012. The sales increase during 2013 was primarily driven by volume increases as a result of new product roll outs coupled with pricing actions and a favorable impact of approximately $0.5 million from foreign currency volatility in relation to the U.S. Dollar as compared with the year ended December 31, 2012. The increase was partially offset by increases in rebates as a result of higher sales through certain market channels and increased sales discounts.
For the year ended December 31, 2013, the Foodservice segment reported operating earnings of $250.3 million compared to $238.6 million for the year ended December 31, 2012. The 2013 operating earnings increase, and the operating margin increase to 16.2% from 16.1% in 2012, were primarily due to increases in volume, pricing actions and manufacturing cost savings. The increase was partially offset by increases in rebates and discounts, warranty expense, headcount and investments in strategic projects. In addition, approximately $2.0 million of the increase was offset by foreign currency volatility in relation to the U.S. Dollar for the year ended December 31, 2013 compared to the year ended December 31, 2012.
General Corporate Expenses
|
(in millions)
|
2014
|
2013
|
2012
|
|||||||||
|
Net sales
|
$
|
3,886.5
|
|
$
|
4,048.1
|
|
$
|
3,913.3
|
|
|||
|
Corporate expenses
|
$
|
53.4
|
|
$
|
64.9
|
|
$
|
63.7
|
|
|||
|
% of Net sales
|
1.4
|
%
|
1.6
|
%
|
1.6
|
%
|
||||||
Year Ended
December 31, 2014
Compared to
2013
Corporate expenses decreased
$11.5 million
to
$53.4 million
in
2014
compared to
$64.9 million
in
2013
. The decrease was primarily due to decreases in employee health expense, short-term incentive compensation, and stock-based compensation.
Year Ended
December 31, 2013
Compared to
2012
Corporate expenses increased $1.2 million to $64.9 million in 2013 compared to $63.7 million in 2012. The increase was primarily due to an increase in employee pension and post-retirement expense, partially offset by lower stock-based award compensation and depreciation expenses.
36
Market Conditions and Outlook
In 2015, we are planning for modest decline in our Cranes and Related Products segment and modest growth in our Foodservice Equipment segment. In the face of anticipated slow market growth and differentiated consumer confidence, as well as an overall conservative macro-economic outlook, we expect to focus our efforts on margin improvements and controlled but intelligent spending. We expect continuing improvement in operational efficiencies and the management of our cost structure. We believe lean initiatives, new product introductions and continued debt repayment goals will help us maximize our net operating results and drive shareholder value.
We expect Foodservice segment revenues to improve modestly in the mid single-digit range and operating margins to improve in 2015. We expect Crane segment revenues to decrease in the mid single-digit range and we anticipate that operating margins in our Crane segment will be in the high single-digit range. Other financial expectations include capital expenditures of approximately $85 million, depreciation and amortization of approximately $110 million, interest expense of approximately $80 million, deferred financing fees of approximately $4 million and a full-year effective tax rate in the mid-to-high 20 percent range.
Proposed Spin-off of our Foodservice Business -
On January 29, 2015, Manitowoc announced that its Board of Directors has approved a plan to pursue a separation of the company’s Cranes and Foodservice businesses into two independent, publicly-traded companies. The company currently anticipates effecting the separation through a tax-free spin-off of the Foodservice business and expects the spin-off to be completed in the first quarter of 2016; however, there can be no assurance regarding the ultimate timing of the proposed transaction or that the transaction will be completed. The costs associated with effecting the transaction may be significant; however, these costs cannot be estimated at this time.
Cranes and Related Products
- Our Crane segment is anticipating mid-single digit decline in sales compared to 2014, with mixed results by product line and region. We expect sales in our North America region to grow by low-single digits driven largely from the new product introduction of our MLC300 and MLC650 crawler cranes. We are also expecting our Central and Eastern Europe and Asia Pacific regions to grow by low-single digits as a result of improved tower crane markets. Our Middle East region is coming off of a strong 2014 and we expect to be flat for 2015 in this region. All of our other regions are projected to be below 2014 sales due to continued economic challenges within Europe, Latin America and Africa. Offsetting the anticipated higher sales of crawler and tower cranes are expected softer sales in mobile cranes.
In 2015, one area of concern is the potential negative impact to the crane market from declining crude oil prices. Our products are used in many energy-related industries, and as the price of crude oil drops, the number of projects needing crane lifting activities tends to slow. Another area of concern is the strengthening of the U.S. Dollar against other global currencies and the negative impact it has on price competitiveness for our U.S.-manufactured products versus our international competition.
Despite the anticipated decline in sales of new crane equipment, we anticipate demand to grow by low-single digits for our industry-leading product support services. We believe our Crane Care business is not only a key differentiator for us, but is also especially important to our customers as the market eventually rebounds and crane utilization increases to ensure uptime availability.
Our end markets remain difficult to predict and forecasting remains challenging due to mixed views from our various sources for leading indicators and customer sentiment. Different industries and different geographic markets can show significant deviations in economic and demand outlook depending on the circumstances within their environments and outlooks can change rapidly during the year. We continue to use what we believe to be the best information that is available, along with our own experiences and knowledge of our customers and the industries they serve, to forecast future demand.
We also continue to focus on improvement initiatives in areas such as manufacturing planning, purchasing and inventory allocation processes to become more responsive to changes in demand from our customers, between regions and within product lines. These efforts may allow us to better meet the sudden changes in demand and enable us to improve our market share with our ability to have the right product available at the right time.
In addition, our initiatives in the area of quality, reliability and performance are continuing to produce positive results. These include improving Customer Satisfaction Index (CSI) scores due to reduced warranty claims, improved Mean Time Between Failure (MTBF) and improved emissions. Our investments in a component and systems validation and accelerated life cycle testing facility have accelerated our new product development process and the reliability of our cranes. We plan to continue to expand our capabilities and facilities in this area of component product verification in 2015. We believe these efforts, combined with cost reduction initiatives in factory productivity and procurement, and facilities and machinery improvements that were made in 2014 and prior years, will allow us to deliver better cranes to our customers in a more efficient manner.
37
The Crane segment also looks to leverage its global manufacturing footprint, while continuing to improve forecasting accuracy, vertical integration manufacturing capabilities, and working capital efficiency throughout 2015. In addition, we will focus on leveraging our existing fixed cost structure, improving manufacturing productivity and reducing material costs to improve our gross margin while increasing ES&A expenses at a slower rate than revenue increases. We also anticipate that a continued focus on economic value-added (EVA
®
) as our main financial management decision support tool will help to optimize cash flow and boost the segment's earnings potential. Underlying these financial goals, the Crane segment is focused on strategic initiatives, which include the continuation of our “Project One” SAP ERP initiative with go-live implementations at certain locations by mid-2015; driving manufacturing excellence initiatives through the use of lean manufacturing and other manufacturing process excellence principles; the continuing introduction of new crawler, tower, and mobile cranes; intensified leverage of our presence in various emerging markets; and an ongoing strengthening of our Crane Care infrastructure to drive profitability and support accelerating whole goods sales in emerging and developed markets.
From a longer-term perspective, we are among the world's leading sources of lifting solutions, with what we believe to be the most recognized brands and the broadest manufacturing and support footprint in the industry. Globally, we are anticipating slow near-term crane demand, but longer-term we believe there will be a higher growth, multi-year recovery driven by increasing global demand for modern infrastructure and energy, and we believe we are well-positioned to support these end markets anywhere in the world. We have a resilient business, with a strong global distribution network and a large installed base of equipment complemented by what we believe to be the best and most experienced workforce in the industry. As a result, we expect to generate increasing profits as the world economy improves and the markets our products serve begin to grow.
Foodservice Equipment
- Manitowoc Foodservice is a leading participant in the global foodservice equipment industry. Our customers include many of the fastest-growing and most-innovative foodservice companies in the world. They come to us for innovations that may enable profitable growth by improving their menus, enhancing operations and reducing costs. We serve customers around the globe and we will continue to expand and support our customers wherever they grow. Our integrated manufacturing operations, service sites and sales offices work together to assist customers worldwide, whether these customers are local businesses or global companies.
During 2014 we launched numerous new products supporting our customers’ menu initiatives, energy savings goals and sustainability initiatives, most notably in our Frymaster, Garland, Kolpak and Manitowoc Ice brands.
A number of leading indicators suggest that 2015 will bring growth opportunities of approximately 4.0% in the foodservice sector for the U.S. and Canada. Specifically, the U.S. National Restaurant Association (
“
NRA
”
) projects that overall U.S. restaurant operator sales would increase 3.8%, with inflation-adjusted real growth of 1.5%. That would mark the sixth consecutive year of U.S. restaurant industry growth. The Canadian Restaurant and Foodservices Association (
“
CRFA
”
) expects Canadian restaurant sales to increase 4.0% in 2015, which is a decrease from 4.9% in 2014 and 4.4% in 2013. The North American Manufacturers Agents Association (“MAFSI”) forecast for 2015 sales is 4.0% growth in equipment and supplies, which is a decrease from 4.9% in 2014. MAFSI also reports increased foodservice design consultant activity. Two leading U.S.-based publications, Food Equipment Reports and Food Equipment and Supplies magazines, also published forecasts that reflect an overall equipment growth rate of approximately 4.0% for 2015, which is unchanged from 2014. Lastly, Technomic has published that growth in food service sales was 3.3% nominal and 0.1% real in 2014 and will be 3.1% nominal and 1.2% real in 2015 with supermarket foodservice, college and university, hospitals, senior living and catering leading the way.
We believe there are pockets of growth in the Europe, Middle East and Africa (
“
EMEA
”
) region. Euromonitor projects that the United Kingdom, Germany, and France will continue to lead the growth of the region with foodservice operator sales expected to grow 3-4% over 2014. The quick-service restaurant (
“QSR”
) and fast casual segment
remains the fastest growing, with customers such as Burger King, Quick, KFC and Subway all predicted to deliver double-digit growth; McDonald's has announced new investments in sub-Saharan Africa; and Taco Bell plans to add 200 of 1,300 new openings globally (by 2023) in EMEA. In-store bakery continues to expand in Central and Eastern Europe and C-Store foodservice is forecasted to grow 5.3%. QSR/Casual Dining Chains and hotel projects in the Middle East remain strong growth drivers
.
Chain sales are forecasted to grow in 2015 by greater than 10% in UAE and Saudi Arabia, and by 15% in Egypt. On the downside, there is concern in the Eurozone due to the risk of deflation, fear over Greece's future and the effect of sanctions on Russia’s stability. The Euro is at its weakest level since 2006, which could be a challenge to achieving 2015 price realization.
The global growth of the Asia Pacific (
“
APAC
”
) region is expected to continue to be healthy in 2015 with projected 6.4% growth, although this is lower than years past. The Chinese government has targeted GDP growth at 7.5% in 2015, and BMI projects China 2015 real GDP growth at 6.7%. Food scandals and government-led anti-corruption drives have had a negative impact on overall foodservice spending, especially on large global and regional QSRs such as McDonald’s, KFCs and Dicos resulting in conservative planning for 2015. The economic outlook for India remains strong on the back of the government’s
38
pro-growth agenda and private consumption, which remains resilient. India real GDP growth is forecasted to accelerate to 5.6% in 2014/2015 from 4.7% from 2013/2014. In summary, we believe we are well positioned to take the advantage of the growth opportunities in the APAC region with global and regional new product introductions, improvement in operational excellence, and other strategic initiatives.
We believe our strong position gives us significant opportunities to grow along with our customers. Not only do we aim to be their supplier of choice, but also their innovator of choice. Our customers are constantly looking for ways to innovate their menus, and we are at the forefront of that innovation. Global chain customers and our channel partners recognize Manitowoc Foodservice and our brands for innovation and supplier support. In April 2014, Manitowoc Foodservice was honored for our ongoing commitment to sustainable practices throughout the foodservice industry, earning Energy Star Partner of the Year for Sustained Excellence and our fifth consecutive Energy Star Partner of the Year award. We also received the 2014 McDonald’s Corporation Best of Sustainable Supply Award for the demonstrated commitment of our Convotherm and Merrychef brands to the community where they are produced, as well as their energy saving design. Manitowoc Foodservice was again honored by the NRA as one of the restaurant industry's leading companies focused on innovation by understanding and meeting the operator's needs. This year Manitowoc Foodservice won Kitchen Innovation Awards from the NRA for the Garland® Induction FlexiHob technology and Multiplex® Blend-In-Cup Manual Fill® machine, bringing the total of these prestigious awards to 27. Additionally, seven of the top Manitowoc Foodservice brands were honored by those in the industry as Best-in-Class equipment for their category. This marks the fourteenth straight year of overall Best-in-Class awards for Manitowoc Ice and Frymaster.
Our Foodservice equipment brands are well-positioned leaders that span virtually all major commercial foodservice equipment categories. Our team is passionate about the combined businesses and the opportunities that our market position and global capabilities provide us. For 2015, our priorities are to continue to grow our Foodservice segment, as well as invest in manufacturing processes improvements and lean initiatives to drive margin improvement. We believe we are continuing to build an industry-leading business for the long-term.
Liquidity and Capital Resources
Cash Flows.
The table below shows a summary of cash flows for fiscal
2014
,
2013
, and
2012
(in millions):
|
2014
|
2013
|
2012
|
||||||||||
|
Cash provided by operating activities
|
$
|
98.3
|
|
$
|
323.1
|
|
$
|
162.4
|
|
|||
|
Cash used for investing activities
|
$
|
(83.6
|
)
|
$
|
(82.2
|
)
|
$
|
(75.5
|
)
|
|||
|
Cash provided by (used for) financing activities
|
$
|
11.2
|
|
$
|
(256.4
|
)
|
$
|
(83.2
|
)
|
|||
Cash flow from operations during
2014
was
$98.3 million
compared to
$323.1 million
in
2013
. We had
$68.0 million
in cash and cash equivalents on-hand at
December 31, 2014
versus
$54.9 million
on-hand at
December 31, 2013
.
The decrease in cash flow from operating activities for the year ended
December 31, 2014
compared to
2013
was primarily due to the timing of payments on accrued expenses and lower levels of accounts receivable as a result of decreased sales, as well as lower cash from profitability, partially offset by improvements in inventory levels.
Cash flow from operations during 2013 was
$323.1 million
compared to
$162.4 million
in 2012. We had
$54.9 million
in cash and cash equivalents on-hand at December 31, 2013 versus $73.2 million on-hand at December 31, 2012.
The increase in cash flow from operating activities for the year ended December 31, 2013 compared to the same period for 2012 was primarily due to cash from profitability and improvements in working capital. The primary contributor to the changes in working capital was cash collection from accounts receivable.
Cash flows used for investing activities of
$83.6 million
in
2014
consisted primarily of cash used for capital expenditures of
$84.8 million
and an increase in restricted cash of
$11.6 million
primarily due to our guarantee of a loan for Manitowoc Dong Yue, partially offset by
$12.8 million
of proceeds from the sale of property, plant, and equipment.
Cash flows used for investing activities of $82.2 million in 2013 consisted primarily of cash used for capital expenditures of $110.7 million and the acquisition of Inducs, AG for $12.2 million, partially offset by proceeds of $39.2 million related to the sale of the Jackson business.
39
Cash flows used for investing activities of $75.5 million in 2012 consisted primarily of cash used for capital expenditures of $72.9 million.
Cash flows provided by financing activities during
2014
consisted primarily of
$640.3 million
of proceeds from long-term debt, of which most related to the refinancing of the Senior Credit Facility in January 2014. The proceeds from long-term debt were almost entirely offset by debt pay downs of
$638.7 million
.
Cash flows used for financing activities during 2013 consisted primarily of pay downs on long-term debt and the revolving credit facility totaling $300.9 million, partially offset by proceeds from debt issuance of $343.0 million.
Cash flows used for financing activities during 2012 consisted primarily of debt pay down totaling $495.4 million, partially offset by proceeds from debt issuance of $383.3 million and proceeds from the revolving credit facility of $34.4 million.
On January 3, 2014, the company entered into the
$1,050.0 million
Third Amended and Restated Credit Agreement (the “Senior Credit Facility”) with JPMorgan Chase Bank, N.A., as Administrative Agent, Deutsche Bank Securities Inc., Bank of America, N.A., Wells Fargo Bank, National Association, and The Bank of Tokyo-Mitsubishi UFJ, Ltd., BMO Harris Bank N.A. and Rabobank Nederland, New York Branch as Documentation Agents. The Senior Credit Facility includes
three
different loan facilities. The first is a revolving facility in the amount of
$500.0 million
, with a term of
five
years. The second facility is a Term A Loan in the aggregate amount of
$350.0 million
, with a term of
five
years. The third facility is a Term B Loan in the amount of
$200.0 million
, with a term of
seven
years.
The Senior Credit Facility replaced the company’s prior
$1,250.0 million
Second Amended and Restated Credit Agreement (the “Prior Senior Credit Facility”), which was entered into on May 13, 2011. The Prior Senior Credit Facility included
three
different loan facilities. The first was a revolving facility in the amount of
$500.0 million
, with a term of
five
years. The second facility was an amortizing Term Loan A facility in the aggregate amount of
$350.0 million
with a term of
five
years. The third facility was an amortizing Term Loan B facility in the amount of
$400.0 million
with a term of
6.5
years.
Loans made under the Senior Credit Facility bear interest at
2.00%
in excess of reserve adjusted LIBOR rate, or
1.00%
in excess of an alternate base rate, at the company’s option. The company also pays a commitment fee of
0.375%
per annum on the unused portion of the revolving facility. The company is also obligated to pay certain fees and expenses of the lenders.
Including interest rate swaps at
December 31, 2014
, the weighted average interest rates for Term Loan A and Term Loan B loans were
2.95%
and
3.25%
, respectively. Excluding interest rate swaps, the interest rates on Term Loan A and Term Loan B were
2.19%
and
3.25%
, respectively, at
December 31, 2014
.
Loans made under the Senior Credit Facility are secured by substantially all of the assets of, and guaranteed by, the material direct and indirect domestic subsidiaries of the company, and secured by
65%
of the stock of certain foreign subsidiaries of Manitowoc. The Senior Credit Facility also requires the company to provide additional collateral to the lenders under the Senior Credit Facility in certain limited circumstances.
The Senior Credit Facility also includes customary representations and warranties and events of default and customary covenants, including without limitation (i) a requirement that the company prepay the term loan facilities from the net proceeds of asset sales, casualty losses, equity offerings, and new indebtedness for borrowed money, and from a portion of its excess cash flow, subject to certain exceptions; and (ii) limitations on indebtedness, capital expenditures, restricted payments, and acquisitions.
The Senior Credit Facility contains financial covenants including (a) a Consolidated Interest Coverage Ratio, which measures the ratio of (i) consolidated earnings before interest, taxes, depreciation and amortization, and other adjustments (Adjusted EBITDA), as defined in the credit agreement to (ii) consolidated cash interest expense, each for the most recent four fiscal quarters; and (b) a Consolidated Senior Secured Leverage Ratio, which measures the ratio of (i) consolidated senior secured indebtedness to (ii) consolidated EBITDA for the most recent four fiscal quarters. The covenant levels of the financial
40
covenants under the New Senior Credit Facility as of December 31, 2014, are set forth below:
|
Fiscal Quarter Ending
|
Consolidated Senior
Secured Leverage
Ratio
(less than)
|
Consolidated Interest
Coverage Ratio
(greater than)
|
||
|
December 31, 2014
|
3.25:1.00
|
2.50:1.00
|
||
|
March 31, 2015
|
3.25:1.00
|
2.75:1.00
|
||
|
June 30, 2015
|
3.25:1.00
|
2.75:1.00
|
||
|
September 30, 2015
|
3.25:1.00
|
2.75:1.00
|
||
|
December 31, 2015
|
3.25:1.00
|
2.75:1.00
|
||
|
March 31, 2016 and thereafter
|
3.00:1.00
|
3.00:1.00
|
||
As of
December 31, 2014
the company had
two
series of Senior Notes outstanding, the 2020 and 2022 Notes (collectively the “Senior Notes,” see below for a description of the 2020 and 2022 Notes). Each series of Senior Notes are unsecured senior obligations ranking subordinate to all existing senior secured indebtedness and equal to all existing senior unsecured obligations. Each series of Senior Notes is guaranteed by certain of the company’s wholly owned domestic subsidiaries, which subsidiaries also guaranty the company’s obligations under the Senior Credit Facility. Each series of Senior Notes contains affirmative and negative covenants which limit, among other things, the company’s ability to redeem or repurchase its debt, incur additional debt, make acquisitions, merge with other entities, pay dividends or distributions, repurchase capital stock, and create or become subject to liens. Each series of Senior Notes also includes customary events of default. If an event of default occurs and is continuing with respect to the Senior Notes, then the Trustee or the holders of at least
25%
of the principal amount of the outstanding Senior Notes may declare the principal and accrued interest on all of the Senior Notes to be due and payable immediately. In addition, in the case of an event of default arising from certain events of bankruptcy, all unpaid principal of, and premium, if any, and accrued and unpaid interest on all outstanding Senior Notes will become due and payable immediately.
On October 19, 2012, the company completed the sale of
$300.0 million
aggregate principal amount of its
5.875%
Senior Notes due October 2022 (the “2022 Notes”) at an issue price of
100%
. Net proceeds from the 2022 Notes were used to redeem the entire
$150.0 million
aggregate principal amount of its 2013 Notes, to repay
$36.0 million
of Term Loan B, and to repay a portion of the outstanding revolver borrowings under its Prior Senior Credit Facility. Interest on the 2022 Notes is payable semi-annually on April 15 and October 15 of each year.
The following would be the principal and premium paid by the company, expressed as percentages of the principal amount thereof, if it redeems the 2022 Notes during the 12-month period commencing on October 15 of the year set forth below:
|
Year
|
Percentage
|
||
|
2017
|
102.938
|
%
|
|
|
2018
|
101.958
|
%
|
|
|
2019
|
100.979
|
%
|
|
|
2020 and thereafter
|
100.000
|
%
|
|
In addition, at any time prior to October 15, 2015, the company is permitted to, at its option, use the net cash proceeds of one or more public equity offers to redeem up to
35%
of the 2022 Notes at a redemption price of
105.875%
, plus accrued but unpaid interest, if any, to the date of redemption; provided that (1) at least
65%
of the principal amount of the 2022 Notes outstanding remains outstanding immediately after any such redemption; and (2) the company makes such redemptions not more than
90
days after the consummation of any such public offering. Further, the company is required to offer to repurchase the 2022 Notes for cash at a price of
101%
of the aggregate principal amount of the 2022 Notes, plus accrued and unpaid interest, if any, upon the occurrence of a change of control triggering event.
On October 18, 2010, the company completed the sale of
$600.0 million
aggregate principal amount of its
8.50%
Senior Notes due 2020 (the “2020 Notes”). Interest on the 2020 Notes is payable semi-annually in May and November of each year.
41
The following would be the principal and premium paid by the company, expressed as percentages of the principal amount thereof, if it redeems the 2020 Notes during the 12-month period commencing on November 1 of the year set forth below:
|
Year
|
Percentage
|
||
|
2015
|
104.250
|
%
|
|
|
2016
|
102.833
|
%
|
|
|
2017
|
101.417
|
%
|
|
|
2018 and thereafter
|
100.000
|
%
|
|
On February 3, 2010, the company completed the sale of
$400.0 million
aggregate principal amount of its
9.50%
Senior Notes due 2018 (the “2018 Notes”). Interest on the 2018 Notes was payable semiannually in February and August of each year. On February 18, 2014 the company redeemed its 2018 Notes for
$419.0 million
or
104.750%
, expressed as a percentage of the principal amount.
As of
December 31, 2014
, the company had outstanding
$106.4 million
of other indebtedness that has a weighted-average interest rate of approximately
5.43%
. This debt includes outstanding overdraft balances and capital lease obligations in the Americas, Asia-Pacific and European regions, as well as a
$20.3 million
loan on a model 31000 crawler crane.
The aggregate scheduled maturities of outstanding debt obligations in subsequent years are as follows (in millions):
|
Year
|
|
|||
|
2015
|
$
|
80.3
|
|
|
|
2016
|
50.4
|
|
||
|
2017
|
52.0
|
|
||
|
2018
|
58.9
|
|
||
|
2019
|
194.4
|
|
||
|
Thereafter
|
1,087.5
|
|
||
|
Total
|
$
|
1,523.5
|
|
|
As of
December 31, 2014
and
December 31, 2013
, the company had outstanding
$0.0 million
and
$100.0 million
, respectively, notional amount of
3.00%
LIBOR caps related to the term loan portion of the Senior Credit Facility and Prior Senior Credit Facility, respectively, which effectively capped the company’s interest rate exposure for the notional value of its variable term debt at a
one-month LIBOR
rate of
3.00%
. The company paid various bank partners
$0.7 million
in option premium to purchase the protection on Term Loans A and B and amortized the premium to interest expense over the life of the cap protection. The caps expired in 2014.
As of
December 31, 2014
and
December 31, 2013
, the company had outstanding
$175.0 million
and
$0.0 million
, respectively, notional amount of float-to-fixed interest rate swaps outstanding related to Term Loan A under the Senior Credit Facility and Prior Senior Credit Facility, respectively, that were designated as cash flow hedges. As a result,
$175.0 million
of Term Loan A was hedged at an interest rate of
1.635%
, plus the applicable spread based on the Consolidated Total Leverage Ratio of the company as defined under the New Senior Credit Facility.
The company has been party to various fixed-to-float interest rate swaps designated as fair market value hedges of its 2018, 2020, and 2020 Notes. In the third quarter of 2012, the company monetized the derivative asset related to the fixed-to-float interest rate swaps related to its 2018 and 2020 Notes and received
$14.8 million
. The company treated the gain as an increase to the debt balances for each of the 2018 and 2020 Notes, and is being amortized to interest expense over the life of the original swaps.
In the fourth quarter of 2012, the company purchased and designated new fixed-to-float swaps as fair market value hedges of the 2022 Notes.
In May 2013, the company entered into new interest rate swaps due in 2020 and 2022, designating them as fair market value hedges of the 2020 and 2022 Notes, respectively. As of
December 31, 2014
,
$75.0 million
and
$125.0 million
of the 2020 and 2022 Notes, respectively, were swapped to floating rate interest. Including the floating rate swaps, the 2020 and 2022 Notes have an all-in interest rate of
8.31%
and
5.19%
, respectively.
As of
December 31, 2014
, the company was in compliance with all affirmative and negative covenants in its debt instruments, inclusive of the financial covenants pertaining to the Senior Credit Facility, the 2020 Notes, and 2022 Notes. Based upon
42
management’s current plans and outlook, it believes the company will be able to comply with these covenants during the subsequent 12 months. As of
December 31, 2014
our Consolidated Senior Secured Leverage Ratio was
1.79
:
1
, while the maximum ratio is
3.25
:
1
and our Consolidated Interest Coverage Ratio was
4.77
:
1
, above the minimum ratio of
2.50
:
1
.
The company defines Adjusted EBITDA as earnings before interest, taxes, depreciation, and amortization, plus certain items such as pro-forma acquisition results and the addback of certain restructuring charges, that are adjustments under the Senior Credit Facility definition.
On February 20, 2015, Manitowoc entered into Amendment No. 2 to the Third Amended and Restated Credit Agreement which reflects non-material changes to the definition of Adjusted EBITDA under the agreement. Adjusted EBITDA presented below reflects these changes, and therefore is different than Adjusted EBITDA presented in our year-ended December 31, 2014, earnings release on January 29, 2015.
The company’s trailing twelve-month Adjusted EBITDA for covenant compliance purposes as of
December 31, 2014
was
$429.0 million
. The company believes this non-GAAP measure is useful to the reader in order to understand the basis for the company’s debt covenant calculations. The reconciliation of Net income attributable to Manitowoc to Adjusted EBITDA is as follows (in millions):
|
Net income attributable to Manitowoc
|
$
|
144.5
|
|
|
|
Loss from discontinued operations
|
1.0
|
|
||
|
Loss on sale of discontinued operations
|
11.0
|
|
||
|
Depreciation and amortization
|
103.5
|
|
||
|
Interest expense and amortization of deferred financing fees
|
98.4
|
|
||
|
Costs due to early extinguishment of debt
|
25.5
|
|
||
|
Restructuring charges
|
9.0
|
|
||
|
Income taxes
|
8.6
|
|
||
|
Forgiveness of loan to Manitowoc Dong Yue
|
4.3
|
|
||
|
Pension and post-retirement
|
11.8
|
|
||
|
Stock-based compensation
|
12.6
|
|
||
|
Other
|
(1.2
|
)
|
||
|
Adjusted EBITDA
|
$
|
429.0
|
|
|
On December 15, 2014, the company amended its accounts receivable securitization facility by entering into a Fifth Amended and Restated Receivables Purchase Agreement (the “Receivables Purchase Agreement”). Pursuant to this amendment, (i) the commitment size of this facility increased from up to
$150 million
, to up to
$185 million
; and (ii) German and United Kingdom subsidiaries were added as “originators” under the facility. Trade accounts receivables sold pursuant to the Receivables Purchase Agreement totaled
$172.8 million
at
December 31, 2014
,versus
$148.9 million
at
December 31, 2013
. See Note 12, “Accounts Receivable Securitization” for further information regarding this arrangement.
We spent a total of
$84.8 million
during
2014
for capital expenditures. We continued to fund capital expenditures to improve the cost structure of our business, invest in new processes, products and technology, maintain high-quality production standards, implement our new Crane ERP system at certain of our facilities and complete certain production capacity expansions. The following table summarizes
2014
capital expenditures and depreciation by segment.
|
(in millions)
|
Capital
Expenditures
|
Depreciation
|
||||||
|
Cranes and Related Products
|
$
|
57.3
|
|
$
|
45.7
|
|
||
|
Foodservice Equipment
|
25.3
|
|
21.2
|
|
||||
|
Corporate
|
2.2
|
|
1.5
|
|
||||
|
Total
|
$
|
84.8
|
|
$
|
68.4
|
|
||
Restricted cash represents cash in escrow funds related to the security provided to third-party lenders for certain international lines of credit, for an indemnity agreement with our casualty insurance provider, and as a guarantee to a loan to Manitowoc Dong Yue.
During the years ended
December 31, 2014
and
2013
, the company sold
$17.0 million
and
$31.2 million
, respectively, of its long-term notes receivable to third party financing companies. The company guarantees some percentage, up to 100%, of
43
collection of the notes to the financing companies. The company has accounted for the sales of the notes as a financing of receivables. The receivables remain on the company’s Consolidated Balance Sheets, net of payments made, in other current and non-current assets and the company has recognized an obligation equal to the net outstanding balance of the notes in other current and non-current liabilities in the Consolidated Balance Sheets. The cash flow benefit of these transactions is reflected as financing activities in the Consolidated Statements of Cash Flows. During the years ended
December 31, 2014
and
2013
customers have paid
$17.3 million
and
$24.6 million
, respectively, of the notes to the third party financing companies. As of
December 31, 2014
and
2013
, the outstanding balance of the notes receivables guaranteed by the company was
$34.0 million
and
$34.3 million
, respectively.
Our debt position at various times increases our vulnerability to general adverse industry and economic conditions, and results in a meaningful portion of our cash flow from operations being used for payment of interest on our debt. This could potentially limit our ability to respond to market conditions or take advantage of future business opportunities. Our ability to service our debt is dependent upon many factors, some of which are not subject to our control, such as general economic, financial, competitive, legislative, and regulatory factors. In addition, our ability to borrow additional funds under the revolving credit facility in the future will depend on our meeting the financial covenants contained in the Senior Credit Facility, even after taking into account such new borrowings.
The revolving credit facility under our Senior Credit Facility, or other future facilities, may be used for working capital requirements, capital expenditures, funding future acquisitions, and other operating, investing and financing needs. We believe that our available cash, revolving credit facility, cash generated from future operations, and access to public debt and equity markets will be adequate to fund our capital and debt financing requirements for the foreseeable future.
Our liquidity positions as of
December 31, 2014
and
2013
were as follows:
|
(in millions)
|
2014
|
2013
|
||||||
|
Cash and cash equivalents
|
$
|
68.0
|
|
$
|
54.9
|
|
||
|
Revolver borrowing capacity
|
500.0
|
|
500.0
|
|
||||
|
Less: Borrowings on revolver
|
—
|
|
—
|
|
||||
|
Less: outstanding letters of credit
|
(5.4
|
)
|
(30.6
|
)
|
||||
|
Total liquidity
|
$
|
562.6
|
|
$
|
524.3
|
|
||
The revolving facility under the Senior Credit Facility has a maximum borrowing capacity of
$500.0 million
. As of
December 31, 2014
, the company had
no
outstanding borrowings on the revolving facility. During the year the highest daily borrowing was
$467.9 million
and the average borrowing was
$342.7 million
, while the average interest rate was
2.68%
. The interest rate fluctuates based upon LIBOR or a Prime rate plus a spread, which is based upon the Consolidated Total Leverage Ratio of the company. As of
December 31, 2014
, the spreads for LIBOR and Prime borrowings were
2.00%
and
1.00%
, respectively, given the effective Consolidated Total Leverage Ratio for this period.
The company has not provided for additional U.S. income taxes on approximately $652.8 million of undistributed earnings of consolidated non-U.S. subsidiaries included in stockholders’ equity. Such earnings could become taxable upon sale or liquidation of these non-U.S. subsidiaries or upon dividend repatriation of cash balances. It is not practicable to estimate the amount of the unrecognized tax liability on such earnings. At
December 31, 2014
, approximately
$37.2 million
of the company’s total cash and cash equivalents were held by its foreign subsidiaries. This cash is associated with earnings that the company has asserted are permanently reinvested. The company has no current plans to repatriate cash or cash equivalents held by its foreign subsidiaries because it plans to reinvest such cash and cash equivalents to support its operations and continued growth plans outside the United States through the funding of capital expenditures, acquisitions, research, operating expenses or other similar cash needs of these operations. Further, the company does not currently forecast a need for these funds in the United States because its U.S. operations and debt service are supported by the cash generated by its U.S. operations. During 2014, the company could no longer assert permanent reinvestment on one subsidiary and as a result, a liability was recorded in the amount of $5.4 million.
Management also considers the following regarding liquidity and capital resources to identify trends, demands, commitments, events and uncertainties that require disclosure:
A
. Our Senior Credit Facility and Senior Notes require us to comply with certain financial ratios and tests.
We were in compliance with these covenants as of
December 31, 2014
, the latest measurement date. The occurrence of any default of these covenants could result in acceleration of any outstanding balances under the Senior Credit Facility. Further, such acceleration would constitute an event of default under the indentures governing our Senior Notes, and could trigger cross default provisions in other agreements.
44
B.
Circumstances that could impair our ability to continue to engage in transactions that have been integral to historical operations or are financially or operationally essential, or that could render that activity commercially impracticable, such as the inability to maintain a specified credit rating, level of earnings, earnings per share, financial ratios, or collateral.
We do not believe that these risk factors applicable to our business are reasonably likely to impair our ability to continue to engage in our planned activities at this time.
C.
Factors specific to us and our markets that we expect to be given significant weight in the determination of our credit rating or will otherwise affect our ability to raise short-term and long-term financing
. We do not presently believe that events covered by these risk factors applicable to our business could materially affect our credit ratings or could adversely affect our ability to raise short-term or long-term financing.
D. We have disclosed information related to certain guarantees in Note 18 to our Consolidated Financial Statements.
E.
Written options on non-financial assets (for example, real estate puts).
We do not have any written options on non-financial assets.
OFF-BALANCE SHEET ARRANGEMENTS
Our disclosures concerning transactions, arrangements and other relationships with unconsolidated entities or other persons that are reasonably likely to materially affect liquidity or the availability of or requirements for capital resources are as follows:
|
•
|
We have disclosed in Note 18, “Guarantees,” to the Consolidated Financial Statements our buyback and residual value guaranty commitments.
|
|
•
|
We lease various assets under operating leases. The future estimated payments under these arrangements are disclosed in Note 21, “Leases,” to the Consolidated Financial Statements and in the table below.
|
|
•
|
We have disclosed our accounts receivable securitization arrangement in Note 12, “Accounts Receivable Securitization,” to the Consolidated Financial Statements.
|
CONTRACTUAL OBLIGATIONS AND COMMERCIAL COMMITMENTS
A summary of our significant contractual obligations as of
December 31, 2014
is as follows:
|
(in millions)
|
Total
Committed
|
2015
|
2016
|
2017
|
2018
|
2019
|
Thereafter
|
|||||||||||||||||||||
|
Debt (including capital lease obligations)
|
$
|
1,523.5
|
|
$
|
80.3
|
|
$
|
50.4
|
|
$
|
52.0
|
|
$
|
58.9
|
|
$
|
194.4
|
|
$
|
1,087.5
|
|
|||||||
|
Interest on long-term debt (including capital lease obligations)
|
553.6
|
|
92.3
|
|
74.1
|
|
73.5
|
|
71.3
|
|
62.6
|
|
179.8
|
|
||||||||||||||
|
Operating leases
|
154.4
|
|
42.4
|
|
33.5
|
|
23.3
|
|
17.0
|
|
14.9
|
|
23.3
|
|
||||||||||||||
|
Purchase obligations
|
283.8
|
|
283.3
|
|
0.3
|
|
0.1
|
|
0.1
|
|
—
|
|
—
|
|
||||||||||||||
|
Total committed
|
$
|
2,515.3
|
|
$
|
498.3
|
|
$
|
158.3
|
|
$
|
148.9
|
|
$
|
147.3
|
|
$
|
271.9
|
|
$
|
1,290.6
|
|
|||||||
|
•
|
Unrecognized tax benefits totaling
$33.3 million
as of
December 31, 2014
, excluding related interests and penalties, are not included in the table because the timing of their resolution cannot be estimated. See Note 13, “Income Taxes,” to the Consolidated Financial Statements for disclosures surrounding uncertain income tax positions under ASC Topic 740.
|
At
December 31, 2014
, we had outstanding letters of credit that totaled
$5.4 million
. We also had buyback commitments and residual value guarantees with a balance outstanding of
$58.9 million
as of
December 31, 2014
. This amount is not reduced for amounts the company would recover from the repossession and subsequent resale of collateral.
We maintain defined benefit pension plans for some of our operations in the United States, Europe and Asia. The company has established the Retirement Plan Committee to manage the operations and administration of all benefit plans and related trusts. As of December 31, 2010, all of the remaining United States defined benefit plans were merged into a single plan: the Manitowoc U.S. Pension Plan. All merged plans had benefit accruals frozen prior to the merger.
45
In
2014
, cash contributions by us to all pension plans were
$10.3 million
, and we estimate that our pension plan contributions will be approximately
$10.5 million
in 2015.
Financial Risk Management
We are exposed to market risks from changes in interest rates, commodities, and changes in foreign currency exchange rates. To reduce these risks, we selectively use derivative financial instruments and other proactive management techniques. We have written policies and procedures that place financial instruments under the direction of corporate finance and restrict all derivative transactions to those intended for hedging purposes. The use of financial instruments for trading purposes or speculation is strictly prohibited.
For a more detailed discussion of our accounting policies and the financial instruments that we use, please refer to Note 2, “Summary of Significant Accounting Policies,” and Note 11, “Debt,” to the Consolidated Financial Statements.
Interest Rate Risk
We are exposed to fluctuating interest rates for our debt. We have established programs to mitigate exposure to these fluctuations. The company is a party to various interest rate swaps in connection with the Senior Credit Facility and the Senior Notes. On January 3, 2014, the company entered into the Senior Credit Facility, which included a
$500.0 million
revolver, a
$350.0 million
Term Loan A, and a
$200.0 million
Term Loan B.
Prior to expiration in December 2014, the company had interest rate cap derivative instruments which effectively capped the company’s interest rate exposure for notional value of its variable term debt at a one-month U.S. LIBOR rate of 3.00% plus the applicable spread per the Senior Credit Facility. As of
December 31, 2014
, the interest rate cap agreements had expired.
As of
December 31, 2014
, the company had outstanding
$175.0 million
notional amount of float-to-fixed interest rate swaps outstanding related to Term Loan A under the Senior Credit Facility that were designated as cash flow hedges. As a result,
$175.0 million
of Term Loan A was hedged at an interest rate of
1.635%
, plus the applicable spread based on the Consolidated Total Leverage Ratio of the company as defined under the New Senior Credit Facility.
As of
December 31, 2014
, total notional swapped from fixed-to-floating rate debt was
$75.0 million
and
$125.0 million
for the 2020 and 2022 Notes, respectively. The variable rate of interest on the 2020 fixed-to-float interest rate swaps was
6.96%
and the 2022 fixed-to-float interest rate swaps was
4.22%
at
December 31, 2014
.
A 10% increase or decrease in the average cost of the company’s variable rate debt would result in an immaterial change in interest expense for the year ended
December 31, 2014
.
Commodity Prices
We are exposed to fluctuating market prices for commodities, including steel, copper, aluminum, and petroleum-based products. Each of our business segments is subject to the effect of changing raw material costs caused by movements in underlying commodity prices. We have established programs to manage the negotiations of commodity prices. Some of these programs are centralized across business segments, and others are specific to a business segment or business unit. In addition to the regular negotiations of material prices with certain vendors, we routinely enter into certain commodity hedges that fix the price of certain of our key commodities utilized in the production of our Foodservice and Crane product offerings. Commodities that are hedged include copper, aluminum, certain steel inputs and natural gas. At
December 31, 2014
,
$0.6 million
(net of tax of
$0.4 million
) of unrealized
losses
due to commodity hedging positions remain deferred in accumulated other comprehensive income and will be realized as a component of cost of sales over the next 12 months.
Currency Risk
We have manufacturing, sales and distribution facilities around the world and thus make investments and enter into transactions denominated in various foreign currencies. International sales, including those sales that originated outside of the United States, were approximately 49% of our total sales for
2014
, with the largest percentage (21%) being sales into various European countries.
Regarding transactional foreign exchange risk, we enter into limited forward exchange contracts to 1) reduce the impact of changes in foreign currency rates between a budgeted rate and the rate realized at the time we recognize a particular purchase or sale transaction and 2) reduce the earnings and cash flow impact on nonfunctional currency denominated receivables and payables. Gains and losses resulting from hedging instruments either impact our Consolidated Statements of Operations in the period of the underlying purchase or sale transaction, or offset the foreign exchange gains and losses on the underlying
46
receivables and payables being hedged. The maturities of these forward exchange contracts coincide with either the underlying transaction date or the settlement date of the related cash inflow or outflow. The hedges of anticipated transactions are designated as cash flow hedges under the guidance of Accounting Standards Codification (“ASC”) Topic 815-10, “Derivatives and Hedging.” At
December 31, 2014
, we had outstanding forward exchange contracts hedging anticipated transactions and future settlements of outstanding accounts receivable and accounts payable with a market value of a
$3.6 million
(net of tax of
$2.2 million
) of unrealized
losses
. A 10% appreciation or depreciation of the underlying functional currency at
December 31, 2014
for non-designated hedges of foreign exchange contracts would not have a significant impact on our Consolidated Statements of Operations as any gains or losses under the foreign exchange contracts hedging accounts receivable or payable balances would be offset by equal gains or losses on the underlying receivables or payables. A 10% appreciation or depreciation of the underlying functional currency at
December 31, 2014
for foreign exchange contracts designated as cash flow hedges could have an impact of approximately $4.0 million on the date of settlement.
Amounts invested in non-U.S. based subsidiaries are translated into U.S. dollars at the exchange rate in effect at year-end. Results of operations are translated into U.S. dollars at an average exchange rate for the period. The resulting translation adjustments are recorded in stockholders’ equity as cumulative translation adjustments. The translation adjustment recorded in accumulated other comprehensive loss at
December 31, 2014
was a loss of
$29.2 million
.
Environmental, Health, Safety, and Other Matters
Please refer to Part II, Item 8, Note 17, “Contingencies and Significant Estimates,” where we have disclosed our environmental, health, safety, contingencies and other matters.
Critical Accounting Policies
The Consolidated Financial Statements include the accounts of the company and all its subsidiaries. The preparation of financial statements in conformity with accounting principles generally accepted in the United States of America (“U.S. GAAP”) requires us to make estimates and assumptions in certain circumstances that affect amounts reported in the accompanying Consolidated Financial Statements and related footnotes. In preparing these Consolidated Financial Statements, we have made our best estimates and judgments of certain amounts included in the Consolidated Financial Statements giving due consideration to materiality. However, application of these accounting policies involves the exercise of judgment and use of assumptions as to future uncertainties and, as a result, actual results could differ from these estimates. Although we have listed a number of accounting policies below which we believe to be most critical, we also believe that all of our accounting policies are important to the reader. Therefore, please refer also to the Notes to the Consolidated Financial Statements for more detailed description of these and other accounting policies of the company.
Revenue Recognition
- Revenue is generally recognized and earned when all the following criteria are satisfied with regard to a specific transaction: persuasive evidence of an arrangement exists, the price is fixed and determinable, collectability of cash is reasonably assured, and delivery has occurred or services have been rendered. We periodically enter into transactions with customers that provide for residual value guarantees and buyback commitments. These transactions are recorded as operating leases for all significant residual value guarantees and for all buyback commitments. These initial transactions are recorded as deferred revenue and are amortized to income on a straight-line basis over a period equal to that of the customer’s third-party financing agreement. In addition, we lease cranes to customers under operating lease terms. Revenue from operating leases is recognized ratably over the term of the lease, and leased cranes are depreciated over their estimated useful lives.
Allowance for Doubtful Accounts
- Accounts receivable are reduced by an allowance for amounts that may become uncollectible in the future. Our estimate for the allowance for doubtful accounts related to trade receivables includes evaluation of specific accounts where we have information that the customer may have an inability to meet its financial obligations together with a general provision for unknown but existing doubtful accounts based on historical experience, which are subject to change if experience improves or deteriorates.
Inventories and Related Reserve for Obsolete and Excess Inventory
- Inventories are valued at the lower of cost or market using both the first-in, first-out (FIFO) method and the last-in, first-out (LIFO) method and are reduced by a reserve for excess and obsolete inventories. The estimated reserve is based upon specific identification of excess or obsolete inventories based on historical usage, estimated future usage, sales requiring the inventory, and on historical write-off experience and are subject to change if experience improves or deteriorates.
Goodwill, Other Intangible Assets and Other Long-Lived Assets
- The company accounts for goodwill and other intangible assets under the guidance of ASC Topic 350-10, “Intangibles - Goodwill and Other.” Under ASC Topic 350-10, goodwill is not
47
amortized; however, the company performs an annual impairment review at June 30 of every year or more frequently if events or changes in circumstances indicate that the asset might be impaired. The company performs impairment reviews for its reporting units, which have been determined to be: the Cranes operating segment; Foodservice Americas; Foodservice Europe, Middle East, and Africa; and Foodservice Asia. Prior to the third quarter 2014, when the Cranes segment completed its reorganization of the Cranes operating and financial consolidation structure from geographic to product line reporting, the reporting units for the Cranes segment were Cranes Americas; Cranes Europe, Middle East, and Africa; Cranes China; Cranes Greater Asia Pacific; and Crane Care. To perform its impairment review, the company uses a fair-value method, primarily the income approach, based on the present value of future cash flows, which involves management’s judgments and assumptions about the amounts of those cash flows and the discount rates used. The estimated fair value is then compared with the carrying amount of the reporting unit, including recorded goodwill. Goodwill and other intangible assets are then subject to risk of write-down to the extent that the carrying amount exceeds the estimated fair value.
The company will continue to monitor market conditions and determine if any additional interim reviews of goodwill, other intangibles or long-lived assets are warranted. Deterioration in the market or actual results as compared with the company’s projections may ultimately result in a future impairment. In the event the company determines that assets are impaired in the future, the company would need to recognize a non-cash impairment charge, which could have a material adverse effect on the company’s consolidated balance sheet and results of operations.
The company also reviews long-lived assets for impairment whenever events or changes in circumstances indicate that the assets carrying amount may not be recoverable. The company conducts its long-lived asset impairment analyses in accordance with ASC Topic 360-10-5, “Property, Plant, and Equipment.” ASC Topic 360-10-5 requires the company to group assets and liabilities at the lowest level for which identifiable cash flows are largely independent of the cash flows of other assets and liabilities and to evaluate the asset group against the sum of the undiscounted future cash flows.
Other intangible assets with definite lives continue to be amortized over their estimated useful lives. Indefinite and definite lived intangible assets are also subject to impairment testing. Indefinite lived assets are tested annually, or more frequently if events or changes in circumstances indicate that the assets might be impaired. Definite lived intangible assets are tested whenever events or circumstances indicate that the carrying value of the assets may not be recoverable. A considerable amount of management judgment and assumptions are required in performing the impairment tests, principally in determining the fair value of the assets. While the company believes its judgments and assumptions were reasonable, different assumptions could change the estimated fair values and, therefore, impairment charges could be required.
Employee Benefit Plans
- We provide a range of benefits to our employees and retired employees, including pensions and postretirement health care coverage. Plan assets and obligations are recorded annually based on the company’s measurement date utilizing various actuarial assumptions such as discount rates, expected return on plan assets, compensation increases, retirement and mortality rates, and health care cost trend rates as of that date. The approach we use to determine the annual assumptions are as follows:
|
•
|
Discount Rate -
Our discount rate assumptions are based on the interest rate of noncallable high-quality corporate bonds, with appropriate consideration of our pension plans’ participants’ demographics and benefit payment terms.
|
|
•
|
Expected Return on Plan Assets
- Our expected return on plan assets assumptions are based on our expectation of the long-term average rate of return on assets in the pension funds, which is reflective of the current and projected asset mix of the funds and considers the historical returns earned on the funds.
|
|
•
|
Compensation increase -
Our compensation increase assumptions reflect our long-term actual experience, the near-term outlook and assumed inflation
|
|
•
|
Retirement and Mortality Rates -
Our retirement and mortality rate assumptions are based primarily on actual plan experience and mortality tables.
|
|
•
|
Health Care Cost Trend Rates -
Our health care cost trend rate assumptions are developed based on historical cost data, near-term outlook and an assessment of likely long-term trends
|
Measurements of net periodic benefit cost are based on the assumptions used for the previous year-end measurements of assets and obligations. We review our actuarial assumptions on an annual basis and make modifications to the assumptions when appropriate. As required by U.S. GAAP, the effects of the modifications are recorded currently or amortized over future periods. We have developed the assumptions with the assistance of our independent actuaries and other relevant sources, and we believe that the assumptions used are reasonable; however, changes in these assumptions could impact the company’s financial position, results of operations or cash flows. Refer to Note 20, “Employee Benefit Plans,” for a summary of the
48
impact of a 0.50% change in the discount rate and rate of return on plan assets and a 1% change on health care trend rates would have on our financial statements.
Product Liability
- We are subject in the normal course of business to product liability lawsuits. To the extent permitted under applicable laws, our exposure to losses from these lawsuits is mitigated by insurance with self-insurance retention limits. We record product liability reserves for our self-insured portion of any pending or threatened product liability actions. Our reserve is based upon two estimates. First, we track the population of all outstanding pending and threatened product liability cases to determine an appropriate case reserve for each based upon our best judgment and the advice of legal counsel. These estimates are continually evaluated and adjusted based upon changes to the facts and circumstances surrounding the case. Second, we determine the amount of additional reserve required to cover incurred but not reported product liability issues and to account for possible adverse development of the established case reserves (collectively referred to as IBNR). This analysis is performed at least twice annually. We have established a position within the actuarially determined range, which we believe is the best estimate of the IBNR liability.
Income Taxes
- We account for income taxes under the guidance of ASC Topic 740-10, “Income Taxes.” Deferred tax assets and liabilities are recognized for the future tax consequences attributable to differences between financial statement carrying amounts of existing assets and liabilities and their respective tax bases and operating loss and tax credit carryforwards. Deferred tax assets and liabilities are measured using enacted tax rates expected to apply to taxable income in the years in which those temporary differences are expected to be recovered or settled. We record a valuation allowance that represents a reserve on deferred tax assets for which utilization is not more likely than not. Management judgment is required in determining our provision for income taxes, deferred tax assets and liabilities, and the valuation allowance recorded against our net deferred tax assets. We do not currently provide for additional United States and foreign income taxes which would become payable upon repatriation of undistributed earnings of foreign subsidiaries.
We measure and record income tax contingency accruals under the guidance of ASC Topic 740-10. We recognize liabilities for uncertain income tax positions based on a two-step process. The first step is to evaluate the tax position for recognition by determining if the weight of available evidence indicates that it is more likely than not that the position will be sustained on audit, including resolution of related appeals or litigation processes, if any. The second step requires us to estimate and measure the tax benefit as the largest amount that is more than 50% likely to be realized upon ultimate settlement. It is inherently difficult and subjective to estimate such amounts, as we must determine the probability of various possible outcomes. We reevaluate these uncertain tax positions on a quarterly basis or when new information becomes available to management. These reevaluations are based on factors including, but not limited to, changes in facts or circumstances, changes in tax law, successfully settled issues under audit, expirations due to statutes, and new audit activity. Such a change in recognition or measurement could result in the recognition of a tax benefit or an increase to the tax accrual.
Stock-Based Compensation
- The computation of the expense associated with stock-based compensation requires the use of certain valuation models and based on projected achievement of underlying performance criteria for performance shares. We currently use a Black-Scholes option pricing model to calculate the fair value of our stock options and Monte Carlo analysis to calculate the total shareholder return portion of performance shares. The Black-Scholes and Monte Carlo models require assumptions regarding the volatility of the company’s stock, the expected life of the stock award and the company’s dividend ratio. We primarily use historical data to determine the assumptions to be used in the Black-Scholes model and have no reason to believe that future data is likely to differ materially from historical data. However, changes in the assumptions to reflect future stock price volatility, future dividend payments and future stock award exercise experience could result in a change in the assumptions used to value awards in the future and may result in a material change to the fair value calculation of stock-based awards.
Warranties
- In the normal course of business, we provide our customers warranties covering workmanship, and in some cases materials, on products manufactured by us. Such warranties generally provide that products will be free from defects for periods ranging from 12 months to 60 months with certain equipment having longer-term warranties. If a product fails to comply with our warranty, we may be obligated, at our expense, to correct any defect by repairing or replacing such defective product. We provide for an estimate of costs that may be incurred under our warranty at the time product revenue is recognized based on historical warranty experience for the related product or estimates of projected losses due to specific warranty issues on new products. These costs primarily include labor and materials, as necessary, associated with repair or replacement. The primary factors that affect our warranty liability include the number of shipped units and historical and anticipated rates or warranty claims. As these factors are impacted by actual experience and future expectations, we assess the adequacy of our recorded warranty liability and adjust the amounts as necessary.
49
Restructuring Charges
- Restructuring charges for exit and disposal activities are recognized when the liability is incurred. The company accounts for restructuring charges under the guidance of ASC Topic 420-10, “Exit or Disposal Cost Obligations.” The liability for the restructuring charge associated with an exit or disposal activity is measured initially at its fair value.
Recent Accounting Changes and Pronouncements
In January 2015, the FASB issued Accounting Standards Update (“ASU”) No. 2015-01, “Income Statement—Extraordinary and Unusual Items.” This update eliminates from GAAP the concept of extraordinary items. ASU 2015-01 is effective for the first interim period within fiscal years beginning after December 15, 2015, with early adoption permitted provided that the guidance is applied from the beginning of the fiscal year of adoption. A reporting entity may apply the amendments prospectively or retrospectively to all prior periods presented in the financial statements. We believe the adoption of this ASU will not have a material impact on the company’s consolidated financial statements.
In August 2014, the FASB issued ASU No. 2014-15, “Presentation of Financial Statements - Going Concern.” This update provided guidance on management’s responsibility in evaluating whether there is substantial doubt about a company’s ability to continue as a going concern and to provide related footnote disclosures. ASU 2014-15 is effective in the first annual period ending after December 15, 2016, with early adoption permitted. We believe the adoption of this ASU will not have a material impact on the company’s consolidated financial statements.
In May 2014, the FASB issued ASU No. 2014-09, “Revenue from Contracts with Customers.” This update provided a principles-based approach to revenue recognition, requiring revenue recognition to depict the transfer of goods or services to customers in an amount that reflects the consideration to which the entity expects to be entitled in exchange for those goods or services. The ASU provides a five-step model to be applied to all contracts with customers. The five steps are to identify the contract(s) with the customer, identify the performance obligations in the contact, determine the transaction price, allocate the transaction price to the performance obligations in the contract and recognize revenue when each performance obligation is satisfied. The revenue standard is effective for the first interim period within fiscal years beginning after December 15, 2016, and can be applied either retrospectively to each prior reporting period presented or retrospectively with the cumulative effect of initially applying the update recognized at the date of initial application along with additional disclosures. The company is evaluating the impact, if any, the adoption of this ASU will have on the company’s consolidated financial statements.
In April 2014, the FASB issued ASU No. 2014-08, “Presentation of Financial Statements and Property, Plant, and Equipment: Reporting Discontinued Operations and Disclosures of Disposals of Components of an Entity.” This ASU changes the requirements for reporting discontinued operations in Accounting Standard Codification Subtopic 205-20, and requires a disposal of a component of an entity or a group of components of an entity to be reported in discontinued operations only if the disposal represents a strategic shift that has (or will have) a major effect on an entity’s operations and financial results. There will also be additional disclosures required. The amendments in this ASU are effective prospectively for fiscal years (and interim reporting periods within those years) beginning after December 15, 2014, with early adoption permitted. The significance of this guidance for the company is dependent on any future disposals.
In July 2013, the FASB issued ASU No. 2013-11, “Presentation of an Unrecognized Tax Benefit When a Net Operating Loss Carryforward, a Similar Tax Loss, or a Tax Credit Carryforward Exists.” This new standard generally requires the netting of unrecognized tax benefits (UTBs) against a deferred tax asset for a loss or other carryforward that would apply in settlement of the uncertain tax positions. Under the new standard, UTBs will be netted against all available same-jurisdiction loss or other tax carryforwards that would be utilized, rather than only against carryforwards that are created by the UTBs. The amendments in this ASU are effective prospectively for fiscal years (and interim reporting periods within those years) beginning after December 15, 2013. The adoption of this ASU did not have a material impact on the company’s consolidated financial statements.
In March 2013, the FASB issued ASU No. 2013-05, “Parent’s Accounting for the Cumulative Translation Adjustment upon Derecognition of Certain Subsidiaries or Groups of Assets within a Foreign Entity or of an Investment in a Foreign Entity.” This ASU changes a parent entity’s accounting for the cumulative translation adjustment upon derecognition of certain subsidiaries or groups of assets within a foreign entity or of an investment in a foreign entity. A parent entity is required to release any related cumulative foreign currency translation adjustment from accumulated other comprehensive income into net income in the following circumstances: (i) a parent entity ceases to have a controlling financial interest in a subsidiary or group of assets that is a business within a foreign entity if the sale or transfer results in the complete or substantially complete liquidation of the foreign entity in which the subsidiary or group of assets had resided; (ii) a partial sale of an equity method investment that is a foreign entity; (iii) a partial sale of an equity method investment that is not a foreign entity whereby the partial sale represents a complete or substantially complete liquidation of the foreign entity that held the equity method investment; and (iv) the sale of an investment in a foreign entity. The amendments in this ASU are effective prospectively for
50
fiscal years (and interim reporting periods within those years) beginning after December 15, 2013. The adoption of this ASU did not have a material impact on the company’s consolidated financial statements.
Cautionary Statements about Forward-Looking Information
Statements in this report and in other company communications that are not historical facts are forward-looking statements, which are based upon our current expectations, within the meaning of the Private Securities Litigation Reform Act of 1995.
These statements involve risks and uncertainties that could cause actual results to differ materially from what appears within this quarterly report.
Forward-looking statements include descriptions of plans and objectives for future operations, and the assumptions behind those plans. The words “anticipates,” “believes,” “intends,” “estimates,” “targets” and “expects,” or similar expressions, usually identify forward-looking statements. Any and all projections of future performance are forward-looking statements.
In addition to the assumptions, uncertainties, and other information referred to specifically in the forward-looking statements, a number of factors relating to each business segment could cause actual results to be significantly different from what is presented in this quarterly report. Those factors include, without limitation, the following:
Crane-cyclicality of the construction industry; the effects of government spending on construction-related projects throughout the world; unanticipated changes in global demand for high-capacity lifting equipment; changes in demand for lifting equipment in emerging economies; the replacement cycle of technologically obsolete cranes; crude oil prices; and demand for used equipment.
Foodservice-weather; global expansion of customers; commercial ice-cube machine and other foodservice equipment replacement cycles in the United States and other mature markets; unanticipated issues associated with refresh/renovation plans by national restaurant accounts and global chains; growth in demand for foodservice equipment by customers in emerging markets; and demand for quick service restaurants (QSR) chains and kiosks.
Corporate (including factors that may affect both of our segments)-possible negative effects on the company's business operations, assets, or financial results as a result of the planned separation of the company into two independent publicly-traded companies; changes in laws and regulations, as well as their enforcement, throughout the world; the ability to complete and appropriately integrate, and/or transition, restructure and consolidate acquisitions, divestitures, strategic alliances, joint ventures and other strategic alternatives; in connection with acquisitions, divestitures, strategic alliances and joint ventures, the finalization of the price and other terms, the realization of contingencies consistent with any established reserves, and unanticipated issues associated with transitional services; realization of anticipated earnings enhancements, cost savings, strategic options and other synergies, and the anticipated timing to realize those savings, synergies, and options; the successful development of innovative products and market acceptance of new and innovative products; the ability to focus and capitalize on product quality and reliability; issues relating to the ability to timely and efficiently execute on manufacturing strategies, including issues relating to new plant start-ups, plant closings, and/or consolidations of existing facilities and operations; efficiencies and capacity utilization of facilities; actions of competitors, including competitive pricing; availability of certain raw materials; changes in raw materials and commodity prices; unexpected issues associated with the quality of materials and components sourced from third parties and resolution of those issues; matters impacting the successful and timely implementation of ERP systems; changes in domestic and international economic and industry conditions, including steel industry conditions; changes in the markets we serve; unexpected issues associated with the availability of local suppliers and skilled labor; changes in the interest rate environment; unanticipated changes in capital and financial markets; risks associated with growth; foreign currency fluctuations and their impact on reported results and hedges in place; world-wide political risk; geographic factors and economic risks; pressure of financing leverage; unanticipated changes in revenue, margins, costs and capital expenditures; work stoppages, labor negotiations, rates and temporary labor; issues associated with workforce reductions and subsequent ramp-up; growth of general and administrative expenses, including health care and postretirement costs (resulting from, among other matters, U.S. health care legislation and reforms; unanticipated changes in consumer spending; the ability of our customers to obtain financing; the state of financial and credit markets; the ability to generate cash and manage working capital consistent with our stated goals; non-compliance with debt covenants; unexpected issues affecting the effective tax rate for the year;
unanticipated issues associated with the resolution or settlement of uncertain tax positions; unfavorable resolution of tax audits;
unanticipated changes in customer demand; the ability to increase operational efficiencies across each of the company’s business segments and capitalize on those efficiencies; the ability to capitalize on key strategic opportunities; actions of activist shareholders; risks associated with data security and technological systems and protections; natural disasters disrupting commerce in one or more regions of the world; acts of terrorism; government approval and funding of projects; and other events outside our control.
51
See Liquidity and Capital Resources, and Risk Management in Management’s Discussion and Analysis of Financial Condition and Results of Operations for a description of the quantitative and qualitative disclosure about market risk.
52
Index to Consolidated Financial Statements and Financial Statement Schedule:
|
Financial Statements:
|
||
|
|
|
|
|
|
||
|
|
|
|
|
|
||
|
|
|
|
|
|
||
|
|
|
|
|
|
||
|
|
|
|
|
|
||
|
|
|
|
|
|
||
|
|
|
|
|
Financial Statement Schedule:
|
||
|
|
|
|
|
|
||
All other schedules are omitted because they are not applicable or the required information is shown in the financial statements or notes thereto.
53
Report of Independent Registered Public Accounting Firm
To the Stockholders and Board of Directors of The Manitowoc Company, Inc.:
In our opinion, the consolidated financial statements listed in the accompanying index present fairly, in all material respects, the financial position of The Manitowoc Company, Inc. and its subsidiaries at December 31, 2014 and 2013, and the results of their operations and cash flows for each of the three years in the period ended December 31, 2014 in conformity with accounting principles generally accepted in the United States of America. In addition, in our opinion, the financial statement schedule listed in the accompanying index presents fairly, in all material respects, the information set forth therein when read in conjunction with the related consolidated financial statements. Also in our opinion, the Company maintained, in all material respects, effective internal control over financial reporting as of December 31, 2014, based on criteria established in Internal Control - Integrated Framework (2013) issued by the Committee of Sponsoring Organizations of the Treadway Commission (COSO). The Company’s management is responsible for these financial statements and financial statement schedule, for maintaining effective internal control over financial reporting and for its assessment of the effectiveness of internal control over financial reporting, included in Management’s Report on Internal Control over Financial Reporting appearing under Item 9A. Our responsibility is to express opinions on these financial statements, on the financial statement schedule, and on the Company’s internal control over financial reporting based on our integrated audits. We conducted our audits in accordance with the standards of the Public Company Accounting Oversight Board (United States). Those standards require that we plan and perform the audits to obtain reasonable assurance about whether the financial statements are free of material misstatement and whether effective internal control over financial reporting was maintained in all material respects. Our audits of the financial statements included examining, on a test basis, evidence supporting the amounts and disclosures in the financial statements, assessing the accounting principles used and significant estimates made by management, and evaluating the overall financial statement presentation. Our audit of internal control over financial reporting included obtaining an understanding of internal control over financial reporting, assessing the risk that a material weakness exists, and testing and evaluating the design and operating effectiveness of internal control based on the assessed risk. Our audits also included performing such other procedures as we considered necessary in the circumstances. We believe that our audits provide a reasonable basis for our opinions.
A company’s internal control over financial reporting is a process designed to provide reasonable assurance regarding the reliability of financial reporting and the preparation of financial statements for external purposes in accordance with generally accepted accounting principles. A company’s internal control over financial reporting includes those policies and procedures that (i) pertain to the maintenance of records that, in reasonable detail, accurately and fairly reflect the transactions and dispositions of the assets of the company; (ii) provide reasonable assurance that transactions are recorded as necessary to permit preparation of financial statements in accordance with generally accepted accounting principles, and that receipts and expenditures of the company are being made only in accordance with authorizations of management and directors of the company; and (iii) provide reasonable assurance regarding prevention or timely detection of unauthorized acquisition, use, or disposition of the company’s assets that could have a material effect on the financial statements.
Because of its inherent limitations, internal control over financial reporting may not prevent or detect misstatements. Also, projections of any evaluation of effectiveness to future periods are subject to the risk that controls may become inadequate because of changes in conditions, or that the degree of compliance with the policies or procedures may deteriorate.
|
/s/ PricewaterhouseCoopers LLP
|
|
|
Milwaukee, Wisconsin
|
|
|
February 20, 2015
|
|
54
The Manitowoc Company, Inc.
For the years ended December 31, 2014, 2013 and 2012
|
Millions of dollars, except per share data
|
2014
|
2013
|
2012
|
||||||||
|
Operations
|
|
|
|
||||||||
|
Net sales
|
$
|
3,886.5
|
|
$
|
4,048.1
|
|
$
|
3,913.3
|
|
||
|
Costs and expenses:
|
|
|
|
|
|
|
|||||
|
Cost of sales
|
2,900.4
|
|
3,026.3
|
|
2,970.3
|
|
|||||
|
Engineering, selling and administrative expenses
|
641.6
|
|
617.6
|
|
597.6
|
|
|||||
|
Asset impairment expense
|
1.1
|
|
—
|
|
—
|
|
|||||
|
Amortization expense
|
35.1
|
|
35.3
|
|
36.5
|
|
|||||
|
Restructuring expense
|
9.0
|
|
4.8
|
|
9.5
|
|
|||||
|
Other expense (income)
|
0.5
|
|
(0.3
|
)
|
2.5
|
|
|||||
|
Total costs and expenses
|
3,587.7
|
|
3,683.7
|
|
3,616.4
|
|
|||||
|
Operating earnings from continuing operations
|
298.8
|
|
364.4
|
|
296.9
|
|
|||||
|
Other (expenses) income:
|
|
|
|
|
|
|
|||||
|
Interest expense
|
(94.0
|
)
|
(128.4
|
)
|
(135.6
|
)
|
|||||
|
Amortization of deferred financing fees
|
(4.4
|
)
|
(7.0
|
)
|
(8.2
|
)
|
|||||
|
Loss on debt extinguishment
|
(25.5
|
)
|
(3.0
|
)
|
(6.3
|
)
|
|||||
|
Other (expense) income -net
|
(5.5
|
)
|
(0.8
|
)
|
0.1
|
|
|||||
|
Total other expenses
|
(129.4
|
)
|
(139.2
|
)
|
(150.0
|
)
|
|||||
|
Earnings from continuing operations before taxes on earnings
|
169.4
|
|
225.2
|
|
146.9
|
|
|||||
|
Provision for taxes on earnings
|
8.6
|
|
36.1
|
|
38.0
|
|
|||||
|
Earnings from continuing operations
|
160.8
|
|
189.1
|
|
108.9
|
|
|||||
|
Discontinued operations:
|
|
|
|
|
|
|
|||||
|
Loss from discontinued operations, net of income taxes of $(0.3), $(1.8) and $0.2, respectively
|
(1.4
|
)
|
(18.8
|
)
|
(16.3
|
)
|
|||||
|
Loss on sale of discontinued operations, net of income taxes of $(0.6), $4.4 and $0.0, respectively
|
(11.0
|
)
|
(2.7
|
)
|
—
|
|
|||||
|
Net earnings
|
148.4
|
|
167.6
|
|
92.6
|
|
|||||
|
Less: Net earnings (loss) attributable to noncontrolling interest, net of tax
|
3.9
|
|
25.8
|
|
(9.1
|
)
|
|||||
|
Net earnings attributable to Manitowoc
|
$
|
144.5
|
|
$
|
141.8
|
|
$
|
101.7
|
|
||
|
Amounts attributable to the Manitowoc common shareholders:
|
|
|
|
|
|
|
|||||
|
Earnings from continuing operations
|
$
|
156.5
|
|
$
|
154.8
|
|
$
|
109.7
|
|
||
|
Loss from discontinued operations, net of income taxes
|
(1.0
|
)
|
(10.3
|
)
|
(8.0
|
)
|
|||||
|
Loss on sale of discontinued operations, net of income taxes
|
(11.0
|
)
|
(2.7
|
)
|
—
|
|
|||||
|
Net earnings attributable to Manitowoc
|
$
|
144.5
|
|
$
|
141.8
|
|
$
|
101.7
|
|
||
|
Per Share Data
|
|
|
|
|
|
|
|||||
|
Basic earnings (loss) per common share:
|
|
|
|
|
|
|
|||||
|
Earnings from continuing operations attributable to Manitowoc common shareholders
|
$
|
1.16
|
|
$
|
1.16
|
|
$
|
0.83
|
|
||
|
Loss from discontinued operations attributable to Manitowoc common shareholders
|
(0.01
|
)
|
(0.08
|
)
|
(0.06
|
)
|
|||||
|
Loss on sale of discontinued operations, net of income taxes
|
(0.08
|
)
|
(0.02
|
)
|
—
|
|
|||||
|
Earnings per share attributable to Manitowoc common shareholders
|
$
|
1.07
|
|
$
|
1.07
|
|
$
|
0.77
|
|
||
|
Diluted earnings (loss) per common share:
|
|
|
|
|
|
|
|||||
|
Earnings from continuing operations attributable to Manitowoc common shareholders
|
$
|
1.14
|
|
$
|
1.14
|
|
$
|
0.82
|
|
||
|
Loss from discontinued operations attributable to Manitowoc common shareholders
|
(0.01
|
)
|
(0.08
|
)
|
(0.06
|
)
|
|||||
|
Loss on sale of discontinued operations, net of income taxes
|
(0.08
|
)
|
(0.02
|
)
|
—
|
|
|||||
|
Earnings per share attributable to Manitowoc common shareholders
|
$
|
1.05
|
|
$
|
1.05
|
|
$
|
0.76
|
|
||
The accompanying notes are an integral part of these financial statements.
55
The Manitowoc Company, Inc.
Consolidated Statements of Comprehensive Income
For the years ended December 31, 2014, 2013 and 2012
|
Millions of dollars
|
2014
|
2013
|
2012
|
|||||||||
|
Net earnings
|
$
|
148.4
|
|
$
|
167.6
|
|
$
|
92.6
|
|
|||
|
Other comprehensive (loss) income, net of tax
|
||||||||||||
|
Foreign currency translation adjustments
|
(84.0
|
)
|
4.5
|
|
8.3
|
|
||||||
|
Unrealized (loss) income on derivatives, net of income taxes of $(3.8), $0.3, and $2.6, respectively
|
(7.3
|
)
|
0.4
|
|
5.2
|
|
||||||
|
Employee pension and postretirement benefits, net of income taxes of $(13.3), $7.6, and $(0.5), respectively
|
(32.3
|
)
|
17.6
|
|
(18.1
|
)
|
||||||
|
Total other comprehensive (loss) income, net of tax
|
(123.6
|
)
|
22.5
|
|
(4.6
|
)
|
||||||
|
Comprehensive income
|
24.8
|
|
190.1
|
|
88.0
|
|
||||||
|
Comprehensive income (loss) attributable to noncontrolling interest
|
3.9
|
|
25.8
|
|
(9.1
|
)
|
||||||
|
Comprehensive income attributable to Manitowoc
|
$
|
20.9
|
|
$
|
164.3
|
|
$
|
97.1
|
|
|||
The accompanying notes are an integral part of these financial statements.
56
The Manitowoc Company, Inc.
As of December 31, 2014 and 2013
|
Millions of dollars, except shares data
|
2014
|
2013
|
||||||
|
Assets
|
|
|
|
|
||||
|
Current Assets:
|
|
|
|
|
||||
|
Cash and cash equivalents
|
$
|
68.0
|
|
$
|
54.9
|
|
||
|
Restricted cash
|
23.7
|
|
12.8
|
|
||||
|
Accounts receivable, less allowances of $19.4 and $18.2, respectively
|
227.4
|
|
255.5
|
|
||||
|
Inventories — net
|
644.5
|
|
720.8
|
|
||||
|
Deferred income taxes
|
71.3
|
|
89.9
|
|
||||
|
Other current assets
|
151.2
|
|
113.9
|
|
||||
|
Current assets of discontinued operations
|
—
|
|
15.1
|
|
||||
|
Total current assets
|
1,186.1
|
|
1,262.9
|
|
||||
|
Property, plant and equipment — net
|
591.0
|
|
578.8
|
|
||||
|
Goodwill
|
1,198.1
|
|
1,218.6
|
|
||||
|
Other intangible assets — net
|
714.7
|
|
766.2
|
|
||||
|
Other non-current assets
|
126.7
|
|
126.8
|
|
||||
|
Long-term assets of discontinued operations
|
—
|
|
23.3
|
|
||||
|
Total assets
|
$
|
3,816.6
|
|
$
|
3,976.6
|
|
||
|
Liabilities and Equity
|
|
|
|
|
||||
|
Current Liabilities:
|
|
|
|
|
||||
|
Accounts payable and accrued expenses
|
$
|
807.4
|
|
$
|
935.6
|
|
||
|
Short-term borrowings
|
80.3
|
|
22.7
|
|
||||
|
Product warranties
|
77.7
|
|
81.1
|
|
||||
|
Customer advances
|
21.3
|
|
34.9
|
|
||||
|
Product liabilities
|
24.6
|
|
25.0
|
|
||||
|
Current liabilities of discontinued operations
|
—
|
|
26.1
|
|
||||
|
Total current liabilities
|
1,011.3
|
|
1,125.4
|
|
||||
|
Non-Current Liabilities:
|
|
|
|
|
||||
|
Long-term debt
|
1,443.2
|
|
1,504.1
|
|
||||
|
Deferred income taxes
|
186.2
|
|
214.3
|
|
||||
|
Pension obligations
|
141.0
|
|
101.5
|
|
||||
|
Postretirement health and other benefit obligations
|
53.1
|
|
44.7
|
|
||||
|
Long-term deferred revenue
|
37.9
|
|
37.6
|
|
||||
|
Other non-current liabilities
|
119.8
|
|
164.5
|
|
||||
|
Long-term liabilities of discontinued operations
|
—
|
|
2.2
|
|
||||
|
Total non-current liabilities
|
1,981.2
|
|
2,068.9
|
|
||||
|
Commitments and contingencies (Note 17)
|
|
|
|
|
||||
|
Total Equity:
|
|
|
|
|
||||
|
Common stock (300,000,000 shares authorized, 163,175,928 shares issued, 135,543,869 and 133,717,057 shares outstanding, respectively)
|
1.4
|
|
1.4
|
|
||||
|
Additional paid-in capital
|
539.7
|
|
506.0
|
|
||||
|
Accumulated other comprehensive loss
|
(130.5
|
)
|
(6.9
|
)
|
||||
|
Retained earnings
|
486.9
|
|
353.2
|
|
||||
|
Treasury stock, at cost (27,632,059 and 29,458,871 shares, respectively)
|
(73.4
|
)
|
(78.2
|
)
|
||||
|
Total Manitowoc stockholders’ equity
|
824.1
|
|
775.5
|
|
||||
|
Noncontrolling interest
|
—
|
|
6.8
|
|
||||
|
Total equity
|
824.1
|
|
782.3
|
|
||||
|
Total liabilities and equity
|
$
|
3,816.6
|
|
$
|
3,976.6
|
|
||
The accompanying notes are an integral part of these financial statements.
57
The Manitowoc Company, Inc.
For the years ended December 31, 2014, 2013, and 2012
|
Millions of dollars
|
2014
|
2013
|
2012
|
||||||||
|
Cash Flows From Operations
|
|
|
|
|
|
|
|||||
|
Net earnings
|
$
|
148.4
|
|
$
|
167.6
|
|
$
|
92.6
|
|
||
|
Adjustments to reconcile net earnings to cash provided by operating activities of continuing operations:
|
|
|
|
|
|||||||
|
Asset impairments
|
1.1
|
|
—
|
|
—
|
|
|||||
|
Discontinued operations, net of income taxes
|
1.4
|
|
18.8
|
|
16.3
|
|
|||||
|
Depreciation
|
68.4
|
|
68.5
|
|
68.1
|
|
|||||
|
Amortization of intangible assets
|
35.1
|
|
35.3
|
|
36.5
|
|
|||||
|
Amortization of deferred financing fees
|
4.4
|
|
7.0
|
|
8.2
|
|
|||||
|
Deferred income taxes
|
(6.2
|
)
|
(13.4
|
)
|
(8.5
|
)
|
|||||
|
Loss on early extinguishment of debt
|
6.3
|
|
3.0
|
|
6.3
|
|
|||||
|
(Gain) loss on sale of property, plant and equipment
|
(6.5
|
)
|
3.7
|
|
3.0
|
|
|||||
|
Loss on sale of discontinued operations
|
11.0
|
|
2.7
|
|
—
|
|
|||||
|
Stock-based compensation expense and other
|
1.9
|
|
14.9
|
|
16.4
|
|
|||||
|
Changes in operating assets and liabilities, excluding the effects of business acquisitions or dispositions:
|
|
|
|
|
|
|
|||||
|
Accounts receivable
|
10.3
|
|
74.3
|
|
(35.9
|
)
|
|||||
|
Inventories
|
9.0
|
|
(22.2
|
)
|
(42.8
|
)
|
|||||
|
Other assets
|
(17.3
|
)
|
(22.6
|
)
|
(2.6
|
)
|
|||||
|
Accounts payable
|
(8.9
|
)
|
(1.6
|
)
|
29.3
|
|
|||||
|
Accrued expenses and other liabilities
|
(153.0
|
)
|
(1.9
|
)
|
(11.6
|
)
|
|||||
|
Net cash provided by operating activities of continuing operations
|
105.4
|
|
334.1
|
|
175.3
|
|
|||||
|
Net cash used for operating activities of discontinued operations
|
(7.1
|
)
|
(11.0
|
)
|
(12.9
|
)
|
|||||
|
Net cash provided by operating activities
|
98.3
|
|
323.1
|
|
162.4
|
|
|||||
|
Cash Flows From Investing
|
|
|
|
|
|
|
|||||
|
Capital expenditures
|
(84.8
|
)
|
(110.7
|
)
|
(72.9
|
)
|
|||||
|
Proceeds from sale of property, plant and equipment
|
12.8
|
|
4.1
|
|
0.8
|
|
|||||
|
Restricted cash
|
(11.6
|
)
|
(2.0
|
)
|
(3.3
|
)
|
|||||
|
Business acquisitions, net of cash acquired
|
—
|
|
(12.2
|
)
|
—
|
|
|||||
|
Proceeds from sale of business
|
—
|
|
39.2
|
|
—
|
|
|||||
|
Net cash used for investing activities of continuing operations
|
(83.6
|
)
|
(81.6
|
)
|
(75.4
|
)
|
|||||
|
Net cash used for investing activities of discontinued operations
|
—
|
|
(0.6
|
)
|
(0.1
|
)
|
|||||
|
Net cash used for investing activities
|
(83.6
|
)
|
(82.2
|
)
|
(75.5
|
)
|
|||||
|
Cash Flows From Financing
|
|
|
|
|
|
|
|||||
|
(Payments on) proceeds from revolving credit facility-net
|
—
|
|
(34.4
|
)
|
34.4
|
|
|||||
|
Proceeds from swap monetization
|
—
|
|
—
|
|
14.8
|
|
|||||
|
Payments on long-term debt
|
(638.7
|
)
|
(266.5
|
)
|
(495.4
|
)
|
|||||
|
Proceeds from long-term debt
|
640.3
|
|
43.0
|
|
383.3
|
|
|||||
|
(Payments on) proceeds from notes financing - net
|
(0.3
|
)
|
6.6
|
|
(10.4
|
)
|
|||||
|
Debt issuance costs
|
(5.2
|
)
|
(1.1
|
)
|
(5.7
|
)
|
|||||
|
Dividends paid
|
(10.8
|
)
|
(10.7
|
)
|
(10.6
|
)
|
|||||
|
Exercises of stock options including windfall tax benefits
|
25.9
|
|
6.7
|
|
6.4
|
|
|||||
|
Net cash provided by (used for) financing activities of continuing operations
|
11.2
|
|
(256.4
|
)
|
(83.2
|
)
|
|||||
|
Net cash used for financing activities of discontinued operations
|
(7.2
|
)
|
—
|
|
—
|
|
|||||
|
Net cash provided by (used for) financing activities
|
4.0
|
|
(256.4
|
)
|
(83.2
|
)
|
|||||
|
Effect of exchange rate changes on cash
|
(5.6
|
)
|
(2.8
|
)
|
1.2
|
|
|||||
|
Net increase (decrease) in cash and cash equivalents
|
13.1
|
|
(18.3
|
)
|
4.9
|
|
|||||
|
Balance at beginning of year
|
54.9
|
|
73.2
|
|
68.3
|
|
|||||
|
Balance at end of year
|
$
|
68.0
|
|
$
|
54.9
|
|
$
|
73.2
|
|
||
|
Supplemental Cash Flow Information
|
|
|
|
|
|
|
|||||
|
Interest paid
|
$
|
120.4
|
|
$
|
134.6
|
|
$
|
137.7
|
|
||
|
Income taxes paid
|
$
|
87.0
|
|
$
|
55.6
|
|
$
|
18.8
|
|
||
The accompanying notes are an integral part of these financial statements.
58
The Manitowoc Company, Inc.
Consolidated Statements of Equity
For the years ended December 31, 2014, 2013 and 2012
|
Millions of dollars, except shares data
|
2014
|
2013
|
2012
|
||||||||
|
Common Stock - Shares Outstanding
|
|
|
|
|
|
|
|||||
|
Balance at beginning of year
|
133,717,057
|
|
132,769,478
|
|
131,884,765
|
|
|||||
|
Stock options exercised
|
1,726,024
|
|
571,094
|
|
699,913
|
|
|||||
|
Restricted stock, net
|
(14,390
|
)
|
31,310
|
|
184,800
|
|
|||||
|
Performance shares issued
|
115,178
|
|
345,175
|
|
—
|
|
|||||
|
Balance at end of year
|
135,543,869
|
|
133,717,057
|
|
132,769,478
|
|
|||||
|
Common Stock - Par Value
|
|
|
|
|
|
|
|||||
|
Balance at beginning of year
|
$
|
1.4
|
|
$
|
1.4
|
|
$
|
1.4
|
|
||
|
Balance at end of year
|
$
|
1.4
|
|
$
|
1.4
|
|
$
|
1.4
|
|
||
|
Additional Paid-in Capital
|
|
|
|
|
|
|
|||||
|
Balance at beginning of year
|
$
|
506.0
|
|
$
|
486.9
|
|
$
|
466.6
|
|
||
|
Stock options exercised and issuance of other stock awards
|
13.6
|
|
2.3
|
|
2.0
|
|
|||||
|
Restricted stock awards expense
|
1.0
|
|
2.8
|
|
4.5
|
|
|||||
|
Windfall tax benefit on stock options exercised
|
7.5
|
|
1.9
|
|
1.9
|
|
|||||
|
Restricted stock units expense
|
5.9
|
|
5.8
|
|
5.2
|
|
|||||
|
Stock option expense
|
5.7
|
|
6.3
|
|
6.7
|
|
|||||
|
Balance at end of year
|
$
|
539.7
|
|
$
|
506.0
|
|
$
|
486.9
|
|
||
|
Accumulated Other Comprehensive (Loss) Income
|
|
|
|
|
|
|
|||||
|
Balance at beginning of year
|
$
|
(6.9
|
)
|
$
|
(29.4
|
)
|
$
|
(24.8
|
)
|
||
|
Other comprehensive (loss) income
|
(123.6
|
)
|
22.5
|
|
(4.6
|
)
|
|||||
|
Balance at end of year
|
$
|
(130.5
|
)
|
$
|
(6.9
|
)
|
$
|
(29.4
|
)
|
||
|
Retained Earnings
|
|
|
|
|
|
|
|||||
|
Balance at beginning of year
|
$
|
353.2
|
|
$
|
222.1
|
|
$
|
131.0
|
|
||
|
Net earnings
|
144.5
|
|
141.8
|
|
101.7
|
|
|||||
|
Cash dividends
|
(10.8
|
)
|
(10.7
|
)
|
(10.6
|
)
|
|||||
|
Balance at end of year
|
$
|
486.9
|
|
$
|
353.2
|
|
$
|
222.1
|
|
||
|
Treasury Stock
|
|
|
|
|
|
|
|||||
|
Balance at beginning of year
|
$
|
(78.2
|
)
|
$
|
(80.7
|
)
|
$
|
(83.2
|
)
|
||
|
Stock options exercised and issuance of other stock awards
|
4.8
|
|
2.5
|
|
2.5
|
|
|||||
|
Balance at end of year
|
$
|
(73.4
|
)
|
$
|
(78.2
|
)
|
$
|
(80.7
|
)
|
||
|
Equity attributable to Manitowoc shareholders
|
$
|
824.1
|
|
$
|
775.5
|
|
$
|
600.3
|
|
||
|
Noncontrolling Interest
|
|
|
|
|
|
|
|||||
|
Balance at beginning of year
|
6.8
|
|
(19.0
|
)
|
(9.9
|
)
|
|||||
|
Comprehensive income (loss) attributable to noncontrolling interest
|
3.9
|
|
25.8
|
|
(9.1
|
)
|
|||||
|
Noncontrolling interest deconsolidation as result of sale
|
(10.7
|
)
|
—
|
|
—
|
|
|||||
|
Balance at end of year
|
$
|
—
|
|
$
|
6.8
|
|
$
|
(19.0
|
)
|
||
|
Total equity
|
$
|
824.1
|
|
$
|
782.3
|
|
$
|
581.3
|
|
||
The accompanying notes are an integral part of these financial statements.
59
Notes to Consolidated Financial Statements
1. Company and Basis of Presentation
Company
The Manitowoc Company, Inc. (referred to as the company, MTW, and Manitowoc) was founded in 1902. Manitowoc is a multi-industry, capital goods manufacturer operating in
two
principal markets: Cranes and Related Products (Crane) and Foodservice Equipment (Foodservice). Crane is recognized as one of the world’s leading providers of engineered lifting equipment for the global construction industry, including lattice-boom cranes, tower cranes, mobile telescopic cranes, and boom trucks. Foodservice is one of the world’s leading innovators and manufacturers of commercial foodservice equipment serving the ice, beverage, refrigeration, food-preparation, and cooking needs of restaurants, convenience stores, hotels, healthcare, and institutional applications. The company has over a 110-year tradition of providing high-quality, customer-focused products and support services to its markets.
The company’s Crane business is a global provider of engineered lift solutions, offering one of the broadest product lines of lifting equipment in our industry. Manitowoc designs, manufactures, markets, and supports a comprehensive line of lattice boom crawler cranes, mobile telescopic cranes, tower cranes, and boom trucks. The company’s Crane products are principally marketed under the Manitowoc, Grove, Potain, National, Shuttlelift, and Manitowoc Crane Care brand names and are used in a wide variety of applications, including energy and utilities, petrochemical and industrial projects, infrastructure development such as road, bridge and airport construction, and commercial and high-rise residential construction.
The company’s Foodservice business is among the world’s leading designers and manufacturers of commercial foodservice equipment. Manitowoc’s Foodservice capabilities span refrigeration, ice-making, cooking, holding, food-preparation, and beverage-dispensing technologies, and allow it to be able to equip entire commercial kitchens and serve the world’s growing demand for food prepared away from home. The company’s Foodservice products are marketed under the following brands: Cleveland, Convotherm, Dean, Delfield, Fabristeel, Frymaster, Garland, Inducs, Koolaire, Kolpak, Kysor Panel Systems, Lincoln, Manitowoc Ice, Merco, Merrychef, Multiplex, Servend, and U.S. Range, and all are supported by Manitowoc KitchenCare.
During the fourth quarter of 2013, the company agreed to sell its
50%
interest in Manitowoc Dong Yue Heavy Machinery Co., Ltd. (“Manitowoc Dong Yue” or the “joint venture”), a consolidated entity, which produces mobile and truck-mounted hydraulic cranes in China, to its joint venture partner, Tai’an Taishan Heavy Industry Investment Co., Ltd., for a nominal amount. Consequently, the joint venture has been classified as discontinued operations in the company’s financial statements. The transaction subsequently closed on January 21, 2014. See Note 4, “Discontinued Operations,” for further details of this transaction.
During the fourth quarter of 2012, the company decided to divest its warewashing equipment business, which operated under the brand name Jackson, and classified this business as discontinued operations in the company’s financial statements. On January 28, 2013, the company sold the Jackson warewashing equipment business to Hoshizaki USA Holdings, Inc. for approximately
$39.2 million
, including post-closing adjustments. Net proceeds were used to reduce ratably the then-outstanding balances of Term Loans A and B. The results of these operations have been classified as discontinued operations. See Note 4, “Discontinued Operations,” for further details of this transaction.
Basis of Presentation
The consolidated financial statements include the accounts of The Manitowoc Company, Inc. and its wholly and majority-owned subsidiaries. All significant intercompany balances and transactions have been eliminated. The preparation of financial statements in conformity with accounting principles generally accepted in the United States of America requires management to make estimates and assumptions that affect the reported amounts of assets and liabilities, disclosure of contingent assets and liabilities at the date of the financial statements, and the reported amounts of revenues and expenses during the reporting period. Actual results could differ from these estimates.
2. Summary of Significant Accounting Policies
Cash Equivalents and Restricted Cash
All short-term investments purchased with an original maturity of three months or less are considered cash equivalents. Restricted cash represents cash in escrow funds related to the security for an indemnity agreement for our casualty insurance provider as well as funds held in escrow to support certain international cash pooling programs.
Inventories
Inventories are valued at the lower of cost or market value. Approximately
84%
and
87%
of the company’s inventories at
December 31, 2014
and
2013
, respectively, were valued using the first-in, first-out (FIFO) method. The remaining inventories were valued using the last-in, first-out (LIFO) method. If the FIFO inventory valuation method had been
60
used exclusively, inventories would have increased by
$36.2 million
at both
December 31, 2014
and
2013
, respectively. Finished goods and work-in-process inventories include material, labor and manufacturing overhead costs.
Goodwill and Other Intangible Assets
The company accounts for its goodwill and other intangible assets under the guidance of ASC Topic 350-10, “Intangibles — Goodwill and Other.” Under ASC Topic 350-10, goodwill is not amortized, but it is tested for impairment annually, or more frequently, as events dictate. See additional discussion of impairment testing under “Impairment of Long-Lived Assets,” below. The company’s other intangible assets with indefinite lives, including trademarks and tradenames and in-place distributor networks, are not amortized, but are also tested for impairment annually, or more frequently, as events dictate. The company’s other intangible assets subject to amortization are tested for impairment whenever events or changes in circumstances indicate that their carrying values may not be recoverable. Other intangible assets are amortized straight-line over the following estimated useful lives:
|
|
Useful lives
|
|
Patents
|
10-20 years
|
|
Engineering drawings
|
15 years
|
|
Customer relationships
|
10-20 years
|
Property, Plant and Equipment
Property, plant and equipment are stated at cost. Expenditures for maintenance, repairs and minor renewals are charged against earnings as incurred. Expenditures for major renewals and improvements that substantially extend the capacity or useful life of an asset are capitalized and are then depreciated. The cost and accumulated depreciation for property, plant and equipment sold, retired, or otherwise disposed of are relieved from the accounts, and resulting gains or losses are reflected in earnings. Property, plant and equipment are depreciated over the estimated useful lives of the assets using the straight-line depreciation method for financial reporting and on accelerated methods for income tax purposes.
Property, plant and equipment are depreciated over the following estimated useful lives:
|
|
Years
|
|
Building and improvements
|
2 - 40
|
|
Machinery, equipment and tooling
|
2 - 20
|
|
Furniture and fixtures
|
3 - 15
|
|
Computer hardware and software
|
2 - 7
|
Property, plant and equipment also include cranes accounted for as operating leases. Equipment accounted for as operating leases includes equipment leased directly to the customer and equipment for which the company has assisted in the financing arrangement whereby it has guaranteed more than insignificant residual value or made a buyback commitment. Equipment that is leased directly to the customer is accounted for as an operating lease with the related assets capitalized and depreciated over their estimated economic life. Equipment involved in a financing arrangement is depreciated over the life of the underlying arrangement so that the net book value at the end of the period equals the buyback amount or the residual value amount. The amount of rental equipment included in property, plant and equipment amounted to
$83.4 million
and
$63.1 million
, net of accumulated depreciation, at
December 31, 2014
and
2013
, respectively.
Impairment of Long-Lived Assets
The company reviews long-lived assets for impairment whenever events or changes in circumstances indicate that the assets’ carrying amount may not be recoverable. The company conducts its long-lived asset impairment analyses in accordance with ASC Topic 360-10-5. ASC Topic 360-10-5 requires the company to group assets and liabilities at the lowest level for which identifiable cash flows are largely independent of the cash flows of other assets and liabilities and to evaluate the asset group against the sum of the undiscounted future cash flows.
For property, plant and equipment and other long-lived assets, other than goodwill and other indefinite lived intangible assets, the company performs undiscounted operating cash flow analyses to determine impairments. If an impairment is determined to exist, any related impairment loss is calculated based upon comparison of the fair value to the net book value of the assets. Impairment losses on assets held for sale are based on the estimated proceeds to be received, less costs to sell.
Each year, in its second quarter, the company tests for impairment of goodwill according to a two-step approach. In the first step, the company estimates the fair values of its reporting units using the present value of future cash flows approach, subject to a comparison for reasonableness to its market capitalization at the date of valuation. If the carrying amount exceeds the fair value, the second step of the goodwill impairment test is performed to measure the amount of the impairment loss, if any. In the second step, the implied fair value of the goodwill is estimated as the fair value of the reporting unit used in the first step
61
less the fair values of all other net tangible and intangible assets of the reporting unit. If the carrying amount of the goodwill exceeds its implied fair market value, an impairment loss is recognized in an amount equal to that excess, not to exceed the carrying amount of the goodwill. In addition, goodwill of a reporting unit is tested for impairment between annual tests if an event occurs or circumstances change that would more-likely-than-not reduce the fair value of a reporting unit below its carrying value. For other indefinite lived intangible assets, the impairment test consists of a comparison of the fair value of the intangible assets to their carrying amount. See Note 9, “Goodwill and Other Intangible Assets,” for further details on our impairment assessments.
Warranties
Estimated warranty costs are recorded in cost of sales at the time of sale of the warranted products based on historical warranty experience for the related product or estimates of projected costs due to specific warranty issues on new products. These estimates are reviewed periodically and are adjusted based on changes in facts, circumstances or actual experience.
Environmental Liabilities
The company accrues for losses associated with environmental remediation obligations when such losses are probable and reasonably estimable. Such accruals are adjusted as information develops or circumstances change. Costs of long-term expenditures for environmental remediation obligations are discounted to their present value when the timing of cash flows are estimable.
Product Liabilities
The company records product liability reserves for its self-insured portion of any pending or threatened product liability actions. The reserve is based upon
two
estimates. First, the company tracks the population of all outstanding pending and threatened product liability cases to determine an appropriate case reserve for each based upon the company’s best judgment and the advice of legal counsel. These estimates are continually evaluated and adjusted based upon changes to facts and circumstances surrounding the case. Second, the company determines the amount of additional reserve required to cover incurred but not reported product liability obligations and to account for possible adverse development of the established case reserves (collectively referred to as IBNR). This analysis is performed at least twice annually.
Foreign Currency Translation
The financial statements of the company’s non-U.S. subsidiaries are translated using the current exchange rate for assets and liabilities and the average exchange rate for the year for income and expense items. Resulting translation adjustments are recorded to Accumulated Other Comprehensive Income (AOCI) as a component of Manitowoc stockholders’ equity.
Derivative Financial Instruments and Hedging Activities
The company has written policies and procedures that place all financial instruments under the direction of corporate treasury and restrict all derivative transactions to those intended for hedging purposes. The use of financial instruments for trading purposes is strictly prohibited. The company uses financial instruments to manage the market risk from changes in foreign exchange rates, commodities and interest rates. The company follows the guidance in accordance with ASC Topic 815-10, “Derivatives and Hedging.” The fair values of all derivatives are recorded in the Consolidated Balance Sheets. The change in a derivative’s fair value is recorded each period in current earnings or AOCI depending on whether the derivative is designated and qualifies as part of a hedge transaction and if so, the type of hedge transaction.
During
2014
,
2013
and
2012
, minimal amounts were recognized in earnings due to ineffectiveness of certain commodity hedges. The amount reported as derivative instrument fair market value adjustment in the AOCI account within the Consolidated Statements of Comprehensive Income (Loss) represents the net gain (loss) on foreign currency exchange contracts, commodity contracts, and interest rate contracts designated as cash flow hedges, net of income taxes.
Cash Flow Hedges
The company selectively hedges anticipated transactions that are subject to foreign exchange exposure, commodity price exposure, or variable interest rate exposure, primarily using foreign currency exchange contracts, commodity contracts, and interest rate contracts, respectively. These instruments are designated as cash flow hedges in accordance with ASC Topic 815-10 and are recorded in the Consolidated Balance Sheets at fair value. The effective portion of the contracts’ gains or losses due to changes in fair value are initially recorded as a component of AOCI and are subsequently reclassified into earnings when the hedged transactions, typically sales and costs related to sales and interest expense, occur and affect earnings. These contracts are highly effective in hedging the variability in future cash attributable to changes in currency exchange rates, commodity prices, or interest rates.
Fair Value Hedges
The company periodically enters into interest rate swaps designated as a hedge of the fair value of a portion of its fixed rate debt. These hedges effectively result in changing a portion of its fixed rate debt to variable interest rate debt. Both the swaps and the debt are recorded in the Consolidated Balance Sheets at fair value. The change in fair value of the swaps should exactly offset the change in fair value of the hedged debt, with no net impact to earnings. Interest expense of the hedged debt is recorded at the variable rate in earnings. See Note 11, “Debt” for further discussion of fair value hedges.
62
The company selectively hedges cash inflows and outflows that are subject to foreign currency exposure from the date of transaction to the related payment date. The hedges for these foreign currency accounts receivable and accounts payable are recorded in the Consolidated Balance Sheets at fair value. Gains or losses due to changes in fair value are recorded as an adjustment to earnings in the Consolidated Statements of Operations.
Stock-Based Compensation
Stock-based compensation plans are described more fully in Note 16, “Stock-Based Compensation.” The company recognizes expense for all stock-based compensation with graded vesting on a straight-line basis over the vesting period of the entire award. The company recognized
$1.0 million
,
$2.8 million
and
$4.5 million
of compensation expense related to restricted stock awards during the years ended
December 31, 2014
,
2013
and
2012
, respectively. In addition, the company recognized
$5.7 million
,
$6.3 million
and
$6.7 million
of compensation expense related to stock options during the years ended
December 31, 2014
,
2013
and
2012
, respectively. The company also recognized
$5.9 million
,
$5.8 million
, and
$5.2 million
of compensation expense associated with restricted stock units in
2014
,
2013
and
2012
, respectively.
Revenue Recognition
Revenue is generally recognized and earned when all the following criteria are satisfied with regard to a specific transaction: persuasive evidence of a sales arrangement exists; the price is fixed or determinable; collectability of cash is reasonably assured; and delivery has occurred or services have been rendered. Shipping and handling fees are reflected in net sales and shipping and handling costs are reflected in cost of sales in the Consolidated Statements of Operations.
The company enters into transactions with customers that provide for residual value guarantees and buyback commitments on certain crane transactions. The company records transactions which it provides significant residual value guarantees and any buyback commitments as operating leases. Net revenues in connection with the initial transactions are recorded as deferred revenue and are amortized to income on a straight-line basis over a period equal to that of the customer’s third party financing agreement. See Note 18, “Guarantees.”
The company also leases cranes to customers under operating lease terms. Revenue from operating leases is recognized ratably over the term of the lease, and leased cranes are depreciated over their estimated useful lives.
Research and Development
Research and development costs are charged to expense as incurred and amounted to
$87.4 million
,
$86.4 million
and
$87.7 million
for the years ended
December 31, 2014
,
2013
and
2012
, respectively. Research and development costs include salaries, materials, contractor fees and other administrative costs.
Income Taxes
The company utilizes the liability method to recognize deferred tax assets and liabilities for the expected future income tax consequences of events that have been recognized in the company’s financial statements. Under this method, deferred tax assets and liabilities are determined based on the temporary difference between financial statement carrying amounts and the tax basis of assets and liabilities using enacted tax rates in effect in the years in which the temporary differences are expected to reverse. Valuation allowances are provided for deferred tax assets where it is considered more likely than not that the company will not realize the benefit of such assets. The company evaluates its uncertain tax positions as new information becomes available. Tax benefits are recognized to the extent a position is more likely than not to be sustained upon examination by the taxing authority.
Earnings Per Share
Basic earnings per share is computed by dividing net earnings attributable to Manitowoc by the weighted average number of common shares outstanding during each year or period. Diluted earnings per share is computed similar to basic earnings per share except that the weighted average shares outstanding is increased to include shares of restricted stock, performance shares and the number of additional shares that would have been outstanding if stock options were exercised and the proceeds from such exercise were used to acquire shares of common stock at the average market price during the year or period.
Comprehensive Income (Loss)
Comprehensive income (loss) includes, in addition to net earnings, other items that are reported as direct adjustments to Manitowoc stockholders’ equity. Currently, these items are foreign currency translation adjustments, employee postretirement benefit adjustments and the change in fair value of certain derivative instruments.
Concentration of Credit Risk
Credit extended to customers through trade accounts receivable potentially subjects the company to risk. This risk is limited due to the large number of customers and their dispersion across various industries and many geographical areas. However, a significant amount of the company’s receivables are with distributors and contractors in the construction industry, large companies in the foodservice and beverage industry, customers servicing the U.S. steel industry, and government agencies. The company currently does not foresee a significant credit risk associated with these individual groups of receivables, but continues to monitor the exposure, if any.
63
Recent accounting changes and pronouncements
In January 2015, the FASB issued Accounting Standards Update (“ASU”) No. 2015-01, “Income Statement—Extraordinary and Unusual Items.” This update eliminates from GAAP the concept of extraordinary items. ASU 2015-01 is effective for the first interim period within fiscal years beginning after December 15, 2015, with early adoption permitted provided that the guidance is applied from the beginning of the fiscal year of adoption. A reporting entity may apply the amendments prospectively or retrospectively to all prior periods presented in the financial statements. The company believes the adoption of this ASU will not have a material impact on its consolidated financial statements.
In August 2014, the FASB issued ASU No. 2014-15, “Presentation of Financial Statements - Going Concern.” This update provided guidance on management’s responsibility in evaluating whether there is substantial doubt about a company’s ability to continue as a going concern and to provide related footnote disclosures. ASU 2014-15 is effective in the first annual period ending after December 15, 2016, with early adoption permitted. The company believes the adoption of this ASU will not have a material impact on its consolidated financial statements.
In May 2014, the FASB issued ASU No. 2014-09, “Revenue from Contracts with Customers.” This update provided a principles-based approach to revenue recognition, requiring revenue recognition to depict the transfer of goods or services to customers in an amount that reflects the consideration to which the entity expects to be entitled in exchange for those goods or services. The ASU provides a five-step model to be applied to all contracts with customers. The five steps are to identify the contract(s) with the customer, identify the performance obligations in the contact, determine the transaction price, allocate the transaction price to the performance obligations in the contract and recognize revenue when each performance obligation is satisfied. The revenue standard is effective for the first interim period within fiscal years beginning after December 15, 2016, and can be applied either retrospectively to each prior reporting period presented or retrospectively with the cumulative effect of initially applying the update recognized at the date of initial application along with additional disclosures. The company is evaluating the impact, if any, the adoption of this ASU will have on the company’s consolidated financial statements.
In April 2014, the FASB issued ASU No. 2014-08, “Presentation of Financial Statements and Property, Plant, and Equipment: Reporting Discontinued Operations and Disclosures of Disposals of Components of an Entity.” This ASU changes the requirements for reporting discontinued operations in Accounting Standard Codification Subtopic 205-20, and requires a disposal of a component of an entity or a group of components of an entity to be reported in discontinued operations only if the disposal represents a strategic shift that has (or will have) a major effect on an entity’s operations and financial results. There will also be additional disclosures required. The amendments in this ASU are effective prospectively for fiscal years (and interim reporting periods within those years) beginning after December 15, 2014, with early adoption permitted. The significance of this guidance for the company is dependent on any future disposals.
In July 2013, the FASB issued ASU No. 2013-11, “Presentation of an Unrecognized Tax Benefit When a Net Operating Loss Carryforward, a Similar Tax Loss, or a Tax Credit Carryforward Exists.” This new standard generally requires the netting of unrecognized tax benefits (UTBs) against a deferred tax asset for a loss or other carryforward that would apply in settlement of the uncertain tax positions. Under the new standard, UTBs will be netted against all available same-jurisdiction loss or other tax carryforwards that would be utilized, rather than only against carryforwards that are created by the UTBs. The amendments in this ASU are effective prospectively for fiscal years (and interim reporting periods within those years) beginning after December 15, 2013. The adoption of this ASU did not have a material impact on the company’s consolidated financial statements.
In March 2013, the FASB issued ASU No. 2013-05, “Parent’s Accounting for the Cumulative Translation Adjustment upon Derecognition of Certain Subsidiaries or Groups of Assets within a Foreign Entity or of an Investment in a Foreign Entity.” This ASU changes a parent entity’s accounting for the cumulative translation adjustment upon derecognition of certain subsidiaries or groups of assets within a foreign entity or of an investment in a foreign entity. A parent entity is required to release any related cumulative foreign currency translation adjustment from accumulated other comprehensive income into net income in the following circumstances: (i) a parent entity ceases to have a controlling financial interest in a subsidiary or group of assets that is a business within a foreign entity if the sale or transfer results in the complete or substantially complete liquidation of the foreign entity in which the subsidiary or group of assets had resided; (ii) a partial sale of an equity method investment that is a foreign entity; (iii) a partial sale of an equity method investment that is not a foreign entity whereby the partial sale represents a complete or substantially complete liquidation of the foreign entity that held the equity method investment; and (iv) the sale of an investment in a foreign entity. The amendments in this ASU are effective prospectively for fiscal years (and interim reporting periods within those years) beginning after December 15, 2013. The adoption of this ASU did not have a material impact on the company’s consolidated financial statements.
64
3. Acquisitions
On October 1, 2013, the company acquired all remaining shares of Inducs, AG (“Inducs”) for a purchase price, net of cash acquired, of approximately
$12.2 million
. The company previously held a minority interest in Inducs. Inducs is a leader in induction cooking technology. Allocation of the purchase price resulted in
$5.0 million
of goodwill and
$7.0 million
of intangible assets. The results of Inducs have been included in the Foodservice segment since the date of acquisition.
4. Discontinued Operations
During the fourth quarter of 2013, the company agreed to sell its
50%
interest in Manitowoc Dong Yue, a consolidated entity, which produces mobile and truck-mounted hydraulic cranes in China, to its joint venture partner, Tai’an Taishan Heavy Industry Investment Co., Ltd., for a nominal amount. Consequently, the joint venture has been classified as discontinued operations in the company’s financial statements. The transaction subsequently closed on January 21, 2014. In connection with the sale, the company agreed to forgive all loans and accrued interest owed by Manitowoc Dong Yue to the company and its affiliates. As of December 31, 2013, loans and accrued interest owed by Manitowoc Dong Yue to the company and its affiliates amounted to
$71.3 million
and the forgiveness resulted in income of
$35.6 million
to the joint venture partner shown as part of net income attributable to noncontrolling interest, net of income taxes, which effectively reduced net earnings attributable to Manitowoc shareholders for the year ended December 31, 2013.
In addition, assets and liabilities classified as held for sale for Manitowoc Dong Yue were required to be recorded at the lower of carrying value or fair value less any costs to sell, which resulted in an impairment charge of approximately
$1.2 million
relating to the Manitowoc Dong Yue trademark intangible asset of which
$0.6 million
impacted net earnings attributable to Manitowoc shareholders. The impairment charge is included within loss from discontinued operations, net of income taxes, in the consolidated statement of operations for the year ended December 31, 2013.
Upon closing of the transaction in the first quarter of 2014, the company also paid an additional
$7.2 million
to Manitowoc Dong Yue for a portion of debt the joint venture had outstanding with third parties. After this payment, Manitowoc Dong Yue had approximately
$17.3 million
of third party debt outstanding under a loan agreement entered into during the first quarter of 2014 that the company has fully guaranteed. The loan is fully secured by Manitowoc Dong Yue’s fixed assets as well as finished goods inventory. Manitowoc Dong Yue will repay the loan over a four-year period, with the last payment due on December 31, 2017.
The following selected financial data of the Manitowoc Dong Yue business for the years ended
December 31, 2014
,
2013
and
2012
is presented for informational purposes only and does not necessarily reflect what the results of operations would have been had the business operated as a stand-alone entity. There was no general corporate expense allocated to discontinued operations for this business during the periods presented.
|
(in millions)
|
2014
|
2013
|
2012
|
|||||||||
|
Net sales
|
$
|
0.3
|
|
$
|
16.8
|
|
$
|
13.7
|
|
|||
|
Pretax loss from discontinued operation
|
$
|
(0.8
|
)
|
$
|
(17.3
|
)
|
$
|
(16.6
|
)
|
|||
|
Benefit for taxes on earnings
|
—
|
|
(0.3
|
)
|
—
|
|
||||||
|
Net loss from discontinued operation
|
$
|
(0.8
|
)
|
$
|
(17.0
|
)
|
$
|
(16.6
|
)
|
|||
During the fourth quarter of 2012, the company decided to divest its warewashing equipment business, which operated under the brand name Jackson, and classified this business as discontinued operations in the company’s financial statements. On January 28, 2013, the company sold the Jackson warewashing equipment business to Hoshizaki USA Holdings, Inc. for approximately
$39.2 million
, including post-closing adjustments. Net proceeds were used to reduce ratably the then-outstanding balances of Term Loan A and B. The transaction resulted in a
$2.7 million
loss on sale, which included
$4.4 million
of income tax expense. The results of these operations have been classified as discontinued operations.
65
The following selected financial data of the Jackson business for the years ended
December 31, 2014
,
2013
and
2012
is presented for informational purposes only and does not necessarily reflect what the results of operations would have been had the business operated as a stand-alone entity. There was no general corporate expense or interest expense allocated to discontinued operations for this business during the periods presented.
|
(in millions)
|
2014
|
2013
|
2012
|
|||||||||
|
Net sales
|
$
|
—
|
|
$
|
2.5
|
|
$
|
32.6
|
|
|||
|
Pretax earnings from discontinued operation
|
$
|
—
|
|
$
|
0.1
|
|
$
|
1.7
|
|
|||
|
(Benefit) provision for taxes on earnings
|
—
|
|
(0.4
|
)
|
0.7
|
|
||||||
|
Net earnings from discontinued operation
|
$
|
—
|
|
$
|
0.5
|
|
$
|
1.0
|
|
|||
During the third quarter of 2014, the company settled a pension obligation related to a previously disposed entity, which resulted in a
$1.1 million
loss on sale of discontinued operations, net of income tax benefit of
$0.6 million
, during the period.
The following selected financial data of various businesses disposed of prior to 2012, primarily consisting of administrative costs, for the years ended
December 31, 2014
,
2013
and
2012
is presented for informational purposes only and does not necessarily reflect what the results of operations would have been had the businesses operated as stand-alone entities. There was no general corporate expense or interest expense allocated to discontinued operations for these businesses during the periods presented.
|
(in millions)
|
2014
|
2013
|
2012
|
|||||||||
|
Net sales
|
$
|
—
|
|
$
|
—
|
|
$
|
—
|
|
|||
|
Pretax loss from discontinued operations
|
$
|
(0.9
|
)
|
$
|
(3.4
|
)
|
$
|
(1.2
|
)
|
|||
|
Benefit for taxes on earnings
|
(0.3
|
)
|
(1.1
|
)
|
(0.5
|
)
|
||||||
|
Net loss from discontinued operations
|
$
|
(0.6
|
)
|
$
|
(2.3
|
)
|
$
|
(0.7
|
)
|
|||
5. Fair Value of Financial Instruments
The following tables set forth the company’s financial assets and liabilities that were accounted for at fair value on a recurring basis as of
December 31, 2014
and
2013
by level within the fair value hierarchy. Financial assets and liabilities are classified in their entirety based on the lowest level of input that is significant to the fair value measurement.
66
|
|
Fair Value as of December 31, 2014
|
|||||||||||||||
|
(in millions)
|
Level 1
|
Level 2
|
Level 3
|
Total
|
||||||||||||
|
Current Assets:
|
|
|
|
|
|
|
|
|
||||||||
|
Foreign currency exchange contracts
|
$
|
—
|
|
$
|
2.1
|
|
$
|
—
|
|
$
|
2.1
|
|
||||
|
Total current assets at fair value
|
$
|
—
|
|
$
|
2.1
|
|
$
|
—
|
|
$
|
2.1
|
|
||||
|
Non-Current Assets:
|
|
|
|
|
|
|
|
|
||||||||
|
Interest rate swap contracts: Float-to-fixed
|
$
|
—
|
|
$
|
0.8
|
|
$
|
—
|
|
$
|
0.8
|
|
||||
|
Total non-current assets at fair value
|
$
|
—
|
|
$
|
0.8
|
|
$
|
—
|
|
$
|
0.8
|
|
||||
|
Current Liabilities:
|
|
|
|
|
|
|
|
|
||||||||
|
Foreign currency exchange contracts
|
$
|
—
|
|
$
|
7.9
|
|
$
|
—
|
|
$
|
7.9
|
|
||||
|
Commodity contracts
|
—
|
|
1.0
|
|
—
|
|
1.0
|
|
||||||||
|
Interest rate swap contracts: Float-to-fixed
|
—
|
|
2.3
|
|
—
|
|
2.3
|
|
||||||||
|
Total current liabilities at fair value
|
$
|
—
|
|
$
|
11.2
|
|
$
|
—
|
|
$
|
11.2
|
|
||||
|
Non-current Liabilities:
|
|
|
|
|
|
|
|
|
||||||||
|
Commodity contracts
|
—
|
|
0.4
|
|
—
|
|
0.4
|
|
||||||||
|
Interest rate swap contracts: Fixed-to-float
|
—
|
|
4.3
|
|
—
|
|
4.3
|
|
||||||||
|
Total non-current liabilities at fair value
|
$
|
—
|
|
$
|
4.7
|
|
$
|
—
|
|
$
|
4.7
|
|
||||
|
|
Fair Value as of December 31, 2013
|
|||||||||||||||
|
(in millions)
|
Level 1
|
Level 2
|
Level 3
|
Total
|
||||||||||||
|
Current Assets:
|
|
|
|
|
|
|
|
|
||||||||
|
Foreign currency exchange contracts
|
$
|
—
|
|
$
|
2.9
|
|
$
|
—
|
|
$
|
2.9
|
|
||||
|
Commodity contracts
|
$
|
—
|
|
$
|
0.2
|
|
$
|
—
|
|
$
|
0.2
|
|
||||
|
Total current assets at fair value
|
$
|
—
|
|
$
|
3.1
|
|
$
|
—
|
|
$
|
3.1
|
|
||||
|
Current Liabilities:
|
|
|
|
|
|
|
|
|
||||||||
|
Foreign currency exchange contracts
|
$
|
—
|
|
$
|
1.1
|
|
$
|
—
|
|
$
|
1.1
|
|
||||
|
Commodity contracts
|
—
|
|
0.4
|
|
—
|
|
0.4
|
|
||||||||
|
Total current liabilities at fair value
|
$
|
—
|
|
$
|
1.5
|
|
$
|
—
|
|
$
|
1.5
|
|
||||
|
Non-current Liabilities:
|
|
|
|
|
|
|
|
|
||||||||
|
Interest rate swap contracts: Fixed-to-float
|
$
|
—
|
|
$
|
14.9
|
|
$
|
—
|
|
$
|
14.9
|
|
||||
|
Total non-current liabilities at fair value
|
$
|
—
|
|
$
|
14.9
|
|
$
|
—
|
|
$
|
14.9
|
|
||||
The fair value of the company’s 2018 Notes was approximately
$423.1 million
as of December 31,
2013
; these notes were redeemed by the company on February 18, 2014. The fair value of the company’s 2020 Notes was approximately
$651.6 million
and
$677.6 million
as of
December 31, 2014
and
2013
, respectively. The fair value of the company’s 2022 Notes was approximately
$309.1 million
and
$303.9 million
as of
December 31, 2014
and
2013
, respectively. The fair values of the company’s term loans under its Senior Credit Facility, respectively, are as follows as of
December 31, 2014
and
2013
: Term Loan A —
$327.8 million
and
$161.9 million
, respectively; and Term Loan B —
$165.0 million
and
$0.0 million
, respectively. See Note 11, “Debt,” for a description of the debt instruments and their related carrying values.
ASC Topic 820-10 defines fair value as the price that would be received to sell an asset or paid to transfer a liability in an orderly transaction between market participants at the measurement date. ASC Topic 820-10 classifies the inputs used to measure fair value into the following hierarchy:
67
|
Level 1
|
|
Unadjusted quoted prices in active markets for identical assets or liabilities
|
|
|
|
|
|
Level 2
|
|
Unadjusted quoted prices in active markets for similar assets or liabilities, or
|
|
|
|
|
|
|
|
Unadjusted quoted prices for identical or similar assets or liabilities in markets that are not active, or
|
|
|
|
|
|
|
|
Inputs other than quoted prices that are observable for the asset or liability
|
|
|
|
|
|
Level 3
|
|
Unobservable inputs for the asset or liability
|
The company endeavors to utilize the best available information in measuring fair value. Financial assets and liabilities are classified in their entirety based on the lowest level of input that is significant to the fair value measurement. The company estimates fair value of its Term Loans and Senior Notes based on quoted market prices of the instruments; because these markets are typically thinly traded, the liabilities are classified as Level 2 within the valuation hierarchy. The carrying values of cash and cash equivalents, accounts receivable, accounts payable, deferred purchase price notes on receivables sold (see Note 12, “Accounts Receivable Securitization”) and short-term variable debt, including any amounts outstanding under our revolving credit facility, approximate fair value, without being discounted as of
December 31, 2014
and
December 31, 2013
due to the short-term nature of these instruments.
As a result of its global operating and financing activities, the company is exposed to market risks from changes in interest rates, foreign currency exchange rates, and commodity prices, which may adversely affect its operating results and financial position. When deemed appropriate, the company minimizes these risks through the use of derivative financial instruments. Derivative financial instruments are used to manage risk and are not used for trading or other speculative purposes, and the company does not use leveraged derivative financial instruments. The foreign currency exchange, interest rate, and commodity contracts are valued through an independent valuation source which uses an industry standard data provider, with resulting valuations periodically validated through third-party or counterparty quotes. As such, these derivative instruments are classified within Level 2.
6. Derivative Financial Instruments
The company’s risk management objective is to ensure that business exposures to risks that have been identified and measured and are capable of being controlled, are minimized using the most effective and efficient methods to eliminate, reduce, or transfer such exposures. Operating decisions consider these associated risks and structure transactions to avoid these risks whenever possible.
Use of derivative instruments is consistent with the overall business and risk management objectives of the company. Derivative instruments may be used to manage business risk within limits specified by the company’s risk policy and manage exposures that have been identified through the risk identification and measurement process, provided that they clearly qualify as “hedging” activities as defined in the risk policy. Use of derivative instruments is not automatic, nor is it necessarily the only response to managing pertinent business risk. Use is permitted only after the risks that have been identified are determined to exceed defined tolerance levels and are considered to be unavoidable.
The primary risks managed by the company by using derivative instruments are interest rate risk, commodity price risk and foreign currency exchange risk. Interest rate swap or cap instruments are entered into to help manage interest rate or fair value risk. Swap contracts on various commodities are entered into to help manage the price risk associated with forecasted purchases of materials used in the company’s manufacturing process. The company also enters into various foreign currency derivative instruments to help manage foreign currency risk associated with the company’s projected purchases and sales and foreign currency denominated receivable and payable balances.
ASC Topic 815-10 requires companies to recognize all derivative instruments as either assets or liabilities at fair value in the statement of financial position. In accordance with ASC Topic 815-10, the company designates commodity swaps, foreign currency exchange contracts, and float-to-fixed interest rate derivative contracts as cash flow hedges of forecasted purchases of commodities and currencies, and variable rate interest payments. Also in accordance with ASC Topic 815-10, the company designates fixed-to-float interest rate swaps as fair market value hedges of fixed rate debt, which synthetically swaps the company’s fixed rate debt to floating rate debt.
For derivative instruments that are designated and qualify as cash flow hedges, the effective portion of the gain or loss on the derivative is reported as a component of Other comprehensive income and reclassified into earnings in the same period or
68
periods during which the hedged transaction affects earnings. Gains and losses on the derivative instruments representing either hedge ineffectiveness or hedge components excluded from the assessment of effectiveness, are recognized in current earnings. In the next twelve months the company estimates
$6.2 million
of unrealized
losses
, net of tax, related to interest rate, commodity price and currency rate hedging will be reclassified from Other comprehensive income into earnings. Foreign currency and commodity hedging is generally completed prospectively on a rolling basis for
twelve
and
twenty-four
months, respectively, depending on the type of risk being hedged.
The risk management objective for the company’s fair market value interest rate hedges is to effectively change the amount of the underlying debt equal to the notional value of the hedges from a fixed to a floating interest rate based on the one-month LIBOR rate. These swaps include an embedded call feature to match the terms of the call schedule embedded in the Senior Notes. Changes in the fair value of the interest rate swap are expected to offset changes in the fair value of the debt due to changes in the one-month LIBOR rate.
As of
December 31, 2014
, the company had the following outstanding commodity and currency forward contracts that were entered into as hedge forecasted transactions:
|
Commodity
|
Units Hedged
|
Type
|
||||
|
Aluminum
|
1,657
|
MT
|
Cash Flow
|
|||
|
Copper
|
820
|
MT
|
Cash Flow
|
|||
|
Natural Gas
|
347,608
|
MMBtu
|
Cash Flow
|
|||
|
Steel
|
14,665
|
Short Tons
|
Cash Flow
|
|||
|
Currency
|
Units Hedged
|
Type
|
||
|
Canadian Dollar
|
7,984,824
|
Cash Flow
|
||
|
European Euro
|
89,006,695
|
Cash Flow
|
||
|
South Korean Won
|
1,964,906,996
|
Cash Flow
|
||
|
Singapore Dollar
|
3,900,000
|
Cash Flow
|
||
|
United States Dollar
|
29,228,731
|
Cash Flow
|
||
|
Mexican Peso
|
52,674,387
|
Cash Flow
|
||
As of
December 31, 2014
and
December 31, 2013
, the company had outstanding
$0.0 million
and
$100.0 million
, respectively, notional amount of
3.00%
LIBOR caps related to the term loan portion of the Senior Credit Facility which effectively capped the company’s interest rate exposure for the notional value of its variable term debt at a
one-month LIBOR
rate of
3.00%
. The company paid various bank partners
$0.7 million
in option premium to purchase the protection on Term Loans A and B and amortized the premium to interest expense over the life of the cap protection. The caps expired in 2014.
As of
December 31, 2014
and
December 31, 2013
, the company had outstanding
$175.0 million
and
$0.0 million
, respectively, notional amount of float-to-fixed interest rate swaps outstanding related to Term Loan A under the Senior Credit Facility that were designated as cash flow hedges. As a result,
$175.0 million
of Term Loan A was hedged at an interest rate of
1.635%
, plus the applicable spread based on the Consolidated Total Leverage Ratio of the company as defined under the Senior Credit Facility.
The company has been party to various fixed-to-float interest rate swaps designated as fair market value hedges of its 2018, 2020, and 2022 Notes. In the third quarter of 2012, the company monetized the derivative asset related to its fixed-to-float interest rate swaps related to its 2018 and 2020 Notes and received
$14.8 million
in the quarter. The gain was treated as an increase to the debt balances for the 2018 and 2020 notes and is being amortized against interest expense over the life of the original swap. Subsequently, the company entered into new interest rate swaps due in 2020 and 2022, designating them as fair market value hedges of the 2020 and 2022 Notes, respectively.
As of both
December 31, 2014
, and
December 31, 2013
, the company had
$75.0 million
and
$125.0 million
total notional amount of fixed-to-float interest rate swaps outstanding related to the 2020 and 2022 Notes, respectively, that were designated as fair market value hedges and swapped to floating rate interest. Including the floating rate swaps, the 2020 and 2022 Notes have an all-in interest rate of
8.31%
and
5.19%
, respectively.
For derivative instruments that are not designated as hedging instruments under ASC Topic 815-10, the gains or losses on the derivatives are recognized in current earnings within Other (expense) income, net in the Condensed Consolidated Statement of
69
Operations. As of
December 31, 2014
, the company had the following outstanding currency forward contracts that were not designated as hedging instruments:
|
Currency
|
Units Hedged
|
Recognized Location
|
Purpose
|
|||
|
European Euro
|
73,302,332
|
Other (expense) income, net
|
Accounts payable and receivable settlement
|
|||
|
United States Dollar
|
18,244,912
|
Other (expense) income, net
|
Accounts payable and receivable settlement
|
|||
|
Australian Dollar
|
2,482,430
|
Other (expense) income, net
|
Accounts payable and receivable settlement
|
|||
|
Mexican Peso
|
3,151,000
|
Other (expense) income, net
|
Accounts payable and receivable settlement
|
|||
|
Canadian Dollar
|
2,516
|
Other (expense) income, net
|
Accounts payable and receivable settlement
|
|||
The fair value of outstanding derivative contracts recorded as assets in the accompanying Consolidated Balance Sheet as of
December 31, 2014
was as follows:
|
|
ASSET DERIVATIVES
|
|||
|
(in millions)
|
Balance Sheet Location
|
Fair Value
|
||
|
Derivatives designated as hedging instruments
|
|
|
|
|
|
Interest rate swap contracts: Float-to-fixed
|
Other non-current assets
|
$
|
0.8
|
|
|
Total derivatives designated as hedging instruments
|
|
$
|
0.8
|
|
|
|
ASSET DERIVATIVES
|
|||
|
(in millions)
|
Balance Sheet Location
|
Fair Value
|
||
|
Derivatives NOT designated as hedging instruments
|
|
|
|
|
|
Foreign exchange contracts
|
Other current assets
|
$
|
2.1
|
|
|
Total derivatives NOT designated as hedging instruments
|
|
$
|
2.1
|
|
|
|
|
|
|
|
|
Total asset derivatives
|
|
$
|
2.9
|
|
The fair value of outstanding derivative contracts recorded as liabilities in the accompanying Consolidated Balance Sheet as of
December 31, 2014
was as follows:
|
|
LIABILITY DERIVATIVES
|
|||
|
(in millions)
|
Balance Sheet Location
|
Fair Value
|
||
|
Derivatives designated as hedging instruments
|
|
|
|
|
|
Foreign exchange contracts
|
Accounts payable and accrued expenses
|
$
|
6.6
|
|
|
Commodity contracts
|
Accounts payable and accrued expenses
|
1.0
|
|
|
|
Interest rate swap contracts: Float-to-fixed
|
Accounts payable and accrued expenses
|
2.3
|
|
|
|
Commodity contracts
|
Other non-current liabilities
|
0.4
|
|
|
|
Interest rate swap contracts: Fixed-to-float
|
Other non-current liabilities
|
4.3
|
|
|
|
Total derivatives designated as hedging instruments
|
|
$
|
14.6
|
|
|
|
LIABILITY DERIVATIVES
|
|||
|
(in millions)
|
Balance Sheet Location
|
Fair Value
|
||
|
Derivatives NOT designated as hedging instruments
|
|
|
|
|
|
Foreign exchange contracts
|
Accounts payable and accrued expenses
|
$
|
1.3
|
|
|
Total derivatives NOT designated as hedging instruments
|
|
$
|
1.3
|
|
|
|
|
|
|
|
|
Total liability derivatives
|
|
$
|
15.9
|
|
70
The effect of derivative instruments on the Consolidated Statement of Operations for the twelve months ended
December 31, 2014
and gains or losses initially recognized in Other Comprehensive Income (OCI) in the Consolidated Balance Sheet was as follows:
|
Derivatives in Cash Flow Hedging
Relationships (in millions)
|
Amount of Gain or
(Loss) Recognized in
OCI on Derivative
(Effective Portion, net of
tax)
|
Location of Gain or
(Loss) Reclassified
from Accumulated
OCI into Income
(Effective Portion)
|
Amount of Gain or
(Loss) Reclassified from
Accumulated OCI into
Income (Effective
Portion)
|
|||||||
|
Foreign exchange contracts
|
$
|
(5.3
|
)
|
Cost of sales
|
$
|
(2.2
|
)
|
|||
|
Commodity contracts
|
(0.8
|
)
|
Cost of sales
|
(0.1
|
)
|
|||||
|
Interest rate swap contracts: Float-to-fixed
|
(0.9
|
)
|
Interest expense
|
(1.8
|
)
|
|||||
|
Total
|
$
|
(7.0
|
)
|
|
$
|
(4.1
|
)
|
|||
|
Derivatives Relationships (in millions)
|
Location of Gain or (Loss)
Recognized in Income on
Derivative (Ineffective Portion
and Amount Excluded from
Effectiveness Testing)
|
Amount of Gain or (Loss)
Recognized in Income on
Derivative (Ineffective Portion
and Amount Excluded from
Effectiveness Testing)
|
||
|
Commodity contracts
|
Cost of sales
|
$
|
(0.1
|
)
|
|
Total
|
|
$
|
(0.1
|
)
|
|
Derivatives Not Designated as
Hedging Instruments (in millions)
|
Location of Gain or (Loss)
Recognized in Income on
Derivative
|
Amount of Gain or (Loss)
Recognized in Income on
Derivative
|
||
|
Foreign exchange contracts
|
Other (expense) income, net
|
$
|
0.8
|
|
|
Total
|
|
$
|
0.8
|
|
|
Derivatives Designated as Fair
Market Value Instruments under
ASC 815 (in millions)
|
Location of Gain or (Loss)
Recognized in Income on
Derivative
|
Amount of Gain or (Loss)
Recognized in Income on
Derivative
|
||
|
Interest rate swap contracts: Fixed-to-float
|
Interest expense
|
$
|
10.6
|
|
|
Total
|
|
$
|
10.6
|
|
As of
December 31, 2013
, the company had the following outstanding commodity and currency forward contracts that were entered into as hedge forecasted transactions:
|
Commodity
|
Units Hedged
|
Type
|
||||
|
Aluminum
|
1,622
|
MT
|
Cash Flow
|
|||
|
Copper
|
382
|
MT
|
Cash Flow
|
|||
|
Natural Gas
|
214,277
|
MMBtu
|
Cash Flow
|
|||
|
Steel
|
11,503
|
Short Tons
|
Cash Flow
|
|||
|
Currency
|
Units Hedged
|
Type
|
||
|
Canadian Dollar
|
11,011,092
|
Cash Flow
|
||
|
European Euro
|
74,934,975
|
Cash Flow
|
||
|
South Korean Won
|
1,258,808,642
|
Cash Flow
|
||
|
Singapore Dollar
|
5,280,000
|
Cash Flow
|
||
|
United States Dollar
|
42,200,000
|
Cash Flow
|
||
71
For derivative instruments that are not designated as hedging instruments under ASC Topic 815-10, the gains or losses on the derivatives are recognized in current earnings within Other (expense) income, net. As of
December 31, 2013
, the company had the following outstanding currency forward contracts that were not designated as hedging instruments:
|
Currency
|
Units Hedged
|
Recognized Location
|
Purpose
|
|||
|
European Euro
|
31,738,273
|
Other (expense) income, net
|
Accounts Payable and Receivable Settlement
|
|||
|
United States Dollar
|
29,091,053
|
Other (expense) income, net
|
Accounts Payable and Receivable Settlement
|
|||
|
Australian Dollar
|
1,000,000
|
Other (expense) income, net
|
Accounts Payable and Receivable Settlement
|
|||
|
Chinese Renminbi
|
125,000,000
|
Other (expense) income, net
|
Accounts Payable and Receivable Settlement
|
|||
The fair value of outstanding derivative contracts recorded as assets in the accompanying Consolidated Balance Sheet as of
December 31, 2013
was as follows:
|
|
ASSET DERIVATIVES
|
|||
|
(in millions)
|
Balance Sheet Location
|
Fair Value
|
||
|
Derivatives designated as hedging instruments
|
|
|
|
|
|
Foreign exchange contracts
|
Other current assets
|
$
|
2.3
|
|
|
Commodity contracts
|
Other current assets
|
0.2
|
|
|
|
Total derivatives designated as hedging instruments
|
|
$
|
2.5
|
|
|
|
ASSET DERIVATIVES
|
|||
|
(in millions)
|
Balance Sheet Location
|
Fair Value
|
||
|
Derivatives NOT designated as hedging instruments
|
|
|
|
|
|
Foreign exchange contracts
|
Other current assets
|
$
|
0.6
|
|
|
Total derivatives NOT designated as hedging instruments
|
|
$
|
0.6
|
|
|
|
|
|
|
|
|
Total asset derivatives
|
|
$
|
3.1
|
|
The fair value of outstanding derivative contracts recorded as liabilities in the accompanying Consolidated Balance Sheet as of
December 31, 2013
was as follows:
|
|
LIABILITIES DERIVATIVES
|
||||
|
(in millions)
|
Balance Sheet Location
|
Fair Value
|
|||
|
Derivatives designated as hedging instruments
|
|
|
|
||
|
Foreign exchange contracts
|
Accounts payable and accrued expenses
|
$
|
0.5
|
|
|
|
Commodity contracts
|
Accounts payable and accrued expenses
|
0.4
|
|
||
|
Interest rate swap contracts: Fixed-to-float
|
Other non-current liabilities
|
14.9
|
|
||
|
Total derivatives designated as hedging instruments
|
|
$
|
15.8
|
|
|
|
|
LIABILITY DERIVATIVES
|
|||
|
(in millions)
|
Balance Sheet Location
|
Fair Value
|
||
|
Derivatives NOT designated as hedging instruments
|
|
|
|
|
|
Foreign exchange contracts
|
Accounts payable and accrued expenses
|
$
|
0.6
|
|
|
Total derivatives NOT designated as hedging instruments
|
|
$
|
0.6
|
|
|
|
|
|
|
|
|
Total liability derivatives
|
|
$
|
16.4
|
|
72
The effect of derivative instruments on the Consolidated Statement of Operations for the twelve months ended
December 31, 2013
and gains or losses initially recognized in OCI in the Consolidated Balance Sheet was as follows:
|
Derivatives in Cash Flow Hedging
Relationships (in millions)
|
Amount of Gain or
(Loss) Recognized in
OCI on Derivative
(Effective Portion, net of
tax)
|
Location of Gain or
(Loss) Reclassified
from Accumulated
OCI into Income
(Effective Portion)
|
Amount of Gain or
(Loss) Reclassified from
Accumulated OCI into
Income (Effective
Portion)
|
|||||||
|
Foreign exchange contracts
|
$
|
(0.3
|
)
|
Cost of sales
|
$
|
3.0
|
|
|||
|
Commodity contracts
|
0.4
|
|
Cost of sales
|
(1.6
|
)
|
|||||
|
Total
|
$
|
0.1
|
|
|
$
|
1.4
|
|
|||
|
Derivatives Relationships (in millions)
|
Location of Gain or (Loss)
Recognized in Income on
Derivative (Ineffective Portion
and Amount Excluded from
Effectiveness Testing)
|
Amount of Gain or (Loss)
Recognized in Income on
Derivative (Ineffective
Portion and Amount
Excluded from Effectiveness
Testing)
|
||||
|
Commodity contracts
|
Cost of sales
|
$
|
—
|
|
||
|
Total
|
|
$
|
—
|
|
||
|
Derivatives Not Designated as Hedging
Instruments (in millions)
|
Location of Gain or (Loss)
recognized in Income on
Derivative
|
Amount of Gain or (Loss)
Recognized in Income on
Derivative
|
||||
|
Foreign exchange contracts
|
Other (expense) income, net
|
$
|
0.2
|
|
||
|
Total
|
|
$
|
0.2
|
|
||
|
Derivatives Designated as Fair
Market Value Instruments under
ASC 815 (in millions)
|
Location of Gain or (Loss)
Recognized in Income on
Derivative
|
Amount of Gain or (Loss)
Recognized in Income on
Derivative
|
||
|
Interest rate swap contracts: Fixed-to-float
|
Interest expense
|
$
|
(13.7
|
)
|
|
Total
|
|
$
|
(13.7
|
)
|
The effect of derivative instruments on the Consolidated Statement of Operations for the twelve months ended
December 31, 2012
and gains or losses initially recognized in OCI in the Consolidated Balance Sheet was as follows:
|
Derivatives in Cash Flow Hedging
Relationships (in millions) |
Amount of Gain or
(Loss) Recognized in OCI on Derivative (Effective Portion, net of tax) |
Location of Gain or
(Loss) Reclassified from Accumulated OCI into Income (Effective Portion) |
Amount of Gain or
(Loss) Reclassified from Accumulated OCI into Income (Effective Portion) |
|||||||
|
Foreign exchange contracts
|
$
|
4.2
|
|
Cost of sales
|
$
|
(7.3
|
)
|
|||
|
Interest rate swap & cap contracts
|
(0.2
|
)
|
Interest expense
|
0.1
|
|
|||||
|
Commodity contracts
|
1.0
|
|
Cost of sales
|
(2.7
|
)
|
|||||
|
Total
|
$
|
5.0
|
|
|
$
|
(9.9
|
)
|
|||
|
Derivatives Relationships (in millions)
|
Location of Gain or (Loss)
Recognized in Income on
Derivative (Ineffective Portion
and Amount Excluded from
Effectiveness Testing)
|
Amount of Gain or (Loss)
Recognized in Income on
Derivative (Ineffective
Portion and Amount
Excluded from Effectiveness
Testing)
|
||||
|
Commodity contracts
|
Cost of sales
|
$
|
—
|
|
||
|
Total
|
|
$
|
—
|
|
||
73
|
Derivatives Not Designated as Hedging
Instruments (in millions) |
Location of Gain or (Loss)
recognized in Income on Derivative |
Amount of Gain or (Loss)
Recognized in Income on Derivative |
||||
|
Foreign exchange contracts
|
Other (expense) income, net
|
$
|
1.2
|
|
||
|
Interest rate swap contracts
|
Other (expense) income, net
|
$
|
9.3
|
|
||
|
Total
|
|
$
|
10.5
|
|
||
|
Derivatives Designated as Fair
Market Value Instruments under
ASC 815 (in millions)
|
Location of Gain or (Loss)
Recognized in Income on Derivative (Ineffective Portion and Amount Excluded from Effectiveness Testing) |
Amount of Gain or (Loss)
Recognized in Income on Derivative (Ineffective Portion and Amount Excluded from Effectiveness Testing) |
||||
|
Interest rate swap contracts
|
Interest expense
|
$
|
(1.7
|
)
|
||
|
Total
|
|
$
|
(1.7
|
)
|
||
7. Inventories
The components of inventories at
December 31, 2014
and
December 31, 2013
are summarized as follows:
|
(in millions)
|
2014
|
2013
|
||||||
|
Inventories — gross:
|
|
|
|
|
||||
|
Raw materials
|
$
|
226.2
|
|
$
|
259.0
|
|
||
|
Work-in-process
|
103.7
|
|
130.2
|
|
||||
|
Finished goods
|
414.8
|
|
436.8
|
|
||||
|
Total inventories — gross
|
744.7
|
|
826.0
|
|
||||
|
Excess and obsolete inventory reserve
|
(64.0
|
)
|
(69.0
|
)
|
||||
|
Net inventories at FIFO cost
|
680.7
|
|
757.0
|
|
||||
|
Excess of FIFO costs over LIFO value
|
(36.2
|
)
|
(36.2
|
)
|
||||
|
Inventories — net
|
$
|
644.5
|
|
$
|
720.8
|
|
||
8. Property, Plant and Equipment
The components of property, plant and equipment at
December 31, 2014
and
December 31, 2013
are summarized as follows:
|
(in millions)
|
2014
|
2013
|
||||||
|
Land
|
$
|
31.2
|
|
$
|
40.8
|
|
||
|
Building and improvements
|
344.2
|
|
361.2
|
|
||||
|
Machinery, equipment and tooling
|
509.1
|
|
509.0
|
|
||||
|
Furniture and fixtures
|
24.5
|
|
47.8
|
|
||||
|
Computer hardware and software
|
169.7
|
|
125.8
|
|
||||
|
Rental cranes
|
111.2
|
|
89.3
|
|
||||
|
Construction in progress
|
104.2
|
|
102.2
|
|
||||
|
Total cost
|
1,294.1
|
|
1,276.1
|
|
||||
|
Less accumulated depreciation
|
(703.1
|
)
|
(697.3
|
)
|
||||
|
Property, plant and equipment-net
|
$
|
591.0
|
|
$
|
578.8
|
|
||
74
9. Goodwill and Other Intangible Assets
The changes in carrying amount of goodwill by reportable segment for the years ended
December 31, 2014
and
December 31, 2013
are as follows:
|
(in millions)
|
Crane
|
Foodservice
|
Total
|
|||||||||
|
Gross balance as of January 1, 2013
|
$
|
341.7
|
|
$
|
1,384.7
|
|
$
|
1,726.4
|
|
|||
|
Acquisition of Inducs
|
—
|
|
5.0
|
|
5.0
|
|
||||||
|
Restructuring reserve adjustment
|
—
|
|
(0.7
|
)
|
(0.7
|
)
|
||||||
|
Foreign currency impact
|
3.4
|
|
0.2
|
|
3.6
|
|
||||||
|
Gross balance as of December 31, 2013
|
$
|
345.1
|
|
$
|
1,389.2
|
|
$
|
1,734.3
|
|
|||
|
Accumulated asset impairments
|
—
|
|
(515.7
|
)
|
(515.7
|
)
|
||||||
|
Net balance as of December 31, 2013
|
$
|
345.1
|
|
$
|
873.5
|
|
$
|
1,218.6
|
|
|||
|
Foreign currency impact
|
(19.8
|
)
|
(0.7
|
)
|
(20.5
|
)
|
||||||
|
Gross balance as of December 31, 2014
|
$
|
325.3
|
|
$
|
1,388.5
|
|
$
|
1,713.8
|
|
|||
|
Accumulated asset impairments
|
—
|
|
(515.7
|
)
|
(515.7
|
)
|
||||||
|
Net balance as of December 31, 2014
|
$
|
325.3
|
|
$
|
872.8
|
|
$
|
1,198.1
|
|
|||
The company accounts for goodwill and other intangible assets under the guidance of ASC Topic 350, “Intangibles — Goodwill and Other.” The company performs an annual impairment review at June 30 of every year or more frequently if events or changes in circumstances indicate that the asset might be impaired. The company performs impairment reviews for its reporting units and indefinite-lived intangible assets using a fair-value method based on the present value of future cash flows, which involves management’s judgments and assumptions about the amounts of those cash flows and the discount rates used. The estimated fair value is then compared with the carrying amount of the reporting unit, including recorded goodwill, or indefinite-lived intangible asset. The intangible asset is then subject to risk of write-down to the extent that the carrying amount exceeds the estimated fair value.
As of June 30, 2014, the company performed its annual impairment analysis for its reporting units, which were Cranes Americas; Cranes Europe, Middle East, and Africa; Cranes China; Cranes Greater Asia Pacific; Crane Care; Foodservice Americas; Foodservice Europe, Middle East, and Africa; and Foodservice Asia, as well as its indefinite-lived intangible assets, and based on those results, no impairment was indicated.
As of September 30, 2014, the company completed its reorganization of the Cranes operating and financial consolidation structure from geographic to product line reporting. As a result of the reorganization, the company determined that for the purpose of goodwill impairment assessment it has a single reporting unit under the new structure, comprised of the Crane operating segment.
The company will continue to monitor market conditions and determine if any additional interim reviews of goodwill, other intangibles or long-lived assets are warranted. In the event the company determines that assets are impaired in the future, the company would recognize a non-cash impairment charge, which could have a material adverse effect on the company’s consolidated balance sheet and results of operations.
As discussed in Note 3, “Acquisitions,” on October 1, 2013, the company acquired all remaining shares of Inducs which the company previously held a minority interest. The aggregate purchase price of
$12.2 million
, net of cash, resulted in
$7.0 million
of identifiable intangible assets and
$5.0 million
of goodwill. Of the
$7.0 million
of acquired intangible assets,
$0.7 million
was assigned to trademarks that are not subject to amortization,
$1.2 million
was assigned to customer relationships with a useful life of
19
years, and
$5.1 million
was assigned to developed technology with a useful life of
12
years.
75
The gross carrying amount and accumulated amortization of the company’s intangible assets other than goodwill are as follows as of
December 31, 2014
and
December 31, 2013
.
|
|
December 31, 2014
|
December 31, 2013
|
||||||||||||||||||||||
|
(in millions)
|
Gross
Carrying
Amount
|
Accumulated
Amortization
Amount
|
Net
Book
Value
|
Gross
Carrying
Amount
|
Accumulated
Amortization
Amount
|
Net
Book
Value
|
||||||||||||||||||
|
Trademarks and tradenames
|
$
|
300.0
|
|
$
|
—
|
|
$
|
300.0
|
|
$
|
311.8
|
|
$
|
—
|
|
$
|
311.8
|
|
||||||
|
Customer relationships
|
425.7
|
|
(136.0
|
)
|
289.7
|
|
426.1
|
|
(114.4
|
)
|
311.7
|
|
||||||||||||
|
Patents
|
32.7
|
|
(28.3
|
)
|
4.4
|
|
34.9
|
|
(28.4
|
)
|
6.5
|
|
||||||||||||
|
Engineering drawings
|
11.0
|
|
(9.3
|
)
|
1.7
|
|
11.5
|
|
(9.1
|
)
|
2.4
|
|
||||||||||||
|
Distribution network
|
19.7
|
|
—
|
|
19.7
|
|
21.0
|
|
—
|
|
21.0
|
|
||||||||||||
|
Other intangibles
|
170.9
|
|
(71.7
|
)
|
99.2
|
|
176.6
|
|
(63.8
|
)
|
112.8
|
|
||||||||||||
|
|
$
|
960.0
|
|
$
|
(245.3
|
)
|
$
|
714.7
|
|
$
|
981.9
|
|
$
|
(215.7
|
)
|
$
|
766.2
|
|
||||||
Amortization expense for the years ended
December 31, 2014
,
2013
and
2012
was
$35.1 million
,
$35.3 million
and
$36.5 million
, respectively. Excluding the impact of any future acquisitions or divestitures, the company anticipates amortization will be approximately
$35 million
per year for next five years.
10. Accounts Payable and Accrued Expenses
Accounts payable and accrued expenses at
December 31, 2014
and
December 31, 2013
are summarized as follows:
|
(in millions)
|
2014
|
2013
|
||||||
|
Trade accounts payable and interest payable
|
$
|
470.0
|
|
$
|
510.6
|
|
||
|
Employee related expenses
|
90.3
|
|
99.9
|
|
||||
|
Restructuring expenses
|
20.3
|
|
20.6
|
|
||||
|
Profit sharing and incentives
|
6.8
|
|
44.7
|
|
||||
|
Accrued rebates
|
52.8
|
|
45.2
|
|
||||
|
Deferred revenue - current
|
21.6
|
|
25.0
|
|
||||
|
Income taxes payable
|
16.2
|
|
62.5
|
|
||||
|
Miscellaneous accrued expenses
|
129.4
|
|
127.1
|
|
||||
|
|
$
|
807.4
|
|
$
|
935.6
|
|
||
11. Debt
Outstanding debt at
December 31, 2014
and
December 31, 2013
is summarized as follows:
|
(in millions)
|
2014
|
2013
|
||||||
|
Revolving credit facility
|
$
|
—
|
|
$
|
—
|
|
||
|
Term loan A
|
336.9
|
|
162.5
|
|
||||
|
Term loan B
|
168.5
|
|
—
|
|
||||
|
Senior notes due 2018
|
—
|
|
408.4
|
|
||||
|
Senior notes due 2020
|
614.8
|
|
614.8
|
|
||||
|
Senior notes due 2022
|
296.9
|
|
289.1
|
|
||||
|
Other
|
106.4
|
|
52.0
|
|
||||
|
Total debt
|
1,523.5
|
|
1,526.8
|
|
||||
|
Less current portion and short-term borrowings
|
(80.3
|
)
|
(22.7
|
)
|
||||
|
Long-term debt
|
$
|
1,443.2
|
|
$
|
1,504.1
|
|
||
On January 3, 2014, the company entered into the
$1,050.0 million
Third Amended and Restated Credit Agreement (the “Senior Credit Facility”) with JPMorgan Chase Bank, N.A., as Administrative Agent, Deutsche Bank Securities Inc., Bank of
76
America, N.A., Wells Fargo Bank, National Association, and The Bank of Tokyo-Mitsubishi UFJ, Ltd., BMO Harris Bank N.A. and Rabobank Nederland, New York Branch as Documentation Agents. The Senior Credit Facility includes
three
different loan facilities. The first is a revolving facility in the amount of
$500.0 million
, with a term of
five
years. The second facility is a Term A Loan in the aggregate amount of
$350.0 million
, with a term of
five
years. The third facility is a Term B Loan in the amount of
$200.0 million
, with a term of
seven
years.
The Senior Credit Facility replaced the company’s prior
$1,250.0 million
Second Amended and Restated Credit Agreement (the “Prior Senior Credit Facility”), which was entered into on May 13, 2011. The Prior Senior Credit Facility included
three
different loan facilities. The first was a revolving facility in the amount of
$500.0 million
, with a term of
five
years. The second facility was an amortizing Term Loan A facility in the aggregate amount of
$350.0 million
with a term of
five
years. The third facility was an amortizing Term Loan B facility in the amount of
$400.0 million
with a term of
6.5
years.
As of
December 31, 2014
, the company had
no
borrowings on the revolving facility. During the year, the highest daily borrowing was
$467.9 million
and the average borrowing was
$342.7 million
, while the average interest rate was
2.68%
. The interest rate fluctuates based upon LIBOR or a Prime rate plus a spread which is based upon the Consolidated Total Leverage Ratio of the company. As of
December 31, 2014
, the spreads for LIBOR and Prime borrowings were
2.00%
and
1.00%
, respectively given the effective Consolidated Total Leverage Ratio for this period. The company also pays a commitment fee of
0.375%
per annum on the unused portion of the revolving facility. The company is also obligated to pay certain fees and expenses of the lenders.
As of
December 31, 2014
, the company had outstanding
$175.0 million
notional amount of float-to-fixed interest rate swaps outstanding related to Term Loan A under the New Senior Credit Facility that were designated as cash flow hedges. As a result,
$175.0 million
of Term Loan A was hedged at an interest rate of
1.635%
, plus the applicable spread based on the Consolidated Total Leverage Ratio of the company as defined under the New Senior Credit Facility.
See Note 6, “Derivative Financial Instruments” for a description of hedging instruments used to mitigate interest rate risk.
Including interest rate swaps at
December 31, 2014
, the weighted average interest rates for Term Loan A and Term Loan B loans were
2.95%
and
3.25%
, respectively. Excluding interest rate swaps, the interest rates on Term Loan A and Term Loan B were
2.19%
and
3.25%
, respectively, at
December 31, 2014
.
Loans made under the Senior Credit Facility are secured by substantially all of the assets of, and guaranteed by, the material direct and indirect domestic subsidiaries of the company, and secured by
65%
of the stock of certain foreign subsidiaries of Manitowoc. The Senior Credit Facility also requires the company to provide additional collateral to the lenders under the Senior Credit Facility in certain limited circumstances.
The Senior Credit Facility also includes customary representations and warranties and events of default and customary covenants, including without limitation (i) a requirement that the company prepay the term loan facilities from the net proceeds of asset sales, casualty losses, equity offerings, and new indebtedness for borrowed money, and from a portion of its excess cash flow, subject to certain exceptions; and (ii) limitations on indebtedness, capital expenditures, restricted payments, and acquisitions.
The Senior Credit Facility contains financial covenants including (a) a Consolidated Interest Coverage Ratio, which measures the ratio of (i) consolidated earnings before interest, taxes, depreciation and amortization, and other adjustments (Adjusted EBITDA), as defined in the credit agreement to (ii) consolidated cash interest expense, each for the most recent four fiscal quarters; and (b) a Consolidated Senior Secured Leverage Ratio, which measures the ratio of (i) consolidated senior secured indebtedness to (ii) consolidated EBITDA for the most recent four fiscal quarters. The covenant levels of the financial covenants under the New Senior Credit Facility are as set forth below:
|
Fiscal Quarter Ending
|
Consolidated Senior
Secured Leverage
Ratio
(less than)
|
Consolidated Interest
Coverage Ratio
(greater than)
|
||
|
December 31, 2014
|
3.25:1.00
|
2.50:1.00
|
||
|
March 31, 2015
|
3.25:1.00
|
2.75:1.00
|
||
|
June 30, 2015
|
3.25:1.00
|
2.75:1.00
|
||
|
September 30, 2015
|
3.25:1.00
|
2.75:1.00
|
||
|
December 31, 2015
|
3.25:1.00
|
2.75:1.00
|
||
|
March 31, 2016 and thereafter
|
3.00:1.00
|
3.00:1.00
|
||
77
As of
December 31, 2014
the company had
two
series of Senior Notes outstanding, the 2020 and 2022 Notes (collectively the “Senior Notes”). Each series of Senior Notes are unsecured senior obligations ranking subordinate to all existing senior secured indebtedness and equal to all existing senior unsecured obligations. Each series of Senior Notes is guaranteed by certain of the company’s wholly owned domestic subsidiaries, which subsidiaries also guaranty the company’s obligations under the Senior Credit Facility. Each series of Senior Notes contains affirmative and negative covenants which limit, among other things, the company’s ability to redeem or repurchase its debt, incur additional debt, make acquisitions, merge with other entities, pay dividends or distributions, repurchase capital stock, and create or become subject to liens. Each series of Senior Notes also includes customary events of default. If an event of default occurs and is continuing with respect to the Senior Notes, then the Trustee or the holders of at least
25%
of the principal amount of the outstanding Senior Notes may declare the principal and accrued interest on all of the Senior Notes to be due and payable immediately. In addition, in the case of an event of default arising from certain events of bankruptcy, all unpaid principal of, and premium, if any, and accrued and unpaid interest on all outstanding Senior Notes will become due and payable immediately.
On October 19, 2012, the company completed the sale of
$300.0 million
aggregate principal amount of its
5.875%
Senior Notes due October 2022 (the “2022 Notes”) at an issue price of
100%
. Net proceeds from the 2022 Notes were used to redeem the entire
$150.0 million
aggregate principal amount of its former 2013 Notes, to repay
$36.0 million
of Term Loan B under its Prior Senior Credit Facility, and to repay a portion of the outstanding revolver borrowings under its Prior Senior Credit Facility. Interest on the 2022 Notes is payable semi-annually on April 15 and October 15 of each year.
The following would be the principal and premium paid by the company, expressed as percentages of the principal amount thereof, if it redeems the 2022 Notes during the 12-month period commencing on October 15 of the year set forth below:
|
Year
|
Percentage
|
|
|
2017
|
102.938
|
%
|
|
2018
|
101.958
|
%
|
|
2019
|
100.979
|
%
|
|
2020 and thereafter
|
100.000
|
%
|
In addition, at any time prior to October 15, 2015, the company is permitted to, at its option, use the net cash proceeds of one or more public equity offers to redeem up to
35%
of the 2022 Notes at a redemption price of
105.875%
, plus accrued but unpaid interest, if any, to the date of redemption; provided that (1) at least
65%
of the principal amount of the 2022 Notes outstanding remains outstanding immediately after any such redemption; and (2) the company makes such redemptions not more than
90
days after the consummation of any such public offering. Further, the company is required to offer to repurchase the 2022 Notes for cash at a price of
101%
of the aggregate principal amount of the 2022 Notes, plus accrued and unpaid interest, if any, upon the occurrence of a change of control triggering event.
On October 18, 2010, the company completed the sale of
$600.0 million
aggregate principal amount of its
8.50%
Senior Notes due 2020 (the “2020 Notes”). Interest on the 2020 Notes is payable semi-annually in May and November of each year.
The following would be the principal and premium paid by the company, expressed as percentages of the principal amount thereof, if it redeems the 2020 Notes during the 12-month period commencing on November 1 of the year set forth below:
|
Year
|
Percentage
|
|
|
2015
|
104.250
|
%
|
|
2016
|
102.833
|
%
|
|
2017
|
101.417
|
%
|
|
2018 and thereafter
|
100.000
|
%
|
On February 3, 2010, the company completed the sale of
$400.0 million
aggregate principal amount of its
9.50%
Senior Notes due 2018 (the “2018 Notes”). Interest on the 2018 Notes was payable semiannually in February and August of each year. On February 18, 2014 the company redeemed its 2018 Notes for
$419.0 million
or
104.750%
, expressed as a percentage of the principal amount.
In the third quarter of 2012, the company monetized the derivative asset related to the fixed-to-float interest rate swaps related to its 2018 and 2020 Notes and received
$14.8 million
. The company treated the gain as an increase to the debt balances for each of the 2018 and 2020 Notes, and is being amortized to interest expense over the life of the original swaps.
78
In the fourth quarter of 2012, the company purchased and designated new fixed-to-float swaps as fair market value hedges of the 2022 Notes.
In May 2013, the company entered into new interest rate swaps due in 2020 and 2022, designating them as fair market value hedges of the 2020 and 2022 Notes, respectively. As of
December 31, 2014
,
$75.0 million
and
$125.0 million
of the 2020 and 2022 Notes, respectively, were swapped to floating rate interest. Including the floating rate swaps, the 2020 and 2022 Notes have an all-in interest rate of
8.31%
and
5.19%
, respectively.
See Note 6, “Derivative Financial Instruments,” for a description of hedging instruments used to mitigate interest rate risk.
The balance sheet values of the 2018, 2020, and 2022 Notes at
December 31, 2014
and
December 31, 2013
are not equal to the face value of the Senior Notes due to the fact that the fair market value of the interest rate hedges and interest rate monetization premiums on these Senior Notes are included in the balance sheet value.
The loss on debt extinguishment was
$25.5 million
during the year ended
December 31, 2014
,
o
f which
$19.0 million
related to the redemption premium on the 2018 Notes and
$4.3 million
related to the write-off of deferred financing fees associated with the 2018 Notes. Of the remaining balance, a
$2.0 million
loss related to the write-off of deferred financing fees as a result of the January 2014 Senior Credit Facility refinancing, and a
$0.2 million
loss due to the write-off of deferred financing fees due to accelerated pay downs on Term Loan B. The losses on debt extinguishment of
$3.0 million
and
$6.3 million
during the years ended December 31, 2013 and December 31, 2012, respectively, consisted entirely of the write-off of deferred financing fees due to accelerated pay downs on Term Loans A and B.
As of
December 31, 2014
, the company had outstanding
$106.4 million
of other indebtedness that has a weighted-average interest rate of approximately
5.43%
. This debt includes outstanding overdraft balances and capital lease obligations in the Americas, Asia-Pacific and European regions, as well as a
$20.3 million
loan on a model 31000 crawler crane.
The aggregate scheduled maturities of outstanding debt obligations in subsequent years are as follows:
|
(in millions)
|
|
||
|
2015
|
$
|
80.3
|
|
|
2016
|
50.4
|
|
|
|
2017
|
52.0
|
|
|
|
2018
|
58.9
|
|
|
|
2019
|
194.4
|
|
|
|
Thereafter
|
1,087.5
|
|
|
|
Total
|
$
|
1,523.5
|
|
As of
December 31, 2014
, the company was in compliance with all affirmative and negative covenants in its debt instruments, inclusive of the financial covenants pertaining to the Senior Credit Facility, the 2020 Notes, and the 2022 Notes. Based upon management’s current plans and outlook, it believes the company will be able to comply with these covenants during the subsequent 12 months. As of
December 31, 2014
our Consolidated Senior Secured Leverage Ratio was
1.79
:
1
, while the maximum ratio is
3.25
:
1
and our Consolidated Interest Coverage Ratio was
4.77
:
1
, above the minimum ratio of
2.50
:
1
.
12. Accounts Receivable Securitization
On December 15, 2014, the company completed changes to its accounts receivable securitization facility by entering into a Fifth Amended and Restated Receivables Purchase Agreement (the “Receivables Purchase Agreement”) among Manitowoc Funding, LLC (“U.S. Seller”) and Manitowoc Cayman Islands Funding Ltd. (“Cayman Seller”), as sellers, the Company, Garland Commercial Ranges Limited (“Garland”), Convotherm Elektrogeräte GmbH (“Convotherm”), Manitowoc Deutschland GmbH (“Manitowoc Deutschland”), Manitowoc Foodservice UK Limited (“Foodservice UK”), and the other persons from time to time party thereto, as servicers, and Wells Fargo Bank, N.A. (“Wells Fargo” or “Purchaser”), as purchaser and agent. Pursuant to this amendment, (i) the commitment size of this facility increased from up to
$150 million
to up to
$185 million
; and (ii) a German subsidiary (Manitowoc Deutschland) and a United Kingdom subsidiary (Foodservice UK) were added as “originators” under the facility. The company’s cost of funds under the facility continues to use a
LIBOR
index rate plus a
1.25%
fixed spread.
79
Under the Receivables Purchase Agreement (and the related Purchase and Sale Agreements referenced in the Receivables Purchase Agreement), the company’s domestic trade accounts receivable are sold to U.S. Seller which, in turn, sells, conveys, transfers and assigns to a third-party financial institution (“Purchaser”), all of the U.S. Sellers’ right, title and interest in and to a pool of receivables to the Purchaser. Certain of the company’s non-U.S. trade accounts receivable are sold to Cayman Seller which, in turn, will sell, convey, transfer and assign to Purchaser, all of Cayman Seller’s right, title and interest in and to a pool of receivables to the Purchaser.
The Purchaser receives ownership of the pool of receivables, in each instance. New receivables are purchased by U.S. Seller or Cayman Seller, as applicable, and resold to the Purchaser as cash collections reduce previously sold investments. The Manitowoc Company, Inc., Garland, Convotherm, Manitowoc Deutschland, and Foodservice UK act as the servicers of the receivables and as such administer, collect and otherwise enforce the receivables. The servicers are compensated for doing so on terms that are generally consistent with what would be charged by an unrelated servicer. As servicers, they initially receive payments made by obligors on the receivables but are required to remit those payments to the Purchaser in accordance with the Receivables Purchase Agreement. The Purchaser has no recourse for uncollectible receivables. The securitization program also contains customary affirmative and negative covenants. Among other restrictions, these covenants require the company to meet specified financial tests, which include a consolidated interest coverage ratio and a consolidated senior secured leverage ratio that are the same as the covenant ratios required per the Senior Credit Facility. As of
December 31, 2014
, the company was in compliance with all affirmative and negative covenants inclusive of the financial covenants pertaining to the Receivables Purchase Agreement, as amended. Based on management’s current plans and outlook, it believes the company will be able to comply with these covenants during the subsequent
12
months.
Due to a short average collection cycle of less than
60
days for such accounts receivable and due to the company’s collection history, the fair value of the company’s deferred purchase price notes approximates book value. The fair value of the deferred purchase price notes recorded at
December 31, 2014
and
2013
was
$50.9 million
and
$41.3 million
, respectively, and is included in accounts receivable in the accompanying Consolidated Balance Sheets.
The securitization program has a maximum capacity of
$185 million
and includes certain of the company’s U.S., Canadian, German, and UK Foodservice and U.S. and German Crane segment businesses. Trade accounts receivables sold to the Purchaser and being serviced by the company totaled
$172.8 million
at
December 31, 2014
and
$148.9 million
at
December 31, 2013
.
Transactions under the accounts receivables securitization program are accounted for as sales in accordance with ASC Topic 860, “Transfers and Servicing.” Sales of trade receivables to the Purchaser are reflected as a reduction of accounts receivable in the accompanying Consolidated Balance Sheets and the proceeds received, including collections on the deferred purchase price notes, are included in cash flows from operating activities in the accompanying Consolidated Statements of Cash Flows. The company deems the interest rate risk related to the deferred purchase price notes to be de minimis, primarily due to the short average collection cycle of the related receivables (i.e.,
60
days) as noted above.
80
13. Income Taxes
Earnings from continuing operations are summarized below:
|
(in millions)
|
2014
|
2013
|
2012
|
|||||||||
|
Earnings (loss) from continuing operations before income taxes:
|
|
|
|
|
|
|
||||||
|
Domestic
|
$
|
32.6
|
|
$
|
90.1
|
|
$
|
94.1
|
|
|||
|
Foreign
|
136.8
|
|
135.1
|
|
52.8
|
|
||||||
|
Total
|
$
|
169.4
|
|
$
|
225.2
|
|
$
|
146.9
|
|
|||
Income tax expense (benefit) from continuing operations is summarized as follows:
|
(in millions)
|
2014
|
2013
|
2012
|
|||||||||
|
Current:
|
|
|
|
|
|
|
||||||
|
Federal and state
|
$
|
(12.0
|
)
|
$
|
24.1
|
|
$
|
29.2
|
|
|||
|
Foreign
|
26.8
|
|
25.4
|
|
17.3
|
|
||||||
|
Total current
|
$
|
14.8
|
|
$
|
49.5
|
|
$
|
46.5
|
|
|||
|
Deferred:
|
|
|
|
|
|
|
||||||
|
Federal and state
|
$
|
4.5
|
|
$
|
(15.2
|
)
|
$
|
(5.2
|
)
|
|||
|
Foreign
|
(10.7
|
)
|
1.8
|
|
(3.3
|
)
|
||||||
|
Total deferred
|
$
|
(6.2
|
)
|
$
|
(13.4
|
)
|
$
|
(8.5
|
)
|
|||
|
Provision for taxes on earnings
|
$
|
8.6
|
|
$
|
36.1
|
|
$
|
38.0
|
|
|||
The federal statutory income tax rate is reconciled to the company’s effective income tax rate for continuing operations for the years ended
December 31, 2014
,
2013
and
2012
as follows, which excludes the impact of discontinued operations which had an effective tax rate of
6.9%
for
2014
:
|
|
2014
|
2013
|
2012
|
||||||
|
Federal income tax at statutory rate
|
35.0
|
%
|
35.0
|
%
|
35.0
|
%
|
|||
|
State income provision (benefit)
|
(0.4
|
)
|
(0.5
|
)
|
0.3
|
|
|||
|
Manufacturing & research incentives
|
(2.7
|
)
|
(3.3
|
)
|
(3.5
|
)
|
|||
|
Taxes on foreign income which differ from the U.S. statutory rate
|
(14.4
|
)
|
(9.3
|
)
|
(7.7
|
)
|
|||
|
Adjustments for unrecognized tax benefits
|
(1.4
|
)
|
(5.4
|
)
|
(6.7
|
)
|
|||
|
Adjustments for valuation allowances
|
26.8
|
|
(1.0
|
)
|
9.2
|
|
|||
|
Capital loss generation
|
(45.7
|
)
|
—
|
|
—
|
|
|||
|
Change in assertion over permanently reinvested foreign earnings
|
3.2
|
|
—
|
|
—
|
|
|||
|
Other items
|
4.7
|
|
0.5
|
|
(0.7
|
)
|
|||
|
Effective tax rate
|
5.1
|
%
|
16.0
|
%
|
25.9
|
%
|
|||
The 2014, 2013, and 2012 effective tax rates were favorably impacted by income earned in jurisdictions where the statutory rate was less than
35%
.
In the third quarter of 2014, the company made an election with the Internal Revenue Service to treat Enodis Holdings Ltd, the company’s UK Holding Company, as a partnership for U.S. federal income tax purposes. As a result of this status change, the company realized a $
25.6 million
capital loss tax benefit. This transaction resulted in an effective tax rate benefit of
15.1%
.
As of each reporting date, the company's management considers new evidence, both positive and negative, that could impact management's view with regard to future realization of deferred tax assets. In the second quarter of 2014, management determined that it was more likely than not that deferred taxes of
$9.0 million
related to its China crane operations were realizable, and reduced the related valuation allowance. In the third quarter of 2014, management determined that it was more likely than not that deferred taxes of
$3.6 million
related to its Spanish foodservice operations were realizable, and reduced the related valuation allowance. In the fourth quarter of 2014, due to a Spanish legislative change, management determined that it was more likely than not that additional deferred taxes of
$0.6 million
related to its Spanish foodservice operations were
81
realizable, and reduced the valuation allowance accordingly. In the fourth quarter of 2014, the company recorded a valuation allowance of
$1.1 million
on the Wisconsin net operating loss carryforwards as management determined that it was more likely than not that a portion of the losses would not be realized. The company continues to record valuation allowances on the deferred tax assets in France, Italy, Slovakia, and the UK, as it remains more likely than not that they will not be utilized.
The company will continue to periodically evaluate its valuation allowance requirements in light of changing facts and circumstances, and may adjust its deferred tax asset valuation allowances accordingly. It is reasonably possible that the company will either add to, or reverse a portion of its existing deferred tax asset valuation allowances in the future. Such changes in the deferred tax asset valuation allowances will be reflected in the current operations through the company’s income tax provision, and could have a material effect on operating results.
No items included in Other items are individually, or when appropriately aggregated, significant.
Temporary differences and carryforwards that give rise to deferred tax assets and liabilities include the following items:
|
(in millions)
|
2014
|
2013
|
||||||
|
Current deferred tax assets (liabilities):
|
|
|
|
|
||||
|
Inventories
|
$
|
29.5
|
|
$
|
32.3
|
|
||
|
Accounts receivable
|
(5.6
|
)
|
(2.1
|
)
|
||||
|
Product warranty reserves
|
19.0
|
|
20.0
|
|
||||
|
Product liability reserves
|
8.3
|
|
7.9
|
|
||||
|
Deferred revenue, current portion
|
7.7
|
|
0.6
|
|
||||
|
Deferred employee benefits
|
13.3
|
|
16.6
|
|
||||
|
Other reserves and allowances
|
5.7
|
|
16.1
|
|
||||
|
Less valuation allowance
|
(12.2
|
)
|
(3.6
|
)
|
||||
|
Net deferred tax assets, current
|
$
|
65.7
|
|
$
|
87.8
|
|
||
|
Non-current deferred tax assets (liabilities):
|
||||||||
|
Property, plant and equipment
|
$
|
(28.2
|
)
|
$
|
(32.6
|
)
|
||
|
Intangible assets
|
(281.8
|
)
|
(296.3
|
)
|
||||
|
Deferred employee benefits
|
87.7
|
|
67.1
|
|
||||
|
Product warranty reserves
|
5.2
|
|
4.2
|
|
||||
|
Tax credits
|
1.0
|
|
2.3
|
|
||||
|
Loss carryforwards
|
199.0
|
|
192.7
|
|
||||
|
Deferred revenue
|
4.0
|
|
5.9
|
|
||||
|
Other
|
(0.7
|
)
|
(2.4
|
)
|
||||
|
Total non-current deferred tax liabilities
|
(13.8
|
)
|
(59.1
|
)
|
||||
|
Less valuation allowance
|
(156.0
|
)
|
(146.2
|
)
|
||||
|
Net deferred tax liabilities, non-current
|
$
|
(169.8
|
)
|
$
|
(205.3
|
)
|
||
The net deferred tax assets (liabilities) are reflected in the Consolidated Balance Sheets for the years ended
December 31, 2014
and
December 31, 2013
as follows:
|
(in millions)
|
2014
|
2013
|
||||||
|
Current income tax asset
|
$
|
71.3
|
|
$
|
89.9
|
|
||
|
Long-term income tax assets, included in other non-current assets
|
16.4
|
|
9.0
|
|
||||
|
Current deferred income tax liability, included in accounts payable and accrued expenses
|
(5.6
|
)
|
(2.1
|
)
|
||||
|
Long-term deferred income tax liability
|
(186.2
|
)
|
(214.3
|
)
|
||||
|
Net deferred income tax liability
|
$
|
(104.1
|
)
|
$
|
(117.5
|
)
|
||
The company has not provided for additional U.S. income taxes on approximately
$652.8 million
of undistributed earnings of consolidated non-U.S. subsidiaries included in stockholders’ equity. Such earnings could become taxable upon sale or
82
liquidation of these non-U.S. subsidiaries or upon dividend repatriation of cash balances. It is not practicable to estimate the amount of the unrecognized tax liability on such earnings. At December 31, 2014, approximately
$37.2 million
of the company’s total cash and cash equivalents were held by its foreign subsidiaries. This cash is associated with earnings that the company has asserted are permanently reinvested. The company has no current plans to repatriate cash or cash equivalents held by its foreign subsidiaries because it plans to reinvest such cash and cash equivalents to support its operations and continued growth plans outside the United States through the funding of capital expenditures, acquisitions, research, operating expenses or other similar cash needs of these operations. Further, the company does not currently forecast a need for these funds in the United States because its U.S. operations and debt service are supported by the cash generated by its U.S. operations. During 2014, the company could no longer assert permanent reinvestment on one subsidiary and as a result, a liability was recorded in the amount of
$5.4 million
.
The company has approximately
$520.9 million
of state net operating loss carryforwards, which are available to reduce future state tax liabilities. These state net operating loss carryforwards expire at various times through 2031. The company has recognized a deferred tax asset of
$19.2 million
for net operating loss carryforwards generated in the state of Wisconsin.
The company has approximately
$551.5 million
of foreign loss carryforwards, which are available to reduce future foreign tax liabilities. Substantially all of the foreign loss carryforwards are not subject to any time restrictions on their future use, and
$495.7 million
are offset by a valuation allowance. The company also has approximately
$139.1 million
of U.S. capital loss carryforwards which expire in
2019
and are offset by a valuation allowance.
The company or one of its subsidiaries files income tax returns in the U.S. federal jurisdiction, and various state and foreign jurisdictions. The following table provides the open tax years for which the company could be subject to income tax examination by the tax authorities in its major jurisdictions:
|
Jurisdiction
|
Open Years
|
|
|
U.S. Federal
|
2012 — 2014
|
|
|
Wisconsin
|
2009 — 2014
|
|
|
China
|
2007 — 2014
|
|
|
France
|
2013 — 2014
|
|
|
Germany
|
2006 — 2014
|
|
The company was under examination by the Internal Revenue Service for the calendar years 2007 through 2011. The examination of the company’s 2007 through 2009 U.S. tax returns was closed during the third quarter of 2014 as the Joint Committee on Taxation concurred with the previously reached tentative resolution of the Appeals division, which was in the company’s favor. The 2010 and 2011 U.S. tax return examination was closed in the fourth quarter of 2014. The adjustments did not have a material impact on the financial statements. There have been no significant developments with respect to the company’s ongoing tax audits in other jurisdictions.
The company regularly assesses the likelihood of an adverse outcome resulting from examinations to determine the adequacy of its tax reserves. As of December 31, 2014, the company believes that it is more likely than not that the tax positions it has taken will be sustained upon the resolution of its audits resulting in no material impact on its consolidated financial position and the results of operations and cash flows. However, the final determination with respect to any tax audits, and any related litigation, could be materially different from the company’s estimates and/or from its historical income tax provisions and accruals and could have a material effect on operating results and/or cash flows in the periods for which that determination is made. In addition, future period earnings may be adversely impacted by litigation costs, settlements, penalties, and/or interest assessments.
During the years ended
December 31, 2014
,
2013
and
2012
, the company recorded a change to gross unrecognized tax benefits including interest and penalties of
$(9.8) million
,
$(20.7) million
, and
$(10.4) million
, respectively. The effective tax rate in 2014, 2013, and 2012 was favorably impacted by the release of reserves of
$8.3 million
,
$9.4 million
and
$11.6 million
, respectively, resulting from favorable audit outcomes, and other settlements.
During the years ended
December 31, 2014
,
2013
and
2012
, the company recognized in the consolidated statements of operations
$(5.2) million
,
$(9.3) million
, and
$(1.4) million
, respectively, for interest and penalties related to uncertain tax liabilities, which the company recognizes as a part of income tax expense. As of
December 31, 2014
and
2013
, the company has accrued interest and penalties of
$5.6 million
and
$12.8 million
, respectively.
83
A reconciliation of the beginning and ending amount of unrecognized tax benefits for the years ended
December 31, 2014
,
2013
and
2012
is as follows:
|
(in millions)
|
2014
|
2013
|
2012
|
|||||||||
|
Balance at beginning of year
|
$
|
35.9
|
|
$
|
47.3
|
|
$
|
56.3
|
|
|||
|
Additions based on tax positions related to the current year
|
15.5
|
|
2.0
|
|
1.8
|
|
||||||
|
Additions for tax positions of prior years
|
0.1
|
|
3.7
|
|
3.6
|
|
||||||
|
Reductions for tax positions of prior years
|
(2.7
|
)
|
(8.1
|
)
|
(11.9
|
)
|
||||||
|
Reductions based on settlements with taxing authorities
|
(7.3
|
)
|
(3.6
|
)
|
(1.1
|
)
|
||||||
|
Reductions for lapse of statute
|
(8.2
|
)
|
(5.4
|
)
|
(1.4
|
)
|
||||||
|
Balance at end of year
|
$
|
33.3
|
|
$
|
35.9
|
|
$
|
47.3
|
|
|||
Substantially all of the company’s unrecognized tax benefits as of
December 31, 2014
,
2013
and
2012
, if recognized, would affect the effective tax rate.
During the next twelve months, it is reasonably possible that federal, state and foreign tax audit resolutions could reduce unrecognized tax benefits and income tax expense by up to
$3.7 million
, either because the company’s tax positions are sustained on audit or settled, or the applicable statute of limitations closes.
14. Earnings Per Share
The following is a reconciliation of the average shares outstanding used to compute basic and diluted earnings per share:
|
|
2014
|
2013
|
2012
|
||||||
|
Basic weighted average common shares outstanding
|
134,934,892
|
|
132,894,179
|
|
131,447,895
|
|
|||
|
Effect of dilutive securities - stock awards
|
2,416,417
|
|
2,436,014
|
|
1,869,155
|
|
|||
|
Diluted weighted average common shares outstanding
|
137,351,309
|
|
135,330,193
|
|
133,317,050
|
|
|||
For the years ended
December 31, 2014
,
2013
, and
2012
,
1.2 million
,
2.3 million
, and
3.4 million
, respectively, of common shares issuable upon the exercise of stock options were anti-dilutive and were excluded from the calculation of diluted earnings per share.
15. Equity
Authorized capitalization consists of
300 million
shares of
$0.01
par value common stock and
3.5 million
shares of
$0.01
par value preferred stock. None of the preferred shares have been issued.
On March 21, 2007, the Board of Directors of the company approved the Rights Agreement between the company and Computershare Trust Company, N.A., as Rights Agent and declared a dividend distribution of
one
right (a Right) for each outstanding share of Common Stock, par value
$0.01
per share, of the company, to shareholders of record at the close of business on March 30, 2007. In addition to the Rights issued as a dividend on the record date, the Board of Directors has also determined that one Right will be issued together with each share of common stock issued by the company after March 30, 2007. Generally, each Right, when it becomes exercisable, entitles the registered holder to purchase from the company
one
share of Common Stock at a purchase price, in cash, of
$110.00
per share, subject to adjustment as set forth in the Rights Agreement.
As explained in the Rights Agreement, the Rights become exercisable on the “Distribution Date”, which is that date that any of the following occurs: (1)
10
days following a public announcement that a person or group of affiliated persons has acquired, or obtained the right to acquire, beneficial ownership of
20%
or more of the outstanding shares of Common Stock of the company; or (2)
10
business days following the commencement of a tender offer or exchange offer that would result in a person or group beneficially owning
20%
or more of such outstanding shares of Common Stock. The Rights will expire at the close of business on March 29, 2017, unless earlier redeemed or exchanged by the company as described in the Rights Agreement.
The amount and timing of the annual dividend are determined by the Board of Directors at its regular meetings each year subject to limitations within the company’s Prior and New Senior Credit Facility. In each of the years ended
December 31,
84
2014
,
December 31, 2013
and
December 31, 2012
, the company paid an annual dividend of
$0.08
per share in the fourth quarter.
Currently, the company has authorization to purchase up to
10 million
shares of common stock at management’s discretion. As of
December 31, 2014
, the company had purchased approximately
7.6 million
shares at a cost of
$49.8 million
pursuant to this authorization. The company did not purchase any shares of its common stock during
2014
,
2013
, or
2012
.
The components of accumulated other comprehensive income (loss) as of
December 31, 2014
and
2013
are as follows:
|
(in millions)
|
2014
|
2013
|
||||||
|
Foreign currency translation
|
$
|
(29.2
|
)
|
$
|
54.8
|
|
||
|
Derivative instrument fair market value, net of income taxes of $(3.2) and $0.6
|
(6.3
|
)
|
1.0
|
|
||||
|
Employee pension and postretirement benefit adjustments, net of income taxes of $(40.1) and $(26.8)
|
(95.0
|
)
|
(62.7
|
)
|
||||
|
|
$
|
(130.5
|
)
|
$
|
(6.9
|
)
|
||
A reconciliation for the changes in accumulated other comprehensive income (loss), net of tax, by component for the year ended
December 31, 2013
and
December 31, 2014
is as follows:
|
(in millions)
|
Gains and Losses on Cash Flow Hedges
|
Pension & Postretirement
|
Foreign Currency Translation
|
Total
|
||||||||||||
|
Balance at December 31, 2012
|
$
|
0.6
|
|
$
|
(80.3
|
)
|
$
|
50.3
|
|
$
|
(29.4
|
)
|
||||
|
Other comprehensive loss before reclassifications
|
$
|
1.3
|
|
$
|
13.5
|
|
$
|
4.5
|
|
$
|
19.3
|
|
||||
|
Amounts reclassified from accumulated other comprehensive income
|
(0.9
|
)
|
4.1
|
|
—
|
|
3.2
|
|
||||||||
|
Net current period other comprehensive income
|
0.4
|
|
17.6
|
|
4.5
|
|
22.5
|
|
||||||||
|
Balance at December 31, 2013
|
$
|
1.0
|
|
$
|
(62.7
|
)
|
$
|
54.8
|
|
$
|
(6.9
|
)
|
||||
|
Other comprehensive loss before reclassifications
|
(9.9
|
)
|
(35.4
|
)
|
(84.0
|
)
|
(129.3
|
)
|
||||||||
|
Amounts reclassified from accumulated other comprehensive income
|
2.6
|
|
3.1
|
|
—
|
|
5.7
|
|
||||||||
|
Net current period other comprehensive loss
|
(7.3
|
)
|
(32.3
|
)
|
(84.0
|
)
|
(123.6
|
)
|
||||||||
|
Balance at December 31, 2014
|
$
|
(6.3
|
)
|
$
|
(95.0
|
)
|
$
|
(29.2
|
)
|
$
|
(130.5
|
)
|
||||
85
A reconciliation for the reclassifications out of accumulated other comprehensive income, net of tax, for the year ended
December 31, 2014
is as follows:
|
(in millions)
|
Amount Reclassified from Accumulated Other Comprehensive Income
|
Recognized Location
|
||||
|
Gains and losses on cash flow hedges
|
||||||
|
Foreign exchange contracts
|
$
|
(2.2
|
)
|
Cost of sales
|
||
|
Commodity contracts
|
(0.1
|
)
|
Cost of sales
|
|||
|
Interest rate swap contracts: Float-to-fixed
|
(1.8
|
)
|
Interest expense
|
|||
|
(4.1
|
)
|
Total before tax
|
||||
|
1.5
|
|
Tax expense
|
||||
|
$
|
(2.6
|
)
|
Net of tax
|
|||
|
Amortization of pension and postretirement items
|
||||||
|
Amortization of prior service cost
|
0.2
|
|
(a)
|
|||
|
Actuarial losses
|
(4.3
|
)
|
(a)
|
|||
|
(4.1
|
)
|
Total before tax
|
||||
|
1.0
|
|
Tax benefit
|
||||
|
$
|
(3.1
|
)
|
Net of Tax
|
|||
|
Total reclassifications for the period
|
$
|
(5.7
|
)
|
Net of Tax
|
||
|
(a) These other comprehensive income components are included in the computation of net periodic pension cost (see Note 20, “Employee Benefit Plans,” for further details).
|
||||||
A reconciliation for the reclassifications out of accumulated other comprehensive income, net of tax, for the year ended
December 31, 2013
is as follows:
|
(in millions)
|
Amount Reclassified from Accumulated Other Comprehensive Income
|
Recognized Location
|
||||
|
Gains and losses on cash flow hedges
|
||||||
|
Foreign exchange contracts
|
$
|
3.0
|
|
Cost of sales
|
||
|
Commodity contracts
|
(1.6
|
)
|
Cost of sales
|
|||
|
1.4
|
|
Total before tax
|
||||
|
(0.5
|
)
|
Tax expense
|
||||
|
$
|
0.9
|
|
Net of tax
|
|||
|
Amortization of pension and postretirement items
|
||||||
|
Actuarial losses
|
(5.5
|
)
|
(a)
|
|||
|
(5.5
|
)
|
Total before tax
|
||||
|
1.4
|
|
Tax benefit
|
||||
|
$
|
(4.1
|
)
|
Net of Tax
|
|||
|
Total reclassifications for the period
|
$
|
(3.2
|
)
|
Net of Tax
|
||
|
(a) These other comprehensive income components are included in the computation of net periodic pension cost (see Note 20, “Employee Benefit Plans,” for further details).
|
||||||
16. Stock-Based Compensation
86
The company’s 2013 Omnibus Incentive Plan (the “2013 Omnibus Plan”) was approved by shareholders on May 7, 2013 and replaced the 2003 Incentive Stock and Awards Plan (the “2003 Stock Plan”) and 2004 Non-Employee Director Stock and Awards Plan (the “2004 Stock Plan”). The 2013 Omnibus Plan also replaced the company’s Short-Term Incentive Plan (the “STIP”) as of December 31, 2013. The 2003 Stock Plan, the 2004 Stock Plan and the STIP are referred to as the “Prior Plans.” No new awards may be granted under the Prior Plans after the respective termination dates, but the Prior Plans continue to govern awards outstanding; outstanding awards will continue in force and effect until vested, exercised or forfeited pursuant to their terms. The 2013 Omnibus Plan provides for both short-term and long-term incentive awards for employees and non-employee directors. Stock-based awards may take the form of stock options, stock appreciation rights, restricted stock, restricted stock units, and performance share or performance unit awards. The total number of shares of the company’s common stock originally available for awards under the 2013 Omnibus Plan is
8.0 million
shares and is subject to adjustments for stock splits, stock dividends and certain other transactions or events in the future.
The 2003 Stock Plan provided for both short-term and long-term incentive awards for employees. Options granted under the plan prior to 2011 became exercisable in
25% increments beginning on the second anniversary of the grant date
over a
four
-year period and expire
ten
years subsequent to the grant date. Option grants to employees beginning in 2011 became exercisable in
25% increments beginning on the first anniversary of the grant date
over a
four
-year period and expire
ten
years subsequent to the grant date. Restrictions on restricted stock awarded under this plan lapse
100% on the third anniversary of the grant date
. Performance shares granted under the 2013 Omnibus Plan and the 2003 Stock Plan are earned based on the extent to which performance goals are met over the applicable performance period. The performance goals and the applicable performance period vary for each grant year. An explanation of the performance goals and the applicable performance period for the 2014, 2013 and 2012 awards is set forth below. There have been no awards of stock appreciation rights or performance units under the 2003 Stock Plan.
The 2004 Stock Plan provided for the granting of stock options to non-employee members of the Board of Directors. No new awards may be made under the 2004 Stock Plan. Stock options awarded under the plan were granted at an exercise price equal to the market price of the common stock at the date of grant and vest immediately and expire
ten
years subsequent to the grant date. Restrictions on restricted stock awarded to date under the plan lapse on the third anniversary of the award date.
The company recognizes expense for all stock-based compensation on a straight-line basis over the vesting period of the entire award.
Total stock-based compensation expense before tax was
$12.6 million
,
$14.9 million
and
$16.4 million
during
2014
,
2013
, and
2012
, respectively.
Stock Options
Any option grants to directors are exercisable immediately upon granting and expire
ten
years subsequent to the grant date. For all outstanding grants made to officers and employees prior to 2011, options become exercisable in
25%
increments annually over a
four
-year period beginning on the second anniversary of the grant date and expire
ten
years subsequent to the grant date. Starting with 2011 grants to officers and directors, options become exercisable in
25%
increments annually over a
four
-year period beginning on the first anniversary of the grant date and expire
ten
years subsequent to the grant date.
The company granted options to acquire
0.3 million
,
0.4 million
and
0.7 million
shares of common stock during
2014
,
2013
, and
2012
, respectively. Stock-based compensation expense is calculated by estimating the fair value of incentive and non-qualified stock options at the time of grant and is amortized over the stock options’ vesting period. The company recognized
$5.7 million
(
$3.6 million
after taxes),
$6.3 million
(
$4.0 million
after taxes) and
$6.7 million
(
$4.2 million
after taxes) of compensation expense associated with stock options during
2014
,
2013
, and
2012
, respectively.
87
A summary of the company’s stock option activity is as follows (in millions, except weighted average exercise price per share):
|
Shares
|
Weighted
Average
Exercise Price
|
Aggregate
Intrinsic
Value
|
|||||||||
|
Options outstanding as of January 1, 2013
|
7.4
|
|
$
|
15.27
|
|
|
|
||||
|
Granted
|
0.4
|
|
18.14
|
|
|
|
|||||
|
Exercised
|
(0.6
|
)
|
8.35
|
|
|
|
|||||
|
Cancelled
|
(0.2
|
)
|
16.66
|
|
|
|
|||||
|
Options outstanding as of December 31, 2013
|
7.0
|
|
$
|
16.00
|
|
|
|
||||
|
Granted
|
0.3
|
|
29.08
|
|
|
|
|||||
|
Exercised
|
(1.7
|
)
|
10.92
|
|
|
|
|||||
|
Cancelled
|
—
|
|
27.07
|
|
|
|
|||||
|
Options outstanding as of December 31, 2014
|
5.6
|
|
$
|
18.23
|
|
$
|
36.3
|
|
|||
|
Options exercisable as of:
|
|
|
|
|
|
|
|||||
|
December 31, 2014
|
4.2
|
|
$
|
17.86
|
|
$
|
29.8
|
|
|||
The outstanding stock options at
December 31, 2014
have a range of exercise prices from
$4.41
to
$47.84
per share. The following table shows the options outstanding and exercisable by range of exercise prices at
December 31, 2014
(in millions, except range of exercise price per share, weighted average remaining contractual life and weighted average exercise price):
|
Outstanding
|
Weighted
Average
Remaining
Contractual
|
Weighted
Average
|
Exercisable
|
Weighted
Average
|
||||||||||||
|
Range of Exercise Price per Share
|
Options
|
Life (Years)
|
Exercise Price
|
Options
|
Exercise Price
|
|||||||||||
|
$4.41 - $9.59
|
0.7
|
|
4.0
|
$
|
4.41
|
|
0.7
|
|
$
|
4.41
|
|
|||||
|
$9.60 - $10.21
|
0.2
|
|
0.3
|
10.13
|
|
0.2
|
|
10.13
|
|
|||||||
|
$10.22 - $18.13
|
1.7
|
|
5.4
|
12.90
|
|
1.2
|
|
12.44
|
|
|||||||
|
$18.14 - $26.09
|
1.2
|
|
6.0
|
19.17
|
|
0.8
|
|
19.38
|
|
|||||||
|
$26.10- $29.06
|
0.5
|
|
1.3
|
26.11
|
|
0.5
|
|
26.11
|
|
|||||||
|
$29.07 - $30.46
|
0.8
|
|
5.2
|
29.32
|
|
0.4
|
|
29.52
|
|
|||||||
|
$30.47 - $36.03
|
0.1
|
|
9.2
|
30.47
|
|
—
|
|
—
|
|
|||||||
|
$36.04 - $47.84
|
0.4
|
|
2.9
|
38.88
|
|
0.4
|
|
38.88
|
|
|||||||
|
|
5.6
|
|
4.6
|
$
|
18.23
|
|
4.2
|
|
$
|
17.86
|
|
|||||
The company uses the Black-Scholes valuation model to value stock options. The company used its historical stock prices as the basis for its volatility assumption. The assumed risk-free rates were based on
ten
-year U.S. Treasury rates in effect at the time of grant. The expected option life represents the period of time that the options granted are expected to be outstanding and is based on historical experience.
As of
December 31, 2014
, the company has
$5.7 million
of unrecognized compensation expense before tax related to stock options, which will be recognized over a weighted average period of
2.4
years.
The weighted average fair value of options granted per share during the years ended
December 31, 2014
,
2013
, and
2012
was
$14.84
,
$9.00
, and
$7.97
, respectively. The fair value of each option grant was estimated at the date of grant using the Black-Scholes option-pricing method with the following assumptions:
|
|
2014
|
2013
|
2012
|
||||||
|
Expected Life (years)
|
6.0
|
|
6.0
|
|
6.0
|
|
|||
|
Risk-free Interest rate
|
1.9
|
%
|
1.1
|
%
|
1.1
|
%
|
|||
|
Expected volatility
|
55.0
|
%
|
56.0
|
%
|
55.0
|
%
|
|||
|
Expected dividend yield
|
0.4
|
%
|
0.6
|
%
|
0.6
|
%
|
|||
88
For the years ended
December 31, 2014
,
2013
, and
2012
the total intrinsic value of stock options exercised was
$28.5 million
,
$6.9 million
, and
$4.9 million
, respectively.
Restricted Stock Awards
The company granted restricted stock of
0.0 million
,
0.1 million
and
0.2 million
of common stock during
2014
,
2013
, and
2012
, respectively. Restricted stock award expense is based on the fair value of the company’s shares as of the grant date. The company recognized
$1.0 million
(
$0.6 million
after taxes),
$2.8 million
(
$1.8 million
after taxes), and
$4.5 million
(
$2.8 million
after taxes) of compensation expense associated with restricted stock for the years ended
December 31, 2014
,
2013
, and
2012
, respectively. The restrictions on all shares of restricted stock expire on the third anniversary of the applicable grant date.
A summary of activity for restricted stock awards for the year ended
December 31, 2014
is as follows (in millions except weighted average grant date fair value):
|
Shares
|
Weighted
Average Grant Date Fair Value |
||||||
|
Unvested as of January 1, 2014
|
0.5
|
|
$
|
18.25
|
|
||
|
Granted
|
—
|
|
—
|
|
|||
|
Vested
|
(0.3
|
)
|
19.58
|
|
|||
|
Cancelled
|
—
|
|
17.21
|
|
|||
|
Unvested as of December 31, 2014
|
0.2
|
|
$
|
16.58
|
|
||
As of
December 31, 2014
, the company has
$0.3 million
of unrecognized compensation expense before tax related to restricted stock, which will be recognized over a weighted average period of
0.8
years.
Restricted Stock Units
The company granted restricted stock units of
0.4 million
,
0.5 million
and
0.3 million
in
2014
,
2013
, and
2012
, respectively. The restricted stock units are earned either based on service over the vesting period, or based on service over the vesting period and on the extent to which performance goals are met over the applicable performance period (“performance shares”). The performance goals and the applicable performance period vary for each grant year. The company recognized
$5.9 million
(
$3.8 million
after taxes),
$5.8 million
(
$3.6 million
after taxes) and
$5.2 million
(
$3.3 million
after taxes) of compensation expense associated with restricted stock units during
2014
,
2013
and
2012
, respectively.
The restricted stock units granted to employees in 2014 vest on the third anniversary of the grant date. The restricted stock units granted to directors in 2014 vest on the second anniversary of the grant date. The performance shares granted in 2014 are earned based on the extent to which performance goals are met by the company over a
three
-year period from January 1, 2014 to December 31, 2016. The performance goals for the performance shares granted in 2014 are based fifty percent (
50%
) on total shareholder return relative to a peer group of companies over the three-year period and fifty percent (
50%
) on EVA
®
improvement over the
three
-year period. Depending on the foregoing factors, the number of shares awarded could range from
zero
to
0.5 million
for the 2014 performance share grants. For these awards, the expense is based on the fair value of the company's shares as of the grant date for the EVA
®
improvement criteria and a Monte Carlo model for the total shareholder return criteria.
The performance shares granted in 2013 are earned based on the extent to which performance goals are met by the company over a
three
-year period from January 1, 2013 to December 31, 2015. The performance goals for the performance shares granted in 2013 are based fifty percent (
50%
) on total shareholder return relative to a peer group of companies over the three-year period and fifty percent (
50%
) on debt reduction over the
three
-year period. Depending on the foregoing factors, the number of shares awarded could range from
zero
to
0.8 million
for the 2013 performance share grants. For these awards, the expense is based on the fair value of the company's shares as of the grant date for the debt reduction criteria and a Monte Carlo model for the total shareholder return criteria.
The performance shares granted in 2012 were earned based on the extent to which performance goals were met by the company over a
three
-year period from January 1, 2012 to December 31, 2014. The performance goals for the performance shares granted in 2012 were based fifty percent (
50%
) on total shareholder return relative to a peer group of companies over the
three
-year period and fifty percent (
50%
)
on improvement in the company’s total leverage ratio over the
three
-year period. Depending on the foregoing factors, the number of shares awarded could have ranged from
zero
to
0.7 million
for the 2012 performance share grants. Based on the performance criteria a total of
0.2 million
shares will be awarded. For these awards,
89
the expense is based on the fair value of the company's shares as of the grant date for the total leverage ratio criteria and a Monte Carlo model for the total shareholder return criteria.
A summary of activity for restricted stock units for the year ended
December 31, 2014
is as follows (in millions except weighted average grant date fair value):
|
Shares
|
Weighted
Average Grant Date Fair Value |
||||||
|
Unvested as of January 1, 2014
|
0.7
|
|
$
|
18.41
|
|
||
|
Granted
|
0.4
|
|
34.57
|
|
|||
|
Vested*
|
(0.3
|
)
|
17.79
|
|
|||
|
Cancelled
|
—
|
|
21.92
|
|
|||
|
Unvested as of December 31, 2014
|
0.8
|
|
$
|
27.09
|
|
||
* Under the terms of the 2012 performance share award, the actual number of shares awarded could have ranged from
zero
to
0.7 million
, depending on the company’s three-year performance as described above. Based on the performance criteria a total of
0.2 million
shares will be awarded.
As of
December 31, 2014
, the company has
$8.5 million
of unrecognized compensation expense before tax related to restricted stock units which will be recognized over a weighted average period of
1.7
years.
17. Contingencies and Significant Estimates
As of
December 31, 2014
, the company held reserves for environmental matters related to Enodis locations of approximately
$0.7 million
. At certain of the company’s other facilities, the company has identified potential contaminants in soil and groundwater. The ultimate cost of any remediation required will depend upon the results of future investigation. Based upon available information, the company does not expect the ultimate costs at any of these locations will have a material adverse effect on its financial condition, results of operations, or cash flows individually and in aggregate.
The company believes that it has obtained and is in substantial compliance with those material environmental permits and approvals necessary to conduct its various businesses. Based on the facts presently known, the company does not expect environmental compliance costs to have a material adverse effect on its financial condition, results of operations, or cash flows.
As of
December 31, 2014
, various product-related lawsuits were pending. To the extent permitted under applicable law, all of these are insured with self-insurance retention levels. The company’s self-insurance retention levels vary by business, and have fluctuated over the last
ten
years. The range of the company’s self-insured retention levels is
$0.1 million
to
$3.0 million
per occurrence. The high-end of the company’s self-insurance retention level is a legacy product liability insurance program inherited in the Grove acquisition for cranes manufactured in the United States for occurrences from January 2000 through October 2002. As of
December 31, 2014
, the largest self-insured retention level for new occurrences currently maintained by the company is
$2.0 million
per occurrence and applies to product liability claims for cranes manufactured in the United States.
Product liability reserves in the Consolidated Balance Sheets at
December 31, 2014
and
December 31, 2013
were
$24.6 million
and
$25.0 million
, respectively;
$4.0 million
and
$5.7 million
, respectively, was reserved specifically for actual cases, and
$20.6 million
and
$19.3 million
, respectively, for claims incurred but not reported, which were estimated using actuarial methods. Based on the company’s experience in defending product liability claims, management believes the current reserves are adequate for estimated case resolutions on aggregate self-insured claims and insured claims. Any recoveries from insurance carriers are dependent upon the legal sufficiency of claims and solvency of insurance carriers.
At
December 31, 2014
and
December 31, 2013
, the company had reserved
$92.2 million
and
$99.0 million
, respectively, for warranty claims included in product warranties and other non-current liabilities in the Consolidated Balance Sheets. Certain of these warranty and other related claims involve matters in dispute that ultimately are resolved by negotiations, arbitration, or litigation. See Note 18, “Guarantees,” for further information.
90
It is reasonably possible that the estimates for environmental remediation, product liability and warranty costs may change in the near future based upon new information that may arise or matters that are beyond the scope of the company’s historical experience. Presently, there are no reliable methods to estimate the amount of any such potential changes.
The company is involved in numerous lawsuits involving asbestos-related claims in which the company is one of numerous defendants. After taking into consideration legal counsel’s evaluation of such actions, the current political environment with respect to asbestos related claims, and the liabilities accrued with respect to such matters, in the opinion of management, ultimate resolution is not expected to have a material adverse effect on the financial condition, results of operations, or cash flows of the company.
The company is also involved in various legal actions arising out of the normal course of business, which, taking into account the liabilities accrued and legal counsel’s evaluation of such actions, in the opinion of management, the ultimate resolution of all matters is not expected to have a material adverse effect on the company’s financial condition, results of operations, or cash flows.
18. Guarantees
The company periodically enters into transactions with customers that provide for residual value guarantees and buyback commitments. These initial transactions are recorded as deferred revenue and are amortized to income on a straight-line basis over a period equal to that of the customer’s third party financing agreement. The deferred revenue included in other current and non-current liabilities at
December 31, 2014
and
December 31, 2013
, was
$59.5 million
and
$62.6 million
, respectively. The total amount of residual value guarantees and buyback commitments given by the company and outstanding at
December 31, 2014
and
December 31, 2013
, was
$58.9 million
and
$66.8 million
, respectively. These amounts are not reduced for amounts the company would recover from repossessing and subsequent resale of the units. The residual value guarantees and buyback commitments expire at various times through 2018.
During the years ended
December 31, 2014
and
2013
, the company sold
$17.0 million
and
$31.2 million
, respectively, of its long-term notes receivable to third party financing companies. The company guarantees some percentage, up to
100%
, of collection of the notes to the financing companies. The company has accounted for the sales of the notes as a financing of receivables. The receivables remain on the company’s Consolidated Balance Sheets, net of payments made, in other current and non-current assets and the company has recognized an obligation equal to the net outstanding balance of the notes in other current and non-current liabilities in the Consolidated Balance Sheets. The cash flow benefit of these transactions is reflected as financing activities in the Consolidated Statements of Cash Flows. During the years ended
December 31, 2014
and
2013
customers have paid
$17.3 million
and
$24.6 million
, respectively, of the notes to the third party financing companies. As of
December 31, 2014
and
2013
, the outstanding balance of the notes receivables guaranteed by the company was
$34.0 million
and
$34.3 million
, respectively.
In the normal course of business, the company provides its customers a warranty covering workmanship, and in some cases materials, on products manufactured by the company. Such warranty generally provides that products will be free from defects for periods ranging from
12
months to
60
months with certain equipment having longer-term warranties. If a product fails to comply with the company’s warranty, the company may be obligated, at its expense, to correct any defect by repairing or replacing such defective products. The company provides for an estimate of costs that may be incurred under its warranty at the time product revenue is recognized. These costs primarily include labor and materials, as necessary, associated with repair or replacement. The primary factors that affect the company’s warranty liability include the number of units shipped and historical and anticipated warranty claims. As these factors are impacted by actual experience and future expectations, the company assesses the adequacy of its recorded warranty liability and adjusts the amounts as necessary. Below is a table summarizing the warranty activity for the years ended
December 31, 2014
and
2013
:
|
(in millions)
|
2014
|
2013
|
||||||
|
Balance at beginning of period
|
$
|
99.0
|
|
$
|
101.2
|
|
||
|
Accruals for warranties issued during the period
|
59.8
|
|
58.6
|
|
||||
|
Acquisition
|
—
|
|
0.2
|
|
||||
|
Settlements made (in cash or in kind) during the period
|
(63.4
|
)
|
(61.7
|
)
|
||||
|
Currency translation
|
(3.2
|
)
|
0.7
|
|
||||
|
Balance at end of period
|
$
|
92.2
|
|
$
|
99.0
|
|
||
19. Restructuring
91
During the fourth quarter of 2014, the company committed to a restructuring plan to reduce the cost structure of its Crane operations through site closings, consolidations, and reductions in workforce across the globe. This is further to a restructuring plan committed to in 2012 to reduce the cost structure primarily in the French crane facilities. These restructuring plans are designed to better align the company’s resources given global economic conditions.
The following is a rollforward of all restructuring activities relating to the Crane segment for the twelve-month period ended
December 31, 2014
(in millions):
|
Restructuring
Reserve Balance as
of
December 31, 2013
|
Restructuring
Charges
|
Use of Reserve
|
Restructuring
Reserve Balance as
of
December 31, 2014
|
|||||||||||
|
$
|
4.3
|
|
$
|
6.6
|
|
$
|
(6.2
|
)
|
$
|
4.7
|
|
|||
In conjunction with the acquisition of Enodis in October 2008, certain restructuring activities were undertaken to recognize cost synergies and rationalize the new cost structure of the Foodservice segment. The company recorded additional amounts in 2014 primarily related to employee termination benefits due to the movement of certain Ice manufacturing activities from Manitowoc, Wisconsin, to Monterrey, Mexico.
The following is a rollforward of all restructuring activities relating to the Foodservice segment for the twelve-month period ended
December 31, 2014
(in millions):
|
Restructuring
Reserve Balance as
of
December 31, 2013
|
Restructuring
Charges
|
Use of Reserve
|
Restructuring
Reserve Balance as
of
December 31, 2014
|
|||||||||||
|
$
|
16.3
|
|
$
|
2.4
|
|
$
|
(3.1
|
)
|
$
|
15.6
|
|
|||
20. Employee Benefit Plans
The company maintains
three
defined contribution retirement plans for its employees: (1) The Manitowoc Company, Inc. 401(k) Retirement Plan (the “Manitowoc 401(k) Retirement Plan”); (2) The Manitowoc Company, Inc. Retirement Savings Plan (the “Manitowoc Retirement Savings Plan”); and (3) The Manitowoc Company, Inc. Deferred Compensation Plan (the “Manitowoc Deferred Compensation Plan”). Each plan results in individual participant balances that reflect a combination of amounts contributed by the company or deferred by the participant, amounts invested at the direction of either the company or the participant, and the continuing reinvestment of returns until the accounts are distributed.
Manitowoc 401(k) Retirement Plan
The Manitowoc 401(k) Retirement Plan is a tax-qualified retirement plan that is available to substantially all non-union U.S. employees of Manitowoc, its subsidiaries and related entities. The company merged the accounts of non-union participants in the Enodis Corporation 401(k) Plan with and into the Manitowoc 401(k) Retirement Plan on December 31, 2009.
The Manitowoc 401(k) Retirement Plan allows employees to make both pre- and post-tax elective deferrals, subject to certain limitations under the Internal Revenue Code of 1986, as amended (the “Tax Code”). The company also has the right to make the following additional contributions: (1) a matching contribution based upon individual employee deferrals; (2) an economic value added (“EVA”) based company contribution; and (3) an additional non-EVA-based company contribution. Each participant in the Manitowoc 401(k) Retirement Plan is allowed to direct the investment of that participant’s account among a diverse mix of investment funds, including a company stock alternative. To the extent that any funds are invested in company stock, that portion of the Manitowoc 401(k) Retirement Plan is an employee stock ownership plan, as defined under the Tax Code (an “ESOP”).
The terms governing the retirement benefits under the Manitowoc 401(k) Retirement Plan are the same for the company’s executive officers as they are for other eligible employees in the U.S.
Manitowoc Retirement Savings Plan
The Manitowoc Retirement Savings Plan is a tax-qualified retirement plan that is available to certain collectively bargained U.S. employees of Manitowoc, its subsidiaries and related entities. The company merged the following plans with and into the Manitowoc Retirement Savings Plan on December 31, 2009: (1) The Manitowoc Cranes, Inc. Hourly-Paid Employees’ Deferred Profit-Sharing Plan; (2) the Manitowoc Ice, Inc. Hourly-Paid Employees’ Deferred Profit-Sharing Plan; and (3) the accounts of collectively bargained participants in the Enodis Corporation 401(k) Plan.
92
The Manitowoc Retirement Savings Plan allows employees to make both pre- and post-tax elective deferrals, subject to certain limitations under the Tax Code. The company also has the right to make the following additional contributions: (1) a matching contribution based upon individual employee deferrals; and (2) an additional discretionary or fixed company contribution. Each participant in the Manitowoc Retirement Savings Plan is allowed to direct the investment of that participant’s account among a diverse mix of investment funds, including a company stock alternative. To the extent that any funds are invested in company stock, that portion of the Manitowoc Retirement Savings Plan is an ESOP.
The company’s executives are not eligible to participate in the Manitowoc Retirement Savings Plan. Company contributions to the plans are based upon formulas contained in the plans. Total costs incurred under these plans were
$6.1 million
,
$6.2 million
and
$4.1 million
for the years ended
December 31, 2014
,
2013
and
2012
, respectively.
Manitowoc Deferred Compensation Plan
The Manitowoc Deferred Compensation Plan is a non-tax-qualified supplemental deferred compensation plan for highly compensated and key management employees and for directors. On December 31, 2009, the company merged the Enodis Corporation Supplemental Executive Retirement Plan, another defined contribution deferred compensation plan, with and into the Manitowoc Deferred Compensation Plan. The company maintains the Manitowoc Deferred Compensation Plan to allow eligible individuals to save for retirement in a tax-efficient manner despite Tax Code restrictions that would otherwise impair their ability to do so under the Manitowoc 401(k) Retirement Plan. The Manitowoc Deferred Compensation Plan also assists the company in retaining those key employees and directors.
The Manitowoc Deferred Compensation Plan accounts are credited with: (1) elective deferrals made at the request of the individual participant; and/or (2) a discretionary company contribution for each individual participant. Although unfunded within the meaning of the Tax Code, the Manitowoc Deferred Compensation Plan utilizes a rabbi trust to hold assets intended to satisfy the company’s corresponding future benefit obligations. Each participant in the Manitowoc Deferred Compensation Plan is credited with interest based upon individual elections from amongst a diverse mix of investment funds that are intended to reflect investment funds similar to those offered under the Manitowoc 401(k) Retirement Plan, including company stock. Participants do not receive preferential or above-market rates of return under the Manitowoc Deferred Compensation Plan.
Plan participants are able to direct deferrals and company matching contributions into
two
separate investment programs, Program A and Program B.
The investment assets in Program A and B are held in
two
separate Deferred Compensation Plans, which restrict the company’s use and access to the funds, but which are also subject to the claims of the company’s general creditors in rabbi trusts. Program A invests solely in the company’s stock; dividends paid on the company’s stock are automatically reinvested; and all distributions must be made in company stock. Program B offers a variety of investment options but does not include company stock as an investment option. All distributions from Program B must be made in cash. Participants cannot transfer assets between programs.
Program A is accounted for as a plan that does not permit diversification. As a result, the company stock held by Program A is classified in equity in a manner similar to accounting for treasury stock. The deferred compensation obligation is classified as an equity instrument. Changes in the fair value of the company’s stock and the compensation obligation are not recognized. The asset and obligation for Program A were both
$1.4 million
at
December 31, 2014
and
$2.2 million
at
December 31, 2013
. These amounts are offset in the Consolidated Statements of Stockholders’ Equity and Comprehensive Income.
Program B is accounted for as a plan that permits diversification. As a result, the assets held by Program B are classified as an asset in the Consolidated Balance Sheets and changes in the fair value of the assets are recognized in earnings. The deferred compensation obligation is classified as a liability in the Consolidated Balance Sheets and adjusted, with a charge or credit to compensation cost, to reflect changes in the fair value of the obligation. The assets, which are included in other non-current assets, and obligation, which are included in other non-current liabilities, were both
$16.5 million
at
December 31, 2014
and
$15.4 million
at
December 31, 2013
. There was no net impact on the Consolidated Statements of Operations for the years ended
December 31, 2014
,
2013
and
2012
.
Pension, Postretirement Health and Other Benefit Plans
The company provides certain pension, health care and death benefits for eligible retirees and their dependents. The pension benefits are funded, while the health care and death benefits are not funded but are paid as incurred. Eligibility for coverage is based on meeting certain years of service and retirement qualifications. These benefits may be subject to deductibles, co-payment provisions, and other limitations. The company has reserved the right to modify these benefits. As of December 31, 2010, all of the remaining United States defined benefit plans were merged into a single plan: the Manitowoc U.S. Pension Plan. All merged plans had benefit accruals frozen prior to merger of plan.
93
The components of period benefit costs for the years ended
December 31, 2014
,
2013
and
2012
are as follows:
|
|
US Pension Plans
|
Non-US Pension Plans
|
Postretirement Health
and Other
|
|||||||||||||||||||||||||||||||||
|
(in millions)
|
2014
|
2013
|
2012
|
2014
|
2013
|
2012
|
2014
|
2013
|
2012
|
|||||||||||||||||||||||||||
|
Service cost - benefits earned during the year
|
$
|
—
|
|
$
|
—
|
|
$
|
—
|
|
$
|
2.4
|
|
$
|
2.4
|
|
$
|
2.2
|
|
$
|
0.4
|
|
$
|
0.6
|
|
$
|
0.8
|
|
|||||||||
|
Interest cost of projected benefit obligation
|
10.3
|
|
9.6
|
|
10.2
|
|
11.3
|
|
9.8
|
|
10.2
|
|
2.1
|
|
2.0
|
|
2.8
|
|
||||||||||||||||||
|
Expected return on assets
|
(9.5
|
)
|
(10.2
|
)
|
(10.2
|
)
|
(9.4
|
)
|
(7.4
|
)
|
(8.2
|
)
|
—
|
|
—
|
|
—
|
|
||||||||||||||||||
|
Amortization of prior service cost
|
—
|
|
—
|
|
—
|
|
0.1
|
|
0.1
|
|
0.1
|
|
(0.3
|
)
|
(0.1
|
)
|
—
|
|
||||||||||||||||||
|
Amortization of actuarial net loss (gain)
|
2.9
|
|
3.5
|
|
2.9
|
|
1.5
|
|
1.9
|
|
0.8
|
|
(0.1
|
)
|
—
|
|
0.4
|
|
||||||||||||||||||
|
Curtailment gain recognized
|
—
|
|
—
|
|
—
|
|
—
|
|
—
|
|
—
|
|
—
|
|
(0.8
|
)
|
—
|
|
||||||||||||||||||
|
Settlement gain recognized
|
—
|
|
—
|
|
—
|
|
—
|
|
—
|
|
(1.6
|
)
|
—
|
|
—
|
|
—
|
|
||||||||||||||||||
|
Net periodic benefit cost
|
$
|
3.7
|
|
$
|
2.9
|
|
$
|
2.9
|
|
$
|
5.9
|
|
$
|
6.8
|
|
$
|
3.5
|
|
$
|
2.1
|
|
$
|
1.7
|
|
$
|
4.0
|
|
|||||||||
|
Weighted average assumptions:
|
|
|
|
|
|
|
|
|
|
|
|
|
|
|
|
|
|
|
||||||||||||||||||
|
Discount rate
|
4.9
|
%
|
4.1
|
%
|
4.6
|
%
|
4.3
|
%
|
4.0
|
%
|
4.7
|
%
|
4.5
|
%
|
3.5
|
%
|
4.6
|
%
|
||||||||||||||||||
|
Expected return on plan assets
|
6.0
|
%
|
5.8
|
%
|
6.0
|
%
|
4.5
|
%
|
3.9
|
%
|
4.5
|
%
|
N/A
|
|
N/A
|
|
N/A
|
|
||||||||||||||||||
|
Rate of compensation increase
|
N/A
|
|
N/A
|
|
N/A
|
|
4.3
|
%
|
3.8
|
%
|
3.7
|
%
|
1.5
|
%
|
3.0
|
%
|
3.0
|
%
|
||||||||||||||||||
The prior service costs are amortized on a straight-line basis over the average remaining service period of active participants. Gains and losses in excess of
10%
of the greater of the benefit obligation and the market-related value of assets are amortized over the average remaining service period of active participants.
To develop the expected long-term rate of return on assets assumptions, the company considered the historical returns and future expectations for returns in each asset class, as well as targeted asset allocation percentages within the pension portfolio.
94
The following is a reconciliation of the changes in benefit obligation, the changes in plan assets, and the funded status as of
December 31, 2014
and
2013
:
|
|
US Pension Plans
|
Non-US Pension Plans
|
Postretirement
Health
and Other
|
|||||||||||||||||||||
|
(in millions)
|
2014
|
2013
|
2014
|
2013
|
2014
|
2013
|
||||||||||||||||||
|
Change in Benefit Obligation
|
|
|
|
|
|
|
|
|
|
|
|
|
||||||||||||
|
Benefit obligation, beginning of year
|
$
|
213.7
|
|
$
|
241.4
|
|
$
|
263.2
|
|
$
|
255.0
|
|
$
|
48.5
|
|
$
|
57.5
|
|
||||||
|
Service cost
|
—
|
|
—
|
|
2.4
|
|
2.4
|
|
0.4
|
|
0.6
|
|
||||||||||||
|
Interest cost
|
10.3
|
|
9.6
|
|
11.3
|
|
9.8
|
|
2.1
|
|
2.0
|
|
||||||||||||
|
Participant contributions
|
—
|
|
—
|
|
0.1
|
|
0.1
|
|
2.3
|
|
2.6
|
|
||||||||||||
|
Medicare subsidies received
|
—
|
|
—
|
|
—
|
|
—
|
|
0.4
|
|
0.4
|
|
||||||||||||
|
Plan curtailments
|
—
|
|
—
|
|
—
|
|
—
|
|
—
|
|
(0.7
|
)
|
||||||||||||
|
Plan settlements
|
1.7
|
|
—
|
|
—
|
|
(0.1
|
)
|
—
|
|
—
|
|
||||||||||||
|
Plan amendments
|
—
|
|
—
|
|
—
|
|
—
|
|
—
|
|
(0.4
|
)
|
||||||||||||
|
Net transfer out
|
—
|
|
—
|
|
(0.3
|
)
|
(0.3
|
)
|
—
|
|
—
|
|
||||||||||||
|
Actuarial (gain) loss
|
30.2
|
|
(19.4
|
)
|
32.9
|
|
3.9
|
|
10.3
|
|
(7.2
|
)
|
||||||||||||
|
Currency translation adjustment
|
—
|
|
—
|
|
(17.4
|
)
|
4.6
|
|
(0.1
|
)
|
(0.2
|
)
|
||||||||||||
|
Benefits paid
|
(20.0
|
)
|
(17.9
|
)
|
(12.7
|
)
|
(12.2
|
)
|
(6.9
|
)
|
(6.1
|
)
|
||||||||||||
|
Benefit obligation, end of year
|
$
|
235.9
|
|
$
|
213.7
|
|
$
|
279.5
|
|
$
|
263.2
|
|
$
|
57.0
|
|
$
|
48.5
|
|
||||||
|
Change in Plan Assets
|
|
|
|
|
|
|
|
|
|
|
|
|
||||||||||||
|
Fair value of plan assets, beginning of year
|
$
|
162.6
|
|
$
|
180.6
|
|
$
|
211.1
|
|
$
|
199.5
|
|
$
|
—
|
|
$
|
—
|
|
||||||
|
Actual return on plan assets
|
16.1
|
|
(1.3
|
)
|
22.4
|
|
16.5
|
|
—
|
|
—
|
|
||||||||||||
|
Employer contributions
|
1.3
|
|
1.2
|
|
4.8
|
|
4.2
|
|
4.2
|
|
3.1
|
|
||||||||||||
|
Participant contributions
|
—
|
|
—
|
|
0.1
|
|
0.1
|
|
2.3
|
|
2.6
|
|
||||||||||||
|
Medicare subsidies received
|
—
|
|
—
|
|
—
|
|
—
|
|
0.4
|
|
0.4
|
|
||||||||||||
|
Plan settlements
|
—
|
|
—
|
|
—
|
|
(0.1
|
)
|
—
|
|
—
|
|
||||||||||||
|
Currency translation adjustment
|
—
|
|
—
|
|
(11.7
|
)
|
3.5
|
|
—
|
|
—
|
|
||||||||||||
|
Net transfer out
|
—
|
|
—
|
|
—
|
|
(0.4
|
)
|
—
|
|
—
|
|
||||||||||||
|
Benefits paid
|
(20.0
|
)
|
(17.9
|
)
|
(12.7
|
)
|
(12.2
|
)
|
(6.9
|
)
|
(6.1
|
)
|
||||||||||||
|
Fair value of plan assets, end of year
|
160.0
|
|
162.6
|
|
214.0
|
|
211.1
|
|
—
|
|
—
|
|
||||||||||||
|
Funded status
|
$
|
(75.9
|
)
|
$
|
(51.1
|
)
|
$
|
(65.5
|
)
|
$
|
(52.1
|
)
|
$
|
(57.0
|
)
|
$
|
(48.5
|
)
|
||||||
|
Amounts recognized in the Consolidated Balance sheet at December 31
|
|
|
|
|
|
|
|
|
|
|
|
|
||||||||||||
|
Pension asset
|
$
|
—
|
|
$
|
—
|
|
$
|
—
|
|
$
|
0.3
|
|
$
|
—
|
|
$
|
—
|
|
||||||
|
Pension obligation
|
(75.9
|
)
|
(51.1
|
)
|
(65.5
|
)
|
(52.4
|
)
|
—
|
|
—
|
|
||||||||||||
|
Postretirement health and other benefit obligations
|
—
|
|
—
|
|
—
|
|
—
|
|
(57.0
|
)
|
(48.5
|
)
|
||||||||||||
|
Net amount recognized
|
$
|
(75.9
|
)
|
$
|
(51.1
|
)
|
$
|
(65.5
|
)
|
$
|
(52.1
|
)
|
$
|
(57.0
|
)
|
$
|
(48.5
|
)
|
||||||
|
Weighted-Average Assumptions
|
|
|
|
|
|
|
|
|
|
|
|
|
||||||||||||
|
Discount rate
|
4.1
|
%
|
4.9
|
%
|
3.3
|
%
|
4.3
|
%
|
3.7
|
%
|
4.5
|
%
|
||||||||||||
|
Expected return on plan assets
|
6.0
|
%
|
5.8
|
%
|
4.5
|
%
|
3.9
|
%
|
N/A
|
|
N/A
|
|
||||||||||||
|
Rate of compensation increase
|
N/A
|
|
N/A
|
|
3.9
|
%
|
4.3
|
%
|
1.5
|
%
|
1.5
|
%
|
||||||||||||
95
Amounts recognized in accumulated other comprehensive income as of
December 31, 2014
and
2013
, consist of the following:
|
|
Pensions
|
Postretirement
Health and Other
|
||||||||||||||
|
(in millions)
|
2014
|
2013
|
2014
|
2013
|
||||||||||||
|
Net actuarial gain (loss)
|
$
|
(128.5
|
)
|
$
|
(93.4
|
)
|
$
|
(5.8
|
)
|
$
|
4.6
|
|
||||
|
Prior service credit
|
(0.8
|
)
|
(1.0
|
)
|
—
|
|
0.3
|
|
||||||||
|
Total amount recognized
|
$
|
(129.3
|
)
|
$
|
(94.4
|
)
|
$
|
(5.8
|
)
|
$
|
4.9
|
|
||||
The amounts in accumulated other comprehensive income that are expected to be recognized as components of net periodic benefit cost during the next fiscal year are
$7.5 million
for the pension plan and expense of
$0.1 million
for the postretirement health and other plans.
For measurement purposes, a
6.4%
annual rate of increase in the per capita cost of covered health care benefits was assumed for
2014
. The rate was assumed to decrease gradually to
4.5%
for 2027 and remain at that level thereafter. Assumed health care cost trend rates have a significant effect on the amounts reported for the health care plans. The following table summarizes the sensitivity of our
December 31, 2014
retirement obligations and 2015 retirement benefit costs of our plans to changes in the key assumptions used to determine those results (in millions):
|
Change in assumption:
|
Estimated increase
(decrease) in 2015 pension
cost
|
Estimated increase
(decrease) in Projected
Benefit Obligation for the
year ended December 31,
2014
|
Estimated increase
(decrease) in 2015 Other
Postretirement Benefit
costs
|
Estimated increase
(decrease) in Other
Postretirement Benefit
Obligation for the year
ended December 31, 2014
|
||||||||||||
|
0.50% increase in discount rate
|
$
|
(1.5
|
)
|
$
|
(31.7
|
)
|
$
|
—
|
|
$
|
(2.5
|
)
|
||||
|
0.50% decrease in discount rate
|
2.2
|
|
37.5
|
|
0.2
|
|
2.7
|
|
||||||||
|
0.50% increase in long-term return on assets
|
(1.8
|
)
|
N/A
|
|
N/A
|
|
N/A
|
|
||||||||
|
0.50% decrease in long-term return on assets
|
1.8
|
|
N/A
|
|
N/A
|
|
N/A
|
|
||||||||
|
1% increase in medical trend rates
|
N/A
|
|
N/A
|
|
0.9
|
|
5.0
|
|
||||||||
|
1% decrease in medical trend rates
|
N/A
|
|
N/A
|
|
(0.4
|
)
|
(4.4
|
)
|
||||||||
It is reasonably possible that the estimate for future retirement and health costs may change in the near future due to changes in the health care environment or changes in interest rates that may arise. Presently, there is no reliable means to estimate the amount of any such potential changes.
The weighted-average asset allocations of the U.S. pension plans at
December 31, 2014
and
2013
, by asset category are as follows:
|
|
2014
|
2013
|
||||
|
Equity
|
24.5
|
%
|
26.1
|
%
|
||
|
Fixed income
|
74.9
|
%
|
73.4
|
%
|
||
|
Other
|
0.6
|
%
|
0.5
|
%
|
||
|
|
100.0
|
%
|
100.0
|
%
|
||
96
The weighted-average asset allocations of the Non U.S. pension plans at
December 31, 2014
and
2013
, by asset category are as follows:
|
|
2014
|
2013
|
||||
|
Equity
|
25.0
|
%
|
20.2
|
%
|
||
|
Fixed income
|
19.6
|
%
|
23.8
|
%
|
||
|
Other
|
55.4
|
%
|
56.0
|
%
|
||
|
|
100.0
|
%
|
100.0
|
%
|
||
The Board of Directors has established the Retirement Plan Committee (the “Committee”) to manage the operations and administration of all benefit plans and related trusts. The Committee is committed to diversification to reduce the risk of large losses. On a quarterly basis, the Committee reviews progress toward achieving the pension plans’ and individual managers’ performance objectives.
Investment Strategy
The overall objective of the company's pension assets is to earn a rate of return over time to satisfy the benefit obligations of the pension plans and to maintain sufficient liquidity to pay benefits and address other cash requirements of the pension fund. Specific investment objectives for our long-term investment strategy include reducing the volatility of pension assets relative to pension liabilities, achieving a competitive, total investment return, achieving diversification between and within asset classes and managing other risks. Investment objectives for each asset class are determined based on specific risks and investment opportunities identified.
The company reviews its long-term, strategic asset allocations annually. The company uses various analytics to determine the optimal asset mix and consider plan liability characteristics, liquidity characteristics, funding requirements, expected rates of return and the distribution of returns. The company identifies investment benchmarks for the asset classes in the strategic asset allocation that are market-based and investable where possible.
Actual allocations to each asset class vary from target allocations due to periodic investment strategy changes, market value fluctuations, the length of time it takes to fully implement investment allocation positions and the timing of benefit payments and contributions. The asset allocation is monitored and rebalanced on a monthly basis.
The actual allocations for the pension assets at
December 31, 2014
, and target allocations by asset class, are as follows:
|
|
Target Allocations
|
Weighted Average Asset Allocations
|
||||||||
|
|
U.S. Plans
|
International Plans
|
U.S. Plans
|
International Plans
|
||||||
|
Equity Securities
|
25
|
%
|
0 - 25%
|
24.5
|
%
|
25.0
|
%
|
|||
|
Debt Securities
|
75
|
%
|
0 - 100%
|
74.9
|
%
|
19.6
|
%
|
|||
|
Other
|
—
|
%
|
0 - 100%
|
0.6
|
%
|
55.4
|
%
|
|||
Risk Management
In managing the plan assets, we review and manage risk associated with funded status risk, interest rate risk, market risk, counterparty risk, liquidity risk and operational risk. Liability management and asset class diversification are central to our risk management approach and are integral to the overall investment strategy. Further, asset classes are constructed to achieve diversification by investment strategy, by investment manager, by industry or sector and by holding. Investment manager guidelines for publicly traded assets are specified and are monitored regularly.
Fair Value Measurements
The following table presents our plan assets using the fair value hierarchy as of
December 31, 2014
and
2013
. The fair value hierarchy has three levels based on the reliability of the inputs used to determine fair value. Level 1 refers to fair values determined based on quoted prices in active markets for identical assets. Level 2 refers to fair values estimated using significant other observable inputs, and Level 3 includes fair values estimated using significant non-observable inputs.
97
|
|
December 31, 2014
|
|||||||||||||||
|
Assets (in millions)
|
Quoted Prices in Active
Markets for Identical
Assets
(Level 1)
|
Significant Other
Observable Inputs
(Level 2)
|
Unobservable Inputs
(Level 3)
|
Total
|
||||||||||||
|
Cash
|
$
|
1.7
|
|
$
|
—
|
|
$
|
—
|
|
$
|
1.7
|
|
||||
|
Insurance group annuity contracts
|
—
|
|
—
|
|
117.7
|
|
117.7
|
|
||||||||
|
Common/collective trust funds — Government debt
|
—
|
|
—
|
|
—
|
|
—
|
|
||||||||
|
Common/collective trust funds — Corporate and other non-government debt
|
—
|
|
47.5
|
|
—
|
|
47.5
|
|
||||||||
|
Common/collective trust funds — Government, corporate and other non-government debt
|
—
|
|
109.9
|
|
—
|
|
109.9
|
|
||||||||
|
Common/collective trust funds — Corporate equity
|
—
|
|
92.9
|
|
—
|
|
92.9
|
|
||||||||
|
Common/collective trust funds — Customized strategy
|
—
|
|
4.3
|
|
—
|
|
4.3
|
|
||||||||
|
Total
|
$
|
1.7
|
|
$
|
254.6
|
|
$
|
117.7
|
|
$
|
374.0
|
|
||||
|
|
December 31, 2013
|
|||||||||||||||
|
Assets (in millions)
|
Quoted Prices in Active
Markets for Identical
Assets
(Level 1)
|
Significant Other
Observable Inputs
(Level 2)
|
Unobservable Inputs
(Level 3)
|
Total
|
||||||||||||
|
Cash
|
$
|
1.7
|
|
$
|
—
|
|
$
|
—
|
|
$
|
1.7
|
|
||||
|
Insurance group annuity contracts
|
—
|
|
—
|
|
118.3
|
|
118.3
|
|
||||||||
|
Common/collective trust funds — Government debt
|
—
|
|
3.0
|
|
—
|
|
3.0
|
|
||||||||
|
Common/collective trust funds — Corporate and other non-government debt
|
—
|
|
49.6
|
|
—
|
|
49.6
|
|
||||||||
|
Common/collective trust funds — Government, corporate and other non-government debt
|
—
|
|
111.6
|
|
—
|
|
111.6
|
|
||||||||
|
Common/collective trust funds — Corporate equity
|
—
|
|
84.3
|
|
—
|
|
84.3
|
|
||||||||
|
Common/collective trust funds — Customized strategy
|
—
|
|
5.2
|
|
—
|
|
5.2
|
|
||||||||
|
Total
|
$
|
1.7
|
|
$
|
253.7
|
|
$
|
118.3
|
|
$
|
373.7
|
|
||||
Cash equivalents and other short-term investments, which are used to pay benefits, are primarily held in registered money market funds which are valued using a market approach based on the quoted market prices of identical instruments. Other cash equivalent and short-term investments are valued daily by the fund using a market approach with inputs that include quoted market prices for similar instruments.
Insurance group annuity contracts are valued at the present value of the future benefit payments owed by the insurance company to the Plans’ participants.
Common/collective funds are typically common or collective trusts valued at their net asset values (NAVs) that are calculated by the investment manager or sponsor of the fund and have daily or monthly liquidity.
98
A reconciliation of the fair values measurements of plan assets using significant unobservable inputs (Level 3) from the beginning of the year to the end of the year is as follows:
|
Insurance Contracts
Year Ended December 31,
|
||||||||
|
(in millions)
|
2014
|
2013
|
||||||
|
Beginning Balance
|
$
|
118.3
|
|
$
|
111.1
|
|
||
|
Actual return on assets
|
12.7
|
|
12.1
|
|
||||
|
Benefit payments
|
(7.1
|
)
|
(6.8
|
)
|
||||
|
Foreign currency impact
|
(6.2
|
)
|
1.9
|
|
||||
|
Ending Balance
|
$
|
117.7
|
|
$
|
118.3
|
|
||
The expected 2015 contributions for the U.S. pension plans are as follows: the minimum contribution for 2015 is
$1.4 million
; and no planned discretionary or non-cash contributions. The expected 2015 contributions for the non-U.S. pension plans are as follows: the minimum contribution for 2015 is
$4.7 million
; and no planned discretionary or non-cash contributions. Expected company paid claims for the postretirement health and life insurance plans are
$4.4 million
for 2015. Projected benefit payments from the plans as of
December 31, 2014
are estimated as follows:
|
(in millions)
|
U.S Pension Plans
|
Non-U.S. Pension
Plans
|
Postretirement
Health and Other
|
|||||||||
|
2015
|
$
|
12.3
|
|
$
|
12.7
|
|
$
|
4.4
|
|
|||
|
2016
|
12.8
|
|
13.2
|
|
4.5
|
|
||||||
|
2017
|
13.2
|
|
14.3
|
|
4.6
|
|
||||||
|
2018
|
13.7
|
|
14.7
|
|
4.9
|
|
||||||
|
2019
|
14.1
|
|
15.5
|
|
4.9
|
|
||||||
|
2020 — 2024
|
73.4
|
|
89.1
|
|
21.4
|
|
||||||
The fair value of plan assets for which the accumulated benefit obligation is in excess of the plan assets as of
December 31, 2014
and
2013
is as follows:
|
|
U.S Pension Plans
|
Non U.S. Pension Plans
|
||||||||||||||
|
(in millions)
|
2014
|
2013
|
2014
|
2013
|
||||||||||||
|
Projected benefit obligation
|
$
|
235.9
|
|
$
|
213.7
|
|
$
|
274.8
|
|
$
|
259.4
|
|
||||
|
Accumulated benefit obligation
|
235.9
|
|
213.7
|
|
269.9
|
|
254.2
|
|
||||||||
|
Fair value of plan assets
|
160.0
|
|
162.6
|
|
210.1
|
|
206.9
|
|
||||||||
The accumulated benefit obligation for all U.S. pension plans as of
December 31, 2014
and
2013
was
$235.9 million
and
$213.7 million
, respectively. The accumulated benefit obligation for all non-U.S. pension plans as of
December 31, 2014
and
2013
was
$272.9 million
and
$256.7 million
, respectively.
The measurement date for all plans is
December 31, 2014
.
The company also maintains a target benefit plan for certain executive officers of the company. Expenses related to the plan in the amount of
$2.4 million
,
$2.9 million
and
$3.3 million
were recorded in
2014
,
2013
, and
2012
, respectively. Amounts accrued as of
December 31, 2014
and
2013
related to this plan were
$25.7 million
and
$24.8 million
, respectively.
The company, through its Lincoln Foodservice operation, participated in a multiemployer defined benefit pension plan under a collective bargaining agreement that covered certain of its union-represented employees. In 2013, with the finalization of the reorganization and plant restructuring that affected the Lincoln Foodservice operation, the company was deemed to have effectively withdrawn its participation in the multiemployer defined benefit pension plan in 2013. This withdrawal obligation was previously recognized in our financial statements as part of the restructuring activities that were undertaken in connection with the 2008 acquisition of Enodis. The present value of the obligation is part of the restructuring accrual in our balance sheet. The withdrawal obligation (
$14.2 million
as of
December 31, 2014
) is payable in
48
quarterly installments of
$0.5 million
through April 2025.
99
The contributions by the company to the multiemployer plan for the years ended
December 31, 2014
,
2013
and
2012
are as follows:
|
(in millions)
|
|
Contributions by Manitowoc
|
||||||||||||||
|
Pension Fund
|
EIN / Pension Plan
Number
|
2014
|
2013
|
2012
|
||||||||||||
|
Sheet Metal Workers’ National Pension Fund
|
52-6112463 / 001
|
$
|
—
|
|
$
|
0.3
|
|
$
|
0.9
|
|
||||||
|
|
|
Total Contributions
|
$
|
—
|
|
$
|
0.3
|
|
$
|
0.9
|
|
|||||
21. Leases
The company leases various property, plant and equipment. Terms of the leases vary, but generally require the company to pay property taxes, insurance premiums, and maintenance costs associated with the leased property. Rental expense attributed to operating leases was
$34.8 million
,
$34.3 million
and
$38.1 million
in
2014
,
2013
and
2012
, respectively.
Future minimum rental obligations under non-cancelable operating leases, as of
December 31, 2014
, are payable as follows:
|
(in millions)
|
|
||
|
2015
|
$
|
42.4
|
|
|
2016
|
33.5
|
|
|
|
2017
|
23.3
|
|
|
|
2018
|
17.0
|
|
|
|
2019
|
14.9
|
|
|
|
Thereafter
|
23.3
|
|
|
|
Total
|
$
|
154.4
|
|
22. Business Segments
The company identifies its segments using the “management approach,” which designates the internal organization that is used by management for making operating decisions and assessing performance as the source of the company’s reportable segments.
The Crane business is a global provider of engineered lift solutions which designs, manufactures and markets a comprehensive line of lattice-boom crawler cranes, mobile telescopic cranes, tower cranes and boom trucks. The Crane products are used in a wide variety of applications, including energy, petrochemical and industrial projects, infrastructure development such as road, bridge and airport construction, and commercial and high-rise residential construction. Our crane-related product support services are principally marketed under the Manitowoc Crane Care brand name and include maintenance and repair services and parts supply.
The Foodservice equipment business designs, manufactures and sells refrigeration, ice-making, cooking, holding, food-preparation, and beverage-dispensing equipment. Our suite of products is used by commercial and institutional foodservice operators such as full service restaurants, QSR chains, hotels, industrial caterers, supermarkets, convenience stores, hospitals, schools and other institutions.
The accounting policies of the segments are the same as those described in the summary of significant accounting policies except that certain expenses are not allocated to the segments. These unallocated expenses are corporate overhead, stock-based compensation expense, amortization expense of intangible assets with definite lives, goodwill impairment, intangible asset impairment, asset impairment expense, restructuring expense, and other non-operating expenses. The company evaluates segment performance based upon profit and loss before the aforementioned expenses. Financial information relating to the company’s reportable segments for the years ended
December 31, 2014
,
2013
and
2012
is as follows:
100
|
(in millions)
|
2014
|
2013
|
2012
|
|||||||||
|
Net sales from continuing operations:
|
|
|
|
|
|
|
||||||
|
Crane
|
$
|
2,305.2
|
|
$
|
2,506.3
|
|
$
|
2,427.1
|
|
|||
|
Foodservice
|
1,581.3
|
|
1,541.8
|
|
1,486.2
|
|
||||||
|
Total
|
$
|
3,886.5
|
|
$
|
4,048.1
|
|
$
|
3,913.3
|
|
|||
|
Operating earnings (loss) from continuing operations:
|
|
|
|
|
|
|
||||||
|
Crane
|
$
|
163.9
|
|
$
|
218.8
|
|
$
|
170.5
|
|
|||
|
Foodservice
|
234.0
|
|
250.3
|
|
238.6
|
|
||||||
|
Corporate
|
(53.4
|
)
|
(64.9
|
)
|
(63.7
|
)
|
||||||
|
Asset impairment expense
|
(1.1
|
)
|
—
|
|
—
|
|
||||||
|
Amortization expense
|
(35.1
|
)
|
(35.3
|
)
|
(36.5
|
)
|
||||||
|
Restructuring expense
|
(9.0
|
)
|
(4.8
|
)
|
(9.5
|
)
|
||||||
|
Other (expense) income
|
(0.5
|
)
|
0.3
|
|
(2.5
|
)
|
||||||
|
Operating earnings from continuing operations
|
$
|
298.8
|
|
$
|
364.4
|
|
$
|
296.9
|
|
|||
|
Other income (expense):
|
||||||||||||
|
Interest expense
|
$
|
(94.0
|
)
|
$
|
(128.4
|
)
|
$
|
(135.6
|
)
|
|||
|
Amortization of deferred financing fees
|
(4.4
|
)
|
(7.0
|
)
|
(8.2
|
)
|
||||||
|
Loss on debt extinguishment
|
(25.5
|
)
|
(3.0
|
)
|
(6.3
|
)
|
||||||
|
Other (expense) income - net
|
(5.5
|
)
|
(0.8
|
)
|
0.1
|
|
||||||
|
Earnings from continuing operations before taxes on earnings
|
$
|
169.4
|
|
$
|
225.2
|
|
$
|
146.9
|
|
|||
|
Capital expenditures:
|
|
|
|
|
|
|
||||||
|
Crane
|
$
|
57.3
|
|
$
|
69.3
|
|
$
|
52.7
|
|
|||
|
Foodservice
|
25.3
|
|
33.6
|
|
17.4
|
|
||||||
|
Corporate
|
2.2
|
|
7.8
|
|
2.8
|
|
||||||
|
Total
|
$
|
84.8
|
|
$
|
110.7
|
|
$
|
72.9
|
|
|||
|
Total depreciation:
|
|
|
|
|
|
|
||||||
|
Crane
|
$
|
45.7
|
|
$
|
46.9
|
|
$
|
43.5
|
|
|||
|
Foodservice
|
21.2
|
|
20.1
|
|
22.3
|
|
||||||
|
Corporate
|
1.5
|
|
1.5
|
|
2.3
|
|
||||||
|
Total
|
$
|
68.4
|
|
$
|
68.5
|
|
$
|
68.1
|
|
|||
|
Total assets:
|
|
|
|
|
|
|
||||||
|
Crane
|
$
|
1,742.3
|
|
$
|
1,900.4
|
|
$
|
1,903.3
|
|
|||
|
Foodservice
|
1,902.0
|
|
1,904.3
|
|
1,956.8
|
|
||||||
|
Corporate
|
172.3
|
|
171.9
|
|
197.2
|
|
||||||
|
Total
|
$
|
3,816.6
|
|
$
|
3,976.6
|
|
$
|
4,057.3
|
|
|||
Net sales are attributed to geographic regions based on location of customer. Net sales from continuing operations and long-lived asset information by geographic area as of and for the years ended December 31 are as follows:
101
|
|
Net Sales
|
Long-Lived Assets
|
||||||||||||||||||
|
(in millions)
|
2014
|
2013
|
2012
|
2014
|
2013
|
|||||||||||||||
|
United States
|
$
|
1,977.4
|
|
$
|
1,978.0
|
|
$
|
1,833.0
|
|
$
|
1,880.8
|
|
$
|
1,888.4
|
|
|||||
|
Other North America
|
238.3
|
|
292.1
|
|
278.2
|
|
12.4
|
|
13.6
|
|
||||||||||
|
Europe
|
821.2
|
|
937.6
|
|
788.0
|
|
478.9
|
|
530.0
|
|
||||||||||
|
Asia
|
377.6
|
|
364.5
|
|
354.0
|
|
189.7
|
|
203.0
|
|
||||||||||
|
Middle East
|
223.2
|
|
174.2
|
|
161.6
|
|
1.5
|
|
1.6
|
|
||||||||||
|
Central and South America
|
106.9
|
|
166.9
|
|
243.0
|
|
30.0
|
|
36.0
|
|
||||||||||
|
Africa
|
56.7
|
|
30.0
|
|
110.8
|
|
—
|
|
—
|
|
||||||||||
|
South Pacific and Caribbean
|
13.3
|
|
12.6
|
|
10.6
|
|
4.0
|
|
4.1
|
|
||||||||||
|
Australia
|
71.9
|
|
92.2
|
|
134.1
|
|
3.0
|
|
4.7
|
|
||||||||||
|
Total
|
$
|
3,886.5
|
|
$
|
4,048.1
|
|
$
|
3,913.3
|
|
$
|
2,600.3
|
|
$
|
2,681.4
|
|
|||||
Net sales from continuing operations and long-lived asset information for Europe primarily relate to France, Germany and the United Kingdom.
23. Subsidiary Guarantors of Senior Notes due 2020 and Senior Notes due 2022
The following tables present condensed consolidating financial information for (a) The Manitowoc Company, Inc. (Parent); (b) the guarantors of the Senior Notes due 2020 and the Senior Notes due 2022 which include substantially all of the domestic, 100% owned subsidiaries of the company (Subsidiary Guarantors); and (c) the wholly and partially owned foreign subsidiaries of the Parent, which do not guarantee the Senior Notes due 2020 and the Senior Notes due 2022 (Non-Guarantor Subsidiaries). Separate financial statements of the Subsidiary Guarantors are not presented because the guarantors are fully and unconditionally, jointly and severally liable under the guarantees, except for normal and customary release provisions.
102
The Manitowoc Company, Inc.
Condensed Consolidating Statement of Operations
For the Year Ended
December 31, 2014
(In millions)
|
Parent
|
Guarantor
Subsidiaries
|
Non-
Guarantor
Subsidiaries
|
Eliminations
|
Consolidated
|
|||||||||||||||
|
Net sales
|
$
|
—
|
|
$
|
2,424.5
|
|
$
|
2,076.1
|
|
$
|
(614.1
|
)
|
$
|
3,886.5
|
|
||||
|
Costs and expenses:
|
|
|
|
|
|
|
|
|
|
|
|||||||||
|
Cost of sales
|
—
|
|
1,889.9
|
|
1,624.6
|
|
(614.1
|
)
|
2,900.4
|
|
|||||||||
|
Engineering, selling and administrative expenses
|
49.8
|
|
287.4
|
|
304.4
|
|
—
|
|
641.6
|
|
|||||||||
|
Asset impairment expense
|
—
|
|
1.1
|
|
—
|
|
—
|
|
1.1
|
|
|||||||||
|
Amortization expense
|
—
|
|
29.6
|
|
5.5
|
|
—
|
|
35.1
|
|
|||||||||
|
Restructuring expense
|
—
|
|
3.0
|
|
6.0
|
|
—
|
|
9.0
|
|
|||||||||
|
Other expense
|
—
|
|
0.3
|
|
0.2
|
|
—
|
|
0.5
|
|
|||||||||
|
Equity in (earnings) loss of subsidiaries
|
(165.6
|
)
|
(73.5
|
)
|
—
|
|
239.1
|
|
—
|
|
|||||||||
|
Total costs and expenses
|
(115.8
|
)
|
2,137.8
|
|
1,940.7
|
|
(375.0
|
)
|
3,587.7
|
|
|||||||||
|
Operating earnings (loss) from continuing operations
|
115.8
|
|
286.7
|
|
135.4
|
|
(239.1
|
)
|
298.8
|
|
|||||||||
|
Other (expense) income :
|
|
|
|
|
|
|
|
|
|
|
|||||||||
|
Interest expense
|
(83.8
|
)
|
(1.9
|
)
|
(8.3
|
)
|
—
|
|
(94.0
|
)
|
|||||||||
|
Amortization of deferred financing fees
|
(4.4
|
)
|
—
|
|
—
|
|
—
|
|
(4.4
|
)
|
|||||||||
|
Loss on debt extinguishment
|
(25.5
|
)
|
—
|
|
—
|
|
—
|
|
(25.5
|
)
|
|||||||||
|
Management fee income (expense)
|
62.4
|
|
(72.6
|
)
|
10.2
|
|
—
|
|
—
|
|
|||||||||
|
Other income (expense) - net
|
16.5
|
|
59.2
|
|
(0.5
|
)
|
(80.7
|
)
|
(5.5
|
)
|
|||||||||
|
Total other (expense) income
|
(34.8
|
)
|
(15.3
|
)
|
1.4
|
|
(80.7
|
)
|
(129.4
|
)
|
|||||||||
|
Earnings (loss) from continuing operations before taxes on earnings
|
81.0
|
|
271.4
|
|
136.8
|
|
(319.8
|
)
|
169.4
|
|
|||||||||
|
(Benefit) provision for taxes on earnings
|
(63.5
|
)
|
45.3
|
|
26.8
|
|
—
|
|
8.6
|
|
|||||||||
|
Earnings (loss) from continuing operations
|
144.5
|
|
226.1
|
|
110.0
|
|
(319.8
|
)
|
160.8
|
|
|||||||||
|
Discontinued operations:
|
|
|
|
|
|
|
|
|
|
|
|||||||||
|
Loss from discontinued operations, net of income taxes
|
—
|
|
(0.5
|
)
|
(0.9
|
)
|
—
|
|
(1.4
|
)
|
|||||||||
|
Loss on sale of discontinued operations, net of income taxes
|
—
|
|
—
|
|
(11.0
|
)
|
—
|
|
(11.0
|
)
|
|||||||||
|
Net earnings (loss)
|
144.5
|
|
225.6
|
|
98.1
|
|
(319.8
|
)
|
148.4
|
|
|||||||||
|
Less: Net earnings attributable to noncontrolling interest
|
—
|
|
—
|
|
3.9
|
|
—
|
|
3.9
|
|
|||||||||
|
Net earnings (loss) attributable to Manitowoc
|
$
|
144.5
|
|
$
|
225.6
|
|
$
|
94.2
|
|
$
|
(319.8
|
)
|
$
|
144.5
|
|
||||
|
Comprehensive income (loss) attributable to Manitowoc
|
$
|
20.9
|
|
$
|
217.8
|
|
$
|
86.0
|
|
$
|
(303.8
|
)
|
$
|
20.9
|
|
||||
103
The Manitowoc Company, Inc.
Condensed Consolidating Statement of Operations
For the Year Ended
December 31, 2013
(In millions)
|
Parent
|
Guarantor
Subsidiaries
|
Non-
Guarantor
Subsidiaries
|
Eliminations
|
Consolidated
|
|||||||||||||||
|
Net sales
|
$
|
—
|
|
$
|
2,631.3
|
|
$
|
2,097.1
|
|
$
|
(680.3
|
)
|
$
|
4,048.1
|
|
||||
|
Costs and expenses:
|
|
|
|
|
|
|
|
|
|
|
|||||||||
|
Cost of sales
|
—
|
|
2,038.1
|
|
1,668.5
|
|
(680.3
|
)
|
3,026.3
|
|
|||||||||
|
Engineering, selling and administrative expenses
|
61.4
|
|
259.5
|
|
296.7
|
|
—
|
|
617.6
|
|
|||||||||
|
Amortization expense
|
—
|
|
29.6
|
|
5.7
|
|
—
|
|
35.3
|
|
|||||||||
|
Restructuring expense
|
—
|
|
0.7
|
|
4.1
|
|
—
|
|
4.8
|
|
|||||||||
|
Other expense (income)
|
—
|
|
0.5
|
|
(0.8
|
)
|
—
|
|
(0.3
|
)
|
|||||||||
|
Equity in (earnings) loss of subsidiaries
|
(199.6
|
)
|
(32.5
|
)
|
—
|
|
232.1
|
|
—
|
|
|||||||||
|
Total costs and expenses
|
(138.2
|
)
|
2,295.9
|
|
1,974.2
|
|
(448.2
|
)
|
3,683.7
|
|
|||||||||
|
Operating earnings (loss) from continuing operations
|
138.2
|
|
335.4
|
|
122.9
|
|
(232.1
|
)
|
364.4
|
|
|||||||||
|
Other (expense) income:
|
|
|
|
|
|
|
|
|
|
|
|||||||||
|
Interest expense
|
(118.8
|
)
|
(1.0
|
)
|
(8.6
|
)
|
—
|
|
(128.4
|
)
|
|||||||||
|
Amortization of deferred financing fees
|
(7.0
|
)
|
—
|
|
—
|
|
—
|
|
(7.0
|
)
|
|||||||||
|
Loss on debt extinguishment
|
(3.0
|
)
|
—
|
|
—
|
|
—
|
|
(3.0
|
)
|
|||||||||
|
Management fee income (expense)
|
59.6
|
|
(77.1
|
)
|
17.5
|
|
—
|
|
—
|
|
|||||||||
|
Other (expense) income - net
|
(3.6
|
)
|
(32.6
|
)
|
35.4
|
|
—
|
|
(0.8
|
)
|
|||||||||
|
Total other (expense) income
|
(72.8
|
)
|
(110.7
|
)
|
44.3
|
|
—
|
|
(139.2
|
)
|
|||||||||
|
Earnings (loss) from continuing operations before taxes on earnings
|
65.4
|
|
224.7
|
|
167.2
|
|
(232.1
|
)
|
225.2
|
|
|||||||||
|
(Benefit) provision for taxes on earnings
|
(76.4
|
)
|
69.3
|
|
43.2
|
|
—
|
|
36.1
|
|
|||||||||
|
Earnings (loss) from continuing operations
|
141.8
|
|
155.4
|
|
124.0
|
|
(232.1
|
)
|
189.1
|
|
|||||||||
|
Discontinued operations:
|
|
|
|
|
|
|
|
|
|
|
|||||||||
|
Loss from discontinued operations, net of income taxes
|
—
|
|
(2.3
|
)
|
(16.5
|
)
|
—
|
|
(18.8
|
)
|
|||||||||
|
Loss on sale of discontinued operations, net of income taxes
|
—
|
|
—
|
|
(2.7
|
)
|
—
|
|
(2.7
|
)
|
|||||||||
|
Net earnings (loss)
|
141.8
|
|
153.1
|
|
104.8
|
|
(232.1
|
)
|
167.6
|
|
|||||||||
|
Less: Net earnings attributable to noncontrolling interest
|
—
|
|
—
|
|
25.8
|
|
—
|
|
25.8
|
|
|||||||||
|
Net earnings (loss) attributable to Manitowoc
|
$
|
141.8
|
|
$
|
153.1
|
|
$
|
79.0
|
|
$
|
(232.1
|
)
|
$
|
141.8
|
|
||||
|
Comprehensive income (loss) attributable to Manitowoc
|
$
|
164.3
|
|
$
|
154.1
|
|
$
|
62.9
|
|
$
|
(217.0
|
)
|
$
|
164.3
|
|
||||
104
The Manitowoc Company, Inc.
Condensed Consolidating Statement of Operations
For the Year Ended
December 31, 2012
(In millions)
|
Parent
|
Guarantor
Subsidiaries
|
Non-
Guarantor
Subsidiaries
|
Eliminations
|
Consolidated
|
|||||||||||||||
|
Net sales
|
$
|
—
|
|
$
|
2,616.4
|
|
$
|
1,959.0
|
|
$
|
(662.1
|
)
|
$
|
3,913.3
|
|
||||
|
Costs and expenses:
|
|
|
|
|
|
|
|
|
|
|
|||||||||
|
Cost of sales
|
—
|
|
2,022.3
|
|
1,610.1
|
|
(662.1
|
)
|
2,970.3
|
|
|||||||||
|
Engineering, selling and administrative expenses
|
61.2
|
|
247.6
|
|
288.8
|
|
—
|
|
597.6
|
|
|||||||||
|
Amortization expense
|
—
|
|
29.9
|
|
6.6
|
|
—
|
|
36.5
|
|
|||||||||
|
Restructuring expense
|
—
|
|
0.7
|
|
8.8
|
|
—
|
|
9.5
|
|
|||||||||
|
Other expense
|
—
|
|
2.5
|
|
—
|
|
—
|
|
2.5
|
|
|||||||||
|
Equity in (earnings) loss of subsidiaries
|
(167.2
|
)
|
(36.0
|
)
|
—
|
|
203.2
|
|
—
|
|
|||||||||
|
Total costs and expenses
|
(106.0
|
)
|
2,267.0
|
|
1,914.3
|
|
(458.9
|
)
|
3,616.4
|
|
|||||||||
|
Operating earnings (loss) from continuing operations
|
106.0
|
|
349.4
|
|
44.7
|
|
(203.2
|
)
|
296.9
|
|
|||||||||
|
Other (expense) income:
|
|
|
|
|
|
|
|
|
|
|
|||||||||
|
Interest expense
|
(122.9
|
)
|
(2.1
|
)
|
(10.6
|
)
|
—
|
|
(135.6
|
)
|
|||||||||
|
Amortization of deferred financing fees
|
(8.2
|
)
|
—
|
|
—
|
|
—
|
|
(8.2
|
)
|
|||||||||
|
Loss on debt extinguishment
|
(6.3
|
)
|
—
|
|
—
|
|
—
|
|
(6.3
|
)
|
|||||||||
|
Management fee income (expense)
|
60.1
|
|
(77.8
|
)
|
17.7
|
|
—
|
|
—
|
|
|||||||||
|
Other income (expense) - net
|
16.5
|
|
(45.9
|
)
|
29.5
|
|
—
|
|
0.1
|
|
|||||||||
|
Total other (expense) income
|
(60.8
|
)
|
(125.8
|
)
|
36.6
|
|
—
|
|
(150.0
|
)
|
|||||||||
|
Earnings (loss) from continuing operations before taxes on earnings
|
45.2
|
|
223.6
|
|
81.3
|
|
(203.2
|
)
|
146.9
|
|
|||||||||
|
(Benefit) provision for taxes on earnings
|
(56.5
|
)
|
69.2
|
|
25.3
|
|
—
|
|
38.0
|
|
|||||||||
|
Earnings (loss) from continuing operations
|
101.7
|
|
154.4
|
|
56.0
|
|
(203.2
|
)
|
108.9
|
|
|||||||||
|
Discontinued operations:
|
|
|
|
|
|
|
|
|
|
|
|||||||||
|
Loss from discontinued operations, net of income taxes
|
—
|
|
(0.9
|
)
|
(15.4
|
)
|
—
|
|
(16.3
|
)
|
|||||||||
|
Net earnings (loss)
|
101.7
|
|
153.5
|
|
40.6
|
|
(203.2
|
)
|
92.6
|
|
|||||||||
|
Less: Net loss attributable to noncontrolling interest
|
—
|
|
—
|
|
(9.1
|
)
|
—
|
|
(9.1
|
)
|
|||||||||
|
Net earnings (loss) attributable to Manitowoc
|
$
|
101.7
|
|
$
|
153.5
|
|
$
|
49.7
|
|
$
|
(203.2
|
)
|
$
|
101.7
|
|
||||
|
Comprehensive income (loss) attributable to Manitowoc
|
$
|
97.1
|
|
$
|
153.7
|
|
$
|
51.9
|
|
$
|
(205.6
|
)
|
$
|
97.1
|
|
||||
105
The Manitowoc Company, Inc.
Condensed Consolidating Balance Sheet
as of
December 31, 2014
(In millions)
|
Parent
|
Guarantor
Subsidiaries
|
Non-
Guarantor
Subsidiaries
|
Eliminations
|
Consolidated
|
|||||||||||||||
|
Assets
|
|
|
|
|
|
|
|
|
|
|
|||||||||
|
Current Assets:
|
|
|
|
|
|
|
|
|
|
|
|||||||||
|
Cash and cash equivalents
|
$
|
1.6
|
|
$
|
3.3
|
|
$
|
63.1
|
|
$
|
—
|
|
$
|
68.0
|
|
||||
|
Restricted cash
|
2.8
|
|
—
|
|
20.9
|
|
—
|
|
23.7
|
|
|||||||||
|
Accounts receivable — net
|
0.1
|
|
—
|
|
233.6
|
|
(6.3
|
)
|
227.4
|
|
|||||||||
|
Intercompany short term note receivable
|
—
|
|
—
|
|
201.7
|
|
(201.7
|
)
|
—
|
|
|||||||||
|
Intercompany interest receivable
|
41.5
|
|
3.2
|
|
—
|
|
(44.7
|
)
|
—
|
|
|||||||||
|
Inventories — net
|
—
|
|
306.3
|
|
338.2
|
|
—
|
|
644.5
|
|
|||||||||
|
Deferred income taxes
|
67.1
|
|
—
|
|
4.2
|
|
—
|
|
71.3
|
|
|||||||||
|
Other current assets
|
3.6
|
|
6.7
|
|
140.9
|
|
—
|
|
151.2
|
|
|||||||||
|
Current assets of discontinued operation
|
—
|
|
—
|
|
—
|
|
—
|
|
—
|
|
|||||||||
|
Total current assets
|
116.7
|
|
319.5
|
|
1,002.6
|
|
(252.7
|
)
|
1,186.1
|
|
|||||||||
|
Property, plant and equipment — net
|
7.7
|
|
325.8
|
|
257.5
|
|
—
|
|
591.0
|
|
|||||||||
|
Goodwill
|
—
|
|
960.5
|
|
237.6
|
|
—
|
|
1,198.1
|
|
|||||||||
|
Other intangible assets — net
|
—
|
|
561.6
|
|
153.1
|
|
—
|
|
714.7
|
|
|||||||||
|
Intercompany long-term notes receivable
|
892.5
|
|
195.3
|
|
851.3
|
|
(1,939.1
|
)
|
—
|
|
|||||||||
|
Intercompany accounts receivable
|
—
|
|
1,619.7
|
|
796.8
|
|
(2,416.5
|
)
|
—
|
|
|||||||||
|
Other non-current assets
|
66.7
|
|
3.1
|
|
56.9
|
|
—
|
|
126.7
|
|
|||||||||
|
Long-term assets of discontinued operation
|
—
|
|
—
|
|
—
|
|
—
|
|
—
|
|
|||||||||
|
Investment in affiliates
|
4,423.6
|
|
3,629.4
|
|
—
|
|
(8,053.0
|
)
|
—
|
|
|||||||||
|
Total assets
|
$
|
5,507.2
|
|
$
|
7,614.9
|
|
$
|
3,355.8
|
|
$
|
(12,661.3
|
)
|
$
|
3,816.6
|
|
||||
|
Liabilities and Equity
|
|
|
|
|
|
|
|
|
|
|
|||||||||
|
Current Liabilities:
|
|
|
|
|
|
|
|
|
|
|
|||||||||
|
Accounts payable and accrued expenses
|
$
|
27.1
|
|
$
|
420.8
|
|
$
|
365.8
|
|
$
|
(6.3
|
)
|
$
|
807.4
|
|
||||
|
Short-term borrowings and current portion of long-term debt
|
24.1
|
|
2.8
|
|
53.4
|
|
—
|
|
80.3
|
|
|||||||||
|
Intercompany short term note payable
|
201.7
|
|
—
|
|
—
|
|
(201.7
|
)
|
—
|
|
|||||||||
|
Intercompany interest payable
|
3.2
|
|
—
|
|
41.5
|
|
(44.7
|
)
|
—
|
|
|||||||||
|
Product warranties
|
—
|
|
45.2
|
|
32.5
|
|
—
|
|
77.7
|
|
|||||||||
|
Customer advances
|
—
|
|
7.3
|
|
14.0
|
|
—
|
|
21.3
|
|
|||||||||
|
Product liabilities
|
—
|
|
22.1
|
|
2.5
|
|
—
|
|
24.6
|
|
|||||||||
|
Current liabilities of discontinued operation
|
—
|
|
—
|
|
—
|
|
—
|
|
—
|
|
|||||||||
|
Total current liabilities
|
256.1
|
|
498.2
|
|
509.7
|
|
(252.7
|
)
|
1,011.3
|
|
|||||||||
|
Non-Current Liabilities:
|
|
|
|
|
|
|
|
|
|
|
|||||||||
|
Long-term debt, less current portion
|
1,393.0
|
|
25.3
|
|
24.9
|
|
—
|
|
1,443.2
|
|
|||||||||
|
Deferred income taxes
|
165.2
|
|
—
|
|
21.0
|
|
—
|
|
186.2
|
|
|||||||||
|
Pension obligations
|
129.1
|
|
7.9
|
|
4.0
|
|
—
|
|
141.0
|
|
|||||||||
|
Postretirement health and other benefit obligations
|
49.5
|
|
2.1
|
|
1.5
|
|
—
|
|
53.1
|
|
|||||||||
|
Long-term deferred revenue
|
—
|
|
10.7
|
|
27.2
|
|
—
|
|
37.9
|
|
|||||||||
|
Intercompany long-term note payable
|
191.0
|
|
813.5
|
|
934.6
|
|
(1,939.1
|
)
|
—
|
|
|||||||||
|
Intercompany accounts payable
|
2,416.5
|
|
—
|
|
—
|
|
(2,416.5
|
)
|
—
|
|
|||||||||
|
Other non-current liabilities
|
82.7
|
|
11.5
|
|
25.6
|
|
—
|
|
119.8
|
|
|||||||||
|
Long-term liabilities of discontinued operation
|
—
|
|
—
|
|
—
|
|
—
|
|
—
|
|
|||||||||
|
Total non-current liabilities
|
4,427.0
|
|
871.0
|
|
1,038.8
|
|
(4,355.6
|
)
|
1,981.2
|
|
|||||||||
|
Equity
|
|
|
|
|
|
|
|
|
|
|
|||||||||
|
Manitowoc stockholders’ equity
|
824.1
|
|
6,245.7
|
|
1,807.3
|
|
(8,053.0
|
)
|
824.1
|
|
|||||||||
|
Noncontrolling interest
|
—
|
|
—
|
|
—
|
|
—
|
|
—
|
|
|||||||||
|
Total equity
|
824.1
|
|
6,245.7
|
|
1,807.3
|
|
(8,053.0
|
)
|
824.1
|
|
|||||||||
|
Total liabilities and equity
|
$
|
5,507.2
|
|
$
|
7,614.9
|
|
$
|
3,355.8
|
|
$
|
(12,661.3
|
)
|
$
|
3,816.6
|
|
||||
106
The Manitowoc Company, Inc.
Condensed Consolidating Balance Sheet
as of
December 31, 2013
(In millions)
|
Parent
|
Guarantor
Subsidiaries
|
Non-
Guarantor
Subsidiaries
|
Eliminations
|
Consolidated
|
|||||||||||||||
|
Assets
|
|
|
|
|
|
|
|
|
|
|
|||||||||
|
Current Assets:
|
|
|
|
|
|
|
|
|
|
|
|||||||||
|
Cash and cash equivalents
|
$
|
1.2
|
|
$
|
3.3
|
|
$
|
50.4
|
|
$
|
—
|
|
$
|
54.9
|
|
||||
|
Restricted cash
|
2.8
|
|
—
|
|
10.0
|
|
—
|
|
12.8
|
|
|||||||||
|
Accounts receivable — net
|
0.2
|
|
16.5
|
|
238.8
|
|
—
|
|
255.5
|
|
|||||||||
|
Intercompany short term note receivable
|
—
|
|
—
|
|
112.1
|
|
(112.1
|
)
|
—
|
|
|||||||||
|
Intercompany interest receivable
|
18.4
|
|
3.2
|
|
—
|
|
(21.6
|
)
|
—
|
|
|||||||||
|
Inventories — net
|
—
|
|
333.4
|
|
387.4
|
|
—
|
|
720.8
|
|
|||||||||
|
Deferred income taxes
|
73.2
|
|
—
|
|
16.7
|
|
—
|
|
89.9
|
|
|||||||||
|
Other current assets
|
3.4
|
|
5.9
|
|
104.6
|
|
—
|
|
113.9
|
|
|||||||||
|
Current assets of discontinued operations
|
—
|
|
—
|
|
15.1
|
|
—
|
|
15.1
|
|
|||||||||
|
Total current assets
|
99.2
|
|
362.3
|
|
935.1
|
|
(133.7
|
)
|
1,262.9
|
|
|||||||||
|
Property, plant and equipment — net
|
6.3
|
|
291.9
|
|
280.6
|
|
—
|
|
578.8
|
|
|||||||||
|
Goodwill
|
—
|
|
960.5
|
|
258.1
|
|
—
|
|
1,218.6
|
|
|||||||||
|
Other intangible assets — net
|
—
|
|
591.3
|
|
174.9
|
|
—
|
|
766.2
|
|
|||||||||
|
Intercompany long-term notes receivable
|
964.4
|
|
158.5
|
|
903.7
|
|
(2,026.6
|
)
|
—
|
|
|||||||||
|
Intercompany accounts receivable
|
—
|
|
1,565.2
|
|
1,848.8
|
|
(3,414.0
|
)
|
—
|
|
|||||||||
|
Other non-current assets
|
42.9
|
|
3.4
|
|
80.5
|
|
—
|
|
126.8
|
|
|||||||||
|
Long-term assets of discontinued operations
|
—
|
|
—
|
|
23.3
|
|
—
|
|
23.3
|
|
|||||||||
|
Investment in affiliates
|
5,356.2
|
|
3,505.6
|
|
—
|
|
(8,861.8
|
)
|
—
|
|
|||||||||
|
Total assets
|
$
|
6,469.0
|
|
$
|
7,438.7
|
|
$
|
4,505.0
|
|
$
|
(14,436.1
|
)
|
$
|
3,976.6
|
|
||||
|
Liabilities and Equity
|
|
|
|
|
|
|
|
|
|
|
|||||||||
|
Current Liabilities:
|
|
|
|
|
|
|
|
|
|
|
|||||||||
|
Accounts payable and accrued expenses
|
$
|
108.1
|
|
$
|
404.2
|
|
$
|
423.3
|
|
$
|
—
|
|
$
|
935.6
|
|
||||
|
Short-term borrowings and current portion of long-term debt
|
—
|
|
0.7
|
|
22.0
|
|
—
|
|
22.7
|
|
|||||||||
|
Intercompany short-term note payable
|
112.1
|
|
—
|
|
—
|
|
(112.1
|
)
|
—
|
|
|||||||||
|
Intercompany interest payable
|
3.2
|
|
—
|
|
18.4
|
|
(21.6
|
)
|
—
|
|
|||||||||
|
Product warranties
|
—
|
|
47.3
|
|
33.8
|
|
—
|
|
81.1
|
|
|||||||||
|
Customer advances
|
—
|
|
12.9
|
|
22.0
|
|
—
|
|
34.9
|
|
|||||||||
|
Product liabilities
|
—
|
|
21.2
|
|
3.8
|
|
—
|
|
25.0
|
|
|||||||||
|
Current liabilities of discontinued operations
|
—
|
|
—
|
|
26.1
|
|
—
|
|
26.1
|
|
|||||||||
|
Total current liabilities
|
223.4
|
|
486.3
|
|
549.4
|
|
(133.7
|
)
|
1,125.4
|
|
|||||||||
|
Non-Current Liabilities:
|
|
|
|
|
|
|
|
|
|
|
|||||||||
|
Long-term debt, less current portion
|
1,474.7
|
|
2.2
|
|
27.2
|
|
—
|
|
1,504.1
|
|
|||||||||
|
Deferred income taxes
|
165.2
|
|
—
|
|
49.1
|
|
—
|
|
214.3
|
|
|||||||||
|
Pension obligations
|
91.0
|
|
6.4
|
|
4.1
|
|
—
|
|
101.5
|
|
|||||||||
|
Postretirement health and other benefit obligations
|
40.6
|
|
2.1
|
|
2.0
|
|
—
|
|
44.7
|
|
|||||||||
|
Long-term deferred revenue
|
—
|
|
9.2
|
|
28.4
|
|
—
|
|
37.6
|
|
|||||||||
|
Intercompany long-term note payable
|
183.3
|
|
832.2
|
|
1,011.1
|
|
(2,026.6
|
)
|
—
|
|
|||||||||
|
Intercompany accounts payable
|
3,414.0
|
|
—
|
|
—
|
|
(3,414.0
|
)
|
—
|
|
|||||||||
|
Other non-current liabilities
|
101.3
|
|
15.6
|
|
47.6
|
|
—
|
|
164.5
|
|
|||||||||
|
Long-term liabilities of discontinued operations
|
—
|
|
—
|
|
2.2
|
|
—
|
|
2.2
|
|
|||||||||
|
Total non-current liabilities
|
5,470.1
|
|
867.7
|
|
1,171.7
|
|
(5,440.6
|
)
|
2,068.9
|
|
|||||||||
|
Equity
|
|
|
|
|
|
|
|
|
|
|
|||||||||
|
Manitowoc stockholders’ equity
|
775.5
|
|
6,084.7
|
|
2,777.1
|
|
(8,861.8
|
)
|
775.5
|
|
|||||||||
|
Noncontrolling interest
|
—
|
|
—
|
|
6.8
|
|
—
|
|
6.8
|
|
|||||||||
|
Total equity
|
775.5
|
|
6,084.7
|
|
2,783.9
|
|
(8,861.8
|
)
|
782.3
|
|
|||||||||
|
Total liabilities and equity
|
$
|
6,469.0
|
|
$
|
7,438.7
|
|
$
|
4,505.0
|
|
$
|
(14,436.1
|
)
|
$
|
3,976.6
|
|
||||
107
The Manitowoc Company, Inc.
Condensed Consolidating Statement of Cash Flows
For the year ended
December 31, 2014
(In millions)
|
Parent
|
Subsidiary
Guarantors
|
Non-
Guarantor
Subsidiaries
|
Eliminations
|
Consolidated
|
|||||||||||||||
|
Net cash (used for) provided by operating activities of continuing operations
|
$
|
(124.3
|
)
|
$
|
243.4
|
|
$
|
67.0
|
|
$
|
(80.7
|
)
|
$
|
105.4
|
|
||||
|
Cash used for operating activities of discontinued operations
|
—
|
|
(0.4
|
)
|
(6.7
|
)
|
—
|
|
(7.1
|
)
|
|||||||||
|
Net cash (used for) provided by operating activities
|
$
|
(124.3
|
)
|
$
|
243.0
|
|
$
|
60.3
|
|
$
|
(80.7
|
)
|
$
|
98.3
|
|
||||
|
Cash Flows from Investing:
|
|
|
|
|
|
|
|
|
|
|
|||||||||
|
Capital expenditures
|
$
|
(2.2
|
)
|
$
|
(51.3
|
)
|
$
|
(31.3
|
)
|
$
|
—
|
|
$
|
(84.8
|
)
|
||||
|
Proceeds from sale of property, plant and equipment
|
—
|
|
0.1
|
|
12.7
|
|
—
|
|
12.8
|
|
|||||||||
|
Restricted cash
|
—
|
|
—
|
|
(11.6
|
)
|
—
|
|
(11.6
|
)
|
|||||||||
|
Intercompany investments
|
77.4
|
|
(213.9
|
)
|
118.8
|
|
17.7
|
|
—
|
|
|||||||||
|
Net cash provided by (used for) investing activities
|
$
|
75.2
|
|
$
|
(265.1
|
)
|
$
|
88.6
|
|
$
|
17.7
|
|
$
|
(83.6
|
)
|
||||
|
Cash Flows from Financing:
|
|
|
|
|
|
|
|
|
|
|
|||||||||
|
Payments on long-term debt
|
$
|
(607.7
|
)
|
$
|
(1.7
|
)
|
$
|
(29.3
|
)
|
$
|
—
|
|
$
|
(638.7
|
)
|
||||
|
Proceeds from long-term debt
|
550.0
|
|
26.8
|
|
63.5
|
|
—
|
|
640.3
|
|
|||||||||
|
Payments on notes financing—net
|
—
|
|
—
|
|
(0.3
|
)
|
—
|
|
(0.3
|
)
|
|||||||||
|
Debt issue costs
|
(5.2
|
)
|
—
|
|
—
|
|
—
|
|
(5.2
|
)
|
|||||||||
|
Dividends paid
|
(10.8
|
)
|
—
|
|
(80.7
|
)
|
80.7
|
|
(10.8
|
)
|
|||||||||
|
Exercises of stock options including windfall tax benefits
|
25.9
|
|
—
|
|
—
|
|
—
|
|
25.9
|
|
|||||||||
|
Intercompany financing
|
97.3
|
|
(3.0
|
)
|
(76.6
|
)
|
(17.7
|
)
|
—
|
|
|||||||||
|
Net cash provided by (used for) financing activities of continuing operations
|
$
|
49.5
|
|
$
|
22.1
|
|
$
|
(123.4
|
)
|
$
|
63.0
|
|
$
|
11.2
|
|
||||
|
Net cash used for financing activities of discontinued operations
|
$
|
—
|
|
$
|
—
|
|
$
|
(7.2
|
)
|
$
|
—
|
|
$
|
(7.2
|
)
|
||||
|
Net cash provided by (used for) financing activities
|
$
|
49.5
|
|
$
|
22.1
|
|
$
|
(130.6
|
)
|
$
|
63.0
|
|
$
|
4.0
|
|
||||
|
Effect of exchange rate changes on cash
|
—
|
|
—
|
|
(5.6
|
)
|
—
|
|
(5.6
|
)
|
|||||||||
|
Net increase in cash and cash equivalents
|
0.4
|
|
—
|
|
12.7
|
|
—
|
|
13.1
|
|
|||||||||
|
Balance at beginning of period
|
1.2
|
|
3.3
|
|
50.4
|
|
—
|
|
54.9
|
|
|||||||||
|
Balance at end of period
|
$
|
1.6
|
|
$
|
3.3
|
|
$
|
63.1
|
|
$
|
—
|
|
$
|
68.0
|
|
||||
108
The Manitowoc Company, Inc.
Condensed Consolidating Statement of Cash Flows
For the year ended
December 31, 2013
(In millions)
|
Parent
|
Subsidiary
Guarantors
|
Non-
Guarantor
Subsidiaries
|
Eliminations
|
Consolidated
|
|||||||||||||||
|
Net cash (used for) provided by operating activities of continuing operations
|
$
|
(51.6
|
)
|
$
|
224.9
|
|
$
|
160.8
|
|
$
|
—
|
|
$
|
334.1
|
|
||||
|
Cash used for operating activities of discontinued operations
|
—
|
|
(2.3
|
)
|
(8.7
|
)
|
—
|
|
(11.0
|
)
|
|||||||||
|
Net cash (used for) provided by operating activities
|
$
|
(51.6
|
)
|
$
|
222.6
|
|
$
|
152.1
|
|
$
|
—
|
|
$
|
323.1
|
|
||||
|
Cash Flows from Investing:
|
|
|
|
|
|
|
|
|
|
|
|||||||||
|
Capital expenditures
|
$
|
(0.8
|
)
|
$
|
(57.4
|
)
|
$
|
(52.5
|
)
|
$
|
—
|
|
$
|
(110.7
|
)
|
||||
|
Proceeds from sale of property, plant and equipment
|
—
|
|
2.0
|
|
2.1
|
|
—
|
|
4.1
|
|
|||||||||
|
Restricted cash
|
2.6
|
|
—
|
|
(4.6
|
)
|
—
|
|
(2.0
|
)
|
|||||||||
|
Business acquisitions, net of cash acquired
|
—
|
|
—
|
|
(12.2
|
)
|
—
|
|
(12.2
|
)
|
|||||||||
|
Proceeds from sale of business
|
—
|
|
—
|
|
39.2
|
|
—
|
|
39.2
|
|
|||||||||
|
Intercompany investments
|
197.1
|
|
(167.2
|
)
|
(169.3
|
)
|
139.4
|
|
—
|
|
|||||||||
|
Net cash provided by (used for) investing activities of continuing operations
|
198.9
|
|
(222.6
|
)
|
(197.3
|
)
|
139.4
|
|
(81.6
|
)
|
|||||||||
|
Net cash used for investing activities of discontinued operations
|
—
|
|
—
|
|
(0.6
|
)
|
—
|
|
(0.6
|
)
|
|||||||||
|
Net cash provided by (used for) investing activities
|
$
|
198.9
|
|
$
|
(222.6
|
)
|
$
|
(197.9
|
)
|
$
|
139.4
|
|
$
|
(82.2
|
)
|
||||
|
Cash Flows from Financing:
|
|
|
|
|
|
|
|
|
|
|
|||||||||
|
Payments on long-term debt
|
$
|
(220.6
|
)
|
$
|
(0.7
|
)
|
$
|
(45.2
|
)
|
$
|
—
|
|
$
|
(266.5
|
)
|
||||
|
Proceeds from long-term debt
|
—
|
|
—
|
|
43.0
|
|
—
|
|
43.0
|
|
|||||||||
|
(Payments on) proceeds from revolving credit facility—net
|
(34.5
|
)
|
—
|
|
0.1
|
|
—
|
|
(34.4
|
)
|
|||||||||
|
Proceeds from notes financing—net
|
—
|
|
—
|
|
6.6
|
|
—
|
|
6.6
|
|
|||||||||
|
Debt issue costs
|
(1.1
|
)
|
—
|
|
—
|
|
—
|
|
(1.1
|
)
|
|||||||||
|
Dividends paid
|
(10.7
|
)
|
—
|
|
—
|
|
—
|
|
(10.7
|
)
|
|||||||||
|
Exercises of stock options including windfall tax benefits
|
6.7
|
|
—
|
|
—
|
|
—
|
|
6.7
|
|
|||||||||
|
Intercompany financing
|
102.1
|
|
—
|
|
37.3
|
|
(139.4
|
)
|
—
|
|
|||||||||
|
Net cash (used for) provided by financing activities
|
$
|
(158.1
|
)
|
$
|
(0.7
|
)
|
$
|
41.8
|
|
$
|
(139.4
|
)
|
$
|
(256.4
|
)
|
||||
|
Effect of exchange rate changes on cash
|
—
|
|
—
|
|
(2.8
|
)
|
—
|
|
(2.8
|
)
|
|||||||||
|
Net decrease in cash and cash equivalents
|
(10.8
|
)
|
(0.7
|
)
|
(6.8
|
)
|
—
|
|
(18.3
|
)
|
|||||||||
|
Balance at beginning of period
|
12.0
|
|
4.0
|
|
57.2
|
|
—
|
|
73.2
|
|
|||||||||
|
Balance at end of period
|
$
|
1.2
|
|
$
|
3.3
|
|
$
|
50.4
|
|
$
|
—
|
|
$
|
54.9
|
|
||||
109
The Manitowoc Company, Inc.
Condensed Consolidating Statement of Cash Flows
For the year ended
December 31, 2012
(In millions)
|
Parent
|
Subsidiary
Guarantors
|
Non-
Guarantor
Subsidiaries
|
Eliminations
|
Consolidated
|
|||||||||||||||
|
Net cash (used for) provided by operating activities of continuing operations
|
$
|
(22.8
|
)
|
$
|
167.4
|
|
$
|
30.7
|
|
$
|
—
|
|
$
|
175.3
|
|
||||
|
Cash used for operating activities of discontinued operations
|
—
|
|
(0.9
|
)
|
(12.0
|
)
|
—
|
|
(12.9
|
)
|
|||||||||
|
Net cash (used for) provided by operating activities
|
$
|
(22.8
|
)
|
$
|
166.5
|
|
$
|
18.7
|
|
$
|
—
|
|
$
|
162.4
|
|
||||
|
Cash Flows from Investing:
|
|
|
|
|
|
|
|
|
|
|
|||||||||
|
Capital expenditures
|
$
|
(1.4
|
)
|
$
|
(36.5
|
)
|
$
|
(35.0
|
)
|
$
|
—
|
|
$
|
(72.9
|
)
|
||||
|
Proceeds from sale of property, plant and equipment
|
—
|
|
—
|
|
0.8
|
|
—
|
|
0.8
|
|
|||||||||
|
Restricted cash
|
1.0
|
|
—
|
|
(4.3
|
)
|
—
|
|
(3.3
|
)
|
|||||||||
|
Intercompany investments
|
131.4
|
|
(175.4
|
)
|
(4.8
|
)
|
48.8
|
|
—
|
|
|||||||||
|
Net cash provided by (used for) investing activities of continuing operations
|
131.0
|
|
(211.9
|
)
|
(43.3
|
)
|
48.8
|
|
(75.4
|
)
|
|||||||||
|
Net cash used for investing activities of discontinued operations
|
—
|
|
—
|
|
(0.1
|
)
|
—
|
|
(0.1
|
)
|
|||||||||
|
Net cash provided by (used for) investing activities
|
$
|
131.0
|
|
$
|
(211.9
|
)
|
$
|
(43.4
|
)
|
$
|
48.8
|
|
$
|
(75.5
|
)
|
||||
|
Cash Flows from Financing:
|
|
|
|
|
|
|
|
|
|
|
|||||||||
|
Payments on long-term debt
|
$
|
(439.7
|
)
|
$
|
(0.7
|
)
|
$
|
(55.0
|
)
|
$
|
—
|
|
$
|
(495.4
|
)
|
||||
|
Proceeds from long-term debt
|
300.0
|
|
—
|
|
83.3
|
|
—
|
|
383.3
|
|
|||||||||
|
Proceeds from revolving credit facility—net
|
34.4
|
|
—
|
|
—
|
|
—
|
|
34.4
|
|
|||||||||
|
Payments on notes financing—net
|
—
|
|
(2.1
|
)
|
(8.3
|
)
|
—
|
|
(10.4
|
)
|
|||||||||
|
Proceeds from swap monetization
|
14.8
|
|
—
|
|
—
|
|
—
|
|
14.8
|
|
|||||||||
|
Debt issue costs
|
(5.7
|
)
|
—
|
|
—
|
|
—
|
|
(5.7
|
)
|
|||||||||
|
Dividends paid
|
(10.6
|
)
|
—
|
|
—
|
|
—
|
|
(10.6
|
)
|
|||||||||
|
Exercises of stock options including windfall tax benefits
|
6.4
|
|
—
|
|
—
|
|
—
|
|
6.4
|
|
|||||||||
|
Intercompany financing
|
—
|
|
43.7
|
|
5.1
|
|
(48.8
|
)
|
—
|
|
|||||||||
|
Net cash (provided by) used for financing activities
|
$
|
(100.4
|
)
|
$
|
40.9
|
|
$
|
25.1
|
|
$
|
(48.8
|
)
|
$
|
(83.2
|
)
|
||||
|
Effect of exchange rate changes on cash
|
—
|
|
—
|
|
1.2
|
|
—
|
|
1.2
|
|
|||||||||
|
Net increase (decrease) in cash and cash equivalents
|
7.8
|
|
(4.5
|
)
|
1.6
|
|
—
|
|
4.9
|
|
|||||||||
|
Balance at beginning of period
|
4.2
|
|
8.5
|
|
55.6
|
|
—
|
|
68.3
|
|
|||||||||
|
Balance at end of period
|
$
|
12.0
|
|
$
|
4.0
|
|
$
|
57.2
|
|
$
|
—
|
|
$
|
73.2
|
|
||||
110
24. Quarterly Financial Data (Unaudited)
The following table presents quarterly financial data for
2014
and
2013
:
|
|
2014
|
2013
|
||||||||||||||||||||||||||||||
|
(in millions, except per share data)
|
First
|
Second
|
Third
|
Fourth
|
First
|
Second
|
Third
|
Fourth
|
||||||||||||||||||||||||
|
Net sales
|
$
|
850.0
|
|
$
|
1,012.8
|
|
$
|
986.3
|
|
$
|
1,037.4
|
|
$
|
894.6
|
|
$
|
1,037.1
|
|
$
|
1,012.1
|
|
$
|
1,104.3
|
|
||||||||
|
Gross profit
|
227.1
|
|
272.3
|
|
245.2
|
|
241.5
|
|
222.1
|
|
276.0
|
|
262.1
|
|
261.6
|
|
||||||||||||||||
|
Earnings from continuing operations before taxes on earnings
|
8.6
|
|
66.1
|
|
56.3
|
|
38.4
|
|
22.3
|
|
71.4
|
|
70.8
|
|
60.7
|
|
||||||||||||||||
|
Discontinued operations:
|
|
|
|
|
|
|
|
|
|
|
|
|
|
|
|
|
||||||||||||||||
|
(Loss) earnings from discontinued operations, net of income taxes
|
(1.0
|
)
|
(0.3
|
)
|
(0.2
|
)
|
0.1
|
|
(4.1
|
)
|
(7.6
|
)
|
(3.2
|
)
|
(3.9
|
)
|
||||||||||||||||
|
Loss on sale of discontinued operations, net of income taxes
|
(9.9
|
)
|
—
|
|
(1.1
|
)
|
—
|
|
(1.6
|
)
|
—
|
|
—
|
|
(1.1
|
)
|
||||||||||||||||
|
Net (loss) earnings
|
(4.9
|
)
|
46.6
|
|
73.1
|
|
33.6
|
|
8.1
|
|
54.5
|
|
50.6
|
|
54.4
|
|
||||||||||||||||
|
Less: Earnings (loss) attributable to noncontrolling interest, net of tax
|
3.9
|
|
—
|
|
—
|
|
—
|
|
(2.3
|
)
|
(3.1
|
)
|
(2.3
|
)
|
33.5
|
|
||||||||||||||||
|
Net (loss) earnings attributable to Manitowoc
|
$
|
(8.8
|
)
|
$
|
46.6
|
|
$
|
73.1
|
|
$
|
33.6
|
|
$
|
10.4
|
|
$
|
57.6
|
|
$
|
52.9
|
|
$
|
20.9
|
|
||||||||
|
Basic earnings per share:
|
|
|
|
|
|
|
|
|
|
|
|
|
|
|
|
|
||||||||||||||||
|
Earnings from continuing operations attributable to Manitowoc common shareholders
|
$
|
0.01
|
|
$
|
0.35
|
|
$
|
0.55
|
|
$
|
0.25
|
|
$
|
0.11
|
|
$
|
0.47
|
|
$
|
0.41
|
|
$
|
0.18
|
|
||||||||
|
Discontinued operations:
|
|
|
|
|
|
|
|
|
|
|
|
|
|
|
|
|
||||||||||||||||
|
Loss from discontinued operations attributable to Manitowoc common shareholders
|
—
|
|
—
|
|
—
|
|
—
|
|
(0.02
|
)
|
(0.04
|
)
|
(0.01
|
)
|
(0.02
|
)
|
||||||||||||||||
|
Loss on sale of discontinued operations, net of income taxes
|
(0.07
|
)
|
—
|
|
(0.01
|
)
|
—
|
|
(0.01
|
)
|
—
|
|
—
|
|
(0.01
|
)
|
||||||||||||||||
|
(Loss) earnings per share attributable to Manitowoc common shareholders
|
$
|
(0.07
|
)
|
$
|
0.35
|
|
$
|
0.54
|
|
$
|
0.25
|
|
$
|
0.08
|
|
$
|
0.43
|
|
$
|
0.40
|
|
$
|
0.16
|
|
||||||||
|
Diluted earnings per share:
|
|
|
|
|
|
|
|
|
|
|
|
|
|
|
|
|
||||||||||||||||
|
Earnings from continuing operations attributable to Manitowoc common shareholders
|
$
|
0.01
|
|
$
|
0.34
|
|
$
|
0.54
|
|
$
|
0.24
|
|
$
|
0.10
|
|
$
|
0.46
|
|
$
|
0.40
|
|
$
|
0.18
|
|
||||||||
|
Discontinued operations:
|
|
|
|
|
|
|
|
|
|
|
|
|
|
|
|
|
||||||||||||||||
|
Loss from discontinued operations attributable to Manitowoc common shareholders
|
—
|
|
—
|
|
—
|
|
—
|
|
(0.02
|
)
|
(0.04
|
)
|
(0.01
|
)
|
(0.02
|
)
|
||||||||||||||||
|
Loss on sale of discontinued operations, net of income taxes
|
(0.07
|
)
|
—
|
|
(0.01
|
)
|
—
|
|
(0.01
|
)
|
—
|
|
—
|
|
(0.01
|
)
|
||||||||||||||||
|
(Loss) earnings per share attributable to Manitowoc common shareholders
|
$
|
(0.06
|
)
|
$
|
0.34
|
|
$
|
0.53
|
|
$
|
0.25
|
|
$
|
0.08
|
|
$
|
0.43
|
|
$
|
0.39
|
|
$
|
0.15
|
|
||||||||
|
Dividends per common share
|
$
|
—
|
|
$
|
—
|
|
$
|
—
|
|
$
|
0.08
|
|
$
|
—
|
|
$
|
—
|
|
$
|
—
|
|
$
|
0.08
|
|
||||||||
111
25. Subsequent Events
On January 29, 2015, Manitowoc announced that its Board of Directors has approved a plan to pursue a separation of the company’s Crane and Foodservice businesses into two independent, publicly-traded companies. The company currently anticipates effecting the separation through a tax-free spin-off of the Foodservice business and expects the spin-off to be completed in the first quarter of 2016.
112
None.
Conclusion Regarding the Effectiveness of Disclosure Controls and Procedures
The company’s management, with the participation of the company’s Chief Executive Officer and Chief Financial Officer, have evaluated the effectiveness of the company’s disclosure controls and procedures (as such term is defined in Rules 13a-15(e) and 15d-15(e) under the Securities Exchange Act of 1934, as amended (“the Exchange Act”)) as of the end of the period covered by this report. Based on such evaluation, the company’s Chief Executive Officer and Chief Financial Officer have concluded that, as of the end of such period, the company’s disclosure controls and procedures are effective in recording, processing, summarizing, and reporting, on a timely basis, information required to be disclosed by the company in the reports that it files or submits under the Exchange Act, and that such information is accumulated and communicated to the Chief Executive Officer and Chief Financial Officer, as appropriate, to allow timely discussions regarding required disclosure.
Management’s Report on Internal Control Over Financial Reporting
The company’s management is responsible for establishing and maintaining adequate internal control over financial reporting, as such term is defined in Exchange Act Rule 13a-15(f). The company’s management, with the participation of the company’s Chief Executive Officer and Chief Financial Officer, has evaluated the effectiveness of the company’s internal control over financial reporting based on the framework in Internal Control-Integrated Framework (2013) issued by the Committee of Sponsoring Organizations of the Treadway Commission. Based on this evaluation, the company’s management has concluded that, as of
December 31, 2014
, the company’s internal control over financial reporting was effective.
Because of its inherent limitations, internal control over financial reporting may not prevent or detect misstatements. Also, projections of any evaluation of effectiveness to future periods are subject to the risk that the controls may become inadequate because of changes in conditions, or that the degree of compliance with the policies or procedures may deteriorate.
The effectiveness of the company’s internal control over financial reporting as of
December 31, 2014
, has been audited by PricewaterhouseCoopers LLP, an independent registered public accounting firm, as stated in their report which appears herein.
Changes in Internal Control Over Financial Reporting
During the fourth quarter of
2014
, there were no changes in our internal control over financial reporting that have materially affected, or are reasonably likely to materially affect, our internal control over financial reporting.
None.
113
The information required by this item is incorporated by reference from the sections of the 2015 Proxy Statement captioned “Section 16(a) Beneficial Ownership Reporting Compliance,” “Audit Committee” and “Election of Directors.” See also “Executive Officers of the Registrant” in Part I hereof, which is incorporated herein by reference.
The company has a Global Ethics Policy and other policies relating to business conduct, that pertain to all employees, which can be viewed at the company’s website (www.manitowoc.com). The company has adopted a code of ethics that applies to the company’s principal executive officer, principal financial officer, and controller, which is part of the company’s Global Ethics Policy and other policies related to business conduct. Any amendments to the Global Ethics Policy, or information about any waivers granted to directors or executive officers with respect to the Global Ethics Policy will be posted on the company’s website (www.manitowoc.com).
The information required by this item is incorporated by reference from the sections of the 2015 Proxy Statement captioned “Compensation of Directors,” “Executive Compensation,” “Report of the Compensation and Benefits Committee on Executive Compensation,” and “Contingent Employment Agreements.”
The information required by this item is incorporated by reference from the sections of the 2015 Proxy Statement captioned “Ownership of Securities” and the subsection captioned “Equity Compensation Plans.”
The information required by this item is incorporated by reference from the section of the 2015 Proxy Statement captioned “Governance of the Board and its Committees — Governance of the Company.”
The information required by this item is incorporated by reference from the section of the 2015 Proxy Statement captioned “Other Information — Independent Registered Public Accounting Firm.”
114
(a) Documents filed as part of this Report.
|
(1)
|
Financial Statements:
|
||
|
The following Consolidated Financial Statements are filed as part of this report under Item 8, “Financial Statements and Supplementary Data.”
|
|||
|
|
|
||
|
|
|||
|
|
|
||
|
|
|||
|
|
|
||
|
|
|||
|
|
|
||
|
|
|||
|
|
|
||
|
|
|||
|
|
|
||
|
|
|||
|
|
|
||
|
(2)
|
Financial Statement Schedule:
|
||
|
|
|
||
|
|
|||
|
Schedule
|
|
Description
|
|
Filed Herewith
|
|
|
|
|
|
|
|
II
|
|
Valuation and Qualifying Accounts
|
|
X
|
All other financial statement schedules not listed have been omitted since the required information is included in the Consolidated Financial Statements or the Notes thereto, or is not applicable or required under rules of Regulation S-X.
(b) Exhibits:
See Index to Exhibits immediately following the signature page of this report, which is incorporated herein by reference.
115
THE MANITOWOC COMPANY, INC
AND SUBSIDIARIES
Schedule II: Valuation and Qualifying Accounts
For The Years Ended December 31, 2014, 2013 and 2012
(dollars in millions)
|
|
Balance at
Beginning of
Year
|
Charge to
Costs and
Expenses
|
Utilization of
Reserve
|
Other, Primarily
Impact of
Foreign
Exchange
Rates
|
Balance at end
of Year
|
||||||||||||||
|
Year End December 31, 2012
|
|
|
|
|
|
|
|
|
|
|
|||||||||
|
Allowance for doubtful accounts
|
$
|
12.8
|
|
$
|
6.5
|
|
$
|
(6.1
|
)
|
$
|
0.1
|
|
$
|
13.3
|
|
||||
|
Deferred tax valuation allowance
|
$
|
118.9
|
|
$
|
35.7
|
|
$
|
—
|
|
$
|
3.4
|
|
$
|
158.0
|
|
||||
|
Year End December 31, 2013
|
|
|
|
|
|
|
|
|
|
|
|||||||||
|
Allowance for doubtful accounts
|
$
|
13.3
|
|
$
|
8.1
|
|
$
|
(3.4
|
)
|
$
|
0.2
|
|
$
|
18.2
|
|
||||
|
Deferred tax valuation allowance
|
$
|
158.0
|
|
$
|
1.1
|
|
$
|
(3.4
|
)
|
$
|
(5.9
|
)
|
$
|
149.8
|
|
||||
|
Year End December 31, 2014
|
|
|
|
|
|
|
|
|
|
|
|||||||||
|
Allowance for doubtful accounts
|
$
|
18.2
|
|
$
|
9.2
|
|
$
|
(6.4
|
)
|
$
|
(1.6
|
)
|
$
|
19.4
|
|
||||
|
Deferred tax valuation allowance
|
$
|
149.8
|
|
$
|
32.4
|
|
$
|
(0.4
|
)
|
$
|
(13.6
|
)
|
$
|
168.2
|
|
||||
116
SIGNATURES
Pursuant to the requirements of Section 13 or 15(d) of the Securities Exchange Act of 1934, the registrant has duly caused this Report to be signed on its behalf by the undersigned, thereunto duly authorized:
Date:
February 20, 2015
|
The Manitowoc Company, Inc.
|
|
|
(Registrant)
|
|
|
|
|
|
/s/ Glen E. Tellock
|
|
|
Glen E. Tellock
|
|
|
Chairman and Chief Executive Officer
|
|
|
|
|
|
/s/ Carl J. Laurino
|
|
|
Carl J. Laurino
|
|
|
Senior Vice President and Chief Financial Officer
|
|
Pursuant to the requirements of the Securities Exchange Act of 1934, this Report has been signed below by the following persons on behalf of the registrant and in the capacities and on the dates indicated:
|
/s/ Glen E. Tellock
|
|
|
|
Glen E. Tellock, Chairman and Chief Executive Officer
|
|
February 20, 2015
|
|
|
|
|
|
/s/ Carl J. Laurino
|
|
|
|
Carl J. Laurino, Senior Vice President and Chief Financial Officer
|
|
February 20, 2015
|
|
|
|
|
|
/s/ Roy V. Armes
|
|
|
|
Roy V. Armes, Director
|
|
February 20, 2015
|
|
|
|
|
|
/s/ Robert G. Bohn
|
|
|
|
Robert G. Bohn, Director
|
|
February 20, 2015
|
|
|
|
|
|
/s/ Joan K. Chow
|
|
|
|
Joan K. Chow, Director
|
|
February 20, 2015
|
|
|
|
|
|
/s/ Donald M. Condon, Jr.
|
||
|
Donald M. Condon, Jr., Director
|
February 20, 2015
|
|
|
/s/ Cynthia M. Egnotovich
|
|
|
|
Cynthia M. Egnotovich, Director
|
|
February 20, 2015
|
|
|
|
|
|
/s/ Kenneth W. Krueger
|
|
|
|
Kenneth W. Krueger, Director
|
|
February 20, 2015
|
|
|
|
|
|
/s/ Keith D. Nosbusch
|
|
|
|
Keith D. Nosbusch, Director
|
|
February 20, 2015
|
|
|
|
|
|
/s/ James L. Packard
|
|
|
|
James L. Packard, Director
|
|
February 20, 2015
|
117
THE MANITOWOC COMPANY, INC.
ANNUAL REPORT ON FORM 10-K
FOR THE YEAR ENDED DECEMBER 31, 2014
INDEX TO EXHIBITS
|
Exhibit No.
|
|
Description
|
|
Filed/Furnished
Herewith
|
|
|
|
|
|
|
|
1.1
|
Underwriting Agreement dated October 4, 2012 among The Manitowoc Company, Inc., the Guarantors named therein (filed as Exhibit 1.1 to the company’s Current Report on Form 8-K filed October 5, 2012 and incorporated herein by reference.)
|
|||
|
|
|
|
|
|
|
3.1
|
|
Amended and Restated Articles of Incorporation, effective as of May 7, 2013 (filed as Exhibit 3.1 to the company’s Quarterly Report on Form 10-Q filed on August 2, 2013 and incorporated herein by reference).
|
|
|
|
|
|
|
|
|
|
3.2
|
|
Restated By-laws (filed as Exhibit 3.1 to the company’s Current Report on Form 8-K filed on January 29, 2015 and incorporated herein by reference).
|
|
|
|
|
|
|
|
|
|
4.1
|
|
Rights Agreement dated March 21, 2007 between the Registrant and Computershare Trust Company, N.A. (filed as Exhibit 4.1 to the company’s Current Report on Form 8-K dated as of March 21, 2007 and incorporated herein by reference).
|
|
|
|
|
|
|
|
|
|
4.2(a)
|
|
Indenture, dated as of February 8, 2010, between The Manitowoc Company, Inc. and Wells Fargo Bank, National Association, a national banking association, as Trustee (filed as Exhibit 4.1 to the company’s Current Report on Form 8-K filed on February 10, 2010 and incorporated herein by reference).
|
|
|
|
|
|
|
|
|
|
4.2(b)
|
|
Second Supplemental Indenture, dated as of October 18, 2010, among The Manitowoc Company, Inc., the Guarantors named therein, and Wells Fargo Bank, National Association, as Trustee (filed as Exhibit 4.1 to the company’s Current Report on Form 8-K filed on October 20, 2010 and incorporated herein by reference).
|
|
|
|
|
|
|
|
|
|
4.2(c)
|
Fourth Supplemental Indenture, dated as of October 19, 2012, among The Manitowoc Company, Inc., the Guarantors named therein, and Wells Fargo Bank, National Association, as Trustee (filed as Exhibit 4.1 to the company’s Current Report on Form 8-K filed on October 22, 2012 and incorporated herein by reference).
|
|||
|
4.3
|
|
Articles III, V, and VIII of the Amended and Restated Articles of Incorporation (see Exhibit 3.1 above).
|
|
|
|
|
|
|
|
|
|
4.4(a)
|
|
Second Amended and Restated Credit Agreement, dated as of May 13, 2011, by and among The Manitowoc Company, Inc., the subsidiary borrowers named therein, the lenders named therein, and JPMorgan Chase Bank, N.A., as administrative agent (filed as Exhibit 4.1 to the company’s Current Report on Form 8-K dated as of May 13, 2011 and incorporated herein by reference). (Superseded)
|
|
|
118
|
4.4(b)
|
Third Amended and Restated Credit Agreement, dated as of January 3, 2014, by and among The Manitowoc Company, Inc., as Borrower, JPMorgan Chase Bank, N.A., as Administrative Agent, Deutsche Bank Securities Inc., Bank of America, N.A., and Wells Fargo Bank, National Association, as Syndication Agents, and SunTrust Bank, as Documentation Agent (filed as Exhibit 4.1 to the company’s Current Report on Form 8-K dated as of January 3, 2014 and incorporated herein by reference).
|
|||
|
|
|
|
|
|
|
4.4(c)
|
|
Amendment No. 1 to the Third Amended and Restated Credit Agreement, dated as of February 10, 2014, by and among The Manitowoc Company, Inc. as Borrower, the Subsidiary Borrowers, and JPMorgan Chase Bank, N.A. as Administrative Agent and other financial institutions. (Reflects non-material changes; filed as exhibit 4.4(c) to the company's Annual Report on Form 10-K for the fiscal year ended December 31, 2013 and incorporated therein by reference).
|
|
|
|
4.4(d)
|
Amendment No. 2 to the Third Amended and Restated Credit Agreement, dated as of February 20, 2015, by and among The Manitowoc Company, Inc. as Borrower, the Subsidiary Borrowers, and JPMorgan Chase Bank, N.A. as Administrative Agent and other financial institutions. (Reflects non-material changes; filed as exhibit 4.4(d) to the company's Annual Report on Form 10-K for the fiscal year ended December 31, 2014 and incorporated therein by reference).
|
X(1)
|
||
|
10.1**
|
|
The Manitowoc Company, Inc. Deferred Compensation Plan, as amended and restated through December 31, 2008 (filed as exhibit 10.1 to the company’s Annual Report on Form 10-K for the fiscal year ended December 31, 2008 and incorporated herein by reference).
|
||
|
|
|
|
|
|
|
10.2(a)**
|
|
Short-Term Incentive Plan, as amended, effective January 1, 2013. (filed as Exhibit 10.2(a) to the company’s Annual Report on Form 10-K for the fiscal year ended December 31, 2012 and incorporated herein by reference).
|
|
|
|
|
|
|
|
|
|
10.3(a)**
|
|
Form of Contingent Employment Agreement between the company and the Chief Executive Officer, Glen E. Tellock. (filed as Exhibit 10.3(a) to the company’s Annual Report on Form 10-K for the fiscal year ended December 31, 2012 and incorporated herein by reference).
|
|
|
|
|
|
|
|
|
|
10.3(b)**
|
|
Form of Contingent Employment Agreement between the company and the following executive officers of the Company: Eric P. Etchart, Robert M. Hund, Carl J. Laurino, Maurice D. Jones, Thomas G. Musial, Dean J. Nolden, Therese C. Houlahan, and Larry J. Weyers. (filed as Exhibit 10.3(b) to the company’s Annual Report on Form 10-K for the fiscal year ended December 31, 2012 and incorporated herein by reference).
|
|
|
|
|
|
|
|
|
|
10.4**
|
|
Form of Indemnity Agreement between the company and each of the directors, executive officers and certain other employees of the company (filed as Exhibit 10(b) to the company’s Annual Report on Form 10-K for the fiscal year ended July 1, 1989 and incorporated herein by reference).
|
|
|
|
|
|
|
|
|
|
10.6(c)**
|
|
Supplemental Retirement Plan, as amended and restated through December 31, 2008 (filed as Exhibit 10.6(c) to the company’s Annual Report on Form 10-K for the fiscal year ended December 31, 2008 and incorporated herein by reference).
|
|
|
|
|
|
|
|
|
119
|
10.7(a)**
|
|
The Manitowoc Company, Inc. 2003 Incentive Stock and Awards Plan, as amended, effective May 1, 2012 (filed as Exhibit 10.7(c) to the company’s Proxy Statement for its 2012 annual meeting, filed on March 22, 2012 and incorporated herein by reference).
|
|
|
|
|
|
|
|
|
|
10.7(b)**
|
|
The Manitowoc Company, Inc. 2004 Non-Employee Director Stock and Awards Plan, as amended on December 17, 2008, (filed as Exhibit 10.7(e) to the company’s Annual Report on Form 10-K for the fiscal year ended December 31, 2008 and incorporated herein by reference).
|
|
|
|
|
|
|
|
|
|
10.8**
|
|
The Manitowoc Company, Inc. Incentive Stock Option Agreement with Vesting Provisions, applicable to the company’s 2003 Incentive Stock and Awards Plan (filed as Exhibit 10.1 to the company’s Current Report on Form 8-K dated as of February 25, 2005 and incorporated herein by reference).
|
|
|
|
|
|
|
|
|
|
10.9**
|
|
The Manitowoc Company, Inc. Non-Qualified Stock Option Agreement with Vesting Provisions, applicable to the company’s 2003 Incentive Stock and Awards Plan (filed as Exhibit 10.2 to the company’s Current Report on Form 8-K dated as of February 25, 2005 and incorporated herein by reference).
|
|
|
|
|
|
|
|
|
|
10.10(a)**
|
|
The Manitowoc Company, Inc. Award Agreement for Restricted Stock Awards under the company’s 2003 Incentive Stock and Awards Plan, amended February 27, 2007 (filed as Exhibit 10.10 to the company’s Annual Report on Form 10-K for the fiscal year ended December 31, 2004 and incorporated herein by reference).
|
|
|
|
|
|
|
|
|
|
10.10(b)**
|
|
The Manitowoc Company, Inc. Performance Share Award Agreement, applicable to the company’s 2003 Incentive Stock and Awards Plan (filed as Exhibit 10.10 to the company’s Annual Report on Form 10-K for the fiscal year ended December 31, 2010 and incorporated herein by reference).
|
|
|
|
|
|
|
|
|
|
10.11**
|
|
The Manitowoc Company, Inc. Award Agreement for the 2004 Non-employee Director Stock and Awards Plan, as amended effective May 3, 2006 and February 27, 2007 (filed as Exhibit 10.11 to the company’s Annual Report on Form 10-K for the fiscal year ended December 31, 2006 and incorporated herein by reference).
|
|
|
|
|
|
|
|
|
|
10.12**
|
The Manitowoc Company, Inc. 2013 Omnibus Incentive Plan (filed as Appendix A to the company’s Definitive Proxy Statement for its 2013 Annual Meeting, filed on March 22, 2013 and incorporated herein by reference).
|
|||
|
10.12(a)**
|
Form of Performance Share Award Agreement under The Manitowoc Company, Inc. 2013 Omnibus Incentive Plan (filed as Exhibit 10.1 to the company’s Quarterly Report on Form 10-Q filed on August 2, 2013 and incorporated herein by reference).
|
|||
|
10.12(b)**
|
Form of Restricted Stock Award Agreement for Directors under The Manitowoc Company, Inc. 2013 Omnibus Incentive Plan (filed as Exhibit 10.2 to the company’s Quarterly Report on Form 10-Q filed on August 2, 2013 and incorporated herein by reference).
|
|||
|
10.12(c)**
|
Form of Restricted Stock Award Agreement for Employees under The Manitowoc Company, Inc. 2013 Omnibus Incentive Plan (filed as Exhibit 10.3 to the company’s Quarterly Report on Form 10-Q filed on August 2, 2013 and incorporated herein by reference).
|
|||
120
|
10.12(d)**
|
Form of Restricted Stock Unit Award Agreement for Directors under The Manitowoc Company, Inc. 2013 Omnibus Incentive Plan (filed as Exhibit 10.4 to the company’s Quarterly Report on Form 10-Q filed on August 2, 2013 and incorporated herein by reference).
|
|||
|
10.12(e)**
|
Form of Restricted Stock Unit Award Agreement for Employees under The Manitowoc Company, Inc. 2013 Omnibus Incentive Plan (filed as Exhibit 10.5 to the company’s Quarterly Report on Form 10-Q filed on August 2, 2013 and incorporated herein by reference).
|
|||
|
10.12(f)**
|
Form of Non-Qualified Stock Option Award Agreement under The Manitowoc Company, Inc. 2013 Omnibus Incentive Plan (filed as Exhibit 10.6 to the company’s Quarterly Report on Form 10-Q filed on August 2, 2013 and incorporated herein by reference).
|
|||
|
10.12(g)**
|
Form of Incentive Award Agreement under The Manitowoc Company, Inc. 2013 Omnibus Incentive Plan (filed as Exhibit 10.7 to the company’s Quarterly Report on Form 10-Q filed on August 2, 2013 and incorporated herein by reference).
|
|||
|
10.13
|
Fifth Amended and Restated Receivables Purchase Agreement among Manitowoc Funding, LLC, as U.S. Seller, Manitowoc Cayman Islands Funding Ltd., as Cayman Seller, and The Manitowoc Company, Inc., Garland Commercial Ranges Limited, Convotherm Elektrogeräte GmbH, Manitowoc Deutschland GmbH, and Manitowoc Foodservice UK Limited as a Servicers, and Wells Fargo, N.A., as Purchaser and Agent dated as of December 15, 2014 (filed as Exhibit 10.1 to the company’s Current Report on Form 8-K filed December 16, 2014 and incorporated herein by reference).
|
|||
|
|
|
|
|
|
|
10.14**
|
|
The Manitowoc Company, Inc. Severance Pay Plan adopted by the Board of Directors as of May 4, 2009 (filed as Exhibit 10.13 to the company’s Quarterly Report on Form 10-Q for the period ended September 30, 2009, and incorporated herein by reference.)
|
|
|
|
11
|
|
Statement regarding computation of basic and diluted earnings per share (see Note 14, “Earnings Per Share” to the Consolidated Financial Statements included herein).
|
|
|
|
|
|
|
|
|
|
12.1
|
|
Statement of Computation of Ratio of Earnings to Fixed Charges
|
|
X(1)
|
|
|
|
|
|
|
|
21
|
|
Subsidiaries of The Manitowoc Company, Inc.
|
|
X(1)
|
|
|
|
|
|
|
|
23.1
|
|
Consent of PricewaterhouseCoopers LLP, the company’s Independent Registered Public Accounting Firm
|
|
X(1)
|
|
|
|
|
|
|
|
31
|
|
Rule 13a - 14(a)/15d - 14(a) Certifications
|
|
X(1)
|
|
|
|
|
|
|
|
32.1
|
|
Certification of CEO pursuant to 18 U.S.C. Section 1350
|
|
X(2)
|
|
|
|
|
|
|
|
32.2
|
|
Certification of CFO pursuant to 18 U.S.C. Section 1350
|
|
X(2)
|
|
|
|
|
|
|
121
|
101
|
|
The following materials from the company’s Annual Report on Form 10-K for the year ended December 31, 2014 formatted in Extensible Business Reporting Language (XBRL): (i) the Consolidated Statements of Income, (ii) the Consolidated Statements of Comprehensive Income (iii) the Consolidated Balance Sheets, (iv) the Consolidated Statements of Cash Flows, (v) the Consolidated Statement of Equity and (vi) related notes.
|
|
X(1)
|
(1) Filed Herewith
(2) Furnished Herewith
** Management contracts and executive compensation plans and arrangements required to be filed as exhibits pursuant to item 15(c) of Form 10-K.
122
TABLE OF CONTENTS
Part IItem 1. BusinessItem 1A. Risk FactorsItem 1B. Unresolved Staff CommentsItem 2. PropertiesItem 3. Legal ProceedingsItem 4. Mine Safety DisclosurePart IIItem 5. Market For Registrant S Common Equity and Related Stockholder MattersItem 6. Selected Financial DataItem 7. Management S Discussion and Analysis Of Financial Condition and Results Of OperationsItem 7A. Quantitative and Qualitative Disclosures About Market RiskItem 8. Financial Statements and Supplementary DataItem 9. Changes in and Disagreements with Accountants on Accounting and Financial DisclosureItem 9A. Controls and ProceduresItem 9B. Other InformationPart IIIItem 10. Directors, Executive Officers and Corporate GovernanceItem 11. Executive CompensationItem 12. Security Ownership Of Certain Beneficial Owners and ManagementItem 13. Certain Relationships and Related Transactions, and Director IndependenceItem 14. Principal Accounting Fees and ServicesPart IVItem 15. Exhibits and Financial Statement Schedules