MINERALS TECHNOLOGIES INC
10-Ks and 10-Qs
|
|
|
|
|
|
|
|
|
|
|
|
|
|
|
|
|
|
|
|
|
|
|
|
|
|
|
|
|
|
|
|
|
|
|
|
|
|
|
|
|
|
|
|
|
|
|
|
|
|
|
|
|
|
|
|
|
|
|
|
|
|
UNITED STATES
SECURITIES AND EXCHANGE COMMISSION
WASHINGTON, D.C. 20549
FORM
10-K
For the fiscal year ended
December 31, 2022
For the transition period from ________ to _________
Commission file number
1-11430
(Exact name of registrant as specified in its charter)
|
|
|
|
|
(State or other jurisdiction of incorporation or organization)
|
(I.R.S. Employer Identification Number)
|
|
|
|
|
|
(Address of principal executive office)
|
(Zip Code)
|
(
212
)
878-1800
(Registrant's telephone number, including area code)
Securities registered pursuant to Section 12(b) of the Act:
|
Title of each class
|
Trading Symbol
|
Name of each exchange on which registered
|
|
|
|
|
Securities registered pursuant to Section 12(g) of the Act:
None
Indicate by check mark if the Registrant is a well-known seasoned issuer, as defined in Rule 405 of the Securities Act.
Indicate by check mark if Registrant is not required to file reports pursuant to Section 13 or 15(d) of the Act.
Yes
☐
No
☒
Indicate by check mark whether the Registrant (1) has filed all reports required to be filed by Section 13 or 15(d) of the Securities Exchange Act of 1934 during the preceding 12 months (or for such shorter period that the Registrant was required to file such reports), and (2) has been subject to such filing requirements for the past 90 days.
Indicate by check mark whether the registrant has submitted electronically every Interactive Data File required to be submitted pursuant to Rule 405 of Regulation S-T (§232.405 of this chapter) during the preceding 12 months (or for such shorter period that the registrant was required to submit such files).
Indicate by check mark whether the registrant is a large accelerated filer, an accelerated filer, a non-accelerated filer, smaller reporting company, or an emerging growth company. See the definitions of “large accelerated filer,” “accelerated filer,” “smaller reporting company,” and “emerging growth company” in Rule 12b-2 of the Exchange Act
|
|
Accelerated Filer
☐
|
Emerging Growth Company
|
|
Non-accelerated Filer
☐
|
Smaller Reporting Company
|
I
f an emerging growth company, indicate by check mark if the registrant has elected not to use the extended transition period for complying with any new or revised financial accounting standards provided pursuant to Section 13(a) of the Exchange Act.
☐
Indicate by check mark whether the registrant has filed a report on and attestation to its management’s assessment of the effectiveness of its internal control over financial reporting under Section 404(b) of the Sarbanes-Oxley Act (15 U.S.C. 7262(b)) by the registered public accounting firm that prepared or issued its audit report.
☒
If securities are registered pursuant to Section 12(b) of the Act, indicate by check mark whether the financial statements of the registrant included in the filing reflect the correction of an error to previously issued financial statements.
☐
Indicate by check mark whether any of those error corrections are restatements that required a recovery analysis of incentive-based compensation received by any of the registrant’s executive officers during the relevant recovery period pursuant to §240.10D-1(b).
☐
Indicate by check mark whether the Registrant is a shell company (as defined in Rule 12b-2 of the Act).
Yes
☐
No
☒
As of July 3, 2022, the aggregate market value of the voting stock held by non-affiliates of the Registrant (based upon the closing price at which the stock was sold as of July 3, 2022) was approximately $
1.8
billion. Solely for the purposes of this calculation, shares of common stock held by officers, directors and beneficial owners of 10% or more of the outstanding common stock have been excluded in that such persons may be deemed to be affiliates. This determination of affiliate status is not necessarily a conclusive determination for other purposes.
As of February 3, 2023, the Registrant had outstanding
32,540,148
shares of common stock, all of one class.
DOCUMENTS INCORPORATED BY REFERENCE
Portions of the registrant’s Proxy Statement for its 2023 Annual Meeting of Stockholders are incorporated herein by reference in Part III of this Annual Report on Form 10-K
.
2022 FORM 10-K ANNUAL REPORT
Table of Contents
|
|
Page No.
|
|
|
PART I
|
||
|
Item 1.
|
3
|
|
|
Item 1A.
|
15
|
|
|
Item 1B.
|
20
|
|
|
Item 2.
|
21
|
|
|
Item 3.
|
32
|
|
|
Item 4.
|
32
|
|
|
PART II
|
||
|
Item 5.
|
34
|
|
|
Item 6.
|
[Reserved]
|
38
|
|
Item 7.
|
38
|
|
|
Item 7A.
|
49
|
|
|
Item 8.
|
51
|
|
|
Item 9.
|
51
|
|
|
Item 9A.
|
51
|
|
|
Item 9B.
|
51
|
|
|
Item 9C.
|
51
|
|
|
PART III
|
||
|
Item 10.
|
52
|
|
|
Item 11.
|
52
|
|
|
Item 12.
|
52
|
|
|
Item 13.
|
52
|
|
|
Item 14.
|
53
|
|
|
PART IV
|
||
|
Item 15.
|
54
|
|
|
58
|
PART I
Minerals Technologies Inc. (together with its subsidiaries, the "Company", “we”, “us” or “our”) is a resource- and technology-based company that develops, produces, and markets on a worldwide basis a broad range of specialty mineral, mineral-based and synthetic mineral products and supporting systems and services.
As of December 31, 2022, the Company had three reportable segments: Performance Materials, Specialty Minerals and Refractories.
| ● |
The Performance Materials segment is a leading global supplier of a wide range of bentonite-based and synthetic materials for consumer-oriented and industrial markets and for non-residential construction, environmental remediation, and infrastructure projects. This segment is the Company's largest and most diverse business segment with extensive technical, sales and commercial capabilities.
|
| ● |
The Specialty Minerals segment produces and sells the synthetic mineral product precipitated calcium carbonate ("PCC") and processed mineral product quicklime ("lime"), and mines mineral ores then processes and sells natural mineral products, primarily limestone and talc. This segment is a leading supplier globally of PCC products. This segment's products are used principally in the paper and packaging, building materials, paint and coatings, glass, ceramic, polymer, food, automotive and pharmaceutical industries.
|
| ● |
The Refractories segment produces monolithic and shaped refractory materials and specialty products. It also provides services and sells application and measurement equipment, calcium metal and metallurgical wire products. Refractories segment products are primarily used in high-temperature applications in the steel, non-ferrous metal and glass industries.
|
See Note 22 to the Consolidated Financial Statements for a discussion of changes to the Company's segments expected to be made for the first quarter of 2023.
The following table sets forth the percentage of our revenues generated from each segment for each of our last three fiscal years:
|
|
2022
|
2021
|
2020
|
|||||||||
|
Percentage of Net Sales
|
||||||||||||
|
Performance Materials
|
53
|
%
|
53
|
%
|
52
|
%
|
||||||
|
Specialty Minerals
|
31
|
%
|
31
|
%
|
32
|
%
|
||||||
|
Refractories
|
16
|
%
|
16
|
%
|
16
|
%
|
||||||
|
Total
|
100
|
%
|
100
|
%
|
100
|
%
|
||||||
The Company maintains a research and development focus. The Company's research and development capability for developing and introducing technologically advanced new products has enabled the Company to anticipate and satisfy changing customer requirements, creating market opportunities through new product development and product application innovations.
Performance Materials Segment
The Performance Materials segment is a leading supplier of bentonite and bentonite-related products. Bentonite is a sedimentary deposit containing greater than 50% montmorillonite and is volcanic in origin. It is surface mined and then dried, crushed, sent through grinding mills where it is sized to customer requirements, and transferred to silos for automatic bagging or bulk shipment. The processed bentonite may be chemically modified. Bentonite’s unique chemical structure gives it a diverse range of capabilities, enabling it to act as a thickener, sealant, binder, lubricant or absorption agent. There are two primary types of natural bentonite utilized by the business, sodium and calcium. Sodium-bentonite is characterized by its ability to absorb large amounts of water and form viscous, thixotropic suspensions. Calcium-bentonite, in contrast, is characterized by its low water absorption and swelling capabilities and its inability to stay suspended in water. Each type of bentonite has its own unique applications. This segment also supplies leonardite, which is primarily used in metalcasting, drilling fluid additive, and agricultural applications. The principal products of this segment are marketed under various registered trade names, including VOLCLAY
®
, PANTHER CREEK
®
, PREMIUM GEL
®
, ADDITROL
®
, PREMIUM CHOICE
®
, ENERSOL
®
, RAFINOL
®
,
,
FLUORO-SORB
®
,
VitaLife
®
and Hevi-Sand
®
.
In addition, the segment provides products for non-residential construction, environmental and infrastructure projects worldwide. It serves customers engaged in a broad range of construction projects, including site remediation, concrete waterproofing for underground structures, liquid containment on projects ranging from landfills to flood control, and drilling applications including foundation, slurry wall, tunneling, water well, and horizontal drilling.
Household, Personal Care & Specialty Products
–
Products and Markets
The household, personal care & specialty products' business contains pet litter, fabric care, health and beauty, animal health, bleaching earth, advanced performance additives, agricultural and industrial specialty product lines.
The pet litter products include sodium bentonite-based scoopable (clumping), traditional and alternative cat litters sold to grocery and drug stores, mass merchandisers, wholesale clubs and pet specialty stores throughout North America, Europe and Asia. The Company’s scoopable products’ clump-forming capability traps urine, thereby reducing waste by allowing for easy removal of only the odor-producing elements from the litter box. The Company is a provider of private-label cat litter to retail partners, as well as a provider of bulk cat litter to national brands and other private label packaging companies. In North America, these products are sold from seven principal sites from which we package and distribute finished goods, as well as ship bulk material via rail cars. The Company’s internal transportation group provides logistics services and is a key component of our capability in supplying customers on a national basis. In Europe, these products are produced and sold by the Company's subsidiary, Sivomatic Holding, B.V. ("Sivomatic"). Sivomatic is a leading European supplier of premium pet litter products and is a vertically integrated manufacturer with production facilities in the Netherlands, Austria and Turkey. Sivomatic is a certified CO
2
neutral producer of cat litter.
On April 29, 2022, the Company completed the acquisition of Concept Pet Heimtierprodukte GmbH ("Concept Pet"), a European supplier of pet litter products. The purchase of Concept Pet supports the expansion of our European pet care business, as well as providing additional mineral reserves. The purchase price was $28.0 million, and the acquisition was financed through cash on hand. The fair value of the total consideration transferred, net of cash acquired, was $22.4 million.
On July 26, 2021, the Company completed the acquisition of Normerica Inc. ("Normerica"), a leading North American supplier of premium pet care products for approximately $189 million. Normerica has production facilities in Canada, the U.S. and Thailand. As a leader in the pet product industry, Normerica provides premium products, both branded and private label to world-class retailers. Its product portfolio consists primarily of bentonite-based cat litter products which are supplied from a network of strategically located manufacturing facilities in Canada and the United States.
The Company supplies fabric care products and additives consisting of high-grade, agglomerated bentonite and other mineral additives that perform as softening agents in certain powdered-detergent formulations or act as carriers for colorants, surfactants and fragrances. These fabric care products are formulated to adapt to our customers’ changing technical requirements.
The Company manufactures personal care products consisting of polymer delivery systems and purified grades of bentonite ingredients for sale to manufacturers of skin care products in the areas of anti-aging, anti-acne and body care. The polymers are used to deliver high-value active ingredients and the bentonite-based materials act as thickening, suspension and dispersion agent emollients for topical skin care formulations. The Company has been a market leader in the development of retinol based delivery systems and has now started to supply liquid retinoid products. Products range from ingredient sales to fully formulated finished goods.
Specialty Products include bentonite and leonardite based proprietary solutions for both consumer and industrial applications. Natural bentonite feed additives improve an animal’s digestive health. Bleaching Earth minerals clarify edible oils and are used for the production of biodiesel fuel. Advanced Performance Additives, including organoclays, are used in wine clarification, flame retardants, plastic packaging, rubber mold release, paints, coatings and ink manufacturing processes. Agricultural products are used to improve plant harvests, plant health and soil that enhance crop yield.
Drilling products are used in oil and gas well drilling as well as environmental and geotechnical drilling applications, horizontal directional drilling, mineral exploration and foundation construction. Bentonite imparts thickening and suspension properties that facilitate the transport of rock cuttings to the surface during the drilling process. It also contributes to a drilling fluid’s ability to lubricate the drill bit and coat the underground formations to prevent hole collapse and drill-bit seizing. Our primary trademark for this application is the trade name PREMIUM GEL
®
.
The Company produces other industrial products utilizing bentonite and bentonite blends for the construction industry to be used as a plasticizing agent in cement, and plaster and bricks. The Company also supplies bentonite to help pelletize other materials for ease of use. An example of this application includes the pelletizing of iron ore.
This product line also includes sales from our internal transportation and logistics group.
The Company’s household, personal care & specialty products product line net sales were $560.9 million, $460.5 million and $380.2 million for the years ended December 31, 2022, 2021 and 2020, respectively.
Metalcasting
–
Products and Markets
The metalcasting product line produces custom-blended mineral and non-mineral products to strengthen sand molds for casting auto parts, farm and construction equipment, oil and gas production equipment, power generation turbine castings and rail car components. These products help our customers in the foundry and casting industry to improve productivity by reducing scrap from metalcasting defects and poor surface quality. The ADDITROL
®
blends also improve the efficiency and recycling of sand blends in mold sand systems by lowering clay consumption and improve air quality by reducing volatile organic compound emissions. Our mine to mold operational capability has resulted in providing a consistent high-quality product, technical support and reliable on-time delivery service valued by our customers.
In the ferrous casting market, the Company specializes in blending bentonite of various grades by themselves or with mineral binders containing sodium bentonite, calcium bentonite, seacoal and other ingredients. In the steel alloy casting market, the Company sells chromite products with a particle size distribution specific to customers’ needs. One of chromite’s qualities is its ability to conduct heat. The Company markets the product for use in making very large, high integrity, steel alloy castings where the chromite is better suited to withstand the high heat and pressure associated with the casting process.
The Company is the exclusive distributor of certain specialty sand chromite products supplied by the Glencore-Merafe joint venture in select territories, including the Americas.
The metalcasting product line was originally sold into the U.S. by the American Colloid Company (ACC) and over the past 90 years has grown in its use throughout the world including China, Thailand, Korea, Australia, India and regions of EMEA. Over the past several years, the Company has focused on further investment in China and India.
The Company’s metalcasting product line net sales were $334.0 million, $319.2 million and $258.1 million for the years ended December 31, 2022, 2021 and 2020, respectively.
Environmental Products
–
Products and Markets
The environmental product line includes bentonite and polymer lining technologies, as well as, other environmental remediation applications.
The Company helps customers protect ground water and soil through the sale of geosynthetic clay liner products containing bentonite. These products are marketed under the RESISTEX
®
and BENTOMAT
®
trade names principally for lining and capping landfills, mine waste disposal sites and industrial waste storage sites, such as bauxite residue and coal ash waste. The Company also provides associated geosynthetic materials for these applications, including geotextiles and drainage geocomposites.
Environmental Products includes specialized technologies to mitigate vapor intrusion in new building construction. The Company’s innovative vapor barrier systems prevent potentially harmful vapors from entering occupied spaces, thus facilitating low-risk redevelopment. The Company also provides reactive capping technologies and solutions to effectively contain residual contamination, to reduce costs associated with ex-situ remedies, and aid in environmental protection. Products offered include Liquid Boot
®
, a liquid applied vapor barrier system; REACTIVE CORE-MAT
™
, an in-situ sediment capping material and QUIK-SOLID
®
, a super absorbent media. The Company specializes within the remediation market providing technologies to treat a variety of hazardous compounds in soil, groundwater, leachate and sediment. These products are marketed under the ORGANOCLAY
®
trade name. The Company also specializes in treating soil, groundwater, surface water and drinking water contaminated with Per-and polyfluoroalkyl substances (PFAS) and Perfluorooctane sulfonate (PFOS) under the FLUORO-SORB
®
trade name.
Additionally, the Environmental Products segment provides offshore filtration and well testing services to improve the production, cost, compliance, and environmental impact of activities performed globally in the oil and gas industry. The composition of customers within this segment varies from year to year and is significantly dependent on the type of activities each customer is undertaking within the year, regulations, and overall dynamics of the oil and gas industry. This product line provides services for offshore filtration and well testing to the worldwide oil and gas industry through subsidiaries located in Australia, Brazil, Malaysia, Nigeria, Indonesia, Saudi Arabia and the United Kingdom.
The Company’s environmental product line net sales were $174.1 million, $136.3 million and $131.6 million for the years ended December 31, 2022, 2021 and 2020, respectively.
Building Materials
–
Products and Markets
The building materials product line includes various active and passive products for the waterproofing of underground structures, commercial building envelopes and tunnels.
The Company offers a wide variety of active and passive waterproofing and greenroof technologies for use in protecting the building envelope of non-residential construction, including buildings, subways, and parkway systems. Our products include VOLTEX
®
, a waterproofing composite comprised of two polypropylene geotextiles filled with sodium bentonite; ULTRASEAL
®
, an advanced membrane using a unique active polymer core; and COREFLEX
®
, featuring heat-welded seams for protection of critical infrastructure. In addition to these membrane materials, we also provide a variety of sealants and other accessories required to create a functional waterproofing system. The end-users of these products are generally building sub-contractors who are responsible for installing the products.
The Company’s building materials product line net sales were $58.7 million, $60.0 million and $55.9 million for the years ended December 31, 2022, 2021 and 2020, respectively.
Specialty Minerals Segment
PCC Products and Markets
The Company's PCC product line net sales were $482.1 million, $426.8 million and $377.7 million for the years ended December 31, 2022, 2021 and 2020, respectively. The Company's sales of PCC have been, and are expected to continue to be, made primarily to the printing and writing papers segment of the paper industry and also into the packaging industry. The Company also produces PCC for sale to companies in the polymer, food and pharmaceutical industries.
PCC Products
In the paper industry, the Company's PCC is used:
| ● |
as a filler in the production of coated and uncoated wood-free printing and writing papers, such as office papers;
|
| ● |
as a filler in the production of coated and uncoated groundwood (wood-containing) paper such as magazine and catalog papers;
|
●
as a filler in the production of packaging grade papers, such as, folding boxboard or linerboard; and
| ● |
as a coating pigment for both paper and packaging grades.
|
The Company's Paper PCC product line net sales were $381.7 million, $349.7 million and $308.4 million for the years ended December 31, 2022, 2021 and 2020, respectively.
Approximately 18% of the Company's sales consist of PCC sold to papermakers from "satellite" PCC plants. A satellite PCC plant is a PCC manufacturing facility located near a paper mill, thereby eliminating costs of transporting PCC from remote production sites to the paper mill. The Company believes the competitive advantages offered by improved economics and superior optical characteristics of paper produced with PCC manufactured by the Company's satellite PCC plants resulted in substantial growth in the number of the Company's satellite PCC plants since the first such plant was built in 1986. For information with respect to the locations of the Company's PCC plants as of December 31, 2022, see Item 2, "Properties," below.
The Company currently manufactures several customized PCC product forms using proprietary processes. Each product form is designed to provide optimum balance of paper properties including brightness, opacity, bulk, strength and improved printability. The Company's research and development and technical service staff focuses on expanding sales from its existing and potential new satellite PCC plants, as well as, developing new technologies for new applications. These technologies include, among others, acid-tolerant ("AT
®
")
PCC, which allows PCC to be introduced to the wood-containing segment of the printing and writing paper market, OPACARB
®
PCC, a family of products for paper coating, our FulFill
®
family of products, a system of high-filler technologies that offers papermakers a variety of efficient, flexible solutions which decrease dependency on natural fibers, and NewYield
®
and ENVIROFIL
®
, innovative technologies that convert a paper and pulp mill waste stream into functional pigments for filling paper.
The Company owns, staffs, operates and maintains all of its satellite PCC facilities, and owns or licenses the related technology. Generally, the Company and its paper mill customers enter into long-term evergreen agreements, initially ten years in length, pursuant to which the Company supplies substantially all of the customer's precipitated calcium carbonate filler requirements. The Company is generally permitted to sell to third-parties PCC produced at a satellite plant in excess of the host paper mill's requirement.
The Company also sells a range of PCC products to paper manufacturers from production sites not associated with paper mills. These merchant facilities are located at Adams, Massachusetts and Lifford, United Kingdom.
PCC Markets
Uncoated Wood-Free Printing and Writing Papers
–
North America
. Beginning in the mid-1980's, as a result of a concentrated research and development effort, the Company's satellite PCC plants facilitated the conversion of a substantial percentage of North American uncoated wood-free printing and writing paper producers to lower-cost alkaline papermaking technology. The Company estimates that during 2022, more than 90% of North American uncoated wood-free paper was produced employing alkaline technology. Presently, the Company owns and operates 12 commercial satellite PCC plants located at paper mills that produce uncoated wood-free printing and writing papers in North America.
Uncoated Wood-Free Printing and Writing Papers
–
Outside North America.
The Company estimates the amount of uncoated wood-free printing and writing papers produced outside of North America at facilities that can be served by satellite and merchant PCC plants is more than three times as large (measured in tons of paper produced) as the North American uncoated wood-free paper market currently served by the Company. The Company believes that the superior brightness, opacity and bulking characteristics offered by its PCC products allow it to compete with suppliers of ground limestone and other filler products outside of North America. Presently, the Company owns and operates 37 commercial satellite PCC plants located at paper mills outside of North America. In addition, there are 3 plants currently under construction that will begin production in 2023.
Coated Paper
. The Company continues to pursue satellite PCC opportunities in coated paper markets where our products provide unique performance and/or cost reduction benefits to papermakers and printers. Our OPACARB
®
PCC product line is designed to create value to the papermaker and can be used alone or in combination with other coating pigments. PCC coating products are produced at 6 of the Company's PCC plants worldwide.
Paper Packaging
. The Company estimates that paper packaging markets are approximately three times the size of the printing and writing paper markets. Growth in the paper packaging segment is driven by growth trends in consumption, e-commerce and demand for sustainable packaging solutions. The Company offers mineral solutions for filler and coating applications in both the containerboard and cartonboard packaging segments. We currently have 1 GCC satellite plant under construction that will begin production in 2023.
Specialty PCC Products and Markets
The Company also produces and sells a full range of dry PCC products on a merchant basis for non-paper applications. The Company's Specialty PCC product line net sales were $100.4 million, $77.1 million and $69.3 million for the years ended December 31, 2022, 2021 and 2020, respectively. The Company sells surface-treated and untreated grades of PCC to the polymer industry for use in automotive and construction applications, and to the adhesives and printing inks industries. The Company's PCC is also used by the food and pharmaceutical industries as a source of calcium in tablets and food applications, as a buffering agent in tablets, and as a mild abrasive in toothpaste. The Company produces PCC for specialty applications from production sites at Adams, Massachusetts, Ste. Genevieve, Missouri, and Lifford, United Kingdom.
Processed Minerals
–
Products and Markets
The Company mines and processes natural mineral products, primarily limestone and talc. The Company also manufactures lime, a limestone-based product. The Company's net sales of processed mineral products were $166.3 million, $152.1 million and $133.2 million for the years ended December 31, 2022, 2021 and 2020, respectively. Net sales of ground calcium carbonate ("GCC") products, which are principally lime and limestone, were $109.1 million, $98.1 million and $89.3 million for the years ended December 31, 2022, 2021 and 2020, respectively. Net sales of talc products were $57.2 million, $54.0 million and $43.9 million for the years ended December 31, 2022, 2021 and 2020, respectively.
The Company mines and processes GCC products at its reserves in the eastern and western parts of the United States. GCC is used and sold in the construction, automotive and consumer markets.
Lime produced at the Company's Adams, Massachusetts, and Lifford, United Kingdom, facilities is used primarily as a raw material for the manufacture of PCC at these sites and is sold commercially to various chemical and other industries.
The Company mines, beneficiates and processes talc through its Barretts Minerals Inc. subsidiary, located near Dillon, Montana. Talc is sold worldwide in finely ground form for ceramic applications and in North America for paint and coatings and polymer applications. Because of the exceptional chemical purity of the Barretts ore, a significant portion of worldwide automotive catalytic converter ceramic substrates contain the Company's Barretts talc.
Our high-quality limestone, dolomitic limestone, and talc products are defined primarily by the chemistry and color characteristics of the ore bodies. Ore samples are analyzed by x-ray fluorescence (XRF) and other techniques to determine purity and more generally by Hunter brightness measurement to determine dry brightness and the Hunter yellowness (b) value. We serve multiple markets from each of our operations, each of which has different requirements relating to a combination of chemical and physical properties.
Refractories Segment
Refractory
–
Products and Markets
The Company offers a broad range of monolithic and pre-cast refractory products and related systems and services. The Company's Refractory segment net sales were $349.4 million, $303.4 million and $258.1 million for the years ended December 31, 2022, 2021 and 2020, respectively.
Refractory product sales are often supported by Company-supplied proprietary application equipment, laser measurement systems and on-site technical service support. The Company's proprietary application equipment is used to apply refractory materials to the walls of steel-making furnaces and other high temperature vessels to maintain and extend their useful life. Net sales of refractory products, including those for non-ferrous applications, were $273.4 million, $237.1 million and $212.3 million for the years ended December 31, 2022, 2021 and 2020, respectively. The Company's proprietary application systems, such as its MINSCAN
®
, allow for remote-controlled application of the Company's refractory products in steel-making furnaces, as well as in steel ladles. Since the steel-making industry is characterized by intense price competition, which results in a continuing emphasis on increased productivity, these application systems and the technologically advanced refractory materials developed in the Company's research laboratories have been well accepted by the Company's customers. These products allow steel makers to improve their performance through, among other things, the application of monolithic refractories to furnace linings while the furnace is at operating temperature, thereby eliminating the need for furnace cool-down periods and steel-production interruption. The result is a lower overall cost for steel produced by steel makers.
The Company's technical service staff and application equipment assist customers to achieve desired productivity objectives. The Company's technicians are also able to conduct laser measurement of refractory wear, sometimes in conjunction with robotic application tools, to improve refractory performance at many customer locations. The Company believes that these services, together with its refractory product offerings, provide it with a strategic marketing advantage.
Over the past several years, the Refractories segment has continued to develop, reformulate, and optimize its products and application technology to maintain its competitive advantage in the marketplace. Some of the products the Company has developed and optimized in the past include:
| ● |
HOTCRETE
®
: High durability shotcrete products for applications at high temperatures in ferrous applications, such as, steel ladles, electric arc furnaces (EAF) and basic oxygen furnaces (BOF).
|
| ● |
FASTFIRE
®
: High durability castable and shotcrete products in the non-ferrous and ferrous industries with the added benefit of rapid dry-out capabilities.
|
| ● |
OPTIFORM
®
: A system of products and equipment for the rapid continuous casting of refractories for applications, such as, steel ladle safety linings.
|
| ● |
ENDURATEQ
®
: A high durability refractory shape for glass contact applications, such as, plungers and orifice rings.
|
| ● |
DECTEQ™: A system for the automatic control of electrical power feeding electrodes used in electric arc steel making furnaces.
|
| ● |
LACAM
®
Torpedo: A laser scanning system that measures the refractory lining thickness inside a Hot Iron (Torpedo) Ladle. The torpedo ladles transport liquid iron from a blast furnace to the steel plant.
|
| ● |
LACAM
®
LI Explorer: A laser scanning system that measures the refractory lining thickness from the interior of a Hot Steel Ladle. By entering the interior, the explorer provides the ability to see all areas of the ladle and identify the smallest flaws in the refractory lining.
|
| ● |
LACAM
®
: A new, fourth generation Lacam
®
laser measurement device for use in the worldwide steel industry that is 17 times faster than the previous version. This new technology provides the fastest and most accurate laser scanning for hot surfaces available today.
|
The principal market for the Company's refractory products is the steel industry. Management believes that certain trends in the steel industry will provide growth opportunities for the Company. These trends include growth and quality improvements regarding the development of improved manufacturing processes, such as, thin-slab casting, the trend in North America to shift production from integrated mills to electric arc furnaces (mini-mills) and the ever-increasing need for improved productivity and longer lasting refractories.
The Company sells its refractory products in the following markets:
Steel Furnace.
The Company sells gunnable monolithic refractory products and application systems to users of basic oxygen furnaces and electric arc furnaces for application on furnace walls to prolong the life of furnace linings.
Other Iron and Steel.
The Company sells monolithic refractory materials and pre-cast refractory shapes for iron and steel ladles, vacuum degassers, continuous casting tundishes, blast furnaces and reheating furnaces. The Company offers a full line of materials to satisfy most continuous casting refractory applications. This full line consists of gunnable materials, refractory shapes and permanent linings.
Industrial Refractory Systems
. The Company sells refractory shapes and linings to the glass, cement, aluminum, petrochemicals, power generation and other non-steel industries. The Company also produces a specialized line of carbon composites and pyrolitic graphite sold under the PYROID
®
trademark, primarily to the aerospace and electronics industries.
Metallurgical Products and Markets
The Company produces a number of other technologically advanced products for the steel industry, including calcium metal, metallurgical wire products and a number of metal treatment specialty products. Net sales of metallurgical products were $76.0 million, $66.3 million and $45.8 million for the years ended December 31, 2022, 2021 and 2020, respectively. The Company manufactures calcium metal at its Canaan, Connecticut facility and purchases calcium to meet global production requirements. Calcium metal is used in the manufacture of the Company's PFERROCAL
®
solid-core calcium wire and is also sold for use in the manufacture of batteries and magnets. We also manufacture cored wires at our Canaan, Connecticut and Hengelo, Netherlands, manufacturing sites. The Company sells metallurgical wire products and associated wire-injection equipment, including SURECAL
®,
for use in the production of high-quality steel. These metallurgical wire products are injected into molten steel to improve castability and reduce imperfections.
Marketing and Sales
The Company relies principally on its worldwide direct sales force to market its products. The direct sales force is augmented by technical service teams that are familiar with the industries to which the Company markets its products, and by several regional distributors. The Company's sales force works closely with the Company's technical service staff to solve technical and other issues faced by the Company's customers.
In the Performance Materials segment, the Company relies on industry-specialized technically oriented salespersons. In Metalcasting, these sales teams provide expertise to educate our customers on the bentonite blend properties and to aid them in producing castings efficiently. Certain other products are distributed through networks of distributors and representatives, who warehouse specific products at strategic locations. In addition, the sales and distribution of environmental products and building materials are primarily performed through the Company’s own personnel and facilities. Our staff includes sales professionals and technical support engineers who analyze the suitability of our products in relation to the customer’s specific application and the conditions that products will endure or the environment in which they will operate.
In the Specialty Minerals segment, the Company's sales team and technical services staff assist paper producers in ongoing evaluations of the use of PCC for paper coating and filling applications as well as PCC, GCC and talc use in the automotive, construction and household goods markets.
In the Refractories segment, the Company's technical service personnel advise on the use of refractory materials, and, in many cases pursuant to service agreements, apply the refractory materials to the customers' furnaces and other vessels.
Continued use of skilled technical service teams is an important component of the Company's business strategy. The Company works closely with its customers to ensure that their requirements are satisfied, and it often trains and supports customer personnel in the use of the Company's products. The Company oversees domestic marketing and sales activities principally from Bethlehem, Pennsylvania and Hoffman Estates, Illinois, and from regional sales offices located elsewhere in the United States. The Company's international marketing and sales efforts are directed from regional centers located in India, the United Kingdom, Brazil, and China. The Company believes that its worldwide network of sales personnel and manufacturing sites facilitates continued international expansion.
Raw Materials
The Company depends in part on having an adequate supply of raw materials for its manufacturing operations, particularly lime and carbon dioxide for the PCC product line, and magnesia and alumina for its Refractory operations. We also depend on having an adequate supply of bentonite and leonardite for our Performance Materials segment and limestone and talc for our Processed Minerals product line. Supplies of bentonite, leonardite, limestone and talc are provided through the Company’s own mining operations and we depend on having adequate access to ore reserves of appropriate quality at such mining operations.
The Company uses lime in the production of PCC and is a significant purchaser of lime worldwide. Generally, the lime utilized in our business is readily available from numerous sources and we purchase lime under long-term supply contracts from unaffiliated suppliers located in close geographic proximity to the Company's PCC plants. We also produce lime at our Adams, Massachusetts facility and our Lifford, UK facility, although most of the lime produced at our Adams facility and all of the lime produced at our Lifford facility is consumed in the production of Specialty PCC at the plant. We currently supply some quantities of lime to third parties that are in close proximity to our Adams plant and could supply small quantities of lime to certain of our PCC satellite facilities that are in close geographic proximity to the Adams plant. Carbon dioxide is readily available in exhaust gas from the host paper mills, or other operations at our merchant facilities.
The principal raw materials used in the Company's monolithic refractory products are refractory-grade magnesia and various forms of alumina silicates. Approximately 50% of the Company’s magnesia requirements were purchased from sources in China over the past five years. The price and availability of bulk raw materials from China are subject to fluctuations that could affect the Company's sales to its customers. In addition, the volatility of transportation costs has also affected the delivered cost of raw materials imported from China to North America and Europe. The Company has developed alternate sources of magnesia over the past few years that have reduced our reliance on China-sourced magnesia. The amount sourced from China and other locations can vary from year to year depending upon price and availability from each source. The alumina we utilize in our business is readily available from numerous sources. The Company also purchases calcium metal, calcium silicide, graphite, calcium carbide and various alloys for use in the production of metallurgical wire products and uses lime and aluminum in the production of calcium metal.
In addition to bentonite and leonardite provided through our mining operations, our Performance Materials segment’s principal raw materials are coal, soda ash, chromite, and woven and unwoven polyester material, all of which are readily available from numerous sources.
Mineral Reserves and Mining Process
The Company relies on access to bentonite reserves to support its Performance Materials segment. The Company has reserves of sodium and calcium bentonite at various locations in the U.S., including Wyoming, South Dakota, Montana and Alabama, as well as in Australia, China, Slovakia, and Turkey. Through the Company’s affiliations and joint ventures, the Company also has access to bentonite deposits in India, and Mexico. The Company owns or controls the properties on which the bentonite reserves are located through long-term leases, royalty agreements (including easement and right of way agreements) and patented and unpatented mining claims. No single or group of mining claims or leases is significant or material to the financial condition or operations of our Company or our segments.
In general, our bentonite reserves are immediately adjacent to, or within sixty miles of, one of the related processing plants. All of the properties on which our reserves are located are either physically accessible for the purposes of mining and hauling or the cost of obtaining physical access would not be material. Access to processing facilities from the mining areas is generally by private road, public highways, or railroads. For most of our leased properties and mining claims, there are multiple means of access.
The Processed Minerals product line of our Specialty Minerals segment is supported by the Company's limestone reserves located in the western and eastern parts of the United States, and talc reserves located in Montana. The Company generally owns and surface mines these reserves and processes its products at nearby processing plants.
The Company has ongoing exploration and development activities for all of its mineral interests with the intent to increase its proven and probable reserves.
See Item 2, “Properties,” for more information with respect to these facilities and mines.
The Company relies on shipping bulk cargos of bentonite within and from the United States, Turkey and China to customers, as well as our own subsidiaries, and we are sensitive to our ability to recover these shipping costs. In the last few years, bulk cargo shipping rates have been very volatile, and, to a lesser extent, the availability of bulk cargo containers has been sporadic.
Competition
The Company is continually engaged in efforts to develop new products and technologies and refine existing products and technologies in order to remain competitive and to position itself as a market leader.
For the Performance Materials segment, the Company competes on the basis of product quality, service, technical support, price, product availability and logistics. There are numerous major producers of competing products and various regional suppliers in the areas the Company serves. The Company is the world leader in bentonite, including number one positions in metalcasting and pet litter. With respect to the environmental products product line, the Company competes with geosynthetic clay liner manufacturers worldwide, several suppliers of alternative lining technologies, and providers of soil and environmental remediation solutions and products. In addition, the filtration and well-testing products within the Environmental Products product line compete with other oil and gas services companies. The building materials product line competes in a highly fragmented market comprised of a wide variety of alternative technologies. A number of integrated bentonite companies compete with our drilling products.
With respect to its PCC products, the Company competes for sales to the paper industry with other minerals, such as GCC and kaolin, based in large part upon technological know-how, patents and processes that allow the Company to deliver PCC that it believes imparts gloss, brightness, opacity and other properties to paper on an economical basis. The Company is the leading manufacturer and supplier of PCC to the paper industry.
The Company competes in sales of its limestone and talc based primarily upon quality, price, and geographic location.
With respect to the Company's refractory products, competitive conditions vary by geographic region. Competition is based upon the performance characteristics of the product (including strength, consistency and ease of application), price, and the availability of technical support.
Seasonality
Some of our products in the Performance Materials segment within the environmental and building materials product lines are impacted by weather and soil conditions. Many of the products cannot be applied in wet or winter weather conditions and, as such, sales and profits tend to be greater during the period from April through October. Our Processed Minerals product line of our Specialty Minerals segment is subject to similar seasonal patterns. In addition, the oil and gas production facilities are subject to natural disasters, such as hurricanes, which could lead to lower sales in the June to November months. As a result, we consider the business of the Performance Materials segment to be seasonal.
Research and Development
Many of the Company's product lines are technologically advanced. The Company’s internal research team has dedicated years of experience into analyzing properties of minerals and synthetic materials while developing processes and applications to enhance their performance. Our expertise in inorganic chemistry, crystallography and structural analysis, fine particle technology and other aspects of materials science apply to and support all of our product lines. The Company's business strategy for growth in sales and profitability depends, to a large extent, on the continued success of its research and development activities.
The Company’s Performance Materials segment also offers a strong portfolio of custom blended compounds, formulations and technology, which have been primarily developed internally by the Company’s research and development efforts. The ADDITROL
®
formulation, a custom blend, meets the need of both ferrous and non-ferrous applications. The Volclay
®
application is used in green sand molding applications ranging from the production of iron and steel castings to the production of non-ferrous castings. The Hevi-Sand
®
specialty chromite blend prevents metal penetration and can be used with most foundry binders in molds and cores. In addition, the Company’s RESISTEX
TM
and CONTINUUM
®
formulation enables withstanding aggressive leachates. The ORGANOCLAY
®
technology offers highly effective solutions in effective in removing oils, greases and other high molecular weight, low solubility organic compounds from aqueous streams. The Company's FLOURO-SORB
®
absorbent is a proprietary, NSF-certified product designed to globally support remediation efforts surrounding per- and polyflouroalkyl substances (PFAS) and Perflourooctane sulfanate (PFOS). The Company will also continue to seek out promising compounds and innovative technologies, developed mainly by our internal research team, to incorporate into our product lines.
In the Specialty Minerals segment, the significant achievements of the Company's research and development efforts include: the satellite PCC plant concept; PCC crystal morphologies for paper filling and coating; FulFill
®
high filler technology systems; NewYield
®
Waste Stream Process Technology; ENVIROFIL
®
Waste Stream Process Technology; Thixocarb
®
PCC, Vicality
®
USP PCC, EMforce
®
, and Optibloc
®
for the Processed Minerals and Specialty PCC product lines.
The FulFill
®
brand High Filler Technology is a portfolio of high-filler technologies that offers papermakers a variety of efficient, flexible solutions that decreases dependency on natural fiber and reduces costs. The FulFill® E and FulFill® E PLUS series allows papermakers to increase filler loading levels of precipitated calcium carbonate (PCC), which replaces higher cost pulp, and increases PCC usage. Depending on paper grades, this PCC volume increase may range from 10 to 25 percent. NewYield
®
Waste Stream Process Technology cost-effectively converts a problematic pulp mill waste stream into a qualified functional pigment for paper filling, while eliminating the cost of environmental disposal and remediation of certain waste streams to papermakers. The product and technology have been validated on a commercial scale in a pulping operation and papermaking system in China, with several current projects underway. ENVIROFIL
®
Waste Stream Process Technology allows cost-effective recovery of mineral pigments from problematic de-inking waste by converting these raw materials into a functional pigment for filling paper while eliminating the cost of environmental disposal and remediation.
In the Refractories segment, the Company’s achievements include the development of FASTFIRE
®
and OPTIFORM
®
shotcrete refractory products; LACAM
®
laser-based refractory measurement systems; and the MINSCAN
®
and HOTCRETE
®
application systems. The Company will continue to reformulate its refractory materials to be more competitive.
For the years ended December 31, 2022, 2021 and 2020, the Company spent approximately $20.4 million, $19.5 million and $19.9 million, respectively, on research and development. The Company's research and development spending for 2022, 2021 and 2020 was approximately 1.0%, 1.0% and 1.2% of net sales, respectively.
The Company maintains its primary research facilities in Bethlehem and Easton, Pennsylvania; Houston, Texas; and Hoffman Estates, Illinois. It also has research and development facilities in China, England, Germany, Ireland, Japan and Turkey. Approximately 217 employees worldwide are engaged in research and development. In addition, the Company has access to some of the world's most advanced papermaking and paper coating pilot facilities.
Patents and Trademarks
The Company owns or has the right to use approximately 328 patents and approximately 1,881 trademarks related to its business. Our patents expire between 2023 and 2040. Our trademarks continue indefinitely. The Company believes that its rights under its existing patents, patent applications and trademarks are of value to its operations, but no one patent, application or trademark is material to the conduct of the Company's business as a whole.
Insurance
The Company maintains liability and property insurance and insurance for business interruption in the event of damage to its production facilities and certain other insurance covering risks associated with its business. The Company believes such insurance is adequate for the operation of its business. There is no assurance that in the future the Company will be able to maintain the coverage currently in place or that the premiums will not increase substantially.
Human Capital Resources
Our people are the most important part of MTI. They are the cornerstone of our operational excellence and safety-first culture, key to our ability to execute on our growth strategies, and vital to our success. Our core values — people, excellence, honesty, customer focus and accountability — guide our actions.
Workforce Demographics
As of December 31, 2022, the Company employed 4,070 persons globally, located in over 30 countries. Of these, 1,938 (48%) were located in North America, 993 (24%) were located in Asia, 953 (23%) were located in Europe, and 186 (5%) were located in Latin America.
Diversity, Equity and Inclusion
As a global company, we are committed to an organizational culture that unconditionally accepts all colleagues. We believe in the power of an environment where everyone feels involved, respected, valued and connected, where everyone is free to be their authentic selves and share ideas. We believe that our culture of diversity, equity and inclusion is a competitive advantage that fuels innovation and enhances our ability to attract and retain talent. We continually strive to improve the attraction, retention, and advancement of diverse employees reflective of the communities in which we live and work. Furthermore, we place a concerted effort on the continued growth of diverse employees through various global development and training programs, mentoring programs and individual development plans. We view diversity as key to leadership development. When selecting participants for internal development programs, we ensure that groups are balanced across a number of factors, including gender, race, ethnicity, tenure, function, geography and experience. As part of our ongoing efforts, diversity and inclusion metrics, which highlight progress and help drive accountability, are shared with our senior leaders on a quarterly basis. We also conduct annual pay equity analyses, with regard to gender globally, and race and ethnicity in the United States, to help ensure our base pay structures are fair and to identify and address potential issues or disparities. We make adjustments to base pay, where appropriate.
Compensation and Benefits
We strive to hire, develop and retain the top talent in all areas of the company.
MTI’s total rewards, values and philosophy is to provide competitive total rewards that include pay and benefits consistent with the varied practices in different regions of the world. We provide an array of programs to recognize individual and team achievements, and to enable us to appropriately reward performance consistent with employee contributions. MTI has a strong commitment to pay for performance at all levels. This commitment is embodied through merit increases, incentive compensation and our variable pay plans.
We offer competitive compensation to attract and retain the best people.
Our benefits are designed to help employees and their families stay healthy, meet their financial goals, protect their income and help them balance their work and personal lives. These benefits include health and wellness, paid time off, employee assistance, competitive pay, tuition reimbursement, career growth opportunities, and a culture of recognition.
Focus on Safety
The health and safety of our employees is our number one core value. We are committed to the health and safety of our employees, contractors, customers, and members of the communities in which we operate. Our "safety first" culture has been built through dedication, continuous improvement and active engagement. We continue to enhance our safety culture and our top priority is for all employees and contractors to return home in the same condition they arrived to work. While we believe zero-injuries across all our operations is attainable, we have set goals of 1.00 for Total Recordable Incident Rate (TRIR, which is the number of recordable injuries per 100 employees) and 0.10 for Lost Workday Injury Rate (LWIR, which is the number of lost workday injuries per 100 employees), and we continue to make strides to drive incidents below these levels. In 2022, our TRIR was 1.25 and our LWIR was 0.23. This safety-first mindset helps us attract and retain top talent from around the world and drives continuous improvement in our manufacturing operations.
Operational Excellence Culture
Our Operational Excellence (OE) journey, rooted in the active engagement of our employees, began more than a decade ago when we developed a comprehensive and highly structured business system of lean principles closely integrated with safe and reliable work practices. We’ve significantly advanced OE across all aspects of our company, fostering a culture of continuous improvement where each employee recognizes the importance of applying these people-focused principles and tools to solve challenges, constantly refine our processes, identify and remove risk and waste, and deliver value to our customers. Every day, MTI employees show their engagement and apply their skills in ways that deliver measurable outcomes and create both business and social value.
Talent Management
Our people are essential to the successful delivery of the MTI strategy and to sustaining superior business performance. The work environment at MTI continually evolves to maximize the employee experience and drive high performance. We accelerate the development of our employees, strengthen our leadership capabilities, and enhance employee performance through engagement.
Our culture of training and development motivates employees at all levels of the organization to work safely and efficiently. We employ several methods to engage, train and develop employees, yielding higher levels of performance year after year. Investment in skills and acceleration of employees’ professional and personal development are essential components of our people strategy. We leverage both formal and informal programs to identify, develop and retain talent across the organization. We offer formal training options, individualized development programs, tools for 360-degree feedback, mentoring, stretch assignments and growth opportunities. Through the MTI Internship Program, we identify new talent and prepare them for success within our organization upon graduation. Additionally, the Chairman and Chief Executive Officer and the MTI Leadership Council meet on a semiannual basis to review strategic succession plans. The above mentioned programs and succession planning sessions demonstrate the Company’s ongoing commitment towards accelerating development of our future leaders.
Environmental, Health and Safety Matters and Government Regulation
The Company’s operations are subject to federal, state, local and foreign laws and regulations relating to the environment and health and safety. In particular, we are subject to certain requirements under the
Clean Air Act. In addition, certain of the Company’s operations involve and have involved the use and release of substances that have been and are classified as toxic or hazardous within the meaning of these laws and regulations. Environmental operating permits are, or may be, required for certain of the Company’s operations and such permits are subject to modification, renewal and revocation. We are also subject to land reclamation requirements relating to our mining operations. In addition to environmental and health and safety laws and regulations, we are subject to a wide variety of other federal, state, local and foreign laws and regulations in the countries where we conduct business. The Company regularly monitors and reviews its operations, procedures and policies for compliance with these laws and regulations. Compliance with these laws and regulations often requires the dedication of time and effort of employees, as well as financial resources. The Company believes its operations are in substantial compliance with these laws and regulations and that there are no violations that would have a material effect on the Company. Despite these compliance efforts, some risk of environmental and other damage is inherent in the Company’s operations, as it is with other companies engaged in similar businesses, and there can be no assurance that material violations will not occur in the future. In fiscal 2022, compliance with the regulations applicable to us did not have a material effect on our capital expenditures, earnings, or competitive position, and the cost of compliance with these laws and regulations is not expected to have a material adverse effect on the Company in the future.
Sustainability is core to who we are and the foundation of how we operate our company. At MTI, we are focused on providing the safest workplace for our employees, creating innovative technologies tailored to our customers’ evolving demands, reducing our environmental impact, preserving natural resources and making positive contributions to our local communities — all of which are ingrained in our values. For the past 14 years, MTI has published an annual Corporate Responsibility and Sustainability Report that describes our efforts in continuous improvement regarding our safety culture, environmental performance, social impact, new product development, and community engagement. Over the past several years, we've taken meaningful steps to advance our broad range of sustainability initiatives, including establishing 2025 environmental reduction targets in six focus areas:
Scope 1 and Scope 2 CO
2
emissions, airborne pollutants, water used, water discharged, and process waste landfilled
. In 2022, we announced that we are targeting even lower absolute emissions and water usage/discharge goals, and announced initial 2025 targets for the intensity metrics per ton of production for each of our focus areas.
Laws and regulations are subject to change. See Item 1A, Risk Factors, for information regarding the possible effects that compliance with new laws and regulations, including those relating to climate change, may have on our businesses and operating results.
Under the terms of certain agreements entered into in connection with the Company's initial public offering in 1992, Pfizer Inc. ("Pfizer") agreed to indemnify the Company against certain liabilities being retained by Pfizer and its subsidiaries including, but not limited to, pending lawsuits and claims, and any lawsuits or claims brought at any time in the future alleging damages or injury from the use, handling of or exposure to any product sold by Pfizer's specialty minerals business prior to the closing of the initial public offering.
Available Information
The Company maintains an internet website located at http://www.mineralstech.com. Its reports on Forms 10-K, 10-Q and 8-K, and amendments to those reports, as well as its Proxy Statement and filings under Section 16 of the Securities Exchange Act of 1934 are available free of charge through the Investor Relations page of its website, as soon as reasonably practicable after they are filed with the Securities and Exchange Commission ("SEC"). Investors may access these reports through the Company's website by navigating to "Investor Relations" and then to "SEC Filings."
Item 1A. Risk Factors
Our business faces significant risks. Set forth below are all risks that we believe are material at this time. Our business, financial condition and results of operations could be materially adversely affected by any of these risks. These risks should be read in conjunction with the other information in this Annual Report on Form 10-K.
Industry and Market Risks
Worldwide general economic, business, and industry conditions may have an adverse effect on the Company’s results.
The Company’s business and operating results are affected by worldwide and regional economic, business, and industry conditions. In recent years, we have experienced, among other things, declining consumer and business confidence, volatile raw material prices, instability in credit markets, high unemployment, fluctuating interest and exchange rates, and other challenges in the countries in which we operate. Uncertainty or a deterioration in the economic conditions affecting the businesses to which, or geographic areas in which, we sell products could reduce demand for our products and inflationary pressures may increase our costs. The Company’s customers and potential customers may experience deterioration of their businesses, cash flow shortages, and difficulty obtaining financing. As discussed below, the industries we serve have in the past been adversely affected by the uncertain global economic climate due to the cyclical nature of their businesses. As a result, existing or potential customers may reduce or delay their growth and investments and their plans to purchase products, pursue inventory reduction measures, and may not be able to fulfill their obligations in a timely fashion. Further, suppliers could experience similar conditions, which could affect their ability to fulfill their obligations to the Company. We may also experience pricing pressure on products and services, or be unsuccessful in passing along to our customers an increase in our raw materials costs or energy prices, which could decrease our revenues and have an adverse effect on our financial condition and cash flows. Adversity within capital markets may also impact the Company’s results of operations by negatively affecting the amount of expense the Company records for its pension and other postretirement benefit plans. Actuarial valuations used to calculate income or expense for the plans reflect assumptions about financial market and other economic conditions – the most significant of which are the discount rate and the expected long-term rate of return on plan assets. Such actuarial valuations may change based on changes in key economic indicators. Global economic markets remain uncertain, and there can be no assurance that market conditions will improve in the near future. Future weakness in the global economy could materially and adversely affect our business and operating results.
Our customers’ businesses are cyclical or have changing regional demands. Our operations are subject to these trends, and we may not be able to mitigate these risks.
A significant portion of our Performance Materials segment’s sales are derived from the metalcasting market.
The metalcasting market is dependent upon the demand for castings for automobile components, farm and construction equipment, oil and gas production equipment, power generation turbine castings, and rail car components. Many of these types of equipment are sensitive to fluctuations in demand during periods of recession or difficult economic conditions, which has affected and may continue to affect the demand for our Performance Materials segment’s products and services.
In the paper industry, which is served by our Paper PCC product line, production levels for uncoated freesheet within North America and Europe, our two largest markets, are projected to continue to decrease. The reduced demand for premium writing paper products has resulted in closures and conversions of mills in both North America and Europe. We expect paper consumption to remain similar to prior year levels in both regions.
Our Refractories segment primarily serves the steel industry. In recent years, global steel production has been volatile. We expect steel consumption to be similar to 2022 levels.
Our Environmental Products and Building Materials products sales are predominantly derived from the commercial construction and infrastructure markets. In addition, our Processed Minerals and Specialty PCC product lines are affected by the domestic building and construction markets, as well as the automotive market.
Demand for our products is subject to trends in these markets.
During periods of economic slowdown, our customers often reduce their capital expenditures and defer or cancel pending projects. Such developments occur even amongst customers that are not experiencing financial difficulties.
In addition, these trends could cause our customers to face liquidity issues or bankruptcy, which could deteriorate the aging of our accounts receivable, increase our bad debt exposure and possibly trigger impairment of assets or realignment of our businesses. The Company has taken steps to reduce its exposure to variations in its customers' businesses, including by diversifying its portfolio of products and services; through geographic expansion, and by structuring most of its long-term satellite PCC contracts to provide a degree of protection against declines in the quantity of product purchased, since the price per ton of PCC generally rises as the number of tons purchased declines. In addition, many of the Company's product lines lower its customers' costs of production or increase their productivity, which should encourage them to use its products. However, there can be no assurance that these efforts will mitigate the risks of our dependence on these industries. Continued weakness in the industries we serve has had, and may in the future have, an adverse effect on sales of our products and our results of operations. A continued or renewed economic downturn in one or more of the industries or geographic regions that the Company serves, or in the worldwide economy, could cause actual results of operations to differ materially from historical and expected results.
The Company operates in very competitive industries, which could adversely affect our profitability.
The Company has many competitors. Some of our principal competitors have greater financial and other resources than we have. Accordingly, these competitors may be better able to withstand economic downturns and changes in conditions within the industries in which we operate and may have significantly greater operating and financial flexibility than we do.
We also face competition for some of our products from alternative products, and some of the competition we face comes from competitors in lower-cost production countries like China and India.
As a result of the competitive environment in the markets in which we operate, we currently face and will continue to face pressure on the sales prices of our products from competitors, which could reduce profit margins.
The Company’s sales could be adversely affected by consolidation in customer industries, principally paper, foundry and steel.
Several consolidations in the paper industry have taken place in recent years and such consolidation could continue in the future. These consolidations could result in partial or total closure of some paper mills where the Company operates PCC satellites. Such closures would reduce the Company's sales of PCC, except to the extent that they resulted in shifting paper production and associated purchases of PCC to another location served by the Company. Similarly, consolidations have occurred in the foundry and steel industries. Such consolidations in the major industries we serve concentrate purchasing power in the hands of a smaller number of manufacturers, enabling them to increase pressure on suppliers, such as the Company. This increased pressure could have an adverse effect on the Company's results of operations in the future.
The Company’s sales of PCC could be adversely affected by our failure to renew or extend long term sales contracts for our satellite operations.
The Company's sales of PCC to paper customers are typically pursuant to long-term evergreen agreements, initially ten years in length, with paper mills where the Company operates satellite PCC plants. Sales pursuant to these contracts represent a significant portion of our worldwide Paper PCC sales, which were $381.7 million in 2022, or approximately 18% of the Company’s net sales. The terms of many of these agreements have been extended or renewed in the past, often in connection with an expansion of the satellite plant. However, failure of a number of the Company's customers to renew or extend existing agreements on terms as favorable to the Company as those currently in effect, or at all, could have a substantial adverse effect on the Company's results of operations, and could also result in impairment of the assets associated with the PCC plant.
Financial Risks
Servicing the Company’s debt will require a significant amount of cash. This could reduce the Company’s flexibility to respond to changing business and economic conditions or fund capital expenditures or working capital needs. Our ability to generate cash depends on many factors beyond our control.
At December 31, 2022, the Company had $1,070.1 million aggregate principal amount of total indebtedness (consisting primarily of $550.0 million aggregate principal amount of loans under our term facility, $400.0 million aggregate principal amount of notes and $115.0 million outstanding under our revolving credit facility) and an additional $175 million of borrowing capacity under the revolving credit facility (after giving effect to $10.5 million of outstanding letters of credit). Our outstanding indebtedness will require a significant amount of cash to make interest payments. Further, the interest rate on a significant portion of our borrowings under our senior secured credit facility is based on SOFR interest rates, which has resulted in and could continue to result in higher interest expense in the event of continued increases in interest rates. Our ability to pay interest on our debt and to satisfy our other debt obligations will depend in part upon our future financial and operating performance and upon our ability to renew or refinance borrowings. Prevailing economic conditions and financial, business, competitive, regulatory and other factors, many of which are beyond our control, will affect our ability to make these payments. We cannot guarantee that our business will generate sufficient cash flow from operations or that future borrowings will be available to us in an amount sufficient to enable us to fund our liquidity needs. If we are unable to generate sufficient cash flow to meet our debt service obligations, we will have to pursue one or more alternatives, such as reducing or delaying capital or other expenditures, refinancing debt, selling assets, or raising equity capital. Further, the requirement to make significant interest payments may reduce the Company’s flexibility to respond to changing business and economic conditions or fund capital expenditure or working capital needs and may increase the Company’s vulnerability to adverse economic conditions.
The agreements and instruments governing our debt contain various covenants that could significantly impact our ability to operate our business.
The agreement governing our senior secured credit facility and the indenture that governs our 5.0% Senior Notes due 2028 contain a number of significant covenants that, among other things, limit our ability to: incur or guarantee additional indebtedness, pay dividends or make other distributions or repurchase or redeem capital stock, prepay, redeem or repurchase certain debt, issue certain preferred stock or similar equity securities, make loans and investments, sell or otherwise dispose of assets, incur liens, enter into transactions with affiliates, enter into agreements restricting our subsidiaries’ ability to pay dividends and consolidate, merge or sell all or substantially all of our assets. In addition, we are required to comply with specific financial ratios, including a maximum net leverage ratio and a minimum interest coverage ratio, under which we are required to achieve specific financial results. Our ability to comply with these provisions may be affected by events beyond our control. A breach of any of these covenants would result in a default under the applicable agreements. In the event of any default under our senior secured credit facility, our lenders could elect to declare all amounts borrowed under the credit agreement, together with accrued interest thereon, to be due and payable. In such an event, we cannot assure you that we would have sufficient assets to pay debt then outstanding under the credit agreement, the indenture governing our notes, and any other agreements governing our debt. Any future refinancing of the senior secured credit facility is likely to contain similar restrictive covenants. We may also incur future debt obligations that might subject us to additional restrictive covenants that could affect our financial and operational flexibility. We cannot assure you that we will be granted waivers or amendments to these agreements if for any reason we are unable to comply with these agreements or that we will be able to refinance our debt on terms acceptable to us, or at all.
Technology, Development and Growth Risks
The Company’s results could be adversely affected if it is unable to effectively achieve and implement its growth initiatives.
Sales and income growth of the Company depends upon a number of uncertain events, including the outcome of the Company's strategies of increasing its penetration into geographic markets such as Brazil, India and China as well as other Asian and Eastern European countries; increasing its penetration into product markets such as the market for papercoating pigments and the market for groundwood paper pigments; increasing sales to existing PCC customers by increasing the amount of PCC used per ton of paper produced; developing, introducing and selling new products for the paper industry. Difficulties, delays or failure of any of these strategies could affect the future growth rate of the Company. Our strategy also anticipates growth through future acquisitions. However, our ability to identify and consummate any future acquisitions on terms that are favorable to us may be limited by the number of attractive acquisition targets, internal demands on our resources and our ability to obtain financing. Our success in integrating newly acquired businesses will depend upon our ability to retain key personnel, avoid diversion of management’s attention from operational matters, and integrate general and administrative services. In addition, future acquisitions could result in the incurrence of additional debt, costs and contingent liabilities. Integration of acquired operations may take longer, or be more costly or disruptive to our business, than originally anticipated, and it is also possible that expected synergies from future acquisitions may not materialize. We also may incur costs and divert management attention with regard to potential acquisitions that are never consummated.
Delays or failures in new product development could adversely affect the Company’s operations.
The Company’s future business success will depend in part upon its ability to maintain and enhance its technological capabilities, to respond to changing customer needs, and to successfully anticipate or respond to technological changes on a cost-effective and timely basis. The Company is engaged in a continuous effort to develop new products and processes in all of its product lines. Difficulties, delays or failures in the development, testing, production, marketing or sale of such new products could cause actual results of operations to differ materially from our expected results.
The Company’s ability to compete is dependent upon its ability to defend its intellectual property against inappropriate disclosure, theft and infringement.
The Company's ability to compete is based in part upon proprietary knowledge, both patented and unpatented. The Company's ability to achieve anticipated results depends in part on its ability to defend its intellectual property against inappropriate disclosure and theft as well as against infringement. In addition, development by the Company's competitors of new products or technologies that are more effective or less expensive than those the Company offers could have a material adverse effect on the Company's financial condition or results of operations.
The Company’s operations could be impacted by the increased risks of doing business abroad.
The Company does business in many areas internationally. Approximately 47% of our sales in 2022 were derived from outside the United States and we have significant production facilities which are located outside of the United States. We have in recent years expanded our operations in emerging markets, and we plan to continue to do so in the future, particularly in China, India, Brazil, the Middle East, and Eastern Europe. Some of our operations are located in areas that have experienced political or economic instability, including Indonesia, Malaysia, Nigeria, Egypt, Saudi Arabia, Turkey, Brazil, Thailand, China and South Africa. As the Company expands its operations overseas, it faces increased risks of doing business abroad, including inflation, fluctuation in interest rates, changes in applicable laws and regulatory requirements, export and import restrictions, tariffs, nationalization, expropriation, limits on repatriation of funds, civil unrest, terrorism, war, unstable governments and legal systems, and other factors. In late February 2022, Russian military forces launched significant military action against Ukraine, which has continued through the date of this report. We have ceased our sales to Russia. Our sales in Russia and Ukraine have not been significant historically. Nevertheless, the outbreak of war between Russia and Ukraine and the resulting sanctions by U.S. and European governments, together with any additional future sanctions by them, could have an impact that expands into other geographies where we do business, including supply chain, business partners, and customers in those markets. Any increased trade barriers or restrictions on global trade or retaliatory trade measures taken by Russia or other countries in response could affect our operating results. We are also subject to increased risks of natural disasters, public health crises, including the occurrence of a contagious disease or illness, such as COVID-19, and other catastrophic events in such countries.
Many of these risks are beyond our control and can lead to sudden, and potentially prolonged, changes in demand for our products, difficulty in enforcing agreements, and losses in the realizability of our assets.
Adverse developments in any of the areas in which we do business could cause actual results to differ materially from historical and expected results. In addition, a significant portion of our raw material purchases and sales outside the United States are denominated in foreign currencies, and liabilities for non-U.S. operating expenses and income taxes are denominated in local currencies. Accordingly, reported sales, net earnings, cash flows and fair values have been and, in the future, will be affected by changes in foreign currency exchange rates. Our overall success as a global business depends, in part, upon our ability to succeed in differing legal, regulatory, economic, social and political conditions. We cannot assure you that we will implement policies and strategies that will be effective in each location where we do business.
The Company’s operations are dependent on the availability of raw materials and access to ore reserves at its mining operations. Increases in costs of raw materials, energy, or shipping could adversely affect our financial results.
The Company depends in part on having an adequate supply of raw materials for its manufacturing operations, particularly lime and carbon dioxide for the PCC product line, and magnesia and alumina for its Refractory operations. Purchase prices and availability of these critical raw materials are subject to volatility. At any given time, we may be unable to obtain an adequate supply of these critical raw materials on a timely basis, on price and other terms, or at all. While most such raw materials are readily available, the Company has purchased approximately 50% of its magnesia requirements from sources in China over the past five years. The price and availability of magnesia have fluctuated in the past and they may fluctuate in the future. Price increases for certain other of our raw materials, including petrochemical products, as well as increases in energy prices, have also affected our business. Our production processes consume a significant amount of energy, primarily electricity, diesel fuel, natural gas and coal. We use diesel fuel to operate our mining and processing equipment and our freight costs are heavily dependent upon fuel prices and surcharges. Energy costs also affect the cost of raw materials. On a combined basis, these factors represent a large exposure to petrochemical and energy products which may be subject to significant price fluctuations. The contracts pursuant to which we construct and operate our satellite PCC plants generally adjust pricing to reflect the pass-through of increases in costs resulting from inflation, including energy. However, there is a time lag before such price adjustments can be implemented. The Company and its customers will typically negotiate reasonable price adjustments in order to recover these escalating costs, but there can be no assurance that we will be able to recover increasing costs through such negotiations.
The Company also depends on having adequate access to ore reserves of appropriate quality at its mining operations. There are numerous uncertainties inherent in estimating ore reserves including subjective judgments and determinations that are based on available geological, technical, contract and economic information. In addition, mining permits, leases and other rights are, or may be, required for certain of the Company’s mining operations. Such permits, leases and other rights are subject to modification, renewal and revocation. Our ability to maintain such mining permits, leases and other rights has been, and may continue to be, affected by changes in laws, regulations and governmental actions, particularly in emerging markets such as Turkey and China. We cannot assure you that we will be able to maintain such mining permits, leases and other rights to the extent we currently maintain them or at all.
The Company relies on shipping bulk cargos of bentonite from the United States, Turkey and China to customers, as well as our own subsidiaries, and we are sensitive to our ability to recover these shipping costs. In the last few years, bulk cargo shipping rates have been very volatile, and, to a lesser extent, the availability of bulk cargo containers have been suspect. If we cannot secure our container requirements or offset additional shipping costs with price increases to customers, our profitability could be impacted. We are also subject to other shipping risks. In particular, rail service interruptions have affected our ability to ship, and the availability of rail service, and our ability to recover increased rail costs, may be beyond our control.
During the COVID-19 pandemic, our ability to ship our products has been, and may in the future be, affected by government mandates in certain jurisdictions in which we operate.
Operational Risks
The Company is subject to stringent regulation in the areas of environmental, health and safety, and tax, and may incur unanticipated costs or liabilities arising out of claims for various legal, environmental and tax matters or product stewardship issues that could materially harm the Company’s results of operations, cash flows and financial condition.
The Company’s operations are subject to international, federal, state and local governmental environmental, health and safety, tax and other laws and regulations. We have expended, and may be required to expend in the future, substantial funds for compliance with such laws and regulations. In addition, future events, such as changes to or modifications of interpretations of existing laws and regulations, or enforcement polices, or further investigation or evaluation of the potential environmental impacts of operations or health hazards of certain products, may affect our mining rights or give rise to additional compliance and other costs that could have a material adverse effect on the Company. Government action taken in response to the COVID-19 pandemic, including government-imposed restrictions on the movement of people and goods, and other new legal rights and obligations, could also have an adverse effect on the Company.
Further, certain of our customers are subject to various federal and international laws and regulations relating to environmental and health and safety matters, especially customers of our Energy Services business within the Environmental Products product line, who are subject to drilling permits, waste water disposal and other regulations. To the extent that these laws and regulations affecting our customers change, demand for our products and services could also change and thereby affect our financial results.
State, national, and international governments and agencies have been evaluating climate-related legislation and regulation that would restrict emissions of greenhouse gases in areas in which we conduct business, and some such legislation and regulation have already been enacted or adopted. Enactment of climate-related legislation or adoption of regulation that restrict emissions of greenhouse gases in areas in which we conduct business could have an adverse effect on our operations or demand for our products. Our manufacturing processes, particularly the manufacturing process for PCC, use a significant amount of energy and, should energy prices increase as a result of such legislation or regulation, we may not be able to pass these increased costs on to purchasers of our products. We cannot predict if or when currently proposed or additional laws and regulations regarding climate change or other environmental or health and safety concerns will be enacted or adopted.
The Company is also subject to income tax laws and regulations in the United States and various foreign jurisdictions. Significant judgment is required in evaluating and estimating our provision and accruals for these taxes. Our income tax liabilities are dependent upon the location of earnings among these different jurisdictions. Our income tax provision and income tax liabilities could be adversely affected by the jurisdictional mix of earnings, changes in valuation of deferred tax assets and liabilities and changes in tax treaties, laws and regulations.
The Company is currently a party in various litigation matters and tax and environmental proceedings and faces risks arising from various unasserted litigation matters, including product liability, patent infringement, antitrust claims, and claims for third-party property damage or personal injury stemming from alleged torts. Litigation can be expensive and disruptive. For example, as described in
Note 17 to the consolidated financial statements included in this report
, the Company and certain of the Company’s subsidiaries are among numerous defendants in a number of cases seeking damages for alleged exposure to asbestos-containing materials related to talc products sold by
the Company’s subsidiary Barretts Minerals Inc.
Depending on the ultimate outcome of these matters, the Company could in the future be required to pay significant amounts as a result of settlements or judgments in these matters, potentially in excess of liabilities accrued to date in respect of such matters. The resolution of, or recognition of additional liabilities in connection with, pending litigation could have a material adverse effect on the Company’s results of operations, cash flows and financial condition. More generally, any failure to appropriately manage safety, human health, product liability and environmental risks associated with the Company’s products and production processes could adversely impact the Company’s employees and other stakeholders, the Company’s reputation, and its results of operations, cash flows and financial condition. Public perception of the risks associated with the Company’s products and production processes could impact product acceptance and influence the regulatory environment in which the Company operates. Any unanticipated liability arising out of a current matter or proceeding, or from the other risks described above, could have a material adverse effect on the Company’s results of operations, cash flows and financial condition.
We have been and could continue to be adversely affected by the COVID-19 pandemic.
We are subject to risks related to the global COVID-19 pandemic, which has adversely affected the global and U.S. economy, market conditions and our business. We have been, and could continue to be, affected by delays and disruptions to our supply chain, logistics, and service providers; travel and site access restrictions; reductions in employee availability and effectiveness; changes in operating procedures; and increased costs. We cannot predict the degree to which, or the time period that, global economic conditions and our business, liquidity, financial condition and results of operations will continue to be affected by the COVID-19 pandemic and the resulting preventative measures. The extent to which we are affected will depend on future developments, including the duration of the outbreak and the significance of new variants of COVID-19, travel restrictions, business and workforce disruptions, and the effectiveness of vaccination and other actions taken to contain and treat the disease. The effects on our business, liquidity, financial condition and results of operations could be material.
Production facilities are subject to operating risks and capacity limitations that may adversely affect the Company’s financial condition or results of operations.
The Company is dependent on the continued operation of its production facilities. During the COVID-19 pandemic, our facilities have been, and may in the future be, temporarily closed in response to government mandates in certain jurisdictions in which we operate or for the safety of our employees in response to positive diagnoses for COVID-19. Production facilities are subject to hazards associated with the manufacturing, handling, storage, and transportation of chemical materials and products, including pipeline leaks and ruptures, explosions, fires, inclement weather and natural disasters, mechanical failure, unscheduled downtime, labor difficulties, transportation interruptions, and environmental risks. We maintain property, business interruption and casualty insurance but such insurance may not cover all risks associated with the hazards of our business and is subject to limitations, including deductibles and maximum liabilities covered. We may incur losses beyond the limits, or outside the coverage, of our insurance policies. Further, from time to time, we may experience capacity limitations in our manufacturing operations. In addition, if we are unable to effectively forecast our customers’ demand, it could affect our ability to successfully manage operating capacity limitations. These hazards, limitations, disruptions in supply and capacity constraints could adversely affect financial results.
Operating results for some of our segments are seasonal.
Certain product lines within our Performance Materials segment are affected by seasonal weather patterns. A majority of revenues from our Energy Services business within the Environmental Products product line is derived from the Gulf of Mexico and surrounding states, which are susceptible to hurricanes that typically occur June 1
st
through November 30
th
. Actual or threatened hurricanes can result in volatile demand for services provided by our Energy Services business. Our other Environmental Products businesses and our Building Materials product line within our Performance Materials segment are affected by weather patterns which determine the feasibility of construction activities. Typically, less construction activity occurs in winter months and thus this segment’s revenues tend to be greatest in the second and third quarters when weather patterns in our geographic markets are more conducive to construction activities. Our Processed Minerals product line is subject to similar seasonal patterns.
Our operations have been and will continue to be subject to cyber-attacks that could have a material adverse impact on our business, consolidated results of operations, and consolidated financial condition.
Our operations are becoming increasingly dependent on digital technologies and services. We use these technologies for internal purposes, including data storage, processing, and transmissions, as well as in our manufacturing operations and in our interactions with customers and suppliers. Increased use of remote working arrangements has only increased our reliance on these technologies. Digital technologies are subject to the risk of cyber-attacks, and we have been in the past been affected by a ransomware attack on our information technology systems. If our systems for protecting against cybersecurity risks prove not to be sufficient, we could be adversely affected by, among other things: loss of or damage to intellectual property, proprietary or confidential information, or customer, supplier, or employee data; interruption of our business operations; and increased costs required to prevent, respond to, or mitigate cybersecurity attacks, which could have a material adverse effect on our business, consolidated results of operations, and consolidated financial condition.
None.
The Company’s corporate headquarters, sales offices, research laboratories, plants, mines and other facilities are owned by the Company except as otherwise noted. Set forth below is certain information relating to the Company’s principal plants and office and research facilities.
|
Location
|
Facility
|
Product Line
|
Segment
|
|||
|
United States
|
||||||
|
Alabama, Sandy Ridge
|
Plant; Mine
|
Metalcasting and specialty products
|
Performance Materials
|
|||
|
Alabama, Selma
|
Satellite Plant
|
PCC
|
Specialty Minerals
|
|||
|
Arizona, Phoenix
|
Plant
|
Pet care products
|
Performance Materials
|
|||
|
Arizona, Pima County (1)
|
Plant; Mine
|
Limestone
|
Specialty Minerals
|
|||
|
Arkansas, Ashdown
|
Satellite Plant
|
PCC
|
Specialty Minerals
|
|||
|
California, Lucerne Valley
|
Plant; Mine
|
Limestone
|
Specialty Minerals
|
|||
|
Connecticut, Canaan
|
Plant; Mine
|
Limestone, Metallurgical Wire/Calcium
|
Specialty Minerals; Refractories
|
|||
|
Georgia. Cartersville
|
Plant
|
Environmental products and other building materials products
|
Performance Materials
|
|||
|
Illinois, Belvidere
|
Plant
|
Metalcasting products
|
Performance Materials
|
|||
|
Illinois, Hoffman Estates (2)
|
Research Laboratories; Administrative office
|
All Company Products
|
Performance Materials
|
|||
|
Indiana, Portage
|
Plant
|
Refractories/Shapes
|
Refractories
|
|||
|
Indiana, Troy
|
Plant
|
Metalcasting products
|
Performance Materials
|
|||
|
Iowa, Shell Rock
|
Plant
|
Metalcasting products
|
Performance Materials
|
|||
|
Kentucky, Wickliffe
|
Satellite Plant
|
PCC
|
Specialty Minerals
|
|||
|
Louisiana, Baton Rouge
|
Plant
|
Monolithic Refractories
|
Refractories
|
|||
|
Louisiana, Lafayette
|
Plant
|
Personal Care Products
|
Performance Materials
|
|||
|
Louisiana, New Iberia (2)
|
Operations base
|
Environmental products
|
Performance Materials
|
|||
|
Massachusetts, Adams
|
Plant; Mine
|
Limestone, Lime, PCC
|
Specialty Minerals
|
|||
|
Michigan, Albion
|
Plant
|
Metalcasting products
|
Performance Materials
|
|||
|
Michigan, Quinnesec
|
Satellite Plant
|
PCC
|
Specialty Minerals
|
|||
|
Minnesota, Cloquet
|
Satellite Plant
|
PCC
|
Specialty Minerals
|
|||
|
Minnesota, International Falls
|
Satellite Plant
|
PCC
|
Specialty Minerals
|
|||
|
Mississippi, Aberdeen
|
Plant
|
Performance additive products
|
Performance Materials
|
|||
|
Missouri, Ste. Genevieve
|
Plant
|
Limestone, Lime, PCC
|
Specialty Minerals
|
|||
|
Montana, Dillon
|
Plant; Mine
|
Talc
|
Specialty Minerals
|
|||
|
Nebraska, Scottsbluff
|
Transportation terminal
|
Performance Materials
|
||||
|
New York, New York (2)
|
Headquarters
|
All Company Products
|
Headquarters
|
|||
|
New York, Ticonderoga
|
Satellite Plant
|
PCC
|
Specialty Minerals
|
|||
|
North Dakota, Gascoyne
|
Plant; Mine
|
Metalcasting and specialty products
|
Performance Materials
|
|||
|
Ohio, Archbold
|
Plant
|
Metalcasting products
|
Performance Materials
|
|||
|
Ohio, Bryan
|
Plant
|
Monolithic Refractories
|
Refractories
|
|||
|
Ohio, Chillicothe
|
Satellite Plant
|
PCC
|
Specialty Minerals
|
|||
|
Ohio, Dover
|
Plant
|
Monolithic Refractories/Shapes
|
Refractories
|
|||
|
Pennsylvania, Bethlehem
|
Administrative Office; Research Laboratories; Sales Offices
|
All Company Products
|
All Segments
|
|||
|
Pennsylvania, Easton
|
Administrative Office; Research Laboratories; Plant; Sales Offices
|
All Company Products
|
All Segments
|
|||
|
Pennsylvania, Slippery Rock
|
Plant; Sales Offices
|
Monolithic Refractories/Shapes
|
Refractories
|
|||
|
Pennsylvania, York
|
Plant
|
Metalcasting and pet care products
|
Performance Materials
|
|
Location
|
Facility
|
Product Line
|
Segment
|
|||
|
South Carolina, Eastover
|
Satellite Plant
|
PCC
|
Specialty Minerals
|
|||
|
Tennessee, Chattanooga
|
Plant
|
Metalcasting products
|
Performance Materials
|
|||
|
Tennessee, Dyersburg
|
Plant
|
Pet care products
|
Performance Materials
|
|||
|
Texas, Bay City
|
Plant
|
Talc
|
Performance Materials
|
|||
|
Texas, Houston (2)
|
Research Laboratories
|
Environmental products
|
Performance Materials
|
|||
|
Texas, Houston (2)
|
Administrative Office
|
Environmental products
|
Performance Materials
|
|||
|
Washington, Longview
|
Satellite Plant
|
PCC
|
Specialty Minerals
|
|||
|
Wisconsin, Neenah
|
Plant
|
Metalcasting products
|
Performance Materials
|
|||
|
Wisconsin, Superior
|
Satellite Plant
|
PCC
|
Specialty Minerals
|
|||
|
Wyoming, Colony
|
Plant; Mine
|
Metalcasting, pet litter, personal care, specialty and basic minerals products
|
Performance Materials
|
|||
|
Wyoming, Lovell
|
Plant; Mine
|
Specialty and pet care products; Environmental and building materials products
|
Performance Materials
|
|
Location
|
Facility
|
Product Line
|
Segment
|
|||
|
International
|
||||||
|
Australia, Brisbane
|
Sales Office/Administrative Office
|
Metalcasting, specialty and pet care products
|
Performance Materials
|
|||
|
Australia, Carlingford (2)
|
Sales Office
|
Monolithic Refractories
|
Refractories
|
|||
|
Australia, Gurulmundi
|
Plant; Mine
|
Metalcasting, specialty and pet care products
|
Performance Materials
|
|||
|
Australia, Perth (2)
|
Operations base
|
Environmental products
|
Performance Materials
|
|||
|
Austria, Pucking
|
Sales Office/Administrative Office
|
Pet care products
|
Performance Materials
|
|||
|
Austria, Rottersdorf
|
Plant
|
Pet care products
|
Performance Materials
|
|||
|
Belgium, Brussels
|
Administrative Office
|
Monolithic Refractories
|
Refractories
|
|||
|
Brazil, Guaiba
|
Satellite Plant
|
PCC
|
Specialty Minerals
|
|||
|
Brazil, Jacarei
|
Satellite Plant
|
PCC
|
Specialty Minerals
|
|||
|
Brazil, Luiz Antonio
|
Satellite Plant
|
PCC
|
Specialty Minerals
|
|||
|
Brazil, Macae (2)
|
Operations base
|
Environmental products
|
Performance Materials
|
|||
|
Brazil, Mucuri
|
Satellite Plant
|
PCC
|
Specialty Minerals
|
|||
|
Brazil, Sao Jose dos Campos
|
Sales Office /Administrative Office
|
PCC
|
Specialty Minerals
|
|||
|
Brazil, Suzano
|
Satellite Plant
|
PCC
|
Specialty Minerals
|
|||
|
Canada, Brantford, Ontario
|
Plant
|
Pet care products
|
Performance Materials
|
|||
|
Canada, Lethbridge, Alberta
|
Plant
|
Pet care products
|
Performance Materials
|
|||
|
Canada, Mississaugua, Ontario
|
Administrative Office
|
Pet care products
|
Performance Materials
|
|||
|
Canada, Pt. Claire
|
Administrative Office
|
PCC/Monolithic Refractories
|
Specialty Minerals; Refractories
|
|||
|
Canada, St. Jerome, Quebec
|
Satellite Plant
|
PCC
|
Specialty Minerals
|
|||
|
Canada, Windsor, Quebec
|
Satellite Plant
|
PCC
|
Specialty Minerals
|
|||
|
China, Beihai (4)
|
Satellite Plant
|
PCC
|
Specialty Minerals
|
|||
|
China, Beijing
|
Sales Office/Administrative Office
|
Metalcasting, specialty, fabric care and pet care products
|
Performance Materials
|
|||
|
China, Chao Yang, Liaoning
|
Plant; Mine
|
Metalcasting and fabric care products
|
Performance Materials
|
|||
|
China, Changshu
|
Satellite Plant
|
PCC
|
Specialty Minerals
|
|||
|
China, Dagang (3)
|
Satellite Plant
|
PCC
|
Specialty Minerals
|
|||
|
China, Henan
|
Satellite Plant
|
PCC
|
Specialty Minerals
|
|||
|
China, Rugao (4)
|
Satellite Plant
|
GCC
|
Specialty Minerals
|
|||
|
China, Shandong
|
Satellite Plant
|
PCC
|
Specialty Minerals
|
|||
|
China, Shanghai
|
Administrative Office/Sales Office
|
PCC/Monolithic Refractories
|
Specialty Minerals; Refractories
|
|
Location
|
Facility
|
Product Line
|
Segment
|
|||
|
China, Shouguang (3)
|
Satellite Plant
|
PCC
|
Specialty Minerals
|
|||
|
China, Suzhou
|
Plant
|
Environmental and building materials products
|
Performance Materials
|
|||
|
China, Suzhou
|
Plant/Sales Office/Research Laboratories
|
PCC/Monolithic Refractories
|
Specialty Minerals; Refractories
|
|||
|
China, Tianjin
|
Plant; Mine; Research Laboratories
|
Metalcasting and fabric care products
|
Performance Materials
|
|||
|
China, Yanzhou
|
Satellite Plant
|
PCC
|
Specialty Minerals
|
|||
|
China, Zhenjiang (3)
|
Satellite Plant
|
PCC
|
Specialty Minerals
|
|||
|
China, Zhumadian
|
Satellite Plant
|
PCC
|
Specialty Minerals
|
|||
|
Finland, Äänekoski
|
Satellite Plant
|
PCC
|
Specialty Minerals
|
|||
|
Finland, Tervakoski
|
Satellite Plant
|
PCC
|
Specialty Minerals
|
|||
|
France, Quimperle
|
Satellite Plant
|
PCC
|
Specialty Minerals
|
|||
|
France, Saillat Sur Vienne
|
Satellite Plant
|
PCC
|
Specialty Minerals
|
|||
|
Germany, Duisburg
|
Plant/Sales Office/Research Laboratories
|
Laser Scanning Instrumentation/ Probes/Monolithic Refractories
|
Refractories
|
|||
|
Germany, Schongau
|
Satellite Plant
|
PCC
|
Specialty Minerals
|
|||
|
Netherlands, Hengelo
|
Plant/Administrative Office
|
Metallurgical Wire
|
Refractories
|
|||
|
India, Ballarshah (3)
|
Satellite Plant
|
PCC
|
Specialty Minerals
|
|||
|
India, Bhuj
|
Plant
|
Environmental and building materials products
|
Performance Materials
|
|||
|
India, Chennai
|
Plant
|
Metalcasting products
|
Performance Materials
|
|||
|
India, Dandeli
|
Satellite Plant
|
PCC
|
Specialty Minerals
|
|||
|
India, Erode (4)
|
Satellite Plant
|
PCC
|
Specialty Minerals
|
|||
|
India, Gaganapur (3)
|
Satellite Plant
|
PCC
|
Specialty Minerals
|
|||
|
India, Kala Amb
|
Satellite Plant
|
PCC
|
Specialty Minerals
|
|||
|
India, Mukstar
|
Satellite Plant
|
PCC
|
Specialty Minerals
|
|||
|
India, Mumbai (2)
|
Sales Office /Administrative Office
|
PCC/Monolithic Refractories/ Metallurgical Wire
|
Specialty Minerals; Refractories
|
|||
|
India, Lalkuan
|
Satellite Plant
|
PCC
|
Specialty Minerals
|
|||
|
India, Rajahmundy (4)
|
Satellite Plant
|
PCC
|
Specialty Minerals
|
|||
|
India, Rayagada (3)
|
Satellite Plant
|
PCC
|
Specialty Minerals
|
|||
|
India, Saila Khurd
|
Satellite Plant
|
PCC
|
Specialty Minerals
|
|||
|
Indonesia, Jakarta (2)
|
Operations base
|
Environmental products
|
Performance Materials
|
|||
|
Indonesia, Perawang (3)
|
Satellite Plant
|
PCC
|
Specialty Minerals
|
|||
|
Indonesia, Perawang 2 (3)
|
Satellite Plant
|
PCC
|
Specialty Minerals
|
|||
|
Ireland, Cork (2)
|
Plant; Administrative Office/ Research Laboratories
|
Monolithic Refractories
|
Refractories
|
|||
|
Italy, Brescia
|
Sales Office
|
Monolithic Refractories/Shapes
|
Refractories
|
|||
|
Italy, Nave
|
Plant
|
Monolithic Refractories/Shapes
|
Refractories
|
|||
|
Japan, Gamagori
|
Plant/Research laboratories
|
Monolithic Refractories/Shapes, Calcium
|
Refractories
|
|||
|
Japan, Shiraoi (3)
|
Satellite Plant
|
PCC
|
Specialty Minerals
|
|||
|
Japan, Tokyo
|
Sales/Administrative Office
|
Monolithic Refractories
|
Refractories
|
|||
|
Korea, Pyeongtaek
|
Plant
|
Environmental, building materials and other products
|
Performance Materials
|
|||
|
Malaysia, Kemaman (2)
|
Operations base
|
Environmental products
|
Performance Materials
|
|||
|
Malaysia, Sipitang
|
Satellite Plant
|
PCC
|
Specialty Minerals
|
|||
|
Netherlands, Moerdjik
|
Plant/Administrative Office
|
Pet Care Products
|
Performance Materials
|
|||
|
Nigeria, Port Harcourt (2)
|
Operations base
|
Environmental products
|
Performance Materials
|
|
Location
|
Facility
|
Product Line
|
Segment
|
|||
|
Poland, Kwidzyn
|
Satellite Plant
|
PCC
|
Specialty Minerals
|
|||
|
Poland, Szczytno
|
Plant
|
Environmental products
|
Performance Material
|
|||
|
Portugal, Figueira da Foz (3)
|
Satellite Plant
|
PCC
|
Specialty Minerals
|
|||
|
Slovakia, Bratislava
|
Plant; Mine
|
Pet Care Products
|
Performance Material
|
|||
|
Slovakia, Kopernica
|
Plant
|
Pet Care Products
|
Performance Material
|
|||
|
Slovakia, Ruzomberok
|
Satellite Plant
|
PCC
|
Specialty Minerals
|
|||
|
South Africa, Johannesburg (2)
|
Sales Office/Administrative Office
|
Monolithic Refractories
|
Refractories
|
|||
|
South Africa, Merebank (3)
|
Satellite Plant
|
PCC
|
Specialty Minerals
|
|||
|
South Africa, Pietermaritzburg
|
Plant
|
Monolithic Refractories
|
Refractories
|
|||
|
South Korea, Yangbuk-Myeun, Kyeung-buk
|
Plant; Mine
|
Metalcasting products
|
Performance Material
|
|||
|
Spain, Santander
|
Administrative Office
|
Monolithic Refractories
|
Refractories
|
|||
|
Thailand, Laemchabang
|
Plant
|
Metalcasting and fabric care products
|
Performance Material
|
|||
|
Thailand, Namphong
|
Satellite Plant
|
PCC
|
Specialty Minerals
|
|||
|
Thailand, Tha Toom (3)
|
Satellite Plant
|
PCC
|
Specialty Minerals
|
|||
|
Thailand, Tha Toom 2 (3)
|
Satellite Plant
|
PCC
|
Specialty Minerals
|
|||
|
Thailand, Wangnoi
|
Plant
|
Pet Care Products
|
Performance Materials
|
|||
|
Turkey, Enez
|
Plant; Mine
|
Metalcasting, specialty and basic minerals products
|
Performance Materials
|
|||
|
Turkey, Gebze
|
Plant/Research Laboratories
|
Monolithic Refractories/Shapes/ Application Equipment
|
Refractories
|
|||
|
Turkey, Istanbul
|
Sales Office/Administrative Office
|
Monolithic Refractories
|
Refractories
|
|||
|
Turkey, Kutahya
|
Plant
|
Monolithic Refractories/Shapes
|
Refractories
|
|||
|
Turkey, Unye
|
Plant; Mine
|
Pet Care Products
|
Performance Material
|
|||
|
Turkey, Usak
|
Plant; Mine
|
Specialty material products
|
Performance Material
|
|||
|
United Kingdom, Aberdeen (2)
|
Operations base
|
Environmental products
|
Performance Material
|
|||
|
United Kingdom, Birkenhead (2)
|
Research Laboratories
|
Environmental products
|
Performance Material
|
|||
|
United Kingdom, Lifford
|
Plant
|
PCC, Lime
|
Specialty Minerals
|
|||
|
United Kingdom, Rotherham
|
Plant/Sales Office
|
Monolithic Refractories/Shapes
|
Refractories
|
|||
|
United Kingdom, Winsford
|
Plant/Research Laboratories
|
Fabric care and other products
|
Performance Material
|
| (1) |
This plant and quarry is leased to another company.
|
| (2) |
Leased by the Company. The facilities in Cork, Ireland, are operated pursuant to a 99-year lease, the term of which commenced in 1963. The Company's headquarters in New York, New York, are held under a lease which expires in 2031.
|
| (3) |
These plants are owned through joint ventures.
|
| (4) |
These plants are under construction.
|
Mining Properties
Information concerning our mining properties in this Annual Report on Form 10-K is disclosed in accordance with the requirements of subpart 1300 of Regulation S-K.
The Company relies on access to bentonite reserves to support its Performance Materials segment. The Company has reserves of sodium and calcium bentonite at various locations in the U.S., including Wyoming, South Dakota, Montana and Alabama, as well as in Australia, China, and Turkey. Through the Company’s affiliations and joint ventures, the Company also has access to bentonite deposits in India and Mexico. The Company owns or controls the properties on which the bentonite reserves are located through long-term leases, royalty agreements (including easement and right of way agreements) and patented and unpatented mining claims. No single or group of mining claims or leases is significant or material to the financial condition or operations of our Company or our segments. The majority of our current bentonite mining in the U.S. occurs on reserves where our rights to such reserves accrue to us through over 80 mining leases and royalty agreements and 2,000 mining claims. A majority of these are with private parties and located in Montana, South Dakota and Wyoming. The bentonite deposits underlying these claims and leases generally lie in parcels of land varying between 20 and 40 acres.
In general, our bentonite reserves are immediately adjacent to, or within sixty miles of, one of the related processing plants. All of the properties on which our reserves are located are either physically accessible for the purposes of mining and hauling or the cost of obtaining physical access would not be material. Access to processing facilities from the mining areas is generally by private road, public highways, or railroads. For most of our leased properties and mining claims, there are multiple means of access.
Bentonite is surface mined, generally with large earthmoving bulldozers and scrapers, and then loaded into trucks and off-highway-haul wagons for movement to processing plants. The mining and hauling of our bentonite is done by us and by independent contractors. At the processing plants, bentonite is dried, crushed and sent through grinding mills, where it is sized to customer requirements, then chemically modified, where needed, and transferred to silos for automatic bagging or bulk shipment. Most of the production is shipped as processed rather than stored for inventory.
For our Performance Materials segment, we also mine leonardite, a form of oxidized lignite, in North Dakota, and transport it to nearby processing facilities.
The Processed Minerals product line of our Specialty Minerals segment is supported by the Company's limestone reserves located in the western and eastern parts of the United States, and talc reserves located in Montana. The Company generally owns and surface mines these reserves and processes its products at nearby processing plants.
The Company also owns mineral deposits that it is not currently mining, including deposits of bentonite in Nevada and chromite in South Africa, and leases its limestone mine in Pima, Arizona to a third party.
Below is a map of our significant mines globally.
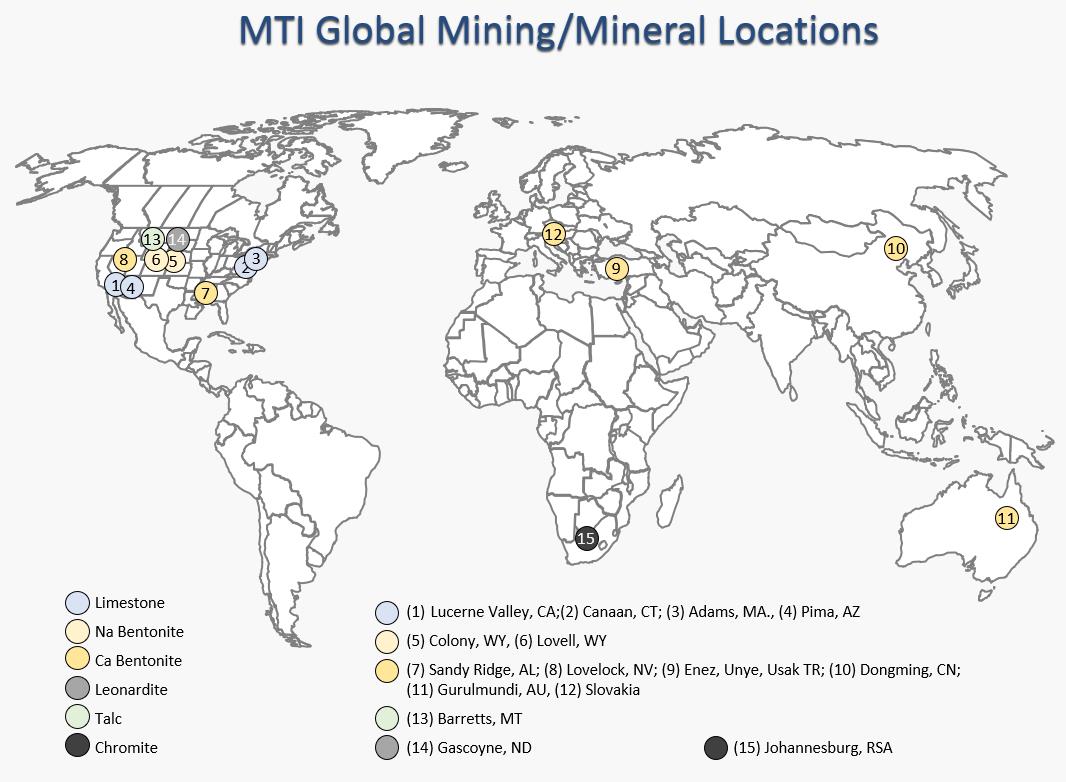
Based upon the quantitative and qualitative factors applicable, we do not consider any of our mines to be individually material to the Company's business or financial condition. The following provides an overview of the Company's most significant mining properties and operations.
Colony, Wyoming Mines
The Company's Colony, WY mining operations are located in the northern Black Hills in the tri-State area of South Dakota, Wyoming, and Montana, with processing facilities located in Colony, WY and Belle Fourche, SD.
The local processing facilities are supported by bentonite clay supplied from 51 million tons of proven and probable reserves, comprised of leases (79%), unpatented claims (14%), and owned properties (7%). The area operates under 12 mining permits covering approximately 100,000 acres, with active mining and future mineral reserves located within 35 miles of the Colony processing facilities.
The Black Hills are a northward-trending anticlinal uplift approximately 200 miles long and flank the Powder River Basin to the west and southwest, and the Williston Basin to the northeast. The bentonite clay in the Black Hills area is predominantly of the sodium type and was formed by the in-situ alteration of rhyolite volcanic ash.
Bentonite mining consists of shallow surface mining for bentonite beds located in the Mitten Black Shale, Gammon Ferruginous, Belle Fourche Shale, Green Horn Formations, Mowry, and Newcastle shales and sandstones. A back-cast method of mining is used whereby small pits are progressively opened and then quickly backfilled in succession as mining progresses along outcrops. The majority of pits are reclaimed in the same year that they were first disturbed.
Annual exploration and permitting activities target the replacement of the number of tons mined to support the long-term sustainability of local operations.
The Colony area mines are supported by 2 main processing plants located in Colony, WY. These plants produce both powder and granular products. A wet-processing facility is located near Belle Fourche, SD. All three facilities have direct access to rail.
Lovell, Wyoming Mines
The Company's Lovell, WY mining operations are located in the Bighorn Basin near Lovell, WY with processing facilities located 3 miles west of the town of Lovell.
The Lovell processing facility is supported by bentonite clay supplied from 35 million tons of proven and probable reserves, comprised of leases (12%), unpatented claims (40%), and owned properties (48%). The area operates under 2 mining permits covering ~30,000 acres, with active mining and future mineral reserves located within 30 miles of the Lovell processing facilities.
The Bighorn Basin is a large sedimentary basin in northwestern Wyoming. It is Laramide in age and style and trends northwest-southeast. The bentonite clay in the Bighorn Basin is predominantly of the sodium type. Mining occurs from 19 different bentonite beds occurring in 3 geologic formations – the Thermopolis shale, the Mowry shale, and the Frontier shale which were deposited during the Upper Cretaceous Period between 70 to 100 million years ago. A back-cast method of mining is used whereby small pits are progressively opened and then quickly backfilled in succession as mining progresses along outcrops. Most pits are reclaimed in the same year that they were first disturbed.
Annual exploration and permitting activities target the replacement of the number of tons mined to support the long-term sustainability of local operations.
The Lovell area mines are supported by 2 processing facilities located 3 miles East of Lovell, WY. One facility produces powder and granular bentonite products; the other facility produces geosynthetic clay liners and other environmental products. Both facilities have direct access to rail.
Ünye, Turkey Mines
The Company's Unye-area mines, Nadirli and Konan, are located southwest of the town of Unye, Turkey on the southern coast of the Black Sea. These mines are operated by the Company via contract mining and hauling. Both mines use conventional open-pit truck and shovel mining methods. The properties are comprised of both government-issued mining claims and privately-owned lands. The orebodies were produced by hydrothermal alteration and generally occur as massive deposits greater than 10 meters in thickness. The bentonite ore is notable for its high brightness. Current mine life is 18 years based on 6 million tons of proven and probable reserves, with additional potential of 18 million tons of identified reserves.
Ore from the mines is transported by truck to a processing facility in the town of Unye where it is stockpiled, dried, and converted to granular products.
Dongming, China Mines
The Company's Dongming mines and processing facilities are located in Jianping county, Liaoning province, China. The regional bentonite occurs within the Jurassic Jingangshan and Tuhulu formations which were deposited during the Upper Jurassic Period between 135 to 144 million years ago. The thickness of the bentonite layers varies from 0.5 to 40m. The bentonite clay in the region is predominantly of the calcium type and is converted to sodium bentonite to produce the majority of products.
The Dongming mines consist of 16 small mining areas under 4 mining permits covering approximately 1,200 acres controlled by the Company. Rights to the bentonite are leased from the Chinese government and separate agreements are made with land owners for surface access and mining. Much of the bentonite supplied to the Dongming processing facility is from 3
rd
-party mines, with Company-controlled mines used to supplement supply and as strategic backup reserves. In most cases, supply from 3
rd
-party mines is directly supervised by local Company staff which assists with grading and quality control.
All mines are operated by contractors with conventional open-pit truck and shovel mining methods. Clay from the mines is hauled by trucks to the Company's processing facility.
The primary processing facility is located approximately 50 miles west of Chaoyang, Liaoning Province near the Dongming mines.
Adams, Massachusetts Mine
The Company's Adams mine and the associated processing facility is located in the town of Adams, in the Northwest corner of Massachusetts. The property consists of approximately 800 total acres, including the land that the production facilities sit on. Production of lime began on the site back in the 1850s and continues today with GCC, Lime and PCC production. The open-pit mine consists mainly of a mineral deposit of limestone (marble). The deposit is part of the Shelburne geological formation, which runs up and down the eastern coast of the United States.
The mined material is finely pulverized at the processing facility using a variety of crushing and milling equipment and sold as ground products, calcined into lime and is also synthesized into a participated crystals or PCC. The resulting calcium and calcium carbonate products are primarily used as food and pharmaceutical ingredients, sealant additives, high-end construction ingredients, as well as asphalt roofing shingles.
The deposit is wholly owned by the Company.
With over 150 years of mining on site by the Company and its predecessors, the resources have become reasonably well understood. A mine plan has been developed based on the prior mining activities and a core drilling program completed in 2019. The reserves and resources outlined further in this document, are the product of this recent life of mine study.
Canaan, Connecticut Mine
The Canaan mine and the associated processing facility is located in the town of North Canaan, Connecticut and consists of approximately 208 total net acres. The mine is situated between Canaan Mountain to the South and Lower Road to the North. The mine is located approximately 1.0 miles south of the main processing facility.
The open-pit mine consists mainly of a mineral deposit of dolomitic limestone. The mined dolomite is finely pulverized at the processing facility using a variety of crushing and milling equipment. This resulting Ground Calcium Carbonate (GCC) is primarily used by high-end, high volume construction supply markets in joint compound, floor coverings, asphalt roofing shingles and glass.
Dillon, Montana Mines
The Barretts talc operations consist of two operating mines, the Regal mine and the Treasure mine, and an inactive mining property, the Smith-Dillon mine, all located in the Ruby Range mountains east of Dillon, Montana. Refining and processing plant operations are in Barretts, Beaverhead County, Montana, 8 miles south of Dillon, Montana.
In November 2020, the Company began a major stripping campaign at the Regal mine for development of the Imperial deposit. Stripping was completed by a contractor during 2021 and mining has resumed with in-house Company mining crews. Drilling programs during 2015-2018 at the Treasure mine defined new mine resources in the Treasure Island deposit. Mine exploration activities are ongoing with work at both operating mines and the inactive Smith-Dillon mine.
Ore is mined by conventional open pit mining methods with ore selectively mined and stockpiled on ore pads at the mine sites. A contract trucking company transports ore from the mines to the processing plant year-round. Both mining locations are fully supported by local power utilities with dedicated power lines to the sites.
The Company's lands, including the Regal and Treasure mines, Barretts plant site, and related properties held for exploration and development, consist of approximately 2,556 net acres, which encompasses 129 unpatented lode mining claims, appropriating approximately 2,008 net acres of Public Land, 27 patented lode claims, consisting of approximately 187 acres, 219 acres of mineral rights in split reservation, and approximately 93 acres of additional real property.
At these mines, talc mineralization is hosted in highly deformed Archean aged dolomitic marbles of the Cherry Creek group of metasedimentary rocks. Deposits are segregated into several different grades based on mineral impurities of dolomite, calcite, chlorite, graphite, and various iron oxide minerals.
Lucerne Valley, California Mines
The Company's Lucerne Valley operation
consists of three high-purity, calcium carbonate surface mining leases, a processing and packaging facility, and supporting infrastructure within 7,347 acres in the town of Lucerne Valley in San Bernardino County, California.
Calcium carbonate mining onsite stretches back to the early 1950’s. The Marble Canyon and Arctic Canyon Leases are both still active, with Marble Canyon at a minimal rate of production. Furnace Canyon is in an advanced stage of reclamation. All mineral rights are owned by the Company.
Operating Statistics
The following table sets forth the tons usage for the fiscal years 2022, 2021 and 2020 by major mineral category.
|
|
2022
|
2021
|
2020
|
|||||||||
|
Tons (000s)
|
Tons (000s)
|
Tons (000s)
|
||||||||||
|
Limestone
|
||||||||||||
|
Adams, MA
|
315
|
355
|
453
|
|||||||||
|
Canaan, CT
|
562
|
522
|
510
|
|||||||||
|
Lucerne Valley, CA
|
1,202
|
1,250
|
1,082
|
|||||||||
|
Pima County, AZ
|
114
|
166
|
177
|
|||||||||
|
Total Limestone
|
2,193
|
2,293
|
2,222
|
|||||||||
|
Talc
|
||||||||||||
|
Dillon, MT
|
102
|
117
|
122
|
|||||||||
|
Sodium Bentonite
|
||||||||||||
|
Australia
|
—
|
118
|
83
|
|||||||||
|
Belle/Colony, WY/SD
|
1,109
|
1,177
|
1,345
|
|||||||||
|
Lovell, WY
|
629
|
629
|
507
|
|||||||||
|
Total Sodium Bentonite
|
1,738
|
1,924
|
1,935
|
|||||||||
|
Calcium Bentonite
|
||||||||||||
|
Chao Yang, Liaoning, China
|
267
|
507
|
332
|
|||||||||
|
Nevada
|
1
|
1
|
1
|
|||||||||
|
Sandy Ridge, AL
|
98
|
77
|
40
|
|||||||||
|
Slovakia, Lutila
|
52
|
—
|
—
|
|||||||||
|
Turkey, Enez
|
172
|
196
|
196
|
|||||||||
|
Turkey, Usak
|
62
|
51
|
33
|
|||||||||
|
Turkey, Unye
|
331
|
320
|
314
|
|||||||||
|
Total Calcium Bentonite
|
983
|
1,152
|
916
|
|||||||||
|
Leonardite
|
||||||||||||
|
Gascoyne, ND
|
31
|
51
|
34
|
|||||||||
|
GRAND TOTALS
|
5,047
|
5,537
|
5,229
|
|||||||||
Proven and Probable Reserves
The following table sets forth the Company’s proven and probable reserves, as well as, the conversion factor for the conversion of in-situ materials to saleable products by major minerals category at December 31, 2022.
|
Proven and Probable Reserves (1)(2) Tons
(000s)
|
||||||||||||||||||||||||
|
|
Proven Reserves (1)(2) Tons (000s)
|
Probable Reserves (1)(2) Tons
(000s)
|
Conversion Factor (%)
|
Owned
|
Unpatented (3)
|
Leased
|
||||||||||||||||||
|
Limestone
|
||||||||||||||||||||||||
|
Adams, MA
|
7,178
|
1,081
|
57
|
%
|
8,259
|
—
|
—
|
|||||||||||||||||
|
Canaan, CT
|
13,742
|
4,021
|
89
|
%
|
17,763
|
—
|
—
|
|||||||||||||||||
|
Lucerne Valley, CA
|
30,088
|
9,198
|
95
|
%
|
39,286
|
—
|
—
|
|||||||||||||||||
|
Pima County, AZ
|
7,243
|
—
|
90
|
%
|
—
|
7,243
|
—
|
|||||||||||||||||
|
Total Limestone
|
58,251
|
14,300
|
65,308
|
7,243
|
—
|
|||||||||||||||||||
|
90
|
%
|
10
|
%
|
0
|
%
|
|||||||||||||||||||
|
Talc
|
||||||||||||||||||||||||
|
Dillon, MT
|
711
|
804
|
65
|
%
|
1,109
|
—
|
405
|
|||||||||||||||||
|
73
|
%
|
0
|
%
|
27
|
%
|
|||||||||||||||||||
|
Sodium Bentonite
|
||||||||||||||||||||||||
|
Australia
|
—
|
910
|
80
|
%
|
—
|
—
|
910
|
|||||||||||||||||
|
Belle/Colony, WY/SD
|
31,942
|
24,105
|
77
|
%
|
3,135
|
11,887
|
41,025
|
|||||||||||||||||
|
Lovell, WY
|
31,645
|
2,486
|
87
|
%
|
15,242
|
14,715
|
4,174
|
|||||||||||||||||
|
Other SD, WY, MT
|
43,117
|
29,714
|
77
|
%
|
54,815
|
15,048
|
2,968
|
|||||||||||||||||
|
Total Sodium Bentonite
|
106,704
|
57,215
|
73,192
|
41,650
|
49,077
|
|||||||||||||||||||
|
45
|
%
|
25
|
%
|
30
|
%
|
|||||||||||||||||||
|
Calcium Bentonite
|
||||||||||||||||||||||||
|
Chao Yang, Liaoning, China
|
—
|
557
|
78
|
%
|
—
|
—
|
557
|
|||||||||||||||||
|
Nevada
|
—
|
1,056
|
75
|
%
|
1,012
|
44
|
—
|
|||||||||||||||||
|
Sandy Ridge, AL
|
4,492
|
2,009
|
75
|
%
|
1,839
|
—
|
4,662
|
|||||||||||||||||
|
Slovakia, Lutila
|
4,308
|
395
|
75
|
%
|
—
|
—
|
4,703
|
|||||||||||||||||
|
Turkey, Enez
|
196
|
1,860
|
78
|
%
|
—
|
—
|
2,056
|
|||||||||||||||||
|
Turkey, Usak
|
523
|
498
|
43
|
%
|
—
|
—
|
1,021
|
|||||||||||||||||
|
Turkey, Unye
|
212
|
5,597
|
80
|
%
|
—
|
—
|
5,809
|
|||||||||||||||||
|
Total Calcium Bentonite
|
9,731
|
11,972
|
2,851
|
44
|
18,808
|
|||||||||||||||||||
|
13
|
%
|
—
|
87
|
%
|
||||||||||||||||||||
|
Leonardite
|
||||||||||||||||||||||||
|
Gascoyne, ND
|
120
|
2,312
|
67
|
%
|
—
|
2,312
|
120
|
|||||||||||||||||
|
0
|
%
|
95
|
%
|
5
|
%
|
|||||||||||||||||||
|
Chromite
|
||||||||||||||||||||||||
|
South Africa
|
2,465
|
649
|
75
|
%
|
—
|
—
|
3,114
|
|||||||||||||||||
|
0
|
%
|
0
|
%
|
100
|
%
|
|||||||||||||||||||
|
GRAND TOTALS
|
177,982
|
87,252
|
142,460
|
51,249
|
71,524
|
|||||||||||||||||||
|
54
|
%
|
19
|
%
|
27
|
%
|
|||||||||||||||||||
|
(1)
|
Certain definitions:
|
The term "mineral reserve" represents an estimate of tonnage and grade or quality of indicated and measured mineral resources that can be the basis of an economically viable project.
The term "proven mineral reserve" represents the economically mineable part of a measured mineral resource and can only result from conversion of a measured mineral resource.
The term "probable mineral reserve" represents the economically mineable part of an indicated and, in some cases a measured mineral resource.
| (2) |
Mineral reserves estimates were calculated and prepared by the Company's in-house technical staff.
|
| (3) |
Quantity of reserves that would be owned if patent was granted.
|
Measured, Indicated and Inferred Resources
The following table sets forth the Company’s measured, indicated and inferred resources by major minerals category at December 31, 2022.
|
Total Resources (1)(2)
Tons (000s)
|
||||||||||||||||||||||||||||
|
|
Measured Resources (1)(2)
Tons (000s)
|
Indicated Resources (1)(2)
Tons (000s)
|
Measured and Indicated (1)(2) Resources
Tons (000s)
|
Inferred (1)(2) Resources
Tons (000s)
|
Owned
|
Unpatented (3)
|
Leased
|
|||||||||||||||||||||
|
Limestone
|
||||||||||||||||||||||||||||
|
Adams, MA
|
12,555
|
1,891
|
14,446
|
583
|
15,029
|
—
|
—
|
|||||||||||||||||||||
|
Canaan, CT
|
30,996
|
25,460
|
56,456
|
3,674
|
60,130
|
—
|
—
|
|||||||||||||||||||||
|
Lucerne Valley, CA
|
61,014
|
31,874
|
92,888
|
7,247
|
100,135
|
—
|
—
|
|||||||||||||||||||||
|
Pima County, AZ
|
—
|
—
|
—
|
—
|
—
|
—
|
—
|
|||||||||||||||||||||
|
Total Limestone
|
104,565
|
59,225
|
163,790
|
11,504
|
175,294
|
—
|
—
|
|||||||||||||||||||||
|
100
|
%
|
0
|
%
|
0
|
%
|
|||||||||||||||||||||||
|
Talc
|
||||||||||||||||||||||||||||
|
Dillon, MT
|
955
|
1,231
|
2,186
|
1,077
|
2,628
|
—
|
635
|
|||||||||||||||||||||
|
81
|
%
|
0
|
%
|
19
|
%
|
|||||||||||||||||||||||
|
Sodium Bentonite
|
||||||||||||||||||||||||||||
|
Australia
|
—
|
1,206
|
1,206
|
—
|
—
|
—
|
1,206
|
|||||||||||||||||||||
|
Belle/Colony, WY/SD
|
8,818
|
6,977
|
15,794
|
94
|
556
|
8,141
|
7,193
|
|||||||||||||||||||||
|
Lovell, WY
|
410
|
57
|
467
|
3,146
|
1,076
|
2,410
|
127
|
|||||||||||||||||||||
|
Other SD, WY, MT
|
4,612
|
—
|
4,612
|
11,030
|
—
|
15,642
|
—
|
|||||||||||||||||||||
|
Total Sodium Bentonite
|
13,840
|
8,240
|
22,079
|
14,270
|
1,631
|
26,193
|
8,526
|
|||||||||||||||||||||
|
5
|
%
|
72
|
%
|
23
|
%
|
|||||||||||||||||||||||
|
Calcium Bentonite
|
||||||||||||||||||||||||||||
|
Chao Yang, Liaoning, China
|
—
|
300
|
300
|
787
|
—
|
—
|
1,087
|
|||||||||||||||||||||
|
Nevada
|
—
|
—
|
—
|
—
|
—
|
—
|
—
|
|||||||||||||||||||||
|
Sandy Ridge, AL
|
195
|
907
|
1,102
|
—
|
—
|
—
|
1,102
|
|||||||||||||||||||||
|
Slovakia, Lutila
|
—
|
3,470
|
3,470
|
—
|
—
|
—
|
3,470
|
|||||||||||||||||||||
|
Turkey, Enez
|
750
|
—
|
750
|
1,192
|
—
|
—
|
1,942
|
|||||||||||||||||||||
|
Turkey, Usak
|
449
|
—
|
449
|
—
|
—
|
—
|
449
|
|||||||||||||||||||||
|
Turkey, Unye
|
—
|
1,320
|
1,320
|
21,000
|
—
|
—
|
22,320
|
|||||||||||||||||||||
|
Total Calcium Bentonite
|
1,394
|
5,997
|
7,391
|
22,979
|
—
|
—
|
30,370
|
|||||||||||||||||||||
|
0
|
%
|
0
|
%
|
100
|
%
|
|||||||||||||||||||||||
|
Leonardite
|
||||||||||||||||||||||||||||
|
Gascoyne, ND
|
1,435
|
—
|
1,435
|
790
|
—
|
—
|
2,225
|
|||||||||||||||||||||
|
0
|
%
|
0
|
%
|
100
|
%
|
|||||||||||||||||||||||
|
Chromite
|
||||||||||||||||||||||||||||
|
South Africa
|
800
|
584
|
1,384
|
7,093
|
—
|
—
|
8,477
|
|||||||||||||||||||||
|
0
|
%
|
0
|
%
|
100
|
%
|
|||||||||||||||||||||||
|
Other
|
||||||||||||||||||||||||||||
|
Nevada
|
—
|
2,997
|
2,997
|
3,031
|
—
|
6,028
|
—
|
|||||||||||||||||||||
|
0
|
%
|
100
|
%
|
0
|
%
|
|||||||||||||||||||||||
|
GRAND TOTALS
|
122,989
|
78,274
|
201,262
|
60,744
|
179,553
|
32,221
|
50,233
|
|||||||||||||||||||||
|
69
|
%
|
12
|
%
|
19
|
%
|
|||||||||||||||||||||||
|
(1)
|
Certain definitions:
|
The term " mineral resource" indicates a concentration or occurrence of material of economic interest in or on the Earth's crust in such form, grade or quality, and quantity that there are reasonable prospects for economic extraction.
The term "measured resource" indicates a mineral resource for which quantity and grade or quality are estimated based on conclusive geological evidence and sampling.
The term "indicated resource" indicates a mineral resource for which quantity and grade or quality are estimated based on adequate geological evidence and sampling.
The term "inferred resource" indicates a mineral resource for which quantity and grade or quality are estimated based on limited geological evidence and sampling.
| (2) |
Mineral resources estimates were calculated and prepared by the Company's in-house technical staff.
|
| (3) |
Quantity of resources that would be owned if patent was granted.
|
The estimates of total reserves and resources noted in the tables above require the Company to make certain key assumptions. These assumptions relate to consistency of deposits in relation to drilling samples obtained with respect to both quantity and quality of reserves contained therein; the ratio of overburden to mineral deposits; any environmental or social impact of mining the minerals; and profitability of extracting those minerals, including haul distance to processing plants, applicability of minerals to various end markets and selling prices within those markets, and our past experiences in the deposits, several of which we have been operating in for many decades.
The Company maintains a Mining Lead Team that develops standards and systems to ensure Company-wide use of best practices for mining and exploration practices. The Mining Lead Team ensures that the Company maintains robust controls over its exploration and resource and reserve estimation efforts. In particular, because the Company has a long history of operations at its mining operations, the Company is able to continuously validate its resource and reserve estimates by reference to actual production from each mine. During the process from exploration to final production, ore is tested a minimum of 3 times beginning with exploration drilling, again after overburden removal and finally on finished products after plant processing. In some cases when blending ore grades, an additional step of testing occurs on stockpiles after hauling from the mine but before plant processing. The quantities, qualities, and costs of grades obtained from mining and processing are reconciled to quantities, qualities, and costs from reserve estimates and mine models. To enable additional verification of reserves if needed, all exploration samples are retained until areas are mined out and reclaimed.
The Company believes that its facilities, which are of varying ages and are of different construction types, have been satisfactorily maintained, are in good condition, are suitable for the Company's operations and generally provide sufficient capacity to meet the Company's production requirements. Based on past loss experience, the Company believes it is adequately insured with respect to these assets and for liabilities likely to arise from its operations.
The Company holds numerous environmental and mineral extraction permits, water rights and other permits, licenses and approvals from governmental authorities authorizing operations at each of our mines. Permits, licenses and approvals are obtained as needed in the normal course of business based on our mine plans and applicable regulatory provisions regarding mine permitting and licensing. Based on our historical permitting experience, we expect to be able to continue to obtain necessary mining permits and approvals to support historical rates of production.
Assuming the continuation of 2022 annualized usage rates, the Company has reserves of commercially usable sodium bentonite for the next 52 years, commercially usable calcium bentonite for the next 22 years and commercially usable leonardite for more than 75 years. At current usage levels, the Company has reserves in excess of 30 years at its limestone production facilities and in excess of 11 years at the Company's subsidiary Barretts Minerals Inc.'s talc production facility.
The Company has ongoing exploration and development activities for all of its mineral interests with the intent to increase its proven and probable reserves.
From time to time, the Company and its subsidiaries are the subject of various legal actions and claims arising in the ordinary course of their businesses. Additional information regarding legal proceedings is disclosed in Note 17 to the consolidated financial statements included elsewhere in this report, which disclosure is incorporated herein by reference.
The information concerning mine safety violations or other regulatory matters required by Section 1503(a) of the Dodd-Frank Wall Street Reform and Consumer Protection Act and Item 104 of Regulation S-K is included in Exhibit 95 to this Annual Report on Form 10-K.
Information About Our Executive Officers
Set forth below are the names and ages of all Executive Officers of the Registrant indicating all positions and offices with the Registrant held by each such person, and each such person's principal occupations or employment during the past five years.
|
Name
|
Age
|
Position
|
||
|
Douglas T. Dietrich
|
53
|
Chairman of the Board and Chief Executive Officer
|
||
|
Erik C. Aldag
|
40
|
Senior Vice President, Finance and Treasury, and Chief Financial Officer
|
||
|
Brett Argirakis
|
58
|
Group President, Performance Materials and Refractories
|
||
|
Michael A. Cipolla
|
65
|
Vice President, Corporate Controller and Chief Accounting Officer
|
||
|
Erin N. Cutler
|
35
|
Vice President, Human Resources
|
||
|
Jonathan J. Hastings
|
60
|
Senior Vice President, Strategy and M&A
|
||
|
Timothy J. Jordan
|
48
|
Vice President, General Counsel, Secretary and Chief Compliance Officer
|
||
|
D.J. Monagle, III
|
60
|
Group President, Specialty Minerals and Household and Personal Care
|
Douglas T. Dietrich was elected Chairman of the Board in March 2021. He has served as the Chief Executive Officer since December 2016. He joined the Company in August 2007 as Vice President, Corporate Development and Treasury, and was appointed Senior Vice President, Finance and Treasury, Chief Financial Officer effective January 2011. Prior to joining the Company, Mr. Dietrich was Vice President, Alcoa Wheel Products since 2006 and President, Alcoa Latin America Extrusions and Global Rod and Bar Products since 2002.
Erik C. Aldag was named Senior Vice President, Finance and Treasury, and Chief Financial Officer effective November 2022. Mr. Aldag joined the Company in 2017 as Director of Financial Analysis and Planning and assumed the role of Investor Relations in 2020. Mr. Aldag has led finance teams in the U.S. and internationally in companies serving both consumer and industrial markets, as Finance Director of The Chia Co., and in various positions at Alcoa Inc.
Brett Argirakis was named Group President, Performance Materials and Refractories in January 2023. Prior to that he was Senior Vice President and Managing Director, Minteq International Inc. and MTI Global Supply Chain effective December 2020, and Vice President and Managing Director, Minteq International effective in 2016 with additional responsibility for MTI Global Supply Chain given in October 2019. Mr. Argirakis joined the Company in 1987 and has held positions of increasing responsibility. Prior to his current position, he was Global Vice President & General Manager, Refractories effective August 2009. Prior to that, he served as Director, Marketing, Minteq Europe and as Director of Sales and Field Operations for Minteq U.S.
Michael A. Cipolla was named Vice President, Corporate Controller and Chief Accounting Officer in July 2003. Prior to that, he served as Corporate Controller and Chief Accounting Officer of the Company since 1998. From 1992 to 1998 he served as Assistant Corporate Controller of the Company.
Erin N. Cutler was named Vice President, Human Resources effective August 2020. Prior to that, she was Director, Talent Management, where she led major human resources initiatives including enhancing talent management and succession practices, strengthening talent acquisition efforts, and building talent development programs through the creation and deployment of internship and mentorship programs. Prior to joining the Company in July 2015, she was employed by Pratt Industries where she held multiple human resource positions of increasing responsibility.
Jonathan J. Hastings was named Senior Vice President, Strategy and M&A in January 2023. Prior to that, he was Group President, Performance Materials effective June 2018. He joined the Company in September 2011 as Vice President, Corporate Development, and was appointed Senior Vice President, Corporate Development effective April 2013. Prior to joining the Company, he was Senior Director of Strategy and New Business Development – Coatings, Global at The Dow Chemical Company. Prior to that he held positions of increasing responsibility at Rohm and Haas, including Vice President & General Manager – Packaging and Building Materials – Europe.
Timothy J. Jordan was named Vice President, General Counsel, Secretary and Chief Compliance Officer effective January 2023. He joined the Company in 2008 managing all legal aspects of the organization and providing legal support to all corporate functions, as well as, commercial, environmental/regulatory and supply chain activities. Mr. Jordan possesses global expertise in designing, negotiating and implementing complex packages inclusive of joint venture, long-term manufacturing/supply, sourcing, construction, real estate and technology licensing agreements.
D.J. Monagle III was named Group President, Specialty Minerals, Household and Personal care in January 2023. Prior to that he was Group President, Specialty Minerals and Refractories effective March 2017 and Senior Vice President, Chief Operating Officer – Specialty Minerals Inc. and Minteq Group, effective February 2014. He joined the Company in January of 2003 and held positions of increasing responsibility including Senior Vice President and Managing Director, Paper PCC; Vice President and Managing Director - Performance Minerals; Vice President, Americas, Paper PCC; and Global Marketing Director, Paper PCC. Before joining the Company, Mr. Monagle worked for the Paper Technology Group at Hercules between 1990 and 2003, where he held sales and marketing positions of increasing responsibility. Between 1985 and 1990, he served as an aviation officer in the U.S. Army’s 11th Armored Cavalry Regiment, leaving the service as a troop commander with a rank of Captain.
PART II
Item 5. Market for Registrant's Common Equity, Related Stockholder Matters and Issuer Purchases of Equity Securities
Market Information
The Company's common stock is traded on the New York Stock Exchange under the symbol "MTX".
Holders
On February 3, 2023 there were approximately 186 holders of record of the common stock.
Issuer Purchases of Equity Securities
On October 20, 2021, the Company's Board of Directors authorized the Company's management to repurchase, at its discretion, up to $75 million of the Company's shares over a one-year period. There were no share repurchases under this program in the fourth quarter of 2022. Over this program's one-year period, 1,027,768 shares were repurchased for $67.8 million, or an average price of approximately $65.99 per share. This program is now complete.
Performance Graph
The graph below compares Minerals Technologies Inc.'s cumulative 5-year total shareholder return on common stock with the cumulative total returns of the S&P 500 index, the Dow Jones US Industrials index, the S&P Midcap 400 index, the Dow Jones US Basic Materials index, and the S&P MidCap 400 Materials Sector. The graph tracks the performance of a $100 investment in our common stock and in each index (with the reinvestment of all dividends) from 12/31/2017 to 12/31/2022.
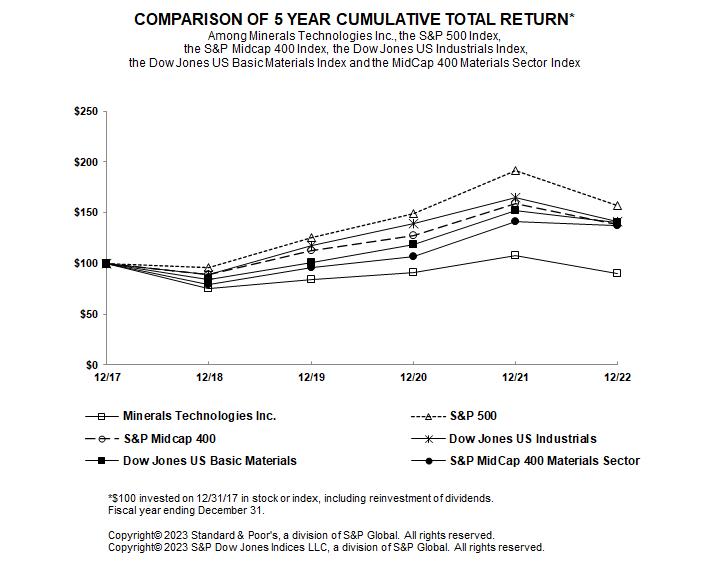
|
|
2017
|
2018
|
2019
|
2020
|
2021
|
2022
|
||||||||||||||||||
|
Minerals Technologies Inc.
|
$
|
100.00
|
$
|
74.79
|
$
|
84.27
|
$
|
91.18
|
$
|
107.65
|
$
|
89.64
|
||||||||||||
|
S&P 500
|
100.00
|
95.62
|
125.72
|
148.85
|
191.58
|
156.89
|
||||||||||||||||||
|
S&P Midcap 400
|
100.00
|
88.92
|
112.21
|
127.54
|
159.12
|
138.34
|
||||||||||||||||||
|
Dow Jones US Industrials
|
100.00
|
88.74
|
117.86
|
138.99
|
164.52
|
141.41
|
||||||||||||||||||
|
Dow Jones US Basic Materials
|
100.00
|
83.83
|
100.39
|
118.78
|
151.78
|
140.30
|
||||||||||||||||||
|
S&P MidCap 400 Materials Sector
|
100.00
|
79.63
|
96.25
|
106.50
|
140.82
|
136.97
|
||||||||||||||||||
The graph below compares Minerals Technologies Inc.'s cumulative 3-year total shareholder return on common stock with the cumulative total returns of the S&P 500 index, the Dow Jones US Industrials index, the S&P Midcap 400 index, the Dow Jones US Basic Materials index, and the S&P MidCap 400 Materials Sector. The graph tracks the performance of a $100 investment in our common stock and in each index (with the reinvestment of all dividends) from 12/31/2019 to 12/31/2022.
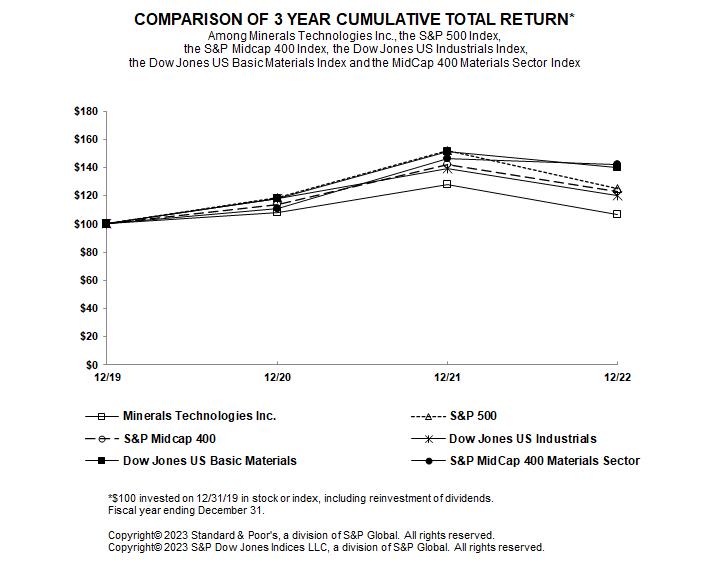
|
|
2019
|
2020
|
2021
|
2022
|
||||||||||||
|
Minerals Technologies Inc.
|
$
|
100.00
|
$
|
108.19
|
$
|
127.74
|
$
|
106.37
|
||||||||
|
S&P 500
|
100.00
|
118.40
|
152.39
|
124.79
|
||||||||||||
|
S&P Midcap 400
|
100.00
|
113.66
|
141.80
|
123.28
|
||||||||||||
|
Dow Jones US Industrials
|
100.00
|
117.92
|
139.58
|
119.98
|
||||||||||||
|
Dow Jones US Basic Materials
|
100.00
|
118.32
|
151.20
|
139.75
|
||||||||||||
|
S&P MidCap 400 Materials Sector
|
100.00
|
110.65
|
146.30
|
142.31
|
||||||||||||
The graph below compares Minerals Technologies Inc.'s cumulative 1-year total shareholder return on common stock with the cumulative total returns of the S&P 500 index, the Dow Jones US Industrials index, the S&P Midcap 400 index, the Dow Jones US Basic Materials index, and the S&P MidCap 400 Materials Sector. The graph tracks the performance of a $100 investment in our common stock and in each index (with the reinvestment of all dividends) from 12/31/2021 to 12/31/2022.
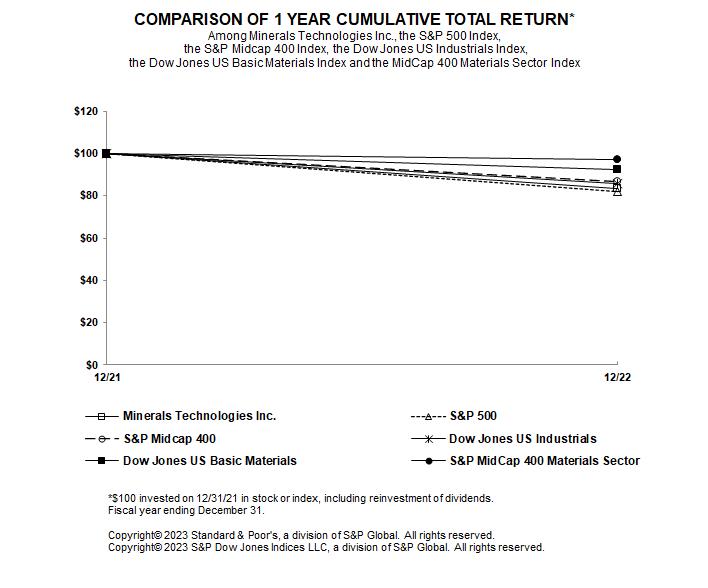
|
|
2021
|
2022
|
||||||
|
Minerals Technologies Inc.
|
$
|
100.00
|
$
|
83.27
|
||||
|
S&P 500
|
100.00
|
81.89
|
||||||
|
S&P Midcap 400
|
100.00
|
86.94
|
||||||
|
Dow Jones US Industrials
|
100.00
|
85.96
|
||||||
|
Dow Jones US Basic Materials
|
100.00
|
92.43
|
||||||
|
S&P MidCap 400 Materials Sector
|
100.00
|
97.27
|
||||||
Item 6. [Reserved]
Cautionary Statement for “Safe Harbor” Purposes under the Private Securities Litigation Reform Act of 1995
The Private Securities Litigation Reform Act of 1995 provides a safe harbor for forward-looking statements made by or on behalf of the Company. This report contains statements that the Company believes may be “forward-looking statements” within the meaning of Section 21E of the Securities Exchange Act of 1934, particularly statements relating to the Company’s objectives, plans or goals, future actions, future performance or results of current and anticipated products, sales efforts, expenditures, and financial results. From time to time, the Company also provides forward-looking statements in other publicly-released materials, both written and oral. Forward-looking statements provide current expectations and forecasts of future events such as new products, revenues and financial performance, and are not limited to describing historical or current facts. They can be identified by the use of words such as “outlook,” “forecast,” “believes,” “expects,” “plans,” “intends,” “anticipates,” and other words and phrases of similar meaning.
Forward-looking statements are necessarily based on assumptions, estimates and limited information available at the time they are made. A broad variety of risks and uncertainties, both known and unknown, as well as the inaccuracy of assumptions and estimates, can affect the realization of the expectations or forecasts in these statements. Many of these risks and uncertainties are difficult to predict or are beyond the Company’s control. Consequently, no forward-looking statements can be guaranteed. Actual future results may vary materially. Significant factors affecting the expectations and forecasts are set forth under “Item 1A — Risk Factors” in this Annual Report on Form 10-K.
The Company undertakes no obligation to update any forward-looking statements to reflect events or circumstances that arise after the date hereof. Investors should refer to the Company's subsequent filings under the Securities Exchange Act of 1934 for further disclosures.
Executive Summary
Worldwide sales increased 14% in 2022 to $2.126 billion as compared with $1.858 billion in 2021. Foreign exchange had an unfavorable impact on sales of $100 million or 6%. Consolidated income from operations was $214.8 million, as compared with $235.7 million in the prior year. Included in income from operations for 2022 was $32.6 million recorded for litigation costs to defend against, opportunistically settle, and establish a reserve for claims associated with certain talc products from the Company's Barretts Minerals Inc. subsidiary and $5.1 million of acquisition related transaction and integration costs. Included in income from operations in 2021 was
$
1.1
million for assets write-downs and severance-related costs and $
4.0
million of acquisition related transaction and integration costs.
Net income was $122.2 million in 2022, as compared to $164.4 million in the prior year. The Company reported diluted earnings of $3.73 per share in 2022 as compared with $4.86 per share in the prior year.
The Company refinanced its revolving credit facility and term loan in the third quarter of 2022, extending out maturities to 2027. In connection with the refinancing, the Company incurred $6.9 million of debt extinguishment expenses.
In 2022, the Company continued to execute on its key growth initiatives driven by multi-year advancements in new product development, of geographic penetration, and growth from acquisitions. On April 29, 2022, the Company completed the acquisition of Concept Pet, a European supplier of pet litter products. The purchase of Concept Pet supports the expansion of our European pet care business as well as providing additional mineral reserves.
Our balance sheet continues to be strong. Cash, cash equivalents and short-term investments were $252.8 million as of December 31, 2022. Cash flow from operations for 2022 was $105.7 million. The Company currently has more than $400 million of available liquidity, including cash on hand, as well as availability under its revolving credit facility. We believe these factors will allow us to meet our anticipated funding requirements. Our intention is to maintain a balanced approach to capital deployment, by using cash flow for investments in growth and continued debt reduction.
Outlook
The Company will continue to focus on innovation and new product development and other opportunities for sales growth in 2023 from its existing businesses, as follows:
| ● |
Increase our presence and gain penetration of our bentonite-based foundry customers for the Metalcasting industry in emerging markets, such as China and India.
|
| ● |
Increase our presence and market share in global pet care products, particularly in emerging markets.
|
| ● |
Deploy new products in pet care such as lightweight litter.
|
| ● |
Increase our presence and market share in Asia and in the global powdered detergent market.
|
| ● |
Continue the development of our FLUORO-SORB
®
products which remediate contamination of Per-and polyflouroalkyl substances (PFAS) and Perflourooctane sulfanate (PFOS).
|
| ● |
Pursue opportunities for our products in environmental and building and construction markets in the Middle East, Asia Pacific and South America regions.
|
| ● |
Increase our presence and market share for geosynthetic clay liners within the Environmental Products product line.
|
| ● |
Continue the development of our proprietary products for agricultural applications worldwide.
|
| ● |
Develop multiple high-filler technologies under
the
FulFill
®
platform of products, to increase the fill rate in freesheet paper and continue to progress with commercial discussions and full-scale paper machine trials.
|
| ● |
Develop products and processes for waste management and recycling opportunities to reduce the environmental impact of the paper mill, reduce energy consumption and improve the sustainability of the papermaking process, including our NewYield
®
and ENVIROFIL
®
products.
|
| ● |
Further penetration into the packaging segment of the paper industry.
|
| ● |
Increase our sales of PCC for paper by further penetration of the markets for paper filling at both freesheet and groundwood mills, particularly in emerging markets.
|
| ● |
Expand the Company’s PCC coating product line using the satellite model.
|
| ● |
Promote the Company’s expertise in crystal engineering, especially in helping papermakers customize PCC morphologies for specific paper applications.
|
| ● |
Expand PCC produced for paper filling applications by working with industry partners to develop new methods to increase the ratio of PCC for fiber substitutions.
|
| ● |
Develop unique mineral products used in the manufacture of novel biopolymers, a new market opportunity.
|
| ● |
Deploy new mineral products in paint, coating and packaging applications.
|
| ● |
Deploy value-added formulations of refractory materials that not only reduce costs but improve performance.
|
| ● |
Deploy our laser measurement technologies into new applications.
|
| ● |
Expand our refractory maintenance model to other steel makers globally.
|
| ● |
Deploy operational excellence principles into all aspects of the organization, including system infrastructure and lean principles.
|
| ● |
Continue to explore selective acquisitions to fit our core competencies in minerals and fine particle technology.
|
However, there can be no assurance that we will achieve success in implementing any one or more of these opportunities.
Results of Operations
Consolidated Income Statement Review
|
|
Year Ended December 31,
|
|||||||||||||||||||
|
(millions of dollars)
|
2022
|
2021
|
2020
|
2022 vs. 2021
|
2021 vs. 2020
|
|||||||||||||||
|
Net sales
|
$
|
2,125.5
|
$
|
1,858.3
|
$
|
1,594.8
|
14.4
|
%
|
16.5
|
%
|
||||||||||
|
Cost of sales
|
1,660.5
|
1,411.8
|
1,189.4
|
17.6
|
%
|
18.7
|
%
|
|||||||||||||
|
Production margin
|
465.0
|
446.5
|
405.4
|
4.1
|
%
|
10.1
|
%
|
|||||||||||||
|
Production margin %
|
21.9
|
%
|
24.0
|
%
|
25.4
|
%
|
||||||||||||||
|
Marketing and administrative expenses
|
192.1
|
186.2
|
176.5
|
3.2
|
%
|
5.5
|
%
|
|||||||||||||
|
Research and development expenses
|
20.4
|
19.5
|
19.9
|
4.6
|
%
|
(2.0
|
)%
|
|||||||||||||
|
Acquisition related transaction and integration costs
|
5.1
|
4.0
|
3.1
|
27.5
|
%
|
29.0
|
%
|
|||||||||||||
|
Litigation costs
|
32.6
|
—
|
10.4
|
*
|
*
|
|||||||||||||||
|
Restructuring and other items, net
|
-
|
1.1
|
7.6
|
*
|
(85.5
|
)%
|
||||||||||||||
|
Income from operations
|
214.8
|
235.7
|
187.9
|
(8.9
|
)%
|
25.4
|
%
|
|||||||||||||
|
Operating margin %
|
10.1
|
%
|
12.7
|
%
|
11.8
|
%
|
||||||||||||||
|
Interest expense, net
|
(43.9
|
)
|
(37.2
|
)
|
(38.2
|
)
|
18.0
|
%
|
(2.6
|
)%
|
||||||||||
|
Debt extinguishment expenses
|
(6.9
|
)
|
—
|
—
|
*
|
*
|
||||||||||||||
|
Non-cash pension settlement charge
|
(3.5
|
)
|
(1.8
|
)
|
(6.4
|
)
|
94.4
|
%
|
(71.9
|
)%
|
||||||||||
|
Other non-operating income (deductions), net
|
(3.8
|
)
|
5.6
|
(5.3
|
)
|
*
|
*
|
|||||||||||||
|
Total non-operating deductions, net
|
(58.1
|
)
|
(33.4
|
)
|
(49.9
|
)
|
74.0
|
%
|
(33.1
|
)%
|
||||||||||
|
Income before tax and equity in earnings
|
156.7
|
202.3
|
138.0
|
(22.5
|
)%
|
46.6
|
%
|
|||||||||||||
|
Provision for taxes on income
|
32.1
|
36.6
|
24.4
|
(12.3
|
)%
|
50.0
|
%
|
|||||||||||||
|
Effective tax rate
|
20.5
|
%
|
18.1
|
%
|
17.7
|
%
|
||||||||||||||
|
Equity in earnings of affiliates, net of tax
|
1.7
|
2.8
|
2.2
|
(39.3
|
)%
|
27.3
|
%
|
|||||||||||||
|
Consolidated net income
|
126.3
|
168.5
|
115.8
|
(25.0
|
)%
|
45.5
|
%
|
|||||||||||||
|
Less: Net income attributable to non-controlling interests
|
4.1
|
4.1
|
3.4
|
0.0
|
%
|
20.6
|
%
|
|||||||||||||
|
Net income attributable to Minerals Technologies Inc. (MTI)
|
$
|
122.2
|
$
|
164.4
|
$
|
112.4
|
(25.7
|
)%
|
46.3
|
%
|
||||||||||
* Not meaningful
Net Sales
|
|
Year Ended December 31,
|
|||||||||||||||||||
|
(millions of dollars)
|
2022
|
2021
|
2020
|
2022 vs. 2021
|
2021 vs. 2020
|
|||||||||||||||
|
U.S.
|
$
|
1,135.6
|
$
|
959.6
|
$
|
822.5
|
18.3
|
%
|
16.7
|
%
|
||||||||||
|
International
|
989.9
|
898.7
|
772.3
|
10.1
|
%
|
16.4
|
%
|
|||||||||||||
|
Total sales
|
$
|
2,125.5
|
$
|
1,858.3
|
$
|
1,594.8
|
14.4
|
%
|
16.5
|
%
|
||||||||||
|
Performance Materials Segment
|
$
|
1,127.7
|
$
|
976.0
|
$
|
825.8
|
15.5
|
%
|
18.2
|
%
|
||||||||||
|
Specialty Minerals Segment
|
648.4
|
578.9
|
510.9
|
12.0
|
%
|
13.3
|
%
|
|||||||||||||
|
Refractories Segment
|
349.4
|
303.4
|
258.1
|
15.2
|
%
|
17.6
|
%
|
|||||||||||||
|
Total sales
|
$
|
2,125.5
|
$
|
1,858.3
|
$
|
1,594.8
|
14.4
|
%
|
16.5
|
%
|
||||||||||
Worldwide net sales in 2022 increased 14.4% from the previous year to $2,125.5 million. Included in net sales for 2022 are $14.7 million of net sales of Concept Pet and $70.0 million of incremental sales from our Normerica acquisition last year. Foreign exchange had an unfavorable impact on sales of approximately $100 million or 6 percentage points. Net sales in the United States increased 18.3% to $1,135.6 million in 2022 and represented 53.0% of consolidated net sales. International sales increased 10.1% to $989.9 million in 2022 and represented 47.0% of consolidated net sales.
Worldwide net sales in 2021 increased 16.5% from the previous year to $1,858.3 million. Included in net sales for 2021 are $48.6 million of net sales of Normerica. Foreign exchange had a favorable impact on sales of approximately $27 million or 2 percentage point. Net sales in the United States increased 16.7% to $959.6 million in 2021 and represented 52.0% of consolidated net sales. International sales increased 16.4% to $898.7 million in 2021 and represented 48.0% of consolidated net sales.
Operating Costs and Expenses
Consolidated cost of sales was $1,660.5 million, $1,411.8 million and $1,189.4 million in 2022, 2021 and 2020, respectively. Production margin as a percentage of net sales was 21.9% in 2022, 24.0% in 2021 and 25.4% in 2020. Production margin decreased in 2022 primarily due to timing of pricing actions relative to higher inflationary costs, including energy and other manufacturing costs as well as supply chain and logistics challenges.
Marketing and administrative costs were $192.1 million, $186.2 million and $176.5 million in 2022, 2021 and 2020, respectively. Marketing and administrative costs as a percentage of net sales were 9.0% in 2022, 10.0% in 2021 and 11.1% in 2020.
Research and development expenses were $20.4 million, $19.5 million and $19.9 million in 2022, 2021 and 2020, respectively. Research and development expenses as a percentage of net sales were 1.0% in 2022, 1.0% in 2021 and 1.2% in 2020.
In 2022, the Company recorded $32.6 million of litigation costs relating to costs incurred to defend against, opportunistically settle, and establish a reserve for claims associated with certain talc products from the Company's Barretts Minerals Inc. subsidiary. In addition, the Company recorded a $5.1 million charge for
acquisition related transaction and integration costs
.
In
2021
, the Company recorded a $
1.1
million charge for asset write-downs and other restructuring costs and $
4.0
million for acquisition related transaction and integration costs.
In
2020
, the Company recorded a $10.4 million charge related to litigation expenses associated with the bankruptcy of Novinda Corp. In addition, the Company recorded a $7.6 million charge for asset write-downs and other restructuring cost and $3.1 million for acquisition related transaction and integration costs.
Income from Operations
During 2022, the Company recorded income from operations of $214.8 million, as compared with $235.7 million in the prior year. Income from operations represented 10.1% of sales compared with 12.7% of sales in the prior year. Income from operations in 2022 included a $32.6 million charge for litigation costs relating to costs incurred to defend against, opportunistically settle, and establish a reserve for claims associated with certain talc products from the Company's Barretts Minerals Inc. subsidiary and a $5.1 million charge for
acquisition related transaction and integration costs
.
During 2021, the Company recorded income from operations of $235.7 million, as compared with $187.9 million in the prior year. Income from operations represented 12.7% of sales compared with 11.8% of sales in the prior year. Income from operations in 2021 included
$
1.1
million for asset write-downs and severance-related costs and $
4.0
million of acquisition related transaction and integration costs.
Non-Operating Income (Deductions)
The Company recorded non-operating deductions, net of $58.1 million in 2022 as compared with $33.4 million in the previous year.
Included in non-operating deductions was net interest expense of $43.9 million in 2022 as compared to $37.2 million in the prior year, primarily due to higher interest rates. The Company recorded debt extinguishment expenses of $6.9 million related to the refinancing of its credit facilities. In addition, the Company recorded a non-cash pension settlement charge of $3.5 million relating to some of the Company's retirement plans in the United States.
Included in non-operating deductions was net interest expense of $
37.2
million in
2021
as compared to $
38.2
million in the prior year,
primarily due to lower interest rates
. Additionally, the Company recorded at $
1.8
million non-cash pension settlement charge relating to one of the Company's retirement plans in the United States.
Provision for Taxes on Income
Provision for taxes was $32.1 million, $36.6 million and $24.4 million in 2022, 2021 and 2020, respectively. The effective tax rates were 20.5%, 18.1% and 17.7% during 2022, 2021 and 2020, respectively.
The U.S. Tax Cuts and Jobs Act ("U.S. Tax Reform) legislation, enacted in December 2017, established several significant changes the U.S. tax code, such as a new Global Intangible Low-Tax Income provision (“GILTI”) that currently taxes certain income from foreign operations and Foreign-Derived Intangible Income ("FDII") which is the portion of a domestic corporation's intangible income that is derived from serving foreign jurisdictions.
The higher effective tax rate in 2022 as compared to 2021 was primarily due to the impact of GILTI and the 162(m) disallowance. The higher effective tax rate in 2021 as compared to 2020 was primarily due to tax credits in the prior year resulting from the expiration of a tax statute of limitations.
The other factors having the most significant impact on our effective tax rates in recent periods are the rate differentials related to foreign earnings indefinitely invested, percentage depletion, GILTI, FDII and the tax benefits on restructuring and impairment charges at a higher rate.
Percentage depletion allowances (tax deductions for depletion that may exceed our tax basis in our mineral reserves) are available to us under the income tax laws of the United States for operations conducted in the United States. The tax benefits from percentage depletion were $9.6 million in 2022, $10.9 million in 2021 and $8.5 million in 2020.
The Company has elected, as its accounting policy, to treat the taxes due from GILTI as a current period expense when incurred. The net charge to the Company for GILTI was $3.5 million, $1.2 million and $0.6 million for 2022, 2021 and 2020, respectively.
We operate in various countries around the world that have tax laws, tax incentives and tax rates that are significantly different than those of the United States. These differences combine to move our overall effective tax rate higher or lower than the United States statutory rate depending on the mix of income relative to income earned in the United States. The effects of foreign earnings and the related foreign rate differentials resulted in increases of $3.8 million, $5.2 million and $4.6 million in 2022, 2021 and 2020, respectively.
Consolidated Net Income Attributable to MTI Shareholders
Consolidated net income was $126.3 million in 2022 and included a $37.9 million charge, net of tax. This charge consisted of litigation costs, acquisition related transaction and integration costs, debt extinguishment expenses and a non-cash pension settlement charge.
Consolidated net income was $168.5 million in 2021 and included a $5.3 million charge, net of tax. This charge consisted of asset write-downs, severance-related costs, acquisition-related transaction and integration costs and a non-cash pension settlement charge.
Segment Review
The following discussions highlight the operating results for each of our three segments.
Performance Materials Segment
|
|
Year Ended December 31,
|
|||||||||||||||||||
|
(millions of dollars)
|
2022
|
2021
|
2020
|
2022 vs. 2021
|
2021 vs. 2020
|
|||||||||||||||
|
Net Sales
|
||||||||||||||||||||
|
Household, Personal Care & Specialty Products
|
$
|
560.9
|
$
|
460.5
|
$
|
380.2
|
$
|
100.4
|
$
|
80.3
|
||||||||||
|
Metalcasting
|
334.0
|
319.2
|
258.1
|
14.8
|
61.1
|
|||||||||||||||
|
Environmental Products
|
174.1
|
136.3
|
131.6
|
37.8
|
4.7
|
|||||||||||||||
|
Building Materials
|
58.7
|
60.0
|
55.9
|
(1.3
|
)
|
4.1
|
||||||||||||||
|
Total net sales
|
$
|
1,127.7
|
$
|
976.0
|
$
|
825.8
|
$
|
151.7
|
$
|
150.2
|
||||||||||
|
Income from operations
|
$
|
127.2
|
$
|
125.0
|
$
|
108.8
|
$
|
2.2
|
$
|
16.2
|
||||||||||
|
% of net sales
|
11.3
|
%
|
12.8
|
%
|
13.2
|
%
|
||||||||||||||
2022
v
2021
Net sales in the Performance Materials segment increased 15.5% to $1,127.7 million as compared with $976.0 in the prior year. Household, Personal Care & Specialty Products sales increased 21.8% to $560.9 million from $460.5 million the prior year. This increase is driven by strong demand for consumer-oriented products and the acquisition of Concept Pet. Included within 2022 net sales for Household, Personal Care & Specialty Products are $14.7 million of net sales for Concept Pet and $70.0 million of incremental sales from our Normerica acquisition last year. Metalcasting’s sales increased 4.6% from $319.2 million in the prior year to $334.0 million in 2022, as strength in North America and the rest of the world offset weakness in China due to COVID-19 related restrictions and shutdowns. Environmental Products sales grew 27.7% on strength in remediation, wastewater and filtration activity. Building Materials sales were 2% lower than prior year on timing of projects.
Income from operations increased $2.2 million, or 14.9% to $127.2 million in 2022 and represented 11.3% of net sales as compared to $125.0 million and 12.8% of sales in 2021. Margin was impacted by the timing of pricing actions relative to inflationary cost increases and supply chain and logistics issues.
2021
v
2020
Net sales in the Performance Materials segment increased 18.2% to $976.0 million as compared with $825.8 in the prior year. Household, Personal Care & Specialty Products sales increased 21.1% to $460.5 million from $380.2 million the prior year. Included within 2021 net sales for Household, Personal Care & Specialty Products are $48.6 million of net sales for Normerica. The acquisition of Normerica contributed 13 percent growth versus prior year. In addition, organic sales contributed an additional 8 percent driven by strong demand for consumer-oriented products. Metalcasting’s sales increased 23.7% from $258.1 million in the prior year to $319.2 million in 2021, primarily due to increased foundry demand across a diverse set of foundry customer end markets and continued penetration in Asia. Environmental Products and Building Materials sales grew 3.6% and 7.3%, respectively on higher levels of project activity that yielded an increase in sales from the prior year of $4.7 million and $4.1 million, respectively.
Income from operations increased $16.2 million, or 14.9% to $125.0 million in 2021 and represented 12.8% of net sales as compared to $108.8 million and 13.2% of sales in 2020. Margin was impacted by the timing of pricing actions relative to inflationary cost increases and operational efficiencies.
Specialty Minerals Segment
|
|
Year Ended December 31,
|
|||||||||||||||||||
|
(millions of dollars)
|
2022
|
2021
|
2020
|
2022 vs. 2021
|
2021 vs. 2020
|
|||||||||||||||
|
Net Sales
|
||||||||||||||||||||
|
Paper PCC
|
$
|
381.7
|
$
|
349.7
|
$
|
308.4
|
$
|
32.0
|
$
|
41.3
|
||||||||||
|
Specialty PCC
|
100.4
|
77.1
|
69.3
|
23.3
|
7.8
|
|||||||||||||||
|
PCC Products
|
$
|
482.1
|
$
|
426.8
|
$
|
377.7
|
$
|
55.3
|
$
|
49.1
|
||||||||||
|
Ground Calcium Carbonate
|
$
|
109.1
|
$
|
98.1
|
$
|
89.3
|
$
|
11.0
|
$
|
8.8
|
||||||||||
|
Talc
|
57.2
|
54.0
|
43.9
|
3.2
|
10.1
|
|||||||||||||||
|
Processed Minerals Products
|
$
|
166.3
|
$
|
152.1
|
$
|
133.2
|
$
|
14.2
|
$
|
18.9
|
||||||||||
|
Total net sales
|
$
|
648.4
|
$
|
578.9
|
$
|
510.9
|
$
|
69.5
|
$
|
68.0
|
||||||||||
|
Income from operations
|
$
|
41.3
|
$
|
72.9
|
$
|
67.8
|
$
|
(31.6
|
)
|
$
|
5.1
|
|||||||||
|
% of net sales
|
6.4
|
%
|
12.6
|
%
|
13.3
|
%
|
||||||||||||||
2022
v
2021
Net sales in the Specialty Minerals segment increased 12.0% to $648.4 million in 2022 from $578.9 million in 2021. Worldwide sales of PCC products increased 13.0% to $482.1 million in 2022 from $426.8 million in the prior year due to the ramp-up of new paper and packaging volumes and strong demand for specialty PCC products in construction, automotive and consumer markets. Specialty PCC sales grew 30.2% as compared with prior year. Sales of Processed Minerals products increased 9.3% to $166.3 million in 2022 from $152.1 million in the prior year due to strength in residential construction and automotive markets.
Income from operations decreased $31.6 million, or 43.3% to $41.3 million in 2022 and represented 6.4% of net sales compared to $72.9 million and 12.6% of sales in the prior year. Included in income from operations were $32.6 million relating to costs incurred to defend against, opportunistically settle and establish a reserve for claims associated with certain talc products from the Company's Barretts Minerals Inc. subsidiary. Operating margin was impacted by the timing of contractual and negotiated price increases relative to inflationary cost increases including energy and other manufacturing costs.
2021
v
2020
Net sales in the Specialty Minerals segment increased 13.3% to $578.9 million in 2021 from $510.9 million in 2020. Worldwide sales of PCC products increased 13.0% to $426.8 million in 2021 from $377.7 million in the prior year due to increased paper machine operating rates, as well as the ramp-up of three new satellite plants in China, India and the U.S. Specialty PCC sales grew 11.3% as compared with prior year driven by strength in construction and automotive markets. Sales of Processed Minerals products increased 14.2% to $152.1 million in 2021 from $133.2 million in the prior year as demand from automotive, construction and consumer end markets remained strong.
Income from operations increased $5.1 million, or 7.5% to $72.9 million in 2021 and represented 12.6% of net sales compared to $67.8 million and 13.3% of sales in the prior year. Included in income from operations were $1.1 million of restructuring and impairment costs. Operating margin was impacted by the timing of contractual and negotiated price increases relative to inflationary cost increases including energy and other manufacturing costs. In addition, logistics and labor challenges impacted both sales and operating performance.
Refractories Segment
|
|
Year Ended December 31,
|
|||||||||||||||||||
|
(millions of dollars)
|
2022
|
2021
|
2020
|
2022 vs. 2021
|
2021 vs. 2020
|
|||||||||||||||
|
Net Sales
|
||||||||||||||||||||
|
Refractory Products
|
$
|
273.4
|
$
|
237.1
|
$
|
212.3
|
$
|
36.3
|
$
|
24.8
|
||||||||||
|
Metallurgical Products
|
76.0
|
66.3
|
45.8
|
9.7
|
20.5
|
|||||||||||||||
|
Total net sales
|
$
|
349.4
|
$
|
303.4
|
$
|
258.1
|
$
|
46.0
|
$
|
45.3
|
||||||||||
|
Income from operations
|
$
|
57.6
|
$
|
49.3
|
$
|
35.5
|
$
|
8.3
|
$
|
13.8
|
||||||||||
|
% of net sales
|
16.5
|
%
|
16.2
|
%
|
13.8
|
%
|
||||||||||||||
2022
v
2021
Net sales in the Refractories segment increased 15.2% to $349.4 million in 2022 from $303.4 million in the prior year driven by improved steel market conditions, strong operating performance and new business development.
Income from operations increased $8.3 million, or 16.8% to $57.6 million and represented 16.5% of net sales in 2022 compared to $49.3 million or 16.2% of sales in 2021 due to higher sales volumes from improved steel market conditions, strong operating performance and new business development.
2021
v
2020
Net sales in the Refractories segment increased 17.6% to $303.4 million in 2021 from $258.1 million in the prior year driven by a gradual improvement of steel mill utilization rates.
Sales of refractory products and systems to steel and other industrial applications increased 11.6% to $237.1 million from $212.3 million in the prior year and sales of metallurgical products increased 44.8% to $66.3 million from $45.8 million in the prior year.
Income from operations increased $13.8 million, or 38.9% to $49.3 million and represented 16.2% of net sales in 2021 compared to $35.5 million or 13.8% of sales in 2020 due to higher sales volumes from improved steel market conditions, strong operating performance and new business development.
Inflation
While inflation historically has not had a material impact on the Company, our financial performance was affected in 2022, and could continue to be adversely affected by increases in energy and commodity prices. Our production processes consume a significant amount of energy, primarily electricity, diesel fuel, natural gas and coal. We use diesel fuel to operate our mining and processing equipment and our freight costs are heavily dependent upon fuel prices and surcharges. Energy costs also affect the cost of raw materials. On a combined basis, these factors represent a large exposure to petrochemical and energy products which may be subject to significant price fluctuations. The contracts pursuant to which we construct and operate our satellite PCC plants generally adjust pricing to reflect the pass-through of increases in costs resulting from inflation, including lime and energy prices. However, there is a time lag before such price adjustments can be implemented. The Company and its customers will typically negotiate reasonable price adjustments in order to recover a portion of these escalating costs, but there can be no assurance that we will be able to recover increasing costs through such negotiations.
Cyclical Nature of Customers' Businesses
The portions of our sales within Specialty Minerals, Performance Materials and Refractories segments are to customers in the paper manufacturing, metalcasting, steel manufacturing, oil and gas and construction industries, which have historically been cyclical. The pricing structure of some of our long-term PCC contracts makes our PCC business less sensitive to declines in the quantity of product purchased.
Oil and natural gas prices decreased significantly between 2014 through 2017 and again in 2020, which has caused exploration companies to reduce their capital expenditures and production and exploration activities. This has had the effect of decreasing the demand and increasing competition for the services we provide.
We cannot predict the economic outlook in the countries in which we do business, nor in the key industries we serve.
Liquidity and Capital Resources
Cash provided from continuing operations in 2022 was $105.7 million, compared with $232.4 million in prior year. Cash flows from operations in 2022 were significantly lower than prior year driven by a deliberate, strategic inventory build, the impact of higher pricing on accounts receivable, and inflation on inventory and other assets. Cash flows provided from operations in 2022 were principally used to fund acquisitions and capital expenditures, repay debt, repurchase shares and to pay the Company's dividend to common shareholders. The Company’s intention is to use excess cash flow for investments in growth, continued debt reduction and selective share repurchases.
On August 11, 2022, the Company entered into a Refinancing Facility Agreement (the “Amendment”) to amend the Company’s previous credit agreement (the “Previous Credit Agreement”; the previous credit agreement, as amended by the Amendment, being the “Amended Credit Agreement”). The Amendment provides for, among other things, a new senior secured revolving credit facility with aggregate commitments of $300 million (the “Revolving Facility”), a portion of which may be used for the issuance of letters of credit and swingline loans, and a new senior secured term loan facility with aggregate commitments of $550 million (the “Term Loan Facility” and, together with the Revolving Facility, the “Senior Secured Credit Facilities”). The Revolving Facility and the Term Loan Facility replace the facilities under the Previous Credit Agreement, which provided for, among other things, a $788 million senior secured floating rate term loan facility and a $300 million senior secured revolving credit facility. The maturity date for loans under the Senior Secured Credit Facilities is August 11, 2027.
In the third quarter of 2022, the Company recorded $6.9 million in non-cash debt extinguishment expenses related to the refinancing of our credit facilities, which represents the difference between the redemption payment and the carrying value of the debt at the refinancing date. All lenders under the previous facility were repaid in full.
Loans under the Senior Secured Credit Facilities will bear interest at a rate equal to, at the election of the Company, Term SOFR plus a credit spread adjustment equal to 0.100% plus an applicable margin equal to 1.500% per annum or a base rate plus an applicable margin equal to 0.500% per annum, subject in each case to (a) an increase of 25 basis points in the event that, and for so long as, the net leverage ratio (as defined in the Amended Credit Agreement) is greater than or equal to 3.00 to 1.00 as of the last day of the preceding fiscal quarter, (b) a decrease of 12.5 basis points in the event that, and for so long as, the net leverage ratio is less than 2.00 to 1.00 and greater than or equal to 1.00 to 1.00 as of the last day of the preceding fiscal quarter and (c) an decrease of 25 basis points in the event that, and for so long as, the net leverage ratio is less than 1.00 to 1.00 as of the last day of the preceding fiscal quarter. The Company will pay certain fees under the Amended Credit Agreement, including (a) a commitment fee of 0.250% per annum on the undrawn portion of the Revolving Facility (subject to a step-up to 0.300% and step-downs to 0.175% and 0.150% at the same levels described above), (b) a fronting fee of 0.125% per annum on the average daily undrawn amount of, plus unreimbursed amounts in respect of disbursements under, letters of credit issued under the Revolving Facility and (c) customary annual administration fees. The obligations of the Company under the Senior Secured Credit Facilities are unconditionally guaranteed jointly and severally by, subject to certain exceptions, all material domestic subsidiaries of the Company (the “Guarantors”) and secured, subject to certain exceptions, by a security interest in substantially all of the tangible and intangible assets of the Company and the Guarantors.
As of December 31, 2022, there were $115.0 million in loans and $10.5 million in letters of credit outstanding under the Revolving Facility.
On June 30, 2020, the Company issued $400 million aggregate principal amount of 5.0% Senior Notes due 2028 (the “Notes”). The Notes were issued pursuant to an indenture, dated as of June 30, 2020, between the Company and The Bank of New York Mellon Trust Company, N.A., as trustee (the “Indenture”). The Notes bear an interest rate of 5.0% per annum payable semi-annually on January 1 and July 1 of each year, beginning on January 1, 2021. The Notes are unconditionally guaranteed on a senior unsecured basis by each of the Company’s existing and future wholly owned domestic restricted subsidiaries that is a borrower under or that guarantees the Company’s obligations under its Senior Secured Credit Facilities or that guarantees the Company’s or any of the Company’s wholly owned domestic subsidiaries’ long-term indebtedness in an aggregate amount in excess of $50 million.
At any time and from time to time prior to July 1, 2023, the Company may redeem some or all of the Notes for cash at a redemption price equal to 100% of their principal amount, plus the “make-whole” premium described in the Indenture and accrued and unpaid interest, if any, to, but excluding, the applicable redemption date. Beginning on July 1, 2023, the Company may redeem some or all of the Notes at any time and from time to time at the applicable redemption prices listed in the Indenture, plus accrued and unpaid interest, if any, to, but excluding, the applicable redemption date. In addition, at any time and from time to time prior to July 1, 2023, the Company may redeem up to 40% of the aggregate principal amount of the Notes with funds from one or more equity offerings at a redemption price equal to 105% of the principal amount thereof, plus accrued and unpaid interest, if any, to, but excluding, the applicable redemption date.
If the Company experiences a change of control (as defined in the indenture), the Company is required to offer to repurchase the Notes at 101% of the principal amount of such Notes, plus accrued and unpaid interest, if any, to, but excluding, the date of repurchase.
The Amended Credit Agreement and the Indenture both contain certain customary affirmative and negative covenants that limit or restrict the ability of the Company and its restricted subsidiaries to enter into certain transactions or take certain actions, as well as customary events of default. In addition, the Amended Credit Agreement contains financial covenants that require the Company to maintain, as of the last day of any fiscal quarter, (x) a maximum net leverage ratio (as defined in the Amended Credit Agreement) of 4.00 to 1.00 for the four fiscal quarter period preceding such day (subject to an increase to 5.00 to 1.00 for four quarters in connection with certain significant acquisitions) and (y) a minimum interest coverage ratio (as defined in the Amended Credit Agreement) of 3.00 to 1.00. The Company is in compliance with all the covenants contained in the Amended Credit Agreement throughout the period covered by this report.
As part of the Company's acquisition of Sivomatic in 2018, the Company assumed $10.7 million in long-term debt, recorded at fair value, consisting of two term loans, one of which matured in the third quarter of 2020 and the other of which matured in the first quarter of 2022. During 2022, the Company repaid $0.2 million on this loan.
The Company has a committed loan facility in Japan. As of December 31, 2022, there was an outstanding balance of $2.0 million on this facility. Principal will be repaid in accordance with the payment schedule ending in 2026. The Company repaid $0.5 million on these loans in 2022.
As part of the Concept Pet acquisition, the Company assumed $1.9 million in long-term debt, recorded at fair value, consisting of two terms loans, one that matures in 2025 and one that matures in 2027. Both loans have annual payments and carry a variable interest rate.
As of December 31, 2022, the Company had $25.3 million in uncommitted short-term bank credit lines, $4.7 million of which were in use.
The credit lines are primarily outside the U.S. and are generally one year in term at competitive market rates at large, well-established institutions. The Company typically uses its available credit lines to fund working capital requirements or local capital spending needs. We anticipate that capital expenditures for
2023
should be between $80 million and $90 million, principally related to opportunities to improve our operations and meet our strategic growth objectives. We expect to meet our other long-term financing requirements from internally generated funds, committed and uncommitted bank credit lines and, where appropriate, project financing of certain satellite plants.
During the second quarter of 2018, the Company entered into a floating to fixed interest rate swap for a notional amount of $150 million.
The fair value of this instrument at December 31,
2022
is an asset of $
1.0
million.
Additionally, the Company entered into a cross currency rate swap with a total notional value of $150 million to exchange monthly fixed-rate interest rate payments in U.S. dollars for monthly fixed-rate interest rate payments in Euros.
The fair value of this instrument at December 31,
2022
is an asset of $
13.8
million.
These swaps mature in May 2023. As a result of these swaps, the Company's effective fixed interest rate on the notional floating rate indebtedness will be 2.5%.
In addition to long-term debt, the Company has committed cash outflow related to pension and post-retirement benefit obligations, non-cancelable operating leases, primarily for office space and equipment, and other long-term contractual obligations. Other long-term liabilities include tax liabilities, including contingent obligations associated with gross unrecognized tax benefits for uncertain tax positions and a tax liability for the one-time transition tax on accumulated foreign subsidiary earnings under U.S. Tax Reform, asset retirement obligations relating to the retirement of certain tangible long-lived assets and land restoration obligations at the Company’s PCC satellite facilities and mining operations. See Notes 2, 8, 15, 16 and 20 to the Consolidated Financial Statements.
On October 20, 2021, the Company's Board of Directors authorized the Company's management to repurchase, at its discretion, up to $75 million of the Company's shares over a one-year period. Over this program's one-year period, 1,027,768 shares were repurchased for $67.8 million, or an average price of approximately $65.99 per share. This program is now complete.
On January 25, 2023, the Company's Board of Directors declared a regular quarterly dividend on its common stock of $0.05 per share. No dividend will be payable unless declared by the Board and unless funds are legally available for payment thereof.
The Company and certain of the Company’s subsidiaries are among numerous defendants in over four hundred cases seeking damages for alleged exposure to asbestos-containing materials related to talc products sold by the Company’s subsidiary Barretts Minerals Inc. Based on its evaluation of available information, the Company accrued $31 million for litigation costs during the third quarter of 2022. The litigation costs were incurred to defend against, opportunistically settle, and establish a reserve for such cases. The Company’s position is that these cases are meritless, and all talc products sold by Barretts Minerals Inc. are safe. However, we cannot predict the ultimate outcome of pending litigation. The Company could in the future be required to pay significant amounts as a result of settlements or judgments in these matters, potentially in excess of liabilities accrued to date. See Note 17 to the consolidated financial statements included in this report for more information.
Critical Accounting Policies and Estimates
Our discussion and analysis of our financial condition and results of operations are based upon our consolidated financial statements, which have been prepared in accordance with U.S. generally accepted accounting principles. The preparation of these financial statements requires us to make estimates and judgments that affect the reported amounts of assets, liabilities, revenues and expenses, and related disclosure of contingent assets and liabilities.
On an ongoing basis, we evaluate our estimates and assumptions, including those related to revenue recognition, valuation of long-lived assets, goodwill and other intangible assets, income taxes, including valuation allowances and pension plan assumptions. We base our estimates on historical experience and on other assumptions that we believe to be reasonable under the circumstances, the results of which form the basis for making judgments about the carrying values of assets and liabilities that cannot readily be determined from other sources. There can be no assurance that actual results will not differ from those estimates.
We believe the following critical accounting policies require us to make significant judgments and estimates in the preparation of our consolidated financial statements.
Revenue Recognition
Revenue is recognized at the point in time when the customer obtains control of the promised goods or services in an amount that reflects the consideration we expect to receive in exchange for those goods or services. The Company's revenues are primarily derived from the sale of products. Our primary performance obligation is satisfied upon shipment or delivery to our customer based on written sales terms, which is also when control is transferred. Revenue, where our performance obligations are satisfied in phases, is recognized over time using certain input measures based on the measurement of the value transferred to the customer, including milestones achieved. Revenues from sales of equipment are recorded upon completion of installation and transfer of control to the customer. Revenues from services are recorded when the services are performed.
In most of our PCC contracts, the price per ton is based upon the total number of tons sold to the customer during the year. Under those contracts, the price billed to the customer for shipments during the year is based on periodic estimates of the total annual volume that will be sold to the customer. Revenues are adjusted at the end of each year to reflect the actual volume sold. There were no significant revenue adjustments in the fourth quarter of 2022 and 2021, respectively. We have consignment arrangements with certain customers in our Refractories segment. Revenues for these transactions are recorded when the consigned products are consumed by the customer.
Valuation of Long-lived Assets, Goodwill and Other Intangible Assets
We assess the possible impairment of long-lived assets and identifiable amortizable intangibles whenever events or changes in circumstances indicate that the carrying value may not be recoverable.
Goodwill is evaluated for impairment at least annually. Factors we consider important that could trigger an impairment review include the following:
| ● |
Significant under-performance relative to historical or projected future operating results;
|
| ● |
Significant changes in the manner of use of the acquired assets or the strategy for the overall business;
|
| ● |
Significant negative industry or economic trends;
|
| ● |
Market capitalization below invested capital.
|
Annually, the Company performs a qualitative assessment for each of its reporting units to determine if the two-step process for impairment testing is required. If the Company determines that it is more likely than not that the fair value of a reporting unit is less than its carrying amount, the Company then evaluates the recoverability of goodwill using a two-step impairment test approach at the reporting unit level. Step one involves a) developing the fair value of total invested capital of each reporting unit in which goodwill is assigned; and b) comparing the fair value of total invested capital for each reporting unit to its carrying amount, to determine if there is goodwill impairment. Should the carrying amount for a reporting unit exceed its fair value, then the step one test is failed, and the magnitude of any goodwill impairment is determined under step two. The amount of impairment loss is determined in step two by comparing the implied fair value of reporting unit goodwill with the carrying amount of goodwill.
The Company has four reporting units; Performance Materials, PCC, Processed Minerals and Refractories. We identify our reporting units by assessing whether the components of our operating segments constitute businesses for which discrete financial information is available, and management regularly reviews the operating results of those components. In the fourth quarter of 2022, the Company performed a qualitative assessment of each of its reporting units and determined it was not more likely than not that the fair value of any of its reporting units was less than their carrying values.
Property, plant and equipment are depreciated over their useful lives. Useful lives are based on management’s estimates of the period that the assets can generate revenue, which does not necessarily coincide with the remaining term of a customer’s contractual obligation to purchase products made using those assets. Our sales of PCC are predominately pursuant to long-term evergreen contracts, initially ten years in length, with paper mills at which we operate satellite PCC plants. The terms of many of these agreements have been extended, often in connection with an expansion of the satellite PCC plant. Failure of a PCC customer to renew an agreement or continue to purchase PCC from our facility could result in an impairment of assets or accelerated depreciation at such facility.
We evaluate the recoverability of our property, plant and equipment whenever events or change in circumstances indicate that the carrying value of the assets may not be recoverable. For testing the recoverability, we primarily use discounted cash flow models or cost approach to estimate the fair value of these assets. Critical assumptions used in conducting these tests included expectations of our business performance and financial results, useful lives of assets, discount rates and comparable market data.
When we acquire a company, we determine fair value on the acquisition date of assets acquired and liabilities assumed. We use the income, market or cost approach (or a combination thereof) for the valuation and use valuation inputs and analyses that are based on market participant assumptions. Changes in assumptions can have a significant impact on the fair value of tangible assets. Goodwill is calculated as the excess of the consideration transferred over the assets acquired and represents the estimated future economic benefits arising from other assets acquired that could not be individually identified and separately recognized.
Income Taxes
As part of the process of preparing our consolidated financial statements, we are required to estimate our income taxes in each of the jurisdictions in which we operate. This process involves estimating current tax expense together with assessing temporary differences resulting from differing treatments of items for tax and accounting purposes. These differences result in deferred tax assets and liabilities, which are included in the consolidated balance sheet. We must then assess the likelihood that our deferred tax assets will be recovered from future taxable income, and to the extent we believe that recovery is not likely, we must establish a valuation allowance. To the extent we establish a valuation allowance or change this allowance in a period, we must include an expense within the tax provision in the Consolidated Statements of Income.
Deferred tax liabilities represent the amount of income taxes payable in future periods. Such liabilities arise because of temporary differences between the financial reporting and tax bases of assets and liabilities. Deferred income tax assets represent amounts available to reduce income taxes payable on taxable income in future years. Such assets arise because of temporary differences between the financial reporting and tax bases of assets and liabilities, as well as from net operating losses. We evaluate the recoverability of these future tax deductions by assessing the adequacy of future expected taxable income from all sources, including reversal of taxable temporary differences and forecasted operating earnings. These sources of income inherently rely heavily on estimates. We use our historical experience and business forecasts to provide insight. The amount recorded for the net deferred tax liability was $156.0 million and $165.1 million at December 31, 2022 and 2021, respectively.
The application of income tax law is inherently complex. Laws and regulations in this area are voluminous and are often ambiguous. As such, we are required to make many subjective assumptions and judgments regarding our income tax exposures. Interpretations of and guidance surrounding income tax laws and regulations change over time. As such, changes in our subjective assumptions and judgments can materially affect amounts recognized in the consolidated balance sheets and statements of operations. See Note 8 to the Consolidated Financial Statements for additional detail on our uncertain tax positions.
Pension Benefits
We sponsor pension and other retirement plans in various forms covering the majority of employees who meet eligibility requirements. Several statistical and actuarial models which attempt to estimate future events are used in calculating the expense and liability related to the plans. These models include assumptions about the discount rate, expected return on plan assets and rate of future compensation increases as determined by us, within certain guidelines. Our assumptions reflect our historical experience and management's best judgment regarding future expectations. In addition, our actuarial consultants also use subjective factors such as withdrawal and mortality rates to estimate these assumptions. The actuarial assumptions used by us may differ materially from actual results due to changing market and economic conditions, higher or lower withdrawal rates, or longer or shorter life spans of participants, among other things.
The investment strategy for pension plan assets is to maintain a broadly diversified portfolio designed to both preserve and grow plan assets to meet future plan obligations. The Company's average rate of return on assets from inception through December 31, 2022 was approximately 9%. The Company’s assets are strategically allocated among equity, debt and other investments to achieve a diversification level that dampens fluctuations in investment returns. The Company’s long-term investment strategy is an investment portfolio mix of approximately 55%-65% in equity securities, 30%-35% in fixed income securities and 0%-15% in other securities. As of December 31, 2022, the Company had approximately 54% of its pension assets in equity securities, 32% in fixed income securities and 14% in other securities.
The Company recognized pension expense of $4.9 million in 2022 as compared to $9.1 million in 2021. Accounting guidance on retirement benefits requires companies to discount future benefit obligations back to today’s dollars using a discount rate that is based on high-quality fixed-income investments. A decrease in the discount rate increases the pension benefit obligation, while an increase in the discount rate decreases the pension benefit obligation. This increase or decrease in the pension benefit obligation is recognized in Accumulated other comprehensive income (loss) and subsequently amortized into earnings as an actuarial gain or loss. The guidance also requires companies to use an expected long-term rate of return on plan assets for computing current year pension expense. Differences between the actual and expected returns are also recognized in Accumulated other comprehensive income (loss) and subsequently amortized into earnings as actuarial gains and losses. At the end of 2022, total actuarial losses recognized in Accumulated other comprehensive income (loss) for pension plans were ($38.1) million as compared to ($73.3) million in 2021. The majority of the actuarial losses were due to decreases in the discount rate and lower actual rates of return on assets than expected during the financial crisis of 2008.
A net gain of $46.3 million ($35.3 million after-tax) primarily due to actuarial gains, driven by a change in discount rates is included in other comprehensive income in 2022. In 2021, a net gain of $60.6 million ($45.2 million after-tax) was recorded in other comprehensive income, primarily due to a change in discount rates. In 2020, a net loss of $24.5 million ($18.7 million after-tax) was recorded in other comprehensive income, primarily due to a change in discount rates and updated mortality tables.
Actuarial losses for pensions will be impacted in future periods by actual asset returns, discount rate changes, actual demographic experience and other factors that impact these expenses. These losses, reported in Accumulated other comprehensive income (loss), will generally be amortized as a component of net periodic benefit cost on a straight-line basis over the average remaining service period of active employees expected to receive benefits under the benefit plans. At the end of 2022, the average remaining service period of active employees or life expectancy for fully eligible employees was 9 years.
For a detailed discussion on the application of these and other accounting policies, see "Summary of Significant Accounting Policies" in Note 1 to the Consolidated Financial Statements. This discussion and analysis should be read in conjunction with the consolidated financial statements and related notes included elsewhere in this report.
Recently Issued Accounting Standards
Changes to accounting principles generally accepted in the United States of America (U.S. GAAP) are established by the Financial Accounting Standards Board (FASB) in the form of accounting standards updates (ASUs) to the FASB’s Accounting Standards Codification. The Company considers the applicability and impact of all ASUs. All recently issued ASUs were assessed and determined to be either not applicable or are expected to have minimal impact on our consolidated financial position and results of operations.
We are exposed to market risk from fluctuations in foreign currency exchange rates, interest rates and credit risk. We use a variety of practices to manage these market risks, including derivative financial instruments when appropriate. Our treasury and risk management policies prohibit us from using derivative instruments for trading or speculative purposes. We also do not use leveraged derivative instruments or derivatives with complex features.
Exchange Rate Sensitivity
As we operate in over 30 countries with many international subsidiaries, we are exposed to currency fluctuations related to manufacturing and selling our products and services. This foreign currency risk is diversified and involves assets, liabilities and cash flows denominated in currencies other than the U.S. Dollar (USD).
We manage our foreign currency exchange risk in part through operational means, including managing same currency revenues versus same currency costs, as well as, same currency assets versus same currency liabilities. We also have subsidiaries with the same currency exposures which may offset each other, providing a natural hedge against one another’s currency risk. When appropriate, we enter into derivative financial instruments, such as forward exchange contracts and cross currency interest rate swaps, to mitigate the impact of foreign exchange rate movements on our operating results. The counterparties are major financial institutions. Such forward exchange contracts would not subject us to additional risk from exchange rate because gains and losses on these contracts would offset losses and gains on the assets, liabilities, and transactions being hedged. In the second quarter of 2018, the Company entered into a cross currency swap with a total notional value of $150 million. The swap matures in May 2023. The fair value of this swap at December 31, 2022, was an asset of $13.8 million.
Assets and liabilities of our international subsidiaries are translated to their parent company’s reporting currency at current exchange rates during consolidation; gains and losses stemming from these translations are included as a component of Other Comprehensive Income and reported within Accumulated Comprehensive Income within our Consolidated Balance Sheets. Income and expenses of our international subsidiaries are translated at average exchange rates for the period and, when included within retained earnings in the balance sheet at current exchange rates, the differences to those average exchange rates are included within Other Comprehensive Income and reported within Accumulated Comprehensive Income. When our subsidiaries transact business in currencies other than their functional currency, those transactions are revalued in their functional currency and differences resulting from such revaluations are included within other non-operating income (deduction), net within our Consolidated Statement of Income.
We do not anticipate that near-term changes in exchange rates will have a material impact on our future earnings or cash flows. However, there can be no assurance that a sudden and significant change in the value of foreign currencies would not have a material adverse effect on our financial condition and results of operations.
Interest Rate Sensitivity
A portion of our long-term bank debt bears interest at variable rates (see Note 15 to the Consolidated Financial Statements) and our results of operations would be affected by interest rate changes to such bank debt outstanding. The Company utilizes interest rate swaps to limit exposure to market fluctuations on floating-rate debt. In the second quarter of 2018, the Company entered into an additional floating to fixed interest rate swap for with a total notional value of $150 million. The fair value of this swap at December 31, 2022, was an asset of $1.0 million. An immediate 10% increase in the interest rates would not have a material effect on our results of operations over the next fiscal year. A one percentage point change in interest rates would cost $21 million in incremental interest charges on an annual basis.
Credit Risk
We are exposed to credit risk on certain assets, primarily accounts receivable. We provide credit to customers in the ordinary course of business and perform ongoing credit evaluations. Concentrations of credit risk with respect to trade receivables are limited due to the large number of customers comprising our customer base. We currently believe our allowance for doubtful accounts is sufficient to cover customer credit risks. Our accounts receivable financial instruments are carried at amounts that approximate fair value.
Sovereign Debt Risk
We do not have any material credit risk with sovereign governments as we do not sell our products to them. We do, however, sell to customers in these countries, but we believe our risk associated with these customers is not material.
Item 8. Financial Statements and Supplementary Data
The financial information required by Item 8 is contained in Item 15 of Part IV of this report.
None.
Disclosure Controls and Procedures
As of the end of the period covered by this report, and under the supervision and with participation of the Company’s management, including the Chief Executive Officer and the Chief Financial Officer, the Company carried out an evaluation of the effectiveness of the design and operation of the Company’s disclosure controls and procedures, pursuant to Exchange Act Rule 13a-15(b). Based upon that evaluation, the Chief Executive Officer and Chief Financial Officer concluded that the Company’s disclosure controls and procedures were effective as of December 31, 2022.
Pursuant to Section 404 of the Sarbanes-Oxley Act of 2002, we have included a report of management's assessment of the design and operating effectiveness of our internal controls as part of this report. Management's report is included in our consolidated financial statements on page F-42 of this report under the caption entitled "Management's Report on Internal Control Over Financial Reporting."
Changes in Internal Control Over Financial Reporting
During 2021, we closed on the acquisition of Normerica, and we excluded Normerica from the scope of management's report on internal control over financial reporting for the year ended December 31, 2021. The process of integrating Normerica to our overall internal control over financial reporting has been completed and we included it in scope for the year ended December 31, 2022.
There were no other changes in the Company's internal control over financial reporting during the fourth fiscal quarter of 2022 that has materially affected, or is reasonably likely to materially affect, our internal control over financial reporting.
None
Not Applicable
PART III
The information concerning the Company's Board of Directors required by this item is incorporated herein by reference to the Company's Proxy Statement, under the captions “Corporate Governance”, “Committees of the Board of Directors” and “Item 1- Election of Directors.”
The Board has established a code of ethics for the Chief Executive Officer, the Chief Financial Officer, and the Chief Accounting Officer entitled "Code of Ethics for the Senior Financial Officers," which is available on our website, www.mineralstech.com, by clicking the links entitled
Our Company,
then
Corporate Governance
and then
Policies and Charters
.
See “Information About Our Executive Officers” in Part I of this report for information regarding executive officers of the Company.
The information appearing in the Company's Proxy Statement under the captions “Compensation Discussion and Analysis,” “Report of the Compensation Committee” and “Compensation of Executive Officers and Directors" is incorporated herein by reference.
Item 12. Security Ownership of Certain Beneficial Owners and Management and Related Stockholder Matters
The information appearing in the Company's Proxy Statement under the caption "Security Ownership of Certain Beneficial Owners and Management" is incorporated herein by reference.
Equity Compensation Plan Information
The following table summarizes information about our equity compensation plans as of December 31, 2022. All of our equity compensation plans have been approved by our stockholders. All outstanding awards relate to our common stock.
|
Plan Category
|
Number of Securities to
be Issued Upon Exercise
of Outstanding Options,
Warrants and Rights
(1)
|
Weighted Average
Exercise Price of
Outstanding Options,
Warrants and Rights
(2)
|
Number of Securities
Remaining Available
for Future Issuance
under Equity
Compensation Plans
(excluding securities
reflected in column (a)
|
|||||||||
|
(a)
|
(b)
|
(c)
|
||||||||||
|
Equity compensation plans approved by security holders
|
1,540,012
|
$
|
62.22
|
1,080,460
|
||||||||
|
Total
|
1,540,012
|
$
|
62.22
|
1,080,460
|
||||||||
| (1) |
Includes shares issuable upon exercise of outstanding stock options and shares issuable upon vesting of time-based deferred restricted stock units (DRSUs).
|
| (2) |
The weighted-average exercise price includes all outstanding stock options but does not include DRSUs which do not have an exercise price.
|
For further information, see Note 6 to the Consolidated Financial Statements.
The information appearing in the Company's Proxy Statement under the caption "Certain Relationships and Related Transactions" is incorporated herein by reference.
The Board has established Corporate Governance principles which include guidelines for determining Director independence, which is available on our website, www.mineralstech.com, by clicking the links entitled
Our Company,
then
Corporate Governance
and then
Policies and Charters
. The information appearing in the Company’s Proxy Statement under the caption “Corporate Governance – Director Independence” is incorporated herein by reference.
Item 14. Principal Accountant Fees and Services
The information appearing in the Company's Proxy Statement under the caption "Principal Accountant Fees and Services" is incorporated herein by reference.
PART IV
| (a) |
The following documents are filed as part of this report:
|
| 1. |
Financial Statements. The following Consolidated Financial Statements of Mineral Technologies Inc. and subsidiary companies and Reports of Independent Registered Public Accounting Firm are set forth on pages F-2 to F-43.
|
Consolidated Balance Sheets as of December 31, 2022 and 2021
Consolidated Statements of Income for the years ended December 31, 2022, 2021 and 2020
Consolidated Statements of Comprehensive Income for the years ended December 31, 2022, 2021 and 2020
Consolidated Statements of Cash Flows for the years ended December 31, 2022, 2021 and 2020
Consolidated Statements of Changes in Shareholders' Equity for the years ended December 31, 2022, 2021 and 2020
Notes to the Consolidated Financial Statements
Reports of Independent Registered Public Accounting Firm
Management's Report on Internal Control Over Financial Reporting
| 2. |
Financial Statement Schedule. The following financial statement schedule is filed as part of this report:
|
Schedule II
–
Valuation and Qualifying Accounts
All other schedules for which provision is made in the applicable accounting regulations of the SEC are not required under the related instructions or are inapplicable and, therefore, have been omitted.
| 3. |
Exhibits. The following exhibits are filed as part of, or incorporated by reference into, this report.
|
|
Exhibit No.
|
Exhibit Title
|
|
|
Restated Certificate of Incorporation of the Company (Incorporated by reference to exhibit 3.1 filed with the Company's Annual Report on Form 10-K (file no. 001-11430) for the year ended December 31, 2003)
|
||
|
By-Laws of the Company as amended and restated effective March 13, 2018 (Incorporated by reference to exhibit 3.1 filed with the Company's Current Report on Form 8-K (file no. 001-11430) filed on March 19, 2018)
|
||
|
Specimen Certificate of Common Stock (Incorporated by reference to exhibit 4.1 filed with the Company's Annual Report on Form 10-K (file no. 001-11430) for the year ended December 31, 2003)
|
||
|
Description of the Registrant's Securities Registered Pursuant to Section 12 of the Securities Exchange Act of 1934 (Incorporated by reference to exhibit 4.2 filed with the Company's Annual Report on Form 10-K (file no. 001-11430) for the year ended December 31, 2019)
|
||
|
Indenture, dated as of June 30, 2020, by and among Minerals Technologies Inc., the subsidiary guarantors from time to time party thereto and The Bank of New York Mellon Trust Company, N.A., as a trustee (incorporated by reference to Exhibit 4.1 to the Company's Current Report on Form 8-K
(file no. 001-11430)
filed on June 30, 2020.)
|
||
|
10.1
|
Asset Purchase Agreement, dated as of September 28, 1992, by and between Specialty Refractories Inc. and Quigley Company Inc. (Incorporated by reference to the exhibit so designated filed with the Company's Registration Statement on Form S-1 (Registration No. 33-51292), originally filed on August 25, 1992)
|
|
|
10.1(a)
|
Agreement dated October 22, 1992 between Specialty Refractories Inc. and Quigley Company Inc., amending Exhibit 10.1 (Incorporated by reference to the exhibit so designated filed with the Company's Registration Statement on Form S-1 (Registration No. 33-59510), originally filed on March 15, 1993)
|
|
|
10.1(b)
|
Letter Agreement dated October 29, 1992 between Specialty Refractories Inc. and Quigley Company Inc., amending Exhibit 10.1 (Incorporated by reference to the exhibit so designated filed with the Company's Registration Statement on Form S-1 (Registration No. 33-59510), originally filed on March 15, 1993)
|
|
|
10.2
|
Reorganization Agreement, dated as of September 28, 1992, by and between the Company and Pfizer Inc. (Incorporated by reference to the exhibit so designated filed with the Company's Registration Statement on Form S-1 (Registration No. 33-51292), originally filed on August 25, 1992)
|
|
|
10.3
|
Asset Contribution Agreement, dated as of September 28, 1992, by and between Pfizer Inc. and Specialty Minerals Inc. (Incorporated by reference to the exhibit so designated filed with the Company's Registration Statement on Form S-1 (Registration No. 33-51292), originally filed on August 25, 1992)
|
|
|
10.4
|
Asset Contribution Agreement, dated as of September 28, 1992, by and between Pfizer Inc. and Barretts Minerals Inc. (Incorporated by reference to the exhibit so designated filed with the Company's Registration Statement on Form S-1 (Registration No. 33-51292), originally filed on August 25, 1992)
|
|
|
10.4(a)
|
Agreement dated October 22, 1992 between Pfizer Inc, Barretts Minerals Inc. and Specialty Minerals Inc., amending Exhibits 10.3 and 10.4 (Incorporated by reference to the exhibit so designated filed with the Company's Registration Statement on Form S-1 (Registration No. 33-59510), originally filed on March 15, 1993)
|
|
Employment Agreement, dated December 13, 2016, between the Company and Douglas T. Dietrich (Incorporated by reference to exhibit 10.1 filed with the Company's Current Report on Form 8-K (file no. 001-11430) filed on December 16, 2016) (+)
|
||
|
First Amendment to Employment Agreement, dated April 15, 2021, between the Company and Douglas T. Dietrich (Incorporated by reference to exhibit 10.1 filed with the Company's Quarterly Report on Form 10-Q (file no. 001-11430) for the quarter ended April 4, 2021) (+)
|
||
|
Form of Employment Agreement between the Company and each of Erik C. Aldag, Brett Argirakis, Michael A. Cipolla, Erin N. Cutler, Jonathan J. Hastings, Timothy J. Jordan, and D.J. Monagle, III (Incorporated by reference to exhibit 10.6 filed with the Company's Annual Report on Form 10-K (file no. 001-11430) for the year ended December 31, 2016) (+)
|
||
|
Severance Agreement between the Company and Douglas T. Dietrich (Incorporated by reference to the exhibit 10.2 filed with the Company’s Current Report on form 8-K (file no. 001-11430) filed on December 16, 2016) (+)
|
||
|
First Amendment to Severance Agreement between the Company and Douglas T. Dietrich (Incorporated by reference to exhibit 10.2 filed with the Company's Quarterly Report on Form 10-Q (file no. 001-11430) for the quarter ended April 4, 2021) (+)
|
||
|
Form of Severance Agreement between the Company and each of Erik C. Aldag, Brett Argirakis, Michael A. Cipolla, Erin N. Cutler, Jonathan J. Hastings, Timothy J. Jordan, and D.J. Monagle, III (Incorporated by reference to exhibit 10.8 filed with the Company's Annual Report on Form 10-K (file no. 001-11430) for the year ended December 31, 2016) (+)
|
||
|
Form of Indemnification Agreement between the Company and each of Erik C. Aldag, Brett Argirakis, Michael A. Cipolla, Erin N. Cutler, Douglas T. Dietrich, Jonathan J. Hastings, Timothy J. Jordan, D.J. Monagle III and each of the Company’s non-employee directors (Incorporated by reference to exhibit 10.1 filed with the Company's Current Report on Form 8-K (file no. 001-11430) filed on May 8, 2009) (+)
|
||
|
Company Nonfunded Deferred Compensation and Unit Award Plan for Non-Employee Directors, as amended and restated effective January 1, 2008 (Incorporated by reference to exhibit 10.8 filed with the Company's Quarterly Report on Form 10-Q (file no. 001-11430) for the quarter ended March 30, 2008) (+)
|
||
|
First Amendment to the Company Nonfunded Deferred Compensation and Unit Award Plan for Non-Employee Directors, dated January 18, 2012 (Incorporated by reference to exhibit 10.11(a) filed with the Company’s Annual Report on Form 10-K (file no. 001-11430) for the year ended December 31, 2011) (+)
|
||
|
2015 Stock Award and Incentive Plan of the Company, as amended and restated effective March 11, 2020 (Incorporated by reference to Appendix A to the Company’s Supplement to its 2020 Proxy Statement (file no. 001-11430) filed on April 22, 2020) (+)
|
||
|
Form of Stock Option Agreement (Incorporated by reference to exhibit 10.12(a) filed with the Company's Annual Report on Form 10-K (file no. 001-11430) for the year ended December 31, 2019) (+)
|
||
|
Form of Deferred Restricted Stock Unit Agreement (Incorporated by reference to exhibit 10.12(b) filed with the Company's Annual Report on Form 10-K (file no. 001-11430) for the year ended December 31, 2019) (+)
|
||
|
Company Retirement Plan, as amended and restated, dated August 27, 2020 (Incorporated by reference to exhibit 10.13 filed with the Company's Annual Report on Form 10-K (file no. 001-11430) for the year ended December 31, 2020) (+)
|
||
|
Company Supplemental Retirement Plan, amended and restated effective December 31, 2009 (Incorporated by reference to exhibit 10.13 filed with the Company's Annual Report on Form 10-K (file no. 001-11430) for the year ended December 31, 2009) (+)
|
||
|
First Amendment to Company Supplemental Retirement Plan, as amended and restated, dated December 22, 2014 (Incorporated by reference to exhibit 10.14(a) filed with the Company's Annual Report on Form 10-K (file no. 001-11430) for the year ended December 31, 2014)(+)
|
||
|
Second Amendment to Company Supplemental Retirement Plan, as amended and restated, dated December 20, 2019 (Incorporated by reference to exhibit 10.14(b) filed with the Company's Annual Report on Form 10-K (file no. 001-11430) for the year ended December 31, 2019) (+)
|
||
|
Company Savings and Investment Plan, as amended and restated, dated December 21, 2012 (Incorporated by reference to exhibit 10.14 filed with the Company's Annual Report on Form 10-K (file no. 001-11430) for the year ended December 31, 2012) (+)
|
||
|
Amendment to the Company Savings and Investment Plan, as amended and restated, dated December 5, 2013 (Incorporated by reference to exhibit 10.15(a) filed with the Company’s Annual Report on Form 10-K (file no. 001-11430) for the year ended December 31, 2013) (+)
|
|
Amendment to the Company Savings and Investment Plan, as amended and restated, dated December 5, 2013 (Incorporated by reference to exhibit 10.15(b) filed with the Company’s Annual Report on Form 10-K (file no. 001-11430) for the year ended December 31, 2013) (+)
|
||
|
Third Amendment to the Company Savings and Investment Plan, as amended and restated, dated December 22, 2014 (Incorporated by reference to exhibit 10.15(c) filed with the Company's Annual Report on Form 10-K (file no. 001-11430) for the year ended December 31, 2014)(+)
|
||
|
Amendment to the Company Savings and Investment Plan, as amended and restated, dated December 31, 2015 (Incorporated by reference to exhibit 10.15(d) filed with the Company's Annual Report on Form 10-K (file no. 001-11430) for the year ended December 31, 2015)(+)
|
||
|
10.14(e
)
|
Amendment to the Company Savings and Investment Plan, as amended and restated, dated July 16, 2020 (Incorporated by reference to exhibit 10.1 filed with the Company's Quarterly Report on Form 10-Q (file no. 001-11430) for the quarter ended June 28, 2020)(+)
|
|
|
Amendment to the Company Savings and Investment Plan, as amended and restated, dated December 21, 2020 (Incorporated by reference to exhibit 10.15(f) filed with the Company's Annual Report on Form 10-K (file no. 001-11430) for the year ended December 31, 2020) (+)
|
||
|
Amendment to the Company Savings and Investment Plan, as amended and restated, dated May 25, 2022 (Incorporated by reference to exhibit 10.1 filed with the Company's Quarterly Report on Form 10-Q (file no. 001-11430) for the quarter ended July 3, 2022) (+)
|
||
|
Amendment to the Company Savings and Investment Plan, as amended and restated, dated December 15, 2022 (*) (+)
|
||
|
Company Supplemental Savings Plan, amended and restated effective December 31, 2009 (Incorporated by reference to exhibit 10.15 filed with the Company's Annual Report on Form 10-K (file no. 001-11430) for the year ended December 31, 2009) (+)
|
||
|
Amendment to the Company Supplemental Savings Plan, dated December 28, 2011 (Incorporated by reference to exhibit 10.16(a) filed with the Company’s Annual Report on Form 10-K (file no. 001-11430) for the year ended December 31, 2011)(+)
|
||
|
First Amendment to the Company Supplemental Savings Plan, dated December 22, 2014 (Incorporated by reference to exhibit 10.16(b) filed with the Company's Annual Report on Form 10-K (file no. 001-11430) for the year ended December 31, 2014)(+)
|
||
|
Second Amendment to the Company Supplemental Savings Plan, dated December 22, 2014 (Incorporated by reference to exhibit 10.16(c) filed with the Company's Annual Report on Form 10-K (file no. 001-11430) for the year ended December 31, 2014)(+)
|
||
|
Third Amendment to the Company Supplemental Savings Plan, dated December 16, 2016 (Incorporated by reference to exhibit 10.16(d) filed with the Company's Annual Report on Form 10-K (file no. 001-11430) for the year ended December 31, 2016)(+)
|
||
|
Fourth Amendment to the Company Supplemental Savings Plan, dated December 20, 2019 (Incorporated by reference to exhibit 10.16(e) filed with the Company's Annual Report on Form 10-K (file no. 001-11430) for the year ended December 31, 2019) (+)
|
||
|
Company Health and Welfare Plan, effective as of April 1, 2003 and amended and restated as of January 1, 2006 (Incorporated by reference to exhibit 10.14 filed with the Company's Annual Report on Form 10-K (file no. 001-11430) for the year ended December 31, 2006)(+)
|
||
|
Amendment to the Company Health and Welfare Plan, dated May 19, 2009 (Incorporated by reference to exhibit 10.16(a) filed with the Company's Annual Report on Form 10-K (file no. 001-11430) for the year ended December 31, 2009) (+)
|
||
|
First Amendment to Company Health and Welfare Plan, dated December 22, 2014 (Incorporated by reference to exhibit 10.17(b) filed with the Company's Annual Report on Form 10-K (file no. 001-11430) for the year ended December 31, 2014)(+)
|
||
|
Company Retiree Medical Plan, effective as of January 1, 2011 (Incorporated by reference to exhibit 10.17 filed with the Company's Annual Report on Form 10-K (file no. 001-11430) for the year ended December 31, 2010)(+)
|
||
|
First Amendment to Company Retiree Medical Plan, dated December 22, 2014 (Incorporated by reference to exhibit 10.18(a) filed with the Company's Annual Report on Form 10-K (file no. 001-11430) for the year ended December 31, 2014)(+)
|
||
|
Second Amendment to Company Retiree Medical Plan, dated November 10, 2021 (Incorporated by reference to exhibit 10.18(b) filed with the Company's Annual Report on Form 10-K (file no. 001-11430) for the year ended December 31, 2021) (+)
|
||
|
Amended and Restated Grantor Trust Agreement, dated as of April 1, 2010, by and between the Company and the Wilmington Trust Company (Incorporated by reference to exhibit 10.1 filed with the Company's Quarterly Report on Form 10-Q (file no. 001-11430) for the period ended April 4, 2010)(+)
|
||
|
Agreement and Amendment No. 1, dated October 1, 2017, to the Amended and Restated Grantor Trust Agreement, dated as of April 1, 2010, by and between the Company and the Wilmington Trust Company (Incorporated by reference to exhibit 10.19(a) filed with the Company's Annual Report on Form 10-K (file no. 001-11430) for the year ended December 31, 2017)(+)
|
|
Refinancing Facility Agreement dated as of August 11, 2022, among Minerals Technologies Inc., certain subsidiaries party thereto, the lenders party thereto, and JPMorgan Chase Bank, N.A., as Administrative Agent. (Incorporated by reference to the exhibit 10.1 filed with the Company's Current Report on Form 8-K (file no. 001-11430) filed on August 11, 2022)
|
||
|
10.20
|
Indenture, dated July 22, 1963, between the Cork Harbour Commissioners and Roofchrome Limited (Incorporated by reference to the exhibit so designated filed with the Company's Registration Statement on Form S-1 (Registration No. 33-51292), originally filed on August 25, 1992)
|
|
|
Subsidiaries of the Company (*)
|
||
|
Consent of Independent Registered Public Accounting Firm (*)
|
||
|
Power of Attorney (*)
|
||
|
Rule 13a-14(a)/15d-14(a) Certification executed by the Company's principal executive officer (*)
|
||
|
Rule 13a-14(a)/15d-14(a) Certification executed by the Company's principal financial officer (*)
|
||
|
Section 1350 Certification (*)
|
||
|
Information Concerning Mine Safety Violations (*)
|
||
|
101.INS
|
Inline XBRL Instance Document (the instance document does not appear in the Interactive Data File because its XBRL tags are embedded within the Inline XBRL document)
|
|
|
101.SCH
|
Inline XBRL Taxonomy Extension Schema Document
|
|
|
101.CAL
|
Inline XBRL Taxonomy Extension Calculation Linkbase Document
|
|
|
101.DEF
|
Inline XBRL Taxonomy Extension Definition Linkbase Document
|
|
|
101.LAB
|
Inline XBRL Taxonomy Extension Label Linkbase Document
|
|
|
101.PRE
|
Inline XBRL Taxonomy Extension Presentation Linkbase Document
|
|
|
104
|
Cover Page Interactive Data File (formatted as Inline XBRL and contained in Exhibit 101)
|
| (*) |
Filed herewith.
|
| (+) |
Management contract or compensatory plan or arrangement required to be filed pursuant to Item 601 of Regulation S-K.
|
Pursuant to the requirements of Section 13 or 15(d) of the Securities Exchange Act of 1934, the Registrant has duly caused this report to be signed on its behalf by the undersigned, thereunto duly authorized.
|
By:
|
/s/ Douglas T. Dietrich
|
||
|
Douglas T. Dietrich
|
|||
|
Chairman of the Board and Chief Executive Officer
|
February 17, 2023
Pursuant to the requirements of the Securities Exchange Act of 1934, this report has been signed below by the following persons on behalf of the Registrant in the capacities and on the dates indicated:
|
SIGNATURE
|
TITLE
|
DATE
|
|||
|
/s/ Douglas T. Dietrich
|
Chairman of the Board and Chief Executive Officer
|
February 17, 2023
|
|||
|
Douglas T. Dietrich
|
(Principal Executive Officer)
|
||||
|
/s/ Erik C. Aldag
|
Senior Vice President
–
Finance and Treasury,
|
February 17, 2023
|
|||
|
Erik C. Aldag
|
Chief Financial Officer (Principal Financial Officer)
|
||||
|
/s/ Michael A. Cipolla
|
Vice President
–
Controller and
|
February 17, 2023
|
|||
|
Michael A. Cipolla
|
Chief Accounting Officer (Principal Accounting Officer)
|
||||
|
*
|
Director
|
February 17, 2023
|
|||
|
Joseph C. Breunig
|
|||||
|
*
|
Director
|
February 17, 2023
|
|||
|
John J. Carmola
|
|||||
|
*
|
Director
|
February 17, 2023
|
|||
|
Robert L. Clark
|
|||||
|
*
|
Director
|
February 17, 2023
|
|||
|
Alison A. Deans
|
|||||
|
/s/ Douglas T. Dietrich
|
Chairman
|
February 17, 2023
|
|||
|
Douglas T. Dietrich
|
|||||
|
*
|
Director
|
February 17, 2023
|
|||
|
Duane R. Dunham
|
|||||
|
*
|
Director
|
February 17, 2023
|
|||
|
Franklin L. Feder
|
|||||
|
*
|
Director
|
February 17, 2023
|
|||
|
Rocky Motwani
|
|||||
|
*
|
Director
|
February 17, 2023
|
|||
|
Carolyn K. Pittman
|
|||||
|
*
|
Director
|
February 17, 2023
|
|||
|
Marc E. Robinson
|
|||||
|
*
|
By: /s/ Timothy J. Jordan
|
||||
|
Timothy J. Jordan
|
|||||
|
Attorney-in-Fact
|
|||||
MINERALS TECHNOLOGIES INC. AND SUBSIDIARY COMPANIES
INDEX TO CONSOLIDATED FINANCIAL STATEMENTS
|
Audited Financial Statements:
|
Page
|
|
|
Consolidated Balance Sheets
as of December 31, 2022 and 2021
|
F-2
|
|
|
Consolidated Statements of Income
for the years ended December 31, 2022, 2021 and 2020
|
F-3
|
|
|
Consolidated Statements of Comprehensive Income
for the years ended December 31, 2022, 2021 and 2020
|
F-4
|
|
|
Consolidated Statements of Cash Flows
for the years ended December 31, 2022, 2021 and 2020
|
F-5
|
|
|
Consolidated Statements of Changes in Shareholders' Equity
for the years ended December 31, 2022, 2021 and 2020
|
F-6
|
|
|
F-7
|
||
|
Reports of Independent Registered Public Accounting Firm
(
|
F-40
|
|
|
F-43
|
||
|
S-1
|
||
MINERALS TECHNOLOGIES INC. AND SUBSIDIARY COMPANIES
|
|
December 31,
|
|||||||
|
(millions of dollars, except share and per share amounts)
|
2022
|
2021
|
||||||
|
ASSETS
|
||||||||
|
Current assets:
|
||||||||
|
Cash and cash equivalents
|
$
|
|
$
|
|
||||
|
Short-term investments, at cost which approximates market
|
|
|
||||||
|
Accounts receivable
|
|
|
||||||
|
Inventories
|
|
|
||||||
|
Prepaid expenses
|
|
|
||||||
|
Other current assets
|
|
|
||||||
|
Total current assets
|
|
|
||||||
|
Property, plant and equipment, less accumulated depreciation and depletion
|
|
|
||||||
|
Goodwill
|
|
|
||||||
|
Intangible assets
|
|
|
||||||
|
Deferred income taxes
|
|
|
||||||
|
Other assets and deferred charges
|
|
|
||||||
|
Total assets
|
$
|
|
$
|
|
||||
|
LIABILITIES AND SHAREHOLDERS' EQUITY
|
||||||||
|
Current liabilities:
|
||||||||
|
Short-term debt
|
$
|
|
$
|
|
||||
|
Current maturities of long-term debt
|
|
|
||||||
|
Accounts payable
|
|
|
||||||
|
Income tax payable
|
|
|
||||||
|
Accrued compensation and related items
|
|
|
||||||
|
Other current liabilities
|
|
|
||||||
|
Total current liabilities
|
|
|
||||||
|
Long-term debt, net of unamortized discount and deferred financing costs
|
|
|
||||||
|
Deferred income taxes
|
|
|
||||||
|
Accrued pension and postretirement benefits
|
|
|
||||||
|
Other non-current liabilities
|
|
|
||||||
|
Total liabilities
|
|
|
||||||
|
Shareholders' equity:
|
||||||||
|
Preferred stock, without par value;
|
|
|
||||||
|
Common stock, par value at $
|
|
|
||||||
|
Additional paid-in capital
|
|
|
||||||
|
Retained earnings
|
|
|
||||||
|
Accumulated other comprehensive loss
|
(
|
)
|
(
|
)
|
||||
|
Less common stock held in treasury, at cost;
|
(
|
)
|
(
|
)
|
||||
|
Total Minerals Technologies Inc. shareholders' equity
|
|
|
||||||
|
Non-controlling interests
|
|
|
||||||
|
Total shareholders' equity
|
|
|
||||||
|
Total liabilities and shareholders' equity
|
$
|
|
$
|
|
||||
See Notes to Consolidated Financial Statements, which are an integral part of these statements.
MINERALS TECHNOLOGIES INC. AND SUBSIDIARY COMPANIES
|
|
Year Ended December 31,
|
|||||||||||
|
(millions of dollars, except per share data)
|
2022
|
2021
|
2020
|
|||||||||
|
Net sales
|
$
|
|
$
|
|
$
|
|
||||||
|
Cost of goods sold
|
|
|
|
|||||||||
|
Production margin
|
|
|
|
|||||||||
|
Marketing and administrative expenses
|
|
|
|
|||||||||
|
Research and development expenses
|
|
|
|
|||||||||
|
Acquisition-related expenses
|
|
|
|
|||||||||
|
Litigation expenses
|
|
|
|
|||||||||
|
Restructuring and other items, net
|
|
|
|
|||||||||
|
Income from operations
|
|
|
|
|||||||||
|
Interest expense, net
|
(
|
)
|
(
|
)
|
(
|
)
|
||||||
|
Debt extinguishment expenses
|
(
|
)
|
|
|
||||||||
|
Non-cash pension settlement charge
|
(
|
)
|
(
|
)
|
(
|
)
|
||||||
|
Other non-operating income (deductions), net
|
(
|
)
|
|
(
|
)
|
|||||||
|
Total non-operating deductions, net
|
(
|
)
|
(
|
)
|
(
|
)
|
||||||
|
Income before tax and equity in earnings
|
|
|
|
|||||||||
|
Provision for taxes on income
|
|
|
|
|||||||||
|
Equity in earnings of affiliates, net of tax
|
|
|
|
|||||||||
|
Consolidated net income
|
|
|
|
|||||||||
|
Less:
|
||||||||||||
|
Net income attributable to non-controlling interests
|
|
|
|
|||||||||
|
Net income attributable to Minerals Technologies Inc. (MTI)
|
$
|
|
$
|
|
$
|
|
||||||
|
Earnings per share:
|
||||||||||||
|
Basic:
|
||||||||||||
|
Income from operations attributable to MTI
|
$
|
|
$
|
|
$
|
|
||||||
|
Diluted:
|
||||||||||||
|
Income from operations attributable to MTI
|
$
|
|
$
|
|
$
|
|
||||||
|
Cash dividends declared per common share
|
$
|
|
$
|
|
$
|
|
||||||
|
Shares used in computation of earnings per share:
|
||||||||||||
|
Basic
|
|
|
|
|||||||||
|
Diluted
|
|
|
|
|||||||||
See Notes to Consolidated Financial Statements, which are an integral part of these statements.
MINERALS TECHNOLOGIES INC. AND SUBSIDIARY COMPANIES
|
|
Year Ended December 31,
|
|||||||||||
|
(millions of dollars)
|
2022
|
2021
|
2020
|
|||||||||
|
Consolidated net income
|
$
|
|
$
|
|
$
|
|
||||||
|
Other comprehensive income (loss), net of tax:
|
||||||||||||
|
Foreign currency translation adjustments
|
(
|
)
|
(
|
)
|
|
|||||||
|
Pension and postretirement plan adjustments
|
|
|
(
|
)
|
||||||||
|
Unrealized gain (loss) on cash flow hedges
|
|
|
(
|
)
|
||||||||
|
Total other comprehensive loss, net of tax
|
(
|
)
|
(
|
)
|
(
|
)
|
||||||
|
Total comprehensive income including non-controlling interests
|
|
|
|
|||||||||
|
Less: Net income attributable to non-controlling interests
|
|
|
|
|||||||||
|
Less: Foreign currency translation adjustments attributable to non-controlling interests
|
(
|
)
|
(
|
)
|
|
|||||||
|
Comprehensive income attributable to non-controlling interests
|
|
|
|
|||||||||
|
Comprehensive income attributable to Minerals Technologies Inc.
|
$
|
|
$
|
|
$
|
|
||||||
See Notes to Consolidated Financial Statements, which are an integral part of these statements.
MINERALS TECHNOLOGIES INC. AND SUBSIDIARY COMPANIES
|
|
Year Ended December 31,
|
|||||||||||
|
(millions of dollars)
|
2022
|
2021
|
2020
|
|||||||||
|
Operating Activities:
|
||||||||||||
|
Consolidated net income
|
$
|
|
$
|
|
$
|
|
||||||
|
Adjustments to reconcile net income to net cash provided by operating activities:
|
||||||||||||
|
Depreciation, depletion and amortization
|
|
|
|
|||||||||
|
Loss on disposal of property, plant and equipment
|
(
|
)
|
|
|
||||||||
|
Deferred income taxes
|
(
|
)
|
|
(
|
)
|
|||||||
|
Pension amortization and settlement loss
|
|
|
|
|||||||||
|
Provision for bad debts
|
|
|
|
|||||||||
|
Stock-based compensation
|
|
|
|
|||||||||
|
Asset write-downs
|
|
|
|
|||||||||
|
Reduction of right of use asset
|
|
|
|
|||||||||
|
Non-cash debt extinguishment expenses
|
|
|
|
|||||||||
|
Other non-cash items
|
(
|
)
|
(
|
)
|
(
|
)
|
||||||
|
Changes in operating assets and liabilities
|
||||||||||||
|
Accounts receivable
|
(
|
)
|
(
|
)
|
|
|||||||
|
Inventories
|
(
|
)
|
(
|
)
|
|
|||||||
|
Pension plan funding
|
(
|
)
|
(
|
)
|
(
|
)
|
||||||
|
Accounts payable
|
|
|
(
|
)
|
||||||||
|
Restructuring liabilities
|
(
|
)
|
(
|
)
|
(
|
)
|
||||||
|
Income taxes payable
|
|
(
|
)
|
|
||||||||
|
Prepaid expenses and other
|
(
|
)
|
(
|
)
|
(
|
)
|
||||||
|
Net cash provided by operating activities
|
|
|
|
|||||||||
|
Investing Activities:
|
||||||||||||
|
Purchases of property, plant and equipment
|
(
|
)
|
(
|
)
|
(
|
)
|
||||||
|
Cash paid for acquisitions, net of cash acquired
|
(
|
)
|
(
|
)
|
(
|
)
|
||||||
|
Proceeds from sale of assets
|
|
|
|
|||||||||
|
Purchases of short-term investments
|
(
|
)
|
(
|
)
|
(
|
)
|
||||||
|
Proceeds from sale of short-term investments
|
|
|
|
|||||||||
|
Other investing activities
|
|
|
|
|||||||||
|
Net cash used in investing activities
|
(
|
)
|
(
|
)
|
(
|
)
|
||||||
|
Financing Activities:
|
||||||||||||
|
Long-term debt issuance
|
|
|
|
|||||||||
|
Debt issuance costs
|
(
|
)
|
|
(
|
)
|
|||||||
|
Repayment of long-term debt
|
(
|
)
|
(
|
)
|
(
|
)
|
||||||
|
Proceeds from issuance of short-term debt
|
|
|
|
|||||||||
|
Repayment of short-term debt
|
|
(
|
)
|
(
|
)
|
|||||||
|
Purchase of common stock for treasury
|
(
|
)
|
(
|
)
|
(
|
)
|
||||||
|
Proceeds from issuance of stock under option plan
|
|
|
|
|||||||||
|
Tax withholding payments for stock-based compensation
|
(
|
)
|
(
|
)
|
(
|
)
|
||||||
|
Dividends paid to non-controlling interests
|
(
|
)
|
(
|
)
|
(
|
)
|
||||||
|
Capital contribution from non-controlling interests
|
|
|
|
|||||||||
|
Cash dividends paid
|
(
|
)
|
(
|
)
|
(
|
)
|
||||||
|
Net cash provided by (used in) financing activities
|
(
|
)
|
|
(
|
)
|
|||||||
|
Effect of exchange rate changes on cash and cash equivalents
|
(
|
)
|
(
|
)
|
|
|||||||
|
Net increase (decrease) in cash and cash equivalents
|
(
|
)
|
(
|
)
|
|
|||||||
|
Cash and cash equivalents at beginning of period
|
|
|
|
|||||||||
|
Cash and cash equivalents at end of period
|
$
|
|
$
|
|
$
|
|
||||||
|
Supplemental disclosure of cash flow information:
|
||||||||||||
|
Non-cash financing activities
|
||||||||||||
|
Treasury stock purchases settled after period end
|
$
|
|
$
|
|
$
|
|
||||||
See Notes to Consolidated Financial Statements, which are an integral part of these statements.
MINERALS TECHNOLOGIES INC. AND SUBSIDIARY COMPANIES
|
|
Equity Attributable to MTI
|
|||||||||||||||||||||||||||
|
(millions of dollars)
|
Common
Stock
|
Additional
Paid-in
Capital
|
Retained
Earnings
|
Accumulated
Other
Comprehensive
Loss
|
Treasury
Stock
|
Non-controlling
Interests
|
Total
|
|||||||||||||||||||||
|
Balance as of December 31,
2019
|
$
|
|
$
|
|
$
|
|
$
|
(
|
)
|
$
|
(
|
)
|
$
|
|
$
|
|
||||||||||||
|
Net income
|
|
|
|
|
|
|
|
|||||||||||||||||||||
|
Other comprehensive loss
|
|
|
|
(
|
)
|
|
|
(
|
)
|
|||||||||||||||||||
|
Dividends declared
|
|
|
(
|
)
|
|
|
|
(
|
)
|
|||||||||||||||||||
|
Dividends paid to non-controlling interests
|
|
|
|
|
|
(
|
)
|
(
|
)
|
|||||||||||||||||||
|
Capital contribution from non-controlling interests
|
|
|
|
|
|
|
|
|||||||||||||||||||||
|
Issuance of shares pursuant to employee stock compensation plans
|
|
|
|
|
|
|
|
|||||||||||||||||||||
|
Purchase of common stock for treasury
|
|
|
|
|
(
|
)
|
|
(
|
)
|
|||||||||||||||||||
|
Stock-based compensation
|
|
|
|
|
|
|
|
|||||||||||||||||||||
|
Conversion of RSU's for tax withholding
|
|
(
|
)
|
|
|
|
|
(
|
)
|
|||||||||||||||||||
|
Balance as of December 31,
2020
|
$
|
|
$
|
|
$
|
|
$
|
(
|
)
|
$
|
(
|
)
|
$
|
|
$
|
|
||||||||||||
|
Net income
|
|
|
|
|
|
|
|
|||||||||||||||||||||
|
Other comprehensive loss
|
|
|
|
(
|
)
|
|
|
(
|
)
|
|||||||||||||||||||
|
Dividends declared
|
|
|
(
|
)
|
|
|
|
(
|
)
|
|||||||||||||||||||
|
Dividends paid to non-controlling interests
|
|
|
|
|
|
(
|
)
|
(
|
)
|
|||||||||||||||||||
|
Issuance of shares pursuant to employee stock compensation plans
|
|
|
|
|
|
|
|
|||||||||||||||||||||
|
Purchase of common stock for treasury
|
|
|
|
|
(
|
)
|
|
(
|
)
|
|||||||||||||||||||
|
Stock-based compensation
|
|
|
|
|
|
|
|
|||||||||||||||||||||
|
Conversion of RSU's for tax withholding
|
|
(
|
)
|
|
|
|
|
(
|
)
|
|||||||||||||||||||
|
Balance as of December 31,
2021
|
$
|
|
$
|
|
$
|
|
$
|
(
|
)
|
$
|
(
|
)
|
$
|
|
$
|
|
||||||||||||
|
Net income
|
|
|
|
|
|
|
|
|||||||||||||||||||||
|
Other comprehensive loss
|
|
|
|
(
|
)
|
|
(
|
)
|
(
|
)
|
||||||||||||||||||
|
Dividends declared
|
|
|
(
|
)
|
|
|
|
(
|
)
|
|||||||||||||||||||
|
Dividends paid to non-controlling interests
|
|
|
|
|
|
(
|
)
|
(
|
)
|
|||||||||||||||||||
|
Issuance of shares pursuant to employee stock compensation plans
|
|
|
|
|
|
|
|
|||||||||||||||||||||
|
Purchase of common stock for treasury
|
|
|
|
|
(
|
)
|
|
(
|
)
|
|||||||||||||||||||
|
Stock-based compensation
|
|
|
|
|
|
|
|
|||||||||||||||||||||
|
Conversion of RSU's for tax withholding
|
|
(
|
)
|
|
|
|
|
(
|
)
|
|||||||||||||||||||
|
Balance as of December 31,
2022
|
$
|
|
$
|
|
$
|
|
$
|
(
|
)
|
$
|
(
|
)
|
$
|
|
$
|
|
||||||||||||
See Notes to Consolidated Financial Statements, which are an integral part of these statements.
MINERALS TECHNOLOGIES INC. AND SUBSIDIARY COMPANIES
NOTES TO CONSOLIDATED FINANCIAL STATEMENTS
Note 1. Summary of Significant Accounting Policies
Business
Minerals Technologies Inc. (the "Company") is a resource- and technology-based company that develops, produces and markets on a worldwide basis a broad range of specialty mineral, mineral-based and synthetic mineral products and supporting systems and services.
Basis of Presentation
The accompanying consolidated financial statements include the accounts of the Company, its wholly and majority-owned subsidiaries, as well as variable interest entities for which the Company is the primary beneficiary. All intercompany balances and transactions have been eliminated in consolidation.
Use of Estimates
The Company employs accounting policies that are in accordance with U.S. generally accepted accounting principles and require management to make estimates and assumptions relating to the reporting of assets and liabilities and the disclosure of contingent assets and liabilities at the date of the consolidated financial statements and the reported amounts of revenue and expenses during the reported period. Significant estimates include those related to revenue recognition, valuation of long-lived assets, goodwill and other intangible assets, pension plan assumptions, income tax, and litigation and environmental liabilities. Actual results could differ from those estimates.
Cash Equivalents and Short-term Investments
The Company considers all highly liquid investments with original maturities of three months or less to be cash equivalents. Short-term investments consist of financial instruments, mainly bank deposits, with original maturities beyond three months, but less than twelve months. Short-term investments amounted to $
5.6
million and $
4.9
million at December 31, 2022 and 2021, respectively. There were
no
unrealized holding gains and losses on the short-term bank investments held at December 31, 2022.
Trade Accounts Receivable
Trade accounts receivables are recorded at the invoiced amount and do not bear interest. The allowance for doubtful accounts is the Company's best estimate of the amount of probable credit losses in the Company's existing accounts receivable. The Company determines the allowance based on historical write-off experience and specific allowances for bankrupt customers. The Company also analyzes the collection history and financial condition of its other customers, considering current industry conditions and determines whether an allowance needs to be established. The Company reviews its allowance for doubtful accounts monthly. Past due balances over
90
days based on payment terms are reviewed individually for collectability. Allowance for doubtful accounts was $
15.1
million and $
15.0
million at December 31, 2022 and 2021, respectively. Account balances are charged off against the allowance after all means of collection have been exhausted and the potential for recovery is considered remote. The Company does not have any off-balance-sheet credit exposure related to its customers.
Inventories
Inventories are valued at the lower of cost or market. Cost is determined by the first-in, first-out (FIFO) method.
Additionally, items such as idle facility expense, excessive spoilage, freight handling costs, and re-handling costs are recognized as current period charges. The allocation of fixed production overheads to the costs of conversion are based upon the normal capacity of the production facility. Fixed overhead costs associated with idle capacity are expensed as incurred.
MINERALS TECHNOLOGIES INC. AND SUBSIDIARY COMPANIES
NOTES TO CONSOLIDATED FINANCIAL STATEMENTS
Property, Plant and Equipment
Property, plant and equipment are recorded at cost. Significant improvements are capitalized, while maintenance and repair expenditures are charged to operations as incurred. The Company capitalizes interest cost as a component of construction in progress. The straight-line method of depreciation is used for substantially all of the assets for financial reporting purposes, except for mining related equipment which uses units-of-production method. The annual rates of depreciation are
3
% -
6.67
% for buildings,
6.67
% -
12.5
% for machinery and equipment,
8
% -
12.5
% for furniture and fixtures and
12.5
% -
25
% for computer equipment and software-related assets. The estimated useful lives of our PCC production facilities and machinery and equipment pertaining to our natural stone mining and processing plants and our chemical plants are
15
years.
Property, plant and equipment are depreciated over their useful lives. Useful lives are based on management's estimates of the period that the assets can generate revenue, which does not necessarily coincide with the remaining term of a customer's contractual obligation to purchase products made using those assets. The Company's sales of PCC are predominantly pursuant to long-term evergreen contracts, initially
ten years
in length, with paper mills at which the Company operates satellite PCC plants. The terms of many of these agreements have been extended, often in connection with an expansion of the satellite PCC plant. Failure of a PCC customer to renew an agreement or continue to purchase PCC from a Company facility could result in an impairment of assets charge or accelerated depreciation at such facility.
Depletion of mineral reserves is determined on a unit-of-extraction basis for financial reporting purposes, based upon proven and probable reserves, and generally on a percentage depletion basis for tax purposes.
Stripping Costs Incurred During Production
Stripping costs are those costs incurred for the removal of waste materials for the purpose of accessing ore body that will be produced commercially. Stripping costs incurred during the production phase of a mine are variable costs that are included in the costs of inventory produced during the period that the stripping costs are incurred.
Accounting for the Impairment of Long-Lived Assets
Long-lived assets are reviewed for impairment whenever events or changes in circumstances indicate that the carrying amount of an asset may not be recoverable. If events or changes in circumstances indicate that the carrying amount of an asset may not be recoverable, the Company estimates the undiscounted future cash flows (excluding interest), resulting from the use of the asset and its ultimate disposition. If the sum of the undiscounted cash flows (excluding interest) is less than the carrying value, the Company recognizes an impairment loss, measured as the amount by which the carrying value exceeds the fair value of the asset, determined principally using discounted cash flows.
Goodwill and Other Intangible Assets
Goodwill represents the excess of purchase price and related costs over the value assigned to the net tangible and identifiable intangible assets of businesses acquired. Goodwill is not amortized, but instead assessed for impairment. Intangible assets with estimable useful lives are amortized on a straight-line basis over their respective estimated lives to the estimated residual values, and reviewed for impairment.
The Company performs a qualitative assessment for each of its reporting units to determine if the two-step process for impairment testing is required. If the Company determines that it is more likely than not that the fair value of a reporting unit is less than its carrying amount, the Company would then evaluate the recoverability of goodwill using a two-step impairment test approach at the reporting unit level. In the first step, the fair value for the reporting unit is compared to its book value including goodwill. In the case that the fair value of the reporting unit is less than book value, a second step is performed which compares the fair value of the reporting unit's goodwill to the book value of the goodwill. The fair value for the goodwill is determined based on the difference between the fair values of the reporting unit and the net fair values of the identifiable assets and liabilities of such reporting unit. If the fair value of the goodwill is less than the book value, the difference is recognized as impairment.
In addition to the assessment of goodwill impairment, the Company also reviews its other identifiable intangibles for impairment. Each year, the Company reviews whether events or changes in circumstances could indicate that a long-lived asset's carrying amount may not be recoverable. Should such events occur, the value of intangibles not recoverable would be recognized as impairment.
MINERALS TECHNOLOGIES INC. AND SUBSIDIARY COMPANIES
NOTES TO CONSOLIDATED FINANCIAL STATEMENTS
Investment in Joint Ventures
The Company uses the equity method of accounting to incorporate the results of its investments in companies in which it has significant influence but does not control; and cost method of accounting in companies in which it cannot exercise significant control. The Company records the equity in earnings of its investments in joint ventures on a one-month lag. At December 31, 2022 and 2021, the book value of the Company’s equity method investments was $
16.5
million and $
17.5
million.
Accounting for Asset Retirement Obligations
The Company provides for obligations associated with the retirement of long-lived assets and the associated asset retirement costs. The fair value of a liability for an asset retirement obligation is recognized in the period in which it is incurred if a reasonable estimate of fair value can be made. The associated asset retirement costs are capitalized as part of the carrying amount of the long-lived asset. The Company also provides for legal obligations to perform asset retirement activities where timing or methods of settlement are conditional on future events.
The Company also records liabilities related to land reclamation as a part of the asset retirement obligations. The Company mines land for various minerals using a surface-mining process that requires the removal of overburden. In many instances, the Company is obligated to restore the land upon completion of the mining activity. As the overburden is removed, the Company recognizes this liability for land reclamation based on the estimated fair value of the obligation. The obligation is adjusted to reflect the passage of time and changes in estimated future cash outflows.
Fair Value of Financial Instruments
The recorded amounts of cash and cash equivalents, receivables, short-term borrowings, accounts payable, accrued interest, and variable-rate long-term debt approximate fair value because of the short maturity of those instruments or the variable nature of underlying interest rates. Short-term investments are recorded at cost, which approximates fair market value.
Derivative Financial Instruments
The Company records derivative financial instruments which are used to hedge certain foreign exchange risk at fair value on the balance sheet. See Note 12 for a full description of the Company's hedging activities and related accounting policies.
Revenue Recognition
Revenue is recognized at the point in time when the customer obtains control of the promised goods or services in an amount that reflects the consideration we expect to receive in exchange for those goods or services. The Company's revenues are primarily derived from the sale of products. Our primary performance obligation is satisfied upon shipment or delivery to our customer based on written sales terms, which is also when control is transferred. Revenues from sales of equipment are recorded upon completion of installation and transfer of control to the customer. Revenue where our performance obligations are satisfied in phases is recognized over time using certain input measures based on the measurement of the value transferred to the customer, including milestones achieved. Revenues from services are recorded when the services are performed.
In most of our PCC contracts, the price per ton is based upon the total number of tons sold to the customer during the year. Under those contracts, the price billed to the customer for shipments during the year is based on periodic estimates of the total annual volume that will be sold to the customer. Revenues are adjusted at the end of each year to reflect the actual volume sold. There were
no
significant revenue adjustments in the fourth quarter of 2022 and 2021, respectively. We have consignment arrangements with certain customers in our Refractories segment. Revenues for these transactions are recorded when the consigned products are consumed by the customer.
MINERALS TECHNOLOGIES INC. AND SUBSIDIARY COMPANIES
NOTES TO CONSOLIDATED FINANCIAL STATEMENTS
Foreign Currency
The assets and liabilities of the Company's international subsidiaries are translated into U.S. dollars using exchange rates at the respective balance sheet date. The resulting translation adjustments are recorded in accumulated other comprehensive income (loss) in shareholders' equity. Income statement items are generally translated at monthly average exchange rates prevailing during the period. International subsidiaries operating in highly inflationary economies translate non-monetary assets at historical rates, while net monetary assets are translated at current rates, with the resulting translation adjustments included in net income. At December 31, 2022, the Company had no international subsidiaries operating in highly inflationary economies.
Income Taxes
Deferred tax assets and liabilities are recognized for the estimated future tax consequences attributable to differences between the financial statement carrying amounts of existing assets and liabilities and their respective tax bases. Deferred tax assets and liabilities are measured using enacted tax rates in effect for the year in which those temporary differences are expected to be recovered or settled. The effect on deferred tax assets and liabilities of a change in tax rates is recognized in income in the period that includes the enactment date.
The Company operates in multiple taxing jurisdictions, both within the U.S. and outside the U.S. In certain situations, a taxing authority may challenge positions that the Company has adopted in its income tax filings. The Company regularly assesses its tax position for such transactions and includes reserves for those differences in position. The reserves are utilized or reversed once the statute of limitations has expired or the matter is otherwise resolved.
The application of income tax law is inherently complex. Laws and regulations in this area are voluminous and are often ambiguous. As such, we are required to make many subjective assumptions and judgments regarding our income tax exposures. Interpretations of and guidance surrounding income tax laws and regulations change over time. As such, changes in our subjective assumptions and judgments can materially affect amounts recognized in the consolidated balance sheets and statements of operations. The Company's accounting policy is to recognize interest and penalties as part of its provision for income taxes. See Note 8 for additional detail on our uncertain tax positions.
The accompanying financial statements do not include a provision for foreign withholding taxes on international subsidiaries' unremitted earnings, which are expected to be permanently reinvested overseas.
Research and Development
Research and development costs are expensed as incurred.
Accounting for Stock-Based Compensation
The Company recognizes compensation expense for share-based awards based upon the grant date fair value over the vesting period.
Pension and Post-retirement Benefits
The Company has defined benefit pension plans covering the majority of its employees. The benefits are generally based on years of service and an employee's modified career earnings.
The Company also provides post-retirement healthcare benefits for the majority of its retirees and employees in the United States. The Company measures the costs of its obligation based on its best estimate. The net periodic costs are recognized as employees render the services necessary to earn the post-retirement benefits.
MINERALS TECHNOLOGIES INC. AND SUBSIDIARY COMPANIES
NOTES TO CONSOLIDATED FINANCIAL STATEMENTS
Environmental
Expenditures that relate to current operations are expensed or capitalized as appropriate. Expenditures that relate to an existing condition caused by past operations and which do not contribute to current or future revenue generation are expensed. Liabilities are recorded when it is probable the Company will be obligated to pay amounts for environmental site evaluation, remediation or related costs, and such amounts can be reasonably estimated.
Earnings Per Share
Basic earnings per share have been computed based upon the weighted average number of common shares outstanding during the period.
Diluted earnings per share have been computed based upon the weighted average number of common shares outstanding during the period assuming the issuance of common shares for all potentially dilutive common shares outstanding.
Subsequent Events
The Company has evaluated for subsequent events through the date of issuance of its financial statements.
Recently Issued Accounting Standards
Changes to accounting principles generally accepted in the United States of America (U.S. GAAP) are established by the Financial Accounting Standards Board (FASB) in the form of accounting standards updates (ASUs) to the FASB’s Accounting Standards Codification. The Company considers the applicability and impact of all ASUs. All recently issued ASUs were assessed and determined to be either not applicable or are expected to have minimal impact on our consolidated financial position and results of operations.
Note 2. Leases
We determine if an arrangement is a lease at inception. The Company has operating leases for premises, equipment, rail cars and automobiles. Our leases have remaining lease terms of
1
year to
50
years, some of which may include options to extend the leases further. The Company considers these options in determining the lease term used to establish the right-of-use assets and lease liabilities. As most of our leases do not provide an implicit rate, we use our incremental borrowing rate based upon the information available at commencement date, or as of implementation of ASC 842, in determining the present value of lease payments.
Leases with an initial term of 12 months or less are not recorded on the balance sheet. We recognize lease expense for these leases on a straight-line basis over the lease term. Certain lease agreements contain both lease and non-lease components. We account for lease components together with non-lease components.
MINERALS TECHNOLOGIES INC. AND SUBSIDIARY COMPANIES
NOTES TO CONSOLIDATED FINANCIAL STATEMENTS
Operating lease cost was $
15.7
million, $
15.3
million and $
15.3
for the years ended December 31, 2022 , December 31, 2021 and December 31, 2020, respectively. The components of lease costs are as follows:
|
|
December 31,
|
|||||||||||
|
(millions of dollars)
|
2022
|
2021
|
2020
|
|||||||||
|
Operating lease cost
|
$
|
|
$
|
|
$
|
|
||||||
|
Short-term lease cost
|
|
|
|
|||||||||
|
Total
|
$
|
|
$
|
|
$
|
|
||||||
Supplemental cash flow information and non-cash activity related to our leases are as follows:
|
(millions of dollars)
|
December 31,
2022
|
|||
|
Operating cash flows information:
|
||||
|
Cash paid for amounts included in the measurement of lease liabilities
|
$
|
|
||
|
Non-cash activity:
|
||||
|
Right-of-use assets obtained in the exchange for operating lease liabilities
|
$
|
|
||
Weighted average remaining lease term, and weighted average discount rates related to the Company’s leases were as follows:
|
Weighted-average remaining operating lease term (in years)
|
|
|||
|
Weighted-average operating leases discount rate
|
|
%
|
The following table summarizes the Company's outstanding lease assets and liabilities and their classification on the Consolidated Balance Sheet:
|
December 31,
|
|||||||||
|
(millions of dollars)
|
Balance Sheet Classification
|
2022
|
2021
|
||||||
|
Right-of-use-asset
|
|
$
|
|
$
|
|
||||
|
Lease liability - current
|
|
|
|
||||||
|
Lease liability - non-current
|
|
|
|
||||||
Future minimum lease payments under the Company's leases as of
December 31,
2022
were as follows:
|
(millions of dollars)
|
December 31,
2022
|
|||
|
2023
|
$
|
|
||
|
2024
|
|
|||
|
2025
|
|
|||
|
2026
|
|
|||
|
2027
|
|
|||
|
Thereafter
|
|
|||
|
Total future minimum lease payments
|
|
|||
|
Less imputed interest
|
(
|
)
|
||
|
Total
|
$
|
|
||
MINERALS TECHNOLOGIES INC. AND SUBSIDIARY COMPANIES
NOTES TO CONSOLIDATED FINANCIAL STATEMENTS
Note 3. Revenue from Contracts with Customers
The Company’s revenues are primarily derived from the sale of products in product lines within our Performance Materials, Specialty Minerals and Refractories businesses.
Our primary performance obligation (the sale of products) is satisfied upon shipment or delivery to our customers based on written sales terms, which is also when control is transferred. In most of our contracts in our Paper PCC product line, which is in our Specialty Minerals segment, the price per ton is based upon the total number of tons sold to the customer during the year. Under these contracts, the price billed to the customer for shipments during the year is based on periodic estimates of the total annual volume that will be sold to such customer. Revenues are adjusted at the end of each year to reflect the actual volume sold.
Revenue from sales of equipment, primarily in our Refractory products product line within our Refractories segment, is recorded upon completion of installation and control is transferred to the customer. Revenue from services is recorded when the services have been performed. Included within our Refractory products product line are certain consignment arrangements with certain customers in our Refractories segment. Revenues for these transactions are recorded when the consigned products are consumed by the customer and control is transferred.
Revenue where our performance obligations are satisfied in phases is recognized over time using certain input measures based on the measurement of the value transferred to the customer, including milestones achieved.
The following table disaggregates our revenue by major source (product line) for the years ended December 31, 2022, 2021 and 2020:
|
|
Year Ended December 31,
|
|||||||||||
|
(millions of dollars)
|
2022
|
2021
|
2020
|
|||||||||
|
Net Sales
|
||||||||||||
|
Household, Personal Care & Specialty Products
|
$
|
|
$
|
|
$
|
|
||||||
|
Metalcasting
|
|
|
|
|||||||||
|
Environmental Products
|
|
|
|
|||||||||
|
Building Materials
|
|
|
|
|||||||||
|
Performance Materials
|
|
|
|
|||||||||
|
Paper PCC
|
|
|
|
|||||||||
|
Specialty PCC
|
|
|
|
|||||||||
|
Ground Calcium Carbonate
|
|
|
|
|||||||||
|
Talc
|
|
|
|
|||||||||
|
Specialty Minerals
|
|
|
|
|||||||||
|
Refractory Products
|
|
|
|
|||||||||
|
Metallurgical Products
|
|
|
|
|||||||||
|
Refractories
|
|
|
|
|||||||||
|
Total
|
$
|
|
$
|
|
$
|
|
||||||
MINERALS TECHNOLOGIES INC. AND SUBSIDIARY COMPANIES
NOTES TO CONSOLIDATED FINANCIAL STATEMENTS
Note 4. Acquisitions
Normerica Inc.
On July 26, 2021, the Company completed the acquisition of Normerica Inc., a leading North American supplier of premium pet care products. Normerica has production facilities in Canada, the U.S. and Thailand. As a leader in the pet product industry, Normerica provides premium products, both branded and private label to world-class retailers. Its product portfolio consists primarily of bentonite-based cat litter products which are supplied from a network of strategically located manufacturing facilities in Canada and the United States. The results of Normerica are included within our Household, Personal Care & Specialty Products product line in our Performance Materials segment. The fair value of the total consideration transferred, net of cash acquired, was $
187.5
million.
The acquisition has been accounted for using the acquisition method of accounting, which requires, among other things, that we recognize the assets acquired and liabilities assumed at their respective fair values as of the acquisition date. As of July 26, 2022, the purchase price allocation has been finalized.
The following table summarizes the Company's final amounts recognized for assets acquired and liabilities assumed for the Normerica acquisition, which did not change from the amounts previously reported on the Company's Form 10-K for the year ended December 31, 2021:
|
(millions of dollars)
|
Final
Allocation
|
|||
|
Accounts receivable
|
$
|
|
||
|
Inventories
|
|
|||
|
Other current assets
|
|
|||
|
Property, plant and equipment
|
|
|||
|
Goodwill
|
|
|||
|
Intangible assets
|
|
|||
|
Total assets acquired
|
|
|||
|
Accounts payable
|
|
|||
|
Accrued expenses
|
|
|||
|
Total liabilities assumed
|
|
|||
|
Net assets acquired
|
$
|
|
||
The Company used the income, market, or cost approach (or a combination thereof) for the valuation and used valuation inputs and analyses that were based on market participant assumptions. Market participants are considered to be buyers and sellers unrelated to the Company in the principal or most advantageous market for the asset or liability. For certain items, the carrying value was determined to be a reasonable approximation of fair value based on the information available.
Goodwill was calculated as the excess of the consideration transferred over the assets acquired and represents the estimated future economic benefits arising from other assets acquired that could not be individually identified and separately recognized. The goodwill is primarily attributable to fair value of expected synergies from combining the MTI and Normerica businesses and was allocated to the Performance Materials segment.
Intangible assets acquired mainly include tradenames and customer relationships. Tradenames have an estimated useful life of approximately
15
years and customer relationships have an estimated useful life of approximately
20
years.
The Company did not present pro forma and other financial information for the Normerica acquisition, as this is not considered to be a material business acquisition.
MINERALS TECHNOLOGIES INC. AND SUBSIDIARY COMPANIES
NOTES TO CONSOLIDATED FINANCIAL STATEMENTS
Concept Pet Heimtierprodukte GmbH
On April 29, 2022, the Company completed the acquisition of Concept Pet Heimtierprodukte GmbH (“Concept Pet”), a European supplier of pet litter products. The purchase of Concept Pet supports the expansion of our European pet care business, as well as providing additional mineral reserves. The purchase price was $
28.0
million and the acquisition was financed through cash on hand. The fair value of the total consideration transferred, net of cash acquired, was $
22.4
million. The results of Concept Pet are included within our Household, Personal Care & Specialty Products product line in our Performance Materials segment. The acquisition has been accounted for using the acquisition method of accounting, which requires, among other things, that we recognize the assets acquired and liabilities assumed at their respective fair values as of the acquisition date. The Company has preliminarily recorded goodwill of $
9.2
million and intangible assets of $
4.3
million relating to this acquisition.
Other
In November 2021, the Company acquired Specialty PCC assets from a company in the Midwest United States for $
6.9
million.
In the third quarter of 2020, the Company acquired the assets of a mining and hauling company in the western United States for $
9.2
million to support our bentonite clay mining operations.
The Company incurred $
5.1
million and $
4.0
million of acquisition-related costs during 2022 and 2021, respectively, which are reflected within the acquisition-related expenses line of the Consolidated Statements of Income.
Note 5. Restructuring and Other Items, net
In the third quarter of 2021, PCA Corporation discontinued the use of PCC at their mill in Jackson, Alabama. As a result, the Company recorded a non-cash asset write-down of $
0.7
million and $
0.4
million in severance related and other closure costs for its Paper PCC satellite facility at this mill.
During the third quarter of 2020, Domtar Corporation announced the permanent shut down of their previously idled paper machine at their mill in Ashdown, Arkansas. As a result, the Company recorded a non-cash asset write-down charge of $
1.1
million for its Paper PCC satellite facility at this mill.
During the second quarter of 2020, Verso Papers announced they would be idling
two
of their paper mills indefinitely. As a result, the Company recorded a non-cash asset write-down charge of $
6.0
million and $
0.3
million in severance related costs for its Paper PCC satellite facilities at these mills. The Company also recorded lease termination costs at
one
of these closed mills.
The following table outlines the amount of restructuring charges recorded within the Consolidated Statements of Income and the segments they relate to:
|
Restructuring and Other Items, net
|
Year Ended December 31,
|
|||||||||||
|
(millions of dollars)
|
2022
|
2021
|
2020
|
|||||||||
|
Asset Write-Downs
|
||||||||||||
|
Specialty Minerals
|
$
|
|
$
|
|
$
|
|
||||||
|
Total asset write-down charges
|
$
|
|
$
|
|
$
|
|
||||||
|
Severance and other costs
|
||||||||||||
|
Specialty Minerals
|
$
|
|
$
|
|
$
|
|
||||||
|
Total severance and other employee costs
|
$
|
|
$
|
|
$
|
|
||||||
|
Total restructuring and other items, net
|
$
|
|
$
|
|
$
|
|
||||||
At December 31, 2022 and 2021, the Company had $
0.0
million and $
2.2
million, respectively, included within other current liabilities within our Consolidated Balance Sheets for cash expenditures needed to satisfy remaining obligations under these reorganization initiatives. The Company paid its remaining restructuring obligations during 2022.
MINERALS TECHNOLOGIES INC. AND SUBSIDIARY COMPANIES
NOTES TO CONSOLIDATED FINANCIAL STATEMENTS
The following table is a reconciliation of our restructuring liability balance as of December 31, 2022 and 2021:
|
|
December 31,
|
|||||||
|
(millions of dollars)
|
2022
|
2021
|
||||||
|
Restructuring liability, beginning of period
|
$
|
|
$
|
|
||||
|
Additional provisions
|
|
|
||||||
|
Cash payments
|
(
|
)
|
(
|
)
|
||||
|
Other
|
(
|
)
|
|
|||||
|
Restructuring liability, end of period
|
$
|
|
$
|
|
||||
Note 6. Stock-Based Compensation
The Company’s 2015 Stock Award and Incentive Plan provides for grants of incentive and non-qualified stock options, restricted stock, restricted stock units, stock appreciation rights, stock awards and performance unit awards (the 2015 Stock Award and Incentive Plan, as amended, referred to herein as the “Plan” and together with its predecessor for awards granted prior to May 2015, the 2001 Stock Award and Incentive Plan, as amended and restated, the “Plans”). The Plans are administered by the Compensation Committee of the Board of Directors. Stock options granted under the Plans generally have a
ten year
term. The exercise price for stock options are at prices at or above the fair market value of the common stock on the date of the grant, and each award of stock options will vest ratably over a specified period, generally
three years
.
Stock-based compensation expense is recognized in the consolidated financial statements for stock options based on the grant date fair value.
Net income for years ended 2022, 2021 and 2020 include $
4.8
million, $
4.9
million and $
4.6
million pre-tax compensation costs, respectively, related to stock option expense as a component of marketing and administrative expenses. All stock option expense is recognized in the consolidated statements of operations. The related tax benefit included in the statement of income on the non-qualified stock options was $
1.3
million, $
1.3
million and $
1.2
million for 2022, 2021 and 2020, respectively.
Stock Options
The fair value of options granted is estimated on the date of grant using the Black-Scholes valuation model. Compensation expense is recognized only for those options expected to vest, with forfeitures estimated at the date of grant based on the Company's historical experience and future expectations. The forfeiture rate assumption used for the periods ended December 31, 2022, 2021 and 2020 was
8.09
%,
8.38
% and
8.45
%, respectively.
The weighted average grant date fair value for stock options granted during the years ended December 31, 2022, 2021 and 2020 was $
24.26
, $
21.62
and $
18.99
, respectively. The weighted average grant date fair value for stock options vested during 2022, 2021 and 2020 was $
19.82
, $
20.56
and $
23.85
, respectively. The total intrinsic value of stock options exercised during the years ended December 31, 2022, 2021 and 2020 was $
2.0
million, $
6.1
million and $
2.3
million, respectively.
The fair value for stock awards was estimated at the date of grant using the Black-Scholes option valuation model with the following weighted average assumptions for the years ended December 31, 2022, 2021 and 2020:
|
|
Year Ended December 31,
|
|||||||||||
|
2022
|
2021
|
2020
|
||||||||||
|
Expected life (in years)
|
|
|
|
|||||||||
|
Interest rate
|
|
%
|
|
%
|
|
%
|
||||||
|
Volatility
|
|
%
|
|
%
|
|
%
|
||||||
|
Expected dividend yield
|
|
%
|
|
%
|
|
%
|
||||||
MINERALS TECHNOLOGIES INC. AND SUBSIDIARY COMPANIES
NOTES TO CONSOLIDATED FINANCIAL STATEMENTS
The expected term of the options represents the estimated period of time until exercised and is based on historical experience of similar awards, based upon contractual terms, vesting schedules, and expectations of future employee behavior. The expected stock-price volatility is based upon the historical and implied volatility of the Company's stock. The interest rate is based upon the implied yield on U.S. Treasury bills with an equivalent remaining term. Estimated dividend yield is based upon historical dividends paid by the Company.
The following table summarizes stock option activity for the year ended December 31, 2022:
|
|
Awards
|
Weighted Average
Exercise Price
per Share
|
Weighted Average
Remaining Contractual
Life (Years)
|
Aggregate
Intrinsic Value
(Millions)
|
||||||||||||
|
Awards outstanding at December 31,
2021
|
|
$
|
|
|||||||||||||
|
Granted
|
|
|
||||||||||||||
|
Exercised
|
(
|
)
|
|
|||||||||||||
|
Canceled
|
(
|
)
|
|
|||||||||||||
|
Expired
|
(
|
)
|
|
|||||||||||||
|
Awards outstanding at December 31,
2022
|
|
$
|
|
|
$
|
|
||||||||||
|
Awards exercisable at December 31,
2022
|
|
$
|
|
|
$
|
|
||||||||||
The aggregate intrinsic value above is calculated before applicable income taxes, based on the Company's closing stock price of $
60.72
as of the last business day of the period ended December 31, 2022 had all options been exercised on that date. The weighted average intrinsic value of the options exercised during 2022, 2021 and 2020 was $
16.34
, $
24.43
and $
24.41
per share, respectively. As of December 31, 2022, total unrecognized stock-based compensation expense related to non-vested stock options was approximately $
4.8
million, which is expected to be recognized over a weighted average period of approximately
three years
.
The Company issues new shares of common stock upon the exercise of stock options.
Non-vested stock option activity for the year ended December 31, 2022 is as follows:
|
|
Awards
|
Weighted Average
Grant Date Fair
Value per Share
|
||||||
|
Nonvested awards outstanding at December 31,
2021
|
|
$
|
|
|||||
|
Granted
|
|
|
||||||
|
Vested
|
(
|
)
|
|
|||||
|
Canceled
|
(
|
)
|
|
|||||
|
Nonvested awards outstanding at December 31,
2022
|
|
$
|
|
|||||
Deferred Restricted Stock Units
The Company has granted key employees units consisting of rights to receive shares of the Company's common stock pursuant to the Plans. The rights will be deferred for a specified number of years of service, subject to restrictions on transfer and other conditions. Compensation expense for these shares is recognized over the vesting period. The Company granted units consisting of rights to receive
98,464
shares,
102,309
shares and
108,212
shares for the periods ended December 31, 2022, 2021 and 2020, respectively. The fair value was determined based on the market value of unrestricted shares. As of December 31, 2022, there was unrecognized stock-based compensation related to deferred restricted stock units of $
6.4
million, which will be recognized over approximately the next
three years
. The compensation expense amortized with respect to all units was approximately $
5.7
million, $
5.9
million and $
5.6
million for the periods ended December 31, 2022, 2021 and 2020, respectively. In addition, the Company recorded reversals of $
2.7
million, $
2.6
million and $
2.3
million for periods ended December 31, 2022, 2021 and 2020, respectively, related mostly to the conversion of units for tax withholding purposes. Such costs and reversals are included in marketing and administrative expenses.
MINERALS TECHNOLOGIES INC. AND SUBSIDIARY COMPANIES
NOTES TO CONSOLIDATED FINANCIAL STATEMENTS
The following table summarizes the deferred restricted stock unit activity for the Plan:
|
|
Awards
|
Weighted Average
Grant Date Fair
Value per Share
|
||||||
|
Unvested balance at December 31,
2021
|
|
$
|
|
|||||
|
Granted
|
|
|
||||||
|
Vested
|
(
|
)
|
|
|||||
|
Canceled
|
(
|
)
|
|
|||||
|
Unvested balance at December 31,
2022
|
|
$
|
|
|||||
Note 7. Earnings Per Share (EPS)
|
|
Year Ended December 31,
|
|||||||||||
|
(in millions, except per share data)
|
2022
|
2021
|
2020
|
|||||||||
|
Net income attributable to MTI
|
$
|
|
$
|
|
$
|
|
||||||
|
Weighted average shares outstanding
|
|
|
|
|||||||||
|
Dilutive effect of stock options and deferred restricted stock units
|
|
|
|
|||||||||
|
Weighted average shares outstanding, adjusted
|
|
|
|
|||||||||
|
Basic earnings per share attributable to MTI
|
$
|
|
$
|
|
$
|
|
||||||
|
Diluted earnings per share attributable to MTI
|
$
|
|
$
|
|
$
|
|
||||||
Of the options outstanding of
1,363,418
,
1,330,002
and
1,363,366
for the years ended December 31, 2022, 2021 and 2020, respectively, options to purchase
754,867
shares,
510,683
shares and
591,322
shares of common stock for the years ended December 31, 2022, 2021 and 2020, respectively, were not included in the computation of diluted earnings per share because they were anti-dilutive, as the exercise prices of the options were greater than the average market price of the common shares.
Note 8. Income Taxes
Income from operations before provision for taxes by domestic and foreign source is as follows:
|
|
Year Ended December 31,
|
|||||||||||
|
(millions of dollars)
|
2022
|
2021
|
2020
|
|||||||||
|
Income from operations before income taxes and income from affiliates and joint ventures:
|
||||||||||||
|
Domestic
|
$
|
|
$
|
|
$
|
|
||||||
|
Foreign
|
|
|
|
|||||||||
|
$
|
|
$
|
|
$
|
|
|||||||
MINERALS TECHNOLOGIES INC. AND SUBSIDIARY COMPANIES
NOTES TO CONSOLIDATED FINANCIAL STATEMENTS
The provision (benefit) for taxes on income consists of the following:
|
|
Year Ended December 31,
|
|||||||||||
|
(millions of dollars)
|
2022
|
2021
|
2020
|
|||||||||
|
Domestic
|
||||||||||||
|
Taxes currently payable
|
||||||||||||
|
Federal
|
$
|
|
$
|
(
|
)
|
$
|
(
|
)
|
||||
|
State and local
|
|
|
|
|||||||||
|
Deferred income taxes
|
(
|
)
|
|
|
||||||||
|
Domestic tax provision (benefit)
|
|
|
(
|
)
|
||||||||
|
Foreign
|
||||||||||||
|
Taxes currently payable
|
|
|
|
|||||||||
|
Deferred income taxes
|
(
|
)
|
|
(
|
)
|
|||||||
|
Foreign tax provision
|
|
|
|
|||||||||
|
Total tax provision (benefit)
|
$
|
|
$
|
|
$
|
|
||||||
The provision (benefit) for taxes on income shown in the previous table is classified based on the location of the taxing authority, regardless of the location in which the taxable income is generated.
The major elements contributing to the difference between the U.S. federal statutory tax rate and the consolidated effective tax rate are as follows:
|
|
Year Ended December 31,
|
|||||||||||
|
2022
|
2021
|
2020
|
||||||||||
|
U.S. statutory rate
|
|
%
|
|
%
|
|
%
|
||||||
|
Depletion
|
(
|
)%
|
(
|
)%
|
(
|
)%
|
||||||
|
Difference between tax provided on foreign earnings and the U.S. statutory rate
|
|
%
|
|
%
|
|
%
|
||||||
|
Global Intangible Low-Tax Income (GILTI)
|
|
%
|
|
%
|
|
%
|
||||||
|
Foreign Derived Intangible Income
|
|
(
|
)%
|
(
|
)%
|
|||||||
|
State and local taxes, net of federal tax benefit
|
(
|
)%
|
|
%
|
|
|||||||
|
Tax credits and foreign dividends
|
(
|
)%
|
(
|
)%
|
(
|
)%
|
||||||
|
Impact of uncertain tax positions
|
(
|
)%
|
(
|
)%
|
(
|
)%
|
||||||
|
Impact of officer's non-deductible compensation
|
|
%
|
|
%
|
|
%
|
||||||
|
Other
|
|
%
|
|
%
|
|
|||||||
|
Consolidated effective tax rate
|
|
%
|
|
%
|
|
%
|
||||||
MINERALS TECHNOLOGIES INC. AND SUBSIDIARY COMPANIES
NOTES TO CONSOLIDATED FINANCIAL STATEMENTS
The Company believes that its accrued liabilities are sufficient to cover its U.S. and foreign tax contingencies. The tax effects of temporary differences that give rise to significant portions of the deferred tax assets and deferred tax liabilities are presented below:
|
|
December 31,
|
|||||||
|
(millions of dollars)
|
2022
|
2021
|
||||||
|
Deferred tax assets attributable to:
|
||||||||
|
Accrued liabilities
|
$
|
|
$
|
|
||||
|
Net operating loss carry forwards
|
|
|
||||||
|
Pension and post-retirement benefits costs
|
|
|
||||||
|
Other
|
|
|
||||||
|
Valuation allowance
|
(
|
)
|
(
|
)
|
||||
|
Total deferred tax assets
|
|
|
||||||
|
Deferred tax liabilities attributable to:
|
||||||||
|
Plant and equipment, principally due to differences in depreciation
|
|
|
||||||
|
Intangible assets
|
|
|
||||||
|
Other
|
|
|
||||||
|
Total deferred tax liabilities
|
|
|
||||||
|
Net deferred tax asset (liability)
|
$
|
(
|
)
|
$
|
(
|
)
|
||
Net deferred tax assets and net deferred tax liabilities are as follows:
|
|
December 31,
|
|||||||
|
(millions of dollars)
|
2022
|
2021
|
||||||
|
Net deferred tax asset, long-term
|
$
|
|
$
|
|
||||
|
Net deferred tax liability, long-term
|
|
|
||||||
|
Net deferred tax liability, long-term
|
$
|
(
|
)
|
$
|
(
|
)
|
||
The Company has $
35.5
million of deferred tax assets arising from tax loss carry forwards which will be realized through future operations. Carry forwards of approximately $
20.0
million expire over the next
20
years, and $
15.5
million can be utilized over an indefinite period.
On December 31, 2022, the Company had $
2.6
million of total unrecognized tax benefits. Included in this amount were a total of $
2.0
million of unrecognized income tax benefits that, if recognized, would affect the Company's effective tax rate. While it is expected that the amount of unrecognized tax benefits will change in the next 12 months, we do not expect the change to have a significant impact on the results of operations or the financial position of the Company.
The following table summarizes the activity related to our unrecognized tax benefits:
|
(millions of dollars)
|
2022
|
2021
|
||||||
|
Balance at beginning of the year
|
$
|
|
$
|
|
||||
|
Increases related to current year tax positions
|
|
|
||||||
|
Increases related to new judgments
|
|
|
||||||
|
Decreases related to audit settlements and statute expirations
|
(
|
)
|
(
|
)
|
||||
|
Balance at the end of the year
|
$
|
|
$
|
|
||||
The Company's accounting policy is to recognize interest and penalties accrued, relating to unrecognized income tax benefits as part of its provision for income taxes. The Company recorded a benefit of $
0.7
million in interest and penalties during 2022 and had a total accrued balance on December 31, 2022 of $
0.4
million.
MINERALS TECHNOLOGIES INC. AND SUBSIDIARY COMPANIES
NOTES TO CONSOLIDATED FINANCIAL STATEMENTS
The Company operates in multiple taxing jurisdictions, both within and outside the U.S. In certain situations, a taxing authority may challenge positions that the Company has adopted in its income tax filings. The Company, with a few exceptions (none of which are material), is no longer subject to U.S. federal, state, local, and international income tax examinations by tax authorities for years prior to 2015.
Net cash paid for income taxes were $
44.0
million, $
42.5
million and $
28.5
million for the years ended December 31, 2022, 2021 and 2020, respectively.
The Company had approximately $
478.2
million of foreign subsidiaries' undistributed earnings as of December 31, 2022. We intend to continue to permanently reinvest these earnings overseas for the foreseeable future and while U.S. federal tax expense has been recognized as a result of U.S. Tax Reform,
no
deferred tax liabilities with respect to foreign withholding taxes or state taxes have been recognized.
Note 9. Inventories
The following is a summary of inventories by major category:
|
|
December 31,
|
|||||||
|
(millions of dollars)
|
2022
|
2021
|
||||||
|
Raw materials
|
$
|
|
$
|
|
||||
|
Work-in-process
|
|
|
||||||
|
Finished goods
|
|
|
||||||
|
Packaging and supplies
|
|
|
||||||
|
Total inventories
|
$
|
|
$
|
|
||||
Note 10. Property, Plant and Equipment
The major categories of property, plant and equipment and accumulated depreciation and depletion are presented below:
|
|
December 31,
|
|||||||
|
(millions of dollars)
|
2022
|
2021
|
||||||
|
Mineral rights and reserves
|
$
|
|
$
|
|
||||
|
Land
|
|
|
||||||
|
Buildings
|
|
|
||||||
|
Machinery and equipment
|
|
|
||||||
|
Furniture and fixtures and other
|
|
|
||||||
|
Construction in progress
|
|
|
||||||
|
|
|
|||||||
|
Less: accumulated depreciation and depletion
|
(
|
)
|
(
|
)
|
||||
|
Property, plant and equipment, net
|
$
|
|
$
|
|
||||
In November 2021, the Company acquired Specialty PCC assets from a company in the Midwest United States for $
6.9
million.
Depreciation and depletion expense for the years ended December 31, 2022, 2021 and 2020 was $
76.3
million, $
77.4
million and $
77.9
million, respectively.
MINERALS TECHNOLOGIES INC. AND SUBSIDIARY COMPANIES
NOTES TO CONSOLIDATED FINANCIAL STATEMENTS
Note 11. Goodwill and Other Intangible Assets
Goodwill and other intangible assets with indefinite lives are not amortized, but instead are assessed for impairment, at least annually. The carrying amount of goodwill was $
914.8
million and $
907.5
million as of December 31, 2022 and December 31, 2021, respectively. The net change in goodwill since December 31, 2021 was attributable to the acquisition of Concept Pet and the effects of foreign exchange.
The balance of goodwill by segment and the activity occurring in the past two fiscal years is as follows:
|
(millions of dollars)
|
Performance
Materials
|
Specialty
Minerals
|
Refractories
|
Consolidated
|
||||||||||||
|
Balance at December 31,
2020
|
$
|
|
$
|
|
$
|
|
$
|
|
||||||||
|
Change in goodwill relating to:
|
||||||||||||||||
|
Normerica acquisition
|
|
|
|
|
||||||||||||
|
Foreign exchange translation
|
(
|
)
|
(
|
)
|
(
|
)
|
(
|
)
|
||||||||
|
Total Changes
|
$
|
|
$
|
(
|
)
|
$
|
(
|
)
|
$
|
|
||||||
|
Balance at December 31,
2021
|
$
|
|
$
|
|
$
|
|
$
|
|
||||||||
|
Change in goodwill relating to:
|
||||||||||||||||
|
Concept Pet acquisition
|
|
|
|
|
||||||||||||
|
Foreign exchange translation
|
(
|
)
|
(
|
)
|
(
|
)
|
(
|
)
|
||||||||
|
Total Changes
|
$
|
|
$
|
(
|
)
|
$
|
(
|
)
|
$
|
|
||||||
|
Balance at December 31,
2022
|
$
|
|
$
|
|
$
|
|
$
|
|
||||||||
Acquired intangible assets subject to amortization as of December 31, 2022 and December 31, 2021 were as follows:
|
|
December 31, 2022
|
December 31, 2021
|
||||||||||||||||||
|
Weighted Average
Useful Life
(Years)
|
Gross
Carrying
Amount
|
Accumulated
Amortization
|
Gross
Carrying
Amount
|
Accumulated
Amortization
|
||||||||||||||||
|
Tradenames
|
|
$
|
|
$
|
|
$
|
|
$
|
|
|||||||||||
|
Technology
|
|
|
|
|
|
|||||||||||||||
|
Patents and trademarks
|
|
|
|
|
|
|||||||||||||||
|
Customer relationships
|
|
|
|
|
|
|||||||||||||||
|
|
$
|
|
$
|
|
$
|
|
$
|
|
||||||||||||
The weighted average amortization period of the acquired intangible assets subject to amortization is approximately
29
years. Amortization expense was approximately $
12.7
million, $
10.6
million and $
9.3
million for the years ended December 31, 2022, 2021 and 2020, respectively and is recorded within the Marketing and administrative expenses line within the Consolidated Statements of Income. The estimated amortization expense is as follows: 2023 - $
12.9
million; 2024 -$
12.0
; 2025 - $
12.0
; 2026 -$
11.9
million; 2027 - $
11.9
million and $
181.2
million thereafter.
MINERALS TECHNOLOGIES INC. AND SUBSIDIARY COMPANIES
NOTES TO CONSOLIDATED FINANCIAL STATEMENTS
Note 12. Derivative Financial Instruments and Hedging Activities
As a multinational corporation with operations throughout the world, the Company is exposed to certain market risks. The Company uses a variety of practices to manage these market risks, including, when considered appropriate, derivative financial instruments. The Company's objective is to offset gains and losses resulting from interest rates and foreign currency exposures with gains and losses on the derivative contracts used to hedge them. The Company uses derivative financial instruments only for risk management and not for trading or speculative purposes.
By using derivative financial instruments to hedge exposures to changes in interest rates and foreign currencies, the Company exposes itself to credit risk and market risk. Credit risk is the risk that the counterparty will fail to perform under the terms of the derivative contract. When the fair value of a derivative contract is positive, the counterparty owes the Company, which creates credit risk for the Company. When the fair value of a derivative contract is negative, the Company owes the counterparty, and therefore, it does not face any credit risk. The Company minimizes the credit risk in derivative instruments by entering into transactions with major financial institutions.
Market risk is the adverse effect on the value of a financial instrument that results from a change in interest rates, currency exchange rates, or commodity prices. The market risk associated with interest rate and forward exchange contracts is managed by establishing and monitoring parameters that limit the types and degree of market risk that may be undertaken.
Cash Flow Hedges
For derivative instruments that are designated and qualify as cash flow hedges, the Company records the effective portion of the gain or loss in accumulated other comprehensive income (loss) as a separate component of shareholders' equity. The Company subsequently reclassifies the effective portion of gain or loss into earnings in the period during which the hedged transaction is recognized in earnings.
The Company utilizes interest rate swaps to limit exposure to market fluctuations on floating-rate debt. In the second quarter of 2018, the Company entered into a floating to fixed interest rate swap for a notional amount of $
150
million. The fair value of this swap is an asset of $
1.0
million at December 31, 2022 and is recorded in other current assets on the Consolidated Balance Sheet. This interest rate swap is designated as a cash flow hedge. As a result, the gains and losses associated with this interest rate swap is recorded in accumulated other comprehensive income (loss).
Net Investment Hedges
To protect the value of our investments in our foreign operations against adverse changes in foreign currency exchange rates, the Company from time to time hedges a portion of our net investment in
one
or more of our foreign subsidiaries. During the
second
quarter of
2018
, the Company entered into a cross currency rate swap with a total notional value of $
150
million to exchange monthly fixed-rate interest payments in U.S. dollars for monthly fixed-rate interest rate payments in Euros. This contract matures in
May 2023
and requires the exchange of Euros and U.S. dollar principal payments upon maturity.
The fair value of this swap is an asset of $
13.8
million at December 31, 2022 and is recorded in other current assets on the Consolidated Balance Sheet.
Changes in the fair value of this instrument are recognized in
accumulated other comprehensive income (loss)
to offset the change in the carrying amount of the net investment being hedged. Amounts are reclassified out of
accumulated other comprehensive income (loss)
into earnings when the hedged net investment is either sold or substantially liquidated.
Other
The Company is exposed to potential gains or losses from foreign currency fluctuations affecting net investments and earnings denominated in foreign currencies. The Company is particularly sensitive to currency exchange rate fluctuations for the following currencies: British pound sterling (GBP), Chinese renminbi (CNY), Euro, Malaysian ringgit (MYR), Polish zloty (PLN), South African Rand (ZAR), Thai baht (THB) and Turkish lira (TRY). When considered appropriate, the Company enters into foreign exchange derivative contracts to mitigate the risk of fluctuations on these exposures. The Company does not designate these contracts for hedge accounting treatment and the changes in fair value of these contracts are recorded in earnings. The Company recorded losses (gains) of $
0.8
million, $
0.7
million and $
0.2
million in other non-operating income (deductions), net within the Consolidated Statements of Income for the years ended 2022, 2021 and 2020 respectively. There were
no
open contracts at December 31, 2022 and December 31, 2021.
MINERALS TECHNOLOGIES INC. AND SUBSIDIARY COMPANIES
NOTES TO CONSOLIDATED FINANCIAL STATEMENTS
Note 13. Fair Value of Financial Instruments
Fair value is an exchange price that would be received for an asset or paid to transfer a liability (exit price) in an orderly transaction between market participants at the measurement date. The Company utilizes market data or assumptions that market participants would use in pricing the asset or liability. The Company follows a three-tier fair value hierarchy, which prioritizes the inputs used in measuring fair value. These tiers include: Level 1, defined as observable inputs such as quoted prices in active markets; Level 2, defined as inputs other than quoted prices in active markets that are either directly or indirectly observable; and Level 3, defined as unobservable inputs about which little or no market data exists, therefore requiring an entity to develop its own assumptions.
Assets and liabilities measured at fair value are based on one or more of three valuation techniques. The three valuation techniques are as follows:
| ● |
Market approach
–
prices and other relevant information generated by market transactions involving identical or comparable assets or liabilities.
|
| ● |
Cost approach
–
amount that would be required to replace the service capacity of an asset or replacement cost.
|
| ● |
Income approach
–
techniques to convert future amounts to a single present amount based on market expectations, including present value techniques, option-pricing and other models.
|
The Company primarily applies the income approach for foreign exchange derivatives for recurring fair value measurements and attempts to utilize valuation techniques that maximize the use of observable inputs and minimize the use of unobservable inputs.
The following table sets forth by level within the fair value hierarchy the Company's financial assets and liabilities accounted for at fair value on a recurring basis at the end of each of the past two years. Assets and liabilities are classified in their entirety based on the lowest level of input that is significant to the fair value measurement. The Company's assessment of the significance of a particular input to the fair value measurement requires judgment and may affect the valuation of fair value assets and liabilities and their placement within the fair value hierarchy levels.
|
(millions of dollars)
|
Fair Value Measurements Using
|
|||||||||||||||
|
Asset /
(Liability)
Balance at
|
Quoted Prices in
Active Markets for
Identical Assets
|
Significant
Other Observable
Inputs
|
Significant
Unobservable
Inputs
|
|||||||||||||
|
Description
|
December 31, 2022
|
(Level 1)
|
(Level 2)
|
(Level 3)
|
||||||||||||
|
Deferred compensation plan assets
|
$
|
|
$
|
|
$
|
|
$
|
|
||||||||
|
Supplementary pension plan assets
|
|
|
|
|
||||||||||||
|
Cross currency rate swap
|
|
|
|
|
||||||||||||
|
Interest rate swap
|
|
|
|
|
||||||||||||
|
|
Fair Value Measurements Using
|
|||||||||||||||
|
Asset /
(Liability)
Balance at
|
Quoted Prices in
Active Markets for
Identical Assets
|
Significant
Other Observable
Inputs
|
Significant
Unobservable
Inputs
|
|||||||||||||
|
Description
|
December 31, 2021
|
(Level 1)
|
(Level 2)
|
(Level 3)
|
||||||||||||
|
Deferred compensation plan assets
|
$
|
|
$
|
|
$
|
|
$
|
|
||||||||
|
Supplementary pension plan assets
|
|
|
|
|
||||||||||||
|
Cross currency rate swap
|
|
|
|
|
||||||||||||
|
Interest rate swap
|
(
|
)
|
|
(
|
)
|
|
||||||||||
MINERALS TECHNOLOGIES INC. AND SUBSIDIARY COMPANIES
NOTES TO CONSOLIDATED FINANCIAL STATEMENTS
The fair value of foreign exchange contracts is determined based on inputs that are readily available in public markets or can be derived from information available in publicly quoted markets and are categorized as Level 2. Deferred compensation and supplementary pension plan assets related to the Company's 2014 acquisition of AMCOL International Corporation are valued using quoted prices for similar assets in active markets.
The Company does not have any financial assets or liabilities measured at fair value on a recurring basis categorized as Level 3, except for pension assets discussed in Note 16, and there were
no
transfers in or out of Level 3 during the year ended December 31, 2022 and 2021. There were also no changes to the Company's valuation techniques used to measure asset and liability fair values on a recurring basis.
Note 14. Financial Instruments and Concentrations of Credit Risk
The following methods and assumptions were used to estimate the fair value of each class of financial instrument:
Cash and cash equivalents, short-term investments, accounts receivable and payable
: The carrying amounts approximate fair value because of the short maturities of these instruments.
Short-term debt and other liabilities
: The carrying amounts of short-term debt and other liabilities approximate fair value because of the short maturities of these instruments.
Long-term debt
: The fair value of the long-term debt of the Company is estimated based on the quoted market prices for that debt or similar debt and approximates the carrying amount.
Forward exchange contracts
: The fair value of forward exchange contracts (used for hedging purposes) is based on information derived from active markets. If appropriate, the Company would enter into forward exchange contracts to mitigate the impact of foreign exchange rate movements on the Company's operating results. It does not engage in speculation. Such foreign exchange contracts would offset losses and gains on the assets, liabilities and transactions being hedged.
Credit risk
: The Company provides credit to customers in the ordinary course of business. The Company’s customer base is diverse and includes customers located throughout the world. Credit risk results from the possibility that a loss may occur from the failure of another party to perform according to the terms of the contracts. The Company regularly monitors its credit risk exposures and takes steps to mitigate the likelihood of these exposures resulting in an actual loss. The Company's extension of credit is based on an evaluation of the customer's financial condition and collateral is generally not required.
The Company's bad debt expense for the years ended December 31, 2022, 2021 and 2020 was $
4.1
million, $
0.9
million and $
2.6
million, respectively.
Note 15. Long-Term Debt and Commitments
The following is a summary of long-term debt:
|
|
December 31,
|
|||||||
|
(millions of dollars)
|
2022
|
2021
|
||||||
|
Secured Credit Agreement:
|
||||||||
|
Term Loan due
, net of unamortized deferred financing cost of $
|
$
|
|
$
|
|
||||
|
Previous Secured Credit Agreement:
|
||||||||
|
Term Loan due
, net of unamortized discount and deferred financing costs of $
|
|
|
||||||
|
Senior Notes:
|
||||||||
|
|
|
|
||||||
|
Other debt
|
|
|
||||||
|
Total
|
$
|
|
$
|
|
||||
|
Less: Current maturities
|
|
|
||||||
|
Long-term debt
|
$
|
|
$
|
|
||||
MINERALS TECHNOLOGIES INC. AND SUBSIDIARY COMPANIES
NOTES TO CONSOLIDATED FINANCIAL STATEMENTS
On
August 11, 2022
, the Company entered into a Refinancing Facility Agreement (the “Amendment”) to amend the Company’s previous credit agreement (the “Previous Credit Agreement”; the previous credit agreement, as amended by the Amendment, being the “Amended Credit Agreement”). The Amendment provides for, among other things, a new senior secured revolving credit facility with aggregate commitments of $
300
million (the “Revolving Facility”), a portion of which may be used for the issuance of letters of credit and swingline loans, and a new senior secured term loan facility with aggregate commitments of $
550
million (the “Term Loan Facility” and, together with the Revolving Facility, the “Senior Secured Credit Facilities”). The Revolving Facility and the Term Loan Facility replace the facilities under the Previous Credit Agreement, which provided for, among other things, a $
788
million senior secured floating rate term loan facility and a $
300
million senior secured revolving credit facility. The maturity date for loans under the Senior Secured Credit Facilities is
August 11, 2027
.
In the
third
quarter of
2022
, the Company recorded $
6.9
million in non-cash debt extinguishment expenses related to the refinancing of our credit facilities, which represents the difference between the redemption payment and the carrying value of the debt at the refinancing date. All lenders under the previous facility were repaid in full.
Loans under the Senior Secured Credit Facilities will bear interest at a rate equal to, at the election of the Company, Term SOFR plus a credit spread adjustment equal to
0.100
%
plus an applicable margin equal to
1.500
%
per annum or a base rate plus an applicable margin equal to
0.500
%
per annum, subject in each case to (a) an increase of
25
basis points in the event that, and for so long as, the net leverage ratio (as defined in the Amended Credit Agreement) is greater than or equal to
3.00
to
1.00
as of the last day of the preceding fiscal quarter, (b) a decrease of
12.5
basis points in the event that, and for so long as, the net leverage ratio is less than
2.00
to
1.00
and greater than or equal to
1.00
to
1.00
as of the last day of the preceding fiscal quarter and (c) an decrease of
25
basis points in the event that, and for so long as, the net leverage ratio is less than
1.00
to
1.00
as of the last day of the preceding fiscal quarter. The Company will pay certain fees under the Amended Credit Agreement, including (a) a commitment fee of
0.250
%
per annum on the undrawn portion of the Revolving Facility (subject to a step-up to
0.300
%
and step-downs to
0.175
%
and
0.150
%
at the same levels described above), (b) a fronting fee of
0.125
%
per annum on the average daily undrawn amount of, plus unreimbursed amounts in respect of disbursements under, letters of credit issued under the Revolving Facility and (c) customary annual administration fees. The obligations of the Company under the Senior Secured Credit Facilities are unconditionally guaranteed jointly and severally by, subject to certain exceptions, all material domestic subsidiaries of the Company (the “Guarantors”) and secured, subject to certain exceptions, by a security interest in substantially all of the tangible and intangible assets of the Company and the Guarantors.
As of December 31, 2022, there were $
115.0
million in loans and $
10.5
million in letters of credit outstanding under the Revolving Facility.
On June 30, 2020, the Company issued $
400
million aggregate principal amount of
5.0
% Senior Notes due 2028 (the "Notes").
The Notes were issued pursuant to an indenture, dated as of
June 30, 2020
, between the Company and The Bank of New York Mellon Trust Company, N.A., as trustee (the “Indenture”). The Notes bear an interest rate of
5.0
%
per annum payable semi-annually on
January 1
and
July 1
of each year, beginning on
January 1, 2021
. The Notes are unconditionally guaranteed on a senior unsecured basis by each of the Company’s existing and future wholly owned domestic restricted subsidiaries that is a borrower under or that guarantees the Company’s obligations under its Senior Secured Credit Facilities or that guarantees the Company’s or any of the Company’s wholly owned domestic subsidiaries’ long-term indebtedness in an aggregate amount in excess of $
50
million.
At any time and from time to time prior to
July 1, 2023
, the Company may redeem some or all of the Notes for cash at a redemption price equal to
100
%
of their principal amount, plus the “make-whole” premium described in the Indenture and accrued and unpaid interest, if any, to, but excluding, the applicable redemption date. Beginning on
July 1, 2023
, the Company may redeem some or all of the Notes at any time and from time to time at the applicable redemption prices listed in the Indenture, plus accrued and unpaid interest, if any, to, but excluding, the applicable redemption date. In addition, at any time and from time to time prior to
July 1, 2023
, the Company may redeem up to
40
%
of the aggregate principal amount of the Notes with funds from
one
or more equity offerings at a redemption price equal to
105
%
of the principal amount thereof, plus accrued and unpaid interest, if any, to, but excluding, the applicable redemption date.
If the Company experiences a change of control (as defined in the indenture), the Company is required to offer to repurchase the Notes at
101
%
of the principal amount of such Notes, plus accrued and unpaid interest, if any, to, but excluding, the date of repurchase.
MINERALS TECHNOLOGIES INC. AND SUBSIDIARY COMPANIES
NOTES TO CONSOLIDATED FINANCIAL STATEMENTS
The Amended Credit Agreement and the Indenture both contain certain customary affirmative and negative covenants that limit or restrict the ability of the Company and its restricted subsidiaries to enter into certain transactions or take certain actions, as well as customary events of default. In addition, the Amended Credit Agreement contains financial covenants that require the Company to maintain, as of the last day of any fiscal quarter, (x) a maximum net leverage ratio (as defined in the Amended Credit Agreement) of
4.00
to
1.00
for the
four
fiscal quarter period preceding such day (subject to an increase to
5.00
to
1.00
for
four
quarters in connection with certain significant acquisitions) and (y) a minimum interest coverage ratio (as defined in the Amended Credit Agreement) of
3.00
to
1.00
. The Company is in compliance with all the covenants contained in the Amended Credit Agreement throughout the period covered by this report.
As part of the Company's acquisition of Sivomatic, the Company assumed $
10.7
million in long-term debt, recorded at fair value, consisting of
two
term loans,
one
of which matured in the third quarter of 2020 and the
of which matured in the first quarter 2022. During 2022, the Company repaid $
0.2
million on this loan.
The Company has a committed loan facility in Japan. As of December 31, 2022, there was an outstanding balance of $
2.0
million on this facility. Principal will be repaid in accordance with the payment schedule ending in 2026. The Company repaid $
0.5
million on this loan in 2022.
As part of the Concept Pet acquisition, the Company assumed $
1.9
million in long-term debt, recorded at fair value, consisting of
two
terms loans,
one
that matures in 2025 and
one
that matures in 2027. Both loans have annual payments and carry a variable interest rate.
As of December 31, 2022, the Company had $
25.3
million in uncommitted short-term bank credit lines, $
4.7
million of which were in use.
There were $
119.7
million and $
80.0
million short-term borrowings as of December 31, 2022 and 2021, respectively. The weighted average interest rates on short-term borrowings outstanding was
3.8
% and
1.8
% as of December 21, 2022 and 2021, respectively.
The aggregate maturities of long-term debt are as follows: $
14.7
million in 2023; $
18.1
million in 2024; $
31.8
million in 2025, $
42.1
million in 2026; $
843.7
million in 2027 and $
0.0
million thereafter.
During 2022, 2021 and 2020, respectively, the Company incurred interest costs of $
48.6
million, $
42.1
million and $
40.7
million, including $
1.3
million, $
1.5
million and $
0.6
million, respectively, which were capitalized. Interest paid approximated the incurred interest cost.
Note 16. Benefit Plans
Pension Plans and Other Postretirement Benefit Plans
The Company and its subsidiaries have pension plans covering the majority of eligible employees on a contributory or non-contributory basis. Benefits under defined benefit plans are generally based on years of service and an employee's career earnings. Employees generally become fully vested after
five years
.
The Company also provides postretirement health care and life insurance benefits for the majority of its U.S. retired employees. Employees are generally eligible for benefits upon retirement and completion of a specified number of years of creditable service. The Company does not pre-fund these benefits and has the right to modify or terminate the plan in the future.
The Company’s disclosures for the U.S. plans have been combined with those outside of the U.S. as the international plans do not have significantly different assumptions, and together represent less than
20
% of our total benefit obligation.
MINERALS TECHNOLOGIES INC. AND SUBSIDIARY COMPANIES
NOTES TO CONSOLIDATED FINANCIAL STATEMENTS
The following table set forth Company's pension obligation and funded status at December 31:
|
|
Pension Benefits
|
Post-Retirement Benefits
|
||||||||||||||
|
(millions of dollars)
|
2022
|
2021
|
2022
|
2021
|
||||||||||||
|
Change in benefit obligations:
|
||||||||||||||||
|
Beginning projected benefit obligation
|
$
|
|
$
|
|
$
|
|
$
|
|
||||||||
|
Service cost
|
|
|
|
|
||||||||||||
|
Interest cost
|
|
|
|
|
||||||||||||
|
Actuarial gain
|
(
|
)
|
(
|
)
|
(
|
)
|
(
|
)
|
||||||||
|
Benefits paid
|
(
|
)
|
(
|
)
|
(
|
)
|
(
|
)
|
||||||||
|
Settlements
|
(
|
)
|
(
|
)
|
|
(
|
)
|
|||||||||
|
Foreign exchange impact
|
(
|
)
|
(
|
)
|
|
(
|
)
|
|||||||||
|
Other
|
|
|
|
|
||||||||||||
|
Ending projected benefit obligation
|
|
|
|
|
||||||||||||
|
Change in plan assets:
|
||||||||||||||||
|
Beginning fair value
|
|
|
|
|
||||||||||||
|
Actual (loss)/return on plan assets
|
(
|
)
|
|
|
|
|||||||||||
|
Employer contributions
|
|
|
|
|
||||||||||||
|
Plan participants' contributions
|
|
|
|
|
||||||||||||
|
Benefits paid
|
(
|
)
|
(
|
)
|
(
|
)
|
(
|
)
|
||||||||
|
Settlements
|
(
|
)
|
(
|
)
|
|
|
||||||||||
|
Foreign exchange impact
|
(
|
)
|
(
|
)
|
|
|
||||||||||
|
Ending fair value
|
|
|
|
|
||||||||||||
|
Funded status
|
$
|
(
|
)
|
$
|
(
|
)
|
$
|
(
|
)
|
$
|
(
|
)
|
||||
Amounts recognized in the consolidated balance sheet consist of:
|
|
Pension Benefits
|
Post-Retirement Benefits
|
||||||||||||||
|
(millions of dollars)
|
2022
|
2021
|
2022
|
2021
|
||||||||||||
|
Current liability
|
$
|
(
|
)
|
$
|
(
|
)
|
$
|
(
|
)
|
$
|
(
|
)
|
||||
|
Non-current liability
|
(
|
)
|
(
|
)
|
(
|
)
|
(
|
)
|
||||||||
|
Recognized liability
|
$
|
(
|
)
|
$
|
(
|
)
|
$
|
(
|
)
|
$
|
(
|
)
|
||||
The current portion of pension liabilities is included in accrued compensation and related items.
Amounts recognized in accumulated other comprehensive loss, net of related tax effects, consist of:
|
|
Pension Benefits
|
Post-Retirement Benefits
|
||||||||||||||
|
(millions of dollars)
|
2022
|
2021
|
2022
|
2021
|
||||||||||||
|
Net actuarial (gain) loss
|
$
|
|
$
|
|
$
|
(
|
)
|
$
|
(
|
)
|
||||||
|
Prior service cost
|
|
|
|
|
||||||||||||
|
Amount recognized end of year
|
$
|
|
$
|
|
$
|
(
|
)
|
$
|
(
|
)
|
||||||
The accumulated benefit obligation for all defined benefit pension plans was $
297.4
million and $
408.7
million at December 31, 2022 and 2021, respectively. The decrease in the Company's pension obligation for 2022 is primarily attributable to actuarial gains resulting from the increase in the discount rate. The accumulated benefit obligations and projected benefit obligations are in excess of the plan assets for each of the Company's defined benefit plans.
MINERALS TECHNOLOGIES INC. AND SUBSIDIARY COMPANIES
NOTES TO CONSOLIDATED FINANCIAL STATEMENTS
Changes in the Plan assets and benefit obligations recognized in other comprehensive income:
|
|
Pension Benefits
|
Post-Retirement Benefits
|
||||||||||||||
|
(millions of dollars)
|
2022
|
2021
|
2022
|
2021
|
||||||||||||
|
Current year actuarial gain
|
$
|
|
$
|
|
$
|
|
$
|
|
||||||||
|
Amortization of actuarial (gain) loss
|
|
|
(
|
)
|
(
|
)
|
||||||||||
|
Total recognized in other comprehensive income
|
$
|
|
$
|
|
$
|
|
$
|
(
|
)
|
|||||||
The components of net periodic benefit costs are as follows:
|
|
Pension Benefits
|
Post-Retirement Benefits
|
||||||||||||||||||||||
|
(millions of dollars)
|
2022
|
2021
|
2020
|
2022
|
2021
|
2020
|
||||||||||||||||||
|
Service cost
|
$
|
|
$
|
|
$
|
|
$
|
|
$
|
|
$
|
|
||||||||||||
|
Interest cost
|
|
|
|
|
|
|
||||||||||||||||||
|
Expected return on plan assets
|
(
|
)
|
(
|
)
|
(
|
)
|
|
|
|
|||||||||||||||
|
Recognized net actuarial (gain) loss
|
|
|
|
(
|
)
|
(
|
)
|
(
|
)
|
|||||||||||||||
|
Settlement/curtailment (gain) loss
|
|
|
|
|
(
|
)
|
|
|||||||||||||||||
|
Net periodic benefit cost
|
$
|
|
$
|
|
$
|
|
$
|
(
|
)
|
$
|
(
|
)
|
$
|
(
|
)
|
|||||||||
Unrecognized prior service cost is amortized over the average remaining service period of each active employee.
The Company's funding policy for U.S. plans generally is to contribute annually into trust funds at a rate that provides for future plan benefits and maintains appropriate funded percentages. Annual contributions to the U.S. qualified plans are at least sufficient to satisfy regulatory funding standards and are not more than the maximum amount deductible for income tax purposes. The funding policies for the international plans conform to local governmental and tax requirements. The plans' assets are invested primarily in stocks and bonds.
Additional Information
The weighted average assumptions used to determine net periodic benefit cost in the accounting for the pension benefit plans and other benefit plans for the years ended December 31, 2022, 2021 and 2020 are as follows:
|
|
Year Ended December 31,
|
|||||||||||
|
2022
|
2021
|
2020
|
||||||||||
|
Discount rate
|
|
%
|
|
%
|
|
%
|
||||||
|
Expected return on plan assets
|
|
%
|
|
%
|
|
%
|
||||||
|
Rate of compensation increase
|
|
%
|
|
%
|
|
%
|
||||||
|
Interest crediting rate
|
|
%
|
|
%
|
|
%
|
||||||
The weighted average assumptions used to determine benefit obligations for the pension benefit plans and other benefit plans at December 31, 2022, 2021 and 2020 are as follows:
|
|
Year Ended December 31,
|
|||||||||||
|
2022
|
2021
|
2020
|
||||||||||
|
Discount rate
|
|
%
|
|
%
|
|
%
|
||||||
|
Rate of compensation increase
|
|
%
|
|
%
|
|
%
|
||||||
For 2022, 2021 and 2020, the discount rate was based on a Citigroup yield curve of high quality corporate bonds with cash flows matching our plans' expected benefit payments. The expected return on plan assets is based on our asset allocation mix and our historical return, taking into account current and expected market conditions. The actual (loss)/return on pension assets was approximately (
22
)% in 2022,
12
% in 2021 and
9
% in 2020.
MINERALS TECHNOLOGIES INC. AND SUBSIDIARY COMPANIES
NOTES TO CONSOLIDATED FINANCIAL STATEMENTS
The Company maintains a self-funded health insurance plan for its retirees. This plan provided that the maximum health care cost trend rate would be
5
%. Effective June 2010, the Company amended its plan to change the eligibility requirement for retirees and revised its plan so that increases in expected health care costs would be borne by the retiree. Effective January 1, 2022, the plan was closed to new retirees.
Plan Assets
The Company's pension plan weighted average asset allocation percentages at December 31, 2022 and 2021 by asset category are as follows:
|
|
December 31,
|
|||||||
|
2022
|
2021
|
|||||||
|
Asset Category
|
||||||||
|
Equity securities
|
|
%
|
|
%
|
||||
|
Fixed income securities
|
|
%
|
|
%
|
||||
|
Real estate
|
|
%
|
|
%
|
||||
|
Other
|
|
%
|
|
%
|
||||
|
Total
|
|
%
|
|
%
|
||||
The Company's pension plan fair values at December 31, 2022 and 2021 by asset category are as follows:
|
|
December 31,
|
|||||||
|
(millions of dollars)
|
2022
|
2021
|
||||||
|
Asset Category
|
||||||||
|
Equity securities
|
$
|
|
$
|
|
||||
|
Fixed income securities
|
|
|
||||||
|
Real estate
|
|
|
||||||
|
Other
|
|
|
||||||
|
Total
|
$
|
|
$
|
|
||||
The following table presents domestic and foreign pension plan assets information at December 31, 2022, 2021 and 2020 (the measurement date of pension plan assets):
|
|
U.S. Plans
|
International Plans
|
||||||||||||||||||||||
|
(millions of dollars)
|
2022
|
2021
|
2020
|
2022
|
2021
|
2020
|
||||||||||||||||||
|
Fair value of plan assets
|
$
|
|
$
|
|
$
|
|
$
|
|
$
|
|
$
|
|
||||||||||||
MINERALS TECHNOLOGIES INC. AND SUBSIDIARY COMPANIES
NOTES TO CONSOLIDATED FINANCIAL STATEMENTS
The following table summarizes our defined benefit pension plan assets measured at fair value as of December 31, 2022:
|
Quoted Prices in
Active Markets for
Identical Assets
|
Significant
Other Observable
Inputs
|
Significant
Unobservable
Inputs
|
||||||||||||||
|
(millions of dollars)
|
(Level 1)
|
(Level 2)
|
(Level 3)
|
Total
|
||||||||||||
|
Pension Assets Fair Value as of December 31, 2022
|
||||||||||||||||
|
Equity securities
|
||||||||||||||||
|
US equities
|
$
|
|
$
|
|
$
|
|
$
|
|
||||||||
|
Non-US equities
|
|
|
|
|
||||||||||||
|
Fixed income securities
|
||||||||||||||||
|
Corporate debt instruments
|
|
|
|
|
||||||||||||
|
Real estate and other
|
||||||||||||||||
|
Real estate
|
|
|
|
|
||||||||||||
|
Other
|
|
|
|
|
||||||||||||
|
Total assets
|
$
|
|
$
|
|
$
|
|
$
|
|
||||||||
The following table summarizes our defined benefit pension plan assets measured at fair value as of December 31, 2021:
|
Quoted Prices in
Active Markets for
Identical Assets
|
Significant
Other Observable
Inputs
|
Significant
Unobservable
Inputs
|
||||||||||||||
|
(millions of dollars)
|
(Level 1)
|
(Level 2)
|
(Level 3)
|
Total
|
||||||||||||
|
Pension Assets Fair Value as of December 31,
2021
|
||||||||||||||||
|
Equity securities
|
||||||||||||||||
|
US equities
|
$
|
|
$
|
|
$
|
|
$
|
|
||||||||
|
Non-US equities
|
|
|
|
|
||||||||||||
|
Fixed income securities
|
||||||||||||||||
|
Corporate debt instruments
|
|
|
|
|
||||||||||||
|
Real estate and other
|
||||||||||||||||
|
Real estate
|
|
|
|
|
||||||||||||
|
Other
|
|
|
|
|
||||||||||||
|
Total assets
|
$
|
|
$
|
|
$
|
|
$
|
|
||||||||
U.S. equities
–
This class included actively and passively managed common equity securities comprised primarily of large-capitalization stocks with value, core and growth strategies.
Non-U.S. equities
–
This class included actively managed common equity securities comprised primarily of international large-capitalization stocks.
Fixed income
–
This
class included corporate debt instruments.
Real Estate and other
–
This class includes assets related to real estate and other assets such as insurance contracts.
Asset classified as Level 1 are valued using quoted prices on major stock exchange on which individual assets are traded. Our Level 2 assets are valued using net asset value. The net asset value is quoted on a private market that is not active; however, the unit price is based on the underlying investments that are traded on an active market. Our Level 3 assets are estimated at fair value based on the most recent financial information available for the underlying securities, which are not traded on active market, and represents significant unobservable input.
MINERALS TECHNOLOGIES INC. AND SUBSIDIARY COMPANIES
NOTES TO CONSOLIDATED FINANCIAL STATEMENTS
The following is a reconciliation of changes in fair value measurement of plan assets using significant unobservable inputs (Level 3):
|
(millions of dollars)
|
||||
|
Beginning balance at December 31,
2020
|
$
|
|
||
|
Purchases, sales, settlements
|
|
|||
|
Actual return on plan assets still held at reporting date
|
(
|
)
|
||
|
Foreign exchange impact
|
|
|||
|
Ending balance at December 31,
2021
|
$
|
|
||
|
Purchases, sales, settlements
|
|
|||
|
Actual return on plan assets still held at reporting date
|
|
|||
|
Foreign exchange impact
|
(
|
)
|
||
|
Ending balance at December 31,
2022
|
$
|
|
||
There were
no
transfers in or out of Level 3 during the year ended December 31, 2022 and 2021.
Contributions
The Company expects to contribute $
6.8
million to its pension plans and $
0.5
million to its other post-retirement benefit plan in 2023.
Estimated Future Benefit Payments
The following benefit payments, which reflect expected future service, as appropriate, are expected to be paid:
|
(millions of dollars)
|
Pension Benefits
|
Other Benefits
|
||||||
|
2023
|
$
|
|
$
|
|
||||
|
2024
|
$
|
|
$
|
|
||||
|
2025
|
$
|
|
$
|
|
||||
|
2026
|
$
|
|
$
|
|
||||
|
2027
|
$
|
|
$
|
|
||||
|
2028
-
2032
|
$
|
|
$
|
|
||||
Investment Strategies
The investment strategy for pension plan assets is to maintain a broadly diversified portfolio designed to both preserve and grow plan assets to meet future plan obligations. The Company's average rate of return on assets from inception through December 31, 2022 was approximately
9
%. The Company’s assets are strategically allocated among equity, debt and other investments to achieve a diversification level that dampens fluctuations in investment returns. The Company’s long-term investment strategy is an investment portfolio mix of approximately
55
%-
65
% in equity securities,
30
%-
35
% in fixed income securities and
0
%-
15
% in other securities.
Savings and Investment Plan
The Company maintains a voluntary Savings and Investment Plan (a 401(k) plan) for most non-union employees in the U.S. Within prescribed limits, the Company bases its contribution to the Savings and Investment Plan on employee contributions. The Company's contributions amounted to $
5.7
million, $
5.3
million and $
5.2
million for the years ended December 31, 2022, 2021 and 2020, respectively.
MINERALS TECHNOLOGIES INC. AND SUBSIDIARY COMPANIES
NOTES TO CONSOLIDATED FINANCIAL STATEMENTS
Note 17. Contingencies
The Company is party to a number of lawsuits arising in the normal course of our business. The Company and certain of the Company’s subsidiaries are among numerous defendants in a number of cases seeking damages for alleged exposure to asbestos-containing materials related to talc products sold by the Company’s subsidiary Barretts Minerals Inc. As of December 31, 2022, we had
440
open asbestos cases related to certain talc products previously sold by Barretts Minerals Inc., which is an increase in volume from previous years. These claims typically allege various theories of liability, including negligence, gross negligence and strict liability and seek compensatory and, in some cases, punitive damages, but most of these claims do not provide adequate information to assess their merits, the likelihood that the Company will be found liable, or the magnitude of such liability, if any. We are unable to state an amount or range of amounts claimed in any of these lawsuits because state court pleading practices do not require the plaintiff to identify the amount of the claimed damage. The Company’s position, as stated publicly, is that the talc products sold by Barretts Minerals Inc. are safe and do not cause cancer.
The Company records accruals for loss contingencies associated with legal matters, including talc-related litigation, when it is probable that a liability will be incurred and the amount of the loss can be reasonably estimated. Amounts accrued for legal contingencies often result from a complex series of judgments about future events and uncertainties that rely heavily on estimates and assumptions including timing of related payments. The ability to make such estimates and judgments can be affected by various factors, including whether damages sought in the proceedings are unsubstantiated or indeterminate, the stage of the litigation, the factual and legal matters in dispute, the ability to achieve comprehensive settlements, the availability of co-defendants with substantial resources and assets participating in the litigation, and our evaluation of the unique attributes of each claim.
While costs relating to the defense of talc-related cases has increased concurrently with the volume, the majority of these costs have historically been borne by Pfizer Inc. pursuant to the terms of certain agreements entered into in connection with the Company’s initial public offering in 1992. The Company is entitled to indemnification, pursuant to agreement, for liabilities related to sales prior to the initial public offering. The Company continues to receive information with respect to potential costs associated with the defense and/or settlement of talc-related cases not subject to indemnification from Pfizer. Although the Company believes that the talc products are safe and that claims to the contrary are without merit, Barretts Minerals Inc. opportunistically settled certain talc-related cases in the third quarter and fourth quarter of 2022. As a result of these settlements and defense costs incurred to date, the Company reviewed its estimates of the probability and amount of losses in connection with its talc-related cases and recorded $
31
million for litigation costs in the third quarter of 2022 to defend against, opportunistically settle, and establish a reserve for claims associated with certain talc products from Barretts Minerals Inc.
Note 18. Stockholders' Equity
Capital Stock
The Company's authorized capital stock consists of
100
million shares of common stock, par value $
0.10
per share, of which
32,495,266
shares and
33,177,193
shares were outstanding at December 31, 2022 and 2021, respectively, and
1,000,000
shares of preferred stock,
none
of which were issued and outstanding.
Cash Dividends
Cash dividends of $
6.5
million or $
0.20
per common share were paid during 2022. In January 2023, a cash dividend of approximately $
1.7
million or $
0.05
per share, was declared, payable in the first quarter of 2023.
Stock Award and Incentive Plan
The Company’s 2015 Stock Award and Incentive Plan provides for grants of incentive and non-qualified stock options, restricted stock, restricted stock units, stock appreciation rights, stock awards and performance unit awards (the 2015 Stock Award and Incentive Plan, as amended, referred to herein as the “Plan” and together with its predecessor for awards granted prior to May 2015, the 2001 Stock Award and Incentive Plan, as amended and restated, the “Plans”). The Plans are administered by the Compensation Committee of the Board of Directors. Stock options granted under the Plans generally have a
ten year
term. The exercise price for stock options are at prices at or above the fair market value of the common stock on the date of the grant, and each award of stock options will vest ratably over a specified period, generally
three years
.
MINERALS TECHNOLOGIES INC. AND SUBSIDIARY COMPANIES
NOTES TO CONSOLIDATED FINANCIAL STATEMENTS
The following table summarizes stock option and restricted stock unit activity for the Plans:
|
|
Stock Options
|
Restricted Stock Units
|
||||||||||||||||||
|
Shares
Available
for Grant
|
Shares
|
Weighted Average
Exercise Price
per Share ($)
|
Shares
|
Weighted Average
Exercise Price
per Share ($)
|
||||||||||||||||
|
Balance January 1,
2020
|
|
|
$
|
|
|
$
|
|
|||||||||||||
|
Authorized
|
|
—
|
—
|
—
|
—
|
|||||||||||||||
|
Granted
|
(
|
)
|
|
|
|
|
||||||||||||||
|
Exercised/vested
|
|
(
|
)
|
|
(
|
)
|
|
|||||||||||||
|
Canceled
|
|
(
|
)
|
|
(
|
)
|
|
|||||||||||||
|
Balance December 31,
2020
|
|
|
|
|
|
|||||||||||||||
|
Granted
|
(
|
)
|
|
|
|
|
||||||||||||||
|
Exercised/vested
|
|
(
|
)
|
|
(
|
)
|
|
|||||||||||||
|
Canceled
|
|
(
|
)
|
|
(
|
)
|
|
|||||||||||||
|
Balance December 31,
2021
|
|
|
|
|
|
|||||||||||||||
|
Granted
|
(
|
)
|
|
|
|
|
||||||||||||||
|
Exercised/vested
|
|
(
|
)
|
|
(
|
)
|
|
|||||||||||||
|
Canceled
|
|
(
|
)
|
|
(
|
)
|
|
|||||||||||||
|
Balance December 31,
2022
|
|
|
$
|
|
|
$
|
|
|||||||||||||
Note 19. Accumulated Other Comprehensive Income (Loss)
Accumulated other comprehensive income (loss) at December 31 comprised of the following components:
|
|
December 31,
|
|||||||
|
(millions of dollars)
|
2022
|
2021
|
||||||
|
Cumulative foreign currency translation
|
$
|
(
|
)
|
$
|
(
|
)
|
||
|
Unrecognized pension costs (net of tax benefit of $
|
(
|
)
|
(
|
)
|
||||
|
Unrealized gain on cash flow hedges (net of tax expense of $
|
|
|
||||||
|
$
|
(
|
)
|
$
|
(
|
)
|
|||
MINERALS TECHNOLOGIES INC. AND SUBSIDIARY COMPANIES
NOTES TO CONSOLIDATED FINANCIAL STATEMENTS
The following table summarizes the changes in other comprehensive income (loss) by component:
|
|
Year Ended December 31,
|
|||||||||||||||||||||||||||||||||||
|
2022
|
2021
|
2020
|
||||||||||||||||||||||||||||||||||
|
(millions of dollars)
|
Pre-Tax
Amount
|
Tax
(Expense)
Benefit
|
Net-of-
Tax
Amount
|
Pre-Tax
Amount
|
Tax
(Expense)
Benefit
|
Net-of-
Tax
Amount
|
Pre-Tax
Amount
|
Tax
(Expense)
Benefit
|
Net-of-
Tax
Amount
|
|||||||||||||||||||||||||||
|
Foreign currency translation adjustment
|
$
|
(
|
)
|
$
|
|
$
|
(
|
)
|
$
|
(
|
)
|
$
|
|
$
|
(
|
)
|
$
|
|
$
|
|
$
|
|
||||||||||||||
|
Pension plans:
|
||||||||||||||||||||||||||||||||||||
|
Net actuarial gains (losses) and prior service costs arising during the period
|
|
(
|
)
|
|
|
(
|
)
|
|
(
|
)
|
|
(
|
)
|
|||||||||||||||||||||||
|
Amortization of net actuarial (gains) losses and prior service costs
|
|
(
|
)
|
|
|
(
|
)
|
|
|
(
|
)
|
|
||||||||||||||||||||||||
|
Unrealized gains (losses) on cash flow hedges
|
|
(
|
)
|
|
|
(
|
)
|
|
(
|
)
|
|
(
|
)
|
|||||||||||||||||||||||
|
Total other comprehensive income (loss)
|
$
|
(
|
)
|
$
|
(
|
)
|
$
|
(
|
)
|
$
|
(
|
)
|
$
|
(
|
)
|
$
|
(
|
)
|
$
|
(
|
)
|
$
|
|
$
|
(
|
)
|
||||||||||
The pre-tax amortization amounts of pension plans in the table above are included within the components of net periodic pension benefit costs (see Note 16) and the related tax amounts are included within provision (benefit) for taxes on income line within Consolidated Statements of Income.
Note 20. Accounting for Asset Retirement Obligations
The Company records asset retirement obligations in which the Company will be required to retire tangible long-lived assets. These are primarily related to its PCC satellite facilities and mining operations. The Company has also recorded the provisions related to conditional asset retirement obligations at its facilities. The Company has recorded asset retirement obligations at all of its facilities except where there are no contractual or legal obligations. The associated asset retirement costs are capitalized as part of the carrying amount of the long-lived asset.
The following is a reconciliation of asset retirement obligations as of December 31, 2022 and 2021:
|
|
December 31,
|
|||||||
|
(millions of dollars)
|
2022
|
2021
|
||||||
|
Asset retirement obligation, beginning of period
|
$
|
|
$
|
|
||||
|
Accretion expense
|
|
|
||||||
|
Other
|
|
|
||||||
|
Payments
|
(
|
)
|
(
|
)
|
||||
|
Foreign currency translation
|
(
|
)
|
(
|
)
|
||||
|
Asset retirement obligation, end of period
|
$
|
|
$
|
|
||||
MINERALS TECHNOLOGIES INC. AND SUBSIDIARY COMPANIES
NOTES TO CONSOLIDATED FINANCIAL STATEMENTS
The Company mines various minerals using a surface mining process that requires the removal of overburden. In certain areas and under various governmental regulations, the Company is obligated to restore the land comprising each mining site to its original condition at the completion of the mining activity. This liability will be adjusted to reflect the passage of time, mining activities, and changes in estimated future cash outflows.
The current portion of the liability of approximately $
0.5
million is included in other current liabilities and the long-term portion of the liability of approximately $
23.3
million is included in other non-current liabilities in the Consolidated Balance Sheet as of December 31, 2022.
Accretion expense is included in cost of goods sold in the Company's Consolidated Statements of Income.
Note 21. Segment and Related Information
The Company determines its operating segments based on the discrete financial information that is regularly evaluated by its chief operating decision maker, our Chief Executive Officer, in deciding how to allocate resources and in assessing performance. The Company's operating segments are strategic business units that offer different products and serve different markets. They are managed separately and require different technology and marketing strategies.
As of December 31, 2022, the Company had
three
reportable segments: Performance Materials, Specialty Minerals and Refractories.
| ● |
The Performance Materials segment is a leading global supplier of a wide range of bentonite-based and synthetic materials for consumer-oriented and industrial markets and for non-residential construction, environmental remediation, and infrastructure projects. This segment is the Company's largest and most diverse business segment with extensive technical, sales and commercial capabilities.
|
| ● |
The Specialty Minerals segment produces and sells the synthetic mineral product precipitated calcium carbonate ("PCC") and processed mineral product quicklime ("lime"), and mines mineral ores then processes and sells natural mineral products, primarily limestone and talc. This segment is a leading supplier globally of PCC products. This segment's products are used principally in the paper and packaging, building materials, paint and coatings, glass, ceramic, polymer, food, automotive and pharmaceutical industries.
|
| ● |
The Refractories segment produces monolithic and shaped refractory materials and specialty products. It also provides services and sells application and measurement equipment, calcium metal and metallurgical wire products. Refractories segment products are primarily used in high-temperature applications in the steel, non-ferrous metal and glass industries.
|
See Note 22 to the Consolidated Financial Statements for a discussion of changes to the Company's segments expected to be made for the first quarter of 2023.
The accounting policies of the segments are the same as those described in the summary of significant accounting policies. The Company evaluates performance based on the operating income of the respective business units. The costs deducted to arrive at operating profit do not include several items, such as net interest or income tax expense. Depreciation expense related to corporate assets is allocated to the business segments and is included in their income from operations. However, such corporate depreciable assets are not included in the segment assets. Intersegment sales and transfers are not significant.
MINERALS TECHNOLOGIES INC. AND SUBSIDIARY COMPANIES
NOTES TO CONSOLIDATED FINANCIAL STATEMENTS
Segment information for the years ended December 31, 2022, 2021 and 2020 was as follows:
|
|
Year Ended December 31,
|
|||||||||||
|
(millions of dollars)
|
2022
|
2021
|
2020
|
|||||||||
|
Net Sales
|
||||||||||||
|
Performance Materials
|
$
|
|
$
|
|
$
|
|
||||||
|
Specialty Minerals
|
|
|
|
|||||||||
|
Refractories
|
|
|
|
|||||||||
|
Total
|
|
|
|
|||||||||
|
Income from Operations
|
||||||||||||
|
Performance Materials
|
|
|
|
|||||||||
|
Specialty Minerals
|
|
|
|
|||||||||
|
Refractories
|
|
|
|
|||||||||
|
Total
|
|
|
|
|||||||||
|
Depreciation, Depletion and Amortization
|
||||||||||||
|
Performance Materials
|
|
|
|
|||||||||
|
Specialty Minerals
|
|
|
|
|||||||||
|
Refractories
|
|
|
|
|||||||||
|
Total
|
|
|
|
|||||||||
|
Segment Assets
|
||||||||||||
|
Performance Materials
|
|
|
|
|||||||||
|
Specialty Minerals
|
|
|
|
|||||||||
|
Refractories
|
|
|
|
|||||||||
|
Total
|
|
|
|
|||||||||
|
Capital Expenditures
|
||||||||||||
|
Performance Materials
|
|
|
|
|||||||||
|
Specialty Minerals
|
|
|
|
|||||||||
|
Refractories
|
|
|
|
|||||||||
|
Total
|
|
|
|
|||||||||
MINERALS TECHNOLOGIES INC. AND SUBSIDIARY COMPANIES
NOTES TO CONSOLIDATED FINANCIAL STATEMENTS
A reconciliation of the totals reported for the operating segments to the applicable line items in the consolidated financial statements is as follows:
|
|
Year Ended December 31,
|
|||||||||||
|
(millions of dollars)
|
2022
|
2021
|
2020
|
|||||||||
|
Income from Operations before Provision for Taxes on Income
|
||||||||||||
|
Income from operations for reportable segments
|
$
|
|
$
|
|
$
|
|
||||||
|
Litigation expenses
|
(
|
)
|
|
(
|
)
|
|||||||
|
Acquisition related transaction and integration costs
|
(
|
)
|
(
|
)
|
(
|
)
|
||||||
|
Unallocated corporate expenses
|
(
|
)
|
(
|
)
|
(
|
)
|
||||||
|
Consolidated income from operations
|
|
|
|
|||||||||
|
Non-operating deductions, net
|
(
|
)
|
(
|
)
|
(
|
)
|
||||||
|
Income before tax and equity in earnings
|
|
|
|
|||||||||
|
Total Assets
|
||||||||||||
|
Total segment assets
|
|
|
|
|||||||||
|
Corporate assets
|
|
|
|
|||||||||
|
Consolidated total assets
|
|
|
|
|||||||||
|
Capital Expenditures
|
||||||||||||
|
Total segment capital expenditures
|
|
|
|
|||||||||
|
Corporate capital expenditures
|
|
|
|
|||||||||
|
Consolidated capital expenditures
|
|
|
|
|||||||||
Financial information relating to the Company's operations by geographic area was as follows:
|
|
Year Ended December 31,
|
|||||||||||
|
(millions of dollars)
|
2022
|
2021
|
2020
|
|||||||||
|
Net Sales
|
||||||||||||
|
United States
|
$
|
|
$
|
|
$
|
|
||||||
|
Canada/Latin America
|
|
|
|
|||||||||
|
Europe/Africa
|
|
|
|
|||||||||
|
Asia
|
|
|
|
|||||||||
|
Total International
|
|
|
|
|||||||||
|
Consolidated net sales
|
|
|
|
|||||||||
|
Long-Lived Assets
|
||||||||||||
|
United States
|
$
|
|
$
|
|
$
|
|
||||||
|
Canada/Latin America
|
|
|
|
|||||||||
|
Europe/Africa
|
|
|
|
|||||||||
|
Asia
|
|
|
|
|||||||||
|
Total International
|
|
|
|
|||||||||
|
Consolidated long-lived assets
|
|
|
|
|||||||||
Net sales and long-lived assets are attributed to countries and geographic areas based on the location of the legal entity. No individual foreign country represents more than 10% of consolidated net sales or consolidated long-lived assets.
MINERALS TECHNOLOGIES INC. AND SUBSIDIARY COMPANIES
NOTES TO CONSOLIDATED FINANCIAL STATEMENTS
The Company's sales by product category are as follows:
|
|
Year Ended December 31,
|
|||||||||||
|
(millions of dollars)
|
2022
|
2021
|
2020
|
|||||||||
|
Household, Personal Care & Specialty Products
|
$
|
|
$
|
|
$
|
|
||||||
|
Metalcasting
|
|
|
|
|||||||||
|
Environmental Products
|
|
|
|
|||||||||
|
Building Materials
|
|
|
|
|||||||||
|
Paper PCC
|
|
|
|
|||||||||
|
Specialty PCC
|
|
|
|
|||||||||
|
Ground Calcium Carbonate
|
|
|
|
|||||||||
|
Talc
|
|
|
|
|||||||||
|
Refractory Products
|
|
|
|
|||||||||
|
Metallurgical Products
|
|
|
|
|||||||||
|
Total
|
$
|
|
$
|
|
$
|
|
||||||
Note 22. Subsequent Event
The Company determines its operating segments based on the discrete financial information that is regularly evaluated by its chief operating decision maker, our Chief Executive Officer, in deciding how to allocate resources and in assessing performance. In the first quarter of 2023, the Company realigned its business reporting structure and, accordingly, expects to be reorganized into
two
segments: Consumer & Specialties and Engineered Solutions.
The
Consumer & Specialties segment
provides technologically enhanced products to consumer-driven end markets, including mineral-to-shelf household products, as well as specialty additives that become functional components in a variety of consumer and industrial goods. This segment includes two product lines: Household & Personal Care and Specialty Additives.
The
Engineered Solutions segment provides
advanced process technologies and solutions that are designed to improve our customers’ manufacturing processes and projects. This segment includes
two
product lines: High-Temperature Technologies and Environmental & Infrastructure.
The new structure is expected to better
align our businesses and technologies with our customers and end markets and create a more efficient and effective management structure that reflects the way performance is evaluated and resources are allocated.
To the Shareholders and Board of Directors
Minerals Technologies Inc.:
Opinion on the Consolidated
Financial Statements
We have audited the accompanying consolidated
balance sheets of Minerals Technologies Inc. and subsidiaries (the Company) as of December 31, 2022
and 2021, the related consolidated statements of income, comprehensive income, cash flows, and changes in shareholders’ equity for
each of the years in the three-year period ended December 31, 2022, and the related notes and financial statement schedule (collectively, the consolidated financial statements). In our opinion, the consolidated financial statements present fairly, in all material respects, the financial position of the Company as of December 31, 2022 and 2021, and the results of its operations and its cash flows for each of the years in the three-year period ended December 31, 2022, in conformity with U.S. generally accepted accounting principles.
We also have audited, in accordance with the standards of the Public Company Accounting Oversight Board (United States) (PCAOB), the Company’s internal control over financial reporting as of December 31, 2022, based on
criteria established in Internal Control – Integrated Framework (2013) issued by the Committee of Sponsoring Organizations of the Treadway Commission, and our report dated
February 17, 2023 expressed an unqualified
opinion on the effectiveness of the Company’s internal control over financial reporting
.
Basis for Opinion
These consolidated financial statements are the responsibility of the Company’s management. Our responsibility is to express an opinion on these consolidated financial statements based on our audits. We are a public accounting firm registered with the PCAOB and are required to be independent with respect to the Company in accordance with the U.S. federal securities laws and the applicable rules and regulations of the Securities and Exchange Commission and the PCAOB.
We conducted our audits in accordance with the standards of the PCAOB. Those standards require that we plan and perform the audit to obtain reasonable assurance about whether the consolidated financial statements are free of material misstatement, whether due to error or fraud. Our audits included performing procedures to assess the risks of material misstatement of the consolidated financial statements, whether due to error or fraud, and performing procedures that respond to those risks. Such procedures included examining, on a test basis, evidence regarding the amounts and disclosures in the consolidated financial statements. Our audits also included evaluating the accounting principles used and significant estimates made by management, as well as evaluating the overall presentation of the consolidated financial statements. We believe that our audits provide a reasonable basis for our opinion.
Critical Audit Matter
The critical audit matter communicated below is a matter arising from the current period audit of the consolidated financial statements that was communicated or required to be communicated to the audit committee and that: (1) relates to accounts or disclosures that are material to the consolidated financial statements and (2) involved our especially challenging, subjective, or complex judgments. The communication of a critical audit matter does not alter in any way our opinion on the consolidated financial statements, taken as a whole, and we are not, by communicating the critical audit matter below, providing a separate opinion on the critical audit matter or on the accounts or disclosures to which it relates.
Measurement of projected pension benefit obligations
As discussed in Note 16 to the consolidated financial statements, the Company estimates the liability related to their pension plans using actuarial models that include assumptions about the Company’s discount rates. The Company’s projected pension benefit obligations were $348.9 million as of December 31, 2022.
We identified the measurement of the Company’s projected pension benefit obligations as a critical audit matter. Specialized skills are required to evaluate the Company’s assumptions. In particular, especially complex auditor judgement was required to assess the discount rates used in the determination of projected pension benefit obligations.
The following are the primary procedures we performed to address this critical audit matter. We evaluated the design and tested the operating effectiveness of certain internal controls over the Company’s pension process, including a control related to the Company’s assessment of the discount rates utilized within the actuarial models. We obtained an understanding of the actuarial models used by the Company in selecting the discount rate for each plan and inquired as to whether there have been changes to this methodology in the current year. We also involved an actuarial professional with specialized skills and knowledge, who assisted in evaluating the Company’s analysis of the discount rates and assessed the discount rates considering the timing and amount of benefit payments used in the determination of the projected pension benefit obligation.
/s/ KPMG LLP
We have served as the Company’s auditor since 1992.
New York, New York
February 17, 2023
Report of Independent Registered Public Accounting Firm
To the Shareholders and Board of Directors
Minerals Technologies Inc.:
Minerals Technologies Inc.:
Opinion on Internal Control Over Financial Reporting
We have audited Minerals Technologies Inc. and subsidiaries' (the Company) internal control over financial reporting as of December 31, 2022, based on criteria established in Internal Control – Integrated Framework (2013) issued by the Committee of Sponsoring Organizations of the Treadway Commission. In our opinion, the Company maintained, in all material respects, effective internal control over financial reporting as of December 31, 2022, based on criteria established in Internal Control – Integrated Framework (2013) issued by the Committee of Sponsoring Organizations of the Treadway Commission.
We also have audited, in accordance with the standards of the Public Company Accounting Oversight Board (United States) (PCAOB), the consolidated balance sheets of the Company as of December 31, 2022 and 2021, the related consolidated statements of income, comprehensive income, cash flows, and changes in shareholders’ equity for each of the years in the three-year period ended December 31, 2022, and the related notes and financial statement schedule (collectively, the consolidated financial statements), and our report dated February 17, 2023 expressed an unqualified opinion on those consolidated financial statements.
Basis for Opinion
The Company’s management is responsible for maintaining effective internal control over financial reporting and for its assessment of the effectiveness of internal control over financial reporting, included in the accompanying Management's Report On Internal Control Over Financial Reporting. Our responsibility is to express an opinion on the Company’s internal control over financial reporting based on our audit. We are a public accounting firm registered with the PCAOB and are required to be independent with respect to the Company in accordance with the U.S. federal securities laws and the applicable rules and regulations of the Securities and Exchange Commission and the PCAOB.
We conducted our audit in accordance with the standards of the PCAOB. Those standards require that we plan and perform the audit to obtain reasonable assurance about whether effective internal control over financial reporting was maintained in all material respects. Our audit of internal control over financial reporting included obtaining an understanding of internal control over financial reporting, assessing the risk that a material weakness exists, and testing and evaluating the design and operating effectiveness of internal control based on the assessed risk. Our audit also included performing such other procedures as we considered necessary in the circumstances. We believe that our audit provides a reasonable basis for our opinion.
Definition and Limitations of Internal Control Over Financial Reporting
A company’s internal control over financial reporting is a process designed to provide reasonable assurance regarding the reliability of financial reporting and the preparation of financial statements for external purposes in accordance with generally accepted accounting principles. A company’s internal control over financial reporting includes those policies and procedures that (1) pertain to the maintenance of records that, in reasonable detail, accurately and fairly reflect the transactions and dispositions of the assets of the company; (2) provide reasonable assurance that transactions are recorded as necessary to permit preparation of financial statements in accordance with generally accepted accounting principles, and that receipts and expenditures of the company are being made only in accordance with authorizations of management and directors of the company; and (3) provide reasonable assurance regarding prevention or timely detection of unauthorized acquisition, use, or disposition of the company’s assets that could have a material effect on the financial statements.
Because of its inherent limitations, internal control over financial reporting may not prevent or detect misstatements. Also, projections of any evaluation of effectiveness to future periods are subject to the risk that controls may become inadequate because of changes in conditions, or that the degree of compliance with the policies or procedures may deteriorate.
/s/ KPMG LLP
New York, New York
February 17, 2023
February 17, 2023
Management of Minerals Technologies Inc. is responsible for the preparation, integrity and fair presentation of its published consolidated financial statements. The financial statements have been prepared in accordance with U.S. generally accepted accounting principles and, as such, include amounts based on judgments and estimates made by management. The Company also prepared the other information included in the annual report and is responsible for its accuracy and consistency with the consolidated financial statements.
Management is also responsible for establishing and maintaining effective internal control over financial reporting. The Company's internal control over financial reporting includes those policies and procedures that pertain to the Company's ability to record, process, summarize and report reliable financial data. The Company maintains a system of internal control over financial reporting, which is designed to provide reasonable assurance to the Company's management and board of directors regarding the preparation of reliable published financial statements and safeguarding of the Company's assets. The system includes a documented organizational structure and division of responsibility, established policies and procedures, including a code of conduct to foster a strong ethical climate, which are communicated throughout the Company, and the careful selection, training and development of our people.
The Board of Directors, acting through its Audit Committee, is responsible for the oversight of the Company's accounting policies, financial reporting and internal control. The Audit Committee of the Board of Directors is comprised entirely of outside directors who are independent of management. The Audit Committee is responsible for the appointment and compensation of the independent registered public accounting firm. It meets periodically with management, the independent registered public accounting firm and the internal auditors to ensure that they are carrying out their responsibilities. The Audit Committee is also responsible for performing an oversight role by reviewing and monitoring the financial, accounting and auditing procedures of the Company in addition to reviewing the Company's financial reports. The independent registered public accounting firm and the internal auditors have full and unlimited access to the Audit Committee, with or without management, to discuss the adequacy of internal control over financial reporting, and any other matters which they believe should be brought to the attention of the Audit Committee.
Management recognizes that there are inherent limitations in the effectiveness of any system of internal control over financial reporting, including the possibility of human error and the circumvention or overriding of internal control. Accordingly, even effective internal control over financial reporting can provide only reasonable assurance with respect to financial statement preparation and may not prevent or detect misstatements. Further, because of changes in conditions, the effectiveness of internal control over financial reporting may vary over time.
The Company assessed its internal control system as of December 31, 2022 in relation to criteria for effective internal control over financial reporting described in "Internal Control
–
Integrated Framework (2013)" issued by the Committee of Sponsoring Organizations of the Treadway Commission. Based on its assessment, the Company has determined that, as of December 31, 2022, its system of internal control over financial reporting was effective.
The consolidated financial statements have been audited by the independent registered public accounting firm, which was given unrestricted access to all financial records and related data, including minutes of all meetings of stockholders, the Board of Directors and committees of the Board. Reports of the independent registered public accounting firm, which includes the independent registered public accounting firm's attestation of the effectiveness of the Company's internal control over financial reporting are also presented within this document.
|
/s/ Douglas T. Dietrich
Chairman of the Board and Chief Executive Officer
|
/s/ Erik C. Aldag
Senior Vice President, Finance and Treasury, Chief Financial Officer
|
|
|
/s/ Michael A. Cipolla
Vice President, Corporate Controller and Chief Accounting Officer
|
February 17, 2023
MINERALS TECHNOLOGIES INC. & SUBSIDIARY COMPANIES
SCHEDULE II
–
VALUATION AND QUALIFYING ACCOUNTS
(millions of dollars)
|
Description
|
Balance at
Beginning of Period
|
Additions Charged to Costs,
Provisions and Expenses
|
Deductions (a)
|
Balance at
End of Period
|
||||||||||||
|
Year Ended December 31,
2022
|
||||||||||||||||
|
Valuation and qualifying accounts deducted from assets to which they apply:
|
||||||||||||||||
|
Allowance for doubtful accounts
|
$
|
|
|
(
|
)
|
$
|
|
|||||||||
|
Year Ended December 31,
2021
|
||||||||||||||||
|
Valuation and qualifying accounts deducted from assets to which they apply:
|
||||||||||||||||
|
Allowance for doubtful accounts
|
$
|
|
|
(
|
)
|
$
|
|
|||||||||
|
Year Ended December 31,
2020
|
||||||||||||||||
|
Valuation and qualifying accounts deducted from assets to which they apply:
|
||||||||||||||||
|
Allowance for doubtful accounts
|
$
|
|
|
(
|
)
|
$
|
|
|||||||||
| (a) |
|
TABLE OF CONTENTS
Part IItem 1. BusinessItem 1A. Risk FactorsItem 1B. Unresolved Staff CommentsItem 2. PropertiesItem 3. Legal ProceedingsItem 4. Mine Safety DisclosuresPart IIItem 5. Market For Registrant's Common Equity, Related Stockholder Matters and Issuer Purchases Of Equity SecuritiesItem 6. [reserved]Item 7. Management's Discussion and Analysis Of Financial Condition and Results Of OperationsItem 7A. Quantitative and Qualitative Disclosures About Market RiskItem 8. Financial Statements and Supplementary DataItem 9. Changes in and Disagreements with Accountants on Accounting and Financial DisclosureItem 9A. Controls and ProceduresItem 9B. Other InformationItem 9C. Disclosure Regarding Foreign Jurisdictions That Prevent InspectionsPart IIIItem 10. Directors, Executive Officers and Corporate GovernanceItem 11. Executive CompensationItem 12. Security Ownership Of Certain Beneficial Owners and Management and Related Stockholder MattersItem 13. Certain Relationships and Related Transactions, and Director IndependenceItem 14. Principal Accountant Fees and ServicesPart IVItem 15. Exhibits and Financial Statement SchedulesNote 1. Summary Of Significant Accounting PoliciesNote 2. LeasesNote 3. Revenue From Contracts with CustomersNote 4. AcquisitionsNote 5. Restructuring and Other Items, NetNote 6. Stock-based CompensationNote 7. Earnings Per Share (eps)Note 8. Income TaxesNote 9. InventoriesNote 10. Property, Plant and EquipmentNote 11. Goodwill and Other Intangible AssetsNote 12. Derivative Financial Instruments and Hedging ActivitiesNote 13. Fair Value Of Financial InstrumentsNote 14. Financial Instruments and Concentrations Of Credit RiskNote 15. Long-term Debt and CommitmentsNote 16. Benefit PlansNote 17. ContingenciesNote 18. Stockholders' EquityNote 19. Accumulated Other Comprehensive Income (loss)Note 20. Accounting For Asset Retirement ObligationsNote 21. Segment and Related InformationNote 22. Subsequent Event