MICRON TECHNOLOGY INC
10-Ks and 10-Qs
|
|
|
|
|
|
|
|
|
|
|
|
|
|
|
|
|
|
|
|
|
|
|
|
|
|
|
|
|
|
|
|
|
|
|
|
|
|
|
|
|
|
|
|
|
|
|
|
|
|
|
|
|
|
|
|
SECURITIES AND EXCHANGE COMMISSION
Washington, D.C. 20549
FORM 10-K
|
(Mark One)
|
|
|
x
|
ANNUAL REPORT PURSUANT TO SECTION 13 OR 15(d) OF THE
SECURITIES EXCHANGE ACT OF 1934
|
OR
|
o
|
TRANSITION REPORT PURSUANT TO SECTION 13 OR 15(d) OF THE SECURITIES EXCHANGE ACT OF 1934
|
Commission file number 1-10658
Micron Technology, Inc.
(Exact name of registrant as specified in its charter)
|
Delaware
|
75-1618004
|
|
(State or other jurisdiction of incorporation or organization)
|
(IRS Employer Identification No.)
|
|
8000 S. Federal Way, Boise, Idaho
|
83716-9632
|
|
(Address of principal executive offices)
|
(Zip Code)
|
|
Registrant's telephone number, including area code
|
(208) 368-4000
|
|
Securities registered pursuant to Section 12(b) of the Act:
|
|
|
Title of each class
|
Name of each exchange on which registered
|
|
Common Stock, par value $.10 per share
|
NASDAQ Global Select Market
|
None
(Title of Class)
Indicate by check mark if the registrant is a well-known seasoned issuer, as defined in Rule 405 of the Securities Act. Yes
¨
No
T
Indicate by check mark if the registrant is not required to file reports pursuant to Section 13 or 15(d) of the Act. Yes
¨
No
T
Indicate by check mark whether the registrant (1) has filed all reports required to be filed by Section 13 or 15(d) of the Securities Exchange Act of 1934 during the preceding 12 months (or for such shorter period that the registrant was required to file such reports), and (2) has been subject to such filing requirements for the past 90 days. Yes
¨
No
T
Indicate by check mark whether the registrant has submitted electronically and posted on its corporate Website, if any, every Interactive Data File required to be submitted and posted pursuant to Rule 405 of Regulation S-T (§232.405 of this chapter) during the preceding 12 months (or for such shorter period that the registrant was required to submit and post such files). Yes
T
No
¨
Indicate by check mark if disclosure of delinquent filers pursuant to Item 405 of Regulation S-K (§ 229.405 of this chapter) is not contained herein, and will not be contained, to the best of registrant’s knowledge, in definitive proxy or information statements incorporated by reference in Part III of this Form 10-K or any amendment to this Form 10-K.
¨
Indicate by check mark whether the registrant is a large accelerated filer, an accelerated filer, a non-accelerated filer, or a smaller reporting company. See definitions of "large accelerated filer," "accelerated filer" and "smaller reporting company" in Rule 12b-2 of the Exchange Act:
|
Large Accelerated Filer
x
|
Accelerated Filer
o
|
Non-Accelerated Filer
o
(Do not check if a smaller reporting company)
|
Smaller Reporting Company
o
|
Indicate by check mark whether the registrant is a shell company (as defined in Rule 12b-2 of the Exchange Act). Yes
o
No
x
The aggregate market value of the voting stock held by non-affiliates of the registrant, based upon the closing price of such stock on March 3, 2011, as reported by the NASDAQ Global Select Market, was approximately
$9.1 billion
. Shares of common stock held by each executive officer and director and by each person who owns 5% or more of the outstanding common stock have been excluded in that such persons may be deemed to be affiliates. This determination of affiliate status is not necessarily a conclusive determination for other purposes.
The number of outstanding shares of the registrant's common stock as of October 18, 2011, was
987,573,286
.
DOCUMENTS INCORPORATED BY REFERENCE:
Portions of the Proxy Statement for the registrant’s 2011 Annual Meeting of Shareholders to be held on January 24, 2012, are incorporated by reference into Part III of this Annual Report on Form 10-K.
The following discussion contains trend information and other forward-looking statements that involve a number of risks and
uncertainties. Forward-looking statements include, but are not limited to, statements such as those made in "Products" regarding growth in demand for NAND Flash products and solid-state drives and the growth in the markets for phase change memory products; in "Manufacturing" regarding the transition to smaller line-width process technologies and increases in output from IM Flash's wafer fabrication facility in Singapore; and in "Research and Develop" regarding tool installation at our new research and development facility in Boise, Idaho. Our actual results could differ materially from our historical results and those
discussed in the forward-looking statements. Factors that could cause actual results to differ materially include, but are not limited to, those identified in "Item 1A. Risk Factors." All period references are to our fiscal periods unless otherwise indicated.
Corporate Information
Micron Technology, Inc., a Delaware corporation, was incorporated in 1978. As used herein, "we," "our," "us" and similar terms include Micron Technology, Inc. and its subsidiaries, unless the context indicates otherwise. Our executive offices are located at 8000 South Federal Way, Boise, Idaho 83716-9632 and our telephone number is (208) 368-4000. Information about us is available on the internet at www.micron.com. Copies of our Annual Report on Form 10-K, Quarterly Reports on Form 10-Q and Current Reports on Form 8-K, as well as any amendments to these reports, are available through the our website as soon as reasonably practicable after they are electronically filed with or furnished to the Securities and Exchange Commission (the "SEC"). Materials filed by us with the SEC are also available at the SEC’s Public Reference Room at 100 F Street, NE, Washington, D.C. 20549. Information on the operation of the Public Reference Room is available by calling (800) SEC-0330. Also available on our website are our: Corporate Governance Guidelines, Governance Committee Charter, Compensation Committee Charter, Audit Committee Charter and Code of Business Conduct and Ethics. Any amendments or waivers of our Code of Business Conduct and Ethics will also be posted on our website at www.micron.com within four business days of the amendment or waiver. Copies of these documents are available to shareholders upon request. Information contained or referenced on our website is not incorporated by reference and does not form a part of this Annual Report on Form 10-K.
Overview
We are a global manufacturer and marketer of semiconductor devices, principally DRAM, NAND Flash and NOR Flash memory, as well as other innovative memory technologies, packaging solutions and semiconductor systems for use in leading-edge computing, consumer, networking, automotive, industrial and mobile products. In addition, we manufacture semiconductor components for CMOS image sensors and other semiconductor products. We market our products through our internal sales force, independent sales representatives and distributors primarily to original equipment manufacturers and retailers located around the world. Our success is largely dependent on the market acceptance of our diversified portfolio of semiconductor products, efficient utilization of our manufacturing infrastructure, successful ongoing development of advanced process technologies and the return on research and development investments.
We obtain products from three primary sources: (1) production from our wholly-owned manufacturing facilities, (2) production from our joint venture manufacturing facilities and (3) to a lesser degree from third party manufacturers. In recent years, we have increased our manufacturing scale and product diversity through strategic acquisitions and various partnering arrangements, including joint ventures, which have helped us to attain lower costs than we could otherwise achieve through internal investments alone.
2
We have made significant investments to develop the proprietary product and process technology that is implemented in our worldwide manufacturing facilities and through our joint ventures to enable the production of semiconductor products with increasing functionality and performance at lower costs. We generally reduce the manufacturing cost of each generation of product through advancements in product and process technology such as our leading-edge line-width process technology and innovative array architecture. We continue to introduce new generations of products that offer improved performance characteristics, such as higher data transfer rates, reduced package size, lower power consumption and increased memory density. To leverage our significant investments in research and development, we have formed various strategic joint ventures that have allowed us to share the costs of developing memory product and process technologies with our joint venture partners. In addition, from time to time, we have also sold and/or licensed technology to other parties. We continue to pursue additional opportunities to monetize our investment in intellectual property through partnering and other arrangements.
In the second quarter of 2011, we reorganized our business to better align with the markets we serve. All prior period amounts have been retrospectively adjusted to reflect this reorganization. After the reorganization, we have the following four reportable segments:
DRAM Solutions Group ("DSG"):
Includes high-volume DRAM products sold to the PC, consumer electronics, networking and server markets.
NAND Solutions Group ("NSG"):
Includes high-volume NAND Flash products sold into data storage, personal music players, and portions of computing markets, as well as NAND Flash products sold to Intel Corporation ("Intel") through our consolidated IM Flash joint ventures.
Wireless Solutions Group ("WSG"):
Includes DRAM, NAND Flash and NOR Flash products, including multi-chip packages, sold to the mobile device market.
Embedded Solutions Group ("ESG"):
Includes DRAM, NAND Flash and NOR Flash products sold into automotive and industrial applications, as well as NOR and NAND Flash sold to consumer electronics, networking, PC and server markets.
Our other operations do not meet the quantitative thresholds of a reportable segment and are reported under All Other. All Other includes our CMOS image sensor, LED, microdisplay and solar operations.
Products
Over the past several years we have been focused on diversifying our product portfolio beyond DRAM products, which historically had constituted a substantial majority of our sales. In 2011, sales of DRAM products were less than half our total sales and in the fourth quarter of 2011 sales of NAND Flash products exceeded sales of DRAM products for the first time in our history.
Dynamic Random Access Memory ("DRAM")
DRAM products are high-density, low-cost-per-bit, random access memory devices that provide high-speed data storage and retrieval. DRAM products were 41%, 60% and 50% of our total net sales in 2011, 2010 and 2009, respectively. DRAM products are sold by the DSG, WSG and ESG segments. We offer DRAM products with a variety of performance, pricing and other characteristics including high-volume DDR3 and DDR2 products as well as specialty DRAM memory products including Mobile Low Power DRAM ("LPDRAM"), DDR, SDRAM, Reduced Latency DRAM ("RLDRAM") and Pseudo-static DRAM ("PSRAM").
DDR3 and DDR2
:
DDR3 and DDR2 are standardized, high-density, high-volume DRAM products that are sold primarily for use as main system memory in computers and servers. DDR3 and DDR2 products offer high speed and high bandwidth at a relatively low cost compared to other DRAM products. DDR3 products were 21%, 22% and 7% of our total net sales in 2011, 2010 and 2009, respectively. DDR2 products were 10%, 24% and 22% of our total net sales in 2011, 2010 and 2009, respectively.
We offer DDR3 products in 1 gigabit ("Gb"), 2Gb and 4 Gb densities and DDR2 products in 256 megabit ("Mb"), 512 Mb, 1 gigabit and 2 Gb densities. We expect these densities will be necessary to meet future customer demands for a broad array of products and offer these products in multiple configurations, speeds and package types.
3
Specialty DRAM products
:
We also offer DRAM memory products including DDR and DDR2 Mobile LPDRAM, DDR, SDRAM, RLDRAM and PSRAM in densities ranging from 64 Mb to 2 Gb. LPDRAM products are used primarily in laptop computers, tablets, and other consumer devices that require low power consumption. Our other specialty DRAM products are used primarily in networking devices, servers, consumer electronics, communications equipment and computer peripherals as well as computer memory upgrades. Aggregate sales of LPDRAM and our other DRAM products were 10%, 14% and 21% of our total net sales in 2011, 2010 and 2009, respectively.
NAND Flash Memory ("NAND")
NAND products are electrically re-writeable, non-volatile semiconductor memory devices that retain content when power is turned off. NAND sales were 36%, 28% and 39% of our total net sales in 2011, 2010 and 2009, respectively. NAND products are sold by the NSG, WSG and ESG segments. NAND is ideal for mass-storage devices due to its fast erase and write times, high density, and low cost per bit relative to other solid-state memory. Removable storage devices, such as USB and Flash memory cards, are used with applications such as personal computers, digital still cameras, MP3/4 players and mobile phones. Embedded NAND-based storage devices are utilized in mobile phones, MP3/4 players, computers, solid-state drives ("SSDs"), tablets and other personal and consumer applications. The market for NAND products has grown rapidly and we expect it to continue to grow due to demand for these and other removable and embedded storage devices.
Our NAND products feature a small cell structure that enables higher densities for demanding applications. We offer Single-Level Cell ("SLC") NAND products and Multi-Level Cell ("MLC") NAND products, which have two or more times the bit density of SLC NAND products. In 2011, we offered SLC NAND products in 1 Gb, 2 Gb, 4 Gb and 8 Gb densities. In addition, we offered 8 Gb, 16 Gb, 32 Gb and 64 Gb 2-bit-per-cell MLC NAND products and 32 Gb and 64 Gb 3-bit-per-cell MLC NAND products. We offer high-speed NAND products that are compatible with advanced interfaces. We offer NAND Flash in multichip packages ("MCPs") that incorporate NAND Flash with other memory products to create a single package that simplifies design while improving performance and functionality.
We offer next-generation RealSSD™ solid-state drives for enterprise server and notebook applications which feature higher performance, reduced power consumption and enhanced reliability as compared to typical hard disk drives. Using our SLC and MLC NAND process technology, these SSDs are offered in 2.5-inch and 1.8-inch form factors, with densities up to 512 gigabytes. We also offer embedded USB devices with densities up to 16 gigabytes. We are sampling enterprise PCIe SSDs with capacities up to 700 gigabytes. We expect that demand for SSDs will continue to increase significantly over the next several years.
Through our Lexar™ brand, we sell high-performance digital media products and other flash-based storage products through retail and original equipment manufacturing ("OEM") channels. Our digital media products include a variety of flash memory cards and JumpDrive™ products with a range of speeds, capacities and value-added features. We offer flash memory cards in a variety of speeds and capacities and in all major media formats, including: CompactFlash, Memory Stick and Secure Digital ("SD"). CompactFlash and Memory Stick products sold by us incorporate our patented controller technology. Other products, including SD memory cards and some JumpDrive™ products, incorporate third party controllers. We sell products under our Lexar™ brand and manufacture products that are sold under other brand names. We also resell flash memory products that are purchased from other NAND Flash suppliers.
NOR Flash Memory ("NOR")
NOR products are electrically re-writeable, non-volatile semiconductor memory devices that retain content when power is turned off, offer fast read times due to random access capability and have execute-in-place ("XiP") capability that enables processors to read NOR without first accessing RAM. These capabilities make NOR ideal for storing program code in wireless and embedded applications. Our NOR sales originated from the May 7, 2010 acquisition of Numonyx and were 18% and 5% of our total net sales for 2011 and 2010, respectively. NOR products are sold by the WSG and ESG segments.
We offer both parallel and serial interface NOR products in a broad range of densities, packages, and features. Our parallel NOR products are constructed to meet the needs of the consumer electronics, industrial, wired and wireless communications, computing and automotive applications. These products offer high densities, XiP performance, architectural flexibility and proven reliability in rigorous industrial settings. Our serial NOR products are designed to meet the needs of consumer electronics, industrial, wired communications, and computing applications. These products offer industry-standard packaging, pinouts, command sets and chipset compatibility.
4
Phase Change Memory ("PCM")
PCM is a new memory technology that combines the attributes of NOR, NAND and RAM, simplifying memory and producing more capabilities within a single chip. PCM is bit-alterable, non-volatile memory featuring fast read/write/erase speeds that is highly scalable to lower line-width technologies. We currently offer both parallel and serial interface PCM products and expect that the market for these products will increase significantly in the next several years.
Partnering Arrangements
The following is a summary of our partnering arrangements as of September 1, 2011:
|
|
Partner(s)
|
Approximate Micron
Ownership Interest
|
Formed/
Acquired
|
Product Market
|
|||
|
Consolidated Entities:
|
|
|
|
|
|||
|
IMFT
|
(1)
|
Intel Corporation
|
51
|
%
|
2006
|
NAND Flash
|
|
|
IMFS
|
(1)
|
Intel Corporation
|
86
|
%
|
2007
|
NAND Flash
|
|
|
MP Mask
|
(2)
|
Photronics, Inc.
|
50
|
%
|
2006
|
Photomasks
|
|
|
Equity Method Investments:
|
|
|
|
|
|
||
|
Inotera
|
(3)
|
Nanya Technology Corporation
|
30
|
%
|
2009
|
DRAM
|
|
|
MeiYa
|
(3)
|
Nanya Technology Corporation
|
50
|
%
|
2008
|
DRAM
|
|
|
Transform
|
(4)
|
Origin Energy Limited
|
50
|
%
|
2010
|
Solar Panels
|
|
|
Aptina
|
(5)
|
Riverwood Capital LLC and TPG Partners VI, L.P.
|
35
|
%
|
2009
|
CMOS Image Sensors
|
|
|
(1)
|
IM Flash:
We partner with Intel Corporation ("Intel") for the design, development and manufacture of NAND Flash products. In connection therewith, we have formed two joint ventures with Intel to manufacture NAND Flash memory products for the exclusive benefit of the partners: IM Flash Technologies, LLC ("IMFT") and IM Flash Singapore LLP ("IMFS") (collectively, "IM Flash"). As of September 1, 2011, we owned an approximate 51% interest in IMFT and an approximate 86% interest in IMFS with the remaining interests held by Intel. Our ownership interest in IMFS increased from 51% prior to the second quarter of 2010 to 86% on September 1, 2011 as Intel did not match our capital contributions. On September 26, 2011, Intel participated in a capital call of IMFS by contributing $131 million. After that capital call, our ownership interest in IMFS was reduced to 82%. The partners share the output of IM Flash generally in proportion to their investment in IM Flash. We sell NAND Flash products to Intel through IM Flash at long-term negotiated prices approximating cost. We generally share product design and other research and development costs equally with Intel. In 2011, IM Flash began ramping production at a new Singapore wafer fabrication facility and we expect that output from this facility will significantly increase our overall NAND Flash production in 2012. (See "Item 8. Financial Statements and Supplementary Data – Notes to Consolidated Financial Statements – Consolidated Variable Interest Entities – NAND Flash joint ventures with Intel" note.)
|
|
(2)
|
MP Mask:
We produce photomasks for leading-edge and advanced next generation semiconductors through MP Mask Technology Center, LLC ("MP Mask"), a joint venture with Photronics, Inc. ("Photronics"). We and Photronics also have supply arrangements wherein we purchase a substantial majority of the reticles produced by MP Mask. (See "Item 8. Financial Statements and Supplementary Data – Notes to Consolidated Financial Statements – Consolidated Variable Interest Entities – MP Mask Technology Center, LLC." note.)
|
5
|
(3)
|
Inotera and MeiYa:
We partner with Nanya Technology Corporation ("Nanya") for the design, development and manufacture of stack DRAM products, including the joint development of DRAM process technology. In connection therewith, we have partnered with Nanya in two Taiwan DRAM memory companies, Inotera Memories, Inc. ("Inotera") and MeiYa Technology Corporation ("MeiYa"). We have a supply agreement with Inotera and Nanya which gives us the right and obligation to purchase 50% of Inotera’s semiconductor memory capacity subject to specific terms and conditions. Under the formula for this supply agreement, all parties’ manufacturing costs related to wafers supplied by Inotera, as well as our and Nanya’s revenue for the resale of products from wafers supplied by Inotera, are considered in determining costs for wafers from Inotera. Inotera accounted for 37% of our DRAM gigabit production in the fourth quarter of 2011. We also partner with Nanya to jointly develop process technology and designs to manufacture stack DRAM products. In connection with the partnering agreement, we have also deployed and licensed certain intellectual property related to the manufacture of stack DRAM products to Nanya and licensed certain intellectual property from Nanya. Under a cost-sharing arrangement effective beginning in April 2010, we generally share DRAM development costs equally with Nanya. In addition, in 2010 we began receiving royalties from Nanya for sales of stack DRAM products manufactured by or for Nanya with technology developed prior to April 2010. (See "Item 8. Financial Statements and Supplementary Data – Notes to Consolidated Financial Statements – Equity Method Investments – Inotera and MeiYa DRAM Joint Ventures with Nanya" note.)
|
|
(4)
|
Transform:
On December 18, 2009, we acquired a 50% interest in Transform Solar Pty Limited ("Transform"), a subsidiary of Origin Energy Limited ("Origin") in exchange for nonmonetary assets with a fair value of $65 million, consisting of manufacturing facilities, equipment, intellectual property and a fully-paid lease to a portion of our Boise, Idaho manufacturing facilities. Transform develops and manufactures photovoltaic solar panels. (See "Item 8. Financial Statements and Supplementary Data – Notes to Consolidated Financial Statements – Equity Method Investments – Transform" note.)
|
|
(5)
|
Aptina:
We manufacture CMOS image sensor products for Aptina under a wafer supply agreement. We own 64% of Aptina’s common stock and none of their preferred stock resulting in a total ownership interest in Aptina of 35%. Our investment in Aptina is accounted for as an equity method investment, in which we recognize our share of Aptina’s results of operations based on our 64% share of Aptina’s common stock. (See "Item 8. Financial Statements and Supplementary Data – Notes to Consolidated Financial Statements – Equity Method Investments – Aptina" note.)
|
Manufacturing
Our manufacturing facilities are located in the United States, China, Israel, Italy, Malaysia, Puerto Rico and Singapore. Our Inotera joint venture also has a wafer fabrication facility in Taiwan. In 2011, we sold our wafer fabrication facility in Japan to Tower Semiconductor Ltd. ("Tower") and entered into a supply agreement for Tower to manufacture products for us in the facility through approximately May 2014. Our manufacturing facilities generally operate 24 hours per day, 7 days per week. Semiconductor manufacturing is extremely capital intensive, requiring large investments in sophisticated facilities and equipment. A significant portion of our semiconductor equipment is replaced every three to five years with increasingly advanced equipment. DRAM, NAND and NOR share common manufacturing processes, enabling us to leverage our product and process technologies and manufacturing infrastructure across these product lines.
Our process for manufacturing semiconductor products is complex, involving a number of precise steps, including wafer fabrication, assembly and test. Efficient production of semiconductor products requires utilization of advanced semiconductor manufacturing techniques and effective deployment of these techniques across multiple facilities. The primary determinants of manufacturing cost are die size, number of mask layers, number of fabrication steps and number of good die produced on each wafer. Other factors that contribute to manufacturing costs are wafer size, cost and sophistication of manufacturing equipment, equipment utilization, process complexity, cost of raw materials, labor productivity, package type and cleanliness of the manufacturing environment. We continuously enhance our production processes, reducing die sizes and transitioning to higher density products. In 2011, we transitioned the majority of our DRAM production to 42nm line-width process technology and began transitioning to 30nm line-width process technology. In 2011 most of our NAND Flash memory products were manufactured on our 25nm line-width process technology and we expect to continue transitioning to 20nm line-width process technology in 2012. In 2011, we manufactured all of our NAND Flash and our high-volume DRAM products on 300mm wafers. We manufactured NOR Flash, some specialty DRAM and CMOS image sensor products on 200mm wafers. In 2011, the majority of our NOR Flash memory products were manufactured on our 65nm line-width process technology and we expect to continue transitioning to 45nm line-width technology in 2012.
6
Wafer fabrication occurs in a highly controlled, clean environment to minimize dust and other yield- and quality-limiting contaminants. Despite stringent manufacturing controls, equipment errors, minute impurities in materials, defects in photomasks, circuit design marginalities or defects and dust particles can lead to wafers being scrapped and individual circuits being nonfunctional. Success of our manufacturing operations depends largely on minimizing defects to maximize yield of high-quality circuits. In this regard, we employ rigorous quality controls throughout the manufacturing, screening and testing processes. We are able to recover many nonstandard devices by testing and grading them to their highest level of functionality.
After fabrication, most silicon wafers are separated into individual die. We sell semiconductor products in both packaged and unpackaged (i.e. "bare die") forms. For packaged products, functional die are sorted, connected to external leads and encapsulated in plastic packages. We assemble products in a variety of packages, including TSOP (thin small outline package), TQFP (thin quad flat package) and FBGA (fine pitch ball grid array). Bare die products address customer requirements for smaller form factors and higher memory densities and provide superior flexibility for use in packaging technologies such as systems-in-a-package (SIPs) and multi-chip packages (MCPs), which reduce the board area required.
We test our products at various stages in the manufacturing process, perform high temperature burn-in on finished products and conduct numerous quality control inspections throughout the entire production flow. In addition, we use our proprietary AMBYX™ line of intelligent test and burn-in systems to perform simultaneous circuit tests of DRAM die during the burn-in process, capturing quality and reliability data and reducing testing time and cost.
We assemble a significant portion of our memory products into memory modules. Memory modules consist of an array of memory components attached to printed circuit boards ("PCBs") that insert directly into computer systems or other electronic devices. We also contract with independent foundries and assembly and testing organizations to manufacture Lexar-brand flash media products such as memory cards and USB devices.
We utilize subcontractors to perform a significant portion of our assembly and module assembly services. Outsourcing these services enables us to reduce costs and minimize our capital investment.
In recent years, we have produced an increasingly broad portfolio of products, which enhances our ability to allocate resources to our most profitable products but also increases the complexity of our manufacturing process. Although our product lines generally use similar manufacturing processes, our overall cost efficiency can be affected by frequent conversions to new products, the allocation of manufacturing capacity to more complex, smaller-volume parts and the reallocation of manufacturing capacity across various product lines.
NAND Flash Joint Ventures with Intel Corporation
Our IM Flash joint ventures with Intel manufacture NAND Flash memory products for the exclusive benefit of the partners. We share the output of IM Flash with Intel generally in proportion to our and Intel's investment in IM Flash. In 2011, IM Flash began ramping production at a new Singapore wafer fabrication facility and we expect that output from this facility will significantly increase our overall NAND Flash production in 2012.
Inotera
Under a supply agreement with Inotera, we have the right and obligation to obtain 50% of Inotera's total capacity of approximately 130,000 300mm DRAM wafer starts per month as of September 1, 2011. Inotera accounted for 33% of our DRAM gigabit production in 2011.
MP Mask
We produce photomasks for leading-edge and advanced next generation semiconductors through MP Mask. We and Photronics also have supply arrangements wherein we have agreed to purchase a substantial majority of the reticles produced by MP Mask.
Aptina Supply Agreement
We manufacture CMOS image sensor products for Aptina under a wafer supply agreement.
(See "Partnering Arrangements")
7
Availability of Raw Materials
Our production processes require raw materials that meet exacting standards, including several that are customized for, or are unique to, us. We generally have multiple sources and sufficient availability of supply. However, only a limited number of suppliers are capable of delivering certain raw materials that meet our standards. In some cases, materials are provided by a single supplier. Various factors could reduce the availability of raw materials such as silicon wafers, photomasks, chemicals, gases, photoresist, lead frames, molding compound and other materials. Shortages may occur from time to time in the future. In addition, transportation problems could delay our receipt of raw materials. Lead times for the supply of raw materials have been extended in the past. If our supply of raw materials is interrupted or our lead times extended, our results of operations or financial condition could be adversely affected.
Marketing and Customers
Our products are sold into computing, consumer, networking, telecommunications, automotive, industrial and imaging markets. Market concentrations from
2011
net sales were approximately as follows: computing (including desktop PCs, servers, notebooks and workstations),
30%
; mobile,
25%
; consumer electronics,
15%
; and networking and storage,
15%
. Sales to Intel, primarily of NAND Flash from our IM Flash joint ventures, were 10% of our net sales in 2011, 9% of our net sales in 2010, and 20% of our net sales in 2009. Sales to Hewlett-Packard Company, primarily of DRAM, were 9% of our net sales in 2011 and 13% of our net sales in 2010.
Our semiconductor memory products are offered under the Micron, Lexar®, Crucial™, SpecTek® and Numonyx® brand names and private labels. We market our semiconductor memory products primarily through our own direct sales force and maintain sales offices in our primary markets around the world. We sell Lexar-branded NAND Flash memory products primarily through retail channels and our Crucial™-branded products through a web-based customer direct sales channel as well as channel and distribution partners. Our products are also offered through independent sales representatives and distributors. Independent sales representatives obtain orders subject to final acceptance by us and are compensated on a commission basis. We make shipments against these orders directly to the customer. Distributors carry our products in inventory and typically sell a variety of other semiconductor products, including competitors' products. We maintain inventory at locations in close proximity to certain key customers to facilitate rapid delivery of products.
We offer products designed to meet the diverse needs of computing, server, automotive, networking, commercial/industrial, consumer electronics, mobile, embedded, security and medical applications. Many of our customers require a thorough review or qualification of semiconductor products, which may take several months.
Backlog
Because of volatile industry conditions, customers are reluctant to enter into long-term, fixed-price contracts. Accordingly, new order volumes for our semiconductor products fluctuate significantly. We typically accept orders with acknowledgment that the terms may be adjusted to reflect market conditions at the date of shipment. For these reasons, we do not believe that our order backlog as of any particular date is a reliable indicator of actual sales for any succeeding period.
Product Warranty
Because the design and manufacturing process for semiconductor products is highly complex, it is possible that we may produce products that do not comply with customer specifications, contain defects or are otherwise incompatible with end uses. In accordance with industry practice, we generally provide a limited warranty that our products are in compliance with our specifications existing at the time of delivery. Under our general terms and conditions of sale, liability for certain failures of product during a stated warranty period is usually limited to repair or replacement of defective items or return of, or a credit with respect to, amounts paid for such items. Under certain circumstances, we provide more extensive limited warranty coverage than that provided under our general terms and conditions.
8
Competition
We face intense competition in the semiconductor memory markets from a number of companies, including Elpida Memory, Inc.; Hynix Semiconductor Inc.; Samsung Electronics Co., Ltd; SanDisk Corporation; Spansion Inc. and Toshiba Corporation. Some of our competitors are large corporations or conglomerates that may have greater resources to withstand downturns in the semiconductor markets in which we compete, invest in technology and capitalize on growth opportunities. Our competitors seek to increase silicon capacity, improve yields, reduce die size and minimize mask levels in their product designs resulting in significantly increased worldwide supply and downward pressure on prices. Many of our high-volume memory products are manufactured to industry standard specifications, and as such, have similar performance characteristics to our competitors. For these high-volume memory products, the principal competitive factors are generally price and performance characteristics including: operating speed, power consumption, reliability, compatibility, size and form factors. For our other memory products, the aforementioned performance characteristics generally take precedent to pricing.
Research and Development
Our process technology research and development ("R&D") efforts are focused primarily on development of successively smaller line-width process technologies, which are designed to facilitate our transition to next generation memory products. Additional process technology R&D efforts focus on advanced computing and mobile memory architectures, the investigation of new opportunities that leverage our core semiconductor expertise and the development of new manufacturing materials. Product design and development efforts are concentrated on our high density DDR3 DRAM and LP-DDR2 mobile LPDRAM products as well as high density and mobile NAND Flash memory (including multi-level cell technology), NOR Flash memory, specialty memory, PCM and other next-generation memories and memory systems.
Our R&D expenses were $791 million, $624 million and $647 million in 2011, 2010 and 2009, respectively. We generally share R&D process and design costs for NAND Flash equally with Intel and for DRAM equally with Nanya. As a result of reimbursements under our NAND Flash and DRAM cost sharing arrangements with our joint venture partners, our overall R&D expenses were reduced by $236 million, $155 million and $107 million in 2011, 2010 and 2009, respectively.
To compete in the semiconductor memory industry, we must continue to develop technologically advanced products and processes. We believe that expansion of our semiconductor product offerings is necessary to meet expected market demand for specific memory solutions. Our process development center and largest design center are located at our corporate headquarters in Boise, Idaho. In 2011, we began construction of a new 450mm-wafer capable R&D facility in Boise which we expect will be ready for tool installations in the beginning of calendar year 2012. We have several additional product design centers in other strategic locations around the world. In addition, we develop leading edge photolithography mask technology at our MP Mask joint venture facility in Boise.
R&D expenses vary primarily with the number of development wafers processed, the cost of advanced equipment dedicated to new product and process development, and personnel costs. Because of the lead times necessary to manufacture our products, we typically begin to process wafers before completion of performance and reliability testing. We deem development of a product complete once the product has been thoroughly reviewed and tested for performance and reliability. R&D expenses can vary significantly depending on the timing of product qualification.
Geographic Information
Sales to customers outside the United States totaled $7.4 billion for 2011 and included $3.0 billion in sales to China, $924 million in sales to Europe, $744 million in sales to Taiwan, $737 million in sales to Malaysia and $1.5 billion in sales to the rest of the Asia Pacific region (excluding China, Malaysia and Taiwan). Sales to customers outside the United States totaled $7.1 billion for 2010 and $3.9 billion for 2009. As of September 1, 2011, we had net property, plant and equipment of $3.6 billion in Singapore, $3.5 billion in the United States, $190 million in Italy, $179 million in China, $94 million in Israel, and $36 million in other countries. (See "Item 8. Financial Statements and Supplementary Data – Notes to Consolidated Financial Statements – Geographic Information" note and "Item 1A. Risk Factors.")
9
Patents and Licenses
In recent years, we have been recognized as a leader in per capita and quality of patents issued. As of September 1, 2011, we owned approximately 17,100 U.S. patents and 3,200 foreign patents. In addition, we have numerous U.S. and foreign patent applications pending. Our patents have various terms expiring through 2030.
We have a number of patent and intellectual property license agreements. Some of these license agreements require us to make one-time or periodic payments. We may need to obtain additional patent licenses or renew existing license agreements in the future. We are unable to predict whether these license agreements can be obtained or renewed on acceptable terms.
In recent years, we have recovered some of our investment in technology through sales or licenses of intellectual property rights to joint venture partners and other third parties. We are pursuing additional opportunities to recover our investment in intellectual property through additional sales or licenses of intellectual property and potential partnering arrangements.
Employees
As of September 1, 2011, we had approximately 26,100 employees, of which approximately 15,500 were outside the United States, including approximately 7,600 in Singapore, 3,300 in Italy, 1,700 in China, 1,300 in Israel and 1,000 in Malaysia. Our employees include approximately 2,800 in our IM Flash joint ventures, primarily located in the United States and Singapore. Our employment levels can vary depending on market conditions and the level of our production, research and product and process development. Many of our employees are highly skilled and our continued success depends in part upon our ability to attract and retain such employees. The loss of key personnel could have a material adverse effect on our business, results of operations or financial condition.
Environmental Compliance
Government regulations impose various environmental controls on raw materials and discharges, emissions and solid wastes from our manufacturing processes. In 2011, our wholly-owned wafer fabrication facilities continued to conform to the requirements of ISO 14001certification. To continue certification, we met annual requirements in environmental policy, compliance, planning, management, structure and responsibility, training, communication, document control, operational control, emergency preparedness and response, record keeping and management review. While we have not experienced any materially adverse effects to our operations from environmental regulations, changes in the regulations could necessitate additional capital expenditures, modification of our operations or other compliance actions.
Directors and Executive Officers of the Registrant
Our officers are appointed annually by the Board of Directors and our directors are elected annually by our shareholders. Any directors appointed by the Board of Directors to fill vacancies on the Board serve until the next election by the shareholders. All officers and directors serve until their successors are duly chosen or elected and qualified, except in the case of earlier death, resignation or removal.
10
As of September 1, 2011, the following executive officers and directors were subject to the reporting requirements of Section 16(a) of the Securities Exchange Act of 1934, as amended.
|
Name
|
Age
|
Position
|
||
|
Mark W. Adams
|
47
|
Vice President of Worldwide Sales
|
||
|
Steven R. Appleton
|
51
|
Chairman and Chief Executive Officer
|
||
|
D. Mark Durcan
|
50
|
President and Chief Operating Officer
|
||
|
Thomas T. Eby
|
50
|
Vice President of Embedded Solutions
|
||
|
Ronald C. Foster
|
61
|
Vice President of Finance and Chief Financial Officer
|
||
|
Glen W. Hawk
|
49
|
Vice President of NAND Solutions
|
||
|
Roderic W. Lewis
|
56
|
Vice President of Legal Affairs, General Counsel and Corporate Secretary
|
||
|
Mario Licciardello
|
69
|
Vice President of Wireless Solutions
|
||
|
Patrick T. Otte
|
49
|
Vice President of Human Resources
|
||
|
Brian J. Shields
|
49
|
Vice President of Worldwide Operations
|
||
|
Brian M. Shirley
|
42
|
Vice President of DRAM Solutions
|
||
|
Teruaki Aoki
|
69
|
Director
|
||
|
James W. Bagley
|
72
|
Director
|
||
|
Robert L. Bailey
|
54
|
Director
|
||
|
Patrick J. Byrne
|
50
|
Director
|
||
|
Mercedes Johnson
|
57
|
Director
|
||
|
Lawrence N. Mondry
|
51
|
Director
|
||
|
Robert E. Switz
|
65
|
Director
|
||
Mark W. Adams
joined us in June 2006. From January 2006, until he joined us, Mr. Adams was the Chief Operating Officer of Lexar Media, Inc. Mr. Adams served as the Vice President of Sales and Marketing for Creative Labs, Inc. from December 2002 to January 2006. From March 2000 to September 2002, Mr. Adams was the Chief Executive Officer of Coresma, Inc. Mr. Adams holds a BA in Economics from Boston College and an MBA from Harvard Business School.
Steven R. Appleton
joined us in February 1983 and has served in various capacities since that time. Mr. Appleton first became an officer in August 1989 and has served in various officer positions since that time. From April 1991 until July 1992 and since May 1994, Mr. Appleton has served on our Board of Directors. From September 1994 to June 2007, Mr. Appleton served as our Chief Executive Officer, President and Chairman of the Board of Directors. From June 2007, Mr. Appleton served as our Chief Executive Officer and Chairman of the Board. Mr. Appleton holds a BA in Business Management from Boise State University.
D. Mark Durcan
joined us in June 1984 and has served in various positions since that time. Mr. Durcan was appointed our Chief Operating Officer in February 2006 and President in June 2007. Mr. Durcan has been an officer since 1996. Mr. Durcan holds a BS and MChE in Chemical Engineering from Rice University.
Thomas T. Eby
joined us in September 2010 and serves as our Vice President of Embedded Solutions. Mr. Eby was with Spansion Inc from October 2005 to September 2010 where he held leading roles in strategy and communications, sales and marketing, and integration. He was also the General Manager of and Excutive Vice President of Spansion's embedded group. Mr. Eby previously held a variety of positions in sales and marketing and strategy with AMD. Mr. Eby holds a BS degree in Electrical Engineering and Computer Science from Princeton University.
Ronald C. Foster
joined us
in April 2008 and is the Chief Financial Officer and Vice President of Finance. In this position, Mr. Foster has oversight responsibilities of the financial aspects of Micron's worldwide operations. He was appointed to his current position in 2008 after serving as a member of the Board of Directors from June 2004 to April 2005. Before joining Micron, Mr. Foster was the chief financial officer of FormFactor, Inc. He previously served as the Chief Financial Officer for JDS Uniphase, Inc., and Novell, Inc., and has held senior financial management positions at Hewlett-Packard and Applied Materials. He is currently a member of the Board of Directors of Luxim, Inc. Mr. Foster holds an MBA from the University of Chicago and a BA in Economics from Whitman College.
Glen W. Hawk
joined us in May 2010 and serves as our Vice President of NAND Solutions. Mr. Hawk served as the Vice President and General Manger of the Embedded Business Group for Numonyx from 2008 to May 2010. Prior to Numonyx, Mr. Hawk served as General Manager of the Flash Product Group for Intel Corporation. Mr. Hawk holds a BS in Chemical Engineering from the University of California, Berkeley.
11
Roderic W. Lewis
joined us in August 1991 and has served in various capacities since that time. Mr. Lewis has served as our Vice President of Legal Affairs, General Counsel and Corporate Secretary since July 1996. Mr. Lewis holds a BA in Economics and Asian Studies from Brigham Young University and a JD from Columbia University School of Law.
Mario Licciardello
joined us in May 2010 and serves as our Vice President of Wireless Solutions. Mr. Licciardello served as the Chief Operating Officer for Numonyx since its inception in 2008 through May 2010. Prior to Numonyx, Mr. Licciardello served as Corporate Vice President and General Manager of the Flash Memories Group at STMicroelectronics N.V. Mr. Licciardello holds a BS in Physics from the University of Catania, Italy.
Patrick T. Otte
joined us in 1987 and has served in various positions of increasing responsibility, including production and operations manager in several of our fabrication facilities and site director for our facility in Manassas, Virginia. Mr. Otte has served as our Vice President of Human Resources since March 2007. Mr. Otte holds a BS degree from St. Paul Bible College in Minneapolis, Minnesota.
Brian J. Shields
joined us in November 1986 and has served in various operational positions with us. Mr. Shields first became an officer in March 2003 and was Vice President of Wafer Fabrication starting December 2005 and has served as Vice President of Worldwide Operations from June 2010.
Brian M. Shirley
joined us in August 1992 and has served in various positions since that time. Mr. Shirley became Vice President of Memory in February 2006 and has served as Vice President of DRAM Solutions from June 2010. Mr. Shirley holds a BS in Electrical Engineering from Stanford University.
Teruaki Aoki
has served as President of Sony University since April 2005. Dr. Aoki has been associated with Sony since 1970 and has held various executive positions, including Senior Executive Vice President and Executive Officer of Sony Corporation as well as President and Chief Operating Officer of Sony Electronics, a U.S. subsidiary. Dr. Aoki holds a Ph.D. in Material Sciences from Northwestern University as well as a BS in Applied Physics from the University of Tokyo. He was elected as an IEEE Fellow in 2003 and serves as Advisory Board Member of Kellogg School of Management of Northwestern University. Dr. Aoki also serves on the board of Citizen Holdings Co., Ltd. Dr. Aoki is the Chairman of the Board's Compensation Committee. He has served on our Board of Directors since 2006.
James W. Bagley
became the Executive Chairman of Lam Research Corporation ("Lam"), a supplier of semiconductor manufacturing equipment, in June 2005. From August 1997 through June 2005, Mr. Bagley served as the Chairman and Chief Executive Officer of Lam. Mr. Bagley is a member of the Board of Directors of Teradyne, Inc. He has served on our Board of Directors since June 1997. Mr. Bagley holds MS and BS degrees in Electrical Engineering from Mississippi State University.
Robert L. Bailey
was the Chairman of the Board of Directors of PMC-Sierra ("PMC") from 2005 until May 2011 and also served as PMC's Chairman from February 2000 until February 2003. Mr. Bailey served as a director of PMC since October 1996. He also served as the President and Chief Executive Officer of PMC from July 1997 until May 2008. PMC is a leading provider of broadband communication and semiconductor storage solutions for the next-generation Internet. Mr. Bailey currently serves on the Board of Directors of Entropic Communications. Mr. Bailey holds a BS degree in Electrical Engineering from the University of Bridgeport and an MBA from the University of Dallas. He has served on our Board of Directors since 2007.
Patrick J. Byrne
has served as Director, President and Chief Executive Officer of Intermec, Inc. (“Intermec”) since July 2007. Intermec develops and integrates products, services and technologies that identify, track and manage supply chain assets and information. Prior to joining Intermec, Mr. Byrne served as a Senior Vice President and President of the Electronic Measurement Group of Agilent Technologies Inc., a bio-analytical and electronic measurement company, from February 2005 to March 2007. Prior to assuming that position, Mr. Byrne served as Vice President and General Manager for Agilent's Electronic Products and Solutions Group's Wireless Business Unit from September 2001 to February 2005. He served as Vice President for Agilent's Electronic Products and Solutions Group's Product Generation Units from 1999 to 2001. Mr. Byrne is also a member of the Board of Directors of Flow International, a manufacturer of ultrahigh-pressure waterjet technology, and a leading provider of robotics and assembly equipment. Mr. Byrne received his BS degree in Electrical Engineering from the University of California, Berkeley, and his MS degree in Electrical Engineering from Stanford University. Mr. Byrne joined our Board of Directors in April 2011.
12
Mercedes Johnson
was the Senior Vice President and Chief Financial Officer of Avago Technologies Limited, a supplier of analog interface components for communications, industrial and consumer applications, from December 2005 to August 2008. She also served as the Senior Vice President, Finance, of Lam from June 2004 to January 2005 and as Lam's Chief Financial Officer from May 1997 to May 2004. Ms. Johnson holds a degree in Accounting from the University of Buenos Aires and currently serves on the Board of Directors for Intersil Corporation and Juniper Networks, Inc. Ms. Johnson is the Chairman of the Board's Audit Committee and has served on our Board of Directors since 2005.
Lawrence N. Mondry
was the President and Chief Executive Officer of CSK Auto Corporation ("CSK"), a specialty retailer of automotive aftermarket parts, from August 2007 to July 2008. Prior to his appointment at CSK, Mr. Mondry served as the Chief Executive Officer of CompUSA Inc. from November 2003 to May 2006. Mr. Mondry joined CompUSA in 1990. Mr. Mondry is the Chairman of the Board's Governance Committee and Presiding Director. He has served on our Board of Directors since 2005.
Robert E. Switz
was the Chairman, President and Chief Executive Officer of ADC Telecommunications, Inc., ("ADC"), a supplier of network infrastructure products and services from August 2003 until December 2010, when Tyco Electronics Ltd. acquired ADC. Mr. Switz joined ADC in 1994 and throughout his career there held numerous leadership positions. Mr. Switz holds an MBA from the University of Bridgeport as well as a degree in Marketing/Economics from Quinnipiac University. Mr. Switz also serves on the Board of Directors for Broadcom Corporation, GT Advanced Technologies and Leap Wireless International, Inc. He has served on our Board of Directors since 2006.
There are no family relationships between any of our directors or executive officers.
13
In addition to the factors discussed elsewhere in this Form 10-K, the following are important factors which could cause actual results or events to differ materially from those contained in any forward-looking statements made by or on behalf of us.
We have experienced dramatic declines in average selling prices for our semiconductor memory products which have adversely affected our business.
If average selling prices for our memory products decrease faster than we can decrease per gigabit costs, our business, results of operations or financial condition could be materially adversely affected. We have experienced significant decreases in our average selling prices in recent years as noted in the table below. In some prior periods, average selling prices for our memory products have been below our manufacturing costs.
|
|
DRAM
|
NAND Flash
|
|||||
|
(percentage change in average selling prices)
|
|||||||
|
2011 from 2010
|
(39
|
)%
|
(17
|
)%
|
|||
|
2010 from 2009
|
28
|
%
|
*
|
(18
|
)%
|
||
|
2009 from 2008
|
(52
|
)%
|
(56
|
)%
|
|||
|
2008 from 2007
|
(51
|
)%
|
(67
|
)%
|
|||
|
2007 from 2006
|
(23
|
)%
|
(56
|
)%
|
|||
|
* Only increase in DRAM pricing since 2004.
|
|||||||
We may be unable to reduce our per gigabit manufacturing costs at the rate average selling prices decline.
Our gross margins are dependent upon continuing decreases in per gigabit manufacturing costs achieved through improvements in our manufacturing processes, including reducing the die size of our existing products. In future periods, we may be unable to reduce our per gigabit manufacturing costs at sufficient levels to improve or maintain gross margins. Factors that may limit our ability to reduce costs include, but are not limited to, strategic product diversification decisions affecting product mix, the increasing complexity of manufacturing processes, technological barriers and changes in process technologies or products that may require relatively larger die sizes. Per gigabit manufacturing costs may also be affected by the relatively smaller production quantities and shorter product lifecycles of certain specialty memory products.
An adverse outcome relating to allegations of anticompetitive conduct could materially adversely affect our business, results of operations or financial condition.
On May 5, 2004, Rambus, Inc. ("Rambus") filed a complaint in the Superior Court of the State of California (San Francisco County) against us and other DRAM suppliers alleging that the defendants harmed Rambus by engaging in concerted and unlawful efforts affecting Rambus DRAM ("RDRAM") by eliminating competition and stifling innovation in the market for computer memory technology and computer memory chips. Rambus' complaint alleges various causes of action under California state law including, among other things, a conspiracy to restrict output and fix prices, a conspiracy to monopolize, intentional interference with prospective economic advantage, and unfair competition. Rambus is seeking a judgment for damages of approximately $3.9 billion, joint and several liability, trebling of damages awarded, punitive damages, a permanent injunction enjoining the defendants from the conduct alleged in the complaint, interest, and attorneys' fees and costs. Trial began on June 20, 2011, and the case went to the jury on September 21, 2011. At the time of this filing, a jury verdict is pending. We cannot predict when a verdict will be reached or when a formal judgment would be entered by the Court subsequent to a verdict. In the event of an adverse judgment, we would anticipate filing appropriate post-judgment motions and appeals. We may be required to post a bond or other security to stay enforcement of an adverse judgment pending appeal. Depending on the amount required, we cannot assure you we would be able to obtain sufficient security to pursue an appeal. We are unable to predict the outcome of this lawsuit and therefore cannot determine the likelihood of loss nor estimate a range of possible loss. Accordingly, we have not provided an accrual for an adverse judgment in the September 1, 2011, financial statements. However, we have accrued a liability and charged operations for estimated costs to successfully defend the matter. An adverse judgment may have a material impact on our business, results of operations and financial condition, including liquidity.
14
On September 24, 2010, Oracle America Inc. ("Oracle"), successor to Sun Microsystems, a DRAM purchaser that opted-out of a direct purchaser class action suit that was settled, filed suit against us in U.S. District Court for the Northern District of California. The complaint alleges DRAM price-fixing and other violations of federal and state antitrust and unfair competition laws based on purported conduct for the period from August 1, 1998 through at least June 15, 2002. Oracle is seeking joint and several damages, trebled, as well as restitution, disgorgement, attorneys' fees, costs and injunctive relief.
We are unable to predict the outcome of these lawsuits. An adverse court determination in any of these lawsuits alleging violations of antitrust laws could result in significant liability and could have a material adverse effect on our business, results of operations or financial condition.
The semiconductor memory industry is highly competitive.
We face intense competition in the semiconductor memory market from a number of companies, including Elpida Memory, Inc.; Hynix Semiconductor Inc.; Samsung Electronics Co., Ltd.; SanDisk Corporation; Spansion Inc. and Toshiba Corporation. Some of our competitors are large corporations or conglomerates that may have greater resources to withstand downturns in the semiconductor markets in which we compete, invest in technology and capitalize on growth opportunities. Our competitors seek to increase silicon capacity, improve yields, reduce die size and minimize mask levels in their product designs. The transitions to smaller line-width process technologies and 300mm wafers in the industry have resulted in significant increases in the worldwide supply of semiconductor memory. Increases in worldwide supply of semiconductor memory also result from semiconductor memory fab capacity expansions, either by way of new facilities, increased capacity utilization or reallocation of other semiconductor production to semiconductor memory production. Our competitors may increase capital expenditures resulting in future increases in worldwide supply. Increases in worldwide supply of semiconductor memory, if not accompanied with commensurate increases in demand, would lead to further declines in average selling prices for our products and would materially adversely affect our business, results of operations or financial condition.
The downturn in the worldwide economy may harm our business.
The downturn in the worldwide economy had an adverse effect on our business. A continuation or further deterioration of depressed economic conditions could have an even greater adverse effect on our business. Adverse economic conditions affect demand for devices that incorporate our products, such as personal computers and other computing and networking products, mobile devices, Flash memory cards and USB devices. Reduced demand for our products could result in continued market oversupply and significant decreases in our average selling prices. A continuation of current negative conditions in worldwide credit markets would limit our ability to obtain external financing to fund our operations and capital expenditures. In addition, we may experience losses on our holdings of cash and investments due to failures of financial institutions and other parties. Difficult economic conditions may also result in a higher rate of losses on our accounts receivables due to credit defaults. As a result, our business, results of operations or financial condition could be materially adversely affected.
Inotera's liquidity risk may adversely impact our ownership interest and supply agreement.
Because of significant market declines in the selling price of DRAM, Inotera incurred net losses of $278 million for the six-month period ended June 30, 2011. Also, Inotera's current liabilities exceeded its current assets by $2.3 billion as of June 30, 2011, which exposes Inotera to liquidity risk. Further, under generally accepted accounting principles in the Republic of China, Inotera reported a loss for its quarter ended September 30, 2011 of an additional New Taiwan dollars 7,022 million (approximately $241 million U.S. dollars). Inotera's management has developed plans to improve its liquidity. If Inotera is unable to adequately improve its liquidity, we may have to impair our $323 million investment in Inotera. In connection with our ownership equity interest in Inotera, we have rights and obligations to purchase 50% of the wafer production capacity of Inotera. In 2011, we purchased $
641 million
of DRAM products from Inotera, and our supply from Inotera accounted for 37% or our DRAM gigabit production in the fourth quarter of 2011. As a result, if our supply of DRAM from Inotera is impacted, our business, results of operations or financial condition could be materially adversely affected.
Our supply agreement with Inotera involves numerous risks.
Our supply agreement with Inotera involves numerous risks including the following:
|
•
|
we have experienced difficulties and delays in ramping production at Inotera on our technology and may continue to experience difficulties and delays in the future;
|
|
•
|
we may experience continued difficulties in transferring technology to Inotera;
|
|
•
|
costs associated with manufacturing inefficiencies resulting from underutilized capacity;
|
15
|
•
|
difficulties in obtaining high yield and throughput due to differences in Inotera's manufacturing processes from our other fabrication facilities;
|
|
•
|
uncertainties around the timing and amount of wafer supply we will receive under the supply agreement; and
|
|
•
|
the cost of our product obtained from Inotera is impacted by Nanya's revenue and back-end manufacturing costs for product obtained from Inotera.
|
The acquisition of our ownership interest in Inotera from Qimonda has been legally challenged by the administrator of the insolvency proceedings for Qimonda.
On January 20, 2011, Dr. Michael Jaffé, administrator for Qimonda AG ("Qimonda") insolvency proceedings, filed suit against us and Micron Semiconductor B.V., our Netherlands subsidiary, in the District Court of Munich, Civil Chamber. The complaint seeks to void under Section 133 of the German Insolvency Act a share purchase agreement between us and Qimonda in fall 2008 pursuant to which we purchased all of Qimonda's shares of Inotera Memories, Inc. and seeks an order requiring us to retransfer the Inotera shares to the Qimonda estate. The complaint also seeks to terminate under Sections 103 or 133 of the German Insolvency Code a patent cross license between us and Qimonda entered into at the same time as the share purchase agreement. A hearing is scheduled to begin on November 9, 2011. We are unable to predict the outcome of this lawsuit. The final resolution of this lawsuit could result in the loss of the Inotera shares or equivalent monetary damages and the termination of the patent cross license, which could have a material adverse effect on our business, results of operation or financial condition.
Our future success may depend on our ability to develop and produce competitive new memory technologies.
Our key semiconductor memory technologies of DRAM, NAND Flash and NOR Flash face technological barriers to continue to meet long-term customer needs. These barriers include potential limitations on the ability to shrink products in order to reduce costs, meet higher density requirements, and improve power consumption and reliability. To meet these requirements, we expect that new memory technologies will be developed by the semiconductor memory industry. Our competitors are working to develop new memory technologies that may offer performance and/or cost advantages to our existing memory technologies and render existing technologies obsolete. Accordingly, our future success may depend on our ability to develop and produce viable and competitive new memory technologies
.
There can be no assurance of the following:
|
•
|
that we will be successful in developing competitive
new semiconductor memory technologies;
|
|
•
|
that we will be able to cost-effectively manufacture new products;
|
|
•
|
that we will be able to successfully market these technologies; and
|
|
•
|
that margins generated from sales of these products will allow us to recover costs of development efforts.
|
If our efforts to develop new semiconductor memory technologies are unsuccessful, our business results of operations or financial condition may be adversely affected.
We may be unable to generate sufficient cash flows or obtain access to external financing necessary to fund our operations and make adequate capital investments.
Our cash flows from operations depend primarily on the volume of semiconductor memory sold, average selling prices and per unit manufacturing costs. To develop new product and process technologies, support future growth, achieve operating efficiencies and maintain product quality, we must make significant capital investments in manufacturing technology, capital equipment, facilities, research and development, and product and process technology. We estimate that capital spending for 2012 will be approximately $2 billion. The actual amounts for 2012 will vary depending on funding participation by joint venture partners and market conditions. As of
September 1, 2011
, we had cash and equivalents of
$2,160 million
, of which $
327 million
consisted of cash and investments of IM Flash that is generally not available to finance our other operations. In the past we have utilized external sources of financing when needed
.
As a result of the downturn in general economic conditions and the adverse conditions in the credit markets
,
it may be difficult for us to obtain financing on terms acceptable to us. We cannot assure you that we will be able to generate sufficient cash flows or find other sources of financing to fund our operations, make adequate capital investments to remain competitive in terms of technology development and cost efficiency, or access capital markets. Our inability to do the foregoing could have a material adverse effect on our business and results of operations.
16
Our joint ventures and strategic partnerships involve numerous risks.
We have entered into partnering arrangements to manufacture products and develop new manufacturing process technologies and products. These arrangements include our IM Flash NAND Flash joint ventures with Intel, our Inotera DRAM joint venture with Nanya, our MP Mask joint venture with Photronics, our Transform joint venture with Origin Energy and our CMOS image sensor wafer supply agreement with Aptina
.
These joint ventures and strategic partnerships are subject to various risks that could adversely affect the value of our investments and our results of operations. These risks include the following:
|
•
|
our interests could diverge from our partners or we may not be able to agree with partners on ongoing manufacturing and operational activities, or on the amount, timing or nature of further investments in our joint venture;
|
|
•
|
we may experience difficulties in transferring technology to joint ventures;
|
|
•
|
we may experience difficulties and delays in ramping production at joint ventures;
|
|
•
|
our control over the operations of our joint ventures is limited;
|
|
•
|
we may need to recognize our share of losses from Inotera, Aptina or Transform in our future results of operations;
|
|
•
|
due to financial constraints, our joint venture partners may be unable to meet their commitments to us or our joint ventures and may pose credit risks for our transactions with them;
|
|
•
|
due to differing business models or long-term business goals, our partners may decide not to join us in capital contributions to our joint ventures, which may result in us increasing our capital contributions to such ventures, resulting in additional cash expenditures by us; for example, our contributions to IM Flash Singapore in 2011 and 2010 totaled $
1,580 million
and $128 million, respectively, while Intel's contributions totaled $
0
and $38 million, respectively;
|
|
•
|
the terms of our partnering arrangements may turn out to be unfavorable;
|
|
•
|
cash flows may be inadequate to fund increased capital requirements; and
|
|
•
|
changes in tax, legal or regulatory requirements may necessitate changes in the agreements with our partners.
|
If our joint ventures and strategic partnerships are unsuccessful, our business, results of operations or financial condition may be adversely affected.
An adverse determination that our products or manufacturing processes infringe the intellectual property rights of others could materially adversely affect our business, results of operations or financial condition.
On January 13, 2006, Rambus filed a lawsuit against us in the U.S. District Court for the Northern District of California. Rambus alleges that certain of our DDR2, DDR3, RLDRAM, and RLDRAM II products infringe as many as fourteen Rambus patents and seeks monetary damages, treble damages, and injunctive relief. The accused products account for a significant portion of our net sales. On June 2, 2006, we filed an answer and counterclaim against Rambus alleging, among other things, antitrust and fraud claims. On January 9, 2009, in another lawsuit involving us and Rambus and involving allegations by Rambus of patent infringement against us in the U.S. District Court for the District of Delaware, Judge Robinson entered an opinion in favor of us holding that Rambus had engaged in spoliation and that the twelve Rambus patents in the suit were unenforceable against us. Rambus subsequently appealed the Delaware Court's decision to the U.S. Court of Appeals for the Federal Circuit. On May 13, 2011, the Federal Circuit affirmed Judge Robinson's finding of spoliation, but vacated the dismissal sanction and remanded the case to the Delaware District Court for analysis of the remedy based on the Federal Circuit's decision. The Northern District of California Court stayed a trial of the patent phase of the Northern District of California case upon appeal of the spoliation issue to the Federal Circuit. (See "Item 1. Legal Proceedings" for additional details on this lawsuit and other Rambus matters pending in the U.S. and Europe.)
We are unable to predict the outcome of assertions of infringement made against us. A court determination that our products or manufacturing processes infringe the intellectual property rights of others could result in significant liability and/or require us to make material changes to our products and/or manufacturing processes. Any of the foregoing results could have a material adverse effect on our business, results of operations or financial condition.
We have a number of patent and intellectual property license agreements. Some of these license agreements require us to make one time or periodic payments. We may need to obtain additional patent licenses or renew existing license agreements in the future. We are unable to predict whether these license agreements can be obtained or renewed on acceptable terms.
17
Products that fail to meet specifications, are defective or that are otherwise incompatible with end uses could impose significant costs on us.
Products that do not meet specifications or that contain, or are perceived by our customers to contain, defects or that are otherwise incompatible with end uses could impose significant costs on us or otherwise materially adversely affect our business, results of operations or financial condition. In recent periods we have further diversified and expanded our product offerings which could potentially increase the chance that one of our products could fail to meet specifications in a particular application. If problems with nonconforming, defective or incompatible products occur after we have shipped such products, we could be adversely affected in several ways, including the following:
|
•
|
we may be required to replace product or otherwise compensate customers for costs incurred or damages caused by defective or incompatible product, and
|
|
•
|
we may encounter adverse publicity, which could cause a decrease in sales of our products.
|
We may make future acquisitions and alliances, which involve numerous risks.
Acquisitions and the formation of alliances, such as joint ventures and other partnering arrangements, involve numerous risks including the following:
|
•
|
integrating the operations, technologies and products of acquired or newly formed entities into our operations;
|
|
•
|
increasing capital expenditures to upgrade and maintain facilities;
|
|
•
|
increasing debt to finance an acquisition or formation of a new business;
|
|
•
|
diverting management's attention from normal daily operations;
|
|
•
|
managing larger or more complex operations and facilities and employees in separate and diverse geographic areas; and
|
|
•
|
hiring and retaining key employees.
|
Acquisitions of, or alliances with, high-technology companies are inherently risky, and future transactions may not be successful and may materially adversely affect our business, results of operations or financial condition.
The limited availability of raw materials, supplies or capital equipment could materially adversely affect our business, results of operations or financial condition.
Our operations require raw materials that meet exacting standards. We generally have multiple sources of supply for our raw materials. However, only a limited number of suppliers are capable of delivering certain raw materials that meet our standards. In some cases, materials are provided by a single supplier. Various factors could reduce the availability of raw materials such as silicon wafers, photomasks, chemicals, gases, photoresist, lead frames and molding compound. Shortages may occur from time to time in the future. In addition, disruptions in transportation lines could delay our receipt of raw materials. Lead times for the supply of raw materials have been extended in the past. If our supply of raw materials is disrupted or our lead times extended, our business, results of operations or financial condition could be materially adversely affected.
Our operations are dependent on our ability to procure advanced semiconductor equipment that enables the transition to lower cost manufacturing processes. For certain key types of equipment, including photolithography tools, we are sometimes dependent on a single supplier. In recent periods we have experienced difficulties in obtaining some equipment on a timely basis due to the supplier's limited capacity. Our inability to obtain this equipment timely could adversely affect our ability to transition to next generation manufacturing processes and reduce costs. Delays in obtaining equipment could also impede our ability to ramp production at new facilities and increase our overall costs of the ramp. If we are unable to obtain advanced semiconductor equipment timely, our business, results of operations or financial condition could be materially adversely affected.
18
New product development may be unsuccessful.
We are developing new products that complement our traditional memory products or leverage their underlying design or process technology. We have made significant investments in product and process technologies and anticipate expending significant resources for new semiconductor product development over the next several years. The process to develop DRAM, NAND Flash, NOR Flash and certain specialty memory products requires us to demonstrate advanced functionality and performance, many times well in advance of a planned ramp of production, in order to secure design wins with our customers. We cannot assure you that our product development efforts will be successful, that we will be able to cost-effectively manufacture new products, that we will be able to successfully market these products or that margins generated from sales of these products will allow us to recover costs of development efforts.
Our net operating loss and tax credit carryforwards may be limited.
We have a valuation allowance against substantially all U.S. net deferred tax assets. As of September 1, 2011, our federal, state and foreign net operating loss carryforwards were $2.9 billion, $2.0 billion and $529 million, respectively. If not utilized, substantially all of our federal and state net operating loss carryforwards will expire in 2022 to 2031 and the foreign net operating loss carryforwards will begin to expire in 2015. As of September 1, 2011, our federal and state tax credit carryforwards were $206 million and $215 million respectively. If not utilized, substantially all of our federal and state tax credit carryforwards will expire in 2013 to 2031. As a consequence of prior business acquisitions, utilization of the tax benefits for some of the tax carryforwards is subject to limitations imposed by Section 382 of the Internal Revenue Code and some portion or all of these carryforwards may not be available to offset any future taxable income. The determination of these tax limitations is complex and requires a significant amount of judgment by us with respect to analysis of past transactions.
Changes in foreign currency exchange rates could materially adversely affect our business, results of operations or financial condition.
Across our multi-national operations, there are transactions and balances denominated in currencies other than the U.S. dollar (our reporting currency), primarily the Singapore dollar, euro and yen. We recorded net losses from changes in currency exchange rates of $
6 million
for
2011
and $23 million for 2010. To the extent our assets and liabilities denominated in currencies other than the U.S. dollar as of September 1, 2011 are not hedged, we estimate that a 1% change in the exchange rate versus the U.S. dollar would expose us to foreign currency gains or losses of approximately U.S. $
2 million
for the euro and U.S. $
1 million
for the yen and Singapore dollar. In the event that the U.S. dollar weakens significantly compared to the Singapore dollar, euro or yen, our results of operations or financial condition may be adversely affected.
We face risks associated with our international sales and operations that could materially adversely affect our business, results of operations or financial condition.
Sales to customers outside the United States approximated 84% of our consolidated net sales for 2011. In addition, a substantial portion of our manufacturing operations are located outside the United States. In particular, a significant portion of our manufacturing operations are concentrated in Singapore. Our international sales and operations are subject to a variety of risks, including:
|
•
|
export and import duties, changes to import and export regulations, and restrictions on the transfer of funds;
|
|
•
|
compliance with U.S. and international laws involving international operations, including the Foreign Corrupt Practices Act, export control laws and similar rules and regulations;
|
|
•
|
political and economic instability;
|
|
•
|
problems with the transportation or delivery of our products;
|
|
•
|
issues arising from cultural or language differences and labor unrest;
|
|
•
|
longer payment cycles and greater difficulty in collecting accounts receivable;
|
|
•
|
compliance with trade, technical standards and other laws in a variety of jurisdictions;
|
|
•
|
contractual and regulatory limitations on our ability to maintain flexibility with our staffing levels;
|
|
•
|
disruptions to our manufacturing operations as a result of actions imposed by foreign governments;
|
|
•
|
changes in economic policies of foreign governments; and
|
|
•
|
difficulties in staffing and managing international operations.
|
These factors may materially adversely affect our business, results of operations or financial condition.
19
If our manufacturing process is disrupted, our business, results of operations or financial condition could be materially adversely affected.
We manufacture products using highly complex processes that require technologically advanced equipment and continuous modification to improve yields and performance. Difficulties in the manufacturing process or the effects from a shift in product mix can reduce yields or disrupt production and may increase our per gigabit manufacturing costs. Additionally, our control over operations at our IM Flash, Inotera, MP Mask and Transform joint ventures is limited by our agreements with our partners. From time to time, we have experienced disruptions in our manufacturing process as a result of power outages, improperly functioning equipment and equipment failures. If production at a fabrication facility is disrupted for any reason, manufacturing yields may be adversely affected or we may be unable to meet our customers' requirements and they may purchase products from other suppliers. This could result in a significant increase in manufacturing costs or loss of revenues or damage to customer relationships, which could materially adversely affect our business, results of operations or financial condition.
We may incur additional material restructure charges in future periods.
In response to a severe downturn in the semiconductor memory industry and global economic conditions, we implemented restructure initiatives that resulted in net charges of $70 million in 2009 and $33 million in 2008. We may need to implement further restructure initiatives in future periods. As a result of these initiatives, we could incur restructure charges, lose production output, lose key personnel and experience disruptions in our operations and difficulties in delivering products timely.
Consolidation of industry participants and governmental assistance to some of our competitors may contribute to uncertainty in the semiconductor memory industry and negatively impact our ability to compete.
In recent years, supply of memory products has significantly exceeded customer demand resulting in significant declines in average selling prices of DRAM, NAND Flash and NOR Flash products and substantial operating losses by us and our competitors. The operating losses as well as limited access to sources of financing have led to the deterioration in the financial condition of a number of industry participants. Some of our competitors may try to enhance their capacity and lower their cost structure through consolidation. In addition, some governments have provided, or are considering providing, significant financial assistance to some of our competitors. Consolidation of industry competitors could put us at a competitive disadvantage.
None.
Our corporate headquarters are located in Boise, Idaho. The following is a summary of our principal facilities as of September 1, 2011:
|
Location
|
Principal Operations
|
|
|
Boise, Idaho
|
R&D including wafer fabrication and reticle manufacturing
|
|
|
Lehi, Utah
|
Wafer fabrication
|
|
|
Manassas, Virginia
|
Wafer fabrication
|
|
|
Singapore
|
Three wafer fabrication facilities and a test, assembly and module assembly facility
|
|
|
Avezzano, Italy
|
Wafer fabrication
|
|
|
Nampa, Idaho
|
Test
|
|
|
Aguadilla, Puerto Rico
|
Module assembly and test
|
|
|
Xi’an, China
|
Test
|
|
|
Qiryat Gat, Israel
|
Wafer fabrication
|
|
|
Muar, Malaysia
|
Module assembly and test
|
|
|
Agrate, Italy
|
R&D including wafer fabrication
|
|
20
We also own and lease a number of other facilities in locations throughout the world that are used for design, research and development, and sales and marketing activities.
Our facility in Lehi and one of our facilities in Singapore are owned and operated by our IM Flash joint venture with Intel. (See "Item 8. Financial Statements and Supplementary Data – Notes to Consolidated Financial Statements – Consolidated Variable Interest Entities – NAND Flash Joint Ventures with Intel" note.)
We believe that our existing facilities are suitable and adequate for our present purposes. We do not identify or allocate assets by operating segment. (See "Item 8. Financial Statements and Supplementary Data – Notes to Consolidated Financial Statements – Geographic Information" note.)
Antitrust Matters
On May 5, 2004, Rambus, Inc. ("Rambus") filed a complaint in the Superior Court of the State of California (San Francisco County) against us and other DRAM suppliers alleging that the defendants harmed Rambus by engaging in concerted and unlawful efforts affecting Rambus DRAM ("RDRAM") by eliminating competition and stifling innovation in the market for computer memory technology and computer memory chips. Rambus' complaint alleges various causes of action under California state law including, among other things, a conspiracy to restrict output and fix prices, a conspiracy to monopolize, intentional interference with prospective economic advantage, and unfair competition. Rambus is seeking a judgment for damages of approximately $3.9 billion, joint and several liability, trebling of damages awarded, punitive damages, a permanent injunction enjoining the defendants from the conduct alleged in the complaint, interest, and attorneys' fees and costs. Trial began on June 20, 2011, and the case went to the jury on September 21, 2011. At the time of this filing, a jury verdict is pending. We cannot predict when a verdict will be reached or when a formal judgment would be entered by the Court subsequent to a verdict. In the event of an adverse judgment, we would anticipate filing appropriate post-judgment motions and appeals. We may be required to post a bond or other security to stay enforcement of an adverse judgment pending appeal. Depending on the amount required, we cannot assure you we would be able to obtain sufficient security to pursue an appeal. We are unable to predict the outcome of this lawsuit and therefore cannot determine the likelihood of loss nor estimate a range of possible loss. Accordingly, we have not provided an accrual for an adverse judgment in the September 1, 2011, financial statements. However, we have accrued a liability and charged operations for estimated costs to successfully defend the matter. An adverse judgment may have a material impact on our business, results of operations and financial condition, including liquidity.
A number of purported class action price-fixing lawsuits have been filed against us and other DRAM suppliers. Four cases have been filed in the U.S. District Court for the Northern District of California asserting claims on behalf of a purported class of individuals and entities that indirectly purchased DRAM and/or products containing DRAM from various DRAM suppliers during the time period from April 1, 1999 through at least June 30, 2002. The complaints allege price fixing in violation of federal antitrust laws and various state antitrust and unfair competition laws and seek treble monetary damages, restitution, costs, interest and attorneys' fees. In addition, at least sixty-four cases have been filed in various state courts asserting claims on behalf of a purported class of indirect purchasers of DRAM. In July 2006, the Attorneys General for approximately forty U.S. states and territories filed suit in the U.S. District Court for the Northern District of California. The complaints allege, among other things, violations of the Sherman Act, Cartwright Act, and certain other states' consumer protection and antitrust laws and seek joint and several damages, trebled, as well as injunctive and other relief. On October 3, 2008, the California Attorney General filed a similar lawsuit in California Superior Court, purportedly on behalf of local California government entities, alleging, among other things, violations of the Cartwright Act and state unfair competition law. On June 23, 2010, we executed a settlement agreement resolving these purported class-action indirect purchaser cases and the pending cases of the Attorneys General relating to alleged DRAM price-fixing in the United States. Subject to certain conditions, including final court approval of the class settlements, we agreed to pay a total of approximately $67 million in three equal installments over a two-year period.
21
Three purported class action cases alleging price-fixing of DRAM products have been filed against us in the following Canadian courts: Superior Court, District of Montreal, Province of Quebec; Ontario Superior Court of Justice, Ontario; and Supreme Court of British Columbia, Vancouver Registry, British Columbia. The substantive allegations in these cases are similar to those asserted in the DRAM antitrust cases filed in the United States. Plaintiffs' motion for class certification was denied in the British Columbia and Quebec cases in May and June 2008, respectively. Plaintiffs have filed an appeal of each of those decisions. On November 12, 2009, the British Columbia Court of Appeal reversed the denial of class certification and remanded the case for further proceedings. The appeal of the Quebec case is still pending.
On February 28, 2007, February 28, 2007 and March 8, 2007, cases were filed against us and other manufacturers of DRAM in the U.S. District Court for the Northern District of California by All American Semiconductor, Inc., Jaco Electronics, Inc. and DRAM Claims Liquidation Trust, respectively, that opted-out of a direct purchaser class action suit that was settled. The complaints allege, among other things, violations of federal and state antitrust and competition laws in the DRAM industry, and seek joint and several damages, trebled, as well as restitution, attorneys' fees, costs, and injunctive relief. On July 11, 2011, we made a collective payment to the three plaintiffs to settle all claims of an amount that was not significant to our business, results of operations or financial condition.
On June 21, 2010, the Brazil Secretariat of Economic Law of the Ministry of Justice ("SDE") announced that it had initiated an investigation relating to alleged anticompetitive activities within the DRAM industry. The SDE's Notice of Investigation names various DRAM manufacturers and certain executives, including ours, and focuses on the period from July 1998 to June 2002.
On September 24, 2010, Oracle America Inc. ("Oracle"), successor to Sun Microsystems, a DRAM purchaser that opted-out of a direct purchaser class action suit that was settled, filed suit against us in U.S. District Court for the Northern District of California. The complaint alleges DRAM price-fixing and other violations of federal and state antitrust and unfair competition laws based on purported conduct for the period from August 1, 1998 through at least June 15, 2002. Oracle is seeking joint and several damages, trebled, as well as restitution, disgorgement, attorneys' fees, costs and injunctive relief.
We are unable to predict the outcome of these lawsuits, except as noted in the U.S. indirect purchasers cases above. The final resolution of these alleged violations of antitrust laws could result in significant liability and could have a material adverse effect on our business, results of operations or financial condition.
Patent Matters
On August 28, 2000, we filed a complaint against Rambus in the U.S. District Court for the District of Delaware seeking declaratory and injunctive relief. Among other things, our complaint (as amended) alleges violation of federal antitrust laws, breach of contract, fraud, deceptive trade practices, and negligent misrepresentation. The complaint also seeks a declaratory judgment (1) that we did not infringe on certain of Rambus' patents or that such patents are invalid and/or are unenforceable, (2) that we have an implied license to those patents, and (3) that Rambus is estopped from enforcing those patents against us. On February 15, 2001, Rambus filed an answer and counterclaim in Delaware denying that we are entitled to relief, alleging infringement of the eight Rambus patents (later amended to add four additional patents) named in our declaratory judgment claim, and seeking monetary damages and injunctive relief. In the Delaware action, we subsequently added claims and defenses based on Rambus' alleged spoliation of evidence and litigation misconduct. The spoliation and litigation misconduct claims and defenses were heard in a bench trial before Judge Robinson in October 2007. On January 9, 2009, Judge Robinson entered an opinion in favor of us holding that Rambus had engaged in spoliation and that the twelve Rambus patents in the suit were unenforceable against us. Rambus subsequently appealed the decision to the U.S. Court of Appeals for the Federal Circuit. On May 13, 2011, the Federal Circuit affirmed Judge Robinson's finding of spoliation, but vacated the dismissal sanction and remanded the case to the Delaware District Court for further analysis of the appropriate remedy.
22
A number of other suits involving Rambus are currently pending in Europe alleging that certain of our SDRAM and DDR SDRAM products infringe various of Rambus' country counterparts to its European patent 525 068, including: on September 1, 2000, Rambus filed suit against Micron Semiconductor (Deutschland) GmbH in the District Court of Mannheim, Germany; on September 22, 2000, Rambus filed a complaint against us and Reptronic (a distributor of our products) in the Court of First Instance of Paris, France; on September 29, 2000, we filed suit against Rambus in the Civil Court of Milan, Italy, alleging invalidity and non-infringement. In addition, on December 29, 2000, we filed suit against Rambus in the Civil Court of Avezzano, Italy, alleging invalidity and non-infringement of the Italian counterpart to European patent 1 004 956. Additionally, on August 14, 2001, Rambus filed suit against Micron Semiconductor (Deutschland) GmbH in the District Court of Mannheim, Germany alleging that certain of our DDR SDRAM products infringe Rambus' country counterparts to its European patent 1 022 642. In the European suits against us, Rambus is seeking monetary damages and injunctive relief. Subsequent to the filing of the various European suits, the European Patent Office (the "EPO") declared Rambus' 525 068, 1 022 642, and 1 004 956 European patents invalid and revoked the patents. The declaration of invalidity with respect to the '068 and '642 patents was upheld on appeal. The original claims of the '956 patent also were declared invalid on appeal, but the EPO ultimately granted a Rambus request to amend the claims by adding a number of limitations.
On January 13, 2006, Rambus filed a lawsuit against us in the U.S. District Court for the Northern District of California. Rambus alleges that certain of our DDR2, DDR3, RLDRAM, and RLDRAM II products infringe as many as fourteen Rambus patents and seeks monetary damages, treble damages, and injunctive relief. The accused products account for a significant portion of our net sales. On June 2, 2006, we filed an answer and counterclaim against Rambus alleging, among other things, antitrust and fraud claims. On January 9, 2009, in another lawsuit involving us and Rambus and involving allegations by Rambus of patent infringement against us in the U.S. District Court for the District of Delaware, Judge Robinson entered an opinion in favor of us holding that Rambus had engaged in spoliation and that the twelve Rambus patents in the suit were unenforceable against us. Rambus subsequently appealed the Delaware Court's decision to the U.S. Court of Appeals for the Federal Circuit. On May 13, 2011, the Federal Circuit affirmed Judge Robinson's finding of spoliation, but vacated the dismissal sanction and remanded the case to the Delaware District Court for analysis of the remedy based on the Federal Circuit's decision. The Northern District of California Court stayed a trial of the patent phase of the Northern District of California case upon appeal of the spoliation issue to the Federal Circuit.
On March 6, 2009, Panavision Imaging, LLC filed suit against us and Aptina Imaging Corporation, then a wholly-owned subsidiary ("Aptina"), in the U.S. District Court for the Central District of California. The complaint alleged that certain of our and Aptina's image sensor products infringed four Panavision Imaging U.S. patents and sought injunctive relief, damages, attorneys' fees, and costs. On February 7, 2011, the Court ruled that one of the four patents in suit was invalid for indefiniteness. On March 10, 2011, claims relating to the remaining three patents in suit were dismissed with prejudice. Panavision subsequently filed a motion for reconsideration of the Court's decision regarding invalidity of the first patent, and we filed a motion for summary judgment of non-infringement of such patent. On July 8, 2011, the Court issued an order that rescinded its prior indefiniteness decision, and held that the disputed term does not render the claims in suit indefinite. A hearing on motions for summary judgment regarding infringement and validity is scheduled for April 2, 2012.
On September 1, 2011, HSM Portfolio LLC and Technology Properties Limited LLC filed a patent infringement action in the U.S. District Court for the District of Delaware against us and seventeen other defendants. The complaint alleges that certain Company DRAM and image sensor products infringe two U.S. patents.
On September 9, 2011, Advanced Data Access LLC filed a patent infringement action in the U.S. District Court for the Eastern District of Texas against the Company and seven other defendants. The complaint alleges that certain Company DRAM products infringe a single U.S. patent.
On September 14, 2011, Smart Memory Solutions LLC filed a patent infringement action in the U.S. District Court for the District of Delaware against the Company and Winbond Electronics Corporation of America. The complaint alleges that certain NOR Flash products infringe a single U.S. patent.
We are unable to predict the outcome of these suits. A court determination that our products or manufacturing processes infringe the product or process intellectual property rights of others could result in significant liability and/or require us to make material changes to our products and/or manufacturing processes. Any of the foregoing results could have a material adverse effect on our business, results of operations or financial condition.
23
Securities Matters
On February 24, 2006, a putative class action complaint was filed against us and certain of our officers in the U.S. District Court for the District of Idaho alleging claims under Section 10(b) and 20(a) of the Securities Exchange Act of 1934, as amended, and Rule 10b-5 promulgated thereunder. Four substantially similar complaints subsequently were filed in the same Court. The cases purport to be brought on behalf of a class of purchasers of our stock during the period February 24, 2001 to February 13, 2003. The five lawsuits have been consolidated and a consolidated amended class action complaint was filed on July 24, 2006. The complaint generally alleges violations of federal securities laws based on, among other things, claimed misstatements or omissions regarding alleged illegal price-fixing conduct or our operations and financial results. The complaint seeks unspecified damages, interest, attorneys' fees, costs, and expenses. On December 19, 2007, the Court issued an order certifying the class but reducing the class period to purchasers of our stock during the period from February 24, 2001 to September 18, 2002. On August 24, 2010, we executed a settlement agreement resolving these purported class-action cases. Subject to certain conditions, including final court approval of the class settlement, we agreed to pay $6 million as our contribution to the settlement. On April 28, 2011, the Court entered final approval of the class settlement.
Commercial Matters
On January 20, 2011, Dr. Michael Jaffé, administrator for Qimonda AG ("Qimonda") insolvency proceedings, filed suit against us and Micron Semiconductor B.V., our Netherlands subsidiary, in the District Court of Munich, Civil Chamber. The complaint seeks to void under Section 133 of the German Insolvency Act a share purchase agreement between us and Qimonda in fall 2008 pursuant to which we purchased all of Qimonda's shares of Inotera Memories, Inc. and seeks an order requiring us to retransfer the Inotera shares to the Qimonda estate. The complaint also seeks to terminate under Sections 103 or 133 of the German Insolvency Code a patent cross license between us and Qimonda entered into at the same time as the share purchase agreement. A hearing is scheduled to begin on November 9, 2011. We are unable to predict the outcome of this lawsuit. The final resolution of this lawsuit could result in the loss of the Inotera shares or equivalent monetary damages and the termination of the patent cross license, which could have a material adverse effect on our business, results of operation or financial condition.
(See "Item 1A. Risk Factors.")
24
Market for Common Stock
Our common stock is listed on the NASDAQ Global Select Market and trades under the symbol "MU" and traded under the same symbol on the New York Stock Exchange through December 29, 2009. The following table represents the high and low closing sales prices for our common stock for each quarter of 2011 and 2010, as reported by Bloomberg L.P.:
|
|
Fourth Quarter
|
Third Quarter
|
Second Quarter
|
First Quarter
|
||||||||||||
|
2011
|
|
|
|
|
||||||||||||
|
High
|
$
|
9.16
|
|
$
|
11.80
|
|
$
|
11.80
|
|
$
|
8.66
|
|
||||
|
Low
|
5.25
|
|
9.41
|
|
7.75
|
|
6.51
|
|
||||||||
|
2010
|
|
|
|
|
|
|
|
|
||||||||
|
High
|
$
|
10.02
|
|
$
|
11.30
|
|
$
|
11.22
|
|
$
|
8.91
|
|
||||
|
Low
|
6.46
|
|
8.57
|
|
8.44
|
|
6.58
|
|
||||||||
Holders of Record
As of October 18, 2011, there were
2,909
shareholders of record of our common stock.
Dividends
We have not declared or paid cash dividends since 1996 and do not intend to pay cash dividends for the foreseeable future.
Equity Compensation Plan Information
The information required by this item is incorporated by reference from the information set forth in Item 12 of this Annual Report on Form 10-K.
Issuer Sales of Unregistered Securities
On May 7, 2010, we issued an aggregate of 137.7 million unregistered shares of common stock (with a fair value of $1,091 million on the issuance date) to Intel Corporation, Intel Technology Asia Pte Ltd, STMicroelectronics N.V., Redwood Blocker S.a.r.l. and PK Flash, LLC as consideration for all the outstanding shares of Numonyx Holdings, B.V. The shares we issued were exempt from registration under Section 4(2) of the Securities Act of 1933.
Issuer Purchases of Equity Securities
On July 26, 2011, we repurchased
19.7 million
shares of common stock at
$7.60
per share. During the fourth quarter of 2011, we acquired, as payment of withholding taxes in connection with the vesting of restricted stock and restricted stock unit awards,
9,692
shares of our common stock at an average price of
$6.40
per share. We retired the
9,692
shares in the fourth quarter of 2011.
25
|
Period
|
(a) Total Number of Shares Purchased
|
(b) Average Price Paid Per Share
|
(c) Total Number of Shares (or Units) Purchased As Part of Publicly Announced Plans or Programs
|
(d) Maximum Number (or Approximate Dollar Value) of Shares (or Units) That May Yet Be Purchased Under the Plans or Programs
|
|||||||||
|
June 3, 2011
|
-
|
July 7, 2011
|
1,008
|
|
$
|
7.92
|
|
N/A
|
N/A
|
||||
|
July 8, 2011
|
-
|
August 4, 2011
|
19,739,445
|
|
7.60
|
|
N/A
|
N/A
|
|||||
|
August 5, 2011
|
-
|
September 1, 2011
|
6,081
|
|
5.66
|
|
N/A
|
N/A
|
|||||
|
|
19,746,534
|
|
7.60
|
|
|
|
|||||||
Performance Graph
The following graph illustrates a five-year comparison of cumulative total returns for our common stock, the S&P 500 Composite Index and the Philadelphia Semiconductor Index (SOX) from August 31, 2006, through August 31, 2011.
Note: Management cautions that the stock price performance information shown in the graph below is provided as of fiscal year-end and may not be indicative of current stock price levels or future stock price performance.
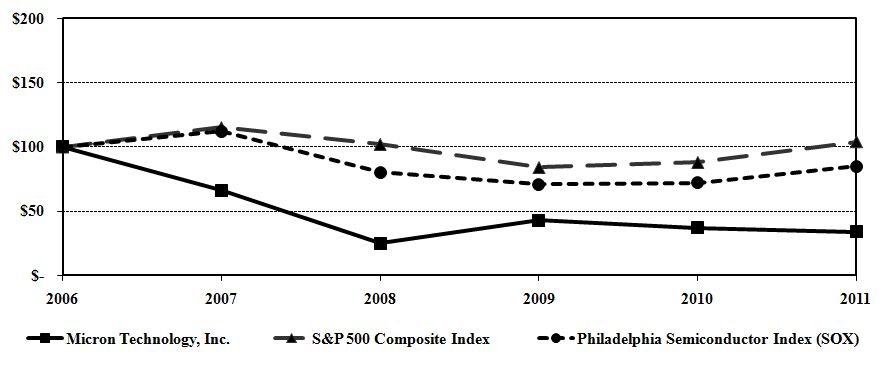
We operate on a 52 or 53 week fiscal year which ends on the Thursday closest to August 31. Accordingly, the last day of our fiscal year varies. For consistent presentation and comparison to the industry indices shown herein, we have calculated our stock performance graph assuming an August 31 year end. The performance graph assumes $100 was invested on August 31, 2006 in common stock of Micron Technology, Inc., the S&P 500 Composite Index and the Philadelphia Semiconductor Index (SOX). Any dividends paid during the period presented were assumed to be reinvested. The performance was plotted using the following data:
|
|
2006
|
2007
|
2008
|
2009
|
2010
|
2011
|
||||||||||||||||||
|
Micron Technology, Inc.
|
$
|
100
|
|
$
|
66
|
|
$
|
25
|
|
$
|
43
|
|
$
|
37
|
|
$
|
34
|
|
||||||
|
S&P 500 Composite Index
|
100
|
|
115
|
|
102
|
|
84
|
|
88
|
|
104
|
|
||||||||||||
|
Philadelphia Semiconductor Index (SOX)
|
100
|
|
112
|
|
80
|
|
71
|
|
72
|
|
85
|
|
||||||||||||
26
Amounts and balances in the table below have been adjusted for the retrospective application of new accounting standards for noncontrolling interests and certain convertible debt instruments.
|
|
2011
|
2010
|
2009
|
2008
|
2007
|
|||||||||||||||
|
|
(in millions)
|
|||||||||||||||||||
|
Net sales
|
$
|
8,788
|
|
$
|
8,482
|
|
$
|
4,803
|
|
$
|
5,841
|
|
$
|
5,688
|
|
|||||
|
Gross margin
|
1,758
|
|
2,714
|
|
(440
|
)
|
(55
|
)
|
1,078
|
|
||||||||||
|
Operating income (loss)
|
755
|
|
1,589
|
|
(1,676
|
)
|
(1,595
|
)
|
(280
|
)
|
||||||||||
|
Net income (loss)
|
190
|
|
1,900
|
|
(1,993
|
)
|
(1,665
|
)
|
(209
|
)
|
||||||||||
|
Net income (loss) attributable to Micron
|
167
|
|
1,850
|
|
(1,882
|
)
|
(1,655
|
)
|
(331
|
)
|
||||||||||
|
Diluted earnings (loss) per share
|
0.17
|
|
1.85
|
|
(2.35
|
)
|
(2.14
|
)
|
(0.43
|
)
|
||||||||||
|
Cash and short-term investments
|
2,160
|
|
2,913
|
|
1,485
|
|
1,362
|
|
2,616
|
|
||||||||||
|
Total current assets
|
5,832
|
|
6,333
|
|
3,344
|
|
3,779
|
|
5,234
|
|
||||||||||
|
Property, plant and equipment, net
|
7,555
|
|
6,601
|
|
7,089
|
|
8,819
|
|
8,279
|
|
||||||||||
|
Total assets
|
14,752
|
|
14,693
|
|
11,459
|
|
13,432
|
|
14,810
|
|
||||||||||
|
Total current liabilities
|
2,480
|
|
2,702
|
|
1,892
|
|
1,598
|
|
2,026
|
|
||||||||||
|
Long-term debt
|
1,861
|
|
1,648
|
|
2,379
|
|
2,106
|
|
1,597
|
|
||||||||||
|
Total Micron shareholders’ equity
|
8,470
|
|
8,020
|
|
4,953
|
|
6,525
|
|
8,135
|
|
||||||||||
|
Noncontrolling interests in subsidiaries
|
1,382
|
|
1,796
|
|
1,986
|
|
2,865
|
|
2,607
|
|
||||||||||
|
Total equity
|
9,852
|
|
9,816
|
|
6,939
|
|
9,390
|
|
10,742
|
|
||||||||||
On May 7, 2010, we acquired Numonyx Holdings B.V. ("Numonyx"), which manufactured and sold primarily NOR Flash and NAND Flash memory products. The total fair value of the consideration paid for Numonyx was $1,112 million and consisted of 137.7 million shares of our common stock issued to the Numonyx shareholders and 4.8 million restricted stock units issued to employees of Numonyx. In connection with the acquisition, we recorded net assets of $1,549 million. Because the fair value of the net assets acquired exceeded the purchase price, we recognized a gain on the acquisition of $437 million in the third quarter of 2010. In addition, we recognized a $51 million income tax benefit in connection with the acquisition. (See "Item 8. Financial Statements and Supplementary Data – Notes to Consolidated Financial Statements – Numonyx" note.)
In the first quarter of 2009, we acquired a noncontrolling interest in Inotera Memories, Inc. ("Inotera"), a publicly-traded DRAM manufacturer in Taiwan. In connection therewith, we entered into a supply agreement with Inotera to purchase 50% of Inotera’s wafer production capacity and substantially began purchasing product in the fourth quarter of 2009. As of September 1, 2011, our ownership interest was 29.7%. (See "Item 8. Financial Statements and Supplementary Data – Notes to Consolidated Financial Statements – Equity Method Investments – Inotera and MeiYa DRAM joint ventures with Nanya" note.)
We have two joint ventures with Intel Corporation: IM Flash Technologies, LLC ("IMFT"), formed in January, 2006, and IM Flash Singapore LLP ("IMFS"), formed in February, 2007 (collectively "IM Flash"), to manufacture NAND Flash memory products for the exclusive benefit of the partners. As of September 1, 2011, we owned an approximate 51% interest in IMFT and an approximate 86% interest in IMFS with the remaining interests held by Intel. Our ownership interest in IMFS has increased from 51% prior to the second quarter of 2010 to 86% on September 1, 2011 as Intel did not match our capital contributions. On September 26, 2011, Intel participated in a capital call of IMFS by contributing $131 million. After that capital call, our ownership interest in IMFS was reduced to 82%. We consolidate IM Flash and report Intel’s ownership interests as noncontrolling interests in subsidiaries. (See "Item 8. Financial Statements and Supplementary Data – Notes to Consolidated Financial Statements – Consolidated Variable Interest Entities – NAND Flash joint venture with Intel" note.)
In the third quarter of 2007 through the second quarter of 2011, we acquired in a series of transactions the noncontrolling interests in TECH Semiconductor Singapore Pte. Ltd. ("TECH"). (See "Item 8. Financial Statements and Supplementary Data – Notes to Consolidated Financial Statements – TECH Semiconductor Singapore Pte. Ltd" note.)
(See "Item 1A. Risk Factors" and "Item 8. Financial Statements and Supplementary Data – Notes to Consolidated Financial Statements.")
27
As used herein, "we," "our," "us" and similar terms include Micron Technology, Inc. and its subsidiaries, unless the context indicates otherwise. The following discussion contains trend information and other forward-looking statements that involve a number of risks and uncertainties. Forward-looking statements include, but are not limited to, statements such as those made in "Operating Results by Business Segment" regarding future royalty and other payments from Nanya; future increases in NAND Flash production resulting from the continued ramp of production at IM Flash's new fabrication facility and lower underutilized capacity costs at the new IM flash fabrication facility in future periods; in "Selling, General and Administrative" regarding SG&A costs for the first quarter of 2012; in "Research and Development" regarding R&D costs for the first quarter of 2012; in "Liquidity and Capital Resources" regarding capital spending in 2012, future distributions from IM Flash to Intel, future contribution by us to IM Flash and the timing of payments for certain contractual obligations; and in "Recently Issued Accounting Standards" regarding the impact from the adoption of new accounting standards. Our actual results could differ materially from our historical results and those discussed in the forward-looking statements. Factors that could cause actual results to differ materially include, but are not limited to, those identified in "Item 1A. Risk Factors." This discussion should be read in conjunction with the Consolidated Financial Statements and accompanying notes for the year ended September 1, 2011. All period references are to our fiscal periods unless otherwise indicated. Our fiscal year is the 52 or 53-week period ending on the Thursday closest to August 31. Our fiscal 2011, which ended on September 1, 2011, contained 52 weeks, our fiscal 2010 contained 52 weeks and our fiscal 2009 contained 53 weeks. All production data includes the production of our consolidated joint ventures and our other partnering arrangements. All tabular dollar amounts are in millions.
Our Management's Discussion and Analysis of Financial Condition and Results of Operations ("MD&A") is provided in addition to the accompanying consolidated financial statements and notes to assist readers in understanding our results of operations, financial condition, and cash flows. MD&A is organized as follows:
|
•
|
Overview:
Highlights of key transactions and events that impacted our 2011 results of operations.
|
|
•
|
Results of Operation:
An analysis of our financial results comparing 2011 to 2010 and comparing 2010 to 2009.
|
|
◦
|
Consolidated results
|
|
◦
|
Operating results by business segment
|
|
◦
|
Operating results by product
|
|
◦
|
Operating expenses and other
|
|
•
|
Liquidity and Capital Resources:
An analysis of changes in our balance sheets and cash flows and discussion of our financial condition and potential sources of liquidity. Also includes our contractual obligations.
|
|
•
|
Off-Balance-Sheet Arrangements:
Contingent liabilities, commitments and off-balance-sheet arrangements outstanding as of September 1, 2011, including expected payment schedule.
|
|
•
|
Critical Accounting Estimates:
Accounting estimates that we believe are most important to understanding the assumptions and judgments incorporated in our reported financial results and forecasts. Also includes changes in accounting standards.
|
Overview
Our results of operations for 2011 were impacted by the following key transactions and events:
Rambus Antitrust Litigation
On May 5, 2004, Rambus, Inc. ("Rambus") filed a complaint in the Superior Court of the State of California (San Francisco County) against us and other DRAM suppliers alleging that the defendants harmed Rambus by engaging in concerted and unlawful efforts affecting Rambus DRAM ("RDRAM") by eliminating competition and stifling innovation in the market for computer memory technology and computer memory chips. Rambus' complaint alleges various causes of action under California state law including, among other things, a conspiracy to restrict output and fix prices, a conspiracy to monopolize, intentional interference with prospective economic advantage, and unfair competition. Rambus is seeking a judgment for damages of approximately $3.9 billion, joint and several liability, trebling of damages awarded, punitive damages, a permanent injunction enjoining the defendants from the conduct alleged in the complaint, interest, and attorneys' fees and costs. Trial began on June 20, 2011, and the case went to the jury on September 21, 2011. At the time of this filing, a jury verdict is pending. We cannot predict when a verdict will be reached or when a formal judgment would be entered by the Court subsequent to a verdict. On September 29, 2011, we entered into a judgment sharing agreement with Hynix Semiconductor, Inc., a co-defendant in the case, pursuant to which each party agreed, if found liable, to share equally any joint and several
28
damages. In the event of an adverse judgment, we would anticipate filing appropriate post-judgment motions and appeals. We may be required to post a bond or other security to stay enforcement of an adverse judgment pending appeal. Depending on the amount required, there can be no assurance we would be able to obtain sufficient security to pursue an appeal. We are unable to predict the outcome of this lawsuit and therefore cannot determine the likelihood of loss nor estimate a range of possible loss. Accordingly, we have not provided an accrual for an adverse judgment in the September 1, 2011, financial statements. However, we have accrued a liability and charged operations for estimated costs to successfully defend the matter. An adverse judgment may have a material impact on our business, results of operations and financial condition, including liquidity.
Numonyx Holdings B.V. ("Numonyx")
On May 7, 2010, we acquired Numonyx, which manufactured and sold primarily NOR Flash and NAND Flash memory products. The total fair value of the consideration paid for Numonyx was $1,112 million and consisted of 137.7 million shares of our common stock issued to the Numonyx shareholders and 4.8 million restricted stock units issued to employees of Numonyx. In connection with the acquisition, we recorded net assets of $1,549 million. Because the fair value of the net assets acquired exceeded the purchase price, we recognized a gain on the acquisition of $437 million in the third quarter of 2010. In addition, we recognized a $51 million income tax benefit in connection with the acquisition. (See "Item 8. Financial Statements – Notes to Consolidated Financial Statements – Numonyx" note.)
Japan Fabrication Facility
On June 2, 2011, we sold our wafer fabrication facility in Japan (the "Japan Fab") to Tower Semiconductor Ltd. ("Tower"). Under the arrangement, Tower paid $
40 million
in cash and approximately
20 million
of Tower ordinary shares. In addition, we will receive an aggregate amount of $
20 million
in twelve equal monthly installments beginning in the second quarter of 2012. We recorded a gain of $
54 million
(net of transaction costs of $
3 million
) in connection with the sale of the Japan Fab. We also recorded a tax provision of $
74 million
related to the gain on the sale and to write down certain deferred tax assets associated with the Japan Fab. In connection with the sale of the Japan Fab, we entered into a supply agreement for Tower to manufacture products for us in the facility through approximately May 2014.
Business Segments
In the second quarter of 2011, we reorganized our business to better align with the markets we serve. All prior period amounts have been retrospectively adjusted to reflect this reorganization. After the reorganization, we have the following four reportable segments:
DRAM Solutions Group ("DSG"):
Includes DRAM products sold to the PC, consumer electronics, networking and server markets.
NAND Solutions Group ("NSG"):
Includes high-volume NAND Flash products sold into data storage, personal music players, and the high-density computing markets, as well as NAND Flash products sold to Intel through our consolidated IM Flash joint ventures.
Wireless Solutions Group ("WSG"):
Includes DRAM, NAND Flash and NOR Flash products, including multi-chip packages, sold to the mobile device market.
Embedded Solutions Group ("ESG"):
Includes DRAM, NAND Flash and NOR Flash products sold into automotive and industrial applications, as well as NOR and NAND flash sold to consumer electronics, networking, PC and server markets.
Our other operations do not meet the quantitative thresholds of a reportable segment and are reported under All Other. All Other includes our CMOS image sensor, LED, microdisplay and solar operations.
29
Results of Operations
Consolidated Results
|
|
2011
|
2010
|
2009
|
|||||||||||||||||||
|
|
(amounts in millions and as a percent of net sales)
|
|||||||||||||||||||||
|
Net sales
|
$
|
8,788
|
|
100
|
%
|
$
|
8,482
|
|
100
|
%
|
$
|
4,803
|
|
100
|
%
|
|||||||
|
Cost of goods sold
|
7,030
|
|
80
|
%
|
5,768
|
|
68
|
%
|
5,243
|
|
109
|
%
|
||||||||||
|
Gross margin
|
1,758
|
|
20
|
%
|
2,714
|
|
32
|
%
|
(440
|
)
|
(9
|
)%
|
||||||||||
|
Selling, general and administrative
|
592
|
|
7
|
%
|
528
|
|
6
|
%
|
354
|
|
7
|
%
|
||||||||||
|
Research and development
|
791
|
|
9
|
%
|
624
|
|
7
|
%
|
647
|
|
13
|
%
|
||||||||||
|
Other operating (income) expense, net
|
(380
|
)
|
(4
|
)%
|
(27
|
)
|
—
|
%
|
235
|
|
5
|
%
|
||||||||||
|
Operating income (loss)
|
755
|
|
9
|
%
|
1,589
|
|
19
|
%
|
(1,676
|
)
|
(35
|
)%
|
||||||||||
|
Gain on acquisition of Numonyx
|
—
|
|
—
|
%
|
437
|
|
5
|
%
|
—
|
|
—
|
%
|
||||||||||
|
Interest income (expense), net
|
(101
|
)
|
(1
|
)%
|
(160
|
)
|
(2
|
)%
|
(160
|
)
|
(3
|
)%
|
||||||||||
|
Other non-operating income (expense), net
|
(103
|
)
|
(1
|
)%
|
54
|
|
1
|
%
|
(16
|
)
|
—
|
%
|
||||||||||
|
Income tax (provision) benefit
|
(203
|
)
|
(2
|
)%
|
19
|
|
—
|
%
|
(1
|
)
|
—
|
%
|
||||||||||
|
Equity in net income (loss) of equity method investees
|
(158
|
)
|
(2
|
)%
|
(39
|
)
|
—
|
%
|
(140
|
)
|
(3
|
)%
|
||||||||||
|
Net (income) loss attributable to noncontrolling interests
|
(23
|
)
|
—
|
%
|
(50
|
)
|
(1
|
)%
|
111
|
|
2
|
%
|
||||||||||
|
Net income (loss) attributable to Micron
|
$
|
167
|
|
2
|
%
|
$
|
1,850
|
|
22
|
%
|
$
|
(1,882
|
)
|
(39
|
)%
|
|||||||
Net Sales
|
|
2011
|
2010
|
2009
|
|||||||||||||||||||
|
DSG
|
$
|
3,203
|
|
36
|
%
|
$
|
4,638
|
|
55
|
%
|
$
|
2,100
|
|
44
|
%
|
|||||||
|
NSG
|
2,196
|
|
25
|
%
|
2,113
|
|
25
|
%
|
1,747
|
|
36
|
%
|
||||||||||
|
WSG
|
1,959
|
|
22
|
%
|
778
|
|
9
|
%
|
247
|
|
5
|
%
|
||||||||||
|
ESG
|
1,002
|
|
11
|
%
|
521
|
|
6
|
%
|
178
|
|
4
|
%
|
||||||||||
|
All Other
|
428
|
|
6
|
%
|
432
|
|
5
|
%
|
531
|
|
11
|
%
|
||||||||||
|
|
$
|
8,788
|
|
100
|
%
|
$
|
8,482
|
|
100
|
%
|
$
|
4,803
|
|
100
|
%
|
|||||||
Total net sales for 2011 increased 4%, as compared to 2010 primarily due to increases in WSG and ESG sales as a result of the acquisition of Numonyx in May 2010. DSG sales for 2011 decreased 31% as compared to 2010 primarily due to declines in average selling prices mitigated by increases in gigabit sales. NSG sales for 2011 increased 4% as compared to 2010 primarily due to increases in gigabit sales partially offset by declines in average selling prices.
Total net sales for 2010 increased 77% as compared to 2009 as a result of improved sales across all reportable segments. Increases in DSG and NSG sales for 2010 primarily reflect significant increases in gigabits sold for both segments and improved average selling prices for DSG products. Increases in ESG and WSG sales for 2010 were primarily the result of the acquisition of Numonyx.
Gross Margin
Our overall gross margin percentage declined from 32% for 2010 to 20% for 2011 primarily due to a significant decline in the gross margin for DSG as a result of the dramatic decreases in average selling prices mitigated by a reduction in costs per gigabit. Declines in the gross margins of NSG, WSG and ESG, primarily due to declines in average selling prices, also contributed to the overall decrease in gross margin for 2011 as compared to 2010. The impact of declines in average selling prices for 2011 was partially offset by cost reductions.
30
Our overall gross margin percentage improved to 32% for 2010 from negative 9% for 2009 primarily due to improvements in the gross margin for all reportable segments as a result of cost reductions and improved DRAM pricing. Our gross margin percentage was also impacted by our acquisition of Numonyx in May of 2010 as gross margins for Numonyx activities were 19% for the 2010 period after the acquisition.
Our gross margins in prior years were impacted by charges to write down inventories to their estimated market values as a result of the significant decreases in average selling prices for both DRAM and NAND Flash products. As charges to write down inventories are recorded in advance of when inventories are sold, gross margins in subsequent reporting periods are higher than they otherwise would be. Our gross margins for 2010 and 2009 were $40 million and $164 million higher as a result of the net impact of sales of products that had been written down to their estimated marked values in prior periods. In future periods, we will be required to record additional inventory write-downs if estimated average selling prices of products held in finished goods and work in process inventories at a quarter-end date are below the manufacturing cost of those products.
Operating Results by Business Segments
DRAM Solutions Group ("DSG")
|
|
2011
|
2010
|
2009
|
|||||||||
|
Net sales
|
$
|
3,203
|
|
$
|
4,638
|
|
$
|
2,100
|
|
|||
|
Operating income (loss)
|
290
|
|
1,269
|
|
(902
|
)
|
||||||
DSG sales and operating results track closely with our average selling prices, gigabit sales volumes and cost per gigabit for our consolidated sales of DRAM products. (See "Operating Results by Product Groups - DRAM" for further detail.) DSG sales for 2011 decreased 31% from 2010 primarily due to significant declines in average selling prices partially offset by an increase in sales volume. DSG operating income decreased from 2010 to 2011 primarily as a result of the significant declines in average selling prices, mitigated by reductions in manufacturing costs per gigabit as a result of improved production efficiencies.
The significant declines in DSG sales and margins for 2011 compared to 2010 was primarily attributable to a severe decrease in demand for PC DRAM, particularly for DDR3 DRAM, due to overall weakness in the PC market. Decreases in PC DRAM margins for 2011 were mitigated by the relatively higher margins in our server and other premium markets.
DSG operating income for 2011 benefited from the following items as compared to the corresponding periods of 2010:
|
•
|
Lower SG&A costs primarily due to costs recognized in the third quarter of 2010 from the settlement of litigation in DRAM antitrust matters;
|
|
•
|
Lower R&D costs primarily due to the DRAM R&D cost-sharing agreement with Nanya that commenced in the third quarter of 2010; and
|
|
•
|
A $75 million gain in 2011 from a license arrangement with Samsung.
|
We have formed partnering arrangements and have sold or licensed technology to other parties. DSG recognized royalty and license revenue of $25 million in 2011, $83 million in 2010 and $120 million in 2009. We have a partnering arrangement with Nanya pursuant to which we and Nanya jointly develop process technology and designs to manufacture stack DRAM products. In addition, we have deployed and licensed certain intellectual property related to the manufacture of stack DRAM products to Nanya and licensed certain intellectual property from Nanya. We recognized $65 million and $105 million of license revenue in net sales from this arrangement during 2010 and 2009, respectively. In April 2010 the license agreement was completed and we began to share DRAM development costs with Nanya on an approximately equal basis. This cost-sharing arrangement reduced our overall research and development costs by $141 million and $51 million for 2011 and 2010, respectively, of which $109 million and $51 million was attributed to DSG. DSG received royalties of $25 million and $6 million in 2011 and 2010, respectively, from Nanya for sales of stack DRAM products manufactured by or for Nanya on process nodes of 50nm or larger and we expect to continue to receive royalties from Nanya associated with technology developed prior to the cost-sharing arrangement.
31
DSG sales for 2010 increased 121% from 2009 primarily due to increases in gigabits sold and average selling prices per gigabit. The increase in gigabits sold for 2010 was largely due to additional supply obtained from Inotera, which accounted for 23% of our DRAM gigabit production in 2010 as compared to 4% for 2009. The increase in average selling prices in 2010 for DSG products from improved market conditions was partially offset by a shift in product mix resulting from increases in sales of Inotera trench DRAM products that had significantly lower average selling prices per gigabit than our other DSG products.
NAND Solutions Group ("NSG")
|
|
2011
|
2010
|
2009
|
|||||||||
|
Net sales
|
$
|
2,196
|
|
$
|
2,113
|
|
$
|
1,747
|
|
|||
|
Operating income (loss)
|
269
|
|
240
|
|
(573
|
)
|
||||||
NSG sales and operating results track closely with our average selling prices, gigabit sales volumes and cost per gigabit for our consolidated sales of NAND Flash products. NSG sales for 2011 increased 4% from 2010 primarily due to increases in gigabits sold partially offset by declines in average selling prices. We sell NSG products in three principal channels: (1) to Intel Corporation ("Intel") through our IM Flash consolidated joint ventures at long-term negotiated prices approximating cost, (2) to original equipment manufacturers ("OEMs") and other resellers and (3) to retailers.
NSG sales through IM Flash to Intel were $884 million for 2011, $764 million for 2010 and $886 million for 2009. The ramp of production at IM Flash's new wafer fabrication facility in Singapore began to increase our NAND Flash production in the second half of 2011 and we expect that it will significantly increase our NAND Flash production in 2012. Our share of the operating costs and supply of NAND Flash from IMFS adjusts in proportion to changes in our ownership share either 12 months or 8 months (depending on the status of IMFS' production ramp) from the date of the applicable ownership change. Accordingly, we anticipate that our share of IMFS costs and supply will increase from
57%
as of
September 1, 2011
to our current ownership interest in IMFS during the course of 2012. In September 2011, subsequent to the end of our 2011, we contributed $103 million and Intel contributed $131 million to IMFS, decreasing our ownership interest in IMFS to 82%. The following table presents the contributions and ownership percentages of IMFS:
|
Contributions
|
Ownership Percentage
|
|||||||||||||
|
Micron
|
Intel
|
Micron
|
Intel
|
|||||||||||
|
Prior to the second quarter of 2010
|
51
|
%
|
49
|
%
|
||||||||||
|
Second quarter of 2010
|
$
|
25
|
|
$
|
—
|
|
53
|
%
|
47
|
%
|
||||
|
Third quarter of 2010
|
26
|
|
24
|
|
53
|
%
|
47
|
%
|
||||||
|
Fourth quarter of 2010
|
77
|
|
14
|
|
57
|
%
|
43
|
%
|
||||||
|
First quarter of 2011
|
392
|
|
—
|
|
71
|
%
|
29
|
%
|
||||||
|
Second quarter of 2011
|
343
|
|
—
|
|
78
|
%
|
22
|
%
|
||||||
|
Third quarter of 2011
|
409
|
|
—
|
|
83
|
%
|
17
|
%
|
||||||
|
Fourth quarter of 2011
|
421
|
|
—
|
|
86
|
%
|
14
|
%
|
||||||
|
Subsequent to fourth quarter of 2011 through October 2011
|
103
|
|
131
|
|
82
|
%
|
18
|
%
|
||||||
NSG sales of NAND Flash products to our OEM, reseller and retail customers decreased 2% for 2011 as compared to 2010 primarily due to declines in average selling prices partially offset by an an increase in gigabits sold. NSG operating income increased for 2011 as compared to 2010 despite declines in average selling prices due to (1) reductions in manufacturing costs per gigabit as a result of improved production efficiencies and higher NAND Flash production and (2) other operating gains including a $57 million gain from the Samsung license arrangement. NSG's costs of goods sold for 2011, 2010 and 2009 included $81 million, $60 million and $60 million, respectively of underutilized capacity costs from the IMFS's wafer fabrication facility in Singapore. We expect that the underutilized capacity costs will decrease significantly in 2012 due to the qualification of IMFS products for sale in the third quarter of 2011.
32
NSG sales for 2010 increased 21% from 2009 primarily due to an increase in gigabits produced partially offset by a decline in average selling prices per gigabit. The decline in average selling prices was primarily due to declines in prices on sales of NAND Flash to Intel as a result of cost reductions and were partially offset by increases in average selling prices to trade customers. NSG's operating income improved for 2010 from 2009 primarily due to reductions in costs per gigabit. The reductions in manufacturing costs per gigabit for 2010 were partially offset by the declines in overall average selling prices per gigabit. NSG's operating income for 2009 included a $144 million gain from termination of a supply agreement with Intel.
Wireless Solutions Group ("WSG")
|
|
2011
|
2010
|
2009
|
|||||||||
|
Net sales
|
$
|
1,959
|
|
$
|
778
|
|
$
|
247
|
|
|||
|
Operating income (loss)
|
20
|
|
(23
|
)
|
(63
|
)
|
||||||
In 2011, WSG sales were composed of NOR Flash, NAND Flash and DRAM in decreasing order of revenue. The 152% increase in WSG sales for 2011 as compared to 2010 was primarily due to the acquisition of Numonyx in May of 2010. WSG experienced pricing pressure in 2011 due to weakness in demand from certain customers. In addition, during 2011 and 2010, a portion of the NAND Flash sold by WSG was obtained from Hynix at market prices and by the end of 2011, substantially all of this supply was obtained from lower-cost Micron production. The improvement in WSG's operating income for 2011 is primarily due to a $95 million gain from the Samsung license arrangement recognized by WSG in 2011.
The significant increase in WSG sales for 2010 as compared to 2009 was primarily due to the acquisition of Numonyx. Operating loss for WSG improved for 2010 from 2009 primarily due to cost reductions and improvements in average selling prices, partially offset by higher R&D expenses.
Embedded Solutions Group ("ESG")
|
|
2011
|
2010
|
2009
|
|||||||||
|
Net sales
|
$
|
1,002
|
|
$
|
521
|
|
$
|
178
|
|
|||
|
Operating income (loss)
|
237
|
|
152
|
|
37
|
|
||||||
In 2011, ESG sales were composed of NOR Flash, DRAM and NAND Flash in decreasing order of revenue. The 92% increase in ESG sales for 2011 as compared to 2010 was primarily due to the acquisition of Numonyx in May of 2010. Absent impacts from the Numonyx acquisition, ESG's performance in the automotive, industrial and networking markets was relatively stable from 2010 to 2011. In addition, during 2011 and 2010, a portion of the NAND Flash sold by ESG was obtained from Hynix at market prices and by the end of 2011, the majority of this supply was obtained from lower-cost Micron production. The improvement in ESG's operating income for 2011 is primarily due to the acquisition of Numonyx. In addition, ESG recognized a $33 million gain from the Samsung license arrangement in 2011.
The significant increase in ESG sales for 2010 as compared to 2009 was primarily due to the acquisition of Numonyx. Operating income for ESG improved for 2010 from 2009 primarily due to cost reductions and improvements in average selling prices, partially offset by higher R&D expenses.
Operating Results by Product
Net Sales by Product
|
|
2011
|
2010
|
2009
|
|||||||||||||||||||
|
DRAM
|
$
|
3,620
|
|
41
|
%
|
$
|
5,052
|
|
60
|
%
|
$
|
2,422
|
|
50
|
%
|
|||||||
|
NAND Flash
|
3,193
|
|
36
|
%
|
2,555
|
|
30
|
%
|
1,857
|
|
39
|
%
|
||||||||||
|
NOR Flash
|
1,547
|
|
18
|
%
|
451
|
|
5
|
%
|
—
|
|
—
|
%
|
||||||||||
|
Other
|
428
|
|
5
|
%
|
424
|
|
5
|
%
|
524
|
|
11
|
%
|
||||||||||
|
|
$
|
8,788
|
|
100
|
%
|
$
|
8,482
|
|
100
|
%
|
$
|
4,803
|
|
100
|
%
|
|||||||
33
Partially as a result of a decrease in DRAM product sales in 2011 and an increase in NAND Flash product sales during the same period, in the fourth quarter of 2011, sales of NAND Flash products were higher than sales of DRAM products. This marks the first time in our history that the primary product by revenue was not DRAM.
DRAM
|
|
2011
|
2010
|
||||
|
(percentage change from prior year)
|
||||||
|
Net sales
|
(28
|
)%
|
109
|
%
|
||
|
Average selling prices per gigabit
|
(39
|
)%
|
28
|
%
|
||
|
Gigabits sold
|
19
|
%
|
69
|
%
|
||
|
Cost reduction per gigabit
|
(23
|
)%
|
(35
|
)%
|
||
The increase in gigabit sales of DRAM products for 2011 as compared to 2010 was primarily due to increased output obtained from our Inotera joint venture and improved production efficiencies. Sales of DDR3 and DDR2 DRAM, were 51% and 25%, respectively, of total DRAM sales for 2011 and 37% and 40%, respectively, of total DRAM sales for 2010.
The gross margin percentage on sales of DRAM products for 2011 declined significantly as compared to 2010 primarily due to the declines in average selling prices particularly for DDR3 DRAM sold into the PC market, partially offset by cost reductions resulting from improvements in manufacturing efficiencies. The gross margin percentage for 2011 was also adversely affected by an increasing percentage of products obtained from Inotera. The gross margin percentage on sales of DRAM products for 2010 improved significantly as compared to 2009 primarily due to cost reductions and increases in average selling prices.
We have rights and obligations to purchase 50% of Inotera's wafer production capacity under a supply agreement with Inotera (the "Inotera Supply Agreement"). DRAM products acquired from Inotera accounted for 33% of our DRAM gigabit production in 2011 as compared to 23% for 2010 and 4% for 2009. Products obtained from Inotera in 2011 were primarily DDR3 for the PC market. Our cost of wafers purchased under the Inotera Supply Agreement is based on a margin-sharing formula among Nanya, Inotera, and ourselves. Under such formula, all parties' manufacturing costs related to wafers supplied by Inotera, as well as our and Nanya's revenue for the resale of products from wafers supplied by Inotera, are considered in determining costs for wafers acquired from Inotera. In 2011, the cost of wafers purchased from Inotera was significantly higher than our cost of wafers manufactured in our facilities. Because of significant market declines in the selling price of DRAM, Inotera incurred net losses of $278 million for the six-month period ended June 30, 2011. Also, Inotera's current liabilities exceeded its current assets by $2.3 billion as of June 30, 2011, which exposes Inotera to liquidity risk. Further, under generally accepted accounting principles in the Republic of China, Inotera reported a loss for its quarter ended September 30, 2011 of an additional New Taiwan dollars 7,022 million (approximately $241 million U.S. dollars). Inotera's management has developed plans to improve its liquidity. We cannot assure you that Inotera's plan to improve its liquidity will be successful.
NAND Flash
|
|
2011
|
2010
|
||||
|
(percentage change from prior year)
|
||||||
|
NAND Flash sales to trade customers:
|
||||||
|
Net sales
|
31
|
%
|
81
|
%
|
||
|
Average selling prices per gigabit
|
(12
|
)%
|
26
|
%
|
||
|
Gigabits sold
|
50
|
%
|
44
|
%
|
||
|
Cost (reduction) increase per gigabit
|
2
|
%
|
(31
|
)%
|
||
|
NAND Flash sales to Intel:
|
||||||
|
Net sales
|
16
|
%
|
(14
|
)%
|
||
|
Average selling prices per gigabit
|
(24
|
)%
|
(49
|
)%
|
||
|
Gigabits sold
|
53
|
%
|
71
|
%
|
||
|
Cost reduction per gigabit
|
(25
|
)%
|
(50
|
)%
|
||
34
Approximately half of our output of NAND Flash products has been sold to Intel through our IM Flash consolidated joint ventures at long-term negotiated prices approximating cost. Sales of NAND Flash products to Intel were $884 million for 2011, $764 million for 2010 and $886 million for 2009. (See "Segment Operating Results - NAND Solutions Group" for further detail.) The remainder of our sales of NAND Flash products is to "trade" customers (i.e., customers other than Intel).
We sell NAND Flash products in various forms, including discrete standalone devices as well as in multi-chip packages ("MCPs") and other NAND Flash systems solution products. MCPs and system solutions products, which combine NAND Flash devices with a controller and/or other semiconductor devices, generally have significantly higher average selling prices and costs per gigabit than discrete NAND Flash devices. Our sales of MCPs and other system solution NAND Flash products increased in 2011 from 2010 due primarily to our acquisition of Numonyx and to targeted efforts at increasing sales of these products. Our mix of single-level cell ("SLC") and multi-level cell ("MLC") NAND Flash products also impacted our average selling prices and sales volumes. SLC products have fewer bits per wafer but higher average selling prices per gigabit as compared to MLC products. These shifts in the mix of our products increased our average selling prices and cost per gigabit in 2011 as compared to 2010.
Increases in gigabits sold for both 2011 and 2010 were primarily due to increased production efficiencies. The ramp of the IMFS wafer fabrication facility in Singapore also contributed to the increase in production for 2011. Our acquisition of Numonyx in May 2010 also contributed to increases in sales volumes to trade customers in 2011 and 2010.
The gross margin percentage on sales of NAND Flash products to trade customers for 2011 declined as compared to 2010 primarily due to the declines in average selling prices. The gross margin percentage on sales of NAND Flash products to trade customers for 2010 improved as compared to 2009 primarily due to cost reductions and by the increases in average selling prices.
NOR Flash
The increases in our sales of NOR Flash products for 2011 and 2010 were primarily due to our acquisition of Numonyx in May 2010 as all of our sales of NOR Flash originated from this acquisition. Our gross margin percentage on sales of NOR products for 2011 improved slightly as compared to 2010 primarily due to cost reductions.
Operating Expenses and Other
Selling, General and Administrative
Selling, general and administrative ("SG&A") expenses for 2011 increased 12% as compared to 2010 primarily due to increased costs associated with Numonyx operations and higher payroll costs, partially offset by a reduction in legal costs. The reduction in legal costs from 2010 to 2011 was primarily due to $64 million of costs in 2010 for estimated settlements in an indirect purchasers antitrust case and other matters.
SG&A expenses for 2010 increased 49% from 2009 primarily due to the costs associated with the indirect purchasers settlements, increased costs associated with Numonyx operations, higher payroll costs and Numonyx acquisition costs. The increase in SG&A expenses for 2010 was partially offset by a reduction in expenses for imaging operations as a result of the sale of a 65% interest in Aptina Imaging Corporation ("Aptina") in the fourth quarter of 2009. We expect that SG&A expenses will approximate $155 million to $165 million for the first quarter of 2012.
Research and Development
R&D expenses for 2011 increased 27% from 2010 primarily due to the following:
•
increased costs associated with R&D activities for acquired Numonyx operations;
•
higher payroll costs; and
•
a higher volume of pre-qualification wafers processed.
Increases in R&D costs for 2011 from the above factors was partially offset by amounts received under a DRAM cost-sharing arrangement with Nanya that commenced in the third quarter of 2010. As a result of amounts reimbursable from Nanya under the DRAM R&D cost-sharing arrangement, R&D expenses were reduced by $141 million for 2011 and $51 million for 2010.
35
R&D expenses for 2010 decreased 4% from 2009 primarily due to the following:
|
•
|
a DRAM cost-sharing arrangement with Nanya that commenced in 2010; and
|
|
•
|
a reduction in R&D costs for imaging products as a result of the sale of a 65% interest in Aptina in the fourth quarter of 2009.
|
Decreases in R&D costs for 2010 from the above factors was partially offset by higher payroll expenses resulting from the accrual of incentive-based compensation costs and additional $79 million of R&D expenses in connection with the May 7, 2010 acquisition of Numonyx.
As a result of amounts reimbursable from Intel under a NAND Flash R&D cost-sharing arrangement, R&D expenses were reduced by $95 million, $104 million and $107 million for 2011, 2010 and 2009 respectively. We expect that R&D expenses, net of amounts reimbursable from our R&D partners, will be approximately $200 million to $230 million for the first quarter of 2012.
Our process technology R&D efforts are focused primarily on development of successively smaller line-width process technologies which are designed to facilitate our transition to next generation memory products. Additional process technology R&D efforts focus on the enablement of advanced computing and mobile memory architectures, the investigation of new opportunities that leverage our core semiconductor expertise and the development of new manufacturing materials. Product design and development efforts are concentrated on our high density DDR3 DRAM and LP-DDR2 Mobile Low Power DRAM products as well as high density and mobile NAND Flash memory (including multi-level cell technology), NOR Flash memory, specialty memory, phase change and memory systems.
Interest Income (Expense)
Interest expense for 2011, 2010 and 2009, included aggregate amounts of non-cash amortization of debt discount and issuance costs of $60 million, $76 million and $71 million, respectively. Net proceeds received at inception from some of our convertible notes were allocated between a liability component (issued at a discount) and an equity component. The debt discount is being amortized from issuance through the expected maturity dates of such convertible notes, with the amortization recorded as additional non-cash interest expense. Included in the aggregate noncash interest expense is amortization on the convertible notes of $54 million for 2011, $56 million for 2010 and $52 million for 2009. (See "Item 1. Financial Statements – Notes to Consolidated Financial Statements – Debt" note.)
Other Non-Operating Income (Expense), Net
Other non-operating expense for 2011 included a $111 million loss recognized in the first quarter of 2011 in connection with a series of debt restructure transactions with certain holders of our convertible notes. (See "Item 1. Financial Statements – Notes to Consolidated Financial Statements – Debt" note.)
Other non-operating income for 2011 also included $15 million in connection with the release of our guarantee of debt in a joint venture in which we previously participated. (See "Item 1. Financial Statements – Notes to Consolidated Financial Statements – Debt" note.)
Other non-operating income for 2010 included a gain of $56 million recognized in the first quarter of 2010 in connection with an issuance of common shares in a public offering by Inotera Memories, Inc. ("Inotera"). As a result of the issuance, our interest in Inotera decreased from 35.5% to 29.8%. (See "Item 1. Financial Statements – Notes to Consolidated Financial Statements – Equity Method Investments – Inotera and MeiYa DRAM joint ventures with Nanya" note.)
Other Operating and Non-operating Income and Expenses
Further discussion of operating and non-operating income and expenses can be found in the following notes contained in "Item 8. Financial Statements and Supplementary Data – Notes to Consolidated Financial Statements":
|
•
|
Other Operating (Income) Expense, Net
|
|
•
|
TECH Semiconductor Singapore Pte. Ltd.
|
|
•
|
Income Taxes
|
|
•
|
Equity Method Investments
|
|
•
|
Equity Plans
|
36
Liquidity and Capital Resources
As of September 1, 2011 and September 2, 2010, we had the following cash and equivalents:
|
As of
|
2011
|
2010
|
||||||
|
Bank deposit accounts
|
$
|
543
|
|
$
|
372
|
|
||
|
Money market accounts
|
1,462
|
|
2,170
|
|
||||
|
Certificates of deposit
|
155
|
|
371
|
|
||||
|
Aggregate cash and equivalents (includes $327 million and $246 million held by IM Flash)
|
$
|
2,160
|
|
$
|
2,913
|
|
||
To mitigate credit risk, we invest through high-credit-quality financial institutions and, by policy, generally limit the concentration of credit exposure by restricting investments with any single obligor. Our ability to access funds held by IM Flash to finance our other operations is subject to agreement by the joint venture partners and contractual limitations. Amounts held by IM Flash are not anticipated to be available to finance our other operations.
Cash generated by operations is our primary source of liquidity. Our liquidity is highly dependent on average selling prices for our products and the timing and level of our capital expenditures, both of which can vary significantly from period to period. Depending on conditions in the semiconductor memory market, our cash flows from operations and current holdings of cash and investments may not be adequate to meet our needs for capital expenditures and operations. We may pursue additional financing alternatives in the future as cost effective and strategic opportunities arise.
Operating activities
Net cash provided by operating activities was
$2,484 million
for 2011, which reflected approximately $2,423 million generated from the production and sales of our products, $230 million (net of tax) from a patent cross-license agreement with Samsung offset by a net $169 million effect from an increase in the amount invested in working capital, primarily due to a $357 million increase in inventories.
Investing activities
Net cash used for investing activities was
$2,201 million
for 2011, which consisted primarily of cash expenditures of
$2,550 million
for property, plant and equipment and $159 million for the acquisition of noncontrolling interests in TECH, partially offset by
$330 million
released from restricted cash. We believe that to develop new product and process technologies, support future growth, achieve operating efficiencies and maintain product quality, we must continue to invest in manufacturing technologies, facilities and capital equipment and research and development. We estimate that capital spending for 2012 will be approximately $2 billion, the majority of which is expected to be incurred in the first half of 2012. The actual amounts for 2012 will vary depending on market conditions. As of September 1, 2011, we had commitments of approximately $600 million for the acquisition of property, plant and equipment, substantially all of which is expected to be paid within one year.
Amounts released to us from restricted cash in 2011 included the following:
|
•
|
$250 million of restricted cash collateral released to us in connection with the termination of our guarantee of a loan for a former joint venture as a result of the underlying loan being repaid, and
|
|
•
|
$
60 million
of previously restricted cash that was released to us as a result of our prepayment of the TECH credit facility in 2011.
|
Financing activities
Net cash used for financing activities was
$1,036 million
for 2011, which included
$1,215 million
of payments on debt,
$322 million
of payments on equipment purchase contracts,
$225 million
of distributions to joint venture partners partially offset by
$690 million
of proceeds from convertible debt offerings and
$268 million
of proceeds from equipment sale-leaseback financing transactions.
37
On
July 26, 2011
, we issued $
345 million
of
1.5%
Convertible Senior Notes due August 1, 2031 (the "2031A Notes") and $
345 million
of
1.875%
Convertible Senior Notes due
August 1, 2031
(the "2031B Notes" and together with the 2031A Notes the "2031 Notes") at face value. Issuance costs for the 2031 Notes totaled $18 million.
On July 26, 2011, concurrent with the offering of the 2031 Notes, we entered into capped call transactions (the "2011 Capped Calls") that have an initial strike price of approximately $9.50 per share, subject to certain adjustments, which was set to equal initial conversion price of the 2031 Notes.
On July 26, 2011, we paid $150 million to repurchase 19.7 million shares of common stock at $7.60 per share.
In the third quarter of 2011, we prepaid the remaining $250 million outstanding under our TECH subsidiary's credit facility.
On November 3, 2010, we completed the following series of debt restructure transactions in connection with separate privately negotiated agreements entered into on October 28, 2010 with certain holders of our convertible notes:
|
•
|
Repurchased $176 million in aggregate principal amount of our 1.875% Convertible Senior Notes due 2014 (the "2014 Notes") for $171 million in cash.
|
|
•
|
Repurchased $91 million in aggregate principal amount of our 4.25% Convertible Senior Notes due 2013 for $166 million in cash.
|
|
•
|
Exchanged $175 million in aggregate principal amount of our 2014 Notes for $175 million in aggregate principal amount of the 1.875% Convertible Senior Notes due 2027 (the"2027 Notes"). Holders of the 2027 Notes have an option to require us to purchase the 2027 Notes on June 1, 2017, and in certain other circumstances, at a price equal to 100 percent of the principal amount of the 2027 Notes plus accrued and unpaid interest.
|
(See "Item 1. Financial Statements - Notes to Consolidated Financial Statements - Debt" and "Item 1. Financial Statements - Notes to Consolidated Financial Statements - Shareholders' Equity" notes.)
Joint ventures
In 2011, IM Flash distributed $225 million to Intel. Timing of future distributions to Intel is subject to market conditions and availability of cash. In 2011, IM Flash began installing tools at its new 300mm wafer fabrication facility in Singapore. We made contributions to IM Flash of $1,580 million in 2011 and $103 million in September 2011, subsequent to 2011. Intel did not make any contributions to IM Flash in 2011 but contributed $131 million in September 2011. We expect to make additional significant contributions to IM Flash in future periods in connection with tool installations and the further ramp of production at the Singapore facility. The level of our future capital contributions to IM Flash will depend on market conditions and the extent to which Intel participates with us in future IM Flash capital calls.
In the second quarter of 2011, we acquired HP's and Canon's interests in our TECH subsidiary for an aggregate of $159 million and we became a 100% owner of TECH as a result of these transactions.
Contractual Obligations
The following table summarizes our significant contractual obligations as of September 1, 2011:
|
|
Total
|
Less than
1 year
|
1-3 years
|
3-5 years
|
More than
5 years
|
|||||||||||||||
|
Notes payable
(1)
|
$
|
2,136
|
|
$
|
39
|
|
$
|
1,163
|
|
$
|
30
|
|
$
|
904
|
|
|||||
|
Capital lease obligations
(1)
|
497
|
|
151
|
|
158
|
|
118
|
|
70
|
|
||||||||||
|
Operating leases
|
116
|
|
32
|
|
42
|
|
17
|
|
25
|
|
||||||||||
|
Purchase obligations
|
1,781
|
|
1,277
|
|
486
|
|
9
|
|
9
|
|
||||||||||
|
Other long-term liabilities
|
559
|
|
—
|
|
282
|
|
152
|
|
125
|
|
||||||||||
|
Total
|
$
|
5,089
|
|
$
|
1,499
|
|
$
|
2,131
|
|
$
|
326
|
|
$
|
1,133
|
|
|||||
|
(1)
Includes interest
|
|
|
|
|
|
|
|
|
|
|
||||||||||
38
The obligations disclosed above do not include contractual obligations recorded on our balance sheet as current liabilities except for the current portion of long-term debt. The expected timing of payment amounts of the obligations discussed above is estimated based on current information. Timing and actual amounts paid may differ depending on the timing of receipt of goods or services, market prices, changes to agreed-upon amounts or timing of certain events for some obligations.
Purchase obligations include all commitments to purchase goods or services of either a fixed or minimum quantity that meet any of the following criteria: (1) they are noncancellable, (2) we would incur a penalty if the agreement was canceled, or (3) we must make specified minimum payments even if it does not take delivery of the contracted products or services ("take-or-pay"). If the obligation to purchase goods or services is noncancellable, the entire value of the contract was included in the above table. If the obligation is cancellable, but we would incur a penalty if canceled, the dollar amount of the penalty was included as a purchase obligation. Contracted minimum amounts specified in take-or-pay contracts are also included in the above table as they represent the portion of each contract that is a firm commitment.
Pursuant to the Inotera Supply Agreement, we have an obligation to purchase 50% of Inotera’s semiconductor memory capacity subject to specific terms and conditions. As purchase quantities are based on qualified production output, the Inotera Supply Agreement does not contain a fixed or minimum purchase quantity and therefore we did not include our obligations under the Inotera Supply Agreement in the contractual obligations table above. Our obligation under the Inotera Supply Agreement also fluctuates due to pricing which is based on manufacturing costs and revenues associated with the resale of DRAM products. We purchased
$641 million
of DRAM products from Inotera in 2011 under the Inotera Supply Agreement.
Off-Balance Sheet Arrangements
Concurrent with the offering of the 2031 Notes on July 26, 2011, we entered into capped call transactions (the "2011 Capped Calls") that have an initial strike price of approximately $9.50 per share, subject to certain adjustments, which was set to the initial conversion price of the 2031 Notes. The 2011 Capped Calls are in four equal tranches, have cap prices of $11.40, $12.16, $12.67 and $13.17 per share, and cover, subject to anti-dilution adjustments similar to those contained in the 2031 Notes, an approximate combined total of 72.6 million shares of common stock. The 2011 Capped Calls expire on various dates between July 2014 and February 2016. The 2011 Capped Calls are intended to reduce the potential dilution upon conversion of the 2031 Notes.
Concurrent with the offering of the 4.25% Convertible Senior Notes due 2013 (the "2013 Notes") in April 2009, we paid approximately $25 million for three capped call instruments that have an initial strike price of approximately $5.08 per share (the "2009 Capped Calls"). The 2009 Capped Calls have a cap price of $6.64 per share and cover an aggregate of approximately 45.2 million shares of common stock. The 2009 Capped Calls expire in October and November of 2012. The 2009 Capped Calls are intended to reduce potential dilution upon conversion of the 2013 Notes.
Concurrent with the offering of the 2014 Notes in May 2007, we paid approximately $151 million for three Capped Call transactions (the "2007 Capped Calls"). The 2007 Capped Calls cover an aggregate of approximately 91.3 million shares of common stock. The 2007 Capped Calls are in three equal tranches with cap prices of $17.25, $20.13 and $23.00 per share, respectively, each with an initial strike price of approximately $14.23 per share, subject to certain adjustments. The 2007 Capped Calls expire on various dates between November 2011 and December 2012. The 2007 Capped Calls are intended to reduce potential dilution upon conversion of the 2014 Notes.
(See "Item 8. Financial Statements and Supplementary Data - Notes to Consolidated Financial Statements - Supplemental Balance Sheet Information - Shareholders' Equity - Capped Call Transactions" note.)
Critical Accounting Estimates
The preparation of financial statements and related disclosures in conformity with U.S. GAAP requires management to make estimates and judgments that affect the reported amounts of assets, liabilities, revenues, expenses and related disclosures. Estimates and judgments are based on historical experience, forecasted events and various other assumptions that we believe to be reasonable under the circumstances. Estimates and judgments may vary under different assumptions or conditions. We evaluate our estimates and judgments on an ongoing basis. Our management believes the accounting policies below are critical in the portrayal of our financial condition and results of operations and requires management's most difficult, subjective or complex judgments.
39
Business Acquisitions
:
Accounting for acquisitions requires us to estimate the fair value of consideration paid and the individual assets and liabilities acquired, which involves a number of judgments, assumptions and estimates that could materially affect the amount and timing of costs recognized. We typically obtain independent third party valuation studies to assist in determining fair values, including assistance in determining future cash flows, appropriate discount rates and comparable market values.
Consolidations
:
We have interests in joint venture entities that are Variable Interest Entities ("VIEs"). Determining whether to consolidate a VIE may require judgment in assessing (1) whether an entity is a VIE and (2) if we are the entity's primary beneficiary. To determine if we are the primary beneficiary of a VIE, we evaluate whether we have (1) the power to direct the activities that most significantly impact the VIE's economic performance and (2) the obligation to absorb losses or the right to receive benefits of the VIE that could potentially be significant to the VIE. Our evaluation includes identification of significant activities and an assessment of our ability to direct those activities based on governance provisions and arrangements to provide or receive product and process technology, product supply, operations services, equity funding and financing and other applicable agreements and circumstances. Our assessment of whether we are the primary beneficiary of our VIEs requires significant assumptions and judgment.
Contingencies
:
We are subject to the possibility of losses from various contingencies. Considerable judgment is necessary to estimate the probability and amount of any loss from such contingencies. An accrual is made when it is probable that a liability has been incurred or an asset has been impaired and the amount of loss can be reasonably estimated. We accrue a liability and charge operations for the estimated costs of adjudication or settlement of asserted and unasserted claims existing as of the balance sheet date.
Income Taxes
:
We are required to estimate our provision for income taxes and amounts ultimately payable or recoverable in numerous tax jurisdictions around the world. These estimates involve judgment and interpretations of regulations and are inherently complex. Resolution of income tax treatments in individual jurisdictions may not be known for many years after completion of any fiscal year. We are also required to evaluate the realizability of our deferred tax assets on an ongoing basis in accordance with U.S. GAAP, which requires the assessment of our performance and other relevant factors. Realization of deferred tax assets is dependent on our ability to generate future taxable income.
Inventories
:
Inventories are stated at the lower of average cost or market value and we recorded charges of $603 million in aggregate for 2009 and $282 million in aggregate for 2008 to write down the carrying value of inventories of memory products to their estimated market values. Cost includes labor, material and overhead costs, including product and process technology costs. Determining market value of inventories involves numerous judgments, including projecting average selling prices and sales volumes for future periods and costs to complete products in work in process inventories. To project average selling prices and sales volumes, we review recent sales volumes, existing customer orders, current contract prices, industry analysis of supply and demand, seasonal factors, general economic trends and other information. When these analyses reflect estimated market values below our manufacturing costs, we record a charge to cost of goods sold in advance of when the inventory is actually sold. Differences in forecasted average selling prices used in calculating lower of cost or market adjustments can result in significant changes in the estimated net realizable value of product inventories and accordingly the amount of write-down recorded. For example, a 5% variance in the estimated selling prices would have changed the estimated market value of our memory inventory by approximately $143 million at September 1, 2011. Due to the volatile nature of the semiconductor memory industry, actual selling prices and volumes often vary significantly from projected prices and volumes and, as a result, the timing of when product costs are charged to operations can vary significantly.
U.S. GAAP provides for products to be grouped into categories in order to compare costs to market values. The amount of any inventory write-down can vary significantly depending on the determination of inventory categories. Our inventories have been categorized as memory, imaging and microdisplay products. The major characteristics we consider in determining inventory categories are product type and markets.
Property, Plant and Equipment
:
We review the carrying value of property, plant and equipment for impairment when events and circumstances indicate that the carrying value of an asset or group of assets may not be recoverable from the estimated future cash flows expected to result from its use and/or disposition. In cases where undiscounted expected future cash flows are less than the carrying value, an impairment loss is recognized equal to the amount by which the carrying value exceeds the estimated fair value of the assets. The estimation of future cash flows involves numerous assumptions which require judgment by us, include, but are not limited to, future use of the assets for our operations versus sale or disposal of the assets, future selling prices for our products and future production and sales volumes. In addition, judgment is required by us in determining the groups of assets for which impairment tests are separately performed.
40
Research and Development
:
Costs related to the conceptual formulation and design of products and processes are expensed as research and development as incurred. Determining when product development is complete requires judgment by us. We deem development of a product complete once the product has been thoroughly reviewed and tested for performance and reliability. Subsequent to product qualification, product costs are valued in inventory.
Stock-based Compensation
:
Compensation cost for stock-based compensation is estimated at the grant date based on the fair-value of the award and is recognized as expense ratably over the requisite service period of the award. For stock-based compensation awards with graded vesting that were granted after 2005, we recognize compensation expense using the straight-line amortization method. For performance-based stock awards, the expense recognized is dependent on the probability of the performance measure being achieved. We utilize forecasts of future performance to assess these probabilities and this assessment requires considerable judgment.
Determining the appropriate fair-value model and calculating the fair value of stock-based awards at the grant date requires considerable judgment, including estimating stock price volatility, expected option life and forfeiture rates. We develop these estimates based on historical data and market information which can change significantly over time. A small change in the estimates used can result in a relatively large change in the estimated valuation. We use the Black-Scholes option valuation model to value employee stock awards. We estimate stock price volatility based on an average of its historical volatility and the implied volatility derived from traded options on our stock.
Recently Adopted Accounting Standards
In June 2009, the Financial Accounting Standards Board ("FASB") issued a new accounting standard on variable interest entities ("VIEs") which (1) replaces the quantitative-based risks and rewards calculation for determining whether an enterprise is the primary beneficiary in a VIE with an approach that is primarily qualitative, (2) requires ongoing assessments of whether an enterprise is the primary beneficiary of a VIE and (3) requires additional disclosures about an enterprise's involvement in VIE. We adopted this standard as of the beginning of 2011. The initial adoption of this standard did not have a significant impact on our financial statements as of the adoption date. The impact on future periods will depend on changes in the nature and composition of our VIEs.
Recently Issued Accounting Standards
In May 2011, the FASB issued a new accounting standard on fair value measurements that clarifies the application of existing guidance and disclosure requirements, changes certain fair value measurement principles and requires additional disclosures about fair value measurements. We are required to adopt this standard in the third quarter of 2012. We do not expect this adoption to have a material impact on our financial statements.
In June 2011, the FASB issued a new accounting standard on the presentation of comprehensive income. The new standard requires the presentation of comprehensive income, the components of net income and the components of other comprehensive income either in a single continuous statement of comprehensive income or in two separate but consecutive statements. The new standard also requires presentation of adjustments for items that are reclassified from other comprehensive income to net income in the statement where the components of net income and the components of other comprehensive income are presented. We are required to adopt this standard as of the beginning of 2013. The adoption of this standard will only impact the presentation of our financial statements.
41
Interest Rate Risk
As of
September 1, 2011
, $
1,950 million
of our $
2,001 million
of debt was at fixed interest rates. As a result, the fair value fluctuates based on changes in market interest rates. The estimated fair value of our debt was $
2,281 million
as of
September 1, 2011
and $
2,565 million
as of
September 2, 2010
. We estimate that, as of
September 1, 2011
, a 1% decrease in market interest rates would change the fair value of our fixed-rate debt instruments by approximately $
59 million
. As of
September 1, 2011
, $
51 million
of the debt had variable interest rates and a 1% increase in the rates would increase annual interest expense by approximately $
1 million
.
Foreign Currency Exchange Rate Risk
The information in this section should be read in conjunction with the information related to changes in the exchange rates of foreign currency in "Item 1A. Risk Factors." Changes in foreign currency exchange rates could materially adversely affect our results of operations or financial condition.
The functional currency for substantially all of our operations is the U.S. dollar. We held cash and other assets in foreign currencies valued at an aggregate of U.S. $
512 million
as of
September 1, 2011
and U.S. $
504 million
as of
September 2, 2010
. We also had foreign currency liabilities valued at an aggregate of U.S. $
944 million
as of
September 1, 2011
, and U.S. $
901 million
as of
September 2, 2010
. Because the substantial majority of our sales are denominated in U.S. dollar, we do not have significant natural hedges to offset our expenditures denominated in other currencies. Significant components of assets and liabilities denominated in currencies other than the U.S. dollar (our reporting currency) were as follows (in U.S. dollar equivalents):
|
|
2011
|
2010
|
||||||||||||||||||||||||||||||
|
|
Singapore Dollars
|
Yen
|
Euro
|
Other
|
Singapore Dollars
|
Yen
|
Euro
|
Other
|
||||||||||||||||||||||||
|
|
(amounts in millions)
|
|||||||||||||||||||||||||||||||
|
Cash and cash equivalents
|
$
|
22
|
|
$
|
4
|
|
$
|
33
|
|
$
|
21
|
|
$
|
27
|
|
$
|
27
|
|
$
|
53
|
|
$
|
19
|
|
||||||||
|
Receivables
|
92
|
|
25
|
|
72
|
|
18
|
|
52
|
|
15
|
|
77
|
|
23
|
|
||||||||||||||||
|
Deferred tax assets
|
—
|
|
39
|
|
7
|
|
1
|
|
—
|
|
115
|
|
6
|
|
1
|
|
||||||||||||||||
|
Other assets
|
12
|
|
16
|
|
88
|
|
62
|
|
9
|
|
13
|
|
66
|
|
1
|
|
||||||||||||||||
|
Accounts payable and accrued expenses
|
(124
|
)
|
(194
|
)
|
(240
|
)
|
(44
|
)
|
(158
|
)
|
(186
|
)
|
(168
|
)
|
(45
|
)
|
||||||||||||||||
|
Debt
|
(81
|
)
|
—
|
|
(3
|
)
|
(3
|
)
|
(78
|
)
|
(9
|
)
|
(61
|
)
|
—
|
|
||||||||||||||||
|
Other liabilities
|
(15
|
)
|
(8
|
)
|
(128
|
)
|
(104
|
)
|
(14
|
)
|
(75
|
)
|
(100
|
)
|
(7
|
)
|
||||||||||||||||
|
Net assets (liabilities)
|
$
|
(94
|
)
|
$
|
(118
|
)
|
$
|
(171
|
)
|
$
|
(49
|
)
|
$
|
(162
|
)
|
$
|
(100
|
)
|
$
|
(127
|
)
|
$
|
(8
|
)
|
||||||||
We estimate that, based on the assets and liabilities denominated in currencies other than the U.S. dollar as of
September 1, 2011
, a 1% change in the exchange rate versus the U.S. dollar, resulting in currency gains or losses of approximately U.S. $
2 million
for the
euro
and $
1 million
for the
yen
and
Singapore dollar
. During 2010, we began using derivative instruments to hedge our foreign currency exchange rate risk. (See "Item 8. Financial Statements and Supplementary Data – Notes to Consolidated Financial Statements – Derivative Financial Instruments" note.)
42
Index to Consolidated Financial Statements
|
|
Page
|
|
|
|
|
Consolidated Financial Statements as of September 1, 2011 and September 2, 2010 and for the fiscal years ended September 1, 2011, September 2, 2010 and September 3, 2009:
|
|
|
|
|
|
Consolidated Statements of Operations
|
|
|
|
|
|
Consolidated Balance Sheets
|
|
|
|
|
|
Consolidated Statements of Changes in Equity
|
|
|
|
|
|
Consolidated Statements of Cash Flows
|
|
|
|
|
|
Notes to Consolidated Financial Statements
|
|
|
|
|
|
Report of Independent Registered Public Accounting Firm
|
|
|
|
|
|
Financial Statement Schedule:
|
|
|
|
|
|
Schedule II – Valuation and Qualifying Accounts
|
|
43
MICRON TECHNOLOGY, INC.
(in millions except per share amounts)
|
For the year ended
|
September 1,
2011 |
September 2,
2010 |
September 3,
2009 |
|||||||||
|
Net sales
|
$
|
8,788
|
|
$
|
8,482
|
|
$
|
4,803
|
|
|||
|
Cost of goods sold
|
7,030
|
|
5,768
|
|
5,243
|
|
||||||
|
Gross margin
|
1,758
|
|
2,714
|
|
(440
|
)
|
||||||
|
Selling, general and administrative
|
592
|
|
528
|
|
354
|
|
||||||
|
Research and development
|
791
|
|
624
|
|
647
|
|
||||||
|
Other operating (income) expense, net
|
(380
|
)
|
(27
|
)
|
235
|
|
||||||
|
Operating income (loss)
|
755
|
|
1,589
|
|
(1,676
|
)
|
||||||
|
Gain on acquisition of Numonyx
|
—
|
|
437
|
|
—
|
|
||||||
|
Interest income
|
23
|
|
18
|
|
22
|
|
||||||
|
Interest expense
|
(124
|
)
|
(178
|
)
|
(182
|
)
|
||||||
|
Other non-operating income (expense), net
|
(103
|
)
|
54
|
|
(16
|
)
|
||||||
|
|
551
|
|
1,920
|
|
(1,852
|
)
|
||||||
|
Income tax (provision) benefit
|
(203
|
)
|
19
|
|
(1
|
)
|
||||||
|
Equity in net income (loss) of equity method investees, net of tax
|
(158
|
)
|
(39
|
)
|
(140
|
)
|
||||||
|
Net income (loss)
|
190
|
|
1,900
|
|
(1,993
|
)
|
||||||
|
Net (income) loss attributable to noncontrolling interests
|
(23
|
)
|
(50
|
)
|
111
|
|
||||||
|
Net income (loss) attributable to Micron
|
$
|
167
|
|
$
|
1,850
|
|
$
|
(1,882
|
)
|
|||
|
Earnings (loss) per share:
|
|
|
|
|
||||||||
|
Basic
|
$
|
0.17
|
|
$
|
2.09
|
|
$
|
(2.35
|
)
|
|||
|
Diluted
|
0.17
|
|
1.85
|
|
(2.35
|
)
|
||||||
|
Number of shares used in per share calculations:
|
|
|
|
|
||||||||
|
Basic
|
988.0
|
|
887.5
|
|
800.7
|
|
||||||
|
Diluted
|
1,007.5
|
|
1,050.7
|
|
800.7
|
|
||||||
See accompanying notes to consolidated financial statements.
44
MICRON TECHNOLOGY, INC.
(in millions except par value amounts)
|
As of
|
September 1,
2011 |
September 2,
2010 |
||||||
|
Assets
|
|
|
||||||
|
Cash and equivalents
|
$
|
2,160
|
|
$
|
2,913
|
|
||
|
Receivables
|
1,497
|
|
1,531
|
|
||||
|
Inventories
|
2,080
|
|
1,770
|
|
||||
|
Other current assets
|
95
|
|
119
|
|
||||
|
Total current assets
|
5,832
|
|
6,333
|
|
||||
|
Intangible assets, net
|
414
|
|
323
|
|
||||
|
Property, plant and equipment, net
|
7,555
|
|
6,601
|
|
||||
|
Equity method investments
|
483
|
|
582
|
|
||||
|
Restricted cash
|
8
|
|
335
|
|
||||
|
Other noncurrent assets
|
460
|
|
519
|
|
||||
|
Total assets
|
$
|
14,752
|
|
$
|
14,693
|
|
||
|
Liabilities and equity
|
|
|
|
|
||||
|
Accounts payable and accrued expenses
|
$
|
1,830
|
|
$
|
1,509
|
|
||
|
Deferred income
|
443
|
|
298
|
|
||||
|
Equipment purchase contracts
|
67
|
|
183
|
|
||||
|
Current portion of long-term debt
|
140
|
|
712
|
|
||||
|
Total current liabilities
|
2,480
|
|
2,702
|
|
||||
|
Long-term debt
|
1,861
|
|
1,648
|
|
||||
|
Other noncurrent liabilities
|
559
|
|
527
|
|
||||
|
Total liabilities
|
4,900
|
|
4,877
|
|
||||
|
Commitments and contingencies
|
|
|
|
|
||||
|
Micron shareholders' equity:
|
|
|
|
|
||||
|
Common stock, $0.10 par value, 3,000 shares authorized, 984.3 shares issued and outstanding (994.5 as of September 2, 2010)
|
98
|
|
99
|
|
||||
|
Additional capital
|
8,610
|
|
8,446
|
|
||||
|
Accumulated deficit
|
(370
|
)
|
(536
|
)
|
||||
|
Accumulated other comprehensive income
|
132
|
|
11
|
|
||||
|
Total Micron shareholders' equity
|
8,470
|
|
8,020
|
|
||||
|
Noncontrolling interests in subsidiaries
|
1,382
|
|
1,796
|
|
||||
|
Total equity
|
9,852
|
|
9,816
|
|
||||
|
Total liabilities and equity
|
$
|
14,752
|
|
$
|
14,693
|
|
||
See accompanying notes to consolidated financial statements.
45
MICRON TECHNOLOGY, INC.
CONSOLIDATED STATEMENTS OF CHANGES IN EQUITY
(in millions)
|
|
Micron Shareholders
|
|
|
|||||||||||||||||||||||||||||
|
|
Common Stock
|
Additional Capital
|
Accumulated Deficit
|
Accumulated Other Comprehensive
Income (Loss)
|
Total Micron Shareholders' Equity
|
Noncontrolling Interests in Subsidiaries
|
Total Equity
|
|||||||||||||||||||||||||
|
|
Number
of Shares
|
Amount
|
||||||||||||||||||||||||||||||
|
Balance at August 28, 2008
|
761.1
|
|
$
|
76
|
|
$
|
6,960
|
|
$
|
(503
|
)
|
$
|
(8
|
)
|
$
|
6,525
|
|
$
|
2,865
|
|
$
|
9,390
|
|
|||||||||
|
Comprehensive income (loss):
|
|
|
|
|
|
|
|
|
|
|
|
|
|
|
|
|
||||||||||||||||
|
Net loss
|
(1,882
|
)
|
(1,882
|
)
|
(111
|
)
|
(1,993
|
)
|
||||||||||||||||||||||||
|
Other comprehensive income (loss):
|
||||||||||||||||||||||||||||||||
|
Net unrealized gain (loss) on investments, net of tax
|
|
|
|
|
|
|
|
|
12
|
|
12
|
|
|
|
12
|
|
||||||||||||||||
|
Pension liability adjustment, net of tax
|
|
|
|
|
|
|
|
|
1
|
|
1
|
|
|
|
1
|
|
||||||||||||||||
|
Net gain (loss) on foreign currency translation adjustment, net of tax
|
|
|
|
|
|
|
|
|
(9
|
)
|
(9
|
)
|
|
|
(9
|
)
|
||||||||||||||||
|
Total comprehensive income (loss)
|
|
|
|
|
|
|
|
|
|
|
(1,878
|
)
|
(111
|
)
|
(1,989
|
)
|
||||||||||||||||
|
Issuance of common stock
|
69.3
|
|
7
|
|
269
|
|
|
|
|
|
276
|
|
|
|
276
|
|
||||||||||||||||
|
Stock-based compensation expense
|
|
|
|
|
44
|
|
|
|
|
|
44
|
|
|
|
44
|
|
||||||||||||||||
|
Stock issued for business acquisition
|
1.8
|
|
|
|
12
|
|
|
|
|
|
12
|
|
|
|
12
|
|
||||||||||||||||
|
Stock issued under stock plans
|
4.0
|
|
1
|
|
|
|
|
|
|
|
1
|
|
|
|
1
|
|
||||||||||||||||
|
Distributions to noncontrolling interests, net
|
|
|
|
|
|
|
|
|
|
|
—
|
|
(681
|
)
|
(681
|
)
|
||||||||||||||||
|
Acquisition of noncontrolling interests in TECH
|
|
|
|
|
|
|
|
|
|
|
—
|
|
(87
|
)
|
(87
|
)
|
||||||||||||||||
|
Purchase of capped calls
|
|
|
|
|
(25
|
)
|
|
|
|
|
(25
|
)
|
|
|
(25
|
)
|
||||||||||||||||
|
Repurchase and retirement of common stock
|
(0.5
|
)
|
|
|
(2
|
)
|
|
|
|
|
(2
|
)
|
|
|
(2
|
)
|
||||||||||||||||
|
Exercise of stock rights held by Intel
|
13.0
|
|
1
|
|
(1
|
)
|
|
|
|
|
—
|
|
|
|
—
|
|
||||||||||||||||
|
Balance at September 3, 2009
|
848.7
|
|
$
|
85
|
|
$
|
7,257
|
|
$
|
(2,385
|
)
|
$
|
(4
|
)
|
$
|
4,953
|
|
$
|
1,986
|
|
$
|
6,939
|
|
|||||||||
|
Comprehensive income (loss):
|
|
|
|
|
|
|
|
|
|
|
|
|
|
|
|
|
||||||||||||||||
|
Net income
|
|
|
|
|
|
|
1,850
|
|
|
|
1,850
|
|
50
|
|
1,900
|
|
||||||||||||||||
|
Other comprehensive income (loss):
|
||||||||||||||||||||||||||||||||
|
Net gain (loss) on foreign currency translation adjustment, net of tax
|
|
|
|
|
|
|
|
|
11
|
|
11
|
|
|
|
11
|
|
||||||||||||||||
|
Net unrealized gain (loss) on investments, net of tax
|
|
|
|
|
|
|
|
|
5
|
|
5
|
|
|
|
5
|
|
||||||||||||||||
|
Net gain (loss) on derivatives, net of tax
|
|
|
|
|
|
|
|
|
1
|
|
1
|
|
(1
|
)
|
—
|
|
||||||||||||||||
|
Pension liability adjustment, net of tax
|
|
|
|
|
|
|
|
|
(2
|
)
|
(2
|
)
|
|
|
(2
|
)
|
||||||||||||||||
|
Total comprehensive income (loss):
|
|
|
|
|
|
|
|
|
|
|
1,865
|
|
49
|
|
1,914
|
|
||||||||||||||||
|
Stock issued in acquisition of Numonyx
|
137.7
|
|
14
|
|
1,098
|
|
|
|
|
|
1,112
|
|
|
|
1,112
|
|
||||||||||||||||
|
Stock-based compensation expense
|
|
|
|
|
93
|
|
|
|
|
|
93
|
|
|
|
93
|
|
||||||||||||||||
|
Stock issued under stock plans
|
6.6
|
|
|
|
8
|
|
|
|
|
|
8
|
|
|
|
8
|
|
||||||||||||||||
|
Distributions to noncontrolling interests, net
|
|
|
|
|
|
|
|
|
|
|
—
|
|
(229
|
)
|
(229
|
)
|
||||||||||||||||
|
Repurchase and retirement of common stock
|
(2.4
|
)
|
|
|
(20
|
)
|
(1
|
)
|
|
|
(21
|
)
|
|
|
(21
|
)
|
||||||||||||||||
|
Exercise of stock rights held by Intel
|
3.9
|
|
|
|
|
|
|
|
|
|
—
|
|
|
|
—
|
|
||||||||||||||||
|
Acquisition of noncontrolling interests in TECH
|
|
|
|
|
10
|
|
|
|
|
|
10
|
|
(10
|
)
|
—
|
|
||||||||||||||||
|
Balance at September 2, 2010
|
994.5
|
|
$
|
99
|
|
$
|
8,446
|
|
$
|
(536
|
)
|
$
|
11
|
|
$
|
8,020
|
|
$
|
1,796
|
|
$
|
9,816
|
|
|||||||||
|
Comprehensive income (loss):
|
|
|
|
|
|
|
|
|
|
|
|
|
|
|
|
|
||||||||||||||||
|
Net income
|
|
|
|
|
|
|
167
|
|
|
|
167
|
|
23
|
|
190
|
|
||||||||||||||||
|
Other comprehensive income (loss):
|
||||||||||||||||||||||||||||||||
|
Net gain (loss) on foreign currency translation adjustment, net of tax
|
|
|
|
|
|
|
|
|
63
|
|
63
|
|
|
|
63
|
|
||||||||||||||||
|
Net gain (loss) on derivatives, net of tax
|
|
|
|
|
|
|
|
|
42
|
|
42
|
|
6
|
|
48
|
|
||||||||||||||||
|
Net unrealized gain (loss) on investments, net of tax
|
|
|
|
|
|
|
|
|
11
|
|
11
|
|
|
|
11
|
|
||||||||||||||||
|
Pension liability adjustment, net of tax
|
|
|
|
|
|
|
|
|
5
|
|
5
|
|
|
|
5
|
|
||||||||||||||||
|
Total comprehensive income (loss):
|
|
|
|
|
|
|
|
|
|
|
288
|
|
29
|
|
317
|
|
||||||||||||||||
|
Issuance and repurchase of convertible debts
|
|
|
|
|
211
|
|
|
|
|
|
211
|
|
|
|
211
|
|
||||||||||||||||
|
Stock-based compensation expense
|
|
|
|
|
76
|
|
|
|
|
|
76
|
|
|
|
76
|
|
||||||||||||||||
|
Stock issued under stock plans
|
11.1
|
|
1
|
|
27
|
|
|
|
|
|
28
|
|
|
|
28
|
|
||||||||||||||||
|
Distributions to noncontrolling interests, net
|
|
|
|
|
|
|
|
|
|
|
—
|
|
(217
|
)
|
(217
|
)
|
||||||||||||||||
|
Repurchase and retirement of common stock
|
(21.3
|
)
|
(2
|
)
|
(160
|
)
|
(1
|
)
|
|
|
(163
|
)
|
|
|
(163
|
)
|
||||||||||||||||
|
Acquisition of noncontrolling interests in TECH
|
|
|
|
|
67
|
|
|
|
|
|
67
|
|
(226
|
)
|
(159
|
)
|
||||||||||||||||
|
Purchase of capped calls
|
|
|
|
|
(57
|
)
|
|
|
|
|
(57
|
)
|
|
|
(57
|
)
|
||||||||||||||||
|
Balance at September 1, 2011
|
984.3
|
|
$
|
98
|
|
$
|
8,610
|
|
$
|
(370
|
)
|
$
|
132
|
|
$
|
8,470
|
|
$
|
1,382
|
|
$
|
9,852
|
|
|||||||||
See accompanying notes to consolidated financial statements.
46
MICRON TECHNOLOGY, INC.
(in millions)
|
For the year ended
|
September 1,
2011 |
September 2,
2010 |
September 3,
2009 |
|||||||||
|
Cash flows from operating activities
|
|
|
|
|||||||||
|
Net income (loss)
|
$
|
190
|
|
$
|
1,900
|
|
$
|
(1,993
|
)
|
|||
|
Adjustments to reconcile net income (loss) to net cash provided by operating activities:
|
|
|
|
|
||||||||
|
Depreciation expense and amortization of intangible assets
|
2,105
|
|
1,922
|
|
2,114
|
|
||||||
|
Amortization of debt discount and other costs
|
57
|
|
83
|
|
72
|
|
||||||
|
Equity in net losses of equity method investees, net of tax
|
158
|
|
39
|
|
140
|
|
||||||
|
Loss on extinguishment of debt
|
113
|
|
—
|
|
—
|
|
||||||
|
Stock-based compensation
|
76
|
|
93
|
|
44
|
|
||||||
|
Provision to write-down inventories to estimated market values
|
9
|
|
27
|
|
603
|
|
||||||
|
Gain from disposition of Japan Fab
|
(54
|
)
|
—
|
|
—
|
|
||||||
|
Restructure charges (credits)
|
(32
|
)
|
(17
|
)
|
156
|
|
||||||
|
(Gain) loss from disposition of property, plant and equipment
|
(17
|
)
|
(1
|
)
|
54
|
|
||||||
|
Gain from acquisition of Numonyx
|
—
|
|
(437
|
)
|
—
|
|
||||||
|
Gain from Inotera and Hynix JV stock issuances, net
|
—
|
|
(52
|
)
|
—
|
|
||||||
|
Change in operating assets and liabilities:
|
|
|
|
|
||||||||
|
Receivables
|
54
|
|
(516
|
)
|
126
|
|
||||||
|
Inventories
|
(357
|
)
|
(121
|
)
|
(356
|
)
|
||||||
|
Accounts payable and accrued expenses
|
(84
|
)
|
54
|
|
44
|
|
||||||
|
Deferred income
|
146
|
|
84
|
|
81
|
|
||||||
|
Deferred income taxes, net
|
103
|
|
(45
|
)
|
(15
|
)
|
||||||
|
Other
|
17
|
|
83
|
|
136
|
|
||||||
|
Net cash provided by operating activities
|
2,484
|
|
3,096
|
|
1,206
|
|
||||||
|
Cash flows from investing activities
|
|
|
|
|
||||||||
|
Expenditures for property, plant and equipment
|
(2,550
|
)
|
(616
|
)
|
(488
|
)
|
||||||
|
Acquisition of noncontrolling interests in TECH
|
(159
|
)
|
—
|
|
—
|
|
||||||
|
Additions to equity method investments
|
(31
|
)
|
(165
|
)
|
(408
|
)
|
||||||
|
Decrease (increase) in restricted cash
|
330
|
|
(240
|
)
|
(56
|
)
|
||||||
|
Proceeds from sales of property, plant and equipment
|
127
|
|
94
|
|
26
|
|
||||||
|
Return of equity method investment
|
48
|
|
—
|
|
41
|
|
||||||
|
Proceeds from sale of interest in Hynix JV
|
—
|
|
423
|
|
—
|
|
||||||
|
Cash acquired from acquisition of Numonyx
|
—
|
|
95
|
|
—
|
|
||||||
|
Proceeds from maturities of available-for-sale securities
|
—
|
|
—
|
|
130
|
|
||||||
|
Other
|
34
|
|
(39
|
)
|
81
|
|
||||||
|
Net cash used for investing activities
|
(2,201
|
)
|
(448
|
)
|
(674
|
)
|
||||||
|
Cash flows from financing activities
|
|
|
|
|
||||||||
|
Repayments of debt
|
(1,215
|
)
|
(840
|
)
|
(429
|
)
|
||||||
|
Payments on equipment purchase contracts
|
(322
|
)
|
(330
|
)
|
(144
|
)
|
||||||
|
Distributions to noncontrolling interests
|
(225
|
)
|
(267
|
)
|
(705
|
)
|
||||||
|
Cash paid to purchase common stock
|
(163
|
)
|
(21
|
)
|
(2
|
)
|
||||||
|
Cash paid to purchase capped calls
|
(57
|
)
|
—
|
|
(25
|
)
|
||||||
|
Proceeds from debt
|
690
|
|
200
|
|
716
|
|
||||||
|
Proceeds from equipment sale-leaseback transactions
|
268
|
|
—
|
|
4
|
|
||||||
|
Proceeds from issuance of common stock
|
28
|
|
8
|
|
277
|
|
||||||
|
Cash received from noncontrolling interests
|
8
|
|
38
|
|
24
|
|
||||||
|
Other
|
(48
|
)
|
(8
|
)
|
(6
|
)
|
||||||
|
Net cash used for financing activities
|
(1,036
|
)
|
(1,220
|
)
|
(290
|
)
|
||||||
|
Net increase (decrease) in cash and equivalents
|
(753
|
)
|
1,428
|
|
242
|
|
||||||
|
Cash and equivalents at beginning of period
|
2,913
|
|
1,485
|
|
1,243
|
|
||||||
|
Cash and equivalents at end of period
|
$
|
2,160
|
|
$
|
2,913
|
|
$
|
1,485
|
|
|||
|
Supplemental disclosures
|
|
|
|
|
||||||||
|
Income taxes refunded (paid), net
|
$
|
(99
|
)
|
$
|
2
|
|
$
|
(43
|
)
|
|||
|
Interest paid, net of amounts capitalized
|
(59
|
)
|
(95
|
)
|
(107
|
)
|
||||||
|
Noncash investing and financing activities:
|
|
|
|
|
|
|
||||||
|
Equipment acquisitions on contracts payable and capital leases
|
469
|
|
420
|
|
331
|
|
||||||
|
Exchange of convertible notes
|
175
|
|
—
|
|
—
|
|
||||||
|
Stock and restricted stock units issued in acquisition of Numonyx
|
—
|
|
1,112
|
|
—
|
|
||||||
|
Acquisition of interest in Transform
|
—
|
|
65
|
|
—
|
|
||||||
47
MICRON TECHNOLOGY, INC.
NOTES TO CONSOLIDATED FINANCIAL STATEMENTS
(All tabular amounts in millions except per share amounts)
Significant Accounting Policies
Basis of presentation
:
We are a global manufacturer and marketer of semiconductor devices, principally DRAM, NAND Flash and NOR Flash memory, as well as other innovative memory technologies, packaging solutions and semiconductor systems for use in leading-edge computing, consumer, networking, embedded and mobile products. In addition, we manufacture CMOS image sensors and other semiconductor products. The accompanying consolidated financial statements include the accounts of Micron Technology, Inc. and its consolidated subsidiaries and have been prepared in accordance with accounting principles generally accepted in the United States of America. Certain reclassifications have been made to prior period amounts to conform to current period presentation.
Our fiscal year is the 52 or 53-week period ending on the Thursday closest to August 31. Our fiscal 2011 and 2010 contained 52 weeks and our fiscal 2009 contained 53 weeks. All period references are to our fiscal periods unless otherwise indicated.
Use of estimates
:
The preparation of financial statements and related disclosures in conformity with accounting principles generally accepted in the United States of America requires our management to make estimates and judgments that affect the reported amounts of assets, liabilities, revenues, expenses and related disclosures. Estimates and judgments are based on historical experience, forecasted events and various other assumptions that we believe to be reasonable under the circumstances. Estimates and judgments may differ under different assumptions or conditions. We evaluate our estimates and judgments on an ongoing basis. Actual results could differ from estimates.
Product warranty
:
We generally provide a limited warranty that our products are in compliance with our specifications existing at the time of delivery. Under our general terms and conditions of sale, liability for certain failures of product during a stated warranty period is usually limited to repair or replacement of defective items or return of, or a credit with respect to, amounts paid for such items. Under certain circumstances, we provide more extensive limited warranty coverage than that provided under our general terms and conditions. Our warranty obligations are not material.
Revenue recognition
:
We recognize product or license revenue when persuasive evidence that a sales arrangement exists, delivery has occurred, the price is fixed or determinable and collectibility is reasonably assured. Since we are unable to estimate returns and changes in market price, and therefore the price is not fixed or determinable, sales made under agreements allowing pricing protection or rights of return (other than for product warranty) are deferred until customers have resold the product.
Research and development
:
Costs related to the conceptual formulation and design of products and processes are expensed as research and development as incurred. Determining when product development is complete requires judgment. Development of a product is deemed complete once the product has been thoroughly reviewed and tested for performance and reliability. Subsequent to product qualification, product costs are valued in inventory. Product design and other research and development costs for NAND Flash and DRAM are shared with our joint venture partners. Amounts receivable from these cost-sharing arrangements are reflected as a reduction of research and development expense. (See "Equity Method Investments" and "Consolidated Variable Interest Entities – NAND Flash joint ventures with Intel" notes.)
Stock-based compensation
:
Stock-based compensation is measured at the grant date, based on the fair value of the award, and is recognized as expense under the straight-line attribution method over the requisite service period. We issue new shares upon the exercise of stock options or conversion of share units. (See "Equity Plans" note.)
Stock repurchases
:
When we repurchase and retire our common stock, any excess of the repurchase price paid over par value is allocated between paid-in capital and retained earnings.
Functional currency
:
The U.S. dollar is the functional currency for all of our consolidated operations.
48
Financial instruments
:
Cash equivalents include highly liquid short-term investments with original maturities to us of three months or less, readily convertible to known amounts of cash. Investments with original maturities greater than three months and remaining maturities less than one year are included in short-term investments. Investments with remaining maturities greater than one year are included in other noncurrent assets. Securities classified as available-for-sale are stated at market value. The carrying value of investment securities sold is determined using the specific identification method.
Derivative and hedging instruments
:
We use derivative financial instruments, primarily forward contracts, to manage exposures to fluctuating currency exchange rates. We do not use financial instruments for trading or speculative purposes. Derivative instruments are measured at their fair values and recognized as either assets or liabilities.
We use forward contracts not designated as hedging instruments to hedge our balance sheet exposures to fluctuations in currency exchange rates. The gain or loss associated with these contracts is recognized in other income (expense).
We use forward contracts designated as cash flow hedges to hedge certain forecasted capital expenditures. The effective portion of the gain or loss on these derivatives is included as a component of other comprehensive income (loss) in shareholders' equity. The amount in accumulated other comprehensive income (loss) for these cash flow hedges are reclassified into earnings in the same line items of the consolidated statements of operation and in the same periods in which the underlying transactions affect earnings. Effectiveness is measured by comparing the cumulative change in the fair value of the hedge contract with the cumulative change in the forecasted cash flows of the hedged item. Forward points are excluded in measuring effectiveness and spot rates are used to value both the hedge contract and the hedged item. Any ineffective or excluded portion of the gain or loss is included in other operating income (expense).
Inventories
:
Inventories are stated at the lower of average cost or market value. Cost includes labor, material and overhead costs, including product and process technology costs. Determining market values of inventories involves numerous judgments, including projecting average selling prices and sales volumes for future periods and costs to complete products in work in process inventories. When market values are below costs, we record a charge to cost of goods sold to write down inventories to their estimated market value in advance of when the inventories are actually sold. Inventories are categorized as memory (primarily DRAM and NAND Flash and NOR Flash), imaging and microdisplay products for purposes of determining average cost and market value. The major characteristics considered in determining inventory categories are product type and markets.
Product and process technology
:
Costs incurred to acquire product and process technology or to patent technology are capitalized and amortized on a straight-line basis over periods ranging up to 10 years. We capitalize a portion of costs incurred based on the historical and projected patents issued as a percent of patents we file. Capitalized product and process technology costs are amortized over the shorter of (i) the estimated useful life of the technology, (ii) the patent term or (iii) the term of the technology agreement. Fully-amortized assets are removed from product and process technology and accumulated amortization.
Property, plant and equipment
:
Property, plant and equipment are stated at cost and depreciated using the straight-line method over estimated useful lives of 5 to 30 years for buildings, 2 to 20 years for equipment and 3 to 5 years for software. Assets held for sale are carried at the lower of cost or estimated fair value and are included in other noncurrent assets. When property or equipment is retired or otherwise disposed of, the net book value of the asset is removed and we recognize any gain or loss in our results of operations.
We capitalize interest on borrowings during the active construction period of major capital projects. Capitalized interest is added to the cost of the underlying assets and is amortized over the useful lives of the assets. We capitalized interest costs of
$12 million
,
$5 million
and
$5 million
in 2011, 2010 and 2009, respectively.
Recently Adopted Accounting Standards
In June 2009, the Financial Accounting Standards Board ("FASB") issued a new accounting standard on Variable Interest Entities ("VIEs") which (1) replaces the quantitative-based risks and rewards calculation for determining whether an enterprise is the primary beneficiary in a VIE with an approach that is primarily qualitative, (2) requires ongoing assessments of whether an enterprise is the primary beneficiary of a VIE and (3) requires additional disclosures about an enterprise's involvement in a VIE. We adopted this standard as of the beginning of 2011. The initial adoption of this standard did not have a significant impact on our financial statements as of the adoption date. The impact on future periods will depend on changes in the nature and composition of our VIEs.
49
Recently Issued Accounting Standards
In May 2011, the FASB issued a new accounting standard on fair value measurements that clarifies the application of existing guidance and disclosure requirements, changes certain fair value measurement principles and requires additional disclosures about fair value measurements. We are required to adopt this standard in the third quarter of 2012. We do not expect this adoption to have a material impact on our financial statements.
In June 2011, the FASB issued a new accounting standard on the presentation of comprehensive income. The new standard requires the presentation of comprehensive income, the components of net income and the components of other comprehensive income either in a single continuous statement of comprehensive income or in two separate but consecutive statements. The new standard also requires presentation of adjustments for items that are reclassified from other comprehensive income to net income in the statement where the components of net income and the components of other comprehensive income are presented. We are required to adopt this standard as of the beginning of 2013. The adoption of this standard will only impact the presentation of our financial statements.
Variable Interest Entities
We have interests in joint venture entities that are VIEs. If we are the primary beneficiary of the VIE, we are required to consolidate it. To determine if we are the primary beneficiary, we evaluate whether we have the power to direct the activities that most significantly impact the VIE's economic performance and the obligation to absorb losses or the right to receive benefits of the VIE that could potentially be significant to the VIE. Our evaluation includes identification of significant activities and an assessment of our ability to direct those activities based on governance provisions and arrangements to provide or receive product and process technology, product supply, operations services, equity funding, financing and other applicable agreements and circumstances. Our assessments of whether we are the primary beneficiary of our VIEs require significant assumptions and judgment. For further information regarding our VIEs that we account for under the equity method, see "Equity Method Investments" note. For further information regarding our consolidated VIEs, see "Consolidated Variable Interest Entities" note.
Unconsolidated Variable Interest Entities
Inotera and MeiYa
– Inotera Memories, Inc. ("Inotera") and MeiYa Technology Corporation ("MeiYa") are VIEs because of the terms of their supply agreements with us and our partner, Nanya Technology Corporation ("Nanya"). We have determined that we do not have power to direct the activities of Inotera and MeiYa that most significantly impact their economic performance, primarily due to (1) limitations on our governance rights that require the consent of other parties for key operating decisions and (2) our dependence on our joint venture partner for financing and the ability to operate in Taiwan. Therefore, we account for our interests in these entities under the equity method.
Transform
– Transform Solar Pty Ltd. ("Transform") is a VIE because its equity is not sufficient to permit Transform to finance its activities without additional subordinated financial support from us and our partner, Origin Energy Limited ("Origin"). We have determined that we do not have power to direct the activities of Transform that most significantly impacts its economic performance, primarily due to limitations on our governance rights that require the consent of Origin for key operating decisions. Therefore, we account for our interest in Transform under the equity method.
Consolidated Variable Interest Entities
IMFT and IMFS
– IM Flash Technologies, LLC ("IMFT") and IM Flash Singapore LLP ("IMFS") are both VIEs because all of their costs are passed to us and our partner, Intel Corporation ("Intel"), through product purchase agreements and they are dependent upon us and Intel for any additional cash requirements. For both IM Flash entities (i.e., IMFT and IMFS), we determined that we have the power to direct the activities of the entities that most significantly impact their economic performance. The primary activities of the IM Flash entities are driven by the constant introduction of product and process technology. Because we perform a significant majority of the technology development, we have the power to direct key activities of the entities. In addition, IMFT manufactures certain products exclusively for us using our technology. As a result of our
86%
ownership interest in IMFS as of September 1, 2011, we have significantly greater economic exposure than Intel. We also determined that we have the obligation to absorb losses and the right to receive benefits from the IM Flash entities that could potentially be significant to these entities. Therefore, we consolidate the IM Flash entities.
50
MP Mask
– MP Mask Technology Center, LLC ("MP Mask") is a VIE because all of its costs are passed to us and our partner, Photronics, Inc. ("Photronics"), through product purchase agreements and it is dependent upon us and Photronics for any additional cash requirements. We determined that we have the power to direct the activities of MP Mask that most significantly impact its economic performance, primarily due to (1) our tie-breaking voting rights over key operating decisions and (2) that nearly all key MP Mask activities are driven by our supply needs. We also determined that we have the obligation to absorb losses and the right to receive benefits from MP Mask that could potentially be significant to MP Mask. Therefore, we consolidate MP Mask.
Japan Fabrication Facility
On June 2, 2011, we sold our wafer fabrication facility in Japan (the "Japan Fab") to Tower Semiconductor Ltd. ("Tower"). Under the arrangement, Tower paid $
40 million
in cash and approximately
20 million
of ordinary shares of Tower. In addition, we will receive an aggregate of $
20 million
in twelve equal monthly installments beginning in the second quarter of 2012. The net carrying value of assets sold and liabilities transferred to Tower on the transaction date prior to the effects of the transaction was
$23 million
and we recorded a gain of
$54 million
(net of transaction costs of $
3 million
) in connection with the sale of the Japan Fab. We also recorded a tax provision of $
74 million
related to the gain on the sale and to write down certain deferred tax assets associated with the Japan Fab. In connection with the sale of the Japan Fab, we entered into a supply agreement for Tower to manufacture products for us in the facility through approximately May 2014.
Numonyx
On
May 7, 2010
, we acquired
Numonyx Holdings B.V.
("Numonyx"), which manufactured and sold primarily NOR Flash and NAND Flash memory products. We acquired Numonyx to
further strengthen our portfolio of memory products, increase manufacturing and revenue scale, access Numonyx's customer base and provide opportunities to increase multi-chip offerings in the embedded and mobile markets. The total fair value of the consideration paid for Numonyx was
$1,112 million
and consisted of
137.7 million
shares of our common stock issued to the Numonyx shareholders and
4.8 million
restricted stock units issued to employees of Numonyx.
We determined the fair value of the assets and liabilities of Numonyx as of May 7, 2010 using an in-exchange model. Because the fair value of the net assets acquired exceeded the purchase price, we recognized a gain on the acquisition of
$437 million
in the third quarter of 2010. We believe the gain realized in acquisition accounting was the result of a number of factors, including the following: significant losses recognized by Numonyx during the recent downturn in the semiconductor memory industry; substantial volatility in Numonyx's primary markets; market perceptions that future opportunities for Numonyx products in certain markets were limited; the liquidity afforded to the sellers as a result of the limited opportunities to realize the value of their investment in Numonyx; and potential gains to the sellers through their investment in our equity from synergies we realize with Numonyx. In addition, we recognized a
$51 million
income tax benefit in connection with the acquisition. The results of operations for 2010 include
$635 million
of net sales and
$14 million
of operating losses from the Numonyx operations after the May 7, 2010 acquisition date. The consideration and valuation of assets acquired and liabilities assumed were as follows:
51
|
Consideration:
|
|||
|
Fair value of common stock issued
|
$
|
1,091
|
|
|
Fair value of restricted stock units issued
|
21
|
|
|
|
$
|
1,112
|
|
|
|
Recognized amounts of identifiable assets acquired and liabilities assumed:
|
|||
|
Cash and equivalents
|
$
|
95
|
|
|
Receivables
|
256
|
|
|
|
Inventories
|
689
|
|
|
|
Other current assets
|
28
|
|
|
|
Intangible assets
|
29
|
|
|
|
Property, plant and equipment
|
344
|
|
|
|
Equity method investment
|
414
|
|
|
|
Other noncurrent assets
|
307
|
|
|
|
Accounts payable and accrued expenses
|
(310
|
)
|
|
|
Other current liabilities
|
(5
|
)
|
|
|
Other noncurrent liabilities
|
(298
|
)
|
|
|
Total net assets acquired
|
1,549
|
|
|
|
Gain on acquisition
|
(437
|
)
|
|
|
$
|
1,112
|
|
|
The following unaudited pro forma financial information presents the combined results of operations as if Numonyx had been combined with us as of the beginning of 2009. The pro forma financial information includes the accounting effects of the business combination, including adjustments to the amortization of intangible assets, depreciation of property, plant and equipment, interest expense and elimination of intercompany activities. The unaudited pro forma financial information below is not necessarily indicative of either future results of operations or results that might have been achieved had Numonyx been combined with us as of the beginning of 2009.
|
|
2010
|
2009
|
||||||
|
Net sales
|
$
|
9,895
|
|
$
|
6,464
|
|
||
|
Net income (loss)
|
1,923
|
|
(2,230
|
)
|
||||
|
Net income (loss) attributable to Micron
|
1,873
|
|
(2,119
|
)
|
||||
|
Earnings (loss) per share:
|
||||||||
|
Basic
|
$
|
1.90
|
|
$
|
(2.31
|
)
|
||
|
Diluted
|
1.72
|
|
(2.31
|
)
|
||||
The unaudited pro forma financial information for 2010 includes the results for the year ended September 2, 2010 and the results of Numonyx, including the adjustments described above, for the approximate fiscal year ended September 2, 2010. The pro forma information for 2009 includes our results for the year ended September 3, 2009 and the results of Numonyx, including the adjustments described above, for the year ended September 27, 2009.
52
Receivables
|
As of
|
2011
|
2010
|
||||||
|
Trade receivables (net of allowance for doubtful accounts of $3 and $4, respectively)
|
$
|
1,105
|
|
$
|
1,238
|
|
||
|
Income and other taxes
|
137
|
|
115
|
|
||||
|
Related party receivables
|
72
|
|
64
|
|
||||
|
Other
|
183
|
|
114
|
|
||||
|
|
$
|
1,497
|
|
$
|
1,531
|
|
||
As of
September 1, 2011
and
September 2, 2010
, related party receivables included $
67 million
and $
57 million
, respectively, due from Aptina Imaging Corporation ("Aptina") primarily for sales of image sensor products under a wafer supply agreement. (See "Equity Method Investments" note.)
As of
September 1, 2011
and
September 2, 2010
, other receivables included $
34 million
and $
30 million
, respectively, due from Intel for amounts related to NAND Flash product design and process development activities under cost-sharing agreements. As of
September 1, 2011
and
September 2, 2010
, other receivables also included $
25 million
and $
17 million
, respectively, due from Nanya for amounts related to DRAM product design and process development activities under a cost-sharing agreement. (See "Equity Method Investments" note and "Consolidated Variable Interest Entities" note.)
Inventories
|
As of
|
2011
|
2010
|
||||||
|
Finished goods
|
$
|
596
|
|
$
|
623
|
|
||
|
Work in process
|
1,342
|
|
1,031
|
|
||||
|
Raw materials and supplies
|
142
|
|
116
|
|
||||
|
|
$
|
2,080
|
|
$
|
1,770
|
|
||
Intangible Assets
|
As of
|
2011
|
2010
|
||||||||||||||
|
|
Gross
Amount
|
Accumulated
Amortization
|
Gross
Amount
|
Accumulated
Amortization
|
||||||||||||
|
Product and process technology
|
$
|
571
|
|
$
|
(203
|
)
|
$
|
439
|
|
$
|
(181
|
)
|
||||
|
Customer relationships
|
127
|
|
(82
|
)
|
127
|
|
(66
|
)
|
||||||||
|
Other
|
1
|
|
—
|
|
23
|
|
(19
|
)
|
||||||||
|
|
$
|
699
|
|
$
|
(285
|
)
|
$
|
589
|
|
$
|
(266
|
)
|
||||
During
2011
and
2010
, we capitalized $
170 million
and $
48 million
, respectively, for product and process technology with weighted-average useful lives of 7 years.
Amortization expense was $
79 million
, $
96 million
and $
75 million
for
2011
,
2010
and 2009, respectively. Annual amortization expense for intangible assets is estimated to be $
86 million
for
2012
, $
80 million
for
2013
, $
71 million
for
2014
, $
53 million
for
2015
and $
46 million
for
2016
.
53
Property, Plant and Equipment
|
As of
|
2011
|
2010
|
||||||
|
Land
|
$
|
92
|
|
$
|
95
|
|
||
|
Buildings (includes $163 and $184, respectively, for capital leases)
|
4,481
|
|
4,394
|
|
||||
|
Equipment (includes $712 and $745, respectively, for capital leases)
|
14,735
|
|
12,970
|
|
||||
|
Construction in progress
|
155
|
|
73
|
|
||||
|
Software
|
293
|
|
281
|
|
||||
|
|
19,756
|
|
17,813
|
|
||||
|
Accumulated depreciation (includes $430 and $478, respectively, for capital leases)
|
(12,201
|
)
|
(11,212
|
)
|
||||
|
|
$
|
7,555
|
|
$
|
6,601
|
|
||
Depreciation expense was $
2,026 million
, $
1,826 million
and $
2,039 million
for
2011
,
2010
and
2009
, respectively.
Other noncurrent assets included buildings, equipment and other assets classified as held for sale of $
35 million
as of
September 1, 2011
and $
56 million
as of
September 2, 2010
.
Equity Method Investments
|
As of
|
2011
|
2010
|
||||||||||||
|
|
Investment Balance
|
Ownership Percentage
|
Investment Balance
|
Ownership Percentage
|
||||||||||
|
Inotera
|
$
|
388
|
|
29.7
|
%
|
$
|
434
|
|
29.9
|
%
|
||||
|
MeiYa
|
1
|
|
50.0
|
%
|
44
|
|
50.0
|
%
|
||||||
|
Transform
|
87
|
|
50.0
|
%
|
82
|
|
50.0
|
%
|
||||||
|
Aptina
|
7
|
|
35.0
|
%
|
22
|
|
35.0
|
%
|
||||||
|
|
$
|
483
|
|
|
|
$
|
582
|
|
|
|
||||
We recognize our share of earnings or losses from all investments under the equity method on a two-month lag. Equity in net income (loss) of equity method investees, net of tax, included the following:
|
For the year ended
|
2011
|
2010
|
2009
|
|||||||||
|
Inotera:
|
|
|
||||||||||
|
Equity method loss
|
$
|
(154
|
)
|
$
|
(56
|
)
|
$
|
(166
|
)
|
|||
|
Inotera Amortization
|
48
|
|
55
|
|
38
|
|
||||||
|
Other
|
(6
|
)
|
(5
|
)
|
(2
|
)
|
||||||
|
|
(112
|
)
|
(6
|
)
|
(130
|
)
|
||||||
|
Transform
|
(31
|
)
|
(12
|
)
|
—
|
|
||||||
|
Aptina
|
(15
|
)
|
(24
|
)
|
—
|
|
||||||
|
Hynix JV
|
—
|
|
2
|
|
—
|
|
||||||
|
MeiYa
|
—
|
|
1
|
|
(10
|
)
|
||||||
|
|
$
|
(158
|
)
|
$
|
(39
|
)
|
$
|
(140
|
)
|
|||
The summarized financial information in the tables below include the aggregate of all of our equity method investees on a stand-alone basis. The tables below include the respective years and periods through which we recorded our proportionate share of each of their results of operations, generally on a two-month lag. The summarized results of operations in the table below include the operating results of Inotera, Transform and Aptina only for the periods subsequent to our acquisition of our ownership interests.
54
|
As of
|
2011
|
2010
|
||||||
|
Current assets
|
$
|
942
|
|
$
|
898
|
|
||
|
Noncurrent assets (primarily property, plant and equipment)
|
4,189
|
|
3,537
|
|
||||
|
Current liabilities
|
3,201
|
|
1,479
|
|
||||
|
Noncurrent liabilities
|
173
|
|
900
|
|
||||
|
For the years ended
|
2011
|
2010
|
2009
|
|||||||||
|
Net sales
|
$
|
1,839
|
|
$
|
1,927
|
|
$
|
670
|
|
|||
|
Gross margin
|
(268
|
)
|
73
|
|
(370
|
)
|
||||||
|
Operating loss
|
(559
|
)
|
(181
|
)
|
(473
|
)
|
||||||
|
Net loss
|
(594
|
)
|
(237
|
)
|
(553
|
)
|
||||||
Our maximum exposure to loss from our ownership in our equity method investments that are VIEs was as follows:
|
As of
|
2011
|
|||
|
Inotera
|
$
|
325
|
|
|
|
MeiYa
|
1
|
|
||
|
Transform
|
90
|
|
||
The maximum exposure to loss primarily included our investment balance as well as the related translation adjustments in accumulated other comprehensive income and receivables, if any. We may also incur losses in connection with our obligations under a supply agreement with Inotera (the "Inotera Supply Agreement") for rights and obligations to purchase
50%
of Inotera's wafer production capacity of DRAM products.
Inotera and MeiYa DRAM joint ventures with Nanya
We have partnered with Nanya in two Taiwanese DRAM memory companies, Inotera and MeiYa. Under a licensing arrangement with Nanya, we recognized
$65 million
and
$105 million
of license revenue in net sales during 2010 and 2009, respectively, and had recognized a total of
$207 million
through the completion of the arrangement in April 2010. Under a cost-sharing arrangement beginning in April 2010, we share equally in DRAM development costs with Nanya and, as a result, our research and development costs were reduced by
$141 million
and
$51 million
in 2011 and 2010, respectively. In addition, we received
$25 million
and
$6 million
of royalty revenue in 2011 and 2010, respectively, from Nanya for sales of stack DRAM products manufactured by or for Nanya on process nodes of 50nm or higher and will continue to receive royalties from Nanya associated with technology developed prior to the cost-sharing arrangement.
Inotera
: In the first quarter of 2009, we acquired a
35.5%
ownership interest in Inotera. As a result of Inotera's sale of common shares in a public offering, our equity ownership interest decreased from 35.5% to
29.8%
and we recognized a gain of
$56 million
in the first quarter of 2010. In the second quarter of 2010, as part of another Inotera offering of common shares, we and Nanya each paid
$138 million
to purchase additional shares, slightly increasing our equity ownership interest from 29.8% to
29.9%
. In 2011, our ownership interest was reduced by shares issued under Inotera's employee stock plans and as of
September 1, 2011
, we held a
29.7%
ownership interest in Inotera, Nanya held a
29.8%
ownership interest, and the balance was publicly held.
The carrying value of our initial investment was less than our proportionate share of Inotera's equity. This difference is being amortized as a credit to earnings through equity in net income (loss) of equity method investees (the "Inotera Amortization"). As of
September 1, 2011
,
$74 million
of Inotera Amortization remained to be recognized of which
$49 million
is scheduled to be amortized in 2012 with the remaining amount to be amortized through 2034. The
$56 million
gain recognized in the first quarter of 2010 on Inotera's issuance of shares included
$33 million
of accelerated Inotera Amortization.
Because of significant market declines in the selling price of DRAM, Inotera incurred net losses of
$278 million
for the six-month period ended June 30, 2011. Also, Inotera's current liabilities exceeded its current assets by
$2.3 billion
as of June 30, 2011, which exposes Inotera to liquidity risk. Inotera's management has developed plans to improve its liquidity. There can be no assurance that Inotera's plan to improve its liquidity will be successful.
55
In connection with the initial acquisition of our shares in Inotera, we and Nanya entered into the Inotera Supply Agreement. Our cost of wafers purchased under the Inotera Supply Agreement is based on a margin-sharing formula among Nanya, Inotera, and ourselves. Under such formula, all parties' manufacturing costs related to wafers supplied by Inotera, as well as our and Nanya's revenue for the resale of products from wafers supplied by Inotera, are considered in determining costs for wafers acquired from Inotera. Under the Inotera Supply Agreement, we purchased
$641 million
and
$693 million
of DRAM products in 2011 and 2010, respectively. In 2011, we recognized a loss on our purchase commitment under the Inotera Supply Agreement of
$28 million
.
In the second quarter of 2009, Qimonda filed for bankruptcy and defaulted on its obligations to purchase trench DRAM products from Inotera under a separate supply agreement between Inotera and Qimonda ("the Qimonda Supply Agreement"). Pursuant to our obligation under the Inotera Supply Agreement to purchase up to 50% of Inotera's trench DRAM capacity, less any trench DRAM products sold to Qimonda pursuant to the Qimonda Supply Agreement, we recorded
$95 million
in cost of goods sold in 2009 for underutilized capacity as a result of Qimonda's default.
In the third quarter of 2009, we received
$50 million
from Inotera pursuant to the terms of a technology transfer agreement and, in connection therewith, recognized
$13 million
and
$15 million
of revenue in 2010 and 2009, respectively.
As of
September 1, 2011
and
September 2, 2010
, there were gains of
$65 million
and
$7 million
, respectively, in accumulated other comprehensive income (loss) for cumulative translation adjustments from our investment in Inotera.
As of
September 1, 2011
, based on the closing trading price of Inotera's shares in an active market, the market value of our equity interest in Inotera was
$296 million
which was below our net carrying value of
$323 million
. The net carrying value is our investment balance of
$388 million
less the cumulative translation adjustments in accumulated other comprehensive income (loss) of
$65 million
. We evaluated our investment in Inotera and concluded that the decline in the market value below carrying value was not an other-than-temporary-impairment primarily for the following reasons: (1) the deficit in market value to carrying value existed for less than one month, (2) the deficit as a percentage of the carrying was relatively minor, (3) the market value subsequently appreciated to exceed the carrying value shortly after the end of our fiscal 2011, and (4) the market value is very volatile based on changes in pricing for Inotera's sole product, DRAM, which fluctuates significantly based on market cycles and other factors.
MeiYa
: In 2008, we acquired a
50%
interest in MeiYa. In connection with our acquisition of an equity interest in Inotera, we entered into agreements with Nanya pursuant to which both parties ceased future funding of, and resource commitments to, MeiYa. Additionally, MeiYa sold substantially all of its assets to Inotera. In the second quarter of 2011, we and Nanya each received a distribution from MeiYa of
$48 million
as a return of capital, representing substantially all of MeiYa's assets.
Pursuant to a technology transfer agreement, we received
$50 million
from MeiYa in the first quarter of 2009. Our technology transfer agreement with MeiYa was supplanted by our technology transfer agreement with Inotera and we returned the
$50 million
with accrued interest to MeiYa in the fourth quarter of 2009.
Transform
In 2010, we acquired a
50%
interest in Transform. In exchange for the equity interest in Transform, we contributed nonmonetary assets, which consisted of manufacturing facilities, equipment, intellectual property and a fully-paid lease to a portion of our Boise, Idaho manufacturing facilities. As of
September 1, 2011
, we and Origin each held a
50%
ownership interest in Transform. During 2011 and 2010, we and Origin each contributed
$30 million
and
$26 million
, respectively, of cash to Transform. Our results of operations for 2011 and 2010 included
$20 million
and $
15 million
, respectively, of net sales which approximates our cost for transition services provided to Transform.
As of September 1, 2011 and September 2, 2010, other noncurrent assets included
$29 million
and
$33 million
, respectively, for the manufacturing facilities leased to Transform and other noncurrent liabilities included
$29 million
and
$33 million
for deferred rent revenue on the fully-paid lease. Additionally, as of September 1, 2011 and September 2, 2010, other noncurrent assets and liabilities included
$4 million
and
$5 million
, respectively, for the value of certain equipment and intangible assets, which we were obligated to contribute to Transform.
56
Aptina
In 2009, we sold a
65%
interest in Aptina, previously a wholly-owned subsidiary. A portion of the 65% interest we sold is in the form of convertible preferred shares that have a liquidation preference over Aptina's common shares. As a result, we recognize our share of Aptina's earnings or losses based on our common stock ownership percentage, which was
64%
as of
September 1, 2011
.
We manufacture components for CMOS image sensors for Aptina under a wafer supply agreement. For 2011, 2010 and 2009, we recognized net sales of
$349 million
,
$372 million
and
$70 million
, respectively, and cost of goods sold of
$358 million
,
$385 million
and
$60 million
, respectively, from products sold to Aptina.
Accounts Payable and Accrued Expenses
|
As of
|
2011
|
2010
|
||||||
|
Accounts payable
|
$
|
1,187
|
|
$
|
799
|
|
||
|
Salaries, wages and benefits
|
304
|
|
346
|
|
||||
|
Related party payables
|
141
|
|
194
|
|
||||
|
Income and other taxes
|
30
|
|
51
|
|
||||
|
Other
|
168
|
|
119
|
|
||||
|
|
$
|
1,830
|
|
$
|
1,509
|
|
||
Related party payables included amounts primarily due to Inotera under the Inotera Supply Agreement of $
139 million
and $
105 million
as of September 1, 2011 and September 2, 2010, respectively, for the purchase of DRAM products. Related party payables as of September 2, 2010 also included $
86 million
for amounts due for the purchase of memory products under a supply agreement with the Hynix JV, a subsidiary of Hynix Semiconductor Inc. in which we previously held an equity interest in connection with our acquisition of Numonyx.
As of September 1, 2011 and September 2, 2010, other accounts payable and accrued expenses included $
17 million
and $
16 million
, respectively, for amounts due to Intel for NAND Flash product design and process development and licensing fees pursuant to cost-sharing agreements. (See "Consolidated Variable Interest Entities" note.)
|
As of
|
2011
|
2010
|
||||||
|
2014 convertible senior notes, due 2014 at stated rate of 1.875%
|
$
|
815
|
|
$
|
1,058
|
|
||
|
Capital lease obligations, due 2023 at 6.1% and 7.2%, respectively
|
423
|
|
527
|
|
||||
|
2031A convertible senior notes, due 2031 at stated rate of 1.5%
|
255
|
|
—
|
|
||||
|
2031B convertible senior notes, due 2031 at stated rate of 1.875%
|
234
|
|
—
|
|
||||
|
2013 convertible senior notes, due 2013 at stated rate of 4.25%
|
139
|
|
230
|
|
||||
|
2027 convertible senior notes, due 2027 at stated rate of 1.875%
|
135
|
|
—
|
|
||||
|
TECH credit facility at effective interest rate of 3.9%
|
—
|
|
348
|
|
||||
|
Mai-Liao Power note at effective interest rate of 12.1%
|
—
|
|
196
|
|
||||
|
Other notes
|
—
|
|
1
|
|
||||
|
|
2,001
|
|
2,360
|
|
||||
|
Less current portion
|
(140
|
)
|
(712
|
)
|
||||
|
|
$
|
1,861
|
|
$
|
1,648
|
|
||
57
Convertible Notes With Debt And Equity Components
The accounting standards for convertible debt instruments that may be fully or partially settled in cash upon conversion require the debt and equity components to be stated separately. The amount recorded as debt is based on the fair value of the debt component as a standalone instrument, determined using an average interest rate for similar nonconvertible debt issued by entities with credit ratings comparable to ours at the time of issuance. The difference between the debt recorded at inception and its principal amount is to be accreted to principal through interest expense through the estimated life of the note. Accordingly, the debt and equity components are required to be stated separately for the following notes:
|
•
|
1.875%
Convertible Senior Notes due 2014 (the "2014 Notes")
|
|
•
|
1.5%
Convertible Senior Notes due 2031 (the "2031A Notes")
|
|
•
|
1.875%
Convertible Senior Notes due 2031 (the "2031B Notes" and together with the 2031A Notes, the "2031 Notes")
|
|
•
|
1.875%
Convertible Senior Notes due 2027 (the "2027 Notes")
|
The debt and equity components of our
4.25%
Convertible Senior Notes due 2013 (the "2013 Notes") are not required to be stated separately as they must be settled in shares of our common stock upon conversion. Information related to our convertible notes with debt and equity components is as follows:
|
As of 2011
|
2014 Notes
|
2031A Notes
|
2031B Notes
|
2027 Notes
|
||||||||||||
|
Outstanding principal
|
$
|
949
|
|
$
|
345
|
|
$
|
345
|
|
$
|
175
|
|
||||
|
Unamortized discount
|
(134
|
)
|
(90
|
)
|
(111
|
)
|
(40
|
)
|
||||||||
|
Net carrying amount of debt
|
815
|
|
255
|
|
234
|
|
135
|
|
||||||||
|
Carrying amount of equity component
|
368
|
|
89
|
|
109
|
|
40
|
|
||||||||
|
Remaining discount amortization period (in years)
|
2.8
|
|
6.9
|
|
8.9
|
|
5.8
|
|
||||||||
As of September 2, 2010, the 2014 Notes had $
1,300 million
of outstanding principal and $
1,058 million
of net carrying value (net of unamortized discount of $
242 million
).
Information related to interest rates and expense of our convertible notes with debt and equity components is as follows:
|
For the year ended 2011
|
2014 Notes
|
2031A Notes
|
2031B Notes
|
2027 Notes
|
||||||||||||
|
Effective interest rate
|
7.9
|
%
|
6.5
|
%
|
7.0
|
%
|
6.9
|
%
|
||||||||
|
Interest cost related to contractual interest rate
|
$
|
19
|
|
$
|
1
|
|
$
|
1
|
|
$
|
3
|
|
||||
|
Interest costs related to amortization of discount and issuance costs
|
46
|
|
1
|
|
1
|
|
5
|
|
||||||||
Interest expense for 2010 included $
24 million
for the contractual interest rate and $
56 million
from the amortization of discount and issuance costs from the 2014 Notes and interest expense for 2009 included $
25 million
for the contractual interest rate and $
52 million
from the amortization of discount and issuance costs from the 2014 Notes.
Debt Restructure
On November 3, 2010, we completed the following series of debt restructure transactions in connection with separate privately negotiated agreements entered into on
October 28, 2010
with certain holders of our convertible notes:
|
•
|
Exchanged $
175 million
in aggregate principal amount of our 2014 Notes for $
175 million
in aggregate principal amount of the 2027 Notes (the "Exchange Transaction").
|
|
•
|
Repurchased $
176 million
in aggregate principal amount of our 2014 Notes for $
171 million
in cash (the "Partial Repurchase of 2014 Notes").
|
|
•
|
Repurchased $
91 million
in aggregate principal amount of our 2013 Notes for $
166 million
in cash (the "Partial Repurchase of 2013 Notes").
|
58
Exchange Transaction
: In the Exchange Transaction, $
175 million
in aggregate principal amount of our 2014 Notes was extinguished. The extinguishment resulted in the derecognition of $
144 million
in debt for the principal of the 2014 Notes (net of $
31 million
of debt discount) and $
13 million
of additional capital. We recognized a loss of $
15 million
on the exchange based on the estimated $
157 million
fair value of the debt component of the 2014 Notes exchanged and their $
142 million
carrying value (net of unamortized issuance costs).
Partial Repurchase of the 2014 Notes:
Because the liability and equity components of the 2014 Notes were stated separately, the repurchase of $
176 million
aggregate principal amount resulted in the derecognition of $
144 million
in debt (net of $
32 million
of debt discount) and $
13 million
of additional capital. We recognized a loss of $
17 million
(including transaction fees) on the repurchase based on the estimated $
158 million
fair value of the debt components of the 2014 Notes repurchased. The fair value of the debt component of the 2014 Notes was estimated using an interest rate for nonconvertible debt, with terms similar to the debt component of the 2014 Notes on a standalone basis, issued by entities with credit ratings comparable to ours at the exchange date (Level 2).
Partial Repurchase of the 2013 Notes
: We recognized a loss of $
79 million
(including transaction fees) in the repurchase of the 2013 Notes.
2014 Notes
In May 2007, we issued $
1.3 billion
of the 2014 Notes, of which $
351 million
was extinguished on November 3, 2010 in connection with the Exchange Transaction and Partial Repurchase of the 2014 Notes. The initial conversion rate of the 2014 Notes is
70.2679
shares of common stock per
$1,000
principal amount, or approximately $
14.23
per share.
Conversion Rights
: Holders may convert their 2014 Notes under the following circumstances: (1) during any calendar quarter if the closing price of our common stock for at least 20 trading days in the 30 consecutive trading days ending on the last trading day of the immediately preceding calendar quarter is more than
130%
of the conversion price of the 2014 Notes (approximately $
18.50
per share); (2) if the 2014 Notes have been called for redemption; (3) if specified distributions or corporate events occur, as set forth in the indenture for the 2014 Notes; (4) if the trading price of the 2014 Notes is less than
98%
of the product of the closing price of our common stock and the conversion rate of the 2014 Notes during the periods specified in the indenture; or (5) at any time on or after
March 1, 2014
.
Upon conversion, we will have the right to deliver shares of our common stock, cash or a combination of cash and shares of common stock.
Cash Redemption at Our Option
: We may redeem for cash the 2014 Notes if the last reported sale price of our common stock has been at least
130%
of the conversion price (approximately $
18.50
per share) for at least 20 trading days during any 30 consecutive trading-day period. The redemption price is 100% of the principal amount to be redeemed, plus accrued and unpaid interest.
Cash Repurchase at the Option of the Holder
: Upon a change in control or a termination of trading, as defined in the indenture, holders may require us to repurchase for cash all or a portion of their 2014 Notes at a repurchase price equal to
100%
of the principal amount, plus accrued and unpaid interest, if any.
Capital Lease Obligations
We have various capital lease obligations due in periodic installments through February 2023 at weighted-average effective interest rates of
6.1%
as of 2011 and
7.2%
as of 2010.
In 2011, we received $
268 million
in proceeds from sales-leaseback transactions and as a result recorded capital lease obligations aggregating $
246 million
at a weighted-average effective interest rate of
5.4%
, payable in periodic installments through
May 2016
.
In 2010, we recorded $
121 million
in capital lease obligations with a weighted-average effective interest rate of
9.5%
, payable in periodic installments through
December 2020
.
59
2031A and 2031B Notes
On
July 26, 2011
, we issued $
345 million
of the 2031A Notes and $
345 million
of 2031B Notes, each due
August 1, 2031
. Issuance costs for the 2031 Notes totaled $
18 million
. The initial conversion rate for the 2031 Notes is
105.2632
shares of common stock per
$1,000
principal amount, equivalent to an initial conversion price of approximately $
9.50
per share of common stock. Interest is payable in February and August of each year.
Upon the issuance of the 2031 Notes, we recorded $
487 million
of debt, $
198 million
of additional capital and $
13 million
of deferred debt issuance costs (included in other noncurrent assets). The amount recorded as debt is based on the fair value of the debt component as a standalone instrument, and was determined using an average interest rate for similar nonconvertible debt issued by entities with credit ratings comparable to ours at the time of issuance (Level 2). The difference between the debt recorded at inception and the principal amount ($
91 million
for the 2031A Notes and $
112 million
for the 2031B Notes) is being accreted to principal through interest expense through
August 2018
for the 2013A Notes and
August 2020
for the 2031B Notes, the expected life of the notes.
Conversion Rights
: Holders may convert their 2031 Notes under the following circumstances: (1) during any calendar quarter if the closing price of our common stock for at least 20 trading days in the 30 consecutive trading days ending on the last trading day of the preceding calendar quarter is more than
130%
of the conversion price of the 2031 Notes (approximately $
12.35
per share); (2) if the 2031 Notes are called for redemption; (3) if specified distributions or corporate events occur, as set forth in the indenture for the 2031 Notes; (4) if the trading price of the 2031 Notes is less than
98%
of the product of the closing price of our common stock and the conversion rate of the 2031 Notes during the periods specified in the indenture; or (5) at any time after
May 1, 2031
.
Upon conversion, we will pay cash up to the aggregate principal amount and cash, shares of common stock or a combination of cash and shares of common stock, at our option, for any remaining conversion obligations. As a result of the settlement terms upon conversion of the 2031 Notes, the 2031 Notes are considered in diluted earnings per share under the treasury stock method.
Cash Redemption at Our Option
: We may redeem for cash the 2031A Notes on or after August 5, 2013 and the 2031B Notes on or after August 5, 2014 if the last reported sale price of our common stock has been at least
130%
of the conversion price (approximately $
12.35
per share) for at least 20 trading days during any 30 consecutive trading day period. The redemption price will equal the principal amount plus accrued and unpaid interest. If we redeem the 2031A Notes prior to
August 5, 2015
, or the 2031B Notes prior to
August 5, 2016
, we will also make a "make-whole premium" payment in cash equal to the present value of all remaining scheduled payments of interest on the 2031 Notes, using a discount rate equal to
150
basis points.
Cash Repurchase at the Option of the Holder
: We may be required by the holders of the 2031 Notes to repurchase for cash all or a portion of the 2031A Notes on
August 1, 2018
and all or a portion of the 2031B Notes on
August 1, 2020
. The repurchase price is equal to the principal amount, plus accrued and unpaid interest. Upon a change in control or a termination of trading, as defined in the indenture, we may be required by the holders of the 2031 Notes to repurchase for cash all or a portion of their 2031 Notes at a repurchase price equal to the principal amount plus accrued and unpaid interest.
2013 Notes
In April 2009, we issued
$230 million
of the 2013 Notes and in connection with Partial Repurchase of 2013 Notes, repurchased $
91 million
of aggregate principal balance on November 3, 2010. The initial conversion rate is
196.7052
shares of common stock per
$1,000
principal amount or approximately $
5.08
per share, and is subject to adjustment upon the occurrence of certain events specified in the indenture.
Conversion Rights
: The 2013 Notes may by converted by their holders at any time prior to
October 15, 2013
.
Cash Redemption at Our Option
: We may redeem for cash the 2013 Notes on or after April 20, 2012 if the closing price of our common stock has been at least
135%
of the conversion price (approximately $
6.86
per share) for at least 20 trading days during a 30 consecutive trading-day period. The redemption price will equal the principal amount and accrued and unpaid interest plus a make-whole premium equal to the present value of the remaining interest payments from the redemption date to the date of maturity.
60
Cash Repurchase at the Option of the Holder
:
Upon a change in control or a termination of trading, as defined in the indenture, we may be required to repurchase for cash all or a portion of the 2013 Notes at a repurchase price equal to
100%
of the principal plus any accrued and unpaid interest to, but excluding, the repurchase date.
2027 Notes
In connection with the Exchange Transaction on November 3, 2010, we issued $175 million of 2027 Notes. The initial conversion rate is
91.7431
shares of common stock per $
1,000
principal amount or approximately
$10.90
per share, and is subject to adjustment upon the occurrence of certain events specified in the indenture.
Upon the issuance of the 2027 Notes, we recorded $
130 million
of debt, $
40 million
of additional capital and $
2 million
of deferred debt issuance costs (included in other noncurrent assets). The amount recorded as debt is based on the fair value of the debt component as a standalone instrument, and was determined using an average interest rate for similar nonconvertible debt issued by entities with credit ratings comparable to ours at the time of issuance (Level 2). The $
45 million
difference between the debt recorded at inception and its principal amount will be accreted to principal through interest expense to June 2017, the expected life of the 2027 Notes. The fair value of the 2027 Notes was based on the trading price on the exchange date (Level 1).
Conversion Rights
: Holders may convert their 2027 Notes under the following circumstances: (1) during any calendar quarter if the closing price of our common stock for at least 20 trading days in the 30 consecutive trading days ending on the last trading day of the immediately preceding calendar quarter is more than
130%
of the conversion price (approximately $
14.17
per share); (2) if the 2027 Notes have been called for redemption; (3) if specified distributions or corporate events occur; (4) if the trading price of the 2027 Notes is less than
98%
of the product of the closing price of our common stock and the conversion rate of the 2027 Notes during the period specified in the indenture; (5) upon our election to terminate the conversion right of the 2027 Notes; or (6) after
March 1, 2027
.
Upon conversion, we will pay cash up to the aggregate principal amount and shares of common stock or cash, at our option, for any remaining conversion obligation. As a result of the conversion provisions in the indenture, upon conversion of the 2027 Notes only the amounts payable in excess of the principal amounts of the 2027 Notes are considered in diluted earnings per share under the treasury stock method.
Cash Redemption at Our Option
: We may redeem for cash the 2027 Notes on or after
June 1, 2014
at a price equal to the principal amount plus accrued and unpaid interest.
Cash Repurchase at the Option of the Holder
: We may be required by the holders of the 2027 Notes to repurchase for cash the 2027 Notes on June 1, 2017. The repurchase price is equal to the principal amount, plus accrued and unpaid interest. Upon a change in control or a termination of trading, as defined in the indenture, we may be required by the holders of the 2027 Notes to repurchase for cash all or a portion of their 2027 Notes at a repurchase price equal to the principal amount plus accrued and unpaid interest.
Termination of Conversion Rights
: We may elect to terminate the conversion right of the 2027 Notes if the daily volume weighted average price of our common stock is greater than or equal to
130%
of the conversion price (approximately $
14.17
per share) for at least 20 trading days during any 30 consecutive trading day period. If we terminate the conversion right prior to June 1, 2014 and any 2027 Notes are converted in connection with the termination, we will pay a make-whole premium equal to the accrued interest as of the conversion date plus the present value of remaining interest that would have been paid through
May 31, 2014
, discounted using a U.S. Treasury bond with an equivalent term. Subject to the terms of the indenture, we may, at our election, deliver shares of common stock in lieu of cash with respect to this make-whole payment.
TECH Credit Facility
In the third quarter of 2011, we repaid the remaining $
250 million
outstanding principal balance of the TECH credit facility, plus accrued interest, that was due in periodic payments through May 2012. In connection therewith, $
60 million
of cash that was previously restricted was released to us. (See "TECH Semiconductor Singapore Pte. Ltd." note.)
61
Maturities of Notes Payable and Future Minimum Lease Payments
As of September 1, 2011, maturities of notes payable and future minimum lease payments under capital lease obligations were as follows:
|
Notes Payable
|
Capital Lease Obligations
|
|||||||
|
2012
|
$
|
—
|
|
$
|
151
|
|
||
|
2013
|
—
|
|
80
|
|
||||
|
2014
|
1,088
|
|
78
|
|
||||
|
2015
|
—
|
|
73
|
|
||||
|
2016
|
—
|
|
45
|
|
||||
|
2017 and thereafter
|
865
|
|
71
|
|
||||
|
Discounts and interest, respectively
|
(375
|
)
|
(75
|
)
|
||||
|
$
|
1,578
|
|
$
|
423
|
|
|||
Debt Guarantee
Concurrent with the Numonyx acquisition, we entered into agreements with STMicroelectronics N.V. and DBS Bank Ltd. ("DBS")
that required us to guarantee a then outstanding loan, made by DBS to Hynix-Numonyx Semiconductor Ltd. (the "Hynix JV"). The outstanding balance of the Hynix JV loan was $
250 million
as of the acquisition date and was due in periodic installments from calendar 2014 through 2016. Under the agreements, we deposited $
250 million
, accounted for as restricted cash, into a pledged account at DBS to collateralize the guarantee of the loan. In the third quarter of 2011, the Hynix JV repaid the $
250 million
outstanding principal balance of the loan before the scheduled due dates, and accordingly, our obligation to guarantee the debt ceased and the $
250 million
restricted cash collateral was released to us. We recognized a gain of $
15 million
in the third quarter of 2011 in other non-operating income (expense) for the termination of our debt guarantee obligation.
Commitments
As of September 1, 2011, we had commitments of approximately
$600 million
for the acquisition of property, plant and equipment. We lease certain facilities and equipment under operating leases. Total rental expense was
$69 million
,
$41 million
and
$28 million
for 2011, 2010 and 2009, respectively. We also subleased certain facilities and buildings under operating leases to Aptina and recognized
$7 million
of rental income in 2011. As of September 1, 2011, minimum future rental commitments are as follows:
|
|
Operating Lease Commitments
|
|||
|
2012
|
$
|
32
|
|
|
|
2013
|
26
|
|
||
|
2014
|
16
|
|
||
|
2015
|
9
|
|
||
|
2016
|
8
|
|
||
|
2017 and thereafter
|
25
|
|
||
|
|
$
|
116
|
|
|
62
Contingencies
We have accrued a liability and charged operations for the estimated costs of adjudication or settlement of various asserted and unasserted claims existing as of the balance sheet date, including those described below. We are currently a party to other legal actions arising from the normal course of business, none of which is expected to have a material adverse effect on our business, results of operations or financial condition.
In the normal course of business, we are a party to a variety of agreements pursuant to which we may be obligated to indemnify the other party. It is not possible to predict the maximum potential amount of future payments under these types of agreements due to the conditional nature of our obligations and the unique facts and circumstances involved in each particular agreement. Historically, our payments under these types of agreements have not had a material adverse effect on our business, results of operations or financial condition.
We are involved in the following antitrust, patent and securities matters.
Antitrust Matters
On May 5, 2004, Rambus, Inc. ("Rambus") filed a complaint in the Superior Court of the State of California (San Francisco County) against us and other DRAM suppliers alleging that the defendants harmed Rambus by engaging in concerted and unlawful efforts affecting Rambus DRAM ("RDRAM") by eliminating competition and stifling innovation in the market for computer memory technology and computer memory chips. Rambus' complaint alleges various causes of action under California state law including, among other things, a conspiracy to restrict output and fix prices, a conspiracy to monopolize, intentional interference with prospective economic advantage, and unfair competition. Rambus is seeking a judgment for damages of approximately $3.9 billion, joint and several liability, trebling of damages awarded, punitive damages, a permanent injunction enjoining the defendants from the conduct alleged in the complaint, interest, and attorneys' fees and costs. Trial began on June 20, 2011, and the case went to the jury on September 21, 2011. At the time of this filing, a jury verdict is pending. We cannot predict when a verdict will be reached or when a formal judgment would be entered by the Court subsequent to a verdict. In the event of an adverse judgment, we would anticipate filing appropriate post-judgment motions and appeals. We may be required to post a bond or other security to stay enforcement of an adverse judgment pending appeal. Depending on the amount required, we cannot assure you we would be able to obtain sufficient security to pursue an appeal. We are unable to predict the outcome of this lawsuit and therefore cannot determine the likelihood of loss nor estimate a range of possible loss. Accordingly, we have not provided an accrual for an adverse judgment in the September 1, 2011, financial statements. However, we have accrued a liability and charged operations for estimated costs to successfully defend the matter. An adverse judgment may have a material impact on our business, results of operations and financial condition, including liquidity.
At least sixty-eight purported class action price-fixing lawsuits have been filed against us and other DRAM suppliers in various federal and state courts in the United States and in Puerto Rico on behalf of indirect purchasers alleging price-fixing in violation of federal and state antitrust laws, violations of state unfair competition law, and/or unjust enrichment relating to the sale and pricing of DRAM products during the period from April 1999 through at least June 2002. The complaints seek joint and several damages, trebled, in addition to restitution, costs and attorneys' fees. A number of these cases have been removed to federal court and transferred to the U.S. District Court for the Northern District of California for consolidated pre-trial proceedings. In July, 2006, the Attorneys General for approximately forty U.S. states and territories filed suit in the U.S. District Court for the Northern District of California. The complaints allege, among other things, violations of the Sherman Act, Cartwright Act, and certain other states' consumer protection and antitrust laws and seek joint and several damages, trebled, as well as injunctive and other relief. On October 3, 2008, the California Attorney General filed a similar lawsuit in California Superior Court, purportedly on behalf of local California government entities, alleging, among other things, violations of the Cartwright Act and state unfair competition law. On June 23, 2010, we executed a settlement agreement resolving these purported class-action indirect purchaser cases and the pending cases of the Attorneys General relating to alleged DRAM price-fixing in the United States. Subject to certain conditions, including final court approval of the class settlements, we agreed to pay a total of approximately $67 million in three equal installments over a two-year period.
63
Three putative class action lawsuits alleging price-fixing of DRAM products also have been filed against us in Quebec, Ontario, and British Columbia, Canada, on behalf of direct and indirect purchasers, asserting violations of the Canadian Competition Act and other common law claims. The claims were initiated between December 2004 (British Columbia) and June 2006 (Quebec). The plaintiffs seek monetary damages, restitution, costs, and attorneys' fees. The substantive allegations in these cases are similar to those asserted in the DRAM antitrust cases filed in the United States. Plaintiffs' motion for class certification was denied in the British Columbia and Quebec cases in May and June 2008, respectively. Plaintiffs subsequently filed an appeal of each of those decisions. On November 12, 2009, the British Columbia Court of Appeal reversed the denial of class certification and remanded the case for further proceedings. The appeal of the Quebec case is still pending.
In February and March 2007, All American Semiconductor, Inc., Jaco Electronics, Inc., and the DRAM Claims Liquidation Trust each filed suit against us and other DRAM suppliers in the U.S. District Court for the Northern District of California after opting-out of a direct purchaser class action suit that was settled. The complaints allege, among other things, violations of federal and state antitrust and competition laws in the DRAM industry, and seek joint and several damages, trebled, as well as restitution, attorneys' fees, costs and injunctive relief. On July 11, 2011, we made a collective payment to the three plaintiffs to settle all claims of an amount that was not significant to our business, results of operations or financial condition.
On June 21, 2010, the Brazil Secretariat of Economic Law of the Ministry of Justice ("SDE") announced that it had initiated an investigation relating to alleged anticompetitive activities within the DRAM industry. The SDE's Notice of Investigation names various DRAM manufacturers and certain executives, including us, and focuses on the period from July 1998 to June 2002.
On September 24, 2010, Oracle America Inc. ("Oracle"), successor to Sun Microsystems, a DRAM purchaser that opted-out of a direct purchaser class action suit that was settled, filed suit against us in U.S. District Court for the Northern District of California. The complaint alleges DRAM price-fixing and other violations of federal and state antitrust and unfair competition laws based on purported conduct for the period from August 1, 1998 through at least June 15, 2002. Oracle is seeking joint and several damages, trebled, as well as restitution, disgorgement, attorneys' fees, costs and injunctive relief.
We are unable to predict the outcome of these lawsuits and therefore cannot estimate the range of possible loss, except as noted in the U.S. indirect purchasers cases above. The final resolution of these alleged violations of antitrust laws could result in significant liability and could have a material adverse effect on our business, results of operations or financial condition.
Patent Matters
As is typical in the semiconductor and other high technology industries, from time to time, others have asserted, and may in the future assert, that our products or manufacturing processes infringe their intellectual property rights. In this regard, we are engaged in litigation with Rambus relating to certain of Rambus' patents and certain of our claims and defenses. Our lawsuits with Rambus are pending in the U.S. District Court for the District of Delaware, U.S. District Court for the Northern District of California, Germany, France, and Italy.
On August 28, 2000, we filed a complaint against Rambus in the U.S. District Court for the District of Delaware seeking declaratory and injunctive relief. The complaint alleges, among other things, various anticompetitive activities and also seeks a declaratory judgment that certain Rambus patents or that such patents are invalid and/or unenforceable. Rambus subsequently filed an answer and counterclaim in Delaware alleging, among other things, infringement of twelve Rambus patents and seeking monetary damages and injunctive relief. We subsequently added claims and defenses based on Rambus' alleged spoliation of evidence and litigation misconduct. The spoliation and litigation misconduct claims and defenses were heard in a bench trial before Judge Robinson in October 2007. On January 9, 2009, Judge Robinson entered an opinion in our favor holding that Rambus had engaged in spoliation and that the twelve Rambus patents in the suit were unenforceable against us. Rambus subsequently appealed the decision to the U.S. Court of Appeals for the Federal Circuit. On May 13, 2011, the Federal Circuit affirmed Judge Robinson's finding of spoliation, but vacated the dismissal sanction and remanded the case to the Delaware District Court for analysis of the remedy based on the Federal Circuit's decision. The Northern District of California Court stayed a trial of the patent phase of the Northern District of California case upon appeal of the spoliation issue to the Federal Circuit.
64
On March 6, 2009, Panavision Imaging, LLC filed suit against us and Aptina Imaging Corporation, then a wholly-owned subsidiary ("Aptina"), in the U.S. District Court for the Central District of California. The complaint alleged that certain of our and Aptina's image sensor products infringed four Panavision Imaging U.S. patents and sought injunctive relief, damages, attorneys' fees, and costs. On February 7, 2011, the Court ruled that one of the four patents in suit was invalid for indefiniteness. On March 10, 2011, claims relating to the remaining three patents in suit were dismissed with prejudice. Panavision subsequently filed a motion for reconsideration of the Court's decision regarding invalidity of the first patent, and we filed a motion for summary judgment of non-infringement of such patent. On July 8, 2011, the Court issued an order that rescinded its prior indefiniteness decision, and held that the disputed term does not render the claims in suit indefinite. A hearing on motions for summary judgment regarding infringement and validity is scheduled for April 2, 2012.
On September 1, 2011, HSM Portfolio LLC and Technology Properties Limited LLC filed a patent infringement action in the U.S. District Court for the District of Delaware against us and seventeen other defendants. The complaint alleges that certain Company DRAM and image sensor products infringe two U.S. patents.
On September 9, 2011, Advanced Data Access LLC filed a patent infringement action in the U.S. District Court for the Eastern District of Texas against the Company and seven other defendants. The complaint alleges that certain Company DRAM products infringe a single U.S. patent.
On September 14, 2011, Smart Memory Solutions LLC filed a patent infringement action in the U.S. District Court for the District of Delaware against the Company and Winbond Electronics Corporation of America. The complaint alleges that certain NOR Flash products infringe a single U.S. patent.
Among other things, the above lawsuits pertain to certain of our SDRAM, DDR SDRAM, DDR2 SDRAM, DDR3 SDRAM, RLDRAM, NOR Flash and image sensor products, which account for a significant portion of our net sales.
We are unable to predict the outcome of assertions of infringement made against us and therefore cannot estimate the range of possible loss. A court determination that our products or manufacturing processes infringe the intellectual property rights of others could result in significant liability and/or require us to make material changes to our products and/or manufacturing processes. Any of the foregoing could have a material adverse effect on our business, results of operations or financial condition.
Securities Matters
On February 24, 2006, a putative class action complaint was filed against us and certain of our officers in the U.S. District Court for the District of Idaho alleging claims under Section 10(b) and 20(a) of the Securities Exchange Act of 1934, as amended, and Rule 10b-5 promulgated thereunder. Four substantially similar complaints subsequently were filed in the same Court. The cases purport to be brought on behalf of a class of purchasers of our stock during the period February 24, 2001 to February 13, 2003. The five lawsuits have been consolidated and a consolidated amended class action complaint was filed on July 24, 2006. The complaint generally alleges violations of federal securities laws based on, among other things, claimed misstatements or omissions regarding alleged illegal price-fixing conduct. The complaint seeks unspecified damages, interest, attorneys' fees, costs, and expenses. On December 19, 2007, the Court issued an order certifying the class but reducing the class period to purchasers of our stock during the period from February 24, 2001 to September 18, 2002. On August 24, 2010, we executed a settlement agreement resolving these purported class-action cases. Subject to certain conditions, including final court approval of the class settlement, we agreed to pay $6 million as our contribution to the settlement. On April 28, 2011, the Court entered final approval of the class settlement.
Commercial Matters
On January 20, 2011, Dr. Michael Jaffé, administrator for Qimonda AG ("Qimonda") insolvency proceedings, filed suit against us and Micron Semiconductor B.V., our Netherlands subsidiary, in the District Court of Munich, Civil Chamber. The complaint seeks to void under Section 133 of the German Insolvency Act a share purchase agreement between us and Qimonda in fall 2008 pursuant to which we purchased all of Qimonda's shares of Inotera Memories, Inc. and seeks an order requiring us to retransfer the Inotera shares to the Qimonda estate. The complaint also seeks to terminate under Sections 103 or 133 of the German Insolvency Code a patent cross license between us and Qimonda entered into at the same time as the share purchase agreement. A hearing is scheduled to begin on November 9, 2011.
We are unable to predict the outcome of this lawsuit and therefore cannot estimate the range of possible loss. The final resolution of this lawsuit could result in the loss of the Inotera shares or equivalent monetary damages and the termination of the patent cross license, which could have a material adverse effect on our business, results of operation or financial condition.
65
Shareholders’ Equity
Repurchase of Common Stock
On July 26, 2011, we paid
$150 million
to repurchase
19.7 million
shares of common stock at
$7.60
per share.
Issuance of Restricted Shares For Acquisition of Numonyx
On May 7, 2010 in connection with the acquisition of Numonyx, we issued
137.7 million
shares of our common stock to Intel, STMicroelectronics N.V. and Redwood Blocker S.a.r.l. and issued
4.8 million
restricted stock units. The shares of common stock issued were restricted from sale until November 6, 2010. In addition,
21.0 million
of the shares of stock issued were placed in escrow as partial security for Numonyx shareholders' indemnity obligations. During 2011, the Numonyx shareholders sold all of the
21.0 million
shares in escrow. Of the restricted stock units issued,
1.6 million
were vested as of the time of issuance. (See "Numonyx" note.)
Issuance of Common Stock
On April 15, 2009, we issued
69.3 million
shares of common stock for
$4.15
per share in a public offering. We received net proceeds of
$276 million
, net of underwriting fees and other offering costs of
$12 million
.
Capped Call Transactions
Concurrent with the offering of the 2031 Notes, in July 2011, we entered into capped call transactions (the "2011 Capped Calls") that have an initial strike price of approximately
$9.50
per share, subject to certain adjustments, which was set to equal the initial conversion price of the 2031 Notes. The 2011 Capped Calls are in four equal tranches, have cap prices of
$11.40
,
$12.16
,
$12.67
and
$13.17
per share, and cover, subject to anti-dilution adjustments similar to those contained in the 2031 Notes, an approximate combined total of
72.6 million
shares of common stock. The 2011 Capped Calls expire on various dates between
July 2014
and
February 2016
. The 2011 Capped Calls are intended to reduce the potential dilution upon conversion of the 2031 Notes. Settlement of the 2011 Capped Calls in cash on their respective expiration dates would result in us receiving an amount ranging from zero if the market price per share of our common stock is at or below
$9.50
to a maximum of
$207 million
. We paid
$57 million
to purchase the 2011 Capped Calls. The 2011 Capped Calls are considered capital transactions and the related cost was recorded as a charge to additional capital.
Concurrent with the offering of the 2013 Notes in April 2009, we entered into capped call transactions (the "2009 Capped Calls") that have an initial strike price of approximately
$5.08
per share, subject to certain adjustments, which was set to equal the initial conversion price of the 2013 Notes. The 2009 Capped Calls have a cap price of
$6.64
per share and cover, subject to anti-dilution adjustments similar to those contained in the 2013 Notes, an approximate combined total of
45.2 million
shares of common stock, and are subject to standard adjustments for instruments of this type. The 2009 Capped Calls expire in
October 2012
and
November 2012
. The 2009 Capped Calls are intended to reduce the potential dilution upon conversion of the 2013 Notes. Settlement of the 2009 Capped Calls in cash on their respective expiration dates would result in us receiving an amount ranging from zero if the market price per share of our common stock is at or below
$5.08
to a maximum of
$70 million
if the market price of our common stock exceeds
$6.64
per share. We paid
$25 million
to purchase the 2009 Capped Calls. The 2009 Capped Calls are considered capital transactions and the related cost was recorded as a charge to additional capital.
Concurrent with the offering of the 2014 Notes in May 2007, we entered into three capped call transactions (the "2007 Capped Calls") that have an initial strike price of approximately
$14.23
per share, subject to certain adjustments, which was set to equal the initial conversion price of the 2014 Notes. The 2007 Capped Calls are in three equal tranches, have cap prices of
$17.25
,
$20.13
and
$23.00
per share, and cover, subject to anti-dilution adjustments similar to those contained in the 2014 Notes, an approximate combined total of
91.3 million
shares of common stock. The 2007 Capped Calls expire on various dates between
November 2011
and
December 2012
. The 2007 Capped Calls are intended to reduce the potential dilution upon conversion of the 2014 Notes. Settlement of the 2007 Capped Calls in cash on their respective expiration dates would result in us receiving an amount ranging from zero if the market price per share of our common stock is at or below
$14.23
to a maximum of
$538 million
. We paid
$151 million
to purchase the 2007 Capped Calls. The 2007 Capped Calls are considered capital transactions and the related cost was recorded as a charge to additional capital.
66
Accumulated Other Comprehensive Income (Loss)
Accumulated other comprehensive income (loss), net of tax, consisted of the following as of the end of the periods shown below:
|
|
2011
|
2010
|
||||||
|
Accumulated translation adjustment, net
|
$
|
65
|
|
$
|
2
|
|
||
|
Gain (loss) on derivatives, net
|
43
|
|
1
|
|
||||
|
Gain (loss) on investments, net
|
25
|
|
14
|
|
||||
|
Unrecognized pension liability
|
(1
|
)
|
(6
|
)
|
||||
|
Accumulated other comprehensive income (loss)
|
$
|
132
|
|
$
|
11
|
|
||
Derivative Financial Instruments
We are exposed to currency exchange rate risk for monetary assets and liabilities held or denominated in foreign currencies, primarily the euro, Singapore dollar and yen. We are also exposed to currency exchange rate risk for capital expenditures, primarily denominated in the euro and yen. We use derivative instruments to manage our exposures to changes in currency exchange rates. For exposures associated with our monetary assets and liabilities, our primary objective in entering into currency derivatives is to reduce the volatility that changes in currency exchange rates have on our earnings. For exposures associated with capital expenditures, our primary objective in entering into currency derivatives is to reduce the volatility that changes in currency exchange rates have on future cash flows.
Our derivatives consist primarily of currency forward contracts. The derivatives expose us to credit risk to the extent the counterparties may be unable to meet the terms of the derivative instrument. Our maximum exposure to loss due to credit risk that we would incur if parties to forward contracts failed completely to perform according to the terms of the contracts was equal to our carrying value of the forward contracts as of
September 1, 2011
, as listed in the tables below under fair values. We seek to mitigate such risk by limiting our counterparties to major financial institutions and by spreading risk across multiple major financial institutions. In addition, we monitor the potential risk of loss with any one counterparty resulting from this type of credit risk on an ongoing basis. We have the following currency risk management programs:
Currency Derivatives without Hedge Accounting Designation
We utilize a rolling hedge strategy with currency forward contracts that generally mature within
35
days to hedge our exposure to changes in currency exchange rates. At the end of each reporting period, monetary assets and liabilities held or denominated in currencies other than the U.S. dollar are remeasured in U.S. dollars and the associated outstanding forward contracts are marked-to-market. Currency forward contracts are valued at fair values based on bid prices of dealers or exchange quotations (referred to as Level 2). Realized and unrealized currency gains and losses on derivative instruments and the underlying monetary assets and liabilities are included in other operating income (expense). Total gross notional amounts and fair values for currency derivatives without hedge accounting designation were as follows:
67
|
|
Notional Amount
(1)
|
Fair Value
|
||||||||||
|
Currency
|
(in U.S. Dollars)
|
Asset
(2)
|
(Liability)
(3)
|
|||||||||
|
As of September 1, 2011:
|
|
|
|
|||||||||
|
Euro
|
$
|
301
|
|
$
|
3
|
|
$
|
—
|
|
|||
|
Singapore dollar
|
210
|
|
—
|
|
—
|
|
||||||
|
Yen
|
165
|
|
3
|
|
—
|
|
||||||
|
Other
|
148
|
|
—
|
|
(2
|
)
|
||||||
|
|
$
|
824
|
|
$
|
6
|
|
$
|
(2
|
)
|
|||
|
As of September 2, 2010:
|
|
|
|
|
|
|
||||||
|
Euro
|
$
|
260
|
|
$
|
—
|
|
$
|
(5
|
)
|
|||
|
Singapore dollar
|
157
|
|
—
|
|
—
|
|
||||||
|
Yen
|
104
|
|
1
|
|
—
|
|
||||||
|
|
$
|
521
|
|
$
|
1
|
|
$
|
(5
|
)
|
|||
|
(1)
|
Represents the face value of outstanding contracts
|
|
(2)
|
Included in other receivables
|
|
(3)
|
Included in other accounts payable and accrued expenses
|
For currency forward contracts without hedge accounting designation, we recognized gains of $
21 million
for
2011
and losses of $
29 million
for
2010
, which were included in other operating (income) expense.
Currency Derivatives with Cash Flow Hedge Accounting Designation
We utilize currency forward contracts that generally mature within
12
months to hedge the exposure of changes in cash flows from changes in currency exchange rates for certain forecasted capital expenditures. Currency forward contracts are valued at their fair values based on market-based observable inputs including currency exchange spot and forward rates, interest rate and credit risk spread (referred to as Level 2). For those derivatives designated as cash flow hedges, the effective portion of the realized and unrealized gain or loss on the derivatives was included as a component of accumulated other comprehensive income (loss) in shareholders' equity. The amounts in the accumulated other comprehensive income (loss) for those cash flow hedges are reclassified into earnings in the same line items of the consolidated statements of operations and in the same periods in which the underlying transactions affect earnings. The ineffective or excluded portion of the realized and unrealized gain or loss was included in other operating income (expense). Total gross notional amounts and fair values for currency derivatives with cash flow hedge accounting designation were as follows:
|
|
Notional Amount
(1)
|
Fair Value
|
|||||||||
|
Currency
|
(in U.S. Dollars)
|
Asset
(2)
|
(Liability)
(3)
|
||||||||
|
As of September 1, 2011:
|
|
|
|
||||||||
|
Euro
|
$
|
232
|
|
$
|
8
|
|
—
|
|
|||
|
Yen
|
19
|
|
1
|
|
—
|
|
|||||
|
|
$
|
251
|
|
$
|
9
|
|
—
|
|
|||
|
As of September 2, 2010:
|
|
|
|
|
|
|
|||||
|
Euro
|
$
|
196
|
|
$
|
1
|
|
—
|
|
|||
|
Yen
|
81
|
|
1
|
|
—
|
|
|||||
|
|
$
|
277
|
|
$
|
2
|
|
—
|
|
|||
|
(1)
|
Represents the face value of outstanding contracts
|
|
(2)
|
Included in other receivables
|
|
(3)
|
Included in other accounts payable and accrued expenses
|
68
For
2011
, we recognized $
49 million
of net derivative gains in other comprehensive income from the effective portion of cash flow hedges. The ineffective and excluded portions of cash flow hedges recognized in other operating income (expense) were not material in 2011. Amounts in accumulated other comprehensive income are amortized to manufacturing cost over the useful life of the underlying hedged equipment and reclassified to earnings when inventory is sold.
Fair Value Measurements
Accounting standards establish three levels of inputs that may be used to measure fair value: quoted prices in active markets for identical assets or liabilities (referred to as Level 1), observable inputs other than Level 1 that are observable for the asset or liability either directly or indirectly (referred to as Level 2) and unobservable inputs to the valuation methodology that are significant to the measurement of fair value of assets or liabilities (referred to as Level 3).
Fair Value Measurements on a Recurring Basis
Assets measured at fair value on a recurring basis were as follows:
|
|
2011
|
2010
|
||||||||||||||||||||||||||||||
|
|
Level 1
|
Level 2
|
Level 3
|
Total
|
Level 1
|
Level 2
|
Level 3
|
Total
|
||||||||||||||||||||||||
|
Money market
(1)
|
$
|
1,462
|
|
—
|
|
—
|
|
$
|
1,462
|
|
$
|
2,170
|
|
—
|
|
—
|
|
$
|
2,170
|
|
||||||||||||
|
Certificates of deposit
(2)
|
—
|
|
155
|
|
—
|
|
155
|
|
—
|
|
705
|
|
—
|
|
705
|
|
||||||||||||||||
|
Marketable equity investments
(3)
|
37
|
|
15
|
|
—
|
|
52
|
|
19
|
|
—
|
|
—
|
|
19
|
|
||||||||||||||||
|
Assets held for sale
(3)
|
—
|
|
—
|
|
35
|
|
35
|
|
—
|
|
—
|
|
56
|
|
56
|
|
||||||||||||||||
|
|
$
|
1,499
|
|
$
|
170
|
|
$
|
35
|
|
$
|
1,704
|
|
$
|
2,189
|
|
$
|
705
|
|
$
|
56
|
|
$
|
2,950
|
|
||||||||
|
(1)
|
Included in cash
and equivalents.
|
|
(2)
|
Amounts as of
September 1, 2011
were included in cash and equivalents. As of
September 2, 2010
, $
371 million
was included in cash
and equivalents and $
334 million
was included in restricted cash.
|
|
(3)
|
Included in other noncurrent assets.
|
Certificates of deposit
:
Certificates of deposit assets were valued using observable inputs in active markets for similar assets (Level 2).
Marketable equity investments
: All marketable equity investments were classified as available-for-sale. As of September 1, 2011, accumulated other comprehensive income included gross gains of
$32 million
and gross losses of
$7 million
from our available-for-sale securities. As of September 1, 2011, available-for-sale securities with a fair value of $15 million had unrealized losses of $7 million and been unrealized for less than three months. Gross realized gains and gross realized losses on sales of our marketable equity investments were not material for 2011, 2010 or 2009. Marketable equity investments as of September 1, 2011 included approximately
20 million
ordinary shares of Tower received in connection with our sale of the Japan Fab, which were valued using quoted market prices in an active market and discounted using a protective put model for our resale restriction (Level 2).
Assets held for sale
: Assets held for sale primarily included semiconductor equipment and facilities. Fair value for semiconductor equipment is based on quotations obtained from equipment dealers, which consider the remaining useful life and configuration of the equipment, and fair value of facilities is determined based on sales of similar facilities and properties in comparable markets (Level 3). Losses recognized in
2011
and
2010
due to fair value measurements using Level 3 inputs were
not material
.
Fair Value Measurements on a Nonrecurring Basis
We hold strategic investments in equity securities which are accounted for under the cost method. As of September 1, 2011, the aggregate carrying amount of all cost method investments was
$12 million
.
69
Fair Value of Financial Instruments
The estimated fair value and carrying value of debt instruments (carrying value excludes the equity component of the 2014 Notes, the 2027 Notes and the 2031 Notes which is classified in equity) were as follows:
|
|
2011
|
2010
|
||||||||||||||
|
|
Fair
Value
|
Carrying
Value
|
Fair
Value
|
Carrying
Value
|
||||||||||||
|
Convertible debt instruments (Level 1)
|
$
|
1,216
|
|
$
|
1,049
|
|
$
|
1,494
|
|
$
|
1,288
|
|
||||
|
Convertible debt instruments (Level 2)
|
629
|
|
529
|
|
—
|
|
—
|
|
||||||||
|
Other debt instruments
|
436
|
|
423
|
|
1,071
|
|
1,072
|
|
||||||||
The fair value of our Level 1 convertible debt instruments was based on quoted market prices in active markets. The fair value of our Level 2 convertible debt instruments was determined based on observable inputs of quoted market prices in markets with insufficient activity to be considered active and market prices for our stock. The fair value of our other debt instruments was estimated based on discounted cash flows using inputs that are observable in the market or that could be derived from or corroborated with observable market data, including interest rates based on yield curves of similar debt issued by parties with credit ratings similar to ours (Level 2). Amounts reported as cash and equivalents, receivables, and accounts payable and accrued expenses approximate fair value.
Equity Plans
As of
September 1, 2011
, we had an aggregate of
177.9 million
shares of common stock reserved for issuance of stock options and restricted stock awards, of which
108.1 million
shares were subject to outstanding awards and
69.8 million
shares were available for future awards. Awards are subject to terms and conditions as determined by our Board of Directors.
Stock Options
Our stock options are generally exercisable in increments of either one-fourth or one-third per year beginning one year from the date of grant. Stock options issued after September, 2004 generally expire six years from the date of grant. All other options expire ten years from the grant date.
Option activity for
2011
is summarized as follows:
|
Number of Shares
|
Weighted-Average Exercise Price Per Share
|
Weighted-Average Remaining Contractual Life
(In Years)
|
Aggregate Intrinsic Value
|
|||||||||||
|
Outstanding at September 2, 2010
|
116.3
|
|
$
|
12.79
|
|
|||||||||
|
Granted
|
15.3
|
|
9.05
|
|
||||||||||
|
Exercised
|
(6.1
|
)
|
4.61
|
|
||||||||||
|
Cancelled or expired
|
(26.2
|
)
|
19.07
|
|
||||||||||
|
Outstanding at September 1, 2011
|
99.3
|
|
11.06
|
|
2.6
|
|
$
|
41
|
|
|||||
|
Exercisable at September 1, 2011
|
61.8
|
|
$
|
13.53
|
|
1.5
|
|
$
|
15
|
|
||||
|
Expected to vest after September 1, 2011
|
36.5
|
|
6.92
|
|
4.3
|
|
26
|
|
||||||
70
The following table summarizes information about options outstanding as of
September 1, 2011
:
|
Outstanding Options
|
Exercisable Options
|
||||||||||||||||
|
Range of Exercise Prices
|
Number
of Shares
|
Weighted-Average Remaining Contractual Life (In Years)
|
Weighted-Average Exercise Price
Per Share
|
Number
of Shares
|
Weighted-Average Exercise Price
Per Share
|
||||||||||||
|
$ 1.56 - $ 6.86
|
19.5
|
|
3.1
|
|
$
|
3.72
|
|
8.2
|
|
$
|
4.06
|
|
|||||
|
7.01 - 9.97
|
28.6
|
|
4.7
|
|
8.31
|
|
3.8
|
|
7.82
|
|
|||||||
|
10.00 - 12.93
|
23.7
|
|
1.9
|
|
12.24
|
|
22.3
|
|
12.36
|
|
|||||||
|
13.00 - 19.61
|
14.7
|
|
1.0
|
|
14.86
|
|
14.7
|
|
14.86
|
|
|||||||
|
20.98 - 39.50
|
12.8
|
|
0.1
|
|
21.81
|
|
12.8
|
|
21.81
|
|
|||||||
|
99.3
|
|
2.6
|
|
11.06
|
|
61.8
|
|
13.53
|
|
||||||||
The weighted-average grant-date fair value per share was
$4.46
,
$4.13
and
$1.71
for options granted during
2011
,
2010
and
2009
, respectively. The total intrinsic value was
$35 million
,
$13 million
, and de minimis for options exercised during
2011
,
2010
and
2009
, respectively.
As of
September 1, 2011
,
$96 million
of total unrecognized compensation cost related to nonvested awards was expected to be recognized through the
fourth
quarter of
2015
, resulting in a weighted-average period of
1.3
years. As of
September 1, 2011
, nonvested options had a weighted-average exercise price of
$6.99
, a weighted-average remaining contractual life of
4.3
years and an aggregate intrinsic value of
$26 million
.
The fair values of option awards were estimated as of the dates of grant using the
Black-Scholes
option valuation model. The
Black-Scholes
model requires the input of assumptions, including the expected stock price volatility and estimated option life. The expected volatilities utilized were based on implied volatilities from traded options on our stock and on historical volatility. Since 2009, the expected lives of options granted were based, in part, on historical experience and on the terms and conditions of the options. Prior to 2009, the expected lives of options granted were based on the simplified method provided by the Securities and Exchange Commission. The risk-free interest rates utilized were based on the U.S. Treasury yield in effect at the time of the grant. No dividends were assumed in estimated option values. Assumptions used in the Black-Scholes model are presented below:
|
|
2011
|
2010
|
2009
|
||||||
|
Average expected life in years
|
5.1
|
|
5.1
|
|
4.9
|
|
|||
|
Weighted-average expected volatility
|
56
|
%
|
60
|
%
|
73
|
%
|
|||
|
Weighted-average risk-free interest rate
|
1.8
|
%
|
2.3
|
%
|
1.9
|
%
|
|||
Restricted Stock and Restricted Stock Units ("Restricted Stock Awards")
As of
September 1, 2011
, there were
8.8 million
shares of Restricted Stock Awards outstanding, of which
1.2 million
were performance-based Restricted Stock Awards. For service-based Restricted Stock Awards, restrictions generally lapse either in one-fourth or one-third increments during each year of employment after the grant date. For performance-based Restricted Stock Awards, vesting is contingent upon meeting certain performance goals. Restricted Stock Awards activity for
2011
is summarized as follows:
71
|
Number of Shares
|
Weighted-Average Grant Date Fair Value Per Share
|
||||||
|
Outstanding at September 2, 2010
|
8.6
|
|
$
|
7.89
|
|
||
|
Granted
|
5.6
|
|
8.72
|
|
|||
|
Restrictions lapsed
|
(5.0
|
)
|
8.26
|
|
|||
|
Cancelled
|
(0.4
|
)
|
8.85
|
|
|||
|
Outstanding at September 1, 2011
|
8.8
|
|
8.17
|
|
|||
|
Expected to vest after September 1, 2011
|
8.5
|
|
8.13
|
|
|||
Restricted Stock Awards granted for
2011
,
2010
and
2009
were as follows:
|
|
2011
|
2010
|
2009
|
|||||||||
|
Service-based awards
|
4.4
|
|
5.9
|
|
1.9
|
|
||||||
|
Performance-based awards
|
1.2
|
|
1.8
|
|
1.7
|
|
||||||
|
Weighted-average grant-date fair values per share
|
$
|
8.72
|
|
$
|
8.29
|
|
$
|
4.40
|
|
|||
Restricted Stock Awards granted during
2010
included
4.1 million
of service-based and
0.7 million
of performance-based Restricted Stock Awards as part of our acquisition of Numonyx. The aggregate fair value at the lapse date of awards for which restrictions lapsed during
2011
,
2010
and
2009
was
$43 million
,
$65 million
and
$8 million
, respectively. As of
September 1, 2011
, there was
$48 million
of total unrecognized compensation cost, net of estimated forfeitures, related to nonvested restricted stock awards, which is expected to be recognized through the
fourth
quarter of
2015
, resulting in a weighted-average period of
1.3
years.
Stock-based Compensation Expense
Total compensation costs for our equity plans were as follows:
|
|
2011
|
2010
|
2009
|
|||||||||
|
Stock-based compensation expense by caption:
|
|
|
|
|||||||||
|
Cost of goods sold
|
$
|
20
|
|
$
|
23
|
|
$
|
16
|
|
|||
|
Selling, general and administrative
|
38
|
|
50
|
|
16
|
|
||||||
|
Research and development
|
17
|
|
18
|
|
13
|
|
||||||
|
Other operating (income) expense
|
1
|
|
2
|
|
(1
|
)
|
||||||
|
|
$
|
76
|
|
$
|
93
|
|
$
|
44
|
|
|||
|
Stock-based compensation expense by type of award:
|
|
|
|
|
|
|
||||||
|
Stock options
|
$
|
44
|
|
$
|
37
|
|
$
|
29
|
|
|||
|
Restricted stock awards
|
32
|
|
56
|
|
15
|
|
||||||
|
|
$
|
76
|
|
$
|
93
|
|
$
|
44
|
|
|||
Stock-based compensation expense of
$5 million
and
$4 million
was capitalized and remained in inventory as of
September 1, 2011
and
September 2, 2010
, respectively. As of
September 1, 2011
,
$144 million
of total unrecognized compensation costs, net of estimated forfeitures, related to non-vested awards were expected to be recognized through the
fourth
quarter of
2015
, resulting in a weighted-average period of
1.3
years. During
2010
, we determined that certain performance-based restricted stock that previously had not been expensed met the probability threshold for expense recognition due to improved operating results. Stock-based compensation expense in the above presentation does not reflect any significant income tax benefits, which is consistent with our treatment of income or loss from our U.S. operations. (See "Income Taxes" note.)
72
Employee Benefit Plans
We have employee retirement plans at our U.S. and international sites. Details of the more significant plans are discussed as follows:
Employee Savings Plan for U.S. Employees
We have 401(k) retirement plans ("RAM Plans") under which U.S. employees may contribute up to
75%
of their eligible pay (subject to IRS annual contribution limits) to various savings alternatives, none of which include direct investment in our common stock. In
2011
we reinstated our match under the RAM Plans after being suspended in
2009
. We match in cash eligible contributions from employees up to
5%
of the employee's annual eligible earnings. Prior to the suspension of our match in 2009, we matched in cash eligible contributions from employees up to
4%
of the employee’s annual eligible earnings or
$2,000
, whichever was greater. Contribution expense for the RAM Plans was
$26 million
and
$16 million
in
2011
and
2009
, respectively.
Retirement Plans
We have pension plans in various countries worldwide. The pension plans are only available to local employees and are generally government mandated. We have determined that these pension plans are not material for separate disclosure.
Other Operating (Income) Expense, Net
Other operating (income) expense consisted of the following:
|
|
2011
|
2010
|
2009
|
|||||||||
|
Samsung patent cross-license agreement
|
$
|
(275
|
)
|
$
|
—
|
|
$
|
—
|
|
|||
|
Gain from disposition of Japan Fab
|
(54
|
)
|
—
|
|
—
|
|
||||||
|
Restructure
|
(21
|
)
|
(10
|
)
|
70
|
|
||||||
|
(Gain) loss on disposition of property, plant and equipment
|
(17
|
)
|
(1
|
)
|
54
|
|
||||||
|
(Gain) loss from changes in currency exchange rates
|
6
|
|
23
|
|
30
|
|
||||||
|
Goodwill impairment
|
—
|
|
—
|
|
58
|
|
||||||
|
Other
|
(19
|
)
|
(39
|
)
|
23
|
|
||||||
|
|
$
|
(380
|
)
|
$
|
(27
|
)
|
$
|
235
|
|
|||
In the first quarter of 2011, we entered into a 10-year patent cross-license agreement with Samsung Electronics Co. Ltd. ("Samsung"). Other operating income for 2011 included gains of
$275 million
for cash received from Samsung under the agreement. The license is a life-of-patents license for existing patents and applications, and a 10-year term license for all other patents.
Other operating income in 2011 included
$8 million
for receipts from the U.S. government in connection with anti-dumping tariffs. Other operating income in
2010
included $
24 million
of grant income related to our operations in China and $
12 million
of receipts from the U.S. government in connection with anti-dumping tariffs.
In the second quarter of 2009, our imaging operations (the primary component of All Other segment) experienced a severe decline in sales, margins and profitability due to a significant decline in demand as a result of the downturn in global economic conditions. The drop in market demand resulted in significant declines in average selling prices and unit sales. Due to these market and economic conditions, our imaging operations experienced a significant decline in market value. Accordingly, in the second quarter of 2009, we performed an assessment of our imaging operations goodwill for impairment. Based on this assessment, we wrote off all of the
$58 million
of goodwill associated with our imaging operations as of March 5, 2009.
73
In response to a severe downturn in the semiconductor memory industry and global economic conditions, we initiated a restructure plan in 2009. In the first quarter of 2009, IM Flash, our joint venture and Intel, terminated an agreement to obtain NAND Flash memory supply from our Boise facility. In connection therewith, Intel paid us $208 million in 2009. In addition, we phased out all remaining 200mm DRAM wafer manufacturing operations in Boise, Idaho in the second half of 2009. As a result of these restructure plans, we reduced employment in 2009 by approximately 4,600 employees, or approximately 20%. As of September 2, 2010, all amounts related to the restructure plan initiated in 2009 had been paid.
Other Non-Operating Income (Expense), Net
Other non-operating income (expense), net for 2011, included
$113 million
for losses recognized in connection with the Exchange Transaction, the Partial Repurchase of the 2014 Notes and the Partial Repurchase of the 2013 Notes. (See "Debt" note.) Other non-operating income (expense), net for 2010, included
$56 million
of gain recognized in connection with Inotera's sale of common shares in a public offering. (See "Equity Method Investments – Inotera and MeiYa DRAM joint ventures with Nanya" note.)
Income Taxes
Income (loss) before taxes, net (income) loss attributable to noncontrolling interests and equity in net income (loss) of equity method investees and income tax (provision) benefit consisted of the following:
|
|
2011
|
2010
|
2009
|
|||||||||
|
Income (loss) before taxes, net (income) loss attributable to noncontrolling interests and equity in net income (loss) of equity method investees:
|
|
|
|
|||||||||
|
Foreign
|
$
|
294
|
|
$
|
537
|
|
$
|
(427
|
)
|
|||
|
U.S.
|
257
|
|
1,383
|
|
(1,425
|
)
|
||||||
|
|
$
|
551
|
|
$
|
1,920
|
|
$
|
(1,852
|
)
|
|||
|
Income tax (provision) benefit:
|
||||||||||||
|
Current:
|
||||||||||||
|
Foreign
|
$
|
(89
|
)
|
$
|
(24
|
)
|
$
|
(12
|
)
|
|||
|
State
|
(1
|
)
|
(4
|
)
|
—
|
|
||||||
|
U.S. federal
|
—
|
|
66
|
|
12
|
|
||||||
|
|
(90
|
)
|
38
|
|
—
|
|
||||||
|
Deferred:
|
||||||||||||
|
Foreign
|
(113
|
)
|
(14
|
)
|
(1
|
)
|
||||||
|
U.S. federal
|
—
|
|
(5
|
)
|
—
|
|
||||||
|
|
(113
|
)
|
(19
|
)
|
(1
|
)
|
||||||
|
Income tax (provision) benefit
|
$
|
(203
|
)
|
$
|
19
|
|
$
|
(1
|
)
|
|||
74
Income tax (provision) benefit computed using the U.S. federal statutory rate reconciled to income tax (provision) benefit was as follows:
|
|
2011
|
2010
|
2009
|
|||||||||
|
U.S. federal income tax (provision) benefit at statutory rate
|
$
|
(193
|
)
|
$
|
(672
|
)
|
$
|
648
|
|
|||
|
Foreign operations
|
(119
|
)
|
135
|
|
(135
|
)
|
||||||
|
Debt repurchase premium
|
(20
|
)
|
—
|
|
—
|
|
||||||
|
State taxes, net of federal benefit
|
(5
|
)
|
(22
|
)
|
39
|
|
||||||
|
Change in valuation allowance
|
103
|
|
424
|
|
(572
|
)
|
||||||
|
Tax credits
|
17
|
|
3
|
|
18
|
|
||||||
|
Gain on acquisition of Numonyx
|
—
|
|
153
|
|
—
|
|
||||||
|
Other
|
14
|
|
(2
|
)
|
1
|
|
||||||
|
Income tax (provision) benefit
|
$
|
(203
|
)
|
$
|
19
|
|
$
|
(1
|
)
|
|||
State taxes reflect tax credits of
$10 million
,
$6 million
and
$7 million
for 2011, 2010 and 2009, respectively.
Deferred income taxes reflect the net tax effects of temporary differences between the bases of assets and liabilities for financial reporting and income tax purposes. Deferred tax assets and liabilities consist of the following as of the end of the periods shown below:
|
|
2011
|
2010
|
||||||
|
Deferred tax assets:
|
|
|
||||||
|
Net operating loss and credit carryforwards
|
$
|
1,581
|
|
$
|
1,336
|
|
||
|
Inventories
|
159
|
|
354
|
|
||||
|
Accrued salaries, wages and benefits
|
99
|
|
124
|
|
||||
|
Deferred income
|
55
|
|
92
|
|
||||
|
Basis differences in investments in joint ventures
|
21
|
|
71
|
|
||||
|
Property, plant and equipment
|
—
|
|
36
|
|
||||
|
Other
|
50
|
|
55
|
|
||||
|
Gross deferred tax assets
|
1,965
|
|
2,068
|
|
||||
|
Less valuation allowance
|
(1,446
|
)
|
(1,627
|
)
|
||||
|
Deferred tax assets, net of valuation allowance
|
519
|
|
441
|
|
||||
|
Deferred tax liabilities:
|
||||||||
|
Debt discount
|
(138
|
)
|
(92
|
)
|
||||
|
Unremitted earnings on certain subsidiaries
|
(117
|
)
|
(97
|
)
|
||||
|
Property, plant and equipment
|
(107
|
)
|
—
|
|
||||
|
Product and process technology
|
(50
|
)
|
(45
|
)
|
||||
|
Intangible assets
|
(24
|
)
|
(33
|
)
|
||||
|
Other
|
(13
|
)
|
(6
|
)
|
||||
|
Deferred tax liabilities
|
(449
|
)
|
(273
|
)
|
||||
|
Net deferred tax assets
|
$
|
70
|
|
$
|
168
|
|
||
|
Reported as:
|
||||||||
|
Current deferred tax assets (included in other current assets)
|
$
|
26
|
|
$
|
39
|
|
||
|
Noncurrent deferred tax assets (included in other noncurrent assets)
|
60
|
|
145
|
|
||||
|
Noncurrent deferred tax liabilities (included in other noncurrent liabilities)
|
(16
|
)
|
(16
|
)
|
||||
|
Net deferred tax assets
|
$
|
70
|
|
$
|
168
|
|
||
75
We have a valuation allowance against substantially all U.S. net deferred tax assets. As of September 1, 2011, our federal, state and foreign net operating loss carryforwards were
$2.9 billion
,
$2 billion
and
$529 million
, respectively. If not utilized, substantially all of our federal and state net operating loss carryforwards will expire in 2022 to 2031 and the foreign net operating loss carryforwards will begin to expire in 2015. As of September 1, 2011, our federal and state tax credit carryforwards were
$206 million
and
$215 million
, respectively. If not utilized, substantially all of our federal and state tax credit carryforwards will expire in 2013 to 2031. As a consequence of prior business acquisitions, utilization of the tax benefits for some of the tax carryforwards is subject to limitations imposed by Section 382 of the Internal Revenue Code and some portion or all of these carryforwards may not be available to offset any future taxable income.
The changes in valuation allowance of
$(181) million
and
$(379) million
in 2011 and 2010, respectively, are primarily due to utilization of U.S. net operating losses and certain tax credit carryforwards. The decrease in the valuation allowance in 2010 was offset with an increase in the valuation allowance of
$64 million
related to deferred tax assets of Numonyx consisting primarily of net operating losses in foreign jurisdictions.
Provision has been made for deferred taxes on undistributed earnings of non-U.S. subsidiaries to the extent that dividend payments from such companies are expected to result in additional tax liability. Remaining undistributed earnings of
$631 million
as of September 1, 2011 have been indefinitely reinvested; therefore, no provision has been made for taxes due upon remittance of these earnings. Determination of the amount of unrecognized deferred tax liability on these unremitted earnings is not practicable.
Below is a reconciliation of the beginning and ending amount of unrecognized tax benefits:
|
|
2011
|
2010
|
2009
|
|||||||||
|
Beginning unrecognized tax benefits
|
$
|
88
|
|
$
|
1
|
|
$
|
1
|
|
|||
|
Increases related to tax positions taken during current year
|
28
|
|
11
|
|
—
|
|
||||||
|
Foreign currency translation increases (decreases) to tax positions
|
6
|
|
—
|
|
—
|
|
||||||
|
Increases related to tax positions from prior years
|
4
|
|
14
|
|
—
|
|
||||||
|
Decreases related to tax positions from prior years
|
(3
|
)
|
—
|
|
—
|
|
||||||
|
Settlements with tax authorities
|
(2
|
)
|
(1
|
)
|
—
|
|
||||||
|
Unrecognized tax benefits acquired in current year
|
—
|
|
63
|
|
—
|
|
||||||
|
Expiration of foreign statutes of limitations
|
—
|
|
—
|
|
(1
|
)
|
||||||
|
Other
|
—
|
|
—
|
|
1
|
|
||||||
|
Ending unrecognized tax benefits
|
$
|
121
|
|
$
|
88
|
|
$
|
1
|
|
|||
Included in the unrecognized tax benefits balance as of September 1, 2011, September 2, 2010 and September 3, 2009 were
$113 million
,
$87 million
, and
$1 million
, respectively, of unrecognized income tax benefits, which if recognized, would affect our effective tax rate. In connection with the acquisition of Numonyx in fiscal 2010, we accrued a
$66 million
liability related to uncertain tax positions on the tax years of Numonyx open to examination. We recorded an indemnification asset for a significant portion of these unrecognized income tax benefits related to uncertain tax positions. We recognize interest and penalties related to income tax matters within income tax expense. As of September 1, 2011 and September 2, 2010, accrued interest and penalties related to uncertain tax positions was
$16 million
and
$6 million
.
We are unable to reasonably estimate possible increases or decreases in uncertain tax positions that may occur within the next 12 months due to the uncertainty of the timing of the resolution and/or closure on audits. However, we do not anticipate any such change would be material.
We currently operate in several tax jurisdictions where we have arrangements that allow us to compute our tax provision at rates below the local statutory rates that expire in whole or in part at various dates through 2026. These arrangements benefitted our tax provision in 2011 and 2010 by approximately
$72 million
(approximately
$0.07
per diluted share) and approximately
$69 million
(approximately
$0.07
per diluted share), respectively.
76
We and our subsidiaries file income tax returns with the United States federal government, various U.S. states and various foreign jurisdictions throughout the world. Our U.S. federal and state tax returns remain open to examination for 2006 through 2011. In addition, tax years open to examination in multiple foreign taxing jurisdictions range from 2004 to 2011. We are currently under examination in various taxing jurisdictions in which we conduct business operations. We believe that adequate amounts of taxes and related interest and penalties have been provided for, and any adjustments as a result of the examinations are not expected to adversely impact our financial condition.
Earnings Per Share
|
|
2011
|
2010
|
2009
|
|||||||||
|
Net income (loss) available to Micron shareholders – Basic
|
$
|
167
|
|
$
|
1,850
|
|
$
|
(1,882
|
)
|
|||
|
Net effect of assumed conversion of debt
|
—
|
|
93
|
|
—
|
|
||||||
|
Net income (loss) available to Micron shareholders – Diluted
|
$
|
167
|
|
$
|
1,943
|
|
$
|
(1,882
|
)
|
|||
|
Weighted-average common shares outstanding – Basic
|
988.0
|
|
887.5
|
|
800.7
|
|
||||||
|
Net effect of dilutive equity awards, escrow shares and assumed conversion of debt
|
19.5
|
|
163.2
|
|
—
|
|
||||||
|
Weighted-average common shares outstanding – Diluted
|
1,007.5
|
|
1,050.7
|
|
800.7
|
|
||||||
|
Earnings (loss) per share:
|
|
|
|
|
||||||||
|
Basic
|
$
|
0.17
|
|
$
|
2.09
|
|
$
|
(2.35
|
)
|
|||
|
Diluted
|
0.17
|
|
1.85
|
|
(2.35
|
)
|
||||||
On May 7, 2010, in connection with the acquisition of Numonyx, we issued
137.7 million
shares of our common stock and issued
4.8 million
restricted stock units. Of the common stock issued,
21 million
shares were held in escrow as partial security for Numonyx shareholders indemnity obligations. During 2011, the Numonyx shareholders sold all of the
21 million
shares in escrow. The shares held in escrow were included in diluted earnings per share but were excluded from basic earnings per share. (See "Numonyx" note.)
Listed below are the potential common shares, as of the end of the periods shown, that could dilute basic earnings per share in the future that were not included in the computation of diluted earnings per share because to do so would have been antidilutive:
|
2011
|
2010
|
2009
|
|||||||
|
Employee stock plans
|
81.4
|
|
92.2
|
|
126.0
|
|
|||
|
Convertible notes
|
182.7
|
|
—
|
|
142.8
|
|
|||
O
ur 2027 Notes and 2031 Notes contain terms that on conversion require us to settle the aggregate principal amount of the notes in cash and the remainder of our conversion obligation amount in either shares of our common stock or cash, at our election. As a result of these terms, the
88.7 million
underlying shares for these convertible notes as of September 1, 2011 are considered in diluted earnings per share under the treasury stock method.
(See "Debt" note.)
Consolidated Variable Interest Entities
NAND Flash Joint Ventures with Intel ("IM Flash")
We have two joint ventures with Intel: IMFT, formed in 2006 and IMFS, formed in 2007, to manufacture NAND Flash memory products for the exclusive benefit of the partners. IMFT and IMFS are each governed by a Board of Managers, the number of which adjusts depending on the parties' respective ownership interests. We and Intel initially appointed an equal number of managers to each of the boards. These joint venture arrangements extend through 2016 but are subject to prior termination under certain terms and conditions. IMFT and IMFS are aggregated as IM Flash in the following disclosure due to
77
the similarity of their function, operations and the way our management reviews the results of their operations. The partners' ownership percentages are based on contributions to the partnership. As of September 1, 2011, we owned
51%
and Intel owned
49%
of IMFT and we owned
86%
and Intel owned
14%
of IMFS. In September 2011, subsequent to the end of our 2011, we contributed
$103 million
and Intel contributed
$131 million
to IMFS, decreasing our ownership interest in IMFS to
82%
.
Although our ownership interest in IMFS changes at the time we make contributions, our share of the operating costs and supply from IMFS adjusts in proportion to changes in our ownership share either 12 months or 8 months (depending on the status of IMFS' production ramp) from the date of the applicable ownership change. Accordingly, we anticipate that our share of IMFS costs and supply will increase from
57%
as of
September 1, 2011
to our current ownership interest in IMFS over 2012. Changes in IMFS ownership interests do not affect our NAND Flash R&D cost-sharing agreement with Intel.
The following table presents IM Flash's distributions to and contributions from its shareholders:
|
For the year ended
|
2011
|
2010
|
2009
|
|||||||||
|
IM Flash distributions to Micron
|
$
|
234
|
|
$
|
278
|
|
$
|
723
|
|
|||
|
IM Flash distributions to Intel
|
225
|
|
267
|
|
695
|
|
||||||
|
Micron contributions to IM Flash
|
1,580
|
|
128
|
|
25
|
|
||||||
|
Intel contributions to IM Flash
|
—
|
|
38
|
|
24
|
|
||||||
IM Flash sells products to the joint venture partners generally in proportion to their ownership interests at long-term negotiated prices approximating cost. IM Flash sales to Intel were $
884 million
, $
764 million
and $
886 million
for 2011, 2010 and 2009, respectively. As of
September 1, 2011
and
September 2, 2010
, IM Flash had receivables of $
165 million
and $
128 million
, respectively, from sales of product to Intel.
Total IM Flash assets and liabilities included in our consolidated balance sheets were as follows:
|
As of
|
September 1,
2011 |
September 2, 2010
|
||||||
|
Assets
|
|
|
||||||
|
Cash and equivalents
|
$
|
327
|
|
$
|
246
|
|
||
|
Receivables
|
252
|
|
154
|
|
||||
|
Inventories
|
227
|
|
160
|
|
||||
|
Other current assets
|
11
|
|
8
|
|
||||
|
Total current assets
|
817
|
|
568
|
|
||||
|
Property, plant and equipment, net
|
4,121
|
|
2,894
|
|
||||
|
Other noncurrent assets
|
66
|
|
57
|
|
||||
|
Total assets
|
$
|
5,004
|
|
$
|
3,519
|
|
||
|
Liabilities
|
|
|
|
|
||||
|
Accounts payable and accrued expenses
|
$
|
458
|
|
$
|
140
|
|
||
|
Deferred income
|
125
|
|
127
|
|
||||
|
Equipment purchase contracts
|
37
|
|
8
|
|
||||
|
Current portion of long-term debt
|
8
|
|
7
|
|
||||
|
Total current liabilities
|
628
|
|
282
|
|
||||
|
Long-term debt
|
58
|
|
62
|
|
||||
|
Other noncurrent liabilities
|
4
|
|
4
|
|
||||
|
Total liabilities
|
$
|
690
|
|
$
|
348
|
|
||
Our ability to access IM Flash's cash and marketable investment securities to finance our other operations is subject to agreement by the joint venture partners. The creditors of each IM Flash entity have recourse only to the assets of each of the respective IM Flash entities and do not have recourse to any other of our assets.
78
IM Flash manufactures NAND Flash memory products using designs and technology we develop with Intel. We generally share product design and other NAND Flash research and development ("R&D") costs equally with Intel. As a result, R&D expenses were reduced by reimbursements from Intel of $
95 million
, $
104 million
and $
107 million
for
2011
,
2010
and
2009
, respectively.
MP Mask Technology Center, LLC ("MP Mask")
In 2006, we formed a joint venture with Photronics to produce photomasks for leading-edge and advanced next generation semiconductors. At inception and through
September 1, 2011
, we owned
50.01%
and Photronics owned
49.99%
of MP Mask. In connection with the formation of the joint venture, we received $
72 million
in 2006 in exchange for entering into a license agreement with Photronics, which is being recognized over the term of the 10-year agreement. As of
September 1, 2011
, deferred income and other noncurrent liabilities included an aggregate of $
34 million
related to this agreement. In 2011, Photronics contributed $
8 million
and we contributed $
9 million
to MP Mask. MP mask made distributions to both us and Photronics of $
10 million
each in 2009. We purchase a substantial majority of the reticles produced by MP Mask pursuant to a supply arrangement.
Total MP Mask assets and liabilities included in our consolidated balance sheets were as follows:
|
As of
|
September 1,
2011 |
September 2, 2010
|
||||||
|
Current assets
|
$
|
24
|
|
$
|
35
|
|
||
|
Noncurrent assets (primarily property, plant and equipment)
|
143
|
|
85
|
|
||||
|
Current liabilities
|
31
|
|
6
|
|
||||
The creditors of MP Mask have recourse only to the assets of MP Mask and do not have recourse to any other of our assets.
In May 2009, we leased to Photronics a facility to produce photomasks under an operating lease. The lease provided for quarterly lease payments aggregating
$41 million
through
October 2014
. During 2011 and 2010, we received
$8 million
and
$7 million
, respectively, in lease payments from Photronics. As of
September 1, 2011
and
September 2, 2010
, the carrying value of this facility was
$44 million
and
$47 million
, respectively.
TECH Semiconductor Singapore Pte. Ltd.
Since 1998, we had participated in TECH Semiconductor Singapore Pte. Ltd. ("TECH"), a semiconductor memory manufacturing joint venture in Singapore with Canon Inc. ("Canon") and Hewlett-Packard Singapore (Private) Limited ("HP"). In December 2010 and January 2011, we acquired HP's and Canon's interests, respectively, in two separate transactions for an aggregate of
$159 million
. In connection therewith, noncontrolling interests in subsidiaries decreased by
$226 million
and additional capital increased by
$67 million
. As a result of these transactions, our ownership interest in TECH increased during 2011 from
87%
to
100%
.
In 2010, we purchased shares of TECH for
$80 million
, which increased our ownership from
85%
to
87%
and increased additional capital by
$10 million
. The effects of changes in our ownership interest in TECH on total Micron shareholders' equity were as follows:
|
For the year ended
|
2011
|
2010
|
||||||
|
Net income attributable to Micron
|
$
|
167
|
|
$
|
1,850
|
|
||
|
Transfers from noncontrolling interest that increased additional capital:
|
||||||||
|
Acquisition of noncontrolling interests in TECH
|
67
|
|
10
|
|
||||
|
Change from net income attributable to Micron and transfers from noncontrolling interests
|
$
|
234
|
|
$
|
1,860
|
|
||
79
Segment Information
In the second quarter of 2011, we reorganized our business to better align with the markets we serve. All prior period amounts have been retrospectively adjusted to reflect this reorganization. Factors used to identify our segments include, among others, products, technologies and customers. Segment information reported herein is consistent with how it is reviewed and evaluated by our chief operating decision makers. After our reorganization, we have the following four reportable segments:
DRAM Solutions Group ("DSG"):
Includes DRAM products sold to the PC, consumer electronics, networking and server markets.
NAND Solutions Group ("NSG"):
Includes high-volume NAND Flash products sold into data storage, personal music players, and the high-density computing markets, as well as NAND Flash products sold to Intel through our consolidated IM Flash joint ventures.
Wireless Solutions Group ("WSG"):
Includes DRAM, NAND Flash and NOR Flash products, including multi-chip packages, sold to the mobile device market.
Embedded Solutions Group ("ESG"):
Includes DRAM, NAND Flash and NOR Flash products sold into automotive and industrial applications, as well as NOR and NAND flash sold to consumer electronics, networking, PC and server markets.
Our other operations do not meet the quantitative thresholds of a reportable segment and are reported under All Other. All Other includes our CMOS image sensor, LED, microdisplay and solar operations.
For 2011, certain operating expenses directly associated with the activities of a specific reportable segment are charged to that segment. Other indirect operating expenses (income) are generally allocated to the reportable segments based on their respective percentage of total net sales, cost of goods sold or forecast wafer production. Prior to 2011, operating expenses were allocated to the reportable segments based on their respective percentage of total cost of goods sold, as certain historical forecast data was not available.
We do not identify or report internally our assets or capital expenditures by segment, nor do we allocate gains and losses from equity method investments, interest, other non-operating income or expense items or taxes to operating segments. There are no differences in the accounting policies for segment reporting and our consolidated results of operations.
|
|
2011
|
2010
|
2009
|
|||||||||
|
Net sales:
|
|
|
||||||||||
|
DSG
|
$
|
3,203
|
|
$
|
4,638
|
|
$
|
2,100
|
|
|||
|
NSG
|
2,196
|
|
2,113
|
|
1,747
|
|
||||||
|
WSG
|
1,959
|
|
778
|
|
247
|
|
||||||
|
ESG
|
1,002
|
|
521
|
|
178
|
|
||||||
|
All Other
|
428
|
|
432
|
|
531
|
|
||||||
|
|
$
|
8,788
|
|
$
|
8,482
|
|
$
|
4,803
|
|
|||
|
Operating income (loss):
|
|
|
|
|
||||||||
|
DSG
|
$
|
290
|
|
$
|
1,269
|
|
$
|
(902
|
)
|
|||
|
NSG
|
269
|
|
240
|
|
(573
|
)
|
||||||
|
WSG
|
20
|
|
(23
|
)
|
(63
|
)
|
||||||
|
ESG
|
237
|
|
152
|
|
37
|
|
||||||
|
All Other
|
(61
|
)
|
(49
|
)
|
(175
|
)
|
||||||
|
|
$
|
755
|
|
$
|
1,589
|
|
$
|
(1,676
|
)
|
|||
80
Depreciation and amortization expense was as follows:
|
|
2011
|
2010
|
2009
|
|||||||||
|
DSG
|
$
|
750
|
|
$
|
947
|
|
$
|
979
|
|
|||
|
NSG
|
513
|
|
530
|
|
780
|
|
||||||
|
WSG
|
512
|
|
212
|
|
103
|
|
||||||
|
ESG
|
196
|
|
97
|
|
47
|
|
||||||
|
All Other
|
130
|
|
140
|
|
205
|
|
||||||
|
Depreciation and amortization expense included in operating income (loss)
|
2,101
|
|
1,926
|
|
2,114
|
|
||||||
|
Other amortization
|
61
|
|
79
|
|
72
|
|
||||||
|
Total depreciation and amortization expense
|
$
|
2,162
|
|
$
|
2,005
|
|
$
|
2,186
|
|
|||
Product Sales
Product sales were as follows:
|
|
2011
|
2010
|
2009
|
|||||||||
|
DRAM
|
$
|
3,620
|
|
$
|
5,052
|
|
$
|
2,422
|
|
|||
|
NAND Flash
|
3,193
|
|
2,555
|
|
1,857
|
|
||||||
|
NOR Flash
|
1,547
|
|
451
|
|
—
|
|
||||||
|
Other
|
428
|
|
424
|
|
524
|
|
||||||
|
$
|
8,788
|
|
$
|
8,482
|
|
$
|
4,803
|
|
||||
Certain Concentrations
Market concentrations from
2011
net sales were approximately as follows: computing (including desktop PCs, servers, notebooks and workstations),
30%
; mobile,
25%
; consumer electronics,
15%
; and networking and storage,
15%
. Market concentrations from 2010 net sales were approximately
45%
computing and for 2009 net sales were approximately
30%
computing. Customer concentrations for 2011 net sales were approximately
10%
with Intel, for 2010 net sales were
13%
with HP and for 2009 net sales were
20%
with Intel. Substantially all of our sales to Intel in 2011 and 2009 were included in the NSG and WSG segments and substantially all of our sales to HP in 2010 were included in the DSG segment.
Certain of the raw materials and production equipment we use in manufacturing semiconductor products are available from multiple sources and in sufficient supply; however, only a limited number of suppliers are capable of delivering certain raw materials that meet our standards. In some cases, materials are provided by a single supplier.
Financial instruments that potentially subject us to concentrations of credit risk consist principally of cash, money market accounts, certificates of deposit and trade receivables. We invest through high-credit-quality financial institutions and, by policy, generally limit the concentration of credit exposure by restricting investments with any single obligor. A concentration of credit risk may exist with respect to receivables as a substantial portion of our customers are affiliated with the computing industry. We perform ongoing credit evaluations of customers worldwide and generally do not require collateral from our customers. Historically, we have not experienced significant losses on receivables. The 2011 Capped Calls, 2009 Capped Calls and 2007 Capped Calls expose us to credit risk to the extent that the counter parties may be unable to meet the terms of the agreement. We seek to mitigate such risk by limiting our counter parties to major financial institutions and by spreading the risk across several major financial institutions. In addition, the potential risk of loss with any one counter party resulting from this type of credit risk is monitored on an ongoing basis. (See "Shareholders' Equity - Capped Call Transactions" note.)
81
Geographic Information
Geographic net sales based on customer ship-to location were as follows:
|
|
2011
|
2010
|
2009
|
|||||||||
|
China
|
$
|
2,983
|
|
$
|
3,294
|
|
$
|
1,242
|
|
|||
|
Asia Pacific (excluding China, Taiwan and Malaysia)
|
1,518
|
|
1,090
|
|
990
|
|
||||||
|
United States
|
1,363
|
|
1,403
|
|
928
|
|
||||||
|
Europe
|
924
|
|
777
|
|
470
|
|
||||||
|
Taiwan
|
744
|
|
711
|
|
447
|
|
||||||
|
Malaysia
|
737
|
|
817
|
|
542
|
|
||||||
|
Other
|
519
|
|
390
|
|
184
|
|
||||||
|
|
$
|
8,788
|
|
$
|
8,482
|
|
$
|
4,803
|
|
|||
Net property, plant and equipment by geographic area were as follows:
|
|
2011
|
2010
|
2009
|
|||||||||
|
Singapore
|
$
|
3,569
|
|
$
|
2,161
|
|
$
|
2,066
|
|
|||
|
United States
|
3,487
|
|
3,925
|
|
4,679
|
|
||||||
|
Italy
|
190
|
|
173
|
|
180
|
|
||||||
|
China
|
179
|
|
90
|
|
48
|
|
||||||
|
Israel
|
94
|
|
111
|
|
—
|
|
||||||
|
Japan
|
1
|
|
81
|
|
112
|
|
||||||
|
Other
|
35
|
|
60
|
|
4
|
|
||||||
|
|
$
|
7,555
|
|
$
|
6,601
|
|
$
|
7,089
|
|
|||
82
Quarterly Financial Information (Unaudited)
(in millions except per share amounts)
|
2011
|
Fourth Quarter
|
Third Quarter
|
Second Quarter
|
First Quarter
|
||||||||||||
|
Net sales
|
$
|
2,140
|
|
$
|
2,139
|
|
$
|
2,257
|
|
$
|
2,252
|
|
||||
|
Gross margin
|
321
|
|
478
|
|
435
|
|
524
|
|
||||||||
|
Operating income (loss)
|
(51
|
)
|
237
|
|
179
|
|
390
|
|
||||||||
|
Net income (loss)
|
(134
|
)
|
77
|
|
75
|
|
172
|
|
||||||||
|
Net income (loss) attributable to Micron
|
(135
|
)
|
75
|
|
72
|
|
155
|
|
||||||||
|
Earnings (loss) per share:
|
|
|
|
|
|
|
|
|
||||||||
|
Basic
|
$
|
(0.14
|
)
|
$
|
0.07
|
|
$
|
0.07
|
|
$
|
0.16
|
|
||||
|
Diluted
|
(0.14
|
)
|
0.07
|
|
0.07
|
|
0.15
|
|
||||||||
The results of operations for the third quarter of 2011 included a gain of
$54 million
in connection with the sale of the Japan Fab. In addition, we recorded a tax provision of
$74 million
related to the gain on the sale and to write down certain deferred tax assets associated with the Japan Fab.
The results of operations for the first, second and third quarters of 2011 included license revenue, net of tax,of
$167 million
,
$33 million
and
$30 million
, respectively, for a life-of-patents license for existing patents and applications, and a 10-year term license for all other patents, from Samsung Electronics, Ltd.
The results of operations in the first quarter of 2011 included a loss of
$113 million
for a debt restructure transaction.
|
2010
|
Fourth Quarter
|
Third Quarter
|
Second Quarter
|
First Quarter
|
||||||||||||
|
Net sales
|
$
|
2,493
|
|
$
|
2,288
|
|
$
|
1,961
|
|
$
|
1,740
|
|
||||
|
Gross margin
|
781
|
|
848
|
|
642
|
|
443
|
|
||||||||
|
Operating income
|
433
|
|
540
|
|
415
|
|
201
|
|
||||||||
|
Net income
|
359
|
|
960
|
|
379
|
|
202
|
|
||||||||
|
Net income attributable to Micron
|
342
|
|
939
|
|
365
|
|
204
|
|
||||||||
|
Earnings per share:
|
|
|
|
|
|
|
|
|
||||||||
|
Basic
|
$
|
0.35
|
|
$
|
1.06
|
|
$
|
0.43
|
|
$
|
0.24
|
|
||||
|
Diluted
|
0.32
|
|
0.92
|
|
0.39
|
|
0.23
|
|
||||||||
The results of operations for the third quarter of 2010 included a gain of
$437 million
for the acquisition of Numonyx. (See "Numonyx" note.)
83
Report of Independent Registered Public Accounting Firm
To the Board of Directors and Shareholders
of Micron Technology, Inc.
In our opinion, the consolidated financial statements listed in the accompanying index appearing under Item 8 present fairly, in all material respects, the financial position of Micron Technology, Inc. and its subsidiaries at September 1, 2011 and September 2, 2010, and the results of their
operations and their cash flows for each of the three years in the period ended September 1, 2011 in conformity with accounting principles generally accepted in the United States of America. In addition, in our opinion, the financial statement schedule listed in the accompanying index under Item 8 presents fairly, in all material respects, the information set forth therein when read in conjunction with the related consolidated
financial statements. Also in our opinion, the Company maintained, in all material respects, effective internal control over financial reporting as of September 1, 2011, based on criteria established in
Internal Control - Integrated Framework
issued by the Committee of Sponsoring Organizations of the Treadway Commission (COSO). The Company's management is responsible for these financial statements and financial statement schedule, for maintaining effective internal control over financial reporting and for its assessment of the effectiveness of internal control over financial reporting, included in Management's Report on Internal Control over Financial Reporting appearing under Item 9A. Our responsibility is to express opinions on these financial statements, on the financial statement schedule, and on the Company's internal control over financial reporting based on our integrated audits. We conducted our audits in accordance with the standards of the Public Company Accounting Oversight Board (United States). Those standards require that we plan and perform the audits to obtain reasonable assurance about whether the financial statements are free of material misstatement and whether effective internal control over financial reporting was maintained in all material respects. Our audits of the financial statements included examining, on a test basis, evidence supporting the amounts and disclosures in the financial statements, assessing the accounting principles used and significant estimates made by management, and evaluating the overall financial statement presentation. Our audit of internal control over financial reporting included obtaining an understanding of internal control over financial reporting, assessing the risk that a material weakness exists, and testing and evaluating the design and operating effectiveness of internal control based on the assessed risk. Our audits also included performing such other procedures as we considered necessary in the circumstances. We believe that our audits provide a reasonable basis for our opinions.
A company's internal control over financial reporting is a process designed to provide reasonable assurance regarding the reliability of financial reporting and the preparation of financial statements for external purposes in accordance with generally accepted accounting principles. A company's internal control over financial reporting includes those policies and procedures that (i) pertain to the maintenance of records that, in reasonable detail, accurately and fairly reflect the transactions and dispositions of the assets of the company; (ii) provide reasonable assurance that transactions are recorded as necessary to permit preparation of financial statements in accordance with generally accepted accounting principles, and that receipts and expenditures of the company are being made only in accordance with authorizations of management and directors of the company; and (iii) provide reasonable assurance regarding prevention or timely detection of unauthorized acquisition, use, or disposition of the company's assets that could have a material effect on the financial statements.
Because of its inherent limitations, internal control over financial reporting may not prevent or detect misstatements. Also, projections of any evaluation of effectiveness to future periods are subject to the risk that controls may become inadequate because of changes in conditions, or that the degree of compliance with the policies or procedures may deteriorate.
/s/ PricewaterhouseCoopers LLP
San Jose, CA
October 25, 2011
84
None.
An evaluation was carried out under the supervision and with the participation of our management, including our principal executive officer and principal financial officer, of the effectiveness of the design and operation of our disclosure controls and procedures (as defined in Rule 13a-15(e) and 15d-15(e) under the Securities Exchange Act of 1934) as of the end of the period covered by this report. Based upon that evaluation, the principal executive officer and principal financial officer concluded that those disclosure controls and procedures were effective to ensure that information required to be disclosed by us in the reports that we file or submit under the Exchange Act are recorded, processed, summarized and reported, within the time periods specified in the Commission's rules and forms and that such information is accumulated and communicated to our management, including the principal executive officer and principal financial officer, to allow timely decision regarding disclosure.
During the fourth quarter of 2011, there were no changes in our internal control over financial reporting that have materially affected, or are reasonably likely to materially affect, our internal control over financial reporting.
Management’s Report on Internal Control over Financial Reporting
Our management is responsible for establishing and maintaining adequate internal control over financial reporting. Internal control over financial reporting is a process designed to provide reasonable assurance regarding the reliability of financial reporting and the preparation of financial statements for external purposes in accordance with accounting principles generally accepted in the United States of America. Our internal control over financial reporting includes those policies and procedures that (i) pertain to the maintenance of records that in reasonable detail accurately reflect the transactions and dispositions of our assets; (ii) provide reasonable assurance that transactions are recorded as necessary to permit preparation of financial statements in accordance with generally accepted accounting principles, and that our receipts and expenditures are being made only in accordance with authorizations of our management and directors; and (iii) provide reasonable assurance regarding prevention or timely detection of unauthorized acquisition, use or disposition of our assets that could have a material effect on our financial statements.
Internal control over financial reporting cannot provide absolute assurance regarding the prevention or detection of misstatements because of inherent limitations. These inherent limitations are known by management and considered in the design of our internal control over financial reporting which reduce, though not eliminate, this risk.
Management conducted an evaluation of the effectiveness of our internal control over financial reporting based on the framework in "Internal Control – Integrated Framework" issued by the Committee of Sponsoring Organizations of the Treadway Commission. Based on this evaluation, management concluded that our internal control over financial reporting was effective as of September 1, 2011. The effectiveness of our internal control over financial reporting as of September 1, 2011 has been audited by PricewaterhouseCoopers LLP, an independent registered public accounting firm, as stated in their report, which is included in Part II, Item 8, of this Form 10-K.
None.
85
Certain information concerning our executive officers is included under the caption, "Directors and Executive Officers of the Registrant," in Part I, Item 1 of this report. Other information required by Items 10, 11, 12, 13 and 14 will be contained in our Proxy Statement which will be filed with the Securities and Exchange Commission within 120 days after September 1, 2011 and is incorporated herein by reference.
The following documents are filed as part of this report:
|
1.
|
Financial Statement: See Index to Consolidated Financial Statements under Item 8.
|
|
2.
|
Certain Financial Statement Schedules have been omitted since they are either not required, not applicable or the information is otherwise included.
|
|
3.
|
Exhibits.
|
|
Description of Exhibits
|
|
|
1.1
|
Underwriting Agreement dated as of May 17, 2007, by and between Micron Technology, Inc. and Morgan Stanley & Co. Incorporated, as representative of the underwriters (1)
|
|
1.2
|
Note Underwriting Agreement, dated as of April 8, 2009, by and among Micron Technology, Inc. and Morgan Stanley & Co. Incorporated and Goldman, Sachs & Co., as representatives of the underwriters (2)
|
|
1.3
|
Common Stock Underwriting Agreement, dated as of April 8, 2009, by and among Micron Technology, Inc. and Morgan Stanley & Co. Incorporated and Goldman, Sachs & Co., as representatives of the underwriters (2)
|
|
3.1
|
Restated Certificate of Incorporation of the Registrant (3)
|
|
3.2
|
Bylaws of the Registrant, as amended (4)
|
|
4.1
|
Indenture, dated November 3, 2010, by and between Micron Technology, Inc. and Wells Fargo Bank, National Association (5)
|
|
4.6
|
Indenture dated as of May 23, 2007, by and between Micron Technology, Inc. and Wells Fargo Bank, National Association, as trustee (1)
|
|
4.7
|
Convertible Senior Indenture between the Company and Wells Fargo Bank, National Association, dated as of April 15, 2009 (6)
|
|
4.8
|
Form of 4.25% Convertible Senior Note due October 15, 2013 (6)
|
|
4.9
|
Indenture, dated July 26, 2011, by and between Micron Technology, Inc. and U.S. Bank National Association, as Trustee for 1.50% Convertible Senior Notes due 2031 (7)
|
|
4.10
|
Indenture, dated July 26, 2011, by and between Micron Technology, Inc. and U.S. Bank National Association, as Trustee for 1.875% Convertible Senior Notes due 2031 (7)
|
|
10.1
|
Executive Officer Performance Incentive Plan, as Amended (8)
|
86
|
10.3
|
1994 Stock Option Plan, as Amended (8)
|
|
10.4
|
1994 Stock Option Plan Form of Agreement and Terms and Conditions (9)
|
|
10.5
|
1997 Nonstatutory Stock Option Plan, as Amended (8)
|
|
10.6
|
1998 Non-Employee Director Stock Incentive Plan, as Amended (8)
|
|
10.7
|
1998 Nonstatutory Stock Option Plan, as Amended (8)
|
|
10.8
|
2001 Stock Option Plan, as Amended (8)
|
|
10.9
|
2001 Stock Option Plan Form of Agreement (10)
|
|
10.10
|
2002 Employment Inducement Stock Option Plan, as Amended (8)
|
|
10.11
|
2004 Equity Incentive Plan, as Amended (11)
|
|
10.12
|
2004 Equity Incentive Plan Forms of Agreement and Terms and Conditions (9)
|
|
10.13
|
Nonstatutory Stock Option Plan, as Amended (8)
|
|
10.14
|
Nonstatutory Stock Option Plan Form of Agreement and Terms and Conditions (9)
|
|
10.15
|
Lexar Media, Inc. 2000 Equity Incentive Plan, as Amended (8)
|
|
10.20*
|
Settlement and Release Agreement dated September 15, 2006, by and among Toshiba Corporation, Micron Technology, Inc. and Acclaim Innovations, LLC (12)
|
|
10.21*
|
Patent License Agreement dated September 15, 2006, by and among Toshiba Corporation, Acclaim Innovations, LLC and Micron Technology, Inc. (12)
|
|
10.22*
|
Omnibus Agreement dated as of February 27, 2007, between Micron Technology, Inc. and Intel Corporation (13)
|
|
10.23*
|
Limited Liability Partnership Agreement dated as of February 27, 2007, between Micron Semiconductor Asia Pte. Ltd. and Intel Technology Asia Pte. Ltd. (13)
|
|
10.24*
|
Supply Agreement dated as of February 27, 2007, between Micron Semiconductor Asia Pte. Ltd. and IM Flash Singapore, LLP (13)
|
|
10.25*
|
Amended and Restated Limited Liability Company Operating Agreement of IM Flash Technologies, LLC dated as of February 27, 2007, between Micron Technology, Inc. and Intel Corporation (13)
|
|
10.26*
|
Supply Agreement dated as of February 27, 2007, between Intel Technology Asia Pte. Ltd. and IM Flash Singapore, LLP (13)
|
|
10.27
|
Form of Indemnification Agreement between the Registrant and its officers and directors (14)
|
|
10.28
|
Form of Severance Agreement between the Company and its officers (15)
|
|
10.29
|
Form of Agreement and Amendment to Severance Agreement between the Company and its officers (16)
|
|
10.36*
|
Master Agreement dated as of November 18, 2005, between Micron Technology, Inc. and Intel Corporation (17)
|
|
10.38*
|
Manufacturing Services Agreement dated as of January 6, 2006, between Micron Technology, Inc. and IM Flash Technologies, LLC (17)
|
|
10.40*
|
MTV Lease Agreement dated as of January 6, 2006, between Micron Technology, Inc. and IM Flash Technologies, LLC (17)
|
|
10.41*
|
Product Designs Assignment Agreement dated January 6, 2006, between Intel Corporation and Micron Technology, Inc. (17)
|
|
10.42*
|
NAND Flash Supply Agreement, effective as of January 6, 2006, between Apple Computer, Inc. and Micron Technology, Inc. (17)
|
|
10.43*
|
Supply Agreement dated as of January 6, 2006, between Micron Technology, Inc. and IM Flash Technologies, LLC (17)
|
|
10.44*
|
Supply Agreement dated as of January 6, 2006, between Intel Corporation and IM Flash Technologies, LLC (17)
|
|
10.45
|
Capped Call Confirmation (Reference No. CEODL6) by and between Micron Technology, Inc. and Morgan Stanley & Co. International plc (1)
|
|
10.46
|
Capped Call Confirmation (Reference No. 53228800) by and between Micron Technology, Inc. and Credit Suisse International (1)
|
|
10.47
|
Capped Call confirmation (Reference No. 53228855) by and between Micron Technology, Inc. and Credit Suisse International (1)
|
|
10.48
|
2007 Equity Incentive Plan, as Amended (18)
|
|
10.49
|
2007 Equity Incentive Plan Forms of Agreement (19)
|
|
10.50
|
Severance Agreement dated April 9, 2008, between Micron Technology, Inc. and Ronald C. Foster (20)
|
|
10.51*
|
Master Agreement, dated as of April 21, 2008, by and between Nanya Technology Corporation and Micron Technology, Inc. (21)
|
|
10.52*
|
Joint Venture Agreement, dated as of April 21, 2008, by and between Micron Semiconductor B.V. and Nanya Technology Corporation (21)
|
87
|
10.54*
|
Joint Development Program Agreement, dated as of April 21, 2008, by and between Nanya Technology Corporation and Micron Technology, Inc. (21)
|
|
10.55*
|
Technology Transfer and License Agreement for 68-50nm Process Nodes, dated as of April 21, 2008, by and between Micron Technology, Inc. and Nanya Technology Corporation (21)
|
|
10.56*
|
Technology Transfer and License Agreement, dated as of April 21, 2008, by and between Micron Technology, Inc. and Nanya Technology Corporation (21)
|
|
10.58*
|
Technology Transfer Agreement, dated as of May 13, 2008, by and among Nanya Technology Corporation, Micron Technology, Inc. and MeiYa Technology Corporation (21)
|
|
10.60
|
Micron Guaranty Agreement, dated April 21, 2008, by and between Nanya Technology Corporation and Micron Semiconductor B.V. (21)
|
|
10.61
|
TECH Facility Agreement, dated March 31, 2008, among TECH Semiconductor Singapore Pte. Ltd. and ABN Amro Bank N.V., Citibank, N.A., Singapore Branch, Citigroup Global Markets Singapore Pte Ltd., DBS Bank Ltd and Oversea-Chinese Banking Corporation Limited, as Original Mandated Lead Arrangers (21)
|
|
10.62
|
Guarantee, dated March 31, 2008, by Micron Technology, Inc. as Guarantor in favor of ABN Amro Bank N.V., Singapore Branch acting as Security Trustee (21)
|
|
10.63
|
Form of Severance Agreement (22)
|
|
10.64
|
Lexar Media, Inc. 1996 Stock Option Plan, as Amended (8)
|
|
10.66*
|
Loan Agreement, dated November 26, 2008, by and among Micron Semiconductor B.V., Micron Technology, Inc., and Nan Ya Plastics Corporation (8)
|
|
10.67
|
Loan Agreement, dated November 26, 2008, by and between Micron Technology, Inc. and Inotera Memories, Inc. (8)
|
|
10.69
|
Micron Guaranty Agreement, dated November 26, 2008, by Micron Technology, Inc. in favor of Nanya Technology Corporation (8)
|
|
10.70
|
Share Purchase Agreement by and among Micron Technology, Inc. as the Buyer Parent, Micron Semiconductor B.V., as the Buyer, Qimonda Ag as the Seller Parent and Qimonda Holding B.V., as the Seller Sub dated as of October 11, 2008 (8)
|
|
10.71*
|
Master Agreement, dated November 26, 2008, among Micron Technology, Inc., Micron Semiconductor B.V., Nanya Technology Corporation, MeiYa Technology Corporation and Inotera Memories, Inc. (8)
|
|
10.72*
|
Joint Venture Agreement, dated November 26, 2008, by and between Micron Semiconductor B.V. and Nanya Technology Corporation (8)
|
|
10.73*
|
Facilitation Agreement, dated November 26, 2008, by and between Micron Semiconductor B.V., Nanya Technology Corporation and Inotera Memories, Inc. (8)
|
|
10.74*
|
Supply Agreement, dated November 26, 2008, by and among Micron Technology, Inc., Nanya Technology Corporation and Inotera Memories, Inc. (8)
|
|
10.75*
|
Amended and Restated Joint Development Program Agreement, dated November 26, 2008, by and between Nanya Technology Corporation and Micron Technology, Inc. (8)
|
|
10.76*
|
Amended and Restated Technology Transfer and License Agreement, dated November 26, 2008, by and between Micron Technology, Inc. and Nanya Technology Corporation (8)
|
|
10.77*
|
Technology Transfer Agreement, dated November 26, 2008, by and among Nanya Technology Corporation, Micron Technology, Inc. and Inotera Memories, Inc. (8)
|
|
10.78*
|
Technology Transfer Agreement for 68-50nm Process Nodes, dated October 11, 2008, by and between Micron Technology, Inc. and Inotera Memories, Inc. (8)
|
|
10.81
|
Capped Call Confirmation (Reference No. SDB 1630322480), dated as of April 8, 2009, by and between Micron Technology, Inc. and Goldman, Sachs & Co. (2)
|
|
10.82
|
Capped Call Confirmation (Reference No. CGPWK6), dated as of April 8, 2009, by and between Micron Technology, Inc. and Morgan Stanley & Co International plc (2)
|
|
10.83
|
Capped Call Confirmation (Reference No. 325758), dated as of April 8, 2009, by and between Micron Technology, Inc. and Deutsche Bank AG, London Branch (2)
|
|
10.84
|
Amendment Agreement, dated September 25, 2009, to TECH Facility Agreement, dated March 31, 2008, among TECH Semiconductor Singapore Pte. Ltd. And ABN Amro Bank N.V., Citibank, N.A., Singapore Branch, Citigroup Global Markets Singapore Pte Ltd, DBS Bank Ltd and Oversea-Chinese Banking Corporation Limited, as Original Mandated Lead Arrangers (23)
|
|
10.85
|
Supplemental Deed, dated September 25, 2009, to Guarantee, dated March 31, 2008, by Micron Technology, Inc. as Guarantor in favor of ABN Amro Bank N.V., Singapore Branch acting as Security Trustee (23)
|
|
10.86
|
Loan Agreement dated as of November 25, 2009, by and among Micron Semiconductor B.V., Micron Technology, Inc., and Mai Liao Power Corporation (24)
|
|
10.87*
|
Amended and Restated Joint Venture Agreement between Micron Semiconductor, B.V. and Nanya Technology Corporation, dated January 11, 2010 (25)
|
88
|
10.88
|
Share Purchase Agreement among Micron Technology, Inc., Micron Semiconductor, B.V., Intel Corporation, Intel Technology Asia Pte Ltd, STMicroelectronics N.V., Redwood Blocker S.a.r.l. and PK Flash, LLC, dated February 9, 2010 (25)
|
|
10.89*
|
Framework Agreement among Micron Technology, Inc., STMicroelectronics N.V. and Numonyx B.V. dated February 9, 2010 (25)
|
|
10.90
|
Stockholder Rights and Restrictions Agreement by and among Micron Technology, Inc., Intel Corporation, Intel Technology Asia Pte Ltd, STMicroelectronics N.V., Redwood Blocker S.a.r.l. and PK Flash LLC, dated as of May 7, 2010 (26)
|
|
10.91*
|
Second Amended and Restated Technology Transfer and License Agreement between MTI and Nanya Technology Corp. (NTC) dated July 2, 2010 (27)
|
|
10.92*
|
Joint Development Program and Cost Sharing Agreement between MTI and Nanya Technology Corp. (NTC) dated July 2, 2010 (27)
|
|
10.93
|
Equity Transfer Agreement between Numonyx B.V. and Hynix dated July 29, 2010 (27)
|
|
10.94*
|
Guarantee, Charge and Deposit Document between Numonyx B.V. and DBS Bank Ltd. dated August 31, 2010 (27)
|
|
10.95
|
Employment Agreement between Numonyx B.V. and Mario Licciardello dated March 30, 2008 (27)
|
|
10.96
|
Amendment to Mario Licciardello's Employment Agreement dated March 26, 2009 (27)
|
|
10.97
|
Severance Agreement between Numonyx B.V. and Mario Licciardello dated March 26, 2009 (27)
|
|
10.98
|
Amendment to Severance Agreement between Numonyx B.V. and Mario Licciardello dated February 9, 2010 (27)
|
|
10.99
|
Numonyx Holdings B.V. Equity Incentive Plan (28)
|
|
10.100
|
Numonyx Holdings B.V. Equity Incentive Plan Forms of Agreement (28)
|
|
10.101
|
Purchase Agreement dated July 20, 2011, between Micron Technology, Inc. and Morgan Stanley & Co. LLC, as representative of the initial purchasers (7)
|
|
10.102
|
Form of Capped Call Confirmation dated as of July 20, 2011, between the Company and Société Genérale
|
|
10.103
|
Form of Capped Call Confirmation dated as of July 22, 2011
|
|
21.1
|
Subsidiaries of the Registrant
|
|
23.1
|
Consent of Independent Registered Public Accounting Firm
|
|
23.2
|
Consent of Independent Registered Public Accounting Firm
|
|
31.1
|
Rule 13a-14(a) Certification of Chief Executive Officer
|
|
31.2
|
Rule 13a-14(a) Certification of Chief Financial Officer
|
|
32.1
|
Certification of Chief Executive Officer Pursuant to 18 U.S.C. 1350
|
|
32.2
|
Certification of Chief Financial Officer Pursuant to 18 U.S.C. 1350
|
|
99.1
|
Financial Statements of Inotera Memories, Inc. as of December 31, 2010 and December 31, 2009 and for each of the three years ended December 31, 2010.
|
|
101.INS
|
XBRL Instance Document
|
|
101.SCH
|
XBRL Taxonomy Extension Schema Document
|
|
101.CAL
|
XBRL Taxonomy Extension Calculation Linkbase Document
|
|
101.DEF
|
XBRL Taxonomy Extension Definition Linkbase Document
|
|
101.LAB
|
XBRL Taxonomy Extension Label Linkbase Document
|
|
101.PRE
|
XBRL Taxonomy Extension Presentation Linkbase Document
|
____________________
89
|
(1)
|
Incorporated by reference to Current Report on Form 8-K dated May 17, 2007
|
|
(2)
|
Incorporated by reference to Current Report on Form 8-K for the fiscal quarter ended April 8, 2009
|
|
(3)
|
Incorporated by reference to Quarterly Report on Form 10-Q for the fiscal quarter ended May 31, 2001
|
|
(4)
|
Incorporated by reference to Current Report on Form 8-K/A dated April 7, 2011
|
|
(5)
|
Incorporated by reference to Current Report on Form 8-K dated November 3, 2010
|
|
(6)
|
Incorporated by reference to Current Report on Form 8-K dated April 15, 2009
|
|
(7)
|
Incorporated by reference to Current Report on Form 8-K dated July 26, 2011
|
|
(8)
|
Incorporated by reference to Quarterly Report on Form 10-Q for the fiscal quarter ended December 4, 2008
|
|
(9)
|
Incorporated by reference to Quarterly Report on Form 10-Q for the fiscal quarter ended March 3, 2005
|
|
(10)
|
Incorporated by reference to Current Report on Form 8-K dated April 3, 2005
|
|
(11)
|
Incorporated by reference to Quarterly Report on Form 10-Q for the fiscal quarter ended March 5, 2009
|
|
(12)
|
Incorporated by reference to Quarterly Report on Form 10-Q for the fiscal quarter ended November 30, 2006
|
|
(13)
|
Incorporated by reference to Quarterly Report on Form 10-Q for the fiscal quarter ended March 1, 2007
|
|
(14)
|
Incorporated by reference to Proxy Statement for the 1986 Annual Meeting of Shareholders
|
|
(15)
|
Incorporated by reference to Annual Report on Form 10-K for the fiscal year ended August 28, 2003
|
|
(16)
|
Incorporated by reference to Quarterly Report on Form 10-Q for the fiscal quarter ended February 27, 1997
|
|
(17)
|
Incorporated by reference to Quarterly Report on Form 10-Q for the fiscal quarter ended December 1, 2005
|
|
(18)
|
Incorporated by reference to Registration Statement on Form S-8 (Reg. No. 333-171717)
|
|
(19)
|
Incorporated by reference to Registration Statement on Form S-8 (Registration No. 333-148357)
|
|
(20)
|
Incorporated by reference to Current Report on Form 8-K dated April 9, 2008
|
|
(21)
|
Incorporated by reference to Quarterly Report on Form 10-Q for the fiscal quarter ended May 29, 2008
|
|
(22)
|
Incorporated by reference to Current Report on Form 8-K dated October 26, 2007
|
|
(23)
|
Incorporated by reference to Current Report on Form 8-K dated September 25, 2009
|
|
(24)
|
Incorporated by reference to Current Report on Form 8-K dated November 25, 2009
|
|
(25)
|
Incorporated by reference to Quarterly Report on Form 10-Q for the fiscal quarter ended March 4, 2010
|
|
(26)
|
Incorporated by reference to Quarterly Report on Form 10-Q for the fiscal quarter ended June 3, 2010
|
|
(27)
|
Incorporated by reference to Annual Report on Form 10-K for the fiscal year ended September 2, 2010
|
|
(28)
|
Incorporated by reference to Registration Statement on Form S-8 (Reg. No. 333-167536
|
* Portions of this exhibit have been omitted pursuant to a request for confidential treatment filed with the Commission.
90
SIGNATURES
Pursuant to the requirements of Section 13 or 15(d) of the Securities Exchange Act of 1934, the Registrant has duly caused this report to be signed on its behalf by the undersigned, thereunto duly authorized, in the City of Boise, State of Idaho, on the 25th day of October, 2011.
|
|
Micron Technology, Inc.
|
|
|
By:
|
/s/ Ronald C. Foster
|
|
|
|
Ronald C. Foster
Vice President of Finance and Chief Financial Officer
|
|
|
(Principal Financial and Accounting Officer)
|
||
Pursuant to the requirements of the Securities Exchange Act of 1934, this Annual Report has been signed below by the following persons on behalf of the Registrant and in the capacities and on the dates indicated.
|
Signature
|
Title
|
Date
|
|
|
|
|
|
/s/ Steven R. Appleton
|
Chairman of the Board,
|
October 25, 2011
|
|
(Steven R. Appleton)
|
Chief Executive Officer
|
|
|
|
(Principal Executive Officer)
|
|
|
|
|
|
|
/s/ Ronald C. Foster
|
Vice President of Finance,
|
October 25, 2011
|
|
(Ronald C. Foster)
|
Chief Financial Officer
|
|
|
|
(Principal Financial and
|
|
|
|
Accounting Officer)
|
|
|
|
|
|
|
/s/ Teruaki Aoki
|
Director
|
October 25, 2011
|
|
(Teruaki Aoki)
|
|
|
|
|
|
|
|
/s/ James W. Bagley
|
Director
|
October 25, 2011
|
|
(James W. Bagley)
|
|
|
|
|
|
|
|
/s/ Robert L. Bailey
|
Director
|
October 25, 2011
|
|
(Robert L. Bailey)
|
|
|
|
|
|
|
|
/s/ Patrick J. Byrne
|
Director
|
October 25, 2011
|
|
(Patrick J. Byrne)
|
|
|
|
/s/ Mercedes Johnson
|
Director
|
October 25, 2011
|
|
(Mercedes Johnson)
|
|
|
|
|
|
|
|
/s/ Lawrence N. Mondry
|
Director
|
October 25, 2011
|
|
(Lawrence N. Mondry)
|
|
|
|
|
|
|
|
/s/ Robert E. Switz
|
Director
|
October 25, 2011
|
|
(Robert E. Switz)
|
|
|
91
MICRON TECHNOLOGY, INC.
SCHEDULE II
VALUATION AND QUALIFYING ACCOUNTS
(in millions)
|
|
Balance at
Beginning of
Year
|
Business Acquisitions
|
Charged
(Credited) to
Costs and
Expenses
|
Deductions/
Write-Offs
|
Balance at
End of
Year
|
||||||||||||||
|
Allowance for Doubtful Accounts
|
|
|
|
|
|
||||||||||||||
|
Year ended September 1, 2011
|
$
|
4
|
|
$
|
—
|
|
$
|
—
|
|
$
|
(1
|
)
|
$
|
3
|
|
||||
|
Year ended September 2, 2010
|
5
|
|
1
|
|
—
|
|
(2
|
)
|
4
|
|
|||||||||
|
Year ended September 3, 2009
|
2
|
|
—
|
|
5
|
|
(2
|
)
|
5
|
|
|||||||||
|
Deferred Tax Asset Valuation Allowance
|
|
|
|
|
|
|
|
|
|
|
|||||||||
|
Year ended September 1, 2011
|
$
|
1,627
|
|
$
|
—
|
|
$
|
(102
|
)
|
$
|
(79
|
)
|
$
|
1,446
|
|
||||
|
Year ended September 2, 2010
|
2,006
|
|
63
|
|
(424
|
)
|
(18
|
)
|
1,627
|
|
|||||||||
|
Year ended September 3, 2009
|
1,440
|
|
—
|
|
572
|
|
(6
|
)
|
2,006
|
|
|||||||||
92
TABLE OF CONTENTS
Part IItem 1. BusinessItem 1A. Risk FactorsItem 1B. Unresolved Staff CommentsItem 2. PropertiesItem 3. Legal ProceedingsItem 4. (removed and Reserved)Part IIItem 5. Market For Registrant's Common Equity, Related Stockholder Matters and Issuer Purchases Of Equity SecuritiesItem 6. Selected Financial DataItem 7. Management's Discussion and Analysis Of Financial Condition and Results Of OperationsItem 7A. Quantitative and Qualitative Disclolsures About Market RiskItem 8. Financial Statements and Supplementary DataItem 9. Changes in and Disagreements with Accountants on Accounting and Financial DisclosureItem 9A. Controls and ProceduresItem 9B. Other InformationPart IIIItem 10. Directors, Executive Officers and Corporate GovernanceItem 11. Executive CompensationItem 12. Security Ownership Of Certain Beneficial Owners and Management and Related Stockholder MattersItem 13. Certain Relationships and Related Transactions, and Director IndependenceItem 14. Principal Accounting Fees and ServicesPart IVItem 15. Exhibits, Financial Statement Schedules