MICRON TECHNOLOGY INC
10-Ks and 10-Qs
|
|
|
|
|
|
|
|
|
|
|
|
|
|
|
|
|
|
|
|
|
|
|
|
|
|
|
|
|
|
|
|
|
|
|
|
|
|
|
|
|
|
|
|
|
|
|
|
|
|
|
|
|
|
|
|
UNITED STATES
SECURITIES AND EXCHANGE COMMISSION
Washington, D.C. 20549
FORM 10-K
|
(Mark One)
|
|
|
x
|
ANNUAL REPORT PURSUANT TO SECTION 13 OR 15(d) OF THE
SECURITIES EXCHANGE ACT OF 1934
|
For the fiscal year ended
August 29, 2019
OR
|
o
|
TRANSITION REPORT PURSUANT TO SECTION 13 OR 15(d) OF THE SECURITIES EXCHANGE ACT OF 1934
|
For the transition period from to
Commission file number 1-10658

Micron Technology, Inc.
(Exact name of registrant as specified in its charter)
|
Delaware
|
75-1618004
|
|||
|
(State or other jurisdiction of incorporation or organization)
|
(IRS Employer Identification No.)
|
|||
|
8000 S. Federal Way, Boise, Idaho
|
83716-9632
|
|||
|
(Address of principal executive offices)
|
(Zip Code)
|
|||
|
Registrant's telephone number, including area code
|
(208) 368-4000
|
|||
|
Securities registered pursuant to Section 12(b) of the Act:
|
||||
|
Title of each class
|
Trading Symbol
|
Name of each exchange on which registered
|
||
|
Common Stock, par value $0.10 per share
|
MU
|
NASDAQ Global Select Market
|
||
Securities registered pursuant to Section 12(g) of the Act:
None
Indicate by check mark if the registrant is a well-known seasoned issuer, as defined in Rule 405 of the Securities Act. Yes
x
No
¨
Indicate by check mark if the registrant is not required to file reports pursuant to Section 13 or 15(d) of the Act. Yes
¨
No
x
Indicate by check mark whether the registrant (1) has filed all reports required to be filed by Section 13 or 15(d) of the Securities Exchange Act of 1934 during the preceding 12 months (or for such shorter period that the registrant was required to file such reports), and (2) has been subject to such filing requirements for the past 90 days. Yes
x
No
¨
Indicate by check mark whether the registrant has submitted electronically every Interactive Data File required to be submitted pursuant to Rule 405 of Regulation S-T (§ 232.405 of this chapter) during the preceding 12 months (or for such shorter period that the registrant was required to submit such files). Yes
x
No
¨
Indicate by check mark whether the registrant is a large accelerated filer, an accelerated filer, a non-accelerated filer, a smaller reporting company, or an emerging growth company. See the definitions of "large accelerated filer," "accelerated filer," "smaller reporting company," and "emerging growth company" in Rule 12b-2 of the Exchange Act.
|
Large Accelerated Filer
x
|
Accelerated Filer
o
|
Non-Accelerated Filer
o
|
Smaller Reporting Company
o
|
Emerging Growth Company
o
|
If an emerging growth company, indicate by check mark if the registrant has elected not to use the extended transition period for complying with any new or revised financial accounting standards provided pursuant to Section 13(a) of the Exchange Act.
o
Indicate by check mark whether the registrant is a shell company (as defined in Rule 12b-2 of the Exchange Act). Yes
o
No
x
The aggregate market value of the voting and non-voting common equity held by non-affiliates was
$36.2 billion
based on the closing price reported on the NASDAQ Global Select Market on February 28, 2019. Shares of common stock held by each executive officer and director and by each person who owns 5% or more of the outstanding common stock were excluded as they may be deemed to be affiliates. This determination of affiliate status is not necessarily a conclusive determination for other purposes.
The number of outstanding shares of the registrant's common stock as of October 10, 2019 was
1,107,050,823
.
DOCUMENTS INCORPORATED BY REFERENCE:
Portions of the Proxy Statement for the registrant's Fiscal 2019 Annual Meeting of Shareholders to be held on January 16, 2020 are incorporated by reference into Part II and Part III of this Annual Report on Form 10-K.
Forward-Looking Statements
This Form 10-K contains trend information and other forward-looking statements that involve a number of risks and uncertainties. Forward-looking statements include, but are not limited to, statements such as those made regarding the timing and effects of our conversion to replacement gate technology, timing of bit crossover of our 96-layer 3D NAND, timing of our production of 128-layer 3D NAND, timing of and purchase price for Intel's interest in IMFT; debt incurred to finance our capital investments and noncontrolling interest in IMFT; the sufficiency of our cash and investments; capital spending in 2020; increase in underutilization of IMFT manufacturing capacity; anticipated change to the depreciable life of our NAND equipment and resulting change in depreciation expense; and the effects of adopting the new lease accounting standard in 2020. Our actual results could differ materially from our historical results and those discussed in the forward-looking statements. Factors that could cause actual results to differ materially include, but are not limited to, those identified in "Part I – Item 1A. Risk Factors." All period references are to our fiscal periods unless otherwise indicated.
Definitions of Commonly Used Terms
As used herein, "we," "our," "us," and similar terms include Micron Technology, Inc. and our consolidated subsidiaries, unless the context indicates otherwise. Abbreviations, terms, or acronyms are commonly used or found in multiple locations throughout this report and include the following:
|
Term
|
Definition
|
Term
|
Definition
|
|||
|
2022 Term Loan B
|
Senior Secured Term Loan B due 2022
|
Micron
|
Micron Technology, Inc. (Parent Company)
|
|||
|
2024 Notes
|
5.25% Senior Notes due 2024
|
MMJ
|
Micron Memory Japan, Inc.
|
|||
|
2025 Notes
|
5.50% Senior Notes due 2025
|
MMJ Companies
|
MAI and MMJ
|
|||
|
2026 Notes
|
5.63% Senior Notes due 2026
|
MMJ Group
|
MMJ and its subsidiaries
|
|||
|
2027 Notes
|
4.19% Senior Notes due 2027
|
MMT
|
Micron Memory Taiwan Co., Ltd.
|
|||
|
2029 Notes
|
5.33% Senior Notes due 2029
|
MSP
|
Micron Semiconductor Products, Inc.
|
|||
|
2030 Notes
|
4.66% Senior Notes due 2027
|
MSTW
|
Micron Semiconductor Taiwan Co., Ltd.
|
|||
|
2032D Notes
|
3.13% Convertible Senior Notes due 2032
|
MTTW
|
Micron Technology Taiwan, Inc.
|
|||
|
2033F Notes
|
2.13% Convertible Senior Notes due 2033
|
NAND
|
Not And
|
|||
|
2043G Notes
|
3.00% Convertible Senior Notes due 2043
|
Nanya
|
Nanya Technology Corporation
|
|||
|
ASIC
|
Application-Specific Integrated Circuit
|
NOR
|
Not Or
|
|||
|
CuA
|
CMOS Under the Array
|
NVMe
|
Non-Volatile Memory Express
|
|||
|
DDR
|
Double Data Rate
|
OEM
|
Original Equipment Manufacturer
|
|||
|
DRAM
|
Dynamic Random Access Memory
|
PCIe
|
Peripheral Component Interconnect Express
|
|||
|
e.MMC
|
Embedded Multi-Media Controller
|
Qimonda
|
Qimonda AG
|
|||
|
eMCP
|
An e.MMC or UFS solution with LPDRAM in the same package
|
QLC
|
Quad-Level Cell (four bits per cell)
|
|||
|
GDDR
|
Graphics Double Data Rate
|
RDIMM
|
Registered Dual In-line Memory Module
|
|||
|
HDD
|
Hard Disk Drive
|
SATA
|
Serial AT Attachment
|
|||
|
IMFT
|
IM Flash Technologies, LLC
|
SLC
|
Single-Level Cell (one bit per cell)
|
|||
|
Inotera
|
Inotera Memories, Inc.
|
SSD
|
Solid State Drive
|
|||
|
Intel
|
Intel Corporation
|
TLC
|
Triple-Level Cell (three bits per cell)
|
|||
|
LPDDR
|
Low Power Double Data Rate
|
UFS
|
Universal Flash Storage
|
|||
|
MAI
|
Micron Akita, Inc.
|
uMCP
|
UFS-based MCP
|
|||
|
MCP
|
Multi-Chip Package
|
VIE
|
Variable Interest Entity
|
|||
Micron, Crucial, Ballistix, any associated logos, and all other Micron trademarks are the property of Micron. 3D XPoint is a trademark of Intel in the United States and/or other countries in the United States and/or other countries. Other product names or trademarks that are not owned by Micron are for identification purposes only and may be the trademarks of their respective owners.
1
PART I
ITEM 1. BUSINESS
Overview
Micron Technology, Inc., including its consolidated subsidiaries, is an industry leader in innovative memory and storage solutions. Through our global brands – Micron
®
, Crucial
®
, and Ballistix
®
– our broad portfolio of high-performance memory and storage technologies, including DRAM, NAND, 3D XPoint
TM
memory, and NOR, is transforming how the world uses information to enrich life. Backed by 40 years of technology leadership, our memory and storage solutions enable disruptive trends, including artificial intelligence, 5G, machine learning, and autonomous vehicles, in key market segments like mobile, data center, client, consumer, industrial, graphics, automotive, and networking.
We manufacture our products at wholly-owned and joint venture facilities and also utilize subcontractors to perform certain manufacturing processes. In recent years, we have increased our manufacturing scale and product diversity through strategic acquisitions, expansion, and various partnering arrangements.
We make significant investments to develop proprietary product and process technology, which are implemented in our manufacturing facilities. We generally increase the density per wafer and reduce manufacturing costs of each generation of product through advancements in product and process technology, such as our leading-edge line-width process technology and 3D NAND architecture. We continue to introduce new generations of products that offer improved performance characteristics, including higher data transfer rates, advanced packaging solutions to meet industry standards, lower power consumption, improved read/write reliability, and increased memory density. Our managed NAND and SSD storage products, which incorporate NAND, a controller, and firmware, constitute a significant portion of our revenues. We develop firmware and, in 2019, introduced our proprietary controllers into our SSDs. Development of advanced technologies enables us to diversify our product portfolio toward a richer mix of differentiated, high-value solutions and to target high-growth markets.
We market our products through our internal sales force, independent sales representatives, and distributors primarily to original equipment manufacturers and retailers located around the world. We face intense competition in the semiconductor memory and storage markets and, to remain competitive, we must continuously develop and implement new products and technologies and decrease manufacturing costs. Our success is largely dependent on obtaining returns on our R&D investments, efficient utilization of our manufacturing infrastructure, development and integration of advanced product and process technologies, market acceptance of our diversified portfolio of semiconductor-based memory and storage solutions, and return-driven capital spending.
Products
Our product portfolio of memory and storage solutions, advanced solutions, and storage platforms are based on our high-performance semiconductor memory and storage technologies, including DRAM, NAND, NOR, 3D XPoint memory, and other technologies. We sell our products into various markets through our four business units in various forms, including wafers, components, modules, SSDs, and MCP products. MCP products combine DRAM, NAND, and/or NOR and in some cases also include a controller and firmware. We are relentlessly focused on evolving our product portfolio to a richer mix of high-value solutions and cultivating deeper relationships with customers. Our position as a developer and manufacturer of DRAM, NAND, NOR, and other emerging memory technologies uniquely enables us to collaborate with our customers to ensure our technology and engineering roadmaps deliver critical features. We continuously introduce new products on our advanced technologies, delivering performance, quality, and cost advantages to our customers.
Compute and Networking Business Unit
CNBU includes memory products and solutions sold into client, cloud server, enterprise, graphics, and networking markets. CNBU reported revenue of
$9.97 billion
in 2019,
$15.25 billion
in 2018, and
$8.62 billion
in 2017. We achieved bit shipment crossover to 1Xnm DRAM products in 2019 and began shipments of our 1Ynm DRAM. In 2019, we began enablement of our 1Znm products, designed to meet the need for better performance, higher density, and reduced power consumption in data center and other applications, and became the first memory company to begin mass production of 16Gb DDR4 memory products using 1Znm technology. Our 1Znm 16Gb DDR4 product delivers substantially higher bit density as well as significant
2
performance enhancements and lower cost compared to the previous generation 1Ynm node and reduces power consumption by approximately 40% compared to previous generations of 8Gb DDR4-based products.
Client
:
The client market was CNBU's largest revenue segment in 2019 and consisted predominantly of our DDR4 DRAM products. We also offer LPDDR4/4X and LPDDR3 products that are incorporated into ultra-thin notebooks with low power features. In 2019, we achieved significant production and sales to the client market from our 1Xnm and 1Ynm technology. Our products sold to the client market support both commercial and consumer PC unit growth, with commercial growth driven primarily by replacement cycles from upgraded operating systems. Growth was primarily driven by increases in memory content per unit.
Cloud Server
:
CNBU sales to the cloud market in 2019 consisted predominantly of our second-generation 1Xnm DDR4 DRAM. In 2019, we qualified RDIMM products incorporating our 1Ynm DRAM with key cloud server customers. The cloud server market continues to experience significant growth, offering improved costs, security, stability, and flexibility. The cloud server market has been driven, in part, by intelligent edge devices capable of artificial intelligence and augmented reality that store and access data in the cloud. Cloud servers supporting artificial intelligence workloads require significantly increasing quantities of DRAM and, as the number and capabilities of these intelligent edge devices increase, more data is stored, processed, and accessed in the cloud, creating a virtuous cycle between the cloud and edge devices.
Enterprise
:
CNBU sales in 2019 into the enterprise market consisted predominantly of our second-generation 1Xnm DDR4 DRAM products. In 2019, we qualified our 64GB DDR4 modules incorporating our 1Ynm DRAM with key enterprise customers for use in servers. The enterprise market is experiencing demand from intelligent edge devices requiring rapid data analysis and storage to enable machine learning, training, and inferencing. Our enterprise RDIMM DRAM memory modules provide the high performance, quality, and reliability required for these applications.
Graphics
:
The graphics market is driven by the need for high-performance, high-bandwidth, and cost-effective memory solutions. Our GDDR6 and GDDR5 DRAM graphics products are incorporated into game consoles, PC graphics cards and graphics processing unit-based data center solutions, which are the driving force behind applications such as artificial intelligence, virtual and augmented reality, 4K and 8K gaming, and professional design. In 2018, we started volume production of our 8Gb GDDR6 DRAM and, in 2019, expanded our customer base and introduced our high-performance 16Gb GDDR6 DRAM.
Networking
:
The networking memory market is characterized by long life-cycle DRAM products, and accordingly, a significant portion of our sales consisted of products manufactured on our legacy 25nm and 20nm-series DRAM technology. In 2019, we accelerated sales of 4Gb and 8Gb DDR4 DRAM into emerging 5G applications and supported further build-out of advanced networking infrastructure to our large corporate and cloud data center customers.
Mobile Business Unit
MBU includes memory products sold into smartphone and other mobile-device markets and includes discrete DRAM, discrete NAND, and managed NAND. MBU managed NAND includes e.MMC and universal flash storage ("UFS") solutions, each of which combine high-capacity NAND with a high-speed controller and firmware in a small ball-grid array, and eMCP products, which combine an e.MMC/UFS solution with LPDRAM. MBU reported revenue of
$6.40 billion
in 2019,
$6.58 billion
in 2018, and
$4.42 billion
in 2017. In 2019, we introduced our 1Ynm 12Gb LPDDR5 mobile DRAM, which offers the highest performance and density available for the mobile market. We also started volume shipments of our 1Znm 16Gb LPDDR4 mobile DRAM in discrete and MCP packages, which is the world's first 16Gb monolithic LPDRAM, enabling higher densities for the mobile market at a more competitive cost structure. In 2019, we launched our second-generation UFS product with best-in-class endurance.
Smartphone
:
MBU sales to the smartphone market in 2019 consisted primarily of our 1Xnm LPDDR4 and managed NAND solutions. High-end smartphones incorporate higher levels of NAND and LPDRAM that enable features such as larger 4K displays, multiple high-resolution cameras, and 4K high-dynamic range video recording. Additionally, our smartphone products are utilized by OEMs to enable artificial intelligence, augmented reality, and life-like virtual reality capabilities into high-end phones, including facial and voice recognition, real-time translation, fast image search, and scene detection. Our managed NAND bit shipments in 2019 more than tripled year-on-year, driven by growth of MCP and discrete NAND e.MMC and UFS products. In the fourth quarter of 2019, we started volume shipments of a new leading-edge UFS-based MCP ("uMCP") that uses our 1Z LPDRAM. This new UFS MCP enables flagship-like performance and densities to mid and high-end smartphones. Our LPDRAM solutions are engineered to meet the demanding performance and power specifications of industry-leading smartphone manufacturers.
3
Other
:
MBU sales also include products sold into the feature phone, mobile PC, and tablet markets. Sales primarily consist of LPDDR4, LPDDR3, and TLC NAND.
Storage Business Unit
SBU includes SSDs and component-level solutions sold into enterprise and cloud, client, and consumer storage markets and other discrete storage products sold in component and wafer forms to removable storage markets. SBU reported revenue of
$3.83 billion
in 2019,
$5.02 billion
in 2018, and
$4.51 billion
in 2017. In 2019, we continued to ramp our 96-layer 3D NAND, enabling cost reductions as compared to our 64-layer 3D NAND. Our 3D NAND technologies utilize CMOS under the array ("CuA") technology to reduce die sizes and deliver improved performance when compared to competitive approaches.
In 2019, we continued to make progress on our 128-layer 3D NAND, which uses replacement gate technology. Our first replacement gate node will be based on our 128-layer 3D NAND, but is expected to be used across a select set of products. With the high initial capital requirements of transitioning from floating gate to replacement gate technology, we don't expect meaningful cost reductions until 2021, when our second-generation replacement gate node is broadly deployed. We believe our replacement gate architecture will allow us to deliver performance improvements and provide an efficient path towards scaling multiple future generations of 3D NAND. Given a more limited initial deployment of our first node of replacement gate technology, we expect that our NAND bit supply growth in calendar 2020 will be below industry demand levels and plan to utilize our cost-effective floating gate inventory to meet growth in customer demand.
SSDs
:
SSD storage products incorporate NAND, a controller, and firmware and offer significant performance and features over HDDs, including a smaller form factor, faster read and write speeds, solid-state architecture, reliability, and lower power consumption. We offer SSD solutions utilizing our NAND technology to the enterprise and cloud, client, and consumer markets.
Enterprise and Cloud SSDs
: SBU sales to the enterprise and cloud SSD markets in 2019 consisted primarily of our flagship SATA 5200 and 5100 series SSDs. In 2019, we continued offering our 5200 series SATA SSDs, which deliver best-in-class performance and capacity and achieved revenue crossover from our 5100 series SSDs. In 2019, we launched our 9300 Datacenter NVMe SSDs for enterprise and cloud markets. These 9300 NVMe SSDs feature industry-leading sequential write performance and latency, increased capacities, and nearly a 30% reduction in power consumption over the previous generation. Similar to trends in the memory market, the enterprise and cloud storage markets have been driven by intelligent edge devices capable of artificial intelligence, augmented reality, and other features that store, access, and analyze data in the cloud. Artificial intelligence servers require significantly higher SSD capacity and our 64-layer QLC NAND technology provides cost-optimized storage solutions with significantly lower total cost of ownership for read-intensive cloud workloads. By leveraging our advanced CuA NAND in enterprise and cloud SSDs, we deliver low-cost, high-density, high-performance storage solutions.
Client SSDs
: SBU sales to the client SSD market in 2019 consisted primarily of our 1100 series 3D NAND SATA Client SSDs, which are targeted for leading personal computer OEMs as a replacement to HDDs. Our client SSDs, used in notebooks, desktops, workstations, and other consumer applications, deliver high performance, power efficiency, security, and capacity to our customers. In 2019, we introduced our next-generation 1300 series SATA SSD, which is one of the industry's first 96-layer TLC 3D NAND-based SSDs. Our 1300 series SATA SSD offers fast storage, device-level security, thermal management, and extended battery life for mobile, desktop, and workstation PCs. We also introduced our 2200 series PCIe NVMe SSD portfolio, which supports the NVM Express™ protocol, bringing increased bandwidth and reduced latency to client computing markets. The 2200 PCIe NVMe SSD is a vertically integrated solution that includes our 3D TLC NAND, internally designed ASIC, and firmware in an M.2 form factor. In 2019, we began shipments to large PC OEMs of our new 2200 PCIe NVMe SSD and we continue to achieve qualification with more customers.
Consumer SSDs
: SBU sales to the consumer SSD market in 2019 consisted primarily of our Crucial-branded MX500 SATA SSD, utilizing our 64-layer TLC 3D NAND. In 2019, we began offering our BX500 SATA SSD, utilizing our 96-layer TLC 3D NAND, and also gained market acceptance of our NVMe SSDs utilizing our QLC NAND. Similar to the client SSD market, our consumer SSD solutions are replacing HDDs as end-users seek the higher performance, power savings, and reliability of our SSDs.
Components and Wafers:
SBU sales of components in 2019 included NAND products and 3D XPoint technology. NAND products primarily consist of our 64-layer and 96-layer TLC and QLC NAND technology sold into storage markets. Sales of 3D XPoint technology includes wafers sold to Intel through our IMFT joint venture. 3D XPoint technology has higher chip density than DRAM, up to 1,000 times lower latency, and exponentially greater endurance than NAND. These specifications
4
create a significant value opportunity for 3D XPoint technology in solutions between DRAM and NAND in the memory and storage hierarchy. We continue to develop products and solutions for 3D XPoint technology in the memory and storage hierarchies. Revenue from sales of 3D XPoint products are included within the business unit that most closely aligns to the memory or storage use of the end product. Trends in machine learning, big data analytics, and artificial intelligence are driving demand for the features offered by 3D XPoint technology.
Embedded Business Unit
EBU includes memory and storage products sold into automotive, industrial, and consumer markets and includes discrete and module DRAM, discrete NAND, managed NAND, and NOR. EBU reported revenue of
$3.14 billion
in 2019,
$3.48 billion
in 2018, and
$2.70 billion
in 2017. The embedded market has traditionally been characterized by long life-cycle DRAM and non-volatile products manufactured on mature process technologies. With strong trends of digitization, connectivity, and intelligence in every device, demand continues to grow for leading-edge products from newer process technologies emerging into the embedded market, which contributed to a fivefold increase in LPDDR4 bit-shipments to the automotive market in 2019 as compared to 2018. Our embedded products enable edge devices to store, connect, and share information in the growing internet of things ("IoT") and are utilized in a diverse set of applications in the automotive, industrial, and consumer markets.
Automotive
:
Our DDR3 DRAM, e.MMC managed NAND, and LPDDR4 DRAM automotive memory and storage products enable connected, large display infotainment systems and higher definition 4K displays and support improved voice and gesture control in automotive applications. Advancements in autonomous driving and advanced driver-assistance systems continue to increase the requirements for high-performing memory and storage products, with higher reliability requirements for leading-edge products. Our comprehensive and expanding portfolio of DRAM, NAND, and NOR solutions to the automotive market, as well as our extensive customer support network, enable us to maintain our strong leadership position in this market. In 2019, we introduced our UFS 2.1 managed NAND portfolio, based on our reliable automotive-grade 64-layer 3D TLC NAND, that features ultrafast boot-up time with up to three times the sequential read-performance of e.MMC-based products. We also introduced the industry's first 1TB TLC NVMe automotive SSD.
Industrial
:
Our industrial products, featuring DDR4 and DDR3 DRAM, SLC NAND, NAND MCPs, and NOR, enable applications in the growing industrial IoT market, including machine-to-machine communication, factory automation, transportation, surveillance, retail, and smart infrastructure. Our Authenta™ technology provides a new level of cyber protection for the lowest layers of IoT device software by leveraging existing flash memory sockets to enable IoT device health and identity without adding additional hardware components.
Consumer
:
Our DDR4 and DDR3 DRAM, LPDDR4 DRAM, and eMCP managed NAND products sold into the consumer market are used in a diverse set of consumer products, including service provider and IP set-top boxes, digital home assistants, digital still and video cameras, home networking, ultra-high definition televisions, and many more applications. Our embedded memory and storage solutions enable edge devices in the consumer products market to store, connect, and share information in the IoT. In 2019, we began offering high density 128GB to 1TB microSD card products for the consumer markets, leveraging our most advanced 96-layer 3D QLC NAND technology.
Manufacturing
In recent years, we have centralized certain key functions of our operations. These centers of excellence enable us to maximize yield and reduce cycle times by combining front and back-end manufacturing, product engineering, and specific technology development to most effectively transfer and ramp technology while driving efficient manufacturing. In 2019, we completed construction and began operating our new Singapore leading-edge 3D NAND clean room expansion. Our Singapore center of excellence enables us to transition to leading-edge technology nodes, which require substantially more clean room space than prior nodes, and maintain existing wafer capacity to meet market demand in our expanding storage business. In 2019, we also completed construction and opened our new Taiwan back-end assembly and test facility, which together with our existing Taiwan facilities, constitute our Taiwan DRAM center of excellence. The new facility enables us to integrate back-end processes into our manufacturing environment while benefitting from economies of scale.
5
We manufacture our products at our wholly-owned and joint venture facilities located in Taiwan, Singapore, Japan, the United States, China, and Malaysia and also utilize subcontractors to perform certain manufacturing processes. Nearly all our products are manufactured on 300mm wafers in facilities that generally operate 24 hours per day, seven days per week. Semiconductor manufacturing is extremely capital intensive, requiring large investments in sophisticated facilities and equipment. Our DRAM, NAND, 3D XPoint memory, and NOR products share a number of common manufacturing processes, enabling us to leverage much of our product and process technology and manufacturing infrastructure across these product lines.
Our process for manufacturing semiconductor products is complex and involves a number of precise steps, including wafer fabrication, assembly, and test. Efficient production of semiconductor products requires utilization of advanced semiconductor manufacturing techniques and effectively deploying those techniques across multiple facilities. The primary determinants of manufacturing cost are process line-width, 3D non-volatile layers, NAND cell levels, process complexity (including number of mask layers and fabrication steps) and manufacturing yield. Other factors include the cost and sophistication of manufacturing equipment, equipment utilization, process complexity, cost of raw materials, labor productivity, package type, cleanliness of our manufacturing environment, and utilization of subcontractors to perform certain manufacturing processes. We continuously enhance our production processes, increasing bits per wafer and transitioning to higher density products. As semiconductor memory technology has matured, the rate of increases in bits per wafer and product density has slowed. In 2019, we achieved bit shipment crossover to the 1Xnm process node for DRAM, significantly increased our production of the 1Ynm process node, and commenced volume production of 16Gb DDR4 products with 1Znm technology. In 2019, we also continued to ramp our 96-layer 3D NAND technology and make progress on our 128-layer 3D NAND, which uses replacement gate technology, that we expect to ramp in 2020.
Wafer fabrication occurs in a highly-controlled clean environment to minimize yield-limiting and quality contaminants. Despite stringent manufacturing controls, individual circuits may be nonfunctional or wafers may be scrapped due to equipment errors, minute impurities in materials, defects in photomasks, circuit design marginalities or defects, and airborne particle defects. Success of our manufacturing operations depends largely on minimizing defects to maximize yield of high-quality circuits. In this regard, we employ rigorous quality controls throughout the manufacturing, screening, and testing processes. We are able to recover certain devices by testing and grading them to their highest level of functionality.
Our products are manufactured and sold in both packaged and unpackaged bare die forms. Our packaged products include memory modules, SSDs, and managed NAND including MCPs and eMMCs. We assemble many products in-house and, in some cases, outsource assembly services for certain memory modules, SSDs, and MCPs. We test our products at various stages in the manufacturing process, conduct numerous quality control inspections throughout the entire production flow, and perform high temperature burn-in on finished products. In addition, we use our proprietary AMBYX™ line of intelligent test and burn-in systems to perform simultaneous circuit tests of semiconductor die during the burn-in process, capturing quality and reliability data and reducing testing time and cost.
In recent years, we have produced an increasingly broad portfolio of products and system solutions which enhances our ability to allocate resources to our most profitable products but also increases the complexity of our manufacturing and supply chain operations. Although our product lines generally use similar manufacturing processes, our costs can be affected by frequent conversions to new products, the allocation of manufacturing capacity to more complex, smaller-volume products, and the reallocation of manufacturing capacity across various product lines.
Arrangements with Intel
IMFT
Since 2006, we have owned
51%
of IMFT, a joint venture between us and Intel. IMFT is governed by a Board of Managers, for which the number of managers appointed by each member varies based on the members' respective ownership interests. IMFT manufactures semiconductor products exclusively for its members under a long-term supply agreement at prices approximating cost. In 2018, IMFT discontinued production of NAND and subsequent to that time manufactured 3D XPoint memory. Members pay their proportionate share of fixed costs associated with IMFT's capacity.
In January 2019, we exercised our option to acquire Intel's interest in IMFT. Intel has set the closing date to occur on October 31, 2019. In connection with our acquisition, in the first quarter of 2020, we expect to pay Intel approximately
$1.4 billion
for Intel's interest in IMFT as well as IMFT member debt owed to Intel.
6
Until we complete our acquisition of Intel's noncontrolling interest in IMFT, the members have rights and obligations to the capacity of IMFT in proportion to their investment, including member debt financing. Any capital contribution or member debt financing results in a proportionate adjustment to the sharing of output on an
eight
-month lag. Intel provided member debt financing of
$1.01 billion
to IMFT in 2018 and IMFT repaid
$316 million
to Intel in 2019. As a result, as of
August 29, 2019
, current debt included
$693 million
of IMFT member debt.
R&D Arrangements
We have had agreements to jointly develop NAND and 3D XPoint technologies with Intel. In 2018, we and Intel agreed to independently develop subsequent generations of 3D NAND. We substantially completed our NAND development cost-sharing arrangement with Intel in the third quarter of 2019. In 2018, we also announced that we and Intel would no longer jointly develop 3D XPoint technology beyond the second generation. We substantially completed this cost-sharing arrangement in the first quarter of 2020.
Supply Chain, Materials, and Use of Third-Party Service Providers
Our supply chain and operations are dependent on the availability of materials that meet exacting standards and also on the use of third parties to provide us with components and services. We generally have multiple sources of supply for our materials and services; however, only a limited number of suppliers are capable of delivering certain materials and services that meet our standards. In some cases, materials, components, or services are provided by a single supplier. Various factors could reduce the availability of materials or components such as chemicals, silicon wafers, gases, photoresist, controllers, substrates, lead frames, printed circuit boards, targets, and reticle glass blanks. Shortages or increases in lead times may occur from time to time in the future. Our manufacturing processes are also dependent on our relationships with third-party manufacturers of controllers used in a number of our products and with outsourced semiconductor assembly and test providers, contract manufacturers, logistic carriers, and other service providers. We monitor and manage supply-chain activities to mitigate risks associated with raw materials and service providers. Certain materials are primarily available in certain countries, including rare earth elements, minerals, and metals available primarily from China. Trade disputes or other political or economic conditions may limit our availability to obtain such materials. Although these rare earth and other materials are generally available from multiple suppliers, China is the predominant producer of certain of these materials. In addition, we and/or our suppliers and service providers are, and may continue to be, affected by tariffs, embargoes or other trade restrictions, as well as laws and regulations enacted in response to concerns regarding climate change, conflict minerals, and responsible sourcing practices, which can limit the supply of our materials and/or increase the cost.
Marketing and Customers
We continue to transform how we interact with our customers from transactional opportunistic sales of standardized memory components to collaborative relationships where we work with our customers to understand their unique opportunities and challenges. Many of our customers require thorough review or qualification of our products. By engaging with our customers early in the product life-cycle to identify and design features and performance characteristics into our products, we are able to manufacture products that anticipate and address their changing needs. Collaborating with our customers on their design needs in a changing end market allows us to differentiate our memory and storage solutions, which provides greater value to our customers.
Our semiconductor memory and storage products are offered under our Micron, Crucial, and Ballistix brand names and through private labels. We market our semiconductor memory and storage products primarily through our own direct sales force and maintain sales or representative offices in our primary markets around the world. We sell our Crucial-branded products through a web-based customer direct sales channel as well as through channel and distribution partners. Our products are also offered through independent sales representatives, distributors, and retailers. Our independent sales representatives obtain orders subject to final acceptance by us, and we make shipments against the orders directly to our customers. Our distributors carry our products in inventory and typically sell a variety of other semiconductor products, including competitors' products. We maintain inventory at locations in close proximity to certain key customers to facilitate rapid delivery of products.
In each of the last three years, approximately one-half of our total net sales were to our top ten customers. For other information regarding our concentrations and customers, see "Part II – Item 8. Financial Statements and Supplementary Data – Notes to Consolidated Financial Statements – Certain Concentrations."
7
Backlog
Because of volatile industry conditions, customers are generally reluctant to enter into long-term, fixed-price contracts. Accordingly, new order volumes for our memory and storage products may fluctuate significantly. We typically accept orders with acknowledgment that the terms may be adjusted to reflect market conditions at the time of shipment. For these reasons, we do not believe that our order backlog as of any particular date is a reliable indicator of actual sales for any succeeding period.
Product Warranty
Because the design and manufacturing process for semiconductor products is highly complex, it is possible that we may produce products that do not comply with applicable specifications, contain defects, or are otherwise incompatible with end uses. In accordance with industry practice, we generally provide a limited warranty that our products comply with applicable specifications existing at the time of delivery and will operate to those specifications during a stated warranty period. Under our standard terms and conditions of sale, liability for certain failures of product during a stated warranty period is usually limited to repair or replacement of defective items or return of, or a credit with respect to, amounts paid for such items. Under certain circumstances, we provide more extensive limited warranty coverage than that provided under our standard terms and conditions.
Competition
We face intense competition in the semiconductor memory and storage markets from a number of companies, including Intel; Samsung Electronics Co., Ltd.; SK Hynix Inc.; Toshiba Memory Corporation; and Western Digital Corporation. Some of our competitors are large corporations or conglomerates that may have greater resources to invest in technology, capitalize on growth opportunities, and withstand downturns in the semiconductor markets in which we compete. Consolidation of industry competitors could put us at a competitive disadvantage. Our competitors generally seek to increase wafer capacity, improve yields, and reduce die size in their product designs which may result in significant increases in worldwide supply and downward pressure on prices. Increases in worldwide supply of semiconductor memory and storage also result from fabrication capacity expansions, either by way of new facilities, increased capacity utilization, or reallocation of other semiconductor production to semiconductor memory and storage production. Our competitors may increase capital expenditures resulting in future increases in worldwide supply. We and some of our competitors have plans to ramp, or are constructing or ramping, production at new fabrication facilities. If competitors are more successful at developing or implementing new product or process technology, their products could have cost or performance advantages. Certain of our memory and storage products are manufactured to industry standard specifications and, as such, have similar performance characteristics to those of our competitors. For these products, the principal competitive factors are generally price and performance characteristics including operating speed, power consumption, reliability, compatibility, size, and form factors.
Some governments have provided, and may continue to provide, significant assistance, financial or otherwise, to some of our competitors or to new entrants and may intervene in support of national industries and/or competitors. In particular, we face the threat of increasing competition as a result of significant investment in the semiconductor industry by the Chinese government and various state-owned or affiliated entities that is intended to advance China's stated national policy objectives. In addition, the Chinese government may restrict us from participating in the China market or may prevent us from competing effectively with Chinese companies. Some of our competitors may use aggressive pricing to obtain market share or take business of our key customers.
8
Research and Development
Our R&D efforts are focused primarily on development of product and process technology that enables continuous improvement to cost structures and performance enhancements for our future products. We are also focused on developing new fundamentally different memory structures, materials, and packages designed to facilitate our transition to next generation products. Additional R&D efforts focus on the enablement of advanced computing, storage, and mobile memory architectures and the investigation of new opportunities that leverage our core semiconductor expertise. Product design and development efforts include high-density DDR4, DDR5, LPDDR4, LPDDR5, and advanced graphics DRAM; 3D NAND (including 96-layer and 128-layer TLC and QLC technologies); 3D XPoint technology; HBM technology; SSDs (including firmware and controllers); managed NAND; specialty memory; and other memory technologies and systems.
To compete in the semiconductor memory and storage markets, we must continue to develop technologically advanced products and processes. The continued evolution of our semiconductor product offerings is necessary to meet expected market demand for memory and storage products and solutions. Our process, design, and package development efforts occur at multiple locations across the world. Our largest R&D center is located in Boise, Idaho and other product and process development centers are located in Japan, China, Germany, Italy, India, Singapore, Taiwan, and other sites in the United States.
R&D expenses vary with the number of development wafers processed and end-product solutions developed, the cost of advanced equipment dedicated to new product and process development, and personnel costs. Because of the lead times necessary to manufacture our products, we typically begin to process wafers before completion of performance and reliability testing. Development of a product is deemed complete when it is qualified through reviews and tests for performance and reliability. As a result, R&D expenses can vary significantly depending on the timing of product qualification.
We have had agreements to share the cost of certain product and process development activities under development agreements with partners, including agreements with Intel to jointly develop NAND and 3D XPoint technologies. Amounts received from our development partners for reimbursements under our cost-sharing arrangements are reflected as reductions of R&D expenses. We substantially completed our NAND technology cost-sharing arrangement with Intel in the third quarter of 2019 and our 3D XPoint arrangement in the first quarter of 2020.
Patents and Licenses
We are a recognized leader in per capita and quality of patents issued. As of
August 29, 2019
, we owned approximately 13,750 active U.S. patents and 5,500 active foreign patents. In addition, we have thousands of U.S. and foreign patent applications pending. Our patents have various terms expiring through 2039.
From time to time, we sell and/or license our technology to other parties and continue to pursue opportunities to monetize our investments in our intellectual property through partnering and other arrangements. We have also jointly developed memory and storage product and process technology with third parties on a limited basis.
We have a number of patent and intellectual property license agreements and have, from time to time, licensed or sold our intellectual property to third parties. Some of these license agreements require us to make one-time or periodic payments while others have resulted in us receiving payments. We may need to obtain additional licenses or renew existing license agreements in the future, and we may enter into additional sales or licenses of intellectual property and partnering arrangements. We are unable to predict whether these license agreements can be obtained or renewed on terms acceptable to us.
Employees
As of
August 29, 2019
, we had approximately 37,000 employees.
9
Environmental Compliance
We approach environmental stewardship and sustainability proactively to ensure we meet all government regulations regarding use of raw materials, discharges, emissions, and wastes from our manufacturing processes. Compliance with the law and other compliance obligations is considered a minimum environmental expectation at Micron. Our wafer fabrication facilities continued to conform to the requirements of the International Organization for Standardization ("ISO") 14001 environmental management systems standard to ensure we are continuously improving our performance. As part of the ISO 14001 framework, we have established a global environmental policy and meet requirements in terms of environmental aspects evaluation and control, compliance obligations, commitment, training, communication, control of documented information, operational control, emergency preparedness and response, and management review. While we have not experienced any material adverse effects to our operations from environmental regulations, changes in regulations could necessitate additional capital expenditures, modification of our operations, or other compliance actions.
Information About Our Directors and Executive Officers
Our executive officers are appointed annually by our Board of Directors and our directors are elected annually by our shareholders. Any directors appointed by our Board to fill vacancies on the Board serve until the next election by our shareholders. All officers and directors serve until their successors are duly chosen or elected and qualified, except in the case of earlier death, resignation, or removal.
The following presents information, as of
August 29, 2019
, about our directors and executive officers who were subject to the reporting requirements of Section 16(a) of the Securities Exchange Act of 1934, as amended:
|
Name
|
Age
|
Officer/ Director Since
|
Position
|
|||
|
April S. Arnzen
|
48
|
2015
|
Senior Vice President, Human Resources
|
|||
|
Michael W. Bokan
|
58
|
2019
|
Senior Vice President, Worldwide Sales
|
|||
|
Manish Bhatia
|
47
|
2018
|
Executive Vice President, Global Operations
|
|||
|
Scott J. DeBoer
|
53
|
2007
|
Executive Vice President, Technology Development
|
|||
|
Sanjay Mehrotra
|
61
|
2017
|
President and Chief Executive Officer, Director
|
|||
|
Joel L. Poppen
|
55
|
2013
|
Senior Vice President, Legal Affairs, General Counsel, and Corporate Secretary
|
|||
|
Sumit Sadana
|
50
|
2017
|
Executive Vice President and Chief Business Officer
|
|||
|
David A. Zinsner
|
50
|
2018
|
Senior Vice President and Chief Financial Officer
|
|||
|
Robert L. Bailey
|
62
|
2007
|
Director
|
|||
|
Richard M. Beyer
|
70
|
2013
|
Director
|
|||
|
Patrick J. Byrne
|
58
|
2011
|
Director
|
|||
|
Steven J. Gomo
|
67
|
2019
|
Director
|
|||
|
Mary Pat McCarthy
|
64
|
2019
|
Director
|
|||
|
Robert E. Switz
|
72
|
2006
|
Chairman of the Board of Directors
|
|||
|
MaryAnn Wright
|
57
|
2019
|
Director
|
|||
April S. Arnzen
joined us in December 1996 and has served in various leadership positions since that time. Ms. Arnzen was named Senior Vice President, Human Resources in June 2017. Ms. Arnzen holds a BS in Human Resource Management and Marketing from the University of Idaho and is a graduate of the Stanford Graduate School of Business Executive Program.
Michael W. Bokan
joined us in 1996 and has served in various leadership positions since that time. Mr. Bokan was named Senior Vice President, Worldwide Sales in October 2018. Mr. Bokan holds a BS in Business Administration from Colorado State University.
Manish Bhatia
joined us in October 2017 as our Executive Vice President of Global Operations. From May 2016 to October 2017, Mr. Bhatia served as the Executive Vice President of Silicon Operations at Western Digital Corporation. From March 2010 to May 2016, Mr. Bhatia held several executive roles at SanDisk Corporation including Executive Vice President of Worldwide Operations when it was acquired by Western Digital in May 2016. Mr. Bhatia holds a BS and MS in Mechanical Engineering and an MBA, each from the Massachusetts Institute of Technology.
10
Scott J. DeBoer
joined us in February 1995
and has served in various leadership positions since that time. Dr. DeBoer was named Executive Vice President, Technology Development in June 2017. Dr. DeBoer holds a PhD in Electrical Engineering and an MS in Physics from Iowa State University. He completed his undergraduate degree at Hastings College.
Sanjay Mehrotra
joined us in May 2017 as our President, Chief Executive Officer, and Director. Mr. Mehrotra co-founded and led SanDisk Corporation as a start-up in 1988 until its eventual sale in May 2016, serving as its President and Chief Executive Officer from January 2011 to May 2016, and as a member of its Board of Directors from July 2010 to May 2016. Mr. Mehrotra served as a member of the Board of Directors for Cavium, Inc. from July 2009 until July 2018 and for Western Digital Corp. from May 2016 to February 2017. Mr. Mehrotra holds a BS and an MS in Electrical Engineering and Computer Science from the University of California, Berkeley and is a graduate of the Stanford Graduate School of Business Executive Program.
Joel L. Poppen
joined us in October 1995 and has held various leadership positions since that time. Mr. Poppen was named Senior Vice President, Legal Affairs, General Counsel, and Corporate Secretary in June 2017. Mr. Poppen holds a BS in Electrical Engineering from the University of Illinois and a JD from the Duke University School of Law.
Sumit Sadana
joined us in June 2017 as our Executive Vice President and Chief Business Officer. From April 2010 to May 2016, Mr. Sadana served in various roles at SanDisk Corporation, including Executive Vice President, Chief Strategy Officer, and General Manager, Enterprise Solutions when it was acquired by Western Digital in May 2016. Mr. Sadana currently serves on the Board of Directors of Silicon Laboratories, Inc. Mr. Sadana holds a B.Tech. in Electrical Engineering from the Indian Institute of Technology, Kharagpur, India and an MS in Electrical Engineering from Stanford University.
David A. Zinsner
joined us in February 2018 as our Senior Vice President and Chief Financial Officer. From April 2017 to February 2018, Mr. Zinsner served as the President and Chief Operating Officer of Affirmed Networks. From January 2009 to April 2017, Mr. Zinsner served as the Senior Vice President of Finance and Chief Financial Officer of Analog Devices. From July 2005 to January 2009, Mr. Zinsner served as the Senior Vice President and Chief Financial Officer of Intersil Corporation. Mr. Zinsner holds an MBA, Finance and Accounting from Vanderbilt University and a BS in Industrial Management from Carnegie Mellon University.
Robert L. Bailey
was Chief Executive Officer of Blue Willow Systems, Inc. from August 2017 until August 2018. Blue Willow is a software as a service resident safety platform for senior living facilities. Mr. Bailey was the Chairman of the Board of Directors of PMC-Sierra, Inc. from 2005 until May 2011 and also served as PMC's Chairman from February 2000 until February 2003. Mr. Bailey served as a director of PMC from October 1996 to May 2011. He also served as the Chief Executive Officer of PMC from July 1997 until May 2008. Within the past five years, Mr. Bailey also served on the Board of Directors of Entropic Communications. Mr. Bailey holds a BS in Electrical Engineering from the University of Bridgeport and an MBA from the University of Dallas.
Richard M. Beyer
was Chairman and Chief Executive Officer of Freescale Semiconductor, Inc. from 2008 through June 2012 and served as a director with Freescale until April 2013. Prior to Freescale, Mr. Beyer was President, Chief Executive Officer and a director of Intersil Corporation from 2002 to 2008. He also has previously served in executive management roles at FVC.com, VLSI Technology, and National Semiconductor Corporation. Within the past five years, Mr. Beyer served on the Board of Directors of Microsemi Corporation, Analog Devices, Inc., and Freescale. He currently serves on the Board of Directors of Dialog Semiconductor. Mr. Beyer served three years as an officer in the United States Marine Corps. He holds a BS and an MS in Russian from Georgetown University and an MBA in Marketing and International Business from Columbia University Graduate School of Business. Mr. Beyer is the Chair of the Board of Directors' Governance and Sustainability Committee.
Patrick J. Byrne
is the Chief Executive Officer of General Electric Company's digital business and is responsible for leading GE's digital strategy. Prior to his role at GE, he served as Senior Vice President of Fortive Corporation when Danaher Corporation completed the separation of its Test & Measurement and Industrial Technologies segments, and as President of Tektronix, a subsidiary of Danaher. Mr. Byrne also served as Vice President of Strategy and Business Development and Chief Technical Officer of Danaher from November 2012 to July 2014. Danaher designs, manufactures, and markets innovative products and services to professional, medical, industrial, and commercial customers. Mr. Byrne served as Director, President and Chief Executive Officer of Intermec, Inc. from 2007 to May 2012. Within the past five years, Mr. Byrne served on the Board of Directors of Flow International. Mr. Byrne holds a BS in Electrical Engineering from the University of California, Berkeley and an MS in Electrical Engineering from Stanford University.
11
Steven J. Gomo
was Executive Vice President, Finance and Chief Financial Officer from October 2004 until his retirement in December 2011, and Senior Vice President, Finance and Chief Financial Officer from August 2002 to September 2004, at NetApp, Inc., a storage and data management company. Within the past five years, Mr. Gomo served on the Board of Directors of SanDisk Corporation and NetSuite, Inc. He currently serves on the Board of Directors of Nutanix, Inc. and Enphase Energy, Inc. Mr. Gomo is the Chair of the Board of Directors' Audit Committee. He received his BS in Business Administration from the Oregon State University in 1974, and an MBA in Finance from the Santa Clara University in 1977.
Mary Pat McCarthy
served as Vice Chair of KPMG LLP, the U.S. member firm of the global audit, tax, and advisory services firm from July 1998 until her retirement in December 2011. She joined KMPG in 1977 and became a partner in 1987 and held numerous senior leadership positions with the firm during her tenure. Within the past five years, Ms. McCarthy served on the Board of Directors of Andeavor (previously known as Tesoro Corporation) and Mutual of Omaha. She currently serves on the Board of Directors of Palo Alto Networks, Inc. She is a Certified Public Accountant (RET) and received her BS in Business Administration from the Creighton University in 1977 and completed the University of Pennsylvania Wharton School's KMPG International Development Program. Ms. McCarthy is the Chair of the Board of Directors' Finance Committee.
Robert E. Switz
was the Chairman, President, and Chief Executive Officer of ADC Telecommunications, Inc., a supplier of network infrastructure products and services, from August 2003 until December 2010, when Tyco Electronics Ltd. acquired ADC. Mr. Switz joined ADC in 1994 and throughout his career there held numerous leadership positions. Within the past five years, Mr. Switz served on the Board of Directors of GT Advanced Technologies Inc., Broadcom Corporation, Cyan, Inc., Pulse Electronics Corporation, Leap Wireless International, Inc., and Gigamon, Inc. Mr. Switz currently serves on the Board of Directors for Marvell Technology Group Ltd. and FireEye, Inc. Mr. Switz holds an MBA from the University of Bridgeport and a BS in Business Administration from Quinnipiac University. Mr. Switz was appointed Chairman of the Board of Directors in 2012 and is the Chair of the Board of Directors' Compensation Committee.
MaryAnn Wright
was Group Vice President of Engineering and Product Development of Johnson Controls International from 2013 to 2017, and Vice President and General Manager from 2009 to 2013. Ms. Wright also served as Vice President and General Manager for Johnson Controls Hybrid Systems business and as CEO of Johnson Controls-Saft from 2007 to 2009. Ms. Wright joined the Ford Motor Company in 1988 and throughout her career there held several executive positions including Chief Engineer from 2003 to 2005, and Director of sustainable mobility technologies and hybrid and fuel cell vehicle programs from 2004 to 2005. Ms. Wright earned a BA in Economics and International Business and an MSE in Engineering from the University of Michigan. She also earned an MBA from Wayne State University. In addition to her position on Micron’s board of directors, Ms. Wright serves on the boards of Group1 Automotive Inc., Maxim Integrated, and Delphi Technologies.
There are no family relationships between any of our directors or executive officers.
Available Information
Micron is a Delaware corporation and was incorporated in 1978. Our executive offices are located at 8000 South Federal Way, Boise, Idaho 83716-9632 and our telephone number is (208) 368-4000. Information about us is available at our website, www.micron.com. Also available on our website are our Corporate Governance Guidelines, Governance and Sustainability Committee Charter, Compensation Committee Charter, Audit Committee Charter, Finance Committee Charter, and Code of Business Conduct and Ethics. Any amendments or waivers of our Code of Business Conduct and Ethics will also be posted on our website within four business days of the amendment or waiver. Copies of these documents are available to shareholders upon request. Information contained or referenced on our website is not incorporated by reference and does not form a part of this Annual Report on Form 10-K.
We use our investor relations website
http://investors.micron.com
as a routine channel for distribution of important information, including news releases, analyst presentations, and financial information. Our filings are available free of charge on our website as soon as reasonably practicable after they are electronically filed with, or furnished to, the U.S. Securities and Exchange Commission ("SEC"), including our annual and quarterly reports on Forms 10-K and 10-Q and current reports on Form 8-K, our proxy statements, and any amendments to those reports or statements. The SEC's website, www.sec.gov, contains reports, proxy and information statements, and other information regarding issuers that file electronically with the SEC. The content on any website referred to in this Form 10-K is not incorporated by reference in this Form 10-K unless expressly noted.
12
ITEM 1A. RISK FACTORS
In addition to the factors discussed elsewhere in this Form 10-K, the following are important factors, the order of which is not necessarily indicative of the level of risk that each poses to us, which could cause actual results or events to differ materially from those contained in any forward-looking statements made by us. Any of these factors could have a material adverse effect on our business, results of operations, financial condition, or stock price. Our operations could also be affected by other factors that are presently unknown to us or not considered significant.
Volatility in average selling prices for our semiconductor memory and storage products may adversely affect our business.
We have experienced significant volatility in our average selling prices, including dramatic declines as noted in the table below, and may continue to experience such volatility in the future. In some prior periods, average selling prices for our products have been below our manufacturing costs and we may experience such circumstances in the future. Average selling prices for our products that decline faster than our costs could have a material adverse effect on our business, results of operations, or financial condition.
|
|
DRAM
|
NAND
|
||||
|
(percentage change in average selling prices)
|
||||||
|
2019 from 2018
|
(30
|
)%
|
(44
|
)%
|
||
|
2018 from 2017
|
37
|
%
|
(8
|
)%
|
||
|
2017 from 2016
|
19
|
%
|
(7
|
)%
|
||
|
2016 from 2015
|
(35
|
)%
|
(19
|
)%
|
||
|
2015 from 2014
|
(11
|
)%
|
(15
|
)%
|
||
We may be unable to maintain or improve gross margins.
Our gross margins are dependent in part upon continuing decreases in per gigabit manufacturing costs achieved through improvements in our manufacturing processes and product designs, including, but not limited to, process line-width, additional 3D memory layers, additional bits per cell (i.e., cell levels), architecture, number of mask layers, number of fabrication steps, and yield. In future periods, we may be unable to reduce our per gigabit manufacturing costs at sufficient levels to maintain or improve gross margins. Factors that may limit our ability to maintain or reduce costs include, but are not limited to, strategic product diversification decisions affecting product mix, the increasing complexity of manufacturing processes, difficulties in transitioning to smaller line-width process technologies, 3D memory layers, NAND cell levels, transitioning to replacement gate technology for NAND, process complexity including number of mask layers and fabrication steps, manufacturing yield, technological barriers, changes in process technologies, and new products that may require relatively larger die sizes.
Many factors may result in a reduction of our output or a delay in ramping production, which could lead to underutilization of our production assets. These factors may include, among others, a weak demand environment, industry oversupply, inventory surpluses, declining selling prices, and changes in supply agreements. A significant portion of our manufacturing costs are fixed and do not vary proportionally with changes in production output. As a result, lower utilization and increases in our per gigabit manufacturing costs may adversely affect our gross margins, business, results of operations, or financial condition.
In addition, per gigabit manufacturing costs may also be affected by a broader product portfolio, which may have smaller production quantities and shorter product lifecycles. Our business and the markets we serve are subject to rapid technological changes and material fluctuations in demand based on end-user preferences. As a result, we may have work in process or finished goods inventories that could become obsolete or in amounts that are in excess of our customers' demand. As a result, we may incur charges in connection with obsolete or excess inventories, which could have a material adverse effect on our business, results of operations, or financial condition. Our inability to maintain or improve gross margins could have a material adverse effect on our business, results of operations, or financial condition.
The semiconductor memory and storage markets are highly competitive.
We face intense competition in the semiconductor memory and storage markets from a number of companies, including Intel; Samsung Electronics Co., Ltd.; SK Hynix Inc.; Toshiba Memory Corporation; and Western Digital Corporation. Some of our competitors are large corporations or conglomerates that may have greater resources to invest in technology, capitalize on growth opportunities, and withstand downturns in the semiconductor markets in which we compete. Consolidation of industry
13
competitors could put us at a competitive disadvantage. In addition, some governments have provided, and may continue to provide, significant assistance, financial or otherwise, to some of our competitors or to new entrants and may intervene in support of national industries and/or competitors. In particular, we face the threat of increasing competition as a result of significant investment in the semiconductor industry by the Chinese government and various state-owned or affiliated entities that is intended to advance China's stated national policy objectives. In addition, the Chinese government may restrict us from participating in the China market or may prevent us from competing effectively with Chinese companies. Some of our competitors may use aggressive pricing to obtain market share or take business of our key customers.
Our competitors generally seek to increase wafer capacity, improve yields, and reduce die size in their product designs which may result in significant increases in worldwide supply and downward pressure on prices. Increases in worldwide supply of semiconductor memory and storage also result from fabrication capacity expansions, either by way of new facilities, increased capacity utilization, or reallocation of other semiconductor production to semiconductor memory and storage production. Our competitors may increase capital expenditures resulting in future increases in worldwide supply. We and some of our competitors have plans to ramp, or are constructing or ramping, production at new fabrication facilities. Increases in worldwide supply of semiconductor memory and storage, if not accompanied by commensurate increases in demand, could lead to further declines in average selling prices for our products and could materially adversely affect our business, results of operations, or financial condition. If competitors are more successful at developing or implementing new product or process technology, their products could have cost or performance advantages.
The competitive nature of our industry could have a material adverse effect on our business, results of operations, or financial condition.
We may be unable to generate sufficient cash flows or obtain access to external financing necessary to fund our operations, make scheduled debt payments, and make adequate capital investments.
Our cash flows from operations depend primarily on the volume of semiconductor memory and storage products sold, average selling prices, and manufacturing costs. To develop new product and process technology, support future growth, achieve operating efficiencies, and maintain product quality, we must make significant capital investments in manufacturing technology, capital equipment, facilities, R&D, and product and process technology.
We estimate that capital expenditures in 2020 for property, plant, and equipment, net of partner contributions, will be approximately $7 billion to $8 billion, focused on technology transitions and product enablement. Investments in capital expenditures may not generate expected returns or cash flows. Delays in completion and ramping of new production facilities could significantly impact our ability to realize expected returns on our capital expenditures, which could have a material adverse effect on our business, results of operations, or financial condition.
As a result of the corporate reorganization proceedings of MMJ initiated in 2012, and for so long as such proceedings are continuing, MMJ is prohibited from paying dividends, including any cash dividends, to us and such proceedings require that excess earnings be used in MMJ's business or to fund the MMJ creditor payments. In addition, pursuant to an order of the Tokyo District Court, MMJ cannot make loans or advances, other than certain ordinary course advances, to us without the consent of the Tokyo District Court and may, under certain circumstances, be subject to approval of the legal trustee. As a result, the assets of MMJ are not available for use by us in our other operations. Furthermore, certain uses of the assets of MMJ, including certain capital expenditures of MMJ, may require consent of MMJ's trustees and/or the Tokyo District Court.
In the past we have utilized external sources of financing when needed. As a result of our debt levels, expected debt amortization, and general economic conditions, it may be difficult for us to obtain financing on terms acceptable to us. We have experienced volatility in our cash flows and operating results and may continue to experience such volatility in the future, which may negatively affect our credit rating. Our credit rating may also be affected by our liquidity, financial results, economic risk, or other factors, which may increase the cost of future borrowings and make it difficult for us to obtain financing on terms acceptable to us. In 2019, we suspended the security interest in the collateral under our credit facility upon achieving specified credit ratings and the prepayment of our 2022 Term Loan B; however, the security interest would be automatically reinstated upon a decline in our corporate credit rating below a certain level. There can be no assurance that we will be able to generate sufficient cash flows, use cash held by MMJ to fund its capital expenditures, access capital markets or find other sources of financing to fund our operations, make debt payments, and make adequate capital investments to remain competitive in terms of technology development and cost efficiency. Our inability to do any of the foregoing could have a material adverse effect on our business, results of operations, or financial condition.
14
Increases in tariffs or other trade restrictions or taxes on our or our customers' products or equipment and supplies could have an adverse impact on our operations.
In 2019, 89% of our revenue was from products shipped to customer locations outside the United States. We also purchase a significant portion of equipment and supplies from suppliers outside the United States. Additionally, a significant portion of our facilities are located outside the United States, including in Taiwan, Singapore, Japan, and China.
The United States and other countries have levied tariffs and taxes on certain goods. General trade tensions between the U.S. and China have been escalating since 2018, with U.S. tariffs on Chinese goods and retaliatory Chinese tariffs on U.S. goods. Some of our products are included in these tariffs. Higher duties on existing tariffs and further rounds of tariffs have been announced or threatened by U.S. and Chinese leaders. Additionally, the U.S. has threatened to impose tariffs on goods imported from other countries, which could also impact certain of our customers' or our operations. If the U.S. were to impose current or additional tariffs on components that we or our suppliers source, our cost for such components would increase. We may also incur increases in manufacturing costs and supply chain risks due to our efforts to mitigate the impact of tariffs on our customers and our operations. Additionally, tariffs on our customers' products could impact their sales of such end products, resulting in lower demand for our products.
We cannot predict what further actions may ultimately be taken with respect to tariffs or trade relations between the U.S. and other countries, what products may be subject to such actions, or what actions may be taken by other countries in retaliation. Further changes in trade policy, tariffs, additional taxes, restrictions on exports or other trade barriers, or restrictions on supplies, equipment, and raw materials including rare earth minerals, may limit our ability to produce products, increase our selling and/or manufacturing costs, decrease margins, reduce the competitiveness of our products, or inhibit our ability to sell products or purchase necessary equipment and supplies, which could have a material adverse effect on our business, results of operations, or financial condition.
U.S. trade regulations have restricted our ability to sell our products to a significant customer and could restrict our ability to sell our products to other customers.
On May 16, 2019, the Bureau of Industry and Security ("BIS") of the U.S. Department of Commerce added Huawei to the BIS's Entity List, which imposes limitations on the supply of certain U.S. items and product support to Huawei. In 2019, our sales to Huawei accounted for
12%
of our total revenue. To ensure compliance with the Entity List restrictions, we suspended shipments of all products to Huawei, effective May 16, 2019. We are reviewing our product portfolio to determine whether our products and related support are subject to the Export Administration Regulations, and therefore within the scope of the Entity List restrictions. We have determined that certain products Huawei purchases from us are not subject to the Export Administration Regulations and consequently can be lawfully sold and shipped to Huawei. Accordingly, we resumed shipping certain products to Huawei in the fourth quarter of 2019.
While Huawei remains on the Entity List, and in the absence of a license from the BIS, we may be unable to work with Huawei on future product development, which may have a negative effect on our ability to sell products to Huawei in the future. Entity List restrictions may also encourage Huawei to seek to obtain a greater supply of similar or substitute products from our competitors that are not subject to these restrictions, thereby decreasing our long-term competitiveness as a supplier to Huawei. Moreover, although Huawei is not prohibited from paying (and we are not restricted from collecting) accounts receivable for products we sell to Huawei, the credit risks associated with these accounts may have increased as a result of the BIS's actions.
We cannot predict what additional actions the U.S. government may take with respect to Huawei, including modifications to, or interpretations of, Entity List restrictions, export restrictions, tariffs, or other trade limitations or barriers. Due to the customized nature of certain of the products we manufacture, we may be unable to sell certain finished goods inventory to an alternative customer or manufacture in-process inventory to different specifications, which may result in excess and obsolescence charges in future periods.
The Entity List trade restrictions enacted during our third quarter of 2019 had an adverse effect on our business. We are unable to predict the duration of the export restrictions imposed with respect to Huawei, whether any licenses will be issued, or the long-term effects on our business. Other companies may be added to the Entity List and/or subject to trade restrictions. For example, in October 2019, the U.S. government added several additional Chinese organizations to the Entity List, effective October 9, 2019. In addition, there may be indirect impacts to our business which we cannot reasonably quantify, including that some of our other customer's products which incorporate our solutions may also be impacted by these and other trade restrictions that may be imposed by the U.S., China, or other countries. Restrictions on our ability to sell and ship our products to Huawei have had, and may continue to have, an adverse effect on our business, results of operations, or financial condition.
15
In addition, restrictions on our ability to sell and ship our products to other organizations added to the Entity List may have a further adverse effect on our business, results of operations, or financial condition.
Our future success depends on our ability to develop and produce competitive new memory and storage technologies.
Our key semiconductor memory and storage products and technologies face technological barriers to continue to meet long-term customer needs. These barriers include potential limitations on stacking additional 3D memory layers, increasing bits per cell (i.e., cell levels), meeting higher density requirements, and improving power consumption and reliability. We may face technological barriers to continue to shrink our products at our current or historical rate, which has generally reduced per-unit cost. We have invested and expect to continue to invest in R&D for new and existing products, which involves significant risk and uncertainties. We may be unable to recover our investment in R&D or otherwise realize the economic benefits of reducing die size or increasing memory and storage densities. Our competitors are working to develop new memory and storage technologies that may offer performance and/or cost advantages to existing technologies and render existing technologies obsolete. Accordingly, our future success may depend on our ability to develop and produce viable and competitive new memory and storage technologies. There can be no assurance of the following:
|
•
|
that we will be successful in developing competitive
new semiconductor memory and storage technologies;
|
|
•
|
that we will be able to cost-effectively manufacture new products;
|
|
•
|
that we will be able to successfully market these technologies; and
|
|
•
|
that margins generated from sales of these products will allow us to recover costs of development efforts.
|
We develop and produce advanced memory technologies, including 3D XPoint memory, a new class of non-volatile technology. There is no assurance that our efforts to develop and market new product technologies will be successful. Unsuccessful efforts to develop new semiconductor memory and storage technologies could have a material adverse effect on our business, results of operations, or financial condition.
A significant portion of our revenue is concentrated with a select number of customers.
In each of the last three years, approximately one-half of our total revenue was from our top ten customers. A disruption in our relationship with any of these customers could adversely affect our business. We could experience fluctuations in our customer base or the mix of revenue by customer as markets and strategies evolve. In addition, any consolidation of our customers could reduce the number of customers to whom our products could be sold. Our inability to meet our customers' requirements or to qualify our products with them could adversely impact our revenue. The loss of one or more of our major customers or any significant reduction in orders from, or a shift in product mix by, these customers could have a material adverse effect on our business, results of operations, or financial condition.
We face risks associated with our international sales and operations that could materially adversely affect our business, results of operations, or financial condition.
In 2019, 53% of our revenue was to customers who have headquarters located in the United States. We ship our products to the locations specified by our customers. Customers with global supply chains and operations may request we deliver products to countries where they own or operate production facilities or to countries where they utilize third-party subcontractors or warehouses. As a result, 89% of our revenue was from products shipped to customer locations outside the United States. In addition, a substantial portion of our manufacturing operations are located outside the United States. In particular, a significant portion of our manufacturing operations are concentrated in Singapore, Taiwan, Japan, and China. Many of our customers, suppliers, and vendors operate internationally and are also subject to the risks described below. In addition, the U.S. government has in the past restricted American firms from selling products and software to certain of our customers and may in the future impose similar bans or other restrictions on sales to one or more of our significant customers. These restrictions may not prohibit our competitors from selling similar products to our customers, which may result in our loss of sales and market share. Even when such restrictions are lifted, financial or other penalties or continuing export restrictions imposed with respect to our customers could have a continuing negative impact on our future revenue and results of operations, and we may not be able to recover any customers or market share we lose while complying with such restrictions. We have experienced restrictions on our ability to sell products to certain foreign customers where sales of products require export licenses or are prohibited by government action. Possible future U.S. government actions could lead to additional or enhanced controls on exports from the United States to China or other countries, bans on sales to other key customers, or other similar restrictions.
Trade-related government actions, by China or other countries, that impose barriers or restrictions that would impact our ability to sell or ship products to Huawei or other customers may have a negative impact on our financial condition and results of operations. We cannot predict the actions government entities may take in this context and may be unable to quickly offset or
16
effectively react to government actions that restrict our ability to sell to certain customers or in certain jurisdictions. Government actions that affect our customers' ability to sell products or access critical elements of their supply chains may result in a decreased demand for their products, which may consequently reduce their demand for our products.
Our international sales and operations are subject to a variety of risks, including:
|
•
|
export and import duties, changes to import and export regulations, customs regulations and processes, and restrictions on the transfer of funds;
|
|
•
|
imposition of bans on sales of goods or services to one or more of our significant foreign customers;
|
|
•
|
compliance with U.S. and international laws involving international operations, including the Foreign Corrupt Practices Act of 1977, as amended, export and import laws, and similar rules and regulations;
|
|
•
|
theft of intellectual property;
|
|
•
|
political and economic instability;
|
|
•
|
government actions or civil unrest preventing the flow of products, including delays in shipping and obtaining products, cancellation of orders, or loss or damage of products;
|
|
•
|
problems with the transportation or delivery of products;
|
|
•
|
issues arising from cultural or language differences and labor unrest;
|
|
•
|
longer payment cycles and greater difficulty in collecting accounts receivable;
|
|
•
|
compliance with trade, technical standards, and other laws in a variety of jurisdictions;
|
|
•
|
contractual and regulatory limitations on the ability to maintain flexibility with staffing levels;
|
|
•
|
disruptions to manufacturing operations as a result of actions imposed by foreign governments;
|
|
•
|
changes in economic policies of foreign governments; and
|
|
•
|
difficulties in staffing and managing international operations.
|
If we or our customers, suppliers, or vendors are impacted by these risks, it could have a material adverse effect on our business, results of operations, or financial condition.
We have been served with complaints in Chinese courts alleging patent infringement.
We have been served with complaints in Chinese courts alleging that we infringe certain Chinese patents by manufacturing and selling certain products in China. The complaints seek orders requiring us to destroy inventory of the accused products and equipment for manufacturing the accused products in China; to stop manufacturing, using, selling, and offering for sale the accused products in China; and to pay damages plus court fees.
We are unable to predict the outcome of these assertions of infringement made against us and therefore cannot estimate the range of possible loss. A determination that our products or manufacturing processes infringe the intellectual property rights of others or entering into a license agreement covering such intellectual property could result in significant liability and/or require us to make material changes to our operations in China, products, and/or manufacturing processes. Any of the foregoing could have a material adverse effect on our business, results of operations, or financial condition. (See "Part II. Financial Information – Item 8. Financial Statements and Supplementary Data – Notes to Consolidated Financial Statements – Contingencies.")
We are subject to allegations of anticompetitive conduct.
On April 27, 2018, a complaint was filed against Micron and other DRAM suppliers in the U.S. District Court for the Northern District of California. Subsequently, two substantially identical cases were filed in the same court. The lawsuits purport to be on behalf of a nationwide class of indirect purchasers of DRAM products. The complaints assert claims based on alleged price-fixing of DRAM products under federal and state law during the period from June 1, 2016 to February 1, 2018, and seek treble monetary damages, costs, interest, attorneys' fees, and other injunctive and equitable relief. On September 3, 2019, the District Court granted Micron's motion to dismiss and allowed plaintiffs the opportunity to file an amended complaint.
On June 26, 2018, a complaint was filed against Micron and other DRAM suppliers in the U.S. District Court for the Northern District of California. Subsequently, four substantially identical cases were filed in the same court. The lawsuits purport to be on behalf of a nationwide class of direct purchasers of DRAM products. The complaints assert claims based on alleged price-fixing of DRAM products under federal and state law during the period from June 1, 2016 to February 1, 2018, and seek treble monetary damages, costs, interest, attorneys' fees, and other injunctive and equitable relief.
17
Additionally, six cases have been filed in the following Canadian courts: Superior Court of Quebec, the Federal Court of Canada, the Ontario Superior Court of Justice, and the Supreme Court of British Columbia. The substantive allegations in these cases are similar to those asserted in the cases filed in the United States.
On May 15, 2018, the Chinese State Administration for Market Regulation ("SAMR") notified Micron that it was investigating potential collusion and other anticompetitive conduct by DRAM suppliers in China. On May 31, 2018, SAMR made unannounced visits to our sales offices in Beijing, Shanghai, and Shenzhen to seek certain information as part of its investigation. We are cooperating with SAMR in its investigation.
We are unable to predict the outcome of these matters and therefore cannot estimate the range of possible loss. The final resolution of these matters could result in significant liability and could have a material adverse effect on our business, results of operations, or financial condition.
Our business, results of operations, or financial condition could be adversely affected by the limited availability and quality of materials, supplies, and capital equipment, or the dependency on third-party service providers.
Our supply chain and operations are dependent on the availability of materials that meet exacting standards and the use of third parties to provide us with components and services. We generally have multiple sources of supply for our materials and services. However, only a limited number of suppliers are capable of delivering certain materials and services that meet our standards and, in some cases, materials, components, or services are provided by a single supplier. Various factors could reduce the availability of materials or components such as chemicals, silicon wafers, gases, photoresist, controllers, substrates, lead frames, printed circuit boards, targets, and reticle glass blanks. Shortages or increases in lead times may occur from time to time in the future. Our manufacturing processes are also dependent on our relationships with third-party manufacturers of controllers used in a number of our products and with outsourced semiconductor assembly and test providers, contract manufacturers, logistic carriers, and other service providers.
Certain materials are primarily available in certain countries, including rare earth elements, minerals, and metals available primarily from China. Trade disputes or other political or economic conditions may limit our availability to obtain such materials. Although these rare earth and other materials are generally available from multiple suppliers, China is the predominant producer of certain of these materials. If China were to stop exporting these materials, our suppliers' ability to obtain such supply may be constrained and we may be unable to obtain sufficient quantities, or obtain supply in a timely manner, or at a commercially reasonable cost. Constrained supply of rare earth elements, minerals, and metals may restrict our ability to manufacture certain of our products and make it difficult or impossible to compete with other semiconductor memory manufacturers who are able to obtain sufficient quantities of these materials from China.
We and/or our suppliers and service providers could be affected by tariffs, embargoes or other trade restrictions, as well as laws and regulations enacted in response to concerns regarding climate change, conflict minerals, and responsible sourcing practices, which could limit the supply of our materials and/or increase the cost. Environmental regulations could limit our ability to procure or use certain chemicals or materials in our operations or products. In addition, disruptions in transportation lines could delay our receipt of materials. Lead times for the supply of materials have been extended in the past. The disruption of our supply of materials, components, services, or the extension of our lead times could have a material adverse effect on our business, results of operations, or financial condition.
Our operations are dependent on our ability to procure advanced semiconductor manufacturing equipment that enables the transition to lower cost manufacturing processes. For certain key types of equipment, including photolithography tools, we are sometimes dependent on a single supplier. From time to time, we have experienced difficulties in obtaining some equipment on a timely basis due to suppliers' limited capacity. Our inability to obtain equipment on a timely basis could adversely affect our ability to transition to next generation manufacturing processes and reduce our costs. Delays in obtaining equipment could also impede our ability to ramp production at new facilities and could increase our overall costs of a ramp. Our inability to obtain advanced semiconductor manufacturing equipment in a timely manner could have a material adverse effect on our business, results of operations, or financial condition.
New product and market development may be unsuccessful.
We are developing new products, including system-level memory and storage products and solutions, which complement our traditional products or leverage their underlying design or process technology. We have made significant investments in product and process technology and anticipate expending significant resources for new semiconductor product and system-level solution development over the next several years. Additionally, we are increasingly differentiating our products and solutions to meet the specific demands of our customers, which increases our reliance on our customer's ability to accurately forecast the
18
end-customer's needs and preferences. As a result, our product demand forecasts may be impacted significantly by the strategic actions of our customers. For certain of our markets, it is important that we deliver products in a timely manner with increasingly advanced performance characteristics at the time our customers are designing and evaluating samples for their products. If we do not meet their product design schedules, our customers may excluded us from further consideration as a supplier for those products. The process to develop new products requires us to demonstrate advanced functionality and performance, often well in advance of a planned ramp of production, in order to secure design wins with our customers. In addition, some of our components have long lead-times, requiring us to place orders several months in advance of anticipated demand. Such long lead-times increase the risk of excess inventory or loss of sales in the event our forecasts vary substantially from actual demand. There can be no assurance of the following:
|
•
|
that our product development efforts will be successful;
|
|
•
|
that we will be able to cost-effectively manufacture new products;
|
|
•
|
that we will be able to successfully market these products;
|
|
•
|
that we will be able to establish or maintain key relationships with customers, or that we will not be prohibited from working with certain customers, for specific chip set or design requirements;
|
|
•
|
that we will be able to introduce new products into the market and qualify them with our customers on a timely basis; or
|
•
that margins generated from sales of these products will allow us to recover costs of development efforts.
Our unsuccessful efforts to develop new products and solutions could have a material adverse effect on our business, results of operations, or financial condition.
Increases in sales of system solutions may increase our dependency upon specific customers and our costs to develop and qualify our system solutions.
Our development of system-level memory and storage products is dependent, in part, upon successfully identifying and meeting our customers' specifications for those products. Developing and manufacturing system-level products with specifications unique to a customer increases our reliance upon that customer for purchasing our products in sufficient volume, quantity, and in a timely manner. If we fail to identify or develop products on a timely basis, or at all, that comply with our customers' specifications or achieve design wins with our customers, we may experience a significant adverse impact on our revenues and margins. Even if our products meet customer specifications, our sales of system-level solutions are dependent upon our customers choosing our products over those of our competitors and purchasing our products at sufficient volumes and prices. Our competitors' products may be less costly, provide better performance, or include additional features when compared to our products. Our long-term ability to sell system-level memory and storage products is reliant upon our customers' ability to create, market, and sell their products containing our system-level solutions at sufficient volumes and prices in a timely manner. If we fail to successfully develop and market system-level products, our business, results of operations, or financial condition may be materially adversely affected.
Even if we are successful in selling system-level solutions to our customers in sufficient volume, we may be unable to generate sufficient profit if our per-unit manufacturing costs exceed our per-unit selling prices. Manufacturing system-level solutions to customer specifications requires a longer development cycle, as compared to discrete products, to design, test, and qualify, which may increase our costs. Additionally, some of our system solutions are increasingly dependent on sophisticated firmware that may require significant customization to meet customer specifications, which increases our costs and time to market. Additionally, we may need to update our firmware or develop new firmware as a result of new product introductions or changes in customer specifications and/or industry standards, which increases our costs. System complexities and extended warranties for system-level products could also increase our warranty costs. Our failure to cost-effectively manufacture system-level solutions and/or firmware in a timely manner may result in reduced demand for our system-level products and could have a material adverse effect on our business, results of operations, or financial condition.
Products that fail to meet specifications, are defective, or that are otherwise incompatible with end uses could impose significant costs on us.
Products that do not meet specifications or that contain, or are perceived by our customers to contain, defects or that are otherwise incompatible with end uses could impose significant costs on us or otherwise materially adversely affect our business, results of operations, or financial condition. From time to time, we experience problems with nonconforming, defective, or incompatible products after we have shipped such products. In recent periods, we have further diversified and expanded our product offerings, which could potentially increase the chance that one or more of our products could fail to meet specifications in a particular application. Our products and solutions may be deemed fully or partially responsible for functions in our customers' products and may result in sharing or shifting of product or financial liability from our customers to us for
19
costs incurred by the end user as a result of our customers' products failing to perform as specified. We could be adversely affected in several ways, including the following:
|
•
|
we may be required or agree to compensate customers for costs incurred or damages caused by defective or incompatible products and to replace products;
|
|
•
|
we could incur a decrease in revenue or adjustment to pricing commensurate with the reimbursement of such costs or alleged damages; and
|
|
•
|
we may encounter adverse publicity, which could cause a decrease in sales of our products or harm our relationships with existing or potential customers.
|
Any of the foregoing items could have a material adverse effect on our business, results of operations, or financial condition.
We may be unable to protect our intellectual property or retain key employees who are knowledgeable of and develop our intellectual property.
We maintain a system of controls over our intellectual property, including U.S. and foreign patents, trademarks, copyrights, trade secrets, licensing arrangements, confidentiality procedures, non-disclosure agreements with employees, consultants, and vendors, and a general system of internal controls. Despite our system of controls over our intellectual property, it may be possible for our current or future competitors to obtain, copy, use, or disclose, illegally or otherwise, our product and process technology or other proprietary information. The laws of some foreign countries may not protect our intellectual property to the same degree as do U.S. laws and our confidentiality, non-disclosure, and non-compete agreements may be unenforceable or difficult and costly to enforce.
Additionally, our ability to maintain and develop intellectual property is dependent upon our ability to attract, develop, and retain highly skilled employees. Global competition for such skilled employees in our industry is intense. Due to the volatile nature of our industry and our operating results, a decline in our operating results and/or stock price may adversely affect our ability to retain key employees whose compensation is dependent, in part, upon the market price of our common stock, achieving certain performance metrics, levels of company profitability, or other financial or company-wide performance. If our competitors or future entrants into our industry are successful in hiring our employees, they may directly benefit from the knowledge these employees gained while they were under our employment.
Our inability to protect our intellectual property or retain key employees who are knowledgeable of and develop our intellectual property could have a material adverse effect on our business, results of operations, or financial condition.
Claims that our products or manufacturing processes infringe or otherwise violate the intellectual property rights of others, or failure to obtain or renew license agreements covering such intellectual property, could materially adversely affect our business, results of operations, or financial condition.
As is typical in the semiconductor and other high technology industries, from time to time others have asserted, and may in the future assert, that our products or manufacturing processes infringe upon, misappropriate, misuse, or otherwise violate their intellectual property rights. We are unable to predict the outcome of these assertions made against us. Any of these types of claims, regardless of the merits, could subject us to significant costs to defend or resolve such claims and may consume a substantial portion of management's time and attention. As a result of these claims, we may be required to:
|
•
|
pay significant monetary damages, fines, royalties, or penalties;
|
|
•
|
enter into license or settlement agreements covering such intellectual property rights;
|
|
•
|
make material changes to or redesign our products and/or manufacturing processes; and/or
|
|
•
|
cease manufacturing, having made, selling, offering for sale, importing, marketing, or using products and/or manufacturing processes in certain jurisdictions.
|
We may not be able to take any of the actions described above on commercially reasonable terms and any of the foregoing results could have a material adverse effect on our business, results of operations, or financial condition. (See "Part II. Financial Information – Item 8. Financial Statements and Supplementary Data – Notes to Consolidated Financial Statements – Contingencies.")
We have a number of intellectual property license agreements. Some of these license agreements require us to make one-time or periodic payments. We may need to obtain additional licenses or renew existing license agreements in the future. We are
20
unable to predict whether these license agreements can be obtained or renewed on terms acceptable to us. The failure to obtain or renew licenses as necessary could have a material adverse effect on our business, results of operations, or financial condition.
Litigation could have a material adverse effect on our business, results of operations, or financial condition.
From time to time we are subject to various legal proceedings and claims that arise out of the ordinary conduct of our business or otherwise, both domestically and internationally. Any claim, with or without merit, could result in significant legal fees that could negatively impact our financial results, disrupt our operations, and require significant attention from our management. We could be subject to litigation or arbitration disputes arising from our relationships with vendors or customers, supply agreements, or contractual obligations with our subcontractors or business partners. We may also be associated with and subject to litigation arising from the actions of our subcontractors or business partners. We may also be subject to litigation as a result of indemnities we issue, primarily with our customers, the terms of our product warranties, and from product liability claims. As we continue to focus on developing system solutions with manufacturers of consumer products, including autonomous driving, augmented reality, and others, we may be exposed to greater potential for personal liability claims against us as a result of consumers' use of those products. There can be no assurance that we are adequately insured to protect against all claims and potential liabilities, and we may elect to self-insure with respect to certain matters. Exposures to various litigation could lead to significant costs and expenses as we defend claims, are required to pay damage awards, or enter into settlement agreements, any of which could have a material adverse effect on our business, results of operations, or financial condition.
We are subject to allegations of securities violations and related wrongful acts.
On March 5, 2019, a shareholder derivative complaint was filed in the U.S. District Court for the District of Delaware, allegedly on behalf of and for the benefit of Micron, against certain current and former officers and directors of Micron for alleged breaches of their fiduciary duties and other violations of law. The allegations are based on, among other things, purported false and misleading statements regarding anticompetitive behavior in the DRAM industry. The complaint seeks damages, fees, interest, costs, and other appropriate relief. Similar shareholder derivative complaints have subsequently been filed in the U.S. District Court for the District of Delaware and the U.S. District Court for the District of Idaho.
We are unable to predict the outcome of these matters and therefore cannot estimate the range of possible loss. The final resolution of these matters could result in significant liability and could have a material adverse effect on our business, results of operations, or financial condition.
If our manufacturing process is disrupted by operational issues, natural disasters, or other events, our business, results of operations, or financial condition could be materially adversely affected.
We and our subcontractors manufacture products using highly complex processes that require technologically advanced equipment and continuous modification to improve yields and performance. Difficulties in the manufacturing process or the effects from a shift in product mix can reduce yields or disrupt production and may increase our per gigabit manufacturing costs. We and our subcontractors maintain operations and continuously implement new product and process technology at manufacturing facilities, which are widely dispersed in multiple locations in several countries including the United States, Singapore, Taiwan, Japan, Malaysia, and China. Additionally, until we complete our acquisition of Intel's noncontrolling interest in IMFT, our control over operations at IMFT is limited by our agreements with Intel. From time to time, there have been disruptions in the manufacturing process as a result of power outages, improperly functioning equipment, disruptions in supply of raw materials or components, or equipment failures. We have manufacturing and other operations in locations subject to natural occurrences such as severe weather and geological events, including earthquakes or tsunamis, that could disrupt operations. In addition, our suppliers and customers also have operations in such locations. If production is disrupted for any reason, manufacturing yields may be adversely affected, or we may be unable to meet our customers' requirements and they may purchase products from other suppliers. This could result in a significant increase in manufacturing costs, loss of revenues, or damage to customer relationships, any of which could have a material adverse effect on our business, results of operations, or financial condition.
A downturn in the worldwide economy may harm our business.
Downturns in the worldwide economy have harmed our business in the past and future downturns could also adversely affect our business. Adverse economic conditions affect demand for devices that incorporate our products, such as personal computers, mobile devices, SSDs, and servers. Reduced demand for these products could result in significant decreases in our average selling prices and product sales. A deterioration of current conditions in worldwide credit markets could limit our ability to obtain external financing to fund our operations and capital expenditures. In addition, we may experience losses on our holdings of cash and investments due to failures of financial institutions and other parties. Difficult economic conditions
21
may also result in a higher rate of losses on our accounts receivables due to credit defaults. As a result, a downturn in the worldwide economy could have a material adverse effect on our business, results of operations, or financial condition.
Breaches of our security systems, or those of our customers, suppliers, or business partners, could expose us to losses.
We maintain a system of controls over the physical security of our facilities. We also manage and store various proprietary information and sensitive or confidential data relating to our operations. In addition, we process, store, and transmit large amounts of data relating to our customers and employees, including sensitive personal information. Unauthorized persons or employees may gain access to our facilities or network systems to steal trade secrets or other proprietary information, compromise confidential information, create system disruptions, or cause shutdowns. These parties may also be able to develop and deploy viruses, worms, and other malicious software programs that disrupt our operations and create security vulnerabilities. Breaches of our physical security and attacks on our network systems, or breaches or attacks on our customers, suppliers, or business partners who have confidential or sensitive information regarding us and our customers and suppliers, could result in significant losses and damage our reputation with customers and suppliers and may expose us to litigation if the confidential information of our customers, suppliers, or employees is compromised. The foregoing could have a material adverse effect on our business, results of operations, or financial condition.
Our joint ventures and strategic relationships involve numerous risks.
We have entered into strategic relationships to develop new manufacturing process technologies and products and to manufacture certain products, including our joint development partnership and our IMFT joint venture with Intel. In January 2019, we exercised our option to acquire Intel's interest in IMFT. Subsequently, Intel set the closing date to occur on October 31, 2019. In the first quarter of 2020, we expect to pay Intel approximately
$1.4 billion
in cash for Intel's noncontrolling interest in IMFT and IMFT member debt. As of August 29, 2019, current debt included
$693 million
of IMFT member debt.
Our joint ventures and strategic relationships are subject to various risks that could adversely affect the value of our investments and our results of operations, including the following:
•
diverging interests between us and our partners and disagreements on the following:
|
◦
|
ongoing or future development, manufacturing, or operational activities;
|
|
◦
|
the amount, timing, or nature of further investments; and
|
|
◦
|
commercial terms in our joint ventures or strategic relationships;
|
•
competition from our partners;
•
access by our partners to our proprietary product and process technology which they may use;
•
difficulties in transferring technology to joint ventures;
•
difficulties and delays in ramping production at joint ventures;
•
limited control over the operations of our joint ventures;
•
inability of our partners to meet their commitments to us or our joint ventures;
|
•
|
differences in participation on funding capital investments in our joint ventures due to differing business models or long-term business goals;
|
•
inadequate cash flows to fund increased capital requirements of our joint ventures;
•
difficulties or delays in collecting amounts due to us from our joint ventures and partners;
|
•
|
disputes with partners regarding the terms of arrangements, including the termination or discontinuance of our joint ventures, or that terms of such arrangements are unfavorable; and
|
•
changes in tax, legal, or regulatory requirements that necessitate changes in the agreements with our partners.
Our pending acquisition of Intel's noncontrolling interest in IMFT may involve additional risks, including, but not limited to, an inability to sell the product IMFT produces, increases in underutilization charges, increase in R&D expenses, retention of key employees, and successful integration of IMFT.
Our joint ventures and strategic relationships, if unsuccessful, could have a material adverse effect on our business, results of operations, or financial condition.
Debt obligations could adversely affect our financial condition.
We have incurred in the past, and expect to incur in the future, debt to finance our capital investments, business acquisitions, and restructuring of our capital structure. As of
August 29, 2019
, we had debt with a carrying value of
$5.85 billion
. As of
August 29, 2019
, we also had an undrawn credit facility totaling $3.75 billion consisting of (1) an undrawn revolving credit facility that matures in July 2023 and provides for borrowings of up to $2.50 billion and (2) a term loan facility
22
for up to $1.25 billion available to be drawn in a single advance prior to November 9, 2019. As of
August 29, 2019
, the conversion value in excess of principal of our convertible notes was
$654 million
, based on the trading price of our common stock of
$44.67
per share on such date.
Our debt obligations could adversely impact us. For example, these obligations could:
|
•
|
require us to use a large portion of our cash flow to pay principal and interest on debt, which will reduce the amount of cash flow available to fund working capital, capital expenditures, acquisitions, R&D expenditures, and other business activities;
|
|
•
|
require us to use cash and/or issue shares of our common stock to settle any conversion obligations of our convertible notes;
|
|
•
|
result in certain of our debt instruments being accelerated to be immediately due and payable or being deemed to be in default if certain terms of default are triggered, such as applicable cross payment default and/or cross-acceleration provisions;
|
|
•
|
adversely impact our credit rating, which could increase future borrowing costs;
|
|
•
|
limit our future ability to raise funds for capital expenditures, strategic acquisitions or business opportunities, R&D, and other general corporate requirements;
|
|
•
|
restrict our ability to incur specified indebtedness, create or incur certain liens, and enter into sale-leaseback financing transactions;
|
|
•
|
increase our vulnerability to adverse economic and semiconductor memory and storage industry conditions;
|
|
•
|
increase our exposure to interest rate risk from variable rate indebtedness;
|
|
•
|
continue to dilute our earnings per share as a result of the conversion provisions in our convertible notes; and
|
|
•
|
require us to continue to pay cash amounts substantially in excess of the principal amounts upon settlement of our convertible notes to minimize dilution of our earnings per share.
|
Our ability to meet our payment obligations under our debt instruments depends on our ability to generate significant cash flows in the future. This, to some extent, is subject to market, economic, financial, competitive, legislative, and regulatory factors as well as other factors that are beyond our control. There can be no assurance that our business will generate cash flow from operations, or that additional capital will be available to us, in amounts sufficient to enable us to meet our debt payment obligations and to fund other liquidity needs. Additionally, events and circumstances may occur which would cause us to not be able to satisfy applicable draw-down conditions and utilize our revolving credit facility. In 2019, we suspended the security interest in the collateral under our credit facility upon achieving a specified credit rating and prepaying the 2022 Term Loan B; however, if our corporate credit rating were to decline below a certain level, the security interest would be automatically reinstated. If we are unable to generate sufficient cash flows to service our debt payment obligations, we may need to refinance or restructure our debt, sell assets, reduce or delay capital investments, or seek to raise additional capital. If we are unable to implement one or more of these alternatives, we may be unable to meet our debt payment obligations, which could have a material adverse effect on our business, results of operations, or financial condition.
We must attract, retain, and motivate highly skilled employees.
To remain competitive, we must attract, retain, and motivate executives and other highly skilled employees. Competition for experienced employees in our industry can be intense and hiring and retaining qualified executives, engineers, technical staff, and sales representatives are critical to our business. Our inability to attract and retain key employees may inhibit our ability to maintain or expand our business operations. Additionally, changes to immigration policies in the numerous countries in which we operate, including the United States, may limit our ability to hire and/or retain talent in specific locations. If our total compensation programs and workplace culture cease to be viewed as competitive, our ability to attract, retain, and motivate employees could be weakened, which could have a material adverse effect on our business, results of operations, or financial condition.
The acquisition of our ownership interest in Inotera from Qimonda has been challenged by the administrator of the insolvency proceedings for Qimonda.
On January 20, 2011, Dr. Michael Jaffé, administrator for Qimonda's insolvency proceedings, filed suit against Micron and Micron Semiconductor B.V. ("Micron B.V."), in the District Court of Munich, Civil Chamber. The complaint seeks to void, under Section 133 of the German Insolvency Act, a share purchase agreement between Micron B.V. and Qimonda signed in fall 2008, pursuant to which Micron B.V. purchased substantially all of Qimonda's shares of Inotera (the "Inotera Shares"), representing approximately 18% of Inotera's outstanding shares as of
August 29, 2019
, and seeks an order requiring us to re-transfer those shares to the Qimonda estate. The complaint also seeks, among other things, to recover damages for the alleged
23
value of the joint venture relationship with Inotera and to terminate, under Sections 103 or 133 of the German Insolvency Code, a patent cross-license between us and Qimonda entered into at the same time as the share purchase agreement.
Following a series of hearings with pleadings, arguments, and witnesses on behalf of the Qimonda estate, on March 13, 2014, the court issued judgments: (1) ordering Micron B.V. to pay approximately $1 million in respect of certain Inotera Shares sold in connection with the original share purchase; (2) ordering Micron B.V. to disclose certain information with respect to any Inotera Shares sold by it to third parties; (3) ordering Micron B.V. to disclose the benefits derived by it from ownership of the Inotera Shares, including in particular, any profits distributed on the Inotera Shares and all other benefits; (4) denying Qimonda's claims against Micron for any damages relating to the joint venture relationship with Inotera; and (5) determining that Qimonda's obligations under the patent cross-license agreement are canceled. In addition, the Court issued interlocutory judgments ordering, among other things: (1) that Micron B.V. transfer to the Qimonda estate the Inotera Shares still owned by Micron B.V. and pay to the Qimonda estate compensation in an amount to be specified for any Inotera Shares sold to third parties; and (2) that Micron B.V. pay the Qimonda estate as compensation an amount to be specified for benefits derived by Micron B.V. from ownership of the Inotera Shares. The interlocutory judgments have no immediate, enforceable effect on us, and, accordingly, we expect to be able to continue to operate with full control of the Inotera Shares subject to further developments in the case. On April 17, 2014, Micron and Micron B.V. filed a notice of appeal with the German Appeals Court challenging the District Court's decision. After opening briefs, the Appeals Court held a hearing on the matter on July 9, 2015, and thereafter appointed two independent experts to perform an evaluation of Dr. Jaffé's claims that the amount Micron paid for Qimonda was less than fair market value. On January 25, 2018, the court-appointed experts issued their report concluding that the amount paid by Micron was within an acceptable fair-value range. The Appeals Court held a subsequent hearing on April 30, 2019, and on May 28, 2019, the Appeals Court remanded the case to the experts for supplemental expert opinion.
We are unable to predict the outcome of the matter and, therefore, cannot estimate the range of possible loss. The final resolution of this lawsuit could result in the loss of the Inotera Shares or monetary damages, unspecified damages based on the benefits derived by Micron B.V. from the ownership of the Inotera Shares, and/or the termination of the patent cross-license, which could have a material adverse effect on our business, results of operations, or financial condition.
We may incur additional tax expense or become subject to additional tax exposure.
We operate in a number of locations outside the United States, including Singapore, where we have tax incentive arrangements that are conditional, in part, upon meeting certain business operations and employment thresholds. Our domestic and international taxes are dependent upon the geographic mix of our earnings among these jurisdictions. Our provision for income taxes and cash tax liabilities in the future could be adversely affected by numerous factors, including challenges by tax authorities to our tax positions and intercompany transfer pricing arrangements, failure to meet performance obligations with respect to tax incentive agreements, expanding our operations in various countries, and changes in tax laws and regulations. Additionally, we file income tax returns with the U.S. federal government, various U.S. states, and various other jurisdictions throughout the world and certain tax returns may remain open to examination for several years. The results of audits and examinations of previously filed tax returns and continuing assessments of our tax exposures may have an adverse effect on our provision for income taxes and cash tax liability. The foregoing items could have a material adverse effect on our business, results of operations, or financial condition.
A change in tax laws in key jurisdictions could materially increase our tax expense.
We are subject to income taxes in the U.S. and many foreign jurisdictions. Changes to income tax laws and regulations in any of the jurisdictions in which we operate, or in the interpretation of such laws, could significantly increase our effective tax rate and ultimately reduce our cash flow from operating activities and otherwise have a material adverse effect on our financial condition. For example, our effective tax rate increased from
1.2%
for 2018 to
9.8%
for 2019 primarily as a result of the Tax Cuts and Jobs Act enacted on December 22, 2017 by the United States. The U.S. Treasury Department continues to issue interpretive guidance on the Tax Act, including foreign tax credits, foreign minimum tax, foreign derived intangible income, and interest expense deduction limitations. It is anticipated that the guidance will be finalized over the next several months. Additionally, various levels of government are increasingly focused on tax reform and other legislative actions to increase tax revenue. Further changes in the tax laws of foreign jurisdictions could arise as a result of the base erosion and profit shifting project undertaken by the Organization for Economic Co-operation and Development, which represents a coalition of member countries and recommended changes to numerous long-standing tax principles. If adopted by countries, such changes, as well as changes in U.S. federal and state tax laws or in taxing jurisdictions' administrative interpretations, decisions, policies, and positions, could have a material adverse effect on our business, results of operations, or financial condition.
24
Our incentives from various governments are conditional upon achieving or maintaining certain performance obligations and are subject to reduction, termination, or clawback.
We have received, and may in the future continue to receive, benefits and incentives from national, state, and local governments in various regions of the world designed to encourage us to establish, maintain, or increase investment, workforce, or production in those regions. These incentives may take various forms, including grants, loan subsidies, and tax arrangements, and typically require us to perform or maintain certain levels of investment, capital spending, employment, technology deployment, or research and development activities to qualify for such incentives. We cannot guarantee that we will successfully achieve performance obligations required to qualify for these incentives or that the granting agencies will provide such funding. These incentive arrangements typically provide the granting agencies with rights to audit our performance with the terms and obligations. Such audits could result in modifications to, or termination of, the applicable incentive program. The incentives we receive could be subject to reduction, termination, or clawback, and any decrease or clawback of government incentives could have a material adverse effect on our business, results of operations, or financial condition.
We may make future acquisitions and/or alliances, which involve numerous risks.
Acquisitions and the formation or operation of alliances, such as joint ventures and other partnering arrangements, involve numerous risks, including the following:
|
•
|
integrating the operations, technologies, and products of acquired or newly formed entities into our operations;
|
|
•
|
increasing capital expenditures to upgrade and maintain facilities;
|
|
•
|
increased debt levels;
|
|
•
|
the assumption of unknown or underestimated liabilities;
|
|
•
|
the use of cash to finance a transaction, which may reduce the availability of cash to fund working capital, capital expenditures, R&D expenditures, and other business activities;
|
|
•
|
diverting management's attention from daily operations;
|
|
•
|
managing larger or more complex operations and facilities and employees in separate and diverse geographic areas;
|
|
•
|
hiring and retaining key employees;
|
|
•
|
requirements imposed by governmental authorities in connection with the regulatory review of a transaction, which may include, among other things, divestitures or restrictions on the conduct of our business or the acquired business;
|
|
•
|
inability to realize synergies or other expected benefits;
|
|
•
|
failure to maintain customer, vendor, and other relationships;
|
|
•
|
inadequacy or ineffectiveness of an acquired company's internal financial controls, disclosure controls and procedures, compliance programs, and/or environmental, health and safety, anti-corruption, human resource, or other policies or practices; and
|
|
•
|
impairment of acquired intangible assets, goodwill, or other assets as a result of changing business conditions, technological advancements, or worse-than-expected performance of the acquired business.
|
In previous years, supply of memory and storage products has significantly exceeded customer demand resulting in significant declines in average selling prices. The global memory and storage industry has experienced consolidation and may continue to consolidate. We engage, from time to time, in discussions regarding potential acquisitions and similar opportunities. To the extent we are successful in completing any such transactions, we could be subject to some or all of the risks described above, including the risks pertaining to funding, assumption of liabilities, integration challenges, and increases in debt that may accompany such transactions. Acquisitions of, or alliances with, technology companies are inherently risky and may not be successful and could have a material adverse effect on our business, results of operations, or financial condition.
Changes in foreign currency exchange rates could materially adversely affect our business, results of operations, or financial condition.
Across our global operations, significant transactions and balances are denominated in currencies other than the U.S. dollar (our reporting currency), primarily the euro, Singapore dollar, New Taiwan dollar, and yen. Although we hedge our primary exposures to changes in currency exchange rates from our monetary assets and liabilities, the effectiveness of these hedges is dependent upon our ability to accurately forecast our monetary assets and liabilities. In addition, a significant portion of our manufacturing costs are denominated in foreign currencies. Exchange rates for some of these currencies against the U.S. dollar, particularly the yen, have been volatile in recent periods. If these currencies strengthen against the U.S. dollar, our manufacturing costs could significantly increase. Exchange rates for the U.S. dollar that adversely change against our foreign currency exposures could have a material adverse effect on our business, results of operations, or financial condition.
25
We may incur additional restructuring charges in future periods.
From time to time, we have, and may in the future, enter into restructure initiatives in order to, among other items, streamline our operations, respond to changes in business conditions, our markets or product offerings, or to centralize certain key functions. We may not realize expected savings or other benefits from our restructure activities and may incur additional restructure charges or other losses in future periods associated with other initiatives. In connection with any restructure initiatives, we could incur restructure charges, loss of production output, loss of key personnel, disruptions in our operations, and difficulties in the timely delivery of products, which could have a material adverse effect on our business, results of operations, or financial condition.
Compliance with customer and responsible sourcing requirements and related regulations could limit the supply and increase the cost of certain materials, supplies, and services used in manufacturing our products.
Many of our customers have adopted responsible sourcing programs that require us to periodically report on our supply chain and responsible sourcing efforts to ensure we source the materials, supplies, and services we use and incorporate into the products we sell in a manner that is consistent with their programs. Some of our customers may elect to disqualify us as a supplier or reduce purchases from us if we are unable to verify that our products meet the specifications of their responsible sourcing programs. Meeting customer requirements may limit the sourcing and availability of some of the materials, supplies, and services we use, particularly when the availability of such is concentrated to a limited number of suppliers. This in turn may affect our ability and/or the cost to obtain materials, supplies, and services necessary for the manufacture of our products in sufficient quantities.
This increased focus on environmental protection and social responsibility initiatives led to the passage of Section 1502 of the Dodd-Frank Wall Street Reform and Consumer Protection Act of 2010 and its implementing SEC regulations. The act imposes supply chain diligence and disclosure requirements for certain manufacturers of products containing specific minerals that may originate in or near the Democratic Republic of the Congo and finance or benefit local armed groups. These conflict minerals are commonly found in materials used in the manufacture of semiconductors.
Our inability to comply with customers' requirements for responsible sourcing or with regulations could have a material adverse effect on our business, results of operations, or financial condition.
We and others are subject to a variety of laws and regulations that may result in additional costs and liabilities.
The manufacturing of our products requires the use of facilities, equipment, and materials that are subject to a broad array of laws and regulations in numerous jurisdictions in which we operate. Additionally, we are subject to a variety of other laws and regulations relative to the construction, maintenance, and operations of our facilities. Any of these laws or regulations could cause us to incur additional direct costs, as well as increased indirect costs related to our relationships with our customers and suppliers, and otherwise harm our operations and financial condition. Any failure to comply with these laws or regulations could adversely impact our reputation and our financial results. Additionally, we engage various third parties to represent us or otherwise act on our behalf and we partner with other companies in our joint ventures, all of whom are also subject to a broad array of laws and regulations. Our engagement with these third parties and our ownership in these joint ventures may also expose us to risks associated with their respective compliance with these laws and regulations. As a result of these items, we could experience the following:
|
•
|
suspension of production;
|
|
•
|
remediation costs;
|
|
•
|
alteration of our manufacturing processes;
|
|
•
|
regulatory penalties, fines, and legal liabilities; and
|
|
•
|
reputational challenges.
|
Our failure, or the failure of our third-party agents or joint ventures, to comply with these laws and regulations could have a material adverse effect on our business, results of operations, or financial condition.
We are subject to counterparty default risks.
We have numerous arrangements with financial institutions that subject us to counterparty default risks, including cash deposits, investments, capped call contracts on our common stock, and derivative instruments. As a result, we are subject to the risk that the counterparty to one or more of these arrangements will default on its performance obligations. A counterparty may
26
not comply with their contractual commitments which could then lead to their defaulting on their obligations with little or no notice to us, which could limit our ability to take action to mitigate our exposure. Additionally, our ability to mitigate our exposures may be constrained by the terms of our contractual arrangements or because market conditions prevent us from taking effective action. If one of our counterparties becomes insolvent or files for bankruptcy, our ability to recover any losses suffered as a result of that counterparty's default may be limited by the liquidity of the counterparty or the applicable laws governing the bankruptcy proceedings. In the event of such default, we could incur significant losses, which could have a material adverse effect on our business, results of operations, or financial condition.
The operations of MMJ are subject to continued oversight by the Tokyo District Court during the pendency of the corporate reorganization proceedings.
Because MMJ's plan of reorganization provides for ongoing payments to creditors following the closing of the MMJ acquisition, the reorganization proceedings in Japan (the "Japan Proceedings") are continuing and MMJ remains subject to the oversight of the Tokyo District Court and of the trustees (including a trustee designated by us, who we refer to as the business trustee, and a trustee designated by the Tokyo District Court, who we refer to as the legal trustee), pending completion of the reorganization proceedings. The business trustee is responsible for overseeing the operation of the business of the MMJ Companies, other than oversight in relation to acts that need to be carried out in connection with the Japan Proceedings, which are the responsibility of the legal trustee. The final creditor payment under MMJ's plan of reorganization is scheduled to occur in December 2019. Following distribution of the final payment and the Tokyo District Court's approval and issuance of an order concluding the reorganization proceedings, MMJ's reorganization proceedings in Japan and oversight of the Tokyo District Court will terminate.
During the pendency of the reorganization proceedings in Japan, MMJ is obligated to provide periodic financial reports to the Tokyo District Court and may be required to obtain the consent of the Tokyo District Court prior to taking a number of significant actions relating to its businesses, including transferring or disposing of, or acquiring, certain material assets, incurring or guaranteeing material indebtedness, settling material disputes, or entering into certain material agreements. The consent of the legal trustee may also be required for matters that would likely have a material impact on the operations or assets of MMJ or for transfers of material assets, to the extent the matters or transfers would reasonably be expected to materially and adversely affect execution of MMJ's plan of reorganization. Accordingly, during the pendency of the reorganization proceedings in Japan, our ability to operate MMJ as part of our global business or to cause MMJ to take certain actions that we deem advisable for its business could be adversely affected if the Tokyo District Court or the legal trustee is unwilling to consent to various actions that we may wish to take with respect to MMJ.
The operations of MMJ being subject to the continued oversight by the Tokyo District Court during the pendency of the corporate reorganization proceedings could have a material adverse effect on our business, results of operations, or financial condition.
ITEM 1B. UNRESOLVED STAFF COMMENTS
None.
ITEM 2. PROPERTIES
Our corporate headquarters are located in Boise, Idaho. The following is a summary of our principal facilities as of
August 29, 2019
:
|
Location
|
Principal Operations
|
|
|
Taiwan
|
R&D, wafer fabrication, component assembly and test, module assembly and test
|
|
|
Singapore
|
R&D, wafer fabrication, component assembly and test, module assembly and test
|
|
|
Japan
|
R&D, wafer fabrication
|
|
|
United States
|
R&D, wafer fabrication, reticle manufacturing
|
|
|
China
|
Component assembly and test, module assembly and test
|
|
|
Malaysia
|
Component assembly and test, module assembly and test
|
|
27
We own or lease numerous other facilities in locations throughout the world used for design, R&D, and sales and marketing activities. We generally utilize all of our manufacturing capacity; however, a portion of our IMFT facility was underutilized for 2019 and 2018. We believe that our existing facilities are suitable and adequate for our present purposes. We do not identify or allocate assets by operating segment, other than goodwill. (See "Part II – Item 8. Financial Statements and Supplementary Data – Notes to Consolidated Financial Statements – Geographic Information.")
ITEM 3. LEGAL PROCEEDINGS
Reorganization Proceedings of the MMJ Companies
In 2013, we completed the acquisition of Elpida Memory, Inc., now known as MMJ, a Japanese corporation, pursuant to the terms and conditions of an Agreement on Support for Reorganization Companies (as amended, the "Sponsor Agreement") that we entered into in 2012 with the trustees of the MMJ Companies' pending corporate reorganization proceedings under the Corporate Reorganization Act of Japan. Under the Sponsor Agreement, we agreed to provide certain support for the reorganization of the MMJ Companies and the trustees agreed to prepare and seek approval from the Tokyo District Court and the MMJ Companies' creditors of plan of reorganization consistent with such support.
The plan of reorganization provides for payments by the MMJ Companies to their secured and unsecured creditors in an aggregate amount of 200 billion yen, less certain expenses of the reorganization proceedings and certain other items. The plan of reorganization also provided for the investment by us pursuant to the Sponsor Agreement of 60 billion yen paid at closing in cash into MMJ in exchange for 100% ownership of MMJ's equity and the use of such investment to fund the initial installment payment by the MMJ Companies to their creditors of 60 billion yen, subject to reduction for certain items specified in the Sponsor Agreement and plan of reorganization.
Under MMJ's plan of reorganization, secured creditors will recover 100% of the amount of their fixed claims and unsecured creditors will recover at least 17.4% of the amount of their fixed claims. The actual recovery of unsecured creditors will be higher, however, based in part on events and circumstances occurring following the plan approval. The remaining portion of the unsecured claims will be discharged, without payment, over the period that payments are made pursuant to the plan of reorganization. The secured creditors were paid in full on or before the sixth installment payment date, while the unsecured creditors will be paid in seven installments. The unsecured creditors of MAI were scheduled to be paid in
seven
installments; however, in connection with our sale of MAI in 2017, the remaining MAI creditor obligation was paid in full and MAI's reorganization proceedings were closed.
Because MMJ's plan of reorganization provides for ongoing payments to creditors following the closing of the MMJ acquisition, the reorganization proceedings in Japan are continuing and MMJ remains subject to the oversight of the Tokyo District Court and of the trustees (including a trustee designated by us, who we refer to as the business trustee, and a trustee designated by the Tokyo District Court, who we refer to as the legal trustee), pending completion of the reorganization proceedings. The business trustee is responsible for overseeing the operation of the businesses of the MMJ Companies, other than oversight in relation to acts that need to be carried out in connection with the Japan Proceedings, which are the responsibility of the legal trustee. The final creditor payment under MMJ's plan of reorganization is scheduled to occur in December 2019. MMJ's reorganization proceedings in Japan and oversight of the Tokyo District Court will terminate following the distribution of the final creditor payment and the Tokyo District Court's approval and issuance of an order concluding the reorganization proceedings.
During the pendency of the reorganization proceedings in Japan, MMJ is obligated to provide periodic financial reports to the Tokyo District Court and may be required to obtain the consent of the Tokyo District Court prior to taking a number of significant actions relating to its businesses, including transferring or disposing of, or acquiring, certain material assets, incurring or guaranteeing material indebtedness, settling material disputes, or entering into certain material agreements. The consent of the legal trustee may also be required for matters that would likely have a material impact on the operations or assets of MMJ or for transfers of material assets, to the extent the matters or transfers would reasonably be expected to materially and adversely affect execution of MMJ's plan of reorganization. Accordingly, during the pendency of the reorganization proceedings in Japan, our ability to effectively integrate MMJ as part of our global operations or to cause MMJ to take certain actions that we deem advisable for its businesses could be adversely affected if the Tokyo District Court or the legal trustee is unwilling to consent to various actions that we may wish to take with respect to MMJ.
See "Part II – Financial Information – Item 8. Financial Statements and Supplementary Data – Notes to Consolidated Financial Statements – Contingencies" and "Item 1A. Risk Factors" for a discussion of other legal proceedings.
28
ITEM 4. MINE SAFETY DISCLOSURES
Not applicable.
PART II
ITEM 5. MARKET FOR REGISTRANT'S COMMON EQUITY, RELATED STOCKHOLDER MATTERS, AND ISSUER PURCHASES OF EQUITY SECURITIES
Holders of Record
As of October 10, 2019, there were
2,009
shareholders of record of our common stock.
Equity Compensation Plan Information
The information required by this item is incorporated by reference from the information to be included in our
2019
Proxy Statement under the section entitled "Equity Compensation Plan Information," which will be filed with the Securities and Exchange Commission within 120 days after
August 29, 2019
.
Issuer Purchase of Equity Securities
Common Stock Repurchase Authorization
:
Our Board of Directors has authorized the discretionary repurchase of up to $10 billion of our outstanding common stock beginning in fiscal 2019. We may purchase shares on a discretionary basis through open-market purchases, block trades, privately-negotiated transactions, derivative transactions, and/or pursuant to Rule 10b5-1 trading plans, subject to market conditions and our ongoing determination of the best use of available cash. The repurchase authorization does not obligate us to acquire any common stock.
|
Period
|
(a) Total number of shares purchased
|
(b) Average price paid per share
|
(c) Total number of shares (or units) purchased as part of publicly announced plans or programs
|
(d) Maximum number (or approximate dollar value) of shares (or units) that may yet be purchased under publicly announced plans or programs
|
||||||||||||
|
May 31, 2019
|
–
|
July 4, 2019
|
—
|
|
$
|
—
|
|
—
|
|
|||||||
|
July 5, 2019
|
–
|
August 1, 2019
|
—
|
|
—
|
|
—
|
|
||||||||
|
August 2, 2019
|
–
|
August 29, 2019
|
—
|
|
—
|
|
—
|
|
||||||||
|
—
|
|
$
|
7,337,838,234
|
|
||||||||||||
Shares of common stock withheld as payment of withholding taxes and exercise prices in connection with the vesting or exercise of equity awards are also treated as common stock repurchases. Those withheld shares of common stock are not considered common stock repurchases under an authorized common stock repurchase plan and accordingly are excluded from the amounts in the table above.
29
Performance Graph
The following graph illustrates a five-year comparison of cumulative total returns for our common stock, the S&P 500 Composite Index, and the Philadelphia Semiconductor Index (SOX) from August 31, 2014, through August 31, 2019. We operate on a 52 or 53 week fiscal year which ends on the Thursday closest to August 31. Accordingly, the last day of our fiscal year varies. For consistent presentation and comparison to the industry indices shown herein, we have calculated our stock performance graph assuming an August 31 year end.
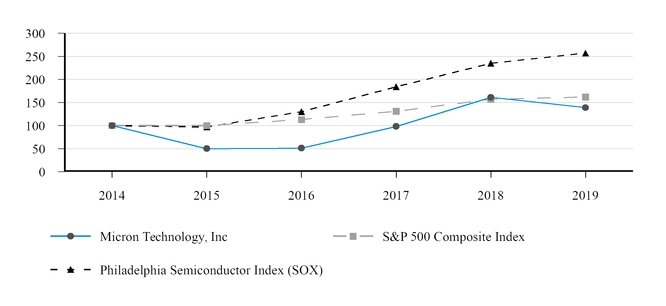
Note: Management cautions that the stock price performance information shown in the graph above may not be indicative of current stock price levels or future stock price performance.
The performance graph above assumes $100 was invested on August 31, 2014 in common stock of Micron Technology, Inc., the S&P 500 Composite Index, and the Philadelphia Semiconductor Index (SOX). Any dividends paid during the period presented were assumed to be reinvested. The performance was plotted using the following data:
|
|
2014
|
2015
|
2016
|
2017
|
2018
|
2019
|
||||||||||||||||||
|
Micron Technology, Inc.
|
$
|
100
|
|
$
|
50
|
|
$
|
51
|
|
$
|
98
|
|
$
|
161
|
|
$
|
139
|
|
||||||
|
S&P 500 Composite Index
|
100
|
|
100
|
|
113
|
|
131
|
|
157
|
|
162
|
|
||||||||||||
|
Philadelphia Semiconductor Index (SOX)
|
100
|
|
97
|
|
130
|
|
184
|
|
235
|
|
257
|
|
||||||||||||
30
ITEM 6. SELECTED FINANCIAL DATA
|
|
2019
|
2018
|
2017
|
2016
|
2015
|
|||||||||||||||
|
|
(in millions, except per share amounts)
|
|||||||||||||||||||
|
Revenue
|
$
|
23,406
|
|
$
|
30,391
|
|
$
|
20,322
|
|
$
|
12,399
|
|
$
|
16,192
|
|
|||||
|
Gross margin
|
10,702
|
|
17,891
|
|
8,436
|
|
2,505
|
|
5,215
|
|
||||||||||
|
Operating income
|
7,376
|
|
14,994
|
|
5,868
|
|
168
|
|
2,998
|
|
||||||||||
|
Net income (loss)
|
6,358
|
|
14,138
|
|
5,090
|
|
(275
|
)
|
2,899
|
|
||||||||||
|
Net income (loss) attributable to Micron
|
6,313
|
|
14,135
|
|
5,089
|
|
(276
|
)
|
2,899
|
|
||||||||||
|
Diluted earnings (loss) per share
|
5.51
|
|
11.51
|
|
4.41
|
|
(0.27
|
)
|
2.47
|
|
||||||||||
|
Cash and short-term investments
|
7,955
|
|
6,802
|
|
5,428
|
|
4,398
|
|
3,521
|
|
||||||||||
|
Total current assets
|
16,503
|
|
16,039
|
|
12,457
|
|
9,495
|
|
8,596
|
|
||||||||||
|
Property, plant, and equipment
|
28,240
|
|
23,672
|
|
19,431
|
|
14,686
|
|
10,554
|
|
||||||||||
|
Total assets
|
48,887
|
|
43,376
|
|
35,336
|
|
27,540
|
|
24,143
|
|
||||||||||
|
Total current liabilities
|
6,390
|
|
5,754
|
|
5,334
|
|
4,835
|
|
3,905
|
|
||||||||||
|
Long-term debt
|
4,541
|
|
3,777
|
|
9,872
|
|
9,154
|
|
6,252
|
|
||||||||||
|
Total Micron shareholders' equity
|
35,881
|
|
32,294
|
|
18,621
|
|
12,080
|
|
12,302
|
|
||||||||||
|
Noncontrolling interests in subsidiaries
|
889
|
|
870
|
|
849
|
|
848
|
|
937
|
|
||||||||||
|
Total equity
|
36,770
|
|
33,164
|
|
|
19,470
|
|
|
12,928
|
|
|
13,239
|
|
|||||||
In December 2016, we acquired the
67%
remaining interest in Inotera and began consolidating Inotera's operating results. In the periods presented above through December 2016, Inotera sold DRAM products exclusively to us through supply agreements. The cash paid for the Inotera Acquisition was funded, in part, with a term loan of 80 billion New Taiwan dollars and
$986 million
from the sale of
58 million
shares of our common stock. See "Item 8. Financial Statements and Supplementary Data – Notes to Consolidated Financial Statements – Acquisition of Inotera."
ITEM 7. MANAGEMENT'S DISCUSSION AND ANALYSIS OF FINANCIAL CONDITION AND RESULTS OF OPERATIONS
This discussion should be read in conjunction with the consolidated financial statements and accompanying notes for the year ended
August 29, 2019
. All period references are to our fiscal periods unless otherwise indicated. Our fiscal year is the 52 or 53-week period ending on the Thursday closest to August 31. Our fiscal 2019, 2018, and 2017 each contain 52 weeks. All tabular dollar amounts are in millions, except per share amounts.
For an overview of our business, see "Part I – Item 1. Business – Overview."
31
Results of Operations
Consolidated Results
|
For the year ended
|
2019
|
2018
|
2017
|
||||||||||||||||||
|
Revenue
|
$
|
23,406
|
|
100
|
%
|
$
|
30,391
|
|
100
|
%
|
$
|
20,322
|
|
100
|
%
|
||||||
|
Cost of goods sold
|
12,704
|
|
54
|
%
|
12,500
|
|
41
|
%
|
11,886
|
|
58
|
%
|
|||||||||
|
Gross margin
|
10,702
|
|
46
|
%
|
17,891
|
|
59
|
%
|
8,436
|
|
42
|
%
|
|||||||||
|
Selling, general, and administrative
|
836
|
|
4
|
%
|
813
|
|
3
|
%
|
743
|
|
4
|
%
|
|||||||||
|
Research and development
|
2,441
|
|
10
|
%
|
2,141
|
|
7
|
%
|
1,824
|
|
9
|
%
|
|||||||||
|
Other operating (income) expense, net
|
49
|
|
—
|
%
|
(57
|
)
|
—
|
%
|
1
|
|
—
|
%
|
|||||||||
|
Operating income
|
7,376
|
|
32
|
%
|
14,994
|
|
49
|
%
|
5,868
|
|
29
|
%
|
|||||||||
|
|
|
||||||||||||||||||||
|
Interest income (expense), net
|
77
|
|
—
|
%
|
(222
|
)
|
(1
|
)%
|
(560
|
)
|
(3
|
)%
|
|||||||||
|
Other non-operating income (expense), net
|
(405
|
)
|
(2
|
)%
|
(465
|
)
|
(2
|
)%
|
(112
|
)
|
(1
|
)%
|
|||||||||
|
Income tax (provision) benefit
|
(693
|
)
|
(3
|
)%
|
(168
|
)
|
(1
|
)%
|
(114
|
)
|
(1
|
)%
|
|||||||||
|
Equity in net income (loss) of equity method investees
|
3
|
|
—
|
%
|
(1
|
)
|
—
|
%
|
8
|
|
—
|
%
|
|||||||||
|
Net income attributable to noncontrolling interests
|
(45
|
)
|
—
|
%
|
(3
|
)
|
—
|
%
|
(1
|
)
|
—
|
%
|
|||||||||
|
Net income attributable to Micron
|
$
|
6,313
|
|
27
|
%
|
$
|
14,135
|
|
47
|
%
|
$
|
5,089
|
|
25
|
%
|
||||||
Total Revenue
Total revenue for 2019 decreased 23% as compared to 2018 primarily due to pricing declines resulting from the challenging memory market environment in 2019. Sales of DRAM products for 2019 decreased 28% as compared to 2018 primarily due to declines in average selling prices of approximately 30% resulting from supply and demand imbalances, customer inventory corrections, and CPU shortages. Sales of NAND products for 2019 decreased 12% as compared to 2018 primarily due to declines in average selling prices in the mid-40% range resulting from supply and demand imbalances, which were partially offset by significant increases in sales volumes. In addition, demand for our NAND products was adversely affected by the transition from SATA SSDs to NVMe SSDs. The higher NAND sales volumes in 2019 were driven by increases in sales of high-value mobile managed NAND products as well as discrete NAND products enabled by our execution in ramping 64- and 96-layer TLC 3D NAND.
Total revenue for 2018 increased 50% as compared to 2017. Higher revenue in 2018 for both DRAM and NAND as compared to 2017 were driven by strong execution in delivering high-value products featuring our 1Xnm DRAM and 64-layer 3D NAND technologies combined with strong demand for products across our primary markets. Sales of DRAM products for 2018 increased 64% from 2017 primarily due to an increase in average selling prices of approximately 35% and an increase in sales volumes of approximately 20% as a result of strong market conditions, particularly for cloud, enterprise, mobile, and graphics markets, combined with increased sales into high-value markets. Sales of NAND products for 2018 increased 20% from 2017 despite declines in average selling prices primarily due to an increase in sales volumes of approximately 30% driven by increases in sales of high-value SSD and mobile managed NAND products enabled by strong demand and our execution in delivering 3D NAND products.
Overall Gross Margin
Our overall gross margin percentage decreased to 46% for 2019 from 59% for 2018 primarily due to declines in average selling prices partially offset by cost reductions resulting from strong execution in delivering products featuring advanced technologies and from continuous improvement initiatives to reduce production costs. Underutilization of IMFT assets adversely impacted our gross margin by a per-quarter average of approximately $100 million in 2019 and $65 million in 2018, and we anticipate the adverse impact of underutilization at IMFT to increase to approximately $150 million per quarter beginning in the first quarter of 2020.
32
We continue to evaluate planned technology node transitions, capital spending and re-use rates for NAND equipment. Based on our preliminary assessment, we anticipate changing the depreciable life of our NAND equipment from five to seven years beginning in the first quarter of 2020. We anticipate this change will reduce our depreciation expense included in cost of goods sold for the first quarter of 2020 by approximately $80 million, increasing to approximately $100 to $150 million per quarter for the remainder of 2020.
Our overall gross margin percentage increased to 59% for 2018 from 42% for 2017 primarily due to favorable market conditions across key markets combined with strong execution in delivering products featuring advanced technologies, including 1Xnm DRAM and 64-layer 3D NAND, enabling manufacturing cost reductions. For 2018 as compared to 2017, pricing for DRAM products increased while manufacturing costs declined and, for NAND products, manufacturing cost reductions outpaced declines in average selling prices.
Revenue by Business Unit
|
For the year ended
|
2019
|
2018
|
2017
|
||||||||||||||||||
|
CNBU
|
$
|
9,968
|
|
43
|
%
|
$
|
15,252
|
|
50
|
%
|
$
|
8,624
|
|
42
|
%
|
||||||
|
MBU
|
6,403
|
|
27
|
%
|
6,579
|
|
22
|
%
|
4,424
|
|
22
|
%
|
|||||||||
|
SBU
|
3,826
|
|
16
|
%
|
5,022
|
|
17
|
%
|
4,514
|
|
22
|
%
|
|||||||||
|
EBU
|
3,137
|
|
13
|
%
|
3,479
|
|
11
|
%
|
2,695
|
|
13
|
%
|
|||||||||
|
All Other
|
72
|
|
—
|
%
|
59
|
|
—
|
%
|
65
|
|
—
|
%
|
|||||||||
|
|
$
|
23,406
|
|
|
$
|
30,391
|
|
|
|
$
|
20,322
|
|
|
|
|||||||
Percentages of total revenue may not total 100% due to rounding.
CNBU revenue for 2019 decreased 35% as compared to 2018 due to challenging market conditions in 2019, which led to price declines. MBU revenue for 2019 decreased 3% as compared to 2018 primarily due to price declines offset by strong execution in developing and qualifying mobile managed NAND products and continued content growth in smartphones, which combined to drive significant increase in shipment volumes. SBU revenue for 2019 decreased 24% as compared to 2018 primarily due to price declines, partially offset by significant growth in shipment volumes as a result of strong execution in ramping 64-layer and 96-layer TLC NAND products. SBU revenue includes products manufactured and sold to Intel under a long-term supply agreement at prices approximating cost, which included 3D XPoint memory and NAND, aggregating $682 million, $541 million, and $553 million, for 2019, 2018, and 2017, respectively. EBU revenue for 2019 decreased 10% as compared to 2018 primarily due to lower sales to consumer markets as a result of weak demand and pricing, partially offset by increases in sales to automotive and industrial markets.
CNBU revenue for 2018 increased 77% as compared to 2017 due to strong market conditions and demand in key markets, including cloud server, client, enterprise server, and graphics, which drove increases in pricing and sales volumes. Sales into cloud and graphics markets more than doubled in 2018 as compared to 2017. MBU revenue for 2018 increased 49% as compared to 2017 primarily due to customer qualifications for LPDRAM and managed NAND products, which combined with higher memory content in smartphones to drive improvements in DRAM pricing and increases in sales volumes. SBU revenue for 2018 from all other sales of NAND products (excluding sales to Intel at prices approximating cost) increased 13% as compared to 2017 driven by higher sales of SSD storage products, which increased by 72%, partially offset by declines in SBU NAND component sales from a strategic reallocation of supply from component sales to SSD and mobile managed NAND products. Increases in SBU sales volumes for 2018 resulting from strong demand for cloud and enterprise SSD markets more than offset declines in selling prices. EBU revenue for 2018 increased 29% as compared to 2017 primarily due to strong demand across EBU's primary markets including consumer, industrial multimarkets, and automotive.
Operating Income (Loss) by Business Unit
|
For the year ended
|
2019
|
2018
|
2017
|
||||||||||||||||||
|
CNBU
|
$
|
4,645
|
|
47
|
%
|
$
|
9,773
|
|
64
|
%
|
$
|
3,755
|
|
44
|
%
|
||||||
|
MBU
|
2,606
|
|
41
|
%
|
3,033
|
|
46
|
%
|
927
|
|
21
|
%
|
|||||||||
|
SBU
|
(386
|
)
|
(10
|
)%
|
964
|
|
19
|
%
|
552
|
|
12
|
%
|
|||||||||
|
EBU
|
923
|
|
29
|
%
|
1,473
|
|
42
|
%
|
975
|
|
36
|
%
|
|||||||||
|
All Other
|
13
|
|
18
|
%
|
—
|
|
—
|
%
|
23
|
|
35
|
%
|
|||||||||
|
|
$
|
7,801
|
|
$
|
15,243
|
|
$
|
6,232
|
|
||||||||||||
Percentages reflect operating income (loss) as a percentage of revenue for each business unit.
33
CNBU operating income for 2019 decreased from 2018 primarily due to declines in pricing and higher R&D costs, partially offset by cost reductions. MBU operating income for 2019 decreased from 2018 primarily due to declines in pricing partially offset by increases in sales of high-value managed NAND products and manufacturing cost reductions. SBU operating margin for 2019 declined from 2018 primarily due to declines in pricing, which were partially offset by manufacturing cost reductions and increases in sales volumes. SBU operating results for 2019 and 2018 were adversely impacted by the underutilization charges at IMFT. EBU operating income for 2019 decreased from 2018 as a result of declines in pricing and higher R&D costs partially offset by manufacturing cost reductions and increases in sales volumes.
CNBU operating income for 2018 improved from 2017 primarily due to improved pricing and higher sales volumes resulting from strong demand for our products combined with manufacturing cost reductions. MBU operating income for 2018 improved from 2017 primarily due to increases in pricing and sales volumes for LPDRAM products, higher sales of high-value managed NAND products, and manufacturing cost reductions. SBU operating income for 2018 improved from 2017 primarily due to manufacturing cost reductions enabled by our execution in transitioning to 64-layer TLC 3D NAND products and improvements in product mix. SBU operating income for 2018 was adversely impacted by higher costs associated with IMFT's production of 3D XPoint memory products at less than full capacity. EBU operating income for 2018 increased as compared to 2017 as a result of increases in average selling prices, manufacturing cost reductions, and increases in sales volumes, partially offset by higher R&D costs.
Operating Expenses and Other
Selling, General, and Administrative
SG&A expenses for 2019 were 3% higher than 2018 primarily due to increases in legal costs and consulting fees, partially offset by a reduction in employee compensation and sales commissions. SG&A expenses for 2018 were 9% higher than 2017 primarily due to increases in legal costs, consulting fees, and employee compensation.
Research and Development
R&D expenses vary primarily with the number of development wafers processed, amounts reimbursed under R&D cost-sharing agreements, the cost of advanced equipment dedicated to new product and process development, and personnel costs. Because of the lead times necessary to manufacture our products, we typically begin to process wafers before completion of performance and reliability testing. Development of a product is deemed complete when it is qualified through reviews and tests for performance and reliability. R&D expenses can vary significantly depending on the timing of product qualification.
R&D expenses for 2019 were 14% higher than 2018 primarily due to decreases in reimbursements from our R&D cost-sharing arrangements as described below, increases in depreciation expense as a result of increases in capital spending, and increases in employee compensation. R&D expenses for 2018 were 17% higher than 2017 primarily due to increases in employee compensation, volumes of development and pre-qualification wafers, and depreciation expense as a result of increases in capital spending.
We share the cost of certain product and process development activities under development agreements with partners, including agreements to jointly develop NAND and 3D XPoint technologies with Intel. Our R&D expenses were reduced by reimbursements under these development partner arrangements by
$60 million
,
$201 million
, and
$213 million
for
2019
,
2018
, and
2017
, respectively. The decrease in R&D reimbursements for 2019 was primarily due to reductions in our joint development activities with Intel for 3D NAND and 3D XPoint technologies. In 2018, we and Intel agreed to independently develop subsequent generations of 3D NAND and we substantially completed this cost-sharing agreement in the third quarter of 2019. In 2018, we announced that we and Intel will no longer jointly develop 3D XPoint technology beyond the second generation and we substantially completed this cost-sharing agreement in the first quarter of 2020.
Income Taxes
On December 22, 2017, the United States enacted comprehensive tax legislation, commonly referred to as the Tax Cuts and Jobs Act (the "Tax Act"), which imposed a one-time transition tax in 2018 (the "Repatriation Tax") and, beginning in 2019, created a new minimum tax on certain foreign earnings (the "Foreign Minimum Tax"). In connection with the provisions of the Tax Act, we made an accounting policy election to treat the Foreign Minimum Tax provision as a period cost in the period the tax is incurred. SEC Staff Accounting Bulletin No. 118 ("SAB 118") allowed the use of provisional amounts (reasonable estimates) if the analyses of the impacts of the Tax Act had not been completed when financial statements were issued. During
34
2019, we finalized the computations of the income tax effects of the Tax Act. As such, in accordance with SAB 118, our accounting for the effects of the Tax Act is complete.
Our income tax (provision) benefit consisted of the following:
|
For the year ended
|
2019
|
2018
|
2017
|
|||||||||
|
Income tax (provision) benefit, excluding items below
|
$
|
(530
|
)
|
$
|
(274
|
)
|
$
|
(168
|
)
|
|||
|
Utilization of and other changes in net deferred tax assets of MMJ, MMT, and MTTW
|
(173
|
)
|
(68
|
)
|
54
|
|
||||||
|
Repatriation Tax, net of adjustments related to uncertain tax positions
|
10
|
|
(1,030
|
)
|
—
|
|
||||||
|
Release of the valuation allowance on net deferred tax assets of our U.S. operations
|
—
|
|
1,337
|
|
—
|
|
||||||
|
Remeasurement of deferred tax assets and liabilities reflecting lower U.S. corporate tax rates
|
—
|
|
(133
|
)
|
—
|
|
||||||
|
$
|
(693
|
)
|
$
|
(168
|
)
|
$
|
(114
|
)
|
||||
|
Effective tax rate
|
9.8
|
%
|
1.2
|
%
|
2.2
|
%
|
||||||
Our effective tax rate increased in 2019 primarily as a result of the Foreign Minimum Tax. Our income tax rates include operations outside the United States, including Singapore, where we have tax incentive arrangements that further decrease our effective tax rates.
As a result of the Tax Act, we reevaluated our indefinite reinvestment assertion in 2018 and deemed a portion of our accumulated foreign earnings to be no longer indefinitely reinvested. Although these earnings have been subject to U.S. federal income tax under the Repatriation Tax, the repatriation to the United States of all or a portion of these earnings would potentially be subject to foreign withholding and state income tax. As of
August 29, 2019
, we had a deferred tax liability of
$10 million
associated with our undistributed earnings.
We operate in a number of jurisdictions outside the Unites States, including Singapore, where we have tax incentive arrangements, which expire in whole or in part at various dates through 2034, that are conditional, in part, upon meeting certain business operations and employment thresholds. The effect of tax incentive arrangements reduced our tax provision by
$756 million
(benefiting our diluted earnings per share by
$0.66
) for
2019
, by
$1.96 billion
(
$1.59
per diluted share) for
2018
, and by
$742 million
(
$0.64
per diluted share) for
2017
.
(See "Item 8. Financial Statements and Supplementary Data – Notes to Consolidated Financial Statements – Income Taxes.")
Other
Interest income increased 71% for 2019 as compared to 2018 primarily due to increases in interest rates. Interest expense decreased 63% as compared to 2018 primarily due to prepayments, repurchases, and conversions of debt in 2018 and 2019 and increases in capitalized interest from higher levels of capital spending, partially offset by the issuance of the 2024 Notes, 2026 Notes, 2027 Notes, 2029 Notes, and 2030 Notes in 2019.
Interest income increased 193% for 2018 as compared to 2017 primarily due to increases in marketable investments and interest rates. Interest expense decreased 43% as compared to 2017 primarily due to decreases in debt obligations.
Further discussion of other operating and non-operating income and expenses can be found in the following notes contained in "Item 8. Financial Statements and Supplementary Data – Notes to Consolidated Financial Statements":
|
•
|
Equity Plans
|
|
•
|
Research and Development
|
|
•
|
Other Operating Income (Expense), Net
|
|
•
|
Other Non-Operating Income (Expense), Net
|
35
Liquidity and Capital Resources
Our primary sources of liquidity are cash generated from operations and financing obtained from capital markets and financial institutions. Cash generated from operations is highly dependent on selling prices for our products, which can vary significantly from period to period. We are continuously evaluating alternatives for efficiently funding our capital expenditures and ongoing operations. We expect, from time to time, to engage in a variety of financing transactions for such purposes, including the issuance of securities. As of
August 29, 2019
, we had undrawn credit facilities totaling $3.75 billion consisting of (1) an undrawn revolving credit facility that matures in July 2023 and provides for borrowings of up to $2.50 billion and (2) a term loan facility of up to $1.25 billion available to be drawn in a single advance prior to November 9, 2019 which matures on the fifth anniversary of the funding date. We expect to draw under the term loan facility prior to acquiring Intel's interest in IMFT in the first quarter of 2020. We expect that our cash and investments, cash flows from operations, and available financing will be sufficient to meet our requirements at least through the next 12 months.
To develop new product and process technology, support future growth, achieve operating efficiencies, and maintain product quality, we must continue to invest in manufacturing technologies, facilities and equipment, and R&D. We estimate that capital expenditures in 2020 for property, plant, and equipment, net of partner contributions, to be $7 billion to $8 billion, focused on technology transitions and product enablement. The actual amounts for 2020 will vary depending on market conditions. As of
August 29, 2019
, we had commitments of approximately
$4.3 billion
for the acquisition of property, plant, and equipment, approximately
$3.2 billion
is expected to be paid in 2020 and the remainder in 2021.
Our Board of Directors has authorized the discretionary repurchase of up to
$10 billion
of our outstanding common stock beginning in 2019, which we may purchase on a discretionary basis through open-market purchases, block trades, privately-negotiated transactions, derivative transactions, and/or pursuant to a Rule 10b5-1 trading plan, subject to market conditions and our ongoing determination of the best use of available cash. The repurchase authorization does not obligate us to acquire any common stock. In 2019, we repurchased
67 million
shares of our common stock for
$2.66 billion
under an accelerated share repurchase agreement, Rule 10b5-1 plans, and through open market repurchases. See "Item 8. Financial Statements and Supplementary Data – Notes to Consolidated Financial Statements – Equity."
In January 2019, we exercised our option to acquire Intel's interest in IMFT. Intel has set the closing date to occur on October 31, 2019. In connection with our acquisition, in the first quarter of 2020, we expect to pay Intel approximately
$1.4 billion
for Intel's interest in IMFT as well as IMFT member debt owed to Intel. As of August 29, 2019, current debt included
$693 million
of IMFT member debt.
Cash and marketable investments totaled
$9.12 billion
as of
August 29, 2019
and
$7.28 billion
as of
August 30, 2018
. Our investments consist primarily of money market funds and liquid investment-grade, fixed-income securities, diversified among industries and individual issuers. To mitigate credit risk, we invest through high-credit-quality financial institutions and by policy generally limit the concentration of credit exposure by restricting the amount of investments with any single obligor. As of
August 29, 2019
, $2.50 billion of our cash and marketable investments was held by our foreign subsidiaries.
Limitations on the Use of Cash and Investments
MMJ Group
:
Cash and marketable investments as of
August 29, 2019
included $536 million held by the MMJ Group. As a result of the corporate reorganization proceedings of MMJ initiated in March 2012, and for so long as such proceedings are continuing, the MMJ Group is prohibited from paying dividends to us. In addition, pursuant to an order of the Tokyo District Court, the MMJ Group cannot make loans or advances, other than certain ordinary course advances, to us without the consent of the Tokyo District Court and may, under certain circumstances, be subject to the approval of the legal trustee. As a result, the assets of the MMJ Group are not available for use by us in our other operations. Furthermore, certain uses of the assets of the MMJ Group, including investments in certain capital expenditures, may require consent of MMJ's trustees and/or the Tokyo District Court.
IMFT
:
Cash and marketable investments included
$130 million
held by IMFT as of
August 29, 2019
. Our ability to access funds held by IMFT to finance our other operations is subject to agreement by Intel and contractual limitations. Amounts held by IMFT are not anticipated to be available to finance our other operations.
36
Cash Flows
|
For the year ended
|
2019
|
2018
|
2017
|
|||||||||
|
Net cash provided by operating activities
|
$
|
13,189
|
|
$
|
17,400
|
|
$
|
8,153
|
|
|||
|
Net cash provided by (used for) investing activities
|
(10,085
|
)
|
(8,216
|
)
|
(7,537
|
)
|
||||||
|
Net cash provided by (used for) financing activities
|
(2,438
|
)
|
(7,776
|
)
|
349
|
|
||||||
|
Effect of changes in currency exchange rates on cash, cash equivalents, and restricted cash
|
26
|
|
(37
|
)
|
(12
|
)
|
||||||
|
Net increase in cash, cash equivalents, and restricted cash
|
$
|
692
|
|
$
|
1,371
|
|
$
|
953
|
|
|||
Operating Activities
:
For 2019, cash provided by operating activities was due primarily to cash generated by our operations and the effect of working capital adjustments, which included a $2.43 billion decrease in receivables due to a lower level of net sales and a $1.53 billion increase in inventory due to higher levels of work in process and raw materials inventories.
For 2018, cash provided by operating activities was due primarily to cash generated by our operations and the effect of working capital adjustments, which included a $1.73 billion increase in receivables due to a higher level of net sales.
For 2017, cash provided by operating activities was due primarily to cash generated by our operations and the effect of working capital adjustments, which included a $1.65 billion increase in receivables due to a higher level of net sales, $361 million of payments attributed to intercompany balances in connection with the Inotera Acquisition, and a $456 million increase in accounts payable and accrued expenses.
Investing Activities
:
For 2019, net cash used for investing activities consisted primarily of $9.03 billion of expenditures for property, plant, and equipment (net of partner contributions) and
$1.17 billion
of net outflows from sales, maturities, and purchases of available-for-sale securities.
For 2018, net cash used for investing activities consisted primarily of $7.99 billion of expenditures for property, plant, and equipment (net of partner contributions), partially offset by
$164 million
of net inflows from sales, maturities, and purchases of available-for-sale securities.
For 2017, net cash used for investing activities consisted primarily of $4.73 billion of expenditures for property, plant, and equipment (net of partner contributions), $2.63 billion of net cash paid for the Inotera Acquisition (net of $361 million of payments attributed to intercompany balances with Inotera included in operating activities), and $269 million of net outflows from sales, maturities, and purchases of available-for-sale securities.
Financing Activities
:
For 2019, net cash used for financing activities consisted primarily of
$2.66 billion
for the acquisition of
67 million
shares of treasury stock under our $10 billion share repurchase authorization and cash payments to reduce our debt, including $1.65 billion to settle conversions of notes, $728 million to prepay the 2022 Term Loan B,
$316 million
for IMFT member debt repayments, and $643 million for scheduled repayment of other notes and capital leases. Cash used for financing activities was partially offset by net proceeds of $3.53 billion from the aggregate issuance of the 2024 Notes, 2026 Notes, 2027 Notes, 2029 Notes, and 2030 Notes.
For 2018, net cash used for financing activities consisted primarily of cash payments to reduce our debt, including $9.42 billion to prepay or repurchase debt and settle conversions of notes and $774 million for scheduled repayment of other notes and capital leases. Cash used for financing activities was partially offset by net proceeds of $1.36 billion from the issuance of 34 million shares of our common stock for $41.00 per share in a public offering and $1.01 billion of proceeds from IMFT member debt.
For 2017, net cash provided by financing activities consisted primarily of $2.48 billion of net proceeds from the 2021 MSTW Term Loan, and $795 million of net proceeds from the 2021 MSAC Term Loan, partially offset by $1.63 billion to repurchase notes, repayments of $381 million of capital lease obligations, repayments of $550 million of other debt and convertible notes, and payments of $519 million on equipment purchase contracts.
See "Item 8. Financial Statements and Supplementary Data – Notes to Consolidated Financial Statements – Debt."
37
Potential Settlement Obligations of Convertible Notes
Since the closing price of our common stock exceeded
130%
of the conversion price per share of all our convertible notes for at least
20
trading days in the
30
trading day period ended on September 30, 2019, holders may convert these notes through the calendar quarter ended December 31, 2019. The following table summarizes the potential settlements that we could be required to make for the calendar quarter ending December 31, 2019 if all holders converted their notes. The amounts in the table below are based on our closing share price of
$44.67
as of
August 29, 2019
.
|
Settlement Option
|
If Settled With Minimum Cash Required
|
If Settled Entirely With Cash
|
||||||||||||||||
|
Principal Amount
|
Amount in Excess of Principal
|
Underlying Shares
|
Cash
|
Remainder in Shares
|
||||||||||||||
|
2032D Notes
|
Cash and/or shares
|
Cash and/or shares
|
13
|
|
$
|
—
|
|
13
|
|
$
|
598
|
|
||||||
|
2033F Notes
|
Cash
|
Cash and/or shares
|
6
|
|
197
|
|
1
|
|
252
|
|
||||||||
|
|
19
|
|
$
|
197
|
|
14
|
|
$
|
850
|
|
||||||||
As of
August 29, 2019
, convertible notes in the table above included an aggregate of
$179 million
net carrying amount for the settlement obligation (including principal and amounts in excess of principal) for conversions of 2033F Notes. The
20
consecutive trading day measurement period ended in the first quarter of 2020, and we settled the conversion for
$192 million
in cash in the first quarter of 2020.
Contractual Obligations
|
Payments Due by Period
|
||||||||||||||||||||
|
As of August 29, 2019
|
Total
|
Less than 1 year
|
1-3 years
|
|
3-5 years
|
|
More than 5 years
|
|||||||||||||
|
Notes payable
(1)(2)
|
$
|
6,811
|
|
$
|
1,302
|
|
$
|
530
|
|
$
|
978
|
|
$
|
4,001
|
|
|||||
|
Capital lease obligations
(2)
|
702
|
|
248
|
|
180
|
|
85
|
|
189
|
|
||||||||||
|
Operating leases
(3)
|
752
|
|
54
|
|
127
|
|
112
|
|
459
|
|
||||||||||
|
Purchase obligations
(4)
|
7,575
|
|
5,155
|
|
1,997
|
|
67
|
|
356
|
|
||||||||||
|
Other long-term liabilities
(5)
|
325
|
|
190
|
|
109
|
|
9
|
|
17
|
|
||||||||||
|
Total
|
$
|
16,165
|
|
$
|
6,949
|
|
$
|
2,943
|
|
$
|
1,251
|
|
$
|
5,022
|
|
|||||
|
(1)
|
Amounts include MMJ Creditor Payments, convertible notes, and other notes.
|
|
(2)
|
Amounts include principal and interest.
|
|
(3)
|
Amounts include contractually obligated minimum lease payments for operating leases having an initial noncancelable term in excess of one year.
|
|
(4)
|
Purchase obligations include all commitments to purchase goods or services of either a fixed or minimum quantity that meet any of the following criteria: (1) they are noncancelable, (2) we would incur a penalty if the agreement was canceled, or (3) we must make specified minimum payments even if we do not take delivery of the contracted products or services. If the obligation to purchase goods or services is noncancelable, the entire value of the contract was included in the above table. If the obligation is cancelable, but we would incur a penalty if canceled, only the dollar amount of the penalty was included as a purchase obligation. Contracted minimum amounts specified in any take-or-pay contracts were included in the above table as they represent the portion of each contract that is a firm commitment.
|
|
(5)
|
Amounts represent future cash payments to satisfy other long-term liabilities recorded on our consolidated balance sheet, including $190 million for the current portion of these long-term liabilities. We are unable to reliably estimate the timing of future certain payments related to uncertain tax positions and deferred tax liabilities; therefore, the amount has been excluded from the preceding table. However, other noncurrent liabilities recorded on our consolidated balance sheet included these uncertain tax positions and deferred tax liabilities.
|
The timing of payment amounts of the obligations discussed above is based on current information. Any redemptions, repurchases, or conversions of debt could impact the amount and timing of our cash payments.
38
Off-Balance Sheet Arrangements
In connection with our 2033F Notes, we entered into the 2033F Capped Calls, which are intended to reduce the effect of potential dilution. See "Item 8. Financial Statements and Supplementary Data – Notes to Consolidated Financial Statements – Equity – Micron Shareholders' Equity – Outstanding Capped Calls."
Critical Accounting Estimates
The preparation of financial statements and related disclosures in conformity with U.S. GAAP requires management to make estimates and judgments that affect the reported amounts of assets, liabilities, revenues, expenses, and related disclosures. Estimates and judgments are based on historical experience, forecasted events, and various other assumptions that we believe to be reasonable under the circumstances. Estimates and judgments may vary under different assumptions or conditions. We evaluate our estimates and judgments on an ongoing basis. Our management believes the accounting policies below are critical in the portrayal of our financial condition and results of operations and require management's most difficult, subjective, or complex judgments.
Business acquisitions
:
Accounting for acquisitions requires us to estimate the fair value of consideration paid and the individual assets and liabilities acquired, which involves a number of judgments, assumptions, and estimates that could materially affect the amount and timing of costs recognized in subsequent periods. Accounting for acquisitions can also involve significant judgment to determine when control of the acquired entity is transferred. We typically obtain independent third-party valuation studies to assist in determining fair values, including assistance in determining future cash flows, discount rates, and comparable market values. Items involving significant assumptions, estimates, and judgments include the following:
|
•
|
Debt, including discount rate and timing of payments;
|
|
•
|
Deferred tax assets, including projections of future taxable income and tax rates;
|
|
•
|
Fair value of consideration paid or transferred;
|
|
•
|
Intangible assets, including valuation methodology, estimations of future revenue and costs, profit allocation rates attributable to the acquired technology, and discount rates;
|
|
•
|
Inventory, including estimated future selling prices, timing of product sales, and completion costs for work in process; and
|
|
•
|
Property, plant, and equipment, including determination of values in a continued-use model.
|
Consolidation
:
We have interests in entities that are VIEs. Determining whether to consolidate a VIE requires judgment in assessing whether an entity is a VIE and if we are the entity's primary beneficiary. If we are the primary beneficiary of a VIE, we are required to consolidate it. To determine if we are the primary beneficiary, we evaluate whether we have the power to direct the activities that most significantly impact the VIE's economic performance and the obligation to absorb losses or the right to receive benefits of the VIE that could potentially be significant to the VIE. Our evaluation includes identification of significant activities and an assessment of our ability to direct those activities based on governance provisions and arrangements to provide or receive product and process technology, product supply, operations services, equity funding, financing, and other applicable agreements and circumstances. Our assessments of whether we are the primary beneficiary of our VIEs require significant assumptions and judgments.
Contingencies
:
We are subject to the possibility of losses from various contingencies. Significant judgment is necessary to estimate the probability and amount of a loss, if any, from such contingencies. An accrual is made when it is probable that a liability has been incurred or an asset has been impaired and the amount of loss can be reasonably estimated. We accrue a liability and charge operations for the estimated costs of adjudication or settlement of asserted and unasserted claims existing as of the balance sheet date. In accounting for the resolution of contingencies, significant judgment may be necessary to estimate amounts pertaining to periods prior to the resolution that are charged to operations in the period of resolution and amounts related to future periods.
Goodwill and intangible assets
:
We test goodwill for impairment in the fourth quarter of our fiscal year, or more frequently if indicators of an impairment exist, to determine whether it is more likely than not that the fair value of the reporting unit with goodwill is less than its carrying value. For reporting units for which this assessment concludes that it is more likely than not that the fair value is more than its carrying value, goodwill is considered not impaired and we are not required to perform the goodwill impairment test. Qualitative factors considered in this assessment include industry and market considerations, overall financial performance, and other relevant events and factors affecting the fair value of the reporting unit. For reporting units for which this assessment concludes that it is more likely than not that the fair value is below the carrying value, goodwill is tested
39
for impairment by determining the fair value of each reporting unit and comparing it to the carrying value of the net assets assigned to the reporting unit. If the fair value of the reporting unit exceeds its carrying value, goodwill is considered not impaired. If the carrying value of the reporting unit exceeds its fair value, then we would record an impairment loss up to the difference between the carrying value and implied fair value.
Determining when to test for impairment, the reporting units, the assets and liabilities of the reporting unit, and the fair value of the reporting unit requires significant judgment and involves the use of significant estimates and assumptions. These estimates and assumptions include revenue growth rates, forecasted manufacturing costs, and other expenses and are developed as part of our long-range planning process. The same estimates are used in business planning, forecasting, and capital budgeting as part of our long-term manufacturing capacity analysis. We test the reasonableness of the output of our long-range planning process by calculating an implied value per share and comparing that to current stock prices, analysts' consensus pricing, and management's expectations. These estimates and assumptions are used to calculate projected future cash flows for the reporting unit, which are discounted using a risk-adjusted rate to estimate a fair value. The discount rate requires determination of appropriate market comparables. We base fair value estimates on assumptions we believe to be reasonable but that are unpredictable and inherently uncertain. Actual future results may differ from those estimates. During the fourth quarter of 2019, we performed a sensitivity analysis for goodwill impairment with respect to each of our respective reporting units and determined that a hypothetical 10% decline in the fair value of each reporting unit would not result in an impairment of goodwill for any reporting unit.
We test other identified intangible assets with definite useful lives when events and circumstances indicate the carrying value may not be recoverable by comparing the carrying amount to the sum of undiscounted cash flows expected to be generated by the asset. We test intangible assets with indefinite lives annually for impairment using a fair value method such as discounted cash flows. Estimating fair values involves significant assumptions, including future sales prices, sales volumes, costs, and discount rates.
Income taxes
:
We are required to estimate our provision for income taxes and amounts ultimately payable or recoverable in numerous tax jurisdictions around the world. These estimates involve significant judgment and interpretations of regulations and are inherently complex. Resolution of income tax treatments in individual jurisdictions may not be known for many years after completion of the applicable fiscal year. We are also required to evaluate the realizability of our deferred tax assets on an ongoing basis in accordance with U.S. GAAP, which requires the assessment of our performance and other relevant factors. Realization of deferred tax assets is dependent on our ability to generate future taxable income. In recent periods, our results of operations have benefitted from increases in the amount of deferred taxes we expect to realize, primarily from the levels of capital spending and increases in the amount of taxable income we expect to realize in Japan and the United States. Our income tax provision or benefit is dependent, in part, on our ability to forecast future taxable income in these and other jurisdictions. Such forecasts are inherently difficult and involve significant judgments including, among others, projecting future average selling prices and sales volumes, manufacturing and overhead costs, levels of capital spending, and other factors that significantly impact our analyses of the amount of net deferred tax assets that are more likely than not to be realized.
Inventories
:
Inventories are stated at the lower of average cost or net realizable value. Cost includes depreciation, labor, material, and overhead costs, including product and process technology costs. Determining net realizable value of inventories involves significant judgments, including projecting future average selling prices and future sales volumes. To project average selling prices and sales volumes, we review recent sales volumes, existing customer orders, current contract prices, industry analyses of supply and demand, seasonal factors, general economic trends, and other information. When these analyses reflect estimated net realizable values below our manufacturing costs, we record a charge to cost of goods sold in advance of when inventories are actually sold. Differences in forecasted average selling prices used in calculating lower of cost or net realizable value adjustments can result in significant changes in the estimated net realizable value of product inventories and accordingly the amount of write-down recorded. For example, a 5% variance in the estimated selling prices would have changed the estimated net realizable value of our inventory by approximately $469 million as of August 29, 2019. Due to the volatile nature of the semiconductor memory and storage markets, actual selling prices and volumes often vary significantly from projected prices and volumes; as a result, the timing of when product costs are charged to operations can vary significantly.
U.S. GAAP provides for products to be grouped into categories in order to compare costs to net realizable values. The amount of any inventory write-down can vary significantly depending on the determination of inventory categories. We review the major characteristics of product type and markets in determining the unit of account for which we perform the lower of average cost or net realizable value analysis and categorize inventories primarily as memory (including DRAM, NAND, and other memory).
40
Property, plant, and equipment
:
We periodically assess the estimated useful lives of our property, plant, and equipment based on technology node transitions, capital spending, and equipment re-use rates. We also review the carrying value of property, plant, and equipment for impairment when events and circumstances indicate that the carrying value of an asset or group of assets may not be recoverable from the estimated future cash flows expected to result from its use and/or disposition. In cases where undiscounted expected future cash flows are less than the carrying value, an impairment loss is recognized equal to the amount by which the carrying value exceeds the estimated fair value of the assets. The estimate of future cash flows involves numerous assumptions which require significant judgment by us, including, but not limited to, future use of the assets for our operations versus sale or disposal of the assets, future selling prices for our products and future production and sales volumes. In addition, significant judgment is required in determining the groups of assets for which impairment tests are separately performed.
Research and development
:
Costs related to the conceptual formulation and design of products and processes are expensed as R&D as incurred. Determining when product development is complete requires significant judgment. We deem development of a product complete once the product has been thoroughly reviewed and tested for performance and reliability. Subsequent to product qualification, product costs are included in cost of goods sold.
Revenue recognition
:
Revenue is primarily recognized at a point in time when control of the promised goods is transferred to our customers in an amount that reflects the consideration we expect to be entitled to in exchange for those goods. Contracts with our customers are generally short-term in duration at fixed, negotiated prices with payment generally due shortly after delivery. We estimate a liability for returns using the expected value method based on historical rates of return. In addition, we generally offer price protection to our distributors, which is a form of variable consideration that decreases the transaction price. We use the expected value method, based on historical price adjustments and current pricing trends, to estimate the amount of revenue recognized from sales to distributors. Differences between the estimated and actual amounts are recognized as adjustments to revenue.
Stock-based compensation
:
Stock-based compensation is estimated at the grant date based on the fair value of the award and is recognized as expense using the straight-line amortization method over the requisite service period. For performance-based stock awards, the expense recognized is dependent on our assessment of the likelihood of the performance measure being achieved. We utilize forecasts of future performance to assess these probabilities and this assessment requires significant judgment.
Determining the appropriate fair-value model and calculating the fair value of stock-based awards at the grant date requires significant judgment, including estimating stock price volatility and expected option life. We develop these estimates based on historical data and market information which can change significantly over time. A small change in the estimates used can result in a relatively large change in the estimated valuation. We use the Black-Scholes option valuation model to value employee stock options and awards granted under our employee stock purchase plan. We estimate stock price volatility based on an average of historical volatility and the implied volatility derived from traded options on our stock.
Recently Adopted Accounting Standards
See "Item 8. Financial Statements and Supplementary Data – Notes to Consolidated Financial Statements – Recently Adopted Accounting Standards."
Recently Issued Accounting Standards Not Yet Adopted
See "Item 8. Financial Statements and Supplementary Data – Notes to Consolidated Financial Statements – Recently Issued Accounting Standards Not Yet Adopted."
41
ITEM 7A. QUANTITATIVE AND QUALITATIVE DISCLOSURES ABOUT MARKET RISK
Interest Rate Risk
We are exposed to interest rate risk related to our indebtedness and our investment portfolio. As of
August 29, 2019
and
August 30, 2018
, we had fixed-rate debt of $5.3 billion and $3.1 billion, respectively, and as a result, the fair value of our debt fluctuates with changes in market interest rates. We estimate that, as of
August 29, 2019
and
August 30, 2018
, a decrease in market interest rates of 1% would increase the fair value of our fixed-rate debt by approximately $290 million and $79 million, respectively. As of
August 29, 2019
, we had no variable-rate debt. As of
August 30, 2018
, we had variable-rate debt of $725 million. As of
August 30, 2018
, a 1% increase in the interest rates of our variable-rate debt would result in an increase in annual interest expense of approximately $7 million.
Foreign Currency Exchange Rate Risk
The information in this section should be read in conjunction with the information related to changes in the currency exchange rates in "Part I – Item 1A. Risk Factors." Changes in currency exchange rates could materially adversely affect our results of operations or financial condition.
The functional currency for all of our operations is the U.S. dollar. The substantial majority of our sales are transacted in the U.S. dollar; however, significant amounts of our debt, operating expenditures, and capital purchases are incurred in or exposed to other currencies, primarily the euro, New Taiwan dollar, Singapore dollar, and yen. We have established currency risk management programs for our monetary assets and liabilities denominated in foreign currencies to hedge against fluctuations in the fair value and volatility of future cash flows caused by changes in currency exchange rates. We generally utilize currency forward contracts in these hedging programs, which reduce, but do not always entirely eliminate, the impact of currency exchange rate movements. We do not use derivative financial instruments for trading or speculative purposes.
Based on monetary assets and liabilities denominated in foreign currencies, we estimate that a 10% adverse change in exchange rates versus the U.S. dollar would result in losses of approximately
$149 million
as of
August 29, 2019
and
$78 million
as of
August 30, 2018
. We hedge our exposure to changes in currency exchange rates by utilizing a rolling hedge strategy for our primary currency exposures with currency forward contracts that generally mature within
three
months. The effectiveness of our hedges is dependent, among other factors, upon our ability to accurately forecast our monetary assets and liabilities. To hedge the exposure of changes in cash flows from changes in currency exchange rates for certain capital expenditures, we may utilize currency forward contracts that generally mature within
12
months. (See "Item 8. Financial Statements and Supplementary Data – Notes to Consolidated Financial Statements – Derivative Instruments.")
42
ITEM 8. FINANCIAL STATEMENTS AND SUPPLEMENTARY DATA
Index to Consolidated Financial Statements
|
|
Page
|
|
|
|
|
Consolidated Financial Statements as of August 29, 2019 and August 30, 2018 and for the fiscal years ended
August 29, 2019, August 30, 2018, and August 31, 2017
|
|
|
|
|
|
Consolidated Statements of Operations
|
|
|
Consolidated Statements of Comprehensive Income
|
|
|
|
|
|
Consolidated Balance Sheets
|
|
|
|
|
|
Consolidated Statements of Changes in Equity
|
|
|
|
|
|
Consolidated Statements of Cash Flows
|
|
|
|
|
|
Notes to Consolidated Financial Statements
|
|
|
|
|
|
Report of Independent Registered Public Accounting Firm
|
|
43
MICRON TECHNOLOGY, INC.
CONSOLIDATED STATEMENTS OF OPERATIONS
(in millions, except per share amounts)
|
For the year ended
|
August 29,
2019 |
August 30,
2018 |
August 31,
2017 |
|||||||||
|
Revenue
|
$
|
23,406
|
|
$
|
30,391
|
|
$
|
20,322
|
|
|||
|
Cost of goods sold
|
12,704
|
|
12,500
|
|
11,886
|
|
||||||
|
Gross margin
|
10,702
|
|
17,891
|
|
8,436
|
|
||||||
|
Selling, general, and administrative
|
836
|
|
813
|
|
743
|
|
||||||
|
Research and development
|
2,441
|
|
2,141
|
|
1,824
|
|
||||||
|
Other operating (income) expense, net
|
49
|
|
(57
|
)
|
1
|
|
||||||
|
Operating income
|
7,376
|
|
14,994
|
|
5,868
|
|
||||||
|
Interest income
|
205
|
|
120
|
|
41
|
|
||||||
|
Interest expense
|
(128
|
)
|
(342
|
)
|
(601
|
)
|
||||||
|
Other non-operating income (expense), net
|
(405
|
)
|
(465
|
)
|
(112
|
)
|
||||||
|
7,048
|
|
14,307
|
|
5,196
|
|
|||||||
|
Income tax (provision) benefit
|
(693
|
)
|
(168
|
)
|
(114
|
)
|
||||||
|
Equity in net income (loss) of equity method investees
|
3
|
|
(1
|
)
|
8
|
|
||||||
|
Net income
|
6,358
|
|
14,138
|
|
5,090
|
|
||||||
|
Net income attributable to noncontrolling interests
|
(45
|
)
|
(3
|
)
|
(1
|
)
|
||||||
|
Net income attributable to Micron
|
$
|
6,313
|
|
$
|
14,135
|
|
$
|
5,089
|
|
|||
|
Earnings per share
|
||||||||||||
|
Basic
|
$
|
5.67
|
|
$
|
12.27
|
|
$
|
4.67
|
|
|||
|
Diluted
|
5.51
|
|
11.51
|
|
4.41
|
|
||||||
|
Number of shares used in per share calculations
|
||||||||||||
|
Basic
|
1,114
|
|
1,152
|
|
1,089
|
|
||||||
|
Diluted
|
1,143
|
|
1,229
|
|
1,154
|
|
||||||
See accompanying notes to consolidated financial statements.
44
MICRON TECHNOLOGY, INC.
CONSOLIDATED STATEMENTS OF COMPREHENSIVE INCOME
(in millions)
|
For the year ended
|
August 29,
2019 |
August 30,
2018 |
August 31,
2017 |
|||||||||
|
Net income
|
$
|
6,358
|
|
$
|
14,138
|
|
$
|
5,090
|
|
|||
|
Other comprehensive income (loss), net of tax
|
||||||||||||
|
Pension liability adjustments
|
(6
|
)
|
(3
|
)
|
1
|
|
||||||
|
Gains (losses) on derivative instruments
|
(3
|
)
|
(15
|
)
|
15
|
|
||||||
|
Foreign currency translation adjustments
|
(1
|
)
|
1
|
|
48
|
|
||||||
|
Gains (losses) on investments
|
9
|
|
(2
|
)
|
—
|
|
||||||
|
Other comprehensive income (loss)
|
(1
|
)
|
(19
|
)
|
64
|
|
||||||
|
Total comprehensive income
|
6,357
|
|
14,119
|
|
5,154
|
|
||||||
|
Comprehensive income attributable to noncontrolling interests
|
(45
|
)
|
(3
|
)
|
(1
|
)
|
||||||
|
Comprehensive income attributable to Micron
|
$
|
6,312
|
|
$
|
14,116
|
|
$
|
5,153
|
|
|||
See accompanying notes to consolidated financial statements.
45
MICRON TECHNOLOGY, INC.
CONSOLIDATED BALANCE SHEETS
(in millions, except par value amounts)
|
As of
|
August 29,
2019 |
August 30,
2018 |
||||||
|
Assets
|
||||||||
|
Cash and equivalents
|
$
|
7,152
|
|
$
|
6,506
|
|
||
|
Short-term investments
|
803
|
|
296
|
|
||||
|
Receivables
|
3,195
|
|
5,478
|
|
||||
|
Inventories
|
5,118
|
|
3,595
|
|
||||
|
Other current assets
|
235
|
|
164
|
|
||||
|
Total current assets
|
16,503
|
|
16,039
|
|
||||
|
Long-term marketable investments
|
1,164
|
|
473
|
|
||||
|
Property, plant, and equipment
|
28,240
|
|
23,672
|
|
||||
|
Intangible assets
|
340
|
|
331
|
|
||||
|
Deferred tax assets
|
837
|
|
1,022
|
|
||||
|
Goodwill
|
1,228
|
|
1,228
|
|
||||
|
Other noncurrent assets
|
575
|
|
611
|
|
||||
|
Total assets
|
$
|
48,887
|
|
$
|
43,376
|
|
||
|
Liabilities and equity
|
||||||||
|
Accounts payable and accrued expenses
|
$
|
4,626
|
|
$
|
4,374
|
|
||
|
Current debt
|
1,310
|
|
859
|
|
||||
|
Other current liabilities
|
454
|
|
521
|
|
||||
|
Total current liabilities
|
6,390
|
|
5,754
|
|
||||
|
Long-term debt
|
4,541
|
|
3,777
|
|
||||
|
Noncurrent unearned government incentives
|
636
|
|
227
|
|
||||
|
Other noncurrent liabilities
|
452
|
|
354
|
|
||||
|
Total liabilities
|
12,019
|
|
10,112
|
|
||||
|
Commitments and contingencies
|
|
|
|
|
||||
|
Redeemable convertible notes
|
—
|
|
3
|
|
||||
|
Redeemable noncontrolling interest
|
98
|
|
97
|
|
||||
|
Micron shareholders' equity
|
||||||||
|
Common stock, $0.10 par value, 3,000 shares authorized, 1,182 shares issued and 1,106 outstanding (1,170 shares issued and 1,161 outstanding as of August 30, 2018)
|
118
|
|
117
|
|
||||
|
Additional capital
|
8,214
|
|
8,201
|
|
||||
|
Retained earnings
|
30,761
|
|
24,395
|
|
||||
|
Treasury stock, 76 shares held (9 shares as of August 30, 2018)
|
(3,221
|
)
|
(429
|
)
|
||||
|
Accumulated other comprehensive income
|
9
|
|
10
|
|
||||
|
Total Micron shareholders' equity
|
35,881
|
|
32,294
|
|
||||
|
Noncontrolling interests in subsidiaries
|
889
|
|
870
|
|
||||
|
Total equity
|
36,770
|
|
33,164
|
|
||||
|
Total liabilities and equity
|
$
|
48,887
|
|
$
|
43,376
|
|
||
See accompanying notes to consolidated financial statements.
46
MICRON TECHNOLOGY, INC.
CONSOLIDATED STATEMENTS OF CHANGES IN EQUITY
(in millions)
|
Micron Shareholders
|
|
|
|||||||||||||||||||||||||||||||||
|
Common Stock
|
Additional Capital
|
Retained Earnings
|
Treasury Stock
|
Accumulated Other Comprehensive
Income (Loss)
|
Total Micron Shareholders' Equity
|
Noncontrolling Interests in Subsidiaries
|
Total Equity
|
||||||||||||||||||||||||||||
|
Number
of Shares
|
Amount
|
||||||||||||||||||||||||||||||||||
|
Balance at September 1, 2016
|
1,094
|
|
$
|
109
|
|
$
|
7,736
|
|
$
|
5,299
|
|
$
|
(1,029
|
)
|
$
|
(35
|
)
|
$
|
12,080
|
|
$
|
848
|
|
$
|
12,928
|
|
|||||||||
|
Net income
|
5,089
|
|
5,089
|
|
1
|
|
5,090
|
|
|||||||||||||||||||||||||||
|
Other comprehensive income (loss), net
|
64
|
|
64
|
|
64
|
|
|||||||||||||||||||||||||||||
|
Stock issued under stock plans
|
20
|
|
3
|
|
139
|
|
142
|
|
142
|
|
|||||||||||||||||||||||||
|
Stock-based compensation expense
|
217
|
|
(2
|
)
|
215
|
|
215
|
|
|||||||||||||||||||||||||||
|
Repurchase and retirement of stock
|
(2
|
)
|
—
|
|
(13
|
)
|
(22
|
)
|
|
|
(35
|
)
|
(35
|
)
|
|||||||||||||||||||||
|
Stock issued to Nanya for Inotera Acquisition
|
4
|
|
—
|
|
70
|
|
(104
|
)
|
1,029
|
|
995
|
|
995
|
|
|||||||||||||||||||||
|
Settlement of capped calls
|
192
|
|
(67
|
)
|
125
|
|
125
|
|
|||||||||||||||||||||||||||
|
Reclassification of redeemable convertible notes, net
|
(21
|
)
|
(21
|
)
|
(21
|
)
|
|||||||||||||||||||||||||||||
|
Conversion of convertible notes
|
(33
|
)
|
(33
|
)
|
(33
|
)
|
|||||||||||||||||||||||||||||
|
Balance at August 31, 2017
|
1,116
|
|
$
|
112
|
|
$
|
8,287
|
|
$
|
10,260
|
|
$
|
(67
|
)
|
$
|
29
|
|
$
|
18,621
|
|
$
|
849
|
|
$
|
19,470
|
|
|||||||||
|
Net income
|
14,135
|
|
14,135
|
|
3
|
|
14,138
|
|
|||||||||||||||||||||||||||
|
Other comprehensive income (loss), net
|
(19
|
)
|
(19
|
)
|
|
|
(19
|
)
|
|||||||||||||||||||||||||||
|
Stock issued in public offering
|
34
|
|
3
|
|
1,363
|
|
1,366
|
|
1,366
|
|
|||||||||||||||||||||||||
|
Stock issued under stock plans
|
22
|
|
2
|
|
287
|
|
289
|
|
289
|
|
|||||||||||||||||||||||||
|
Stock-based compensation expense
|
198
|
|
198
|
|
198
|
|
|||||||||||||||||||||||||||||
|
Contributions from noncontrolling interest
|
—
|
|
18
|
|
18
|
|
|||||||||||||||||||||||||||||
|
Repurchase and retirement of stock
|
(2
|
)
|
—
|
|
(71
|
)
|
(71
|
)
|
(71
|
)
|
|||||||||||||||||||||||||
|
Settlement of capped calls
|
429
|
|
(429
|
)
|
—
|
|
—
|
|
|||||||||||||||||||||||||||
|
Reclassification of redeemable convertible notes, net
|
18
|
|
18
|
|
18
|
|
|||||||||||||||||||||||||||||
|
Conversion and repurchase of convertible notes
|
(2,310
|
)
|
67
|
|
(2,243
|
)
|
(2,243
|
)
|
|||||||||||||||||||||||||||
|
Balance at August 30, 2018
|
1,170
|
|
$
|
117
|
|
$
|
8,201
|
|
$
|
24,395
|
|
$
|
(429
|
)
|
$
|
10
|
|
$
|
32,294
|
|
$
|
870
|
|
$
|
33,164
|
|
|||||||||
|
Cumulative effect of adopting new
accounting standards
|
92
|
|
92
|
|
92
|
|
|||||||||||||||||||||||||||||
|
Net income
|
6,313
|
|
6,313
|
|
36
|
|
6,349
|
|
|||||||||||||||||||||||||||
|
Other comprehensive income (loss), net
|
(1
|
)
|
(1
|
)
|
(1
|
)
|
|||||||||||||||||||||||||||||
|
Stock issued under stock plans
|
14
|
|
1
|
|
178
|
|
179
|
|
179
|
|
|||||||||||||||||||||||||
|
Stock-based compensation expense
|
243
|
|
243
|
|
243
|
|
|||||||||||||||||||||||||||||
|
Repurchase of stock
|
(2
|
)
|
—
|
|
103
|
|
(39
|
)
|
(2,792
|
)
|
(2,728
|
)
|
(2,728
|
)
|
|||||||||||||||||||||
|
Acquisitions of noncontrolling interests
|
1
|
|
1
|
|
(17
|
)
|
(16
|
)
|
|||||||||||||||||||||||||||
|
Reclassification of redeemable convertible notes, net
|
3
|
|
3
|
|
3
|
|
|||||||||||||||||||||||||||||
|
Conversion of convertible notes
|
(515
|
)
|
(515
|
)
|
(515
|
)
|
|||||||||||||||||||||||||||||
|
Balance at August 29, 2019
|
1,182
|
|
$
|
118
|
|
$
|
8,214
|
|
$
|
30,761
|
|
$
|
(3,221
|
)
|
$
|
9
|
|
$
|
35,881
|
|
$
|
889
|
|
$
|
36,770
|
|
|||||||||
See accompanying notes to consolidated financial statements.
47
MICRON TECHNOLOGY, INC.
CONSOLIDATED STATEMENTS OF CASH FLOWS
(in millions)
|
For the year ended
|
August 29,
2019 |
August 30,
2018 |
August 31,
2017 |
|||||||||
|
Cash flows from operating activities
|
||||||||||||
|
Net income
|
$
|
6,358
|
|
$
|
14,138
|
|
$
|
5,090
|
|
|||
|
Adjustments to reconcile net income to net cash provided by operating activities
|
|
|
|
|
||||||||
|
Depreciation expense and amortization of intangible assets
|
5,424
|
|
4,759
|
|
3,861
|
|
||||||
|
Amortization of debt discount and other costs
|
49
|
|
101
|
|
125
|
|
||||||
|
Loss on debt prepayments, repurchases, and conversions
|
396
|
|
385
|
|
99
|
|
||||||
|
Stock-based compensation
|
243
|
|
198
|
|
215
|
|
||||||
|
Gain on remeasurement of previously-held equity interest in Inotera
|
—
|
|
—
|
|
(71
|
)
|
||||||
|
Change in operating assets and liabilities
|
|
|
|
|
||||||||
|
Receivables
|
2,431
|
|
(1,734
|
)
|
(1,651
|
)
|
||||||
|
Inventories
|
(1,528
|
)
|
(472
|
)
|
50
|
|
||||||
|
Accounts payable and accrued expenses
|
(174
|
)
|
668
|
|
456
|
|
||||||
|
Payments attributed to intercompany balances with Inotera
|
—
|
|
—
|
|
(361
|
)
|
||||||
|
Deferred income taxes, net
|
150
|
|
(265
|
)
|
(22
|
)
|
||||||
|
Other
|
(160
|
)
|
(378
|
)
|
362
|
|
||||||
|
Net cash provided by operating activities
|
13,189
|
|
17,400
|
|
8,153
|
|
||||||
|
Cash flows from investing activities
|
|
|
|
|
||||||||
|
Expenditures for property, plant, and equipment
|
(9,780
|
)
|
(8,879
|
)
|
(4,734
|
)
|
||||||
|
Purchases of available-for-sale securities
|
(4,218
|
)
|
(760
|
)
|
(1,239
|
)
|
||||||
|
Acquisition of Inotera
|
—
|
|
—
|
|
(2,634
|
)
|
||||||
|
Proceeds from maturities of available-for-sale securities
|
1,541
|
|
320
|
|
194
|
|
||||||
|
Proceeds from sales of available-for-sale securities
|
1,504
|
|
604
|
|
776
|
|
||||||
|
Proceeds from government incentives
|
748
|
|
355
|
|
21
|
|
||||||
|
Other
|
120
|
|
144
|
|
79
|
|
||||||
|
Net cash provided by (used for) investing activities
|
(10,085
|
)
|
(8,216
|
)
|
(7,537
|
)
|
||||||
|
Cash flows from financing activities
|
|
|
|
|
||||||||
|
Repayments of debt
|
(3,340
|
)
|
(10,194
|
)
|
(2,558
|
)
|
||||||
|
Payments to acquire treasury stock
|
(2,729
|
)
|
(71
|
)
|
(36
|
)
|
||||||
|
Payments on equipment purchase contracts
|
(75
|
)
|
(206
|
)
|
(519
|
)
|
||||||
|
Proceeds from issuance of debt
|
3,550
|
|
1,009
|
|
3,311
|
|
||||||
|
Proceeds from issuance of stock
|
179
|
|
1,655
|
|
142
|
|
||||||
|
Other
|
(23
|
)
|
31
|
|
9
|
|
||||||
|
Net cash provided by (used for) financing activities
|
(2,438
|
)
|
(7,776
|
)
|
349
|
|
||||||
|
Effect of changes in currency exchange rates on cash, cash equivalents, and restricted cash
|
26
|
|
(37
|
)
|
(12
|
)
|
||||||
|
Net increase in cash, cash equivalents, and restricted cash
|
692
|
|
1,371
|
|
953
|
|
||||||
|
Cash, cash equivalents, and restricted cash at beginning of period
|
6,587
|
|
5,216
|
|
4,263
|
|
||||||
|
Cash, cash equivalents, and restricted cash at end of period
|
$
|
7,279
|
|
$
|
6,587
|
|
$
|
5,216
|
|
|||
|
Supplemental disclosures
|
|
|
|
|
||||||||
|
Income taxes paid, net
|
$
|
(524
|
)
|
$
|
(226
|
)
|
$
|
(99
|
)
|
|||
|
Interest paid, net of amounts capitalized
|
(53
|
)
|
(312
|
)
|
(468
|
)
|
||||||
|
Noncash investing and financing activity
|
||||||||||||
|
Equipment acquisitions on contracts payable and capital leases
|
119
|
|
84
|
|
813
|
|
||||||
See accompanying notes to consolidated financial statements.
48
MICRON TECHNOLOGY, INC.
NOTES TO CONSOLIDATED FINANCIAL STATEMENTS
(All tabular amounts in millions, except per share amounts)
Significant Accounting Policies
Basis of Presentation:
Micron Technology, Inc., including its consolidated subsidiaries, is an industry leader in innovative memory and storage solutions. Through our global brands – Micron, Crucial, and Ballistix – our broad portfolio of high-performance memory and storage technologies, including DRAM, NAND, 3D XPoint memory, and NOR, is transforming how the world uses information to enrich life. Backed by 40 years of technology leadership, our memory and storage solutions enable disruptive trends, including artificial intelligence, 5G, machine learning, and autonomous vehicles, in key market segments like mobile, data center, client, consumer, industrial, graphics, automotive, and networking. The accompanying consolidated financial statements include the accounts of Micron and our consolidated subsidiaries and have been prepared in accordance with accounting principles generally accepted in the United States of America. Intercompany balances and transactions have been eliminated in consolidation. Certain reclassifications have been made to prior period amounts to conform to current period presentation. Information prior to 2019 is presented in accordance with the accounting guidance in effect during that period and has not been recast for recently adopted accounting standards. See "Recently Adopted Accounting Standards" note.
Our fiscal year is the 52 or 53-week period ending on the Thursday closest to August 31. Fiscal years 2019, 2018, and 2017 each contained 52 weeks. All period references are to our fiscal periods unless otherwise indicated.
Derivative and Hedging Instruments:
We use derivative instruments to manage our exposure to changes in currency exchange rates from (1) our monetary assets and liabilities denominated in currencies other than the U.S. dollar and (2) forecasted cash flows for certain capital expenditures. Derivative instruments are measured at their fair values and recognized as either assets or liabilities. The accounting for changes in the fair value of derivative instruments is based on the intended use of the derivative and the resulting designation. For derivative instruments that are not designated for hedge accounting, gains or losses from changes in fair values are recognized in other non-operating income (expense).
For derivative instruments designated as cash flow hedges, the effective portion of the realized and unrealized gains or losses on derivatives is included as a component of accumulated other comprehensive income. Amounts in accumulated other comprehensive income are reclassified into earnings in the same line items and in the same periods in which the underlying transactions affect earnings. For the periods presented prior to the second quarter of 2018, the ineffective and excluded portion of the realized and unrealized gain or loss was included in other non-operating income (expense). As a result of adopting Accounting Standards Update ("ASU") 2017-12, beginning in the second quarter of 2018, such amounts are included in the same line item in which the underlying transactions affect earnings.
For derivative forward contracts designated as fair value hedges, hedge effectiveness is determined by the change in the fair value of the undiscounted spot rate of the forward contract. The changes in fair values of hedge instruments attributed to changes in undiscounted spot rates are recognized in other non-operating income (expense). The time value associated with hedge instruments is excluded from the assessment of the effectiveness of hedges and is recognized on a straight-line basis over the life of hedges to other non-operating income (expense).
We enter into master netting arrangements with our counterparties to mitigate credit risk in derivative hedge transactions. These master netting arrangements allow us and our counterparties to net settle amounts owed to each other. Derivative assets and liabilities that can be net settled with each counterparty have been presented in our consolidated balance sheet on a net basis.
Financial Instruments:
Cash equivalents include highly liquid short-term investments with original maturities to us of three months or less that are readily convertible to known amounts of cash. Other investments with remaining maturities of less than one year are included in short-term investments. Investments with remaining maturities greater than one year are included in long-term marketable investments. The carrying value of investment securities sold is determined using the specific identification method.
Functional Currency:
The U.S. dollar is the functional currency for us and all of our consolidated subsidiaries.
49
Goodwill and Non-Amortizing Intangible Assets:
We perform an annual impairment assessment for goodwill and non-amortizing intangible assets in the fourth quarter of our fiscal year.
Government Incentives:
We receive incentives from governmental entities related to expenses, assets, and other activities. Our government incentives may require that we meet or maintain specified spending levels and other operational metrics and may be subject to reimbursement if such conditions are not met or maintained. Government incentives are recorded in the financial statements in accordance with their purpose: as a reduction of expenses, a reduction of asset costs, or other income. Incentives related to specific operating activities are offset against the related expense in the period the expense is incurred. Incentives related to the acquisition or construction of fixed assets are recognized as a reduction in the carrying amounts of the related assets and reduce depreciation expense over the useful lives of the assets. Other incentives are recognized as other operating income. Government incentives received prior to being earned are recognized in current or noncurrent deferred income, whereas government incentives earned prior to being received are recognized in current or noncurrent receivables. Cash received from government incentives related to operating expenses is included as an operating activity in the statement of cash flows, whereas cash received from incentives related to the acquisition of property, plant, and equipment is included as an investing activity.
Inventories:
Inventories are stated at the lower of average cost or net realizable value. Cost includes depreciation, labor, material, and overhead costs, including product and process technology costs. When net realizable value (which requires projecting future average selling prices, sales volumes, and costs to complete products in work in process inventories) is below cost, we record a charge to cost of goods sold to write down inventories to their estimated net realizable value in advance of when inventories are actually sold. We review the major characteristics of product type and markets in determining the unit of account for which we perform the lower of average cost or net realizable value analysis and categorize inventories primarily as memory (including DRAM, NAND, and other memory). We remove amounts from inventory and charge such amounts to cost of goods sold on an average cost basis.
Product and Process Technology:
Costs incurred to (1) acquire product and process technology, (2) patent technology, and (3) maintain patent technology, are capitalized and amortized on a straight-line basis over periods ranging up to
12.5
years. We capitalize a portion of the costs incurred to patent technology based on historical data of patents issued as a percent of patents we file. Capitalized product and process technology costs are amortized over the shorter of (1) the estimated useful life of the technology, (2) the patent term, or (3) the term of the technology agreement. Fully-amortized assets are removed from product and process technology and accumulated amortization.
Product Warranty:
We generally provide a limited warranty that our products are in compliance with applicable specifications existing at the time of delivery. Under our standard terms and conditions of sale, liability for certain failures of product during a stated warranty period is usually limited to repair or replacement of defective items or return of, or a credit with respect to, amounts paid for such items. Under certain circumstances, we provide more extensive limited warranty coverage than that provided under our standard terms and conditions. Our warranty obligations are not material.
Property, Plant, and Equipment:
Property, plant, and equipment is stated at cost and depreciated using the straight-line method over estimated useful lives of generally
10
to
30
years for buildings,
5
to
7
years for equipment, and
3
to
5
years for software. Assets held for sale are carried at the lower of cost or estimated fair value and are included in other noncurrent assets. When property, plant, or equipment is retired or otherwise disposed, the net book value is removed and we recognize any gain or loss in results of operations.
We capitalize interest on borrowings during the period of time we carry out the activities necessary to bring assets to the condition of their intended use and location. Capitalized interest becomes part of the cost of assets.
Research and Development:
Costs related to the conceptual formulation and design of products and processes are charged to R&D expense as incurred. Development of a product is deemed complete when it is qualified through reviews and tests for performance and reliability. Subsequent to product qualification, product costs are included in cost of goods sold. Product design and other R&D costs for certain technologies may be shared with a development partner. Amounts from cost-sharing arrangements are reflected as a reduction of R&D expense.
Revenue Recognition:
Revenue is primarily recognized at a point in time when control of the promised goods is transferred to our customers in an amount that reflects the consideration we expect to be entitled to in exchange for those goods. Contracts with our customers are generally short-term in duration at fixed, negotiated prices with payment generally due shortly after delivery. We estimate a liability for returns using the expected value method based on historical rates of return. In addition, we generally offer price protection to our distributors, which is a form of variable consideration that decreases the transaction
50
price. We use the expected value method, based on historical price adjustments and current pricing trends, to estimate the amount of revenue recognized from sales to distributors. Differences between the estimated and actual amounts are recognized as adjustments to revenue.
Stock-based Compensation:
Stock-based compensation is measured at the grant date, based on the fair value of the award, and recognized as expense under the straight-line attribution method over the requisite service period. We account for forfeitures as they occur. We issue new shares upon the exercise of stock options or conversion of share units.
Treasury Stock:
Treasury stock is carried at cost. When we retire our treasury stock, any excess of the repurchase price paid over par value is allocated between additional capital and retained earnings.
Use of Estimates:
The preparation of financial statements and related disclosures in conformity with accounting principles generally accepted in the United States of America requires our management to make estimates and judgments that affect the reported amounts of assets, liabilities, revenues, expenses, and related disclosures. Estimates and judgments are based on historical experience, forecasted events, and various other assumptions that we believe to be reasonable under the circumstances. Estimates and judgments may differ under different assumptions or conditions. We evaluate our estimates and judgments on an ongoing basis. Actual results could differ from estimates.
Variable Interest Entities
We have interests in entities that are VIEs. If we are the primary beneficiary of a VIE, we are required to consolidate it. To determine if we are the primary beneficiary, we evaluate whether we have the power to direct the activities that most significantly impact the VIE's economic performance and the obligation to absorb losses or the right to receive benefits of the VIE that could potentially be significant to the VIE. Our evaluation includes identification of significant activities and an assessment of our ability to direct those activities based on governance provisions and arrangements to provide or receive product and process technology, product supply, operations services, equity funding, financing, and other applicable agreements and circumstances. Our assessments of whether we are the primary beneficiary of our VIEs require significant assumptions and judgments.
Unconsolidated VIE
PTI Xi'an
:
Powertech Technology Inc. Xi'an ("PTI Xi'an") is a wholly-owned subsidiary of Powertech Technology Inc. ("PTI") and was created to provide assembly services to us at our manufacturing site in Xi'an, China. We do not have an equity interest in PTI Xi'an. PTI Xi'an is a VIE because of the terms of its service agreement with us and its dependency on PTI to finance its operations. We do not have the power to direct the activities of PTI Xi'an that most significantly impact its economic performance, primarily because we do not have governance rights. Therefore, we do not consolidate PTI Xi'an. In connection with our assembly services with PTI, as of
August 29, 2019
and
August 30, 2018
, we had net property, plant, and equipment of
$50 million
and
$63 million
, respectively, and capital lease obligations of
$47 million
and
$63 million
, respectively.
Consolidated VIE
IMFT
:
IMFT is a VIE because all of its costs are passed to us and its other member, Intel, through product purchase agreements and because IMFT is dependent upon us or Intel for additional cash requirements. The primary activities of IMFT are driven by the constant introduction of product and process technology. Because we perform a significant majority of the technology development, we have the power to direct its key activities. We consolidate IMFT because we have the power to direct the activities of IMFT that most significantly impact its economic performance and because we have the obligation to absorb losses and the right to receive benefits from IMFT that could potentially be significant to it. In January 2019, we exercised our option to acquire Intel's interest in IMFT. Subsequently, Intel set the closing date to occur on October 31, 2019, at which time IMFT will become a wholly-owned subsidiary. (See "Equity – Noncontrolling Interests in Subsidiaries – IMFT" note.)
51
Recently Adopted Accounting Standards
In October 2016, the Financial Accounting Standards Board ("FASB") issued Accounting Standards Update ("ASU") 2016-16 –
Intra-Entity Transfers Other Than Inventory
("ASU 2016-16"), which requires an entity to recognize the income tax consequences of an intra-entity transfer of an asset other than inventory when the transfer occurs. We adopted this ASU in the first quarter of 2019 under the modified retrospective method and, in connection therewith, made certain adjustments as noted in the table below.
In January 2016, the FASB issued ASU 2016-01 –
Recognition and Measurement of Financial Assets and Financial Liabilities
, which provides guidance for the recognition, measurement, presentation, and disclosure of financial assets and liabilities. We adopted this ASU in the first quarter of 2019 under the modified retrospective method, with prospective adoption for amendments related to equity securities without readily determinable fair values. The adoption of this ASU did not have a material impact on our financial statements.
In May 2014, the FASB issued ASU 2014-09 –
Revenue from Contracts with Customers
(as amended, "ASC 606"), which supersedes nearly all existing revenue recognition guidance under generally accepted accounting principles in the United States. The core principal of ASC 606 is that an entity should recognize revenue when it transfers control of promised goods or services to customers in an amount that reflects the consideration to which the entity expects to be entitled in exchange for those goods or services. ASC 606 also requires additional disclosure about the nature, amount, timing, and uncertainty of revenue and cash flows arising from customer contracts, including significant judgments and changes in judgments, and assets recognized from costs incurred to obtain or fulfill a contract. We adopted ASC 606 in the first quarter of 2019 under the modified retrospective method and, in connection therewith, made certain adjustments as noted in the table below. We applied ASC 606 to contracts with customers that had not yet been completed as of the adoption date.
The following table summarizes the effects of adopting ASU 2016-16 and ASC 606:
|
Ending Balance
as of
August 30, 2018
|
ASU 2016-16
|
ASC 606
|
Opening Balance
as of
August 31, 2018
|
||||||||||||
|
Receivables
|
$
|
5,478
|
|
$
|
—
|
|
$
|
114
|
|
$
|
5,592
|
|
|||
|
Inventories
|
3,595
|
|
—
|
|
(5
|
)
|
3,590
|
|
|||||||
|
Other current assets
|
164
|
|
(14
|
)
|
30
|
|
180
|
|
|||||||
|
Deferred tax assets
|
1,022
|
|
56
|
|
(92
|
)
|
986
|
|
|||||||
|
Other current liabilities
|
521
|
|
—
|
|
(4
|
)
|
517
|
|
|||||||
|
Other noncurrent liabilities
|
354
|
|
—
|
|
1
|
|
355
|
|
|||||||
|
Retained earnings
|
24,395
|
|
42
|
|
50
|
|
24,487
|
|
|||||||
As a result of the adoption of ASC 606, the opening balances as of August 31, 2018 for receivables, other current assets, and other current liabilities increased due to the reclassification of allowances for rebates, pricing adjustments, and returns to conform to the new presentation requirements. In addition, the margin from previously deferred sales to distributors was reclassified from other current liabilities to retained earnings. The tax effects of the adoption of ASC 606 were recorded primarily as a reduction of net deferred tax assets, substantially as a result of recognizing income for accounting purposes earlier under ASC 606 than for tax purposes in various jurisdictions.
52
The effects of ASC 606 to our consolidated statement of operations and balance sheet were as follows:
|
Year ended August 29, 2019
|
||||||||||||
|
As Reported
|
Adjustments
|
Amounts Without the Effects of Adoption of ASC 606
|
||||||||||
|
Revenue
|
$
|
23,406
|
|
$
|
(40
|
)
|
$
|
23,366
|
|
|||
|
Cost of goods sold
|
12,704
|
|
(70
|
)
|
12,634
|
|
||||||
|
Interest expense
|
(128
|
)
|
5
|
|
(123
|
)
|
||||||
|
Income tax (provision) benefit
|
(693
|
)
|
(19
|
)
|
(712
|
)
|
||||||
|
Net income attributable to Micron
|
6,313
|
|
16
|
|
6,329
|
|
||||||
|
As of August 29, 2019
|
As Reported
|
Adjustments
|
Amounts Without the Effects of Adoption of ASC 606
|
|||||||||
|
Receivables
|
$
|
3,195
|
|
$
|
(94
|
)
|
$
|
3,101
|
|
|||
|
Other current assets
|
235
|
|
(44
|
)
|
191
|
|
||||||
|
Deferred tax assets
|
837
|
|
79
|
|
916
|
|
||||||
|
Accounts payable and accrued expenses
|
4,626
|
|
6
|
|
4,632
|
|
||||||
|
Other current liabilities
|
454
|
|
(30
|
)
|
424
|
|
||||||
|
Other noncurrent liabilities
|
452
|
|
(1
|
)
|
451
|
|
||||||
|
Retained earnings
|
30,761
|
|
(34
|
)
|
30,727
|
|
||||||
Recently Issued Accounting Standards Not Yet Adopted
In November 2018, the FASB issued ASU 2018-18 –
Collaborative Arrangements
, which clarifies that certain transactions between collaborative arrangement participants should be accounted for as revenue when the collaborative arrangement participant is a customer in the context of a unit of account and precludes recognizing as revenue consideration received from a collaborative arrangement participant if the participant is not a customer. This ASU will be effective for us in the first quarter of 2021 with early adoption permitted. This ASU requires retrospective adoption to the date we adopted ASC 606, which was August 31, 2018, by recognizing a cumulative-effect adjustment to the opening balance of retained earnings of the earliest annual period presented. We do not anticipate the adoption of this ASU to have a material impact to our financial statements.
In June 2016, the FASB issued ASU 2016-13 –
Measurement of Credit Losses on Financial Instruments
, which requires a financial asset (or a group of financial assets) measured on the basis of amortized cost to be presented at the net amount expected to be collected. This ASU requires that the income statement reflect the measurement of credit losses for newly recognized financial assets as well as the increases or decreases of expected credit losses that have taken place during the period. This ASU requires that credit losses of debt securities designated as available-for-sale be recorded through an allowance for credit losses and limits the credit loss to the amount by which fair value is below amortized cost. This ASU will be effective for us in the first quarter of 2021 with adoption permitted as early as the first quarter of 2020. This ASU requires modified retrospective adoption, with prospective adoption for debt securities for which an other-than-temporary impairment had been recognized before the effective date. We are evaluating the timing and effects of our adoption of this ASU on our financial statements.
In February 2016, the FASB issued ASU 2016-02 –
Leases
, which amends a number of aspects of lease accounting, including requiring lessees to recognize operating leases with a term greater than one year on their balance sheet as a right-of-use asset and corresponding liability, measured at the present value of lease payments. We will adopt the provisions of this ASU under a modified retrospective method at the beginning of 2020 and not recast prior periods. The adoption of this ASU will result in an increase to our consolidated balance sheet of approximately
$550 million
for operating lease liabilities and right-of-use assets.
53
Acquisition of Inotera
Through December 6, 2016, we held a
33%
ownership interest in Inotera, now known as MTTW, Nanya and certain of its affiliates held a
32%
ownership interest, and the remaining ownership interest was publicly held. On December 6, 2016, we acquired the
67%
remaining interest in Inotera not owned by us (the "Inotera Acquisition") and began consolidating Inotera's operating results. The cash paid for the Inotera Acquisition was funded, in part, with proceeds from the 2021 MSTW Term Loan and the sale of the Micron Shares (as defined below) to Nanya. Inotera manufactures DRAM products at its 300mm wafer fabrication facility in Taoyuan City, Taiwan. From December 2015 until our acquisition of the remaining interest in Inotera, the price for DRAM products purchased by us was based on a formula that equally shared margin between Inotera and us. Under these agreements, we purchased
$504 million
of DRAM products in 2017 through the date of our acquisition. SG&A expenses for 2017 and 2016 included transaction costs of
$13 million
and
$3 million
, respectively, incurred in connection with the Inotera Acquisition.
In connection with the Inotera Acquisition, we revalued our previously-held
33%
equity interest to its fair value. In determining the fair value, we used various valuation techniques, including the share price of Inotera prior to the announcement of the Inotera Acquisition and discounted cash flow projections using inputs including discount rate and terminal growth rate (Level 3). As a result, we recognized a non-operating gain of
$71 million
in 2017.
In connection with the Inotera Acquisition, we sold
58 million
shares of our common stock to Nanya (the "Micron Shares") and received cash proceeds of
$986 million
. Because the sale of the Micron Shares to Nanya was contemporaneous with, and contingent upon, the closing of the Inotera Acquisition, the issuance of the Micron Shares was treated in purchase accounting as a non-cash exchange for a portion of the shares of Inotera held by Nanya. The Micron Shares were issued in a transaction exempt from the registration requirements of the Securities Act of 1933, as amended, and were subject to certain restrictions on transfers at the time of sale. To reflect the lack of transferability, the fair value of the Micron Shares (based on the trading price of our common stock on the acquisition date) was reduced by a discount of
$81 million
, based on the implied volatility derived from traded options on our stock and on the duration of the lack of transferability (Level 2).
The allocation of purchase price to assets acquired and liabilities assumed of Inotera was as follows:
|
Consideration
|
||||
|
Cash paid for Inotera Acquisition
|
$
|
4,099
|
|
|
|
Less cash received from sale of Micron Shares
|
(986
|
)
|
||
|
Net cash paid for Inotera Acquisition
|
3,113
|
|
||
|
Fair value of our previously-held equity interest in Inotera
|
1,441
|
|
||
|
Fair value of Micron Shares exchanged for Inotera shares
|
995
|
|
||
|
Other
|
3
|
|
||
|
Payments attributed to intercompany balances with Inotera
|
(361
|
)
|
||
|
$
|
5,191
|
|
||
|
Assets acquired and liabilities assumed
|
||||
|
Cash and equivalents
|
$
|
118
|
|
|
|
Inventories
|
285
|
|
||
|
Other current assets
|
27
|
|
||
|
Property, plant, and equipment
|
3,722
|
|
||
|
Deferred tax assets
|
82
|
|
||
|
Goodwill
|
1,124
|
|
||
|
Other noncurrent assets
|
130
|
|
||
|
Accounts payable and accrued expenses
|
(232
|
)
|
||
|
Debt
|
(56
|
)
|
||
|
Other noncurrent liabilities
|
(9
|
)
|
||
|
$
|
5,191
|
|
||
The Inotera Acquisition enhanced our flexibility to drive new technology, optimized the deployment of capital, and enabled us to adapt our product offerings to changes in market conditions. As a result of these synergies, we allocated goodwill of
$829
54
million
,
$198 million
, and
$97 million
to CNBU, MBU, and EBU, respectively. Goodwill resulting from the Inotera Acquisition is not deductible for Taiwan corporate income tax purposes; however, it is deductible for Taiwan surtax purposes.
Unaudited Pro Forma Financial Information
The following unaudited pro forma financial information presents the combined results of operations as if the Inotera Acquisition had occurred on September 4, 2015. The pro forma financial information includes the accounting effects of the business combination, including adjustments for depreciation of property, plant, and equipment, interest expense, elimination of intercompany activities, and revaluation of inventories. The unaudited pro forma financial information below is not necessarily indicative of either future results of operations or results that might have been achieved had the Inotera Acquisition occurred on September 4, 2015.
|
Year ended
|
August 31,
2017 |
|||
|
Net sales
|
$
|
20,317
|
|
|
|
Net income
|
5,172
|
|
||
|
Net income attributable to Micron
|
5,171
|
|
||
|
Earnings per share
|
||||
|
Basic
|
4.68
|
|
||
|
Diluted
|
4.42
|
|
||
The unaudited pro forma financial information for 2017 includes our results for the year ended August 31, 2017 (which includes the results of Inotera since our acquisition of Inotera on December 6, 2016), the results of Inotera for the three months ended November 30, 2016, and the adjustments described above.
Technology Transfer and License Agreements with Nanya
Effective December 6, 2016, the terms of technology transfer and license agreements provided Nanya with options to require us to transfer to Nanya certain technology for Nanya's use and deliverables related to the next DRAM process node generation after our 20nm process node (the "1X Process Node") and the next DRAM process node generation after the 1X Process Node (the "1Y Process Node"). Nanya's option for the 1X Process Node expired unexercised. If Nanya exercises its right for the 1Y Process Node, Nanya would pay us royalties for a license to the transferred 1Y Process Node technology based on revenues from products utilizing the technology, subject to specified caps, and we would also receive an equity interest in Nanya upon the achievement of certain milestones.
55
Cash and Investments
Substantially all of our marketable debt and equity investments were classified as available-for-sale as of the dates noted below. Cash and equivalents and the fair values of our available-for-sale investments, which approximated amortized costs, were as follows:
|
As of
|
2019
|
2018
|
||||||||||||||||||||||||||||||
|
Cash and Equivalents
|
Short-term Investments
|
Long-term Marketable Investments
(1)
|
Total Fair Value
|
Cash and Equivalents
|
Short-term Investments
|
Long-term Marketable Investments
(1)
|
Total Fair Value
|
|||||||||||||||||||||||||
|
Cash
|
$
|
2,388
|
|
$
|
—
|
|
$
|
—
|
|
$
|
2,388
|
|
$
|
3,223
|
|
$
|
—
|
|
$
|
—
|
|
$
|
3,223
|
|
||||||||
|
Level 1
(2)
|
||||||||||||||||||||||||||||||||
|
Money market funds
|
3,418
|
|
—
|
|
—
|
|
3,418
|
|
2,443
|
|
—
|
|
—
|
|
2,443
|
|
||||||||||||||||
|
Level 2
(3)
|
||||||||||||||||||||||||||||||||
|
Certificates of deposits
|
1,292
|
|
13
|
|
1
|
|
1,306
|
|
806
|
|
11
|
|
2
|
|
819
|
|
||||||||||||||||
|
Corporate bonds
|
—
|
|
550
|
|
689
|
|
1,239
|
|
3
|
|
172
|
|
272
|
|
447
|
|
||||||||||||||||
|
Government securities
|
36
|
|
149
|
|
232
|
|
417
|
|
5
|
|
63
|
|
103
|
|
171
|
|
||||||||||||||||
|
Asset-backed securities
|
—
|
|
67
|
|
242
|
|
309
|
|
—
|
|
34
|
|
96
|
|
130
|
|
||||||||||||||||
|
Commercial paper
|
18
|
|
24
|
|
—
|
|
42
|
|
26
|
|
16
|
|
—
|
|
42
|
|
||||||||||||||||
|
7,152
|
|
$
|
803
|
|
$
|
1,164
|
|
$
|
9,119
|
|
6,506
|
|
$
|
296
|
|
$
|
473
|
|
$
|
7,275
|
|
|||||||||||
|
Restricted cash
(4)
|
127
|
|
81
|
|
||||||||||||||||||||||||||||
|
Cash, cash equivalents, and restricted cash
|
$
|
7,279
|
|
$
|
6,587
|
|
||||||||||||||||||||||||||
|
(1)
|
The maturities of long-term marketable securities range from
one
to
four
years.
|
|
(2)
|
The fair value of Level 1 securities is measured based on quoted prices in active markets for identical assets.
|
|
(3)
|
The fair value of Level 2 securities is measured using information obtained from pricing services, which obtain quoted market prices for similar instruments, non-binding market consensus prices that are corroborated by observable market data, or various other methodologies, to determine the appropriate value at the measurement date. We perform supplemental analysis to validate information obtained from these pricing services. No adjustments were made to the fair values indicated by such pricing information as of
August 29, 2019
or
August 30, 2018
.
|
|
(4)
|
Restricted cash is included in other noncurrent assets and primarily relates to the MMJ Creditor Payments and government incentives received prior to being earned. The restrictions lapse on the MMJ Creditor Payments upon approval by the trustees and/or Tokyo District Court and for the government incentives upon achieving certain performance conditions.
|
Gross realized gains and losses from sales of available-for-sale securities were not material for any period presented. As of
August 29, 2019
, there were
no
available-for-sale securities that had been in a loss position for longer than 12 months.
Receivables
|
As of
|
2019
|
2018
|
||||||
|
Trade receivables
|
$
|
2,778
|
|
$
|
5,056
|
|
||
|
Income and other taxes
|
242
|
|
161
|
|
||||
|
Other
|
175
|
|
261
|
|
||||
|
$
|
3,195
|
|
$
|
5,478
|
|
|||
56
Inventories
|
As of
|
2019
|
2018
|
||||||
|
Finished goods
|
$
|
757
|
|
$
|
815
|
|
||
|
Work in process
|
3,825
|
|
2,357
|
|
||||
|
Raw materials and supplies
|
536
|
|
423
|
|
||||
|
$
|
5,118
|
|
$
|
3,595
|
|
|||
Property, Plant, and Equipment
|
As of
|
2019
|
2018
|
||||||
|
Land
|
$
|
352
|
|
$
|
345
|
|
||
|
Buildings (includes $528 and $483, respectively, under capital leases)
|
10,931
|
|
8,680
|
|
||||
|
Equipment
(1)
(includes $905 and $1,336, respectively, under capital leases)
|
44,051
|
|
38,249
|
|
||||
|
Construction in progress
(2)
|
1,700
|
|
1,162
|
|
||||
|
Software
|
790
|
|
655
|
|
||||
|
|
57,824
|
|
49,091
|
|
||||
|
Accumulated depreciation (includes $733 and $868, respectively, under capital leases)
|
(29,584
|
)
|
(25,419
|
)
|
||||
|
|
$
|
28,240
|
|
$
|
23,672
|
|
||
|
(1)
|
Included costs related to equipment not placed into service of
$2.33 billion
as of
August 29, 2019
and
$1.73 billion
as of
August 30, 2018
.
|
|
(2)
|
Included building-related construction, tool installation, and software costs for assets not placed into service.
|
Depreciation expense was
$5.34 billion
,
$4.66 billion
, and
$3.76 billion
for
2019
,
2018
, and
2017
, respectively. Interest capitalized as part of the cost of property, plant, and equipment was
$103 million
,
$44 million
, and
$7 million
for
2019
,
2018
, and
2017
, respectively.
Intangible Assets and Goodwill
|
As of
|
2019
|
2018
|
||||||||||||||
|
Gross
Amount
|
Accumulated
Amortization
|
Gross
Amount
|
Accumulated
Amortization
|
|||||||||||||
|
Amortizing assets
|
||||||||||||||||
|
Product and process technology
|
$
|
583
|
|
$
|
(243
|
)
|
$
|
567
|
|
$
|
(344
|
)
|
||||
|
Non-amortizing assets
|
||||||||||||||||
|
In-process R&D
|
—
|
|
—
|
|
108
|
|
—
|
|
||||||||
|
Total intangible assets
|
$
|
583
|
|
$
|
(243
|
)
|
$
|
675
|
|
$
|
(344
|
)
|
||||
|
Goodwill
|
$
|
1,228
|
|
$
|
1,228
|
|
||||||||||
In
2019
,
2018
, and
2017
, we capitalized
$91 million
,
$48 million
, and
$29 million
, respectively, for product and process technology with weighted-average useful lives of
8
years,
10
years, and
11
years, respectively. In 2019, we placed
$108 million
of in-process R&D in service, which is being amortized on a straight-line basis over
six
years. Expected amortization expense for our intangible assets is
$72 million
for
2020
,
$62 million
for
2021
,
$50 million
for
2022
,
$44 million
for
2023
, and
$40 million
for
2024
.
57
Accounts Payable and Accrued Expenses
|
As of
|
2019
|
2018
|
||||||
|
Accounts payable
|
$
|
1,677
|
|
$
|
1,692
|
|
||
|
Property, plant, and equipment
|
1,782
|
|
1,238
|
|
||||
|
Salaries, wages, and benefits
|
695
|
|
841
|
|
||||
|
Income and other taxes
|
309
|
|
402
|
|
||||
|
Other
|
163
|
|
201
|
|
||||
|
$
|
4,626
|
|
$
|
4,374
|
|
|||
Debt
|
As of
|
2019
|
2018
|
||||||||||||||||||||||||||||||||||||
|
Net Carrying Amount
|
Net Carrying Amount
|
|||||||||||||||||||||||||||||||||||||
|
Instrument
|
Stated Rate
|
Effective Rate
|
Principal
|
Current
|
Long-Term
|
Total
(1)
|
Principal
|
Current
|
Long-Term
|
Total
(1)
|
||||||||||||||||||||||||||||
|
IMFT Member Debt
|
N/A
|
|
N/A
|
|
$
|
693
|
|
$
|
693
|
|
$
|
—
|
|
$
|
693
|
|
$
|
1,009
|
|
$
|
—
|
|
$
|
1,009
|
|
$
|
1,009
|
|
||||||||||
|
Capital lease obligations
|
N/A
|
|
4.30
|
%
|
591
|
|
223
|
|
368
|
|
591
|
|
846
|
|
310
|
|
536
|
|
846
|
|
||||||||||||||||||
|
MMJ Creditor Payments
|
N/A
|
|
9.76
|
%
|
206
|
|
198
|
|
—
|
|
198
|
|
520
|
|
$
|
309
|
|
183
|
|
492
|
|
|||||||||||||||||
|
2024 Notes
|
4.64
|
%
|
4.76
|
%
|
600
|
|
—
|
|
597
|
|
597
|
|
—
|
|
—
|
|
—
|
|
—
|
|
||||||||||||||||||
|
2025 Notes
|
5.50
|
%
|
5.56
|
%
|
519
|
|
—
|
|
516
|
|
516
|
|
519
|
|
—
|
|
515
|
|
515
|
|
||||||||||||||||||
|
2026 Notes
|
4.98
|
%
|
5.07
|
%
|
500
|
|
—
|
|
497
|
|
497
|
|
—
|
|
—
|
|
—
|
|
—
|
|
||||||||||||||||||
|
2027 Notes
|
4.19
|
%
|
4.27
|
%
|
900
|
|
—
|
|
895
|
|
895
|
|
—
|
|
—
|
|
—
|
|
—
|
|
||||||||||||||||||
|
2029 Notes
|
5.33
|
%
|
5.40
|
%
|
700
|
|
—
|
|
696
|
|
696
|
|
—
|
|
—
|
|
—
|
|
—
|
|
||||||||||||||||||
|
2030 Notes
|
4.66
|
%
|
4.73
|
%
|
850
|
|
—
|
|
845
|
|
845
|
|
—
|
|
—
|
|
—
|
|
—
|
|
||||||||||||||||||
|
2032D Notes
(2)
|
3.13
|
%
|
6.33
|
%
|
134
|
|
—
|
|
127
|
|
127
|
|
143
|
|
—
|
|
132
|
|
132
|
|
||||||||||||||||||
|
2033F Notes
(2)(3)
|
2.13
|
%
|
4.93
|
%
|
62
|
|
196
|
|
—
|
|
196
|
|
107
|
|
235
|
|
—
|
|
235
|
|
||||||||||||||||||
|
2043G Notes
|
3.00
|
%
|
6.76
|
%
|
—
|
|
—
|
|
—
|
|
—
|
|
1,019
|
|
—
|
|
682
|
|
682
|
|
||||||||||||||||||
|
2022 Term
Loan B
|
4.24
|
%
|
4.65
|
%
|
—
|
|
—
|
|
—
|
|
—
|
|
735
|
|
5
|
|
720
|
|
725
|
|
||||||||||||||||||
|
|
$
|
5,755
|
|
$
|
1,310
|
|
$
|
4,541
|
|
$
|
5,851
|
|
$
|
4,898
|
|
$
|
859
|
|
$
|
3,777
|
|
$
|
4,636
|
|
||||||||||||||
|
(1)
|
Net carrying amount is the principal amount less unamortized debt discount and issuance costs. In addition, the net carrying amount as of
August 29, 2019
and
August 30, 2018
included
$135 million
and
$132 million
, respectively, of derivative debt liabilities recognized as a result of our election to settle entirely in cash converted notes with an aggregate principal amount of
$44 million
and
$35 million
, respectively.
|
|
(2)
|
Since the closing price of our common stock exceeded
130%
of the conversion price per share for at least
20
trading days in the
30
trading day period ended on June 30, 2019, these notes are convertible by the holders through the calendar quarter ended September 30, 2019. Additionally, the closing price of our common stock also exceeded the thresholds for the calendar quarter ended September 30, 2019; therefore, these notes are convertible by the holders at any time through December 31, 2019.
|
|
(3)
|
Current debt as of
August 29, 2019
included an aggregate of
$179 million
for the settlement obligation (including principal and amounts in excess of principal) for conversions of our 2033F Notes that settled in cash in the first quarter of 2020. The remainder of the 2033F Notes were classified as current as of
August 29, 2019
because the terms of these notes require us to pay cash for the principal amount of any converted notes and holders of these notes had the right to convert their notes as of that date.
|
Our convertible and other senior notes are unsecured obligations that rank equally in right of payment with all of our other existing and future unsecured indebtedness and are effectively subordinated to all of our other existing and future secured indebtedness, to the extent of the value of the assets securing such indebtedness. As of
August 29, 2019
, Micron had
$4.37
58
billion
of unsecured debt (net of unamortized discount and debt issuance costs), including the 2024 Notes, 2025 Notes, 2026 Notes, 2027 Notes, 2029 Notes, 2030 Notes, 2032D Notes, and 2033F Notes that were structurally subordinated to all liabilities of its subsidiaries, including trade payables. The terms of our indebtedness generally contain cross payment default and cross acceleration provisions. Micron guarantees certain debt obligations of its subsidiaries but does not guarantee the MMJ Creditor Payments. Micron's guarantees of its subsidiary debt obligations are unsecured obligations ranking equally in right of payment with all of Micron's other existing and future unsecured indebtedness.
IMFT Member Debt
Pursuant to the terms of the IMFT joint venture agreement, Intel provided debt financing ("IMFT Member Debt") of
$1.01 billion
to IMFT in 2018. IMFT Member Debt is non-interest bearing and is convertible, at the election of Intel, in whole or in part, into a capital contribution to IMFT. Additionally, to the extent IMFT distributes cash to its members under the terms of the IMFT joint venture agreement, Intel may, at its option, designate any portion of the distribution to be a repayment of IMFT Member Debt. The remaining balance of IMFT Member Debt on October 31, 2019 will be paid by Micron upon the closing of the IMFT transaction as a component of the consideration paid to Intel for their interest in IMFT. As a result, it was classified as current as of August 29, 2019. (See "Equity – Noncontrolling Interests in Subsidiaries – IMFT" note.)
Capital Lease Obligations
In
2019
, we recorded capital lease obligations aggregating
$53 million
at a weighted-average effective interest rate of
5.4%
, with a weighted-average expected term of
ten
years. In
2018
, we recorded capital lease obligations aggregating
$20 million
.
MMJ Creditor Payments
Under the MMJ Companies' corporate reorganization proceedings, which set forth the treatment of the MMJ Companies' pre-petition creditors and their claims, the MMJ Companies were required to pay
200 billion
yen, less certain expenses of the reorganization proceedings and other items, to their secured and unsecured creditors in
seven
annual installment payments (the "MMJ Creditor Payments"). The MMJ Creditor Payments do not provide for interest and, as a result of our acquisition of the MMJ Companies in 2013, we recorded the MMJ Creditor Payments at fair value. The fair-value discount is accreted to interest expense over the term of the installment payments.
Under the MMJ Companies' corporate reorganization proceedings, the secured creditors of MMJ recovered
100%
of the amount of their fixed claims in
six
annual installment payments through October 2018 and the unsecured creditors will recover at least
17.4%
of the amount of their fixed claims in
seven
annual installment payments through December 2019. The remaining portion of the unsecured claims of the creditors of MMJ not recovered pursuant to the corporate reorganization proceedings will be discharged, without payment, through December 2019. The following table presents the remaining MMJ Creditor Payment (stated in Japanese yen and U.S. dollars) as of
August 29, 2019
:
|
2020
|
¥
|
21,757
|
|
$
|
206
|
|
||
|
Less unamortized discount
|
(709
|
)
|
(8
|
)
|
||||
|
¥
|
21,048
|
|
$
|
198
|
|
|||
In 2012, we entered into a series of agreements with the corporate reorganization trustees of the MMJ Companies and the MMJ Companies, including supply agreements, research and development services agreements, and general services agreements, which are intended to generate operating cash flows to meet the requirements of the MMJ Companies' businesses, including the funding of the MMJ Creditor Payments.
Senior Unsecured Notes
Our 2024 Notes, 2025 Notes, 2026 Notes, 2027 Notes, 2029 Notes, and 2030 Notes (the "Senior Unsecured Notes") each contain covenants that, among other things, limit, in certain circumstances, our ability and/or the ability of our restricted subsidiaries (which are generally domestic subsidiaries in which we own at least
80%
of the voting stock) to (1) create or incur certain liens, (2) enter into certain sale and lease-back transactions, (3) consolidate with or merge with or into, or convey, transfer or lease all or substantially all of our assets, to another entity, and (4) for our 2025 Notes, create, assume, incur, or guarantee certain additional secured indebtedness and unsecured indebtedness of our domestic restricted subsidiaries. These covenants are subject to a number of limitations and exceptions. If a change in control triggering event occurs, as defined in
59
the indenture governing our Senior Unsecured Notes, we will be required to offer to purchase such notes at
101%
of the outstanding aggregate principal amount plus accrued interest up to the purchase date.
Redemption at Our Option
:
We may redeem the 2025 Notes, in whole or in part, at prices above the principal amount that decline over time, as specified in the indenture, together with accrued and unpaid interest. We may redeem all other Senior Unsecured Notes, in whole or in part, at our option prior to their maturity at a price equal to accrued interest plus the present value of the remaining scheduled payments and we may redeem, in whole or in part, at a price equal to par between
one
and
three
months prior to maturity.
Convertible Senior Notes
|
Holder Put
Date (1) |
Maturity Date
|
Conversion Price Per Share
|
Conversion Price Per Share Threshold
(2)
|
Underlying Shares of Common Stock
|
Conversion Value in Excess of Principal
(3)
|
Principal
Settlement
Option
(4)
|
|||||||||||||||
|
2032D Notes
|
May 2021
|
May 2032
|
$
|
9.98
|
|
$
|
12.97
|
|
13
|
|
$
|
464
|
|
Cash and/or shares
|
|||||||
|
2033F Notes
(5)
|
Feb. 2020
|
Feb. 2033
|
10.93
|
|
14.21
|
|
6
|
|
190
|
|
Cash
|
||||||||||
|
19
|
|
$
|
654
|
|
|||||||||||||||||
|
(1)
|
Debt discount and debt issuance costs are amortized through the earliest holder put date.
|
|
(2)
|
Represents
130%
of the conversion price per share. If the trading price of our common stock exceeds such threshold for a specified period, holders may convert such notes during a specified period. See "Conversion Rights" below.
|
|
(3)
|
Based on the trading price of our common stock of
$44.67
as of
August 29, 2019
.
|
|
(4)
|
It is our current intent to settle in cash the principal amount of our convertible notes upon conversion. As a result, only the amounts payable in excess of the principal amounts upon conversion of our convertible notes are considered in diluted earnings per share under the treasury stock method. For each of our convertible notes, we may elect to settle any amounts in excess of the principal in cash, shares of our common stock, or a combination thereof.
|
|
(5)
|
Holders may put their notes to us on February 15, 2020 and on February 15, 2023.
|
Conversion Rights
:
Holders of our convertible notes may convert their notes under the following circumstances: (1) if the notes are called for redemption; (2) during any calendar quarter if the closing price of our common stock for at least
20
trading days in the
30
consecutive trading days ending on the last trading day of the preceding calendar quarter is more than
130%
of the conversion price (see "Conversion Price Per Share Threshold" in the table above); (3) if the trading price of the notes is less than
98%
of the product of the closing price of our common stock and the conversion rate of the notes during the periods specified in the indentures; (4) if specified distributions or corporate events occur, as set forth in the indenture for the notes; or (5) during the last three months prior to the maturity date of the notes. For the calendar quarter ended September 30, 2019, the closing price of our common stock exceeded
130%
of the conversion price for each series of our convertible notes; therefore, those notes are convertible by the holders through December 31, 2019.
In August 2019, holders of our 2033F Notes with an aggregate principal amount of
$44 million
converted their notes, which were settled in cash the first quarter of 2020. As a result of our election to settle all amounts due upon conversion in cash for these notes, such settlement obligations became derivative debt liabilities in 2019 subject to mark-to-market accounting treatment based on the volume-weighted-average price of our common stock over a period of
20
consecutive trading days. Accordingly, at the dates of our elections to settle the conversions in cash, we reclassified the fair values of the equity components of each of the converted notes from additional capital to derivative debt liabilities within current debt in our consolidated balance sheet. The net carrying amount for 2019 included
$179 million
for the fair values of the derivative debt liabilities as of August 29, 2019. The
20
consecutive trading day period ended in the first quarter of 2020, and we settled the conversion for
$192 million
in cash.
60
Cash Redemption at Our Option
:
We may redeem our convertible notes under the circumstances listed in the table below. The redemption price for the notes will equal the principal amount at maturity plus accrued and unpaid interest.
|
Conditional Redemption Period
at Our Option
(1)
|
Unconditional Redemption Period
at Our Option
|
Redemption Period Requiring
Make-Whole
|
||||
|
2032D Notes
|
On or after May 1, 2017
|
On or after May 4, 2021
|
Prior to May 4, 2021
(2)
|
|||
|
2033F Notes
|
N/A
|
On or after Feb. 20, 2020
|
N/A
|
|||
|
(1)
|
We may redeem for cash on or after the applicable dates if the volume weighted average price of our common stock has been at least
130%
of the conversion price for at least
20
trading days during any
30
consecutive trading day period.
|
|
(2)
|
If we redeem prior to the applicable date, we will pay a make-whole premium in cash equal to the present value of the remaining scheduled interest payments from the redemption date to May 4, 2021.
|
Cash Repurchase at the Option of the Holders
:
We may be required by the holders of our convertible notes to repurchase for cash all or a portion of the notes on the "Holder Put Date" listed in the table above. The repurchase price would equal the principal amount plus accrued and unpaid interest. Also, upon a change in control or a termination of trading, as defined in the respective indentures, holders of our convertible notes may require us to repurchase for cash all or a portion of their notes.
Other
:
Interest expense for our convertible notes consisted of contractual interest of
$21 million
,
$44 million
, and
$51 million
for
2019
,
2018
, and
2017
, respectively, and amortization of discount and issuance costs of
$14 million
,
$32 million
, and
$37 million
for
2019
,
2018
, and
2017
, respectively. As of
August 29, 2019
and
August 30, 2018
, the carrying amounts of the equity components of our convertible notes, which are included in additional capital, were
$29 million
and
$208 million
, respectively.
Credit Facility
In July 2018, we entered into a credit agreement providing a committed revolving credit facility that matures in July 2023. On November 27, 2018, we amended the credit agreement to increase the amount available to draw under the revolving credit facility from
$2.0 billion
to
$2.5 billion
. On July 9, 2019, we entered into an incremental amendment to the credit agreement to obtain a term loan facility for up to
$1.25 billion
of financing. We suspended the security interest in the collateral under the credit agreement in 2019 upon satisfying the requirements under the credit agreement, including achieving specified credit ratings and prepayment of the 2022 Term Loan B; however, the security interest would be automatically reinstated upon a decline below a certain level in our corporate credit rating. If the security interest is reinstated, any amounts drawn under the credit agreement would be collateralized by substantially all of the assets of Micron and MSP, subject to certain permitted liens.
Borrowings under either the revolving credit facility or the term loan facility will generally bear interest at a rate equal to LIBOR plus
1.25%
to
2.00%
, depending on our corporate credit ratings or leverage ratio. We may elect to convert outstanding revolving or term loan interest to other variable-rate indexes. The term loan facility may be drawn in a single advance prior to November 9, 2019. If drawn, the term loan matures on the fifth anniversary of the funding date of the term loan. Principal payments are due annually in an amount equal to
5.0%
of the initial aggregate principal amount with the balance due at maturity. As of
August 29, 2019
, there were
no
outstanding amounts drawn under either the revolving credit facility or the term loan facility.
Under the terms of the credit agreement, we must maintain ratios, calculated as of the last day of each fiscal quarter, of total indebtedness to adjusted EBITDA not to exceed
2.75
to
1.00
and adjusted EBITDA to net interest expense of not less than
3.50
to
1.00
. The credit agreement contains other covenants that, among other things, limit, in certain circumstances, our ability and/or the ability of our restricted subsidiaries to (1) create or incur certain liens and enter into sale and lease-back transactions, (2) create, assume, incur, or guarantee certain additional secured indebtedness and unsecured indebtedness of our restricted subsidiaries, and (3) consolidate with or merge with or into, or convey, transfer, lease, or otherwise dispose of all or substantially all of our assets, to another entity. These covenants are subject to a number of limitations, exceptions, and qualifications.
61
Debt Activity
The table below presents the effects of issuances, prepayments, and conversions of debt in 2019. When we receive a notice of conversion for any of our convertible notes and elect to settle in cash any amount of the conversion obligation in excess of the principal amount, the cash settlement obligations become derivative debt liabilities subject to mark-to-market accounting treatment based on the volume-weighted-average price of our common stock over a period of
20
consecutive trading days. Accordingly, at the date of our election to settle a conversion in cash, we reclassify the fair value of the equity component of the converted notes from additional capital to derivative debt liability within current debt in our consolidated balance sheet.
|
Increase (Decrease) in Principal
|
Increase (Decrease) in Carrying Value
|
Increase (Decrease) in Cash
|
Decrease in Equity
|
Gain (Loss)
|
||||||||||||||||
|
Issuances
|
||||||||||||||||||||
|
2024 Notes
(1)
|
$
|
600
|
|
$
|
597
|
|
$
|
597
|
|
$
|
—
|
|
$
|
—
|
|
|||||
|
2026 Notes
(1)
|
500
|
|
497
|
|
497
|
|
—
|
|
—
|
|
||||||||||
|
2027 Notes
(2)
|
900
|
|
895
|
|
895
|
|
—
|
|
—
|
|
||||||||||
|
2029 Notes
(1)
|
700
|
|
695
|
|
695
|
|
—
|
|
—
|
|
||||||||||
|
2030 Notes
(2)
|
850
|
|
845
|
|
845
|
|
—
|
|
—
|
|
||||||||||
|
Prepayments
|
||||||||||||||||||||
|
2022 Term Loan B
|
(728
|
)
|
(721
|
)
|
(728
|
)
|
—
|
|
(7
|
)
|
||||||||||
|
Settled conversions
|
||||||||||||||||||||
|
2032D Notes
|
(10
|
)
|
(9
|
)
|
(35
|
)
|
(28
|
)
|
2
|
|
||||||||||
|
2033F Notes
|
(45
|
)
|
(175
|
)
|
(192
|
)
|
(28
|
)
|
11
|
|
||||||||||
|
2043G Notes
|
(1,019
|
)
|
(691
|
)
|
(1,426
|
)
|
(326
|
)
|
(400
|
)
|
||||||||||
|
Conversions not settled
|
||||||||||||||||||||
|
2033F Notes
(3)
|
—
|
|
135
|
|
—
|
|
(133
|
)
|
(2
|
)
|
||||||||||
|
$
|
1,748
|
|
$
|
2,068
|
|
$
|
1,148
|
|
$
|
(515
|
)
|
$
|
(396
|
)
|
||||||
|
(1)
|
Issued February 6, 2019.
|
|
(2)
|
Issued July 12, 2019.
|
|
(3)
|
As of
August 29, 2019
, an aggregate of
$44 million
principal amount of our 2033F Notes (with a carrying value of
$179 million
) had converted but not settled. These notes settled in the first quarter of 2020 for
$192 million
in cash.
|
In 2018, we repurchased or redeemed
$6.96 billion
of principal amount of notes (carrying value of
$6.93 billion
) for an aggregate of
$9.42 billion
in cash and
4 million
shares of our treasury stock. As of August 30, 2018, an aggregate of
$35 million
principal amount of our 2033F Notes (with a carrying value of
$165 million
) had converted but not settled. These notes settled in 2019 for
$153 million
in cash and the effect of the settlement is included in the table above. In connection with these transactions, we recognized aggregate non-operating losses of
$385 million
in 2018.
In 2017, we repurchased or redeemed
$1.55 billion
of principal amount of notes (carrying value of
$1.54 billion
) for an aggregate of
$1.63 billion
in cash. In connection with these transactions, we recognized aggregate non-operating losses of
$94 million
in 2017.
62
Maturities of Notes Payable and Future Minimum Lease Payments
As of
August 29, 2019
, maturities of notes payable (including the MMJ Creditor Payments) and future minimum lease payments under capital lease obligations were as follows:
|
Notes Payable
|
Capital Lease Obligations
|
|||||||
|
2020
|
$
|
1,095
|
|
$
|
248
|
|
||
|
2021
|
134
|
|
107
|
|
||||
|
2022
|
—
|
|
73
|
|
||||
|
2023
|
—
|
|
48
|
|
||||
|
2024
|
600
|
|
37
|
|
||||
|
2025 and thereafter
|
3,469
|
|
189
|
|
||||
|
Unamortized discounts and interest, respectively
|
(38
|
)
|
(111
|
)
|
||||
|
$
|
5,260
|
|
$
|
591
|
|
|||
Commitments
As of
August 29, 2019
, we had commitments of approximately
$7.6 billion
of purchase obligations, a substantial majority of which will be due within five years. Purchase obligations include payments for the acquisition of property, plant, and equipment, and other goods or services of either a fixed or minimum quantity.
We lease certain facilities and equipment under operating leases, for which expense was
$93 million
,
$63 million
, and
$52 million
for
2019
,
2018
, and
2017
, respectively. Minimum future operating lease commitments as of
August 29, 2019
were as follows:
|
2020
|
$
|
54
|
|
|
|
2021
|
64
|
|
||
|
2022
|
63
|
|
||
|
2023
|
59
|
|
||
|
2024
|
53
|
|
||
|
2025 and thereafter
|
459
|
|
||
|
$
|
752
|
|
||
Contingencies
We have accrued a liability and charged operations for the estimated costs of adjudication or settlement of various asserted and unasserted claims existing as of the balance sheet date, including those described below. We are currently a party to other legal actions arising from the normal course of business, none of which is expected to have a material adverse effect on our business, results of operations, or financial condition.
Patent Matters
As is typical in the semiconductor and other high-tech industries, from time to time, others have asserted, and may in the future assert, that our products or manufacturing processes infringe upon their intellectual property rights.
On August 12, 2014, MLC Intellectual Property, LLC filed a patent infringement action against Micron in the United States District Court for the Northern District of California. The complaint alleges that Micron infringes a single U.S. patent and seeks damages, attorneys' fees, and costs.
On November 21, 2014, Elm 3DS Innovations, LLC ("Elm") filed a patent infringement action against Micron; Micron Semiconductor Products, Inc.; and Micron Consumer Products Group, Inc. in the U.S. District Court for the District of Delaware. On March 27, 2015, Elm filed an amended complaint against the same entities. The amended complaint alleges that
63
unspecified semiconductor products of ours that incorporate multiple stacked die infringe
13
U.S. patents and seeks damages, attorneys' fees, and costs.
On December 15, 2014, Innovative Memory Solutions, Inc. ("IMS") filed a patent infringement action against Micron in the U.S. District Court for the District of Delaware. The complaint alleges that a variety of our NAND products infringe
eight
U.S. patents and seeks damages, attorneys' fees, and costs. On July 23, 2018, IMS served a patent infringement complaint on Micron Semiconductor (Deutschland) GmbH and Micron Europe Limited in the Regional Court, Mannheim, Germany alleging that products including our SSDs infringe a European patent. The complaint seeks unspecified damages and an order forbidding Micron Semiconductor (Deutschland) GmbH and Micron Europe Limited from offering to sell, using, and importing the accused products. On June 7, 2019, the Regional Court found no infringement and dismissed the case. On August 31, 2018, Micron was served with a complaint filed by IMS in Shenzhen Intermediate People's Court in Guangdong Province, China. The complaint alleges that certain of our NAND flash products infringe a Chinese patent. The complaint seeks an order requiring Micron to stop manufacturing, using, selling, and offering for sale the accused products in China, and to pay damages of
1 million
Chinese yuan plus expenses.
On March 19, 2018, Micron Semiconductor (Xi'an) Co., Ltd. ("MXA") was served with a patent infringement complaint filed by Fujian Jinhua Integrated Circuit Co., Ltd. ("Jinhua") in the Fuzhou Intermediate People's Court in Fujian Province, China (the "Fuzhou Court"). On April 3, 2018, Micron Semiconductor (Shanghai) Co. Ltd. ("MSS") was served with the same complaint. The complaint alleges that MXA and MSS infringe a Chinese patent by manufacturing and selling certain Crucial DDR4 DRAM modules. The complaint seeks an order requiring MXA and MSS to destroy inventory of the accused products and equipment for manufacturing the accused products in China, to stop manufacturing, using, selling, and offering for sale the accused products in China, and to pay damages of
98 million
Chinese yuan plus court fees incurred.
On March 21, 2018, MXA was served with a patent infringement complaint filed by United Microelectronics Corporation ("UMC") in the Fuzhou Court. On April 3, 2018, MSS was served with the same complaint. The complaint alleges that MXA and MSS infringe a Chinese patent by manufacturing and selling certain Crucial DDR4 DRAM modules. The complaint seeks an order requiring MXA and MSS to destroy inventory of the accused products and equipment for manufacturing the accused products in China, to stop manufacturing, using, selling, and offering for sale the accused products in China, and to pay damages of
90 million
Chinese yuan plus court fees incurred.
On April 3, 2018, MSS was served with another patent infringement complaint filed by Jinhua and two additional complaints filed by UMC in the Fuzhou Court. The three additional complaints allege that MSS infringes three Chinese patents by manufacturing and selling certain Crucial MX300 SSDs and certain GDDR5 memory chips. The two complaints filed by UMC each seek an order requiring MSS to destroy inventory of the accused products and equipment for manufacturing the accused products in China, to stop manufacturing, using, selling, and offering for sale the accused products in China, and to pay damages for each complaint of
90 million
Chinese yuan plus court fees incurred. The complaint filed by Jinhua seeks an order requiring MSS to destroy inventory of the accused products and equipment for manufacturing the accused products in China; to stop manufacturing, using, selling, and offering for sale the accused products in China; and to pay damages of
98 million
Chinese yuan plus court fees incurred. On October 9, 2018, UMC withdrew its complaint that alleged MSS infringed a Chinese patent by manufacturing and selling certain GDDR5 memory chips.
On July 5, 2018, MXA and MSS were notified that the Fuzhou Court granted a preliminary injunction against those entities that enjoins them from manufacturing, selling, or importing certain Crucial and Ballistic-branded DRAM modules and solid-state drives in China. The affected products make up slightly more than
1%
of our annualized revenues. We are complying with the ruling and have requested the Fuzhou Court to reconsider or stay its decision.
Among other things, the above lawsuits pertain to substantially all of our DRAM, NAND, and other memory and storage products we manufacture, which account for a significant portion of our revenue.
64
Qimonda
On January 20, 2011, Dr. Michael Jaffé, administrator for Qimonda's insolvency proceedings, filed suit against Micron and Micron Semiconductor B.V., ("Micron B.V."), in the District Court of Munich, Civil Chamber. The complaint seeks to void, under Section 133 of the German Insolvency Act, a share purchase agreement between Micron B.V. and Qimonda signed in fall 2008, pursuant to which Micron B.V. purchased substantially all of Qimonda's shares of Inotera (the "Inotera Shares"), representing approximately
18%
of Inotera's outstanding shares as of
August 29, 2019
, and seeks an order requiring us to re-transfer those shares to the Qimonda estate. The complaint also seeks, among other things, to recover damages for the alleged value of the joint venture relationship with Inotera and to terminate, under Sections 103 or 133 of the German Insolvency Code, a patent cross-license between us and Qimonda entered into at the same time as the share purchase agreement.
Following a series of hearings with pleadings, arguments, and witnesses on behalf of the Qimonda estate, on March 13, 2014, the court issued judgments: (1) ordering Micron B.V. to pay approximately
$1 million
in respect of certain Inotera Shares sold in connection with the original share purchase; (2) ordering Micron B.V. to disclose certain information with respect to any Inotera Shares sold by it to third parties; (3) ordering Micron B.V. to disclose the benefits derived by it from ownership of the Inotera Shares, including in particular, any profits distributed on the Inotera Shares and all other benefits; (4) denying Qimonda's claims against Micron for any damages relating to the joint venture relationship with Inotera; and (5) determining that Qimonda's obligations under the patent cross-license agreement are canceled. In addition, the court issued interlocutory judgments ordering, among other things: (1) that Micron B.V. transfer to the Qimonda estate the Inotera Shares still owned by Micron B.V. and pay to the Qimonda estate compensation in an amount to be specified for any Inotera Shares sold to third parties; and (2) that Micron B.V. pay the Qimonda estate as compensation an amount to be specified for benefits derived by Micron B.V. from ownership of the Inotera Shares. The interlocutory judgments have no immediate, enforceable effect on us, and, accordingly, we expect to be able to continue to operate with full control of the Inotera Shares subject to further developments in the case. On April 17, 2014, Micron and Micron B.V. filed a notice of appeal with the German Appeals Court challenging the District Court's decision. After opening briefs, the Appeals Court held a hearing on the matter on July 9, 2015, and thereafter appointed two independent experts to perform an evaluation of Dr. Jaffé's claims that the amount Micron paid for Qimonda was less than fair market value. On January 25, 2018, the court-appointed experts issued their report concluding that the amount paid by Micron was within an acceptable fair-value range. The Appeals Court held a subsequent hearing on April 30, 2019, and on May 28, 2019, the Appeals Court remanded the case to the experts for supplemental expert opinion.
Antitrust Matters
On April 27, 2018, a complaint was filed against Micron and other DRAM suppliers in the U.S. District Court for the Northern District of California. Subsequently, two substantially identical cases were filed in the same court. The lawsuits purport to be on behalf of a nationwide class of indirect purchasers of DRAM products. The complaints assert claims based on alleged price-fixing of DRAM products under federal and state law during the period from June 1, 2016 to February 1, 2018, and seek treble monetary damages, costs, interest, attorneys' fees, and other injunctive and equitable relief. On September 3, 2019, the District Court granted Micron's motion to dismiss and allowed plaintiffs the opportunity to file an amended complaint.
On June 26, 2018, a complaint was filed against Micron and other DRAM suppliers in the U.S. District Court for the Northern District of California. Subsequently, four substantially identical cases were filed in the same court. The lawsuits purport to be on behalf of a nationwide class of direct purchasers of DRAM products. The complaints assert claims based on alleged price-fixing of DRAM products under federal and state law during the period from June 1, 2016 to February 1, 2018, and seek treble monetary damages, costs, interest, attorneys' fees, and other injunctive and equitable relief.
Additionally, six cases have been filed in the following Canadian courts: Superior Court of Quebec, the Federal Court of Canada, the Ontario Superior Court of Justice, and the Supreme Court of British Columbia. The substantive allegations in these cases are similar to those asserted in the cases filed in the United States.
On May 15, 2018, the Chinese State Administration for Market Regulation ("SAMR") notified Micron that it was investigating potential collusion and other anticompetitive conduct by DRAM suppliers in China. On May 31, 2018, SAMR made unannounced visits to our sales offices in Beijing, Shanghai, and Shenzhen to seek certain information as part of its investigation. We are cooperating with SAMR in its investigation.
65
Securities Matters
On January 23, 2019, a complaint was filed against Micron and two of our officers, Sanjay Mehrotra and David Zinsner, in the U.S. District Court for the Southern District of New York. The lawsuit purports to be brought on behalf of a class of purchasers of our stock during the period from June 22, 2018 through November 19, 2018. Subsequently two substantially similar cases were filed in the same court adding one of our former officers, Ernie Maddock, as a defendant and alleging a class action period from September 26, 2017 through November 19, 2018. The separate cases were joined, and a consolidated amended complaint was filed on June 15, 2019. The consolidated amended complaint alleges that defendants committed securities fraud through misrepresentations and omissions about purported anticompetitive behavior in the DRAM industry and seek compensatory and punitive damages, fees, interest, costs, and other appropriate relief. On October 2, 2019, the parties submitted a joint stipulation to dismiss the complaint. The Court approved the stipulation and dismissed the complaint on October 3, 2019.
On March 5, 2019, a shareholder derivative complaint was filed in the U.S. District Court for the District of Delaware, allegedly on behalf of and for the benefit of Micron, against certain current and former officers and directors of Micron for alleged breaches of their fiduciary duties and other violations of law. The allegations are based on, among other things, purported false and misleading statements regarding anticompetitive behavior in the DRAM industry. The complaint seeks damages, fees, interest, costs, and other appropriate relief. Similar shareholder derivative complaints have subsequently been filed in the U.S. District Court for the District of Delaware and the U.S. District Court for the District of Idaho.
Other
On December 5, 2017, Micron filed a complaint against UMC and Jinhua in the U.S. District Court for the Northern District of California. The complaint alleges that UMC and Jinhua violated the Defend Trade Secrets Act, the civil provisions of the Racketeer Influenced and Corrupt Organizations Act, and California's Uniform Trade Secrets Act by misappropriating Micron's trade secrets and other misconduct. Micron's complaint seeks damages, restitution, disgorgement of profits, injunctive relief, and other appropriate relief.
On June 13, 2019, current Micron employee Chris Manning filed a putative class action lawsuit on behalf of Micron employees subject to the Idaho Claim Act who earned a performance-based bonus after the conclusion of fiscal year 2018 whose performance rating was calculated based upon a mandatory percentage distribution range of performance ratings. On behalf of himself and the putative class, Manning asserts claims for violation of the Idaho Wage Claim Act, breach of contract, breach of the covenant of good faith and fair dealing, and fraud.
In the normal course of business, we are a party to a variety of agreements pursuant to which we may be obligated to indemnify the other party. It is not possible to predict the maximum potential amount of future payments under these types of agreements due to the conditional nature of our obligations and the unique facts and circumstances involved in each particular agreement. Historically, our payments under these types of agreements have not had a material adverse effect on our business, results of operations, or financial condition.
We are unable to predict the outcome of the patent matters, the Qimonda matter, antitrust matters, securities matters, and other matters noted above and therefore cannot estimate the range of possible loss. A determination that our products or manufacturing processes infringe the intellectual property rights of others or entering into a license agreement covering such intellectual property could result in significant liability and/or require us to make material changes to our products and/or manufacturing processes. Any of the foregoing, as well as the resolution of any other legal matter noted above, could have a material adverse effect on our business, results of operations, or financial condition.
Redeemable Convertible Notes
Under the terms of the indentures governing our 2033F Notes, upon conversion, we would be required to pay cash equal to the lesser of (1) the aggregate principal amount or (2) the conversion value of the notes being converted. To the extent the conversion value exceeds the principal amount, we could pay cash, shares of common stock, or a combination thereof, at our option, for the amount of such excess. The closing price of our common stock met the threshold for conversion and our 2033F Notes were convertible by their holders as of August 29, 2019 and August 30, 2018. As a result, the balance of these notes was classified as current debt and the difference between the principal amount and the carrying value was classified as redeemable convertible notes.
66
Redeemable Noncontrolling Interest
Redeemable noncontrolling interest reflects
100,000
preferred shares authorized and issued by Micron Semiconductor Asia Operations Pte. Ltd. ("MSAO") in 2018 for proceeds, net of issuance related costs, of
$97 million
. Holders of the preferred shares are entitled to receive a cumulative dividend of
7.75%
per annum, to be paid from the profits of MSAO on the last day of each quarter and a liquidation preference senior to MSAO's common shares. We recognize the accrued dividend in net income attributable to noncontrolling interests. Holders may require us to purchase their shares after August 29, 2028, and we have the right to reacquire the shares during the period beginning August 31, 2020 through August 29, 2026, each for par value per share plus accrued dividends.
Equity
Micron Shareholders' Equity
Common Stock Repurchases
:
Our Board of Directors has authorized the discretionary repurchase of up to
$10 billion
of our outstanding common stock beginning in fiscal 2019. We may purchase shares on a discretionary basis through open-market purchases, block trades, privately-negotiated transactions, derivative transactions, and/or pursuant to Rule 10b5-1 trading plans, subject to market conditions and our ongoing determination of the best use of available cash. The repurchase authorization does not obligate us to acquire any common stock. In 2019, we repurchased
67 million
shares of our common stock for
$2.66 billion
under an accelerated share repurchase agreement, Rule 10b5-1 plans, and through open market repurchases. The shares were recorded as treasury stock.
Common Stock Issuance
:
In 2018, we issued
34 million
shares of our common stock for
$41.00
per share in a public offering, for net proceeds of
$1.36 billion
, net of underwriting fees and other offering costs.
Treasury Stock
:
In connection with the Inotera Acquisition, we sold
58 million
shares of our common stock to Nanya for
$986 million
in cash, of which
54 million
shares were issued from treasury stock. As a result, in 2017, treasury stock decreased by
$1.03 billion
while retained earnings decreased by
$104 million
for the difference between the carrying value of the treasury stock and its
$925 million
fair value.
Outstanding Capped Calls
:
In connection with our 2033F Notes, we entered into the 2033F Capped Calls, which cover, subject to anti-dilution adjustments similar to those contained in the 2033F Notes,
27 million
shares of common stock and are intended to reduce the effect of potential dilution. The 2033F Capped Calls have an initial strike price of
$10.93
, subject to certain adjustments, which equals the conversion price of the 2033F Notes, a cap price of
$14.51
, and provide for our receipt of cash or shares, at our election, from our counterparties if the trading price of our stock is above the strike prices on the expiration dates. The 2033F Capped Calls expire on various dates between January 2020 and February 2020. As of
August 29, 2019
, the dollar value of cash or shares that we would receive from our 2033F Capped Calls upon their expiration dates range from
$0
, if the trading price of our stock is below the strike prices at expiration, to
$98 million
, if the trading price of our stock is at or above the cap prices. Settlement of the capped calls prior to the expiration dates may be for an amount less than the maximum value at expiration.
Expiration of Capped Calls
: In 2018, we share-settled certain capped calls upon their expirations, and received
9 million
shares, equal to a value of
$429 million
. In 2017, we cash-settled and share-settled certain capped calls upon their expirations, and received
$125 million
in cash and
4 million
shares, equal to a value of
$67 million
. The amounts received upon settlement were based on volume-weighted-average trading prices of our stock at the expiration dates. The shares received in all periods were recorded as treasury stock.
67
Accumulated Other Comprehensive Income
:
Changes in accumulated other comprehensive by component for the year ended
August 29, 2019
were as follows:
|
Pension Liability Adjustments
|
Gains (Losses) on Derivative Instruments
|
Cumulative Foreign Currency Translation Adjustment
|
Unrealized Gains (Losses) on Investments
|
Total
|
|||||||||||||||
|
As of August 30, 2018
|
$
|
10
|
|
$
|
2
|
|
$
|
—
|
|
$
|
(2
|
)
|
$
|
10
|
|
||||
|
Other comprehensive income
|
(13
|
)
|
(3
|
)
|
(1
|
)
|
14
|
|
(3
|
)
|
|||||||||
|
Amount reclassified out of accumulated other comprehensive income
|
4
|
|
—
|
|
—
|
|
(3
|
)
|
1
|
|
|||||||||
|
Tax effects
|
3
|
|
—
|
|
—
|
|
(2
|
)
|
1
|
|
|||||||||
|
Other comprehensive income
|
(6
|
)
|
(3
|
)
|
(1
|
)
|
9
|
|
(1
|
)
|
|||||||||
|
As of August 29, 2019
|
$
|
4
|
|
$
|
(1
|
)
|
$
|
(1
|
)
|
$
|
7
|
|
$
|
9
|
|
||||
Noncontrolling Interests in Subsidiaries
|
As of
|
2019
|
2018
|
||||||||||||
|
Balance
|
Percentage
|
Balance
|
Percentage
|
|||||||||||
|
IMFT
|
$
|
889
|
|
49
|
%
|
$
|
853
|
|
49
|
%
|
||||
|
Other
|
—
|
|
—
|
|
17
|
|
Various
|
|
||||||
|
$
|
889
|
|
$
|
870
|
|
|||||||||
IMFT
:
Since 2006, we have owned
51%
of IMFT, a joint venture between us and Intel. IMFT is governed by a Board of Managers, for which the number of managers appointed by each member varies based on the members' respective ownership interests. IMFT manufactures semiconductor products exclusively for its members under a long-term supply agreement at prices approximating cost. In 2018, IMFT discontinued production of NAND and subsequent to that time manufactured 3D XPoint memory. In 2018, we announced that we and Intel will no longer jointly develop 3D XPoint technology beyond the second generation and we substantially completed this cost-sharing arrangement in the first quarter of 2020. IMFT sales to Intel were
$731 million
,
$507 million
, and
$493 million
for
2019
,
2018
, and
2017
, respectively.
IMFT's capital requirements are generally determined based on an annual plan approved by the members, and capital contributions to IMFT are requested as needed. Capital requests are made to the members in proportion to their then-current ownership interest. Members may elect to not contribute their proportional share, and in such event, the contributing member may elect to contribute any amount of the capital request, either in the form of an equity contribution or member debt financing. Under the supply agreement, the members have rights and obligations to the capacity of IMFT in proportion to their investment, including member debt financing. Any capital contribution or member debt financing results in a proportionate adjustment to the sharing of output on an
eight
-month lag. Pursuant to the terms of the IMFT joint venture agreement, Intel provided debt financing of
$1.01 billion
to IMFT in 2018 and IMFT repaid
$316 million
to Intel in 2019. As of
August 29, 2019
, current debt included
$693 million
of IMFT Member Debt. Members pay their proportionate share of fixed costs associated with IMFT's capacity.
In January 2019, we exercised our option to acquire Intel's interest in IMFT. Subsequently, Intel set the closing date to occur on October 31, 2019, at which time IMFT will become a wholly-owned subsidiary. In the first quarter of 2020, we expect to pay Intel approximately
$1.4 billion
in cash for Intel's noncontrolling interest in IMFT and IMFT member debt. Pursuant to the terms of the IMFT wafer supply agreement, Intel notified us of its election to receive supply from IMFT from the closing date through April 2020 at a volume equal to approximately
50%
of their volume from IMFT in the
six
-month period prior to closing.
68
Creditors of IMFT have recourse only to IMFT's assets and do not have recourse to any other of our assets. The following table presents the assets and liabilities of IMFT included in our consolidated balance sheets:
|
As of
|
2019
|
2018
|
||||||
|
Assets
|
|
|
||||||
|
Cash and equivalents
|
$
|
130
|
|
$
|
91
|
|
||
|
Receivables
|
128
|
|
126
|
|
||||
|
Inventories
|
124
|
|
114
|
|
||||
|
Other current assets
|
9
|
|
8
|
|
||||
|
Total current assets
|
391
|
|
339
|
|
||||
|
Property, plant, and equipment
|
2,235
|
|
2,641
|
|
||||
|
Other noncurrent assets
|
38
|
|
45
|
|
||||
|
Total assets
|
$
|
2,664
|
|
$
|
3,025
|
|
||
|
Liabilities
|
|
|
|
|
||||
|
Accounts payable and accrued expenses
|
$
|
118
|
|
$
|
138
|
|
||
|
Current debt
|
696
|
|
20
|
|
||||
|
Other current liabilities
|
37
|
|
9
|
|
||||
|
Total current liabilities
|
851
|
|
167
|
|
||||
|
Long-term debt
|
53
|
|
1,064
|
|
||||
|
Other noncurrent liabilities
|
5
|
|
74
|
|
||||
|
Total liabilities
|
$
|
909
|
|
$
|
1,305
|
|
||
Amounts exclude intercompany balances that were eliminated in our consolidated balance sheets.
Fair Value Measurements
Substantially all of our marketable debt and equity investments were classified as available-for-sale and carried at fair value. Amounts reported as cash and equivalents, receivables, and accounts payable and accrued expenses approximate fair value. The estimated fair value and carrying value of our outstanding debt instruments (excluding the carrying value of equity and mezzanine equity components of our convertible notes) were as follows:
|
As of
|
2019
|
2018
|
||||||||||||||
|
Fair
Value
|
Carrying
Value
|
Fair
Value
|
Carrying
Value
|
|||||||||||||
|
Notes and MMJ Creditor Payments
|
$
|
5,194
|
|
$
|
4,937
|
|
$
|
2,798
|
|
$
|
2,741
|
|
||||
|
Convertible notes
|
852
|
|
323
|
|
3,124
|
|
1,049
|
|
||||||||
The fair values of our convertible notes were determined based on Level 2 inputs, including the trading price of our convertible notes when available, our stock price, and interest rates based on similar debt issued by parties with credit ratings similar to ours. The fair values of our other debt instruments were estimated based on Level 2 inputs, including discounted cash flows, the trading price of our notes, when available, and interest rates based on similar debt issued by parties with credit ratings similar to ours.
Other operating (income) expense, net included unrealized losses primarily from semiconductor equipment held for sale of
$82 million
in 2019. The fair values were based on quotations obtained from equipment dealers, which consider the remaining useful life and configuration of the equipment (Level 3). As of
August 29, 2019
, assets held for sale were not material.
69
Derivative Instruments
|
Gross Notional Amount
|
Fair Value of
|
|||||||||||
|
Current Assets
(1)
|
Current Liabilities
(2)
|
|||||||||||
|
As of August 29, 2019
|
||||||||||||
|
Derivative instruments with hedge accounting designation
|
||||||||||||
|
Cash flow currency hedges
|
$
|
146
|
|
$
|
1
|
|
$
|
—
|
|
|||
|
Derivative instruments without hedge accounting designation
|
||||||||||||
|
Non-designated currency hedges
|
1,871
|
|
1
|
|
(9
|
)
|
||||||
|
Convertible notes settlement obligation
(3)
|
—
|
|
(179
|
)
|
||||||||
|
1
|
|
(188
|
)
|
|||||||||
|
$
|
2
|
|
$
|
(188
|
)
|
|||||||
|
As of August 30, 2018
|
||||||||||||
|
Derivative instruments with hedge accounting designation
|
||||||||||||
|
Cash flow currency hedges
|
$
|
538
|
|
$
|
—
|
|
$
|
(13
|
)
|
|||
|
Derivative instruments without hedge accounting designation
|
||||||||||||
|
Non-designated currency hedges
|
1,919
|
|
14
|
|
(10
|
)
|
||||||
|
Convertible notes settlement obligation
(3)
|
—
|
|
(167
|
)
|
||||||||
|
|
|
14
|
|
(177
|
)
|
|||||||
|
$
|
14
|
|
$
|
(190
|
)
|
|||||||
|
(1)
|
Included in receivables – other.
|
|
(2)
|
Included in accounts payable and accrued expenses – other for forward contracts and in current debt for convertible notes settlement obligations.
|
|
(3)
|
Notional amounts of convertible notes settlement obligations as of
August 29, 2019
and
August 30, 2018
were
4 million
and
3 million
shares of our common stock, respectively.
|
Derivative Instruments with Hedge Accounting Designation
We utilize currency forward contracts that generally mature within
12
months to hedge our exposure to changes in currency exchange rates. Currency forward contracts are measured at fair value based on market-based observable inputs including currency exchange spot and forward rates, interest rates, and credit-risk spreads (Level 2). We do not use derivative instruments for speculative purposes.
Cash Flow Hedges
:
We utilize cash flow hedges for our exposure from changes in currency exchange rates for certain capital expenditures. We recognized losses of
$3 million
and
$17 million
and gains of
$15 million
for
2019
,
2018
, and
2017
, respectively, in accumulated other comprehensive income from the effective portion of cash flow hedges. Neither the amount excluded from hedge effectiveness nor the reclassifications from accumulated other comprehensive income to earnings were material in
2019
,
2018
, or
2017
. The amounts from cash flow hedges included in accumulated other comprehensive income that are expected to be reclassified into earnings in the next 12 months were also not material.
70
Fair Value Hedges
:
In 2018, we utilized fair value hedges for our exposure from changes in currency exchange rates for certain monetary assets and liabilities. The effects of fair value hedges on our consolidated statements of operations were as follows:
|
Other
Non-Operating
Income (Expense)
|
||||
|
For the year ended
|
2018
|
|||
|
Loss on remeasurement of hedged assets and liabilities
|
$
|
(25
|
)
|
|
|
Gain on derivatives designated as hedged instruments
|
25
|
|
||
|
Amortization of amounts excluded from hedge effectiveness
|
(32
|
)
|
||
|
$
|
(32
|
)
|
||
Derivative Instruments without Hedge Accounting Designation
Currency Derivatives
:
We generally utilize a rolling hedge strategy with currency forward contracts that mature within
three
months to hedge our exposures of monetary assets and liabilities from changes in currency exchange rates. At the end of each reporting period, monetary assets and liabilities denominated in currencies other than the U.S. dollar are remeasured into U.S. dollars and the associated outstanding forward contracts are marked to market. Currency forward contracts are valued at fair values based on the middle of bid and ask prices of dealers or exchange quotations (Level 2). Realized and unrealized gains and losses on derivative instruments without hedge accounting designation as well as the changes in the underlying monetary assets and liabilities from changes in currency exchange rates are included in other non-operating income (expense). For derivative instruments without hedge accounting designation, we recognized losses of
$32 million
,
$38 million
, and
$45 million
for
2019
,
2018
, and
2017
, respectively.
Convertible Notes Settlement Obligations
:
For settlement obligations associated with our convertible notes subject to mark-to-market accounting treatment, the fair values of the underlying derivative settlement obligations were initially determined using the Black-Scholes option valuation model (Level 2), which requires inputs of stock price, expected stock-price volatility, estimated option life, risk-free interest rate, and dividend rate. The subsequent measurement amounts were based on the volume-weighted-average trading price of our common stock (Level 2). (See "Debt" note.) We recognized losses of
$58 million
and
$124 million
for
2019
and
2018
, respectively, in other non-operating income (expense), net for the changes in fair value of the derivative settlement obligations. Recognized gains and losses for 2017 were not material.
Derivative Counterparty Credit Risk and Master Netting Arrangements
Our derivative instruments expose us to credit risk to the extent counterparties may be unable to meet the terms of the contracts. Our maximum exposure to loss due to credit risk if counterparties fail completely to perform according to the terms of the contracts would generally equal the fair value of assets for these contracts as listed in the tables above. We seek to mitigate such risk by limiting our counterparties to major financial institutions and by spreading risk across multiple financial institutions. As of
August 29, 2019
and
August 30, 2018
, amounts netted under our master netting arrangements were not material.
Equity Plans
As of
August 29, 2019
,
108 million
shares of our common stock were available for future awards under our equity plans, including
29 million
shares approved for issuance under our employee stock purchase plan ("ESPP").
Restricted Stock and Restricted Stock Units ("Restricted Stock Awards")
As of
August 29, 2019
, there were
16 million
shares of Restricted Stock Awards outstanding,
14 million
of which contained only service conditions. For service-based Restricted Stock Awards, restrictions generally lapse in one-fourth or one-third increments during each year of employment after the grant date. Restrictions lapse on Restricted Stock granted in 2019 with performance or market conditions over a
three
-year period if conditions are met. At the end of the performance period, the number of actual shares to be awarded will vary between
0%
and
200%
of target amounts, depending upon the achievement level. Restricted Stock Awards activity for
2019
is summarized as follows:
71
|
Number of Shares
|
Weighted-Average Grant Date Fair Value Per Share
|
||||||
|
Outstanding as of August 30, 2018
|
15
|
|
$
|
25.18
|
|
||
|
Granted
|
9
|
|
41.11
|
|
|||
|
Restrictions lapsed
|
(6
|
)
|
24.22
|
|
|||
|
Canceled
|
(2
|
)
|
24.79
|
|
|||
|
Outstanding as of August 29, 2019
|
16
|
|
34.72
|
|
|||
|
For the year ended
|
2019
|
2018
|
2017
|
||||||||||||||||||
|
Restricted stock award shares granted
|
9
|
4
|
8
|
||||||||||||||||||
|
Weighted-average grant-date fair value per share
|
$
|
41.11
|
$
|
42.48
|
$
|
18.77
|
|||||||||||||||
|
Aggregate vesting-date fair value of shares vested
|
$
|
248
|
$
|
259
|
$
|
115
|
|||||||||||||||
Stock Options
Our stock options are generally exercisable in increments of either one-fourth or one-third per year beginning one year from the date of grant. Stock options issued after February 2014 expire
eight
years from the date of grant. Options issued prior to February 2014 expire
six
years from the date of grant. Option activity for
2019
is summarized as follows:
|
Number of Shares
|
Weighted-Average Exercise Price Per Share
|
Weighted-Average Remaining Contractual Life
(In Years)
|
Aggregate Intrinsic Value
|
||||||||||
|
Outstanding as of August 30, 2018
|
18
|
|
$
|
23.38
|
|
||||||||
|
Granted
|
—
|
|
44.30
|
|
|||||||||
|
Exercised
|
(5
|
)
|
17.50
|
|
|||||||||
|
Canceled or expired
|
(1
|
)
|
22.60
|
|
|||||||||
|
Outstanding as of August 29, 2019
|
12
|
|
25.94
|
|
4.3
|
$
|
220
|
|
|||||
|
Exercisable as of August 29, 2019
|
7
|
|
$
|
25.37
|
|
3.7
|
$
|
143
|
|
||||
|
Unvested as of August 29, 2019
|
5
|
|
26.94
|
|
5.5
|
77
|
|
||||||
The total intrinsic value was
$108 million
,
$446 million
, and
$198 million
for options exercised in
2019
,
2018
, and
2017
, respectively.
Stock options granted and assumptions used in the
Black-Scholes
option valuation model were as follows:
|
For the year ended
|
2019
|
2018
|
2017
|
||||||||||||||||||||||
|
Stock options granted
|
—
|
2
|
8
|
||||||||||||||||||||||
|
Weighted-average grant-date fair value per share
|
$
|
19.50
|
$
|
18.65
|
$
|
8.68
|
|||||||||||||||||||
|
Average expected life in years
|
5.4
|
5.5
|
5.5
|
||||||||||||||||||||||
|
Weighted-average expected volatility
|
44.0
|
%
|
44.0
|
%
|
46.0
|
%
|
|||||||||||||||||||
|
Weighted-average risk-free interest rate
|
2.9
|
%
|
2.2
|
%
|
1.8
|
%
|
|||||||||||||||||||
|
Expected dividend yield
|
0.0
|
%
|
0.0
|
%
|
0.0
|
%
|
|||||||||||||||||||
Stock price volatility was based on an average of historical volatility and the implied volatility derived from traded options on our stock. The expected lives of options granted were based, in part, on historical experience and on the terms and conditions of the options. The risk-free interest rates utilized were based on the U.S. Treasury yield in effect at each grant date.
72
Employee Stock Purchase Plan
Our employee stock purchase plan ("ESPP") was offered to substantially all employees beginning in August 2018 and permits eligible employees to purchase shares of our common stock through payroll deductions of up to
10%
of their eligible compensation, subject to certain limitations. The purchase price of the shares under the ESPP equals
85%
of the lower of the fair market value of our common stock on either the first or last day of each
six
-month offering period. Compensation expense is calculated as of the beginning of the offering period as the fair value of the employees' purchase rights utilizing the
Black-Scholes
option valuation model and is recognized over the offering period. Assumptions used in the Black-Scholes option valuation model were as follows:
|
For the year ended
|
2019
|
2018
|
||||||||||||||
|
Weighted-average grant-date fair value per share
|
$
|
11.60
|
$
|
14.55
|
||||||||||||
|
Average expected life in years
|
0.5
|
0.5
|
||||||||||||||
|
Weighted-average expected volatility
|
45.0
|
%
|
43.0
|
%
|
||||||||||||
|
Weighted-average risk-free interest rate
|
2.2
|
%
|
2.2
|
%
|
||||||||||||
|
Expected dividend yield
|
0.0
|
%
|
0.0
|
%
|
||||||||||||
Employees purchased
3 million
shares of common stock for
$95 million
in 2019 under the ESPP.
Stock-based Compensation Expense
|
For the year ended
|
2019
|
2018
|
2017
|
|||||||||
|
Stock-based compensation expense by caption
|
||||||||||||
|
Cost of goods sold
|
$
|
102
|
|
$
|
83
|
|
$
|
88
|
|
|||
|
Selling, general, and administrative
|
73
|
|
61
|
|
75
|
|
||||||
|
Research and development
|
68
|
|
54
|
|
52
|
|
||||||
|
$
|
243
|
|
$
|
198
|
|
$
|
215
|
|
||||
|
Stock-based compensation expense by type of award
|
||||||||||||
|
Restricted stock awards
|
$
|
178
|
|
$
|
140
|
|
$
|
144
|
|
|||
|
Stock options
|
33
|
|
55
|
|
71
|
|
||||||
|
ESPP
|
32
|
|
3
|
|
—
|
|
||||||
|
$
|
243
|
|
$
|
198
|
|
$
|
215
|
|
||||
The income tax benefit related to share-based compensation was
$66 million
,
$158 million
and
$97 million
for
2019
,
2018
and
2017
, respectively. The income tax benefits related to share-based compensation for the periods presented prior to the second quarter of 2018 were offset by an increase in the U.S. valuation allowance. Stock-based compensation expense of
$30 million
and
$19 million
was capitalized and remained in inventory as of
August 29, 2019
and
August 30, 2018
, respectively. As of
August 29, 2019
,
$439 million
of total unrecognized compensation costs for unvested awards, before the effect of any future forfeitures, was expected to be recognized through the
fourth quarter of 2023
, resulting in a weighted-average period of
1.3
years.
Employee Benefit Plans
We have employee retirement plans at our U.S. and international sites. Details of the more significant plans are discussed as follows:
Employee Savings Plan for U.S. Employees
We have a 401(k) retirement plan under which U.S. employees may contribute up to
75%
of their eligible pay, subject to Internal Revenue Service annual contribution limits, to various savings alternatives, none of which include direct investment in our stock. We match in cash eligible contributions from employees up to
5%
of the employee's annual eligible earnings. Contribution expense for the 401(k) plan was
$67 million
,
$61 million
, and
$52 million
in
2019
,
2018
, and
2017
, respectively.
73
Retirement Plans
We have pension plans in various countries available to local employees which are generally government mandated. As of
August 29, 2019
, the projected benefit obligations of our plans were
$206 million
and plan assets were
$195 million
. As of
August 30, 2018
, the projected benefit obligations of our plans were
$190 million
and plan assets were
$171 million
. Pension expense was not material for
2019
,
2018
, or
2017
.
Revenue and Contract Liabilities
Revenue by product type was as follows:
|
For the year ended
|
2019
|
2018
|
2017
|
|||||||||
|
DRAM
|
$
|
15,247
|
|
$
|
21,232
|
|
$
|
12,963
|
|
|||
|
NAND
(1)
|
6,946
|
|
7,897
|
|
6,585
|
|
||||||
|
Other (primarily 3D XPoint memory and NOR)
|
1,213
|
|
1,262
|
|
774
|
|
||||||
|
$
|
23,406
|
|
$
|
30,391
|
|
$
|
20,322
|
|
||||
|
(1)
|
MCP revenue is reported within NAND.
|
Our contract liabilities from customer advances are for advance payments received from customers to secure product in future periods. Other contract liabilities consist of amounts received in advance of satisfying performance obligations. These balances are reported within other current liabilities and other noncurrent liabilities. Revenue and interest expense associated with contract liabilities for the time value of advance payments was not material in any period presented. As of
August 29, 2019
, our future performance obligations beyond one year were not material. Contract liabilities were as follows:
|
As of
|
August 29,
2019 |
Opening Balance as of August 31, 2018
|
||||||
|
Contract liabilities from customer advances
|
$
|
61
|
|
$
|
235
|
|
||
|
Other contract liabilities
|
69
|
|
113
|
|
||||
|
$
|
130
|
|
$
|
348
|
|
|||
Revenue recognized during 2019 from the opening balance was
$273 million
, primarily from shipments against customer advances, which was partially offset by new customer advances.
As of
August 29, 2019
, other current liabilities included
$326 million
for estimates of consideration payable to customers, including estimates for pricing adjustments and returns.
Research and Development
We share the cost of certain product and process development activities with development partners. Our R&D expenses were reduced by
$60 million
,
$201 million
, and
$213 million
for
2019
,
2018
, and
2017
, respectively, pursuant to reimbursements under these arrangements.
We have had agreements to jointly develop NAND and 3D XPoint technologies with Intel. In 2018, we and Intel agreed to independently develop subsequent generations of 3D NAND and we substantially completed this cost-sharing arrangement in the third quarter of 2019. In 2018, we announced that we and Intel will no longer jointly develop 3D XPoint technology beyond the second generation and we substantially completed this cost-sharing arrangement in the first quarter of 2020.
74
Other Operating (Income) Expense, Net
|
For the year ended
|
2019
|
2018
|
2017
|
|||||||||
|
(Gain) loss on disposition of property, plant, and equipment
|
$
|
43
|
|
$
|
(96
|
)
|
$
|
(22
|
)
|
|||
|
Restructure and asset impairments
|
(29
|
)
|
28
|
|
18
|
|
||||||
|
Other
|
35
|
|
11
|
|
5
|
|
||||||
|
$
|
49
|
|
$
|
(57
|
)
|
$
|
1
|
|
||||
Restructure and asset impairments primarily relate to our continued emphasis to centralize certain key functions. In addition, in 2019, we finalized the sale of our 200mm fabrication facility in Singapore and recognized restructure gains of
$128 million
. In 2017, we recognized net restructure gains of
$15 million
related to the sale of our Lexar assets; our assets associated with our 200mm fabrication facility in Singapore; and our
40%
ownership interest in Tera Probe, Inc and assembly and test facility located in Akita, Japan.
Other Non-Operating Income (Expense), Net
|
For the year ended
|
2019
|
2018
|
2017
|
|||||||||
|
Loss on debt prepayments, repurchases, and conversions
|
$
|
(396
|
)
|
$
|
(385
|
)
|
$
|
(100
|
)
|
|||
|
Loss from changes in currency exchange rates
|
(9
|
)
|
(75
|
)
|
(74
|
)
|
||||||
|
Gain on remeasurement of previously-held equity interest in Inotera
|
—
|
|
—
|
|
71
|
|
||||||
|
Other
|
—
|
|
(5
|
)
|
(9
|
)
|
||||||
|
$
|
(405
|
)
|
$
|
(465
|
)
|
$
|
(112
|
)
|
||||
Income Taxes
On December 22, 2017, the United States enacted comprehensive tax legislation, commonly referred to as the Tax Cuts and Jobs Act (the "Tax Act"), which imposed a one-time transition tax in 2018 (the "Repatriation Tax") and, beginning in 2019, created a new minimum tax on certain foreign earnings (the "Foreign Minimum Tax"). In connection with the provisions of the Tax Act, we made an accounting policy election to treat the Foreign Minimum Tax provision as a period cost in the period the tax is incurred. SEC Staff Accounting Bulletin No. 118 ("SAB 118") allowed the use of provisional amounts (reasonable estimates) if the analyses of the impacts of the Tax Act had not been completed when financial statements were issued. During 2019, we finalized the computations of the income tax effects of the Tax Act. As such, in accordance with SAB 118, our accounting for the effects of the Tax Act is complete.
75
Our income tax (provision) benefit consisted of the following:
|
For the year ended
|
2019
|
2018
|
2017
|
|||||||||
|
Income (loss) before income taxes, net income (loss) attributable to noncontrolling interests, and equity in net income (loss) of equity method investees
|
||||||||||||
|
U.S.
|
$
|
(67
|
)
|
$
|
141
|
|
$
|
(56
|
)
|
|||
|
Foreign
|
7,115
|
|
14,166
|
|
5,252
|
|
||||||
|
|
$
|
7,048
|
|
$
|
14,307
|
|
$
|
5,196
|
|
|||
|
Income tax (provision) benefit
|
||||||||||||
|
Current
|
||||||||||||
|
U.S. federal
|
$
|
(36
|
)
|
$
|
(54
|
)
|
$
|
—
|
|
|||
|
State
|
(2
|
)
|
1
|
|
(1
|
)
|
||||||
|
Foreign
|
(319
|
)
|
(374
|
)
|
(152
|
)
|
||||||
|
|
(357
|
)
|
(427
|
)
|
(153
|
)
|
||||||
|
Deferred
|
||||||||||||
|
U.S. federal
|
(146
|
)
|
232
|
|
—
|
|
||||||
|
State
|
91
|
|
101
|
|
—
|
|
||||||
|
Foreign
|
(281
|
)
|
(74
|
)
|
39
|
|
||||||
|
(336
|
)
|
$
|
259
|
|
39
|
|
||||||
|
Income tax (provision) benefit
|
$
|
(693
|
)
|
$
|
(168
|
)
|
$
|
(114
|
)
|
|||
The table below reconciles our tax (provision) benefit based on the U.S. federal statutory rate to our effective rate:
|
For the year ended
|
2019
|
2018
|
2017
|
||||||||||||||||||
|
U.S. federal income tax (provision) benefit at statutory rate
|
$
|
(1,480
|
)
|
21.0
|
%
|
$
|
(3,677
|
)
|
25.7
|
%
|
$
|
(1,819
|
)
|
35.0
|
%
|
||||||
|
Foreign tax rate differential
|
993
|
|
(14.1
|
)%
|
2,606
|
|
(18.2
|
)%
|
1,600
|
|
(30.8
|
)%
|
|||||||||
|
U.S. tax on foreign operations
|
(327
|
)
|
4.6
|
%
|
(20
|
)
|
0.1
|
%
|
(37
|
)
|
0.7
|
%
|
|||||||||
|
Repatriation Tax related to the Tax Act
|
(10
|
)
|
0.1
|
%
|
(1,049
|
)
|
7.3
|
%
|
—
|
|
—
|
%
|
|||||||||
|
Remeasurement of deferred tax assets and liabilities related to the Tax Act
|
—
|
|
—
|
%
|
(179
|
)
|
1.3
|
%
|
—
|
|
—
|
%
|
|||||||||
|
Change in valuation allowance
|
(40
|
)
|
0.6
|
%
|
2,079
|
|
(14.5
|
)%
|
64
|
|
(1.2
|
)%
|
|||||||||
|
State taxes, net of federal benefit
|
102
|
|
(1.4
|
)%
|
(84
|
)
|
0.6
|
%
|
—
|
|
—
|
%
|
|||||||||
|
Research and development tax credits
|
118
|
|
(1.7
|
)%
|
90
|
|
(0.6
|
)%
|
66
|
|
(1.3
|
)%
|
|||||||||
|
Other
|
(49
|
)
|
0.7
|
%
|
66
|
|
(0.5
|
)%
|
12
|
|
(0.2
|
)%
|
|||||||||
|
Income tax (provision) benefit
|
$
|
(693
|
)
|
9.8
|
%
|
$
|
(168
|
)
|
1.2
|
%
|
$
|
(114
|
)
|
2.2
|
%
|
||||||
Measurement period adjustments in 2019 included
$47 million
of benefit for the Repatriation Tax, net of adjustments related to uncertain tax positions. Provisional estimates for 2018 in the table above included
$1.34 billion
of benefit for the release of the valuation allowance on the net deferred tax assets of our U.S. operations and
$1.03 billion
of provision for the Repatriation Tax, net of adjustments related to uncertain tax positions.
We operate in a number of jurisdictions outside the United States, including Singapore, where we have tax incentive arrangements, which expire in whole or in part at various dates through 2034, that are conditional, in part, upon meeting certain business operations and employment thresholds. The effect of tax incentive arrangements reduced our tax provision by
$756 million
(benefiting our diluted earnings per share by
$0.66
) for
2019
, by
$1.96 billion
(
$1.59
per diluted share) for
2018
, and by
$742 million
(
$0.64
per diluted share) for
2017
.
76
A provision has been recognized for deferred taxes on undistributed earnings of non-U.S. subsidiaries to the extent that dividend payments from such companies are expected to be subject to additional foreign withholding or state income tax. As of
August 29, 2019
, we had a deferred tax liability of
$10 million
associated with our undistributed earnings. Certain non-U.S. subsidiaries had cumulative undistributed earnings of
$2.84 billion
that were deemed to be indefinitely reinvested. Determination of the amount of unrecognized deferred tax liabilities related to investments in these foreign subsidiaries is not practicable.
Deferred income taxes reflect the net tax effects of temporary differences between the bases of assets and liabilities for financial reporting and income tax purposes as well as carryforwards. Deferred tax assets and liabilities consist of the following:
|
As of
|
2019
|
2018
|
||||||
|
Deferred tax assets
|
||||||||
|
Net operating loss and tax credit carryforwards
|
$
|
1,045
|
|
$
|
1,417
|
|
||
|
Accrued salaries, wages, and benefits
|
122
|
|
163
|
|
||||
|
Property, plant, and equipment
|
80
|
|
—
|
|
||||
|
Other
|
110
|
|
115
|
|
||||
|
Gross deferred tax assets
|
1,357
|
|
1,695
|
|
||||
|
Less valuation allowance
|
(277
|
)
|
(228
|
)
|
||||
|
Deferred tax assets, net of valuation allowance
|
1,080
|
|
1,467
|
|
||||
|
Deferred tax liabilities
|
||||||||
|
Product and process technology
|
(138
|
)
|
(62
|
)
|
||||
|
Property, plant, and equipment
|
—
|
|
(173
|
)
|
||||
|
Other
|
(109
|
)
|
(213
|
)
|
||||
|
Deferred tax liabilities
|
(247
|
)
|
(448
|
)
|
||||
|
Net deferred tax assets
|
$
|
833
|
|
$
|
1,019
|
|
||
|
Reported as
|
||||||||
|
Deferred tax assets
|
$
|
837
|
|
$
|
1,022
|
|
||
|
Deferred tax liabilities (included in other noncurrent liabilities)
|
(4
|
)
|
(3
|
)
|
||||
|
Net deferred tax assets
|
$
|
833
|
|
$
|
1,019
|
|
||
We assess positive and negative evidence for each jurisdiction to determine whether it is more likely than not that existing deferred tax assets will be realized. As of
August 29, 2019
, and
August 30, 2018
, we had a valuation allowance of
$277 million
and
$228 million
, respectively, against our net deferred tax assets, primarily related to net operating loss carryforwards in Japan. Changes in 2019 in the valuation allowance were due to adjustments based on management's assessment of tax credits and net operating losses that are more likely than not to be realized.
As of
August 29, 2019
, our federal, state, and foreign net operating loss carryforward amounts and expiration periods, as reported to tax authorities, were as follows:
|
Year of Expiration
|
U.S. Federal
|
State
|
Japan
|
Taiwan
|
Other Foreign
|
Total
|
||||||||||||||||||
|
2020 - 2024
|
$
|
—
|
|
$
|
48
|
|
$
|
969
|
|
$
|
309
|
|
$
|
4
|
|
$
|
1,330
|
|
||||||
|
2025 - 2029
|
—
|
|
404
|
|
524
|
|
4
|
|
12
|
|
944
|
|
||||||||||||
|
2030 - 2034
|
—
|
|
296
|
|
—
|
|
—
|
|
—
|
|
296
|
|
||||||||||||
|
2035 - 2039
|
5
|
|
72
|
|
—
|
|
—
|
|
—
|
|
77
|
|
||||||||||||
|
Indefinite
|
—
|
|
1
|
|
—
|
|
241
|
|
8
|
|
250
|
|
||||||||||||
|
$
|
5
|
|
$
|
821
|
|
$
|
1,493
|
|
$
|
554
|
|
$
|
24
|
|
$
|
2,897
|
|
|||||||
77
As of
August 29, 2019
, our federal and state tax credit carryforward amounts and expiration periods, as reported to tax authorities, were as follows:
|
Year of Tax Credit Expiration
|
U.S. Federal
|
State
|
Total
|
|||||||||
|
2020 - 2024
|
$
|
—
|
|
$
|
55
|
|
$
|
55
|
|
|||
|
2025 - 2029
|
—
|
|
58
|
|
58
|
|
||||||
|
2030 - 2034
|
3
|
|
113
|
|
116
|
|
||||||
|
2035 - 2039
|
350
|
|
4
|
|
354
|
|
||||||
|
Indefinite
|
—
|
|
75
|
|
75
|
|
||||||
|
$
|
353
|
|
$
|
305
|
|
$
|
658
|
|
||||
Below is a reconciliation of the beginning and ending amount of our unrecognized tax benefits:
|
For the year ended
|
2019
|
2018
|
2017
|
|||||||||
|
Beginning unrecognized tax benefits
|
$
|
261
|
|
$
|
327
|
|
$
|
304
|
|
|||
|
Increases related to tax positions from prior years
|
124
|
|
—
|
|
—
|
|
||||||
|
Increases related to tax positions taken in current year
|
44
|
|
68
|
|
15
|
|
||||||
|
Decreases related to tax positions from prior years
|
(46
|
)
|
(126
|
)
|
—
|
|
||||||
|
Settlements with tax authorities
|
—
|
|
(8
|
)
|
(47
|
)
|
||||||
|
Increases due to the Inotera Acquisition
|
—
|
|
—
|
|
54
|
|
||||||
|
Other
|
—
|
|
—
|
|
1
|
|
||||||
|
Ending unrecognized tax benefits
|
$
|
383
|
|
$
|
261
|
|
$
|
327
|
|
|||
As of
August 29, 2019
, gross unrecognized tax benefits were
$383 million
, substantially all of which would affect our effective tax rate in the future, if recognized. The amount accrued for interest and penalties related to uncertain tax positions was not material for any period presented. The resolution of tax audits or expiration of statute of limitations could also reduce our unrecognized tax benefits. Although the timing of final resolution is uncertain, the estimated potential reduction in our unrecognized tax benefits in the next
12
months would not be material.
We and our subsidiaries file income tax returns with the U.S. federal government, various U.S. states, and various foreign jurisdictions throughout the world. Our U.S. federal and state tax returns remain open to examination for 2015 through 2019. In addition, tax returns that remain open to examination in Japan range from the years 2013 to 2019 and in Singapore and Taiwan from 2014 to 2019. We believe that adequate amounts of taxes and related interest and penalties have been provided, and any adjustments as a result of examinations are not expected to materially adversely affect our business, results of operations, or financial condition.
Earnings Per Share
|
For the year ended
|
2019
|
2018
|
2017
|
|||||||||
|
Net income attributable to Micron – Basic
|
$
|
6,313
|
|
$
|
14,135
|
|
$
|
5,089
|
|
|||
|
Assumed conversion of debt
|
(12
|
)
|
—
|
|
—
|
|
||||||
|
Net income attributable to Micron – Diluted
|
$
|
6,301
|
|
$
|
14,135
|
|
$
|
5,089
|
|
|||
|
Weighted-average common shares outstanding – Basic
|
1,114
|
|
1,152
|
|
1,089
|
|
||||||
|
Dilutive effect of equity plans and convertible notes
|
29
|
|
77
|
|
65
|
|
||||||
|
Weighted-average common shares outstanding – Diluted
|
1,143
|
|
1,229
|
|
1,154
|
|
||||||
|
Earnings per share
|
||||||||||||
|
Basic
|
$
|
5.67
|
|
$
|
12.27
|
|
$
|
4.67
|
|
|||
|
Diluted
|
5.51
|
|
11.51
|
|
4.41
|
|
||||||
78
Listed below are the potential common shares, as of the end of the periods shown, that could dilute basic earnings per share in the future that were not included in the computation of diluted earnings per share because to do so would have been antidilutive:
|
For the year ended
|
2019
|
2018
|
2017
|
||||||
|
Equity plans
|
8
|
|
3
|
|
21
|
|
|||
|
Convertible notes
|
—
|
|
—
|
|
26
|
|
|||
Segment Information
Segment information reported herein is consistent with how it is reviewed and evaluated by our chief operating decision maker. We have the following
four
business units, which are our reportable segments:
Compute and Networking Business Unit ("CNBU")
:
Includes memory products sold into client, cloud server, enterprise, graphics, and networking markets.
Mobile Business Unit ("MBU")
:
Includes memory products sold into smartphone and other mobile-device markets.
Storage Business Unit ("SBU")
:
Includes SSDs and component-level solutions sold into enterprise and cloud, client, and consumer storage markets as well as other discrete storage products sold in component and wafer forms to the removable storage markets and sales of 3D XPoint memory.
Embedded Business Unit ("EBU")
:
Includes memory and storage products sold into automotive, industrial, and consumer markets.
Certain operating expenses directly associated with the activities of a specific segment are charged to that segment. Other indirect operating income and expenses are generally allocated to segments based on their respective percentage of cost of goods sold or forecasted wafer production. We do not identify or report internally our assets (other than goodwill) or capital expenditures by segment, nor do we allocate gains and losses from equity method investments, interest, other non-operating income or expense items, or taxes to segments. As of
August 29, 2019
and
August 30, 2018
, CNBU, MBU, SBU, and EBU had goodwill of
$832 million
,
$198 million
,
$101 million
, and
$97 million
, respectively.
79
|
For the year ended
|
2019
|
2018
|
2017
|
|||||||||
|
Revenue
|
||||||||||||
|
CNBU
|
$
|
9,968
|
|
$
|
15,252
|
|
$
|
8,624
|
|
|||
|
MBU
|
6,403
|
|
6,579
|
|
4,424
|
|
||||||
|
SBU
|
3,826
|
|
5,022
|
|
4,514
|
|
||||||
|
EBU
|
3,137
|
|
3,479
|
|
2,695
|
|
||||||
|
All Other
|
72
|
|
59
|
|
65
|
|
||||||
|
$
|
23,406
|
|
$
|
30,391
|
|
$
|
20,322
|
|
||||
|
Operating income (loss)
|
||||||||||||
|
CNBU
|
$
|
4,645
|
|
$
|
9,773
|
|
$
|
3,755
|
|
|||
|
MBU
|
2,606
|
|
3,033
|
|
927
|
|
||||||
|
SBU
|
(386
|
)
|
964
|
|
552
|
|
||||||
|
EBU
|
923
|
|
1,473
|
|
975
|
|
||||||
|
All Other
|
13
|
|
—
|
|
23
|
|
||||||
|
7,801
|
|
15,243
|
|
6,232
|
|
|||||||
|
Unallocated
|
||||||||||||
|
Stock-based compensation
|
(243
|
)
|
(198
|
)
|
(215
|
)
|
||||||
|
Employee severance
|
(116
|
)
|
—
|
|
—
|
|
||||||
|
Start-up and preproduction costs
|
(58
|
)
|
—
|
|
—
|
|
||||||
|
Restructure and asset impairments
|
32
|
|
(28
|
)
|
(18
|
)
|
||||||
|
Flow-through of Inotera inventory step up
|
—
|
|
—
|
|
(107
|
)
|
||||||
|
Other
|
(40
|
)
|
(23
|
)
|
(24
|
)
|
||||||
|
(425
|
)
|
(249
|
)
|
(364
|
)
|
|||||||
|
Operating income
|
$
|
7,376
|
|
|
$
|
14,994
|
|
$
|
5,868
|
|
||
Depreciation and amortization expense included in operating income was as follows:
|
For the year ended
|
2019
|
2018
|
2017
|
|||||||||
|
CNBU
|
$
|
1,833
|
|
$
|
1,755
|
|
$
|
1,344
|
|
|||
|
MBU
|
1,235
|
|
1,077
|
|
926
|
|
||||||
|
SBU
|
1,555
|
|
1,295
|
|
1,083
|
|
||||||
|
EBU
|
748
|
|
603
|
|
484
|
|
||||||
|
All Other
|
27
|
|
18
|
|
13
|
|
||||||
|
Unallocated
|
26
|
|
11
|
|
11
|
|
||||||
|
$
|
5,424
|
|
$
|
4,759
|
|
$
|
3,861
|
|
||||
Certain Concentrations
Markets with concentrations of revenue were approximately as follows:
|
For the year ended
|
2019
|
2018
|
2017
|
||||||
|
Mobile
|
25
|
%
|
20
|
%
|
20
|
%
|
|||
|
Client and graphics
|
20
|
%
|
25
|
%
|
20
|
%
|
|||
|
Enterprise and cloud server
|
20
|
%
|
25
|
%
|
15
|
%
|
|||
|
SSDs and other storage
|
15
|
%
|
15
|
%
|
20
|
%
|
|||
|
Automotive, industrial, and consumer
|
15
|
%
|
10
|
%
|
15
|
%
|
|||
80
Revenue from Huawei Technologies Co. Ltd. was
12%
of total revenue for 2019. Revenue from Kingston Technology Company, Inc. was
11%
of total revenue for
2019
and
10%
of total revenue for
2018
and
2017
. No other customer exceeded 10% of our total revenue. Our sales to Huawei were included in our MBU, CNBU, SBU, and EBU segments and our sales to Kingston were included in our CNBU, MBU, and SBU segments.
We generally have multiple sources of supply for our raw materials and production equipment; however, only a limited number of suppliers are capable of delivering certain raw materials and production equipment that meet our standards and, in some cases, materials or production equipment are provided by a single supplier.
Financial instruments that potentially subject us to concentrations of credit risk consist principally of cash, money market accounts, certificates of deposit, fixed-rate debt securities, trade receivables, share repurchase, capped call, and derivative contracts. We invest through high-credit-quality financial institutions and, by policy, generally limit the concentration of credit exposure by restricting investments with any single obligor and monitoring credit risk of bank counterparties on an ongoing basis. A concentration of credit risk may exist with respect to receivables of certain customers. We perform ongoing credit evaluations of customers worldwide and generally do not require collateral from our customers. Historically, we have not experienced material losses on receivables. A concentration of risk may also exist with respect to our foreign currency hedges as the number of counterparties to our hedges is limited and the notional amounts are relatively large. We seek to mitigate such risk by limiting our counterparties to major financial institutions and through entering into master netting arrangements. Capped call agreements expose us to credit risk to the extent the counterparties may be unable to meet the terms of the agreements. We seek to mitigate such risk by limiting our counterparties to major financial institutions and by spreading the risk across several major financial institutions. In addition, the potential risk of loss with any one counterparty resulting from this type of credit risk is monitored on an ongoing basis.
Geographic Information
Revenue based on the
geographic location of our customer's headquarters
was as follows:
|
For the year ended
|
2019
|
2018
|
2017
|
|||||||||
|
United States
|
$
|
12,451
|
|
$
|
17,116
|
|
$
|
11,359
|
|
|||
|
Mainland China (excluding Hong Kong)
|
3,595
|
|
3,607
|
|
1,539
|
|
||||||
|
Taiwan
|
2,703
|
|
3,918
|
|
2,892
|
|
||||||
|
Hong Kong
|
1,614
|
|
1,761
|
|
1,429
|
|
||||||
|
Other Asia Pacific
|
1,032
|
|
1,458
|
|
1,078
|
|
||||||
|
Japan
|
958
|
|
1,265
|
|
1,042
|
|
||||||
|
Other
|
1,053
|
|
1,266
|
|
983
|
|
||||||
|
$
|
23,406
|
|
$
|
30,391
|
|
$
|
20,322
|
|
||||
We ship our products to locations specified by our customers and, as a result, customers may have headquarters in one location with global supply chain and operations in other locations. Our customers may request we deliver products to countries where they own or operate production facilities or to countries where they utilize third-party subcontractors or warehouses. Based on the
ship-to locations specified by our customers
, revenue from sales into China (including Hong Kong) accounted for
53%
,
57%
, and
51%
of total revenue in 2019, 2018, and 2017, respectively; revenue from sales into Taiwan accounted for
13%
,
9%
, and
13%
of total revenue in 2019, 2018, and 2017, respectively; and revenue from sales into the United States accounted for
11%
,
12%
, and
14%
of total revenue in 2019, 2018, and 2017, respectively.
Net property, plant, and equipment by geographic area was as follows:
|
As of
|
2019
|
2018
|
||||||
|
Taiwan
|
$
|
9,397
|
|
$
|
7,640
|
|
||
|
Singapore
|
7,986
|
|
6,933
|
|
||||
|
Japan
|
5,202
|
|
3,451
|
|
||||
|
United States
|
5,048
|
|
5,113
|
|
||||
|
China
|
370
|
|
398
|
|
||||
|
Other
|
237
|
|
137
|
|
||||
|
$
|
28,240
|
|
$
|
23,672
|
|
|||
81
Quarterly Financial Information (Unaudited)
(in millions, except per share amounts)
|
2019
|
Fourth Quarter
|
Third Quarter
|
Second Quarter
|
First Quarter
|
||||||||||||
|
Revenue
|
$
|
4,870
|
|
$
|
4,788
|
|
$
|
5,835
|
|
$
|
7,913
|
|
||||
|
Gross margin
|
1,395
|
|
1,828
|
|
2,864
|
|
4,615
|
|
||||||||
|
Operating income
|
650
|
|
1,010
|
|
1,957
|
|
3,759
|
|
||||||||
|
Net income
|
586
|
|
851
|
|
1,625
|
|
3,296
|
|
||||||||
|
Net income attributable to Micron
|
561
|
|
840
|
|
1,619
|
|
3,293
|
|
||||||||
|
Earnings per share
|
||||||||||||||||
|
Basic
|
$
|
0.51
|
|
$
|
0.76
|
|
$
|
1.45
|
|
$
|
2.91
|
|
||||
|
Diluted
|
0.49
|
|
0.74
|
|
1.42
|
|
2.81
|
|
||||||||
|
2018
|
Fourth Quarter
|
Third Quarter
|
Second Quarter
|
First Quarter
|
||||||||||||
|
Revenue
|
$
|
8,440
|
|
$
|
7,797
|
|
$
|
7,351
|
|
$
|
6,803
|
|
||||
|
Gross margin
|
5,151
|
|
4,723
|
|
4,270
|
|
3,747
|
|
||||||||
|
Operating income
|
4,377
|
|
3,953
|
|
3,567
|
|
3,097
|
|
||||||||
|
Net income
|
4,326
|
|
3,823
|
|
3,311
|
|
2,678
|
|
||||||||
|
Net income attributable to Micron
|
4,325
|
|
3,823
|
|
3,309
|
|
2,678
|
|
||||||||
|
Earnings per share
|
|
|
|
|
|
|
|
|
||||||||
|
Basic
|
$
|
3.73
|
|
$
|
3.30
|
|
$
|
2.86
|
|
$
|
2.36
|
|
||||
|
Diluted
|
3.56
|
|
3.10
|
|
2.67
|
|
2.19
|
|
||||||||
82
Report of Independent Registered Public Accounting Firm
To the Shareholders and Board of Directors of Micron Technology, Inc.:
Opinions on the Financial Statements and Internal Control over Financial Reporting
We have audited the accompanying consolidated balance sheets of Micron Technology, Inc. and its subsidiaries (the "Company") as of August 29, 2019
and August 30, 2018,
and the related consolidated
statements of operations, comprehensive income, changes in equity and cash flows for each of the three years in the period ended August 29, 2019, including the related notes and schedule of valuation and qualifying accounts for each of the three years in the period ended August 29, 2019 as listed in the index appearing under Item 15(a)(2) (collectively referred to as the "consolidated financial statements").
We also have audited the Company's internal control over financial reporting as of August 29, 2019, based on criteria established in
Internal Control – Integrated Framework
(2013)
issued by the Committee of Sponsoring Organizations of the Treadway Commission (COSO).
In our opinion, the consolidated financial statements referred to above present fairly, in all material respects, the financial position of the Company as of August 29, 2019
and August 30, 2018
,
and the results of its operations and its cash flows for each of the three years in the period ended August 29, 2019
in conformity with accounting principles generally accepted in the United States of America. Also in our opinion, the Company maintained, in all material respects, effective internal control over financial reporting as of August 29, 2019, based on criteria established in
Internal Control – Integrated Framework
(2013)
issued by the COSO.
Basis for Opinions
The Company's management is responsible for these consolidated financial statements, for maintaining effective internal control over financial reporting, and for its assessment of the effectiveness of internal control over financial reporting, included in
Management's Report on Internal Control over Financial Reporting appearing under Item 9A. Our responsibility is to express opinions on the Company's consolidated financial statements and on the Company's internal control over financial reporting based on our audits. We are a public accounting firm registered with the Public Company Accounting Oversight Board (United States) (PCAOB) and are required to be independent with respect to the Company in accordance with the U.S. federal securities laws and the applicable rules and regulations of the Securities and Exchange Commission and the PCAOB.
We conducted our audits in accordance with the standards of the PCAOB. Those standards require that we plan and perform the audits to obtain reasonable assurance about whether the consolidated financial statements are free of material misstatement, whether due to error or fraud, and whether effective internal control over financial reporting was maintained in all material respects.
Our audits of the consolidated financial statements included performing procedures to assess the risks of material misstatement of the consolidated financial statements, whether due to error or fraud, and performing procedures that respond to those risks. Such procedures included examining, on a test basis, evidence regarding the amounts and disclosures in the consolidated financial statements. Our audits also included evaluating the accounting principles used and significant estimates made by management, as well as evaluating the overall presentation of the consolidated
financial statements. Our audit of internal control over financial reporting included obtaining an understanding of internal control over financial reporting, assessing the risk that a material weakness exists, and testing and evaluating the design and operating effectiveness of internal control based on the assessed risk. Our audits also included performing such other procedures as we considered necessary in the circumstances. We believe that our audits provide a reasonable basis for our opinions.
Definition and Limitations of Internal Control over Financial Reporting
A company's internal control over financial reporting is a process designed to provide reasonable assurance regarding the reliability of financial reporting and the preparation of financial statements for external purposes in accordance with generally accepted accounting principles. A company's internal control over financial reporting includes those policies and procedures that (i) pertain to the maintenance of records that, in reasonable detail, accurately and fairly reflect the transactions and dispositions of the assets of the company; (ii) provide reasonable assurance that transactions are recorded as necessary to permit preparation of financial statements in accordance with generally accepted accounting principles, and that receipts and expenditures of the company are being made only in accordance with authorizations of management and directors of the company; and (iii) provide reasonable assurance regarding prevention or timely detection of unauthorized acquisition, use, or disposition of the company's assets that could have a material effect on the financial statements.
83
Because of its inherent limitations, internal control over financial reporting may not prevent or detect misstatements. Also, projections of any evaluation of effectiveness to future periods are subject to the risk that controls may become inadequate because of changes in conditions, or that the degree of compliance with the policies or procedures may deteriorate.
Critical Audit Matters
The critical audit matter communicated below is a matter arising from the current period audit of the consolidated financial statements that was communicated or required to be communicated to the audit committee and that (i) relates to accounts or disclosures that are material to the consolidated financial statements and (ii) involved our especially challenging, subjective, or complex judgments. The communication of critical audit matters does not alter in any way our opinion on the consolidated financial statements, taken as a whole, and we are not, by communicating the critical audit matter below, providing a separate opinion on the critical audit matter or on the accounts or disclosures to which it relates.
Valuation of Inventories (Finished goods and Work in process)
As described in the Significant Accounting Policies and Inventories notes to the consolidated financial statements, determining the net realizable value of the Company's net inventories involves significant judgments, including projecting future average selling prices and future sales volumes. As of August 29, 2019, the Company had a net inventory balance for finished goods and work in process inventory totaling approximately $4.6 billion.
The principal considerations for our determination that performing procedures relating to the valuation of finished goods and work in process inventories is a critical audit matter are the valuation involved the application of significant judgment on the part of management, which in turn led to significant judgment, subjectivity and effort in performing our audit procedures over the reasonableness of the significant assumptions used to estimate net realizable value of its finished goods and work in process inventories, including future average selling prices and future sales volumes.
Addressing the matter involved performing procedures and evaluating audit evidence in connection with forming our overall opinion on the consolidated financial statements. These procedures included testing the effectiveness of controls relating to the Company's estimate of net realizable value of its finished goods and work in process inventories, significant assumptions, and data used to value its inventories. These procedures also included, among others, testing management's process for developing the net realizable value estimate of its finished goods and work in process inventories; evaluating the appropriateness of the Company's estimated net realizable value methodology; testing the completeness, accuracy, and relevance of underlying data used in the estimate of net realizable value of its finished goods and work in process inventories; and evaluating the reasonableness of management's assumptions, including future average selling prices and future sales volumes. Evaluating management's assumptions related to future average selling prices and future sales volumes involved evaluating whether the assumptions used by management were reasonable considering (i) current and past results, including recent sales, (ii) the consistency with external market, industry data and current contract prices, (iii) a comparison of the prior year estimates to actual results in the current year, and (iv) and whether these assumptions were consistent with evidence obtained in other areas of the audit.
/s/ PricewaterhouseCoopers LLP
San Jose, California
October 17, 2019
We have served as the Company's auditor since 1984.
84
ITEM 9. CHANGES IN AND DISAGREEMENTS WITH ACCOUNTANTS ON ACCOUNTING AND FINANCIAL DISCLOSURE
None.
ITEM 9A. CONTROLS AND PROCEDURES
An evaluation was carried out under the supervision and with the participation of our management, including our principal executive officer and principal financial officer, of the effectiveness of the design and operation of our disclosure controls and procedures (as defined in Rule 13a-15(e) and 15d-15(e) under the Securities Exchange Act of 1934) as of the end of the period covered by this report. Based upon that evaluation, the principal executive officer and principal financial officer concluded that those disclosure controls and procedures were effective to ensure that information required to be disclosed by us in the reports that we file or submit under the Exchange Act are recorded, processed, summarized, and reported within the time periods specified in the Commission's rules and forms and that such information is accumulated and communicated to our management, including the principal executive officer and principal financial officer, to allow timely decision regarding disclosure.
During the fourth quarter of
2019
, there were no changes in our internal control over financial reporting that have materially affected, or are reasonably likely to materially affect, our internal control over financial reporting.
Management's Report on Internal Control over Financial Reporting
Our management is responsible for establishing and maintaining adequate internal control over financial reporting. Internal control over financial reporting is a process designed to provide reasonable assurance regarding the reliability of financial reporting and the preparation of financial statements for external purposes in accordance with accounting principles generally accepted in the United States of America. Our internal control over financial reporting includes those policies and procedures that (i) pertain to the maintenance of records that in reasonable detail accurately reflect the transactions and dispositions of our assets; (ii) provide reasonable assurance that transactions are recorded as necessary to permit preparation of financial statements in accordance with generally accepted accounting principles, and that our receipts and expenditures are being made only in accordance with authorizations of our management and directors; and (iii) provide reasonable assurance regarding prevention or timely detection of unauthorized acquisition, use, or disposition of our assets that could have a material effect on our financial statements.
Because of its inherent limitations, internal control over financial reporting may not prevent or detect misstatements. Also, projections of any evaluation of effectiveness to future periods are subject to the risk that controls may become inadequate because of changes in conditions or that the degree of compliance with the policies or procedures may deteriorate.
Management conducted an evaluation of the effectiveness of our internal control over financial reporting based on the framework in Internal Control – Integrated Framework (2013) issued by the Committee of Sponsoring Organizations of the Treadway Commission. Based on this evaluation, management concluded that our internal control over financial reporting was effective as of
August 29, 2019
. The effectiveness of our internal control over financial reporting as of
August 29, 2019
has been audited by PricewaterhouseCoopers LLP, an independent registered public accounting firm, as stated in their report, which is included in Part II, Item 8, of this Form 10-K.
ITEM 9B. OTHER INFORMATION
None.
85
PART III
ITEM 10. DIRECTORS, EXECUTIVE OFFICERS, AND CORPORATE GOVERNANCE
ITEM 11. EXECUTIVE COMPENSATION
ITEM 12. SECURITY OWNERSHIP OF CERTAIN BENEFICIAL OWNERS AND MANAGEMENT AND RELATED STOCKHOLDER MATTERS
ITEM 13. CERTAIN RELATIONSHIPS AND RELATED TRANSACTIONS, AND DIRECTOR INDEPENDENCE
ITEM 14. PRINCIPAL ACCOUNTANT FEES AND SERVICES
Certain information concerning our executive officers is included under the caption, "Information About Our Directors and Executive Officers" in Part I, Item 1 of this report. Other information required by Items 10, 11, 12, 13, and 14 will be contained in our Proxy Statement which will be filed with the Securities and Exchange Commission within 120 days after
August 29, 2019
and is incorporated herein by reference.
86
PART IV
ITEM 15. EXHIBITS, FINANCIAL STATEMENT SCHEDULES
(a) The following documents are filed as part of this report:
|
1.
|
Financial Statements: See Index to Consolidated Financial Statements under Item 8.
|
|
2.
|
Financial Statement Schedule:
Schedule II – Valuation and Qualifying Accounts
Certain Financial Statement Schedules have been omitted since they are either not required, not applicable, or the information is otherwise included.
|
|
3.
|
Exhibits.
|
87
SCHEDULE II
VALUATION AND QUALIFYING ACCOUNTS
(in millions)
MICRON TECHNOLOGY, INC.
|
|
Balance at
Beginning of
Year
|
Charged
(Credited) to
Income Tax
Provision
|
Currency
Translation
and Charges
to Other
Accounts
|
Balance at
End of
Year
|
|||||||||||
|
Deferred Tax Asset Valuation Allowance
|
|
|
|
|
|
|
|
|
|||||||
|
Year ended August 29, 2019
|
$
|
228
|
|
$
|
40
|
|
$
|
9
|
|
$
|
277
|
|
|||
|
Year ended August 30, 2018
|
2,321
|
|
(2,079
|
)
|
(14
|
)
|
228
|
|
|||||||
|
Year ended August 31, 2017
|
2,107
|
|
(64
|
)
|
278
|
|
2,321
|
|
|||||||
Amounts charged to other accounts for the year ended August 31, 2017 includes
$325 million
as a result of the adoption of ASU 2016-09 –
Improvements to Employee Share-Based Payment Accounting
.
88
3. Exhibits.
|
Exhibit Number
|
Description of Exhibit
|
Filed Herewith
|
Form
|
Period Ending
|
Exhibit/ Appendix
|
Filing Date
|
|
2.1*
|
8-K/A
|
2.1
|
10/31/12
|
|||
|
2.2*
|
8-K
|
2.3
|
10/31/12
|
|||
|
2.3*
|
8-K
|
2.4
|
8/6/13
|
|||
|
2.4
|
8-K
|
2.5
|
8/6/13
|
|||
|
2.5
|
10-Q
|
3/3/16
|
2.6
|
4/8/16
|
||
|
3.1
|
8-K
|
99.2
|
1/26/15
|
|||
|
3.2
|
8-K
|
99.2
|
7/1/19
|
|||
|
4.1
|
8-K
|
4.3
|
4/18/12
|
|||
|
4.2
|
8-K
|
4.3
|
4/18/12
|
|||
|
4.3
|
8-K
|
4.3
|
2/12/13
|
|||
|
4.4
|
8-K
|
4.3
|
2/12/13
|
|||
|
4.5
|
8-K
|
4.1
|
7/29/14
|
|||
|
4.6
|
8-K
|
4.1
|
7/29/14
|
|||
|
4.7
|
8-K
|
4.1
|
7/22/16
|
|||
|
4.8
|
8-K
|
4.1
|
2/6/19
|
|||
|
4.9
|
8-K
|
4.2
|
2/6/19
|
|||
|
4.10
|
8-K
|
4.3
|
2/6/19
|
|||
|
4.11
|
8-K
|
4.4
|
2/6/19
|
|||
|
4.12
|
8-K
|
4.5
|
2/6/19
|
|||
|
4.13
|
8-K
|
4.2
|
7/12/19
|
|||
89
|
Exhibit Number
|
Description of Exhibit
|
Filed Herewith
|
Form
|
Period Ending
|
Exhibit/ Appendix
|
Filing Date
|
|
4.14
|
8-K
|
4.3
|
7/12/19
|
|||
|
4.15
|
8-K
|
4.4
|
7/12/19
|
|||
|
10.1
|
DEF 14A
|
B
|
12/7/17
|
|||
|
10.2
|
10-K
|
9/1/16
|
10.6
|
10/28/16
|
||
|
10.3
|
10-K
|
9/1/16
|
10.7
|
10/28/16
|
||
|
10.4
|
10-K
|
9/1/16
|
10.8
|
10/28/16
|
||
|
10.5
|
10-K
|
9/1/16
|
10.9
|
10/28/16
|
||
|
10.6
|
10-K
|
9/1/16
|
10.10
|
10/28/16
|
||
|
10.7
|
10-K
|
9/1/16
|
10.11
|
10/28/16
|
||
|
10.8*
|
10-Q
|
11/30/06
|
10.66
|
1/16/07
|
||
|
10.9
|
10-Q
|
2/27/14
|
10.3
|
4/7/14
|
||
|
10.10*
|
10-Q
|
12/1/05
|
10.155
|
1/10/06
|
||
|
10.11
|
8-K
|
99.2
|
11/1/07
|
|||
|
10.12
|
10-Q
|
12/4/08
|
10.70
|
1/13/09
|
||
|
10.13*
|
10-Q
|
3/1/12
|
10.104
|
4/9/12
|
||
|
10.14*
|
10-Q
|
5/31/12
|
10.108
|
7/9/12
|
||
|
10.15*
|
10-Q
|
5/31/12
|
10.109
|
7/9/12
|
||
|
10.16*
|
10-Q
|
5/31/12
|
10.110
|
7/9/12
|
||
|
10.17*
|
10-Q
|
5/31/12
|
10.111
|
7/9/12
|
||
|
10.18*
|
10-Q
|
5/31/12
|
10.112
|
7/9/12
|
||
|
10.19*
|
10-Q/A
|
2/28/13
|
10.126
|
8/7/13
|
||
|
10.20*
|
10-Q
|
2/28/13
|
10.127
|
4/8/13
|
||
90
|
Exhibit Number
|
Description of Exhibit
|
Filed Herewith
|
Form
|
Period Ending
|
Exhibit/ Appendix
|
Filing Date
|
|
10.21*
|
10-Q/A
|
2/28/13
|
10.128
|
8/7/13
|
||
|
10.22*
|
10-Q
|
2/28/13
|
10.129
|
4/8/13
|
||
|
10.23*
|
8-K/A
|
10.139
|
10/2/13
|
|||
|
10.24*
|
8-K
|
10.140
|
8/6/13
|
|||
|
10.25*
|
8-K/A
|
10.141
|
10/2/13
|
|||
|
10.26
|
8-K
|
10.1
|
2/12/13
|
|||
|
10.27*
|
10-Q
|
3/2/17
|
10.50
|
3/28/17
|
||
|
10.28*
|
10-Q/A
|
3/3/16
|
10.57
|
9/8/16
|
||
|
10.29
|
10-Q
|
3/3/16
|
10.59
|
4/8/16
|
||
|
10.30*
|
10-Q
|
6/2/16
|
10.61
|
7/6/16
|
||
|
10.31
|
10-Q
|
5/31/18
|
10.64
|
6/22/18
|
||
|
10.32
|
10-Q
|
6/1/17
|
10.67
|
6/30/17
|
||
|
10.33
|
10-Q
|
11/30/17
|
10.70
|
12/20/17
|
||
|
10.34
|
10-K
|
8/31/17
|
10.71
|
10/26/17
|
||
|
10.35
|
8-K
|
99.1
|
11/13/17
|
|||
|
10.36
|
10-Q
|
11/30/17
|
10.74
|
12/20/17
|
||
|
10.37
|
DEF 14A
|
A
|
12/7/17
|
|||
|
10.38
|
10-Q
|
3/1/18
|
10.76
|
3/23/18
|
||
|
10.39
|
10-K
|
8/30/18
|
10.68
|
10/15/18
|
||
|
10.40
|
10-K
|
8/30/18
|
10.69
|
10/15/18
|
||
91
|
Exhibit Number
|
Description of Exhibit
|
Filed Herewith
|
Form
|
Period Ending
|
Exhibit/ Appendix
|
Filing Date
|
|
10.41
|
10-Q
|
11/29/18
|
10.70
|
12/19/18
|
||
|
10.42
|
X
|
|||||
|
21.1
|
X
|
|||||
|
23.1
|
X
|
|||||
|
31.1
|
X
|
|||||
|
31.2
|
X
|
|||||
|
32.1
|
X
|
|||||
|
32.2
|
X
|
|||||
|
101.INS
|
XBRL Instance Document
|
X
|
||||
|
101.SCH
|
XBRL Taxonomy Extension Schema Document
|
X
|
||||
|
101.CAL
|
XBRL Taxonomy Extension Calculation Linkbase Document
|
X
|
||||
|
101.DEF
|
XBRL Taxonomy Extension Definition Linkbase Document
|
X
|
||||
|
101.LAB
|
XBRL Taxonomy Extension Label Linkbase Document
|
X
|
||||
|
101.PRE
|
XBRL Taxonomy Extension Presentation Linkbase Document
|
X
|
||||
* Portions of this exhibit have been omitted pursuant to a request for confidential treatment filed with the Commission.
ITEM 16. 10-K SUMMARY
None.
92
SIGNATURES
Pursuant to the requirements of Section 13 or 15(d) of the Securities Exchange Act of 1934, the Registrant has duly caused this report to be signed on its behalf by the undersigned, thereunto duly authorized.
|
|
Micron Technology, Inc.
|
||
|
Date
|
October 17, 2019
|
By:
|
/s/ David A. Zinsner
|
|
|
David A. Zinsner
Senior Vice President and Chief Financial Officer
|
||
|
(Principal Financial Officer)
|
|||
Pursuant to the requirements of the Securities Exchange Act of 1934, this Annual Report has been signed below by the following persons on behalf of the Registrant and in the capacities and on the dates indicated.
|
Signature
|
Title
|
Date
|
|
|
|
|
|
/s/ Sanjay Mehrotra
|
President and
|
October 17, 2019
|
|
(Sanjay Mehrotra)
|
Chief Executive Officer and
|
|
|
|
Director
|
|
|
(Principal Executive Officer)
|
||
|
/s/ David A. Zinsner
|
Senior Vice President and
|
October 17, 2019
|
|
(David A. Zinsner)
|
Chief Financial Officer
|
|
|
|
(Principal Financial Officer)
|
|
|
|
|
|
|
/s/ Paul Marosvari
|
Vice President and
|
October 17, 2019
|
|
(Paul Marosvari)
|
Chief Accounting Officer
|
|
|
|
(Principal Accounting Officer)
|
|
|
|
|
|
|
/s/ Robert L. Bailey
|
Director
|
October 17, 2019
|
|
(Robert L. Bailey)
|
|
|
|
/s/ Richard M. Beyer
|
Director
|
October 17, 2019
|
|
(Richard M. Beyer)
|
|
|
|
/s/ Patrick J. Byrne
|
Director
|
October 17, 2019
|
|
(Patrick J. Byrne)
|
|
|
|
/s/ Steve Gomo
|
Director
|
October 17, 2019
|
|
(Steve Gomo)
|
|
|
|
/s/ Mary Pat McCarthy
|
Director
|
October 17, 2019
|
|
(Mary Pat McCarthy)
|
|
|
|
|
|
|
|
/s/ Robert E. Switz
|
Chairman of the Board
|
October 17, 2019
|
|
(Robert E. Switz)
|
Director
|
|
|
/s/ MaryAnn Wright
|
Director
|
October 17, 2019
|
|
(MaryAnn Wright)
|
|
|
93
TABLE OF CONTENTS
Part IItem 1. BusinessItem 1A. Risk FactorsItem 1B. Unresolved Staff CommentsItem 2. PropertiesItem 3. Legal ProceedingsItem 4. Mine Safety DisclosuresPart IIItem 5. Market For Registrant's Common Equity, Related Stockholder Matters, and Issuer Purchases Of Equity SecuritiesItem 6. Selected Financial DataItem 7. Management's Discussion and Analysis Of Financial Condition and Results Of OperationsItem 7A. Quantitative and Qualitative Disclosures About Market RiskItem 8. Financial Statements and Supplementary DataItem 9. Changes in and Disagreements with Accountants on Accounting and Financial DisclosureItem 9A. Controls and ProceduresItem 9B. Other InformationPart IIIItem 10. Directors, Executive Officers, and Corporate GovernanceItem 11. Executive CompensationItem 12. Security Ownership Of Certain Beneficial Owners and Management and Related Stockholder MattersItem 13. Certain Relationships and Related Transactions, and Director IndependenceItem 14. Principal Accountant Fees and ServicesPart IVItem 15. Exhibits, Financial Statement SchedulesItem 16. 10-k Summary