Table of Contents
As filed with the Securities and Exchange Commission on July 18, 2014
UNITED STATES
SECURITIES AND EXCHANGE COMMISSION
WASHINGTON, D.C. 20549
FORM 20-F
¨ REGISTRATION STATEMENT PURSUANT TO SECTION 12(b) OR (g) OF
THE SECURITIES EXCHANGE ACT OF 1934
OR
x ANNUAL REPORT PURSUANT TO SECTION 13 OR 15(d) OF
THE SECURITIES EXCHANGE ACT OF 1934
For the fiscal year ended March 31, 2014
OR
¨ TRANSITION REPORT PURSUANT TO SECTION 13 OR 15(d) OF
THE SECURITIES EXCHANGE ACT OF 1934
For the transition period to
OR
¨ SHELL COMPANY REPORT PURSUANT TO SECTION 13 OR 15(d) OF
THE SECURITIES EXCHANGE ACT OF 1934
Date of event requiring this shell company report
Commission file number 000-54189
KABUSHIKI KAISHA MITSUBISHI UFJ FINANCIAL GROUP
(Exact name of Registrant as specified in its charter)
MITSUBISHI UFJ FINANCIAL GROUP, INC.
(Translation of Registrant’s name into English)
Japan
(Jurisdiction of incorporation or organization)
7-1, Marunouchi 2-chome
Chiyoda-ku, Tokyo 100-8330
Japan
(Address of principal executive offices)
Hiroshi Fukunaga, +81-3-3240-8111, +81-3-3240-7073, same address as above
(Name, Telephone, Facsimile number and Address of Company Contact Person)
Securities registered or to be registered pursuant to Section 12(b) of the Act:
|
Title of each class |
Name of each exchange on which registered | |
|
Common stock, without par value |
New York Stock Exchange (1) | |
|
American depositary shares, each of which represents one share of common stock |
New York Stock Exchange |
| (1) | The listing of the registrant’s common stock on the New York Stock Exchange is for technical purposes only and without trading privileges. |
Securities registered or to be registered pursuant to Section 12(g) of the Act: None
Securities for which there is a reporting obligation pursuant to Section 15(d) of the Act:
$2,300,000,000 Fixed/Floating Rate Non-Cumulative Preferred Securities of MUFG Capital Finance 1 Limited, and Mitsubishi UFJ Financial Group, Inc.’s Guarantee thereof
€750,000,000 Fixed/Floating Rate Non-Cumulative Preferred Securities of MUFG Capital Finance 2 Limited, and Mitsubishi UFJ Financial Group, Inc.’s Guarantee thereof
Restricted Share Units granting rights to common stock pursuant to the UnionBanCal Corporation Stock Bonus Plan and the Bank of Tokyo-Mitsubishi UFJ, Ltd. Headquarters for the Americas Stock Bonus Plan
Indicate the number of outstanding shares of each of the issuer’s classes of capital or common stock as of the close of the period covered by the annual report:
As of March 31, 2014, (1) 14,164,026,420 shares of common stock (including 3,389,416 shares of common stock held by the registrant and its consolidated subsidiaries as treasury stock) and (2) 1,000 shares of class 11 preferred stock. All of the outstanding class 11 preferred stock as of July 31, 2014 will be acquired mandatorily by the registrant on August 1, 2014.
Indicate by check mark if the registrant is a well-known seasoned issuer, as defined in Rule 405 of the Securities Act.
Yes x No ¨
If this report is an annual or transition report, indicate by check mark if the registrant is not required to file reports pursuant to Section 13 or 15(d) of the Securities Exchange Act of 1934.
Yes ¨ No x
Note—Checking the box above will not relieve any registrant required to file reports pursuant to Section 13 or 15(d) of the Securities Exchange Act of 1934 from their obligations under those Sections.
Indicate by check mark whether the registrant (1) has filed all reports required to be filed by Section 13 or 15(d) of the Securities Exchange Act of 1934 during the preceding 12 months (or for such shorter period that the registrant was required to file such reports), and (2) has been subject to such filing requirements for the past 90 days.
Yes x No ¨
Indicate by check mark whether the registrant has submitted electronically and posted on its corporate Web site, if any, every Interactive Data File required to be submitted and posted pursuant to Rule 405 of Regulation S-T (§232.405 of this chapter) during the preceding 12 months (or for such shorter period that the registrant was required to submit and post such files).
Yes x No ¨
Indicate by check mark whether the registrant is a large accelerated filer, an accelerated filer, or a non-accelerated filer. See definition of “accelerated filer and large accelerated filer” in Rule 12b-2 of the Exchange Act. (Check one):
|
Large accelerated filer x |
Accelerated filer ¨ | Non-accelerated filer ¨ |
Indicate by check mark which basis of accounting the registrant has used to prepare the financial statements included in this filing:
|
U.S. GAAP x |
International Financial Reporting Standards as issued
by the International Accounting Standards Board ¨ |
Other ¨ |
If “Other” has been checked in response to the previous question, indicate by check mark which financial statement item the registrant has elected to follow.
Item 17 ¨ Item 18 ¨
If this is an annual report, indicate by check mark whether the registrant is a shell company (as defined in Rule 12b-2 of the Exchange Act).
Yes ¨ No x
Table of Contents
For purposes of this Annual Report, we have presented our consolidated financial statements in accordance with accounting principles generally accepted in the United States, or U.S. GAAP, except for risk-adjusted capital ratios, business segment financial information and some other specifically identified information. Unless otherwise stated or the context otherwise requires, all amounts in our financial statements are expressed in Japanese yen.
When we refer in this Annual Report to “MUFG,” “we,” “us,” “our” and the “Group,” we generally mean Mitsubishi UFJ Financial Group, Inc. and its consolidated subsidiaries, but from time to time as the context requires, we mean Mitsubishi UFJ Financial Group, Inc. as an individual legal entity. Similarly, references to “MTFG” and “UFJ Holdings” are to Mitsubishi Tokyo Financial Group, Inc. and to UFJ Holdings, Inc., as single entities, respectively, as well as to MTFG and UFJ Holdings and their respective consolidated subsidiaries, as the context requires. Unless the context otherwise requires, references in this Annual Report to the financial results or business of the “MTFG group” and the “UFJ group” refer to those of MTFG and UFJ Holdings and their respective consolidated subsidiaries. In addition, our “commercial banking subsidiaries” refers to The Bank of Tokyo-Mitsubishi UFJ, Ltd., or “BTMU,” and, as the context requires, its consolidated subsidiaries engaged in the commercial banking business. Our “trust banking subsidiaries” refers to Mitsubishi UFJ Trust and Banking Corporation, or “MUTB,” and, as the context requires, its consolidated subsidiaries engaged in the trust banking business. Our “banking subsidiaries” refers to BTMU and MUTB and, as the context requires, their respective consolidated subsidiaries engaged in the banking business.
References to “MUAH” and “MUB” are to MUFG Americas Holdings Corporation and MUFG Union Bank, N.A., as single entities, respectively, as well as to MUAH and MUB and their respective consolidated
1
Table of Contents
subsidiaries, as the context requires. Effective July 1, 2014, we integrated BTMU’s operations in the Americas region with the operations of UnionBanCal Corporation, or “UNBC,” which is a wholly owned subsidiary of BTMU, and changed UNBC’s corporate name to “MUFG Americas Holdings Corporation.” Union Bank, N.A., which is MUAH’s principal subsidiary, was also renamed “MUFG Union Bank, N.A.,” effective the same day.
References in this Annual Report to “yen” or “¥” are to Japanese yen, references to “U.S. dollars,” “U.S. dollar,” “dollars,” “U.S.$” or “$” are to United States dollars, and references to “euro” or “€” are to the currency of the member states of the European Monetary Union. Our fiscal year ends on March 31 of each year. References to years not specified as being fiscal years are to calendar years.
We usually hold the ordinary general meeting of shareholders of Mitsubishi UFJ Financial Group, Inc. in June of each year in Tokyo.
2
Table of Contents
We may from time to time make written or oral forward-looking statements. Written forward-looking statements may appear in documents filed with or submitted to the U.S. Securities and Exchange Commission, or SEC, including this Annual Report, and other reports to shareholders and other communications.
The U.S. Private Securities Litigation Reform Act of 1995 provides a “safe harbor” for forward-looking information to encourage companies to provide prospective information about themselves. We rely on this safe harbor in making these forward-looking statements.
Forward-looking statements appear in a number of places in this Annual Report and include statements regarding our current intent, business plan, targets, belief or expectations or the current belief or current expectations of our management with respect to our results of operations and financial condition, including, among other matters, our problem loans and loan losses. In many, but not all cases, we use words such as “anticipate,” “aim,” “believe,” “estimate,” “expect,” “intend,” “plan,” “probability,” “risk,” “will,” “may” and similar expressions, as they relate to us or our management, to identify forward-looking statements. These statements reflect our current views with respect to future events and are subject to risks, uncertainties and assumptions. Should one or more of these risks or uncertainties materialize or should underlying assumptions prove incorrect, actual results may vary materially from those which are aimed, anticipated, believed, estimated, expected, intended or planned, or otherwise stated.
Our forward-looking statements are not guarantees of future performance and involve risks and uncertainties. Actual results may differ from those in the forward-looking statements as a result of various factors. We identify in this Annual Report in “Item 3.D. Key Information—Risk Factors,” “Item 4.B. Information on the Company—Business Overview,” “Item 5. Operating and Financial Review and Prospects” and elsewhere, some, but not necessarily all, of the important factors that could cause these differences.
We are under no obligation, and disclaim any obligation, to update or alter our forward-looking statements, whether as a result of new information, future events or otherwise.
3
Table of Contents
| Item 1. | Identity of Directors, Senior Management and Advisers. |
Not applicable.
| Item 2. | Offer Statistics and Expected Timetable. |
Not applicable.
| Item 3. | Key Information. |
| A. | Selected Financial Data |
The selected statement of income data and selected balance sheet data set forth below has been derived from our audited consolidated financial statements.
Except for risk-adjusted capital ratios, which are calculated in accordance with Japanese banking regulations based on information derived from our consolidated financial statements prepared in accordance with accounting principles generally accepted in Japan, or Japanese GAAP, the selected financial data set forth below are derived from our consolidated financial statements prepared in accordance with U.S. GAAP.
You should read the selected financial data set forth below in conjunction with “Item 5. Operating and Financial Review and Prospects,” “Selected Statistical Data” and our consolidated financial statements and other financial data included elsewhere in this Annual Report. These data are qualified in their entirety by reference to all of that information.
4
Table of Contents
| Fiscal years ended March 31, | ||||||||||||||||||||
| 2010 | 2011 | 2012 | 2013 | 2014 | ||||||||||||||||
| (in millions, except per share data and number of shares) | ||||||||||||||||||||
|
Statement of income data: |
||||||||||||||||||||
|
Interest income (1) |
¥ | 2,757,866 | ¥ | 2,550,144 | ¥ | 2,595,956 | ¥ | 2,427,521 | ¥ | 2,522,283 | ||||||||||
|
Interest expense |
774,400 | 670,673 | 640,139 | 556,418 | 560,972 | |||||||||||||||
|
|
|
|
|
|
|
|
|
|
|
|||||||||||
|
Net interest income |
1,983,466 | 1,879,471 | 1,955,817 | 1,871,103 | 1,961,311 | |||||||||||||||
|
Provision (credit) for credit losses |
647,793 | 292,035 | 223,809 | 144,542 | (106,371 | ) | ||||||||||||||
|
|
|
|
|
|
|
|
|
|
|
|||||||||||
|
Net interest income after provision (credit) for credit losses |
1,335,673 | 1,587,436 | 1,732,008 | 1,726,561 | 2,067,682 | |||||||||||||||
|
Non-interest income |
2,469,411 | 1,694,822 | 1,440,576 | 2,067,909 | 1,821,081 | |||||||||||||||
|
Non-interest expense |
2,508,060 | 2,460,446 | 2,322,642 | 2,378,599 | 2,468,320 | |||||||||||||||
|
|
|
|
|
|
|
|
|
|
|
|||||||||||
|
Income before income tax expense |
1,297,024 | 821,812 | 849,942 | 1,415,871 | 1,420,443 | |||||||||||||||
|
Income tax expense |
413,105 | 433,625 | 429,191 | 296,020 | 337,917 | |||||||||||||||
|
|
|
|
|
|
|
|
|
|
|
|||||||||||
|
Net income before attribution of noncontrolling interests |
883,919 | 388,187 | 420,751 | 1,119,851 | 1,082,526 | |||||||||||||||
|
Net income (loss) attributable to noncontrolling interests |
15,257 | (64,458 | ) | 4,520 | 50,727 | 67,133 | ||||||||||||||
|
|
|
|
|
|
|
|
|
|
|
|||||||||||
|
Net income attributable to Mitsubishi UFJ Financial Group |
¥ | 868,662 | ¥ | 452,645 | ¥ | 416,231 | ¥ | 1,069,124 | ¥ | 1,015,393 | ||||||||||
|
|
|
|
|
|
|
|
|
|
|
|||||||||||
|
Net income available to common shareholders of Mitsubishi UFJ Financial Group |
¥ | 846,984 | ¥ | 431,705 | ¥ | 398,291 | ¥ | 1,051,184 | ¥ | 994,152 | ||||||||||
|
|
|
|
|
|
|
|
|
|
|
|||||||||||
|
Amounts per share: |
||||||||||||||||||||
|
Basic earnings per common share—net income available to common shareholders of Mitsubishi UFJ Financial Group |
¥ | 68.72 | ¥ | 30.55 | ¥ | 28.17 | ¥ | 74.30 | ¥ | 70.21 | ||||||||||
|
Diluted earnings per common share—net income available to common shareholders of Mitsubishi UFJ Financial Group |
68.59 | 30.43 | 28.09 | 74.16 | 69.98 | |||||||||||||||
|
Number of shares used to calculate basic earnings per common share (in thousands) |
12,324,315 | 14,131,567 | 14,140,136 | 14,148,060 | 14,158,698 | |||||||||||||||
|
Number of shares used to calculate diluted earnings per common share (in thousands) (2) |
12,332,681 | 14,144,737 | 14,156,820 | 14,169,080 | 14,180,080 | |||||||||||||||
|
Cash dividends per share paid during the fiscal year: |
||||||||||||||||||||
|
—Common stock |
¥ | 11.00 | ¥ | 12.00 | ¥ | 12.00 | ¥ | 12.00 | ¥ | 14.00 | ||||||||||
| $ | 0.12 | $ | 0.14 | $ | 0.15 | $ | 0.15 | $ | 0.14 | |||||||||||
|
—Preferred stock (Class 3) |
¥ | 60.00 | ¥ | 30.00 | — | — | — | |||||||||||||
| $ | 0.65 | $ | 0.34 | — | — | — | ||||||||||||||
|
—Preferred stock (Class 5) (3) |
¥ | 100.50 | ¥ | 115.00 | ¥ | 115.00 | ¥ | 115.00 | ¥ | 115.00 | ||||||||||
| $ | 1.10 | $ | 1.33 | $ | 1.45 | $ | 1.42 | $ | 1.14 | |||||||||||
|
—Preferred stock (Class 11) |
¥ | 5.30 | ¥ | 5.30 | ¥ | 5.30 | ¥ | 5.30 | ¥ | 5.30 | ||||||||||
| $ | 0.06 | $ | 0.06 | $ | 0.07 | $ | 0.07 | $ | 0.05 | |||||||||||
| As of March 31, | ||||||||||||||||||||
| 2010 | 2011 | 2012 | 2013 | 2014 | ||||||||||||||||
| (in millions) | ||||||||||||||||||||
|
Balance sheet data: |
||||||||||||||||||||
|
Total assets |
¥ | 200,081,462 | ¥ | 202,850,243 | ¥ | 215,202,514 | ¥ | 230,559,276 | ¥ | 253,661,077 | ||||||||||
|
Loans, net of allowance for credit losses |
90,870,295 | 86,261,519 | 91,012,736 | 97,254,242 | 109,181,991 | |||||||||||||||
|
Total liabilities |
190,980,363 | 194,187,331 | 206,344,067 | 219,617,296 | 240,909,633 | |||||||||||||||
|
Deposits |
135,472,496 | 136,631,704 | 139,493,730 | 148,209,739 | 162,517,786 | |||||||||||||||
|
Long-term debt |
14,162,424 | 13,356,728 | 12,593,062 | 12,182,358 | 14,498,678 | |||||||||||||||
|
Total equity |
9,101,099 | 8,662,912 | 8,858,447 | 10,941,980 | 12,751,444 | |||||||||||||||
|
Capital stock—common stock |
1,643,238 | 1,644,132 | 1,645,144 | 1,646,035 | 1,647,145 | |||||||||||||||
5
Table of Contents
| Fiscal years ended March 31, | ||||||||||||||||||||
| 2010 | 2011 | 2012 | 2013 | 2014 | ||||||||||||||||
| (in millions, except percentages) | ||||||||||||||||||||
|
Other financial data: |
||||||||||||||||||||
|
Average balances: |
||||||||||||||||||||
|
Interest-earning assets |
¥ | 175,370,688 | ¥ | 180,260,385 | ¥ | 184,179,147 | ¥ | 193,824,256 | ¥ | 212,176,348 | ||||||||||
|
Interest-bearing liabilities |
158,156,363 | 161,344,664 | 165,420,569 | 173,399,441 | 189,413,309 | |||||||||||||||
|
Total assets |
195,571,703 | 204,781,984 | 211,835,389 | 225,682,785 | 247,729,744 | |||||||||||||||
|
Total equity |
7,871,505 | 8,987,129 | 8,594,310 | 9,244,530 | 10,683,098 | |||||||||||||||
|
Return on equity and assets: |
||||||||||||||||||||
|
Net income available to common shareholders as a percentage of total average assets |
0.43 | % | 0.21 | % | 0.19 | % | 0.47 | % | 0.40 | % | ||||||||||
|
Net income available to common shareholders as a percentage of total average equity |
10.76 | % | 4.80 | % | 4.63 | % | 11.37 | % | 9.31 | % | ||||||||||
|
Dividends per common share as a percentage of basic earnings per common share |
16.01 | % | 39.28 | % | 42.60 | % | 16.15 | % | 19.94 | % | ||||||||||
|
Total average equity as a percentage of total average assets |
4.02 | % | 4.39 | % | 4.06 | % | 4.10 | % | 4.31 | % | ||||||||||
|
Net interest income as a percentage of total average interest-earning assets |
1.13 | % | 1.04 | % | 1.06 | % | 0.97 | % | 0.92 | % | ||||||||||
|
Credit quality data: |
||||||||||||||||||||
|
Allowance for credit losses |
¥ | 1,315,615 | ¥ | 1,240,456 | ¥ | 1,285,507 | ¥ | 1,335,987 | ¥ | 1,094,420 | ||||||||||
|
Allowance for credit losses as a percentage of loans |
1.43 | % | 1.42 | % | 1.39 | % | 1.36 | % | 0.99 | % | ||||||||||
|
Impaired loans |
¥ | 1,825,852 | ¥ | 1,893,098 | ¥ | 2,031,868 | ¥ | 2,200,766 | ¥ | 1,861,027 | ||||||||||
|
Impaired loans as a percentage of loans |
1.98 | % | 2.16 | % | 2.20 | % | 2.23 | % | 1.69 | % | ||||||||||
|
Allowance for credit losses related to impaired loans as a percentage of impaired loans |
42.19 | % | 39.30 | % | 42.92 | % | 43.39 | % | 40.32 | % | ||||||||||
|
Net loan charge-offs |
¥ | 468,400 | ¥ | 342,100 | ¥ | 173,370 | ¥ | 112,862 | ¥ | 153,748 | ||||||||||
|
Net loan charge-offs as a percentage of average loans |
0.49 | % | 0.39 | % | 0.20 | % | 0.12 | % | 0.15 | % | ||||||||||
|
Average interest rate spread |
1.08 | % | 0.99 | % | 1.02 | % | 0.93 | % | 0.89 | % | ||||||||||
|
Risk-adjusted capital ratio calculated under Japanese GAAP (4) |
14.87 | % | 14.89 | % | 14.91 | % | 16.68 | % | 15.53 | % | ||||||||||
| Notes: |
| (1) | Interest income for the fiscal year ended March 31, 2012 includes a gain of ¥139,320 million on the conversion rate adjustment of Morgan Stanley’s convertible preferred stock. Exclusive of the one-time gain associated with the conversion, interest income would have been lower for the fiscal year ended March 31, 2012. |
| (2) | Includes the common shares potentially issuable upon conversion of the Class 11 Preferred Stock. |
| (3) | Preferred dividends were ¥57.5 per share semi-annually, except for the semi-annual period ended March 31, 2009 when preferred dividends were ¥43.0 per share. |
| (4) | Risk-adjusted capital ratios have been calculated in accordance with Japanese banking regulations as applicable on the relevant calculation date, based on information derived from our consolidated financial statements prepared in accordance with Japanese GAAP. For a description of the applicable capital ratio calculation and other requirements applicable, see “Item 4.B. Information on the Company—Business Overview—Supervision and Regulation—Japan—Capital adequacy” and “Item 5.B. Operating and Financial Review and Prospects—Liquidity and Capital Resources—Capital Adequacy.” |
6
Table of Contents
Exchange Rate Information
The tables below set forth, for each period indicated, certain information concerning the rate of exchange of Japanese yen per U.S. $1.00 based on exchange rate information found on Bloomberg. On July 7, 2014, the closing exchange rate was ¥101.86 to U.S.$1.00 and the inverse rate was U.S.$0.98 to ¥100.00.
| Year 2014 | ||||||||||||||||||||||||
| February | March | April | May | June | July (1) | |||||||||||||||||||
|
High |
¥ | 102.83 | ¥ | 103.76 | ¥ | 104.13 | ¥ | 103.02 | ¥ | 102.80 | ¥ | 102.27 | ||||||||||||
|
Low |
¥ | 100.76 | ¥ | 101.20 | ¥ | 101.33 | ¥ | 100.82 | ¥ | 101.24 | ¥ | 101.30 | ||||||||||||
| Note: |
| (1) | Period from July 1, 2014 to July 7, 2014. |
| Fiscal years ended March 31, | ||||||||||||||||||||
| 2010 | 2011 | 2012 | 2013 | 2014 | ||||||||||||||||
|
Average (of month-end rates) |
¥ | 92.51 | ¥ | 84.99 | ¥ | 78.90 | ¥ | 83.32 | ¥ | 100.38 | ||||||||||
| B. | Capitalization and Indebtedness |
Not applicable.
| C. | Reasons for the Offer and Use of Proceeds |
Not applicable.
| D. | Risk Factors |
Investing in our securities involves a high degree of risk. You should carefully consider the risks described in this section, which is intended to disclose all of the risks that we consider material based on the information currently available to us, as well as all the other information in this Annual Report, including our consolidated financial statements and related notes, “Item 5. Operating and Financial Review and Prospects,” “Item 11. Quantitative and Qualitative Disclosures about Credit, Market and Other Risk” and “Selected Statistical Data.”
Our business, operating results and financial condition could be materially and adversely affected by any of the factors discussed below. The trading price of our securities could decline due to any of these factors. This Annual Report also contains forward-looking statements that involve risks and uncertainties. Our actual results could differ materially from those anticipated in these forward-looking statements as a result of various factors, including the risks faced by us described in this section and elsewhere in this Annual Report. See “Forward-Looking Statements.”
Risks Related to Our Business
Because a large portion of our assets as well as our business operations are in Japan, we may incur losses if economic conditions in Japan worsen.
Our performance is particularly affected by the general economic conditions of Japan where we are headquartered and conduct a significant amount of our business. As of March 31, 2014, 62.6% of our total assets were related to Japanese domestic assets, including Japanese national government and Japanese government agency bonds, which accounted for 75.6% of our total investment securities portfolio and 16.5% of our total assets, respectively. Interest and non-interest income in Japan represented 71.6% of our total interest and non-interest income for the fiscal year ended March 31, 2014. Furthermore, as of March 31, 2014, our loans in Japan accounted for 64.0% of our total loans outstanding.
7
Table of Contents
Since December 2012, the Japanese government has put forth a series of policies, including emergency economic measures and a supplementary budget, expanded monetary easing, and a growth strategy. The Bank of Japan introduced quantitative and qualitative monetary easing in April 2013 in an effort to achieve an inflation target of two percent in two years. However, there is still significant uncertainty surrounding Japan’s economy. If these government policies prove ineffective, the growing debt burden of the Japanese government may adversely affect Japan’s economy. For example, if the prices of Japanese government bonds decrease, resulting in unexpectedly higher interest rates, our investment securities portfolio as well as our lending, borrowing, trading and other operations may be negatively impacted. In addition, under the legislation enacted by the Japanese Diet in August 2012, the consumption tax rate increased from 5% to 8% on April 1, 2014 and will increase further to 10% by October 2015, which may significantly weaken consumer spending in Japan. In recent periods, several credit rating agencies have downgraded the credit ratings of Japan’s sovereign debt, including a downgrade by Moody’s Japan K.K., or Moody’s, in August 2011 and a downgrade by Fitch Ratings Japan Limited, or Fitch, in May 2012. For a more detailed discussion of the risks related to increases in interest rates, see “—Risks Related to Our Business—Increases in interest rates could adversely affect the value of our bond portfolio.”
Instability in the Japanese stock market and foreign currency exchange rates may also have a significant adverse impact on our asset and liability management as well as our results of operations. Various other factors, including stagnation or deterioration of economic and market conditions in other countries, and growing global competition, may also have a material negative impact on the Japanese economy. For a detailed discussion on the business environment in Japan and abroad, see “Item 5. Operating and Financial Review and Prospects—Business Environment.”
Since our domestic loans in Japan accounted for a significant portion of our loan portfolio, deteriorating or stagnant economic conditions in Japan may cause adverse effects on our financial results, such as increases in credit costs, as the credit quality of some borrowers could deteriorate. For example, due to the intensifying global competition and weakening consumer spending in recent periods, some Japanese companies, including electronics manufacturers, have experienced significant financial difficulties. For a further discussion, see “—Risks Related to Our Business—We may suffer additional credit-related losses in the future if our borrowers are unable to repay their loans as expected or if the measures we take in reaction to, or in anticipation of, our borrowers’ deteriorating repayment abilities prove inappropriate or insufficient.”
If the global economy deteriorates further, our credit-related losses may increase, and the value of the financial instruments we hold may decrease, resulting in losses.
Global economic conditions remain volatile, and it is uncertain how the global economy will evolve over time. The shift in the monetary policy in the United States, slowing economic growth in China due to the deterioration of the Chinese financial market and other causes, and the political turmoil in various regions around world could negatively impact wider markets, including those of both emerging and developed countries. As of March 31, 2014, based principally on the domicile of the obligors, assets related to Europe accounted for approximately 8.8% of our total assets, assets related to Asia and Oceania excluding Japan accounted for approximately 8.8% of our total assets, and assets related to the United States accounted for approximately 16.0% of our total assets. If the global economy deteriorates or the global economic recovery significantly slows down again, the availability of credit may become limited, and some of our borrowers may default on their loan obligations to us, increasing our credit losses. In addition, concerns over the sovereign debt problem in some European countries may limit liquidity in the global financial markets. Some of our credit derivative transactions may also be negatively affected, including the protection we sold through single name credit default swaps, index and basket credit default swaps, and credit linked notes. The notional amounts of these protections sold as of March 31, 2014 were ¥2,692.1 billion, ¥773.8 billion and ¥4.5 billion, respectively. In addition, if credit market conditions worsen, our capital funding structure may need to be adjusted or our funding costs may increase, which could have a material adverse impact on our financial condition and results of operations.
8
Table of Contents
Furthermore, we have incurred losses, and may incur further losses, as a result of changes in the fair value of our financial instruments resulting from weakening market conditions. For example, declines in the fair value of our investment securities, particularly equity investment securities, resulted in our recording impairment losses of ¥195.7 billion, ¥124.2 billion and ¥6.5 billion for the fiscal years ended March 31, 2012, 2013 and 2014, respectively. As of March 31, 2014, approximately 36.7% of our total assets were financial instruments for which we measure fair value on a recurring basis, and less than 0.5% of our total assets were financial instruments for which we measure fair value on a non-recurring basis. Generally, in order to establish the fair value of these instruments, we rely on quoted prices. If the value of these financial instruments declines, a corresponding write-down may be recognized in our consolidated statements of income. In addition, because we hold a large amount of investment securities, short-term fluctuations in the value of our securities may trigger losses or exit costs for us to manage our risk. For more information on our valuation method for financial instruments, see “Item 5. Operating and Financial Review and Prospects—Critical Accounting Estimates.”
Our business operations are exposed to risks of natural disasters, terrorism and other disruptions caused by external events.
As a major financial institution incorporated in Japan and operating in major international financial markets, our business operations, ATMs and other information technology systems, personnel, and facilities and other physical assets are subject to the risks of earthquakes, typhoons, floods and other natural disasters, terrorism and other political and social conflicts, health epidemics, and other disruptions caused by external events, which are beyond our control. Our risk management policies and procedures may be insufficient to address these unanticipated risks, resulting in our inability to continue to operate a part or the whole of our business.
As with other Japanese companies, we are exposed to heightened risks of large-scale natural disasters, particularly earthquakes. Our redundancy and backup measures may not be sufficient to avoid a material disruption in our operations, and our contingency and business continuity plans may not address all eventualities that may occur in the event of a material disruption. For example, large-scale natural disasters such as the March 2011 Great East Japan Earthquake, which led to tsunamis, soil liquefaction and fires, as well as electricity power supply shortages and electricity power conservation measures resulting from the suspension of the operations of the nuclear power plants, could significantly disrupt our facilities and other operational infrastructures, including branches, offices, ATMs and information technology systems.
As a consequence of earthquakes and other events, we may be required to incur significant costs and expenses for remedial measures or compensation to customers or transaction counterparties for resulting losses. We may also suffer loss of business. In addition, earthquakes and other events may have various other significant adverse effects, including deterioration in economic conditions, declines in the business performance of our borrowers and decreases in stock prices, which may result in higher credit costs or impairment or valuation losses on the financial instruments we hold. These effects could materially and adversely affect our business, operating results and financial condition.
We may suffer additional credit-related losses in the future if our borrowers are unable to repay their loans as expected or if the measures we take in reaction to, or in anticipation of, our borrowers’ deteriorating repayment abilities prove inappropriate or insufficient.
When we lend money or commit to lend money, we incur credit risk which is the risk of losses if our borrowers do not repay their loans. We may incur significant credit losses or have to provide for a significant amount of additional allowance for credit losses if:
| Ÿ |
large borrowers become insolvent or must be restructured; |
| Ÿ |
domestic or global economic conditions, either generally or in particular industries in which large borrowers operate, deteriorate; |
9
Table of Contents
| Ÿ |
the value of the collateral we hold, such as real estate or securities, declines; or |
| Ÿ |
we are adversely affected by corporate credibility issues among our borrowers, to an extent that is worse than anticipated. |
As a percentage of total loans, impaired loans, which primarily include nonaccrual loans and troubled debt restructurings, or TDRs, ranged from 1.69% to 2.23% as of the five most recent fiscal year-ends. As of March 31, 2014, impaired loans were ¥1,861.0 billion, representing 1.69% of our total outstanding loans. If the economic conditions in Japan or other parts of the world to which we have significant credit risk exposure worsen, our problem loans and credit-related expenses may increase. An increase in problem loans and credit-related expenses would adversely affect our results of operations, weaken our financial condition and erode our capital base. For a discussion of our problem loans, see “Item 5.B. Operating and Financial Review and Prospects—Liquidity and Capital Resources—Financial Condition.”
We may provide additional loans, equity capital or other forms of support to troubled borrowers in order to facilitate their restructuring and revitalization efforts. We may also forbear from exercising some or all of our rights as a creditor against them, and we may forgive loans to them in conjunction with their debt restructurings. We may take these steps even when such steps might not be warranted from the perspective of our short-term or narrow economic interests or a technical analysis of our legal rights against those borrowers, in light of other factors such as our longer-term economic interests, and our commitment to support the Japanese economy. These practices may substantially increase our exposure to troubled borrowers and increase our losses. Credit losses may also increase if we elect, or are forced by economic or other considerations, to sell or write off our problem loans at a larger discount, in a larger amount or in a different time or manner, than we may otherwise want.
Although we, from time to time, enter into credit derivative transactions, including credit default swap contracts, to manage our credit risk exposure, such transactions may not provide the protection against credit defaults that we intended due to counterparty defaults or similar issues. The credit default swap contracts could also result in significant losses. As of March 31, 2014, the total notional amount of the protection we sold through single name credit default swaps, index and basket credit default swaps, and credit-linked notes was ¥3.46 trillion. In addition, negative changes in financial market conditions may restrict the availability and liquidity of credit default swaps. For more information on our credit derivative transactions, see Note 23 to our consolidated financial statements included elsewhere in this Annual Report.
Our loan losses could prove to be materially different from our estimates and could materially exceed our current allowance for credit losses, in which case we may need to provide for additional allowance for credit losses and may also record credit losses beyond our allowance. Our allowance for credit losses in our loan portfolio is based on evaluations of customers’ creditworthiness and the value of collateral we hold. Negative changes in economic conditions, government policies or our borrowers’ repayment abilities could require us to provide for additional allowance. For example, companies in the Japanese electronics manufacturing industry in particular have experienced significant declines in sales and financial difficulties due to increased global competition. Moreover, the Japanese electric utility companies, including The Tokyo Electric Power Company, Incorporated, have been significantly affected by the accidents at the Fukushima Daiichi Nuclear Power Plants in March 2011 and subsequent developments, including the suspension of all of the nuclear power plants for seismic safety inspections and other reasons, higher fuel prices in recent periods and compensation issues for affected individuals and companies. Other borrowers in Japan may be adversely affected by electricity power supply shortages and electricity rate increases. As a result, our borrowers may incur financial and non-financial losses that exceed our estimations. In such case, we may need to provide for additional allowance for credit losses. Also, the regulatory standards or guidance on establishing allowances may also change, causing us to change some of the evaluations used in determining the allowances. As a result, we may need to provide for additional allowance for credit losses. For a discussion of our allowance policy, see “Item 5.B. Operating and Financial Review and Prospects—Liquidity and Capital Resources—Financial Condition.”
10
Table of Contents
For the fiscal year ended March 31, 2014, we recorded ¥106.4 billion of credit for credit losses, which was included in our consolidated statements of income. When there is an improvement in asset quality, a credit for credit losses is recorded to reverse the allowance for credit losses to a level management deems appropriate. However, we have historically more often provided for credit losses rather than recording credit for credit losses, and in future periods we may need to recognize a provision for credit losses, which may have a significant negative effect on our results of operations.
If the Japanese stock market or other global markets decline in the future, we may incur losses on our securities portfolio and our capital ratios will be adversely affected.
A decline in Japanese stock prices could reduce the value of the Japanese domestic marketable equity securities that we hold, which accounted for 8.7% of our total investment securities portfolio, or 1.9% of our total assets, as of March 31, 2014. The Nikkei Stock Average, which is the average of 225 blue chip stocks listed on the Tokyo Stock Exchange, fluctuated throughout the fiscal year ended March 31, 2014 declining to the intra-day lowest price of ¥11,805.78 on April 2, 2013 and rising to the intra-day highest price of ¥16,320.22 on December 30, 2013. As of July 7, 2014, the closing price of the Nikkei Stock Average was ¥15,379.44. Recent fluctuations in the Nikkei Stock Average have reflected the volatility in the global economy and investor sentiment as investors continue to observe the changes in the economic and monetary policies mainly in Japan, the United States, the Eurozone and Asian countries. For example, in Japan, if the economic measures under the Japanese government’s “Abenomics” policy prove ineffective or result in adverse consequences, the Japanese stock market will likely be adversely affected. In addition, weakening or stagnant economic conditions in other regions may have a significant negative impact on Japanese companies, which in turn will cause their stock prices to decline. Concerns over the impact of geopolitical tensions and conflicts in various parts of the world on Japanese companies may also adversely affect stock prices in Japan. If stock market prices decline or do not improve, we may incur losses on our securities portfolio. Because we hold a large amount of Japanese domestic marketable equity securities, even short-term fluctuations in the value of our securities may trigger losses or exit costs for us to manage our risk. Declines in the Japanese stock market or other global markets may also materially and adversely affect our capital ratios and financial condition. For a detailed discussion of our holdings of marketable equity securities and the effect of market declines on our capital ratios, see “Item 5.B. Operating and Financial Review and Prospects—Liquidity and Capital Resources—Capital Adequacy” and “Selected Statistical Data—Investment Portfolio.”
Increases in interest rates could adversely affect the value of our bond portfolio.
The aggregate carrying amount of the Japanese government and corporate bonds and foreign bonds, including U.S. Treasury bonds, that we held as of March 31, 2014 was 17.5% of our total assets. In particular, the Japanese national government and Japanese government agency bonds accounted for 16.5% of our total assets as of March 31, 2014. For a detailed discussion of our bond portfolio, see “Selected Statistical Data—Investment Portfolio.”
The Bank of Japan has been maintaining a very low policy rate (uncollateralized overnight call rate) of 0.10% in an effort to lift the economy out of deflation. Short-term interest rates in Japan continue to decline because of the Bank of Japan’s so-called “quantitative and qualitative monetary easing” policy. As part of this policy, the Bank of Japan purchases up to ¥6.0 to ¥8.0 trillion of Japanese national government bonds each month. The central bank’s policies, however, may change, resulting in an interest rate increase. Separate from the central bank’s monetary policies, interest rates could also significantly increase in the event that Japanese government bonds decline in value due to such factors as a decline in confidence in the Japanese government’s fiscal administration, further issuances of government bonds in connection with emergency economic measures and concerns over excessive government intervention with the Bank of Japan, or in the event that interest rates on U.S. Treasury securities rise due to such factors as the tapering of quantitative easing in the United States if implemented earlier than expected. The yield on newly issued ten-year Japanese government bonds rose above 1% in May 2013 for the first time in a year. If relevant interest rates increase for these or other reasons,
11
Table of Contents
particularly if such increase is unexpected or sudden, we may incur significant losses on sales of, and valuation losses on, our bond portfolio. See “Item 5. Operating and Financial Review and Prospects—Business Environment.”
Fluctuations in foreign currency exchange rates may result in transaction losses on translation of monetary assets and liabilities denominated in foreign currencies as well as foreign currency translation losses with respect to our foreign subsidiaries and equity method investees.
Fluctuations in foreign currency exchange rates against the Japanese yen create transaction gains or losses on the translation into Japanese yen of monetary assets and liabilities denominated in foreign currencies. To the extent that our foreign currency-denominated assets and liabilities are not matched in the same currency or appropriately hedged, we could incur losses due to future foreign exchange rate fluctuations. During the fiscal year ended March 31, 2014, the average balance of our foreign interest-earning assets was ¥77.09 trillion and the average balance of our foreign interest-bearing liabilities was ¥47.54 trillion, representing 36.3% of our average total interest-earning assets and 25.1% of our average total interest-bearing liabilities during the same period. For the fiscal year ended March 31, 2014, net foreign exchange losses, which primarily include net transaction losses on the translation into Japanese yen of monetary assets and liabilities denominated in foreign currencies, net losses on currency derivative instruments entered into for trading purposes, and net gains on translation into Japanese yen of securities accounted for under the fair value option, were ¥61.8 billion, compared to ¥39.0 billion for the previous fiscal year. In addition, we may incur foreign currency translation losses with respect to our foreign subsidiaries and equity method investees due to fluctuations in foreign currency exchange rates. The average exchange rate for the fiscal year ended March 31, 2014 was ¥100.24 per U.S.$1.00, compared to ¥83.10 per U.S.$1.00 for the previous fiscal year. The change in the average exchange rate of the Japanese yen against the U.S. dollar and other foreign currencies had the effect of increasing total revenue by ¥285.2 billion, increasing net interest income by ¥171.0 billion and income before income tax expense by ¥115.4 billion, respectively, for the fiscal year ended March 31, 2014. Since the introduction of “Abenomics” in December 2012, the exchange rate between the Japanese yen and the U.S. dollar has been fluctuating with the Japanese yen depreciating from ¥92.57 to the U.S. dollar on April 2, 2013 to ¥105.44 to the U.S. dollar on January 2, 2014. As of July 7, 2014, the exchange rate was ¥101.86 to the U.S. dollar. For more information on foreign exchange gains and losses and foreign currency translation gains and losses, see “Item 5. Operating and Financial Review and Prospects—Business Environment” and “Item 5.A. Operating and Financial Review and Prospects—Operating Results.”
We may become subject to regulatory actions or other legal proceedings relating to our transactions or other aspects of our operations, which could result in significant financial losses, restrictions on our operations and damage to our reputation.
We conduct our business subject to ongoing regulation and associated regulatory and legal risks. Global financial institutions, including us, currently face heightened regulatory scrutiny as a result of the concerns developing in the global financial sector, and growing public pressure to demand even greater regulatory surveillance following several high-profile scandals and risk management failures in the financial industry. In the current regulatory environment, multiple government authorities with overlapping jurisdiction more frequently conduct investigations and take other regulatory actions in coordination with one another or separately on the same or related matters.
In December 2012, The Bank of Tokyo-Mitsubishi UFJ, Ltd., or BTMU, agreed to make an approximately $8.6 million payment to the Office of Foreign Assets Control, or OFAC, of the U.S. Department of the Treasury to settle potential civil liability for apparent violations of certain U.S. sanctions regulations from 2006 to 2007. In June 2013, BTMU entered into a consent agreement with the New York State Department of Financial Services, or DFS, to resolve issues relating to certain U.S. dollar payments that were routed through New York from 2002 to 2007. Under the terms of the agreement with DFS, BTMU made a civil monetary payment of $250 million to DFS and retained an independent consultant to conduct a compliance review of the relevant controls and related matters in BTMU’s current operations. BTMU continues to cooperate closely with all relevant regulators and is undertaking necessary actions.
12
Table of Contents
We have received requests and subpoenas for information from government agencies in some jurisdictions that are conducting investigations into past submissions made by panel members, including us, to the bodies that set various interbank benchmark rates. We are cooperating with these investigations and have been conducting an internal investigation among other things. In connection with these matters, we and other panel members have been named as defendants in a number of civil lawsuits, including putative class actions, in the United States. In June 2013, BTMU was censured by the Monetary Authority of Singapore for deficiencies in its governance, risk management and internal controls for its involvement in benchmark submissions and was directed, among other things, to adopt measures to address these deficiencies.
These developments or other similar matters may result in additional regulatory actions against us or agreements to make significant additional settlement payments. These developments or other similar matters may also expose us to substantial monetary damages, legal defense costs, criminal and civil liability, and restrictions on our business operations as well as damage to our reputation. The outcome of such matters, including the extent of the potential impact of any unfavorable outcome on our financial results, however, is inherently uncertain and difficult to predict. The extent of financial, human and other resources required to conduct any investigations or to implement any corrective or preventive measures is similarly uncertain and could be significant.
Legal and regulatory changes could have a negative impact on our business, financial condition and results of operations.
As a global financial services provider, our business is subject to ongoing changes in laws, regulations, policies, voluntary codes of practice and interpretations in Japan and other markets where we operate. Major global financial institutions currently face an increasingly stricter set of laws, regulations and standards as a result of the concerns enveloping the global financial sector. There is also growing political pressure to demand even greater internal compliance and risk management systems following several high-profile scandals and risk management failures in the financial industry. We may not be able to enhance our compliance risk management systems and programs, which, in some cases, are supported by third-party service providers, in a timely manner or as planned. Our risk management systems and programs may not be fully effective in preventing all violations of laws, regulations and rules.
Our failure or inability to comply fully with the stricter set of laws and regulations could lead to fines, public reprimands, damage to reputation, civil liability, enforced suspension of operations or, in extreme cases, withdrawal of authorization to operate, adversely affecting our business and results of operations. Legal or regulatory compliance failure may also adversely affect our ability to obtain regulatory approvals for future strategic initiatives. Furthermore, failure to take necessary corrective action, or the discovery of violations of laws in the process of further review of any of the matters mentioned above or in the process of implementing any corrective measures, could result in further regulatory action.
We could also be required to incur significant expenses to comply with new or revised regulations. For example, if we adopt a new information system infrastructure in the future, we may be required to incur significant additional costs for establishing and implementing effective internal controls, which may materially and adversely affect our financial condition and results of operations.
Future developments or changes in laws, regulations, policies, voluntary codes of practice and their effects are expected to require greater capital resources and significant management attention, and may require us to modify our business strategies and plans. For example, since March 31, 2013, Japanese banking institutions with international operations have become subject to stricter capital adequacy requirements adopted by the Financial Services Agency of Japan, an agency of the Cabinet Office, or the FSA, based in part on the international regulatory framework generally known as “Basel III.” For more information, see “—Risks Related to Our Business—We may not be able to maintain our capital ratios above minimum required levels, which could result in the suspension of some or all of our operations.” and “Item 4.B. Information on the Company—Business Overview—Supervision and Regulation—Japan.”
13
Table of Contents
Furthermore, regulatory reforms recently implemented, proposed and currently being debated in the United States may also significantly affect our business operations. For example, in February 2014, the Federal Reserve Board, or FRB, approved final rules strengthening supervision and regulation of large U.S. bank holding companies and foreign banking organizations, or FBOs. These final rules require a large FBO with $50 billion or more in U.S. combined assets excluding the assets held by its U.S. branches or agencies, such as us, to organize all of our U.S. bank and non-bank subsidiaries under a U.S. intermediate holding company that would be subject to U.S. capital requirements, capital stress testing, liquidity buffer requirements, and other enhanced prudential standards comparable to those applicable to top-tier U.S. bank holding companies of the same size. The rules will become effective in July 2016, and we continue to analyze the rules to assess its impact on our U.S. operations and overall governance structure. Significant resources and management attention may be required to ensure compliance with the rules. See “Item 4.B. Information on the Company—Business Overview—Supervision and Regulation—United States.”
Global financial regulatory reform measures may also have a significant impact on our business operations. For example, various international organizations, including the Financial Stability Board and the Basel Committee on Banking Supervision, are currently considering ways to address, among other things, issues including the “too big to fail” issue and the measurement of interest rate risk in the banking book. We intend to continue to monitor developments relating to global regulatory reforms.
Any adverse changes in the business of MUFG Americas Holdings Corporation, an indirect wholly-owned subsidiary in the United States, could significantly affect our results of operations.
MUFG Americas Holdings Corporation, or MUAH, which is an indirect wholly owned subsidiary in the United States formerly called UnionBanCal Corporation, or UNBC, has historically contributed to a significant portion of our net income. MUAH reported net income of $762 million, $628 million and $667 million for the fiscal years ended December 31, 2011, 2012 and 2013, respectively. Any adverse developments which could arise at MUAH may have a significant negative impact on our results of operations and financial condition. The risks relating to MUAH have increased as MUAH has been expanding its business through acquisitions of community banks and other financially-related businesses in the United States. If MUAH is unable to achieve the benefits expected from its business strategies, including its business expansion strategy through acquisitions of community banks and other financially-related businesses, we may suffer an adverse financial impact. For more information, see “Item 5. Operating and Financial Review and Prospects—Recent Developments.”
Other factors that have negatively affected, and could continue to negatively affect, MUAH’s results of operations include difficult economic conditions, such as a downturn in the real estate and housing industries in California and other states within the United States, the fiscal challenges being experienced by the U.S. federal and California state governments, substantial competition in the banking markets in California and other states within the United States and uncertainty over the U.S. economy, as well as fluctuating oil prices, negative trends in debt ratings, and interest rate uncertainties. Since the financial crisis in 2008 and 2009, the U.S. banking industry has operated in an extremely low interest rate environment as a result of the highly accommodative monetary policy of the FRB, which has placed downward pressure on the net interest margins of U.S. banks, including MUAH. To the extent this policy continues, negative pressure on the net interest margins of U.S. banks, including MUAH, can be expected.
Significant costs may arise from enterprise-wide compliance and risk management requirements, or failure to comply, with applicable laws and regulations, such as the U.S. Bank Secrecy Act and related amendments under the USA PATRIOT Act, and any adverse impact of the implementation of the Dodd-Frank Act. In addition, the FRB and other U.S. bank regulators have adopted final rules to implement the Basel III global regulatory framework for U.S. banks and bank holding companies which require higher quality of capital, as well as significantly revise the calculations for risk-weighted assets. The FRB has also adopted final rules to implement various enhanced prudential standards required by the Dodd-Frank Act for larger U.S. bank holding companies, such as MUAH. These standards require the larger bank holding companies to meet enhanced capital,
14
Table of Contents
liquidity and leverage standards. Further, the FRB has adopted final regulations applicable to FBOs operating in the United States, which require MUFG’s and BTMU’s U.S. operations, including those of MUAH, to be restructured and, subject to certain exceptions, conducted under a single U.S. intermediate holding company, or IHC, with its own capital and liquidity requirements. Any actions management may take in response to these proposed regulatory changes may involve the issuance of additional capital or other measures. For more information, see “Item 4.B. Information on the Company—Business Overview—Supervision and Regulation—United States.”
MUFG Union Bank, N.A., or MUB, which is the principal subsidiary of MUAH, and reportedly other financial institutions have been the targets of various denial-of-service or other cyberattacks as part of what appears to be a coordinated effort to disrupt the operations of financial institutions and potentially test their cybersecurity in advance of future and more advanced cyberattacks. These denial-of-service attacks may require substantial resources to defend against and affect customer satisfaction and behavior. Moreover, MUB’s information security measures may not be sufficient to defend against cyberattacks and other information security breaches, in which case the consequences could be significant in terms of financial, reputational and other losses. In addition, there have been increasing efforts to breach data security at financial institutions as well as other types of companies, such as large retailers, or with respect to financial transactions, including through the use of social engineering schemes such as “phishing.” Even if cyberattacks and similar tactics are not directed specifically at MUB, such attacks on other large institutions could disrupt the overall functioning of the U.S. or global financial system and undermine consumer confidence in banks generally to the detriment of other financial institutions, including MUB.
Any adverse changes in the business of Bank of Ayudhya, an indirect subsidiary in Thailand, could significantly affect our results of operations.
Any adverse changes to the business or management of Bank of Ayudhya Public Company Limited, or Krungsri, in Thailand, which became one of our major subsidiaries in December 2013 following our acquisition of 72.01% of its total outstanding shares through a Voluntary Tender Offer for ¥545.8 billion, may negatively affect our financial condition and results of operations. Factors that may negatively affect Krungsri’s financial condition and results of operations include:
| Ÿ |
volatile political and social conditions, adverse economic conditions, substantial competition in the banking industry, natural disasters including floods, terrorism and armed conflicts, restrictions under applicable financial systems and regulations, or significant fluctuations in interest rates, currency exchange rates, stock prices or commodity prices, in Southeast Asia, particularly in Thailand, |
| Ÿ |
the business performance of companies making investments in and entering into markets in the Southeast Asian region, as well as the conditions of economies, financial systems, laws and financial markets in the countries where such companies primarily operate, |
| Ÿ |
losses from legal proceedings involving Krungsri, |
| Ÿ |
credit rating downgrades and declines in stock prices of Krungsri’s borrowers, and bankruptcies of Krungsri’s borrowers resulting from such factors, |
| Ÿ |
defaults on Krungsri’s loans to individuals, |
| Ÿ |
adverse changes in the cooperative relationship between us and the other major shareholder of Krungsri, |
| Ÿ |
higher-than-expected costs incurred as we integrate Krungsri into our group, and |
| Ÿ |
costs incurred due to unexpected weaknesses in the internal controls and regulatory compliance systems of Krungsri or any of its subsidiaries. |
In connection with our acquisition of Krungsri, we recorded ¥217.4 billion of goodwill. If the business of Krungsri deteriorates, we may be required to record impairment losses, which could have a material adverse
15
Table of Contents
effect on our results of operations and financial condition. See “Item 5. Operating and Financial Review and Prospects—Recent Developments” and “—Risks Related to Our Business—If the goodwill recorded in connection with our acquisitions becomes impaired, we may be required to record impairment losses, which may adversely affect our financial results and the price of our securities.”
Our strategy to expand the range of our financial products and services and the geographic scope of our business globally may fail if we are unable to anticipate or manage new or expanded risks that entail such expansion.
We continue to seek opportunities to expand the range of our products and services beyond our traditional banking and trust businesses, through development and introduction of new products and services or through acquisitions of or investments in financial institutions with products and services that complement our business. For example, taking advantage of our financial holding company status which enables us to underwrite securities, we are currently seeking to expand our corporate banking operations in the United States. In addition, the sophistication of financial products and management systems has been growing significantly in recent years. As a result, we are exposed to new and increasingly complex risks, while market and regulatory expectations that we manage these risk properly continue to rise. Some of the activities that our subsidiaries are expected to engage in, such as derivatives and foreign currency trading, present substantial risks. In some cases, we have only limited experience with the risks related to the expanded range of these products and services. In addition, we may not be able to successfully develop or operate the necessary information systems. As a result, we may not be able to foresee the risks relating to new products and services.
As we expand the geographic scope of our business, we will also be exposed to risks that are unique to particular jurisdictions or markets. For example, in an effort to further develop our operations in Asia, BTMU entered into a capital and business alliance with Vietnam Joint Stock Commercial Bank for Industry and Trade in December 2012 and acquired approximately 20% of the ordinary shares of the Vietnamese bank in May 2013. In addition, in December 2013, BTMU purchased 72.01% of the outstanding shares of Krungsri. In some cases, we hold minority stakes in financial institutions as we seek to enter new markets or jurisdictions by collaborating with a local business partner. In such circumstances, the controlling shareholder may make or cause to be made business decisions that are inconsistent with our interests and, as a result, we may be unable to achieve the goals initially set out for the expansion strategy.
Our risk management systems may prove to be inadequate and may not work in all cases or to the degree required. The substantial market, credit, compliance and regulatory risks in relation to the expanding scope of our products, services and trading activities or expanding our business beyond our traditional markets, could result in us incurring substantial losses. In addition, our efforts to offer new services and products or penetrate new markets may not succeed if product or market opportunities develop more slowly than expected, if our new services or products are not well accepted among customers, or if the profitability of opportunities is undermined by competitive pressures. For more information on our recent acquisition transactions, see “Item 5. Operating and Financial Review and Prospects—Recent Developments.”
Unanticipated economic changes in, and measures taken in response to such changes by, emerging market countries could result in additional losses.
We are increasingly active, through a network of branches and subsidiaries, in emerging market countries, particularly countries in Asia, Latin America, Central and Eastern Europe, and the Middle East. For example, based principally on the domicile of the obligors, assets related to Asia and Oceania excluding Japan increased 40.0% from ¥15.94 trillion as of March 31, 2013 to ¥22.31 trillion as of March 31, 2014, accounting for 8.8% of our total assets as of March 31, 2014. The economies of emerging market countries can be volatile and susceptible to adverse changes and trends in the global financial markets. For example, a decline in the value of local currencies of these countries could negatively affect the creditworthiness of some of our borrowers in these countries. The loans we have made to borrowers and banks in these countries are often denominated in
16
Table of Contents
U.S. dollars, Euro or other foreign currencies. These borrowers often do not hedge the loans to protect against fluctuations in the values of local currencies. A devaluation of the local currency would make it more difficult for a borrower earning income in that currency to pay its debts to us and other foreign lenders. In addition, some countries in which we operate may attempt to support the value of their currencies by raising domestic interest rates. If this happens, the borrowers in these countries would have to devote more of their resources to repaying their domestic obligations, which may adversely affect their ability to repay their debts to us and other foreign lenders. The limited credit availability resulting from these conditions may adversely affect economic conditions in some countries. This could cause a further deterioration of the credit quality of borrowers and banks in those countries and cause us to incur further losses. In addition, should there be excessively rapid economic growth and increasing inflationary pressure in some of the emerging market countries, such developments could adversely affect the wider regional and global economies. Some emerging market countries may also change their monetary or other economic policies in response to economic and political instabilities or pressures, which are difficult to predict. As of March 31, 2014, based on the domicile of the obligors, our assets in Europe, Asia and Oceania excluding Japan, and other areas excluding Japan and the United States, were ¥22.35 trillion, ¥22.31 trillion and ¥9.56 trillion, representing 8.8%, 8.8% and 3.8% of our total assets, respectively. See “Item 5.B. Operating and Financial Review and Prospects—Liquidity and Capital Resources—Financial Condition.”
If our strategic alliance with Morgan Stanley fails, we could suffer financial or reputational loss.
We have a global strategic alliance with Morgan Stanley, under which we operate two joint venture securities companies in Japan, engage in joint corporate finance operations in the United States and pursue other cooperative opportunities. We hold approximately 21.9% of the voting rights in Morgan Stanley as of March 31, 2014 and continue to hold approximately $521.4 million, or ¥ 53.6 billion, of perpetual non-cumulative non-convertible preferred stock with a 10% dividend. In addition, we currently have two representatives on Morgan Stanley’s board of directors.
We initially entered into this strategic alliance in October 2008 with a view towards long-term cooperation with Morgan Stanley, and currently plan to deepen the strategic alliance. However, due to any unexpected changes in social, economic or financial conditions, changes in the regulatory environment, or any failure to integrate or share staff, products or services, or to operate, manage or implement the business strategy of the securities joint venture companies or other cooperative opportunities as planned, we may be unable to achieve the expected synergies from this alliance.
If our strategic alliance with Morgan Stanley is terminated, it could have a material negative impact on our business strategy, financial condition, and results of operations. For example, because we conduct our securities operations in Japan through the joint venture companies we have with Morgan Stanley, such termination may result in our inability to attain the planned growth in this line of business.
In addition, with our current investment in Morgan Stanley, we have neither a controlling interest in, nor control over the business operations of Morgan Stanley. If Morgan Stanley makes any business decisions that are inconsistent with our interests, we may be unable to achieve the goals initially set out for the strategic alliance. Furthermore, although we do not control Morgan Stanley, given the magnitude of our investment, if Morgan Stanley encounters financial or other business difficulties due to adverse changes in the economy, regulatory environment or other factors, we may suffer a financial loss on our investment or damage to our reputation. For example, we recorded an impairment loss of ¥579.5 billion on our investment in Morgan Stanley’s common stock for the fiscal year ended March 31, 2012.
In the fiscal year ended March 31, 2012, Morgan Stanley became an equity-method affiliate in our consolidated financial statements. Accordingly, Morgan Stanley’s performance has a more significant impact on our results of operations as a result of equity method accounting. Further, fluctuations in Morgan Stanley’s stock price or in our equity ownership interest in Morgan Stanley may cause us to recognize additional losses on our investment in Morgan Stanley.
17
Table of Contents
We may incur further losses as a result of financial difficulties relating to other financial institutions, both directly and through the effect they may have on the overall banking environment and on their borrowers.
Some domestic and foreign financial institutions, including banks, non-bank lending and credit institutions, securities companies and insurance companies, have experienced declining asset quality, capital adequacy and other financial problems. This may lead to severe liquidity and solvency problems, which have in the past resulted in the liquidation, government control or restructuring of affected institutions. In addition, allegations or governmental prosecution of improper trading activities or inappropriate business conduct of a specific financial institution could also negatively affect the public perception of other global financial institutions individually and the global financial industry as a whole. These developments may adversely affect our financial results.
Financial difficulties relating to financial institutions could adversely affect us because we have extended loans, some of which may need to be classified as impaired loans, to banks, securities companies, insurance companies and other financial institutions that are not our consolidated subsidiaries. Our loans to banks and other financial institutions have been more than 5% of our total loans as of each year-end in the three fiscal years ended March 31, 2014, with the percentage increasing from 11.0% to 12.5% between March 31, 2013 and March 31, 2014. We may also be adversely affected because we are a shareholder of some other banks and financial institutions that are not our consolidated subsidiaries, including our shareholdings in Japanese regional banks and our 21.9% voting interest in Morgan Stanley as of March 31, 2014. If some of the financial institutions to which we have exposure experience financial difficulties, we may need to provide financial support to them even when such support might not be warranted from the perspective of our narrow economic interests because such institutions may be systematically important to the Japanese or global financial system.
We may also be adversely affected because we enter into transactions, such as derivative transactions, in the ordinary course of business, with other banks and financial institutions as counterparties. For example, we enter into credit derivatives with banks, broker-dealers, insurance companies and other financial institutions for managing credit risk exposures, for facilitating client transactions, and for proprietary trading purposes. The notional amount of the protection we sold through these instruments was ¥3.46 trillion as of March 31, 2014.
In addition, financial difficulties relating to financial institutions could indirectly have an adverse effect on us because:
| Ÿ |
we may be requested to participate in providing assistance to support distressed financial institutions that are not our consolidated subsidiaries; |
| Ÿ |
the government may elect to provide regulatory, tax, funding or other benefits to those financial institutions to strengthen their capital, facilitate their sale or otherwise, which in turn may increase their competitiveness against us; |
| Ÿ |
deposit insurance premiums could rise if deposit insurance funds prove to be inadequate; |
| Ÿ |
bankruptcies or government support or control of financial institutions could generally undermine confidence in financial institutions or adversely affect the overall banking environment; |
| Ÿ |
failures or financial difficulties experienced by other financial institutions could result in additional regulations or requirements that increase the cost of business for us; and |
| Ÿ |
negative media coverage of the financial industry, regardless of its accuracy and applicability to us, could affect customer or investor sentiment, harm our reputation and have a materially adverse effect on our business or the price of our securities. |
Because of our loans to consumers and our shareholdings in companies engaged in consumer lending, changes in the business or regulatory environment for consumer finance companies in Japan may further adversely affect our financial results.
We have a large loan portfolio in the consumer lending industry as well as large shareholdings in subsidiaries and equity method investees in the consumer finance industry. Our domestic loans to consumers
18
Table of Contents
amount to approximately one-seventh of our total outstanding loans. Of this amount, the consumer loans provided by Mitsubishi UFJ NICOS, Co., Ltd., which is our primary consumer financing subsidiary, were ¥608.6 billion as of March 31, 2014, compared to ¥671.6 billion as of March 31, 2013.
Mitsubishi UFJ NICOS’s consumer loan portfolio has been adversely affected by a series of regulatory reforms recently implemented in Japan, which has affected the consumer lending industry in recent years. In December 2006, the Diet passed legislation to reform the regulations relating to the consumer lending business, including amendments to the Act Regulating the Receipt of Contributions, the Receipt of Deposits, and Interest Rates, which, effective June 18, 2010, reduced the maximum permissible interest rate from 29.2% per annum to 20% per annum. The regulatory reforms also included amendments to the Money Lending Business Act, which, effective June 18, 2010, abolished the so-called “gray-zone interest.” Gray-zone interest refers to interest rates exceeding the limits stipulated by the Interest Rate Restriction Act (between 15% per annum to 20% per annum depending on the amount of principal). Prior to June 18, 2010, gray-zone interest was permitted under certain conditions set forth in the Money Lending Business Act. As a result of the regulatory reforms, all interest rates are now subject to the lower limits imposed by the Interest Rate Restriction Act, compelling lending institutions, including our consumer finance subsidiaries and equity method investees, to lower the interest rates they charge borrowers. The regulations that became effective on June 18, 2010 also have had a further negative impact on the business of consumer finance companies as one of the new regulations requires, among other things, consumer finance companies to limit their lending to a single customer to a maximum of one third of the customer’s annual income regardless of the customer’s repayment capability, significantly affecting consumer financing companies.
The regulations and regulatory reforms affecting the consumer finance business were one of the main factors that contributed to the decrease in interest income attributable to our consumer finance business. Our interest income attributable to the consumer finance business was approximately ¥190 billion and ¥160 billion for the fiscal years ended March 31, 2009 and 2010, respectively. However, following the regulatory changes in June 2010, our interest income attributable to the consumer finance business decreased to approximately ¥130 billion, ¥120 billion and ¥100 billion for the fiscal years ended March 31, 2011, 2012 and 2013, respectively. For the fiscal year ended March 31, 2014, our interest income attributable to the consumer finance business was approximately ¥100 billion.
In addition, as a result of decisions by the Supreme Court of Japan prior to June 18, 2010 imposing stringent requirements under the Money Lending Business Act for charging gray-zone interest rates, consumer finance companies have experienced a significant increase in borrowers’ claims for reimbursement of previously collected interest payments in excess of the limits stipulated by the Interest Rate Restriction Act.
Following the various legal developments in June 2010 and other industry developments, Mitsubishi UFJ NICOS revised its estimate by updating management’s future forecast to reflect new reimbursement claims information and other data. As of March 31, 2012, 2013 and 2014, we had ¥99.4 billion, ¥77.6 billion and ¥54.1 billion of allowance for repayment of excess interest, respectively. For the same periods, one of our equity method investees engaged in consumer lending, ACOM CO., LTD., had a negative impact of ¥19.3 billion, ¥17.0 billion and ¥18.0 billion, respectively, on net equity in losses of equity method investees in our consolidated statements of income. We intend to carefully monitor future developments and trends.
These developments have adversely affected, and these and any future developments may further adversely affect, the operations and financial condition of our subsidiaries, equity method investees and borrowers which are engaged in consumer lending, which in turn may affect the value of our related shareholdings and loan portfolio.
Our business may be adversely affected by competitive pressures, which have partly increased due to regulatory changes and recent market changes in the financial industry domestically and globally.
In recent years, the Japanese financial system has been undergoing significant changes and regulatory barriers to competition have been reduced. In particular, any further reform of the Japanese postal savings
19
Table of Contents
system, under which the Japan Post Group companies, including Japan Post Bank Co., Ltd., were established in October 2007, could substantially increase competition within the financial services industry as Japan Post Bank, with the largest deposit base and branch network in Japan, may begin to offer financial services in competition with our business operations generating fee income. In May 2012, amendments to the postal privatization law became effective under which Japan Post Bank and Japan Post Insurance may enter into new businesses upon obtaining government approvals, and if the government’s equity holdings decrease to a certain level, the two companies will be allowed to enter into new businesses upon submission of a notice to the government. As a result, the Japan Post Group companies may seek to enter into new financial businesses. The privatization of the Japan Post Group companies remains subject to political negotiations and government action.
We also face intensifying competition in areas of our strategic expansion. For example, the Japanese mega banks, including us, and other major international banks have been expanding, or are expected to expand, their operations in the Asian market, where leading local banks have recently been growing and increasing their presence. In addition, there has been significant consolidation and convergence among financial institutions domestically and globally, and this trend may continue in the future and further increase competition in the market. A number of large commercial banks and other broad-based financial services firms have merged or formed strategic alliances with, or have acquired, other financial institutions both in Japan and overseas. As a result of the strategic alliance and the joint venture companies that we formed with Morgan Stanley, we may be newly perceived as a competitor by some of the financial institutions with which we had a more cooperative relationship in the past. If we are unable to compete effectively in this more competitive and deregulated business environment, our business, results of operations and financial condition will be adversely affected. For a more detailed discussion of our competition in Japan, see “Item 4.B. Information on the Company—Business Overview—Competition.”
Future changes in accounting standards could have a negative impact on our business and results of operations.
Future developments or changes in accounting standards are unpredictable and beyond our control. For example, in response to the recent instabilities in global financial markets, several international organizations which set accounting standards have released proposals to revise standards on accounting for financial instruments. Accounting standards applicable to financial instruments remain subject to debate and revision by international organizations which set accounting standards. If the current accounting standards change in the future, the reported values of some of our financial instruments may need to be modified, and such modification could have a significant impact on our financial results or financial condition. For more information, see “Item 5. Operating and Financial Review and Prospects—Critical Accounting Estimates.”
We could also be required to incur significant expenses to comply with new accounting standards and regulations. For example, if we adopt a new accounting system in the future, we may be required to incur significant additional costs for establishing and implementing effective internal controls, which may materially and adversely affect our financial condition and results of operations.
Transactions with counterparties in countries designated by the U.S. Department of State as state sponsors of terrorism may lead some potential customers and investors in the United States and other countries to avoid doing business with us or investing in our shares.
We, through our subsidiaries, engage in business activities with entities in or affiliated with Iran, including transactions with counterparties owned or controlled by the Iranian government, and our commercial banking subsidiary has a representative office in Iran. The U.S. Department of State has designated Iran and other countries as “state sponsors of terrorism,” and U.S. law generally prohibits U.S. persons from doing business with such countries. We currently have business activities with entities in or affiliated with such countries in accordance with our policies and procedures designed to ensure compliance with regulations applicable in the jurisdictions in which we operate.
20
Table of Contents
We have loan transactions with counterparties in or affiliated with Iran, the outstanding balance of which was approximately $4.5 million, representing less than 0.001% of our total assets, as of March 31, 2014. We do not have any loans outstanding to the financial institutions specifically listed by the U.S. government. In addition to such loan transactions, our other transactions with counterparties in or affiliated with countries designated as state sponsors of terrorism consist of receiving deposits or holding assets on behalf of individuals residing in Japan who are citizens of countries designated as state sponsors of terrorism, processing payments to or from entities in or affiliated with these countries on behalf of our customers, and issuing letters of credit and guarantees in connection with transactions with entities in or affiliated with such countries by our customers. These transactions do not have a material impact on our business or financial condition. For a further discussion of transactions required to be disclosed under the U.S. Iran Threat Reduction and Syria Human Rights Act of 2012, see “Item 4.B. Information on the Company—Business Overview—Supervision and Regulation—United States—Disclosure pursuant to Section 13(r) of the Securities Exchange Act of 1934.”
We are aware of initiatives by U.S. governmental entities and non-government entities, including institutional investors such as pension funds, to adopt or consider adopting laws, regulations or policies prohibiting transactions with or investment in, or requiring divestment from, entities doing business with Iran and other countries identified as state sponsors of terrorism. It is possible that such initiatives may result in our being unable to gain or retain entities subject to such prohibitions as customers, counter-parties or investors in our shares. In addition, depending on socio-political developments, our reputation may suffer due to our transactions with counterparties in or affiliated with these countries. The above circumstances could have an adverse effect on our business and financial condition.
Global financial institutions, including us, have become subject to an increasingly complex set of sanctions laws and regulations in recent years, and this regulatory environment is expected to continue. Moreover, the measures proposed or adopted vary across the major jurisdictions, increasing the cost and resources necessary to design and implement an appropriate global compliance program. The U.S. federal government and some state governments in the United States have enacted legislation designed to limit economic and financial transactions with Iran by limiting the ability of financial institutions that may have engaged in any one of a broad range of activities related to Iran to conduct various transactions in the relevant jurisdictions. The Japanese government has also implemented a series of measures under the Foreign Exchange and Foreign Trade Act, such as freezing the assets of designated financial institutions and others that could contribute to Iran’s nuclear activities, and our most recently modified policies and procedures take into account the current Japanese regulatory requirements. There remains a risk of potential U.S. regulatory action against us, however, if U.S. regulators perceive the modified policies and procedures not to be in compliance with applicable regulations.
We may not be able to maintain our capital ratios above minimum required levels, which could result in the suspension of some or all of our operations.
We, as a holding company, and our Japanese banking subsidiaries are required to maintain risk-weighted capital ratios above the levels specified in the capital adequacy guidelines of the FSA which have been revised as of March 31, 2013, as described below. As of March 31, 2014, our total risk-adjusted capital ratio was 15.53% compared to the minimum risk-adjusted capital ratio required of 8.00%, our Tier 1 capital ratio was 12.45% compared to the minimum Tier 1 capital ratio required of 5.50%, and our Common Equity Tier 1 capital ratio was 11.25% compared to the minimum Common Equity Tier 1 capital ratio required of 4.00%. Our capital ratios are calculated in accordance with Japanese banking regulations based on information derived from our financial statements prepared in accordance with Japanese GAAP. In addition, some of our subsidiaries are also subject to the capital adequacy rules of various foreign countries, including the United States where each of MUFG, BTMU, Mitsubishi UFJ Trust and Banking Corporation, or MUTB, and MUAH is a financial holding company under the U.S. Bank Holding Company Act. We or our banking subsidiaries may be unable to continue to satisfy the capital adequacy requirements because of:
| Ÿ |
increases in our and our banking subsidiaries’ credit risk assets and expected losses because of fluctuations in our or our banking subsidiaries’ portfolios due to deterioration in the creditworthiness of borrowers and the issuers of equity and debt securities, |
21
Table of Contents
| Ÿ |
difficulty in refinancing or issuing instruments upon redemption or at maturity of such instruments to raise capital under terms and conditions similar to prior financings or issuances, |
| Ÿ |
declines in the value of our or our banking subsidiaries’ securities portfolios, |
| Ÿ |
adverse changes in foreign currency exchange rates, |
| Ÿ |
adverse revisions to the capital ratio requirements, |
| Ÿ |
reductions in the value of our or our banking subsidiaries’ deferred tax assets, and |
| Ÿ |
other adverse developments. |
The Group of Central Bank Governors and Heads of Supervision has made a series of announcements regarding the new global regulatory framework, which has been referred to as “Basel III,” to strengthen the regulation, supervision and risk management of the banking sector. Various Basel III measures are being phased in from the calendar year 2013, including those designed to raise the level of minimum capital requirements and to establish an internationally harmonized leverage ratio and a global minimum liquidity standard. In addition, the Basel Committee on Banking Supervision has proposed additional loss absorbency requirements to supplement the Common Equity Tier 1 capital requirement ranging from 1% to 3.5% for global systemically important banks, or G-SIBs, depending on the bank’s systemic importance. The Financial Stability Board identified us as a G-SIB in its most recent annual report published in November 2013, and indicated that, as a G-SIB, we would be required to hold an additional 1.5% of Tier 1 common equity. The group of banks identified as G-SIBs is expected to be updated annually, and the first group of G-SIBs to which the stricter capital requirements will initially be applied is expected to be identified in 2014. The stricter capital requirements are expected to be implemented in phases between January 1, 2016 and December 31, 2018 and will become fully effective on January 1, 2019. Based on the Basel III framework, the Japanese capital ratio framework has been revised to implement the more stringent requirements, which are being implemented in phases beginning on March 31, 2013. Likewise, local banking regulators outside of Japan, such as those in the United States, have begun, or are expected, to revise the capital and liquidity requirements imposed on our subsidiaries and operations in those countries to implement the more stringent requirements of Basel III as adopted in those countries.
Under the capital adequacy guidelines of the FSA, which have been revised in connection with the adoption of Basel III, there is a transitional measure relating to the inclusion as a capital item of capital raising instruments issued in or prior to March 2013, and such instruments can be included as a capital item when calculating capital ratios to the extent permitted by the transitional measure. Such capital raising instruments may require refinancing upon the expiration of the transition period during which such instruments can be included as a capital item in the calculation of capital ratios. However, in order for newly issued capital raising instruments, other than common stock, to be included as a capital item in the calculation of capital ratios under the capital adequacy guidelines, such instruments must have a clause in their terms and conditions that requires them to be written off or converted into common stock upon the occurrence of certain events, including when the issuing financial institution is deemed non-viable or when the issuing financial institution’s capital ratios decline below prescribed levels. As a result, under certain market conditions, we may be unable to refinance or issue capital raising instruments under terms and conditions similar to those of capital raising instruments issued in or prior to March 2013. If such circumstances arise, our and our banking subsidiaries’ capital could be reduced, and our and our bank subsidiaries’ capital ratio could decrease.
In addition, under the FSA’s capital adequacy guidelines, deferred tax assets can be included as a capital item when calculating capital ratios up to a prescribed amount. However, this upper limit is expected to be reduced in phases. If and to the extent the amount of deferred tax assets exceeds this limit and cannot be included in Common Equity Tier 1 capital, our and our banking subsidiaries’ capital ratios can decrease.
If our capital ratios fall below required levels, the FSA could require us to take a variety of corrective actions, including withdrawal from all international operations or suspension of all or part of our business operations. In addition, if the capital ratios of our subsidiaries subject to capital adequacy rules of foreign
22
Table of Contents
jurisdictions fall below the required levels, the local regulators could also take action against them that may result in reputational damage or financial losses to us. Since maintaining our capital ratios at acceptable levels is crucial to our business, our management devotes a significant amount of attention and resources to capital ratio related issues and may also significantly alter our business strategy or operations if our capital ratios decline to unacceptable levels. For a discussion of our capital ratios and the related regulatory guidelines, see “Item 4.B. Information on the Company—Business Overview—Supervision and Regulation” and “Item 5.B. Operating and Financial Review and Prospects—Liquidity and Capital Resources—Capital Adequacy.”
If the goodwill recorded in connection with our acquisitions becomes impaired, we may be required to record impairment losses, which may adversely affect our financial results and the price of our securities.
In accordance with U.S. GAAP, we account for our business combinations using the acquisition method of accounting. We recorded the excess of the purchase price over the fair value of the assets and liabilities of the acquired companies as goodwill. U.S. GAAP requires us to test goodwill for impairment at least annually, or more frequently if events or changes in circumstances indicate that goodwill may be impaired. As of March 31, 2014, the total balance of goodwill was ¥728.5 billion.
For the fiscal year ended March 31, 2014, we recognized ¥7.8 billion in impairment of goodwill relating to the Integrated Trust Assets Business Group segment. We readjusted our future projection of a reporting unit in this segment, considering a subsidiary’s recent business performance. As a result, the fair value of this reporting unit, which is based on discounted future cash flows, fell below the carrying amount of the reporting unit, and the impairment loss was recognized on the related goodwill.
We may be required to record additional impairment losses relating to goodwill in future periods if the fair value of any of our reporting units declines below the fair value of related assets net of liabilities. Any additional impairment losses will negatively affect our financial results, and the price of our securities could be adversely affected. For a detailed discussion of our periodic testing of goodwill for impairment and the goodwill recorded, see “Item 5. Operating and Financial Review and Prospects—Critical Accounting Estimates—Accounting for Goodwill and Intangible Assets.”
A further downgrade of our credit ratings could trigger additional collateral obligations under our derivative contracts and increase our funding costs.
In August 2011, Moody’s announced that it downgraded the long-term credit ratings of BTMU and MUTB by one-notch from Aa2 to Aa3, and the long-term credit rating of Mitsubishi UFJ Securities Holding Co., Ltd., or MUSHD, by one-notch from A1 to A2. On July 20, 2012, Fitch downgraded the ratings assigned to BTMU and MUTB by one-notch from A to A-, although Fitch subsequently upgraded them. A further credit rating downgrade by Moody’s, Fitch, Standard & Poor’s Ratings Services LLC or any other credit rating agency may have an adverse impact on us. Substantially all of the derivative contracts with collateral obligations entered into by BTMU, MUTB and MUSHD are subject to a Credit Support Annex, or CSA, as published by the International Swaps and Derivatives Association, Inc., or ISDA. Following the downgrades by Moody’s and Fitch, some of our existing CSAs were modified to require, and some of the new CSAs that we entered into required, additional collateral at lower thresholds.
Assuming all of the relevant credit rating agencies downgraded the credit ratings of BTMU, MUTB and MUSHD by one-notch on March 31, 2014, we estimate that our three main subsidiaries under their derivative contracts as of the same date, would have been required to provide additional collateral of approximately ¥6.5 billion. Assuming a two-notch downgrade by all of the relevant credit rating agencies occurred on the same date, we estimate that the additional collateral requirements for BTMU, MUTB and MUSHD under their derivative contracts as of the same date would have been approximately ¥12.6 billion. In addition, a further downgrade of the credit ratings of our major subsidiaries could result in higher funding costs. For additional information on the impact of recent downgrades, see “Item 5.B. Operating and Financial Review and Prospects—Liquidity and Capital Resources—Financial Condition—Sources of Funding and Liquidity.”
23
Table of Contents
Failure to safeguard personal and other confidential information may result in liability, reputational damage or financial losses.
As our operations expand in volume, complexity and geographic scope, we are exposed to increased risk of confidential information in our possession being lost, leaked, altered or falsified as a result of human or system error, misconduct, unlawful behavior or scheme, unauthorized access or natural or human-caused disasters. Our information systems and information management policies and procedures may not be sufficient to safeguard confidential information against such risks.
As a financial institution in possession of customer information, we are required to treat personal and other confidential information as required by the Act on the Protection of Personal Information of Japan, as well as the Banking Law and the Financial Instruments and Exchange Law. In the event that personal information in our possession about our customers or employees is leaked or improperly accessed and subsequently misused, we may be subject to liability and regulatory action. We may have to provide compensation for economic loss and emotional distress arising out of a failure to protect such information. In addition, such incidents could create a negative public perception of our operations, systems or brand, which may in turn decrease customer and market confidence and materially and adversely affect our business, operating results and financial condition.
Moreover, any loss, leakage, alteration or falsification of confidential information, or any malfunction or failure of our information systems, may result in significant disruptions to our business operations or plans or may require us to incur significant financial, human and other resources to implement corrective measures or enhance our information systems and information management policies and procedures.
Risks Related to Owning Our Shares
It may not be possible for investors to effect service of process within the United States upon us or our directors, corporate auditors or other management members, or to enforce against us or those persons judgments obtained in U.S. courts predicated upon the civil liability provisions of the U.S. federal or state securities laws.
We are a joint stock company incorporated under the laws of Japan. Almost all of our directors, corporate auditors or other management members reside outside the United States. Many of our assets and the assets of these persons are located in Japan and elsewhere outside the United States. It may not be possible, therefore, for U.S. investors to effect service of process within the United States upon us or these persons or to enforce, against us or these persons, judgments obtained in the U.S. courts predicated upon the civil liability provisions of the U.S. federal or state securities laws.
We believe there is doubt as to the enforceability in Japan, in original actions or in actions brought in Japanese courts to enforce judgments of U.S. courts, of claims predicated solely upon the U.S. federal or state securities laws mainly because the Civil Execution Act of Japan requires Japanese courts to deny requests for the enforcement of judgments of foreign courts if foreign judgments fail to satisfy the requirements prescribed by the Civil Execution Act, including:
| Ÿ |
the jurisdiction of the foreign court be recognized under laws, regulations, treaties or conventions; |
| Ÿ |
proper service of process be made on relevant defendants, or relevant defendants be given appropriate protection if such service is not received; |
| Ÿ |
the judgment and proceedings of the foreign court not be repugnant to public policy as applied in Japan; and |
| Ÿ |
there exist reciprocity as to the recognition by a court of the relevant foreign jurisdiction of a final judgment of a Japanese court. |
Judgments obtained in the U.S. courts predicated upon the civil liability provisions of the U.S. federal or state securities laws may not satisfy these requirements.
24
Table of Contents
Risks Related to Owning Our ADSs
As a holder of ADSs, you have fewer rights than a shareholder of record in our shareholder register since you must act through the depositary to exercise these rights.
The rights of our shareholders under Japanese law to take actions such as voting, receiving dividends and distributions, bringing derivative actions, examining our accounting books and records and exercising appraisal rights are available only to shareholders of record. Because the depositary, through its custodian, is the record holder of the shares underlying the American Depositary Shares, or ADSs, only the depositary can exercise shareholder rights relating to the deposited shares. ADS holders, in their capacity, will not be able to directly bring a derivative action, examine our accounting books and records and exercise appraisal rights. We have appointed The Bank of New York Mellon as depositary, and we have the authority to replace the depositary.
Pursuant to the deposit agreement among us, the depositary and a holder of ADSs, the depositary will make efforts to exercise voting or any other rights associated with shares underlying ADSs in accordance with the instructions given by ADS holders, and to pay to ADS holders dividends and distributions collected from us. However, the depositary can exercise reasonable discretion in carrying out the instructions or making distributions, and is not liable for failure to do so as long as it has acted in good faith. Therefore, ADS holders may not be able to exercise voting or any other rights in the manner that they had intended, or may lose some or all of the value of the dividends or the distributions. Moreover, the depositary agreement that governs the obligations of the depositary may be amended or terminated by us and the depositary without your consent, notice, or any reason. As a result, you may be prevented from having the rights in connection with the deposited shares exercised in the way you had wished or at all.
ADS holders are dependent on the depositary to receive our communications. We send to the depositary all of our communications to ADS holders, including annual reports, notices and voting materials, in Japanese. ADS holders may not receive all of our communications with shareholders of record in our shareholder register in the same manner or on an equal basis. In addition, ADS holders may not be able to exercise their rights as ADS holders due to delays in the depositary transmitting our shareholder communications to ADS holders. For a detailed discussion of the rights of ADS holders and the terms of the deposit agreement, see “Item 10.B. Additional Information—Memorandum and Articles of Association.”
| Item 4. | Information on the Company. |
| A. | History and Development of the Company |
Mitsubishi UFJ Financial Group, Inc.
MUFG is a bank holding company incorporated as a joint stock company ( kabushiki kaisha ) under the Company Law of Japan. We are the holding company for The Bank of Tokyo-Mitsubishi UFJ, Ltd., or BTMU, Mitsubishi UFJ Trust and Banking Corporation, or MUTB, Mitsubishi UFJ Securities Holdings Co., Ltd., or MUSHD, Mitsubishi UFJ Morgan Stanley Securities Co., Ltd., or MUMSS, Mitsubishi UFJ NICOS Co., Ltd., and other companies engaged in a wide range of financial businesses.
On April 2, 2001, The Bank of Tokyo-Mitsubishi, Ltd., Mitsubishi Trust and Banking Corporation, or Mitsubishi Trust Bank, and Nippon Trust and Banking Co., Ltd. established Mitsubishi Tokyo Financial Group, Inc., or MTFG, to be a holding company for the three entities. Before that, each of the banks had been a publicly traded company. On April 2, 2001, through a stock-for-stock exchange, they became wholly-owned subsidiaries of MTFG, and the former shareholders of the three banks became shareholders of MTFG. Nippon Trust and Banking was later merged into Mitsubishi Trust Bank.
On June 29, 2005, the merger agreement between MTFG and UFJ Holdings was approved at the general shareholders meetings of MTFG and UFJ Holdings. As the surviving entity, Mitsubishi Tokyo Financial Group, Inc. was renamed “Mitsubishi UFJ Financial Group, Inc.” The merger of the two bank holding companies was completed on October 1, 2005.
25
Table of Contents
On September 30, 2007, MUSHD, which was then called “Mitsubishi UFJ Securities Co., Ltd.,” or MUS, became our wholly-owned subsidiary through a share exchange transaction.
On October 13, 2008, we formed a global strategic alliance with Morgan Stanley and, as part of the alliance, made an equity investment in Morgan Stanley in the form of convertible and non-convertible preferred stock, and subsequently appointed a representative to Morgan Stanley’s board of directors.
On October 21, 2008, we completed a tender offer for outstanding shares of ACOM CO., LTD. common stock, raising our ownership in ACOM to approximately 40%.
On November 4, 2008, BTMU completed the acquisition of all of the shares of common stock of UnionBanCal Corporation, or UNBC, not previously owned by BTMU and, as a result, UNBC became a wholly-owned indirect subsidiary of MUFG.
On May 1, 2010, we and Morgan Stanley integrated our securities and investment banking businesses in Japan into two joint venture securities companies, one of which is MUMSS. MUMSS was created by spinning off the wholesale and retail securities businesses conducted in Japan from MUSHD and subsequently assuming certain operations in Japan from a subsidiary of Morgan Stanley.
On June 30, 2011, we converted all of our Morgan Stanley’s convertible preferred stock into Morgan Stanley’s common stock, resulting in our holding approximately 22.4% of the voting rights in Morgan Stanley. Further, we appointed a second representative to Morgan Stanley’s board of directors on July 20, 2011. Following the conversion on June 30, 2011, Morgan Stanley became our equity-method affiliate. As of March 31, 2014, we held approximately 21.9% of the voting rights in Morgan Stanley and had two representatives appointed to Morgan Stanley’s board of directors. We and Morgan Stanley continue to pursue a variety of business opportunities in Japan and abroad in accordance with the global strategic alliance.
On December 18, 2013, we acquired approximately 72.0% of the total outstanding shares of Bank of Ayudhya Public Company Limited, or Krungsri, through BTMU. As a result of the transaction, Krungsri has become a consolidated subsidiary of BTMU.
On July 1, 2014, we integrated BTMU’s operations in the Americas region with UNBC’s operations, and changed UNBC’s corporate name to “MUFG Americas Holdings Corporation,” or MUAH. On the same day, Union Bank, N.A., which is MUAH’s principal subsidiary and our primary operating subsidiary in the United States, was also renamed “MUFG Union Bank, N.A.,” or MUB. MUAH currently oversees BTMU’s operations in the Americas region as well as the operations of MUB.
Our registered address is 7-1, Marunouchi 2-chome, Chiyoda-ku, Tokyo 100-8330, Japan, and our telephone number is 81-3-3240-8111.
For a discussion of recent developments, see “Item 5. Operating and Financial Review and Prospects—Recent Developments.”
The Bank of Tokyo-Mitsubishi UFJ, Ltd.
BTMU is a major commercial banking organization in Japan that provides a broad range of domestic and international banking services from its offices in Japan and around the world. BTMU’s registered head office is located at 7-1, Marunouchi 2-chome, Chiyoda-ku, Tokyo 100-8388, Japan, and its telephone number is 81-3-3240-1111. BTMU is a joint stock company ( kabushiki kaisha ) incorporated in Japan under the Company Law.
BTMU was formed through the merger, on January 1, 2006, of Bank of Tokyo-Mitsubishi and UFJ Bank Limited after their respective parent companies, MTFG and UFJ Holdings, merged to form MUFG on October 1, 2005.
26
Table of Contents
Bank of Tokyo-Mitsubishi was formed through the merger, on April 1, 1996, of The Mitsubishi Bank, Limited and The Bank of Tokyo, Ltd.
The origins of Mitsubishi Bank can be traced to the Mitsubishi Exchange Office, a money exchange house established in 1880 by Yataro Iwasaki, the founder of the Mitsubishi industrial, commercial and financial group. In 1895, the Mitsubishi Exchange Office was succeeded by the Banking Division of the Mitsubishi Goshi Kaisha, the holding company of the “Mitsubishi group” of companies. Mitsubishi Bank had been a principal bank to many of the Mitsubishi group companies but broadened its relationships to cover a wide range of Japanese industries, small and medium-sized companies and individuals.
Bank of Tokyo was established in 1946 as a successor to The Yokohama Specie Bank, Ltd., a special foreign exchange bank established in 1880. When the government of Japan promulgated the Foreign Exchange Bank Law in 1954, Bank of Tokyo became the only bank licensed under that law. Because of its license, Bank of Tokyo received special consideration from the Ministry of Finance in establishing its offices abroad and in many other aspects relating to foreign exchange and international finance.
UFJ Bank was formed through the merger, on January 15, 2002, of The Sanwa Bank, Limited and The Tokai Bank, Limited.
Sanwa Bank was established in 1933 when the three Osaka-based banks, the Konoike Bank, the Yamaguchi Bank, and the Sanjyushi Bank merged. Sanwa Bank was known as a city bank having the longest history in Japan, since the foundation of Konoike Bank can be traced back to the Konoike Exchange Office established in 1656. The origin of Yamaguchi Bank was also a money exchange house, established in 1863. Sanjyushi Bank was founded by influential fiber wholesalers in 1878. The corporate philosophy of Sanwa Bank had been the creation of premier banking services especially for small and medium-sized companies and individuals.
Tokai Bank was established in 1941 when the three Nagoya-based banks, the Aichi Bank, the Ito Bank, and the Nagoya Bank merged. In 1896, Aichi Bank took over businesses of the Jyuichi Bank established by wholesalers in 1877 and the Hyakusanjyushi Bank established in 1878. Ito Bank and Nagoya Bank were established in 1881 and 1882, respectively. Tokai Bank had expanded the commercial banking business to contribute to economic growth mainly of the Chubu area in Japan, which is known for its manufacturing industries, especially automobiles.
Mitsubishi UFJ Trust and Banking Corporation
MUTB is a major trust bank in Japan, providing trust and banking services to meet the financing and investment needs of clients in Japan and the rest of Asia, as well as in the United States and Europe. MUTB’s registered head office is located at 4-5, Marunouchi 1-chome, Chiyoda-ku, Tokyo 100-8212, Japan, and its telephone number is 81-3-3212-1211. MUTB is a joint stock company (kabushiki kaisha) incorporated in Japan under the Company Law.
MUTB was formed on October 1, 2005 through the merger of Mitsubishi Trust Bank and UFJ Trust Bank Limited. As the surviving entity, Mitsubishi Trust Bank was renamed “Mitsubishi UFJ Trust and Banking Corporation.”
Mitsubishi Trust Bank traces its history to The Mitsubishi Trust Company, Limited, which was founded by the leading members of the Mitsubishi group companies in 1927. The Japanese banking and financial industry was reconstructed after World War II and, in 1948, Mitsubishi Trust Bank was authorized to engage in the commercial banking business, in addition to its trust business, under the new name Asahi Trust & Banking Corporation. In 1952, the bank changed its name again, to “The Mitsubishi Trust and Banking Corporation.”
Nippon Trust and Banking and The Tokyo Trust Bank, Ltd., which were previously subsidiaries of Bank of Tokyo-Mitsubishi, was merged into Mitsubishi Trust Bank on October 1, 2001.
27
Table of Contents
UFJ Trust Bank was founded in 1959 as The Toyo Trust & Banking Company, Limited, or Toyo Trust Bank. The Sanwa Trust & Banking Company, Limited, which was a subsidiary of Sanwa Bank, was merged into Toyo Trust Bank on October 1, 1999. The Tokai Trust & Banking Company, Limited, which was a subsidiary of Tokai Bank, was merged into Toyo Trust Bank on July 1, 2001. Toyo Trust Bank was renamed “UFJ Trust Bank Limited” on January 15, 2002.
Mitsubishi UFJ Securities Holdings Co., Ltd.
MUSHD is a wholly-owned subsidiary of MUFG. MUSHD functions as an intermediate holding company of MUFG’s global securities business. MUSHD’s registered head office is located at 5-2, Marunouchi 2-chome, Chiyoda-ku, Tokyo 100-0005, Japan, and its telephone number is 81-3-6213-2550. MUSHD is a joint stock company ( kabushiki kaisha ) incorporated in Japan under the Company Law. MUSHD has major overseas subsidiaries in London, New York, Hong Kong, Singapore and Geneva.
In April 2010, MUSHD, which was previously called “Mitsubishi UFJ Securities Co., Ltd.,” or MUS, became an intermediate holding company by spinning off its securities and investment banking business operations to a wholly-owned operating subsidiary established in December 2009, currently MUMSS. Upon the consummation of the corporate spin-off transaction, the intermediate holding company was renamed “Mitsubishi UFJ Securities Holdings Co., Ltd.” and the operating subsidiary was renamed “Mitsubishi UFJ Securities Co., Ltd.” The operating subsidiary was subsequently renamed MUMSS in May 2010 upon integration of our securities operations in Japan with those of Morgan Stanley.
MUS was formed through the merger between Mitsubishi Securities Co., Ltd. and UFJ Tsubasa Securities Co., Ltd. on October 1, 2005, with Mitsubishi Securities being the surviving entity. The surviving entity was renamed “Mitsubishi UFJ Securities Co., Ltd.” and, in September 2007, became our wholly-owned subsidiary through a share exchange transaction.
Mitsubishi Securities was formed in September 2002 through a merger of Bank of Tokyo-Mitsubishi’s securities subsidiaries and affiliate, KOKUSAI Securities Co., Ltd., Tokyo-Mitsubishi Securities Co., Ltd. and Tokyo-Mitsubishi Personal Securities Co., Ltd., and Mitsubishi Trust Bank’s securities affiliate, Issei Securities Co., Ltd. In July 2005, MTFG made Mitsubishi Securities a directly-held subsidiary by acquiring all of the shares of Mitsubishi Securities common stock held by Bank of Tokyo-Mitsubishi and Mitsubishi Trust Bank.
Mitsubishi UFJ Morgan Stanley Securities Co., Ltd.
MUMSS is our core securities and investment banking subsidiary. MUMSS was created as one of the two Japanese joint venture securities companies in May 2010 between Morgan Stanley and us as part of our global strategic alliance. MUMSS succeeded to the investment banking operations conducted in Japan by a subsidiary of Morgan Stanley and the wholesale and retail securities businesses conducted in Japan by MUS. MUFG, through MUSHD, holds 60% voting and economic interests in MUMSS. MUMSS’s registered head office is located at 5-2 Marunouchi 2-chome, Chiyoda-ku, Tokyo, 100-0005 Japan, and its telephone number is 81-3-6213-8500. MUMSS is a joint stock company ( kabushiki kaisha ) incorporated in Japan under the Company Law. For more information on our joint venture securities companies, see “—B. Business Overview—Global Strategic Alliance with Morgan Stanley.”
Mitsubishi UFJ NICOS Co., Ltd.
Mitsubishi UFJ NICOS is a major credit card company in Japan that issues credit cards, including those issued under the MUFG, NICOS, UFJ and DC brands, and provides a broad range of credit card and other related services for its card members in Japan. Mitsubishi UFJ NICOS is a consolidated subsidiary of MUFG. Mitsubishi UFJ NICOS’s registered head office is located at 33-5, Hongo 3-chome, Bunkyo-ku, Tokyo 113-8411, Japan, and its telephone number is 81-3-3811-3111. Mitsubishi UFJ NICOS is a joint stock company ( kabushiki kaisha ) incorporated in Japan under the Company Law.
28
Table of Contents
On August 1, 2008, Mitsubishi UFJ NICOS became a wholly-owned subsidiary of MUFG through a share exchange transaction. On the same day, we entered into a share transfer agreement with The Norinchukin Bank, or Norinchukin, under which we sold some of our shares of Mitsubishi UFJ NICOS common stock to Norinchukin. Currently, Mitsubishi UFJ NICOS is a consolidated subsidiary of MUFG. In March 2011, we and Norinchukin made additional equity investments in Mitsubishi UFJ NICOS in proportion to our and Norinchukin’s respective beneficial ownership of approximately 85% and 15%, respectively.
Mitsubishi UFJ NICOS was formed through the merger, on April 1, 2007, of UFJ NICOS Co., Ltd. and DC Card Co., Ltd. As the surviving entity, UFJ NICOS Co., Ltd. was renamed “Mitsubishi UFJ NICOS Co., Ltd.”
UFJ NICOS was formed through the merger, on October 1, 2005, of Nippon Shinpan Co., Ltd. and UFJ Card Co., Ltd. Originally founded in 1951 and listed on the Tokyo Stock Exchange in 1961, Nippon Shinpan was a leading company in the consumer credit business in Japan. Nippon Shinpan became a subsidiary of MUFG at the time of the merger with UFJ Card.
Prior to the merger between MTFG and UFJ Holdings in October 2005, DC Card was a subsidiary of MTFG while UFJ Card was a subsidiary of UFJ Holdings.
| B. | Business Overview |
We are one of the world’s largest and most diversified financial groups with total assets of ¥253.66 trillion as of March 31, 2014. The Group is comprised of BTMU, MUTB, MUMSS (through MUSHD), Mitsubishi UFJ NICOS and other subsidiaries and affiliates, for which we are the holding company. As a bank holding company, we are regulated under the Banking Law of Japan. Our services include commercial banking, trust banking, securities, credit cards, consumer finance, asset management, leasing and many more fields of financial services. The Group has the largest overseas network among the Japanese banks, comprised of offices and subsidiaries, including MUB and Krungsri, in more than 40 countries.
While maintaining the corporate cultures and core competencies of BTMU, MUTB, MUMSS (through MUSHD) and Mitsubishi UFJ NICOS, we, as the holding company, seek to work with them to find ways to:
| Ÿ |
establish a more diversified financial services group operating across business sectors; |
| Ÿ |
leverage the flexibility afforded by our organizational structure to expand our business; |
| Ÿ |
benefit from the collective expertise of BTMU, MUTB, MUMSS (through MUSHD) and Mitsubishi UFJ NICOS; |
| Ÿ |
achieve operational efficiencies and economies of scale; and |
| Ÿ |
enhance the sophistication and comprehensiveness of the Group’s risk management expertise. |
Since April 2004, we have adopted an integrated business group system comprising our core business areas, which serve as the Group’s core sources of net operating profit. As of March 31, 2014, we have five business segments: Integrated Retail Banking Business, Integrated Corporate Banking Business, Integrated Trust Assets Business, Integrated Global Business and Global Markets. MUFG’s role as the holding company is to strategically manage and coordinate the activities of these business segments. Group-wide strategies are determined by the holding company and executed by the banking subsidiaries and other subsidiaries. For further information on our business segments, see “Item 5.A. Operating and Financial Review and Prospects—Operating Results—Business Segment Analysis.”
In October 2008, each of MUFG, BTMU, MUTB and UNBC (now MUAH) became a financial holding company under the U.S. Bank Holding Company Act. For more information, see “Item 3.D. Key Information—Risk Factors—Risks Related to Our Business—We may not be able to maintain our capital ratios above minimum required levels, which could result in the suspension of some or all of our operations” and “—B. Information on the Company—Business Overview—Supervision and Regulation—United States.”
29
Table of Contents
MUFG Management Policy
MUFG Group has formulated the Group Corporate Vision to clarify the nature of the Group’s overall mission and the type of group it should aspire to be, and as a shared principle to unify the hearts and minds of Group employees, while meeting the expectations of our customers and society. Throughout the Group, the people of MUFG are working under three shared values—Integrity and Responsibility, Professionalism and Teamwork, and Challenging Ourselves to Grow—while aiming to be the world’s most trusted financial group.

We have declared our message to the world as “Quality for You,” with management’s emphasis on quality. “Quality for You” means that by providing high-quality services, we aspire to help improve the quality of the lives of individual customers and the quality of each corporate customer. The “You” expresses the basic stance of MUFG that we seek to contribute not only to the development of our individual customers but also communities and society. We believe that delivering superior quality services, reliability, and global coverage will result in more profound and enduring contributions to society.
Integrated Retail Banking Business Group
The Integrated Retail Banking Business Group covers all retail businesses, including commercial banking, trust banking and securities businesses, and offers a full range of banking products and services, including financial consulting services, to retail customers in Japan. This business group integrates the retail businesses of BTMU, MUTB, MUMSS and other affiliate companies of MUFG. We offer a full range of bank deposit products, including a non-interest-bearing deposit account that is redeemable on demand and intended primarily for payment and settlement functions. We also offer a variety of asset management and asset administration services, and trust products and other investment products, as well as other products and services described below.
MUFG, as an integrated financial service group, aims to respond to customers’ specific needs, utilizing its breadth of businesses such as commercial banking, trust banking, securities and credit card businesses. The MUFG Group is committed to offering customers safe and reliable services by strengthening frameworks for, among other things, customer protection, legal compliance, and security response.
Service Improvement Project . BTMU has launched a project titled “Do Smart „ ” with an aim to improve quality of services for individual customers. In order to contribute to the lifelong wellbeing of customers and their families, this project focuses on enhancing online banking services with smartphones and other devices, and providing customized consulting to satisfy their needs.
Responding to Investment Needs . We aim to ensure that customers can adequately inform themselves of investment opportunities by providing various mediums such as appointments with representatives, seminars at branches with investment experts as lecturers, and “investment consultation sessions” on weekends and national
30
Table of Contents
holidays, and during evening hours. We have also been expanding our product lines, adding services such as investment trusts and foreign currency deposits, in order to be better able to respond to customers’ various investment needs. MUFG has also been working proactively to promote the Japanese individual savings account system, generally referred to as the NISA program, which was launched in January 2014 and offers tax exemptions on capital gains and dividend income for investments up to ¥1.0 million a year for a maximum of five years. The MUFG Group focuses on strengthening collaboration among group companies. For example, foreign bonds made available by MUMSS and other group securities companies are also available for purchases at BTMU and MUTB. Also, BTMU provides “Retail Money Desk” services at 63 branches across Japan, where investment experts seconded from MUMSS respond to customers’ sophisticated investment needs. We have implemented methods that are designed to better communicate information regarding product and service options to customers. The use of tablet computers enables BTMU’s sales representatives to propose products and services that match individual customers’ needs by showing them the latest market information, detailed information on major products and services, and asset management and life-plan simulations. All MUTB branches now offer “Private Account,” an asset management account service through which each customer can consult with his or her portfolio manager in person to manage investments according to a personalized plan.
Responding to Insurance Needs . BTMU acts as a sales channel for a variety of insurance products, including annuity insurance, single premium whole life insurance, flat-rate premium whole life insurance, medical insurance, cancer insurance and nursing-care insurance. Insurance-sales specialists (insurance planners) and staffs who have taken insurance-sales and other relevant training take care of customers’ various insurance needs. Individual annuity insurance, whole life insurance and medical insurance plans are available at all MUTB branches. Continued efforts will be made to further reinforce product lines and sales framework.
Responding to Needs Relating to Inheritance, Gift and Real Estate. MUTB offers a number of services including a testamentary trust service called “ Ishindenshin ” which helps customers prepare, maintain and execute wills, an inheritance planning service called “ Shisan Keisho Planning ” which helps customers manage and analyze financial assets and real estate properties comprehensively, and an inheritance procedure support service called “ Wakachi Ai ” which helps customers navigate the necessary procedures upon inheritance. BTMU and MUMSS also offer inheritance-related products and services, serving as sales agents of MUTB. In January 2013, MUTB’s asset management service called “ Zutto Anshin Shintaku ,” which helps customers and their families protect their funds and allows them to receive funds according to their chosen plan, received the “Nikkei Veritas Award” in the Nikkei Excellent Products & Services Awards for 2012. In April 2013, an educational fund gift trust product called “ Magoyorokobu ” was launched. BTMU also sells this product as a sales agent of MUTB. MUTB and Mitsubishi UFJ Real Estate Services offer real estate brokerage services for both investment and business properties and residential properties, responding to customers’ various real-estate-related needs.
Responding to Loan Needs. With respect to housing loans, BTMU offers “Loans with Supplemental Health Insurance for Seven Major Illnesses” through a third party insurance company to help with loan payments in case of unexpected major illnesses such as cancer or heart attacks, a group credit life insurance plan which is mandatory for housing loans, with reduced qualification requirements (“ Wide Danshin ”) and a preferred interest rate plan (“ Gun-to Ureshii Housing Loan ”). MUTB also offers housing loan plans incorporating “ Wide Danshin ” and other plans to respond to customers’ needs. BTMU also offers “Card Loans” and “Purpose-Specific Term Loans,” depending on customers’ needs. A card loan service called “BANQUIC” offers access to cash as quickly as in 40 minutes after the submission of an application through a video teller machine. Also, online applications are accepted 24 hours a day, 365 days a year, and the underwriting process can be completed as quickly as in 30 minutes. Applications are also accepted over the phone. A card loan service called “My Card Plus” automatically loans money into the customers linked account when its balance becomes negative. Customers who already have an account with BTMU can apply for this service online. “Net DE Loan” is a purpose-specific term loan, which BTMU-account-holder customers can, in most circumstances, apply for without visiting a bank branch. This loan can be used to pay for education, motor vehicle purchases and other purposes.
Responding to Internet Banking Needs. BTMU and MUTB offer Internet banking services called “Mitsubishi Tokyo UFJ Direct” and “Mitsubishi UFJ Trust Direct,” respectively, which allow customers to,
31
Table of Contents
among other things, transfer money, check their balance, make time deposits, make investments, apply for housing loans, and consult specialists regarding investments. In 2013, transaction screens of “Mitsubishi Tokyo UFJ Direct” were renewed, making the service even more user-friendly. The number of users has grown to approximately 14 million as of March 31, 2014. Jibun Bank Corporation was founded by BTMU in collaboration with KDDI Corporation in June 2008. The convenience that Jibun Bank offers by allowing users to execute transactions at any time on their cellphones has attracted customers in a wide age group. In addition to enabling users to check their balance and transfer money, Jibun Bank offers other products and services such as yen-denominated time deposits, foreign currency deposits, and, since June 2013, “Jibun Bank FX” (over-the-counter foreign exchange margin trading). As of March 31, 2014, Jibun Bank had approximately 1.6 million retail customer accounts with a total balance of deposits of ¥560 billion. Jibun Bank aims to continue offering high-quality services under the motto of “a bank in the palm of your hand.”
Credit Card Business. Mitsubishi UFJ Nicos offers a variety of credit cards, including “MUFG Card (Gold Card),” a credit card with an annual fee starting at as low as ¥2,000. With five international credit card brands (JCB, Visa, Master Card ® , American Express ® and China UnionPay) available, MUFG Card is designed to meet customers’ various needs. BTMU’s “Mitsubishi Tokyo UFJ VISA” offers numerous attractive reward programs, such as cash-back in exchange for earned points.
Development of Branch and ATM Networks. We have an extensive network of branches in the greater Tokyo, Nagoya and Osaka areas. Also, “MUFG Plazas,” which are operated jointly by BTMU, MUTB and MUMSS, are strategically located across Japan. BTMU and MUTB have a nationwide ATM network, making use of convenience store ATMs and partnerships with other banks in addition to BTMU and MUTB’s own ATMs. In an effort to improve access to its ATMs, BTMU increased its ATM locations and extended operating hours and transaction-fee-free hours in 2013. At the same time, BTMU introduced a revised fee schedule for using partner banks’ ATMs and transferring money using ATMs.
Finance Facilitation. We believe that finance facilitation for customers is one of our most important social responsibilities and strive to exemplify that standard. Although the Act Concerning Temporary Measures to Facilitate Financing for Small and Medium-sized Firms and Others has expired, our basic policy has not changed. We seek to offer consultation and otherwise deal attentively with small and medium-sized enterprise, or SME, customers who wish to modify terms and conditions for repayment.
Strengthening the Compliance Framework. We have been making efforts to strengthen our frameworks for customer protection and legal compliance. BTMU has 260 compliance specialists stationed at its branches across the country. As for MUTB, branches are given guidance by compliance officers based in the Head Office. We intend to continue to strictly monitor the legal compliance associated with selling financial products and services.
Integrated Corporate Banking Business Group
The Integrated Corporate Banking Business Group covers domestic corporate businesses, including commercial banking, investment banking, trust banking and securities businesses, as well as businesses outside of Japan assisting mainly Japanese companies in executing and expanding their operations. Through the integration of these business lines, diverse financial products and services are provided mainly to our Japanese corporate customers, from large corporations to medium-sized and small businesses. The business group has clarified strategic domains, sales channels and methods to match the different growth stages and financial needs of our corporate customers.
Commercial Banking
We provide various financial solutions, such as loans and fund management, remittance and foreign exchange services, to meet the requirements of small and medium-sized enterprise customers. We also help our customers develop business strategies, such as overseas expansions, inheritance-related business transfers and stock listings.
32
Table of Contents
CIB (Corporate and Investment Banking)
We offer advanced financial solutions mainly to large corporations through corporate and investment banking services. Product specialists globally provide derivatives, securitization, syndicated loans, structured finance, and other services. We also provide investment banking services, such as M&A advisory, bond and equity underwriting, to meet our customers’ needs.
A large part of our investment banking business in Japan is provided by MUMSS which was formed in May 2010 through the integration of the domestic wholesale and retail securities business previously conducted by MUS and the investment banking business conducted by Morgan Stanley Japan. See “—Global Strategic Alliance with Morgan Stanley” below.
Transaction Banking
Our transaction banking operations support customers with capital management, focusing on cash management and trade finance. Through our global network we support customers who wish to establish a global manufacturing and sales network with our friendly services and commitment to quality.
Trust Banking
MUTB’s experience and know-how in the asset management business, real estate brokerage and appraisal services, and stock transfer agency services also enable us to offer services tailored to the financial strategies of each client, including securitization of real estate, receivables and other assets.
Integrated Trust Assets Business Group
The Integrated Trust Assets Business Group covers asset management and administration services for products such as pension trusts and security trusts by integrating the trust banking expertise of MUTB and the international strengths of BTMU. The business group provides a full range of services to corporate and pension funds, including stable and secure pension fund management and administration, advice on pension schemes, and payment of benefits to scheme members.
Our Integrated Trust Assets Business Group combines MUTB’s trust assets business, comprising trust assets management services, asset administration and custodial services, and the businesses of Mitsubishi UFJ Global Custody S.A., Mitsubishi UFJ Fund Services, Mitsubishi UFJ Asset Management Co., Ltd. and KOKUSAI Asset Management Co., Ltd.
Mitsubishi UFJ Global Custody S.A. and Mitsubishi UFJ Fund Services provide global custody services, administration services for investment funds and fiduciary and trust accounts, and other related services mainly to institutional investors.
Mitsubishi UFJ Asset Management and KOKUSAI Asset Management provide asset management and trust products and services mainly to individual customers and corporate clients in Japan.
MUTB acquired Mitsubishi UFJ Fund Services (MFS), formerly known as Butterfield Fulcrum Group, in September 2013. We have taken this opportunity to establish and promote a new brand called “MUFG Investor Services.” Under this brand, we provide a full suite of global asset administration services, including fund administration, custody, securities lending and foreign exchange as a one stop shop.
With an aim to further enhance its business, MUTB has strategic alliances with asset management companies outside of Japan, including Aberdeen Asset Management PLC, a U.K. asset manager, and AMP Capital Holdings Limited, an Australian asset manager.
Integrated Global Business Group
The Integrated Global Business Group was established on July 1, 2011 to effectively coordinate and enhance our group-wide efforts to strengthen and expand overseas operations. Integrated Global Business Group is designed to clarify the leadership in, and enhance the coordination for, our overseas strategies on a group-wide basis.
33
Table of Contents
Overseas business development has been an important pillar of our growth strategy. Aiming to further raise our presence in the global financial market, we are shifting our approach where each of our group companies individually promotes its overseas business to a more group-wide approach. The new approach is designed to enable us to exercise our comprehensive expertise to provide our customers with value-added services more effectively.
As global financial regulations have become increasingly stringent following the recent global financial crisis, the realignment in the global financial industry has accelerated with financial institutions merging and entering into alliances particularly in Europe and the United States. Moreover, the importance of emerging markets in Asia and other regions has been rapidly growing, and the business environment surrounding the international financial industry is becoming more complex. In addition, customers’ financing needs are becoming more diverse and sophisticated as their activities are becoming more globalized.
Amidst this dynamic environment, the Integrated Global Business Group covers our overseas businesses, including commercial banking services such as loans, deposits and cash management services, retail banking, trust assets and securities businesses (with the retail banking and trust assets businesses being conducted through MUB), through a global network of more than 500 offices outside of Japan to provide customers with financial products and services that meet their increasingly diverse and sophisticated financing needs.
CIB (Corporate and Investment Banking)
Our global CIB business primarily serves large corporations, financial institutions, and sovereign and multinational organizations with a comprehensive set of solutions for their financing needs. Through our global network of offices and branches, we provide a full range of services, including corporate banking services such as project finance, export credit agency, or ECA, finance, and financing through asset-backed commercial papers. We also provide investment banking services such as debt/equity issuance and M&A advisory services to help our clients develop their financial strategies and realize their goals. In order to meet clients’ various financing needs, we have established a client-oriented coverage model through which we coordinate our product experts who offer innovative finance services globally. We are among the world’s top providers of project finance, one of the core businesses of CIB. We provide professional services in arranging limited-recourse finance and offering financial advice in various sectors, including natural resources, power, and infrastructure, backed by our experience, expertise, knowledge, and global network.
Transaction Banking
We have Transaction Banking offices in six locations around the globe through which we provide commercial banking products and services primarily for large corporations and financial institutions in managing and processing domestic and cross-border payments, mitigating risks in international trade, and providing working capital optimization. A team of approximately 400 officers provides customers with support for their domestic, regional and global trade finance and cash management programs through our extensive global network.
MUFG Union Bank, N.A., (MUB)
MUB is the primary subsidiary of MUAH, which is a wholly owned subsidiary of BTMU and is a bank holding company in the United States. Effective July 1, 2014, BTMU’s operations in the Americas region were integrated with MUAH’s operations. MUAH oversees BTMU’s operations in the Americas region and MUB is the primary operating entity of BTMU in the United States. MUB is a leading regional bank in California, ranked by the Federal Deposit Insurance Corporation, or FDIC, as the 20th largest bank in the United States in terms of total deposits as of March 2014. MUB provides a wide range of financial services to consumers, small businesses, middle-market companies and major corporations, primarily in California, Oregon, Washington, and Texas as well as nationally and internationally. In October 2012, MUB acquired Smartstreet, formerly a division of Atlanta-based PNC Bank, N.A. which had approximately $1.0 billion in deposits and provided banking
34
Table of Contents
services nationwide to homeowners associations and community association management companies in the United States. In December 2012, MUAH acquired Pacific Capital Bancorp, a bank holding company based in California with approximately $6.7 billion in total assets and approximately $4.7 billion in deposits. In June 2013, MUB acquired PB Capital Corporation’s institutional commercial real estate lending division platform. Headquartered in New York, the commercial real estate lending division of PB Capital had approximately $3.5 billion in loans outstanding on properties in various major metropolitan areas in the United States as of June 14, 2013. In November 2013, MUB completed the acquisition of First Bank Association Bank Services, a unit of First Bank, which provided a full range of banking services to homeowners associations and community management companies. MUB acquired approximately $570 million in deposits in this transaction. For more information, see “Item 5. Operating and Financial Review and Prospects—Recent Developments.”
Activities in Asia
We have been expanding our operations in Asia in an effort to further develop our operations abroad. We opened five office and branch locations recently, namely Ulaanbaatar Representative Office in Mongolia, Suryacipta City of Industry Service Point in Indonesia, BTMU (China) Shanghai Pilot Free Trade Zone Sub-Branch, Bangalore Branch in India, and BTMU (China) Suzhou branch.
Global Markets
Global Markets covers asset and liability management and strategic investments of BTMU and MUTB, and sales and trading of financial products of BTMU, MUTB and MUSHD. Effective July 1, 2012, the Integrated Global Business Group and Global Markets started working jointly on some of the sales and trading businesses of MUSHD’s foreign subsidiaries as part of our efforts to strengthen the cooperation between BTMU and MUSHD of their markets businesses and to expand investor relationships while improving our trading capabilities to seize interest rate and foreign exchange market opportunities for loans and corporate bond transactions. Accordingly, during the year ended March 31, 2013, we began reporting a portion of the securities sales and trading businesses, which previously was presented within the Integrated Global Business Group, as part of Global Markets.
Global Strategic Alliance with Morgan Stanley
As of March 31, 2014, we hold approximately 432 million shares of Morgan Stanley’s common stock representing approximately 21.9% of the voting rights in Morgan Stanley and Series C Preferred Stock with a face value of approximately $521.4 million, or ¥53.6 billion, and 10% dividend. As of the same date, we had two representatives appointed to Morgan Stanley’s board of directors. We adopted the equity method of accounting for our investment in Morgan Stanley beginning with the fiscal year ended March 31, 2012.
In conjunction with Morgan Stanley, we formed two securities joint venture companies in May 2010 to integrate our respective Japanese securities companies. We converted the wholesale and retail securities businesses conducted in Japan by MUS into MUMSS. Morgan Stanley contributed the investment banking operations conducted in Japan by its former wholly-owned subsidiary, Morgan Stanley Japan, to MUMSS, and converted the sales and trading and capital markets businesses conducted in Japan by Morgan Stanley Japan into an entity called Morgan Stanley MUFG Securities, Co., Ltd., or MSMS. We hold a 60% economic interest in MUMSS and MSMS, and Morgan Stanley holds a 40% economic interest in MUMSS and MSMS. We hold a 60% voting interest and Morgan Stanley holds a 40% voting interest in MUMSS, and we hold a 49% voting interest and Morgan Stanley holds a 51% voting interest in MSMS. Morgan Stanley’s and our economic and voting interests in the securities joint venture companies are held through intermediate holding companies. We have retained control of MUMSS and we account for our interest in MSMS under the equity method due to our significant influence over MSMS. The board of directors of MUMSS has fifteen members, nine of whom are designated by us and six of whom are designated by Morgan Stanley. The board of directors of MSMS has ten members, six of whom are designated by Morgan Stanley and four of whom are designated by us. The CEO of MUMSS is designated by us and the CEO of MSMS is designated by Morgan Stanley.
35
Table of Contents
We have also expanded the scope of our global strategic alliance with Morgan Stanley into other geographies and businesses, including (1) a loan marketing joint venture that provides clients in the United States with access to expand the world-class lending and capital markets services from both companies, (2) an agreement to establish business referral arrangements in Asia, Europe, the Middle East and Africa, covering capital markets, loans, fixed income sales and other businesses, (3) a global commodities referral agreement whereby BTMU and its affiliates refer clients in need of commodities-related hedging solutions to certain affiliates of Morgan Stanley, and (4) an employee secondment program to share best practices and expertise in a wide range of business areas.
We completed transactions to transfer shares of Mitsubishi UFJ Merrill Lynch PB Securities Co., Ltd. among our consolidated subsidiaries on March 20, 2014. Upon completion of the transactions, MUMSS holds 75%, and BTMU holds the remaining 25%, of the voting rights in the company. Prior to the transactions, MUSHD held 51%, and BTMU held the remaining 49%, of the voting rights in the company. Concurrent with the completion of the transactions, the company changed its name to “Mitsubishi UFJ Morgan Stanley PB Securities Co., Ltd.” In connection with its new shareholdings, Mitsubishi UFJ Morgan Stanley PB Securities entered into a new service agreement with Morgan Stanley. Mitsubishi UFJ Morgan Stanley PB Securities leverages MUFG’s broad customer base, utilizes Morgan Stanley’s global and high quality insight, and further its collaborations with other group companies by strengthening its coordination with MUMSS. It aims for further development of its wealth management business, which is one of the largest in Japan.
See “Item 3.D. Key Information—Risk Factors—Risks Related to Our Business—If our strategic alliance with Morgan Stanley fails, we could suffer financial or reputational loss.”
Acquisition of Bank of Ayudhya Shares through Voluntary Tender Offer
On December 18, 2013, BTMU completed a voluntary tender offer (VTO) for shares of Krungsri in Thailand at 39 Thai Baht per share. BTMU purchased 72.01% (4,373,714,120 shares) shares of Krungsri for ¥545.8 billion in cash. As a result, Krungsri became a subsidiary of BTMU. Under a Conditional Branch Purchase Agreement between BTMU and Krungsri, or the BPA, dated September 18, 2013, BTMU’s Bangkok Branch will be integrated with Krungsri through a contribution in kind of the BTMU Bangkok Branch business to Krungsri within one year from the date of the acquisition of Krungsri shares through the VTO. The effective date of the integration, however, is subject to change in accordance with an agreement between the parties and regulatory approval. In exchange for the contribution in kind, Krungsri will issue 1,143,221,782 common shares to BTMU, and BTMU’s ownership in Krungsri is expected to be 76.44% immediately following the integration. However, the number of shares to be issued by Krungsri is subject to change in accordance with a price adjustment clause with a maximum of 1,500,000,000 shares and no specified minimum under the BPA.
For more information on recent transactions in Asia, see “Item 5. Operating and Financial Review and Prospects—Recent Developments.”
Competition
We face strong competition in all of our principal areas of operations. The structural reforms in the regulation of the financial industry and recent developments in financial markets have resulted in some significant changes in the Japanese financial system and prompted banks to merge or reorganize their operations, thus changing the nature of competition from other financial institutions as well as from other types of businesses.
Japan
Since their formation in 2000 and 2001, the so-called Japanese “mega bank” groups, including us, the Mizuho Financial Group and the Sumitomo Mitsui Financial Group, have continued to expand their businesses and take measures designed to enhance their financial group capabilities. For example, Mizuho Bank, Ltd. and Mizuho Corporate Bank, Ltd. merged in July 2013, and the merged entity presently operates under the corporate name of “Mizuho Bank, Ltd.”
36
Table of Contents
Heightened competition among the mega bank groups is currently expected in the various financial sectors as they have recently announced plans to expand, or have expanded, their respective businesses. For example, in the securities sector, in May 2010, we created two securities joint venture companies in Japan in conjunction with Morgan Stanley, MUMSS and MSMS, by integrating the operations of MUS and Morgan Stanley Japan. In May 2009, Mizuho Securities Co., Ltd. acquired Shinko Securities Co., Ltd. In September 2011, the Norinchukin Bank, Mizuho Corporate Bank and Mizuho Securities entered into definitive agreements to expand areas of business cooperation and enhance collaborative relationships. In January 2013, Mizuho Securities and Mizuho Investors Securities Co., Ltd. merged. In October 2009, the Sumitomo Mitsui Financial Group acquired the former Nikko Cordial Securities Inc. and other businesses from Citigroup Inc. For a discussion of the two securities joint venture companies created by us and Morgan Stanley, see “—B. Business Overview—Global Strategic Alliance with Morgan Stanley.”
In the retail business sector, customers often have needs for a broad range of financial products and services, such as investment trusts and insurance products. Recently, competition has increased due to the development of products and distribution channels. For example, Japanese banks have started competing with one another by developing innovative proprietary computer technologies that allow them to deliver basic banking services in a more efficient manner, such as internet banking services, and to create sophisticated new products in response to customer demand. In addition, the Japanese individual savings account system, generally referred to as the NISA program, commenced in January 2014, and offers tax exemptions on capital gains and dividend income for investments up to ¥1 million a year for a maximum of five years. Competition in the retail business sector is also expected to increase due to the implementation of the NISA program.
In the private banking sector, competition among the mega bank groups has intensified as a result of recent corporate actions designed to strengthen their operations. We made Mitsubishi UFJ Merrill Lynch PB Securities Co., Ltd. a wholly owned subsidiary in December 2012 to enhance our private banking services for high net-worth customers, and changed its name to Mitsubishi UFJ Morgan Stanley PB Securities, Ltd. in March 2014. In October 2013, Sumitomo Mitsui Banking Corporation acquired the former Société Générale Private Banking Japan, Ltd. from Société Générale S.A. and changed its name to SMBC Trust Bank Ltd.
In the consumer finance sector, recent regulatory reforms and legal developments have negatively impacted the business environment, resulting in failures of several consumer finance companies and intensified competitions among consumer finance companies that have remained in business, particularly among those affiliated with the mega banks. In April 2012, Promise Co., Ltd. became a wholly owned subsidiary of the Sumitomo Mitsui Financial Group, and changed its name as SMBC Consumer Finance Co., Ltd. in July 2012. See “Item 3.D. Key Information—Risk Factors—Risks Related to Our Business—Because of our loans to consumers and our shareholdings in companies engaged in consumer lending, changes in the business or regulatory environment for consumer finance companies in Japan may further adversely affect our financial results.”
The trust assets business is an area that is becoming increasingly competitive because of regulatory changes in the industry that have expanded the products and services that can be offered since the mid-2000s . In addition, there is growing corporate demand for changes in the trust regulatory environment, such as reforms of the pension system and related accounting regulations under Japanese GAAP. Competition may increase in the future as changes are made to respond to such corporate demand and regulatory barriers to entry are lowered. In October 2009, The Sumitomo Trust and Banking Co., Ltd. acquired Nikko Asset Management Co., Ltd. from Citigroup Inc. In April 2011, Sumitomo Trust and Banking and Chuo Mitsui Trust Holdings, Inc. established Sumitomo Mitsui Trust Holdings, Inc., a holding company, to integrate their operations. In April 2012, Sumitomo Trust and Banking, The Chuo Mitsui Trust and Banking Company, Limited and Chuo Mitsui Asset Trust and Banking Company, Limited, the three trust bank subsidiaries of Sumitomo Mitsui Trust Holdings, merged and were renamed Sumitomo Mitsui Trust Bank, Limited. As a result, competition is expected to intensify in the asset management and trust assets businesses.
37
Table of Contents
In recent years, the Japanese government has identified several governmental financial institutions as candidates to privatize. In particular, the privatization of the Japan Post Group companies could substantially increase competition within the financial services industry as Japan Post Bank Co., Ltd. is one of the world’s largest holders of deposits. Although the Japanese government’s privatization plan for the Japan Post Group companies was suspended in December 2009, a revised postal privatization law became effective in May 2012, allowing the government to commence its sales of shares in the Japan Post Group companies. The revised law requires Japan Post Holdings Co., Ltd. to make efforts to sell its shares in Japan Post Bank and Japan Post Insurance Co., Ltd. as soon as possible but does not provide a specific deadline. Additionally, under the revised law, Japan Post Bank and Japan Post Insurance may enter into new business areas upon obtaining required government approvals, and if the government’s equity holdings decrease to a certain level, the two companies will be allowed to enter into new business areas upon submission of a notice to the government. As a result, the Japan Post Group companies may seek to enter into new financial businesses and increasingly compete with us. The privatization of the Japan Post Group companies remains subject to political negotiations and government action. Nonetheless, Japan Post may seek new business opportunities that compete with our business in Japan. See “Item 3.D. Key Information—Risk Factors—Risks Related to Our Business—Our business may be adversely affected by competitive pressures, which have partly increased due to regulatory changes and recent market changes in the financial industry domestically and globally” and “—B. Business Overview—The Japanese Financial System—Government Financial Institutions.”
The mega bank groups face significant competition with other domestic and foreign financial groups. For example, the Nomura Group has been a major player in the securities market in Japan, and Citigroup Inc. conducts its banking business in Japan through a locally incorporated banking subsidiary. In addition, various Japanese non-bank financial institutions and non-financial companies have entered into the Japanese banking sector. For example, Orix Corporation, a non-bank financial institution, and the Seven & i Holdings group and Sony Corporation, which were both non-financial companies, offer various banking services, often through non-traditional distribution channels.
Foreign
In the United States, we face substantial competition in all aspects of our business. We face competition from large U.S. and non-U.S. money-center banks, as well as from similar institutions that provide financial services. Through MUB, we currently compete principally with U.S. and non-U.S. money-center and regional banks, thrift institutions, asset management companies, investment advisory companies, consumer finance companies, credit unions and other financial institutions.
In other international markets, we also face competition from commercial banks and similar financial institutions, particularly major international banks and the leading domestic banks in the local financial markets in which we conduct business. For example, Japanese mega banks, including us, and other major international banks have been expanding, or are expected to expand, their operations in the Asian market, where leading local banks have been growing and increasing their presence recently. As a result, we are exposed to intense competition in Asia. Furthermore, we are aiming to expand our retail and small and medium enterprises businesses along with our corporate banking business in South East Asia through our acquisition of Krungsri in Thailand, and compete with leading local banks in such businesses.
In addition, we may face further competition as a result of recent investments, mergers and other business tie-ups among global financial institutions.
The Japanese Financial System
Japanese financial institutions may be categorized into three types:
| Ÿ |
the central bank, namely the Bank of Japan; |
| Ÿ |
private banking institutions; and |
| Ÿ |
government financial institutions. |
38
Table of Contents
The Bank of Japan
The Bank of Japan’s role is to maintain price stability and the stability of the financial system to ensure a solid foundation for sound economic development.
Private Banking Institutions
Private banking institutions in Japan are commonly classified into two categories (the following numbers are based on information published by the Financial Services Agency of Japan available as of June 23, 2014):
| Ÿ |
ordinary banks (125 ordinary banks and 55 foreign commercial banks with ordinary banking operations); and |
| Ÿ |
trust banks (16 trust banks, including two Japanese subsidiaries of foreign financial institutions). |
Ordinary banks in turn are classified as city banks, of which there are four, including BTMU, and regional banks, of which there are 106 and other banks, of which there are 15. In general, the operations of ordinary banks correspond to commercial banking operations in the United States. City banks and regional banks are distinguished based on head office location as well as the size and scope of their operations.
The city banks are generally considered to constitute the largest and most influential group of banks in Japan. Generally, these banks are based in large cities, such as Tokyo and Osaka, and operate nationally through networks of branch offices. City banks have traditionally emphasized their business with large corporate clients, including the major industrial companies in Japan. However, many of these banks, including BTMU, in recent years have increased their emphasis on other markets, such as small and medium-sized companies and retail banking.
With some exceptions, the regional banks tend to be much smaller in terms of total assets than the city banks. Each of the regional banks is based in one of the Japanese prefectures and extends its operations into neighboring prefectures. Their clients are mostly regional enterprises and local public utilities. The regional banks also lend to large corporations. In line with the recent trend among financial institutions toward mergers or business tie-ups, various regional banks have announced or are currently negotiating or pursuing integration transactions.
Trust banks, including MUTB, provide various trust services relating to money trusts, pension trusts and investment trusts and offer other services relating to real estate, stock transfer agency and testamentary services as well as banking services.
In recent years, almost all of the city banks have consolidated with other city banks and in some cases, integrated with trust banks. Consolidation or integration among these banks was achieved, in most cases, through the use of a bank holding company.
In addition to ordinary banks and trust banks, other private financial institutions in Japan, including shinkin banks, or credit associations, and credit cooperatives, are engaged primarily in making loans to small businesses and individuals.
Government Financial Institutions
There are a number of government financial institutions in Japan, which are corporations wholly owned by the government and operate under the government’s supervision. Their funds are provided mainly from government sources. Certain types of operations undertaken by these institutions have been or are planned to be assumed by, or integrated with the operations of, private corporations through privatization and other measures.
Among them are the following:
| Ÿ |
The Development Bank of Japan, which was established for the purpose of contributing to the economic development of Japan by extending long-term loans, mainly to primary and secondary sector industries, |
39
Table of Contents
|
and which was reorganized as a joint stock company in October 2008 as part of its ongoing privatization process, the target completion date for which has been postponed until sometime between April 2020 and March 2022; |
| Ÿ |
Japan Finance Corporation, which was formed in October 2008, through the merger of the international financial operations of the former Japan Bank for International Cooperation, National Life Finance Corporation, Agriculture, Forestry and Fisheries Finance Corporation, and Japan Finance Corporation for Small and Medium Enterprise, for the primary purposes of supplementing and encouraging the private financing of exports, imports, overseas investments and overseas economic cooperation, and supplementing private financing to the general public, small and medium enterprises and those engaged in agriculture, forestry and fishery. In April 2012, Japan Finance Corporation spun off its international operations to create Japan Bank for International Cooperation as a separate government-owned entity; |
| Ÿ |
Japan Housing Finance Agency, which was originally established in June 1950 as the Government Housing Loan Corporation for the purpose of providing housing loans to the general public, and which was reorganized as an incorporated administrative agency and started to specialize in securitization of housing loans in April 2007; and |
| Ÿ |
The Japan Post Group companies, a group of joint stock companies including Japan Post Bank, which were formed in October 2007 as part of the Japanese government’s privatization plan for the former Japan Post, a government-run public services corporation, which had been the Postal Service Agency until March 2003. The Japanese government’s privatization plan for the Japan Post Group companies was suspended in December 2009. In May 2012, a revised postal privatization law became effective, allowing the government to commence its sales of shares in the Japan Post Group companies in the future. |
Supervision and Regulation
Japan
Supervision . The Financial Services Agency of Japan, an agency of the Cabinet Office, or the FSA, is responsible for supervising and overseeing financial institutions, making policy for the overall Japanese financial system and conducting insolvency proceedings with respect to financial institutions. The Bank of Japan, as the central bank for financial institutions, also has supervisory authority over banks in Japan, based primarily on its contractual agreements and transactions with the banks.
The Banking Law . Among the various laws that regulate financial institutions, the Banking Law and its subordinated orders and ordinances are regarded as the fundamental law for ordinary banks and other private financial institutions. The Banking Law addresses capital adequacy, inspections and reporting to banks and bank holding companies, as well as the scope of business activities, disclosure, accounting, limitation on granting credit and standards for arm’s length transactions for them. As a result of the amendment to the Banking Law and the Financial Instruments and Exchange Law, effective as of June 2009, firewall regulations that separate bank holding companies or banks from affiliated securities companies have become less stringent. On the other hand, bank holding companies, banks and other financial institutions are required to establish an appropriate system to better cope with conflicts of interest that may arise from their business operations.
In June 2013, the Diet passed a bill to amend various financial regulation related laws, including the Banking Law, which includes certain deregulations on restrictions for shareholdings by banks. For example, although a bank is generally prohibited from holding more than 5% of the outstanding shares of another company (other than certain financial institutions) under the Banking Law, the bank may be exempt from such requirement and allowed to hold more than 5% of the outstanding shares of such company, if, among other exempted cases, a bank’s shareholding contributes to revitalizing a company’s business or the local economy related to such company. The exemption became effective on April 1, 2014.
40
Table of Contents
Bank holding company regulations . A bank holding company is prohibited from carrying out any business other than the management of its subsidiaries and other incidental businesses. A bank holding company may have any of the following as a subsidiary: a bank, a securities company, an insurance company and a foreign subsidiary that is engaged in the banking, securities or insurance business. In addition, a bank holding company may have as a subsidiary, any company that is engaged in a finance-related business, such as a credit card company, a leasing company or an investment advisory company. Certain companies that are designated by a ministerial ordinance as those that cultivate new business fields may also become the subsidiary of a bank holding company.
Capital adequacy. The capital adequacy guidelines adopted by the FSA that are applicable to Japanese bank holding companies and banks with international operations closely follow the risk-weighted approach introduced by the Basel Committee on Banking Supervision of the Bank for International Settlements, or BIS.
The Group of Central Bank Governors and Heads of Supervision reached an agreement on the new global regulatory framework, which has been referred to as “Basel III,” in July and September 2010. In December 2010, the Basel Committee agreed on the details of the Basel III rules. The agreement on Basel III includes the following: (1) raising the quality of capital to ensure banks are able to better absorb losses on both a going concern and a gone concern basis, (2) increasing the risk coverage of the capital framework, in particular for trading activities, securitizations, exposures to off-balance sheet vehicles and counterparty credit exposures arising from derivatives, (3) raising the level of minimum capital requirements, including an increase in the minimum common equity requirement from 2% to 4.5%, which is planned to be phased in between January 1, 2013 and January 1, 2015, and a capital conservation buffer of 2.5%, which is planned to be phased in between January 1, 2016 and year end 2018, bringing the total common equity requirement to 7%, (4) introducing an internationally harmonized leverage ratio to serve as a backstop to the risk-based capital measure and to contain the build-up of excessive leverage in the system, (5) raising standards for the supervisory review process (Pillar 2) and public disclosures (Pillar 3), together with additional guidance in the areas of sound valuation practices, stress testing, liquidity risk management, corporate governance and compensation, (6) introducing minimum global liquidity standards consisting of both a short term liquidity coverage ratio and a longer term, structural net stable funding ratio, and (7) promoting the build-up of capital buffers that can be drawn down in periods of stress, including both a capital conservation buffer and a countercyclical buffer to protect the banking sector from periods of excess credit growth.
Certain provisions of Basel III were adopted by the FSA effective March 31, 2013 for Japanese banking institutions with international operations conducted by their foreign offices. Based on the Basel III framework, the Japanese capital ratio framework has been revised to implement more stringent capital adequacy requirements to prevent excessive risk takings. Under Basel III, Common Equity Tier 1, Tier 1 and total capital ratios are used to assess capital adequacy, which ratios are determined by dividing applicable capital components by risk-weighted assets. Total capital is defined as the sum of Tier 1 and Tier 2 capital, and the target minimum total capital ratio is 8.0%, which consists of a target minimum Tier 1 capital ratio of 6.0% (including a target minimum Common Equity Tier 1 capital ratio of 4.5% and a target minimum Additional Tier 1 capital ratio of 1.5%) and a target minimum Tier 2 capital ratio of 2.0%. These minimum capital ratios are applicable to MUFG on a consolidated basis and to BTMU and MUTB on a consolidated as well as stand-alone basis.
Under Basel III, Tier 1 capital is defined to include Common Equity Tier 1 and Additional Tier 1 capital. Common Equity Tier 1 capital is a new category of capital primarily consisting of:
| Ÿ |
common stock, |
| Ÿ |
capital surplus, |
| Ÿ |
retained earnings, and |
| Ÿ |
other comprehensive income (progressively phased into the capital ratio calculation over several years). |
41
Table of Contents
Regulatory adjustments including certain intangible fixed assets, such as goodwill, and defined benefit pension fund net assets (prepaid pension costs) will be deducted from Common Equity Tier 1 capital. The amount of adjustments to be deducted will increase progressively over time.
Additional Tier 1 capital generally consists of Basel III compliant preferred securities and, during the transition period, other capital that meets Tier I requirements under the former Basel II standards, net of regulatory adjustments. Subject to transitional measures, adjustments are made to Additional Tier 1 capital for items including intangible fixed assets, such as goodwill, and foreign currency translation adjustments, with the amounts of such adjustments to Additional Tier 1 capital progressively decreasing over time.
Tier 2 capital generally consists of:
| Ÿ |
Basel III compliant deferred obligations, |
| Ÿ |
during the transition period, capital that meet Tier II requirements under the former Basel II standards, |
| Ÿ |
allowances for credit losses, and |
| Ÿ |
non-controlling interests in subsidiaries’ Tier 2 capital instruments. |
Subject to transitional measures, certain items including 45% of unrealized profit on securities available for sale and revaluation of land are reflected in Tier 2 capital with the amounts progressively decreasing over time.
In order to qualify as Tier 1 or Tier 2 capital under Basel III, applicable instruments such as preferred shares and subordinated debt must have a clause in their terms and conditions that requires them to be written-off or forced to be converted into common stock upon the occurrence of certain trigger events.
Risk-weighted assets are the sum of risk-weighted assets compiled for credit risk purposes, quotient of dividing the amount equivalent to market risk by 8%, and quotient of dividing the amount equivalent to operational risk by 8%, and also include amount to be added due to transitional measures as well as floor adjustments, if necessary. Risk-weighted assets include the capital charge of the credit valuation adjustment (CVA), the credit risk related to asset value correlation multiplier for large financial institutions, the 250% risk-weighted threshold items not deducted from Common Equity Tier 1 capital, and certain Basel II capital deductions that were converted to risk-weighted assets under Basel III, such as securitizations and significant investments in commercial entities. Under the FSA guidelines, Basel III is expected to be adopted progressively over several years. For example, from March 31, 2013 until March 30, 2014, the minimum capital ratio is 3.5% for Common Equity Tier 1, 4.5% for Tier 1 capital, and 8.0% for total capital, and the requirement will be progressively raised to meet the Basel III requirement by March 31, 2015. Additionally, certain items that will no longer be counted towards Tier 1 and Tier 2 capital will be progressively phased out of the capital ratio calculation over several years to arrive at the capital base required by Basel III.
We have been granted an approval by the FSA to exclude the majority of our investment in Morgan Stanley from being subject to double gearing adjustments. The approval was granted for a 10-year period, but the approval amount will be phased out by 20% each year starting from March 31, 2019. As of March 31, 2014, a full application of double gearing adjustments with respect to our investment in Morgan Stanley would have reduced our Common Equity Tier 1 capital ratio by approximately 0.7%.
The Basel Committee on Banking Supervision has proposed additional loss absorbency requirements to supplement the Common Equity Tier 1 capital requirement ranging from 1% to 3.5% for global systemically important banks, or G-SIBs, depending on the bank’s systemic importance. The Financial Stability Board identified us as a G-SIB in its most recent annual report published in November 2013, and indicated that, as a G-SIB, we would be required to hold an additional 1.5% of Tier 1 common equity. The group of banks identified as G-SIBs is expected to be updated annually, and the first group of G-SIBs to which the stricter capital requirements will initially be applied is expected to be identified in 2014. The stricter capital requirements are expected to be implemented in phases between January 1, 2016 and December 31, 2018 and will become fully effective on January 1, 2019.
42
Table of Contents
As for local banking regulations outside of Japan, such as those in the United States, in July 2013, the FRB and the other U.S. federal banking agencies adopted final rules making significant changes to the U.S. regulatory capital framework for U.S. banking organizations to conform it to the Basel III global regulatory capital framework. The final rules establish more restrictive capital definitions, create additional categories and higher risk weightings for certain asset classes and off-balance sheet exposures, higher minimum capital and leverage ratios and capital conservation buffers that will be added to the minimum capital requirements. The final rules began to apply to MUAH and MUB on January 1, 2014, subject to certain transition provisions.
For a discussion on our capital ratios, see “Item 5.B. Operating and Financial Review and Prospects—Liquidity and Capital Resources—Capital Adequacy.”
Inspection and reporting . By evaluating banks’ systems of self-assessment, auditing their accounts and reviewing their compliance with laws and regulations, the FSA monitors the financial soundness of banks, including the status and performance of their control systems for business activities. The FSA applies the Financial Inspection Rating System, or FIRST, to major banks. By providing inspection results in the form of graded evaluations (i.e., ratings), the FSA expects this rating system to motivate financial institutions to voluntarily improve their management and operations. Additionally, the FSA currently takes the “better regulation” approach in its financial regulation and supervision. This consists of four pillars: (1) optimal combination of rules-based and principles-based supervisory approaches, (2) timely recognition of priority issues and effective responses, (3) encouraging voluntary efforts by financial firms and placing greater emphasis on providing them with incentives, and (4) improving the transparency and predictability of regulatory actions, in pursuit of improvement of the quality of financial regulation and supervision.
In September 2013, the FSA announced its updated policy for monitoring financial institutions, which places a greater emphasis on identifying and minimizing significant risks to the financial system as a whole. Under the new policy, the FSA is expected to increase monitoring of, and communication with, financial institutions, particularly large global financial institutions, including us, and enhance cooperation with financial regulatory bodies in other jurisdictions.
The FSA, if necessary to secure the sound and appropriate operations of a bank’s business, may request the submission of reports or materials from, or conduct an on-site inspection of, the bank or the bank holding company. If a bank’s capital adequacy ratio falls below a specified level, the FSA may request the bank to submit an improvement plan and may restrict or suspend the bank’s operations when it determines that action is necessary.
In addition, the Securities and Exchange Surveillance Commission of Japan inspects banks in connection with their securities business as well as financial instruments business operators, such as securities firms.
The Bank of Japan also conducts inspections of banks. The Bank of Japan Law provides that the Bank of Japan and financial institutions may agree as to the form of inspection to be conducted by the Bank of Japan.
Laws limiting shareholdings of banks . The provisions of the Antimonopoly Act that generally prohibit a bank from holding more than 5% of another company’s voting rights do not apply to a bank holding company. However, the Banking Law prohibits a bank holding company and its subsidiaries from holding, on an aggregated basis, more than 15% of the voting rights of companies other than those which can legally become subsidiaries of bank holding companies.
In addition, a bank is prohibited from holding shares in other companies exceeding the aggregate of its Common Equity Tier 1 capital amount and Additional Tier 1 capital amount. For a detailed discussion on the capital requirements for Japanese banks, see “Item 5.B. Operating and Financial Review and Prospects—Liquidity and Capital Review—Capital Adequacy.”
The Financial Instruments and Exchange Law. The Financial Instruments and Exchange Law provides protection for investors and also regulates sales of a wide range of financial instruments and services, requiring
43
Table of Contents
financial institutions to improve their sales rules and strengthen compliance frameworks and procedures. Among the instruments that the Japanese banks deal in, derivatives, foreign currency-denominated deposits, and variable insurance and annuity products are subject to regulations covered by the sales-related rules of conduct under the law.
Article 33 of the Financial Instruments and Exchange Law generally prohibits banks from engaging in securities transactions. However, bank holding companies and banks may, through a domestic or overseas securities subsidiary, conduct all types of securities businesses, with appropriate approval from the FSA. Similarly, registered banks are permitted to provide securities intermediation services and engage in certain other similar types of securities related transactions, including retail sales of investment funds and government and municipal bonds.
Subsidiaries of bank holding companies engaging in the securities business are subject to the supervision of the FSA as financial instruments business operators. The Prime Minister has the authority to regulate the securities industry and securities companies, which authority is delegated to the Commissioner of the FSA under the Financial Instruments and Exchange Law. In addition, the Securities and Exchange Surveillance Commission, an external agency of the FSA, is independent from the FSA’s other bureaus and is vested with the authority to conduct day-to-day monitoring of the securities markets and to investigate irregular activities that hinder fair trading of securities, including inspections of securities companies as well as banks in connection with their securities business. Furthermore, the Commissioner of the FSA delegates certain authority to the Director General of the Local Finance Bureau to inspect local securities companies and their branches. A violation of applicable laws and ordinances may result in various administrative sanctions, including revocation of registration, suspension of business or an order to discharge any director or executive officer who has failed to comply with applicable laws and ordinances. Securities companies are also subject to the rules and regulations of the Japanese stock exchanges and the Japan Securities Dealers Association, a self-regulatory organization of securities companies.
Act on Sales, etc. of Financial Instruments. The Act on Sales, etc. of Financial Instruments was enacted to protect customers from incurring unexpected losses as a result of purchasing financial instruments. Under this act, sellers of financial instruments have a duty to their potential customers to explain important matters such as the nature and magnitude of risks involved regarding the financial instruments that they intend to sell. If a seller fails to comply with the duty, there is a rebuttable presumption that the loss suffered by the customer due to the seller’s failure to explain is equal to the amount of decrease in the value of the purchased financial instruments.
Anti-money laundering laws . Under the Act on Prevention of Transfer of Criminal Proceeds, banks and other financial institutions are required to report to the responsible ministers—in the case of banks, the Commissioner of the FSA—any assets which they receive while conducting their businesses that are suspected of being illicit profits from criminal activities.
Acts concerning trust business conducted by financial institutions . Under the Trust Business Act, joint stock companies that are licensed by the Prime Minister as trust companies, including non-financial companies, are allowed to conduct trust business. In addition, under the Act on Provision, etc. of Trust Business by Financial Institutions, banks and other financial institutions, as permitted by the Prime Minister, are able to conduct trust business. The Trust Business Act provides for a separate type of registration for trustees who conduct only administration type trust business. The Trust Business Act also provides for various duties imposed on the trustee in accordance with and in addition to the Trust Act.
Deposit insurance system and government measures for troubled financial institutions . The Deposit Insurance Act is intended to protect depositors if a financial institution fails to meet its obligations. The Deposit Insurance Corporation was established in accordance with this act.
City banks (including BTMU), regional banks, trust banks (including MUTB), and various other credit institutions participate in the deposit insurance system on a compulsory basis.
44
Table of Contents
Under the Deposit Insurance Act, the maximum amount of protection is ¥10 million per customer within one bank. All deposits are subject to the ¥10 million maximum, except for non-interest bearing deposits that are redeemable on demand and used by the depositor primarily for payment and settlement functions (the “settlement accounts”). Deposits in settlement accounts are fully protected without a maximum amount limitation. Certain types of deposits are not covered by the deposit insurance system, such as foreign currency deposits and negotiable certificates of deposit. As of April 1, 2014, the Deposit Insurance Corporation charges insurance premiums equal to 0.108% per year on the deposits in the settlement accounts, which are fully protected as mentioned above, and premiums equal to 0.081% per year on the deposits in other accounts. If no financial institution becomes insolvent during the year ending on March 31, 2015, the premiums will be retrospectively revised to 0.090% per year and 0.068% per year, respectively, and the balance will be returned.
Under the Deposit Insurance Act, a Financial Reorganization Administrator can be appointed by the Prime Minister if a bank is unable to fully perform its obligations with its assets or may suspend or has suspended repayment of deposits. The Financial Reorganization Administrator will take control of the assets of the troubled bank, dispose of the assets and search for another institution willing to take over its business. The troubled bank’s business may also be transferred to a “bridge bank” established by the Deposit Insurance Corporation for the purpose of the temporary maintenance and continuation of operations of the troubled bank, and the bridge bank will seek to transfer the troubled bank’s assets to another financial institution or dissolve the troubled bank. The Deposit Insurance Corporation protects deposits, as described above, either by providing financial aid for costs incurred by the financial institution succeeding the insolvent bank or by paying insurance money directly to depositors. The financial aid, provided by the Deposit Insurance Corporation, may take the form of a monetary grant, loan or deposit of funds, purchase of assets, guarantee or assumption of debts, subscription of preferred stock, or loss sharing. The Deposit Insurance Act also provides for exceptional measures to cope with systemic risk in the financial industry.
In June 2013, the Diet passed the amendments to the Deposit Insurance Act, which established a new procedures for orderly processing of assets and liabilities of distressed financial institutions to stabilize the financial system, and expand the scope of financial institutions covered by the new procedures to include financial holding companies, securities firms and insurance companies. Under the new procedures, in case a designated financial institution becomes distressed, such financial institution will be subject to compulsory management of its operations and assets and receive financial assistance in the form of loans or subscription of shares. These amendments became effective on March 6, 2014.
Further, the Act on Special Measures for Strengthening of Financial Function enables the Japanese government to take special measures to strengthen the capital of financial institutions. Under the act, banks and other financial institutions may apply to receive capital injections from the Deposit Insurance Corporation, subject to government approval, which will be granted subject to the fulfillment of certain requirements, including, among other things, the improvement of profitability and efficiency, facilitation of financing to small and medium-sized business enterprises in the local communities, and that the financial institution be not insolvent. In response to the Great East Japan Earthquake in March, 2011, the act was revised in July 2011, adding a special case for the financial institutions suffering damage from the disaster. The requirement to create the improvement plan of profitability and efficiency is eased for such financial institutions. Moreover, the application deadline has been extended from March 31, 2012 to March 31, 2017.
Regulatory Developments Relating to Lending to Small and Medium-sized Firms and Others. The Act Concerning Temporary Measures to Facilitate Financing for Small and Medium-sized Firms and Others required financial institutions, among other things, to make an effort to reduce their customers’ burden of loan repayment by employing methods such as modifying the term of loans at the request of eligible borrowers, including small and medium-sized firms and individual home loan borrowers. This legislation also required financial institutions to internally establish a system to implement the requirements of the legislation and periodically make public disclosure of and report to the relevant authority on the status of implementation. Although this legislation expired on March 31, 2013, the FSA is encouraging the financial institutions to continue to provide support to
45
Table of Contents
small and medium-sized firms by revising the Inspection Manual, Supervisory Policy and Ordinance for Enforcement of the Baking Law in order to encourage financial institutions to modify the terms of loans, provide smooth financing, and take active roles in supporting operations of such companies.
The Act on the Protection of Personal Information . With regard to protection of personal information, the Act on the Protection of Personal Information requires, among other things, Japanese banking institutions to limit the use of personal information to the stated purpose and to properly manage the personal information in their possession, and forbids them from providing personal information to third parties without consent. If a bank violates certain provisions of the act, the FSA may advise or order the bank to take proper action. In addition, the Banking Law and the Financial Instruments and Exchange Law provide certain provisions with respect to appropriate handling of customer information.
Act Concerning Protection of Depositors from Illegal Withdrawals Made by Counterfeit or Stolen Cards. The Act on Protection, etc. of Depositors and Postal Saving Holders from Unauthorized Automated Withdrawal, etc. Using Counterfeit Cards, etc. and Stolen Cards, etc. requires financial institutions to establish internal systems to prevent illegal withdrawals of deposits made using counterfeit or stolen bank cards. The act also requires a financial institution to compensate depositors for any amount illegally withdrawn using stolen bank cards except in certain cases, including those where the financial institution can verify that it acted in good faith without negligence and there was gross negligence on the part of the relevant depositor. In addition, the act provides that illegal withdrawals with counterfeit bank cards are invalid unless the financial institution acted in good faith without negligence and there was gross negligence on the part of the relevant account holder.
Government Reforms to Restrict Maximum Interest Rates on Consumer Lending Business. In December 2006, the Diet passed legislation to reform the regulations relating to the consumer lending business, including amendments to the Act Regulating the Receipt of Contributions, Receipt of Deposits and Interest Rates which, effective June 18, 2010, reduced the maximum permissible interest rate from 29.2% per annum to 20% per annum. The regulatory reforms also included amendments to the Law Concerning Lending Business which, effective June 18, 2010, abolished the so-called “gray-zone interest.” Gray-zone interest refers to interest rates exceeding the limits stipulated by the Interest Rate Restriction Act (between 15% per annum to 20% per annum depending on the amount of principal). Prior to June 18, 2010, gray-zone interests were permitted under certain conditions set forth in the Law Concerning Lending Business. As a result of the regulatory reforms, all interest rates are now subject to the lower limits imposed by the Interest Rate Restriction Act, compelling lending institutions, including our consumer finance subsidiaries and equity method investees, to lower the interest rates they charge borrowers. Furthermore, the new regulations, which became effective on June 18, 2010, require, among other things, consumer finance companies to limit their lending to a single customer to a maximum of one third of the customer’s annual income regardless of the customer’s repayment capability.
In addition, as a result of decisions made by the Supreme Court of Japan prior to June 18, 2010, imposing stringent requirements for charging such gray-zone interest rates, consumer finance companies have been responding to borrowers’ claims for reimbursement of previously collected interest payments in excess of the limits stipulated by the Interest Rate Restriction Act. We continue to carefully monitor future developments and trends of the claims. See “Item 3.D. Key Information—Risk Factors—Risks Related to Our Business—Because of our loans to consumers and our shareholdings in companies engaged in consumer lending, changes in the business or regulatory environment for consumer finance companies in Japan may further adversely affect our financial results.”
United States
As a result of our operations in the United States, we are subject to extensive U.S. federal and state supervision and regulation.
46
Table of Contents
Overall supervision and regulation . We are subject to supervision, regulation and examination with respect to our U.S. operations by the FRB pursuant to the U.S. Bank Holding Company Act of 1956, as amended, or the BHCA, and the International Banking Act of 1978, as amended, or the IBA, because we are a bank holding company and a foreign banking organization, respectively, as defined pursuant to those statutes. The FRB functions as our “umbrella” supervisor under amendments to the BHCA effected by the Gramm-Leach-Bliley Act of 1999, which among other things:
| Ÿ |
prohibited further expansion of the types of activities in which bank holding companies, acting directly or through non-bank subsidiaries, may engage; |
| Ÿ |
authorized qualifying bank holding companies to opt to become “financial holding companies,” and thereby acquire the authority to engage in an expanded list of activities; and |
| Ÿ |
modified the role of the FRB by specifying new relationships between the FRB and the functional regulators of non-bank subsidiaries of both bank holding companies and financial holding companies. |
The BHCA generally prohibits each of a bank holding company and a foreign banking organization that maintains branches or agencies in the United States from, directly or indirectly, acquiring more than 5% of the voting shares of any company engaged in non-banking activities in the United States unless the bank holding company or foreign banking organization has elected to become a financial holding company, as discussed above, or the FRB has determined, by order or regulation, that such activities are so closely related to banking as to be a proper incident thereto and has granted its approval to the bank holding company or foreign banking organization for such an acquisition. The BHCA also requires a bank holding company or foreign banking organization that maintains branches or agencies in the United States to obtain the prior approval of an appropriate federal banking authority before acquiring, directly or indirectly, the ownership of more than 5% of the voting shares or control of any U.S. bank or bank holding company. In addition, under the BHCA, a U.S. bank or a U.S. branch or agency of a foreign bank is prohibited from engaging in various tying arrangements involving it or its affiliates in connection with any extension of credit, sale or lease of any property or provision of any services.
On October 6, 2008, we became a financial holding company in the United States. At the same time, BTMU, MUTB, and UNBC (now MUAH), which are also bank holding companies, elected to become financial holding companies. As noted above, as a financial holding company we are authorized to engage in an expanded list of activities. These activities include those deemed to be financial in nature or incidental to such financial activity, including among other things merchant banking, insurance underwriting, and a full range of securities activities. In addition, we are permitted to engage in certain specified non-banking activities deemed to be closely related to banking, without prior notice to or approval from the FRB. To date, we have utilized this expanded authority by electing to engage in certain securities activities, including securities underwriting, indirectly through certain of our securities subsidiaries. In order to maintain our status as a financial holding company that allows us to expand our activities, we must continue to meet certain standards established by the FRB. Those standards require that we exceed the minimum standards applicable to bank holding companies that have not elected to become financial holding companies. These higher standards include meeting the “well capitalized” and “well managed” standards for financial holding companies as defined in the regulations of the FRB. In addition, as a financial holding company, we must ensure that our U.S. banking subsidiaries identified below meet certain minimum standards under the Community Reinvestment Act of 1977. At this time, we continue to comply with these standards.
U.S. branches and agencies of subsidiary Japanese banks. Under the authority of the IBA, our banking subsidiaries, BTMU and MUTB, operate four branches, one agency and eight representative offices in the United States. BTMU operates branches in Los Angeles, California; Chicago, Illinois; New York, New York; an agency in Houston, Texas; and representative offices in Washington, D.C; San Francisco, California; Seattle, Washington; Atlanta, Georgia; Minneapolis, Minnesota; Dallas, Texas; Jersey City, New Jersey; and Florence, Kentucky. MUTB operates a branch in New York, New York.
47
Table of Contents
The IBA provides, among other things, that the FRB may examine U.S. branches and agencies of foreign banks, and each branch and agency shall be subject to on-site examination by the appropriate federal or state bank supervisor as frequently as would a U.S. bank. The IBA also provides that if the FRB determines that a foreign bank is not subject to comprehensive supervision or regulation on a consolidated basis by the appropriate authorities in its home country, or if there is reasonable cause to believe that the foreign bank or its affiliate has committed a violation of law or engaged in an unsafe or unsound banking practice in the United States, the FRB may order the foreign bank to terminate activities conducted at a branch or agency in the United States.
U.S. branches and agencies of foreign banks must be licensed, and are also supervised and regulated, by a state or by the Office of the Comptroller of the Currency, or the OCC, the federal regulator of U.S. national banks. All of the branches and agencies of BTMU and MUTB in the United States are state-licensed. Under U.S. federal banking laws, state-licensed branches and agencies of foreign banks may engage only in activities that would be permissible for their federally-licensed counterparts, unless the FRB determines that the additional activity is consistent with safe and sound practices. U.S. federal banking laws also subject state-licensed branches and agencies to the single-borrower lending limits that apply to federal branches and agencies, which generally are the same as the lending limits applicable to national banks, but are based on the capital of the entire foreign bank.
As an example of state supervision, the branches of BTMU and MUTB in New York are licensed by the New York State Department of Financial Services, pursuant to the New York Banking Law. Under the New York Banking Law and the Superintendent’s Regulations, each of BTMU and MUTB must maintain with banks in the State of New York eligible assets as defined and in amounts determined by the Superintendent. These New York branches must also submit written reports concerning their assets and liabilities and other matters, to the extent required by the Superintendent, and are examined at periodic intervals by the New York State Department of Financial Services. In addition, the Superintendent is authorized to take possession of the business and property of BTMU and MUTB located in New York whenever events specified in the New York Banking Law occur.
U.S. banking subsidiaries. We indirectly own and control two U.S. banks:
| Ÿ |
Mitsubishi UFJ Trust & Banking Corporation (U.S.A.), New York, New York (through MUTB, a registered bank holding company), and |
| Ÿ |
MUFG Union Bank, N.A. or MUB (known prior to July 1, 2014 as Union Bank, N.A.), through BTMU and its subsidiary, MUAH, a registered bank holding company. |
Mitsubishi UFJ Trust & Banking Corporation (U.S.A.) is chartered by the State of New York and is subject to the supervision, examination and regulatory authority of the Superintendent pursuant to the New York Banking Law. MUB is a national bank subject to the supervision, examination and regulatory authority of the OCC pursuant to the National Bank Act.
The FDIC is the primary federal agency responsible for the supervision, examination and regulation of Mitsubishi UFJ Trust & Banking Corporation (U.S.A.). The FDIC may take enforcement action, including the issuance of prohibitive and affirmative orders, if it determines that a financial institution under its supervision has engaged in unsafe or unsound banking practices, or has committed violations of applicable laws and regulations. The FDIC insures the deposits of both of our U.S. banking subsidiaries up to legally specified maximum amounts. In the event of a failure of an FDIC-insured bank, the FDIC is virtually certain to be appointed as receiver, and would resolve the failure under provisions of the Federal Deposit Insurance Act. An FDIC-insured institution that is affiliated with a failed or failing FDIC-insured institution can be required to indemnify the FDIC for losses resulting from the insolvency of the failed institution, even if this causes the affiliated institution also to become insolvent. In the liquidation or other resolution of a failed FDIC-insured depository institution, deposits in its U.S. offices and other claims for administrative expenses and employee compensation are afforded priority over other general unsecured claims, including deposits in offices outside the United States, non-deposit
48
Table of Contents
claims in all offices and claims of a parent company. Moreover, under longstanding FRB policy, a bank holding company is expected to act as a source of financial strength for its banking subsidiaries and to commit resources to support such banks.
Bank capital requirements and capital distributions . Our U.S. banking subsidiaries are subject to applicable risk-based and leverage capital guidelines issued by U.S. regulators for banks and bank holding companies. In addition, BTMU and MUTB, as foreign banking organizations that have U.S. branches and agencies and that are controlled by us as a financial holding company, are subject to the FRB’s requirements that they be “well-capitalized” based on Japan’s risk based capital standards, as well as “well managed.” All of our U.S. banking subsidiaries and BTMU, MUTB, and MUAH are “well capitalized” as defined under, and otherwise comply with, all U.S. regulatory capital requirements applicable to them. The Federal Deposit Insurance Corporation Improvement Act of 1991, or FDICIA, provides, among other things, for expanded regulation of insured depository institutions, including banks, and their parent holding companies. As required by FDICIA, the federal banking agencies have established five capital tiers ranging from “well capitalized” to “critically undercapitalized” for insured depository institutions. As an institution’s capital position deteriorates, the federal banking regulators may take progressively stronger actions, such as further restricting affiliate transactions, activities, asset growth or interest payments. In addition, FDICIA generally prohibits an insured depository institution from making capital distributions, including the payment of dividends, or the payment of any management fee to its holding company, if the insured depository institution would subsequently become undercapitalized.
The availability of dividends from insured depository institutions in the United States is limited by various other statutes and regulations. The National Bank Act and other federal laws prohibit the payment of dividends by a national bank under various circumstances and limit the amount a national bank can pay without the prior approval of the OCC. In addition, state-chartered banking institutions are subject to dividend limitations imposed by applicable federal and state laws.
Other regulated U.S. subsidiaries. Our non-bank subsidiaries that engage in securities-related activities in the United States are regulated by appropriate functional regulators, such as the SEC, any self-regulatory organizations of which they are members, and the appropriate state regulatory agencies. These non-bank subsidiaries are required to meet separate minimum capital standards as imposed by those regulatory authorities.
Anti-Money Laundering Initiatives and the USA PATRIOT Act . A major focus of U.S. governmental policy relating to financial institutions in recent years has been aimed at preventing money laundering and terrorist financing. The USA PATRIOT Act of 2001 substantially broadened the scope of U.S. anti-money laundering laws and regulations by imposing significant new compliance and due diligence obligations, creating new crimes and penalties and expanding the extra-territorial jurisdiction of the United States. The U.S. Department of the Treasury has issued a number of regulations that impose obligations on financial institutions to maintain appropriate policies, procedures and controls to detect, prevent and report money laundering and terrorist financing, and to verify the identity of their customers. In addition, the bank regulatory agencies carefully scrutinize the adequacy of an institution’s policies, procedures and controls. As a result, there has been an increased number of regulatory sanctions and law enforcement authorities have been taking a more active role in enforcing these laws. Failure of a financial institution to maintain and implement adequate policies, procedures and controls to prevent money laundering and terrorist financing could in some cases have serious legal and reputational consequences for the institution, including the incurrence of expenses to enhance the relevant programs, the imposition of limitations on the scope of their operations and the imposition of fines and other monetary penalties.
Foreign Corrupt Practices Act. In recent years, U.S. regulatory and enforcement agencies including the U.S. Securities and Exchange Commission, or SEC, and the U.S. Department of Justice have significantly increased their enforcement efforts of the Foreign Corrupt Practices Act, or the FCPA. The FCPA prohibits U.S. securities issuers, U.S. domestic entities, and parties doing substantial business within the United States (including their shareholders, directors, agents, officers, and employees) from making improper payments to non-U.S. government officials in order to obtain or retain business. The FCPA also requires U.S. securities issuers to keep their books and records in
49
Table of Contents
detail, accurately, and in such a way that they fairly reflect all transactions and dispositions of assets. Those enforcement efforts have targeted a wide range of U.S. and foreign-based entities and have been based on a broad variety of alleged fact patterns, and in a number of cases have resulted in the imposition of substantial criminal and civil penalties or in agreed payments in settlement of alleged violations. Failure of a financial institution doing business in the United States to maintain adequate policies, procedures, internal controls, and books and records on a global basis that address compliance with FCPA requirements could in some cases have serious legal and reputational consequences for the institution, including the incurrence of expenses to enhance the relevant programs and the imposition of fines and other monetary penalties.
Regulatory Reform Legislation. In response to the global financial crisis and the perception that lax supervision of the financial industry in the United States may have been a contributing cause, new legislation designed to reform the system for supervision and regulation of financial firms doing business in the United States, the so-called Dodd-Frank Act, was signed into law on July 21, 2010. The Dodd-Frank Act is complex and extensive in its coverage and contains a wide range of provisions that would affect financial institutions operating in the United States, including our U.S. operations. Included among these provisions are sweeping reforms designed to reduce systemic risk presented by very large financial firms, promote enhanced supervision, regulation, and prudential standards for financial firms, establish comprehensive supervision of financial markets, impose new limitations on permissible financial institution activities and investments, expand regulation of the derivatives markets, protect consumers and investors from financial abuse, and provide the government with the tools needed to manage a financial crisis. Many aspects of the legislation require subsequent regulatory action by supervisory agencies for full implementation. While some regulatory rule-making has been adopted as discussed below, others remain pending or require further interpretive guidance by the relevant supervisory agencies. Accordingly, while we expect the legislation to have an impact on our operations, we are unable to assess with certainty the degree of impact of the Dodd-Frank Act on our operations at this time.
Currently, the components of the Dodd-Frank Act that have impacted or may impact our operations are the provisions relating to the “Volcker Rule,” enhanced prudential standards (including capital , liquidity, and structural requirements), resolution plans, credit reporting, derivatives regulation, incentive-based compensation, the establishment of the Consumer Financial Protection Bureau, and debit interchange fees. Although a significant portion of the regulatory rules regarding the foregoing components are still pending, based on information currently available to us, other than the Volcker Rule and derivatives regulations as discussed below, the impact of these components is expected to be mainly limited to our U.S. operations and not to be material to us on a consolidated basis. We intend to continue to monitor developments relating to the Dodd-Frank Act and the potential impact on our activities inside and outside of the United States.
With respect to the Dodd-Frank Act provisions related to enhanced prudential standards, in February 2014 the FRB issued final rules that established enhanced prudential standards for the U.S. operations of foreign banking organizations such as MUFG. These rules will require us to organize by July 2016 all of our U.S. bank and non-bank subsidiaries under a U.S. intermediate holding company that would be subject to U.S. capital requirements and enhanced prudential standards comparable to those applicable to top-tier U.S. bank holding companies of the same size. Under these rules, we will be required to change the structure of our U.S. operations, including the manner in which we oversee and manage those operations, and may be required to inject capital into our U.S. operations. The rules require that financial banking organizations that have U.S. non-branch assets of $50 billion or more as of June 30, 2014, including MUFG, prepare an Implementation Plan for filing with the Federal Reserve by January 1, 2015, describing how we intend to meet the requirements of the rules. MUFG is in the process of preparing that Plan, and until that Plan is finalized and filed with and reviewed by the Federal Reserve, we are unable to assess the extent to which the rules may affect our operations in the United States.
The Volcker rule was issued in final form by the Federal Reserve in December 2013. Under the Volcker Rule, we are required to cease conducting certain proprietary trading activities (i.e., trading in securities and financial instruments for our own account) subject to certain exceptions, including market-making, hedging, and underwriting activities if such activities are conducted within a rigorous compliance framework. We are also
50
Table of Contents
restricted from engaging in certain activities regarding hedge funds and private equity funds. While the Volcker Rule excludes restrictions on such activities conducted solely outside of the United States, the regulatory definition of such exempted activities is narrow and complex and in some cases requires further clarification. Our proprietary trading activities are generally executed outside of the United States, but certain activities within the United States could potentially fall within the scope of the definition of proprietary trading. The Federal Reserve has extended the conformance period under the Rule until July 2015, during which time further clarification under the Rule may be necessary to fully ascertain its impact on those activities. Given the limited amount of potentially restricted activities in which we engage within the United States, we do not expect the proprietary trading revenues attributable to our U.S. subsidiaries as a result of the implementation of the Volcker Rule to be material to our operations based on our current revenues attributable to the proprietary trading activities conducted in our U.S. subsidiaries.
U.S. regulators have also begun to issue final regulations governing swaps and derivatives markets as contemplated by the Dodd-Frank Act. To date, BTMU and Mitsubishi UFJ Securities International, plc, or MUSI, have registered as swap dealers with the U.S. Commodity Futures Trading Commission, or CFTC. Depending on the final outcome of the regulations governing swaps and derivatives markets under the Dodd-Frank Act, as well as the activities of our other subsidiaries located inside and outside of the United States, our other subsidiaries may have to register as swap dealers with, or be subject to the regulations of, the CFTC and/or SEC. Regulation of swap dealers by the CFTC and SEC will impose numerous corporate governance, business conduct, capital, margin, reporting, clearing, execution, and other regulatory requirements on our operations, which may adversely impact our derivatives businesses and make us less competitive than those competitors that are not subject to the same regulations. Although many regulations applicable to swap dealers are already in effect, it is difficult to assess the full impact of these requirements because some of the most important rules have not yet been implemented or finalized. For example, U.S. regulators are adopting guidance and rules on the application of U.S. regulations to activities of registered swap dealers outside of the United States. The potential extraterritorial application of swap dealer regulatory requirements could impose significant operational and compliance burdens on our swaps activities outside of the United States.
Foreign Account Tax Compliance Act. The Hiring Incentives to Restore Employment Act was enacted in March 2010 and contains provisions commonly referred to as the Foreign Account Tax Compliance Act, or FATCA. The U.S. Treasury, acting through the Internal Revenue Service, or the IRS, issued final regulations of FATCA in January 2013.
The FATCA framework has been expanded with the introduction of Intergovernmental Agreements, or IGAs, between the U.S. Treasury and foreign governments, which pursue a framework for intergovernmental cooperation to facilitate the implementation of FATCA. The United States and Japan have entered into an IGA.
Within our Japanese operations, we have developed internal procedures and processes that we believe address the regulatory requirements under FATCA. However, doing so has required us to develop extensive systems capabilities and internal processes to identify and report U.S. account holders who are subject to FATCA requirements, which has been a complex and costly process requiring significant internal resources. If our procedures and processes are determined not to be adequate to meet the requirements of FATCA, we could potentially be subject to serious legal and reputational consequences, including the imposition of withholding taxes on certain amounts payable to us from U.S. sources, and could be required to expend additional resources to enhance our systems, procedures and processes and take other measures in response to such consequences.
Disclosure pursuant to Section 13(r) of the Securities Exchange Act of 1934
Section 13(r) of the U.S. Securities Exchange Act of 1934 requires an issuer to disclose whether it or any of its affiliates knowingly engaged in certain activities, transactions or dealings relating to Iran or with natural persons or entities designated by the U.S. government under specified Executive Orders. The scope of activities that must be reported includes activities not prohibited by U.S. law and conducted outside the United States in compliance with applicable local law.
51
Table of Contents
During the fiscal year ended March 31, 2014, one of our non-U.S. affiliates engaged in business activities with entities in or affiliated with Iran, including counterparties owned or controlled by the Iranian government. These activities were consistent with rules and regulations applicable to the non-U.S. affiliate. Specifically, our non-U.S. banking subsidiary, BTMU, issued letters of credit and guarantees and provided remittance and other settlement services mainly in connection with customer transactions related to the purchase and exportation of Iranian crude oil to Japan, and in some cases, in connection with other petroleum-related transactions with Iran by its customers. These transactions did not involve U.S. dollars nor clearing services of U.S. banks for the settlement of payments, and were reviewed for compliance with applicable U.S. and non-U.S. laws and regulations. For the fiscal year ended March 31, 2014, the aggregate interest and fee income relating to these transactions was less than ¥130 million, representing less than 0.005% of our total interest and fee income. Some of these transactions were conducted through the use of non-U.S. dollar correspondent accounts and other similar settlement accounts maintained with BTMU outside the United States by Iranian financial institutions and other entities in or affiliated with Iran. In addition to such accounts, BTMU receives deposits in Japan from and provides settlement services in Japan to fewer than ten Iranian government-related entities and fewer than 100 Iranian government-related individuals such as Iranian diplomats, and maintains settlement accounts outside the United States for certain other financial institutions specified in Executive Order 13382, which settlement accounts were frozen in accordance with applicable laws and regulations. For the fiscal year ended March 31, 2014, the average aggregate balance of deposits held in these accounts represented less than 0.01% of the average balance of our total deposits. The fee income from the transactions attributable to these account holders was less than ¥3 million, representing less than 0.001% of our total fee income. BTMU also holds loans that were arranged prior to changes in applicable laws and regulations to borrowers in or affiliated with Iran, including entities owned by the Iranian government, the outstanding balance of which was less than ¥500 million, representing less than 0.001% of our total loans, as of March 31, 2014. For the fiscal year ended March 31, 2014, the aggregate gross interest and fee income relating to these loan transactions was less than ¥45 million, representing less than 0.005% of our total interest and fee income.
In addition, in accordance with the Joint Plan of Action agreed to among the P5+1 (the United States, United Kingdom, Germany, France, Russia and China) and Iran in November 2013, BTMU has been providing settlement services in connection with humanitarian trade to assist Iran in meeting its domestic needs, namely food, agricultural products, medicine and medical devices, since April 2014. The overall framework for these settlement services was based on an agreement between U.S. and Japanese authorities, and the relevant U.S. regulator has authorized the settlement services as compliant with applicable U.S. laws and regulations. The purchasers of the humanitarian goods were entities in or affiliated with Iran, including entities related to the Iranian government. The sellers of the humanitarian goods were entities permitted by U.S. and Japanese regulators. These transactions did not involve U.S. dollars nor clearing services of U.S. banks for the settlement of payments. These transactions were conducted through the use of special purpose yen accounts maintained with BTMU outside the United States by an Iranian financial institution which is affiliated with the Iranian government but through which these transactions were permitted to be settled. In connection with these transactions, the Iranian financial institution has increased the amount of its non-U.S. dollar deposits at BTMU used for the settlement purposes. BTMU intends to continue to provide the settlement services in connection with the exports of humanitarian goods to Iran in close coordination with U.S. and Japanese authorities.
BTMU will continue to limit its participation in these types of transactions mainly to arrange financing transactions relating to customer imports of Iranian crude oil into Japan and authorized exports of humanitarian goods to Iran, maintain accounts in Japan of Iranian entities and individuals, and obtain interest and fee income and repayment of principal in connection with existing loans to borrowers in or affiliated with Iran, in each case to the extent permitted by applicable laws and regulations.
52
Table of Contents
| C. | Organizational Structure |
The following chart presents our corporate structure summary as of March 31, 2014:
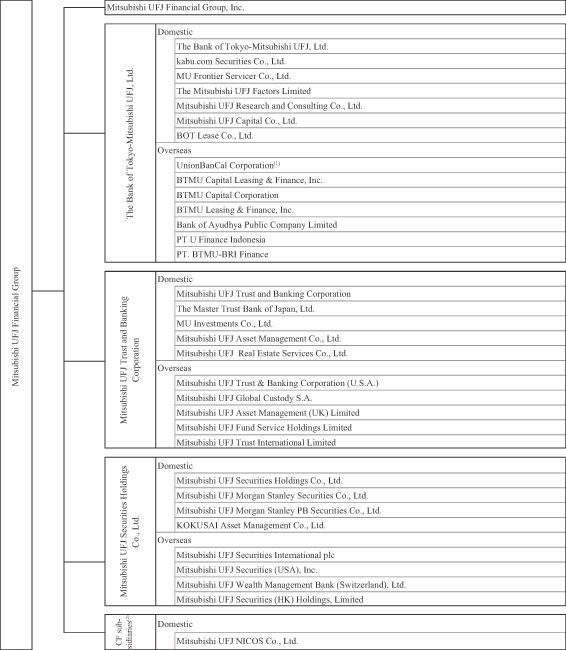
| (1) | Effective July 1, 2014, UnionBanCal Corporation has been renamed MUFG Americas Holding Corporation in connection with the integration of BTMU’s operations in the Americas region with the operations of UnionBanCal. See “Item 5. Operating and Financial Review and Prospects—Recent Developments.” |
| (2) | Consumer finance subsidiaries. |
53
Table of Contents
Set forth below is a list of our principal consolidated subsidiaries as of March 31, 2014:
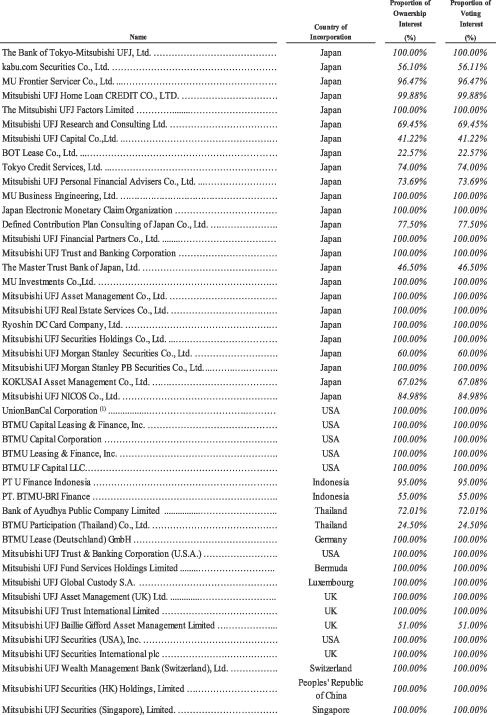
| Note: |
| (1) | Effective July 1, 2014, UnionBanCal Corporation has been renamed MUFG Americas Holding Corporation in connection with the integration of BTMU’s operations in the Americas region with the operations of UnionBanCal. See “Item 5. Operating and Financial Review and Prospects—Recent Developments.” |
54
Table of Contents
| D. | Property, Plant and Equipment |
Premises and equipment as of March 31, 2013 and 2014 consisted of the following:
| As of March 31, | ||||||||
| 2013 | 2014 | |||||||
| (in millions) | ||||||||
|
Land |
¥ | 379,943 | ¥ | 403,184 | ||||
|
Buildings |
723,902 | 747,998 | ||||||
|
Equipment and furniture |
767,733 | 929,939 | ||||||
|
Leasehold improvements |
236,353 | 251,875 | ||||||
|
Construction in progress |
17,976 | 27,606 | ||||||
|
|
|
|
|
|||||
|
Total |
2,125,907 | 2,360,602 | ||||||
|
Less accumulated depreciation |
1,066,853 | 1,123,954 | ||||||
|
|
|
|
|
|||||
|
Premises and equipment—net |
¥ | 1,059,054 | ¥ | 1,236,648 | ||||
|
|
|
|
|
|||||
Our registered address is 7-1, Marunouchi 2-chome, Chiyoda-ku, Tokyo 100-8330, Japan. As of March 31, 2014, we and our subsidiaries conducted our operations either in premises we owned or in properties we leased.
The following table presents the book values of our material offices and other properties as of March 31, 2014:
| Book value | ||||
| (in millions) | ||||
|
Owned land |
¥ | 403,184 | ||
|
Owned buildings |
226,407 | |||
The buildings and land we own are primarily used by us and our subsidiaries as offices and branches. Most of the buildings and land we own are free from material encumbrances.
During the fiscal year ended March 31, 2014, we invested approximately ¥158.5 billion, primarily for office renovations and relocation.
| Item 4A. | Unresolved Staff Comments. |
None.
55
Table of Contents
| Item 5. | Operating and Financial Review and Prospects. |
The following discussion and analysis should be read in conjunction with “Item 3.A. Key Information—Selected Financial Data,” “Selected Statistical Data” and our consolidated financial statements and related notes included elsewhere in this Annual Report.
| Page | ||||||
| 57 | ||||||
| 64 | ||||||
| 73 | ||||||
| 77 | ||||||
|
Accounting Changes and Recently Issued Accounting Pronouncements |
83 | |||||
|
A. |
Operating Results | 84 | ||||
| 84 | ||||||
| 101 | ||||||
| 106 | ||||||
|
Effect of Change in Exchange Rates on Foreign Currency Translation |
107 | |||||
|
B. |
Liquidity and Capital Resources | 108 | ||||
| 108 | ||||||
| 131 | ||||||
| 137 | ||||||
|
C. |
Research and Development, Patents and Licenses, etc. | 137 | ||||
|
D. |
Trend Information | 137 | ||||
|
E. |
Off-Balance Sheet Arrangements | 138 | ||||
|
F. |
Tabular Disclosure of Contractual Obligations | 139 | ||||
|
G. |
Safe Harbor | 139 | ||||
56
Table of Contents
We are a holding company for The Bank of Tokyo-Mitsubishi UFJ, Ltd., or BTMU, Mitsubishi UFJ Trust and Banking Corporation, or MUTB, Mitsubishi UFJ Morgan Stanley Securities Co., Ltd., or MUMSS (through Mitsubishi UFJ Securities Holdings Co., Ltd., or MUSHD, an intermediate holding company), Mitsubishi UFJ NICOS Co., Ltd., or Mitsubishi UFJ NICOS, and other subsidiaries. Through our subsidiaries and affiliated companies, we engage in a broad range of financial businesses and services, including commercial banking, investment banking, trust banking and asset management services, securities businesses, and credit card businesses, and provide related services to individual and corporate customers.
Summary of Our Recent Financial Results
The following table presents some key figures relating to our financial results:
| Fiscal years ended March 31, | ||||||||||||
| 2012 | 2013 | 2014 | ||||||||||
| (in billions, except per share data) | ||||||||||||
|
Net interest income (1) |
¥ | 1,955.8 | ¥ | 1,871.1 | ¥ | 1,961.3 | ||||||
|
Provision (credit) for credit losses |
223.8 | 144.5 | (106.4 | ) | ||||||||
|
Non-interest income (2) |
1,440.6 | 2,068.0 | 1,821.0 | |||||||||
|
Non-interest expense |
2,322.7 | 2,378.7 | 2,468.3 | |||||||||
|
Income before income tax expense |
849.9 | 1,415.9 | 1,420.4 | |||||||||
|
Net income before attribution of noncontrolling interests |
420.7 | 1,119.9 | 1,082.5 | |||||||||
|
Net income attributable to Mitsubishi UFJ Financial Group |
416.2 | 1,069.1 | 1,015.4 | |||||||||
|
Diluted earnings per common share—earnings applicable to common shareholders of Mitsubishi UFJ Financial Group |
28.09 | 74.16 | 69.98 | |||||||||
| Notes: |
| (1) | Interest income for the fiscal year ended March 31, 2012 includes a gain of ¥139.3 billion on the conversion rate adjustment of Morgan Stanley’s convertible preferred stock. For more information, see Note 2 to our consolidated financial statements included elsewhere in this Annual Report. |
| (2) | Non-interest income for the fiscal year ended March 31, 2012 reflects an impairment loss of ¥579.5 billion on our investment in Morgan Stanley’s common stock resulting from a decline in the quoted price of Morgan Stanley’s common stock that we determined to be other than temporary in light of the increasingly stringent regulatory environment and the existing adverse economic events in Europe. For more information, see Note 2 to our consolidated financial statements included elsewhere in this Annual Report. |
We reported net income attributable to Mitsubishi UFJ Financial Group of ¥1,015.4 billion for the fiscal year ended March 31, 2014, a decrease of ¥53.7 billion from ¥1,069.1 billion for the fiscal year ended March 31, 2013. Domestic net income attributable to Mitsubishi UFJ Financial Group was ¥859.8 billion, and foreign net income attributable to Mitsubishi UFJ Financial Group was ¥155.6 billion, for the fiscal year ended March 31, 2014. Asia and Oceania excluding Japan, Europe, and other areas including Canada, Latin America, the Caribbean and the Middle East contributed ¥149.4 billion, ¥6.5 billion and ¥131.2 billion, respectively, to foreign net income which were partly offset by net loss of ¥131.5 billion in the United States.
For the fiscal year ended March 31, 2014, our domestic revenue, which consists of interest income and non-interest income attributable to our operations in Japan, was ¥3,110.1 billion, while our total foreign revenue, which consists of interest income and non-interest income attributable to our operations outside of Japan, was ¥1,233.3 billion, with revenue attributable to our operations in the United States contributing ¥219.0 billion, Asia and Oceania excluding Japan contributing ¥569.0 billion, and Europe contributing ¥155.0 billion. As a percentage of total revenue, domestic revenue increased to 71.6% for the fiscal year ended March 31, 2014 from 67.1% for the previous fiscal year.
57
Table of Contents
More specifically, our net income attributable to Mitsubishi UFJ Financial Group for the fiscal year ended March 31, 2014 mainly reflected the following:
Net interest income. Net interest income is a function of:
| Ÿ |
the amount of interest-earning assets, |
| Ÿ |
the amount of interest-bearing liabilities, |
| Ÿ |
the general level of interest rates, |
| Ÿ |
the so-called “spread,” or the difference between the rate of interest earned on interest-earning assets and the rate of interest paid on interest-bearing liabilities, and |
| Ÿ |
the proportion of interest-earning assets financed by non-interest-bearing liabilities and equity. |
Net interest income for the fiscal year ended March 31, 2014 was ¥1,961.3 billion, an increase of ¥90.2 billion from ¥1,871.1 billion for the fiscal year ended March 31, 2013. Interest income increased ¥94.8 billion while interest expense increased only ¥4.6 billion. The increase in interest income reflected higher interest income from foreign loans, foreign currency denominated trading debt securities and deposits in central banks primarily due to increased volumes of these assets, which were partially offset by a decrease in interest income from domestic loans due to lower interest rates and intensified competition among lending institutions, and a decrease in interest income from domestic investment securities due to our reduced holding of such securities, including Japanese government bonds. The increase in interest expense reflected higher interest payments on foreign deposits due to an increased balance of such deposits, and larger long-term debt primarily reflecting an increase in the balance of borrowings with longer maturities.
The average interest spread decreased 0.04 percentage points to 0.89% for the fiscal year ended March 31, 2014 from 0.93% for the fiscal year ended March 31, 2013, reflecting the continued low interest rate environment and intensified competition among financial institutions.
The following table shows changes in our net interest income by changes in volume and by changes in rates for the fiscal year ended March 31, 2013 compared to the fiscal year ended March 31, 2012, and the fiscal year ended March 31, 2014 compared to the fiscal year ended March 31, 2013:
|
Fiscal Year Ended March 31, 2012
versus Fiscal Year Ended March 31, 2013 |
Fiscal Year Ended March 31, 2013
versus Fiscal Year Ended March 31, 2014 |
|||||||||||||||||||||||
|
Increase (decrease)
due to changes in |
Increase (decrease)
due to changes in |
|||||||||||||||||||||||
| Volume (1) | Rate (1) | Net change | Volume (1) | Rate (1) | Net change | |||||||||||||||||||
| (in millions) | ||||||||||||||||||||||||
|
Domestic |
¥ | 34,889 | ¥ | (108,724 | ) | ¥ | (73,835 | ) | ¥ | (22,455) | ¥ | (48,533) | ¥ | (70,988) | ||||||||||
|
Foreign (2) |
174,449 | (185,328 | ) | (10,879 | ) | 254,092 | (92,896) | 161,196 | ||||||||||||||||
|
|
|
|
|
|
|
|
|
|
|
|
|
|||||||||||||
|
Total |
¥ | 209,338 | ¥ | (294,052 | ) | ¥ | (84,714 | ) | ¥ | 231,637 | ¥ | (141,429) | ¥ | 90,208 | ||||||||||
|
|
|
|
|
|
|
|
|
|
|
|
|
|||||||||||||
| Notes: |
| (1) | Volume/rate variance is allocated based on the percentage relationship of changes in volume and changes in rate to the total “net change.” |
| (2) | Interest income on foreign activities for the fiscal year ended March 31, 2012 includes a gain of ¥139.3 billion on the conversion rate adjustment of Morgan Stanley’s convertible preferred stock. For more information, see Note 2 to our consolidated financial statements included elsewhere in this Annual Report. |
58
Table of Contents
The following table is a summary of the amount of interest-earning assets and interest-bearing liabilities, average interest rates, the interest rate spread and non-interest-bearing liabilities for the fiscal years ended March 31, 2012, 2013 and 2014:
| Fiscal years ended March 31, | ||||||||||||||||||||||||
| 2012 | 2013 | 2014 | ||||||||||||||||||||||
|
Average
balance |
Average
rate |
Average
balance |
Average
rate |
Average
balance |
Average
rate |
|||||||||||||||||||
| (in billions, except percentages) | ||||||||||||||||||||||||
|
Interest-earning assets: |
||||||||||||||||||||||||
|
Domestic |
¥ | 130,856.7 | 1.07 | % | ¥ | 134,759.6 | 0.95 | % | ¥135,087.3 | 0.87 | % | |||||||||||||
|
Foreign (1) |
53,322.4 | 2.24 | 59,064.7 | 1.95 | 77,089.0 | 1.75 | ||||||||||||||||||
|
|
|
|
|
|
|
|||||||||||||||||||
|
Total |
¥ | 184,179.1 | 1.41 | % | ¥ | 193,824.3 | 1.25 | % | ¥212,176.3 | 1.19 | % | |||||||||||||
|
|
|
|
|
|
|
|||||||||||||||||||
|
Financed by: |
||||||||||||||||||||||||
|
Interest-bearing liabilities: |
||||||||||||||||||||||||
|
Domestic |
¥ | 130,916.6 | 0.26 | % | ¥ | 135,974.9 | 0.21 | % | ¥141,878.0 | 0.18 | % | |||||||||||||
|
Foreign |
34,504.0 | 0.88 | 37,424.6 | 0.73 | 47,535.3 | 0.64 | ||||||||||||||||||
|
|
|
|
|
|
|
|||||||||||||||||||
|
Total |
165,420.6 | 0.39 | 173,399.5 | 0.32 | 189,413.3 | 0.30 | ||||||||||||||||||
|
Non-interest-bearing liabilities |
18,758.5 | — | 20,424.8 | — | 22,763.0 | — | ||||||||||||||||||
|
|
|
|
|
|
|
|||||||||||||||||||
|
Total |
¥ | 184,179.1 | 0.35 | % | ¥ | 193,824.3 | 0.29 | % | ¥212,176.3 | 0.26 | % | |||||||||||||
|
|
|
|
|
|
|
|||||||||||||||||||
|
Interest rate spread |
1.02 | % | 0.93 | % | 0.89 | % | ||||||||||||||||||
|
Net interest income as a percentage of total interest-earning assets |
1.06 | % | 0.97 | % | 0.92 | % | ||||||||||||||||||
Note:
| (1) | Interest income on foreign activities for the fiscal year ended March 31, 2012 includes a gain of ¥139.3 billion on the conversion rate adjustment of Morgan Stanley’s convertible preferred stock. For more information, see Note 2 to our consolidated financial statements included elsewhere in this Annual Report. |
Provision (credit) for credit losses. Provision for credit losses is charged to operations to maintain the allowance for credit losses at a level deemed appropriate by management. When there is an improvement in asset quality, credit for credit losses is recorded to reverse the allowance for credit losses to an appropriate level. For the fiscal year ended March 31, 2014, we recorded ¥106.4 billion of credit for credit losses, compared to provision for credit losses of ¥144.5 billion for the previous fiscal year. For details of the provision for credit losses and a description of the approach and methodology used to establish the allowance for credit losses, see “—B. Liquidity and Capital Resources—Financial Condition—Loan Portfolio.”
Non-interest income . Non-interest income consists of:
| Ÿ |
fees and commissions income, including: |
| Ÿ |
trust fees, |
| Ÿ |
fees on funds transfer and service charges for collections, |
| Ÿ |
fees and commissions on international business, |
| Ÿ |
fees and commissions on credit card business, |
| Ÿ |
service charges on deposits, |
| Ÿ |
fees and commissions on securities business, |
59
Table of Contents
| Ÿ |
fees on real estate business, |
| Ÿ |
insurance commissions, |
| Ÿ |
fees and commissions on stock transfer agency services, |
| Ÿ |
guarantee fees, |
| Ÿ |
fees on investment funds business, and |
| Ÿ |
other fees and commissions, |
| Ÿ |
foreign exchange gains (losses)—net, which include gains (losses) on foreign exchange derivative contracts (for example, foreign exchange gains (losses) on currency derivatives), foreign exchange gains (losses) on other than derivative contracts (for example, gains (losses) on foreign exchange transactions), and foreign exchange gains (losses) related to the fair value option (for example, foreign exchange gains (losses) on securities under the fair value option), |
| Ÿ |
trading account profits (losses)—net, which primarily include net profits (losses) on trading account securities and interest rate derivative contracts entered into for trading purposes, including assets relating to the following activities: |
| Ÿ |
trading purpose activities, which are conducted mainly for the purpose of generating profits either through transaction fees or arbitrage gains and involve frequent and short-term selling and buying of securities, commodities or others, and |
| Ÿ |
trading account assets relating to application of certain accounting rules, which are generally not related to trading purpose activities but are classified as trading accounts due to application of certain accounting rules, such as assets that are subject to fair value option accounting treatment or investment securities held by variable interest entities that are classified as trading account securities. |
Of the two categories, trading purpose activities represent a smaller portion of our trading account profits,
| Ÿ |
investment securities gains (losses)—net, which primarily include net gains or losses on sales and impairment losses on securities available for sale, |
| Ÿ |
equity in earnings (losses) of equity method investees—net, which includes our equity interest in the earnings of our equity investees and impairment losses on our investments in equity method investees, |
| Ÿ |
gains on sales of loans, and |
| Ÿ |
other non-interest income. |
The following table is a summary of our non-interest income for the fiscal years ended March 31, 2012, 2013 and 2014:
| Fiscal years ended March 31, | ||||||||||||
| 2012 | 2013 | 2014 | ||||||||||
| (in billions) | ||||||||||||
|
Fees and commissions income |
¥ | 1,100.0 | ¥ | 1,160.9 | ¥ | 1,294.1 | ||||||
|
Foreign exchange gains (losses)—net |
34.3 | (39.0 | ) | (61.8 | ) | |||||||
|
Trading account profits (losses)—net |
667.3 | 570.3 | (33.9 | ) | ||||||||
|
Investment securities gains—net |
19.4 | 156.0 | 303.5 | |||||||||
|
Equity in earnings (losses) of equity method investees—net |
(499.4 | ) | 60.2 | 110.5 | ||||||||
|
Gains on sales of loans |
15.6 | 14.8 | 17.7 | |||||||||
|
Government grant for transfer of substitutional portion of Employees’ Pension Fund Plans |
— | — | 115.2 | |||||||||
|
Other non-interest income |
103.4 | 144.8 | 75.7 | |||||||||
|
|
|
|
|
|
|
|||||||
|
Total non-interest income |
¥ | 1,440.6 | ¥ | 2,068.0 | ¥ | 1,821.0 | ||||||
|
|
|
|
|
|
|
|||||||
60
Table of Contents
Fees and commissions income for the fiscal year ended March 31, 2014 was ¥1,294.1 billion, an increase of ¥133.2 billion from ¥1,160.9 billion for the fiscal year ended March 31, 2013. The increase reflected our improved performance in the securities, investment funds, trust and international businesses.
Net foreign exchange losses for the fiscal year ended March 31, 2014 were ¥61.8 billion, compared to ¥39.0 billion of net foreign exchange losses for the fiscal year ended March 31, 2013. This was mainly due to lower net foreign exchange gains related to the fair value option. This decrease was primarily because the Japanese yen depreciated to smaller degrees against other major currencies during the fiscal year ended March 31, 2014, compared to the previous fiscal year. This decrease was partially offset by decreases in losses related to foreign exchange derivative contracts and foreign exchange other than derivatives.
We recorded net trading account losses of ¥33.9 billion for the fiscal year ended March 31, 2014, compared to net trading account profits of ¥570.3 billion for the previous fiscal year. This was primarily attributable to lower fair values of foreign bonds, including U.S. Treasury bonds, due to higher interest rates in the United States, reflecting the tapering of the quantitative monetary easing program by the FRB.
Net investment securities gains for the fiscal year ended March 31, 2014 were ¥303.5 billion, an increase of ¥147.5 billion from ¥156.0 billion for the fiscal year ended March 31, 2013. This increase mainly reflected higher stock prices in Japan, increasing realized gains from sales of marketable equity securities, and a reduction of impairment losses on marketable equity securities.
Net equity in earnings of equity method investees for the fiscal year ended March 31, 2014 was ¥110.5 billion, compared to net equity in earnings of equity method investees of ¥60.2 billion for the previous fiscal year, mainly due to higher earnings from the equity method investees such as Morgan Stanley.
We recorded a one-time adjustment of ¥115.2 billion, which was reported as a component of our non-interest income, for the fiscal year ended March 31, 2014, as we transferred the substitutional portion of MUTB’s benefit obligations relating to employee benefit funds to the Japanese government.
Core Business Areas
We operate our main businesses under an integrated business group system. This integrates the operations of BTMU, MUTB, MUMSS (through MUSHD), Mitsubishi UFJ NICOS and other subsidiaries in the following five areas—Retail, Corporate, Trust Assets, Global, and Global Markets. These five businesses serve as the core sources of our revenue. Operations that are not covered under the integrated business group system, which mainly consists of the corporate center of MUFG, BTMU, MUTB and MUMSS and the elimination of net revenues among business segments, are classified under Other. For further information, see “—A. Operating Results—Business Segment Analysis.”
Our business segment information is based on financial information prepared in accordance with Japanese GAAP, as adjusted in accordance with internal management accounting rules and practices and is not consistent with our consolidated financial statements included elsewhere in this Annual Report, which have been prepared in accordance with U.S. GAAP. For information on a reconciliation of operating profit under our internal management reporting system to income before income tax expense shown on the consolidated statements of income, see Note 29 to our consolidated financial statements included elsewhere in this Annual Report.
61
Table of Contents
The following table sets forth the relative contributions to operating profit for the fiscal year ended March 31, 2014 of the five core business areas and other based on our business segment information:
|
Integrated
Retail Banking Business Group |
Integrated
Corporate Banking Business Group |
Integrated
Trust Assets Business Group |
Integrated Global Business
Group |
Global
Markets |
Other | Total | ||||||||||||||||||||||||||||||
|
Other
than MUAH |
MUAH | Total | ||||||||||||||||||||||||||||||||||
| (in billions) | ||||||||||||||||||||||||||||||||||||
|
Net revenue |
¥ | 1,290.6 | ¥ | 924.5 | ¥ | 159.2 | ¥ | 567.9 | ¥ | 375.9 | ¥ | 943.8 | ¥ | 568.6 | ¥ | (13.6 | ) | ¥ | 3,873.1 | |||||||||||||||||
|
Operating expenses |
961.9 | 438.4 | 94.4 | 299.5 | 266.9 | 566.4 | 176.5 | 172.4 | 2,410.0 | |||||||||||||||||||||||||||
|
|
|
|
|
|
|
|
|
|
|
|
|
|
|
|
|
|
|
|||||||||||||||||||
|
Operating profit (loss) |
¥ | 328.7 | ¥ | 486.1 | ¥ | 64.8 | ¥ | 268.4 | ¥ | 109.0 | ¥ | 377.4 | ¥ | 392.1 | ¥ | (186.0 | ) | ¥ | 1,463.1 | |||||||||||||||||
|
|
|
|
|
|
|
|
|
|
|
|
|
|
|
|
|
|
|
|||||||||||||||||||
Summary of Our Recent Financial Condition
The following table presents some key asset figures:
| As of March 31, | ||||||||
| 2013 | 2014 | |||||||
| (in trillions) | ||||||||
|
Total assets |
¥ | 230.56 | ¥ | 253.66 | ||||
|
Net loans |
97.25 | 109.18 | ||||||
|
Loans, net of unearned income, unamortized premiums and deferred loan fees |
98.59 | 110.28 | ||||||
|
Allowance for credit losses |
(1.34 | ) | (1.10 | ) | ||||
|
Investment securities |
61.87 | 55.33 | ||||||
|
Securities available for sale |
58.84 | 51.89 | ||||||
|
Securities being held to maturity |
2.13 | 2.71 | ||||||
|
Trading account assets |
40.83 | 40.65 | ||||||
|
Trading securities |
26.18 | 28.84 | ||||||
|
Trading derivative assets |
14.65 | 11.81 | ||||||
|
Interest-earning deposits in other banks |
8.11 | 20.50 | ||||||
Total assets as of March 31, 2014 were ¥253.66 trillion, an increase of ¥23.10 trillion from ¥230.56 trillion as of March 31, 2013.
Total loans outstanding as of March 31, 2014 were ¥110.28 trillion, an increase of ¥11.69 trillion from ¥98.59 trillion as of March 31, 2013. This primarily reflected an increase in foreign loans mainly due to favorable economic fundamentals in the United States, our acquisition of Bank of Ayudhya Public Company Limited, or Krungsri, and an appreciation of the relevant foreign currencies against the Japanese yen, as well as an increase in domestic loans particularly to government related institutions.
Total allowance for credit losses as of March 31, 2014 was ¥1,094.4 billion, a decrease of ¥241.6 billion from ¥1,336.0 billion as of March 31, 2013. The decrease mainly reflected charge-offs, and reversal of allowance for credit losses due to an overall improvement in the credit quality of our loan portfolio.
Total investment securities as of March 31, 2014 were ¥55.33 trillion, a decrease of ¥6.54 trillion from ¥61.87 trillion as of March 31, 2013. This was mainly due to a decrease in our holding of Japanese government bonds primarily in response to the Bank of Japan’s monetary policy and measure to purchase such bonds in the market to stimulate the economy by increasing liquidity, and also as part of our asset and liability management.
Trading account assets as of March 31, 2014 were ¥40.65 trillion, compared to ¥40.83 trillion as of March 31, 2013. While the fair values of foreign currency-denominated bonds held by our commercial and trust banking subsidiaries increased on a Japanese yen basis, the fair values of trading derivatives, particularly interest rate-related derivatives, in our securities subsidiaries declined.
62
Table of Contents
Interest-earning deposits in other banks as of March 31, 2014 was ¥20.50 trillion, an increase of ¥12.39 trillion from ¥8.11 trillion as of March 31, 2013 mainly due to increased interest-earning deposits with the Bank of Japan and the FRB. A significant portion of the cash received as a result of our sale of Japanese government bonds was deposited with the Bank of Japan. Similarly, a significant portion of the cash received as a result of our sale of U.S. Treasury bonds was deposited with the FRB.
The following table presents some key liability figures:
| As of March 31, | ||||||||
| 2013 | 2014 | |||||||
| (in trillions) | ||||||||
|
Total liabilities |
¥ | 219.62 | ¥ | 240.91 | ||||
|
Total deposits |
148.21 | 162.52 | ||||||
|
Domestic |
118.33 | 121.51 | ||||||
|
Overseas |
29.88 | 41.01 | ||||||
|
Payables under repurchase agreements |
15.70 | 21.27 | ||||||
|
Other short-term borrowings |
11.61 | 11.11 | ||||||
|
Trading account liabilities |
14.97 | 11.98 | ||||||
|
Long-term debt |
12.18 | 14.50 | ||||||
Total liabilities as of March 31, 2014 were ¥240.91 trillion, an increase of ¥21.29 trillion from ¥219.62 trillion as of March 31, 2013.
Total deposits as of March 31, 2014 were ¥162.52 trillion, an increase of ¥14.31 trillion from ¥148.21 trillion as of March 31, 2013. This was mainly due to a higher balance of interest-bearing deposits in the United States.
Payables under repurchase agreements as of March 31, 2014 were ¥21.27 trillion, an increase of ¥5.57 trillion from ¥15.70 trillion as of March 31, 2013. This increase was primarily due to increases in the volumes of transactions by our commercial banking, securities and trust banking subsidiaries.
Trading account liabilities as of March 31, 2014 were ¥11.98 trillion, compared to ¥14.97 trillion as of March 31, 2013, as the fair values of trading derivatives, particularly interest rate-related derivatives, in our securities subsidiaries, declined.
Long-term debt as of March 31, 2014 was ¥14.50 trillion, an increase of ¥2.32 trillion from ¥12.18 trillion as of March 31, 2013. This primarily reflected increased long-term borrowings and issuances of bonds by our commercial banking, trust banking and securities subsidiaries.
Shareholders’ Equity
The following table presents some key shareholders’ equity figures:
| As of March 31, | ||||||||
| 2013 | 2014 | |||||||
| (in trillions) | ||||||||
|
Shareholders’ equity |
¥ | 10.61 | ¥ | 12.21 | ||||
|
Retained earnings |
1.60 | 2.40 | ||||||
|
Unrealized gains on investment securities, net of tax |
1.11 | 1.27 | ||||||
|
Foreign currency translation adjustments, net of tax |
(0.21 | ) | 0.29 | |||||
63
Table of Contents
Capital Ratio
The following tables present our risk-adjusted capital ratio in accordance with Basel III as of March 31, 2013 and 2014. Underlying figures are calculated in accordance with Japanese banking regulations based on information derived from our consolidated financial statements prepared in accordance with Japanese GAAP, as required by the FSA. The figures in the tables below are rounded down.
Common Equity Tier 1 (minimum capital ratios required: 4.00%)
| As of March 31, | ||||||||
| 2013 | 2014 | |||||||
|
MUFG (consolidated) |
11.70 | % | 11.25 | % | ||||
|
BTMU (consolidated) |
11.71 | 11.05 | ||||||
|
BTMU (stand-alone) |
11.76 | 11.88 | ||||||
|
MUTB (consolidated) |
13.12 | 14.21 | ||||||
|
MUTB (stand-alone) |
12.49 | 13.72 | ||||||
Tier 1 Capital (minimum capital ratios required: 5.50%)
| As of March 31, | ||||||||
| 2013 | 2014 | |||||||
|
MUFG (consolidated) |
12.74 | % | 12.45 | % | ||||
|
BTMU (consolidated) |
13.11 | 12.21 | ||||||
|
BTMU (stand-alone) |
13.99 | 13.74 | ||||||
|
MUTB (consolidated) |
13.77 | 14.76 | ||||||
|
MUTB (stand-alone) |
13.22 | 14.37 | ||||||
Total Capital (minimum capital ratios required: 8.00%)
| As of March 31, | ||||||||
| 2013 | 2014 | |||||||
|
MUFG (consolidated) |
16.68 | % | 15.53 | % | ||||
|
BTMU (consolidated) |
17.51 | 15.57 | ||||||
|
BTMU (stand-alone) |
18.52 | 17.52 | ||||||
|
MUTB (consolidated) |
17.79 | 18.38 | ||||||
|
MUTB (stand-alone) |
17.94 | 18.51 | ||||||
Through our subsidiaries and affiliated companies, we engage in a broad range of financial businesses and services, including commercial banking, investment banking, trust banking and asset management services, securities businesses and credit card businesses, and provide related services to individuals primarily in Japan and the United States and to corporate customers around the world. Our results of operations and financial condition are exposed to changes in various external economic factors, including:
| Ÿ |
general economic conditions, |
| Ÿ |
interest rates, |
| Ÿ |
foreign currency exchange rates, and |
| Ÿ |
stock and real estate prices. |
64
Table of Contents
The global economy lacked strong momentum during the fiscal year ended March 31, 2014. Although gradually improving trends in Japan and the United States generally continued, recovery in Europe and in other Asian countries was limited.
In Japan, since the introduction of the “Abenomics” policy at the end of the calendar year 2012 and the Bank of Japan’s “quantitative and qualitative monetary easing” policy in April 2013, the Japanese yen depreciated against other major currencies, and this has generally had a positive effect on the Japanese economy while concerns still remain over the effectiveness of the government’s economic measures in the longer-term. In the United States, stock, land and housing prices gradually improved while the FRB maintained its zero-interest rate policy, a policy to maintain the federal funds target rate between zero and 0.25%. However, uncertainty remains as to whether the improving trends would continue if, for example, the FRB further tapers or discontinues its economic stimulus measures. Eurozone GDP growth turned positive in the quarter ended June 30, 2013 for the first time in seven quarters and it maintained a positive growth for the four consecutive quarters since then, but the rate of economic recovery in the region has remained slow. Emerging economics have been slowing partially due to decreased foreign investments and heightened geopolitical risks.
Economic Environment in Japan
Signs of improvement in the Japanese economy continued to emerge in the fiscal year ended March 31, 2014. The depreciation of the Japanese yen against other major currencies after the introduction of the “Abenomics” policy helped large-scale exporters improve their financial performance, which led to higher stock prices. The stronger stock market led to increased corporate and household spending, production of goods and exports. The trend among large corporations to increase salaries through “base-up” (raising base pay rather than giving a one-time raise) in response to the Abe administration’s encouragement and the temporary increase in private demand before the increase in the consumption tax rate from 5% to 8% on April 1, 2014, supported stronger private spending and economic growth, particularly in the second half of the fiscal year ended March 31, 2014. However, concerns still remain over the effectiveness of the government’s economic measures in the longer-term particularly in light of the disparate effects of “Abenomics,” the increasing public debt, the adverse impact of higher consumption tax rates on private consumption, and the negative effect of a weaker Japanese yen on imports.
The “Abenomics” policy consists of three fundamental strategies. As part of the first fundamental strategy, a series of anti-deflation and other monetary measures are being implemented in coordination with the Bank of Japan. The Bank of Japan put forth in January 2014 an inflation target of 2% in terms of a year-on-year rate of change in the consumer price index to be achieved in approximately two years, and began to implement measures under its “quantitative and qualitative monetary easing” policy in April 2014. The policy measures set forth by the Bank of Japan include:
| Ÿ |
money market operations with an aim to double Japan’s monetary base in two years, |
| Ÿ |
market purchase of Japanese government bonds of up to ¥6.0 to ¥8.0 trillion per month, and |
| Ÿ |
market purchases of exchange-traded funds, Japanese real estate investment trust, commercial paper and corporate bonds. |
According to the Bank of Japan, under this policy, Japan’s monetary base increased ¥73.84 trillion to ¥219.89 trillion as of March 31, 2014 from ¥146.04 trillion as of March 31, 2013. As of June 30, 2014, the monetary base increased to ¥243.43 trillion. The aggregate amount that the Bank of Japan spent on purchasing long-term Japanese government bonds under the policy during the fiscal year ended March 31, 2014 was ¥88.03 trillion. The aggregate purchase amount of long-term Japanese government bonds during the quarter ended June 30, 2014 was ¥20.06 trillion. The continued supply of cash by the Bank of Japan in the market has had the effect of keeping interest rates low and contributed to increased stock and real estate purchases.
65
Table of Contents
The second fundamental strategy set forth by the Abe administration includes increased government spending to stimulate the economy. Measures discussed in connection with this strategy include the acceleration of measures to promote reconstruction, disaster prevention and safety, and mitigation of the adverse impact of the government’s economic measures on low-income earners and child-rearing households. The third fundamental strategy includes deregulation and other growth measures, as well as plans focused on, among other things, the health, energy, infrastructure and agriculture sectors, foreign investments and trade, and labor and employment. Measures discussed in connection with this strategy include corporate tax reform, reform of investments of public and quasi-public funds, provision of services to enable women to participate more actively in the workforce, utilization of foreign human resources, and the introduction of flexible and diversified ways of working.
Despite the indicia of improvement in economic conditions in Japan seen thus far, however, there is still uncertainty surrounding Japan’s economy, including the medium and long-term effects of the “Abenomics” measures on Japan’s economy. Moreover, the “Abenomics” measures have affected, and may continue to affect, each economic segment differently, potentially creating varying business environments for our customers, borrowers and investees depending on their industry and particular circumstances.
The following table sets forth Japan’s real gross domestic product and its components on a quarter on quarter basis for the periods indicated:
| Calendar Year | (Unit: %) | |||||||||||||||||||||||||||||||||||||||||||||||
| 2011 | 2012 | 2013 | 2014 | |||||||||||||||||||||||||||||||||||||||||||||
| 2Q | 3Q | 4Q | 1Q | 2Q | 3Q | 4Q | 1Q | 2Q | 3Q | 4Q | 1Q | |||||||||||||||||||||||||||||||||||||
|
Gross Domestic Product |
(0.8 | ) | 2.6 | 0.2 | 1.0 | (0.6 | ) | (0.8 | ) | 0.0 | 1.3 | 0.7 | 0.3 | 0.1 | 1.6 | |||||||||||||||||||||||||||||||||
|
Private Consumption |
1.0 | 1.6 | 0.6 | 0.4 | 0.4 | (0.5 | ) | 0.5 | 1.0 | 0.7 | 0.2 | 0.4 | 2.2 | |||||||||||||||||||||||||||||||||||
|
Private Residential Investment |
(2.3 | ) | 5.2 | (1.8 | ) | (1.6 | ) | 3.1 | 1.8 | 2.4 | 1.8 | 0.8 | 3.3 | 4.3 | 3.1 | |||||||||||||||||||||||||||||||||
|
Private Non-Residential Investment |
(0.4 | ) | 2.3 | 8.3 | (2.9 | ) | 0.5 | (1.5 | ) | (0.2 | ) | (2.2 | ) | 0.9 | 0.9 | 1.6 | 7.6 | |||||||||||||||||||||||||||||||
|
Government Consumption |
0.3 | 0.1 | 0.2 | 1.5 | (0.6 | ) | 0.4 | 0.7 | 0.9 | 0.4 | 0.2 | 0.2 | 0.1 | |||||||||||||||||||||||||||||||||||
|
Public Investment |
2.5 | (2.4 | ) | (4.8 | ) | 9.9 | (2.0 | ) | (2.4 | ) | (0.3 | ) | 4.6 | 6.4 | 6.8 | 1.1 | (2.7 | ) | ||||||||||||||||||||||||||||||
|
Exports |
(7.5 | ) | 9.6 | (3.0 | ) | 2.8 | (0.5 | ) | (4.0 | ) | (3.0 | ) | 4.3 | 2.9 | (0.7 | ) | 0.5 | 6.0 | ||||||||||||||||||||||||||||||
|
Imports |
(0.5 | ) | 3.3 | 1.9 | 2.0 | 1.4 | (0.4 | ) | (1.9 | ) | 1.1 | 1.8 | 2.4 | 3.7 | 6.3 | |||||||||||||||||||||||||||||||||
Source: Cabinet Office, Government of Japan
Japan’s GDP grew for the six consecutive quarters ended March 31, 2014 reflecting stronger domestic demand. The following trends were observed for each component of Japan’s GDP in recent periods:
| Ÿ |
Private consumption continued to grow during the fiscal year ended March 31, 2014. In the quarter ended December 31, 2013, durable goods (such as vehicles) and services (such as financial services) contributed to the positive growth, while semi-durable goods showed little change, and non-durable goods (such as gasoline) contributed to the negative growth. In the quarter ended March 31, 2014, durable goods (such as vehicles, home electronics, personal computers and household items) contributed to positive growth. The improved economic environment after the introduction of the “Abenomics” policy, expectation of increases in salaries and bonuses, and the temporary increase in private demand before the increase in consumption tax from 5% to 8% on April 1, 2014 were among the key-drivers of the positive growth in private consumption. The impact of the increase in consumption tax on April 1, 2014 has been limited, although decreases were reported, for example, in the number of vehicles sold and the sales volume of luxury department stores. Private consumption may significantly weaken, however, if the consumption tax rate is increased again from 8% to 10% in October 2015 as currently planned. |
66
Table of Contents
| Ÿ |
Private residential investment continued to grow during the fiscal year ended March 31, 2014, marking eight consecutive quarters of positive growth. The increase in private residential investment partly reflected the recovery from the negative impact of the Great East Japan Earthquake in 2011, and the positive impact of the “Abenomics” measures. In the fiscal year ended March 31, 2013, the Tohoku area, the northeastern area of Japan that suffered damages from the earthquake was the main region to show strong growth. In the fiscal year ended March 31, 2014, wider areas including the Tohoku area showed firm growth. However, this trend may not continue, as the number of new housing projects began to show negative growth in the quarter ended March 31, 2014. |
| Ÿ |
Private non-residential investment grew during the fiscal year ended March 31, 2014. In the quarter ended December 31, 2013, private investments in manufacturing industries increased 0.7% compared to the quarter ended December 31, 2012, mainly due to increases in the automobile, electronics and communications devices industries, which were partially offset by a decrease in the chemical industry. Non-residential investments in non-manufacturing industries increased 5.7% compared to the quarter ended December 31, 2012, mainly due to increases in the service and transportation industries, which were partially offset by a decrease in the wholesale and retail industry. In the quarter ended March 31, 2014, private non-residential investments in manufacturing industries increased 6.8% compared to the quarter ended March 31, 2013, mainly due to increases in the automobile and food industries, which were partially offset by a decrease in the chemical industry. Non-residential investments in non-manufacturing industries increased 7.7% compared to the quarter ended March 31, 2013, mainly due to increases in the transportation and wholesale and retail industries, which were partially offset by a decrease in the telecommunications industry. Private inventory investments, however, showed negative growth in the quarter ended December 31, 2013, as finished goods inventories in the automobile and raw steels industries decreased. Decreases were recorded in finished goods inventories and channel inventories in the quarter ended March 31, 2014. |
| Ÿ |
Government consumption grew during the fiscal year ended March 31, 2014 mainly due to increased social benefit expenses, including government spending on medical and nursing care services. |
| Ÿ |
Public investment increased 2.3% in the quarter ended December 31, 2013, but decreased 2.4% in the quarter ended March 31, 2014, marking the first negative growth recorded in six quarters. The positive effects of the ¥3.3 trillion supplemental budget passed in February 2013 waned, which negatively impacted public investment. |
| Ÿ |
Exports grew slowly during the fiscal year ended March 31, 2014. In the quarter ended December 31, 2013, exports of electronics, communications devices and semiconductor manufacturing equipment contributed to the increase in exports. This trend continued in the quarter ended March 31, 2014. In addition, exports of automobiles also grew in the quarter ended March 31, 2014. Imports showed consistent growth during the fiscal year ended March 31, 2014. In the quarter ended December 31, 2013, imports of crude oil, natural gas and petroleum products contributed to the positive growth of imports. Oil and natural gas imports continued to grow in the quarter ended March 31, 2014, and the growth in imports was further supported by increased imports of electronics and communications devices such as cellular phones and personal computers. |
The following table sets forth the growth rates of Japan’s nationwide consumer price indices on a year-on-year basis for the periods indicated:
|
Calendar Year |
(Unit: %) | |||||||||||||||||||||||||||||||||||||||||||||||||||||||
| 2013 | 2014 | |||||||||||||||||||||||||||||||||||||||||||||||||||||||
| Apr. | May | Jun. | Jul. | Aug. | Sep. | Oct. | Nov. | Dec. | Jan. | Feb. | Mar. | Apr. | May | |||||||||||||||||||||||||||||||||||||||||||
|
Consumer Price Index |
(0.7 | ) | (0.3 | ) | 0.2 | 0.7 | 0.9 | 1.1 | 1.1 | 1.5 | 1.6 | 1.4 | 1.5 | 1.6 | 3.4 | 3.7 | ||||||||||||||||||||||||||||||||||||||||
Source: Ministry of Internal Affairs and Communications of Japan
67
Table of Contents
The following table sets forth Japan’s nationwide unemployment rates for the periods indicated:
|
Calendar Year |
(Unit: %) | |||||||||||||||||||||||||||||||||||||||||||||||
| 2011 | 2012 | 2013 | 2014 | |||||||||||||||||||||||||||||||||||||||||||||
| 2Q | 3Q | 4Q | 1Q | 2Q | 3Q | 4Q | 1Q | 2Q | 3Q | 4Q | 1Q | |||||||||||||||||||||||||||||||||||||
|
Unemployment Rate |
4.7 | 4.4 | 4.3 | 4.5 | 4.6 | 4.3 | 4.0 | 4.3 | 4.2 | 4.0 | 3.7 | 3.7 | ||||||||||||||||||||||||||||||||||||
Source: Ministry of Internal Affairs and Communications of Japan
Japan’s nationwide unemployment rate for May 2014 was 3.5%.
The Bank of Japan has sought to keep short-term interest rates low by maintaining its “quantitative and qualitative monetary easing” policy. Euro-yen-3-month Tokyo Interbank Offered Rate, or TIBOR, declined from 0.22800% on October 1, 2013 to 0.21200% on March 31, 2014, and further declined to around 0.21% as of July 7, 2014, the lowest level since 2006. Long term interest rates have fluctuated during the fiscal year ended March 31, 2014. The yield on newly issued ten-year Japanese government bonds fell to the historical low of approximately 0.325% shortly after the introduction of the “Abenomics” measures, but rose to around 1% by May 2013 partly reflecting concerns over increased market volatility and a general shift in investors’ allocation of capital from the debt markets to the improving stock markets as well as increased bonds being sold off in reaction to the discussion surrounding the FRB’s possible tapering of the quantitative monetary easing program. Since late May 2013, the yield on newly-issued ten-year Japanese government bonds has fluctuated between approximately 0.6% and 0.8%, influenced by events such as the drop of the Chinese Purchasing Managers’ Index, or PMI, to below 50 for the first time in seven months, indicating a contraction in the manufacturing sector, the FRB’s decision to taper the quantitative easing program, and the fiscal cliff and government shut-down in the United States. The fluctuations in interest rates also reflected investor sentiment of risk aversion in response to signs of deteriorating economic conditions in developing countries and concerns over geopolitical risks, particularly in countries such as Iraq, Syria and Ukraine.
The following chart shows the interest rate trends in Japan since April 2012:
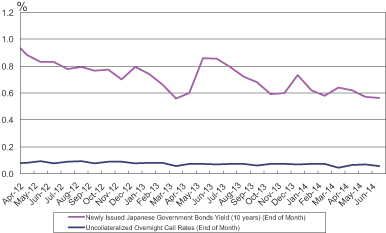
|
||||
|
Source: Bank of Japan |
With regards to the Japanese stock market, the closing price of the Nikkei Stock Average, or Nikkei 225, which is the average of 225 blue chip stocks listed on the Tokyo Stock Exchange, increased from ¥12,397.91 on March 29, 2013 to ¥14,827.83 on March 31, 2014. The depreciation of the Japanese yen, together with improved U.S. economic statistics, contributed to the rise in stock indices in Japan. The Nikkei 225 recorded an intra-day high of ¥15,942.60 on May 23, 2013. However, the Nikkei 225 started to decline rapidly on the same day after
68
Table of Contents
the announcement of weak Chinese statistics, and the downward trend continued for approximately one month until late June 2013, when the price was at a similar level to what it had been at the end of March 2013. The downward trend reflected investors’ reactions to a rapid increase in stock prices and to the congressional testimony of Mr. Ben Bernanke, the Chair of the FRB at the time, suggesting the possibility of tapering the quantitative monetary easing program. Subsequent to the one-month long downward trend, the Nikkei 225 remained generally between ¥13,100 and ¥14,800 until the end of October 2013. As interest rates in the United States rose, the Japanese yen depreciated against the U.S. dollar, and Japanese stock prices rose. On December 30, 2013, the Nikkei 225 was at ¥16,320.22, the high of the fiscal year ended March 31, 2014. The upward trend ended in early 2014, partially influenced by risk aversion among investors following weak U.S. economic statistics, the rapid depreciation of developing countries’ currencies, and increased political unrest such as in Crimea. The Nikkei 225 generally remained between ¥14,000 and ¥16,000 from April to July 2014.
The Tokyo Stock Price Index, or TOPIX, a composite index of all stocks listed on the First Section of the Tokyo Stock Exchange, similarly fluctuated due to the same reasons as those for the Nikkei 225. The TOPIX increased from the beginning of April 2013 to an intra-day high of 1,289.77 on May 23, 2013. On the same day, the TOPIX began to decline rapidly, and the downward trend continued for approximately one month. Subsequently, the stock market became more stable with the TOPIX remaining generally between 1,100 and 1,230 until the end of October 2013. Heightened expectations of tapering of the U.S. quantitative easing policy after the announcement of improved U.S. labor statistics contributed to a rise in stock prices towards mid-January 2014, and the TOPIX recorded intra-day high of 1,308.08 on January 16, 2014. Subsequently, weaker U.S. statistics and heightened geopolitical risks put downward pressure on stock prices, and as a result, the TOPIX remained between 1,140 and 1,300 for the rest of the fiscal year ended March 31, 2014. The TOPIX was generally in a similar range from April to mid-June 2014, but has since showed some increase.
The following chart shows the daily closing price of the Nikkei Stock Average since April 2012:
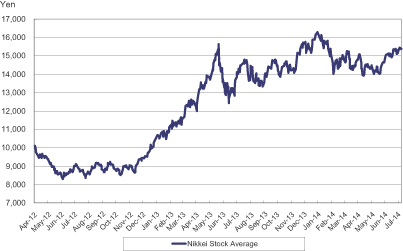
The Japanese yen depreciated against other major currencies, such as the U.S. dollar, from the closing price of ¥94.22 to $1 on March 29, 2013 to an intra-day high of ¥103.74 to $1 on May 22, 2013, reflecting the introduction of the “quantitative and qualitative monetary easing” policy by the Bank of Japan, and the stronger U.S. dollar after the announcement of reductions in the policy interest rates of the European Central Bank, or ECB, and the Reserve Bank of Australia. The Japanese yen appreciated against the U.S. dollar as U.S. statistics worsened, reaching an intra-day low of ¥93.79 to the U.S. dollar on June 13, 2013, and the exchange rate generally remained between ¥95 and ¥100 to the U.S. dollar until the end of October, 2013. In early November 2013, the United States reported improved labor statistics, and the FRB’s decision to taper the quantitative monetary easing program was officially announced on December 18, 2013. Reflecting these events, the exchange
69
Table of Contents
rate reached the high for the fiscal year ended March 31, 2014 of ¥105.44 to the U.S. dollar on January 2, 2014. The exchange rate has remained between ¥100.76 and ¥104.13 to the U.S. dollar for the five months since February 2014.
The following chart shows the foreign exchange rates expressed in Japanese yen per U.S. dollar since April 2012:
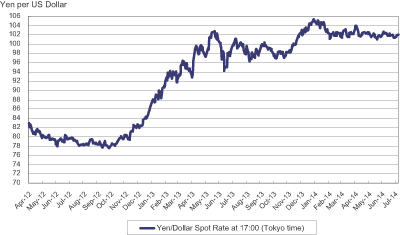
Source: Bank of Japan
According to a land price survey conducted by the Japanese government, the average residential land price in Japan declined by 0.6% between January 1, 2013 and January 1, 2014. The average commercial land price in Japan also declined 0.5% during the same period. In the three major metropolitan areas of Tokyo, Osaka and Nagoya, the average residential land price increased 0.5% between January 1, 2013 and January 1, 2014, while the average commercial land price in those areas also increased 1.6% during the same period. In the local regions of Japan, which consist of regions other than the three major metropolitan areas, the average residential land price declined 1.5% between January 1, 2013 and January 1, 2014, and the average commercial land price declined 2.1% during the same period. Of the five areas with the greatest increases in land prices over the fiscal year ended March 31, 2014, three were in the Tohoku region, which was the region most heavily affected by the Great East Japan Earthquake in March of 2011.
According to Teikoku Databank, a Japanese research institution, the number of companies that filed for legal bankruptcies in Japan from April 2013 to March 2014 was approximately 10,100, a decrease of 5.7% from the same period of the previous year. The decrease in the number of companies that filed for legal bankruptcy was mainly due to the positive effects of the Japanese government’s economic stimulus measures under the “Abenomics” policy and increased demand before the increase of the consumption tax in April 2014. The number of companies that filed for legal bankruptcy with debt exceeding ¥10 billion was 19 in the fiscal year ended March 31, 2014, the lowest recorded in 10 years. As a percentage of the total number of legal bankruptcy filings made in the same fiscal year, the number of such filings made by businesses that are either unincorporated or capitalized at less than ¥10 million constituted 57.4%. The aggregate amount of liabilities subject to bankruptcy filings, excluding financial institutions’ bankruptcy filings, from April 2013 to March 2014 was approximately ¥2.75 trillion, a decrease of ¥0.18 trillion , or 6.2%, compared to the same period of the previous year.
International Financial Markets
U.S. Economy
The U.S. economy demonstrated signs of continued improvement during the fiscal year ended March 31, 2014, mainly driven by stronger personal consumption, which reflected improved stock prices. In addition, U.S.
70
Table of Contents
labor statistics generally improved during the fiscal year ended March 31, 2014. However, uncertainty remains as to whether the improving trends would continue if, for example, the FRB further tapers or discontinues its economic stimulus measures. The FRB maintained its zero-interest rate policy during the six months ended September 30, 2013. On December 18, 2013, however, the FRB announced its decision to taper the quantitative monetary easing policy by decreasing by $5.0 billion the monthly purchase amounts for each of mortgage-backed securities and U.S. treasury bonds starting in January 2014. Thereafter, the monthly purchase amounts were again decreased by $5.0 billion each, once in March, and again in April 2014.
The following table sets forth the growth rates of U.S. real gross domestic product and its components on a quarter-on-quarter basis for the periods indicated:
| Calendar Year | (Unit: %) | |||||||||||||||||||||||||||||||||||||||||||||||
| 2011 | 2012 | 2013 | 2014 | |||||||||||||||||||||||||||||||||||||||||||||
| 2Q | 3Q | 4Q | 1Q | 2Q | 3Q | 4Q | 1Q | 2Q | 3Q | 4Q | 1Q | |||||||||||||||||||||||||||||||||||||
|
Gross Domestic Product |
3.2 | 1.4 | 4.9 | 3.7 | 1.2 | 2.8 | 0.1 | 1.1 | 2.5 | 4.1 | 2.6 | (2.9 | ) | |||||||||||||||||||||||||||||||||||
|
Personal Consumption Expenditures |
1.5 | 2.1 | 2.4 | 2.9 | 1.9 | 1.7 | 1.7 | 2.3 | 1.8 | 2.0 | 3.3 | 1.0 | ||||||||||||||||||||||||||||||||||||
|
Gross Private Domestic Investment |
14.2 | 2.5 | 31.9 | 10.5 | (1.6 | ) | 6.5 | (2.4 | ) | 4.7 | 9.2 | 17.2 | 2.5 | (11.7 | ) | |||||||||||||||||||||||||||||||||
|
Fixed Investment |
8.6 | 14.8 | 10.0 | 8.6 | 4.7 | 2.7 | 11.6 | (1.5 | ) | 6.5 | 5.9 | 2.8 | (1.8 | ) | ||||||||||||||||||||||||||||||||||
|
Non-residential |
9.9 | 16.7 | 9.5 | 5.8 | 4.5 | 0.3 | 9.8 | (4.6 | ) | 4.7 | 4.8 | 5.7 | (1.2 | ) | ||||||||||||||||||||||||||||||||||
|
Residential |
2.7 | 6.1 | 12.2 | 23.0 | 5.7 | 14.1 | 19.8 | 12.5 | 14.2 | 10.3 | (7.9 | ) | (4.2 | ) | ||||||||||||||||||||||||||||||||||
|
Government Consumption Expenditures and Gross Investment |
(1.3 | ) | (2.5 | ) | (1.5 | ) | (1.4 | ) | 0.3 | 3.5 | (6.5 | ) | (4.2 | ) | (0.4 | ) | 0.4 | (5.2 | ) | (0.8 | ) | |||||||||||||||||||||||||||
|
Exports |
4.9 | 7.0 | 2.7 | 4.2 | 3.8 | 0.4 | 1.1 | (1.3 | ) | 8.0 | 3.9 | 9.5 | (8.9 | ) | ||||||||||||||||||||||||||||||||||
|
Imports |
0.7 | 4.9 | 5.9 | 0.7 | 2.5 | 0.5 | (3.1 | ) | 0.6 | 6.9 | 2.4 | 1.5 | 1.8 | |||||||||||||||||||||||||||||||||||
Source: U.S. Department of Commerce Bureau of Economic Analysis
The U.S. real GDP grew for the first three quarters of the fiscal year ended March 31, 2014. Private consumption, which accounted for approximately 68% of the U.S. GDP, demonstrated consistent growth during the fiscal year ended March 31, 2014, mainly due to increased purchasing activities.
Government consumption generally decreased during the fiscal year ended March 31, 2014, largely due to decreased expenditures on national defense. Federal government non-defense expenditures also decreased through the calendar year 2013 but increased in the quarter ended March 31, 2014, while consumption by state and local governments increased through the calendar year 2013 but subsequently declined.
The Consumer Price Index for All Urban Consumers, or CPI-U, increased 1.5% before seasonal adjustment over the 12 months ended March 31, 2014. Although CPI-U decreased 0.4% in April 2013 on a seasonally adjusted month-on-month basis, it has since shown growth of 0.0% to 0.4% on the same basis.
Housing prices showed signs of improvement during the fiscal year ended March 31, 2014. As of March 2014, the Federal Housing Finance Agency’s U.S. house price index exhibited an eleventh consecutive quarterly price increase in the purchase-only, seasonally adjusted index. This also marked the ninth consecutive quarter where the house price index showed an increase compared to the same quarter of the previous year.
Interest rates on U.S. Treasury bonds decreased in April 2013 to 1.6120% on May 1, 2013, and were generally on an upward trend partly in reaction to the discussions surrounding the possible tapering of the FRB’s quantitative monetary easing program and improved U.S. statistics including labor figures were released, reaching approximately 3.0% in September 2013. Following the FRB’s decided not to taper their monetary easing policy in September and the U.S. federal government shut-down in early October 2013, interest rates fluctuated, dropping to just below 2.5% at the end of October 2013. U.S. Treasury bond rates reached 3.0516% on January 2, 2014, following the announcement of the FRB’s decision to taper the quantitative monetary easing program. Interest rates have generally remained between 2.4% and 2.8% since February 2014.
71
Table of Contents
Stock prices in the United States were on a generally improving trend during the fiscal year ended March 31, 2014, with the Dow Jones Industrial Average generally fluctuating between $14,434.43 and $16,588.25. During the same period, the NASDAQ composite index was also on an upward trend, rising from 3,154.96 on April 18, 2013 to 4,371.71 on March 6, 2014. Subsequently, stock prices reached historical high levels as the U.S. economy showed signs of gradual growth, reflecting improved economic conditions supported by increased private consumption and lower unemployment rates. Since April 1, 2014, the Dow Jones Industrial Average has increased to an intra-day high of $17,074.65 on July 3, 2014, and the NASDAQ composite index increased to an intra-day high of 4,485.93 on the same day.
The following table sets forth U.S. unemployment rates on a month-on-month basis for the periods indicated:
|
Calendar Year |
(Unit: %) | |||||||||||||||||||||||||||||||||||||||||||||||||||||||||||
| 2013 | 2014 | |||||||||||||||||||||||||||||||||||||||||||||||||||||||||||
| Apr. | May | Jun. | Jul. | Aug. | Sep. | Oct. | Nov. | Dec. | Jan. | Feb. | Mar. | Apr. | May | Jun. | ||||||||||||||||||||||||||||||||||||||||||||||
|
Unemployment Rate |
7.5 | 7.5 | 7.5 | 7.3 | 7.2 | 7.2 | 7.2 | 7.0 | 6.7 | 6.6 | 6.7 | 6.7 | 6.3 | 6.3 | 6.1 | |||||||||||||||||||||||||||||||||||||||||||||
Source: United States Department of Labor, Bureau of Labor Statistics, BLS Information
Eurozone Economy
The Eurozone economy showed signs of recovery in the fiscal year ended March 31, 2014, but the growth remained weak. GDP grew in the quarter ended June 30, 2013 for the first time in seven quarters, and maintained positive growth for the following three quarters through the quarter ended March 31, 2014. The growth in GDP was mainly supported by increases in exports. The ECB has maintained its low interest rate policy, reducing its policy interest rate to 0.5% on May 2, 2013. On July 4, 2013, the ECB introduced “forward guidance,” indicating that short-term interest rates would remain low for an “extended period” of time. On November 7, 2013, the ECB further reduced its policy interest rate to a historical low of 0.25% to support the economy in response to low inflation rates in the Eurozone countries. On January 25, 2014, the ECB reaffirmed the “forward guidance” and its commitment to monetary easing, and also stated that it was willing and able to act further if needed. On June 5, 2014, the ECB took steps to further monetary easing by introducing a negative deposit facility interest rate of negative 0.1%. This new measure aims to stop the appreciation of the Euro against other currencies, which contributed to low inflation rates in the region, and also to increase the volume of loans especially to medium and small-sized enterprises in European peripheral countries.
The following table sets forth the growth rates of Eurozone real gross domestic product and its main expenditure components on a quarter-on-quarter basis for the periods indicated:
| Calendar Year | (Unit: %) | |||||||||||||||||||||||||||||||||||||||||||||||
| 2011 | 2012 | 2013 | 2014 | |||||||||||||||||||||||||||||||||||||||||||||
| 2Q | 3Q | 4Q | 1Q | 2Q | 3Q | 4Q | 1Q | 2Q | 3Q | 4Q | 1Q | |||||||||||||||||||||||||||||||||||||
|
Gross Domestic Product |
0.1 | 0.0 | (0.2 | ) | (0.1 | ) | (0.3 | ) | (0.2 | ) | (0.5 | ) | (0.2 | ) | 0.3 | 0.1 | 0.3 | 0.2 | ||||||||||||||||||||||||||||||
|
Private Final Consumption |
(0.5 | ) | 0.3 | (0.7 | ) | (0.3 | ) | (0.6 | ) | (0.1 | ) | (0.5 | ) | (0.2 | ) | 0.2 | 0.1 | 0.0 | 0.1 | |||||||||||||||||||||||||||||
|
Gross Fixed Capital Formation |
(0.6 | ) | (0.4 | ) | (0.7 | ) | (1.0 | ) | (1.8 | ) | (0.6 | ) | (1.4 | ) | (1.6 | ) | 0.2 | 0.5 | 0.9 | 0.3 | ||||||||||||||||||||||||||||
|
Government Final Consumption |
0.1 | (0.3 | ) | 0.2 | (0.3 | ) | (0.2 | ) | (0.2 | ) | 0.1 | 0.2 | 0.0 | 0.2 | (0.4 | ) | 0.3 | |||||||||||||||||||||||||||||||
|
Exports |
0.4 | 1.3 | 0.3 | 0.9 | 0.9 | 0.8 | (0.6 | ) | (0.8 | ) | 2.4 | 0.0 | 1.4 | 0.3 | ||||||||||||||||||||||||||||||||||
|
Imports |
(0.1 | ) | 0.5 | (1.1 | ) | 0.1 | (0.2 | ) | 0.3 | (1.0 | ) | (0.8 | ) | 1.6 | 0.9 | 0.7 | 0.8 | |||||||||||||||||||||||||||||||
Source: European Central Bank – Eurosystem
72
Table of Contents
Eurozone real GDP growth turned positive in the quarter ended June 30, 2013 for the first time since the beginning of the financial crisis in the peripheral countries of the Eurozone in the quarter ended December 31, 2011. Eurozone real GDP growth showed a positive growth of 0.3%, 0.1%, 0.3% and 0.2% for the quarters ended June 30, 2013, September 30, 2013, December 31, 2013 and March 31, 2014, respectively. Although all of the expenditure components recorded positive growths in the quarter ended March 31, 2014, the growth rate remained very limited.
The following table sets forth Eurozone unemployment rates on a month-on-month basis for the periods indicated:
|
Calendar Year |
(Unit: %) | |||||||||||||||||||||||||||||||||||||||||||||||||||||||
| 2013 | 2014 | |||||||||||||||||||||||||||||||||||||||||||||||||||||||
| Apr. | May | Jun. | Jul. | Aug. | Sep. | Oct. | Nov. | Dec. | Jan. | Feb. | Mar. | Apr. | May | |||||||||||||||||||||||||||||||||||||||||||
|
Unemployment Rate |
12.0 | 12.0 | 12.0 | 11.9 | 12.0 | 12.0 | 11.9 | 11.9 | 11.8 | 11.8 | 11.8 | 11.7 | 11.7 | 11.6 | ||||||||||||||||||||||||||||||||||||||||||
Source: European Central Bank—Eurosystem
The unemployment rate gradually recovered during the fiscal year ended March 31, 2014. The unemployment rate for May 2014 was 11.6%, the lowest in the last twelve months.
We continued to pursue global growth opportunities, including opportunities to expand our business in Southeast Asia and the operations of MUB in the United States and strengthen our alliance with Morgan Stanley during the fiscal year ended March 31, 2014. We plan to continue to selectively review and consider growth opportunities that will enhance our global competitiveness. We will monitor regulatory developments and pursue prudent transactions that will create a strong capital structure to enable us to contribute to the real economy, both domestically and globally, as a provider of a stable source of funds and high quality financial services. In order to respond to the increasingly complex market and legal risks, we continue to endeavor to enhance our compliance and internal control frameworks.
Integration of BTMU’s Operations in the Americas with UNBC’s Operations
Effective July 1, 2014, we integrated BTMU’s operations in the Americas region with the operations of UnionBanCal Corporation, or UNBC, which is a wholly owned subsidiary of BTMU, and changed UNBC’s corporate name to “MUFG Americas Holdings Corporation,” or MUAH. Union Bank, N.A., which is MUAH’s principal subsidiary and our primary operating subsidiary in the United States, was also renamed “MUFG Union Bank, N.A.,” or MUB, effective the same day. MUAH currently oversees BTMU’s operations in the Americas region as well as the operations of MUB.
Issuance of Basel III-Compliant Domestic Subordinated Bonds
On June 26, 2014, we issued in Japan two tranches of Basel III-compliant Japanese yen-denominated subordinated bonds due 2024 in an aggregate principal amount of ¥50 billion. The terms and conditions of these bonds contain a clause that requires the bonds to be written off upon the occurrence of certain events, including when the Japanese banking regulator deems us to be at risk of becoming non-viable. The issuance of these bonds was our first issuance of Basel III-compliant subordinated bonds.
Acquisition of Outstanding Classes of Preferred Stock
On April 1, 2014, we acquired all of the 156,000,000 outstanding shares of First Series of Class 5 Preferred Stock for ¥390 billion and cancelled all of the acquired shares. In addition, we expect to acquire all of the 1,000
73
Table of Contents
outstanding shares of Class 11 Preferred Stock on August 1, 2014 as required under the terms of the preferred stock or prior to that date at the request of the holder of the shares in exchange for up to 1,245 shares of our common stock. We plan to use shares of our common stock held in treasury for this acquisition. Upon our acquisition of the shares of Class 11 Preferred Stock, we will have no outstanding shares of any class of preferred stock.
Acquisition of Bank of Ayudhya Shares through Voluntary Tender Offer
On December 18, 2013, BTMU acquired an aggregate of 4,373,714,120 shares, representing 72.01%, of the total outstanding shares of Krungsri in Thailand through a Voluntary Tender Offer, or VTO, for 39 Thai Baht per share. The total purchase price was paid in cash, and was approximately ¥545.8 billion based on the currency exchange rate between the Thai Baht and the Japanese yen as of December 18, 2013. As a result of the transaction, Krungsri has become a consolidated subsidiary of BTMU. Krungsri has remained listed on the Stock Exchange of Thailand since the transaction.
In connection with the transaction, we recorded ¥217.4 billion of goodwill and ¥214.6 billion of intangible assets. We also recorded ¥202.2 billion of noncontrolling interests at fair value determined by a quoted market price as of the acquisition date. During the fiscal year ended March 31, 2014, we incurred ¥2.3 billion of acquisition-related costs. These expenses are included in Other non-interest expenses in our consolidated statements of income for the fiscal year ended March 31, 2014. The results of operations of Krungsri and its subsidiaries since the acquisition date were not material to us for the fiscal year ended March 31, 2014.
Under a Conditional Branch Purchase Agreement between BTMU and Krungsri, or the BPA, dated September 18, 2013, BTMU’s Bangkok Branch will be integrated with Krungsri through a contribution in kind of the BTMU Bangkok Branch business to Krungsri within one year from the date of the acquisition of Krungsri shares through the VTO. The effective date of the integration, however, is subject to change in accordance with an agreement between the parties and regulatory approval. In exchange for the contribution in kind, Krungsri will issue 1,143,221,782 additional common shares to BTMU, which would increase BTMU’s ownership in Krungsri to 76.44%. The number of shares to be issued by Krungsri in exchange for BTMU’s contribution in kind is subject to a price adjustment under the BPA such that the total shares to be issued can increase up to a maximum of 1,500,000,000 shares or decrease without a specified minimum. For more information on Krungsri, see “Item 4.B. Information on the Company—Business Overview—Acquisition of Bank of Ayudhya Shares through Voluntary Tender Offer.
Changes in Shareholdings of Mitsubishi UFJ Merrill Lynch PB Securities Co., Ltd.
We completed transactions to transfer shares of Mitsubishi UFJ Merrill Lynch PB Securities Co., Ltd. among our consolidated subsidiaries in March 2014. Upon completion of the transactions, MUMSS holds 75%, and BTMU holds the remaining 25%, of the voting rights in the company. Prior to the transactions, MUSHD held 51%, and BTMU held the remaining 49%, of the voting rights in the company. Concurrent with the completion of the transactions, the company changed its name to “Mitsubishi UFJ Morgan Stanley PB Securities Co., Ltd.”
MUB’s Acquisition of First Bank Association Bank Services
In November 2013, MUB completed the acquisition of First Bank Association Bank Services, a unit of First Bank, which provided a full range of banking services to homeowners associations and community management companies. MUB acquired approximately $570 million in deposits in this transaction.
MUTB’s Acquisition of Butterfield Fulcrum Group
In September 2013, MUTB completed the acquisition of Butterfield Fulcrum Group for ¥30.2 billion in cash and recorded goodwill of ¥20.3 billion. Post-acquisition, Butterfield Fulcrum Group changed its name to
74
Table of Contents
Mitsubishi UFJ Fund Services Holdings Limited. During the fiscal year ended March 31, 2014, we applied measurement period adjustments to the acquisition date fair values, which decreased the goodwill by ¥5.8 billion, and recorded intangible assets of ¥21.6 billion.
For more information on Mitsubishi UFJ Fund Services Holdings, see “Item 4.B. Business Overview—Integrated Trust Assets Business Group.”
Recent Regulatory Developments in the United States
In December 2012, BTMU agreed to make an approximately $8.6 million payment to the Office of Foreign Assets Control, or OFAC, of the U.S. Department of the Treasury to settle potential civil liability for apparent violations of certain U.S. sanctions regulations from 2006 to 2007. In June 2013, BTMU entered into a consent agreement with the New York State Department of Financial Services, or DFS, to resolve issues relating to certain U.S. dollar payments that were routed through New York from 2002 to 2007. Under the terms of the agreement with DFS, BTMU made a civil monetary payment of $250 million to DFS and retained an independent consultant to conduct a compliance review of the relevant controls and related matters in BTMU’s current operations. BTMU continues to cooperate closely with all relevant regulators and is undertaking necessary actions.
For a detailed description of these and other recent regulatory and legal developments, see “Item 3.D. Key Information—Risk Factors—Risks Related to Our Business—We may become subject to regulatory actions or other legal proceedings relating to our transactions or other aspects of our operations, which could result in significant financial losses, restrictions on our operations and damage to our reputation.”
MUB’s Acquisition of PB Capital Corporation’s Institutional Commercial Lending Portfolio
In June 2013, MUB acquired PB Capital Corporation’s institutional commercial real estate lending division for ¥358.0 billion in cash and recorded goodwill of ¥22.0 billion. Headquartered in New York, the institutional commercial real estate lending division of PB Capital had approximately ¥341.8 billion in loans outstanding on properties in various U.S. major metropolitan areas as of June 14, 2013. During the fiscal year ended March 31, 2014, we applied measurement period adjustments to the acquisition date fair values, which increased the goodwill by ¥1.0 billion.
Agreement to Invest in VietinBank
In May 2013, BTMU acquired approximately 20% of the ordinary shares of Vietnam Joint Stock Commercial Bank for Industry and Trade, or VietinBank. VietinBank is one of the major Vietnamese state-controlled commercial banks by asset size with the Vietnamese government owning approximately 64% of the outstanding ordinary shares as of December 31, 2013. BTMU’s acquisition of newly issued shares for approximately 15.5 trillion Vietnamese Dong (equivalent to approximately ¥75.1 billion based on the currency exchange rate of ¥0.005 to the Vietnamese Dong) resulted in BTMU becoming the second largest shareholder of VietinBank. In addition, BTMU has appointed two directors to the VietinBank board. As a result, VietinBank is accounted for under the equity method beginning in the fiscal year ended March 31, 2014.
Exposures to Selected European Countries
Several European countries, including Italy, Spain, Portugal, Ireland and Greece, have been experiencing weaknesses in their economic and fiscal situations in varying degrees of severity. We are closely monitoring our exposures in these countries.
The following table sets forth information about our aggregate exposure to selected European countries of BTMU, MUTB and MUSHD, which were the subsidiaries holding the exposure, as of March 31, 2014. The
75
Table of Contents
information in the table is categorized by counterparties, consisting of sovereign, non-sovereign financial institutions and non-sovereign non-financial institutions, and by type of financial instruments, which include loans, securities, derivatives and credit default swap, or CDS, protection (sold and bought). The securities exposure includes available-for-sale, held-to-maturity and trading securities. The information included in the table below is based on information compiled for internal risk management purposes only, and not for financial accounting purposes. The exposures are determined based on the country in which the borrower’s head office is located. However, in case of a subsidiary located in a country different from that in which its parent company is located, the country exposure is determined based on the country in which the subsidiary is located.
| As of March 31, 2014 | ||||||||||||||||||||||||||||
|
Loans
(funded & unfunded) |
Securities (1) | Derivatives (2) |
CDS
protection sold (3) |
Gross
exposure (funded & unfunded) |
CDS
protection bought (3) |
Net
exposure (4) |
||||||||||||||||||||||
| (in billions) | ||||||||||||||||||||||||||||
|
Italy |
$ | 5.6 | $ | 1.4 | $ | 1.6 | $ | 0.0 | $ | 8.6 | $ | 0.3 | $ | 8.3 | ||||||||||||||
|
Sovereign |
— | 1.3 | 0.3 | — | 1.6 | — | 1.6 | |||||||||||||||||||||
|
Financial Institutions |
0.0 | 0.1 | 0.0 | 0.0 | 0.1 | — | 0.1 | |||||||||||||||||||||
|
Others |
5.6 | 0.0 | 1.3 | 0.0 | 6.9 | 0.3 | 6.6 | |||||||||||||||||||||
|
|
|
|
|
|
|
|
|
|
|
|
|
|
|
|||||||||||||||
|
Spain |
4.3 | 0.2 | 0.0 | 0.0 | 4.5 | 0.0 | 4.5 | |||||||||||||||||||||
|
Sovereign |
— | 0.1 | — | — | 0.1 | — | 0.1 | |||||||||||||||||||||
|
Financial Institutions |
0.0 | 0.1 | — | 0.0 | 0.1 | 0.0 | 0.1 | |||||||||||||||||||||
|
Others |
4.3 | 0.0 | 0.0 | 0.0 | 4.3 | 0.0 | 4.3 | |||||||||||||||||||||
|
|
|
|
|
|
|
|
|
|
|
|
|
|
|
|||||||||||||||
|
Portugal |
0.4 | 0.0 | 0.0 | — | 0.4 | 0.2 | 0.2 | |||||||||||||||||||||
|
Sovereign |
— | 0.0 | — | — | 0.0 | — | 0.0 | |||||||||||||||||||||
|
Financial Institutions |
— | 0.0 | — | — | 0.0 | — | 0.0 | |||||||||||||||||||||
|
Others |
0.4 | 0.0 | 0.0 | — | 0.4 | 0.2 | 0.2 | |||||||||||||||||||||
|
|
|
|
|
|
|
|
|
|
|
|
|
|
|
|||||||||||||||
|
Ireland |
0.2 | 0.0 | 0.0 | — | 0.2 | — | 0.2 | |||||||||||||||||||||
|
Sovereign |
— | — | — | — | — | — | — | |||||||||||||||||||||
|
Financial Institutions |
— | 0.0 | 0.0 | — | 0.0 | — | 0.0 | |||||||||||||||||||||
|
Others |
0.2 | 0.0 | 0.0 | — | 0.2 | — | 0.2 | |||||||||||||||||||||
|
|
|
|
|
|
|
|
|
|
|
|
|
|
|
|||||||||||||||
|
Greece |
0.0 | — | — | — | 0.0 | — | 0.0 | |||||||||||||||||||||
|
Sovereign |
— | — | — | — | — | — | — | |||||||||||||||||||||
|
Financial Institutions |
— | — | — | — | — | — | — | |||||||||||||||||||||
|
Others |
0.0 | — | — | — | 0.0 | — | 0.0 | |||||||||||||||||||||
|
|
|
|
|
|
|
|
|
|
|
|
|
|
|
|||||||||||||||
|
Total |
$ | 10.5 | $ | 1.6 | $ | 1.6 | $ | 0.0 | $ | 13.7 | $ | 0.5 | $ | 13.2 | ||||||||||||||
|
Sovereign |
— | 1.4 | 0.3 | — | 1.7 | — | 1.7 | |||||||||||||||||||||
|
Financial Institutions |
0.0 | 0.2 | 0.0 | 0.0 | 0.2 | 0.0 | 0.2 | |||||||||||||||||||||
|
Others |
10.5 | 0.0 | 1.3 | 0.0 | 11.8 | 0.5 | 11.3 | |||||||||||||||||||||
|
|
|
|
|
|
|
|
|
|
|
|
|
|
|
|||||||||||||||
| Notes: |
| (1) | Securities include securities being held to maturity, securities available for sale, and trading securities. Securities being held to maturity are shown at amortized cost, and securities available for sale and trading securities are shown at fair value. |
| (2) | Derivatives amounts represent current exposures, taking into consideration legally enforceable master netting agreements. |
| (3) | CDS protection amounts represent notional amounts. |
| (4) | Net exposure represents gross exposure (funded & unfunded), net of CDS protection bought. |
| (5) | To the extent financial instruments are originally denominated in currencies other than U.S. dollars, the exposure amounts have been translated into U.S. dollars at an internal exchange rate used for our internal risk management purposes as of March 31, 2014. |
76
Table of Contents
Based on information collected for internal risk management purposes as of March 31, 2014, the consolidated exposure of BTMU, MUTB and MUSHD listed above to Italy, Spain, Portugal, Ireland and Greece represented less than 1% of our total assets.
As of March 31, 2014, other than BTMU, MUFG group companies had limited exposures to those European countries, except such other group companies’ exposures to sovereign bonds issued by those countries as discussed below. As of the same date, BTMU held no sovereign bonds issued by those European countries.
As of March 31, 2014, we had a total balance of $1.7 billion of sovereign bonds of the European peripheral countries identified in the table above on a consolidated basis. Among these countries, we had no Irish or Greek government bonds as of March 31, 2014. All of our Italian and Spanish government bonds were held in our trading accounts as of March 31, 2014.
As of March 31, 2014, excluding sovereign bonds, we had a total of $11.5 billion of exposures relating to the European peripheral countries identified in the table above. These exposures mainly consisted of commercial loan exposures to corporations and structured finance transactions. Our exposures to Italy and Spain mainly related to the infrastructure sector, such as electricity, gas and telecommunications. Our loan-related exposures to financial institutions in those countries were limited and not material.
In addition to these exposures, we also have indirect exposures. Examples of indirect exposures include country risk exposures related to the collateral received on secured financing transactions. These indirect exposures are managed in the normal course of business through our credit, market and operational risk management framework.
Our consolidated financial statements included elsewhere in this Annual Report are prepared in accordance with U.S. GAAP. Many of the accounting policies require management to make difficult, complex or subjective judgments regarding the valuation of assets and liabilities. The accounting policies are fundamental to understanding our operating and financial review and prospects. The notes to our consolidated financial statements included elsewhere in this Annual Report provide a summary of our significant accounting policies. The following is a summary of the critical accounting estimates:
Allowance for Credit Losses
The allowance for credit losses represents management’s best estimate of probable losses in our loan portfolio. The evaluation process, including credit-ratings and self-assessments, involves a number of estimates and judgments. The allowance is based on two principles of accounting guidance: (1) the guidance on contingencies requires that losses be accrued when they are probable of occurring and can be estimated, and (2) the guidance on accounting by creditors for impairment of a loan requires that losses be accrued based on the difference between the loan balance, on the one hand, and the present value of expected future cash flows discounted at the loan’s original effective interest rate, the fair value of collateral or the loan’s observable market value, on the other hand.
We divide our loan portfolio into the following segments—Commercial, Residential, Card, MUAH and Krungsri based on the segments used to determine the allowance for credit losses. We further divide the Commercial segment into classes based on initial measurement attributes, risk characteristics, and our approach to monitoring and assessing credit risk. We determine the appropriate level of the allowance for credit losses for each of our loan portfolios by evaluating various factors and assumptions, such as the borrower’s credit rating, collateral value, historical loss experience, and probability of insolvency based on the number of actual delinquencies as well as existing economic conditions. We update these factors and assumptions on a regular basis and upon the occurrence of unexpected changes in the economic environment.
77
Table of Contents
For the Commercial, MUAH and Krungsri segments, our allowance for credit losses primarily consists of allocated allowances. The allocated allowance comprises (1) an allowance for individual loans specifically identified for evaluation, (2) an allowance for large groups of smaller-balance homogeneous loans, and (3) a formula allowance. The allocated allowance within the Commercial segment also includes an allowance for country risk exposure. The allowance for country risk exposure within the Commercial segment covers transfer risk which is not specifically covered by other types of allowance. Both the allowance for country risk exposure and the formula allowance are provided for performing loans that are not subject to either the allowance for individual loans specifically identified for evaluation or the allowance for large groups of smaller-balance homogeneous loans.
The allowance for credit losses within the MUAH segment also includes an unallocated allowance which captures losses that are attributable to economic events in various industry or geographic sectors whose impact on our loan portfolio in this segment have occurred but have yet to be recognized in the allocated allowance.
For the Residential and Card segments, the loans are smaller-balance homogeneous loans that are pooled by the risk ratings based on the number of delinquencies. We principally determine the allowance for credit losses based on the probability of insolvency, the number of actual delinquencies and historical loss experience.
For all portfolio segments, key elements relating to the policies and discipline used in determining the allowance for credit losses are our credit classification and the related borrower categorization process. Each of these components is determined based on estimates subject to change when actual events occur. The categorization is based on conditions that may affect the ability of borrowers to service their debt, taking into consideration current financial information, historical payment experience, credit documentation, public information, analyses of relevant industry segments and current trends. In determining the appropriate level of allowance, we evaluate the probable loss by category of loan based on its type and characteristics.
In addition to the allowance for credit losses on our loan portfolio, we maintain an allowance for credit losses on off-balance sheet credit instruments, including commitments to extend credit, a variety of guarantees and standby letters of credit and other financial instruments. This allowance is included in other liabilities.
Determining the adequacy of the allowance for credit losses requires the exercise of considerable judgment and the use of estimates, such as those discussed above. Our actual losses could be more or less than the estimates. To the extent that actual losses differ from management’s estimates, additional provisions for credit losses may be required that would adversely impact our operating results and financial condition in future periods. For further information regarding our methodologies used in establishing the allowance for credit losses by portfolio segments and allowance for credit losses policies, see Note 1 to our consolidated financial statements included elsewhere in this Annual Report and “—B. Liquidity and Capital Resources—Financial Condition—Loan Portfolio.”
For more information on our credit and borrower ratings, see “Item 11. Quantitative and Qualitative Disclosures about Credit, Market and Other Risk—Credit Risk Management.”
Impairment of Investment Securities
U.S. GAAP requires the recognition in earnings of an impairment loss on investment securities for a decline in fair value that is other than temporary. Determination of whether a decline is other than temporary often involves estimating the outcome of future events. Management judgment is required in determining whether factors exist that indicate that an impairment loss has been incurred at the balance sheet date. These judgments are based on subjective as well as objective factors. We conduct a review semi-annually to identify and evaluate investment securities that have indications of possible impairment. The assessment of other-than-temporary impairment requires judgment and therefore can have an impact on the results of operations. Impairment is evaluated considering various factors, and their significance varies from case to case.
78
Table of Contents
Debt and marketable equity securities. In determining whether a decline in fair value below cost is other than temporary for a particular equity security, we generally consider factors such as the ability and positive intent to hold the investments for a period of time sufficient to allow for any anticipated recovery in fair value. In addition, an other-than-temporary impairment is recognized in earnings for marketable equity securities when one of the following criteria is met:
| Ÿ |
the fair value of investments is 20% or more below cost as of the end of the reporting period, |
| Ÿ |
due to the financial condition and near-term prospects of the issuer, the issuer is categorized as “Likely to become Bankrupt,” “Virtually Bankrupt” or “Bankrupt or de facto Bankrupt” status under the Japanese banking regulations, |
| Ÿ |
the fair value of the investment has been below cost for six months or longer, or |
| Ÿ |
the fair value of the securities is below cost and a decision has been made to sell the securities. |
For debt securities, an other-than-temporary impairment is recognized in earnings if we have an intent to sell a debt security or if it is more likely than not we will be required to sell the debt security before recovery of its amortized cost basis. When we do not intend to sell a debt security and if it is more likely than not that we will not be required to sell the debt security before recovery of its amortized cost basis, the credit component of an other-than-temporary impairment of the debt security is recognized in earnings, but the noncredit component is recognized in accumulated other comprehensive income.
Certain securities held by BTMU, MUTB and certain other subsidiaries, which primarily consist of debt securities issued by the Japanese national government and generally considered to be of minimal credit risk, are determined not to be impaired as the respective subsidiaries do not have an intention to sell the securities, or those subsidiaries are not more likely than not required to sell before recovery of their amortized cost basis.
The determination of other-than-temporary impairment for certain debt securities held by MUAH, which primarily consist of residential mortgage-backed securities and certain asset-backed securities, is made on the basis of a cash flow analysis and monitoring of performance of such securities, as well as whether MUAH intends to sell, or is more likely than not required to sell, the securities before recovery of their amortized cost basis.
Nonmarketable equity securities. Nonmarketable equity securities include unlisted preferred securities mainly issued by public companies as well as equity securities of companies that are not publicly traded or are thinly traded. The securities consist of cost-method investments, which are primarily carried at cost because their fair values are not readily determinable. For nonmarketable equity securities issued by public companies, such as preferred stock convertible to marketable common stock in the future, we estimate fair value using commonly accepted valuation models, such as option pricing models based on a number of factors, including the quoted market price of the underlying marketable common stock, volatility and dividend repayments as appropriate, to determine if the investment is impaired in each reporting period. If the fair value of the investment is less than the cost of the investment, we proceed to evaluate whether the impairment is other than temporary. When the decline is other than temporary, those nonmarketable equity securities issued by public companies are written down to fair value estimated by commonly accepted valuation models.
With respect to the other nonmarketable equity securities, we perform a test to determine whether any impairment indicator exists with respect to each cost-method investment in each reporting period. The primary method we use to identify impairment indicators is a comparison of our share in an investee’s net assets to the carrying amount of our investment in the investee. We also consider whether significant adverse changes in the regulatory, economic or technological environment have occurred with respect to the investee. We periodically monitor the status of each investee including the credit ratings, which are generally updated once a year based on the annual financial statements of issuers. In addition, if an event that could impact the credit rating of an issuer occurs, we reassess the appropriateness of the credit rating assigned to the issuer in order to maintain an updated
79
Table of Contents
credit rating. If an impairment indicator exists, we estimate the fair value of the cost-method investment. If the fair value of the investment is less than the cost of the investment, we proceed to conduct the other-than-temporary impairment evaluation. When we determine that the decline is other than temporary, such remaining nonmarketable equity securities are written down to the estimated fair value, determined based on such factors as the ratio of our investment in the issuer to the issuer’s net assets and the latest transaction price, if applicable.
Equity method investees. We determine whether loss on investments is other than temporary, through consideration of various factors, such as the length of time and the extent to which the fair value has been less than cost, the financial condition and near-term prospects of the investees, and the intent and ability to retain its investment in the investees for a period of time sufficient to allow for any anticipated recovery in the fair value. We also evaluate additional factors, such as the condition and trend of the economic cycle, and trends in the general market.
Our assessment of potential impairment involves risks and uncertainties depending on market conditions that are global or regional in nature and the condition of specific issuers or industries, as well as management’s subjective assessment of the estimated future performance of investments. If we later conclude that a decline is other than temporary, the impairment loss may significantly affect our operating results and financial condition in future periods.
For further information on the amount of the impairment losses and the aggregate amount of unrealized gross losses on investment securities, see Note 3 to our consolidated financial statements included elsewhere in this Annual Report.
Allowance for Repayment of Excess Interest
We maintain an allowance for repayment of excess interest based on our estimate of the potential liability exposure. Our estimate of the potential liability exposure represents the estimated amount of claims for repayment of excess interest to be received in the future. We expect that any such claim will be made on the basis of a 2006 ruling of the Japanese Supreme Court, or the Ruling. Under the Ruling, lenders are generally required to reimburse borrowers for interest payments made in excess of the limits stipulated by the Interest Rate Restriction Act upon receiving claims for reimbursement, despite the then-effective provisions of the Law Concerning Lending Business that exempted a lender from this requirement if the lender provided required notices to the borrower and met other specified requirements, and the borrower voluntarily made the interest payment.
While we have not entered into any consumer loan agreement after April 2007 that imposes an interest rate exceeding the limits stipulated by the Interest Rate Restriction Act, we need to estimate the number of possible claims for reimbursement of excess interest payments. To determine the allowance for repayment of excess interest, we analyze the historical number of repayment claims we have received, the amount of such claims, borrowers’ profiles, the actual amount of reimbursements we have made, management’s future forecasts, and other events that are expected to possibly affect the repayment claim trends in order to arrive at our best estimate of the potential liability. We believe that the provision for repayment of excess interest is adequate and the allowance is at the appropriate amount to absorb probable losses, so that the impact of future claims for reimbursement of excess interest will not have a material adverse effect on our financial position and results of operations. The allowance is recorded as a liability in Other liabilities.
For further information, see Note 26 to our consolidated financial statements included elsewhere in this Annual Report and “Item 3.D. Key Information—Risk Factors—Risks Related to Our Business—Because of our loans to consumers and our shareholdings in companies engaged in consumer lending, changes in the business or regulatory environment for consumer finance companies in Japan may further adversely affect our financial results.”
80
Table of Contents
Income Taxes
Valuation of deferred tax assets . A valuation allowance for deferred tax assets is recognized if, based on the weight of available evidence, it is more likely than not that some portion or all of the deferred tax assets will not be realized. All available evidence, both positive and negative, is considered to determine whether, based on the weight of that evidence, a valuation allowance is needed. Future realization of the tax benefit of existing deductible temporary differences or carryforwards ultimately depends on the existence of sufficient taxable income and the applicable income tax rates in future periods.
In determining a valuation allowance, we perform a review of future reversals of existing taxable temporary differences, and future taxable income exclusive of reversing temporary differences. Future taxable income is developed from forecasted operating results, based on recent historical trends and approved business plans, the eligible carryforward periods and other relevant factors. For certain subsidiaries where strong negative evidence exists, such as the existence of significant amounts of operating loss carryforwards, cumulative losses and the expiration of unused operating loss carryforwards in recent years, a valuation allowance is recognized against the deferred tax assets to the extent that it is more likely than not that they will not be realized.
Forecasted operating results, which serve as the basis of our estimation of future taxable income, have a significant effect on the amount of the valuation allowance. In developing forecasted operating results, we assume that our operating performance is stable for certain entities where strong positive evidence exists, including core earnings based on past performance over a certain period of time. The actual results may be adversely affected by unexpected or sudden changes in interest rates as well as an increase in credit-related expenses due to the deterioration of economic conditions in Japan and material declines in the Japanese stock market to the extent that such impacts exceed our original forecast. In addition, near-term taxable income and assumptions on future income tax rates are also influential on the amount of the expiration of unused operating loss carryforwards since the Japanese corporate tax law permits operating losses to be deducted for a predetermined period generally no longer than seven years for losses generated prior to April 1, 2008 and nine years for losses generated in fiscal years ending after April 1, 2008. For further information on the amount of operating loss carryforwards and the expiration dates, see Note 7 to our consolidated financial statements included elsewhere in this Annual Report.
Because the establishment of the valuation allowance is an inherently uncertain process involving estimates as discussed above, the currently established valuation allowance may not be sufficient. If the estimated valuation allowance is not sufficient, we will incur additional deferred tax expenses, which could materially affect our operating results and financial condition in future periods.
Recognition and Measurement of Uncertain Tax Positions . We provide reserves for unrecognized tax benefits as required under the guidance on accounting for uncertainty in income taxes. In applying the guidance, we consider the relative risks and merits of positions taken in tax returns filed and to be filed, considering statutory, judicial, and regulatory guidance applicable to those positions. The guidance requires us to make assumptions and judgments about potential outcomes that lie outside of management’s control. To the extent that the tax authorities disagree with our conclusions, and depending on the final resolution of those disagreements, our effective tax rate may be materially affected in the period of final settlement with tax authorities.
Accounting for Goodwill and Intangible Assets
Accounting for Goodwill . U.S. GAAP requires us to test goodwill for impairment at least annually, or more frequently if events or changes in circumstances indicate that goodwill may be impaired, using a two-step process that begins with an estimation of the fair value of a reporting unit of our business, which is to be compared with the carrying amount of the unit, to identify potential impairment of goodwill. A reporting unit is an operating segment or component of an operating segment that constitutes a business for which discrete financial information is available and is regularly reviewed by management. The fair value of a reporting unit is
81
Table of Contents
defined as the amount at which the unit as a whole could be bought or sold in a current transaction between willing parties. For a reporting unit for which an observable quoted price is not available, the fair value is determined using an income approach. In the income approach, the present value of expected future cash flows is calculated by taking the net present value based on each reporting unit’s internal forecasts. A control premium factor is also considered in relation to market capitalization.
If the carrying amount of a reporting unit exceeds its estimated fair value, the second step of the goodwill impairment test is performed to measure the amount of impairment loss recorded in our consolidated statements of income. This test requires comparison of the implied fair value of the unit’s goodwill with the carrying amount of that goodwill. The estimate of the implied fair value of the reporting unit’s goodwill requires us to allocate the fair value of a reporting unit to all of the assets and liabilities of that reporting unit, including unrecognized intangible assets, if any, since the implied fair value is determined as the excess of the fair value of a reporting unit over the net amounts assigned to its assets and liabilities in the allocation. Accordingly, the second step of the impairment test also requires an estimate of the fair value of individual assets and liabilities, including any unrecognized intangible assets that belong to that unit. A change in the estimation could have an impact on impairment recognition since it is driven by hypothetical assumptions, such as customer behavior and interest rate forecasts. The estimation is based on information available to management at the time the estimation is made.
Accounting for Intangible Assets . Intangible assets are amortized over their estimated useful lives unless they have indefinite useful lives. Amortization for intangible assets is computed in a manner that best reflects the economic benefits of the intangible assets. Intangible assets having indefinite useful lives are subject to annual impairment tests. An impairment exists if the carrying value of an indefinite lived asset exceeds its fair value. For other intangible assets subject to amortization, an impairment is recognized if the carrying amount exceeds the fair value of the intangible asset. Each reporting period, we evaluate the remaining useful life of an intangible asset to determine whether events and circumstances warrant a revision to the remaining useful life. When the useful life of intangible assets that were previously not subject to amortization is determined to no longer be indefinite, for example, when unanticipated competition enters the market, the intangible asset becomes subject to amortization over the remaining period that it is expected to contribute to positive cash flows.
Accrued Severance Indemnities and Pension Liabilities
We have defined retirement benefit plans, including lump-sum severance indemnities and pension plans, which cover substantially all of our employees. Severance indemnities and pension costs are calculated based upon a number of actuarial assumptions, including discount rates, expected long-term rates of return on our plan assets and rates of increase in future compensation levels. In accordance with U.S. GAAP, actual results that differ from the assumptions are accumulated and amortized over future periods, and affect our recognized net periodic pension costs and accrued severance indemnities and pension obligations in future periods. Differences in actual experience or changes in assumptions may affect our financial condition and operating results in future periods.
The discount rates for the domestic plans are set to reflect the interest rates of high-quality fixed-rate instruments with maturities that correspond to the timing of future benefit payments.
In developing our assumptions for expected long-term rates of return, we refer to the historical average returns earned by the plan assets and the rates of return expected to be available for reinvestment of existing plan assets, which reflect recent changes in trends and economic conditions, including market prices. We also evaluate input from our actuaries, as well as their reviews of asset class return expectations.
Valuation of Financial Instruments
We measure certain financial assets and liabilities at fair value. The majority of such assets and liabilities are measured at fair value on a recurring basis, including trading securities, trading derivatives and investment
82
Table of Contents
securities. In addition, certain other assets and liabilities are measured at fair value on a non-recurring basis, including held for sale loans which are carried at the lower of cost or fair value, collateral dependent loans and nonmarketable equity securities subject to impairment.
We have elected the fair value option for certain foreign securities classified as available for sale, whose unrealized gains and losses are reported in income.
The guidance on the measurement of fair value defines fair value as the price that would be received to sell an asset or paid to transfer a liability in an orderly transaction between market participants at the measurement date. We have an established and documented process for determining fair value in accordance with the guidance. To determine fair value, we use quoted prices which include those provided from pricing vendors, where available. We generally obtain one price or quote per instrument and do not adjust it to determine fair value of the instrument. Certain asset-backed securities are valued based on non-binding quotes provided by independent broker-dealers where no or few observable inputs are available to measure fair value. We do not adjust such broker-dealer quotes to the extent that there is no evidence that would indicate that the quotes are not indicative of the fair values of the securities. We perform internal price verification procedures to ensure that the quotes provided from the independent broker-dealers are reasonable. Such verification procedures include analytical review of periodic price changes, comparison analysis between periodic price changes and changes of indices such as a credit default swap index, or inquiries regarding the underlying inputs and assumptions used by the broker-dealers such as probability of default, prepayment rate and discount margin. These verification procedures are periodically performed by independent risk management departments. For collateralized loan obligations, or CLOs, backed by general corporate loans, the fair value is determined by weighting the internal model valuation and the non-binding broker-dealer quotes. If quoted prices are not available to determine fair value of derivatives, the fair value is based upon valuation techniques that use, where possible, current market-based or independently sourced parameters, such as interest rates, yield curves, foreign exchange rates, volatilities and credit curves. The fair values of trading liabilities are determined by discounting future cash flows at a rate which incorporates our own creditworthiness. In addition, valuation adjustments may be made to ensure that the financial instruments are recorded at fair value. These adjustments include, but are not limited to, amounts that reflect counterparty credit quality, liquidity risk, and model risk. Our financial models are validated and periodically reviewed by risk management departments independent of divisions that created the models.
For a further discussion of the valuation techniques applied to the material assets or liabilities, see Note 31 to our consolidated financial statements included elsewhere in this Annual Report.
Accounting Changes and Recently Issued Accounting Pronouncements
See “Accounting Changes” and “Recently Issued Accounting Pronouncements” in Note 1 to our consolidated financial statements included elsewhere in this Annual Report.
83
Table of Contents
| A. | Operating Results |
The following table sets forth a summary of our results of operations for the fiscal years ended March 31, 2012, 2013 and 2014:
| Fiscal years ended March 31, | ||||||||||||
| 2012 | 2013 | 2014 | ||||||||||
| (in billions) | ||||||||||||
|
Interest income (1) |
¥ | 2,595.9 | ¥ | 2,427.5 | ¥ | 2,522.3 | ||||||
|
Interest expense |
640.1 | 556.4 | 561.0 | |||||||||
|
|
|
|
|
|
|
|||||||
|
Net interest income |
1,955.8 | 1,871.1 | 1,961.3 | |||||||||
|
|
|
|
|
|
|
|||||||
|
Provision (credit) for credit losses |
223.8 | 144.5 | (106.4 | ) | ||||||||
|
Non-interest income (2) |
1,440.6 | 2,068.0 | 1,821.0 | |||||||||
|
Non-interest expense |
2,322.7 | 2,378.7 | 2,468.3 | |||||||||
|
|
|
|
|
|
|
|||||||
|
Income before income tax expense |
849.9 | 1,415.9 | 1,420.4 | |||||||||
|
Income tax expense |
429.2 | 296.0 | 337.9 | |||||||||
|
|
|
|
|
|
|
|||||||
|
Net income before attribution of noncontrolling interests |
¥ | 420.7 | ¥ | 1,119.9 | ¥ | 1,082.5 | ||||||
|
Net income attributable to noncontrolling interests |
4.5 | 50.8 | 67.1 | |||||||||
|
|
|
|
|
|
|
|||||||
|
Net income attributable to Mitsubishi UFJ Financial Group |
¥ | 416.2 | ¥ | 1,069.1 | ¥ | 1,015.4 | ||||||
|
|
|
|
|
|
|
|||||||
| Notes: |
| (1) | Interest income for the fiscal year ended March 31, 2012 includes a gain of ¥139.3 billion on the conversion rate adjustment of Morgan Stanley’s convertible preferred stock. For more information, see Note 2 to our consolidated financial statements included elsewhere in this Annual Report. |
| (2) | Non-interest income for the fiscal year ended March 31, 2012 reflects an impairment loss of ¥579.5 billion on our investment in Morgan Stanley’s common stock resulting from a decline in the quoted price of Morgan Stanley’s common stock that we determined to be other than temporary in light of the increasingly stringent regulatory environment and the existing adverse economic events in Europe. For more information, see Note 2 to our consolidated financial statements included elsewhere in this Annual Report. |
We reported net income attributable to Mitsubishi UFJ Financial Group of ¥1,015.4 billion for the fiscal year ended March 31, 2014, a decrease of ¥53.7 billion from ¥1,069.1 billion for the fiscal year ended March 31, 2013. Domestic net income attributable to Mitsubishi UFJ Financial Group was ¥859.8 billion, and foreign net income attributable to Mitsubishi UFJ Financial Group was ¥155.6 billion, for the fiscal year ended March 31, 2014. Asia and Oceania excluding Japan, Europe, and other areas including Canada, Latin America, the Caribbean and the Middle East contributed ¥149.4 billion, ¥6.5 billion and ¥131.2 billion, respectively, to the foreign net income which were partly offset by net loss of ¥131.5 billion in the United States. Our diluted earnings per common share (earnings applicable to common shareholders of Mitsubishi UFJ Financial Group) for the fiscal year ended March 31, 2014 was ¥69.98, a decrease of ¥4.18 from ¥74.16 for the fiscal year ended March 31, 2013. Income before income tax expense for the fiscal year ended March 31, 2014 was ¥1,420.4 billion, an increase of ¥4.5 billion from ¥1,415.9 billion for the fiscal year ended March 31, 2013.
84
Table of Contents
Net Interest Income
The following table is a summary of the interest rate spread for the fiscal years ended March 31, 2012, 2013 and 2014:
| Fiscal years ended March 31, | ||||||||||||||||||||||||
| 2012 | 2013 | 2014 | ||||||||||||||||||||||
|
Average
balance |
Average
rate |
Average
balance |
Average
rate |
Average
balance |
Average
rate |
|||||||||||||||||||
| (in billions, except percentages) | ||||||||||||||||||||||||
|
Interest-earning assets: |
||||||||||||||||||||||||
|
Domestic |
¥ | 130,856.7 | 1.07 | % | ¥ | 134,759.6 | 0.95 | % | ¥ | 135,087.3 | 0.87 | % | ||||||||||||
|
Foreign (1) |
53,322.4 | 2.24 | 59,064.7 | 1.95 | 77,089.0 | 1.75 | ||||||||||||||||||
|
|
|
|
|
|
|
|||||||||||||||||||
|
Total |
¥ | 184,179.1 | 1.41 | % | ¥ | 193,824.3 | 1.25 | % | ¥ | 212,176.3 | 1.19 | % | ||||||||||||
|
|
|
|
|
|
|
|||||||||||||||||||
|
Financed by: |
||||||||||||||||||||||||
|
Interest-bearing liabilities: |
||||||||||||||||||||||||
|
Domestic |
¥ | 130,916.6 | 0.26 | % | ¥ | 135,974.9 | 0.21 | % | ¥ | 141,878.0 | 0.18 | % | ||||||||||||
|
Foreign |
34,504.0 | 0.88 | 37,424.6 | 0.73 | 47,535.3 | 0.64 | ||||||||||||||||||
|
|
|
|
|
|
|
|||||||||||||||||||
|
Total |
165,420.6 | 0.39 | 173,399.5 | 0.32 | 189,413.3 | 0.30 | ||||||||||||||||||
|
Non-interest-bearing liabilities |
18,758.5 | — | 20,424.8 | — | 22,763.0 | — | ||||||||||||||||||
|
|
|
|
|
|
|
|||||||||||||||||||
|
Total |
¥ | 184,179.1 | 0.35 | % | ¥ | 193,824.3 | 0.29 | % | ¥ | 212,176.3 | 0.26 | % | ||||||||||||
|
|
|
|
|
|
|
|||||||||||||||||||
|
Interest rate spread |
1.02 | % | 0.93 | % | 0.89 | % | ||||||||||||||||||
|
Net interest income as a percentage of total interest-earning assets |
1.06 | % | 0.97 | % | 0.92 | % | ||||||||||||||||||
| Note: |
| (1) | Interest income on foreign activities for the fiscal year ended March 31, 2012 includes a gain of ¥139.3 billion on the conversion rate adjustment of Morgan Stanley’s convertible preferred stock. For more information, see Note 2 to our consolidated financial statements included elsewhere in this Annual Report. |
We use interest rate and other derivative contracts to manage the risks affecting the values of our financial assets and liabilities. Although these contracts are generally entered into for risk management purposes, a majority of them do not meet the specific conditions to qualify for hedge accounting under U.S. GAAP and thus are accounted for as trading assets or liabilities. Any gains or losses resulting from such derivative instruments are recorded as part of Trading account profits—net. Therefore, our net interest income for each of the fiscal years ended March 31, 2012, 2013 and 2014 was not materially affected by gains or losses resulting from such derivative instruments. For a detailed discussion of our risk management activities, see “—A. Operating Results—Results of Operations—Non-Interest Income” and “Item 11. Quantitative and Qualitative Disclosures about Credit, Market and Other Risk.”
Fiscal Year Ended March 31, 2014 Compared to Fiscal Year Ended March 31, 2013
Net interest income for the fiscal year ended March 31, 2014 was ¥1,961.3 billion, an increase of ¥90.2 billion from ¥1,871.1 billion for the fiscal year ended March 31, 2013.
Interest income increased ¥94.8 billion to ¥2,522.3 billion for the fiscal year ended March 31, 2014 from ¥2,427.5 billion for the previous fiscal year. Of the ¥94.8 billion of increase in interest income, ¥85.9 billion was attributable to interest income from loans, including fees, especially from foreign branches and subsidiaries reflecting a higher volume of loans, while interest income from the domestic loan business decreased due to downward pressure on interest rates. Interest income from deposits in other banks increased ¥19.8 billion mainly due to a higher balance of deposits in central banks including the Bank of Japan and the FRB, and interest income from trading account assets increased ¥12.6 billion due to a higher volume of foreign currency denominated bonds which were held by our banking subsidiaries and which were accounted for as trading securities. These increases were partially offset by a decrease of ¥28.5 billion in interest income from investment securities due to lower interest rates and a decrease in the balance of debt securities held as investment securities.
85
Table of Contents
Interest expense also increased ¥4.6 billion to ¥561.0 billion for the fiscal year ended March 31, 2014 from ¥556.4 billion for the previous fiscal year. For the fiscal year ended March 31, 2014, compared to the previous fiscal year, interest expense on activities in Japan decreased ¥29.0 billion and interest expense on foreign activities increased ¥33.5 billion. The decrease in interest expense on domestic activities was mainly due to decreases in expenses on interest-bearing deposits and long-term debt, reflecting downward pressure on interest rates in Japan despite an increase in the balance of these liabilities. The increase in interest expense on foreign activities was mainly due to a higher volume of deposits in our banking subsidiaries, an increase in long-term debt, reflecting an increase in the balance of borrowings with longer maturities, and higher long-term interest rates, which were partially offset by a decrease in interest expense on payables under repurchase agreements and securities lending transactions mainly due to lower short-term interest rates, such as Euro Overnight Index Average, or EONIA, rates used for repurchase transactions.
The average interest rate spread (the average interest rate for interest-earning assets minus the average interest rate for interest-bearing liabilities) decreased 0.04 percentage points to 0.89% for the fiscal year ended March 31, 2014 from 0.93% for the previous fiscal year. For the fiscal year ended March 31, 2014, compared to the previous fiscal year, the average interest rate on interest-earning assets decreased 0.06 percentage points to 1.19% from 1.25%, while the average interest rate on interest-bearing liabilities decreased 0.02 percentage points to 0.30% from 0.32%, which resulted in the overall decrease in the average interest rate spread. The average interest rate spread on domestic activities decreased 0.05 percentage points to 0.69% from 0.74%, and the average interest rate spread on foreign activities decreased 0.11 percentage points to 1.11% from 1.22%. The lower interest rates and intensified competitive environment caused the interest rates on both domestic and foreign activities in both assets and liabilities to decline. As the interest rates on domestic interest-bearing liabilities remained at near-zero level, the decreases in the interest rates on domestic interest-earning assets exceeded the decreases in the interest rates on domestic interest-bearing liabilities.
In Japan, the Bank of Japan sought to keep short-term interest rates low by maintaining its “quantitative and qualitative monetary easing” policy throughout the reporting period. As a result, the average interest rate on domestic interest-earning assets continued to decline, while the average interest rate on domestic interest-bearing liabilities reached and remained at historically low levels. If the Bank of Japan continues to maintain its current policy on its short-term policy interest rate as well as other monetary easing policies, our interest rate spread on domestic activities will likely continue to be under severe pressure. Moreover, monetary easing policies adopted in foreign markets in the Americas, Europe, Asia and other regions have negatively affected our interest rate spread on foreign activities in recent periods. In addition, our interest rate spread may be affected by changes in long-term interest rates, which, for example, have been fluctuating to an increasing degree in Japan in recent periods due to wider fluctuations in long-term Japanese government bond prices. For further information on the Bank of Japan’s monetary policy and recent interest rate fluctuations in Japan, see “Business Environment — Economic Environment in Japan.”
Average interest-earning assets for the fiscal year ended March 31, 2014 were ¥212,176.3 billion, an increase of ¥18,352.0 billion from ¥193,824.3 billion for the fiscal year ended March 31, 2013. Average domestic interest-earning assets for the fiscal year ended March 31, 2014 were ¥135,087.3 billion, an increase of ¥327.7 billion from ¥134,759.6 billion for the previous fiscal year, mainly due to increases in interest-earning deposits in other banks, particularly the Bank of Japan, and loans mainly to the national government of Japan. Average foreign interest-earning assets for the fiscal year ended March 31, 2014 were ¥77,089.0 billion, an increase of ¥18,024.3 billion from ¥59,064.7 billion for the previous fiscal year, mainly due to increases in loans and trading account assets. The increase in foreign loans was mainly due to an increase in loans at the overseas branches of BTMU, especially the New York branch, and MUB through the acquisition of a local bank. The increase in foreign trading account assets was primarily due to an increase in the value of foreign debt securities translated into Japanese yen resulting from the depreciation of the Japanese yen against other major currencies as of March 31, 2014 compared to March 31, 2013.
86
Table of Contents
Average interest-bearing liabilities for the fiscal year ended March 31, 2014 were ¥189,413.3 billion, an increase of ¥16,013.8 billion from ¥173,399.5 billion for the fiscal year ended March 31, 2013. Average domestic interest-bearing liabilities for the fiscal year ended March 31, 2014 were ¥141,878.0 billion, an increase of ¥5,903.1 billion from ¥135,974.9 billion for the previous fiscal year, mainly due to increases in deposits, and call money, funds purchased, and payables under repurchase agreements and securities lending transactions. The increase in deposits was mainly due to increases in the ordinary deposits in our commercial and trust banking subsidiaries, while the increase in call money, funds purchased and payables under repurchase agreements and securities lending transactions was mainly due to increases in payables under repurchase agreements in our commercial and trust banking subsidiaries, as well as increases in payables under securities lending transactions in our trust banking subsidiaries. Average foreign interest-bearing liabilities for the fiscal year ended March 31, 2014 were ¥47,535.3 billion, an increase of ¥10,110.7 billion from ¥37,424.6 billion for the previous fiscal year, mainly due to increases in deposits in foreign branches of BTMU and MUB, as well as increases in call money, funds purchased, and payables under repurchase agreements and securities lending transactions reflecting higher payables under securities lending transactions in foreign branches and subsidiaries of our securities subsidiaries.
Fiscal Year Ended March 31, 2013 Compared to Fiscal Year Ended March 31, 2012
Net interest income for the fiscal year ended March 31, 2013 was ¥1,871.1 billion, a decrease of ¥84.7 billion from ¥1,955.8 billion for the fiscal year ended March 31, 2012. The higher interest income for the fiscal year ended March 31, 2012 reflected the one-time gain of ¥139.3 billion on the conversion rate adjustment of convertible preferred stock of Morgan Stanley. Exclusive of the one-time gain, net interest income for the fiscal year ended March 31, 2013 was ¥1,871.1 billion, an increase of ¥54.6 billion compared to the previous fiscal year, primarily due to a decrease in interest expense on deposits, short-term borrowings, and long-term debt reflecting the lower interest rate environment in the fiscal year ended March 31, 2013, and redemption of some of our subordinated bonds.
Interest income decreased ¥168.4 billion to ¥2,427.5 billion for the fiscal year ended March 31, 2013 from ¥2,595.9 billion for the previous fiscal year. For the fiscal year ended March 31, 2013, compared to the previous fiscal year, interest income on activities in Japan decreased ¥124.7 billion and interest income on foreign activities decreased ¥43.8 billion. The decrease in interest income on activities in Japan was primarily due to lower interest rates. The higher interest income on foreign activities for the fiscal year ended March 31, 2012 compared to the fiscal year ended March 31, 2013 reflected the one-time gain of ¥139.3 billion on the conversion rate adjustment of convertible preferred stock of Morgan Stanley.
Interest expense also decreased ¥83.7 billion to ¥556.4 billion for the fiscal year ended March 31, 2013 from ¥640.1 billion for the previous fiscal year. For the fiscal year ended March 31, 2013, compared to the previous fiscal year, interest expense on activities in Japan decreased ¥50.8 billion and interest expense on foreign activities decreased ¥32.9 billion. The lower interest expense on activities in Japan was mainly due to lower interest rates and redemption of some of our subordinated bonds. The lower interest expense on foreign activities was mainly due to lower interest rates.
The average interest rate spread (the average interest rate for interest-earning assets minus the average interest rate for interest-bearing liabilities) decreased 0.09 percentage points to 0.93% for the fiscal year ended March 31, 2013 from 1.02% for the previous fiscal year. For the fiscal year ended March 31, 2013 compared to the previous fiscal year, the average interest rate on interest-earning assets decreased 0.16 percentage points to 1.25% from 1.41%, while the average interest rate on interest-bearing liabilities decreased 0.07 percentage points to 0.32% from 0.39%, which resulted in the overall decrease in the average interest rate spread. The average interest rate spread on domestic activities decreased 0.07 percentage points to 0.74% for the fiscal year ended March 31, 2013 from 0.81% for the previous fiscal year as interest rates on interest-earning assets decreased at steeper rates than interest-bearing liabilities in the current near-zero interest rate environment. The average interest rate spread on foreign activities decreased 0.14 percentage points to 1.22% for the fiscal year ended March 31, 2013 from 1.36% for the previous fiscal year. Excluding the one-time gain on the conversion rate
87
Table of Contents
adjustment of Morgan Stanley’s convertible preferred stock, our average foreign interest rate spread would have improved primarily because we were able to effectively manage the yields on our interest-earning assets while interest rates on our interest-bearing liabilities decreased as market interest rates declined.
In Japan, the Bank of Japan sought to keep short-term interest rates low by maintaining its “quantitative and qualitative monetary easing” policy throughout the reporting period. As a result, the average interest rate on domestic interest-earning assets continued to decline, while the average interest rate on domestic interest-bearing liabilities reached and remained at historically low levels. If the Bank of Japan continues to maintain its current policy on its short-term policy interest rate as well as other monetary easing policies, our interest rate spread on domestic activities will likely continue to be under severe pressure. Moreover, monetary easing policies adopted in foreign markets in the Americas, Europe, Asia and other regions have negatively affected our interest rate spread on foreign activities in recent periods. In addition, our interest rate spread may be affected by changes in long-term interest rates, which, for example, have been fluctuating to an increasing degree in Japan in recent periods due to wider fluctuations in long-term Japanese government bond prices. For further information on the Bank of Japan’s monetary policy and recent interest rate fluctuations in Japan, see “Business Environment—Economic Environment in Japan.”
Average interest-earning assets for the fiscal year ended March 31, 2013 were ¥193,824.3 billion, an increase of ¥9,645.2 billion from ¥184,179.1 billion for the fiscal year ended March 31, 2012. Average domestic interest-earning assets for the fiscal year ended March 31, 2013 were ¥134,759.6 billion, an increase of ¥3,902.9 billion from ¥130,856.7 billion for the previous fiscal year, mainly due to increases in loans, trading account assets and investment securities. The increase in domestic loans was mainly due to an increase in loans to the national government and large corporations in the manufacturing industry. Average foreign interest-earning assets for the fiscal year ended March 31, 2013 were ¥59,064.7 billion, an increase of ¥5,742.3 billion from ¥53,322.4 billion for the previous fiscal year, mainly due to increases in loans and trading account assets. The increase in foreign loans was mainly due to an increase in loans at overseas branches of BTMU due to stronger demand, partially reflecting the improving general market conditions globally, and BTMU’s improved overseas market presence. The increase in foreign trading account assets was primarily due to an increase in the value of foreign bonds translated into Japanese yen resulting from the depreciation of the Japanese yen against other currencies towards the end of the fiscal year ended March 31, 2013, as well as an increase in trading derivative assets reflecting an increase in interest rate derivatives assets in foreign branches of our banking subsidiaries and an increase in interest rate swap trading in our securities subsidiaries outside of Japan. Despite the increase in the average balance of interest-earning assets, the smaller average interest rate spread resulted in the decrease in our interest income for the fiscal year ended March 31, 2013 compared to the previous fiscal year.
Average interest-bearing liabilities for the fiscal year ended March 31, 2013 were ¥173,399.5 billion, an increase of ¥7,978.9 billion from ¥165,420.6 billion for the fiscal year ended March 31, 2012. Average domestic interest-bearing liabilities for the fiscal year ended March 31, 2013 were ¥135,974.9 billion, an increase of ¥5,058.3 billion from ¥130,916.6 billion for the previous fiscal year, mainly due to increases in call money, funds purchased, and payables under repurchase agreements and securities lending transactions as well as deposits. The increase in domestic call money, funds purchased, and payables under repurchase agreements and securities lending transactions was mainly due to an increase in the volume of payables under repurchase agreement in our banking and securities subsidiaries. Average foreign interest-bearing liabilities for the fiscal year ended March 31, 2013 were ¥37,424.6 billion, an increase of ¥2,920.6 billion from ¥34,504.0 billion for the previous fiscal year, mainly due to an increase in the value of foreign currency-denominated deposits, reflecting the depreciation of the Japanese yen against other currencies towards the end of the fiscal year ended March 31, 2013. Despite the increase in the average balance of interest-bearing liabilities, the smaller average interest rate spread resulted in the decrease in our interest expense for the fiscal year ended March 31, 2013 compared to the previous fiscal year.
88
Table of Contents
Provision (credit) for credit losses
Provision (credit) for credit losses is charged to operations to maintain the allowance for credit losses at a level deemed appropriate by management. For more information on our provision for credit losses and a description of the approach and methodology used to establish the allowance for credit losses, see “—B. Liquidity and Capital Resources—Financial Condition—Loan Portfolio—Allowance policy.”
Fiscal Year Ended March 31, 2014 Compared to Fiscal Year Ended March 31, 2013
We recorded ¥106.4 billion of credit for credit losses for the fiscal year ended March 31, 2014 compared to provision for credit losses of ¥144.5 billion for the fiscal year ended March 31, 2013. By segment, ¥70.1 billion, ¥36.0 billion and ¥5.9 billion of credit for credit losses were recorded in the Commercial, Residential and MUAH segments, respectively, and ¥5.6 billion of provision for credit losses was recorded in the Card segment for the fiscal year ended March 31, 2014, compared to ¥127.9 billion, ¥1.3 billion, ¥12.4 billion and ¥2.9 billion of provision for credit losses in the Commercial, Residential, Card and MUAH segments, respectively, for the previous fiscal year.
The improvement in the Commercial segment was mainly due to the upgrades of the internal borrower ratings of a substantial portion of large borrowers in the segment whose financial performance and prospects improved in light of favorable economic conditions in Japan, including a depreciating Japanese yen and rising stock prices. The improvement in the Residential segment was mainly due to an overall improvement in the credit quality of the loan portfolio of the segment, including a decrease in the number of civil rehabilitation filings made by individual borrowers, as economic conditions were generally favorable in Japan. The improvement in the Card segment primarily reflected an overall improvement in the credit quality of the loan portfolio of the segment partially as a result of our implementation of stricter borrower screening under regulatory reforms in the consumer finance industry.
The credit for credit losses in our domestic loan portfolio was ¥81.4 billion for the fiscal year ended March 31, 2014, compared to provision for credit losses of ¥115.7 billion for the fiscal year ended March 31, 2013. The credit for credit losses in our foreign portfolio for the fiscal year ended March 31, 2014 was ¥25.0 billion, compared to provision for credit losses of ¥28.8 billion for the previous fiscal year. MUAH had reversal of allowance for credit losses of ¥5.9 billion for the fiscal year ended March 31, 2014 primarily due to improved credit quality of its loan portfolio.
Fiscal Year Ended March 31, 2013 Compared to Fiscal Year Ended March 31, 2012
Provision for credit losses for the fiscal year ended March 31, 2013 was ¥144.5 billion, a decrease of ¥79.3 billion from ¥223.8 billion for the fiscal year ended March 31, 2012. The provision for credit losses decreased ¥53.5 billion, ¥28.2 billion and ¥15.5 billion in our Commercial segment, Residential segment and Card segment, respectively. On the other hand, the provision for credit losses increased ¥17.9 billion in our MUAH segment.
The decrease in the provision in the Commercial segment was mainly due to a reduction of provision for loans to smaller enterprises for the fiscal year ended March 31, 2013 compared to the fiscal year ended March 31, 2012, when the operating environment and outlook for such enterprises were more negative. The decrease in the provision in the Residential segment was mainly due to the decrease of provision rate as our collection and default rates improved in this segment.
The provision for credit losses in our domestic loan portfolio was ¥115.7 billion, a decrease of ¥104.0 billion from ¥219.7 billion for the fiscal year ended March 31, 2012. The provision for credit losses in our foreign loan portfolio for the fiscal year ended March 31, 2013 was ¥28.8 billion, an increase of ¥24.7 billion compared to the provision for credit losses of ¥4.1 billion for the previous fiscal year. Although the significant improvement in the credit quality of MUAH’s loan portfolio resulted in a reversal of provision in the MUAH segment in the fiscal year ended March 31, 2012, the pace of improvement slowed in the fiscal year ended March 31, 2013, resulting in a provision for credit losses of ¥2.9 billion.
89
Table of Contents
Non-Interest Income
The following table is a summary of our non-interest income for the fiscal years ended March 31, 2012, 2013 and 2014:
| Fiscal years ended March 31, | ||||||||||||
| 2012 | 2013 | 2014 | ||||||||||
| (in billions) | ||||||||||||
|
Fees and commissions income: |
||||||||||||
|
Trust fees |
¥ | 95.0 | ¥ | 92.5 | ¥ | 105.7 | ||||||
|
Fees on funds transfer and service charges for collections |
139.8 | 137.3 | 140.0 | |||||||||
|
Fees and commissions on international business |
57.7 | 58.9 | 68.3 | |||||||||
|
Fees and commissions on credit card business |
149.9 | 149.7 | 157.2 | |||||||||
|
Service charges on deposits |
18.2 | 16.7 | 20.5 | |||||||||
|
Fees and commissions on securities business |
128.4 | 156.0 | 221.8 | |||||||||
|
Fees on real estate business |
23.6 | 28.0 | 34.7 | |||||||||
|
Insurance commissions |
33.7 | 33.6 | 39.7 | |||||||||
|
Fees and commissions on stock transfer agency services |
49.3 | 49.1 | 49.4 | |||||||||
|
Guarantee fees |
58.4 | 55.4 | 52.6 | |||||||||
|
Fees on investment funds business |
126.6 | 130.0 | 155.6 | |||||||||
|
Other fees and commissions |
219.4 | 253.7 | 248.6 | |||||||||
|
|
|
|
|
|
|
|||||||
|
Total |
1,100.0 | 1,160.9 | 1,294.1 | |||||||||
|
Foreign exchange gains (losses)—net |
34.3 | (39.0 | ) | (61.8 | ) | |||||||
|
Trading account profits (losses)—net: |
||||||||||||
|
Net profits (losses) on interest rate and other derivative contracts |
77.7 | (82.7 | ) | (84.4 | ) | |||||||
|
Net profits on trading account securities, excluding derivatives |
589.6 | 653.0 | 50.5 | |||||||||
|
|
|
|
|
|
|
|||||||
|
Total |
667.3 | 570.3 | (33.9 | ) | ||||||||
|
Investment securities gains—net: |
||||||||||||
|
Net gains on sales of securities available for sale: |
||||||||||||
|
Debt securities |
142.9 | 185.9 | 128.8 | |||||||||
|
Marketable equity securities |
34.1 | 64.8 | 77.7 | |||||||||
|
Impairment losses on securities available for sale: |
||||||||||||
|
Debt securities |
(13.8 | ) | (8.3 | ) | (2.6 | ) | ||||||
|
Marketable equity securities |
(176.1 | ) | (113.5 | ) | (0.3 | ) | ||||||
|
Other |
32.3 | 27.1 | 99.9 | |||||||||
|
|
|
|
|
|
|
|||||||
|
Total |
19.4 | 156.0 | 303.5 | |||||||||
|
Equity in earnings (losses) of equity method investees—net |
(499.4 | ) | 60.2 | 110.5 | ||||||||
|
Gains on sales of loans |
15.6 | 14.8 | 17.7 | |||||||||
|
Government grant for transfer of substitutional portion of Employees’ Pension Fund Plans |
— | — | 115.2 | |||||||||
|
Other non-interest income |
103.4 | 144.8 | 75.7 | |||||||||
|
|
|
|
|
|
|
|||||||
|
Total non-interest income |
¥ | 1,440.6 | ¥ | 2,068.0 | ¥ | 1,821.0 | ||||||
|
|
|
|
|
|
|
|||||||
Fees and commissions income
Fees and commissions income consist of income from fees and commissions listed in the above table. Trust fees consist primarily of fees earned on fiduciary asset management and administration services for corporate pension plans, investment funds and other clients. Fees on funds transfer and service charges for collection are fees earned by providing settlement services such as domestic fund remittances and domestic collection services. Fees and commissions on international business primarily consist of fees from international fund transfer and collection services, and trade-related financing services. Fees and commissions on credit card business are composed of interchange income, annual fees, royalty and other service charges from franchisees. Service charges on deposits are fees charged for withdrawal and other services relating to deposits such as checking account deposits. Fees and commissions on securities business include those on underwriting, brokerage and
90
Table of Contents
advisory services and arrangement fees on securitizations. Fees on real estate business primarily consist of fees from real estate agent services. Insurance commissions are commissions earned by acting as agent for insurance companies to sell insurance products. Fees and commissions on stock transfer agency services consist of fees earned primarily on stock title transfers and agency services for the calculation and payment of dividends. Guarantee fees are fees earned by providing guarantees on residential mortgage loans. Fees on investment funds business primarily consist of management fees for investment funds. Other fees and commissions include various arrangement fees and agent fees excluding the fees and commissions mentioned above.
Net foreign exchange gains (losses)
Net foreign exchange gains (losses) consist of foreign exchange gains (losses) on derivative contracts, foreign exchange gains (losses) on other than derivative contracts and foreign exchange gains (losses) related to the fair value option.
Foreign exchange gains (losses) related to derivative contracts are net gains (losses) primarily on currency derivative instruments entered into for trading purposes. For the details of derivative contracts, see Note 23 to our consolidated financial statements included elsewhere in this Annual Report. Foreign exchange gains (losses) on other than derivative contracts include foreign exchange trading gains (losses) as well as transaction gains (losses) on the translation into Japanese yen of monetary assets and liabilities denominated in foreign currencies. The transaction gains (losses) on the translation into Japanese yen fluctuate from period to period depending upon the spot rates at the end of each fiscal year. In principle, all transaction gains (losses) on translation of monetary assets and liabilities denominated in foreign currencies are included in current earnings. Foreign exchange gains (losses) related to the fair value option include transaction gains (losses) on translation into Japanese yen of securities under the fair value option. For the details of the fair value option, see Note 31 to our consolidated financial statements included elsewhere in this Annual Report.
Net trading account profits (losses)
Trading account assets or liabilities are carried at fair value and changes in the value of trading account assets or liabilities are recorded in net trading account profits (losses). Activities reported in our net trading account profits (losses) can generally be classified into two categories:
| Ÿ |
trading purpose activities, which are conducted mainly for the purpose of generating profits either through transaction fees or arbitrage gains and involve frequent and short-term selling and buying of securities, commodities or others; and |
| Ÿ |
trading account assets relating to application of certain accounting rules, which are generally not related to trading purpose activities, but simply classified as trading accounts due to application of certain accounting rules. |
Of the two categories, trading purpose activities represent a smaller portion of our trading account profits.
We generally do not separate for financial reporting purposes customer originated trading activities from those with non-customer related, proprietary trading activities. When an order for a financial product is placed by a customer, a dealer offers a price which includes certain transaction fees, often referred to as the “margin” to the market price. The margin is determined by considering factors such as administrative costs, transaction amount and liquidity of the applicable currency. Once the customer agrees to the offered price, the deal is completed and the position is recorded in our ledger as a single entry without any separation of components. To manage the risk relating to the customer side position, we often enter into an offsetting transaction with the market. Unrealized gains and losses as of the period-end for both the customer side position and the market side position are recorded within the same trading account profits and losses.
Net trading account profits (losses) consist of net profits (losses) on interest rate and other derivative contracts and net profits (losses) on trading account securities, excluding derivatives.
91
Table of Contents
Net profits (losses) on interest rate and other derivative contracts are reported for net profits (losses) on derivative instruments which primarily relate to trading purpose activities and include:
| Ÿ |
Interest rate contract s: Interest rate contracts are mainly utilized to manage interest rate risks which could arise from mismatches between assets and liabilities resulting from customer originated trading activities; |
| Ÿ |
Equity contracts : Equity contracts are mainly utilized to manage the risk that would arise from price fluctuations of stocks held in connection with customer transactions; |
| Ÿ |
Credit derivatives: Credit derivatives are mainly utilized as a part of our credit portfolio risk management; and |
| Ÿ |
Commodity contracts : Commodity contracts are mainly utilized to meet customers’ demand for hedging the risks relating to their transactions, and to diversify our portfolio. |
Derivative instruments for trading purposes also include those used as hedges of net exposures rather than for specifically identified assets or liabilities, which do not meet the specific criteria for hedge accounting.
Net profits (losses) on trading account securities, excluding derivatives, consist of net profits (losses) on trading account securities and net profits (losses) on trading account securities under the fair value option. Net profits (losses) on trading account securities primarily consist of gains and losses on trading and valuation of trading securities which relate to trading purpose activities. Net profits (losses) on investment securities held by certain consolidated variable interest entities are included in accordance with the applicable accounting rules. Net profits (losses) on securities under the fair value option are classified into trading accounts profits (losses) in accordance with certain accounting rules. For the details of the fair value option, see Note 31 to our consolidated financial statements included elsewhere in this Annual Report.
Net investment securities gains (losses)
Net investment securities gains (losses) primarily include net gains (losses) on sales of marketable securities, particularly debt securities and marketable equity securities that are classified as securities available for sale. In addition, impairment losses are recognized as an offset of net investment securities gains (losses) when management concludes that declines in fair value of investment securities are other than temporary.
Fiscal Year Ended March 31, 2014 Compared to Fiscal Year Ended March 31, 2013
Non-interest income for the fiscal year ended March 31, 2014 was ¥1,821.0 billion, a decrease of ¥247.0 billion from ¥2,068.0 billion for the fiscal year ended March 31, 2013. This decrease was mainly attributable to a ¥602.5 billion decrease in net profits on trading account securities, excluding derivatives, to ¥50.5 billion for the fiscal year ended March 31, 2014 from ¥653.0 billion for the fiscal year ended March 31, 2013. This decrease was partially offset by a ¥133.2 billion increase in fees and commissions income, primarily due to higher fees and commissions on securities business and investment funds business, and by a ¥147.5 billion increase in investment securities gains mainly attributable to a ¥113.2 billion improvement in impairment losses on marketable equity securities available for sale, and by a one-time adjustment of ¥115.2 billion in connection with the transfer of the substitutional portion of MUTB’s benefit obligations relating to employee benefit funds to the Japanese government.
Fees and commissions income
Fees and commissions income for the fiscal year ended March 31, 2014 was ¥1,294.1 billion, an increase of ¥133.2 billion from ¥1,160.9 billion for the fiscal year ended March 31, 2013. This increase was partly due to an increase of ¥65.8 billion in fees and commissions from our securities business, particularly commissions from
92
Table of Contents
brokerage and underwriting activities. Fees on investment funds business increased ¥25.6 billion due to a larger amount of mutual funds in our trust banking and commercial banking subsidiaries, while trust fees increased ¥13.2 billion reflecting increases in pension assets and mutual fund assets partly due to higher prices of financial products such as equity securities. Fees on international business also increased ¥9.4 billion mainly in our commercial banking subsidiaries due to increases in fees on foreign exchange transactions in foreign branches.
Net foreign exchange losses
The following table sets forth the details of our foreign exchange gains and losses for the fiscal years ended March 31, 2013 and 2014:
| Fiscal years ended March 31, | ||||||||
| 2013 | 2014 | |||||||
| (in billions) | ||||||||
|
Foreign exchange losses—net: |
||||||||
|
Net foreign exchange losses on derivative contracts |
¥ | (94.2 | ) | ¥ | (52.7 | ) | ||
|
Net foreign exchange losses on other than derivative contracts |
(2,130.7 | ) | (2,026.4 | ) | ||||
|
Net foreign exchange gains related to the fair value option |
2,185.9 | 2,017.3 | ||||||
|
|
|
|
|
|||||
|
Total |
¥ | (39.0 | ) | ¥ | (61.8 | ) | ||
|
|
|
|
|
|||||
Net foreign exchange losses for the fiscal year ended March 31, 2014 were ¥61.8 billion, compared to ¥39.0 billion of net foreign exchange losses for the fiscal year ended March 31, 2013. This was mainly due to a decrease of ¥168.6 billion in net foreign exchange gains related to the fair value option. This decrease was primarily because the Japanese yen depreciated to smaller degrees against other major currencies during the fiscal year ended March 31, 2014, compared to the previous fiscal year. This was partially offset by an improvement of ¥104.3 billion in foreign exchange losses on other than derivative contracts mainly due to lower foreign exchange translation losses on monetary liabilities denominated in foreign currencies in our commercial banking subsidiaries, reflecting the gradual depreciation of the Japanese yen against other major currencies, and by an improvement of ¥41.5 billion in foreign exchange losses on derivative contracts mainly in our trust banking and securities subsidiaries.
Net trading account profits (losses)
The following table sets forth details of our trading account profits and losses for the fiscal years ended March 31, 2013 and 2014:
| Fiscal years ended March 31, | ||||||||
| 2013 | 2014 | |||||||
| (in billions) | ||||||||
|
Trading account profits (losses)—net: |
||||||||
|
Net losses on interest rate and other derivative contracts |
||||||||
|
Interest rate contracts |
¥ | 121.4 | ¥ | 29.9 | ||||
|
Equity contracts |
(137.6 | ) | (104.7 | ) | ||||
|
Commodity contracts |
3.8 | 2.9 | ||||||
|
Credit derivatives |
(10.9 | ) | (6.4 | ) | ||||
|
Other |
(59.4 | ) | (6.1 | ) | ||||
|
|
|
|
|
|||||
|
Total |
¥ | (82.7 | ) | ¥ | (84.4 | ) | ||
|
|
|
|
|
|||||
|
Net profits on trading account securities, excluding derivatives |
||||||||
|
Trading account securities |
¥ | 341.2 | ¥ | 276.5 | ||||
|
Trading account securities under the fair value option |
311.8 | (226.0 | ) | |||||
|
|
|
|
|
|||||
|
Total |
¥ | 653.0 | ¥ | 50.5 | ||||
|
|
|
|
|
|||||
|
Total |
¥ | 570.3 | ¥ | (33.9 | ) | |||
|
|
|
|
|
|||||
93
Table of Contents
We recorded net trading account losses of ¥33.9 billion for the fiscal year ended March 31, 2014 compared to net trading account profits of ¥570.3 billion for the fiscal year ended March 31, 2013. This was mainly due to a decrease of ¥602.5 billion in net profits on trading account securities, excluding derivatives, which primarily consisted of a decrease of ¥393.3 billion in our commercial banking subsidiaries and a decrease of ¥239.9 billion in our trust banking subsidiaries. Due to the increases in interest rates in the United States reflecting the tapering of the quantitative monetary easing program by the FRB, the fair values of foreign bonds, including U.S. Treasury bonds, decreased significantly. In addition, we also incurred losses on transactions in mutual funds investing in debt securities executed in the trading account.
Net investment securities gains
Net investment securities gains for the fiscal year ended March 31, 2014 were ¥303.5 billion, an increase of ¥147.5 billion from ¥156.0 billion for the fiscal year ended March 31, 2013. This increase was mainly due to an improvement of ¥113.2 billion in impairment losses on marketable equity securities, an increase of ¥12.9 billion in gains on sales of marketable equity securities, and an improvement of ¥5.7 billion in impairment losses on debt securities, due to higher stock prices reflecting an overall improvement in financial performance of the corporate sector in Japan, which benefited from the depreciation of the Japanese yen against other major currencies and increased private consumption. The increase in net investment securities gains was also attributable to higher gains on sales of unlisted preferred securities of other companies held by our banking subsidiaries. However, this was partially offset by a ¥57.1 billion decrease in net gains on sales of debt securities due to a lower volume of debt securities, including Japanese government bonds, sold.
Net equity in earnings of equity method investees
Net equity in earnings of equity method investees for the fiscal year ended March 31, 2014 was ¥110.5 billion, compared to net equity in earnings of equity method investees of ¥60.2 billion for the previous fiscal year, mainly due to higher earnings from the equity method investees such as Morgan Stanley.
Government grant for transfer of substitutional portion of Employees’ Pension Fund Plans
We recorded a one-time adjustment of ¥115.2 billion for the fiscal year ended March 31, 2014, in connection with the transfer to the Japanese government of the substitutional portion of MUTB’s benefit obligations relating to employee benefit funds.
In December 2011, in accordance with the Defined Benefit Corporate Pension Plan Act, which permits each employer and employees’ pension fund plan to separate the substitutional portion of the employees’ pension fund from the rest of the fund and transfer the related obligation and assets to the Japanese government, MUTB obtained an approval from the Minister of Health, Labor and Welfare for an exemption from the obligation to pay benefits for future employee services related to the substitutional portion of the governmental welfare pension program. In January 2013, MUTB also obtained an approval for an exemption from the obligation to pay benefits for past employee services related to the substitutional portion. To complete the separation process, the substitutional obligation and the related plan assets were transferred to the Japanese government on February 17, 2014. In accordance with the guidance, which addresses the accounting for the transfer to the Japanese government of a substitutional portion of employee pension fund liabilities, MUTB accounted for the entire separation process, upon completion of transfer of the plan assets to the government, as a single settlement transaction. For the fiscal year ended March 31, 2014, MUTB recognized the difference of ¥115.2 billion between the accumulated benefit obligations settled and the assets transferred to the Japanese government as a government subsidy.
Fiscal Year Ended March 31, 2013 Compared to Fiscal Year Ended March 31, 2012
Non-interest income for the fiscal year ended March 31, 2013 was ¥2,068.0 billion, an increase of ¥627.4 billion from ¥1,440.6 billion for the fiscal year ended March 31, 2012. This increase was mainly
94
Table of Contents
attributable to net equity in earnings of equity method investees of ¥60.2 billion for the fiscal year ended March 31, 2013, compared to net equity in losses of equity method investees of ¥499.4 billion for the previous fiscal year, which included an other-than-temporary impairment loss on our investment in the common stock of Morgan Stanley. Other factors which contributed to the increase in non-interest income included a ¥136.6 billion increase in investment securities gains resulting from an increase in net gains on sales of securities available for sale and a decrease in impairment losses on securities available for sale. These increases were partially offset by a ¥97.0 billion decrease in trading account profits and ¥39.0 billion of net foreign exchange losses compared to net foreign exchange gains of ¥34.3 billion in the previous fiscal year.
Fees and commissions income
Fees and commissions income for the fiscal year ended March 31, 2013 was ¥1,160.9 billion, an increase of ¥60.9 billion from ¥1,100.0 billion for the fiscal year ended March 31, 2012. This increase was partly due to an increase of ¥27.6 billion in fees and commissions from our securities business as a result of increased cross-selling, customer referral and other coordinated efforts between our banking and securities subsidiaries and an increase in our underwriting activity. Other fees and commissions also increased ¥34.3 billion mainly due to an increase in brokerage fees at our banking subsidiaries both in Japan and overseas.
Net foreign exchange gains (losses)
The following table sets forth the details of our foreign exchange gains and losses for the fiscal years ended March 31, 2012 and 2013:
| Fiscal years ended March 31, | ||||||||
| 2012 | 2013 | |||||||
| (in billions) | ||||||||
|
Foreign exchange gains (losses)—net: |
||||||||
|
Net foreign exchange losses on derivative contracts |
¥ | (94.9 | ) | ¥ | (94.2 | ) | ||
|
Net foreign exchange gains (losses) on other than derivative contracts |
72.1 | (2,130.7 | ) | |||||
|
Net foreign exchange gains related to the fair value option |
57.1 | 2,185.9 | ||||||
|
|
|
|
|
|||||
|
Total |
¥ | 34.3 | ¥ | (39.0 | ) | |||
|
|
|
|
|
|||||
Net foreign exchange losses for the fiscal year ended March 31, 2013 were ¥39.0 billion, compared to ¥34.3 billion of net foreign exchange gains for the fiscal year ended March 31, 2012. The Japanese yen depreciated rapidly against other major foreign currencies, including the U.S. dollar, towards the end of the fiscal year ended March 31, 2013 and thus contributed to an increase in yen-denominated foreign exchange gains related to the fair value option. However, this increase was more than offset by an increase in foreign exchange losses on other than derivative contracts resulting from an increase in foreign exchange trading losses and higher foreign exchange translation losses on monetary liabilities denominated in foreign currencies, which we assumed when the Japanese yen was higher.
95
Table of Contents
Net trading account profits
The following table sets forth the details of our trading account profits and losses for the fiscal years ended March 31, 2012 and 2013:
| Fiscal years ended March 31, | ||||||||
| 2012 | 2013 | |||||||
| (in billions) | ||||||||
|
Trading account profits—net: |
||||||||
|
Net profits (losses) on interest rate and other derivative contracts |
||||||||
|
Interest rate contracts |
¥ | 160.4 | ¥ | 121.4 | ||||
|
Equity contracts |
(46.8 | ) | (137.6 | ) | ||||
|
Commodity contracts |
(1.3 | ) | 3.8 | |||||
|
Credit derivatives |
1.6 | (10.9 | ) | |||||
|
Other |
(36.2 | ) | (59.4 | ) | ||||
|
|
|
|
|
|||||
|
Total |
¥ | 77.7 | ¥ | (82.7 | ) | |||
|
|
|
|
|
|||||
|
Net profits on trading account securities, excluding derivatives |
||||||||
|
Trading account securities |
¥ | 149.7 | ¥ | 341.2 | ||||
|
Trading account securities under the fair value option |
439.9 | 311.8 | ||||||
|
|
|
|
|
|||||
|
Total |
¥ | 589.6 | ¥ | 653.0 | ||||
|
|
|
|
|
|||||
|
Total |
¥ | 667.3 | ¥ | 570.3 | ||||
|
|
|
|
|
|||||
Net trading account profits for the fiscal year ended March 31, 2013 were ¥570.3 billion, a decrease of ¥97.0 billion from ¥667.3 billion for the fiscal year ended March 31, 2012. The decrease in net trading account profits was largely due to a ¥160.4 billion decrease in net profits on interest rate and other derivative contracts, which in turn was primarily due to a ¥90.8 billion increase in net losses on equity contracts as a result of an increase in losses at our securities subsidiaries on short positions in equity index futures and to a ¥39.0 billion decrease in net profits on interest rate contracts as a result of losses on revaluation of interest rate swap contracts. These decreases were partially offset by a ¥63.4 billion increase in net profits on trading account securities, excluding derivatives, as a result of an increase in volume on trading transactions, reflecting an improvement in general market conditions. In particular, despite a decrease in net profits on trading account securities under the fair value option of ¥128.1 billion mainly due to a smaller increase in the value of foreign debt securities reflecting a smaller decrease in applicable interest rates, net profits on trading account securities, excluding derivatives, increased due to a ¥191.5 billion increase in net profits on trading account securities other than those under the fair value option, reflecting an increase in the volume of our securities trading activity.
Net investment securities gains
Net investment securities gains for the fiscal year ended March 31, 2013 were ¥156.0 billion, an increase of ¥136.6 billion from ¥19.4 billion for the fiscal year ended March 31, 2012. This increase was mainly due to a decrease of ¥62.6 billion in impairment losses on marketable equity securities, an increase of ¥43.0 billion in gains on sales of debt securities as a result of an increase in gains on sales of Japanese government bonds in the lower interest rate environment, and ¥30.7 billion of gains on sales of marketable equity securities as a result of an increase in gains on sales of domestic equity securities mainly due to an improvement in the domestic equity market.
Net equity in earnings (losses) of equity method investees
Net equity in earnings of equity method investees for the fiscal year ended March 31, 2013 was ¥60.2 billion, compared to net equity in losses of equity method investees of ¥499.4 billion for the previous fiscal year, which included an other-than-temporary impairment loss of ¥579.5 billion on our investment in Morgan Stanley’s common stock. For further information, see Note 2 to our consolidated financial statements included elsewhere in this Annual Report.
96
Table of Contents
Non-Interest Expense
The following table shows a summary of our non-interest expense for the fiscal years ended March 31, 2012, 2013 and 2014:
| Fiscal years ended March 31, | ||||||||||||
| 2012 | 2013 | 2014 | ||||||||||
| (in billions) | ||||||||||||
|
Salaries and employee benefits |
¥ | 900.1 | ¥ | 932.4 | ¥ | 1,029.6 | ||||||
|
Occupancy expenses—net |
150.8 | 151.1 | 158.4 | |||||||||
|
Fees and commissions expenses |
204.7 | 209.8 | 222.0 | |||||||||
|
Outsourcing expenses, including data processing |
191.1 | 198.1 | 216.7 | |||||||||
|
Depreciation of premises and equipment |
94.8 | 94.0 | 103.7 | |||||||||
|
Amortization of intangible assets |
212.2 | 207.6 | 198.1 | |||||||||
|
Impairment of intangible assets |
31.0 | 3.4 | 0.3 | |||||||||
|
Insurance premiums, including deposit insurance |
115.4 | 98.7 | 101.1 | |||||||||
|
Communications |
49.3 | 47.1 | 50.9 | |||||||||
|
Taxes and public charges |
65.6 | 66.9 | 69.5 | |||||||||
|
Other non-interest expenses |
307.7 | 369.6 | 318.0 | |||||||||
|
|
|
|
|
|
|
|||||||
|
Total non-interest expense |
¥ | 2,322.7 | ¥ | 2,378.7 | ¥ | 2,468.3 | ||||||
|
|
|
|
|
|
|
|||||||
Fiscal Year Ended March 31, 2014 Compared to Fiscal Year Ended March 31, 2013
Non-interest expense for the fiscal year ended March 31, 2014 was ¥2,468.3 billion, an increase of ¥89.6 billion from ¥2,378.7 billion for the previous fiscal year. This increase was mainly due to a ¥97.2 billion increase in salaries and employee benefits expenses reflecting an increase in the number of employees in our commercial banking subsidiaries and higher performance-based compensation in our securities subsidiaries, a ¥18.6 billion increase in outsourcing expenses, including data processing, and a ¥12.2 billion increase in fees and commissions expenses. These increases were partially offset by a ¥51.6 billion decrease in other non-interest expenses.
Salaries and employee benefits
Salaries and employee benefits for the fiscal year ended March 31, 2014 were ¥1,029.6 billion, an increase of ¥97.2 billion from ¥932.4 billion for the previous fiscal year. This increase was due to a one-time loss of ¥40.7 billion in connection with the transfer to the Japanese government of the substitutional portion of MUTB’s benefit obligations relating to employee benefit funds, an increase in the number of employees in foreign branches, especially in New York, of our commercial banking subsidiaries, MUAH’s acquisition of local banks, larger bonus payments under a performance-based bonus plan in our securities subsidiaries, and the depreciation of Japanese yen against other major currencies.
Fees and commissions expenses
Fees and commissions expenses for the fiscal year ended March 31, 2014 was ¥222.0 billion, an increase of ¥12.2 billion from ¥209.8 billion for the fiscal year ended March 31, 2013. This increase was mainly due to an increase in fees and commissions expenses recorded in our consumer finance subsidiaries reflecting an increased volume of transactions. The fees and commissions expenses in our commercial banking, trust banking and securities subsidiaries also increased during the fiscal year due to higher transaction volumes as the subsidiaries took advantage of improvements in the business environment after the introduction of “Abenomics” in December 2012.
Outsourcing expenses, including data processing
Outsourcing expenses, including data processing, for the fiscal year ended March 31, 2014 was ¥216.7 billion, an increase of ¥18.6 billion from ¥198.1 billion for the fiscal year ended March 31, 2013. A substantial
97
Table of Contents
portion of this increase was recorded in our commercial banking subsidiaries due to higher maintenance fees related to system software in foreign branches and subsidiaries, including MUAH. The increase in outsourcing expenses was also attributable to higher outsourcing fees incurred by our securities subsidiaries, and an increase in the number of temporary employees obtained from temporary staffing agencies.
Other non-interest expenses
Other non-interest expenses for the fiscal year ended March 31, 2014 were ¥318.0 billion, a decrease of ¥51.6 billion from ¥369.6 billion for the fiscal year ended March 31, 2013, when other non-interest expenses included the realization of losses which were previously recorded in foreign currency translation included in accumulated other comprehensive income, resulting from the deconsolidation of several overseas variable interest entities, or VIEs. There were no such non-interest expenses recorded for the fiscal year ended March 31, 2014.
Fiscal Year Ended March 31, 2013 Compared to Fiscal Year Ended March 31, 2012
Non-interest expense for the fiscal year ended March 31, 2013 was ¥2,378.7 billion, an increase of ¥56.0 billion from ¥2,322.7 billion for the previous fiscal year. This increase was mainly due to a ¥32.3 billion increase in salaries and employee benefits expenses reflecting an increase in the number of employees and larger employee retirement benefits at BTMU and a ¥61.9 billion increase in other non-interest expenses mainly due to realization of losses, which were previously recorded in foreign currency translation included in accumulated other comprehensive income, resulting from the deconsolidation of several overseas VIEs, and a ¥24.5 billion of civil monetary payment to DFS. These increases were partially offset by a ¥27.6 billion decrease in impairment of intangible assets and a ¥16.7 billion decrease in insurance premiums, including deposit insurance.
Salaries and employee benefits
Salaries and employee benefits for the fiscal year ended March 31, 2013 were ¥932.4 billion, an increase of ¥32.3 billion from ¥900.1 billion for the previous fiscal year. This increase was mainly due to an increase in the number of employees, larger retirement benefit expenses at BTMU, an increase in bonuses at MUMSS reflecting improved business performance and an increase in retirement benefit expenses at our trust banking subsidiaries.
Impairment of intangible assets
Impairment of intangible assets for the fiscal year ended March 31, 2013 was ¥3.4 billion, a decrease of ¥27.6 billion from ¥31.0 billion for the fiscal year ended March 31, 2012. This decrease mainly reflected impairment losses on intangible assets related to our trust banking and securities subsidiaries’ customer relationships from fund contracts for the fiscal year ended March 31, 2012, while we did not recognize significant impairment losses for the fiscal year ended March 31, 2013.
Other non-interest expenses
Other non-interest expenses for the fiscal year ended March 31, 2013 were ¥369.6 billion, an increase of ¥61.9 billion from ¥307.7 billion for the fiscal year ended March 31, 2012. This increase was mainly due to realization of losses, which were previously recorded in foreign currency translation included in accumulated other comprehensive income, resulting from the deconsolidation of several overseas VIEs, and a ¥24.5 billion, or U.S.$250.0 million, civil monetary payment to DFS. For more information on the civil monetary payment, see “—Recent Developments.”
98
Table of Contents
Income Tax Expense
The following table shows a summary of our income tax expense for the fiscal years ended March 31, 2012, 2013 and 2014:
| Fiscal years ended March 31, | ||||||||||||
| 2012 | 2013 | 2014 | ||||||||||
| (in billions, except percentages) | ||||||||||||
|
Income before income tax expense |
¥ | 849.9 | ¥ | 1,415.9 | ¥ | 1,420.4 | ||||||
|
Income tax expense |
429.2 | 296.0 | 337.9 | |||||||||
|
Effective income tax rate |
50.5 | % | 20.9 | % | 23.8 | % | ||||||
|
Combined normal effective statutory tax rate |
40.6 | % | 38.0 | % | 38.0 | % | ||||||
Reconciling items between the combined normal effective statutory tax rates and the effective income tax rates for the fiscal years ended March 31, 2012, 2013 and 2014 are summarized as follows:
| Fiscal years ended March 31, | ||||||||||||
| 2012 | 2013 | 2014 | ||||||||||
|
Combined normal effective statutory tax rate |
40.6 | % | 38.0 | % | 38.0 | % | ||||||
|
Increase (decrease) in taxes resulting from: |
||||||||||||
|
Nondeductible expenses |
0.2 | 0.1 | 0.2 | |||||||||
|
Dividends from foreign subsidiaries |
0.1 | 0.0 | 0.0 | |||||||||
|
Foreign tax credits and payments |
(2.1 | ) | (0.8 | ) | (0.6 | ) | ||||||
|
Lower tax rates applicable to income of subsidiaries |
(0.5 | ) | (0.5 | ) | (0.4 | ) | ||||||
|
Change in valuation allowance |
2.3 | (7.3 | ) | (12.4 | ) | |||||||
|
Realization of previously unrecognized tax effects of subsidiaries |
0.0 | (10.7 | ) | (0.1 | ) | |||||||
|
Nontaxable dividends received |
(3.4 | ) | (2.3 | ) | (3.3 | ) | ||||||
|
Undistributed earnings of subsidiaries |
0.2 | 1.5 | 0.5 | |||||||||
|
Tax and interest expense for uncertainty in income taxes |
0.1 | (0.1 | ) | — | ||||||||
|
Expiration of loss carryforward |
4.8 | 2.1 | — | |||||||||
|
Effect of changes in tax laws |
9.1 | — | 1.2 | |||||||||
|
Other—net |
(0.9 | ) | 0.9 | 0.7 | ||||||||
|
|
|
|
|
|
|
|||||||
|
Effective income tax rate |
50.5 | % | 20.9 | % | 23.8 | % | ||||||
|
|
|
|
|
|
|
|||||||
The effective income tax rate for the fiscal year ended March 31, 2014 was 23.8%, 14.2 percentage points lower than the combined normal effective statutory tax rate of 38.0%. This lower effective income tax rate primarily reflected a decrease in the valuation allowance against deferred tax assets which accounted for 12.4 percentage points of the difference between the combined normal effective statutory tax rate and the effective income tax rate. For the fiscal year ended March 31, 2014, we recorded a valuation allowance release on the basis of management’s reassessment of the amount of our deferred tax assets that were more likely than not to be realized. As of March 31, 2014, management considered new evidence, both positive and negative, that could impact management’s view with regard to future realization of deferred tax assets. Among others,
| Ÿ |
a release of valuation allowance of ¥91.1 billion was due to the application of the consolidated corporate-tax system beginning with the fiscal year ending March 31, 2015. This is because MUFG would be able to utilize income in more profitable subsidiaries to realize the benefit of net operating loss carryforwards and existing deductible temporary differences recorded at MUFG. A consolidated basis for corporate income taxes results in the reporting of taxable income or loss based upon the combined profits or losses of the parent company and its wholly owned domestic subsidiaries. Management believes that the net operating loss carryforwards related to corporate taxes will be fully utilized by the application of the consolidated corporate-tax system; and |
| Ÿ |
a release of valuation allowance of ¥45.9 billion was due to the profitability improvement of a certain subsidiary. Management considered various factors, including the improved operating performance and |
99
Table of Contents
|
cumulative operating results over the prior several years of the subsidiary as well as the outlook regarding prospective operating performance of the subsidiary, and determined that sufficient positive evidence exists as of March 31, 2014, to conclude that it is more likely than not that additional deferred tax assets would be realizable. |
The effective income tax rate of 20.9% for the fiscal year ended March 31, 2013 was 17.1 percentage points lower than the combined normal effective statutory tax rate of 38.0%. This lower effective income tax rate primarily reflected the liquidation of a subsidiary, whose assets and operations we took over after the liquidation, and the realization of tax benefits from the temporary differences not previously recognized as part of deferred tax assets. The lower effective tax rate also reflected a ¥161.7 billion decrease in valuation allowance to ¥483.0 billion as of March 31, 2013 from ¥644.7 billion as of March 31, 2012. The valuation allowance was reduced to the extent that it was more likely than not that the deferred tax assets would be realized primarily because certain subsidiaries were considered to have returned to sustained profitability.
The effective income tax rate of 50.5% for the fiscal year ended March 31, 2012 was 9.9 percentage points higher than the combined normal effective statutory tax rate of 40.6%. This higher effective income tax rate primarily caused by changes in tax laws that mainly include an approximately 5% reduction in the effective statutory rate of corporate tax from 40.6% to 35.6%, which accounted for 9.1% of the difference between the combined normal effective statutory tax rate and the effective income tax rate.
On November 30, 2011, the Japanese Diet enacted two tax related laws, namely “Amendment to the 2011 Tax Reform” and “Special Measures to Secure the Financial Resources to Implement the Restoration form The Great East Japan Earthquake.” The changes under the new laws include a limitation on the use of net operating loss carryforwards to 80% of taxable income, a two-year increase in the carryforward period of certain net operating loss carryforwards to a nine-year period, and an approximately 5% reduction in the effective statutory rate of corporate income tax from 40.6% to 35.6%. While the reduction in the effective statutory rate is effective for the fiscal year beginning on or after April 1, 2012, a temporary surtax levied on corporate income taxes to fund the earthquake recovery efforts caused the effective statutory rate of corporate income tax to be approximately 38.0% for the three year period between April 1, 2012 and March 31, 2015.
On March 20, 2014, the Japanese Diet enacted the “2014 Tax Reform” which terminated the temporary surtax levied on corporate income taxes one year earlier than the change in tax law on November 30, 2011 as described above. As a result, the effective statutory rate of corporate income tax for the fiscal year ending March 31, 2015 was set at approximately 35.6%. The change in tax law resulted in an increase of ¥16.7 billion in income tax expense for the fiscal year ended March 31, 2014.
Net income attributable to noncontrolling interests
Fiscal Year Ended March 31, 2014 Compared to Fiscal Year Ended March 31, 2013
We recorded net income attributable to noncontrolling interests of ¥67.1 billion for the fiscal year ended March 31, 2014, compared to net income attributable to noncontrolling interests of ¥50.7 billion for the previous fiscal year. This increase was mainly due to an increase in net income recorded at MUMSS, in which MUFG has a 60% economic interest, in the fiscal year ended March 31, 2014.
Fiscal Year Ended March 31, 2013 Compared to Fiscal Year Ended March 31, 2012
We recorded net income attributable to noncontrolling interests of ¥50.7 billion for the fiscal year ended March 31, 2013, compared to net income attributable to noncontrolling interests of ¥4.5 billion for the previous fiscal year. This increase was mainly due to an increase in net income recorded at MUMSS, in which MUFG has a 60% economic interest, in the fiscal year ended March 31, 2013.
100
Table of Contents
We measure the performance of each of our business segments primarily in terms of “operating profit.” Operating profit and other segment information in this Annual Report are based on the financial information prepared in accordance with Japanese GAAP as adjusted in accordance with internal management accounting rules and practices. Accordingly, the format and information are not consistent with our consolidated financial statements prepared on the basis of U.S. GAAP. For example, operating profit does not reflect items such as a part of the provision for credit losses (primarily equivalent to the formula allowance under U.S. GAAP), foreign exchange gains (losses) and investment securities gains (losses). For information on a reconciliation of operating profit under the internal management reporting system to income before income tax expense shown on the consolidated statements of income, see Note 29 to our consolidated financial statements included elsewhere in this Annual Report. We do not use information on the segments’ total assets to allocate our resources and assess performance. Accordingly, business segment information on total assets is not presented.
We operate our main businesses under an integrated business group system, which integrates the operations of BTMU, MUTB, MUMSS (through MUSHD), Mitsubishi UFJ NICOS and other subsidiaries in the following five areas—Retail, Corporate, Trust Assets, Global, and Global Markets. Operations that are not covered by the integrated business group system are classified under Other.
The following is a brief explanation of our business segments:
Integrated Retail Banking Business Group —Covers all domestic retail businesses, including commercial banking, trust banking and securities businesses. This business group integrates the retail businesses of BTMU, MUTB, MUMSS, Mitsubishi UFJ NICOS and other subsidiaries as well as retail product development, promotion and marketing in a single management structure. At the same time, this business group has developed and implemented MUFG Plaza, a one-stop, comprehensive financial services concept that provides integrated banking, trust and securities services.
Integrated Corporate Banking Business Group —Covers all domestic corporate businesses, including commercial banking, investment banking, trust banking and securities businesses. Through the integration of these business lines, diverse financial products and services are provided to our corporate clients. This business group has clarified strategic domains, sales channels and methods to match the different growth stages and financial needs of our corporate clients.
Integrated Trust Assets Business Group —Covers asset management and administration services for products such as pension trusts and security trusts by integrating the trust banking expertise of MUTB and the global network of BTMU. This business group provides a full range of services to corporate and other pension funds, including stable and secure pension fund management and administration, advice on pension schemes and payment of benefits to scheme members.
Integrated Global Business Group —Covers businesses outside Japan, including commercial banking such as loans, deposits and cash management services, investment banking, retail banking, trust banking and securities businesses (with the retail banking and trust assets businesses being conducted through MUB), through a global network of more than 500 offices outside Japan to provide customers with financial products and services that meet their increasingly diverse and sophisticated financing needs. MUB is one of the largest commercial banks in California by both total assets and total deposits. MUB provides a wide range of financial services to consumers, small businesses, middle market companies and major corporations, primarily in California, Oregon and Washington but also nationally and internationally. MUB’s parent company is MUAH, which is a bank holding company in the United States.
Global Markets —Covers asset and liability management and strategic investments of BTMU and MUTB, and sales and trading of financial products of BTMU, MUTB and MUSHD.
101
Table of Contents
Other —Consists mainly of the corporate centers of MUFG, BTMU, MUTB and MUMSS. The elimination of duplicated amounts of net revenue among business segments is also reflected in Other.
Effective April 1, 2013 and October 1, 2013, in order to further streamline and integrate our managerial accounting methodologies on a group-wide basis, we made modifications to such methodologies, which mainly affected the Integrated Retail Banking Business Group and the Corporate Banking Business Group. These modifications had no impact on our total operating profit for the fiscal years ended March 31, 2012 and 2013, but affected net revenue and operating expense allocations among business segments. Prior period business segment information has been reclassified to enable comparisons between the relevant amounts for the fiscal years ended March 31, 2012, 2013 and 2014, respectively.
For further information, see Note 29 to our consolidated financial statements included elsewhere in this Annual Report.
The following table set forth our business segment information for the fiscal years ended March 31, 2012, 2013 and 2014:
|
Integrated
Retail Banking Business Group |
Integrated
Corporate Banking Business Group |
Integrated
Trust Assets Business Group |
Integrated Global Business Group | |||||||||||||||||||||||||||||||||
|
Other
than MUAH |
MUAH | Total |
Global
Markets |
Other | Total | |||||||||||||||||||||||||||||||
| (in billions) | ||||||||||||||||||||||||||||||||||||
|
Fiscal year ended March 31, 2012: |
||||||||||||||||||||||||||||||||||||
|
Net revenue: |
¥ | 1,227.1 | ¥ | 870.7 | ¥ | 140.1 | ¥ | 364.6 | ¥ | 252.0 | ¥ | 616.6 | ¥ | 727.9 | ¥ | (1.3 | ) | ¥ | 3,581.1 | |||||||||||||||||
|
Operating expenses |
915.8 | 440.5 | 87.3 | 196.5 | 173.0 | 369.5 | 128.1 | 161.4 | 2,102.6 | |||||||||||||||||||||||||||
|
|
|
|
|
|
|
|
|
|
|
|
|
|
|
|
|
|
|
|||||||||||||||||||
|
Operating profit (loss) |
¥ | 311.3 | ¥ | 430.2 | ¥ | 52.8 | ¥ | 168.1 | ¥ | 79.0 | ¥ | 247.1 | ¥ | 599.8 | ¥ | (162.7 | ) | ¥ | 1,478.5 | |||||||||||||||||
|
|
|
|
|
|
|
|
|
|
|
|
|
|
|
|
|
|
|
|||||||||||||||||||
|
Fiscal year ended March 31, 2013: |
||||||||||||||||||||||||||||||||||||
|
Net revenue: |
¥ | 1,207.8 | ¥ | 864.0 | ¥ | 138.8 | ¥ | 465.4 | ¥ | 288.5 | ¥ | 753.9 | ¥ | 763.0 | ¥ | (10.8 | ) | ¥ | 3,716.7 | |||||||||||||||||
|
Operating expenses |
917.3 | 434.4 | 88.3 | 246.8 | 205.4 | 452.2 | 142.5 | 174.4 | 2,209.1 | |||||||||||||||||||||||||||
|
|
|
|
|
|
|
|
|
|
|
|
|
|
|
|
|
|
|
|||||||||||||||||||
|
Operating profit (loss) |
¥ | 290.5 | ¥ | 429.6 | ¥ | 50.5 | ¥ | 218.6 | ¥ | 83.1 | ¥ | 301.7 | ¥ | 620.5 | ¥ | (185.2 | ) | ¥ | 1,507.6 | |||||||||||||||||
|
|
|
|
|
|
|
|
|
|
|
|
|
|
|
|
|
|
|
|||||||||||||||||||
|
Fiscal year ended March 31, 2014: |
||||||||||||||||||||||||||||||||||||
|
Net revenue: |
¥ | 1,290.6 | ¥ | 924.5 | ¥ | 159.2 | ¥ | 567.9 | ¥ | 375.9 | ¥ | 943.8 | ¥ | 568.6 | ¥ | (13.6 | ) | ¥ | 3,873.1 | |||||||||||||||||
|
Operating expenses |
961.9 | 438.4 | 94.4 | 299.5 | 266.9 | 566.4 | 176.5 | 172.4 | 2,410.0 | |||||||||||||||||||||||||||
|
|
|
|
|
|
|
|
|
|
|
|
|
|
|
|
|
|
|
|||||||||||||||||||
|
Operating profit (loss) |
¥ | 328.7 | ¥ | 486.1 | ¥ | 64.8 | ¥ | 268.4 | ¥ | 109.0 | ¥ | 377.4 | ¥ | 392.1 | ¥ | (186.0 | ) | ¥ | 1,463.1 | |||||||||||||||||
|
|
|
|
|
|
|
|
|
|
|
|
|
|
|
|
|
|
|
|||||||||||||||||||
Fiscal Year Ended March 31, 2014 Compared to Fiscal Year Ended March 31, 2013
Integrated Retail Banking Business Group
Net revenue of the Integrated Retail Banking Business Group increased ¥82.8 billion to ¥1,290.6 billion for the fiscal year ended March 31, 2014 from ¥1,207.8 billion for the fiscal year ended March 31, 2013. Net revenue of the Integrated Retail Banking Business Group mainly consists of domestic revenues from commercial banking operations, such as deposits and lending operations, and fees related to sales of investment products to retail customers, as well as fees received by subsidiaries within the Integrated Retail Banking Business Group. The increase in net revenue was mainly due to increases in volumes of sales of financial products such as mutual funds, debt securities and equity securities, reflecting improved market conditions since the introduction of “Abenomics” despite the negative impact of lower interest income from loans due to lower interest rates.
Operating expenses of the Integrated Retail Banking Business Group increased ¥44.6 billion to ¥961.9 billion for the fiscal year ended March 31, 2014 from ¥917.3 billion for the fiscal year ended March 31, 2013.
102
Table of Contents
Operating profit of the Integrated Retail Banking Business Group increased ¥38.2 billion to ¥328.7 billion for the fiscal year ended March 31, 2014 from ¥290.5 billion for the fiscal year ended March 31, 2013.
Integrated Corporate Banking Business Group
Net revenue of the Integrated Corporate Banking Business Group increased ¥60.5 billion to ¥924.5 billion for the fiscal year ended March 31, 2014 from ¥864.0 billion for the fiscal year ended March 31, 2013. Net revenue of the Integrated Corporate Banking Business Group mainly consists of domestic revenues from corporate lending and other commercial banking operations, investment banking and trust banking businesses in relation to corporate clients, as well as fees received by subsidiaries within the Integrated Corporate Banking Business Group. The increase in net revenue was mainly from investment banking businesses such as derivative sales and structured financing in our banking subsidiaries and from primary and secondary businesses in our securities subsidiaries, reflecting improved market conditions in Japan.
Operating expenses of the Integrated Corporate Banking Business Group were ¥438.4 billion for the fiscal year ended March 31, 2014, an increase of ¥4.0 billion from ¥434.4 billion for the fiscal year ended March 31, 2013.
Operating profit of the Integrated Corporate Banking Business Group increased ¥56.5 billion to ¥486.1 billion for the fiscal year ended March 31, 2014 from ¥429.6 billion for the fiscal year ended March 31, 2013.
Integrated Trust Assets Business Group
Net revenue of the Integrated Trust Assets Business Group increased ¥20.4 billion to ¥159.2 billion for the fiscal year ended March 31, 2014 from ¥138.8 billion for the fiscal year ended March 31, 2013. Net revenue of the Integrated Trust Assets Business Group mainly consists of fees from asset management and administration services for products such as pension trusts and investment trusts. Improvements in market conditions since the introduction of “Abenomics” had a positive impact on the businesses of the Integrated Trust Assets Business Group.
Operating expenses of the Integrated Trust Assets Business Group increased by ¥6.1 billion to ¥94.4 billion for the fiscal year ended March 31, 2014 from ¥88.3 billion for the fiscal year ended March 31, 2013.
Operating profit of the Integrated Trust Assets Business Group increased ¥14.3 billion to ¥64.8 billion for the fiscal year ended March 31, 2014 from ¥50.5 billion for the fiscal year ended March 31, 2013.
Integrated Global Business Group
Net revenue of the Integrated Global Business Group increased ¥189.9 billion to ¥943.8 billion for the fiscal year ended March 31, 2014 from ¥753.9 billion for the fiscal year ended March 31, 2013. Net revenue of the Integrated Global Business Group mainly consists of revenues from commercial banking businesses outside of Japan, including loan, deposit and cash management, investment banking, retail banking, trust banking and securities businesses. The increase in net revenue mainly came from increases in fees and commissions income in Asia and interest income from loans to both Japanese and non-Japanese companies in the Americas. The depreciation of the Japanese yen against other major currencies also contributed to the increase in net revenue of the business group.
Operating expenses of the Integrated Global Business Group increased ¥114.2 billion to ¥566.4 billion for the fiscal year ended March 31, 2014 from ¥452.2 billion for the fiscal year ended March 31, 2013, mainly due to increases in salaries in foreign branches of our commercial banking and securities subsidiaries, and the depreciation of the Japanese yen against other major currencies.
Operating profit of the Integrated Global Business Group increased ¥75.7 billion to ¥377.4 billion for the fiscal year ended March 31, 2014 from ¥301.7 billion for the fiscal year ended March 31, 2013.
103
Table of Contents
Global Markets
Net revenue of Global Markets decreased ¥194.4 billion to ¥568.6 billion for the fiscal year ended March 31, 2014 from ¥763.0 billion for the fiscal year ended March 31, 2013. This decrease was mainly due to lower gains in sales of debt securities, particularly Japanese government bonds held as investment securities, in our commercial and trust banking subsidiaries, reflecting lower volumes of debt securities sold, despite increases in gains from the equity and debt securities trading in our securities subsidiaries.
Operating expenses of Global Markets increased ¥34.0 billion to ¥176.5 billion for the fiscal year ended March 31, 2014 from ¥142.5 billion for the fiscal year ended March 31, 2013, primarily due to an increase in salaries, including performance-based bonuses in our securities subsidiaries, reflecting increased market activities.
Operating profit of the Global Markets decreased ¥228.4 billion to ¥392.1 billion for the fiscal year ended March 31, 2014 from ¥620.5 billion for the fiscal year ended March 31, 2013.
Fiscal Year Ended March 31, 2013 Compared to Fiscal Year Ended March 31, 2012
Integrated Retail Banking Business Group
Net revenue of the Integrated Retail Banking Business Group decreased ¥19.3 billion to ¥1,207.8 billion for the fiscal year ended March 31, 2013 from ¥1,227.1 billion for the fiscal year ended March 31, 2012. Net revenue of the Integrated Retail Banking Business Group mainly consists of domestic revenues from commercial banking operations, such as deposits and lending operations, and fees related to sales of investment products to retail customers, as well as fees of subsidiaries within the Integrated Retail Banking Business Group. The decrease in net revenue reflected a decrease in income generated from funds deposited with us due to the impact of the declining interest rate environment that continued throughout the fiscal year ended March 31, 2013, and a decrease in income related to our group companies engaged in the consumer finance business reflecting a decrease in volume of consumer loans, partially offset by an increase in fees from sales of insurance and other investment products.
Operating expenses of the Integrated Retail Banking Business Group increased ¥1.5 billion to ¥917.3 billion for the fiscal year ended March 31, 2013 from ¥915.8 billion for the fiscal year ended March 31, 2012.
Operating profit of the Integrated Retail Banking Business Group decreased ¥20.8 billion to ¥290.5 billion for the fiscal year ended March 31, 2013 from ¥311.3 billion for the fiscal year ended March 31, 2012.
Integrated Corporate Banking Business Group
Net revenue of the Integrated Corporate Banking Business Group decreased ¥6.7 billion to ¥864.0 billion for the fiscal year ended March 31, 2013 from ¥870.7 billion for the fiscal year ended March 31, 2012. Net revenue of the Integrated Corporate Banking Business Group mainly consists of domestic revenues from corporate lending and other commercial banking operations, investment banking and trust banking businesses in relation to corporate clients, as well as fees received by subsidiaries within the Integrated Corporate Banking Business Group. The decrease in net revenue was mainly due to a decrease in net interest income from deposits reflecting the low interest rate environment and the generally stagnant demand for loans from customers except for a few large corporate borrowers, partially offset by increases in investment banking business related to structured financing and asset finance business primarily due to increased cross-selling, customer referral and other coordinated efforts between our banking and securities subsidiaries.
Operating expenses of the Integrated Corporate Banking Business Group were ¥434.4 billion for the fiscal year ended March 31, 2013, a decrease of ¥6.1 billion from ¥440.5 billion for the fiscal year ended March 31, 2012.
Operating profit of the Integrated Corporate Banking Business Group decreased ¥0.6 billion to ¥429.6 billion for the fiscal year ended March 31, 2013 from ¥430.2 billion for the fiscal year ended March 31, 2012.
104
Table of Contents
Integrated Trust Assets Business Group
Net revenue of the Integrated Trust Assets Business Group decreased ¥1.3 billion to ¥138.8 billion for the fiscal year ended March 31, 2013 from ¥140.1 billion for the fiscal year ended March 31, 2012. Net revenue of the Integrated Trust Assets Business Group mainly consists of fees from asset management and administration services for products such as pension trusts and investment trusts. The decrease in net revenue was mainly due to a decrease in the volume of our investment trust business affected by the market slowdown in the first half of the fiscal year ended March 31, 2013, partially offset by an increase in the volume of our global custody business.
Operating expenses of the Integrated Trust Assets Business Group increased ¥1.0 billion to ¥88.3 billion for the fiscal year ended March 31, 2013 from ¥87.3 billion for the fiscal year ended March 31, 2012.
Operating profit of the Integrated Trust Assets Business Group decreased ¥2.3 billion to ¥50.5 billion for the fiscal year ended March 31, 2013 from ¥52.8 billion for the fiscal year ended March 31, 2012.
Integrated Global Business Group
Net revenue of the Integrated Global Business Group increased ¥137.3 billion to ¥753.9 billion for the fiscal year ended March 31, 2013 from ¥616.6 billion for the fiscal year ended March 31, 2012. Net revenue of the Integrated Global Business Group mainly consists of revenues from commercial banking businesses outside of Japan, including loan, deposit and cash management, investment banking, retail banking, trust banking and securities businesses. The increase in net revenue was mainly due to increases in interest income attribute to non-Japanese customers mainly in Asia and income from investment banking business especially in Europe and the United States.
Operating expenses of the Integrated Global Business Group increased ¥82.7 billion to ¥452.2 billion for the fiscal year ended March 31, 2013 from ¥369.5 billion for the fiscal year ended March 31, 2012, reflecting the geographic expansion of our operations and an increase in regulatory costs for our banking business.
Operating profit of the Integrated Global Business Group increased ¥54.6 billion to ¥301.7 billion for the fiscal year ended March 31, 2013 from ¥247.1 billion for the fiscal year ended March 31, 2012.
Global Markets
Net revenue of Global Markets increased ¥35.1 billion to ¥763.0 billion for the fiscal year ended March 31, 2013 from ¥727.9 billion for the fiscal year ended March 31, 2012. This increase was mainly due to gains from our asset and liability management business, gains attributable to the sales and trading business, and profits from the overseas fixed income businesses of MUMSS.
Operating expenses of Global Markets increased ¥14.4 billion to ¥142.5 billion for the fiscal year ended March 31, 2013 from ¥128.1 billion for the fiscal year ended March 31, 2012.
Operating profit of the Global Markets increased ¥20.7 billion to ¥620.5 billion for the fiscal year ended March 31, 2013 from ¥599.8 billion for the fiscal year ended March 31, 2012. This increase was mainly due to the gains from our asset and liability management business.
105
Table of Contents
The table below sets forth our total revenue, income before income tax expense and net income (loss) attributable to Mitsubishi UFJ Financial Group on a geographic basis for the fiscal years ended March 31, 2012, 2013 and 2014. Assets, income and expenses attributable to foreign operations are allocated to geographical areas based on the domicile of the debtors and customers. For further information, see Note 30 to our consolidated financial statements included elsewhere in this Annual Report.
| Fiscal years ended March 31, | ||||||||||||
| 2012 | 2013 | 2014 | ||||||||||
| (in billions) | ||||||||||||
|
Total revenue (interest income and non-interest income): |
||||||||||||
|
Domestic |
¥ | 2,936.9 | ¥ | 3,016.0 | ¥ | 3,110.1 | ||||||
|
|
|
|
|
|
|
|||||||
|
Foreign: |
||||||||||||
|
United States of America (1) |
192.8 | 426.4 | 219.0 | |||||||||
|
Europe |
290.5 | 256.5 | 155.0 | |||||||||
|
Asia/Oceania excluding Japan |
450.6 | 585.5 | 569.0 | |||||||||
|
Other areas (2) |
165.7 | 211.1 | 290.3 | |||||||||
|
|
|
|
|
|
|
|||||||
|
Total foreign |
1,099.6 | 1,479.5 | 1,233.3 | |||||||||
|
|
|
|
|
|
|
|||||||
|
Total |
¥ | 4,036.5 | ¥ | 4,495.5 | ¥ | 4,343.3 | ||||||
|
|
|
|
|
|
|
|||||||
|
Income (loss) before income tax expense (benefit) : |
||||||||||||
|
Domestic |
¥ | 498.1 | ¥ | 767.2 | ¥ | 1,157.8 | ||||||
|
|
|
|
|
|
|
|||||||
|
Foreign: |
||||||||||||
|
United States of America |
(91.8 | ) | 98.8 | (207.1 | ) | |||||||
|
Europe |
139.4 | 96.5 | 11.6 | |||||||||
|
Asia/Oceania excluding Japan |
227.4 | 317.1 | 253.8 | |||||||||
|
Other areas (2) |
76.8 | 136.3 | 204.3 | |||||||||
|
|
|
|
|
|
|
|||||||
|
Total foreign |
351.8 | 648.7 | 262.6 | |||||||||
|
|
|
|
|
|
|
|||||||
|
Total |
¥ | 849.9 | ¥ | 1,415.9 | ¥ | 1,420.4 | ||||||
|
|
|
|
|
|
|
|||||||
|
Net income (loss) attributable to Mitsubishi UFJ Financial Group |
||||||||||||
|
Domestic |
¥ | 163.3 | ¥ | 499.1 | ¥ | 859.8 | ||||||
|
|
|
|
|
|
|
|||||||
|
Foreign: |
||||||||||||
|
United States of America |
(119.8 | ) | 95.6 | (131.5 | ) | |||||||
|
Europe |
113.6 | 78.4 | 6.5 | |||||||||
|
Asia/Oceania excluding Japan |
192.8 | 275.0 | 149.4 | |||||||||
|
Other areas (2) |
66.3 | 121.0 | 131.2 | |||||||||
|
|
|
|
|
|
|
|||||||
|
Total foreign |
252.9 | 570.0 | 155.6 | |||||||||
|
|
|
|
|
|
|
|||||||
|
Total |
¥ | 416.2 | ¥ | 1,069.1 | ¥ | 1,015.4 | ||||||
|
|
|
|
|
|
|
|||||||
| Notes: |
| (1) | For the fiscal year ended March 31, 2012, Total revenue of United States of America includes an other-than-temporary impairment loss of Morgan Stanley’s common stock. See Note 2 to our consolidated financial statements included elsewhere in this Annual Report for further details of an other-than-temporary impairment loss on Morgan Stanley’s common stock. |
| (2) | Other areas primarily include Canada, Latin America, the Caribbean and the Middle East. |
Fiscal Year Ended March 31, 2014 Compared to Fiscal Year Ended March 31, 2013
Domestic net income attributable to Mitsubishi UFJ Financial Group for the fiscal year ended March 31, 2014 was ¥859.8 billion, compared to net income of ¥499.1 billion for the fiscal year ended March 31, 2013.
106
Table of Contents
This was mainly due to an increase in non-interest income, particularly fees and commissions on securities business, investment fund business and trust business, as our commercial banking, trust banking and securities subsidiaries took advantage of increased market activities in Japan.
Foreign net income attributable to Mitsubishi UFJ Financial Group for the fiscal year ended March 31, 2014 was ¥155.6 billion, a decrease of ¥414.4 billion from ¥570.0 billion for the fiscal year ended March 31, 2013. The decrease in foreign net income was mainly due to a decrease in net income in the U.S. region reflecting lower fair values of foreign currency denominated bonds related to the fair value option, including U.S. Treasury bonds, as interest rates rose in the United States where the FRB began tapering its quantitative monetary easing program.
Fiscal Year Ended March 31, 2013 Compared to Fiscal Year Ended March 31, 2012
Domestic net income attributable to Mitsubishi UFJ Financial Group for the fiscal year ended March 31, 2013 was ¥499.1 billion, compared to net income of ¥163.3 billion for the fiscal year ended March 31, 2012. This was mainly due to a decrease in tax expenses resulting from a change in valuation allowance and the realization of previously unrecognized tax benefits of subsidiaries, as well as a decrease in expenses relating to provision for credit losses recorded in our banking subsidiaries.
Foreign net income attributable to Mitsubishi UFJ Financial Group for the fiscal year ended March 31, 2013 was ¥570.0 billion, an increase of ¥317.1 billion from ¥252.9 billion for the fiscal year ended March 31, 2012. This increase reflected a ¥579.5 billion other-than-temporary impairment loss on our investment in Morgan Stanley’s common stock recorded in the fiscal year ended March 31, 2012. Exclusive of this item, foreign net income attributable to Mitsubishi UFJ Financial Group for the fiscal year ended March 31, 2013 would have decreased ¥262.4 billion mainly due to a decrease in interest income from U.S. government bonds reflecting a decrease in the average balance during the fiscal year ended March 31, 2013.
Effect of Change in Exchange Rates on Foreign Currency Translation
Fiscal Year Ended March 31, 2014 Compared to Fiscal Year Ended March 31, 2013
The average exchange rate for the fiscal year ended March 31, 2014 was ¥100.24 per U.S.$1.00, compared to the average exchange rate of ¥83.10 per U.S.$1.00 for the previous fiscal year. The average exchange rate for the conversion of the U.S. dollar financial statements of some of our foreign subsidiaries for the fiscal year ended December 31, 2013 was ¥97.65 per U.S.$1.00, compared to the average exchange rate for the fiscal year ended December 31, 2012 of ¥79.82 per U.S.$1.00.
The change in the average exchange rate of the Japanese yen against the U.S. dollar and other foreign currencies had the effect of increasing total revenue by ¥285.2 billion, net interest income by ¥171.0 billion and income before income tax expense by ¥115.4 billion, respectively, for the fiscal year ended March 31, 2014.
Fiscal Year Ended March 31, 2013 Compared to Fiscal Year Ended March 31, 2012
The average exchange rate for the fiscal year ended March 31, 2013 was ¥83.10 per U.S.$1.00, compared to the average exchange rate of ¥79.08 per U.S.$1.00 for the previous fiscal year. The average exchange rate for the conversion of the U.S. dollar financial statements of some of our foreign subsidiaries for the fiscal year ended December 31, 2012 was ¥79.82 per U.S.$1.00, compared to the average exchange rate for the fiscal year ended December 31, 2011 of ¥79.84 per U.S.$1.00.
The change in the average exchange rate of the Japanese yen against the U.S. dollar and other foreign currencies had the effect of increasing total revenue by ¥39.9 billion, net interest income by ¥22.3 billion and income before income tax expense by ¥26.6 billion, respectively, for the fiscal year ended March 31, 2013.
107
Table of Contents
| B. | Liquidity and Capital Resources |
Total Assets
Our total assets as of March 31, 2014 were ¥253.66 trillion, an increase of ¥23.10 trillion from ¥230.56 trillion as of March 31, 2013. The increase in total assets mainly reflected increases in interest-earning deposits in other banks of ¥12.39 trillion, net loans of ¥11.93 trillion, trading securities of ¥2.66 trillion, which were partially offset by decreases in securities available for sale of ¥6.95 trillion and trading derivative assets of ¥2.84 trillion.
We have allocated a substantial portion of our assets to international activities. As a result, reported amounts are affected by changes in the exchange rate of the Japanese yen against the U.S. dollar and other foreign currencies. Foreign assets are denominated primarily in U.S. dollars. The following table shows our total assets as of March 31, 2013 and 2014 by geographic region based principally on the domicile of the obligors:
| As of March 31, | ||||||||
| 2013 | 2014 | |||||||
| (in trillions) | ||||||||
|
Japan |
¥ | 152.00 | ¥ | 158.81 | ||||
|
Foreign: |
||||||||
|
United States |
30.73 | 40.63 | ||||||
|
Europe |
23.22 | 22.35 | ||||||
|
Asia/Oceania excluding Japan |
15.94 | 22.31 | ||||||
|
Other areas (1) |
8.67 | 9.56 | ||||||
|
|
|
|
|
|||||
|
Total foreign |
78.56 | 94.85 | ||||||
|
|
|
|
|
|||||
|
Total |
¥ | 230.56 | ¥ | 253.66 | ||||
|
|
|
|
|
|||||
| Note: |
| (1) | Other areas primarily include Canada, Latin America, the Caribbean and the Middle East. |
The Japanese yen amount of foreign currency-denominated assets increased as the relevant foreign exchange rates appreciated against the Japanese yen. For example, as of March 31, 2014 the exchange rate was ¥102.92 per U.S.$1.00, as compared with ¥94.05 as of March 31, 2013. This depreciation of the Japanese yen against the U.S. dollar and other foreign currencies between March 31, 2013 and March 31, 2014 resulted in a ¥9.66 trillion increase in the Japanese yen amount of our total assets as of March 31, 2014.
108
Table of Contents
Loan Portfolio
The following table sets forth our loans outstanding, before deduction of allowance for credit losses, as of March 31, 2013 and 2014, based on the industry segment loan classifications as defined by the Bank of Japan for regulatory reporting purposes, which is not necessarily based on the use of proceeds:
| As of March 31, | ||||||||
| 2013 | 2014 | |||||||
| (in billions) | ||||||||
|
Domestic: |
||||||||
|
Manufacturing |
¥ | 11,767.4 | ¥11,540.8 | |||||
|
Construction |
1,056.3 | 980.9 | ||||||
|
Real estate |
11,143.8 | 10,989.6 | ||||||
|
Services |
2,881.7 | 2,693.6 | ||||||
|
Wholesale and retail |
8,330.6 | 8,475.1 | ||||||
|
Banks and other financial institutions (1) |
3,622.0 | 3,985.1 | ||||||
|
Communication and information services |
1,314.5 | 1,443.5 | ||||||
|
Other industries |
12,191.5 | 13,496.7 | ||||||
|
Consumer |
17,132.3 | 16,921.3 | ||||||
|
|
|
|
|
|||||
|
Total domestic |
69,440.1 | 70,526.6 | ||||||
|
|
|
|
|
|||||
|
Foreign: |
||||||||
|
Governments and official institutions |
673.5 | 811.5 | ||||||
|
Banks and other financial institutions (1) |
7,259.0 | 9,792.2 | ||||||
|
Commercial and industrial |
18,738.8 | 24,533.8 | ||||||
|
Other |
2,601.3 | 4,872.4 | ||||||
|
|
|
|
|
|||||
|
Total foreign |
29,272.6 | 40,009.9 | ||||||
|
|
|
|
|
|||||
|
Unearned income, unamortized premium—net and deferred loan fees—net |
(122.5 | ) | (260.1 | ) | ||||
|
|
|
|
|
|||||
|
Total (2) |
¥ | 98,590.2 | ¥110,276.4 | |||||
|
|
|
|
|
|||||
| Notes: |
| (1) | Loans to the so-called “non-bank finance companies” are generally included in the “Banks and other financial institutions” category. Non-bank finance companies are primarily engaged in consumer lending, factoring and credit card businesses. |
| (2) | The above table includes loans held for sale of ¥35.3 billion and ¥46.6 billion as of March 31, 2013 and 2014, respectively, which are carried at the lower of cost or estimated fair value. |
Loans are our primary use of funds. The average loan balance accounted for 48.0% of total interest-earning assets for the fiscal year ended March 31, 2013 and 48.4% for the fiscal year ended March 31, 2014.
As of March 31, 2014, our total loans were ¥110.28 trillion, an increase of ¥11.69 trillion from ¥98.59 trillion as of March 31, 2013. Before unearned income, net unamortized premiums and net deferred loan fees, our loan balance as of March 31, 2014 consisted of ¥70.53 trillion of domestic loans and ¥40.01 trillion of foreign loans, while the loan balance as of March 31, 2013 consisted of ¥69.44 trillion of domestic loans and ¥29.27 trillion of foreign loans.
The domestic loan balance increased 2% between March 31, 2013 and March 31, 2014. The increase was mainly due to an increase in loans to government institutions, which are included in the other industries category. The loan demand from government institutions continued to increase because of the expanding government expenditures and reducing tax revenue. Although loans to the private sector also increased, there is less certainty in the loan demand in the domestic private sector as a result of the continuing negative effect of the regulatory reforms in the consumer finance sector that limits lending to consumers and severe competition among lenders in the residential mortgage loan market in Japan. Loans to construction businesses decreased mainly reflecting weakened demand for loans for apartment building construction projects. In addition, loans to borrowers in the services category declined mainly as a result of our sale of Nippon Business Lease Co., Ltd., a leasing subsidiary in Japan, to Hitachi Capital Corporation in April 2013.
109
Table of Contents
Foreign loans increased 37% between March 31, 2013 and March 31, 2014, mainly due to favorable economic fundamentals in the United States and an appreciation of the relevant foreign currencies against the Japanese yen. Foreign loans increased in all of the industry segments. By region, larger increases in the balances of outstanding loans were recorded in the Americas and in Asia, where Krungsri was newly consolidated in December 2013, compared to other regions, where uncertainty still remains over trends in loan demand.
Changes in the allowance for credit losses and provision (credit) for credit losses
The following table shows a summary of the changes in the allowance for credit losses by portfolio segment for the fiscal years ended March 31, 2013 and 2014:
|
Fiscal year ended March 31, 2013: |
Commercial | Residential | Card | MUAH | Total | |||||||||||||||
| (in billions) | ||||||||||||||||||||
|
Allowance for credit losses: |
||||||||||||||||||||
|
Balance at beginning of fiscal year |
¥ | 984.3 | ¥ | 171.8 | ¥ | 68.9 | ¥ | 60.5 | ¥ | 1,285.5 | ||||||||||
|
Provision for credit losses |
127.9 | 1.3 | 12.4 | 2.9 | 144.5 | |||||||||||||||
|
Charge-offs |
80.5 | 16.3 | 32.1 | 15.6 | 144.5 | |||||||||||||||
|
Recoveries |
23.4 | 0.4 | 2.7 | 5.2 | 31.7 | |||||||||||||||
|
|
|
|
|
|
|
|
|
|
|
|||||||||||
|
Net charge-offs |
57.1 | 15.9 | 29.4 | 10.4 | 112.8 | |||||||||||||||
|
Others (1) |
13.4 | — | — | 5.4 | 18.8 | |||||||||||||||
|
|
|
|
|
|
|
|
|
|
|
|||||||||||
|
Balance at end of fiscal year |
¥ | 1,068.5 | ¥ | 157.2 | ¥ | 51.9 | ¥ | 58.4 | ¥ | 1,336.0 | ||||||||||
|
|
|
|
|
|
|
|
|
|
|
|||||||||||
|
Fiscal year ended March 31, 2014: |
Commercial | Residential | Card | MUAH | Krungsri (2) | Total | ||||||||||||||||||
| (in billions) | ||||||||||||||||||||||||
|
Allowance for credit losses: |
||||||||||||||||||||||||
|
Balance at beginning of fiscal year |
¥ | 1,068.5 | ¥ | 157.2 | ¥ | 51.9 | ¥58.4 | ¥ | — | ¥ | 1,336.0 | |||||||||||||
|
Provision (credit) for credit losses |
(70.1 | ) | (36.0 | ) | 5.6 | (5.9) | — | (106.4 | ) | |||||||||||||||
|
Charge-offs |
158.9 | 4.6 | 20.1 | 7.5 | — | 191.1 | ||||||||||||||||||
|
Recoveries |
29.5 | 0.3 | 3.2 | 4.4 | — | 37.4 | ||||||||||||||||||
|
|
|
|
|
|
|
|
|
|
|
|
|
|||||||||||||
|
Net charge-offs |
129.4 | 4.3 | 16.9 | 3.1 | — | 153.7 | ||||||||||||||||||
|
Others (1) |
7.9 | 0.0 | — | 10.6 | — | 18.5 | ||||||||||||||||||
|
|
|
|
|
|
|
|
|
|
|
|
|
|||||||||||||
|
Balance at end of fiscal year |
¥ | 876.9 | ¥ | 116.9 | ¥ | 40.6 | ¥60.0 | ¥ | — | ¥ | 1,094.4 | |||||||||||||
|
|
|
|
|
|
|
|
|
|
|
|
|
|||||||||||||
| Notes: |
| (1) | Others are principally comprised of gains or losses from foreign exchange translation. |
| (2) | For the Krungsri segment, which is a new portfolio segment added following our acquisition of Krungsri in December 2013, the acquired loans were recorded at their fair values as of the acquisition date, and there have been no indications that allowance for credit loss is necessary for these loans since then. Therefore, no allowance for credit loss is stated in the above table. |
We recorded credit for credit losses of ¥106.4 billion for the fiscal year ended March 31, 2014, compared to provision for credit losses of ¥144.5 billion for the fiscal year ended March 31, 2013.
For the Commercial segment, ¥70.1 billion of credit for credit losses was recorded for the fiscal year ended March 31, 2014, compared to ¥127.9 billion of provision for credit losses for the previous fiscal year. This mainly reflected the upgrades of the internal borrower ratings of a substantial portion of large borrowers in the segment whose financial performance and prospects improved in light of favorable economic conditions in Japan, including a depreciating Japanese yen and rising stock prices.
For the Residential segment, ¥36.0 billion of credit for credit losses was recorded for the fiscal year ended March 31, 2014, compared to ¥1.3 billion of provision for credit losses for the previous fiscal year. This
110
Table of Contents
primarily reflected an overall improvement in the credit quality of the loan portfolio of the segment, including a decrease in the number of civil rehabilitation filings made by individual borrowers, as economic conditions were generally favorable in Japan.
For the Card segment, ¥5.6 billion of provision for credit losses was recorded for the fiscal year ended March 31, 2014, an improvement of ¥6.8 billion compared to the previous fiscal year. This primarily reflected an overall improvement in the credit quality of the loan portfolio of the segment, partly due to our implementation of stricter borrower screening under regulatory reforms in the consumer finance industry.
For the MUAH segment, ¥5.9 billion of credit for credit losses was recorded for the fiscal year ended March 31, 2014, compared to ¥2.9 billion of provision for credit losses for the previous fiscal year. This was due to a general improvement in the credit quality of MUAH’s borrowers, reflecting improvements in U.S. economic conditions, including higher stock and real estate prices.
Charge-offs for the fiscal year ended March 31, 2014 were ¥191.1 billion, an increase of ¥46.6 billion from ¥144.5 billion for the fiscal year ended March 31, 2013. Charge-offs increased ¥78.4 billion in the Commercial segment, primarily reflecting specific borrower conditions, despite an overall improvement in the credit quality of borrowers in the segment. Among other factors, the increase in charge-offs in the Commercial segment reflected a charge-off of a portion of the loan outstanding to a large borrower in the manufacturing category to assist the borrower in improving its financial performance and repayment ability. In addition, we charged off loans to a larger number of small and medium-sized borrowers that continued to face challenging financial conditions and were considered unable to repay their loans. On the other hand, charge-offs decreased in each of the Residential, Card and MUAH segments primarily due to improved customer credit quality.
Charge-offs for the fiscal years ended March 31, 2013 and 2014 in the Commercial segment also reflected sales of nonperforming loans amounting to ¥0.4 billion and ¥16.2 billion, respectively. BTMU and MUTB actively disposed of nonperforming loans in recent periods in order to improve the credit quality of their respective loan portfolios. See Note 4 to our consolidated financial statements included elsewhere in this Annual Report.
The total allowance for credit losses as of March 31, 2014 was ¥1,094.4 billion, a decrease of ¥241.6 billion from ¥1,336.0 billion as of March 31, 2013, as we recorded credit for credit losses of ¥106.4 billion and net charge-offs of ¥153.7 billion for the fiscal year ended March 31, 2014. For further information on our allowance for credit losses, see “—Allowance for credit losses” below.
Allowance policy
Our credit rating system is closely linked to the risk grading standards set by the Japanese regulatory authorities for asset evaluation and assessment, and is used as a basis for establishing the allowance for credit losses and charge-offs. The categorization is based on conditions that may affect the ability of borrowers to service their debt, such as current financial condition and results of operations, historical payment experience, credit documentation, other public information and current trends.
We have divided our allowance for loan losses into five portfolio segments—Commercial, Residential, Card, MUAH and Krungsri.
For the Commercial, MUAH and Krungsri segments, our allowance for credit losses primarily consists of allocated allowances. The allocated allowances consist of (1) an allowance for individual loans specifically identified for evaluation, (2) an allowance for large groups of smaller-balance homogeneous loans, and (3) a formula allowance. The allocated allowance within the Commercial segment also includes an allowance for country risk exposure. The allowance for country risk exposure within the Commercial segment covers transfer risk which is not specifically covered by other types of allowances. Both the allowance for country risk exposure
111
Table of Contents
and the formula allowance are provided for performing loans that are not subject to either the allowance for individual loans specifically identified for evaluation or the allowance for large groups of smaller-balance homogeneous loans. The allowance for credit losses within the MUAH segment also includes an unallocated allowance which captures losses that are attributable to economic events in various industry or geographic sectors whose impact on our loan portfolios in these segments have occurred but have yet to be recognized in the allocated allowance. For the Residential and Card segments, the loans are smaller-balance homogeneous loans that are pooled by the risk ratings based on the number of delinquencies. For all portfolio segments, key elements relating to the policies and discipline used in determining the allowance for credit losses are our credit classification and related borrower categorization process. Each of these components is determined based on estimates subject to change when actual events occur.
For more information on our credit and borrower ratings, see “Item 11. Quantitative and Qualitative Disclosures about Credit, Market and Other Risk—Credit Risk Management.”
For more information on our methodologies used to estimate the allowance for each portfolio segment, see “Summary of Significant Accounting Policies” in Note 1 to our consolidated financial statements included elsewhere in this Annual Report, and “—Critical Accounting Estimates—Allowance for Credit Losses” above.
During the fiscal year ended March 31, 2014, there was no significant change in our general allowance policy, which affected our allowance for credit losses for the period, resulting from directives, advice or counsel from governmental or regulatory bodies.
Allowance for credit losses
Allowance for credit losses and recorded investment in loans by portfolio segment as of March 31, 2013 and 2014 are shown below:
|
As of March 31, 2013: |
Commercial | Residential | Card | MUAH | Total | |||||||||||||||
| (in billions) | ||||||||||||||||||||
|
Allowance for credit losses: |
||||||||||||||||||||
|
Individually evaluated for impairment |
¥ | 784.8 | ¥ | 117.6 | ¥ | 37.9 | ¥ | 3.6 | ¥ | 943.9 | ||||||||||
|
Collectively evaluated for impairment |
248.8 | 37.4 | 13.8 | 54.7 | 354.7 | |||||||||||||||
|
Loans acquired with deteriorated credit quality |
34.9 | 2.2 | 0.2 | 0.1 | 37.4 | |||||||||||||||
|
|
|
|
|
|
|
|
|
|
|
|||||||||||
|
Total |
¥ | 1,068.5 | ¥ | 157.2 | ¥ | 51.9 | ¥ | 58.4 | ¥ | 1,336.0 | ||||||||||
|
|
|
|
|
|
|
|
|
|
|
|||||||||||
|
Loans: |
||||||||||||||||||||
|
Individually evaluated for impairment |
¥ | 1,677.2 | ¥ | 309.4 | ¥ | 123.5 | ¥ | 54.2 | ¥ | 2,164.3 | ||||||||||
|
Collectively evaluated for impairment |
75,771.9 | 14,874.6 | 534.9 | 5,099.4 | 96,280.8 | |||||||||||||||
|
Loans acquired with deteriorated credit quality |
101.3 | 17.2 | 13.2 | 100.6 | 232.3 | |||||||||||||||
|
|
|
|
|
|
|
|
|
|
|
|||||||||||
|
Total (1) |
¥ | 77,550.4 | ¥ | 15,201.2 | ¥ | 671.6 | ¥ | 5,254.2 | ¥ | 98,677.4 | ||||||||||
|
|
|
|
|
|
|
|
|
|
|
|||||||||||
112
Table of Contents
|
As of March 31, 2014: |
Commercial | Residential | Card | MUAH | Krungsri (2) | Total | ||||||||||||||||||
| (in billions) | ||||||||||||||||||||||||
|
Allowance for credit losses: |
||||||||||||||||||||||||
|
Individually evaluated for impairment |
¥ | 640.5 | ¥ | 69.6 | ¥ | 29.2 | ¥ | 4.1 | ¥ | — | ¥ | 743.4 | ||||||||||||
|
Collectively evaluated for impairment |
209.1 | 45.4 | 11.3 | 55.8 | — | 321.6 | ||||||||||||||||||
|
Loans acquired with deteriorated credit quality |
27.3 | 1.9 | 0.1 | 0.1 | — | 29.4 | ||||||||||||||||||
|
|
|
|
|
|
|
|
|
|
|
|
|
|||||||||||||
|
Total |
¥ | 876.9 | ¥ | 116.9 | ¥ | 40.6 | ¥ | 60.0 | ¥ | — | ¥ | 1,094.4 | ||||||||||||
|
|
|
|
|
|
|
|
|
|
|
|
|
|||||||||||||
|
Loans: |
||||||||||||||||||||||||
|
Individually evaluated for impairment |
¥ | 1,459.3 | ¥ | 211.8 | ¥ | 102.9 | ¥ | 64.0 | ¥ | — | ¥ | 1,838.0 | ||||||||||||
|
Collectively evaluated for impairment |
83,052.5 | 14,751.2 | 493.0 | 7,060.6 | 3,025.2 | 108,382.5 | ||||||||||||||||||
|
Loans acquired with deteriorated credit quality |
75.7 | 15.3 | 12.7 | 115.0 | 50.7 | 269.4 | ||||||||||||||||||
|
|
|
|
|
|
|
|
|
|
|
|
|
|||||||||||||
|
Total (1) |
¥ | 84,587.5 | ¥ | 14,978.3 | ¥ | 608.6 | ¥ | 7,239.6 | ¥ | 3,075.9 | ¥ | 110,489.9 | ||||||||||||
|
|
|
|
|
|
|
|
|
|
|
|
|
|||||||||||||
Notes:
| (1) | Total loans in the above table do not include loans held for sale and represent balances without adjustments in relation to unearned income, unamortized premiums and deferred loan fees. |
| (2) | For the Krungsri segment, acquired loans were recorded at their fair values as of the acquisition date, and there have been no indications that allowance for credit loss is necessary for these loans since then. Therefore, no allowance for credit loss is stated in the above table. |
The total allowance for credit losses as of March 31, 2014 was ¥1,094.4 billion, a decrease of ¥241.6 billion from ¥1,336.0 billion as of March 31, 2013. This decrease mainly reflected charge-offs, and reversal of allowance for credit losses due to an overall improvement in the credit quality of our loan portfolio. In the Commercial segment, allowance for credit losses decreased ¥191.6 billion to ¥876.9 billion, reflecting the upgrades of the internal borrower ratings of a substantial portion of large borrowers in the segment whose financial performance and prospects improved, and the charge-offs as discussed above. In the Residential segment, allowance for credit losses decreased ¥40.3 billion to ¥116.9 billion primarily due to a decrease in allowance for individually-evaluated impaired loans in the Residential segment as the improved borrower financial conditions allowed us to reset the terms of a substantial portion of housing loans so that the terms of such loans were equivalent to their respective terms prior to the modifications of the original loan terms. In the Card segment, allowance for credit losses decreased ¥11.3 billion to ¥40.6 billion due to a general improvement in customer credit quality. In the MUAH segment, allowance for credit losses increased ¥1.6 billion to ¥60.0 billion due to an increase in newly extended loans, partially offset by an overall improvement in the credit quality of its loan portfolio. For more information, see “—Nonaccrual loans and trouble debt restructurings,” “—Impaired loans and impairment allowance” and “—Credit quality indicator” below.
The total allowance for credit losses represented 0.99% of our total loan portfolio as of March 31, 2014, a decrease of 0.37 percentage points from 1.36% as of March 31, 2013. By segment, the ratio of total allowance to the total loan balance as of March 31, 2014 was 1.04% in the Commercial segment, 0.78% in the Residential segment, 6.68% in the Card segment and 0 .83% in the MUAH segment, representing a decrease of 0.34, 0.25, 1.04 and 0.28 percentage points in the Commercial, Residential, Card and MUAH segments, respectively, compared to the ratio as of March 31, 2013. The decreases in the Commercial, Residential and Card segments reflected the decreases in allowance for credit losses, and the decrease in the MUAH segment reflected the increase in the loan balance.
113
Table of Contents
Allowance for off-balance sheet credit instruments
In addition to the allowance for credit losses in the loan portfolio, we maintain an allowance for credit losses on off-balance sheet credit instruments, including credit commitments, guarantees and standby letters of credit. This allowance is included in other liabilities. With regards to the specific allocated allowance for specifically identified credit exposures and the allocated formula allowance, we apply the same methodology that we use in determining the allowance for loan credit losses. The allowance for credit losses on off-balance sheet credit instruments was ¥69.9 billion as of March 31, 2014, an increase of ¥14.0 billion from ¥55.9 billion as of March 31, 2013.
Sales of loans
The following table presents comparative data relating to the principal amount of nonperforming loans sold and reversal of allowance for credit losses:
|
Principal
amount of loans (1) |
Allowance
for credit losses (2) |
Loans,
net of allowance |
Reversal of
allowance for credit losses |
|||||||||||||
| (in billions) | ||||||||||||||||
|
For the fiscal year ended March 31, 2013 |
¥ | 37.9 | ¥ | 3.5 | ¥ | 34.4 | ¥ | (3.1 | ) | |||||||
|
For the fiscal year ended March 31, 2014 |
¥ | 38.7 | ¥ | 22.0 | ¥ | 16.7 | ¥ | (5.8 | ) | |||||||
Notes:
| (1) | Represents principal amount after the deduction of charge-offs made before the sales of nonperforming loans. |
| (2) | Represents allowance for credit losses at the latest balance-sheet date. |
Through the sale of nonperforming loans to third parties, additional provisions or gains may arise from factors such as a change in the credit quality of the borrowers or the value of the underlying collateral subsequent to the prior reporting date, and the risk appetite and investment policy of the purchasers.
Due to the inherent uncertainty of factors that may affect negotiated prices, which reflect the borrowers’ financial condition and the value of underlying collateral, the fact that we recorded no additional cost during a reported period is not necessarily indicative of the results that we may record in the future.
In connection with the sale of loans, including performing loans, we recorded net gains of ¥14.3 billion and net gains of ¥19.0 billion for the fiscal years ended March 31, 2013 and 2014, respectively.
Nonaccrual loans and troubled debt restructurings
We consider a loan to be a nonaccrual loan when substantial doubt exists as to the full and timely payment of interest on, or repayment of, the principal of the loan, which is a borrower condition that generally corresponds to borrowers in categories 13 and below in our internal rating system (which corresponds to “Likely to become Bankrupt,” “Virtually Bankrupt” and “Bankrupt or de facto Bankrupt” status under Japanese banking regulations). Substantially all nonaccrual loans are also impaired loans. Loans are also placed in nonaccrual status when principal or interest is contractually past due one month or more with respect to loans within all classes of the Commercial segment, three months or more with respect to loans within the Card, MUAH and Krungsri segments, and six months or more with respect to loans within the Residential segment.
We modify certain loans in conjunction with our loss-mitigation activities. Through these modifications, concessions are granted to a borrower who is experiencing financial difficulty, generally in order to minimize economic loss, to avoid foreclosure or repossession of collateral, and to ultimately maximize payments received from the borrower. The concessions granted vary by portfolio segment, by program, and by borrower-specific characteristics, and may include interest rate reductions, term extensions, payment deferrals, and partial principal forgiveness. Loan modifications that represent concessions made to borrowers who are experiencing financial difficulties are identified as troubled debt restructurings, or TDRs.
114
Table of Contents
Generally, accruing loans that are modified in a TDR remain as accruing loans subsequent to the modification, and nonaccrual loans remain as nonaccrual. However, if a nonaccrual loan has been restructured as a TDR and the borrower is not delinquent under the restructured terms, and demonstrates that its financial condition has improved, we may reclassify the loan to accrual status. This determination is generally performed at least once a year through a detailed internal credit rating review process. Although we have not defined any minimum period to qualify for an upgrade, it is not common for a borrower to be able to demonstrate that its business problems have been resolved or can soon be resolved within a short period of time following a restructuring. If the borrower is upgraded to category 12 or higher in our internal rating system (which corresponds to “Normal” and “Close Watch” status under the Japanese banking regulations), a TDR would be reclassified to accrual status. Once a restructured nonaccrual loan is deemed to be a TDR, we will continue to designate the loan as a TDR even if the loan is reclassified to accrual status.
A loan that has been modified into a TDR is considered to be impaired until it matures, is repaid, or is otherwise liquidated, regardless of whether the borrower performs under the modified terms. Because loans modified as TDRs are considered to be impaired, these loans are measured for impairment using our established asset-specific allowance methodology, which considers the expected default rates for the modified loans.
For more information on our credit and borrower ratings, see “Item 11. Quantitative and Qualitative Disclosures about Credit, Market and Other Risk—Credit Risk Management.”
For a more information on our TDRs, see Note 4 to our consolidated financial statements included elsewhere in this Annual Report.
The following table shows information about the nonaccrual status of loans by class as of March 31, 2013 and 2014:
| As of March 31, | ||||||||
| 2013 | 2014 | |||||||
| (in billions) | ||||||||
|
Commercial |
||||||||
|
Domestic |
¥ | 911.7 | ¥ | 737.9 | ||||
|
Manufacturing |
212.0 | 167.8 | ||||||
|
Construction |
37.4 | 30.1 | ||||||
|
Real estate |
185.6 | 142.0 | ||||||
|
Services |
86.0 | 72.1 | ||||||
|
Wholesale and retail |
249.2 | 211.8 | ||||||
|
Banks and other financial institutions |
14.0 | 7.2 | ||||||
|
Communication and information services |
31.9 | 24.9 | ||||||
|
Other industries |
42.5 | 36.0 | ||||||
|
Consumer |
53.1 | 46.0 | ||||||
|
Foreign-excluding MUAH and Krungsri |
98.1 | 82.6 | ||||||
|
Residential |
130.8 | 111.2 | ||||||
|
Card |
88.0 | 72.5 | ||||||
|
MUAH |
43.7 | 46.6 | ||||||
|
Krungsri |
— | 26.0 | ||||||
|
|
|
|
|
|||||
|
Total (1) |
¥ | 1,272.3 | ¥ | 1,076.8 | ||||
|
|
|
|
|
|||||
| Note: |
| (1) | The above table does not include loans held for sale of ¥0.8 billion and nil as of March 31, 2013 and 2014, respectively, and loans acquired with deteriorated credit quality of ¥22.0 billion and ¥38.7 billion as of March 31, 2013 and 2014, respectively. |
Total nonaccrual loans were ¥1,076.8 billion as of March 31, 2014, a decrease of ¥195.5 billion from ¥1,272.3 billion as of March 31, 2013. Domestic nonaccrual loans in the Commercial segment decreased ¥173.8 billion between March 31, 2013 and March 31, 2014, reflecting a ¥44.2 billion decrease mainly resulting from
115
Table of Contents
the reclassification from nonaccrual to accrual loan of the loan outstanding to a large borrower in the manufacturing category after a portion of the loan outstanding to the borrower was written off to assist the borrower in improving its financial performance and repayment ability, and a payment was received from the borrower. Additionally, the loans outstanding to a substantial portion of large borrowers in the manufacturing category became current, and the internal borrower ratings of such borrowers were thus upgraded. Nonaccrual loans to borrowers in the real estate category in the domestic Commercial segment decreased ¥43.6 billion as we were able to collect on the loans to some large borrowers. Nonaccrual loans to borrowers in the wholesale and retail category in the domestic Commercial segment also decreased ¥37.4 billion as the loans outstanding to a substantial portion of medium and small-sized borrowers became current, and the internal borrower ratings of such borrowers were thus upgraded, and as we had charge-offs of loans to a larger number of small borrowers that continued to face challenging financial conditions and were considered unable to repay their loans. Foreign nonaccrual loans in the Commercial segment excluding MUAH and Krungsri decreased ¥15.5 billion between March 31, 2013 and March 31, 2014 mainly due to sales of assets by a leasing subsidiary of BTMU. Nonaccrual loans in the Residential segment decreased ¥19.6 billion primarily because the improved borrower financial conditions allowed us to reset the terms of a substantial portion of housing loans so that the terms of such loans were equivalent to their respective terms prior to the modifications of the original loan terms. Nonaccrual loans in the Card segment decreased ¥15.5 billion mainly due to our implementation of stricter borrower screening under regulatory reforms in the consumer finance industry. Nonaccrual loans in the MUAH segment increased ¥2.9 billion primarily due to MUAH’s acquisition of PB Capital Corporation’s commercial mortgage loan portfolio.
The following table shows information about outstanding recorded investment balances of TDRs by class as of March 31, 2013 and 2014:
| As of March 31, | ||||||||
| 2013 | 2014 | |||||||
| (in billions) | ||||||||
|
Commercial (1) |
||||||||
|
Domestic |
¥ | 567.9 | ¥ | 528.1 | ||||
|
Manufacturing |
247.1 | 257.0 | ||||||
|
Construction |
15.1 | 13.7 | ||||||
|
Real estate |
54.2 | 64.0 | ||||||
|
Services |
74.8 | 57.5 | ||||||
|
Wholesale and retail |
123.0 | 95.8 | ||||||
|
Banks and other financial institutions |
1.3 | 1.2 | ||||||
|
Communication and information services |
21.3 | 12.0 | ||||||
|
Other industries |
10.3 | 10.5 | ||||||
|
Consumer |
20.8 | 16.4 | ||||||
|
Foreign-excluding MUAH and Krungsri |
103.2 | 114.3 | ||||||
|
Residential (1) |
178.6 | 99.3 | ||||||
|
Card (2) |
124.4 | 103.6 | ||||||
|
MUAH (2) |
52.8 | 62.4 | ||||||
|
Krungsri (2)(3) |
— | — | ||||||
|
|
|
|
|
|||||
|
Total |
¥ | 1,026.9 | ¥ | 907.7 | ||||
|
|
|
|
|
|||||
| Notes: |
| (1) | TDRs for the Commercial and Residential segments include accruing loans with concessions granted, and do not include nonaccrual loans with concessions granted. |
| (2) | TDRs for the Card, MUAH and Krungsri segments include accrual and nonaccrual loans. Included in the outstanding recorded investment balances as of March 31, 2013 and 2014 are nonaccrual TDRs as follows: ¥63.2 billion and ¥51.8 billion—Card; ¥18.1 billion and ¥23.7 billion—MUAH, respectively. |
| (3) | For the Krungsri segment, acquired loans were recorded at their fair values as of the acquisition date, and there have been no indications that allowance for credit loss is necessary for these loans since then. Therefore, no TDRs are stated in the above table. |
Total TDRs were ¥907.7 billion as of March 31, 2014, a decrease of ¥119.2 billion from ¥1,026.9 billion as of March 31, 2013. For the fiscal years ended March 31, 2013 and 2014, extensions of the stated maturity dates
116
Table of Contents
were the primary type of concessions made to loans in the Commercial and Residential segments, whereas reductions in the stated interest rates and payment deferrals were the primary type of concessions made to loans in the Card and MUAH segments.
In the above table, TDRs for the Commercial and Residential segments include accruing loans with concessions granted, and do not include nonaccrual loans with concessions granted, whereas TDRs for the Card, MUAH and Krungsri segments include accrual and nonaccrual loans.
TDRs in the domestic Commercial segment decreased ¥39.8 billion primarily attributable to decreases in TDRs in the services and wholesale and retail categories mainly because a portion of the loans outstanding to small and medium-sized borrowers were repaid as their financial condition improved or as their loans matured. Because TDRs for the domestic Commercial segment do not include nonaccrual loans with concessions granted, these decreases were partially offset by the addition to the amount of TDRs disclosed for the manufacturing category primarily resulting from the reclassification from nonaccrual loan to accrual TDR of the loan outstanding to a large borrower as the loan became current. The decreases in TDRs were also offset in part by an increase in TDRs in the real estate category primarily resulting from modifications made to the loans to some large borrowers.
TDRs in the Residential segment decreased ¥79.3 billion as the improved borrower financial conditions allowed us to reset the terms of a substantial portion of housing loans so that the terms of such loans were equivalent to their respective terms prior to the modifications of the original loan terms. TDRs in the Card segment decreased ¥20.8 billion mainly due to our implementation of stricter borrower screening under regulatory reforms in the consumer finance industry. TDRs in the MUAH segment increased ¥9.6 billion as the loan balance increased.
Impaired loans and impairment allowance
Impaired loans primarily include nonaccrual loans and TDRs. We consider a loan to be impaired when, based on current information and events, it is probable that we will be unable to collect all of the scheduled payments of interest on, and repayment of, the principal of the loan when due according to the contractual terms of the loan agreement.
117
Table of Contents
The following table shows information about impaired loans by class as of March 31, 2013 and 2014:
| As of March 31, 2013 | ||||||||||||||||||||
| Recorded Loan Balance | ||||||||||||||||||||
|
Requiring
an Impairment Allowance |
Not Requiring
an Impairment Allowance (1) |
Total (2) |
Unpaid
Principal Balance |
Related
Allowance |
||||||||||||||||
| (in billions) | ||||||||||||||||||||
|
Commercial |
||||||||||||||||||||
|
Domestic |
¥ | 1,158.9 | ¥ | 318.0 | ¥ | 1,476.9 | ¥ | 1,537.2 | ¥ | 662.4 | ||||||||||
|
Manufacturing |
400.9 | 55.8 | 456.7 | 475.9 | 221.1 | |||||||||||||||
|
Construction |
35.6 | 16.9 | 52.5 | 59.4 | 22.6 | |||||||||||||||
|
Real estate |
139.2 | 100.6 | 239.8 | 247.7 | 55.3 | |||||||||||||||
|
Services |
122.8 | 37.8 | 160.6 | 166.5 | 67.2 | |||||||||||||||
|
Wholesale and retail |
309.9 | 62.3 | 372.2 | 380.3 | 209.7 | |||||||||||||||
|
Banks and other financial institutions |
15.2 | 0.1 | 15.3 | 17.4 | 8.0 | |||||||||||||||
|
Communication and information services |
40.2 | 13.0 | 53.2 | 55.0 | 23.7 | |||||||||||||||
|
Other industries |
43.0 | 9.8 | 52.8 | 53.8 | 33.5 | |||||||||||||||
|
Consumer |
52.1 | 21.7 | 73.8 | 81.2 | 21.3 | |||||||||||||||
|
Foreign-excluding MUAH |
199.9 | 0.3 | 200.2 | 200.5 | 122.4 | |||||||||||||||
|
Loans acquired with deteriorated credit quality |
30.9 | 0.1 | 31.0 | 47.9 | 9.9 | |||||||||||||||
|
Residential |
300.2 | 13.8 | 314.0 | 363.5 | 118.8 | |||||||||||||||
|
Card |
123.6 | 0.8 | 124.4 | 139.2 | 37.9 | |||||||||||||||
|
MUAH |
31.3 | 23.0 | 54.3 | 60.7 | 3.6 | |||||||||||||||
|
|
|
|
|
|
|
|
|
|
|
|||||||||||
|
Total (3) |
¥ | 1,844.8 | ¥ | 356.0 | ¥ | 2,200.8 | ¥ | 2,349.0 | ¥ | 955.0 | ||||||||||
|
|
|
|
|
|
|
|
|
|
|
|||||||||||
| As of March 31, 2014 | ||||||||||||||||||||
| Recorded Loan Balance |
Unpaid
Principal Balance |
Related
Allowance |
||||||||||||||||||
|
Requiring
an Impairment Allowance |
Not Requiring
an Impairment Allowance (1) |
Total (2) | ||||||||||||||||||
| (in billions) | ||||||||||||||||||||
|
Commercial |
||||||||||||||||||||
|
Domestic |
¥ | 1,006.3 | ¥ | 257.2 | ¥ | 1,263.5 | ¥ | 1,312.3 | ¥ | 544.3 | ||||||||||
|
Manufacturing |
368.9 | 55.0 | 423.9 | 431.7 | 181.4 | |||||||||||||||
|
Construction |
30.5 | 13.3 | 43.8 | 45.3 | 18.7 | |||||||||||||||
|
Real estate |
141.2 | 63.7 | 204.9 | 212.4 | 52.8 | |||||||||||||||
|
Services |
102.0 | 27.3 | 129.3 | 139.3 | 54.5 | |||||||||||||||
|
Wholesale and retail |
249.0 | 58.6 | 307.6 | 317.6 | 169.5 | |||||||||||||||
|
Banks and other financial institutions |
8.3 | 0.1 | 8.4 | 8.4 | 7.0 | |||||||||||||||
|
Communication and information services |
25.4 | 11.5 | 36.9 | 39.3 | 16.5 | |||||||||||||||
|
Other industries |
36.8 | 9.6 | 46.4 | 47.9 | 26.9 | |||||||||||||||
|
Consumer |
44.2 | 18.1 | 62.3 | 70.4 | 17.0 | |||||||||||||||
|
Foreign-excluding MUAH and Krungsri |
193.3 | 2.4 | 195.7 | 195.9 | 96.2 | |||||||||||||||
|
Loans acquired with deteriorated credit quality |
18.8 | 0.2 | 19.0 | 32.1 | 6.1 | |||||||||||||||
|
Residential |
203.6 | 11.6 | 215.2 | 255.7 | 70.4 | |||||||||||||||
|
Card |
102.9 | 0.7 | 103.6 | 115.8 | 29.2 | |||||||||||||||
|
MUAH |
39.6 | 24.4 | 64.0 | 71.2 | 4.1 | |||||||||||||||
|
Krungsri (4) |
— | — | — | — | — | |||||||||||||||
|
|
|
|
|
|
|
|
|
|
|
|||||||||||
|
Total (3) |
¥ | 1,564.5 | ¥ | 296.5 | ¥ | 1,861.0 | ¥ | 1,983.0 | ¥ | 750.3 | ||||||||||
|
|
|
|
|
|
|
|
|
|
|
|||||||||||
118
Table of Contents
| Notes: |
| (1) | These loans do not require an allowance for credit losses because the fair values of the impaired loans equal or exceed the recorded investments in the loans. |
| (2) | Included in impaired loans as of March 31, 2013 and 2014 are accrual TDRs as follows: ¥671.1 billion and ¥642.4 billion—Commercial; ¥178.6 billion and ¥99.4 billion—Residential; ¥61.2 billion and ¥51.8 billion—Card; and ¥34.8 billion and ¥38.7 billion—MUAH, respectively. |
| (3) | In addition to impaired loans presented in the above table, there were loans held for sale that were impaired of ¥0.8 billion and nil as of March 31, 2013 and 2014, respectively. |
| (4) | For the Krungsri segment, which is a new portfolio segment added following our acquisition of Krungsri in December 2013, the acquired loans were recorded at their fair values as of the acquisition date, and there have been no indications that allowance for credit loss is necessary for these loans since then. Therefore, no impaired loans were stated in the above table. |
The following table shows information regarding the average recorded loan balance and recognized interest income on impaired loans for the fiscal years ended March 31, 2013 and 2014:
| Fiscal years ended March 31, | ||||||||||||||||
| 2013 | 2014 | |||||||||||||||
|
Average
Recorded Loan Balance |
Recognized
Interest Income |
Average
Recorded Loan Balance |
Recognized
Interest Income |
|||||||||||||
| (in billions) | ||||||||||||||||
|
Commercial |
||||||||||||||||
|
Domestic |
¥ | 1,414.3 | ¥ | 24.0 | ¥ | 1,359.6 | ¥ | 23.3 | ||||||||
|
Manufacturing |
418.4 | 7.0 | 430.4 | 7.0 | ||||||||||||
|
Construction |
54.7 | 1.2 | 47.8 | 0.9 | ||||||||||||
|
Real estate |
198.1 | 2.7 | 228.1 | 3.5 | ||||||||||||
|
Services |
170.0 | 3.2 | 140.6 | 2.8 | ||||||||||||
|
Wholesale and retail |
376.0 | 6.2 | 339.6 | 5.9 | ||||||||||||
|
Banks and other financial institutions |
11.5 | 0.2 | 10.7 | 0.2 | ||||||||||||
|
Communication and information services |
51.9 | 1.0 | 44.4 | 0.9 | ||||||||||||
|
Other industries |
58.1 | 1.3 | 49.6 | 1.0 | ||||||||||||
|
Consumer |
75.6 | 1.2 | 68.4 | 1.1 | ||||||||||||
|
Foreign-excluding MUAH and Krungsri |
172.5 | 2.5 | 187.7 | 2.8 | ||||||||||||
|
Loans acquired with deteriorated credit quality |
33.0 | 2.0 | 30.1 | 1.7 | ||||||||||||
|
Residential |
320.2 | 6.0 | 264.3 | 5.1 | ||||||||||||
|
Card |
135.6 | 6.5 | 114.0 | 5.2 | ||||||||||||
|
MUAH |
46.9 | 1.8 | 60.9 | 3.5 | ||||||||||||
|
Krungsri |
— | — | — | — | ||||||||||||
|
|
|
|
|
|
|
|
|
|||||||||
|
Total |
¥ | 2,122.5 | ¥ | 42.8 | ¥ | 2,016.6 | ¥ | 41.6 | ||||||||
|
|
|
|
|
|
|
|
|
|||||||||
119
Table of Contents
Credit quality indicator
The following table sets forth credit quality indicators of loans by class as of March 31, 2013 and 2014:
|
As of March 31, 2013: |
Normal |
Close
Watch |
Likely to become
Bankrupt or Legally/ Virtually Bankrupt |
Total (1) | ||||||||||||
| (in billions) | ||||||||||||||||
|
Commercial |
||||||||||||||||
|
Domestic |
¥ | 48,099.4 | ¥ | 4,476.8 | ¥ | 911.9 | ¥ | 53,488.1 | ||||||||
|
Manufacturing |
10,062.4 | 1,481.4 | 212.0 | 11,755.8 | ||||||||||||
|
Construction |
797.5 | 220.5 | 37.4 | 1,055.4 | ||||||||||||
|
Real estate |
9,570.1 | 898.6 | 185.7 | 10,654.4 | ||||||||||||
|
Services |
2,417.7 | 362.7 | 86.0 | 2,866.4 | ||||||||||||
|
Wholesale and retail |
7,297.2 | 748.0 | 249.3 | 8,294.5 | ||||||||||||
|
Banks and other financial institutions |
3,239.7 | 367.2 | 14.0 | 3,620.9 | ||||||||||||
|
Communication and information services |
1,183.3 | 98.7 | 31.9 | 1,313.9 | ||||||||||||
|
Other industries |
11,951.4 | 192.3 | 42.6 | 12,186.3 | ||||||||||||
|
Consumer |
1,580.1 | 107.4 | 53.0 | 1,740.5 | ||||||||||||
|
Foreign-excluding MUAH |
22,341.0 | 1,530.2 | 89.8 | 23,961.0 | ||||||||||||
|
Loans acquired with deteriorated credit quality |
31.0 | 52.0 | 18.3 | 101.3 | ||||||||||||
|
|
|
|
|
|
|
|
|
|||||||||
|
Total |
¥ | 70,471.4 | ¥ | 6,059.0 | ¥ | 1,020.0 | ¥ | 77,550.4 | ||||||||
|
|
|
|
|
|
|
|
|
|||||||||
| Accrual | Nonaccrual | Total (1) | ||||||||||
| (in billions) | ||||||||||||
|
Residential |
¥ | 15,067.8 | ¥ | 133.4 | ¥ | 15,201.2 | ||||||
|
Card |
¥ | 582.5 | ¥ | 89.1 | ¥ | 671.6 | ||||||
|
Credit Quality Based on
the Number of Delinquencies |
Credit Quality Based on
Internal Credit Ratings |
Total (1)(2) | ||||||||||||||||||||||
| Accrual | Nonaccrual | Pass |
Special
Mention |
Classified | ||||||||||||||||||||
| (in billions) | ||||||||||||||||||||||||
|
MUAH |
¥ | 2,260.8 | ¥ | 31.3 | ¥ | 2,745.4 | ¥ | 69.5 | ¥ | 80.4 | ¥ | 5,187.4 | ||||||||||||
|
As of March 31, 2014: |
Normal |
Close
Watch |
Likely to become
Bankrupt or Legally/Virtually Bankrupt |
Total (1) | ||||||||||||
| (in billions) | ||||||||||||||||
|
Commercial |
||||||||||||||||
|
Domestic |
¥ | 50,608.9 | ¥ | 3,549.1 | ¥ | 737.7 | ¥ | 54,895.7 | ||||||||
|
Manufacturing |
10,032.9 | 1,329.4 | 167.8 | 11,530.1 | ||||||||||||
|
Construction |
786.6 | 163.3 | 30.1 | 980.0 | ||||||||||||
|
Real estate |
9,747.1 | 716.3 | 141.8 | 10,605.2 | ||||||||||||
|
Services |
2,279.4 | 328.1 | 72.1 | 2,679.6 | ||||||||||||
|
Wholesale and retail |
7,582.6 | 651.7 | 211.7 | 8,446.0 | ||||||||||||
|
Banks and other financial institutions |
3,959.3 | 18.5 | 7.2 | 3,985.0 | ||||||||||||
|
Communication and information services |
1,349.2 | 68.8 | 25.0 | 1,443.0 | ||||||||||||
|
Other industries |
13,274.0 | 182.7 | 36.1 | 13,492.8 | ||||||||||||
|
Consumer |
1,597.8 | 90.3 | 45.9 | 1,734.0 | ||||||||||||
|
Foreign-excluding MUAH and Krungsri |
28,399.2 | 1,132.1 | 84.8 | 29,616.1 | ||||||||||||
|
Loans acquired with deteriorated credit quality |
32.4 | 33.1 | 10.2 | 75.7 | ||||||||||||
|
|
|
|
|
|
|
|
|
|||||||||
|
Total |
¥ | 79,040.5 | ¥ | 4,714.3 | ¥ | 832.7 | ¥ | 84,587.5 | ||||||||
|
|
|
|
|
|
|
|
|
|||||||||
120
Table of Contents
| Accrual | Nonaccrual | Total (1) | ||||||||||
| (in billions) | ||||||||||||
|
Residential |
¥ | 14,864.9 | ¥ | 113.4 | ¥ | 14,978.3 | ||||||
|
Card |
¥ | 535.5 | ¥ | 73.1 | ¥ | 608.6 | ||||||
|
Credit Quality Based on
the Number of Delinquencies |
Credit Quality Based on
Internal Credit Ratings |
Total (1)(2) | ||||||||||||||||||||||
| Accrual | Nonaccrual | Pass |
Special
Mention |
Classified | ||||||||||||||||||||
| (in billions) | ||||||||||||||||||||||||
|
MUAH |
¥ | 3,003.8 | ¥ | 35.0 | ¥ | 3,947.0 | ¥ | 98.6 | ¥ | 95.2 | ¥ | 7,179.6 | ||||||||||||
| Normal |
Special
Mention |
Substandard or Doubtful
or Doubtful of Loss |
Total | |||||||||||||
| (in billions) | ||||||||||||||||
|
Krungsri |
¥ | 2,923.1 | ¥ | 101.2 | ¥ | 51.6 | ¥ | 3,075.9 | ||||||||
Notes:
| (1) | Total loans in the above table do not include loans held for sale. |
| (2) | Total loans of MUAH do not include FDIC covered loans and small business loans which are not individually rated totaling ¥66.9 billion and ¥60.0 billion as of March 31, 2013 and 2014, respectively. We will be reimbursed for a substantial portion of any future losses on FDIC covered loans under the terms of the FDIC loss share agreements. |
We classify loans into risk categories based on relevant information about the ability of borrowers to service their debt, including, but not limited to, historical and current financial information, historical and current payment experience, credit documentation, public and non-public information about borrowers and current economic trends as deemed appropriate to each segment.
The primary credit quality indicator for loans within all classes of the Commercial segment is the internal credit rating assigned to each borrower based on our internal borrower ratings of 1 through 15 with the rating of 1 assigned to a borrower with the highest quality of credit. When assigning a credit rating to a borrower, we evaluate the borrower’s expected debt-service capability based on various information, including financial and operating information of the borrower as well as information on the industry in which the borrower operates, and the borrower’s business profile, management and compliance system. In evaluating a borrower’s debt-service capability, we also conduct an assessment of the level of earnings and an analysis of the borrower’s net worth. Based on the internal borrower rating, loans within the Commercial segment are categorized as Normal (internal borrower ratings of 1 through 9), Close Watch (internal borrower ratings of 10 through 12), and Likely to become Bankrupt or Legally/Virtually Bankrupt (internal borrower ratings of 13 through 15). Loans to borrowers categorized as Normal represent those that are not deemed to have collectibility issues. Loans to borrowers categorized as Close Watch represent those that require close monitoring as the borrower has begun to exhibit elements of potential concern with respect to its business performance and financial condition, the borrower has begun to exhibit elements of serious concern with respect to its business performance and financial condition, including business problems requiring long-term solutions, or the borrower’s loans are TDRs or loans contractually past due 90 days or more for special reasons. Loans to borrowers categorized as Likely to become Bankrupt or Legally/Virtually Bankrupt represent those that have a higher probability of default than those categorized as Close Watch due to serious debt repayment problems with poor progress in achieving restructuring plans, the borrower being considered virtually bankrupt with no prospects for an improvement in business operations, or the borrower being legally bankrupt with no prospects for continued business operations because of non-payment, suspension of business, voluntary liquidation or filing for legal liquidation.
For more information on our credit and borrower ratings, see “Item 11. Quantitative and Qualitative Disclosures about Credit, Market and Other Risk—Credit Risk Management.”
The accrual status is a primary credit quality indicator for loans within the Residential segment, the Card segment, and consumer loans within the MUAH segment. The accrual status of these loans is determined based on the number of delinquent payments.
121
Table of Contents
Commercial loans within the MUAH segment are categorized as either pass or criticized based on the internal credit rating assigned to each borrower. Criticized credits are those that are internally risk graded as special mention, substandard or doubtful. Special mention credits are potentially weak, as the borrower has begun to exhibit deteriorating trends, which, if not corrected, may jeopardize repayment of the loan and result in further downgrade. Adversely classified credits are those that are internally risk graded as substandard or doubtful. Substandard credits have well-defined weaknesses, which, if not corrected, could jeopardize the full satisfaction of the debt. A credit classified as doubtful has critical weaknesses that make full collection improbable on the basis of currently existing facts and conditions.
Loans within the Krungsri segment are categorized as Normal, Special Mention, and Substandard, which is further divided into Substandard, Doubtful and Doubtful of Loss, primarily based on their delinquency status. Loans categorized as Special Mention generally represent those that have overdue principal or interest payments for a cumulative period exceeding one month commencing from the contractual due date. Loans categorized as Substandard, Doubtful or Doubtful of Loss generally represent those that have overdue principal or interest payments for a cumulative period exceeding three months, commencing from the contractual due date.
For the Commercial, Residential and Card segments, credit quality indicators are based on information as of March 31. For the MUAH and Krungsri segments, credit quality indicators are generally based on information as of December 31.
The ratio of loans classified as Close Watch or below in the Commercial segment decreased 2.5 percentage points to 6.6% as of March 31, 2014 from 9.1% as of March 31, 2013. The decrease in loans rated Close Watch or below was mainly due to an overall decrease in such loans, including a decrease of ¥355.5 billion in such loans to borrowers in the banks and other financial institutions category, including two large consumer finance companies and a large securities firm, primarily resulting from the upgrades of the internal borrower ratings of these and other large borrowers as their financial performance improved. The increase in total loans in the Commercial segment was mainly due to an increase in foreign loans.
The ratio of loans classified as Nonaccrual status in the Residential segment decreased 0.1 percentage points to 0.8% as of March 31, 2014 from 0.9% as of March 31, 2013. Loans in the Nonaccrual status in the Residential segment decreased ¥20.0 billion to ¥113.4 billion as of March 31, 2014, primarily due to a decrease in the number of civil rehabilitation filings made by individual borrowers.
The ratio of loans classified as Nonaccrual status in the Card segment decreased 1.3 percentage points to 12.0% as of March 31, 2014 from 13.3% as of March 31, 2013. This was primarily due to an overall improvement in the credit quality of the loan portfolio, and our implementation of stricter borrower screening under regulatory reforms in the consumer finance industry.
The ratio of loans classified as Special mention or below and Nonaccrual in the MUAH segment decreased 0.3 percentage points to 3.2% as of March 31, 2014 from 3.5% as of March 31, 2013. The decrease reflected gradually improving economic conditions in the United States.
122
Table of Contents
Past due analysis
Aging of past due loans by class as of March 31, 2013 and 2014 are shown below:
|
As of March 31, 2013: |
1-3 months
Past Due |
Greater
Than 3 months |
Total
Past Due |
Current |
Total
Loans (1)(2) |
Recorded
Investment> 90 Days and Accruing |
||||||||||||||||||
| (in billions) | ||||||||||||||||||||||||
|
Commercial |
||||||||||||||||||||||||
|
Domestic |
¥ | 45.9 | ¥ | 84.8 | ¥ | 130.7 | ¥ | 53,357.4 | ¥ | 53,488.1 | ¥ | 7.5 | ||||||||||||
|
Manufacturing |
7.0 | 15.3 | 22.3 | 11,733.5 | 11,755.8 | 0.0 | ||||||||||||||||||
|
Construction |
2.1 | 1.9 | 4.0 | 1,051.4 | 1,055.4 | 0.0 | ||||||||||||||||||
|
Real estate |
5.3 | 15.1 | 20.4 | 10,634.0 | 10,654.4 | 2.3 | ||||||||||||||||||
|
Services |
12.2 | 7.5 | 19.7 | 2,846.7 | 2,866.4 | 0.1 | ||||||||||||||||||
|
Wholesale and retail |
10.1 | 24.0 | 34.1 | 8,260.4 | 8,294.5 | 0.1 | ||||||||||||||||||
|
Banks and other financial institutions |
— | 0.1 | 0.1 | 3,620.8 | 3,620.9 | 0.0 | ||||||||||||||||||
|
Communication and information services |
2.3 | 2.8 | 5.1 | 1,308.8 | 1,313.9 | 0.0 | ||||||||||||||||||
|
Other industries |
1.6 | 6.8 | 8.4 | 12,177.9 | 12,186.3 | 0.0 | ||||||||||||||||||
|
Consumer |
5.3 | 11.3 | 16.6 | 1,723.9 | 1,740.5 | 5.0 | ||||||||||||||||||
|
Foreign-excluding MUAH |
19.8 | 17.7 | 37.5 | 23,923.5 | 23,961.0 | 0.2 | ||||||||||||||||||
|
Residential |
91.2 | 55.1 | 146.3 | 15,037.7 | 15,184.0 | 32.9 | ||||||||||||||||||
|
Card |
23.7 | 39.8 | 63.5 | 594.9 | 658.4 | — | ||||||||||||||||||
|
MUAH |
30.7 | 18.0 | 48.7 | 5,102.9 | 5,151.6 | 0.1 | ||||||||||||||||||
|
|
|
|
|
|
|
|
|
|
|
|
|
|||||||||||||
|
Total |
¥ | 211.3 | ¥ | 215.4 | ¥ | 426.7 | ¥ | 98,016.4 | ¥ | 98,443.1 | ¥ | 40.7 | ||||||||||||
|
|
|
|
|
|
|
|
|
|
|
|
|
|||||||||||||
|
As of March 31, 2014: |
1-3 months
Past Due |
Greater
Than 3 months |
Total
Past Due |
Current |
Total
Loans (1)(2) |
Recorded
Investment> 90 Days and Accruing |
||||||||||||||||||
| (in billions) | ||||||||||||||||||||||||
|
Commercial |
||||||||||||||||||||||||
|
Domestic |
¥ | 26.2 | ¥ | 53.6 | ¥ | 79.8 | ¥ | 54,815.9 | ¥ | 54,895.7 | ¥ | 6.5 | ||||||||||||
|
Manufacturing |
5.3 | 7.2 | 12.5 | 11,517.6 | 11,530.1 | — | ||||||||||||||||||
|
Construction |
0.7 | 0.6 | 1.3 | 978.7 | 980.0 | 0.0 | ||||||||||||||||||
|
Real estate |
4.9 | 9.6 | 14.5 | 10,590.7 | 10,605.2 | 2.2 | ||||||||||||||||||
|
Services |
4.3 | 2.8 | 7.1 | 2,672.5 | 2,679.6 | 0.0 | ||||||||||||||||||
|
Wholesale and retail |
4.7 | 22.8 | 27.5 | 8,418.5 | 8,446.0 | 0.0 | ||||||||||||||||||
|
Banks and other financial institutions |
0.0 | 0.1 | 0.1 | 3,984.9 | 3,985.0 | — | ||||||||||||||||||
|
Communication and information services |
0.7 | 1.4 | 2.1 | 1,440.9 | 1,443.0 | — | ||||||||||||||||||
|
Other industries |
0.6 | 1.6 | 2.2 | 13,490.6 | 13,492.8 | — | ||||||||||||||||||
|
Consumer |
5.0 | 7.5 | 12.5 | 1,721.5 | 1,734.0 | 4.3 | ||||||||||||||||||
|
Foreign-excluding MUAH and Krungsri |
3.3 | 7.1 | 10.4 | 29,605.7 | 29,616.1 | 0.4 | ||||||||||||||||||
|
Residential |
85.5 | 54.5 | 140.0 | 14,823.0 | 14,963.0 | 40.5 | ||||||||||||||||||
|
Card |
21.6 | 33.4 | 55.0 | 540.9 | 595.9 | — | ||||||||||||||||||
|
MUAH |
30.1 | 14.3 | 44.4 | 7,078.6 | 7,123.0 | 0.5 | ||||||||||||||||||
|
Krungsri |
66.9 | 22.1 | 89.0 | 2,936.2 | 3,025.2 | — | ||||||||||||||||||
|
|
|
|
|
|
|
|
|
|
|
|
|
|||||||||||||
|
Total |
¥233.6 | ¥185.0 | ¥418.6 | ¥109,800.3 | ¥110,218.9 | ¥47.9 | ||||||||||||||||||
|
|
|
|
|
|
|
|
|
|
|
|
|
|||||||||||||
| Notes: |
| (1) | Total loans in the above table do not include loans held for sale and loans acquired with deteriorated credit quality. |
| (2) | Total loans of MUAH do not include ¥2.0 billion and ¥1.6 billion of FDIC covered loans as of March 31, 2013 and 2014, respectively, which are not subject to the guidance on loans and debt securities acquired with deteriorated credit quality. |
123
Table of Contents
Total past due loans as of March 31, 2014 were ¥418.6 billion, a decrease of ¥8.1 billion from ¥426.7 billion as of March 31, 2013. This reflected an overall improvement in the credit quality of all of the segments, more than offsetting the impact of the consolidation of Krungsri.
Investment Portfolio
Our investment securities primarily consist of Japanese government bonds, corporate bonds and marketable equity securities. Japanese government bonds are mostly classified as securities available for sale. Our investment in Japanese government bonds is a part of our asset and liability management policy with respect to investing the amount of yen-dominated funds exceeding our net loans. The percentage of our holding of Japanese government bonds available for sale to the total investment securities decreased to 75.2% as of March 31, 2014 from 80.0% as of March 31, 2013. We also hold Japanese government bonds that are classified as securities being held to maturity, which accounted for 0.4% of our investment portfolio as of March 31, 2014.
Historically, we have held equity securities of some of our customers primarily for strategic purposes, in particular, to maintain long-term relationships with these customers. We continue to focus on reducing our investment in equity securities for such purposes in order to reduce the price fluctuation risk in our equity portfolio from a risk management perspective and to respond to applicable regulatory requirements as well as increasing market expectation for us to reduce our equity portfolio. As of March 31, 2014, however, our investment in marketable equity securities increased due to a higher fair value of our equity portfolio reflecting increased stock prices in Japan. As of March 31, 2013 and March 31, 2014, the aggregate book value of our marketable equity securities under Japanese GAAP satisfied the requirements of the legislation prohibiting banks from holding equity securities in excess of their Tier 1 capital.
Investment securities decreased ¥6.54 trillion to ¥55.33 trillion as of March 31, 2014 from ¥61.87 trillion as of March 31, 2013, primarily due to a decrease in our holding of Japanese government bonds primarily in response to the Bank of Japan’s monetary policy and measure to purchase such bonds in the market to stimulate the economy by increasing liquidity and also as part of our asset and liability management. The decrease in our holding of Japanese government bonds was partially offset by an increase in foreign bonds held by our commercial banking subsidiaries to maintain buffer assets for liquidity management purposes, an increase in foreign bonds as a result of our acquisition of Krungsri and an increase in the fair values of marketable equity securities reflecting higher stock prices.
Investment securities other than securities available for sale or being held to maturity, which are nonmarketable equity securities presented on our consolidated balance sheet as other investment securities, were primarily carried at cost of ¥0.74 trillion as of March 31, 2014 and ¥0.89 trillion as of March 31, 2013, respectively, because their fair values were not readily determinable.
For the fiscal year ended March 31, 2014, losses resulting from impairment of investment securities were ¥6.5 billion, compared to ¥124.2 billion for the fiscal year ended March 31, 2013.
124
Table of Contents
The following table shows information regarding the amortized cost, net unrealized gains (losses), and fair value of our investment securities available for sale and being held to maturity as of March 31, 2013 and 2014.
| As of March 31, | ||||||||||||||||||||||||
| 2013 | 2014 | |||||||||||||||||||||||
|
Amortized
cost |
Fair value |
Net
unrealized gains (losses) |
Amortized
cost |
Fair value |
Net
unrealized gains (losses) |
|||||||||||||||||||
| (in billions) | ||||||||||||||||||||||||
|
Securities available for sale: |
||||||||||||||||||||||||
|
Debt securities: |
||||||||||||||||||||||||
|
Japanese government and Japanese government agency bonds |
¥49,159.8 | ¥49,480.0 | ¥320.2 | ¥41,388.6 | ¥41,589.0 | ¥200.4 | ||||||||||||||||||
|
Japanese prefectural and municipal bonds |
207.2 | 217.1 | 9.9 | 195.1 | 203.1 | 8.0 | ||||||||||||||||||
|
Foreign governments and official institutions bonds |
701.5 | 716.3 | 14.8 | 1,272.2 | 1,271.4 | (0.8) | ||||||||||||||||||
|
Corporate bonds |
1,868.6 | 1,922.9 | 54.3 | 1,523.0 | 1,561.2 | 38.2 | ||||||||||||||||||
|
Mortgage-backed securities |
1,464.3 | 1,493.0 | 28.7 | 1,220.4 | 1,180.8 | (39.6) | ||||||||||||||||||
|
Asset-backed securities (1) |
813.3 | 810.7 | (2.6) | 1,060.8 | 1,058.0 | (2.8) | ||||||||||||||||||
|
Other debt securities |
109.4 | 106.7 | (2.7) | 184.5 | 184.9 | 0.4 | ||||||||||||||||||
|
Marketable equity securities |
2,224.1 | 4,097.4 | 1,873.3 | 2,457.0 | 4,837.3 | 2,380.3 | ||||||||||||||||||
|
|
|
|
|
|
|
|
|
|
|
|
|
|||||||||||||
|
Total securities available for sale |
¥56,548.2 | ¥58,844.1 | ¥2,295.9 | ¥49,301.6 | ¥51,885.7 | ¥2,584.1 | ||||||||||||||||||
|
|
|
|
|
|
|
|
|
|
|
|
|
|||||||||||||
|
Debt securities being held to maturity (2) |
¥2,131.2 | ¥2,188.1 | ¥56.9 | ¥2,707.0 | ¥ 2,735.1 | ¥28.1 | ||||||||||||||||||
|
|
|
|
|
|
|
|
|
|
|
|
|
|||||||||||||
| Notes: |
| (1) | AAA and AA-rated products account for approximately two-thirds of our asset-backed securities. |
| (2) | See Note 3 to our consolidated financial statements included elsewhere in this Annual Report for more details. |
Net unrealized gains on securities available for sale increased ¥288.2 billion to ¥2,584.1 billion as of March 31, 2014 from ¥2,295.9 billion as of March 31, 2013. This increase primarily consisted of a ¥507.0 billion increase in net unrealized gains on marketable equity securities reflecting improved equity market conditions in Japan following the introduction of “Abenomics” and the implementation of measures under the Bank of Japan’s “quantitative and qualitative monetary easing” policy, which was partially offset by a decrease of ¥119.8 billion in net unrealized gains on Japanese government and Japanese government agency bonds, reflecting the reduction in our holding of domestic debt securities primarily in response to the Bank of Japan’s monetary policy and market bond purchase operations and also as part of our asset and liability management.
The amortized cost of securities being held to maturity increased ¥575.8 billion between March 31, 2013 and March 31, 2014 mainly due to the transfer of ¥411.5 billion of mortgage-backed securities from securities available for sale to securities being held to maturity to reduce the impact of price volatility on accumulated other comprehensive income and in response to changes in the regulatory capital requirements in the United States, and purchases of foreign currency dominated asset-backed securities by our commercial banking subsidiaries. These increases were partially offset by the redemption of foreign bonds held by our trust banking subsidiaries.
125
Table of Contents
The following table shows information relating to our investment securities other than investment securities available for sale or being held to maturity as of March 31, 2013 and 2014:
| As of March 31, | ||||||||
| 2013 | 2014 | |||||||
| (in billions) | ||||||||
|
Other investment securities: |
||||||||
|
Nonmarketable equity securities |
||||||||
|
Unlisted preferred securities (1) |
¥ | 727.8 | ¥ | 583.2 | ||||
|
Others (2) |
136.3 | 128.2 | ||||||
|
Investment securities held by investment companies and brokers and dealers (3) |
25.9 | 26.2 | ||||||
|
|
|
|
|
|||||
|
Total |
¥ | 890.0 | ¥ | 737.6 | ||||
|
|
|
|
|
|||||
| Notes: |
| (1) | These securities are mainly issued by public companies, including preferred stocks issued by Morgan Stanley, preferred securities issued by our non-consolidated funding vehicles, and other unlisted preferred securities issued by several Japanese public companies. Those securities are primarily carried at cost. The decrease of ¥144.6 billion in unlisted preferred securities was mainly due to the sales by our commercial and trust banking subsidiaries of such preferred securities issued by some Japanese companies. |
| (2) | These securities are equity securities issued by unlisted companies other than unlisted preferred securities. Those securities are primarily carried at cost. |
| (3) | These investment securities are held by certain subsidiaries subject to specialized industry accounting principles for investment companies and brokers and dealers, and are measured at fair value. |
Cash and Due from Banks
Cash and due from banks fluctuate significantly from day to day depending upon financial market conditions. Cash and due from banks as of March 31, 2014 were ¥3.69 trillion, an increase of ¥0.07 trillion from ¥3.62 trillion as of March 31, 2013.
Interest-earning Deposits in Other Banks
A significant portion of the cash received as a result of our sale of Japanese government bonds in response to the Bank of Japan’s monetary policy and as part of our asset and liability management was placed in interest-earning deposits in other banks. Interest-earning deposits in other banks as of March 31, 2014 were ¥20.50 trillion, an increase of ¥12.39 trillion compared to ¥8.11 trillion as of March 31, 2013 mainly due to increased interest-earning deposits with the Bank of Japan and the FRB. The average interest-earning deposits in other banks by our domestic offices for the fiscal year ended March 31, 2014 increased ¥7.46 trillion reflecting an increase in interest-earning deposits with the Bank of Japan, while the average interest-earning deposits in other banks by our overseas offices increased ¥2.76 trillion for the same period.
Trading Account Assets
Trading account assets as of March 31, 2014 were ¥40.65 trillion, compared to ¥40.83 trillion as of March 31, 2013. Trading account assets consist of trading securities and trading derivative assets. Trading securities increased ¥2.66 trillion to ¥28.84 trillion as of March 31, 2014 from ¥26.18 trillion as of March 31, 2013. The increase of trading securities was mainly due to increases in the fair values of foreign currency-denominated bonds held by our commercial and trust banking subsidiaries. Although the fair values of such bonds held by our commercial and trust banking subsidiaries in their respective original currencies, particularly U.S. dollars, declined due to increased interest rates reflecting the tapering of the quantitative monetary easing program by the FRB, the fair values of such bond as translated into Japanese yen increased as the Japanese yen depreciated against the U.S. dollar and other major currencies. Trading derivative assets decreased ¥2.84 trillion to ¥11.81 trillion as of March 31, 2014 from ¥14.65 trillion as of March 31, 2013. This decrease was mainly attributable to decreases in the fair values of interest rate-related derivatives in our securities subsidiaries.
126
Table of Contents
Deferred Tax Assets
Deferred tax assets decreased ¥0.15 trillion to ¥0.36 trillion as of March 31, 2014 from ¥0.51 trillion as of March 31, 2013. This decrease was primarily attributable to a decrease in allowance for credit losses resulting from an overall improvement in the credit quality of our loan portfolio, and a decrease in accrued severance indemnities and pension plans mainly due to an increase in plan assets reflecting higher Japanese stock prices, as well as a decrease in projected benefit obligations as a result of the transfer of the substitutional portion of MUTB’s benefit obligations to the Japanese government. These decreases were partially offset by an increase in deferred tax assets resulting from a decrease in valuation allowance mainly due to the effect of the application of the consolidated corporate-tax system as well as the profitability improvement of a certain subsidiary.
Fore more information, see Note 7 to our consolidated financial statements included elsewhere in this Annual Report.
Accounts Receivable
Accounts receivable, which are included in other assets, increased ¥1.04 trillion to ¥3.21 trillion as of March 31, 2014 from ¥2.17 trillion as of March 31, 2013, reflecting increases in account receivables related to the sales of debt securities toward the end of the fiscal year ended March 31, 2014 in our commercial banking, trust banking and securities subsidiaries.
Investment in Equity Method Investees
Investment in equity method investees, which is included in other assets, increased ¥0.35 trillion to ¥1.62 trillion as of March 31, 2014 from ¥1.27 trillion as of March 31, 2013. The increase was mainly due to our new investments in Asian banks, including VietinBank, and the impact of the depreciation of the Japanese yen against the U.S. dollar on our investment in Morgan Stanley.
For more information, see Note 14 to our consolidated financial statements included elsewhere in this Annual Report.
Total Liabilities
As of March 31, 2014, total liabilities were ¥240.91 trillion, an increase of ¥21.29 trillion from ¥219.62 trillion as of March 31, 2013. The total balance of deposits was ¥162.52 trillion as of March 31, 2014, an increase of ¥14.31 trillion from ¥148.21 trillion as of March 31, 2013. Payables under repurchase agreements were ¥21.27 trillion as of March 31, 2014, an increase of ¥5.57 trillion from ¥15.70 trillion as of March 31, 2013. Long-term debt as of March 31, 2014 was ¥14.50 trillion, an increase of ¥2.32 trillion from ¥12.18 trillion as of March 31, 2013. Trading account liabilities were ¥11.98 trillion as of March 31, 2014, a decrease of ¥2.99 trillion from ¥14.97 trillion as of March 31, 2013.
The depreciation of the Japanese yen against the U.S. dollar and other foreign currencies between March 31, 2013 and March 31, 2014 resulted in an increase of ¥8.85 trillion in the Japanese yen equivalent amount of foreign currency-denominated liabilities as of March 31, 2014.
Deposits
Deposits are our primary source of funds. The total average balance of deposits increased ¥11.65 trillion to ¥151.95 trillion for the fiscal year ended March 31, 2014 from ¥140.30 trillion for the fiscal year ended March 31, 2013.
The balance of domestic deposits increased ¥3.18 trillion to ¥121.51 trillion as of March 31, 2014 from ¥118.33 trillion as of March 31, 2013, and the balance of foreign deposits increased ¥11.13 trillion to ¥41.01 trillion as of March 31, 2014 from ¥29.88 trillion as of March 31, 2013. The increases in domestic
127
Table of Contents
deposits were mainly due to an increase in ordinary deposits in the domestic offices of our commercial banking subsidiaries and an increase in certificates of deposit in our trust banking subsidiaries. The increases in foreign deposits were mainly due to an increase in interest-bearing deposits in overseas offices, particularly the New York branch of our commercial banking subsidiaries as well as our trust banking subsidiaries, an increase in non-interest bearing deposits in MUB, the depreciation of the Japanese yen against other major currencies, and the deposits we assumed in connection with our acquisition of Krungsri.
Short-term Borrowings
We use short-term borrowings as a funding source and in our management of interest rate risk. For management of interest rate risk, short-term borrowings are used in asset and liability management operations to match interest rate risk exposure resulting from loans and other interest-earning assets and to manage funding costs of various financial instruments at an appropriate level, based on our forecast of future interest rate levels. Short-term borrowings consist of call money, funds purchased, payables under repurchase agreements, payables under securities lending transactions, due to trust accounts, and other short-term borrowings.
Short-term borrowings increased ¥6.11 trillion to ¥42.06 trillion as of March 31, 2014 from ¥35.95 trillion as of March 31, 2013. This increase was primarily attributable to an increase of ¥5.57 trillion in payables under repurchase agreements, and an increase of ¥1.53 trillion in payables under securities lending transactions. The increase in payables under repurchase agreements was primarily due to an increase in the volume of transactions in the headquarters of our commercial banking subsidiaries, foreign branches and subsidiaries of our securities subsidiaries, and domestic branches of our trust banking subsidiaries. The increase in payables under securities lending transactions was primarily because our trust banking and securities subsidiaries diversified their short-term funding sources as short-term interest rates remained stable at historical low levels.
Trading Account Liabilities
Trading account liabilities as of March 31, 2014 were ¥11.98 trillion, compared to ¥14.97 trillion as of March 31, 2013. Trading account liabilities mainly consist of trading derivative liabilities. The decrease in trading derivative liabilities was mainly attributable to decreases in the fair values of interest rate-related derivatives in our securities subsidiaries.
Long-term debt as of March 31, 2014 was ¥14.50 trillion, an increase of ¥2.32 trillion from ¥12.18 trillion as of March 31, 2013. This increase was mainly due to an increase in long-term borrowings by our commercial banking subsidiaries in Japan. Our trust banking subsidiaries also increased long-term borrowings in Japan and issued long-term bonds in Japan. Our securities subsidiaries issued a higher volume of bonds outside of Japan through their medium term note programs and obtained additional loans from banks.
Other Liabilities
Other liabilities increased ¥0.56 trillion to ¥5.61 trillion as of March 31, 2014 from ¥5.05 trillion as of March 31, 2013. This increase was mainly due to increases in accrued and other liabilities and deferred tax liabilities. The increase in accrued and other liabilities was due to our acquisition of Krungsri and an increase in money deposited in our securities subsidiaries.
128
Table of Contents
Shareholders’ Equity
The following table presents the key MUFG shareholders’ equity balances figures:
| As of March 31, | ||||||||
| 2013 | 2014 | |||||||
| (in trillions) | ||||||||
|
Shareholders’ equity |
¥ | 10.61 | ¥ | 12.21 | ||||
|
Retained earnings |
1.60 | 2.40 | ||||||
|
Unrealized gains on investment securities, net of tax |
1.11 | 1.27 | ||||||
|
Foreign currency translation adjustments, net of tax |
(0.21 | ) | 0.29 | |||||
Shareholders’ equity as of March 31, 2014 was ¥12.21 trillion, an increase of ¥1.60 trillion from ¥10.61 trillion as of March 31, 2013.
Retained earnings as of March 31, 2014 were ¥2.40 trillion, an increase of ¥0.80 trillion from ¥1.60 trillion as of March 31, 2013, reflecting higher net income of our commercial and trust banking subsidiaries for the fiscal year ended March 31, 2014 compared to the previous fiscal year. We raised our annual dividend to ¥16 per share for the fiscal year ended March 31, 2014 from ¥13 per share for the previous fiscal year.
Unrealized gains on investment securities, net of tax, as of March 31, 2014 were ¥1.27 trillion, an increase of ¥0.16 trillion from ¥1.11 trillion as of March 31, 2013. The increase was mainly due to an increase of ¥450.3 billion in unrealized gains on marketable equity securities in our commercial and trust banking subsidiaries reflecting higher stock prices in Japan, which was partially offset by a decrease of ¥83.5 billion in unrealized gains on Japanese government bonds also held by our commercial and trust banking subsidiaries. In addition, unrealized gains on investment securities decreased ¥188.8 billion as a result of the reduction in our holding of investment securities.
Foreign currency translation adjustments, net of taxes, as of March 31, 2014 were a positive adjustment of ¥0.29 trillion, compared to a negative adjustment of ¥0.21 trillion as of March 31, 2013. This improvement was recorded largely in MUAH, Morgan Stanley and other foreign subsidiaries, including BTMU Liquidity Reserve Investment Limited, a Cayman subsidiary set up to purchase and hold U.S. Treasury bonds, reflecting the depreciation of the Japanese yen against the U.S. dollar.
Sources of Funding and Liquidity
Our primary source of liquidity is from a large balance of deposits, mainly ordinary deposits, certificates of deposit and time deposits. Time deposits have historically shown a high rollover rate among our corporate customers and individual depositors. Due to our broad customer base in Japan and the depositors’ recent preference to seek the safety of deposits at large financial institutions, the balance of our deposits increased to ¥162.52 trillion as of March 31, 2014 from ¥148.21 trillion as of March 31, 2013. As of March 31, 2014, our deposits exceeded our loans, net of allowance for credit losses of ¥109.18 trillion, by ¥53.34 trillion. These deposits provide us with a sizable source of stable and low-cost funds. Our average deposits, combined with average total equity of ¥10.68 trillion, funded 65.6% of our average total assets of ¥247.73 trillion during the fiscal year ended March 31, 2014.
The remaining funding was primarily provided by short-term borrowings and long-term senior and subordinated debt. Short-term borrowings consist of call money and funds purchased, payables under repurchase agreements, payables under securities lending transactions, due to trust account, and other short-term borrowings. From time to time, we have issued long-term instruments such as straight bonds with maturities between three to ten years. The balance of our short-term borrowings as of March 31, 2014 was ¥42.06 trillion, and the average balance of our short-term borrowings for the fiscal year ended March 31, 2014 was ¥40.85 trillion. The balance of our long-term debt as of March 31, 2014 was ¥14.50 trillion, and the average balance of our long-term debt for
129
Table of Contents
the fiscal year ended March 31, 2014 was ¥12.64 trillion. Liquidity may also be provided by the sale of financial assets, including securities available for sale, trading account securities and loans. Additional liquidity may be provided by the maturity of loans.
We manage liquidity separately at certain of our foreign and domestic non-bank and bank subsidiaries because they are subject to separate regulatory requirements, pursue different business models and have distinctive liquidity risk profiles. We manage our group-wide liquidity on a consolidated basis based on the tests and analyses conducted at the subsidiary level. Liquidity risk management measures at the subsidiary level include the following:
| Ÿ |
Domestic Bank Subsidiaries —Our major domestic bank subsidiaries, BTMU and MUTB, set liquidity and funding limits designed to maintain their respective requirements for funding from market sources below pre-determined levels for certain periods (e.g., one-day, two-week and one-month). The major domestic bank subsidiaries also monitor the balance of buffer assets they respectively hold, including Japanese government bonds and U.S. Treasury bonds, which can be used for cash funding even in periods of stress. In addition, the major domestic bank subsidiaries regularly perform liquidity stress testing designed to evaluate the impact of systemic market stress conditions and institution-specific stress events, including credit rating downgrades, on their liquidity positions; |
| Ÿ |
Foreign Bank Subsidiaries —Our major foreign bank subsidiaries, MUAH and Krungsri, monitors various liquidity metrics, including total available liquidity, the net non-core funding dependence ratio, and minimum liquidity assets, as a tool to maintain a sufficient amount of liquidity and diversity of funding sources to allow the major foreign bank subsidiaries to meet expected obligations in both stable and adverse conditions. In addition, the major foreign bank subsidiaries regularly conduct stress testing, which incorporates both bank-specific and systemic market scenarios that would adversely affect its liquidity position, to facilitate the identification of appropriate remedial measures to help ensure that it maintains adequate liquidity in adverse conditions; |
| Ÿ |
Securities Subsidiaries —Our securities subsidiaries implement liquidity and funding limits designed to maintain their requirements for funding from market sources below pre-determined levels for specified periods. In addition, the securities subsidiaries regularly conduct analyses designed to assess the period for which they can continue to meet their respective liquidity requirements by selling or pledging assets they respectively hold under scenarios where they are unable to access any additional sources of financing in the market; and |
| Ÿ |
Non-Bank Subsidiaries —Our non-bank subsidiaries, including Mitsubishi UFJ NICOS, regularly conduct cash flow analyses designed to assess their ability to generate sufficient liquidity for specified periods, considering the cash and cash equivalents as well as deposits they respectively hold, and their respective operating income and expenses under scenarios where they are no longer able to obtain funding from markets through issuance of commercial paper, bonds or other instruments. The non-bank subsidiaries also conduct analyses to ensure sufficient liquidity and funding are available from our bank subsidiaries and other financial institutions outside of our group of companies. |
We collect and evaluate the results of the stress tests individually performed by our major subsidiaries to ensure our ability to meet our liquidity requirements on a consolidated basis in stress scenarios.
We manage our funding sources using buffer assets, primarily Japanese government bonds, for cash funding. As of March 31, 2014, we held ¥41.59 trillion of Japanese national government and Japanese government agency bonds as available for sale. Our major domestic commercial banking subsidiaries use liquidity-supplying assets, primarily commitment lines for minor currencies funding. In addition, the major bank subsidiaries use a liquidity gap, or the excess of cash inflows over cash outflows, for cash funding.
See “Item 3.D. Key Information—Risk Factors—Risks Related to Our Business—A further downgrade of our credit ratings could trigger additional collateral obligations under our derivative contracts and increase our funding costs.”
130
Table of Contents
Total Equity
The following table presents a summary of our total equity as of March 31, 2013 and 2014:
| As of March 31, | ||||||||
| 2013 | 2014 | |||||||
| (in billions, except percentages) | ||||||||
|
Preferred stock |
¥ | 442.1 | ¥ | 442.1 | ||||
|
Common stock |
1,646.0 | 1,647.1 | ||||||
|
Capital surplus |
6,348.1 | 6,363.4 | ||||||
|
Retained earnings appropriated for legal reserve |
239.6 | 239.6 | ||||||
|
Unappropriated retained earnings |
1,361.7 | 2,157.6 | ||||||
|
Accumulated other comprehensive income, net of taxes |
574.3 | 1,357.7 | ||||||
|
Treasury stock, at cost |
(3.0 | ) | (2.5 | ) | ||||
|
|
|
|
|
|||||
|
Total Mitsubishi UFJ Financial Group shareholders’ equity |
¥ | 10,608.8 | ¥ | 12,205.0 | ||||
|
Noncontrolling interests |
333.2 | 546.4 | ||||||
|
|
|
|
|
|||||
|
Total equity |
¥ | 10,942.0 | ¥ | 12,751.4 | ||||
|
|
|
|
|
|||||
|
Ratio of total equity to total assets |
4.75 | % | 5.03 | % | ||||
Total equity increased ¥1,809.4 billion to ¥12,751.4 billion as of March 31, 2014 from ¥10,942.0 billion as of March 31, 2013. The ratio of total equity to total assets improved 0.28 percentage points to 5.03% as of March 31, 2014 from 4.75% as of March 31, 2013. Although total assets increased between March 31, 2013 and March 31, 2014, the ratio of total equity to total assets also increased between those dates mainly due to an increase in unappropriated retained earnings which can be roughly calculated by subtracting the amount of dividends from net profits, and an increase in accumulated other comprehensive income, net of tax, reflecting larger net unrealized holding gains on investment securities and positive foreign currency translation adjustments.
Due to our holdings of a large amount of marketable equity securities and the volatility of the equity markets in Japan, changes in the fair value of marketable equity securities have significantly affected our total equity in recent years. The following table presents information relating to the accumulated net unrealized gains, net of taxes, in respect of investment securities classified as available for sale as of March 31, 2014:
| As of March 31, | ||||||||
| 2013 | 2014 | |||||||
| (in billions, except percentages) | ||||||||
|
Accumulated net unrealized gains on investment securities |
¥ | 1,106.3 | ¥ | 1,272.7 | ||||
|
Accumulated net unrealized gains to total equity |
10.11 | % | 9.98 | % | ||||
We are subject to various regulatory capital requirements promulgated by the regulatory authorities of the countries in which we operate. Failure to meet minimum capital requirements can result in mandatory actions being taken by regulators that could have a direct material effect on our consolidated financial statements. Moreover, if our capital ratios are perceived to be low, our counterparties may avoid entering into transactions with us, which in turn could negatively affect our business and operations. For further information, see “Item 3.D. Key Information—Risk Factors—Risks Related to Our Business—We may not be able to maintain our capital ratios above minimum required levels, which could result in the suspension of some or all of our operations.”
We continually monitor our risk-adjusted capital ratio closely and manage our operations in consideration of the capital ratio requirements. These ratios are affected not only by fluctuations in the value of our assets,
131
Table of Contents
including our credit risk assets such as loans and equity securities, the risk weights of which depend on the borrowers’ or issuers’ internal ratings, marketable securities and deferred tax assets, but also by fluctuations in the value of the Japanese yen against the U.S. dollar and other foreign currencies and by general price levels of Japanese equity securities.
Capital Requirements for Banking Institutions in Japan
Certain provisions of Basel III were adopted by the FSA effective March 31, 2013 for Japanese banking institutions with international operations conducted by their foreign offices. Under Basel III, Common Equity Tier 1, Tier 1 and total capital ratios are used to assess capital adequacy, which ratios are determined by dividing applicable capital components by risk-weighted assets. Total capital is defined as the sum of Tier 1 and Tier 2 capital.
Under Basel III, Tier 1 capital includes Common Equity Tier 1 and Additional Tier 1 capital. Common Equity Tier 1 capital is a new category of capital primarily consisting of:
| Ÿ |
common stock, |
| Ÿ |
capital surplus, |
| Ÿ |
retained earnings, and |
| Ÿ |
accumulated other comprehensive income (progressively phased into the capital ratio calculation over several years). |
Regulatory adjustments including certain intangible fixed assets, such as goodwill, defined benefit pension fund net assets (prepaid pension costs), and other adjustments will be deducted from Common Equity Tier 1 capital. The amount of adjustments to be deducted will increase progressively over time.
Additional Tier 1 capital generally consists of Basel III compliant preferred securities and, during the transition period, other capital that meets Tier I requirements under the former Basel II standards, net of regulatory adjustments. Subject to transitional measures, adjustments are made to Additional Tier 1 capital for items including intangible fixed assets, such as goodwill, and foreign currency translation adjustments, with the amounts of such adjustments to Additional Tier 1 capital progressively decreasing over time.
Tier 2 capital generally consists of:
| Ÿ |
Basel III compliant deferred obligations, |
| Ÿ |
during the transition period, capital that meet Tier II requirements under the former Basel II standards, |
| Ÿ |
allowances for credit losses, and |
| Ÿ |
non-controlling interests in subsidiaries’ Tier 2 capital instruments. |
Subject to transitional measures, certain items including 45% of unrealized profit on securities available for sale and revaluation of land are reflected in Tier 2 capital with the amounts progressively decreasing over time.
In determining capital ratios under the FSA guidelines reflecting Basel III, we and our banking subsidiaries used the Advanced Internal Ratings-Based approach, or the AIRB approach, to calculate capital requirements for credit risk as of March 31, 2014. The Standardized Approach is used for some subsidiaries that are considered to be immaterial to the overall MUFG capital requirements, and MUAH has adopted a phased rollout of the internal ratings-based approach. Market risk is reflected in the risk-weighted assets by applying the Internal Models Approach to calculate general market risk and the Standardized Measurement Method to calculate specific risk. Under the Internal Models Approach, we principally use a historical simulation model to calculate value-at-risk, or VaR, amounts by estimating the profit and loss on our portfolio by applying actual fluctuations in historical
132
Table of Contents
market rates and prices over a fixed period. Under the FSA guidelines reflecting Basel III, we reflect operational risk in the risk-weighted assets by applying the Standardized Approach as of March 31, 2011 and the Advanced Measurement Approach from March 31, 2012. The Basel Committee on Banking Supervision has issued proposals to revise the current market risk framework, including stricter measures relating to some of our investment securities portfolio. Under the current proposals, certain financial instruments that we hold, including investment securities, could become subject to stricter trading book capital requirements. For more information, see “Item 11. Quantitative and Qualitative Disclosures about Credit, Market and Other Risk—Operational Risk Management.”
We have been granted approval by the FSA to exclude the majority of our investment in Morgan Stanley from being subject to double gearing adjustments. The approval was granted for a 10-year period, but the approval amount will be phased out by 20% each year starting from March 31, 2019. As of March 31, 2014, a full application of double gearing adjustments with respect to our investment in Morgan Stanley would have reduced our Common Equity Tier 1 capital ratio by approximately 0.7%.
Under Japanese regulatory capital requirements, our consolidated capital components, including Common Equity Tier 1, Tier 1, and Tier 2 capital and risk-weighted assets, are calculated based on our consolidated financial statements prepared under Japanese GAAP. Each of the consolidated and stand-alone capital components and risk-weighted assets of our banking subsidiaries in Japan is also calculated based on consolidated and non-consolidated financial statements prepared under Japanese GAAP.
Certain Basel III provisions were adopted by the FSA with transitional measures and became effective March 31, 2013. Various Basel III measures are being phased in from the calendar year 2013, including those designed to raise the level of minimum capital requirements and to establish an internationally harmonized leverage ratio and a global minimum liquidity standard. In addition, the Basel Committee on Banking Supervision has proposed additional loss absorbency requirements to supplement the Common Equity Tier 1 capital requirement ranging from 1% to 3.5% for global systemically important banks, or G-SIBs, depending on the bank’s systemic importance. The Financial Stability Board identified us as a G-SIB in its most recent annual report published in November 2013, and indicated that, as a G-SIB, we would be required to hold an additional 1.5% of Tier 1 common equity. The group of banks identified as G-SIBs is expected to be updated annually, and the first group of G-SIBs to which the stricter capital requirements will initially be applied is expected to be identified in 2014. The stricter capital requirements are expected to be implemented in phases between January 1, 2016 and December 31, 2018 and will become fully effective on January 1, 2019.
In September 2013, the Basel Committee on Banking Supervision and the International Organization of Securities Commissions released the final framework for margin requirements for non-centrally cleared derivatives. The new framework will require high quality liquid assets to be posted as margin on non-centrally cleared derivative trades, and is expected, among other things, to adversely affect our liquidity position. The margin requirement will be phased in over a four-year period, beginning in December 2015 with the largest, most active and most systemically important derivatives market participants, including us.
For additional discussion of the calculation of our capital ratios, see Note 21 to our consolidated financial statements included elsewhere in this Annual Report.
For more information, see “Item 4.B. Information on the Company—Business Overview—Supervision and Regulation—Japan—Capital adequacy.”
133
Table of Contents
Mitsubishi UFJ Financial Group Ratios
The table below presents our consolidated total capital components, risk-weighted assets and risk-adjusted capital ratios in accordance with Basel III as of March 31, 2013 and 2014. Underlying figures are calculated in accordance with Japanese banking regulations based on information derived from our consolidated financial statements prepared in accordance with Japanese GAAP, as required by the FSA. The percentages in the table below are rounded down. For further information, see Note 21 to our consolidated financial statements included elsewhere in this Annual Report.
|
As of March 31,
2013 |
Minimum capital
ratios required |
As of March 31,
2014 |
Minimum capital
ratios required |
|||||||||||||
| (in billions, except percentages) | (in billions, except percentages) | |||||||||||||||
|
Capital components: |
||||||||||||||||
|
Common Equity Tier 1 |
¥10,300.6 | ¥11,153.0 | ||||||||||||||
|
Additional Tier 1 |
914.2 | 1,188.8 | ||||||||||||||
|
Tier 1 capital |
11,214.8 | 12,341.9 | ||||||||||||||
|
Tier 2 capital |
3,459.1 | 3,052.5 | ||||||||||||||
|
Total capital |
¥14,674.0 | ¥15,394.3 | ||||||||||||||
|
Risk-weighted assets |
¥87,968.6 | ¥99,084.3 | ||||||||||||||
|
Capital ratios: |
||||||||||||||||
|
Common Equity Tier 1 |
11.70 | % | 3.50 | % | 11.25 | % | 4.00 | % | ||||||||
|
Tier 1 capital |
12.74 | 4.50 | 12.45 | 5.50 | ||||||||||||
|
Total capital |
16.68 | 8.00 | 15.53 | 8.00 | ||||||||||||
As of March 31, 2014, management believed that we were in compliance with all capital adequacy requirements to which we were subject.
Our Common Equity Tier 1 ratio, Tier 1 capital ratio and Total capital ratio as of March 31, 2014 were generally decreased from the ratios as of March 31, 2013 due to an increase in our risk-weighted assets, despite increases in our regulatory capital amounts. The increase in our risk-weighted assets was due to an increase in our loan balance reflecting the impact of our acquisition of Krungsri and the depreciation of the Japanese yen against other major currencies. The increases in our consolidated regulatory capital amounts, including Common Equity Tier 1 capital, were due to an increase in retained earnings, reflecting higher net income.
134
Table of Contents
Capital Ratios of Our Major Banking Subsidiaries in Japan
The table below presents the risk-adjusted capital ratios of BTMU and MUTB in accordance with Basel III as of March 31, 2013 and 2014. Underlying figures are calculated in accordance with Japanese banking regulations based on information derived from each bank’s consolidated and non-consolidated financial statements prepared in accordance with Japanese GAAP, as required by the FSA. The percentages in the table below are rounded down. For further information, see Note 21 to our consolidated financial statements included elsewhere in this Annual Report.
|
As of
March 31, 2013 |
Minimum capital
ratios required |
As of
March 31, 2014 |
Minimum capital
ratios required |
|||||||||||||
|
Consolidated capital ratios: |
||||||||||||||||
|
BTMU |
||||||||||||||||
|
Common Equity Tier 1 capital |
11.71 | % | 3.50 | % | 11.05 | % | 4.00 | % | ||||||||
|
Tier 1 capital |
13.11 | 4.50 | 12.21 | 5.50 | ||||||||||||
|
Total capital |
17.51 | 8.00 | 15.57 | 8.00 | ||||||||||||
|
MUTB |
||||||||||||||||
|
Common Equity Tier 1 capital |
13.12 | 3.50 | 14.21 | 4.00 | ||||||||||||
|
Tier 1 capital |
13.77 | 4.50 | 14.76 | 5.50 | ||||||||||||
|
Total capital |
17.79 | 8.00 | 18.38 | 8.00 | ||||||||||||
|
Stand-alone capital ratios: |
||||||||||||||||
|
BTMU |
||||||||||||||||
|
Common Equity Tier 1 capital |
11.76 | 3.50 | 11.88 | 4.00 | ||||||||||||
|
Tier 1 capital |
13.99 | 4.50 | 13.74 | 5.50 | ||||||||||||
|
Total capital |
18.52 | 8.00 | 17.52 | 8.00 | ||||||||||||
|
MUTB |
||||||||||||||||
|
Common Equity Tier 1 capital |
12.49 | 3.50 | 13.72 | 4.00 | ||||||||||||
|
Tier 1 capital |
13.22 | 4.50 | 14.37 | 5.50 | ||||||||||||
|
Total capital |
17.94 | 8.00 | 18.51 | 8.00 | ||||||||||||
As of March 31, 2014, management believes that our banking subsidiaries were in compliance with all capital adequacy requirements to which they were subject.
Capital Requirements for Banking Institutions in the United States
In the United States, MUAH and its banking subsidiary, MUB, our largest subsidiaries operating outside Japan, are subject to various regulatory capital requirements administered by U.S. Federal banking agencies, including minimum capital requirements. Under capital adequacy guidelines and the regulatory framework for prompt corrective action, they must meet specific capital guidelines that involve quantitative measures of their assets, liabilities and certain off-balance sheet items as calculated under U.S. regulatory and accounting practices. Their capital amounts and prompt corrective action classification are also subject to qualitative judgments by the regulators about components, risk weightings and other factors.
In addition, as foreign banking organizations that have U.S. branches and agencies and also as entities that are controlled by MUFG, which is a financial holding company, BTMU and MUTB are subject to the FRB’s requirements.
In July 2013, the FRB and the other U.S. federal banking agencies adopted final rules making significant changes to the U.S. regulatory capital framework for U.S. banking organizations to conform it to the Basel III global regulatory capital framework. The final rules establish more restrictive capital definitions, create additional categories and higher risk weightings for certain asset classes and off-balance sheet exposures, higher minimum capital and leverage ratios and capital conservation buffers that will be added to the minimum capital requirements. The final rules began to apply to UNBC (now MUAH) and Union Bank (now MUB) on January 1, 2014, subject to certain transition provisions.
135
Table of Contents
For a detailed discussion of the capital adequacy guidelines applicable to us in the United States, see “Item 4.B. Information on the Company—Business Overview—Supervision and Regulation—United States—Bank capital requirements and capital distributions.”
Capital Ratios of Banking Subsidiaries in the United States
The table below presents the risk-adjusted capital ratios of MUAH and MUB, both subsidiaries of BTMU, calculated in accordance with applicable U.S. banking regulations as of December 31, 2012 and 2013:
| As of December 31, |
Minimum capital
ratios required |
Ratio OCC
requires to be “well capitalized” |
||||||||||||||
| 2012 | 2013 | |||||||||||||||
|
MUAH: |
||||||||||||||||
|
Tier I capital (to risk-weighted assets) |
11.91 | % | 12.41 | % | 4.00 | % | — | |||||||||
|
Tier I capital (to quarterly average assets) (1) |
11.18 | 11.27 | 4.00 | — | ||||||||||||
|
Total capital (to risk-weighted assets) |
13.34 | 14.61 | 8.00 | — | ||||||||||||
|
MUB: |
||||||||||||||||
|
Tier I capital (to risk-weighted assets) |
11.68 | % | 12.94 | % | 4.00 | % | 6.00 | % | ||||||||
|
Tier I capital (to quarterly average assets) (1) |
10.51 | 11.13 | 4.00 | 5.00 | ||||||||||||
|
Total capital (to risk-weighted assets) |
13.17 | 14.91 | 8.00 | 10.00 | ||||||||||||
| Note: |
| (1) | Excludes certain intangible assets. |
Management believes that, as of December 31, 2013, MUAH and MUB were in compliance with all capital adequacy requirements to which they were subject.
As of December 31, 2012 and 2013, the Office of the Comptroller of the Currency, or OCC, categorized MUB as “well-capitalized.” To be categorized as “well-capitalized,” MUB must maintain minimum ratios of Total and Tier I capital to risk-weighted assets and of Tier I capital to quarterly average assets (leverage ratio) as set forth in the table. There are no conditions or events since December 31, 2013 that would cause management to believe that MUB’s category has changed.
For further information, see Note 21 to our consolidated financial statements included elsewhere in this Annual Report.
Capital Requirements for Securities Firms in Japan and Overseas
We have securities subsidiaries in Japan and overseas, which are also subject to regulatory capital requirements. In Japan, the Financial Instruments and Exchange Law of Japan and related ordinances require financial instruments firms to maintain a minimum capital ratio of 120% calculated as a percentage of capital accounts less certain fixed assets, as determined in accordance with Japanese GAAP, against amounts equivalent to market, counterparty credit and operations risks. Specific guidelines are issued as a ministerial ordinance which details the definition of essential components of the capital ratios, including capital, deductible fixed asset items and risks, and related measures. Failure to maintain a minimum capital ratio will trigger mandatory regulatory actions. A capital ratio of less than 140% will call for regulatory reporting and a capital ratio of less than 100% may lead to a suspension of all or part of the business for a period of time and cancellation of registration. Overseas securities subsidiaries are subject to the relevant regulatory capital requirements of the countries or jurisdictions in which they operate.
Capital Adequacy Ratio of MUMSS
As of March 31, 2014, MUMSS’ capital accounts less certain fixed assets of ¥377.3 billion on a stand-alone basis and ¥400.6 billion on a consolidated basis represented 292.9% and 295.0% of the total amounts equivalent
136
Table of Contents
to market, counterparty credit and operations risks, respectively, as calculated pursuant to the Financial Instruments and Exchange Law of Japan. As of March 31, 2013, MUMSS’ capital accounts less certain fixed assets of ¥388.2 billion on a stand-alone basis represented 315.9% of the total amounts equivalent to market, counterparty credit and operations risks as calculated pursuant to the applicable law.
For further information, see Note 21 to our consolidated financial statements included elsewhere in this Annual Report.
Non-exchange Traded Contracts Accounted for at Fair Value
The use of non-exchange traded or over-the-counter contracts provides us with the ability to adapt to the varied requirements of a wide customer base while mitigating market risks. Non-exchange traded contracts are accounted for at fair value, which is generally based on pricing models or quoted prices for instruments with similar characteristics. Gains or losses on non-exchange traded contracts are included in “Trading account profits (losses)—net” in our consolidated statements of operations included elsewhere in this Annual Report. The following table summarizes the changes in fair value of non-exchange traded contracts for the fiscal years ended March 31, 2013 and 2014:
| Fiscal years ended March 31, | ||||||||
| 2013 | 2014 | |||||||
| (in millions) | ||||||||
|
Net fair value of contracts outstanding at beginning of fiscal year |
¥ | 19,776 | ¥ | 12,968 | ||||
|
Changes attributable to contracts realized or otherwise settled during the fiscal year |
(3,280 | ) | (1,319 | ) | ||||
|
Fair value of new contracts entered into during the fiscal year |
3,375 | (2,042 | ) | |||||
|
Other changes in fair value, principally revaluation at end of fiscal year |
(6,903 | ) | 7,132 | |||||
|
|
|
|
|
|||||
|
Net fair value of contracts outstanding at end of fiscal year |
¥ | 12,968 | ¥ | 16,739 | ||||
|
|
|
|
|
|||||
During the fiscal year ended March 31, 2014, the fair value of non-exchange traded contracts increased mainly due to an increase in the fair value resulting from fluctuations in foreign exchange rates and fluctuations in the value of credit default swaps embedded in collateralized debt obligations.
The following table summarizes the maturities of non-exchange traded contracts as of March 31, 2014:
| Net fair value of contracts—unrealized gains | ||||||||
|
Prices provided
by
other external sources |
Prices based on models and
other valuation methods |
|||||||
| (in millions) | ||||||||
|
Maturity less than 1 year |
¥ | 899 | ¥ | 9,290 | ||||
|
Maturity less than 3 years |
579 | 4,353 | ||||||
|
Maturity less than 5 years |
553 | 1,301 | ||||||
|
Maturity 5 years or more |
— | (236 | ) | |||||
|
|
|
|
|
|||||
|
Total fair value |
¥ | 2,031 | ¥ | 14,708 | ||||
|
|
|
|
|
|||||
| C. | Research and Development, Patents and Licenses, etc. |
Not applicable.
| D. | Trend Information |
See the discussions in “—Business Environment,” “—Recent Developments,” “—A. Operating Results” and “—B. Liquidity and Capital Resources.”
137
Table of Contents
| E. | Off-Balance Sheet Arrangements |
In the normal course of business, we engage in several types of off-balance sheet arrangements to meet the financing needs of customers, including various types of guarantees, credit commitments and commercial letters of credit. The following table summarizes these commitments as of March 31, 2014:
| Amount of commitment by expiration period | ||||||||||||||||
|
1 year
or less |
1-5
years |
Over
5 years |
Total | |||||||||||||
| (in billions) | ||||||||||||||||
|
Guarantees: |
||||||||||||||||
|
Standby letters of credit and financial guarantees |
¥ | 2,082 | ¥ | 1,116 | ¥ | 576 | ¥ | 3,774 | ||||||||
|
Performance guarantees |
1,766 | 727 | 78 | 2,571 | ||||||||||||
|
Derivative instruments |
33,281 | 26,432 | 9,098 | 68,811 | ||||||||||||
|
Liabilities of trust account |
6,580 | 343 | 828 | 7,751 | ||||||||||||
|
|
|
|
|
|
|
|
|
|||||||||
|
Total guarantees |
43,709 | 28,618 | 10,580 | 82,907 | ||||||||||||
|
|
|
|
|
|
|
|
|
|||||||||
|
Other off-balance sheet instruments: |
||||||||||||||||
|
Commitments to extend credit |
49,203 | 21,386 | 1,651 | 72,240 | ||||||||||||
|
Commercial letters of credit |
760 | 95 | — | 855 | ||||||||||||
|
Commitments to make investments |
38 | 25 | 18 | 81 | ||||||||||||
|
Others |
1 | 8 | 12 | 21 | ||||||||||||
|
|
|
|
|
|
|
|
|
|||||||||
|
Total other off-balance sheet instruments |
50,002 | 21,514 | 1,681 | 73,197 | ||||||||||||
|
|
|
|
|
|
|
|
|
|||||||||
|
Total |
¥ | 93,711 | ¥ | 50,132 | ¥ | 12,261 | ¥ | 156,104 | ||||||||
|
|
|
|
|
|
|
|
|
|||||||||
See Note 24 to our consolidated financial statements included elsewhere in this Annual Report for a description of the nature of our guarantees and other off-balance sheet instruments.
The contractual amounts of these guarantees and other off-balance sheet instruments represent the amounts at risk if the contracts were to be fully drawn upon as a result of a subsequent default by our customer and a decline in the value of the underlying collateral. Since many of these commitments expire without being drawn upon, the total contractual or notional amounts of these commitments do not necessarily represent our future cash requirements. As of March 31, 2014, approximately 60% of these commitments have an expiration date within one year, 32% have an expiration date from one year to five years, and 8% have an expiration date after five years. Such risks are monitored and managed as a part of our risk management system as set forth in “Item 11. Quantitative and Qualitative Disclosures about Credit, Market and Other Risk.” We evaluate off-balance sheet arrangements in the manner described in Note 1 to our consolidated financial statements included elsewhere in this Annual Report.
The fees generated specifically from off-balance sheet arrangements are not a dominant source of our overall fees and commissions.
Some of our off-balance sheet arrangements are related to activities of special purpose entities, most of which are variable interest entities, or VIEs. For further information, see Note 25 to our consolidated financial statements included elsewhere in this Annual Report.
138
Table of Contents
| F. | Tabular Disclosure of Contractual Obligations |
The following table shows a summary of our contractual cash obligations outstanding as of March 31, 2014:
| Payments due by period | ||||||||||||||||||||
|
Less than
1 year |
1-3
years |
3-5
years |
Over
5 years |
Total | ||||||||||||||||
| (in billions) | ||||||||||||||||||||
|
Contractual cash obligations: |
||||||||||||||||||||
|
Time deposit obligations |
¥ | 61,474 | ¥ | 9,689 | ¥ | 1,671 | ¥ | 488 | ¥ | 73,322 | ||||||||||
|
Long-term debt obligations |
1,680 | 4,452 | 2,317 | 6,030 | 14,479 | |||||||||||||||
|
Capital lease obligations |
7 | 7 | 2 | 4 | 20 | |||||||||||||||
|
Operating lease obligations |
86 | 136 | 112 | 390 | 724 | |||||||||||||||
|
Purchase obligations |
50 | 24 | 28 | 13 | 115 | |||||||||||||||
|
|
|
|
|
|
|
|
|
|
|
|||||||||||
|
Total (1)(2) |
¥ | 63,297 | ¥ | 14,308 | ¥ | 4,130 | ¥ | 6,925 | ¥ | 88,660 | ||||||||||
|
|
|
|
|
|
|
|
|
|
|
|||||||||||
Notes:
| (1) | The total amount of expected future pension payments is not included in the above table or the total amount of commitments outstanding as of March 31, 2014 as such amount is not currently determinable. We expect to contribute approximately ¥56.0 billion for pension and other benefits for our employees for the fiscal year ending March 31, 2015. For further information, see Note 13 to our consolidated financial statements included elsewhere in this Annual Report. |
| (2) | The above table does not include unrecognized tax benefits and interest and penalties related to income tax associated with the guidance on accounting for uncertainty in income taxes as we cannot estimate reasonably the timing of cash settlement of the liabilities for unrecognized tax benefit. The total amount of the liabilities for unrecognized tax benefits is ¥14.0 billion as of March 31, 2014. Among the liabilities for unrecognized tax benefits, it is reasonably possible that approximately ¥3.0 billion will decrease during the next twelve months. For further information, see Note 7 to our consolidated financial statements included elsewhere in this Annual Report. |
Purchase obligations include any legally binding contractual obligations that require us to spend more than ¥100 million annually under the contract. Purchase obligations in the table primarily include commitments to make investments into corporate recovery or private equity investment funds.
| G. | Safe Harbor |
See the discussion under “Forward-Looking Statements.”
| Item 6. | Directors, Senior Management and Employees. |
| A. | Directors and Senior Management |
The following table sets forth the members of our board of directors as of July 1, 2014, together with their respective dates of birth, positions and experience:
|
Name (Date of Birth) |
Position in MUFG |
Business Experience |
||||
|
Kiyoshi Sono
|
Chairman | April 1976 | Joined Sanwa Bank | |||
| May 2004 | Executive Officer of UFJ Bank | |||||
| January 2006 | Executive Officer of BTMU | |||||
| May 2006 | Managing Executive Officer of BTMU | |||||
| May 2010 | Senior Managing Executive Officer of BTMU | |||||
| May 2012 | Managing Officer of MUFG | |||||
| June 2012 | Deputy President of BTMU | |||||
| May 2014 |
Deputy Chairman of BTMU (incumbent) Retired from Managing Officer of MUFG |
|||||
| June 2014 |
Chairman of MUFG (incumbent) Director of Mitsubishi UFJ NICOS Co., Ltd. (incumbent) |
|||||
139
Table of Contents
|
Name (Date of Birth) |
Position in MUFG |
Business Experience |
||||
|
Tatsuo Wakabayashi
|
Deputy Chairman and Chief Audit Officer |
April 1977 June 2004 |
Joined Mitsubishi Trust Bank Director (Non-Board Member Director) of Mitsubishi Trust Bank |
|||
|
October 2005 |
Executive Officer of MUTB |
|||||
| June 2006 | Managing Executive Officer of MUTB | |||||
| June 2008 | Managing Director of MUTB | |||||
| June 2009 | Senior Managing Director of MUTB | |||||
| June 2010 | Managing Officer of MUFG | |||||
| June 2011 | Director of MUFG | |||||
| April 2012 | President of MUTB | |||||
| April 2013 | Deputy Chairman of MUFG (incumbent) | |||||
| December 2013 |
President and Chairman of MUTB (incumbent) |
|||||
|
Nobuyuki Hirano
|
President & CEO |
April 1974 June 2001 |
Joined Mitsubishi Bank Non-Board Member Director of Bank of Tokyo-Mitsubishi |
|||
| July 2004 | Executive Officer of MTFG | |||||
|
May 2005 |
Non-Board Member Managing Director of Bank of Tokyo-Mitsubishi |
|||||
|
June 2005 |
Managing Director of Bank of Tokyo-Mitsubishi |
|||||
| Director of MTFG | ||||||
| October 2005 | Director of MUFG | |||||
| January 2006 | Managing Director of BTMU | |||||
| October 2008 | Senior Managing Director of BTMU | |||||
| June 2009 | Deputy President of BTMU | |||||
| Managing Officer of MUFG | ||||||
| June 2010 | Director of MUFG | |||||
| October 2010 | Deputy President of MUFG | |||||
| April 2012 | President of BTMU (incumbent) | |||||
| Director of MUFG | ||||||
| April 2013 | President & CEO of MUFG (incumbent) | |||||
|
Masaaki Tanaka
|
Deputy President |
April 1977 |
Joined Mitsubishi Bank |
|||
|
June 2004 |
Non-Board Member Director of Bank of Tokyo-Mitsubishi |
|||||
|
Executive Officer of MTFG |
||||||
|
May 2005 |
Retired from Executive Officer of MTFG |
|||||
|
January 2006 |
Executive Officer of BTMU |
|||||
|
Executive Officer of MUFG |
||||||
|
April 2007 May 2007 |
Retired from Executive Officer of MUFG Managing Executive Officer of BTMU President and Chief Executive Officer of Union Bank of California |
|||||
|
June 2010 |
Managing Officer of MUFG |
|||||
|
May 2011 |
Senior Managing Executive Officer of BTMU |
|||||
|
Director of Morgan Stanley (incumbent) |
||||||
|
May 2012 |
Retired from Managing Officer of MUFG |
|||||
|
June 2012 |
Retired from Senior Managing Executive Officer of BTMU |
|||||
|
Deputy President of MUFG (incumbent) |
||||||
140
Table of Contents
|
Name (Date of Birth) |
Position in MUFG |
Business Experience |
||||
|
Taihei Yuki
|
Senior Managing Director and Chief Financial Officer |
April 1977 |
Joined Mitsubishi Trust Bank |
|||
|
June 2004 |
Director (Non-Board Member Director) of Mitsubishi Trust Bank |
|||||
|
July 2004 |
Executive Officer of MTFG |
|||||
|
October 2005 |
Executive Officer of MUTB |
|||||
|
June 2006 |
Managing Executive Officer of MUTB |
|||||
|
June 2007 |
Managing Director of MUTB |
|||||
|
Director of MUFG |
||||||
|
June 2008 |
Managing Officer of MUFG |
|||||
|
June 2009 June 2010 |
Senior Managing Director of MUTB Retired from Managing Officer of MUFG |
|||||
|
June 2011 |
Retired from Senior Managing Director of MUTB |
|||||
|
Director of BTMU (incumbent) |
||||||
|
Senior Managing Director of MUFG (incumbent) |
||||||
|
Akihiko Kagawa
|
Senior Managing Director and Chief Compliance and Risk Officer |
April 1980 | Joined Bank of Tokyo | |||
| June 2006 | Executive Officer of BTMU | |||||
| May 2010 | Executive Officer of MUFG | |||||
| May 2012 |
Retired from Executive Officer of BTMU Managing Officer of MUFG |
|||||
| June 2012 |
Director of kabu.com Securities Co., Ltd. (incumbent) |
|||||
|
Director of MUSHD (incumbent) Managing Director of MUFG |
||||||
| May 2014 |
Senior Managing Director of MUFG (incumbent) |
|||||
|
Tadashi Kuroda
|
Managing Director and Chief Planning Officer |
April 1981 | Joined Sanwa Bank | |||
| April 2008 | Executive Officer of BTMU | |||||
|
May 2011 |
Retired from Executive Officer of BTMU |
|||||
|
June 2011 |
Senior Managing Executive Officer of Mitsubishi UFJ Research and Consulting Co., Ltd. (MURC) |
|||||
|
Director and Senior Managing Executive Officer of MURC |
||||||
| May 2013 | Managing Executive Officer of BTMU | |||||
|
Retired from Director and Senior Managing Executive Officer of MURC |
||||||
|
May 2014 |
Retired from Managing Executive Officer of BTMU |
|||||
| Managing Officer of MUFG | ||||||
| June 2014 | Director of MUTB (incumbent) | |||||
| Managing Director of MUFG (incumbent) | ||||||
141
Table of Contents
|
Name (Date of Birth) |
Position in MUFG |
Business Experience |
||||
|
Takashi Nagaoka
|
Director | April 1976 | Joined Mitsubishi Bank | |||
| June 2003 |
Non-Board Member Director of Bank of Tokyo-Mitsubishi |
|||||
| January 2006 | Executive Officer of BTMU | |||||
| May 2006 | Managing Executive Officer of BTMU | |||||
|
April 2008 |
Managing Officer of MUFG |
|||||
|
June 2008 |
Managing Director of BTMU |
|||||
| May 2010 | Senior Managing Executive Officer of BTMU | |||||
| Retired from Managing Officer of MUFG | ||||||
| April 2011 | Managing Officer of MUFG | |||||
| June 2011 | Deputy President of BTMU | |||||
| May 2012 | Retired from Managing Officer of MUFG | |||||
| May 2014 | Retired from Deputy President of BTMU | |||||
| June 2014 | Advisor of MUSHD | |||||
| Advisor of MUMSS | ||||||
| President & CEO of MUMSS (incumbent) | ||||||
| President & CEO of MUSHD (incumbent) | ||||||
| Director of MUFG (incumbent) | ||||||
|
Junichi Okamoto
|
Director and Group Head, Integrated Trust Assets Business Group |
April 1980 | Joined Toyo Trust Bank | |||
| June 2008 | Executive Officer of MUTB | |||||
| June 2010 | Managing Executive Officer of MUTB | |||||
| Executive Officer of MUFG | ||||||
|
June 2012 |
Senior Managing Executive Officer of MUTB |
|||||
|
June 2013 |
Deputy President of MUTB (incumbent) |
|||||
| Director of MUFG (incumbent) | ||||||
|
Hiroyuki Noguchi
|
Director |
April 1981 |
Joined Tokai Bank |
|||
| June 2009 |
Executive Officer of BTMU |
|||||
| May 2011 |
Retired from Executive Officer of BTMU |
|||||
|
June 2011 |
Senior Executive Officer of MUSHD |
|||||
|
Senior Executive Officer of MUMSS |
||||||
|
Managing Director of MUMSS (incumbent) |
||||||
|
Managing Director of MUSHD (incumbent) |
||||||
|
Director of MUFG (incumbent) |
||||||
142
Table of Contents
|
Name (Date of Birth) |
Position in MUFG |
Business Experience |
||||
|
Ryuji Araki
|
Director (Outside Officer) |
April 1962 |
Joined the Toyota Motor Co., Ltd. |
|||
| September 1992 |
Director, Member of the Board of TOYOTA MOTOR CORPORATION (TOYOTA) |
|||||
| June 1997 |
Managing Director, Member of the Board of TOYOTA |
|||||
|
June 1999 |
Senior Managing Director, Member of the Board of TOYOTA |
|||||
|
June 2001 |
Vice President, Member of the Board and Representative Director of TOYOTA |
|||||
|
June 2002 |
Auditor of Aioi Insurance Company Limited. (Aioi Insurance) |
|||||
|
June 2005 |
Senior Advisor to the Board of TOYOTA |
|||||
|
Chairman of Aioi Insurance |
||||||
|
Chairman of TOYOTA FINANCIAL SERVICES CORPORATION. (TFS) |
||||||
|
June 2007 |
Advisor of TFS |
|||||
|
June 2008 |
Advisor of TOYOTA (incumbent) |
|||||
|
Senior Advisor of Aioi Insurance |
||||||
|
June 2009 |
Retired from Advisor of TFS Director of MUFG (incumbent) |
|||||
|
October 2010 |
Senior Advisor of Aioi Nissay Dowa Insurance Co., Ltd. (Aioi Nissay Dowa Insurance) |
|||||
|
June 2012 |
Advisor of Aioi Nissay Dowa Insurance |
|||||
|
June 2014 |
Retired from Advisor of Aioi Nissay Dowa Insurance |
|||||
|
Yuko Kawamoto
|
Director |
April 1982 |
Joined Bank of Tokyo |
|||
|
April 1986 |
Left Bank of Tokyo |
|||||
|
September 1988 |
Joined McKinsey & Company, Inc. |
|||||
|
July 2001 |
Senior Expert of McKinsey & Company, Inc., Tokyo office |
|||||
|
March 2004 |
Left McKinsey & Company, Inc. |
|||||
|
April 2004 |
Professor at Waseda Graduate School of Finance, Accounting and Law (incumbent) |
|||||
|
June 2006 |
Audit & Supervisory Board Member of Tokio Marine Holdings, Inc. (incumbent) |
|||||
|
January 2013 |
Director of Japan Exchange Group, Inc. |
|||||
|
June 2013 |
Director of MUFG (incumbent) |
|||||
|
June 2014 |
Retired from Director of Japan Exchange Group, Inc. |
|||||
143
Table of Contents
|
Name (Date of Birth) |
Position in MUFG |
Business Experience |
||||
|
Tsutomu Okuda
|
Director
|
April 1964 |
Joined Daimaru, Inc. |
|||
|
September 1991 |
Managing Director of Daimaru Australia Pty. Ltd. |
|||||
|
May 1995 |
Director of Daimaru, Inc. |
|||||
|
May 1996 |
Managing Director of Daimaru, Inc. |
|||||
|
March 1997 |
President of Daimaru, Inc. |
|||||
|
May 2003 |
Chairman and Chief Executive Officer of Daimaru, Inc. |
|||||
|
September 2007 |
Chairman of Daimaru, Inc. |
|||||
|
President and Chief Executive Officer of J . Front Retailing Co., Ltd. |
||||||
|
March 2010 |
Chairman and Chief Executive Officer of J . Front Retailing Co., Ltd. |
|||||
|
January 2013 |
Director of Japan Exchange Group, Inc. (incumbent) |
|||||
|
April 2013 |
Director and Senior Advisor of J . Front Retailing Co., Ltd. |
|||||
|
May 2014 |
Senior Advisor of J . Front Retailing Co., Ltd. (incumbent) |
|||||
|
June 2014 |
Director of MUFG (incumbent) |
|||||
|
Kunie Okamoto
|
Director
|
June 1969 |
Joined Nippon Life Insurance Company (Nippon Life) |
|||
|
July 1995 |
Director of Nippon Life |
|||||
| March 1999 |
Managing Director of Nippon Life |
|||||
| March 2002 |
Senior Managing Director of Nippon Life |
|||||
|
April 2005 |
President of Nippon Life |
|||||
|
June 2005 |
Corporate Auditor of UFJ Holdings, Inc. Corporate Auditor of TOKYU CORPORATION (incumbent) |
|||||
|
October 2005 June 2010 |
Corporate Auditor of MUFG Director of Kintetsu Corporation (incumbent) Corporate Auditor of Daicel Corporation (incumbent) |
|||||
|
April 2011 |
Chairman of Nippon Life (incumbent) |
|||||
|
June 2014 |
Director of MUFG (incumbent) |
|||||
|
Haruka Matsuyama
|
Director
|
April 1995 |
Assistant Judge, Tokyo District Court |
|||
| July 2000 |
Attorney at law, Hibiya Park Law Offices Member, the Daini Tokyo Bar Association |
|||||
| January 2002 |
Partner, Hibiya Park Law Offices (incumbent) |
|||||
|
June 2012 |
Corporate Auditor, Vitec Co., Ltd. (incumbent) |
|||||
|
June 2013 |
Director, T&D Holdings, Inc. (incumbent) |
|||||
|
June 2014 |
Corporate Auditor, MITSUI & CO., LTD. (incumbent) |
|||||
|
Director of MUFG (incumbent) |
||||||
144
Table of Contents
The following table sets forth our corporate auditors as of July 1, 2014, together with their respective dates of birth, positions and experience:
|
Name (date of birth) |
Position in MUFG |
Business experience |
||||
|
Takehiko Nemoto
|
Corporate Auditor
|
April 1976 |
Joined Mitsubishi Bank |
|||
|
June 2004 |
Non-Board Member Director of Bank of Tokyo-Mitsubishi |
|||||
|
October 2005 |
Executive Officer of MUFG |
|||||
|
January 2006 |
Executive Officer of BTMU |
|||||
|
October 2008 |
Managing Executive Officer of BTMU |
|||||
|
May 2009 |
Managing Officer of MUFG |
|||||
|
June 2009 |
Managing Director of BTMU |
|||||
|
October 2010 |
Senior Managing Director of BTMU |
|||||
|
May 2011 |
Retired from Managing Officer of MUFG |
|||||
|
June 2011 |
Retired from Senior Managing Director of BTMU |
|||||
|
Corporate Auditor (Full-Time) of MUFG (incumbent) |
||||||
|
June 2013 |
Corporate Auditor of MUMSS (incumbent) Corporate Auditor of MUSHD (incumbent) |
|||||
|
Takashi Mikumo
|
Corporate Auditor
|
April 1980 |
Joined Toyo Trust Bank |
|||
|
June 2007 |
Executive Officer of MUTB |
|||||
|
Executive Officer of MUFG |
||||||
|
June 2009 |
Managing Director of MUTB |
|||||
|
Retired from Executive Officer of MUFG |
||||||
|
June 2012 |
Senior Managing Director of MUTB |
|||||
|
June 2013 |
Retired from Senior Managing Director of MUTB |
|||||
|
Corporate Auditor (Full-Time) of MUFG (incumbent) |
||||||
|
Yasushi Ikeda
|
Corporate Auditor
|
April 1972 |
Admitted to the Bar Joined the Tokyo Bar Association |
|||
|
April 1977 |
Partner of the law firm Miyake Imai & Ikeda (incumbent) |
|||||
|
June 2009 |
Corporate Auditor of MUFG (incumbent) |
|||||
145
Table of Contents
|
Name (date of birth) |
Position in MUFG |
Business experience |
||||
|
Hideo Kojima
|
Corporate Auditor
|
March 1980 |
Became a member of the Japanese Institute of Certified Public Accountants |
|||
|
May 1995 |
Representative Partner of Showa Ota & Co. |
|||||
|
May 2000 |
Executive Director of Century Ota Showa & Co. |
|||||
|
July 2001 |
Executive Director of Shin Nihon & Co. |
|||||
|
May 2006 |
Deputy Chief Executive Officer of Shin Nihon & Co. |
|||||
|
July 2008 |
Deputy Chief Executive Officer of Ernst & Young ShinNihon LLC. |
|||||
|
September 2010 |
Senior Advisor of Ernst & Young ShinNihon LLC. |
|||||
|
June 2011 |
Retired from Ernst & Young ShinNihon LLC. |
|||||
|
Certified Public Accountant of Hideo Kojima CPA Office (incumbent) |
||||||
|
Corporate Auditor of Sumitomo Heavy Industries, Ltd. (incumbent) Auditor of Alpine Electronics, Inc. (incumbent) |
||||||
|
June 2013 |
Corporate Auditor of MUFG (incumbent) |
|||||
|
Yukihiro Sato
|
Corporate Auditor
|
April 1969 June 2001 |
Joined Mitsubishi Electric Corporation Director and General Manager, Corporate Accounting Division of Mitsubishi Electric Corporation |
|||
|
April 2003 |
Managing Director and General Manager, Corporate Accounting Division of Mitsubishi Electric Corporation |
|||||
|
June 2003 |
Director, Senior Executive Officer and General Manager, Corporate Accounting Division of Mitsubishi Electric Corporation |
|||||
|
April 2005 |
Director and Senior Vice President of Mitsubishi Electric Corporation |
|||||
|
April 2007 |
Director, Representative Executive Officer and Executive Vice President of Mitsubishi Electric Corporation |
|||||
|
April 2009 |
Director of Mitsubishi Electric Corporation |
|||||
|
June 2009 |
Senior Corporate Adviser of Mitsubishi Electric Corporation |
|||||
|
June 2013 |
Adviser of Mitsubishi Electric Corporation |
|||||
|
June 2014 |
Corporate Auditor of MUFG (incumbent) |
|||||
|
July 2014 |
Adviser of Mitsubishi Electric Corporation (incumbent) |
|||||
The board of directors and corporate auditors may be contacted through our headquarters at Mitsubishi UFJ Financial Group, Inc., 7-1, Marunouchi 2-chome, Chiyoda-ku, Tokyo 100-8330, Japan.
All directors and corporate auditors were elected at a general meeting of shareholders. The regular term of office of a director is one year from the date of election, and the regular term of office of a corporate auditor is four years from the date of election. Directors and corporate auditors may serve their terms until the close of the
146
Table of Contents
annual general meeting of shareholders held in the last year of their terms. Directors and corporate auditors may serve any number of consecutive terms. No family relationship exists among any of our directors or corporate auditors. None of our directors is party to a service contract with MUFG or any of its subsidiaries that provides for benefits upon termination of employment.
Ms. Yuko Kawamoto has, in the past, worked at The Bank of Tokyo, Ltd. (currently The Bank of Tokyo-Mitsubishi UFJ, Ltd.) and thus does not satisfy the requirements for Outside Director provided in Article 2, Item 15 of the Company Law. However, she has experience and knowledge derived from having served as a management consultant and graduate school professor for more than 25 years after her career at The Bank of Tokyo. Therefore, her conditions are believed to be the same as those of Outside Director, in terms of independence from the Company. The Company expects her to reflect such experience and knowledge in duties as a Director, including supervising business operations, from the perspective from outside the Company.
| B. | Compensation |
The aggregate amount of compensation paid, including benefits in kind granted and any contingent and deferred compensation by MUFG and its subsidiaries during the fiscal year ended March 31, 2014 to our directors (excluding outside directors), to corporate auditors (excluding outside auditors) and to outside directors and auditors, was ¥1,216 million, ¥114 million and ¥119 million, respectively.
The compensation paid by MUFG and its subsidiaries during the fiscal year ended March 31, 2014 to our directors and corporate auditors consists of annual base salaries, stock acquisition rights, bonuses and other benefits. The maximum aggregate amount of each type of compensation for our directors and corporate auditors is approved at a general meeting of our shareholders. The amount and allocation of compensation for each director are then proposed to, and voted upon by, the board of directors. The amount and allocation of compensation for each corporate auditor are determined through discussions and agreement among the corporate auditors. The nomination and compensation committee deliberates and makes proposals to the board of directors regarding matters relating to, among other things, the compensation of our directors. For more information on the nomination and compensation committee, see “—C. Board Practices.”
The following table sets forth details of the aggregate compensation paid by MUFG and its subsidiaries during the fiscal year ended March 31, 2014 to our directors (excluding outside directors) and corporate auditors (excluding outside corporate auditors):
| Non-Adjustable Compensation | ||||||||||||||||||||||||
|
Number of Directors and Corporate Auditors (1) |
Aggregate
Compensation |
Base
Salary |
Stock
Acquisition Rights |
Adjustable
Compensation (Cash Bonuses) |
Retirement
Allowances (2) |
Other | ||||||||||||||||||
| (in millions) | ||||||||||||||||||||||||
|
19 |
¥ | 1,330 | ¥ | 780 | ¥ | 265 | ¥ | 240 | ¥ | 45 | ¥ | 0 | ||||||||||||
| Notes: |
| (1) | Includes current directors and corporate auditors as well as those who retired during the fiscal year ended March 31, 2014 but excludes outside directors and corporate auditors. |
| (2) | Represents the aggregate amount of retirement allowances paid in cash during the fiscal year ended March 31, 2014, pursuant to a one-time shareholders’ approval in June 2007 for the retirement allowances to be paid to the directors and corporate auditors who were elected prior to that date at the time of their retirement. A reserve in the total amount of such retirement allowances was set aside as of September 30, 2007. For more information, see “—Retirement Allowances” below. |
147
Table of Contents
The following table sets forth the details of individual compensation paid, including benefits in kind granted but excluding retirement allowances paid, by MUFG and its subsidiaries in an amount equal to or exceeding ¥100 million during the fiscal year ended March 31, 2014:
|
Directors |
Aggregate
amount |
Paid by | Compensation paid | |||||||||||||||||
|
Annual
salary |
Stock
options |
Bonus | ||||||||||||||||||
| (in millions) | ||||||||||||||||||||
|
Takamune Okihara |
¥ | 122 | MUFG | ¥ | 15 | ¥ | 7 | ¥ | 6 | |||||||||||
| BTMU | 55 | 17 | 22 | |||||||||||||||||
|
Tatsuo Wakabayashi |
¥ | 103 | MUFG | ¥ | 15 | ¥ | 6 | ¥ | 5 | |||||||||||
| MUTB | 51 | 11 | 15 | |||||||||||||||||
|
Nobuyuki Hirano |
¥ | 126 | MUFG | ¥ | 15 | ¥ | 6 | ¥ | 5 | |||||||||||
| BTMU | 59 | 18 | 23 | |||||||||||||||||
|
Masaaki Tanaka |
¥ | 112 | MUFG | ¥ | 60 | ¥ | 33 | ¥ | 19 | |||||||||||
Annual Base Salary
Annual base salaries are paid to our directors (including outside directors) and corporate auditors (including outside corporate auditors) in the form of monthly cash installment payments. The aggregate annual base salary paid to our directors (excluding outside corporate directors) and corporate auditors (excluding outside corporate auditors) for the fiscal year ended March 31, 2014 was ¥780 million. The aggregate annual base salary paid to our outside directors and outside corporate auditors for the same period was ¥81 million.
Stock-based Compensation Plans
We issue stock acquisition rights to further motivate our directors (excluding outside directors) to contribute to the improvement of our stock prices and profits. The number of options granted to each director is determined by comprehensively taking into account each grantee’s seniority of the position held at MUFG or its subsidiaries, experience and contribution to our performance throughout the period of the grantee’s service within the maximum aggregate number of options approved by our shareholders. On June 27, 2013, our shareholders approved modifications to the previous shareholder authorization for granting stock acquisition rights to our directors, corporate auditors and certain of our officers so that no outside directors or corporate auditors (including outside corporate auditors) are eligible for any stock-based compensation plan adopted by the board of directors on or after that date.
As part of our compensation structure, on June 28, 2007, our shareholders approved the creation of a stock-based compensation plan for our directors, corporate auditors and certain of our officers. On November 21, 2007, the board of directors adopted a plan entitled “First Series of Stock Acquisition Rights of Mitsubishi UFJ Financial Group, Inc.” for our directors, corporate auditors and certain of our officers. Under the stock-based compensation plan, on December 6, 2007, we allotted an aggregate of 3,224 stock acquisition rights to our directors and an aggregate of 493 stock acquisition rights to our corporate auditors for their respective services to MUFG and its subsidiaries. Each stock acquisition right represents a right to purchase 100 shares of MUFG common stock at ¥1 per share of common stock. The stock acquisition rights were subject to a one-year vesting period. The rights are exercisable until December 5, 2037, but only after the date on which a grantee’s service as a director and an officer or as a corporate auditor of each of MUFG and the relevant subsidiaries terminates. The fair value of each stock acquisition right was ¥103,200.
As part of our compensation structure, on June 27, 2008, the board of directors adopted another stock-based compensation plan entitled “Second Series of Stock Acquisition Rights of Mitsubishi UFJ Financial Group, Inc.” for our directors, corporate auditors and certain of our officers. Under the stock-based compensation plan, on July 15, 2008, we allotted an aggregate of 4,690 stock acquisition rights to our directors and an aggregate of 495 stock acquisition rights to our corporate auditors for their respective services to MUFG and its subsidiaries. Each
148
Table of Contents
stock acquisition right represents a right to purchase 100 shares of MUFG common stock at ¥1 per share of common stock. The stock acquisition rights were subject to a one-year vesting period. The rights are exercisable until July 14, 2038, but only after the date on which a grantee’s service as a director and an officer or as a corporate auditor of each of MUFG and the relevant subsidiaries terminates. The fair value of each stock acquisition right was ¥92,300.
As part of our compensation structure, on June 26, 2009, the board of directors adopted another stock-based compensation plan entitled “Third Series of Stock Acquisition Rights of Mitsubishi UFJ Financial Group, Inc.” for our directors, corporate auditors and certain of our officers. Under the stock-based compensation plan, on July 14, 2009, we allotted an aggregate of 6,466 stock acquisition rights to our directors and an aggregate of 872 stock acquisition rights to our corporate auditors for their respective services to MUFG and its subsidiaries. Each stock acquisition right represents a right to purchase 100 shares of MUFG common stock at ¥1 per share of common stock. The stock acquisition rights were subject to a one-year vesting period. The rights are exercisable until July 13, 2039, but only after the date on which a grantee’s service as a director and an officer or as a corporate auditor of each of MUFG and the relevant subsidiaries terminates. The fair value of each stock acquisition right was ¥48,700.
As part of our compensation structure, on June 29, 2010, the board of directors adopted another stock-based compensation plan entitled “Fourth Series of Stock Acquisition Rights of Mitsubishi UFJ Financial Group, Inc.” for our directors, corporate auditors and certain of our officers. Under the stock-based compensation plan, on July 16, 2010, we allotted an aggregate of 8,014 stock acquisition rights to our directors and an aggregate of 1,149 stock acquisition rights to our corporate auditors for their respective services to MUFG and its subsidiaries. Each stock acquisition right represents a right to purchase 100 shares of MUFG common stock at ¥1 per share of common stock. The stock acquisition rights are subject to a one-year vesting period. The rights are exercisable until July 15, 2040, but only after the date on which a grantee’s service as a director and an officer or as a corporate auditor of each of MUFG and the relevant subsidiaries terminates. The fair value of each stock acquisition right was ¥36,600.
As part of our compensation structure, on June 29, 2011, the board of directors adopted another stock-based compensation plan entitled “Fifth Series of Stock Acquisition Rights of Mitsubishi UFJ Financial Group, Inc.” for our directors, corporate auditors and certain of our officers. Under the stock-based compensation plan, on July 20, 2011, we allotted an aggregate of 7,740 stock acquisition rights to our directors and an aggregate of 1,160 stock acquisition rights to our corporate auditors for their respective services to MUFG and its subsidiaries. Each stock acquisition right represents a right to purchase 100 shares of MUFG common stock at ¥1 per share of common stock. The stock acquisition rights are subject to a one-year vesting period. The rights are exercisable until July 19, 2041, but only after the date on which a grantee’s service as a director and an officer or as a corporate auditor of each of MUFG and the relevant subsidiaries terminates. The fair value of each stock acquisition right was ¥33,700.
As part of our compensation structure, on June 28, 2012, the board of directors adopted another stock-based compensation plan entitled “Sixth Series of Stock Acquisition Rights of Mitsubishi UFJ Financial Group, Inc.” for our directors, corporate auditors and certain of our officers. Under the stock-based compensation plan, on July 18, 2012, we allotted an aggregate of 10,002 stock acquisition rights to our directors and an aggregate of 1,161 stock acquisition rights to our corporate auditors for their respective services to MUFG and its subsidiaries. Each stock acquisition right represents a right to purchase 100 shares of MUFG common stock at ¥1 per share of common stock. The stock acquisition rights are subject to a one-year vesting period. The rights are exercisable until July 17, 2042, but only after the date on which a grantee’s service as a director and an officer or as a corporate auditor of each of MUFG and the relevant subsidiaries terminates. The fair value of each stock acquisition right was ¥33,100.
As part of our compensation structure, on June 27, 2013, the board of directors adopted a stock-based compensation plan entitled “Seventh Series of Stock Acquisition Rights of Mitsubishi UFJ Financial Group,
149
Table of Contents
Inc.” for our directors (excluding outside directors) and certain of our officers. Under the stock-based compensation plan, on July 17, 2013, we allotted an aggregate of 4,103 stock acquisition rights to our directors (excluding outside directors) for their respective services to MUFG and its subsidiaries. Each stock acquisition right represents a right to purchase 100 shares of MUFG common stock at ¥1 per share of common stock. The stock acquisition rights are subject to a one-year vesting period. The rights are exercisable until July 16, 2043, but only after the date on which a grantee’s service as a director and an officer of each of MUFG and the relevant subsidiaries terminates. The fair value of each stock acquisition right was ¥61,100.
As part of our compensation structure, on June 27, 2014, the board of directors adopted a stock-based compensation plan entitled “Eighth Series of Stock Acquisition Rights of Mitsubishi UFJ Financial Group, Inc.” for our directors (excluding outside directors) and certain of our officers. Under the stock-based compensation plan, on July 15, 2014, we allotted an aggregate of 3,315 stock acquisition rights to our directors (excluding outside directors) for their respective services to MUFG and its subsidiaries. Each stock acquisition right represents a right to purchase 100 shares of MUFG common stock at ¥1 per share of common stock. The stock acquisition rights are subject to a one-year vesting period. The rights are exercisable until July 14, 2044, but only after the date on which a grantee’s service as a director and an officer of each of MUFG and the relevant subsidiaries terminates. The fair value of each stock acquisition right was ¥53,900.
Bonuses
We from time to time pay cash bonuses to our directors to further motivate them to contribute to the improvement of our stock prices and profits if such bonuses are deemed appropriate based on a balanced scorecard approach taking into account the results of operations of the MUFG Group and each director’s individual performance of his duties as a director in light of both quantitative and qualitative criteria, including our medium-term strategy for improving our corporate value. None of the outside directors and corporate auditors (including outside corporate auditors) is eligible to receive a cash bonus. The nomination and compensation committee evaluates the amount of cash bonuses annually to determine the reasonableness of the amount in proportion to the aggregate compensation approved by our shareholders. The aggregate cash bonus paid to our directors for the fiscal year ended March 31, 2014 was ¥240 million.
Retirement Allowances
Prior to June 28, 2007, in accordance with customary Japanese practice, when a director or corporate auditor retired, a proposal to pay a retirement allowance was submitted at the annual ordinary general meeting of shareholders for approval. The retirement allowance consisted of a one-time payment of a portion of the allowance paid at the time of retirement and periodic payments of the remaining amount for a prescribed number of years. After the shareholders’ approval was obtained, the retirement allowance for a director or corporate auditor was fixed by the board of directors or by consultation among the corporate auditors in accordance with our internal regulations and practice and generally reflected the position of the director or corporate auditor at the time of retirement, the length of his service as a director or corporate auditor and his contribution to our performance. Historically, MUFG did not set aside reserves for any retirement payments for directors and corporate auditors made under this practice.
Pursuant to a one-time shareholders’ approval in June 2007, retirement allowances are paid in cash to the directors and corporate auditors who were elected prior to that date at the time of their retirement. A reserve in the total amount of such retirement allowances was set aside as of September 30, 2007. The aggregate amount of retirement allowances paid in cash by MUFG and its subsidiaries pursuant to the one-time shareholder approval during the fiscal year ended March 31, 2014 to our directors (excluding outside directors), to corporate auditors (excluding outside auditors) and to outside directors and auditors, who have retired from their respective positions held at MUFG or, if such directors and corporate auditors concurrently held positions at MUFG’s subsidiaries, who have retired from such positions, was ¥45 million, nil and ¥32 million, respectively.
150
Table of Contents
UNBC Stock Bonus Plan
UNBC (now MUAH) has a discretionary stock bonus plan under which selected employees of UNBC and its subsidiaries are paid some or a portion of annual bonuses in the form of Restricted Share Units representing a right to receive American Depositary Receipts, or ADRs, evidencing American Depositary Shares, or ADSs, each exchangeable for one share of MUFG common stock, from an independent trust established to administer the plan grants upon the satisfaction of vesting conditions as determined by the Executive Compensation and Benefits Committee of UNBC’s board of directors, consistent with the plan and pursuant to a Restricted Share Unit Agreement between UNBC and the grantees.
Unless otherwise provided in the relevant Restricted Share Unit Agreement, Restricted Share Units will become vested and nonforfeitable as follows: one-third (33 1 / 3 %) of a grantee’s Restricted Share Units would vest on each one year anniversary of the date of the award such that all of the Restricted Share Units would be fully vested after three years from the date of the award so long as the grantee remains an employee of UNBC or its subsidiaries.
The ADSs to be delivered to grantees will be purchased on the open market by the trustee of the independent trust pursuant to a trust agreement between UNBC and the trustee.
For more information on the MUAH stock bonus plan, see Note 32 to our consolidated financial statements included elsewhere in this Annual Report. See also “Item 16E. Purchases of Equity Securities by the Issuer and Affiliated Purchasers.”
BTMU Headquarters for the Americas Stock Bonus Plan
Effective August 27, 2012, BTMU Headquarters for the Americas, or BTMU HQA (now MUAH), adopted a stock bonus plan. Under the plan, qualified key employees of BTMU HQA are granted Restricted Stock Units, or RSUs, representing a right to receive American Depositary Receipts, or ADRs, evidencing American Depositary Shares, or ADSs, each exchangeable for one share of MUFG common stock, from an independent trust established to administer the plan grants, upon the satisfaction of vesting conditions. The RSUs vest pro-rata on each anniversary of the grant date and become fully vested three years from the grant date so long as the grantee satisfies the specified continuous service requirement and any other conditions under the plan documents.
The ADSs to be delivered to grantees will be purchased on the open market by the trustee of the independent trust. As of June 1, 2014, 3,686,849 RSUs have been granted under the plan.
See “Item 16E. Purchases of Equity Securities by the Issuer and Affiliated Purchasers.”
151
Table of Contents
Share Ownership
As of June 30, 2014, our directors and corporate auditors held the following numbers of shares of our common stock:
|
Directors |
Number of Shares
Registered |
|||
|
Kiyoshi Sono |
43,620 | |||
|
Tatsuo Wakabayashi |
20,500 | |||
|
Nobuyuki Hirano |
34,000 | |||
|
Masaaki Tanaka |
14,200 | |||
|
Taihei Yuki |
140,330 | |||
|
Akihiko Kagawa |
153,400 | |||
|
Tadashi Kuroda |
94,900 | |||
|
Takashi Nagaoka |
386,940 | |||
|
Junichi Okamoto |
9,120 | |||
|
Hiroyuki Noguchi |
95,800 | |||
|
Ryuji Araki |
63,300 | |||
|
Yuko Kawamoto |
4,200 | |||
|
Tsutomu Okuda |
— | |||
|
Kunie Okamoto |
536 | |||
|
Haruka Matsuyama |
— | |||
|
Corporate Auditors |
Number of Shares
Registered |
|||
|
Takehiko Nemoto |
145,800 | |||
|
Takashi Mikumo |
251,100 | |||
|
Yasushi Ikeda |
— | |||
|
Hideo Kojima |
— | |||
|
Yukihiro Sato |
9,500 | |||
| C. | Board Practices |
Our articles of incorporation provide for a board of directors of not more than twenty members and not more than seven corporate auditors. Our corporate officers are responsible for executing our business operations, and our directors oversee these officers and set our fundamental strategies.
We currently have fifteen directors. Our board of directors has ultimate responsibility for the administration of our affairs. By resolution, our board of directors shall appoint, from the directors, representative directors who may represent us severally. Our board of directors shall appoint a president and may also appoint a chairman, deputy chairmen, deputy presidents, senior managing directors and managing directors from their members by resolution. Deputy presidents assist the president, and senior managing directors and managing directors assist the president and deputy presidents, if any, in the management of our day-by-day operations.
We currently have four outside directors as members of our board of directors. Under the Company Law, an outside director is defined as a person who has never been an executive director ( gyomu shikko torishimariyaku ), executive officer ( shikkoyaku ), manager ( shihainin ) or any other type of employee of the company or any of its subsidiaries prior to his or her appointment.
In June 2014, the Japanese Diet passed amendments to the Company Law, among other things, to exclude from the definition of “outside director” a person who has a certain relationship with the relevant company or an individual who controls the management of the company. The amendments also include provisions that are designed to encourage large companies to have an “outside director” by requiring large companies which do not have any “outside directors” to explain the reason at annual shareholders meetings. These amendments will become effective on a date within eighteen months from June 27, 2014.
152
Table of Contents
Under the Company Law, a resolution of the board of directors is required if any director wishes to engage in any business that is in competition with us or any transaction with us. Additionally, no director may vote on a proposal, arrangement or contract in which that director is deemed to be particularly interested.
Neither the Company Law nor our articles of incorporation contain special provisions as to the borrowing power exercisable by a director, the retirement age of our directors and corporate auditors or a requirement of our directors and corporate auditors to hold any shares of our capital stock.
The Company Law requires a resolution of the board of directors for a company to determine the execution of important businesses, to acquire or dispose of material assets, to borrow substantial amounts of money, to employ or discharge managers ( shihainin ) and other important employees, and to establish, change or abolish branch offices or other material corporate organizations, to float bonds, to establish internal control systems, and to exempt a director from liability to the company in accordance with applicable laws and regulations.
We currently have five corporate auditors, including three outside corporate auditors. An outside corporate auditor is defined under the Company Law as a person who has not served as a director, account assistant, executive officer ( shikkoyaku ), manager ( shihainin ) or any other type of employee of the company or any of its subsidiaries prior to his or her appointment.
Our corporate auditors, who are not required to be certified public accountants, have various statutory duties, including principally:
| Ÿ |
the examination of the financial statements, business reports, proposals and other documents which our board of directors prepares and submits to a general meeting of shareholders; |
| Ÿ |
the examination of our directors’ administration of our affairs; and |
| Ÿ |
the preparation and submission of a report on their examination to a general meeting of shareholders. |
Our corporate auditors are obligated to attend meetings of our board of directors, and to make statements at the meetings if they deem necessary, although they are not entitled to vote at the meetings. Our corporate auditors comprise the board of corporate auditors, which determines matters relating to the performance of audits. The Company Law provides that a company that has or is required to have a board of corporate auditors must have three or more corporate auditors, and at least half of the corporate auditors must be outside corporate auditors. In a company that has or is required to have a board of corporate auditors, one or more of the corporate auditors must be designated by the board of corporate auditors to serve on a full-time basis.
Under the Company Law and our articles of incorporation, we may exempt, by resolution of the board of directors, our directors and corporate auditors from liabilities to the company arising in connection with their failure to execute their duties without gross negligence, within the limits stipulated by applicable laws and regulations. In addition, we have entered into a liability limitation agreement with each outside director and outside corporate auditor which limits the maximum amount of their liability to the company arising in connection with a failure to execute their duties without gross negligence to the greater of either ¥10 million or the aggregate sum of the amounts prescribed in paragraph 1 of Article 425 of the Company Law and Articles 113 and 114 of the Company Law Enforcement Regulations.
The Company Law permits two types of governance systems for large companies, including MUFG. The first system is for companies with audit, nomination and compensation committees, and the other is for companies with corporate auditors. We have elected to adopt a corporate governance system based on corporate auditors.
Under the Company Law, if a company has corporate auditors, the company is not obligated to have any outside directors or to have any audit, nomination or compensation committees. Although we have adopted a board of corporate auditors, we have four outside directors as part of our efforts to further enhance corporate
153
Table of Contents
governance. In an effort to further enhance our corporate governance, we have also voluntarily established a nomination and compensation committee, a risk committee, an internal audit and compliance committee, and a governance committee to support our board of directors.
Nomination and Compensation Committee. The nomination and compensation committee, a majority of which is comprised of outside directors, deliberates matters relating to the appointment and dismissal of our directors and the directors of our subsidiaries, the compensation framework of our directors and the directors of our subsidiaries, as well as the compensation of our top management and the top management of our subsidiaries. The nomination and compensation committee makes reports and proposals to the board of directors about important matters for deliberation and necessary improvement measures. The chairman of the nomination and compensation committee is Tsutomu Okuda, an outside director. The other members of this committee are Ryuji Araki, an outside director, Yuko Kawamoto, a director, Kunie Okamoto and Haruka Matsuyama, outside directors, and Nobuyuki Hirano, President & CEO. The nomination and compensation committee met eight times between April 2013 and March 2014.
Risk Committee. The risk committee, a majority of which is comprised of outside directors and specialists, deliberates important matters related to the status, control and management of various risks that we face, reports the results of its deliberation and makes recommendations to the board of directors on a regular basis. The chairman of the risk committee is Yuko Kawamoto, who is a director. The other members of this committee are Tsutomu Okuda, an outside director, Akira Ariyoshi and Kenzo Yamamoto, outside specialists who have no prior employment relationships with any MUFG Group company, and Akihiko Kagawa, a senior managing director. The risk committee met four times between April 2013 and March 2014.
Internal Audit and Compliance Committee. The internal audit and compliance committee, a majority of which is comprised of outside directors and specialists, deliberates important matters relating to internal audits, internal control of financial information, financial audits, compliance, corporate risk management, and other internal control systems. This committee makes reports and proposals to the board of directors about important matters for deliberation and necessary improvement measures. We aim to enhance the effectiveness of internal audit functions by utilizing the external view points provided by the internal audit and compliance committee members. The chairman of the internal audit and compliance committee is Ryuji Araki, who is an outside director. The other members of this committee are Haruka Matsuyama, an outside director, Shin Kikuchi, an attorney-at-law, Akira Yamate, a certified public accountant, and Tatsuo Wakabayashi, Deputy Chairman and Chief Audit Officer. The internal audit and compliance committee met twelve times between April 2013 and March 2014.
Governance Committee. We aim to maintain a transparent and impartial corporate governance framework that takes into account external perspectives. On June 27, 2014, we formed a governance committee to support our board of directors in an additional effort to improve the Group’s corporate governance. The chairman of the Governance Committee is Kunie Okamoto, who is an outside director. Currently, the other members of this committee are Ryuji Araki, an outside director, Yuko Kawamoto, a director, Tsutomu Okuda and Haruka Matsuyama, outside directors, Shinsaku Iwahara, who has no prior employment relationship with any MUFG Group company, and Nobuyuki Hirano, President & CEO. Mr. Iwahara is a professor of Waseda University and has expertise in commercial law, company law and financial law. The governance committee deliberates matters pertaining to the state of the Group’s corporate governance, relevant policies and approaches, reports the results of its deliberation and makes recommendations to the Board of Directors on a semi-annually basis.
For additional information on our board practices and the significant differences in corporate governance practices between MUFG and U.S. companies listed on the New York Stock Exchange, see “—A. Directors and Senior Management” and “Item 16G. Corporate Governance.”
154
Table of Contents
| D. | Employees |
As of March 31, 2014, we had approximately 100,500 employees, an increase of approximately 19,600 employees compared with the number of employees as of March 31, 2013 primarily as a result of our acquisition of Bank of Ayudhya Public Company Limited, or Krungsri in December 2013. As of March 31, 2014, we also had approximately 34,800 part-time and temporary employees. The following tables show the percentages of our employees across our different business units and in different locations as of March 31, 2014:
|
Business unit |
||||
|
Bank of Tokyo-Mitsubishi UFJ: |
||||
|
Retail Banking Business Unit |
15 | % | ||
|
Corporate Banking Business Unit |
10 | |||
|
Global Business Unit |
23 | |||
|
Bank of Ayudhya Public Company Limited |
19 | |||
|
Global Markets Unit |
1 | |||
|
Corporate Services |
8 | |||
|
Corporate Center/Independent Divisions |
2 | |||
|
Mitsubishi UFJ Trust and Banking Corporation: |
||||
|
Trust-Banking |
4 | |||
|
Trust Assets |
3 | |||
|
Real Estate |
1 | |||
|
Global Markets |
1 | |||
|
Administration and subsidiaries |
2 | |||
|
Mitsubishi UFJ Securities Holdings: |
||||
|
Sales Marketing Business Unit |
3 | |||
|
Global Investment Banking Business Unit |
1 | |||
|
Global Markets Business Unit |
0 | |||
|
International Business Unit |
1 | |||
|
Corporate Center and Others |
2 | |||
|
Mitsubishi UFJ NICOS: |
||||
|
Business Marketing Division |
1 | |||
|
Credit Risk Management & Risk Assets Administration Division |
1 | |||
|
Merchant Business Management Division |
0 | |||
|
Operations Division |
1 | |||
|
Systems Division |
0 | |||
|
Corporate Division |
0 | |||
|
Others |
1 | |||
|
|
|
|||
| 100 | % | |||
|
|
|
|||
155
Table of Contents
|
Location |
||||
|
Bank of Tokyo-Mitsubishi UFJ: |
||||
|
Japan |
35 | % | ||
|
United States |
13 | |||
|
Europe |
2 | |||
|
Asia/Oceania excluding Japan |
8 | |||
|
Bank of Ayudhya Public Company Limited (1) |
19 | |||
|
Other areas |
1 | |||
|
Mitsubishi UFJ Trust and Banking Corporation: |
||||
|
Japan |
10 | |||
|
United States |
0 | |||
|
Europe |
0 | |||
|
Asia/Oceania excluding Japan |
0 | |||
|
Mitsubishi UFJ Securities Holdings: |
||||
|
Japan |
6 | |||
|
United States |
0 | |||
|
Europe |
1 | |||
|
Asia/Oceania excluding Japan |
0 | |||
|
Mitsubishi UFJ NICOS: |
||||
|
Japan |
4 | |||
|
United States |
0 | |||
|
Europe |
0 | |||
|
Asia/Oceania excluding Japan |
0 | |||
|
Others |
1 | |||
|
|
|
|||
| 100 | % | |||
|
|
|
|||
| Note: |
| (1) | Bank of Ayudhya Public Company Limited is located in Thailand. |
Most of our employees are members of an employees’ union, which negotiates on behalf of employees in relation to remuneration and working conditions. We believe our labor relations to be good.
| E. | Share Ownership |
The information required by this item is set forth in “—B. Compensation.”
156
Table of Contents
| Item 7. | Major Shareholders and Related Party Transactions. |
| A. | Major Shareholders |
Common Stock
As of March 31, 2014, we had 743,933 registered shareholders of our common stock. The ten largest holders of our common stock appearing on the register of shareholders as of March 31, 2014, and the number and the percentage of such shares held by each of them, were as follows:
|
Name |
Number of shares
held |
Percentage of
total shares in issue |
||||||
|
Japan Trustee Services Bank, Ltd. (Trust account) (1) |
687,872,700 | 4.85 | % | |||||
|
The Master Trust Bank of Japan, Ltd. (Trust account) (1) |
589,568,800 | 4.16 | ||||||
|
The Bank of New York Mellon SA/NV 10 |
313,508,710 | 2.21 | ||||||
|
State Street Bank and Trust Company |
223,166,446 | 1.57 | ||||||
|
Nippon Life Insurance Company |
198,137,853 | 1.39 | ||||||
|
The Bank of New York Mellon as Depositary Bank for DR Holders (2) |
186,466,730 | 1.31 | ||||||
|
Meiji Yasuda Life Insurance Company (3) |
175,000,000 | 1.23 | ||||||
|
Japan Trustee Services Bank, Ltd. (Trust account 1) (1) |
172,662,600 | 1.21 | ||||||
|
Japan Trustee Services Bank, Ltd. (Trust account 2) (1) |
157,029,900 | 1.10 | ||||||
|
State Street Bank and Trust Company 505225 |
156,934,894 | 1.10 | ||||||
|
|
|
|
|
|||||
|
Total |
2,860,348,633 | 20.19 | % | |||||
|
|
|
|
|
|||||
| Notes: |
| (1) | Includes the shares held in trust accounts, which do not disclose the names of beneficiaries. |
| (2) | An owner of record for our American depositary shares. |
| (3) | These shares are those held in a pension trust account with The Master Trust Bank of Japan, Ltd. for the benefit of retirement plans with voting rights retained by Meiji Yasuda Life Insurance Company. |
As of March 31, 2014, 1,393,786 shares, representing less than 0.01% of our outstanding common stock, were held by our directors and corporate auditors. Our major shareholders do not have different voting rights.
As of March 31, 2014, 2,081,091,190 shares, representing 14.69% of our outstanding common stock, were owned by 347 U.S. shareholders of record who are resident in the United States, one of whom is the ADR depository’s nominee holding 186,466,730 shares, or 1.31%, of our issued common stock.
Preferred Stock
No holder of our preferred stock has the right to vote at a general meeting of shareholders, except:
| Ÿ |
from the commencement of our ordinary general meeting of shareholders if an agenda for approval to declare a preferred dividend is not submitted to such meeting; or |
| Ÿ |
from the close of any ordinary general meeting of shareholders if a proposed resolution to declare a preferred dividend is not approved at such meeting; |
in each case, unless and until such time as a resolution of an ordinary general meeting of shareholders declaring a preferred dividend is passed.
Holders of our preferred stock are entitled to vote at a meeting separately held for their respective classes of preferred stock in accordance with the Company Law. A resolution of a separate meeting of class shareholders is required for the following actions, but only if the action is likely to prejudice the interests of the relevant class shareholders:
| Ÿ |
an amendment to our articles of incorporation to (a) create a new class of shares, (b) change the terms of shares, or (c) increase the total number of authorized shares or the total number of authorized shares of a |
157
Table of Contents
|
class of stock, except in some cases, such as an amendment to change a class of stock to callable stock, the resolution of, or the unanimous consent from, relevant class shareholders is required, regardless of whether the action is likely to prejudice their interests; |
| Ÿ |
a consolidation of shares; |
| Ÿ |
a share split; |
| Ÿ |
an allotment of shares to our existing shareholders; |
| Ÿ |
an allotment of stock acquisition rights to our existing shareholders; and |
| Ÿ |
a merger, corporate split, stock for stock exchange, or stock for stock transfer. |
Class 11 preferred stock is convertible into shares of our common stock as described in “Item 10.B. Additional Information—Memorandum and Articles of Association.”
The shareholders of class 11 preferred stock, appearing on the register of shareholders as of March 31, 2014, and the number and the percentage of such shares held by each of them, were as follows:
|
Name |
Number of shares
held |
Percentage of
total shares in issue |
||||||
|
UFJ Trustee Services PVT. (Bermuda) Limited as the trustee of UFJ International Finance (Bermuda) Trust |
1,000 | 100 | % | |||||
|
|
|
|
|
|||||
|
Total |
1,000 | 100 | % | |||||
|
|
|
|
|
|||||
We expect to acquire all of the outstanding shares of class 11 preferred stock on August 1, 2014 as required under the terms of the preferred stock or prior to that date at the request of the holder of the shares in exchange for up to 1,245 shares of our common stock. We plan to use shares of our common stock held in treasury for this acquisition. In addition, on April 1, 2014, MUFG acquired all of the 156,000,000 outstanding shares of first series of class 5 preferred stock for ¥390 billion and cancelled all the acquired shares. Upon our acquisition of the shares of class 11 preferred stock, we will have no outstanding shares of any class of preferred stock.
| B. | Related Party Transactions |
As of March 31, 2014, we held approximately 21.9% of the voting rights in Morgan Stanley and Series C Preferred Stock with a face value of approximately $521.4 million, or ¥53.6 billion, and 10% dividend. We also have two representatives appointed to Morgan Stanley’s board of directors. We adopted the equity method of accounting for our investment in Morgan Stanley beginning with the fiscal year ended March 31, 2012.
We and Morgan Stanley have two securities joint venture companies, namely, MUMSS and MSMS, in Japan. We hold a 60% economic interest in MUMSS and MSMS, and Morgan Stanley holds a 40% economic interest in MUMSS and MSMS. We hold a 60% voting interest and Morgan Stanley holds a 40% voting interest in MUMSS, and we hold a 49% voting interest and Morgan Stanley holds a 51% voting interest in MSMS.
We and Morgan Stanley continue to pursue a variety of business opportunities in Japan and abroad in accordance with the global strategic alliance. For a detailed discussion of our global alliance with Morgan Stanley, see “Item 4.B. Information on the Company—Business Overview—Global Strategic Alliance with Morgan Stanley.”
We and our banking subsidiaries had, and expect to have in the future, banking transactions and other transactions in the ordinary course of business with our related parties. Although for the fiscal year ended March 31, 2014, such transactions included, but were not limited to, call money, loans, electronic data processing, leases and management of properties, those transactions were immaterial and were made at prevailing market rates, terms and conditions and do not involve more than the normal risk of collectibility or present other unfavorable features.
None of our directors or corporate auditors, nor any of the close members of their respective families, has had any transactions or has any presently proposed transactions that are material or any transactions that are unusual in their nature or conditions, involving goods, services or tangible or intangible assets, to which we were, are or will be a party.
158
Table of Contents
No loans have been made to our directors or corporate auditors other than in the normal course of business, on normal commercial terms and conditions, involving the normal risk of collectibility, and presenting normal features. In addition, no loans have been made to our directors or executive officers or corporate auditors other than as permitted under Section 13(k) of the U.S. Securities Exchange Act and Rule 13k-1 promulgated thereunder.
No family relationship exists among any of our directors or corporate auditors. No arrangement or understanding exists between any of our directors or corporate auditors and any other person pursuant to which any director or corporate auditor was elected to their position at MUFG.
As part of our compensation structure, we have granted stock acquisition rights to our directors and corporate auditors. For a detailed discussion of the stock acquisition rights, see “Item 6.B. Directors, Senior Management and Employees—Compensation.”
| C. | Interests of Experts and Counsel |
Not applicable.
| Item 8. | Financial Information. |
| A. | Consolidated Statements and Other Financial Information |
The information required by this item is set forth in our consolidated financial statements starting on page F-1 of this Annual Report and in “Selected Statistical Data” starting on page A-1 of this Annual Report.
Legal Proceedings
From time to time, we are involved in various litigation matters and other legal proceedings, including regulatory actions. Although the final resolution of any such matters and proceedings could have a material effect on our consolidated operating results for a particular reporting period, based on our current knowledge and consultation with legal counsel, we believe the current litigation matters and other legal proceedings, when ultimately determined, will not materially affect our results of operations or financial position. For more information, see “Item 3.D. Key Information—Risk Factors—Risks Related to Our Business—We may become subject to regulatory actions or other legal proceedings relating to our transactions or other aspects of our operations, which could result in significant financial losses, restrictions on our operations and damage to our reputation.”
Distributions
Our board of directors submits a recommendation for a year-end dividend for our shareholders’ approval at the ordinary general meeting of shareholders customarily held in June of each year. The year-end dividend is usually distributed immediately following shareholders’ approval to holders of record at the end of the preceding fiscal year. In addition to year-end dividends, we may make cash distributions by way of interim dividends to shareholders of record as of September 30 of each year as distribution of surplus by resolution of our board of directors. Year-end dividends in the amount of ¥16 per share of our common stock for the fiscal year ended March 31, 2014 were approved by shareholders at the ordinary general meeting of shareholders held on June 27, 2014.
See “Item 10.B. Additional Information—Memorandum and Articles of Association” for additional information on our dividends policy.
Under the Japanese foreign exchange regulations currently in effect, dividends paid on shares held by non-residents of Japan may be converted into any foreign currency and repatriated abroad. Under the terms of the
159
Table of Contents
deposit agreement pursuant to which ADSs are issued, the depositary is required, to the extent that in its judgment it can convert Japanese yen on a reasonable basis into U.S. dollars and transfer the resulting U.S. dollars to the United States, to convert all cash dividends that it receives in respect of deposited shares into U.S. dollars and to distribute the amount received, after deduction of any applicable withholding taxes, to the holders of ADSs. See “Item 10.D. Additional Information—Exchange Controls” and “Item 12.D. Description of Securities Other than Equity Securities—American Depositary Shares.”
| B. | Significant Changes |
Other than as described in this Annual Report, no significant changes have occurred since the date of our consolidated financial statements included in this Annual Report.
160
Table of Contents
| Item 9. | The Offer and Listing. |
| A. | Offer and Listing Details |
| Market | Price Information |
The following table shows, for the periods indicated, the reported intra-day high and low trade prices for shares of our common stock on the Tokyo Stock Exchange, or the TSE, and of the ADSs on the New York Stock Exchange, or the NYSE:
| Price per share on the TSE | Price per ADS on the NYSE | |||||||||||||||
| High | Low | High | Low | |||||||||||||
| (yen) | (U.S.$) | |||||||||||||||
|
Fiscal year ended March 31, 2010 |
699 | 437 | 6.84 | 4.79 | ||||||||||||
|
Fiscal year ended March 31, 2011 |
520 | 321 | 5.68 | 4.44 | ||||||||||||
|
Fiscal year ended March 31, 2012 |
448 | 318 | 5.36 | 4.01 | ||||||||||||
|
Fiscal year ended March 31, 2013 |
||||||||||||||||
|
First quarter |
427 | 328 | 5.16 | 4.16 | ||||||||||||
|
Second quarter |
398 | 349 | 4.97 | 4.44 | ||||||||||||
|
Third quarter |
462 | 345 | 5.42 | 4.24 | ||||||||||||
|
Fourth quarter |
592 | 449 | 6.10 | 5.19 | ||||||||||||
|
Fiscal year ended March 31, 2014 |
||||||||||||||||
|
First quarter |
750 | 515 | 7.31 | 5.52 | ||||||||||||
|
Second quarter |
677 | 575 | 6.81 | 5.82 | ||||||||||||
|
Third quarter |
696 | 598 | 6.74 | 6.13 | ||||||||||||
|
Fourth quarter |
697 | 519 | 6.64 | 5.19 | ||||||||||||
|
February |
632 | 581 | 6.15 | 5.77 | ||||||||||||
|
March |
610 | 519 | 5.96 | 5.19 | ||||||||||||
|
Fiscal year ending March 31, 2015 |
||||||||||||||||
|
April |
587 | 523 | 5.63 | 5.21 | ||||||||||||
|
May |
586 | 542 | 5.73 | 5.33 | ||||||||||||
|
June |
642 | 578 | 6.27 | 5.69 | ||||||||||||
|
July (through July 7) |
638 | 620 | 6.31 | 6.08 | ||||||||||||
| B. | Plan of Distribution |
Not applicable.
| C. | Markets |
The primary market for our common stock is the TSE. Our common stock is also listed on the Nagoya Stock Exchange in Japan. ADSs, each representing one share of common stock, are quoted on the NYSE under the symbol, “MTU.”
| D. | Selling Shareholders |
Not applicable.
| E. | Dilution |
Not applicable.
| F. | Expenses of the Issue |
Not applicable.
161
Table of Contents
| Item 10. | Additional Information. |
| A. | Share Capital |
Not applicable.
| B. | Memorandum and Articles of Association |
Our Corporate Purpose
Article 2 of our Articles of Incorporation provides that our corporate purpose is to carry on the following businesses:
| Ÿ |
administration of management of banks, trust banks, specialized securities companies, insurance companies or other companies which we may own as our subsidiaries under the Banking Law; and |
| Ÿ |
any other businesses incidental to the foregoing businesses mentioned in the preceding clause. |
Board of Directors
For discussion of the provisions of our Articles of Incorporation as they apply to our directors, see “Item 6.C. Directors, Senior Management and Employees—Board Practices.”
Common Stock
We summarize below the material provisions of our Articles of Incorporation, our share handling regulations and the Company Law as they relate to a type of joint stock company known as kabushiki kaisha , within which we fall. Because it is a summary, this discussion should be read together with our Articles of Incorporation and share handling regulations, which have been filed as exhibits to this Annual Report.
General
A joint stock company is a legal entity incorporated under the Company Law. The investment and rights of the shareholders of a joint stock company are represented by shares of stock in the company and shareholders’ liability is limited to the amount of the subscription for the shares.
As of June 27, 2014, our authorized common share capital was comprised of 33,000,000,000 shares of common stock with no par value.
As of March 31, 2014, a total of 14,164,026,420 shares of common stock (including 3,389,416 shares of common stock held by us and our consolidated subsidiaries as treasury stock) had been issued. Each of the shares issued and outstanding was fully paid and non-assessable.
As of June 27, 2014, we were authorized to issue 800,001,000 shares of preferred stock, including 400,000,000 shares of each of the first to fourth series of class 5 preferred stock (provided the aggregate number of shares authorized to be issued with respect to the four series of class 5 preferred stock does not exceed 400,000,000 shares), 200,000,000 shares of each of the first to fourth series of class 6 preferred stock (provided the aggregate number of shares authorized to be issued with respect to the four series of class 6 preferred stock does not exceed 200,000,000 shares), 200,000,000 shares of each of the first to fourth series of class 7 preferred stock (provided the aggregate number of shares authorized to be issued with respect to the four series of class 7 preferred stock does not exceed 200,000,000 shares), and 1,000 shares of class 11 preferred stock. As of March 31, 2014, we had 156,000,000 shares of first series of class 5 preferred stock and 1,000 shares of class 11 preferred stock issued and outstanding.
162
Table of Contents
We may issue shares from our authorized but unissued share capital following a resolution to that effect by our board of directors. An increase in our authorized share capital is only possible by amendment of our Articles of Incorporation, which generally requires shareholders’ special approval.
In order to assert shareholder rights against us, a shareholder must have its name and address registered on our register of shareholders, in accordance with the Company Law and our share handling regulations. The registered holder of deposited shares underlying the ADSs is the depositary for the ADSs, or its nominee. Accordingly, holders of ADSs will not be able to assert shareholder rights other than as provided in the agreement among us, the depositary and the holders of the ADSs.
Under the Act on Book-Entry Transfer of Company Bonds, Shares, etc., the shares of all Japanese companies listed on any Japanese stock exchange, including our shares, are traded without share certificates through entry in the books maintained under a central clearing system.
Dividends
Dividends are distributed in proportion to the number of shares owned by each shareholder on the record date for the dividend. Dividends for each financial period may be distributed following shareholders’ approval at a general meeting of shareholders.
Payment of dividends on common stock is subject to the preferential dividend rights of holders of preferred stock.
Under the Banking Law and our Articles of Incorporation, our financial accounts are closed on March 31 of each year, and dividends, if any, are paid to shareholders of record as of March 31 following shareholders’ approval at a general meeting of shareholders. In addition to year-end dividends, our board of directors may by resolution declare an interim cash dividend to shareholders of record as of September 30 of each year. Under the Company Law, distribution of dividends will take the form of distribution of surplus (as defined below). We will be permitted to make distributions of surplus to our shareholders any number of times per fiscal year pursuant to resolutions of our general meetings of shareholders, subject to certain limitations described below. Distributions of surplus are in principle required to be authorized by a resolution of a general meeting of shareholders. Distributions of surplus would, however, be permitted to be made pursuant to a resolution of our board of directors if:
| (a) | our Articles of Incorporation so provide (our Articles of Incorporation currently contain no such provisions); |
| (b) | the normal term of office of our directors is one year; and |
| (c) | certain conditions concerning our non-consolidated annual financial statements and certain documents for the latest fiscal year as required by an ordinance of the Ministry of Justice are satisfied. |
In an exception to the above rule, even if the requirements described in (a) through (c) are not met, we are permitted to make distributions of surplus in cash to our shareholders by resolutions of the board of directors once per fiscal year as mentioned above concerning interim cash dividend.
Under the Company Law, distributions of surplus may be made in cash or in kind in proportion to the number of shares of common stock held by each shareholder. A resolution of a general meeting of shareholders or our board of directors authorizing a distribution of surplus must specify the kind and aggregate book value of the assets to be distributed, the manner of allocation of such assets to shareholders, and the effective date of the distribution. If a distribution of surplus is to be made in kind, we may, pursuant to a resolution of a general meeting of shareholders or (as the case may be) our board of directors, grant to our shareholders the right to require us to make such distribution in cash instead of in kind. If no such right is granted to shareholders, the relevant distribution of surplus must be approved by a special resolution of a general meeting of shareholders. See “—B. Memorandum and Articles of Association—Common Stock—Voting Rights.”
163
Table of Contents
Under the Company Law, we may make distributions of surplus to the extent that the aggregate book value of the assets to be distributed to shareholders does not exceed the distributable amount (as defined below) as of the effective date of such distributions of surplus. The amount of surplus (the “surplus”) at any given time shall be the amount of our assets and the book value of our treasury stock after subtracting the amounts of items (1) through (5) below as they appear on our non-consolidated balance sheet as of the end of our last fiscal year, and after reflecting the changes in our surplus after the end of our last fiscal year, by adding the amounts of items (6), (7) and (8) below and/or subtracting the amounts of items (9), (10) and (11) below:
| (1) | our liabilities; |
| (2) | our stated capital; |
| (3) | our additional paid-in capital; |
| (4) | our accumulated legal reserve; |
| (5) | other amounts as are set out in an ordinance of the Ministry of Justice; |
| (6) | (if we transferred our treasury stock after the end of the last fiscal year) the transfer price of our treasury stock after subtracting the book value thereof; |
| (7) | (if we decreased our stated capital after the end of the last fiscal year) the amount of decrease in our stated capital (excluding the amount transferred to additional paid-in capital or legal reserve); |
| (8) | (if we decreased our additional paid-in capital or legal reserve after the end of the last fiscal year) the amount of decrease in our additional paid-in capital or legal reserve (excluding the amount transferred to stated capital); |
| (9) | (if we cancelled our treasury stock after the end of the last fiscal year) the book value of the cancelled treasury stock; |
| (10) | (if we distributed surplus to shareholders after the end of the last fiscal year) the amount of the assets distributed to shareholders by way of such distribution of surplus; and |
| (11) | other amounts as are set out in an ordinance of the Ministry of Justice. |
A distributable amount (the “distributable amount”) at any given time shall be the aggregate amount of (a) the surplus, (b) the amount of profit as recorded for the period after the end of our last fiscal year until the date of an extraordinary settlement of account (if any) as is set out in an ordinance of the Ministry of Justice and (c) the transfer price of our treasury stock in the same period, after subtracting the amounts of the following items:
| (1) | the book value of our treasury stock; |
| (2) | (if we transferred our treasury stock after the end of the last fiscal year) the transfer price of our treasury stock; |
| (3) | the losses recorded for the period after the end of our last fiscal year until the date of an extraordinary settlement of account (if any) as set out in an ordinance of the Ministry of Justice; and |
| (4) | other amounts as set out in an ordinance of the Ministry of Justice. |
In Japan, the “ex-dividend” date and the record date for any dividends precede the date of determination of the amount of the dividend to be paid. The market price of shares generally becomes ex-dividend on the third business day prior to the record date. Under our Articles of Incorporation, we are not obligated to pay any dividends which are left unclaimed for a period of five years after the date on which they first became payable.
Capital and Reserves
Under the Company Law, we may reduce our additional paid-in capital or legal reserve (without limitation as to the amount of such reduction) as mentioned previously, generally by resolution of a general meeting of
164
Table of Contents
shareholders and, if so resolved in the same resolution, may account for the whole or any part of the amount of such reduction as stated capital. We may also reduce our stated capital generally by special resolution of a general meeting of shareholders and, if so resolved in the same resolution, such reduction may account for the whole or any part of the amount of such reduction as additional paid-in capital or legal reserve. Conversely, we may reduce our surplus and increase either (i) stated capital or (ii) additional paid-in capital and/or legal reserve by the same amount, in either case by resolution of a general meeting of shareholders.
Stock Splits
Stock splits of our outstanding stock may be effected at any time by resolution of the board of directors. When a stock split is to be effected, we may increase the authorized share capital to cover the number of shares to be increased by the stock split by amending our Articles of Incorporation by resolution of the board of directors without approval by special resolution of the general meeting of shareholders, unless more than one class of stock is issued and outstanding. We must give public notice of the stock split, specifying a record date at least two weeks prior to the record date.
We conducted a stock split pursuant to which each of our shares of common and preferred stock were split into 1,000 shares of the respective classes of securities, effective as of September 30, 2007. Our Articles of Incorporation were amended to increase the authorized share capital to cover the number of shares increased by the stock split, which amendment became effective simultaneously with the effectiveness of the stock split.
Unit Share (tan-gen kabu) System
We have adopted a unit share system, where 100 shares of either common or preferred stock shall each constitute a unit, as the amendment of our Articles of Incorporation to provide for such system was approved at the shareholders’ meetings on June 27 and 28, 2007.
Under the unit share system, each unit is entitled to one voting right. A holder of less than one unit has no voting right. Our Articles of Incorporation provide that the holders of shares constituting less than a full unit will not have shareholder rights except for those specified in the Company Law or an ordinance of the Ministry of Justice, including rights (i) to receive dividends, (ii) to receive cash or other assets in case of consolidation or split of shares, stock-for-stock exchange or stock-for-stock transfer, corporate split or merger or (iii) to be allotted rights to subscribe for free for new shares and stock acquisition rights when such rights are granted to shareholders. Shareholders may require us to purchase shares constituting less than a unit at the current market price. In addition, holders of shares constituting less than a unit may require us to sell them such number of shares, which, when combined with the number of shares already held by such holder, shall constitute a whole unit of share; provided that we will be obliged to comply with such request only when we own a sufficient number of shares to accommodate the desired sale and purchase. The board of directors may reduce the number of shares constituting a unit or cease to use the unit share system by amendments to the Articles of Incorporation without shareholders’ approval even though amendments to the Articles of Incorporation generally require a special resolution of the general meeting of shareholders.
General Meeting of Shareholders
The ordinary general meeting of our shareholders is usually held in June of each year in Tokyo. In addition, we may hold an extraordinary general meeting of shareholders whenever necessary by giving at least two weeks’ advance notice to shareholders who are entitled to vote at the relevant general meeting of shareholders. The record date for ordinary general meetings of our shareholders is March 31.
Any shareholder holding at least 300 voting rights or 1% of the total number of voting rights for six consecutive months or longer may propose a matter to be considered at a general meeting of shareholders by submitting a written request to a director at least eight weeks prior to the date of the meeting. The number of
165
Table of Contents
minimum voting rights, minimum percentage and time period necessary for exercising the minority shareholder rights described above may be decreased or shortened if our Articles of Incorporation so provide. Our Articles of Incorporation currently contain no such provisions.
Voting Rights
A holder of shares of our common stock is generally entitled to one voting right for each unit of common stock held. The following shares of common stock are not entitled to voting rights even when such shares constitute a whole unit, and such shares of common stock are not considered when determining whether a quorum exists for a shareholders’ meeting:
| Ÿ |
treasury stock; |
| Ÿ |
shares held by a company in which we and/or our subsidiaries own 25% or more of the total voting rights; and |
| Ÿ |
shares issued after the record date as a result of conversion of convertible stock, exercise of stock acquisition rights, and fractional shareholders becoming a shareholder of a whole unit share. |
On the other hand, holders of certain class of preferred stock shall be entitled to a voting right for each unit of preferred stock held under certain conditions provided for by relevant laws or regulations and our Articles of Incorporation, for example, when a proposal to pay the full amount of preferential dividends on any class of preferred stock in compliance with the terms of such preferred stock is not included in the agenda of the relevant shareholders meeting. See “—Preferred Stock.”
Under our Articles of Incorporation, except as otherwise provided by law or by other provisions of our Articles of Incorporation, a resolution can be adopted at a shareholders’ meeting by the holders of a majority of the voting rights represented at the meeting. The Company Law and our Articles of Incorporation require a quorum of not less than one-third of the total number of voting rights for election of our directors and corporate auditors.
The Company Law and our Articles of Incorporation provide that a quorum of not less than one-third of outstanding voting rights, excluding those owned by our subsidiaries and affiliates of which we own, directly or indirectly, 25 percent or more, must be present at a shareholders’ meeting to approve specified corporate actions, such as:
| Ÿ |
the amendment of our Articles of Incorporation, except in some limited cases; |
| Ÿ |
the repurchase of our own stock from a specific shareholder other than our subsidiary; |
| Ÿ |
the consolidation of shares; |
| Ÿ |
the offering to persons other than shareholders of stock at a specially favorable price, or of stock acquisition rights or bonds or notes with stock acquisition rights with specially favorable conditions; |
| Ÿ |
the removal of a corporate auditor; |
| Ÿ |
the exemption from liability of a director or corporate auditor, with certain exceptions; |
| Ÿ |
a reduction in stated capital with certain exceptions in which a shareholders’ resolution is not required; |
| Ÿ |
a distribution of in-kind dividends which meets certain requirements; |
| Ÿ |
the transfer of the whole or an important part of our business, except in some limited circumstances; |
| Ÿ |
the acquisition of the whole business of another company, except in some limited circumstances; |
| Ÿ |
a dissolution, merger or consolidation, except for certain types of mergers; |
166
Table of Contents
| Ÿ |
a stock-for-stock exchange ( kabushiki-kokan ) or stock-for-stock transfer ( kabushiki-iten ), except in some limited circumstances; and |
| Ÿ |
a corporate split, except in some limited circumstances. |
A special resolution representing at least two-thirds of the voting rights represented at the meeting is required to approve these actions.
Our Articles of Incorporation do not include any provision that grants shareholders cumulative voting rights at elections of directors or corporate auditors.
Subscription Rights
Holders of our shares have no preemptive rights under our Articles of Incorporation. Under the Company Law, however, our board of directors may determine that shareholders be given subscription rights in connection with a particular issue of new shares. In this case, these subscription rights must be given on uniform terms to all shareholders, and if a specified record date is set, it must be announced in a public notice at least two weeks prior to the record date. A notification to each individual shareholder must also be given at least two weeks prior to the subscription date.
Under the Company Law, rights to subscribe for new shares may not be transferred; however, we may allot stock acquisition rights to shareholders without consideration, and such rights will be transferable.
Stock Acquisition Rights
We may issue stock acquisition rights ( shinkabu yoyakuken ), which in the United States are often in the form of warrants, or bonds with stock acquisition rights that cannot be detached ( shinkabu yoyakuken-tsuki shasai ), which in the United States are often in the form of convertible bonds or bonds with non-detachable warrants. Except where the issuance would be on “specially favorable” conditions, the issuance of stock acquisition rights or bonds with stock acquisition rights may be authorized by a resolution of our board of directors. Upon exercise of the stock acquisition rights, the holder of such rights may acquire shares by paying the applicable exercise price or, if so determined by a resolution of our board of directors, by making a substitute payment, such as having the convertible bonds redeemed for no cash in lieu of the exercise price.
Liquidation Rights
Upon our liquidation, the assets remaining after payment of all debts, liquidation expenses, taxes and preferred distributions to holders of shares of our preferred stock will be distributed among the holders of shares of our common stock in proportion to the number of shares they own.
Transfer Agent
MUTB is the transfer agent for our common stock. The office of MUTB for this purpose is located at 4-5, Marunouchi 1-chome, Chiyoda-ku, Tokyo 100-8212, Japan. MUTB maintains our register of shareholders.
Reports to Shareholders
We furnish to our shareholders notices, in Japanese, of shareholders’ meetings, annual business reports, including our financial statements, and notices of resolutions adopted at our shareholders’ meetings.
Record Dates
As stated above, March 31 is the record date for the payment of annual dividends (if any), the determination of shareholders entitled to vote at ordinary general meetings of our shareholders, and the determination of class
167
Table of Contents
shareholders entitled to vote at meetings of our class shareholders if any matter to be resolved at an ordinary general meeting of our shareholders requires a resolution by our class shareholders in addition to a resolution by our shareholders. September 30 is the record date for the payment of interim dividends, if any. In addition, by a resolution of our board of directors and after giving at least two weeks’ prior public notice, we may at any time set a record date in order to determine the shareholders who are entitled to the rights pertaining to our shares.
Repurchase of Our Shares
We may repurchase our own shares:
| Ÿ |
through the Tokyo Stock Exchange or other stock exchanges on which our shares are listed, if authorized by a resolution of a general meeting of shareholders or our board of directors; |
| Ÿ |
by way of a tender offer, if authorized by a resolution of a general meeting of shareholders or our board of directors; |
| Ÿ |
from a specific party, if authorized by a special resolution of a general meeting of shareholders and we give notice thereof to shareholders prior to such general meeting, in general; |
| Ÿ |
from all shareholders of a specific class of shares offering to sell their shares, if authorized by a resolution of a general meeting of shareholders or our board of directors and we give a public notice or notice thereof to all of the shareholders (if we repurchase any class of preferred stock, notices to all shareholders of the relevant class of preferred stock); or |
| Ÿ |
from our subsidiaries, if authorized by a resolution of the board of directors. |
When the repurchase is made by us from a specific party, as authorized by a special resolution of a general meeting of shareholders, any shareholder may make a demand to a director, five days or more prior to the relevant shareholders’ meeting, that we also repurchase the shares held by that shareholder. However, no such right will be available if the shares have a market price, and if the purchase price does not exceed the then market price calculated in a manner set forth in an ordinance of the Ministry of Justice.
Repurchase of our own shares described above must satisfy various specified requirements. In general, the same restrictions on the distributable amount as described in the seventh paragraph under “—Common Stock—Dividends.” are applicable to the repurchase of our own shares, so the total amount of the repurchase price may not exceed the distributable amount.
We may hold our own shares so repurchased without restrictions. In addition, we may cancel or dispose of our repurchased shares by a resolution of our board of directors. As of March 31, 2014, we (excluding our subsidiaries) owned 212,200 shares of treasury stock.
Preferred Stock
The following is a summary of information concerning the shares of our preferred stock, including brief summaries of the relevant provisions of our Articles of Incorporation, the share handling regulations and the Company Law as currently in effect. The detailed rights of our preferred stock are set out in our Articles of Incorporation and the resolutions of our board of directors relating to the issuance of the relevant stock.
General
As of March 31, 2014, we were authorized under our Articles of Incorporation to issue four classes of preferred stock totaling 800,001,000 shares of preferred stock, including 400,000,000 shares of each of the first to fourth series of class 5 preferred stock (provided the aggregate number of shares authorized to be issued with respect to the four series of class 5 preferred stock does not exceed 400,000,000 shares), 200,000,000 shares of
168
Table of Contents
each of the first to fourth series of class 6 preferred stock (provided the aggregate number of shares authorized to be issued with respect to the four series of class 6 preferred stock does not exceed 200,000,000 shares), 200,000,000 shares of each of the first to fourth series of class 7 preferred stock (provided the aggregate number of shares authorized to be issued with respect to the four series of class 7 preferred stock does not exceed 200,000,000 shares) and 1,000 shares of class 11 preferred stock. Our preferred stock has equal preference over our shares of common stock with respect to dividend entitlements and distribution of assets upon our liquidation. However, holders of shares of our preferred stock are not entitled to vote at general meetings of shareholders, subject to the exceptions provided under our Articles of Incorporation. On April 1, 2014, MUFG acquired all of the 156,000,000 outstanding shares of first series of class 5 preferred stock for ¥390.0 billion and cancelled all the acquired shares. In addition, MUFG expects to acquire all of the 1,000 outstanding shares of class 11 preferred stock on August 1, 2014 as required under the terms of the preferred stock or prior to that date at the request of the holder of the shares in exchange for up to 1,245 shares of our common stock. We plan to use shares of our common stock held in treasury for this acquisition. Upon our acquisition of the shares of class 11 preferred stock, we will have no outstanding shares of any class of preferred stock.
We may acquire shares of first to fourth series of class 5 and first to fourth series of class 6 preferred stock at our discretion pursuant to the terms and conditions provided by our Articles of Incorporation and the resolution of our board of directors. The provisions for acquisition of shares of first to fourth series of class 5 and first to fourth series of class 6 preferred stock will be determined by the board of directors at the time of issuance of such preferred stock. When issued, any holder of shares of first to fourth series of class 6 preferred stock or first to fourth series of class 7 preferred stock may request acquisition of shares of such preferred stock in exchange for shares of our common stock during the period determined by resolution of the board of directors adopted at the time of issuance of such shares of preferred stock. Any shares of first to fourth series of class 6 preferred stock or first to fourth series of class 7 preferred stock for which no request for acquisition in exchange for shares of our common stock is made during such period will be mandatorily acquired on the day immediately following the last day of such period (the “Mandatory Acquisition Date”) in the number obtained by dividing an amount equivalent to the subscription price per each relevant share of preferred stock by the average daily closing price of our common stock as reported by the Tokyo Stock Exchange for the 30 trading days commencing on the 45th trading day prior to the Mandatory Acquisition Date. Any holder of shares of class 11 preferred stock may request acquisition of shares of the relevant preferred stock in exchange for shares of our common stock during the period as provided for in the attachment to our Articles of Incorporation. Any shares of class 11 preferred stock for which no request for acquisition in exchange for shares of our common stock is made during such period will be mandatorily acquired on the Mandatory Acquisition Date in the number obtained by dividing an amount equivalent to the subscription price per each relevant share of preferred stock by the average daily closing price of our common stock as reported by the Tokyo Stock Exchange for the 30 trading days commencing on the 45th trading day prior to the Mandatory Acquisition Date.
Additionally, in order to enable the relevant preferred stock to meet the criteria for Additional Tier 1 capital under Basel III requirements as adopted by the FSA and became effective on March 31, 2013, the terms of the second to fourth series of class 5 as well as all the series of class 6 and class 7 preferred stock were amended in June 2013 to have mandatory acquisition provisions. When newly issuing these preferred stock, the board of directors will determine events that will require us to acquire the relevant preferred stock pursuant to the capital adequacy requirements applicable to us. Upon the occurrence of such events, we will acquire all the relevant preferred stock on an acquisition date, which is a date determined by the board of directors either at the time of the issuance or after the occurrence of such event. We shall acquire the relevant preferred stock in exchange for common stock or for no consideration as determined by the board of directors at the time of the issuance, considering certain factors including the market conditions. The formula to be used in exchanging the preferred stock for common stock will also be determined by the board of directors at the time of the issuance. For more information, see “Item 4.B. Information on the Company—Business Overview—Supervision and Regulation—Japan—Capital adequacy.”
169
Table of Contents
Preferred Dividends
In priority to the payment of dividends to holders of our common stock, the amount of preferred dividends payable each fiscal year for each class of our preferred stock is set forth below:
| Ÿ |
first series of class 5 preferred stock: ¥115.00 per share; |
| Ÿ |
second to fourth series of class 5 preferred stock: to be set by resolution of our board of directors at the time of issuance, up to a maximum of ¥250.00 per share; |
| Ÿ |
first to fourth series of class 6 preferred stock: to be set by resolution of our board of directors at the time of issuance, up to a maximum of ¥125.00 per share; |
| Ÿ |
first to fourth series of class 7 preferred stock: to be set by resolution of our board of directors at the time of issuance, up to a maximum of ¥125.00 per share; and |
| Ÿ |
class 11 preferred stock: ¥5.30 per share. |
In the event that our board of directors decides to pay an interim dividend to holders of record of our common stock as of September 30 of any year, we will, in priority to the payment of that interim dividend, pay a preferred interim dividend in the amount specified in our Articles of Incorporation to holders of record of our preferred stock as of September 30 of the same year. The amount of any preferred interim dividend will be deducted from the preferred dividend payable on the relevant class of our preferred stock for the same fiscal year.
No preferred dividend will be paid on any of our preferred stock converted into our common stock for the period from the date following the record date for the preferred dividend or preferred interim dividend last preceding the relevant conversion date to the relevant conversion date, but the common stock issued upon conversion will be entitled to receive any dividend payable to holders of record of common stock upon the next succeeding record date for common stock dividends.
No payment of dividends on our preferred stock or any other shares can be made unless we have a sufficient distributable amount and a resolution to distribute such distributable amount is obtained at the relevant ordinary general meeting of shareholders, in the case of annual preferred dividends, or at the board of directors, in the case of preferred interim dividends.
Dividends on our preferred stock are non-cumulative. If the full amount of any dividend is not declared on our preferred stock in respect of any fiscal year, holders of our preferred stock do not have any right to receive dividends in respect of the deficiency in any subsequent fiscal year, and we will have no obligation to pay the deficiency or to pay any interest regardless of whether or not dividends are paid in respect of any subsequent fiscal year. The holders of our preferred stock are not entitled to any further dividends or other participation in or distribution of our profits.
Liquidation Rights
In the event of our voluntary or involuntary liquidation, record holders of our preferred stock are entitled, equally in rank as among themselves, to receive before any distribution out of our residual assets is made to holders of our common stock, a distribution out of our residual assets of:
| Ÿ |
¥2,500 per share of first to fourth series of class 5 preferred stock; |
| Ÿ |
¥2,500 per share of first to fourth series of class 6 preferred stock; |
| Ÿ |
¥2,500 per share of first to fourth series of class 7 preferred stock; and |
| Ÿ |
¥1,000 per share of class 11 preferred stock. |
The holders of our preferred stock are not entitled to any further dividends or other participation in or distribution of our residual assets upon our liquidation.
170
Table of Contents
Voting Rights
No holder of our preferred stock has the right to receive notice of, or to vote at, a general meeting of shareholders, except as otherwise specifically provided under our Articles of Incorporation or other applicable law. Under our Articles of Incorporation, holders of our preferred stock will be entitled to receive notice of, and have one voting right per unit of preferred stock at, our general meetings of shareholders:
| Ÿ |
from the commencement of our ordinary general meeting of shareholders if an agenda for approval to declare a preferred dividend is not submitted to such meeting; or |
| Ÿ |
from the close of any ordinary general meeting of shareholders if a proposed resolution to declare a preferred dividend is not approved at such meeting. |
In each case, holders of our preferred stock will be entitled to receive notice of and vote at the relevant general meetings of shareholders unless and until such time as a resolution of an ordinary general meeting of shareholders declaring a preferred dividend is passed.
For more information, see “Item 7.A. Major Shareholders and Related Party Transactions—Major Shareholders—Preferred Stock.”
American Depositary Shares
The Bank of New York Mellon will issue American depositary receipts, or ADRs. Each ADR will represent ownership interests in American depositary shares, or ADSs. Each ADS represents one share of our common stock. Each ADS is held by BTMU, acting as custodian, at its principal office in Tokyo, on behalf of The Bank of New York Mellon, acting as depositary. Each ADS will also represent securities, cash or other property deposited with The Bank of New York Mellon but not distributed to ADS holders. The Bank of New York Mellon’s corporate trust office is located at 101 Barclay Street, New York, New York 10286 and its principal executive office is located at One Wall Street, New York, New York 10286.
You may hold ADSs either directly or indirectly through your broker or other financial institution. If you hold ADSs directly, you are an ADS holder. This description assumes you hold your ADSs directly. If you hold the ADSs indirectly, you must rely on the procedures of your broker or other financial institution to assert the rights of ADS holders described in this section. You should consult with your broker or financial institution to find out what those procedures are.
The Bank of New York Mellon will actually be the registered holder of the common stock, so you will have to rely on it to exercise your rights as a shareholder. Our obligations and the obligations of The Bank of New York Mellon are set out in a deposit agreement among us, The Bank of New York Mellon and you, as an ADS holder. The deposit agreement and the ADSs are governed by New York law.
The following is a summary of the material terms of the deposit agreement. Because it is a summary, it does not contain all the information that may be important to you. For more complete information, you should read the entire deposit agreement and the form of ADR.
Share Dividends and Other Distributions
The Bank of New York Mellon has agreed to pay to you the cash dividends or other distributions it or the custodian receives on shares of common stock or other deposited securities, after deducting its fees and expenses. You will receive these distributions in proportion to the number of shares your ADSs represent.
Cash . The Bank of New York Mellon will convert any cash dividend or other cash distribution we pay on our common stock into U.S. dollars, if it can do so on a reasonable basis and can transfer the U.S. dollars to the United States. If that is not possible or if any approval from the Japanese government is needed and cannot be obtained, the deposit agreement allows The Bank of New York Mellon to distribute the Japanese yen only to
171
Table of Contents
those ADS holders to whom it is possible to do so. The Bank of New York Mellon will hold the Japanese yen it cannot convert for the account of the ADS holders who have not been paid. It will not invest the Japanese yen and it will not be liable for any interest.
Before making a distribution, any withholding taxes that must be paid under Japanese law will be deducted. See “—E. Taxation—Japanese Taxation.” The Bank of New York Mellon will distribute only whole U.S. dollars and cents and will round fractional cents to the nearest whole cent. If the relevant exchange rates fluctuate during a time when The Bank of New York Mellon cannot convert the Japanese currency, you may lose some or all of the value of the distribution.
Shares. The Bank of New York Mellon may distribute new ADSs representing any shares we may distribute as a dividend or free distribution, if we furnish The Bank of New York Mellon promptly with satisfactory evidence that it is legal to do so. The Bank of New York Mellon will only distribute whole ADSs. It will sell shares which would require it to issue a fractional ADS and distribute the net proceeds in the same way as it distributes cash dividends. If The Bank of New York Mellon does not distribute additional ADSs, each ADS will also represent the new shares.
Rights to receive additional shares . If we offer holders of our common stock any rights to subscribe for additional shares of common stock or any other rights, The Bank of New York Mellon may, after consultation with us, make those rights available to you. We must first instruct The Bank of New York Mellon to do so and furnish it with satisfactory evidence that it is legal to do so. If we do not furnish this evidence and/or do not give these instructions, and The Bank of New York Mellon decides that it is practical to sell the rights, The Bank of New York Mellon will sell the rights and distribute the proceeds in the same way as it distributes cash dividends. The Bank of New York Mellon may allow rights that are not distributed or sold to lapse. In that case, you will receive no value for them.
If The Bank of New York Mellon makes rights available to you, upon instruction from you it will exercise the rights and purchase the shares on your behalf. The Bank of New York Mellon will then deposit the shares and issue ADSs to you. It will only exercise the rights if you pay it the exercise price and any other charges the rights require you to pay.
U.S. securities laws may restrict the sale, deposit, cancellation and transfer of the ADSs issued after the exercise of the rights. For example, you may not be able to trade the ADSs freely in the United States. In this case, The Bank of New York Mellon may issue the ADSs under a separate restricted deposit agreement which will contain the same provisions as the deposit agreement, except for changes needed to put the restrictions in place. The Bank of New York Mellon will not offer you rights unless those rights and the securities to which the rights relate are either exempt from registration or have been registered under the U.S. Securities Act with respect to a distribution to you. We will have no obligation to register under the Securities Act those rights or the securities to which they relate.
Other distributions . The Bank of New York Mellon will send to you anything else we distribute on deposited securities by any means it thinks is legal, fair and practical. If it cannot make the distribution in that way, The Bank of New York Mellon has a choice. It may decide to sell what we distributed and distribute the net proceeds, in the same way as it does with cash. Or, it may decide to hold what we distributed, in which case ADSs will also represent the newly distributed property.
The Bank of New York Mellon is not responsible if it decides that it is unlawful or impractical to make a distribution available to any ADS holders. We have no obligation to register ADSs, shares, rights or other securities under the Securities Act. We also have no obligation to take any other action to permit the distribution of ADSs, shares, rights or anything else to ADS holders. This means that you may not receive the distributions we make on our shares or any value for them if it is illegal or impractical for us or The Bank of New York Mellon to make them available to you.
172
Table of Contents
Deposit, Withdrawal and Cancellation
The Bank of New York Mellon will issue ADSs if you or your broker deposits shares or evidence of rights to receive shares with the custodian. Upon payment of its fees and expenses and of any taxes or charges, such as stamp taxes or stock transfer taxes or fees, The Bank of New York Mellon will register the appropriate number of ADSs in the names you request and will deliver the ADSs at its corporate trust office to the persons you request.
In certain circumstances, subject to the provisions of the deposit agreement, The Bank of New York Mellon may issue ADSs before the deposit of the underlying shares. This is called a pre-release of ADSs. A pre-release is closed out as soon as the underlying shares are delivered to the depositary. The depositary may receive ADSs instead of the shares to close out a pre-release. The depositary may pre-release ADSs only under the following conditions:
| Ÿ |
Before or at the time of the pre-release, the person to whom the pre-release is made must represent to the depositary in writing that it or its customer, as the case may be, owns the shares to be deposited; |
| Ÿ |
The pre-release must be fully collateralized with cash or collateral that the depositary considers appropriate; and |
| Ÿ |
The depositary must be able to close out the pre-release on not more than five business days’ notice. |
The pre-release will be subject to whatever indemnities and credit regulations that the depositary considers appropriate. In addition, the depositary will limit the number of ADSs that may be outstanding at any time as a result of a pre-release.
You may turn in your ADSs at the Corporate Trust Office of The Bank of New York Mellon’s office. Upon payment of its fees and expenses and of any taxes or charges, such as stamp taxes or stock transfer taxes or fees, The Bank of New York Mellon will deliver (1) the underlying shares to an account designated by you and (2) any other deposited securities underlying the ADS at the office of the custodian. Or, at your request, risk and expense, The Bank of New York Mellon will deliver the deposited securities at its Corporate Trust Office.
The ADSs may only be presented for cancellation and release of the underlying shares of common stock or other deposited securities in multiples of 100 ADSs. Holders of ADRs evidencing less than 100 ADSs are not entitled to delivery of any underlying shares or other deposited securities unless ADRs, together with other ADRs presented by the same holder at the same time, represent in the aggregate at least 100 ADSs. If any ADSs are surrendered but not cancelled pursuant to the preceding sentence, The Bank of New York Mellon will execute and deliver an ADR or ADRs evidencing the balance of ADSs not so cancelled to the person or persons surrendering the same.
Voting Rights
If you are an ADS holder on a record date fixed by The Bank of New York Mellon, you may instruct The Bank of New York Mellon to vote the shares underlying your ADSs at a meeting of our shareholders in accordance with the procedures set forth in the deposit agreement.
The Bank of New York Mellon will notify you of the upcoming meeting and arrange to deliver our voting materials to you. The notice shall contain (a) such information as is contained in such notice of meeting, (b) a statement that as of the close of business on a specified record date you will be entitled, subject to any applicable provision of Japanese law and our Articles of Incorporation, to instruct The Bank of New York Mellon as to the exercise of the voting rights, if any, pertaining to the amount of shares or other deposited securities represented by your ADSs, and (c) a brief statement as to the manner in which such instructions may be given, including an express indication that instructions may be given to The Bank of New York Mellon to give a discretionary proxy to a person designated by us. Upon your written request, received on or before the date established by The Bank of New York Mellon for such purpose, The Bank of New York Mellon shall endeavor in so far as practicable to vote or cause to be voted the amount of shares or other deposited securities represented by your ADSs in
173
Table of Contents
accordance with the instructions set forth in your request. So long as Japanese law provides that votes may only be cast with respect to one or more whole shares or other deposited securities, The Bank of New York Mellon will aggregate voting instructions to the extent such instructions are the same and vote such whole shares or other deposited securities in accordance with your instructions. If, after aggregation of all instructions to vote received by The Bank of New York Mellon, any portion of the aggregated instructions constitutes instructions with respect to less than a whole share or other deposited securities, The Bank of New York Mellon will not vote or cause to be voted the shares or other deposited securities to which such portion of the instructions apply. The Bank of New York Mellon will not vote or attempt to exercise the right to vote that attaches to the shares or other deposited securities, other than in accordance with the instructions of the ADS holders. If no instructions are received by The Bank of New York Mellon from you with respect to any of the deposited securities represented by your ADSs on or before the date established by The Bank of New York Mellon for such purpose, The Bank of New York Mellon shall deem you to have instructed The Bank of New York Mellon to give a discretionary proxy to a person designated by us with respect to such deposited securities and The Bank of New York Mellon shall give a discretionary proxy to a person designated by us to vote such deposited securities, provided that no such instruction shall be given with respect to any matter as to which we inform The Bank of New York Mellon (and we have agreed to provide such information as promptly as practicable in writing) that (1) we do not wish such proxy given, (2) substantial opposition exists or (3) such matter materially and adversely affects the rights of holders of shares.
We cannot assure you that you will receive the voting materials in time to ensure that you can instruct The Bank of New York Mellon to vote your shares. In addition, The Bank of New York Mellon is not responsible for failing to carry out voting instructions or for the manner of carrying out voting instructions as long as it has acted in good faith. This means that you may not be able to exercise your right to vote and there may be nothing you can do if your shares are not voted as you requested.
Fees and Expenses
See “Item 12.D. Description of Securities Other than Equity Securities—American Depositary Shares.”
Payment of Taxes
You will be responsible for any taxes or other governmental charges payable on your ADSs or on the deposited securities underlying your ADSs. The Bank of New York Mellon may refuse to transfer your ADSs or allow you to withdraw the deposited securities underlying your ADSs until those taxes or other charges are paid. It may apply payments owed to you or sell deposited securities underlying your ADSs to pay any taxes owed and you will remain liable for any deficiency. If it sells deposited securities, it will, if appropriate, reduce the number of ADSs to reflect the sale and pay to you any property remaining after it has paid the taxes.
Reclassifications, Recapitalizations and Mergers
If we:
| Ÿ |
reclassify, split up or consolidate any of our shares or the deposited securities; |
| Ÿ |
recapitalize, reorganize, merge, liquidate, consolidate or sell all or substantially all of our assets or take any similar action; or |
| Ÿ |
distribute securities on the shares that are not distributed to you, then, |
| (1) | the cash, shares or other securities received by The Bank of New York Mellon will become deposited securities and each ADS will automatically represent its equal share of the new deposited securities unless additional ADSs are issued; and |
| (2) | The Bank of New York Mellon may, and will if we request, issue new ADSs or ask you to surrender your outstanding ADSs in exchange for new ADSs, identifying the new deposited securities. |
174
Table of Contents
Amendment and Termination
We may agree with The Bank of New York Mellon to amend the deposit agreement and the ADSs without your consent for any reason. If the amendment adds or increases fees or charges, except for taxes and other governmental charges, registration fees, cable, telex or facsimile transmission costs, delivery costs or other such expenses, or prejudices an important right of ADS holders, it will only become effective three months after The Bank of New York Mellon notifies you of the amendment. At the time an amendment becomes effective, you are considered, by continuing to hold your ADS, to agree to the amendment and to be bound by the ADSs and the deposit agreement as amended. However, no amendment will impair your right to receive the deposited securities in exchange for your ADSs.
The Bank of New York Mellon will terminate the deposit agreement if we ask it to do so, in which case it must notify you at least 30 days before termination. The Bank of New York Mellon may also terminate the deposit agreement if The Bank of New York Mellon has told us that it would like to resign and we have not appointed a new depositary bank within 60 days.
If any ADSs remain outstanding after termination, The Bank of New York Mellon will stop registering the transfers of ADSs, will stop distributing dividends to ADS holders and will not give any further notices or do anything else under the deposit agreement other than:
| (1) | collect dividends and distributions on the deposited securities; |
| (2) | sell rights and other property offered to holders of deposited securities; and |
| (3) | deliver shares and other deposited securities in exchange for ADSs surrendered to The Bank of New York Mellon. |
At any time after one year following termination, The Bank of New York Mellon may sell any remaining deposited securities. After that, The Bank of New York Mellon will hold the money it received on the sale, as well as any other cash it is holding under the deposit agreement for the pro rata benefit of the ADS holders that have not surrendered their ADSs. It will not invest the money and has no liability for interest. The Bank of New York Mellon’s only obligations will be to account for the money and other cash and with respect to indemnification and to retain depositary documents. After termination, our only obligations will be with respect to indemnification and to pay certain amounts to The Bank of New York Mellon.
Limitations on Obligations and Liability to ADS Holders
The deposit agreement expressly limits our obligations and the obligations of The Bank of New York Mellon. It also limits our liability and the liability of The Bank of New York Mellon. We and The Bank of New York Mellon:
| Ÿ |
are only obligated to take the actions specifically set forth in the deposit agreement without negligence or bad faith; |
| Ÿ |
are not liable if either is prevented or delayed by law, any provision of our Articles of Incorporation or circumstances beyond their control from performing their obligations under the deposit agreement; |
| Ÿ |
are not liable if either exercises or fails to exercise discretion permitted under the deposit agreement; |
| Ÿ |
have no obligation to become involved in a lawsuit or other proceeding related to the ADSs or the deposit agreement on your behalf or on behalf of any other party unless indemnified to their satisfaction; and |
| Ÿ |
may rely upon any advice of or information from legal counsel, accountants, any person depositing shares, any ADS holder or any other person believed in good faith to be competent to give them that advice or information. |
In the deposit agreement, we and The Bank of New York Mellon agree to indemnify each other for liabilities arising out of acts performed or omitted by the other party in accordance with the deposit agreement.
175
Table of Contents
Requirements for Depositary Actions
Before The Bank of New York Mellon will issue or register transfer of an ADS, make a distribution on an ADS, or permit withdrawal of shares, it may require:
| Ÿ |
payment of stock transfer or other taxes or other governmental charges and transfer or registration fees charged by third parties for the transfer of any shares or other deposited securities; |
| Ÿ |
production of satisfactory proof of the identity and genuineness of any signature or other information it deems necessary; and |
| Ÿ |
compliance with regulations it may establish, from time to time, consistent with the deposit agreement, including presentation of transfer documents. |
The Bank of New York Mellon may refuse to deliver, transfer, or register transfers of ADSs generally when its transfer books are closed, when our transfer books are closed or at any time if it or we think it advisable to do so.
You have the right to cancel your ADSs and withdraw the underlying shares at any time except:
| Ÿ |
when temporary delays arise because: (1) The Bank of New York Mellon has closed its transfer books or we have closed our transfer books; (2) the transfer of shares is blocked to permit voting at a shareholders’ meeting; or (3) we are paying a dividend on the shares; |
| Ÿ |
when you or other ADS holders seeking to withdraw shares owe money to pay fees, taxes and similar charges; or |
| Ÿ |
when it is necessary to prohibit withdrawals in order to comply with any laws or governmental regulations that apply to ADSs or to the withdrawal of shares or other deposited securities. |
This right of withdrawal may not be limited by any other provision of the deposit agreement.
Reports and Other Communications
The Bank of New York Mellon will make available for your inspection at its corporate trust office any reports and communications, including any proxy soliciting material, that it receives from us, if those reports and communications are both (a) received by The Bank of New York Mellon as the holder of the deposited securities and (b) made generally available by us to the holders of the deposited securities. If we ask it to, The Bank of New York Mellon will also send you copies of those reports it receives from us.
Inspection of Transfer Books
The Bank of New York Mellon will keep books for the registration and transfer of ADSs, which will be open for your inspection at all reasonable times. You will only have the right to inspect those books if the inspection is for the purpose of communicating with other owners of ADSs in connection with our business or a matter related to the deposit agreement or the ADSs.
| C. | Material Contracts |
Except as described elsewhere in this Annual Report, all material contracts entered into by us in the past two years preceding the filing of this Annual Report were entered into in the ordinary course of business.
| D. | Exchange Controls |
Foreign Exchange and Foreign Trade Law
The Foreign Exchange and Foreign Trade Law of Japan and the cabinet orders and ministerial ordinances incidental thereto, collectively known as the Foreign Exchange Law, set forth, among other matters, regulations
176
Table of Contents
relating to the receipt by non-residents of Japan of payment with respect to shares to be issued by us and the acquisition and holding of shares by non-residents of Japan and foreign investors, both as defined below. It also applies in some cases to the acquisition and holding of ADSs representing such shares acquired and held by non-residents of Japan and by foreign investors. Generally, the Foreign Exchange Law currently in effect does not affect the right of a non-resident of Japan to purchase or sell an ADS outside Japan for non-Japanese currency.
“Non-residents of Japan” are defined as individuals who are not resident in Japan and corporations whose principal offices are located outside Japan. Generally, the branches and offices of non-resident corporations which are located in Japan are regarded as residents of Japan while the branches and offices of Japanese corporations located outside Japan are regarded as non-residents of Japan.
“Foreign investors” are defined as:
| Ÿ |
non resident individuals; |
| Ÿ |
corporations which are organized under the laws of foreign countries or whose principal offices are located outside Japan; |
| Ÿ |
corporations of which 50% or more of the shares are directly or indirectly held by individuals not resident of Japan and corporations which are organized under the laws of foreign countries or whose principal offices are located outside Japan; and |
| Ÿ |
corporations, a majority of officers (or a majority of officers having the power of representation) of which are non-resident individuals. |
Dividends and Proceeds of Sales
Under the Foreign Exchange Law, dividends paid on, and the proceeds of sales in Japan of, shares held by non-residents of Japan may in general be converted into any foreign currency and repatriated abroad. The acquisition of our shares by non-residents by way of a stock split is not subject to any notification or reporting requirements.
Acquisition of Shares
In general, a non-resident who acquires shares from a resident of Japan is not subject to any prior filing requirement, although the Foreign Exchange Law empowers the Minister of Finance of Japan to require a prior approval for any such acquisition in certain limited circumstances.
If a foreign investor acquires our shares, and, together with parties who have a special relationship with that foreign investor, holds 10% or more of our issued shares as a result of such acquisition, the foreign investor must file a report of such acquisition with the Minister of Finance and any other competent Minister by the fifteenth day of the month immediately following the month to which the date of such acquisition belongs. In certain limited circumstances, however, a prior notification of such acquisition must be filed with the Minister of Finance and any other competent Minister, who may modify or prohibit the proposed acquisition.
Deposit and Withdrawal under American Depositary Facility
The deposit of shares with us, in our capacity as custodian and agent for the depositary, in Tokyo, the issuance of ADSs by the depositary to a non-resident of Japan in respect of the deposit and the withdrawal of the underlying shares upon the surrender of the ADSs are not subject to any of the formalities or restrictions referred to above. However, where as a result of a deposit or withdrawal the aggregate number of shares held by the depositary, including shares deposited with us as custodian for the depositary, or the holder surrendering ADSs, as the case may be, would be 10% or more of the total outstanding shares, a report will be required, and in specified circumstances, a prior notification may be required, as noted above.
177
Table of Contents
Reporting of Substantial Shareholdings
The Financial Instruments and Exchange Law of Japan requires any person who has become, beneficially and solely or jointly, a holder of more than 5% of the total issued shares of capital stock of a company listed on any Japanese financial instruments exchange or whose shares are traded on the over-the-counter market in Japan to file with the director of a competent finance bureau within 5 business days a report concerning such shareholdings.
A similar report must also be filed in respect of any subsequent change of 1% or more in any such holding ratio or any change in material matters set out in reports previously filed, with certain exceptions. For this purpose, shares issuable to such person upon exchange of exchangeable securities, conversion of convertible securities or exercise of share subscription warrants or stock acquisition rights (including those incorporated in bonds with stock acquisition rights) are taken into account in determining both the number of shares held by such holder and the issuer’s total issued shares of capital stock. Copies of such report must also be furnished to the issuer of such shares and all Japanese financial instruments exchanges on which the shares are listed or (in the case of shares traded over-the-counter) the Japan Securities Dealers Association.
| E. | Taxation |
Japanese Taxation
The following sets forth the material Japanese tax consequences to owners of shares of our common stock or ADSs who are non-resident individuals or non-Japanese corporations without a permanent establishment in Japan to which the relevant income is attributable, which we refer to as “non-resident holders” in this section. The statements regarding Japanese tax laws below are based on the laws in force and as interpreted by the Japanese taxation authorities as at the date of this Annual Report and are subject to changes in the applicable Japanese laws, double taxation treaties, conventions or agreements or interpretations thereof occurring after that date. This summary is not exhaustive of all possible tax considerations that may apply to a particular investor, and potential investors are advised to satisfy themselves as to the overall tax consequences of the acquisition, ownership and disposition of shares of our common stock or ADSs, including specifically the tax consequences under Japanese law, the laws of the jurisdiction of which they are resident and any tax treaty between Japan and their country of residence, by consulting their own tax advisers.
For the purpose of Japanese tax law and the Convention between the Government of the United States of America and Japan for the Avoidance of Double Taxation and the Prevention of Fiscal Evasion with Respect to Taxes on Income, or the Tax Convention, a U.S. holder of ADSs will be treated as the owner of the shares of our common stock underlying the ADSs evidenced by the ADRs.
Generally, a non-resident holder of shares of our common stock or ADSs is subject to Japanese withholding tax on dividends paid by us. In the absence of any applicable tax treaty, convention or agreement reducing the rate of withholding tax, the rate of Japanese withholding tax applicable to dividends paid by us to non-resident holders is (i) 15.315% for dividends to be paid on or before December 31, 2037 and (ii) 15% for dividends to be paid thereafter, except for dividends paid to any individual non-resident holder who holds 3% or more of our issued shares for which the applicable rate is (a) 20.42% for dividends to be paid on or before December 31, 2037 and (b) 20% for dividends to be paid thereafter, pursuant to Japanese tax law.
The Tax Convention establishes the maximum rate of Japanese withholding tax which may be imposed on dividends paid to a U.S. resident not having a permanent establishment in Japan. Under the Tax Convention, the maximum withholding rate for U.S. holders (as defined below) is generally set at 10% of the gross amount distributed. However, the maximum rate is 5% of the gross amount distributed if the recipient is a corporation and owns directly or indirectly, on the date on which entitlement to the dividends is determined, at least 10% of the voting shares of the paying corporation. Furthermore, the amount distributed shall not be taxed if the recipient is (i) a pension fund which is a U.S. resident, provided that such dividends are not derived from the
178
Table of Contents
carrying on of a business, directly or indirectly, by such pension fund or (ii) a parent company with a controlling interest in the paying company and satisfies certain other requirements. U.S. holders (as defined below) are urged to consult their own tax advisors with respect to their eligibility for benefits under the Tax Convention.
Japanese tax law provides in general that if the Japanese statutory rate is lower than the maximum rate applicable under tax treaties, conventions or agreements, the Japanese statutory rate as stated above shall be applicable.
Non-resident holders of shares who are entitled to a reduced rate of Japanese withholding tax on payments of dividends on the shares of our common stock or ADSs by us are required to submit an Application Form for the Income Tax Convention regarding Relief from Japanese Income Tax on Dividends, or an Application Form for the Income Tax Convention, in advance through a paying handling agent to the relevant tax authority before the payment of dividends. A standing proxy for non-resident holders may provide this application service for the non-resident holders. In this regard, a certain simplified special filing procedure is available for non-resident holders to claim treaty benefits of exemption from or reduction of Japanese withholding tax with respect to dividends to be paid on or after January 1, 2014, by submitting a Special Application Form for Income Tax Convention regarding Relief from Japanese Income Tax and Special Income Tax for Reconstruction on Dividends of Listed Stocks (together with any other required forms and documents). Non-resident holders who are entitled, under any applicable tax treaty, to a reduced rate of Japanese withholding tax below the rate otherwise applicable under Japanese tax law, or exemption therefrom, as the case may be, but fail to submit the required application in advance may nevertheless be entitled to claim a refund from the relevant Japanese tax authority of withholding taxes withheld in excess of the rate under an applicable tax treaty (if such non-resident holders are entitled to a reduced treaty rate under the applicable tax treaty) or the full amount of tax withheld (if such non-resident holders are entitled to an exemption under the applicable tax treaty), as the case may be, by complying with a certain subsequent filing procedure. We do not assume any responsibility to ensure withholding at the reduced rate, or exemption therefrom, for non-resident holders who would be so eligible under an applicable tax treaty but where the required procedures as stated above are not followed.
Gains derived from the sale or other disposition of shares of our common stock or ADSs by a non-resident holder are not, in general, subject to Japanese income or corporation taxes or other Japanese taxes.
Any deposits or withdrawals of shares of our common stock by a non-resident holder in exchange for ADSs are not subject to Japanese income or corporation tax.
Japanese inheritance and gift taxes, at progressive rates, may be payable by an individual who has acquired shares of our common stock or ADSs as legatee, heir or donee, even if none of the individual, the decedent or the donor is a Japanese resident.
U.S. Taxation
The following sets forth the material U.S. federal income tax consequences of the ownership of shares and ADSs by a U.S. holder, as defined below. This summary is based on U.S. federal income tax laws, including the U.S. Internal Revenue Code of 1986, or the Code, its legislative history, existing and proposed Treasury regulations thereunder, published rulings and court decisions, and the Tax Convention (as defined above), all of which are subject to change, possibly with retroactive effect.
The following summary is not a complete analysis or description of all potential U.S. federal income tax consequences to a particular U.S. holder. It does not address all U.S. federal income tax considerations that may be relevant to all categories of potential purchasers, certain of which (such as banks or other financial institutions, insurance companies, dealers in securities, tax-exempt entities, non-U.S. persons, persons holding a share or an ADS as part of a “straddle,” “hedge,” conversion or integrated transaction, holders whose “functional
179
Table of Contents
currency” is not the U.S. dollar, holders liable for alternative minimum tax and holders of 10% or more of our voting shares) are subject to special tax treatment. This summary does not address any foreign, state, local or other tax consequences of investments in our shares or ADSs.
This summary addresses only shares or ADSs that are held as capital assets within the meaning of Section 1221 of the Code.
As used herein, a “U.S. holder” is a beneficial owner of shares or ADSs, as the case may be, that is:
| Ÿ |
a citizen or resident of the United States as determined for U.S. federal income tax purposes; |
| Ÿ |
a corporation or other entity taxable as a corporation created or organized under the laws of the United States, any state thereof or the District of Columbia; |
| Ÿ |
an estate, the income of which is subject to U.S. federal income tax regardless of its source; or |
| Ÿ |
a trust |
| Ÿ |
the administration of which is subject to (1) the supervision of a court within the United States and (2) the control of one or more U.S. persons as described in Section 7701(a)(30) of the Code; or |
| Ÿ |
that has a valid election in effect under applicable U.S. Treasury regulations to be treated as a U.S. person. |
A “Non-U.S. holder” is any beneficial holder of shares or ADSs that is not a U.S. holder.
If a partnership holds shares or ADSs, the tax treatment of a partner will generally depend on the status of the partner and the activities of the partnership. If you are a partner of a partnership holding shares or ADSs, you should consult your tax advisor.
We urge U.S. holders to consult their own tax advisors concerning the U.S. federal, state and local and other tax consequences to them of the purchase, ownership and disposition of shares or ADSs.
This summary is based in part on the assumption that each obligation under the deposit agreement and any related agreement will be performed in accordance with its respective terms. Subject to the discussion in the next paragraph, for U.S. federal income tax purposes, holders of ADSs will be treated as the owners of the shares represented by the ADSs. Accordingly, withdrawals or deposits of shares in exchange for ADSs generally will not be subject to U.S. federal income tax.
The U.S. Treasury has expressed concerns that intermediaries in the chain of ownership between the holder of an ADS and the issuer of the security underlying the ADS may be taking actions that are inconsistent with the beneficial ownership of the underlying shares (for example, pre-releasing ADSs to persons who do not have beneficial ownership of the securities underlying the ADSs). Accordingly, the discussion on the creditability of Japanese taxes and the availability of the reduced rate of tax for dividends received by certain non-corporate U.S. holders, each as described below, could be affected by actions taken by intermediaries in the chain of ownership between the holder of ADSs and us if, as a result of such actions, the holders of ADSs are not properly treated as beneficial owners of the underlying shares. We are not aware of any intention to take any such actions, and accordingly, the remainder of this discussion assumes that holders of ADSs will be properly treated as beneficial owners of the underlying shares.
Special adverse U.S. federal income tax rules apply if a U.S. holder holds shares or ADSs of a company that is treated as a “passive foreign investment company” (a “PFIC”) for any taxable year during which the U.S. holder held shares or ADSs, as discussed in more detail below. U.S. holders should consult their own tax advisors as to the potential application of the PFIC rules to their ownership and disposition of shares or ADSs.
180
Table of Contents
Taxation of Dividends
Subject to the application of the PFIC rules discussed below, U.S. holders will include the gross amount of any distribution received with respect to shares or ADSs (before reduction for Japanese withholding taxes), to the extent paid out of our current or accumulated earnings and profits (as determined for U.S. federal income tax purposes), as ordinary income in their gross income. As discussed below, for certain U.S. holders, dividends may be eligible for a reduced rate of taxation. The amount of distribution of property other than cash will be the fair market value of such property on the date of the distribution. Dividends received by a U.S. holder will not be eligible for the “dividends-received deduction” allowed to U.S. corporations in respect of dividends received from other U.S. corporations. To the extent that an amount received by a U.S. holder exceeds such holder’s allocable share of our current earnings and profits, such excess will be applied first to reduce such holder’s tax basis in its shares or ADSs, thereby increasing the amount of gain or decreasing the amount of loss recognized on a subsequent disposition of the shares or ADSs. Then, to the extent such distribution exceeds such U.S. holder’s tax basis, such excess will be treated as capital gain. However, we do not maintain calculations of our earnings and profits in accordance with U.S. federal income tax principles, and U.S. holders should therefore assume that any distribution by us with respect to shares or ADSs will constitute ordinary dividend income. The amount of the dividend will be the U.S. dollar value of the Japanese yen payments received. This value will be determined at the spot Japanese yen/U.S. dollar rate on the date the dividend is received by the depositary in the case of U.S. holders of ADSs, or by the shareholder in the case of U.S. holders of shares, regardless of whether the dividend payment is in fact converted into U.S. dollars at that time. If the Japanese yen received as a dividend are not converted into U.S. dollars on the date of receipt, a U.S. holder will have basis in such Japanese yen equal to their U.S. dollar value on the date of receipt, and any foreign currency gains or losses resulting from the conversion of the Japanese yen will generally be treated as U.S. source ordinary income or loss. If the Japanese yen received as a dividend are converted into U.S. dollars on the date of receipt, a U.S. holder will generally not be required to recognize foreign currency gain or loss in respect of the dividend income.
If a U.S. holder is eligible for benefits under the Tax Convention, the holder may be able to claim a reduced rate of Japanese withholding tax. All U.S. holders should consult their tax advisors about their eligibility for reduction of Japanese withholding tax. A U.S. holder may claim a deduction or a foreign tax credit, subject to other applicable limitations, only for tax withheld at the appropriate rate. A U.S. holder would be allowed a foreign tax credit for withholding tax for any portion of the tax that could have been avoided by claiming benefits under the Tax Convention. For foreign tax credit limitation purposes, the dividend will be income from sources outside the United States. The limitation on foreign taxes eligible for credit is calculated separately with respect to specific classes of income. For this purpose, dividends we pay will constitute “passive income” or, in the case of certain U.S. holders, “financial services income.” The rules governing U.S. foreign tax credits are very complex and U.S. holders should consult their tax advisors regarding the availability of foreign tax credits under their particular circumstances.
Subject to applicable exceptions with respect to short-term and hedged positions, qualified dividends received by non-corporate U.S. holders from a qualified corporation may be eligible for reduced rates of taxation. Qualified corporations include those foreign corporations eligible for the benefits of a comprehensive income tax treaty with the United States that the U.S. Treasury Department determines to be satisfactory for these purposes and that includes an exchange of information provision. The Tax Convention meets these requirements. We believe that we are a qualified foreign corporation and that dividends received by U.S. investors with respect to our shares or ADSs will be qualified dividends. Dividends received by U.S. investors from a foreign corporation that was a PFIC in either the taxable year of the distribution or the preceding taxable year are not qualified dividends.
Passive Foreign Investment Company Considerations
Special adverse U.S. federal income tax rules apply if a U.S. holder holds shares or ADSs of a company that is treated as a PFIC, for any taxable year during which the U.S. holder held shares or ADSs. A foreign
181
Table of Contents
corporation will be considered a PFIC for any taxable year in which (i) 75% or more of its gross income is passive income (the “income test”), or (ii) 50% or more of the average fair market value of its assets (determined quarterly) is attributable to assets that produce or are held for the production of passive income (the “asset test”). For this purpose, passive income generally includes dividends, interest, royalties, rents and certain gains from the sale of stock and securities. If a foreign corporation owns at least 25% (by value) of the stock of another corporation, the corporation will be treated, for purposes of the PFIC tests, as owning a proportionate share of the other corporation’s assets and receiving its proportionate share of the other corporation’s income. The determination of whether a foreign corporation is a PFIC is made annually.
Proposed Treasury regulations convert what would otherwise be passive income into non-passive income when such income is banking income earned by an active bank. Based upon these proposed Treasury regulations and certain IRS guidance relating to the treatment of certain qualifying government bonds, and upon certain management estimates and assumptions, we do not believe that we were a PFIC for the year ended March 31, 2014 because we did not meet either the income test or the asset test. The determination of whether we are a PFIC must be made annually and involves a fact-intensive analysis based upon, among other things, the composition of our income and assets and the value of our assets from time to time. It is possible that we may become a PFIC in the fiscal year ending March 31, 2015 or any future taxable year due to changes in our income or asset composition. In addition, a decrease in the price of our shares may also result in our becoming a PFIC. Furthermore, there can be no assurance that the above-described proposed Treasury regulations will be finalized in their current form or that the above IRS guidance which is scheduled to expire for taxable years beginning after 2016 will continue to apply. Moreover, the application of the proposed Treasury regulations is not clear. If we were classified as a PFIC in any year during which a U.S. holder owns shares or ADSs and the U.S. holder does not make a “mark-to-market” election, as discussed below, we generally would continue to be treated as a PFIC as to such U.S. holder in all succeeding years, regardless of whether we continue to meet the income or asset test discussed above. U.S. Holders are urged to consult their own tax advisors with respect to the tax consequences to them if we were to become a PFIC for any taxable year in which they own our shares or ADSs.
If we were classified as a PFIC for any taxable year during which a U.S. holder holds our shares or ADSs, the U.S. holder would generally not receive capital gains treatment upon the sale of the shares or ADSs and would be subject to increased tax liability (generally including an interest charge) upon the sale or other disposition of the shares or ADSs or upon the receipt of certain distributions treated as “excess distributions,” unless the U.S. holder makes the mark-to-market election described below. An excess distribution generally would be any distribution to a U.S. holder with respect to shares or ADSs during a single taxable year that is greater than 125% of the average annual distributions received by a U.S. holder with respect to shares or ADSs during the three preceding taxable years or, if shorter, during the U.S. holder’s holding period for the shares or ADSs.
Mark-to-Market Election . If the shares or ADSs are regularly traded on a registered national securities exchange or certain other exchanges or markets, then such shares or ADSs would constitute “marketable stock” for purposes of the PFIC rules, and a U.S. holder would not be subject to the foregoing PFIC rules if such holder made a mark-to-market election. After making such an election, the U.S. holder generally would include as ordinary income each year during which the election is in effect and during which we are a PFIC the excess, if any, of the fair market value of our shares or ADSs at the end of the taxable year over such holder’s adjusted basis in such shares or ADSs. These amounts of ordinary income would not be eligible for the favorable tax rates applicable to qualified dividend income or long-term capital gains. A U.S. holder also would be allowed to take an ordinary loss in respect of the excess, if any, of the holder’s adjusted basis in our shares or ADSs over their fair market value at the end of the taxable year (but only to the extent of the net amount of income that was previously included as a result of the mark-to-market election). A U.S. holder’s tax basis in our shares or ADSs would be adjusted to reflect any income or loss amounts resulting from a mark-to-market election. If made, a mark-to-market election would be effective for the taxable year for which the election was made and for all subsequent taxable years unless the shares or ADSs cease to qualify as “marketable stock” for purposes of the
182
Table of Contents
PFIC rules or the Internal Revenue Service consented to the revocation of the election. In the event that we are classified as a PFIC, U.S. holders are urged to consult their tax advisors regarding the availability of the mark-to-market election, and whether the election would be advisable in the holder’s particular circumstances.
QEF Election . The PFIC rules outlined above also would not apply to a U.S. holder if such holder alternatively elected to treat us as a “qualified electing fund” or “QEF.” An election to treat us as a QEF will not be available, however, if we do not provide the information necessary to make such an election. We will not provide U.S. holders with the information necessary to make a QEF election, and thus, the QEF election will not be available with respect to our shares.
Notwithstanding any election made with respect to our shares, dividends received with respect to our shares will not constitute “qualified dividend income” if we are a PFIC in either the year of the distribution or the preceding taxable year. Dividends that do not constitute qualified dividend income are not eligible for taxation at the reduced tax rate described above in “—Taxation of Dividends.” Instead, such dividends would be subject to tax at ordinary income rates.
If a U.S. holder owns shares or ADSs during any year in which we are a PFIC, the U.S. holder must also file IRS Form 8621 regarding distributions received on the shares or ADSs, any gain realized on the shares or ADSs, and any “reportable election” in accordance with the instructions to such form. In addition, each U.S. holder is required to file a separate IRS Form 8621 if such U.S. holder owns shares or ADSs during any year in which we are a PFIC whether or not such U.S. holder received distributions on the shares or ADSs, realized a gain on the shares or ADSs or made a “reportable election” during such year. U.S. holders are urged to consult their own tax advisors concerning the U.S. federal income tax consequences of holding shares or ADSs if the Company were considered a PFIC in any taxable year.
Taxation of Capital Gains
Subject to the application of the PFIC rules discussed above, upon a sale or other disposition of shares or ADSs, a U.S. holder will recognize a gain or loss in an amount equal to the difference between the U.S. dollar value of the amount realized and the U.S. holder’s tax basis, determined in U.S. dollars, in such shares or ADSs. Such gains or losses will be capital gains or losses and will be long-term capital gains or losses if the U.S. holder’s holding period for such shares or ADSs exceeds one year. Long-term capital gains of non-corporate U.S. holders (including individuals) are generally eligible for reduced rates of taxation. A U.S. holder’s adjusted tax basis in its shares or ADSs will generally be the cost to the holder of such shares or ADSs. Any such gains or losses realized by a U.S. holder upon disposal of the shares or ADSs will generally be income or loss from sources within the United States for foreign tax credit limitation purposes. The deductibility of capital losses is subject to limitations under the Code.
Information Reporting and Backup Withholding
Dividends paid on shares or ADSs to a U.S. holder, or proceeds from a U.S. holder’s sale or other disposition of shares or ADSs, may be subject to information reporting requirements. Those dividends or proceeds from sale or disposition may also be subject to backup withholding unless the U.S. holder:
| Ÿ |
is a corporation or other exempt recipient, and, when required, demonstrates this fact; or |
| Ÿ |
provides a correct taxpayer identification number on a properly completed U.S. Internal Revenue Service Form W-9 or other appropriate form which certifies that the U.S. holder is not subject to backup withholding and otherwise complies with applicable requirements of the backup withholding rules. |
Backup withholding is not an additional tax. Any amount withheld under these rules will be creditable against the U.S. holder’s U.S. federal income tax liability or refundable to the extent that it exceeds such liability if the U.S. holder provides the required information to the Internal Revenue Service. If a U.S. holder is required
183
Table of Contents
to and does not provide a correct taxpayer identification number, the U.S. holder may be subject to penalties imposed by the Internal Revenue Service. All holders should consult their tax advisors as to their qualification for the exemption from backup withholding and the procedure for obtaining an exemption.
In addition, certain U.S. holders who are individuals that hold certain foreign financial assets (which may include our shares or ADSs) are required to report information relating to such assets, subject to certain exceptions. U.S. Holders should consult their tax advisors regarding the effect, if any, of this requirement on their ownership and disposition of our shares and ADSs.
Additional Tax on Investment Income
U.S. Holders that are individuals, estates or trusts and whose income exceeds certain thresholds will be subject to an additional 3.8% tax on unearned income, including, among other things, dividends on, and capital gains from the sale or other taxable disposition of, shares or ADSs, subject to certain limitations and exceptions.
| F. | Dividends and Paying Agents |
Not applicable.
| G. | Statement by Experts |
Not applicable.
| H. | Documents on Display |
We file periodic reports and other information with the SEC. You may read and copy any document that we file with the SEC at the SEC’s public reference room at 100 F Street, NE, Washington, DC 20549. Please call the SEC at 1-800-SEC-0330 for further information on the operation of its public reference rooms. The SEC also maintains a web site that contains reports, proxy and information statements and other information regarding registrants that file electronically with the SEC (http://www.sec.gov). Some of this information may also be found on our website at http://www.mufg.jp.
| I. | Subsidiary Information |
Please refer to discussion under “Item 4.C. Information on the Company—Organizational Structure.”
| Item 11. | Quantitative and Qualitative Disclosures about Credit, Market and Other Risk. |
Numerous changes in our business environment have occurred as a result of globalization of the financial industry, the advancement of information technology, and changes in economic conditions. We aim to be a global and comprehensive financial group encompassing leading commercial and trust banks, and securities firms. Risk management plays an increasingly important role as the risks faced by financial groups such as us increase in scope and variety.
We identify various risks arising from businesses based on uniform criteria, and implement integrated risk management to ensure a stronger financial condition and to maximize shareholder value. Based on this policy, we identify, measure, control and monitor a wide variety of risks so as to achieve a stable balance between earnings and risks. We undertake risk management to create an appropriate capital structure and to achieve optimal allocation of resources.
184
Table of Contents
Risk Classification
At the holding company level, we broadly classify and define risk categories faced by the Group including those that are summarized below. Group companies perform more detailed risk management based on their respective operations.
|
Type of Risk |
Definition |
|
|
Credit Risk |
The risk of financial loss in credit assets (including off-balance sheet instruments) caused by deterioration in the credit conditions of counterparties. This category includes country risk. | |
|
Market Risk |
Market risk is the risk of financial loss where the value of our assets and liabilities could be adversely affected by changes in market variables such as interest rates, securities prices and foreign exchange rates. Market liquidity risk is the risk of financial loss caused by the inability to secure market transactions at the required volume or price levels as a result of market turbulence or lack of trading liquidity. | |
|
Liquidity Risk |
The risk of incurring loss if a poor financial position at a group company hampers the ability to meet funding requirements or necessitates fund procurement at interest rates markedly higher than normal. | |
|
Operational Risk |
The risk of loss resulting from inadequate or failed internal processes, people or systems, or from external events. | |
|
Ÿ Operations Risk |
The risk of incurring loss that might be caused by negligence of correct operational processing, or by incidents or misconduct by either officers or staff, as well as other similar risks. | |
|
Ÿ Information Asset Risk |
The risk of loss caused by loss, alteration, falsification or leakage of information, or by destruction, disruption, errors or misuse of information systems, as well as other similar risks. | |
|
Ÿ Legal Risk |
The risk of loss due to failure to comply with applicable laws and regulations, adequately evaluate contractual rights and obligations, or appropriately deal with disputes, as well as other similar risks. | |
|
Ÿ Reputation Risk |
The risk of loss due to deterioration in reputation as a consequence of the spread of rumors among customers or in the market, or as a consequence of inadequate response to a particular circumstance by MUFG, as well as other similar risks. | |
Risk Management System
We have adopted an integrated risk management system to promote close cooperation among the holding company and group companies. The holding company and the major subsidiaries (which include BTMU, MUTB and MUSHD) each appoint a chief risk officer and establish an independent risk management division. The board of directors of the holding company determines risk management policies for various type of risk based on the discussions at, and reports and recommendations from, committees established specially for risk management purposes. The holding company has established committees to assist management in managing risks relevant to the Group. Following the fundamental risk management policies determined by the board of directors, each group company establishes its own systems and procedures for identifying, analyzing and managing various types of risks from both quantitative and qualitative perspectives. The holding company seeks to enhance group wide risk identification, to integrate and improve the Group’s risk management system and related methods, to maintain asset quality, and to eliminate concentrations of specific risks.
185
Table of Contents
The following diagram summarizes our integrated risk management framework:
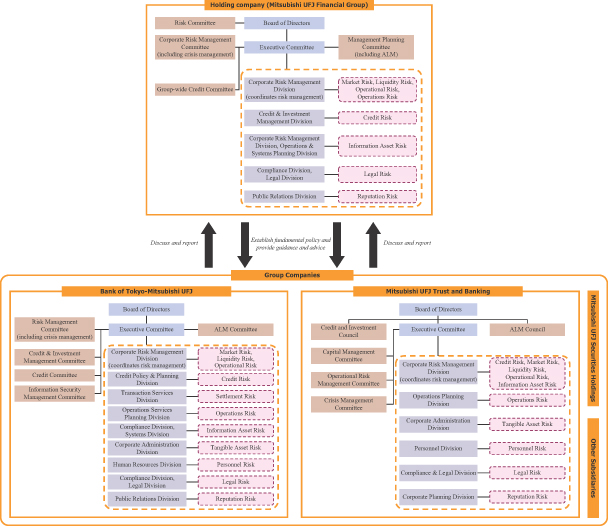
Crisis Management Framework
In order to have a clear critical response rationale and associated decision-making criteria, we have developed systems designed to ensure that our operations are not interrupted or can be restored to normal quickly in the event of a natural disaster or system failure so as to minimize any disruption to customers and markets. A crisis management team within the holding company is the central coordinating body in the event of any emergency. Based on information collected from crisis management personnel at the major subsidiaries, this central body would assess the overall impact of a crisis on the Group’s business and establish task forces that could implement all countermeasures to restore full operations. We have business continuity plans to maintain continuous operational viability in the event of natural disasters, system failures and other types of emergencies. Regular training drills are conducted to upgrade the practical effectiveness of these systems.
Recognizing that our operations particularly in Japan are subject to the risk of earthquakes and other natural disasters as well as accidents resulting from such disasters, including a sudden massive blackout in major metropolitan areas in Japan, and that our contingency plans may not address all eventualities that may occur in the event of a material disruption to our operations, we have been conducting a comprehensive review of our existing business continuity plan to more effectively respond to such extreme scenarios, and continue to
186
Table of Contents
contemplate and implement measures to augment our current business continuity management framework, including enhancing our off-site back-up data storage and other information technology systems.
Implementation of Basel Standards
Basel II, as adopted by the FSA, has been applied to Japanese banks since March 31, 2007. Certain provisions of Basel III were adopted by the FSA effective March 31, 2013 for Japanese banking institutions with international operations conducted by their foreign offices. Basel III is based on Basel II’s comprehensive regulatory framework which is built on “three pillars”: (1) minimum capital requirements, (2) the self-regulation of financial institutions based on supervisory review process, and (3) market discipline through the disclosure of information. Based on the Basel principles, MUFG has adopted the Advanced Internal Ratings-Based Approach to calculate its capital requirements for credit risk since March 31, 2009. The Standardized Approach is used for some subsidiaries that are considered to be immaterial to our overall capital requirements, and MUFG Americas Holding Corporation, or MUAH, has adopted a phased rollout of the Internal Ratings-Based Approach. MUFG has adopted the Advanced Measurement Approach since March 31, 2012 to calculate its capital requirements for operational risk, except that we use the Basic Indicator Approach for entities that are deemed to be less important in the calculation of the operational risk equivalent amount and for entities that are still preparing to implement the Advanced Measurement Approach. As for market risk, MUFG has adopted the Internal Models Approach mainly to calculate general market risk and adopted the Standardized Measurement Method to calculate specific risk.
In response to the recent financial crisis, the Group of Central Bank Governors and Heads of Supervision has made a series of announcements regarding the new global regulatory framework, which has been referred to as “Basel III,” to strengthen the regulation, supervision and risk management of the banking sector. Various Basel III measures are being phased in from the calendar year 2013, including those designed to raise the level of minimum capital requirements and to establish an internationally harmonized leverage ratio and a global minimum liquidity standard. In addition, the Basel Committee on Banking Supervision has proposed additional loss absorbency requirements to supplement the Common Equity Tier 1 capital requirement ranging from 1% to 3.5% for global systemically important banks, or G-SIBs, depending on the bank’s systemic importance. The Financial Stability Board identified us as a G-SIB in its most recent annual report published in November 2013, and indicated that, as a G-SIB, we would be required to hold an additional 1.5% of Tier 1 common equity. The group of banks identified as G-SIBs is expected to be updated annually, and the first group of G-SIBs to which the stricter capital requirements will initially be applied is expected to be identified in 2014. The stricter capital requirements are expected to be implemented in phases between January 1, 2016 and December 31, 2018 and will become fully effective on January 1, 2019.
Based on the Basel III framework, the Japanese capital ratio framework has been revised to implement the more stringent requirements, which are being implemented in phases beginning on March 31, 2013. Likewise, local banking regulators outside of Japan, such as those in the United States, have revised or are expected to revise the capital and liquidity requirements imposed on our subsidiaries and operations in those countries to implement the more stringent requirements of Basel III as adopted in those countries. We intend to carefully monitor further developments with an aim to enhance our corporate value and maximize shareholder value by integrating the various strengths within the MUFG Group. For more information on the Basel regulatory framework and requirements, see “Item 4.B. Information on the Company—Business Overview—Supervision and Regulation.”
Credit Risk Management
Credit risk is the risk of losses due to deterioration in the financial condition of a borrower. We have established risk management systems to maintain asset quality, manage credit risk exposure and achieve earnings commensurate with risk.
Our major banking subsidiaries (which include BTMU and MUTB) apply a uniform credit rating system for asset evaluation and assessment, loan pricing, and quantitative measurement of credit risk. This system also underpins the calculation of capital requirements and management of credit portfolios. We continually seek to
187
Table of Contents
upgrade credit portfolio management, or CPM, expertise to achieve an improved risk-adjusted return based on the Group’s credit portfolio status and flexible response capability to economic and other external changes.
Credit Risk Management System
The credit portfolios of our major banking subsidiaries are monitored and assessed on a regular basis by the holding company to maintain and improve asset quality. A uniform credit rating and asset evaluation and assessment system is used to ensure timely and proper evaluation of all credit risks.
Under our credit risk management system, each of our subsidiaries in the banking, securities, consumer finance, and leasing businesses, manages its respective credit risk on a consolidated basis based on the attributes of the risk, while the holding company oversees and manages credit risk on an overall group-wide basis. The holding company also convenes regular committee meetings to monitor credit risk management at banking subsidiaries and to issue guidance where necessary.
Each major banking subsidiary has in place a system of checks and balances in which a credit administration section that is independent of the business promotion sections screens individual transactions and manages the extension of credit. At the management level, regular meetings of the Credit & Investment Management Committee and related deliberative bodies ensure full discussion of important matters related to credit risk management. Besides such checks and balances and internal oversight systems, credit examination sections also undertake credit testing and evaluation to ensure appropriate credit risk management.
The following diagram summarizes the credit risk management framework for our major banking subsidiaries:
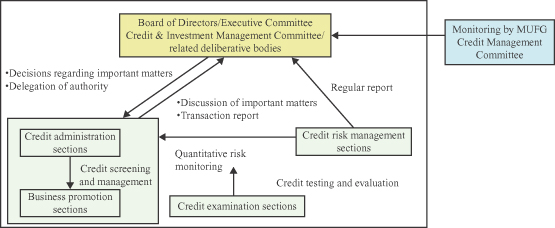
Credit Rating System
MUFG and its major banking subsidiaries use an integrated credit rating system to evaluate credit risk. The credit rating system consists primarily of borrower rating, facility risk rating, structured finance rating and asset securitization rating.
Country risk is also rated on a uniform group-wide basis. Our country risk rating is reviewed periodically to take into account relevant political and economic factors, including foreign currency availability.
Risk exposure for small retail loans, such as residential mortgage loans, is managed by grouping loans into various pools and assigning ratings at the pool level.
Borrower rating
Our borrower rating classifies borrowers into 15 grades based on evaluations of their expected debt-service capability over the next three to five years.
188
Table of Contents
The following table sets forth our borrower grades:
Definition of MUFG Borrower Rating
|
MUFG
Borrower
|
MUFG Borrower Rating Definition |
|||
| 1 | The capacity to meet financial commitments is extremely certain, and the borrower has the highest level of creditworthiness. | |||
| 2 | The capacity to meet financial commitments is highly certain, but there are some elements that may result in lower creditworthiness in the future. | |||
| 3 | The capacity to meet financial commitments is sufficiently certain, but there is the possibility that creditworthiness may fall in the long run. | |||
| 4 | There are no problems concerning the capacity to meet financial commitments, but there is the possibility that creditworthiness may fall in the long run. | |||
| 5 | There are no problems concerning the capacity to meet financial commitments, and creditworthiness is in the middle range. | |||
| 6 | There are no problems concerning the capacity to meet financial commitments presently, but there are elements that require attention if the situation changes. | |||
| 7 | There are no problems concerning the capacity to meet financial commitments presently, but long-term stability is poor. | |||
| 8 | There are no problems concerning the capacity to meet financial commitments presently, but long-term stability is poor, and creditworthiness is relatively low. | |||
| 9 | The capacity to meet financial commitments is somewhat poor, and creditworthiness is the lowest among “Normal” customers. | |||
|
10 through 12
|
Borrowers who must be closely monitored because of the following business performance and financial conditions: | |||
|
(1) Borrowers who have problematic business performance, such as virtually delinquent principal repayment or interest payment; |
||||
|
(2) Borrowers whose business performance is unsteady, or who have unfavorable financial conditions; |
||||
|
(3) Borrowers who have problems with loan conditions, for whom interest rates have been reduced or shelved. |
||||
| 10 | Although business problems are not serious or their improvement is seen to be remarkable, there are elements of potential concern with respect to the borrower’s management, and close monitoring is required. | |||
| 11 | Business problems are serious, or require long-term solutions. Serious elements concerning business administration of the borrower have emerged, and subsequent debt repayment needs to be monitored closely. | |||
| 12 | Borrowers who fall under the criteria of Rating 10 or 11 and have a loan concession granted. Borrowers who have “Loans contractually past due 90 days or more.” (As a rule, delinquent borrowers are categorized as “Likely to Become Bankrupt,” but the definition here applies to borrowers delinquent for 90 days or more because of inheritance and other special reasons.) | |||
| 13 | Borrowers who pose a serious risk with respect to debt repayment, loss is likely to occur in the course of transactions. While still not bankrupt, these borrowers are in financial difficulty, with poor progress in achieving restructuring plans, and are likely to become bankrupt in the future. | |||
| 14 | While not legally bankrupt, borrowers who are considered to be virtually bankrupt because they are in serious financial difficulty and have no prospects for an improvement in their business operations. | |||
| 15 | Borrowers who are legally bankrupt (i.e., who have no prospects for continued business operations because of non-payment, suspension of business, voluntary liquidation, or filing for legal liquidation). | |||
189
Table of Contents
The Japanese regulatory authorities require Japanese banks to categorize borrowers as follows:
| Ÿ |
Normal borrowers (generally corresponding to borrowers in categories 1 through 9 in our ratings), which are borrowers that are performing well, with no significant financial concerns, |
| Ÿ |
Borrowers requiring close watch (generally corresponding to borrowers in categories 10 through 12 in our ratings), which include loans that have been amended to allow for delays or forgiveness of interest payments, borrowers experiencing difficulty in complying with loan terms and conditions and borrowers that are recording losses or performing badly, |
| Ÿ |
Borrowers likely to become bankrupt (generally corresponding to borrowers in category 13 in our ratings), which relate to borrowers who pose a serious risk with respect to debt repayment, loss is likely to occur in the course of transactions. While still not bankrupt, these borrowers are in financial difficulty, with poor progress in achieving restructuring plans, and are likely to become bankrupt in the future, |
| Ÿ |
Virtually bankrupt borrowers (generally corresponding to borrowers in category 14 in our ratings), which are not legally bankrupt, but borrowers who are considered to be virtually bankrupt because they are in serious financial difficulty and have no prospects for an improvement in their business operations, and |
| Ÿ |
Bankrupt borrowers or de facto bankrupt borrowers (generally corresponding to borrowers in category 15 in our ratings), which are borrowers who are legally bankrupt (i.e., who have no prospects for continued business operations because of non-payment, suspension of business, voluntary liquidation, or filing for legal liquidation) proceedings. |
The primary data utilized in our assessment of borrowers include the borrower’s financial statements and notes thereto as well as other public disclosure made by the borrower. In addition, when appropriate and possible, we obtain non-public financial and operating information from borrowers, such as the borrower’s business plan, borrower’s self-evaluation of its operating assets and other borrower information about its business and products.
Based on the borrower and industry information, we assign borrower ratings mainly by applying financial scoring models—either developed internally or by third party vendors, depending on the borrower’s attributes, whether the borrower is domestic or foreign, whether the borrower is a large corporation or small and medium-sized corporation, and whether the borrower is corporate entity or another type of legal entity (such as a school, hospital or fund).
For example, for domestic small and medium-sized corporations, which constitute the largest borrower attribute in our current loan portfolio in terms of number of borrowers, we have adopted an internally developed financial scoring model, exclusively designed and developed for such attribute. We have selected various financial ratios that we believe to be useful and meaningful to quantitatively measure and assess the borrowers’ financial standings and repayment capability. Such financial ratios represent, among other things, borrowers’ growth, profitability, stability, cash flow, company size and capital efficiency. The model is periodically tested against historical results. The following is an illustration of some of the financial ratio we utilize as part of our financial scoring model:
| Ÿ |
To measure growth: Sales growth, and growth in total assets, |
| Ÿ |
To measure profitability: Current profit to sales, and profit before tax to sales, and |
| Ÿ |
To measure stability: Equity ratio and current ratio. |
The financial score obtained through the models is reviewed and, when necessary, adjusted downward to reflect our qualitative assessment of the borrower’s financial strength and other factors that could affect the borrower’s ability to service the debt. For example, we take into account: capability of turning around the business (in case of borrowers with losses) or recovering positive net worth (in case of borrowers with negative net worth), industry risk, management risk, legal risk, as well as our assessment of the probability of receiving support from parent companies (if the borrower is a subsidiary of a large listed company).
190
Table of Contents
When adjusting the results of primary financial scoring assigned to borrowers with losses, we consider the severity of losses and the possibility of improving operating results. We analyze and assess whether the loss is temporary, the trend in operating results is improving, or the loss is expected to continue for an extended period. When adjusting the results of primary financial scoring assigned to borrowers with losses or borrowers with negative net worth, we also analyze whether the borrower can return to a positive net worth, and the time period needed to achieve such recovery (one to two years, three to five years, or five years or more).
In addition, adjustments based on industry risk are based on future prospects, applicable laws and regulations, and other factors surrounding the industry. Adjustments for management risk reflect our assessment of management’s track record, the composition of the management team including the board of directors, any management succession plan as well as the risk management and compliance framework of the borrower. Adjustments for legal risk are made when the borrower is facing a lawsuit and when there is a possibility of a significant claim payment related to product liability, intellectual property, environmental problems, building standard law, and other legal issues.
When assessing the probability of receiving support from parent companies, various factors are examined, such as the parent company’s credit standings, whether key management personnel are sent by the parent, whether the borrower is consolidated by the parent, and the proportion of the borrower in consolidated sales and profits of the parent.
In addition, we consider outside ratings, and its internal borrower ratings may be adjusted when deemed appropriate.
Facility risk rating
Facility risk rating is used to evaluate and classify the quality of individual credit facilities, including guarantees and collateral. Ratings are assigned by quantitatively measuring the estimated loss rate of a facility in the event of a default.
Structured finance rating and asset securitization rating
Structured finance rating and asset securitization rating are used to evaluate and classify the quality of individual credit facilities, including guarantees and collateral, and focus on the structure, including the applicable credit period, of each credit facility. In evaluating the debt service potential of a credit facility, we scrutinize its underlying structure to determine the likelihood of the planned future cash flows being achieved.
Pool assignment
Each major banking subsidiary has its own system for pooling and rating small retail loans designed to reflect the risk profile of its loan portfolios.
Asset Evaluation and Assessment System
The asset evaluation and assessment system is used to classify assets held by us according to the probability of collection and the risk of any impairment in value based on borrower classifications consistent with the borrower ratings and the status of collateral, guarantees, and other factors.
The system is used to conduct write-offs and allocate allowances against credit risk in a timely and adequate manner.
Quantitative Analysis of Credit Risk
MUFG and its major banking subsidiaries manage credit risk by monitoring credit amount and expected losses, and run simulations based on internal models to estimate the maximum amount of credit risk. These models are used for internal management purposes, including loan pricing and measuring economic capital.
191
Table of Contents
When quantifying credit risk amounts using the internal models, MUFG and its major banking subsidiaries consider various parameters, including probability of default, or PD, loss given default, or LGD, and exposure at default, or EAD, used in their borrower ratings, facility risk ratings and pool assignments as well as any credit concentration risk in particular borrower groups or industry sectors. MUFG and its major banking subsidiaries also share credit portfolio data in appropriate cases.
Loan Portfolio Management
We aim to achieve and maintain levels of earnings commensurate with credit risk exposure. Products are priced to take into account expected losses, based on the internal credit ratings.
We assess and monitor loan amounts and credit exposure by credit rating, industry and region. Portfolios are managed to limit concentrations of risk in specific categories in accordance with our Large Credit Guidelines.
To manage country risk, we have established specific credit ceilings by country. These ceilings are reviewed when there is a material change in a country’s credit standing, in addition to being subject to a regular periodic review.
Continuous CPM Improvement
With the prevalence of securitized products and credit derivatives in global markets, we seek to supplement conventional CPM techniques with advanced methods based on the use of such market-based instruments.
Through credit risk quantification and portfolio management, we aim to improve the risk return profile of the Group’s credit portfolio, using financial markets to rebalance credit portfolios in a dynamic and active manner based on an accurate assessment of credit risk. The following diagram summarizes our CPM framework:
Credit Portfolio Management (CPM) Framework
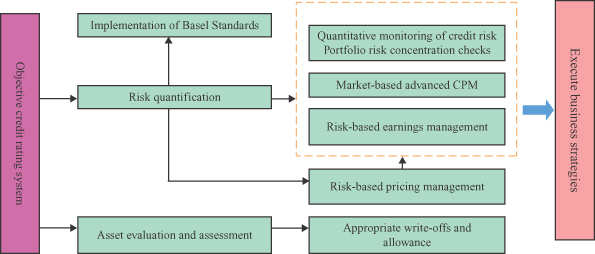
Risk Management of Strategic Equity Portfolio
Strategic equity investment risk is the risk of loss caused by a decline in the prices of our equity investments.
192
Table of Contents
We hold shares of various corporate clients for strategic purposes, in particular to maintain long-term relationships with these clients. These investments have the potential to increase business revenue and appreciate in value. At the same time, we are exposed to the risk of price fluctuation in the Japanese stock market. For that reason, in recent years, it has been a high priority for us to reduce our equity portfolio to limit the risks associated with holding a large equity portfolio, but also to respond to applicable regulatory requirements as well as increasing market expectation and demands for us to reduce our equity portfolio. We are required to comply with a regulatory framework that prohibits Japanese banks from holding an amount of shares in excess of their adjusted Tier 1 capital after September 2006.
We use quantitative analysis to manage the risks associated with the portfolio of equities held for strategic purposes. According to internal calculations, the market value of our strategically held (Tokyo Stock Exchange-listed) stocks (excluding foreign stock exchange-listed stocks) as of March 31, 2014 was subject to a variation of approximately ¥3.66 billion when TOPIX index moves one point in either direction.
We seek to manage and reduce strategic equity portfolio risk based on such types of simulation. The aim is to keep this risk at appropriate levels compared with Tier 1 capital while generating returns commensurate with the degree of risk exposure.
Market Risk Management
Market risk is the risk that the value of our assets and liabilities could be adversely affected by changes in market variables such as interest rates, securities prices, or foreign exchange rates.
Management of market risk at MUFG aims to control related risk exposure across the Group while ensuring that earnings are commensurate with levels of risk.
Market Risk Management System
We have adopted an integrated system to manage market risk from our trading and non-trading activities. The holding company monitors group-wide market risk, while each of the major subsidiaries manages its market risks on a consolidated and global basis.
At each of the major subsidiaries, checks and balances are maintained through a system in which back and middle offices operate independently from front offices. In addition, separate Asset-Liability Management, or ALM, Committee, ALM Council and Risk Management Meetings are held at each of the major subsidiaries every month to deliberate important matters related to market risk and control.
193
Table of Contents
The holding company and the major subsidiaries allocate economic capital commensurate with levels of market risk and determined within the scope of their capital bases. The major subsidiaries have established quantitative limits relating to market risk based on their allocated economic capital. In addition, in order to keep losses within predetermined limits, the major subsidiaries have also set limits for the maximum amount of losses arising from market activities. The following diagram summarizes the market risk management system of each major subsidiary:
Market Risk Management System of Our Major Subsidiaries
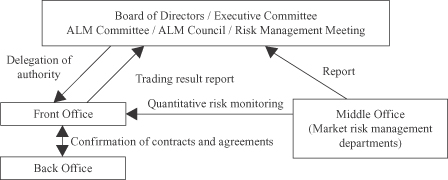
Market Risk Management and Control
At the holding company and the major subsidiaries, market risk exposure is reported to the Chief Risk Management Officers on a daily basis. At the holding company, the Chief Risk Management Officer monitors market risk exposure across the Group as well as the major subsidiaries’ control over their quantitative limits for market risk and losses. Meanwhile, the Chief Risk Management Officers at the major subsidiaries monitor their own market risk exposure and their control over their quantitative limits for market risk and losses. In addition, various analyses on risk profiles, including stress testing, are conducted and reported to the Executive Committees and the Corporate Risk Management Committees on a regular basis. At the business unit levels in the major subsidiaries, the market risks on their marketable assets and liabilities, such as interest rate risk and foreign exchange rate risk, are controlled by entering into various hedging transactions using marketable securities and derivatives.
As part of our market risk management activities, we use certain derivative financial instruments to manage our interest rate and currency exposures. We maintain an overall interest rate risk management strategy that incorporates the use of interest rate contracts to minimize significant unplanned fluctuations in earnings that are caused by interest rate volatility. We enter into interest rate swaps and other contracts as part of our interest rate risk management strategy primarily to alter the interest rate sensitivity of our loans, investment securities and deposit liabilities. Our principal objectives in risk management include asset and liability management. Asset and liability management is viewed as one of the methods for us to manage our interest rate exposures on interest-earning assets and interest-bearing liabilities. Interest rate contracts, which are generally non-leveraged generic interest rate and basis swaps, options and futures, allow us to effectively manage our interest rate risk position. Option contracts primarily consist of caps, floors, swaptions and options on index futures. Futures contracts used for asset and liability management activities are primarily index futures providing for cash payments based upon the movement of an underlying rate index. We enter into forward exchange contracts, currency swaps and other contracts in response to currency exposures resulting from on-balance sheet assets and liabilities denominated in foreign currencies in order to limit the net foreign exchange position by currency to an appropriate level.
These market risk management activities are performed in accordance with the predetermined rules and procedures. The internal auditors regularly verify the appropriateness of the management controls over these activities and the risk evaluation models adopted.
194
Table of Contents
Market Risk Measurement Model
Market risks consist of general risks and specific risks. General market risks result from changes in entire markets, while specific risks relate to changes in the prices of individual stocks and bonds which are independent of the overall direction of the market.
To measure market risks, MUFG uses the VaR method which estimates changes in the market value of portfolios within a certain period by statistically analyzing past market data. Since the daily variation in market risk is significantly greater than that in other types of risk, MUFG measures and manages market risk using VaR on a daily basis.
Market risk for trading and non-trading activities is measured using a uniform market risk measurement model. The principal model used for these activities is historical simulation, or HS, model (holding period, 10 business days; confidence interval, 99%; and observation period, 701 business days). The HS model calculates VaR amounts by estimating the profit and loss on the current portfolio by applying actual fluctuations in market rates and prices over a fixed period in the past. This method is designed to capture certain statistically infrequent movements, such as a fat tail, and accounts for the characteristics of financial instruments with non-linear behavior. The holding company and banking subsidiaries also use the HS model to calculate as part of the calculation of their Basel III regulatory capital adequacy ratios.
In calculating VaR using the HS method, we have implemented an integrated market risk measurement system throughout the Group. Our major subsidiaries calculate their VaR based on the risk and market data prepared by the information systems of their front offices and other departments. The major subsidiaries provide this risk data to the holding company, which calculates overall VaR, taking into account the diversification effect among all portfolios of the major subsidiaries.
For the purpose of internally evaluating capital adequacy on an economic capital basis in terms of market risk, we use this market risk measurement model to calculate risk amounts based on a holding period of one year and a confidence interval of 99.9%.
Monitoring and managing our sensitivity to interest rate fluctuations is the key to managing market risk in MUFG’s non-trading activities. The major banking subsidiaries take the following approach to measuring risks concerning core deposits, loan prepayments and early deposit withdrawals.
To measure interest rate risk relating to deposits without contract-based fixed maturities, the amount of “core deposits” is calculated through a statistical analysis based on deposit balance trend data and the outlook for interest rates on deposits, business decisions, and other factors. The amount of “core deposit” is categorized into various groups of maturity terms of up to ten years (4.5 years on average) to recognize interest rate risk. The calculation assumptions and methods to determine the amount of core deposits and maturity term categorization are regularly reviewed.
Meanwhile, deposits and loans with contract-based maturities are sometimes cancelled or repaid before their maturity dates. To measure interest rate risk for these deposits and loans, we reflect these early termination events mainly by applying early termination rates calculated based on a statistical analysis of historical repayment and cancellation data together with historical market interest rate data.
Summaries of Market Risks (Fiscal Year Ended March 31, 2014)
Trading activities
The aggregate VaR for our total trading activities as of March 31, 2014 was ¥18.09 billion, comprising interest rate risk exposure of ¥14.98 billion, foreign exchange risk exposure of ¥3.46 billion, and equity-related risk exposure of ¥2.90 billion. Compared with the VaR as of March 31, 2013, we experienced an increase in market risk during the fiscal year ended March 31, 2014, primarily due to an increase in yen interest rate risk.
195
Table of Contents
Our average daily VaR for the fiscal year ended March 31, 2014 was ¥20.79 billion. Based on a simple sum of figures across market risk categories, interest rate risk accounted for approximately 63%, foreign exchange risk for approximately 25% and equity-related risk for approximately 7%, of our total trading activity market risks.
Due to the nature of trading operations which involves frequent changes in trading positions, market risk varied substantially during the fiscal year, depending on our trading positions.
The following tables set forth the VaR related to our trading activities by risk category for the periods indicated:
|
April 1, 2012—March 31, 2013 |
Average | Maximum (1) | Minimum (1) | March 31, 2013 | ||||||||||||
| (in billions) | ||||||||||||||||
|
MUFG |
¥ | 9.86 | ¥ | 15.32 | ¥ | 6.55 | ¥ | 12.94 | ||||||||
|
Interest rate |
8.44 | 12.38 | 6.42 | 12.38 | ||||||||||||
|
Yen |
4.37 | 8.35 | 2.55 | 8.35 | ||||||||||||
|
U.S. Dollars |
3.34 | 6.98 | 1.89 | 2.69 | ||||||||||||
|
Foreign exchange |
3.40 | 7.72 | 0.34 | 3.19 | ||||||||||||
|
Equities |
0.79 | 3.50 | 0.12 | 1.17 | ||||||||||||
|
Commodities |
0.48 | 1.06 | 0.15 | 0.51 | ||||||||||||
|
Less diversification effect |
(3.25 | ) | — | — | (4.31 | ) | ||||||||||
|
April 1, 2013—March 31, 2014 |
Average | Maximum (1) | Minimum (1) | March 31, 2014 | ||||||||||||
| (in billions) | ||||||||||||||||
|
MUFG |
¥ | 20.79 | ¥ | 29.50 | ¥ | 15.34 | ¥ | 18.09 | ||||||||
|
Interest rate |
17.33 | 21.93 | 14.02 | 14.98 | ||||||||||||
|
Yen |
8.59 | 14.07 | 5.36 | 6.16 | ||||||||||||
|
U.S. Dollars |
6.66 | 11.12 | 3.95 | 5.05 | ||||||||||||
|
Foreign exchange |
6.93 | 15.30 | 3.46 | 3.46 | ||||||||||||
|
Equities |
2.07 | 7.35 | 0.79 | 2.90 | ||||||||||||
|
Commodities |
0.74 | 1.39 | 0.31 | 1.25 | ||||||||||||
|
Less diversification effect |
(6.28 | ) | — | — | (4.50 | ) | ||||||||||
|
Assumptions for VaR calculations: |
|
Historical simulation method |
|
Holding period: 10 business days |
|
Confidence interval: 99% |
|
Observation period: 701 business days |
| Note: |
| (1) | The maximum and minimum VaR overall and for various risk categories were taken from different days. A simple summation of VaR by risk category is not equal to total VaR due to the effect of diversification. |
The average daily VaR by quarter in the fiscal year ended March 31, 2014 was as follows:
|
Quarter |
Daily average VaR | |||
| (in billions) | ||||
|
April—June 2013 |
¥ | 22.80 | ||
|
July—September 2013 |
21.72 | |||
|
October—December 2013 |
19.22 | |||
|
January—March 2014 |
19.39 | |||
The quantitative market risk figures from trading activities tend to fluctuate widely due to the market sensitive nature of the trading business. During the fiscal year ended March 31, 2014, the revenue from our
196
Table of Contents
trading activities has been relatively stable, keeping positive numbers in 234 days out of 260 trading days in the period. During the same period, there were 106 days with positive revenue exceeding ¥1 billion and 9 days with negative revenue exceeding minus ¥1 billion.
Non-trading Activities
The aggregate VaR for our total non-trading activities as of March 31, 2014, excluding market risks related to our strategic equity portfolio and measured using the same standards as trading activities, was ¥332.1 billion. Market risks related to interest rates equaled ¥304.2 billion and equities-related risks equaled ¥172.9 billion.
Compared with the VaR for MUFG as of March 31, 2013, the decrease in the overall market risk was ¥80.9 billion. Market risks related to interest rates decreased ¥118.1 billion. Equity related risks increased ¥64.4 billion.
Based on a simple sum of figures across market risk categories, interest rate risks accounted for approximately 71% of our total non-trading activity market risks. Looking at a breakdown of interest rate related risk by currency, as of March 31, 2014, the yen accounted for approximately 49% while the U.S. dollar accounted for approximately 36%, and the Euro approximately 15%.
The following table shows the VaR related to our non-trading activities by risk category for the fiscal year ended March 31, 2014:
|
April 1, 2013—March 31, 2014 |
Average | Maximum (1) | Minimum (1) | March 31, 2014 | ||||||||||||
| (in billions) | ||||||||||||||||
|
Interest rate |
¥ | 400.8 | ¥ | 459.8 | ¥ | 304.2 | ¥ | 304.2 | ||||||||
|
Yen |
223.8 | 276.5 | 183.3 | 190.4 | ||||||||||||
|
U.S. Dollars |
183.8 | 230.2 | 135.8 | 140.8 | ||||||||||||
|
Foreign exchange |
1.3 | 3.0 | 0.8 | 0.9 | ||||||||||||
|
Equities |
161.3 | 202.4 | 100.6 | 172.9 | ||||||||||||
|
Total (1) |
410.7 | 462.1 | 332.1 | 332.1 | ||||||||||||
|
Assumptions for VaR calculations: |
|
Historical simulation method |
|
Holding period: 10 business days |
|
Confidence interval: 99% |
|
Observation period: 701 business days |
| Note: |
| (1) | The maximum and minimum VaR overall for each category and in total were taken from different days. The equities-related risk figures do not include market risk exposure from our strategic equity portfolio. A simple summation of VaR by risk category is not equal to total VaR due to the effect of diversification. |
The average daily interest rate VaR by quarter in the fiscal year ended March 31, 2014 was as follows.
|
Quarter |
Daily average VaR | |||
| (in billions) | ||||
|
April—June 2013 |
¥ | 419.88 | ||
|
July—September 2013 |
384.29 | |||
|
October—December 2013 |
425.98 | |||
|
January—March 2014 |
372.11 | |||
Comparing the proportion of each currency’s interest rate VaR to the total interest rate VaR as of March 31, 2014 against that as of March 31, 2013, there were a five percentage point increase in Japanese yen from 44% to 49%, a one percentage point decrease in Euro from 16% to 15%, and a four percentage point decrease in U.S. dollar from 40% to 36%.
197
Table of Contents
Backtesting
We conduct backtesting in which a VaR is compared with hypothetical profits and losses on a daily basis to verify the accuracy of our VaR measurement model. We also conduct additional backtesting using other methods, including testing VaR against actual realized and unrealized losses and testing VaR by various changing parameters such as confidence intervals and observation periods used in the model.
Hypothetical losses never exceeded VaR in the fiscal year ended March 31, 2014. This means that our VaR model provided reasonably accurate measurements of market risk during the fiscal year.
The following graph shows daily VaR of trading activities and the distribution of corresponding hypothetical profits and losses for the fiscal year ended March 31, 2014:
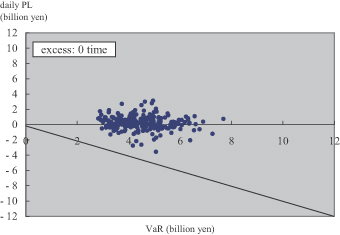
The following graph shows VaR of trading activities and hypothetical profits and losses on a daily basis for the fiscal year ended March 31, 2014:
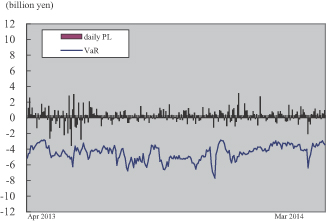
Stress Testing
We have adopted an HS-VaR model, which calculates potential changes in the market value of our portfolio as a statistically possible amount of losses that could be incurred due to market fluctuations within a certain
198
Table of Contents
period (or holding period, of 10 business days) based on historical market volatility for a certain period (or observation period, of 701 business days, or approximately three years). Actual losses may exceed the value at risk obtained by the application of the model in the event, for example, that the market fluctuates to a degree not accounted for in the observation period, or that the correlations among various risk factors, including interest rates and foreign currency exchange rates, deviate from those assumed in the model.
In order to complement these weaknesses of the HS-VaR model and measure potential losses that the model is not designed to capture, we conduct stress testing. For example, we measure on a quarterly basis potential losses that could be incurred in our portfolio by applying various stress scenarios, including the 10-year most extreme movement in each of the risk factors as well as actual past market movement observed beyond the 10 year historical observation period. In addition, the holding company and major subsidiaries conduct stress testing, as appropriate, by applying various stress scenarios, including those which take into account estimates regarding future market volatility, in order to better identify risks and manage our portfolio in a more stable and appropriate manner. Since October 2011, the holding company and major subsidiaries have also been measuring stressed VaR relating to their trading activities based on a one-year observation period with the highest VaR at least in the immediately preceding ten years.
Liquidity Risk Management
Liquidity risk is the risk of incurring losses if a poor financial position hampers the ability to meet funding requirements, or necessitates fund procurement at interest rates markedly higher than normal.
Our major subsidiaries maintain appropriate liquidity in both Japanese yen and foreign currencies by managing their funding sources and mechanism, such as liquidity gap, liquidity-supplying products such as commitment lines, and buffer assets.
We have established a group-wide system for managing liquidity risk by categorizing the risk in the following three stages: Normal, With-Concern, and Critical. The front offices and risk management offices of the major subsidiaries and the holding company exchange information and data on liquidity risk even at the Normal stage. At higher alert stages, we centralize information about liquidity risk and discuss issues relating to group-wide liquidity control actions among group companies, if necessary. We have also established a system for liaison and consultation on funding in preparation for contingency, such as natural disasters, wars and terrorist attacks. The holding company and the major subsidiaries conduct group-wide contingency preparedness drills on a regular basis to ensure smooth implementation in the event of an emergency.
For more information, see “Item 5.B. Operating and Financial Review and Prospects—Liquidity and Capital Resources—Financial Condition—Sources of Funding and Liquidity.”
Operational Risk Management
Operational risk refers to the risk of loss caused by either internal control issues, such as inadequate operational processes or misconduct, system failures, or external factors such as serious political instability, major terrorist activity, health epidemics and natural disasters. The term includes a broad range of risks that could lead to losses, including operations risk, information asset risk, legal risk, reputation risk, personnel risk and tangible asset risk. These risks that comprise operational risk are referred to as sub-category risks.
MUFG’s board of directors has approved the MUFG Operational Risk Management Policy as a group-wide policy for managing operational risk. This policy sets forth the core principles regarding operational risk management, including the definition of operational risk, and the risk management system and processes. The policy also requires the board of directors and the Executive Committee to formulate fundamental principles of operational risk management and establish and maintain an appropriate risk management system. The Chief Risk
199
Table of Contents
Management Officer is responsible for recognizing, evaluating, and appropriately managing operational risk in accordance with the fundamental principles formulated by the board of directors and the Executive Committee. A division in charge of operational risk management must be established that is independent of business promotion sections to manage overall operational risk in a comprehensive manner. These fundamental principles have also been approved by the boards of directors of the major subsidiaries, providing a consistent framework for operational risk management of the Group. The diagram below sets forth the operational risk management system of each major banking subsidiary:
Operational Risk Management System of Our Major Banking Subsidiaries
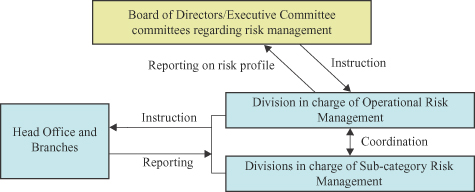
As set forth in the following diagram, we have established a risk management framework for loss data collection, control self assessment, or CSA, and measurement of operational risk in order to appropriately identify, recognize, evaluate, measure, control, monitor and report operational risk.
We have also established group-wide reporting guidelines with respect to loss data collection and its monitoring. We focus our efforts on ensuring accurate assessment of the status of operational risk losses and the implementation of appropriate countermeasures, while maintaining databases of internal and external loss events.
200
Table of Contents
The following diagram summarizes our operational risk management framework:
Operational Risk Management Framework
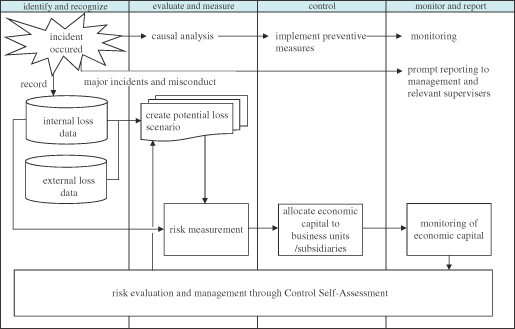
Operations Risk Management
Operations risk refers to the risk of loss that is attributable to the actions of executives or employees, whether accidental or the result of neglect or deliberate misconduct. The Group companies offer a wide range of financial services, ranging from commercial banking products such as deposits, exchange services and loans to trust and related services covering pensions, securities, real estate and securitization, as well as transfer agent services. Cognizant of the potentially significant impact that operations risk-related events could have in terms of both economic losses and damage to our reputation, our banking subsidiaries continue to improve their management systems to create and apply appropriate operations risk-related controls.
Specific ongoing measures to reduce operations risk include the development of databases to manage, analyze and prevent the recurrence of related loss events; efforts to tighten controls over administrative procedures and related operating authority, while striving to improve human resources management; investments in systems to improve the efficiency of administrative operations; and programs to expand and upgrade internal auditing and operational guidance systems.
Senior management receives regular reports on the status of our businesses from an operations risk management perspective. We work to promote the sharing within the Group of information and expertise concerning any operational incidents and the measures implemented to prevent any recurrence.
Efforts to upgrade the management of operations risk continue with the aim of providing our customers with a variety of high-quality services.
201
Table of Contents
Information Asset Risk Management
Information asset risk refers to the risk of loss caused by loss, alteration, falsification or leakage of information, or by destruction, disruption, errors or misuse of information systems, as well as risks similar to this risk. In order to ensure proper handling of information and prevent loss or leakage of information, our major banking subsidiaries strive to better manage and reduce such risks through the appointment of managers with specific responsibilities for information security issues, the establishment of internal procedures, training courses designed for all staff, and the implementation of measures to ensure stable IT systems control. We have also formulated the Personal Information Protection Policy as the basis for ongoing programs to protect the confidentiality of personal information.
Systems planning, development and operations include appropriate design and extensive testing phases to ensure that systems are designed to help prevent failures while providing sufficient safeguards for the security of personal information. The status of the development of any mission-critical IT systems is reported regularly to senior management. We have developed disaster countermeasures systems and have also been investing in duplication of the Group’s IT infrastructure to minimize damage in the event of any system failure. Emergency drills are conducted to help increase staff preparedness.
With the aim of preventing any recurrence, we also work to promote sharing of information within the Group related to the causes of any loss or leakage of information, or system failure.
Legal Risk Management
Legal risk refers to the risk of loss due to failure to comply with applicable laws and regulations, adequately evaluate contractual rights and obligations, or appropriately deal with disputes, as well as other similar risks. We recognize the potentially significant impact legal risk-related events can have on the management and execution of the Group’s businesses, which in turn can result in economic, reputation and other losses to, or diminished market confidence in, the Group. Accordingly, we continue to improve our risk control framework designed to appropriately manage such risk.
Specifically, in order to promote compliance, we have established our Principles of Ethics and Conduct as the basic legal compliance policy for the Group’s directors and employees. In addition, a compliance management division has been established at each of the holding company and the major subsidiaries. See “—Compliance” below. Moreover, the legal division at each of the holding company and the major subsidiaries centrally and uniformly evaluates legal issues prior to entering into contracts, deals with disputes and manages other legal matters. Through these and other measures, we endeavor to effectively manage our legal risk.
Reputation Risk Management
Reputation risk refers to the risk of loss due to deterioration in reputation as a consequence of the spread of rumors among customers or in the market, or as a consequence of our inadequate response to particular situations, as well as risks similar to this risk.
We recognize the potentially significant impact reputation risk-related events can have on the management and execution of the Group’s businesses, which in turn can result in economic losses to, or diminished market confidence in, the Group. Accordingly, we continue to improve our risk control framework designed to appropriately manage such risk.
Specifically, in order to manage our reputation risk effectively on a group-wide basis, we have established a risk management system designed to ensure mutual consultation and reporting if a reputation risk-related event occurs or is anticipated and, through this system, share relevant information within the Group.
Through the risk control framework and risk management system, we seek to minimize damage to the reputation and credibility of, and the market confidence in, the Group by promptly obtaining an accurate
202
Table of Contents
understanding of relevant facts relating to reputation risk-related events and disclosing information concerning the events and the measures we take in response to such events in an appropriate and timely manner.
Risk Management for Other Risks
In addition to the risks discussed above, the MUFG Group companies define and manage sub-category risks as appropriate, including tangible asset risk and personnel risk as set forth in the “Operational Risk Management System of Our Major Banking Subsidiaries” diagram above.
Regulatory Capital Requirements for Operational Risk
(1) Adoption of the Advanced Measurement Approach (AMA)
We have employed the AMA since March 31, 2012, in place of the Standardized Approach that we had been using previously, for calculation of the operational risk equivalent amount in connection with measuring capital adequacy ratios based on the Basel Standards. On the other hand, we use the Basic Indicator Approach, or BIA, for entities that are deemed to be less important in the calculation of the operational risk equivalent amount and for entities that are still preparing to implement the AMA.
(2) Outline of AMA
We have established a measurement model designed to account for four data elements—internal loss data, external loss data, scenario analysis, and business environment and internal control factors, or BEICFs—and calculate the operational risk equivalent amount by estimating the maximum loss using a 99.9th percentile one-tailed confidence interval and a one-year holding period.
In calculating the operational risk equivalent amount, we exclude expected losses relating to the amount of allowance for repayment of excess interest associated with the consumer finance business of a subsidiary. We do not exclude any other expected losses and do not reflect the risk mitigating impact of insurance. In addition, we take into account credit risk-related events that are not reflected in the measurement of the credit risk equivalent amount.
(3) Outline of Measurement Model
Our operational risk equivalent amount measured under the AMA is a simple sum of the amounts calculated separately for BTMU on a consolidated basis, MUTB on a consolidated basis, and the total amount for other Group companies (including the holding company, MUSHD and Mitsubishi UFJ NICOS). For each of BTMU and MUTB on consolidated basis, the operational risk equivalent amount is a simple sum of the amounts calculated based on the seven loss event types defined by the Basel Standards. For other Group companies, the operational risk equivalent amount is a simple sum of the amounts calculated based on eight loss event types consisting of the seven loss event types defined by the Basel Standards and an additional loss event type representing losses relating to repayment of excess interest associated with the consumer finance business of a subsidiary. We do not reflect the correlation effects among the loss event types in the calculation of our operational risk equivalent amount.
203
Table of Contents
Outline of Measurement Model
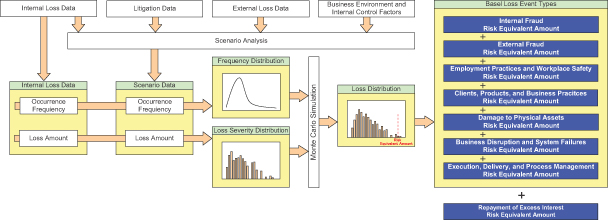
The risk equivalent amount for each loss event type represents the amount of maximum loss estimated with a 99.9th percentile one-tailed confidence interval and a one-year holding period based on the distribution of losses arising from all relevant risk events for a one-year period (Loss Distribution). A Loss Distribution combines a Frequency Distribution (through which the frequency of occurrence of risk events is expressed) and a Loss Severity Distribution (through which the amounts of losses resulting from risk events are expressed) through Monte Carlo simulations. The data used for this purpose include internal loss data and scenario data. Scenario data are generated through a scenario analysis. External data and BEICFs are taken into account in the scenario analysis and reflected in scenario data. The Frequency Distribution is derived from the occurrence frequency information in internal loss data and scenario data expressed through a Poisson Distribution. The Loss Severity Distribution is derived from the amount information in internal loss data and scenario data expressed in a non-parametric manner (where no underlying distribution is assumed).
With respect to the risk of losses relating to repayment of excess interest associated with the consumer finance business of a subsidiary, the risk equivalent amount represents the amount of maximum loss estimated with a 99.9th percentile one–tailed confidence interval and a one-year holding period based on a normal distribution assumed by applying data on losses that arose in a given period, excluding any related expected losses.
We confirm the appropriateness of the measurement models by periodic verification and back testing.
(4) Outline of Scenario Analysis
As an initial step of our scenario analysis, we identify potential severe loss events that we have not experienced but may potentially experience in the future. In this identification process, we seek to ensure exhaustive coverage of potential severe loss events by comprehensively examining our experience relating to loss events and legal proceedings, external loss data, the control self-assessment results and other relevant information.
In the next step, we prepare scenario data for each identified severe loss event by quantifying the values depending on its occurrence frequency and loss severity, taking into account relevant transaction amounts and restructuring costs as well as BEICFs. In preparing scenario data, we apply an analysis method we deem appropriate for the type and nature of the operational risk involved.
In order to obtain an operational risk equivalent amount that is commensurate with, and appropriate for, our risk profile, we assess the need for an additional scenario or modification to our existing scenarios semi-annually.
204
Table of Contents
We then reflect, as necessary, new risks arising as a result of changes in the business environment and the results of the implementation of measures to enhance our internal controls in response to newly identified risks in our scenario data.
Compliance
Basic Policy
We have clarified our mission, our vision and our values in the Corporate Vision and have expressed our commitment to meeting the expectations of customers and society as a whole. Furthermore, we have established Principles of Ethics and Conduct as the guidelines for how the Group’s directors and employees act to realize the Corporate Vision, in which we have expressed our commitment to complying with laws and regulations, to acting with honesty and integrity, and to behaving in a manner that supports and strengthens the trust and confidence of society.
In addition, as we expand the geographic scope of our business globally, we are committed to keeping abreast with developments in laws and regulations of the jurisdictions in which we operate including anti-money laundering and anti-bribery, as well as paying attention to trends in financial crimes.
See “Item 3.D. Key Information—Risk Factors—Risks Related to Our Business—Legal and regulatory changes could have a negative impact on our business, financial condition and results of operations.” and “Item 3.D. Key Information—Risk Factors—Risks Related to Our Business—We may become subject to regulatory actions or other legal proceedings relating to our transactions or other aspects of our operations, which could result in significant financial losses, restrictions on our operations and damage to our reputation.” See also “Item 4.B. Information on the Company—Business Overview—Supervision and Regulation.”
Principles of Ethics and Conduct
Introduction
These Principles of Ethics and Conduct establish clear and consistent standards for all MUFG employees to guide decisions and actions. They reflect and support the MUFG Corporate Vision. The principles are organized in three sections. Chapter 1 presents the attitude that we adopt with our customers, to act with honesty and integrity and pursue their best interests, which is a core component of our business practices. Chapter 2 presents a set of standards to help us fulfill our responsibilities as a good corporate citizen. MUFG’s reputation depends upon the trust and confidence of our customers and other stakeholders, including local communities, and we are responsible to society on a global level. Chapter 3 describes the actions and mindset that will create a stimulating and supportive working environment as MUFG continues to grow. Our success depends on building and maintaining a dynamic workplace where all employees can reach their full potential in ways that support our customers and contribute to society as a whole.
Outline / Overview
Chapter 1 Customer Focus
We place our diverse customers at the center of all our activities and always act in their best interests. MUFG is able to thrive today because of the trust and confidence that customers have placed in us—the result of years of fair, transparent, and honorable dealings. Our business culture is not driven by the prospect of short-term, immediate gains. Instead, we place a premium on supporting long-term, sustainable relationships with our customers to help them meet their goals.
205
Table of Contents
1-1. Acting with Honesty and Integrity
We always place our diverse customers at the center of all activities and act with honesty and integrity in all of our dealings with them. We protect customer assets, including their personal information, and strive at all times not to damage their interests.
1-2. Controlling Quality
In order to earn the lasting trust and confidence of our customers, we maintain thorough quality control of our products and services in all aspects from product design and development to delivery, and continually improve our processes to provide accurate and secure transactions.
1-3. Exceeding Customer Expectations
We strive to satisfy the diverse needs of our customers worldwide and to exceed their expectations through the highest standards of professionalism and by effectively leveraging our global network and consolidated strength.
Chapter 2 Responsibility as a Corporate Citizen
As a member of MUFG with global operations, we act honorably, with honesty and integrity, and comply at all times with laws, regulations, rules, and internal policies globally. We strive to maintain stability and confidence in the global financial system and to contribute to the sound growth and development of society. We behave in a manner that supports and strengthens the trust and confidence that MUFG has built up over the years.
2-1. Adherence to Laws and Regulations
We always judge and act with honesty and integrity, do what is right, and comply with both the letter and the spirit of the laws, regulations, and rules that apply to us. We avoid insider trading, do not engage in anti-competitive conduct or any form of corrupt activity, and publicly disclose corporate information in an appropriate manner.
2-2. Combating Criminal Activity
We do not conduct business with criminal elements. We do not allow our financial products and services to be used for illegal or improper activities such as money laundering, fraud, or financing terrorist activities.
2-3. Commitment to Social Sustainability
We respect the history, culture, and customs of local communities and strive to contribute to their development and the protection of the environment through our corporate activities and employee volunteer efforts.
Chapter 3 Ethical and Dynamic Workplace
We are committed to creating a working environment that fosters mutual respect among MUFG employees, supports the full expression of our individuality as professionals, promotes the power of teamwork, honors diversity, transcends differences, and embraces new challenges.
3-1. Stimulating Workplace
We strive to enhance our knowledge and expertise, focus on maximizing the value of teamwork, and view changes in the business environment as opportunities to launch new initiatives.
206
Table of Contents
3-2. Ethical Workplace
We respect the diversity and human rights of all MUFG employees. We do not engage in or tolerate discrimination, harassment, intimidation, or any other behavior or activity that is inconsistent with these core beliefs. We report any violations of laws and rules, and we manage corporate assets appropriately.
Compliance Framework
Management and coordination of compliance-related matters are the responsibility of separate compliance management divisions established at the holding company and the major subsidiaries. Each compliance management division formulates compliance programs and organizes training courses to promote compliance, and regularly reports to each company’s board of directors and Executive Committee on the status of compliance activities.
The holding company and each major subsidiary have also established voluntary committees, such as an Internal Audit and Compliance Committee, where members with no prior employment relationship with the Group account for a majority, and a Group Compliance Committee. Through these measures, we have established a structure for deliberating key issues related to compliance. Additionally, the holding company has the Group Chief Compliance Officer, or CCO, Committee which deliberates important matters related to compliance and compliance-related issues for which the Group should share a common understanding.
CCO of Holding Company
Directors responsible for compliance at the holding company and the major subsidiaries have been named the CCOs of their respective companies. The CCOs of the major subsidiaries have also been appointed as the deputy CCOs of the holding company to assist the CCO of the holding company. This system promotes the prompt reporting of group-wide compliance-related information to the holding company and also allows the CCO of the holding company to effectively provide compliance-related guidance, advice, and instructions to MUFG Group companies.
Group CCO Committee
The Group CCO Committee consists of the CCO of the holding company as the committee chairman and the CCOs of the major subsidiaries.
By timely holding meetings, the Group CCO Committee seeks to promote greater sharing of compliance-related information among the MUFG Group companies and works to strengthen the Group’s incident prevention controls and to help the Group companies respond to unforeseen problems. The Committee also continues to strive to improve compliance systems throughout the Group.
207
Table of Contents
The following diagram summarizes our compliance framework:
Compliance Framework
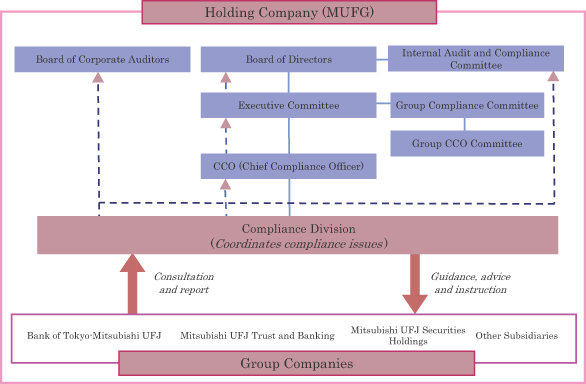
Internal Reporting System and Accounting Auditing Hotline
The major subsidiaries have established internal reporting systems that aim to identify compliance issues early so that any problems can be quickly rectified. This system includes an independent external compliance hotline. Furthermore, the holding company has set up an MUFG Group Compliance Helpline that acts in parallel with group-company internal reporting systems and provides a reporting channel for directors and employees of group companies.
In addition to these internal reporting systems, the holding company has also established an accounting auditing hotline that provides a means to report any problems related to MUFG accounting.
MUFG Accounting Auditing Hotline
MUFG has set up an accounting auditing hotline to be used to make reports related to instances of improper practices (violations of laws and regulations) and inappropriate practices, or of practices raising questions about such impropriety or inappropriateness, regarding accounting and internal control or audits related to accounting in Group companies. The reporting process works as follows, and may be carried out via letter or e-mail:
Hokusei Law Office, P.C.
Address: Kojimachi 4-3-4, Chiyoda-ku, Tokyo
e-mail: MUFG-accounting-audit-hotline@hokusei-law.com
208
Table of Contents
When reporting information please pay attention to the following:
| Ÿ |
Matters subject to reporting are limited to instances regarding MUFG Group companies. |
| Ÿ |
Please provide detailed information with respect to the matter. Without detailed factual information there is a limit to how much our investigations can achieve. |
| Ÿ |
Anonymous information will be accepted. |
| Ÿ |
No information regarding the identity of the informant will be passed on to third parties without the approval of the informant him- or herself. However, this excludes instances where disclosure is legally mandated, or to the extent that the information is necessary for surveys or reports, when data may be passed on following the removal of the informant’s name. |
| Ÿ |
Please submit reports in either Japanese or English. |
| Ÿ |
If the informant wishes, we will endeavor to report back to the informant on the response taken within a reasonable period of time following the receipt of specific information, but cannot promise to do so in all instances. |
Internal Audit
Role of Internal Audit
Internal audit functions within MUFG seek to provide independent verification of the adequacy and effectiveness of internal control systems. This includes monitoring the status of risk management and compliance systems, which are critical to the maintenance of sound and appropriate business operations. Internal audit results are reported to senior management. An additional role of internal audit is to make suggestions to help improve or rectify any issues or specific problems that are identified.
Group Internal Audit Framework
The board of directors at the holding company level has instituted MUFG’s internal audit policy to define the policy, function and organizational position of internal audits. Separate internal audit divisions have been created within the holding company and certain subsidiaries. Through close cooperation and collaboration among the internal audit divisions in each of these subsidiaries, these internal audit divisions provide coverage for the Group and also support the board of directors in monitoring and overseeing all MUFG operations.
In addition to having primary responsibility for initiating and preparing plans and proposals related to internal audits of the Group, the Internal Audit Division at the holding company monitors and, as necessary, guides, advises and administers the internal audit divisions of subsidiaries and affiliated companies. The internal audit divisions within the major subsidiaries conduct audits of the respective head office and branch operations of these companies. In addition, each of these internal audit divisions undertakes direct audits of their respective subsidiaries, and monitors and oversees the separate internal audit functions established within them. This helps to evaluate and verify the adequacy and effectiveness of internal controls within MUFG on a consolidated basis.
Implementing Effective and Efficient Internal Audits
To ensure that internal audit processes use available resources with optimal effectiveness and efficiency, the internal audit divisions implement risk-focused internal audits in which the nature and magnitude of the associated risks are considered in determining audit priorities and the frequency and depth of internal audit activities. The internal audit divisions ensure that audit personnel attend key meetings, collect important internal control documents and access databases to facilitate efficient off-site monitoring.
209
Table of Contents
Reports to and from Internal Audit and Compliance Committees
To strengthen the respective boards of directors’ monitoring and supervision of operational execution status and to ensure the independence of the internal audit divisions, the holding company and the major subsidiaries have voluntarily established internal audit and compliance committees. These committees receive reports from the internal audit divisions on important matters, including the results of the internal audits and basic policies for planning internal audits. The deliberations of the internal audit and compliance committees concerning such matters are then reported to the respective boards of directors.
| Item 12. | Description of Securities Other than Equity Securities. |
| A. | Debt Securities |
Not applicable.
| B. | Warrants and Rights |
Not applicable.
| C. | Other Securities |
Not applicable.
210
Table of Contents
| D. | American Depositary Shares |
Fees, charges and other payments relating to ADSs
As a holder of our ADSs, you will be required to pay to The Bank of New York Mellon, as depositary for the ADRs, or the “Depositary,” either directly or indirectly, the following fees or charges. The Depositary collects its fees for delivery and surrender of ADRs directly from investors depositing shares or surrendering ADRs for the purpose of withdrawal or from intermediaries acting for them. The Depositary collects fees for making distributions to investors by deducting those fees from the amounts distributed or by selling a portion of distributable property to pay the fees.
|
ADS holders must pay: |
For: |
|
|
$5.00 (or less) per 100 ADSs (or portion thereof) |
Each issuance of an ADR, including as a result of a distribution of shares or rights or other property
Each cancellation of an ADR, including if the agreement terminates |
|
|
$0.02 (or less) per ADS |
Any cash distribution, to the extent permitted by any securities exchange on which the ADSs may be listed for trading | |
| A fee equivalent to the fee that would be payable if securities distributed to the ADS holder had been shares and the shares had been deposited for issuance of ADRs | Distribution of securities distributed to holders of deposited securities which are distributed by the Depositary to ADS registered holders | |
|
Registration or transfer fees |
Transfer and registration of shares on the share register from your name to the name of The Bank of New York Mellon or its agent and vice versa when you deposit or withdraw shares | |
|
Expenses of The Bank of New York Mellon |
Conversion of foreign currency to U.S. dollars, as well as cable, telex and facsimile transmission expenses | |
| Taxes and other governmental charges The Bank of New York Mellon or BTMU, as custodian, have to pay on any ADS or share underlying an ADS, for example, stock transfer taxes, stamp duty or withholding taxes | As necessary | |
Fees Waived or Paid by the Depositary
The Depositary has agreed to waive the standard out-of-pocket administrative, maintenance and other expenses for providing services to the registered holders of our ADSs, which consisted of the expenses of postage and envelopes for mailing annual reports, printing and distributing dividend checks, stationery, postage, facsimile, and telephone calls. For the fiscal year ended March 31, 2014, the Depositary waived $132,655.85 of standard out-of-pocket expenses.
The Depositary has also agreed to reimburse us for expenses related to the administration and maintenance of the ADS program, including investor relations expenses, the annual New York Stock Exchange listing fees and other program-related expenses. There is a limit on the amount of expenses for which the Depositary will reimburse us based on the number of outstanding ADSs. For the fiscal year ended March 31, 2014, the Depositary reimbursed us $1.0 million for such expenses.
211
Table of Contents
| Item 13. | Defaults, Dividend Arrearages and Delinquencies. |
None.
| Item 14. | Material Modifications to the Rights of Security Holders and Use of Proceeds. |
None.
| Item 15. | Controls and Procedures. |
Disclosure Controls and Procedures
An evaluation was carried out under the supervision and with the participation of our management, including the Chief Executive Officer, or CEO, and the Chief Financial Officer, or CFO, of the effectiveness of our disclosure controls and procedures, as defined in Rule 13a-15(e) under the U.S. Securities Exchange Act of 1934, as of the end of the period covered by this Annual Report.
Based on that evaluation, our CEO and CFO concluded that our disclosure controls and procedures were effective as of March 31, 2014.
Management’s Annual Report on Internal Control Over Financial Reporting
Our management is responsible for establishing and maintaining adequate internal control over financial reporting, as defined in Rule 13a-15(f) under the U.S. Securities Exchange Act of 1934. Our internal control over financial reporting is a process designed by, or under the supervision of, MUFG’s principal executive and principal financial officers, and effected by MUFG’s board of directors, management, and other personnel, to provide reasonable assurance regarding the reliability of financial reporting and the preparation of financial statements for external purposes in accordance with U.S. GAAP and includes those policies and procedures that:
| (i) | pertain to the maintenance of records that, in reasonable detail, accurately and fairly reflect the transactions and dispositions of the assets of MUFG, |
| (ii) | provide reasonable assurance that transactions are recorded as necessary to permit preparation of financial statements in accordance with generally accepted accounting principles, and that receipts and expenditures of MUFG are being made only in accordance with authorizations of management and directors of MUFG, and |
| (iii) | provide reasonable assurance regarding prevention or timely detection of unauthorized acquisition, use or disposition of MUFG’s assets that could have a material effect on the financial statements. |
Because of inherent limitations, internal control over financial reporting, no matter how well designed, may not prevent or detect misstatements. Also, projections of any evaluation of effectiveness to future periods are subject to the risk that controls may become inadequate because of changes in conditions, or that the degree of compliance with the policies or procedures may deteriorate.
Our management excluded from its assessment of the effectiveness of our internal control over financial reporting as of March 31, 2014, an assessment of internal control over financial reporting of Bank of Ayudhya Public Company Limited, or Krungsri, and its subsidiaries. Krungsri and its subsidiaries became our subsidiary on December 18, 2013, when the acquisition of a majority stake in Krungsri was completed by BTMU. The total assets represented 1.6 % of MUFG’s consolidated total assets as of March 31, 2014. The results of operations of Krungsri and its subsidiaries since the acquisition date were not material to MUFG for the fiscal year ended March 31, 2014.
212
Table of Contents
Our management evaluated the effectiveness of our internal control over financial reporting as of March 31, 2014 based on the criteria established in “Internal Control—Integrated Framework (1992)” issued by the Committee of Sponsoring Organizations of the Treadway Commission. Based on the evaluation, management has concluded that MUFG maintained effective internal control over financial reporting as of March 31, 2014.
The effectiveness of our internal control over financial reporting as of March 31, 2014 has been audited by Deloitte Touche Tohmatsu LLC, an independent registered public accounting firm, as stated in its report, presented on page 214.
Changes in Internal Control Over Financial Reporting
During the period covered by this Annual Report, there has been no change in our internal control over financial reporting that has materially affected or is reasonably likely to materially affect our internal control over financial reporting.
213
Table of Contents
REPORT OF INDEPENDENT REGISTERED PUBLIC ACCOUNTING FIRM
To the Board of Directors and Shareholders of
Mitsubishi UFJ Financial Group, Inc.
(Kabushiki Kaisha Mitsubishi UFJ Financial Group):
We have audited the internal control over financial reporting of Mitsubishi UFJ Financial Group, Inc. (Kabushiki Kaisha Mitsubishi UFJ Financial Group) (“MUFG”) and subsidiaries (together, the “MUFG Group”) as of March 31, 2014 based on the criteria established in Internal Control—Integrated Framework (1992) issued by the Committee of Sponsoring Organizations of the Treadway Commission. As described in Management’s Annual Report on Internal Control Over Financial Reporting, management excluded from its assessment the internal control over financial reporting at Bank of Ayudhya Public Company Limited. (“Krungsri”) and its subsidiaries, which were acquired on December 18, 2013 and whose financial statements constitute 1.6% of total assets of the consolidated financial amounts as of March 31, 2014. The results of operations of Krungsri and its subsidiaries since the acquisition date were not material to the MUFG Group for the year ended March 31, 2014. Accordingly, our audit did not include the internal control over financial reporting at Krungsri and its subsidiaries. The MUFG Group’s management is responsible for maintaining effective internal control over financial reporting and for its assessment of the effectiveness of internal control over financial reporting, included in the accompanying Management’s Annual Report on Internal Control Over Financial Reporting. Our responsibility is to express an opinion on the MUFG Group’s internal control over financial reporting based on our audit.
We conducted our audit in accordance with the standards of the Public Company Accounting Oversight Board (United States). Those standards require that we plan and perform the audit to obtain reasonable assurance about whether effective internal control over financial reporting was maintained in all material respects. Our audit included obtaining an understanding of internal control over financial reporting, assessing the risk that a material weakness exists, testing and evaluating the design and operating effectiveness of internal control based on the assessed risk, and performing such other procedures as we considered necessary in the circumstances. We believe that our audit provides a reasonable basis for our opinion.
A company’s internal control over financial reporting is a process designed by, or under the supervision of, the company’s principal executive and principal financial officers, or persons performing similar functions, and effected by the company’s board of directors, management, and other personnel to provide reasonable assurance regarding the reliability of financial reporting and the preparation of financial statements for external purposes in accordance with generally accepted accounting principles. A company’s internal control over financial reporting includes those policies and procedures that (1) pertain to the maintenance of records that, in reasonable detail, accurately and fairly reflect the transactions and dispositions of the assets of the company; (2) provide reasonable assurance that transactions are recorded as necessary to permit preparation of financial statements in accordance with generally accepted accounting principles, and that receipts and expenditures of the company are being made only in accordance with authorizations of management and directors of the company; and (3) provide reasonable assurance regarding prevention or timely detection of unauthorized acquisition, use, or disposition of the company’s assets that could have a material effect on the financial statements.
Because of the inherent limitations of internal control over financial reporting, including the possibility of collusion or improper management override of controls, material misstatements due to error or fraud may not be prevented or detected on a timely basis. Also, projections of any evaluation of the effectiveness of the internal control over financial reporting to future periods are subject to the risk that the controls may become inadequate because of changes in conditions, or that the degree of compliance with the policies or procedures may deteriorate.
In our opinion, the MUFG Group maintained, in all material respects, effective internal control over financial reporting as of March 31, 2014, based on the criteria established in Internal Control—Integrated Framework (1992) issued by the Committee of Sponsoring Organizations of the Treadway Commission.
214
Table of Contents
We have also audited, in accordance with the standards of the Public Company Accounting Oversight Board (United States), the accompanying consolidated balance sheets of the MUFG Group as of March 31, 2014, and the related consolidated statements of income, comprehensive income, equity, and cash flows for the year ended March 31, 2014 (all expressed in Japanese Yen) and our report dated July 18, 2014 expressed an unqualified opinion on those financial statements.
/s/ Deloitte Touche Tohmatsu LLC
Tokyo, Japan
July 18, 2014
215
Table of Contents
| Item 16A. | Audit Committee Financial Expert. |
Our board of corporate auditors has determined that Mr. Hideo Kojima, a corporate auditor, is an “audit committee financial expert” as defined in Item 16A. of Form 20-F and is “independent” as defined in the listing standards of the New York Stock Exchange. Mr. Kojima has spent most of his professional career as a certified public accountant in Japan, auditing Japanese corporations, including those registered with the U.S. Securities and Exchange Commission. Mr. Kojima is an “outside corporate auditor” under Japanese law.
| Item 16B. | Code of Ethics. |
We have adopted a code of ethics, which consists of internal rules named Principles of Ethics and Conduct, compliance rules, compliance manual and rules of employment. Each of these rules applies to our principal executive officer, principal financial officer, principal accounting officer and persons performing similar functions. A copy of the Principles of Ethics and Conduct and the sections of our compliance rules, compliance manual and rules of employment relating to the “code of ethics” (as defined in paragraph (b) of Item 16B of Form 20-F) is attached as Exhibit 11 to this Annual Report. For a detailed discussion of our current compliance structure, see “Item 11. Quantitative and Qualitative Disclosures about Credit, Market and Other Risk—Compliance.” No waivers of the Principles of Ethics and Conduct or the ethical framework and code of conduct, as applicable, or the relevant sections of our compliance rules, compliance manual and rules of employment were granted to our principal executive officer, principal financial officer, principal accounting officer, directors or corporate auditors during the fiscal year ended March 31, 2014.
| Item 16C. | Principal Accountant Fees and Services. |
Fees and Services of Deloitte Touche Tohmatsu LLC
The aggregate fees billed by Deloitte Touche Tohmatsu LLC, our independent registered public accounting firm and its affiliates, for the fiscal years ended March 31, 2013 and 2014 are presented in the following table:
| 2013 | 2014 | |||||||
| (in millions) | ||||||||
|
Audit fees |
¥ | 5,604 | ¥ | 6,029 | ||||
|
Audit-related fees |
426 | 499 | ||||||
|
Tax fees |
308 | 309 | ||||||
|
All other fees |
— | 14 | ||||||
|
|
|
|
|
|||||
|
Total |
¥ | 6,338 | ¥ | 6,851 | ||||
|
|
|
|
|
|||||
The description of our fees billed for each category described above is as follows:
Audit fees —Audit fees are primarily for annual audit of our financial statements, review of our semi-annual condensed financial statements, statutory audit of our financial statements and audits of our subsidiary financial statements and attestation services relating to the internal controls over financial reporting under Section 404 of the Sarbanes-Oxley Act.
Audit-related fees —Audit-related fees primarily include accounting consultations, agreed upon procedures on internal controls, employee benefit plan audit, and advisory services relating to the internal control reviews.
Tax fees —Tax fees relate primarily to tax compliance, including assistance with preparation of tax return filings, tax advisory and tax planning services.
All other fees —All other fees primarily include fees for risk management and compliance advisory services.
216
Table of Contents
Pre-Approval Policies and Procedures for Services by Deloitte Touche Tohmatsu LLC
Our board of corporate auditors performs the pre-approval function required by applicable SEC rules and regulations. Our board of corporate auditors has established pre-approval policies and procedures that MUFG and its subsidiaries must follow before engaging Deloitte Touche Tohmatsu LLC to perform audit and permitted non-audit services.
When MUFG or a subsidiary intends to engage Deloitte Touche Tohmatsu LLC to perform audit and permitted non-audit services, it must make an application for pre-approval on either a periodic or case-by-case basis.
| Ÿ |
Periodic application is an application for pre-approval made each fiscal year for services that are expected to be provided by Deloitte Touche Tohmatsu LLC during the next fiscal year. |
| Ÿ |
Case-by-case application is an application for pre-approval made on a case-by-case basis for services to be provided by Deloitte Touche Tohmatsu LLC that are not covered by the periodic application. |
Pre-approval is resolved in principle by our board of corporate auditors prior to engagement, although if necessary a full-time corporate auditor may consider any case-by-case application for pre-approval on behalf of the board of corporate auditors prior to the next scheduled board of corporate auditors meeting. Such decisions made individually by a full-time corporate auditor are reported to and ratified by the board of corporate auditors as appropriate at the next scheduled board of corporate auditors meeting.
Fees approved pursuant to the procedures described in paragraph 2-01(c)(7)(i)(C) of Regulation S-X, which provides for an exception to the general requirement for pre-approval in certain circumstances, were approximately 0.2% for the fiscal year ended March 31, 2013 and less than 0.1% for the fiscal year ended March 31, 2014.
| Item 16D. | Exemptions from the Listing Standards for Audit Committees. |
In reliance upon the general exemption contained in Rule 10A-3(c)(3) under the U.S. Securities Exchange Act of 1934, MUFG does not have an audit committee. Rule 10A-3 provides an exemption from the listing standards of the New York Stock Exchange, or the NYSE, relating to audit committees for foreign companies like MUFG that have a board of corporate auditors established pursuant to applicable Japanese law and Articles of Incorporation. MUFG’s reliance on Rule 10A-3(c)(3) does not, in its opinion, materially adversely affect the ability of its board of corporate auditors to act independently and to satisfy the other requirements of Rule 10A-3.
217
Table of Contents
| Item 16E. | Purchases of Equity Securities by the Issuer and Affiliated Purchasers. |
Issuer Purchases of Common Stock
|
Total
Number of Shares Purchased (1) |
Average Price
Paid per Share |
Total
Number of Shares Purchased as Part of Publicly Announced Plans or Programs |
Maximum
Number of Shares that May Yet Be Purchased Under the Plans or Programs |
|||||||||||||
|
April 1 to April 30, 2013 |
5,429 | ¥ | 623.35 | — | — | |||||||||||
|
May 1 to May 31, 2013 |
6,606 | 679.24 | — | — | ||||||||||||
|
June 1 to June 30, 2013 |
3,637 | 585.74 | — | — | ||||||||||||
|
July 1 to July 31, 2013 |
7,590 | 652.03 | — | — | ||||||||||||
|
August 1 to August 31, 2013 |
4,838 | 607.93 | — | — | ||||||||||||
|
September 1 to September 30, 2013 |
4,577 | 617.23 | — | — | ||||||||||||
|
October 1 to October 31, 2013 |
5,030 | 625.37 | — | — | ||||||||||||
|
November 1 to November 30, 2013 |
5,627 | 636.10 | — | — | ||||||||||||
|
December 1 to December 31, 2013 |
11,586 | 648.81 | — | — | ||||||||||||
|
January 1 to January 31, 2014 |
6,601 | 674.34 | — | — | ||||||||||||
|
February 1 to February 28, 2014 |
4,928 | 607.82 | — | — | ||||||||||||
|
March 1 to March 31, 2014 |
6,068 | 578.20 | — | — | ||||||||||||
|
|
|
|
|
|
|
|
|
|||||||||
|
Total |
72,517 | 633.15 | — | — | ||||||||||||
| Note: |
| (1) | All of the purchased shares were shares constituting less than one unit (100 shares) purchased from registered holders of such shares at the current market price of those shares. |
We did not make any purchases of our shares other than the above for the fiscal year ended March 31, 2014.
In connection with the UNBC’s stock bonus plan, 2,598,862 ADSs were purchased by the trustee of the independent trust between April 1, 2013 and March 31, 2014. In the same period, 280,509 ADSs were purchased by the trustee of the independent trust in connection with the BTMU Headquarters for the Americas stock bonus plan. For descriptions of the UNBC’s stock bonus plan and the BTMU Headquarters for the Americas’ stock bonus plan, see “Item 6.B. Directors, Senior Management and Employees—Compensation.”
| Item 16F. | Change in Registrant’s Certifying Accountant. |
None.
| Item 16G. | Corporate Governance. |
The New York Stock Exchange, or the NYSE, allows NYSE-listed companies that are foreign private issuers, such as MUFG, with certain exceptions, to follow home-country practices in lieu of the corporate governance practices followed by U.S. companies pursuant to the NYSE’s Listed Company Manual. The following sections summarize the significant differences between MUFG’s corporate governance practices and those followed by U.S. listed companies under the NYSE’s Listed Company Manual.
1. A NYSE-listed U.S. company must have a majority of directors that meet the independence requirements under Section 303A of the NYSE’s Listed Company Manual.
As of June 30, 2014, MUFG has four outside directors as members of its board of directors. Under the Company Law of Japan, an “outside director” is defined as a director who has not served as an executive director (gyomu shikko torishimariyaku) , executive officer (shikkoyaku) , manager (shihainin) or any other type of employee of the relevant company or any of its subsidiaries prior to his or her appointment.
218
Table of Contents
For MUFG and other large Japanese companies employing a corporate governance system based on a board of corporate auditors, the Company Law has no requirement for independent directors or similar requirement with respect to directors. Tokyo Stock Exchange rules require listed companies, including MUFG, to identify at least one individual who the company believes will unlikely have a conflict of interests with general shareholders and have such individual serve as an independent director or corporate auditor.
For companies employing the corporate auditor system such as MUFG, the task of overseeing the management of the company is assigned to the corporate auditors as well as the board of directors. At least half of the corporate auditors are required to be an “outside corporate auditor.”
2. A NYSE-listed U.S. company must have an audit committee composed entirely of independent directors.
Under the Company Law, MUFG and other Japanese companies (excluding companies with committees established pursuant to the Company Law) are not obliged to establish an audit committee.
As discussed above, MUFG employs a corporate auditor system as stipulated by the Company Law. Accordingly, MUFG has established a board of corporate auditors consisting of corporate auditors with a statutory duty to audit MUFG directors’ performance of their professional duties and to review and report on the manner and results of the audit of MUFG’s financial statements, for the benefit of MUFG’s shareholders.
The Company Law requires companies having a board of corporate auditors, including MUFG, to elect at least three corporate auditors through a resolution adopted at a general meeting of shareholders. At least half of the corporate auditors must be an “outside corporate auditor,” which is defined as a corporate auditor who has not served as a director, account assistant, executive officer (shikkoyaku) , manager (shihainin) , or any other employee of the relevant company or any of its subsidiaries.
As of June 30, 2014, MUFG had five corporate auditors, three of whom are outside corporate auditors.
3. A NYSE-listed U.S. company must have a compensation committee composed entirely of independent directors.
Under the Company Law, MUFG and other Japanese companies (excluding companies with committees established pursuant to the Company Law) are not obliged to establish a compensation committee.
MUFG has voluntarily established a nomination and compensation committee to support MUFG’s board of directors. The nomination and compensation committee, a majority of which is comprised of outside directors, deliberates matters relating to the appointment and dismissal of MUFG’s directors and the directors of MUFG’s subsidiaries, the compensation framework of MUFG’s directors and the directors of MUFG’s subsidiaries, as well as the compensation of MUFG’s top management and the top management of MUFG’s subsidiaries. The nomination and compensation committee makes reports and proposals to the board of directors about important matters for deliberation and necessary improvement measures.
The maximum aggregate amounts of compensation for MUFG’s directors and corporate auditors are approved at MUFG’s general meeting of shareholders. The amount and allocation of compensation for each MUFG director are then proposed to, and voted upon by, the board of directors. The amount and allocation of compensation for each MUFG corporate auditor are determined through discussions and agreement among MUFG’s corporate auditors.
219
Table of Contents
4. A NYSE-listed U.S. company must have a nominating or corporate governance committee composed entirely of independent directors.
Under the Company Law, MUFG and other Japanese companies (excluding companies with committees established pursuant to the Company Law) are not obliged to establish a nominating or corporate governance committee.
MUFG’s directors are elected or dismissed at MUFG’s general meeting of shareholders in accordance with the relevant provisions of the Company Law and MUFG’s articles of incorporation. MUFG’s corporate auditors are also elected or dismissed at MUFG’s general meeting of shareholders. A proposal by MUFG’s board of directors to elect a corporate auditor needs the consent of its board of corporate auditors. MUFG’s board of corporate auditors is empowered to adopt a resolution requesting that MUFG’s directors submit a proposal for election of a corporate auditor to MUFG’s general meeting of shareholders.
The corporate auditors have the right to state their opinion concerning the election or dismissal of a corporate auditor at MUFG’s general meeting of shareholders.
5. A NYSE-listed U.S. company must obtain shareholder approval with respect to any equity compensation plan.
Under the Company Law, a public company seeking to issue “stock acquisition rights” (granting the holder thereof the right to acquire from the issuer shares of its stock at a prescribed price) must obtain the approval of its board of directors, not its shareholders.
When stock acquisition rights are issued under terms and conditions that are especially favorable to the recipients thereof, such issuance must be approved by a “special resolution” of a general meeting of shareholders. Under MUFG’s articles of incorporation, the quorum for a special resolution is at least one-third of the total outstanding voting rights, and the approval of at least two-thirds of the voting rights represented at the relevant general meeting of shareholders of MUFG is required to pass a special resolution.
6. A NYSE-listed U.S. company must adopt and disclose Corporate Governance Guidelines and a Code of Business Conduct and Ethics, and it must also disclose any exemptions granted to directors or executives.
Under the Company Law, the Financial Instruments and Exchange Law of Japan and applicable stock exchange rules, Japanese companies, including MUFG, are not obliged to adopt and disclose corporate governance guidelines or a code of business conduct and ethics for directors, officers and employees. In order to further enhance its disclosure, however, MUFG has decided to disclose the details of its corporate governance in its periodic reports and other disclosure documents.
MUFG has also adopted a code of ethics, compliance rules and a compliance manual which it believes are compliant with the requirements for a Code of Ethics as set forth under Section 406 of the U.S. Sarbanes-Oxley Act. MUFG has disclosed the relevant sections of its code of ethics, compliance rules and compliance manual as an exhibit to this Annual Report. No exemptions from MUFG’s code of ethics, compliance rules or compliance manual were granted to its directors or executives during the fiscal year ended March 31, 2014.
7. A NYSE-listed U.S. company must hold regularly scheduled executive sessions where participants are limited to non-management directors.
Under the Company Law, Japanese corporations are not obliged to hold executive sessions where participants are limited to non-management directors. Such executive sessions are also not required under MUFG’s internal corporate governance rules.
| Item 16H. | Mine Safety Disclosure. |
Not applicable.
220
Table of Contents
| Item 17. | Financial Statements. |
In lieu of responding to this item, we have responded to Item 18 of this Annual Report.
| Item 18. | Financial Statements. |
The information required by this item is set forth in our consolidated financial statements starting on page F-1 of this Annual Report.
| Item 19. | Exhibits. |
|
Exhibit |
Description |
|
| 1(a) | Articles of Incorporation of Mitsubishi UFJ Financial Group, Inc., as amended on June 27, 2013. (English translation)* | |
| 1(b) | Board of Directors Regulations of Mitsubishi UFJ Financial Group, Inc., as amended on December 24, 2010. (English translation)** | |
| 1(c) | Corporation Meetings Regulations of Mitsubishi UFJ Financial Group, Inc., as amended on December 24, 2010. (English translation)** | |
| 1(d) | Share Handling Regulations of Mitsubishi UFJ Financial Group, Inc., as amended on June 26, 2009. (English Translation)*** | |
| 2(a) | Form of American Depositary Receipt.**** | |
| 2(b) | Form of Deposit Agreement, amended and restated as of December 22, 2004, among Mitsubishi Tokyo Financial Group, Inc. (subsequently renamed Mitsubishi UFJ Financial Group, Inc.), The Bank of New York Mellon and the holders from time to time of American Depositary Receipts issued thereunder.**** | |
| 8 | Subsidiaries of the Company—see “Item 4.C. Information on the Company—Organizational Structure.” | |
| 11 | Principles of Ethics and Conduct, Compliance Rules, Compliance Manual, and Rules of Employment of Mitsubishi UFJ Financial Group, Inc. applicable to its principal executive officer, principal financial officer, principal accounting officer and persons performing similar functions. (English translation of relevant sections)* | |
| 12 | Certifications required by Rule 13a-14(a) (17 CFR 240.13a-14(a)) or Rule 15d-14(a) (17 CFR 240.15d-14(a)). | |
| 13 | Certifications required by Rule 13a-14(b) (17 CFR 240.13a-14(b)) or Rule 15d-14(b) (17 CFR 240.15d-14(b)) and Section 1350 of Chapter 63 of Title 18 of the United States Code (18 U.S.C. 1350). | |
| 101.INS | XBRL Instance Document | |
| 101.SCH | XBRL Schema Document | |
| 101.CAL | XBRL Calculation Linkbase Document | |
| 101.DEF | XBRL Definition Linkbase Document | |
| 101.LAB | XBRL Label Linkbase Document | |
| 101.PRE | XBRL Presentation Linkbase Document | |
| Notes: |
| * | Incorporated by reference to our annual report on Form 20-F (File No. 000-54189) field on July 22, 2013. |
| ** | Incorporated by reference to our annual report on Form 20-F (File No. 000-54189) field on July 28, 2011. |
| *** | Incorporated by reference to our annual report on Form 20-F (File No. 333-98061-99) filed on September 2, 2009. |
| **** | Incorporated by reference to our annual report on Form 20-F (File No. 000-54189) field on July 23, 2012. |
221
Table of Contents
Due to close integration of our foreign and domestic activities, it is difficult to make a precise determination of the assets, liabilities, income and expenses of our foreign operations. The foreign operations as presented include the business conducted by overseas subsidiaries and branches, and the international business principally conducted by the several international banking-related divisions headquartered in Japan. Our management believes that the results appropriately represent our domestic and foreign activities.
A-1
Table of Contents
| I. Distribution | of Assets, Liabilities and Equity; Interest Rates and Interest Differential |
The following table shows our average balances, interest and average interest rates for the fiscal years ended March 31, 2012, 2013 and 2014. Average balances are generally based on a daily average while a month-end average is used for certain average balances when it is not practicable to obtain applicable daily averages. The average balances determined by such methods are considered to be representative of our operations.
| Fiscal years ended March 31, | ||||||||||||||||||||||||||||||||||||
| 2012 | 2013 | 2014 | ||||||||||||||||||||||||||||||||||
|
Average
balance |
Interest
income |
Average
rate |
Average
balance |
Interest
income |
Average
rate |
Average
balance |
Interest
income |
Average
rate |
||||||||||||||||||||||||||||
| (in millions, except percentages) | ||||||||||||||||||||||||||||||||||||
|
Assets: |
||||||||||||||||||||||||||||||||||||
|
Interest-earning assets: |
||||||||||||||||||||||||||||||||||||
|
Interest-earning deposits in other banks: |
||||||||||||||||||||||||||||||||||||
|
Domestic |
¥ | 1,866,249 | ¥ | 2,412 | 0.13 | % | ¥ | 2,855,051 | ¥ | 3,964 | 0.14 | % | ¥ | 10,321,128 | ¥ | 10,990 | 0.11 | % | ||||||||||||||||||
|
Foreign |
4,976,720 | 37,551 | 0.75 | 3,763,476 | 23,340 | 0.62 | 6,520,619 | 36,066 | 0.55 | |||||||||||||||||||||||||||
|
|
|
|
|
|
|
|
|
|
|
|
|
|||||||||||||||||||||||||
|
Total |
6,842,969 | 39,963 | 0.58 | 6,618,527 | 27,304 | 0.41 | 16,841,747 | 47,056 | 0.28 | |||||||||||||||||||||||||||
|
|
|
|
|
|
|
|
|
|
|
|
|
|||||||||||||||||||||||||
|
Call loans, funds sold, and receivables under resale agreements and securities borrowing transactions: |
||||||||||||||||||||||||||||||||||||
|
Domestic |
3,409,929 | 5,299 | 0.16 | 3,133,225 | 3,456 | 0.11 | 958,054 | 2,506 | 0.26 | |||||||||||||||||||||||||||
|
Foreign |
8,221,074 | 88,089 | 1.07 | 6,972,640 | 53,376 | 0.77 | 9,421,311 | 59,227 | 0.63 | |||||||||||||||||||||||||||
|
|
|
|
|
|
|
|
|
|
|
|
|
|||||||||||||||||||||||||
|
Total |
11,631,003 | 93,388 | 0.80 | 10,105,865 | 56,832 | 0.56 | 10,379,365 | 61,733 | 0.59 | |||||||||||||||||||||||||||
|
|
|
|
|
|
|
|
|
|
|
|
|
|||||||||||||||||||||||||
|
Trading account assets: |
||||||||||||||||||||||||||||||||||||
|
Domestic |
5,317,152 | 44,358 | 0.83 | 5,780,004 | 45,367 | 0.78 | 5,211,819 | 40,044 | 0.77 | |||||||||||||||||||||||||||
|
Foreign |
14,985,875 | 271,384 | 1.81 | 18,504,836 | 349,421 | 1.89 | 22,827,441 | 367,371 | 1.61 | |||||||||||||||||||||||||||
|
|
|
|
|
|
|
|
|
|
|
|
|
|||||||||||||||||||||||||
|
Total |
20,303,027 | 315,742 | 1.56 | 24,284,840 | 394,788 | 1.63 | 28,039,260 | 407,415 | 1.45 | |||||||||||||||||||||||||||
|
|
|
|
|
|
|
|
|
|
|
|
|
|||||||||||||||||||||||||
|
Investment securities (1) : |
||||||||||||||||||||||||||||||||||||
|
Domestic |
54,336,768 | 306,903 | 0.56 | 55,159,363 | 259,420 | 0.47 | 49,152,403 | 222,644 | 0.45 | |||||||||||||||||||||||||||
|
Foreign (2) |
3,838,534 | 244,863 | 6.38 | 4,617,964 | 111,407 | 2.41 | 5,166,347 | 119,693 | 2.32 | |||||||||||||||||||||||||||
|
|
|
|
|
|
|
|
|
|
|
|
|
|||||||||||||||||||||||||
|
Total |
58,175,302 | 551,766 | 0.95 | 59,777,327 | 370,827 | 0.62 | 54,318,750 | 342,337 | 0.63 | |||||||||||||||||||||||||||
|
|
|
|
|
|
|
|
|
|
|
|
|
|||||||||||||||||||||||||
|
Loans (3) : |
||||||||||||||||||||||||||||||||||||
|
Domestic |
65,926,637 | 1,041,921 | 1.58 | 67,831,943 | 964,031 | 1.42 | 69,443,921 | 900,085 | 1.30 | |||||||||||||||||||||||||||
|
Foreign |
21,300,209 | 553,176 | 2.60 | 25,205,754 | 613,739 | 2.43 | 33,153,305 | 763,657 | 2.30 | |||||||||||||||||||||||||||
|
|
|
|
|
|
|
|
|
|
|
|
|
|||||||||||||||||||||||||
|
Total |
87,226,846 | 1,595,097 | 1.83 | 93,037,697 | 1,577,770 | 1.70 | 102,597,226 | 1,663,742 | 1.62 | |||||||||||||||||||||||||||
|
|
|
|
|
|
|
|
|
|
|
|
|
|||||||||||||||||||||||||
|
Total interest-earning assets: |
||||||||||||||||||||||||||||||||||||
|
Domestic |
130,856,735 | 1,400,893 | 1.07 | 134,759,586 | 1,276,238 | 0.95 | 135,087,325 | 1,176,269 | 0.87 | |||||||||||||||||||||||||||
|
Foreign |
53,322,412 | 1,195,063 | 2.24 | 59,064,670 | 1,151,283 | 1.95 | 77,089,023 | 1,346,014 | 1.75 | |||||||||||||||||||||||||||
|
|
|
|
|
|
|
|
|
|
|
|
|
|||||||||||||||||||||||||
|
Total |
184,179,147 | 2,595,956 | 1.41 | 193,824,256 | 2,427,521 | 1.25 | 212,176,348 | 2,522,283 | 1.19 | |||||||||||||||||||||||||||
|
|
|
|
|
|
|
|
|
|
|
|
|
|||||||||||||||||||||||||
|
Non-interest-earning assets: |
||||||||||||||||||||||||||||||||||||
|
Cash and due from banks |
2,651,846 | 3,131,561 | 3,441,312 | |||||||||||||||||||||||||||||||||
|
Other non-interest-earning assets |
26,235,174 | 30,016,918 | 33,369,623 | |||||||||||||||||||||||||||||||||
|
Allowance for credit losses |
(1,230,778 | ) | (1,289,950 | ) | (1,257,539 | ) | ||||||||||||||||||||||||||||||
|
|
|
|
|
|
|
|||||||||||||||||||||||||||||||
|
Total non-interest- earning assets |
27,656,242 | 31,858,529 | 35,553,396 | |||||||||||||||||||||||||||||||||
|
|
|
|
|
|
|
|||||||||||||||||||||||||||||||
|
Total assets |
¥ | 211,835,389 | ¥ | 225,682,785 | ¥ | 247,729,744 | ||||||||||||||||||||||||||||||
|
|
|
|
|
|
|
|||||||||||||||||||||||||||||||
Notes:
| (1) | Tax-exempt income of tax-exempt investment securities has not been calculated on a tax equivalent basis because the effect of such calculation would not be material. |
| (2) | Interest income on foreign activities for the fiscal year ended March 31, 2012 includes a gain of ¥139,320 million on conversion rate adjustment of Morgan Stanley’s convertible preferred stock. Exclusive of the gain associated with the conversion, the average rate would have been lower at 2.90% rather than 6.38% for the fiscal year ended March 31, 2012. |
| (3) | Average balances on loans outstanding include all nonaccrual and restructured loans. See “III. Loan Portfolio.” The amortized portion of net loan origination fees (costs) is included in interest income on loans, which accounts for an insignificant amount of an adjustment to the yields. |
A-2
Table of Contents
| Fiscal years ended March 31, | ||||||||||||||||||||||||||||||||||||
| 2012 | 2013 | 2014 | ||||||||||||||||||||||||||||||||||
|
Average
balance |
Interest
expense |
Average
rate |
Average
balance |
Interest
expense |
Average
rate |
Average
balance |
Interest
expense |
Average
rate |
||||||||||||||||||||||||||||
| (in millions, except percentages) | ||||||||||||||||||||||||||||||||||||
|
Liabilities and equity: |
||||||||||||||||||||||||||||||||||||
|
Interest-bearing liabilities: |
||||||||||||||||||||||||||||||||||||
|
Deposits: |
||||||||||||||||||||||||||||||||||||
|
Domestic |
¥ | 97,953,258 | ¥ | 101,673 | 0.10 | % | ¥ | 99,884,032 | ¥ | 77,708 | 0.08 | % | ¥ | 102,854,486 | ¥ | 65,358 | 0.06 | % | ||||||||||||||||||
|
Foreign |
19,678,674 | 127,185 | 0.65 | 23,436,714 | 134,359 | 0.57 | 30,453,791 | 161,297 | 0.53 | |||||||||||||||||||||||||||
|
|
|
|
|
|
|
|
|
|
|
|
|
|||||||||||||||||||||||||
|
Total |
117,631,932 | 228,858 | 0.19 | 123,320,746 | 212,067 | 0.17 | 133,308,277 | 226,655 | 0.17 | |||||||||||||||||||||||||||
|
|
|
|
|
|
|
|
|
|
|
|
|
|||||||||||||||||||||||||
|
Call money, funds purchased, and payables under repurchase agreements and securities lending transactions: |
||||||||||||||||||||||||||||||||||||
|
Domestic |
12,456,171 | 34,148 | 0.27 | 16,284,255 | 35,030 | 0.22 | 18,576,215 | 28,703 | 0.15 | |||||||||||||||||||||||||||
|
Foreign |
9,055,602 | 60,956 | 0.67 | 7,948,167 | 28,793 | 0.36 | 9,871,891 | 17,467 | 0.18 | |||||||||||||||||||||||||||
|
|
|
|
|
|
|
|
|
|
|
|
|
|||||||||||||||||||||||||
|
Total |
21,511,773 | 95,104 | 0.44 | 24,232,422 | 63,823 | 0.26 | 28,448,106 | 46,170 | 0.16 | |||||||||||||||||||||||||||
|
|
|
|
|
|
|
|
|
|
|
|
|
|||||||||||||||||||||||||
|
Due to trust account—Domestic |
608,061 | 647 | 0.11 | 590,150 | 665 | 0.11 | 506,466 | 519 | 0.10 | |||||||||||||||||||||||||||
|
|
|
|
|
|
|
|
|
|
|
|
|
|||||||||||||||||||||||||
|
Other short-term borrowings and trading account liabilities: |
||||||||||||||||||||||||||||||||||||
|
Domestic |
10,558,305 | 39,425 | 0.37 | 10,247,601 | 35,928 | 0.35 | 10,177,337 | 34,379 | 0.34 | |||||||||||||||||||||||||||
|
Foreign |
2,552,810 | 22,232 | 0.87 | 3,153,184 | 16,414 | 0.52 | 4,332,788 | 23,122 | 0.53 | |||||||||||||||||||||||||||
|
|
|
|
|
|
|
|
|
|
|
|
|
|||||||||||||||||||||||||
|
Total |
13,111,115 | 61,657 | 0.47 | 13,400,785 | 52,342 | 0.39 | 14,510,125 | 57,501 | 0.40 | |||||||||||||||||||||||||||
|
|
|
|
|
|
|
|
|
|
|
|
|
|||||||||||||||||||||||||
|
Long-term debt: |
||||||||||||||||||||||||||||||||||||
|
Domestic |
9,340,803 | 159,553 | 1.71 | 8,968,836 | 135,295 | 1.51 | 9,763,504 | 126,686 | 1.30 | |||||||||||||||||||||||||||
|
Foreign |
3,216,885 | 94,320 | 2.93 | 2,886,502 | 92,226 | 3.20 | 2,876,831 | 103,441 | 3.60 | |||||||||||||||||||||||||||
|
|
|
|
|
|
|
|
|
|
|
|
|
|||||||||||||||||||||||||
|
Total |
12,557,688 | 253,873 | 2.02 | 11,855,338 | 227,521 | 1.92 | 12,640,335 | 230,127 | 1.82 | |||||||||||||||||||||||||||
|
|
|
|
|
|
|
|
|
|
|
|
|
|||||||||||||||||||||||||
|
Total interest-bearing liabilities: |
||||||||||||||||||||||||||||||||||||
|
Domestic |
130,916,598 | 335,446 | 0.26 | 135,974,874 | 284,626 | 0.21 | 141,878,008 | 255,645 | 0.18 | |||||||||||||||||||||||||||
|
Foreign |
34,503,971 | 304,693 | 0.88 | 37,424,567 | 271,792 | 0.73 | 47,535,301 | 305,327 | 0.64 | |||||||||||||||||||||||||||
|
|
|
|
|
|
|
|
|
|
|
|
|
|||||||||||||||||||||||||
|
Total |
165,420,569 | 640,139 | 0.39 | 173,399,441 | 556,418 | 0.32 | 189,413,309 | 560,972 | 0.30 | |||||||||||||||||||||||||||
|
|
|
|
|
|
|
|
|
|
|
|
|
|||||||||||||||||||||||||
|
Non-interest-bearing liabilities |
37,820,510 | 43,038,814 | 47,633,337 | |||||||||||||||||||||||||||||||||
|
|
|
|
|
|
|
|||||||||||||||||||||||||||||||
|
Total equity |
8,594,310 | 9,244,530 | 10,683,098 | |||||||||||||||||||||||||||||||||
|
|
|
|
|
|
|
|||||||||||||||||||||||||||||||
|
Total liabilities and equity |
¥ | 211,835,389 | ¥ | 225,682,785 | ¥ | 247,729,744 | ||||||||||||||||||||||||||||||
|
|
|
|
|
|
|
|||||||||||||||||||||||||||||||
|
Net interest income and interest rate spread |
¥ | 1,955,817 | 1.02 | % | ¥ | 1,871,103 | 0.93 | % | ¥ | 1,961,311 | 0.89 | % | ||||||||||||||||||||||||
|
|
|
|
|
|
|
|
|
|
|
|
|
|||||||||||||||||||||||||
|
Net interest income as a percentage of total interest-earning
|
1.06 | % | 0.97 | % | 0.92 | % | ||||||||||||||||||||||||||||||
|
|
|
|
|
|
|
|||||||||||||||||||||||||||||||
The percentage of total average assets attributable to foreign activities was 29.5%, 31.5% and 36.5%, respectively, for the fiscal years ended March 31, 2012, 2013 and 2014.
The percentage of total average liabilities attributable to foreign activities was 30.1%, 32.1% and 37.2%, respectively, for the fiscal years ended March 31, 2012, 2013 and 2014.
A-3
Table of Contents
Analysis of Net Interest Income
The following table shows changes in our net interest income by changes in volume and by changes in rate for the fiscal year ended March 31, 2013 compared to the fiscal year ended March 31, 2012, and the fiscal year ended March 31, 2014 compared to the fiscal year ended March 31, 2013.
|
Fiscal year ended March 31, 2012
versus fiscal year ended March 31, 2013 |
Fiscal year ended March 31, 2013
versus fiscal year ended March 31, 2014 |
|||||||||||||||||||||||
|
Increase (decrease)
due to changes in |
Net change |
Increase (decrease)
due to changes in |
Net change | |||||||||||||||||||||
| Volume (1) | Rate (1) | Volume (1) | Rate (1) | |||||||||||||||||||||
| (in millions) | ||||||||||||||||||||||||
|
Interest income: |
||||||||||||||||||||||||
|
Interest-earning deposits in other banks: |
||||||||||||||||||||||||
|
Domestic |
¥ | 1,361 | ¥ | 191 | ¥ | 1,552 | ¥ | 8,148 | ¥ | (1,122 | ) | ¥ | 7,026 | |||||||||||
|
Foreign |
(8,212 | ) | (5,999 | ) | (14,211 | ) | 15,488 | (2,762 | ) | 12,726 | ||||||||||||||
|
|
|
|
|
|
|
|
|
|
|
|
|
|||||||||||||
|
Total |
(6,851 | ) | (5,808 | ) | (12,659 | ) | 23,636 | (3,884 | ) | 19,752 | ||||||||||||||
|
|
|
|
|
|
|
|
|
|
|
|
|
|||||||||||||
|
Call loans, funds sold, and receivables under resale agreements and securities borrowing transactions: |
||||||||||||||||||||||||
|
Domestic |
(403 | ) | (1,440 | ) | (1,843 | ) | (3,505 | ) | 2,555 | (950 | ) | |||||||||||||
|
Foreign |
(12,051 | ) | (22,662 | ) | (34,713 | ) | 16,524 | (10,673 | ) | 5,851 | ||||||||||||||
|
|
|
|
|
|
|
|
|
|
|
|
|
|||||||||||||
|
Total |
(12,454 | ) | (24,102 | ) | (36,556 | ) | 13,019 | (8,118 | ) | 4,901 | ||||||||||||||
|
|
|
|
|
|
|
|
|
|
|
|
|
|||||||||||||
|
Trading account assets: |
||||||||||||||||||||||||
|
Domestic |
3,725 | (2,716 | ) | 1,009 | (4,382 | ) | (941 | ) | (5,323 | ) | ||||||||||||||
|
Foreign |
66,029 | 12,008 | 78,037 | 74,236 | (56,286 | ) | 17,950 | |||||||||||||||||
|
|
|
|
|
|
|
|
|
|
|
|
|
|||||||||||||
|
Total |
69,754 | 9,292 | 79,046 | 69,854 | (57,227 | ) | 12,627 | |||||||||||||||||
|
|
|
|
|
|
|
|
|
|
|
|
|
|||||||||||||
|
Investment securities (2) : |
||||||||||||||||||||||||
|
Domestic |
4,582 | (52,065 | ) | (47,483 | ) | (27,473 | ) | (9,303 | ) | (36,776 | ) | |||||||||||||
|
Foreign (3) |
42,110 | (175,566 | ) | (133,456 | ) | 12,836 | (4,550 | ) | 8,286 | |||||||||||||||
|
|
|
|
|
|
|
|
|
|
|
|
|
|||||||||||||
|
Total |
46,692 | (227,631 | ) | (180,939 | ) | (14,637 | ) | (13,853 | ) | (28,490 | ) | |||||||||||||
|
|
|
|
|
|
|
|
|
|
|
|
|
|||||||||||||
|
Loans: |
||||||||||||||||||||||||
|
Domestic |
29,436 | (107,326 | ) | (77,890 | ) | 22,481 | (86,427 | ) | (63,946 | ) | ||||||||||||||
|
Foreign |
96,705 | (36,142 | ) | 60,563 | 184,593 | (34,675 | ) | 149,918 | ||||||||||||||||
|
|
|
|
|
|
|
|
|
|
|
|
|
|||||||||||||
|
Total |
126,141 | (143,468 | ) | (17,327 | ) | 207,074 | (121,102 | ) | 85,972 | |||||||||||||||
|
|
|
|
|
|
|
|
|
|
|
|
|
|||||||||||||
|
Total interest income: |
||||||||||||||||||||||||
|
Domestic |
38,701 | (163,356 | ) | (124,655 | ) | (4,731 | ) | (95,238 | ) | (99,969 | ) | |||||||||||||
|
Foreign |
184,581 | (228,361 | ) | (43,780 | ) | 303,677 | (108,946 | ) | 194,731 | |||||||||||||||
|
|
|
|
|
|
|
|
|
|
|
|
|
|||||||||||||
|
Total |
¥ | 223,282 | ¥ | (391,717 | ) | ¥ | (168,435 | ) | ¥ | 298,946 | ¥ | (204,184 | ) | ¥ | 94,762 | |||||||||
|
|
|
|
|
|
|
|
|
|
|
|
|
|||||||||||||
Notes:
| (1) | Volume/rate variance is allocated based on the percentage relationship of changes in volume and changes in rate to the total “net change.” |
| (2) | Tax-exempt income of tax-exempt investment securities has not been calculated on a tax equivalent basis because the effect of such calculation would not be material. |
| (3) | Interest income on foreign activities includes a gain of ¥139,320 million on conversion rate adjustment of Morgan Stanley’s convertible preferred stock for the fiscal year ended March 31, 2012. Exclusive of the effect of the conversion, the increase due to changes in volume was ¥25,432 million and the decrease due to changes in rate was ¥19,568 million for the fiscal year ended March 31, 2013 compared to the fiscal year ended March 31, 2012. |
A-4
Table of Contents
|
Fiscal year ended March 31, 2012
versus fiscal year ended March 31, 2013 |
Fiscal year ended March 31, 2013
versus fiscal year ended March 31, 2014 |
|||||||||||||||||||||||
|
Increase (decrease)
due to changes in |
Net change |
Increase (decrease)
due to changes in |
Net change | |||||||||||||||||||||
| Volume (1) | Rate (1) | Volume (1) | Rate (1) | |||||||||||||||||||||
| (in millions) | ||||||||||||||||||||||||
|
Interest expense: |
||||||||||||||||||||||||
|
Deposits: |
||||||||||||||||||||||||
|
Domestic |
¥ | 1,967 | ¥ | (25,932 | ) | ¥ | (23,965 | ) | ¥ | 2,252 | ¥ | (14,602 | ) | ¥ | (12,350 | ) | ||||||||
|
Foreign |
22,564 | (15,390 | ) | 7,174 | 37,786 | (10,848 | ) | 26,938 | ||||||||||||||||
|
|
|
|
|
|
|
|
|
|
|
|
|
|||||||||||||
|
Total |
24,531 | (41,322 | ) | (16,791 | ) | 40,038 | (25,450 | ) | 14,588 | |||||||||||||||
|
|
|
|
|
|
|
|
|
|
|
|
|
|||||||||||||
|
Call money, funds purchased, and payables under repurchase agreements and securities lending transactions: |
||||||||||||||||||||||||
|
Domestic |
9,166 | (8,284 | ) | 882 | 4,468 | (10,795 | ) | (6,327 | ) | |||||||||||||||
|
Foreign |
(6,734 | ) | (25,429 | ) | (32,163 | ) | 5,824 | (17,150 | ) | (11,326 | ) | |||||||||||||
|
|
|
|
|
|
|
|
|
|
|
|
|
|||||||||||||
|
Total |
2,432 | (33,713 | ) | (31,281 | ) | 10,292 | (27,945 | ) | (17,653 | ) | ||||||||||||||
|
|
|
|
|
|
|
|
|
|
|
|
|
|||||||||||||
|
Due to trust account—Domestic |
(19 | ) | 37 | 18 | (89 | ) | (57 | ) | (146 | ) | ||||||||||||||
|
|
|
|
|
|
|
|
|
|
|
|
|
|||||||||||||
|
Other short-term borrowings and trading account liabilities: |
||||||||||||||||||||||||
|
Domestic |
(1,137 | ) | (2,360 | ) | (3,497 | ) | (245 | ) | (1,304 | ) | (1,549 | ) | ||||||||||||
|
Foreign |
4,453 | (10,271 | ) | (5,818 | ) | 6,285 | 423 | 6,708 | ||||||||||||||||
|
|
|
|
|
|
|
|
|
|
|
|
|
|||||||||||||
|
Total |
3,316 | (12,631 | ) | (9,315 | ) | 6,040 | (881 | ) | 5,159 | |||||||||||||||
|
|
|
|
|
|
|
|
|
|
|
|
|
|||||||||||||
|
Long-term debt: |
||||||||||||||||||||||||
|
Domestic |
(6,165 | ) | (18,093 | ) | (24,258 | ) | 11,337 | (19,946 | ) | (8,609 | ) | |||||||||||||
|
Foreign |
(10,151 | ) | 8,057 | (2,094 | ) | (310 | ) | 11,525 | 11,215 | |||||||||||||||
|
|
|
|
|
|
|
|
|
|
|
|
|
|||||||||||||
|
Total |
(16,316 | ) | (10,036 | ) | (26,352 | ) | 11,027 | (8,421 | ) | 2,606 | ||||||||||||||
|
|
|
|
|
|
|
|
|
|
|
|
|
|||||||||||||
|
Total interest expense: |
||||||||||||||||||||||||
|
Domestic |
3,812 | (54,632 | ) | (50,820 | ) | 17,723 | (46,704 | ) | (28,981 | ) | ||||||||||||||
|
Foreign |
10,132 | (43,033 | ) | (32,901 | ) | 49,585 | (16,050 | ) | 33,535 | |||||||||||||||
|
|
|
|
|
|
|
|
|
|
|
|
|
|||||||||||||
|
Total |
¥ | 13,944 | ¥ | (97,665 | ) | ¥ | (83,721 | ) | ¥ | 67,308 | ¥ | (62,754 | ) | ¥ | 4,554 | |||||||||
|
|
|
|
|
|
|
|
|
|
|
|
|
|||||||||||||
|
Net interest income: |
||||||||||||||||||||||||
|
Domestic |
¥ | 34,889 | ¥ | (108,724 | ) | ¥ | (73,835 | ) | ¥ | (22,455 | ) | ¥ | (48,533 | ) | ¥ | (70,988 | ) | |||||||
|
Foreign |
174,449 | (185,328 | ) | (10,879 | ) | 254,092 | (92,896 | ) | 161,196 | |||||||||||||||
|
|
|
|
|
|
|
|
|
|
|
|
|
|||||||||||||
|
Total |
¥ | 209,338 | ¥ | (294,052 | ) | ¥ | (84,714 | ) | ¥ | 231,637 | ¥ | (141,429 | ) | ¥ | 90,208 | |||||||||
|
|
|
|
|
|
|
|
|
|
|
|
|
|||||||||||||
Note:
| (1) | Volume/rate variance is allocated based on the percentage relationship of changes in volume and changes in rate to the total “net change.” |
A-5
Table of Contents
| II. | Investment Portfolio |
The following table shows information as to the value of our investment securities available-for-sale and being held-to-maturity at March 31, 2012, 2013 and 2014:
| At March 31, | ||||||||||||||||||||||||||||||||||||
| 2012 | 2013 | 2014 | ||||||||||||||||||||||||||||||||||
|
Amortized
cost |
Fair value |
Net
unrealized gains (losses) |
Amortized
cost |
Fair value |
Net
unrealized gains (losses) |
Amortized
cost |
Fair value |
Net
unrealized gains (losses) |
||||||||||||||||||||||||||||
| (in millions) | ||||||||||||||||||||||||||||||||||||
|
Securities available-for-sale: |
||||||||||||||||||||||||||||||||||||
|
Domestic: |
||||||||||||||||||||||||||||||||||||
|
Japanese national government and Japanese government agency bonds |
¥ | 48,736,276 | ¥ | 48,882,662 | ¥ | 146,386 | ¥ | 49,159,827 | ¥ | 49,479,954 | ¥ | 320,127 | ¥ | 41,388,592 | ¥ | 41,589,009 | ¥ | 200,417 | ||||||||||||||||||
|
Corporate bonds |
2,227,855 | 2,294,537 | 66,682 | 1,644,555 | 1,696,529 | 51,974 | 1,229,167 | 1,264,960 | 35,793 | |||||||||||||||||||||||||||
|
Marketable equity securities |
2,305,916 | 3,427,722 | 1,121,806 | 2,220,507 | 4,092,121 | 1,871,614 | 2,434,946 | 4,812,596 | 2,377,650 | |||||||||||||||||||||||||||
|
Other securities |
494,185 | 500,454 | 6,269 | 551,447 | 561,082 | 9,635 | 592,682 | 600,471 | 7,789 | |||||||||||||||||||||||||||
|
|
|
|
|
|
|
|
|
|
|
|
|
|
|
|
|
|
|
|||||||||||||||||||
|
Total domestic |
53,764,232 | 55,105,375 | 1,341,143 | 53,576,336 | 55,829,686 | 2,253,350 | 45,645,387 | 48,267,036 | 2,621,649 | |||||||||||||||||||||||||||
|
|
|
|
|
|
|
|
|
|
|
|
|
|
|
|
|
|
|
|||||||||||||||||||
|
Foreign: |
||||||||||||||||||||||||||||||||||||
|
U.S. Treasury and other U.S. government agencies bonds |
546,813 | 551,825 | 5,012 | 204,330 | 207,871 | 3,541 | 485,565 | 480,470 | (5,095 | ) | ||||||||||||||||||||||||||
|
Other governments and official institutions bonds |
406,551 | 419,403 | 12,852 | 497,174 | 508,425 | 11,251 | 786,616 | 790,951 | 4,335 | |||||||||||||||||||||||||||
|
Mortgage-backed securities |
1,182,554 | 1,193,627 | 11,073 | 1,426,238 | 1,455,246 | 29,008 | 1,205,344 | 1,165,948 | (39,396 | ) | ||||||||||||||||||||||||||
|
Other securities |
468,580 | 470,171 | 1,591 | 844,092 | 842,841 | (1,251 | ) | 1,178,728 | 1,181,247 | 2,519 | ||||||||||||||||||||||||||
|
|
|
|
|
|
|
|
|
|
|
|
|
|
|
|
|
|
|
|||||||||||||||||||
|
Total foreign |
2,604,498 | 2,635,026 | 30,528 | 2,971,834 | 3,014,383 | 42,549 | 3,656,253 | 3,618,616 | (37,637 | ) | ||||||||||||||||||||||||||
|
|
|
|
|
|
|
|
|
|
|
|
|
|
|
|
|
|
|
|||||||||||||||||||
|
Total |
¥ | 56,368,730 | ¥ | 57,740,401 | ¥ | 1,371,671 | ¥ | 56,548,170 | ¥ | 58,844,069 | ¥ | 2,295,899 | ¥ | 49,301,640 | ¥ | 51,885,652 | ¥ | 2,584,012 | ||||||||||||||||||
|
|
|
|
|
|
|
|
|
|
|
|
|
|
|
|
|
|
|
|||||||||||||||||||
|
Securities being held-to-maturity: |
||||||||||||||||||||||||||||||||||||
|
Domestic: |
||||||||||||||||||||||||||||||||||||
|
Japanese national government and Japanese government agency bonds |
¥ | 590,147 | ¥ | 594,517 | ¥ | 4,370 | ¥ | 232,881 | ¥ | 234,764 | ¥ | 1,883 | ¥ | 214,968 | ¥ | 215,838 | ¥ | 870 | ||||||||||||||||||
|
Other securities |
43,709 | 43,789 | 80 | 600 | 600 | — | 400 | 400 | — | |||||||||||||||||||||||||||
|
|
|
|
|
|
|
|
|
|
|
|
|
|
|
|
|
|
|
|||||||||||||||||||
|
Total domestic |
633,856 | 638,306 | 4,450 | 233,481 | 235,364 | 1,883 | 215,368 | 216,238 | 870 | |||||||||||||||||||||||||||
|
|
|
|
|
|
|
|
|
|
|
|
|
|
|
|
|
|
|
|||||||||||||||||||
|
Foreign: |
||||||||||||||||||||||||||||||||||||
|
U.S. Treasury and other U.S. government agencies bonds |
141,810 | 142,740 | 930 | 40,414 | 41,808 | 1,394 | 3,166 | 4,265 | 1,099 | |||||||||||||||||||||||||||
|
Other governments and official institutions bonds |
485,061 | 487,653 | 2,592 | 243,901 | 244,916 | 1,015 | 18,925 | 18,925 | — | |||||||||||||||||||||||||||
|
Other securities |
1,124,641 | 1,161,990 | 37,349 | 1,613,368 | 1,665,982 | 52,614 | 2,469,523 | 2,495,699 | 26,176 | |||||||||||||||||||||||||||
|
|
|
|
|
|
|
|
|
|
|
|
|
|
|
|
|
|
|
|||||||||||||||||||
|
Total foreign |
1,751,512 | 1,792,383 | 40,871 | 1,897,683 | 1,952,706 | 55,023 | 2,491,614 | 2,518,889 | 27,275 | |||||||||||||||||||||||||||
|
|
|
|
|
|
|
|
|
|
|
|
|
|
|
|
|
|
|
|||||||||||||||||||
|
Total |
¥ | 2,385,368 | ¥ | 2,430,689 | ¥ | 45,321 | ¥ | 2,131,164 | ¥ | 2,188,070 | ¥ | 56,906 | ¥ | 2,706,982 | ¥ | 2,735,127 | ¥ | 28,145 | ||||||||||||||||||
|
|
|
|
|
|
|
|
|
|
|
|
|
|
|
|
|
|
|
|||||||||||||||||||
Nonmarketable equity securities presented in Other investment securities in the accompanying consolidated financial statements were primarily carried at cost of ¥876,333 million, ¥864,052 million and ¥711,416 million, at March 31, 2012, 2013 and 2014, respectively. The corresponding fair values at those dates were not readily determinable. Investment securities held by certain subsidiaries subject to specialized industry accounting principles for investment companies and brokers and dealers presented in Other investment securities were carried at fair value of ¥33,432 million, ¥25,900 million and ¥26,201 million, at March 31, 2012, 2013 and 2014, respectively.
A-6
Table of Contents
The following table presents the book values, maturities and weighted average yields of investment securities available-for-sale and being held-to-maturity, excluding equity securities, at March 31, 2014. Weighted average yields are calculated based on amortized cost. Yields on tax-exempt obligations have not been calculated on a tax equivalent basis because the effect of such calculation would not be material:
|
Maturities within
one year |
Maturities after
one year but within five years |
Maturities after
five years but within ten years |
Maturities after
ten years |
Total | ||||||||||||||||||||||||||||||||||||
| Amount | Yield | Amount | Yield | Amount | Yield | Amount | Yield | Amount | Yield | |||||||||||||||||||||||||||||||
| (in millions, except percentages) | ||||||||||||||||||||||||||||||||||||||||
|
Securities available-for-sale: |
||||||||||||||||||||||||||||||||||||||||
|
Domestic: |
||||||||||||||||||||||||||||||||||||||||
|
Japanese national government and Japanese government agency bonds |
¥ | 14,937,054 | 0.08 | % | ¥ | 19,579,279 | 0.43 | % | ¥ | 5,505,150 | 0.69 | % | ¥ | 1,567,526 | 1.78 | % | ¥ | 41,589,009 | 0.39 | % | ||||||||||||||||||||
|
Corporate bonds |
230,318 | 1.32 | 804,001 | 0.83 | 200,849 | 0.63 | 29,792 | 2.13 | 1,264,960 | 0.92 | ||||||||||||||||||||||||||||||
|
Other securities |
288,018 | 0.47 | 218,357 | 1.01 | 71,743 | 0.65 | 22,353 | 1.38 | 600,471 | 0.72 | ||||||||||||||||||||||||||||||
|
|
|
|
|
|
|
|
|
|
|
|
|
|
|
|
|
|
|
|
|
|||||||||||||||||||||
|
Total domestic |
15,455,390 | 0.10 | 20,601,637 | 0.45 | 5,777,742 | 0.69 | 1,619,671 | 1.78 | 43,454,440 | 0.41 | ||||||||||||||||||||||||||||||
|
|
|
|
|
|
|
|
|
|
|
|
|
|
|
|
|
|
|
|
|
|||||||||||||||||||||
|
Foreign: |
||||||||||||||||||||||||||||||||||||||||
|
U.S. Treasury and other U.S. government agencies bonds |
30,313 | 2.13 | 304,111 | 1.23 | 146,046 | 1.64 | — | — | 480,470 | 1.41 | ||||||||||||||||||||||||||||||
|
Other governments and official institutions bonds |
213,086 | 1.41 | 338,017 | 2.44 | 234,535 | 2.71 | 5,313 | 4.82 | 790,951 | 2.26 | ||||||||||||||||||||||||||||||
|
Mortgage-backed securities |
215 | 4.30 | 4,502 | 2.50 | 67,592 | 1.95 | 1,093,639 | 2.46 | 1,165,948 | 2.43 | ||||||||||||||||||||||||||||||
|
Other securities |
200,118 | 1.58 | 529,324 | 1.99 | 189,079 | 1.76 | 238,091 | 2.04 | 1,156,612 | 1.89 | ||||||||||||||||||||||||||||||
|
|
|
|
|
|
|
|
|
|
|
|
|
|
|
|
|
|
|
|
|
|||||||||||||||||||||
|
Total foreign |
443,732 | 1.53 | 1,175,954 | 1.93 | 637,252 | 2.09 | 1,337,043 | 2.39 | 3,593,981 | 2.08 | ||||||||||||||||||||||||||||||
|
|
|
|
|
|
|
|
|
|
|
|
|
|
|
|
|
|
|
|
|
|||||||||||||||||||||
|
Total |
¥ | 15,899,122 | 0.14 | % | ¥ | 21,777,591 | 0.53 | % | ¥ | 6,414,994 | 0.83 | % | ¥ | 2,956,714 | 2.07 | % | ¥ | 47,048,421 | 0.54 | % | ||||||||||||||||||||
|
|
|
|
|
|
|
|
|
|
|
|
|
|
|
|
|
|
|
|
|
|||||||||||||||||||||
|
Securities being held-to-maturity: |
||||||||||||||||||||||||||||||||||||||||
|
Domestic: |
||||||||||||||||||||||||||||||||||||||||
|
Japanese national government and Japanese government agency bonds |
¥ | 190,011 | 0.49 | % | ¥ | 24,957 | 0.49 | % | ¥ | — | — | % | ¥ | — | — | % | ¥ | 214,968 | 0.49 | % | ||||||||||||||||||||
|
Other securities |
— | — | 400 | 0.75 | — | — | — | — | 400 | 0.75 | ||||||||||||||||||||||||||||||
|
|
|
|
|
|
|
|
|
|
|
|
|
|
|
|
|
|
|
|
|
|||||||||||||||||||||
|
Total domestic |
190,011 | 0.49 | 25,357 | 0.49 | — | — | — | — | 215,368 | 0.49 | ||||||||||||||||||||||||||||||
|
|
|
|
|
|
|
|
|
|
|
|
|
|
|
|
|
|
|
|
|
|||||||||||||||||||||
|
Foreign: |
||||||||||||||||||||||||||||||||||||||||
|
U.S. Treasury and other U.S. government agencies bonds |
— | — | — | — | 3,166 | 8.31 | — | — | 3,166 | 8.31 | ||||||||||||||||||||||||||||||
|
Other governments and official institutions bonds |
18,925 | 6.72 | — | — | — | — | — | — | 18,925 | 6.72 | ||||||||||||||||||||||||||||||
|
Other securities |
5,148 | 1.22 | 51,760 | 1.48 | 1,400,596 | 1.11 | 1,012,019 | 2.04 | 2,469,523 | 1.50 | ||||||||||||||||||||||||||||||
|
|
|
|
|
|
|
|
|
|
|
|
|
|
|
|
|
|
|
|
|
|||||||||||||||||||||
|
Total foreign |
24,073 | 5.54 | 51,760 | 1.48 | 1,403,762 | 1.13 | 1,012,019 | 2.04 | 2,491,614 | 1.55 | ||||||||||||||||||||||||||||||
|
|
|
|
|
|
|
|
|
|
|
|
|
|
|
|
|
|
|
|
|
|||||||||||||||||||||
|
Total |
¥ | 214,084 | 1.06 | % | ¥ | 77,117 | 1.15 | % | ¥ | 1,403,762 | 1.13 | % | ¥ | 1,012,019 | 2.04 | % | ¥ | 2,706,982 | 1.47 | % | ||||||||||||||||||||
|
|
|
|
|
|
|
|
|
|
|
|
|
|
|
|
|
|
|
|
|
|||||||||||||||||||||
Excluding U.S. Treasury and other U.S. government agencies bonds and Japanese national government bonds, none of the individual issuers held in our investment securities portfolio exceeded 10% of the consolidated total Mitsubishi UFJ Financial Group shareholders’ equity at March 31, 2014.
A-7
Table of Contents
| III. | Loan Portfolio |
The following table shows our loans outstanding, before deduction of allowance for credit losses, by domicile and industry of the borrower at March 31 of each of the five fiscal years ended March 31, 2014. Classification of loans by industry is based on the industry segment loan classification as defined by the Bank of Japan for regulatory reporting purposes and is not necessarily based on the use of proceeds:
| At March 31, | ||||||||||||||||||||
| 2010 | 2011 | 2012 | 2013 | 2014 | ||||||||||||||||
| (in millions) | ||||||||||||||||||||
|
Domestic: |
||||||||||||||||||||
|
Manufacturing |
¥ | 12,027,795 | ¥ | 11,248,033 | ¥ | 11,451,720 | ¥ | 11,767,352 | ¥ | 11,540,753 | ||||||||||
|
Construction |
1,427,933 | 1,280,899 | 1,155,926 | 1,056,276 | 980,877 | |||||||||||||||
|
Real estate |
12,261,588 | 11,660,798 | 11,035,029 | 11,143,777 | 10,989,562 | |||||||||||||||
|
Services |
3,714,148 | 3,417,689 | 3,239,688 | 2,881,666 | 2,693,561 | |||||||||||||||
|
Wholesale and retail |
8,597,192 | 8,443,580 | 8,492,234 | 8,330,553 | 8,475,143 | |||||||||||||||
|
Banks and other financial institutions (1) |
4,159,603 | 3,421,419 | 3,511,055 | 3,622,021 | 3,985,106 | |||||||||||||||
|
Communication and information services |
1,339,753 | 1,249,272 | 1,284,585 | 1,314,505 | 1,443,466 | |||||||||||||||
|
Other industries |
9,393,031 | 8,410,092 | 10,390,191 | 12,191,566 | 13,496,763 | |||||||||||||||
|
Consumer |
19,096,832 | 18,420,864 | 17,636,553 | 17,132,396 | 16,921,352 | |||||||||||||||
|
|
|
|
|
|
|
|
|
|
|
|||||||||||
|
Total domestic |
72,017,875 | 67,552,646 | 68,196,981 | 69,440,112 | 70,526,583 | |||||||||||||||
|
|
|
|
|
|
|
|
|
|
|
|||||||||||
|
Foreign: |
||||||||||||||||||||
|
Governments and official institutions |
490,376 | 516,637 | 554,933 | 673,548 | 811,475 | |||||||||||||||
|
Banks and other financial institutions (1) |
3,900,267 | 4,466,126 | 5,871,731 | 7,258,978 | 9,792,255 | |||||||||||||||
|
Commercial and industrial |
13,794,584 | 13,134,725 | 15,693,487 | 18,738,731 | 24,533,816 | |||||||||||||||
|
Other |
2,082,532 | 1,934,712 | 2,072,194 | 2,601,338 | 4,872,372 | |||||||||||||||
|
|
|
|
|
|
|
|
|
|
|
|||||||||||
|
Total foreign |
20,267,759 | 20,052,200 | 24,192,345 | 29,272,595 | 40,009,918 | |||||||||||||||
|
|
|
|
|
|
|
|
|
|
|
|||||||||||
|
Total |
92,285,634 | 87,604,846 | 92,389,326 | 98,712,707 | 110,536,501 | |||||||||||||||
|
Unearned income, unamortized premiums—net and deferred loan fees—net |
(99,724 | ) | (102,871 | ) | (91,083 | ) | (122,478 | ) | (260,090 | ) | ||||||||||
|
|
|
|
|
|
|
|
|
|
|
|||||||||||
|
Total (2) |
¥ | 92,185,910 | ¥ | 87,501,975 | ¥ | 92,298,243 | ¥ | 98,590,229 | ¥ | 110,276,411 | ||||||||||
|
|
|
|
|
|
|
|
|
|
|
|||||||||||
Notes:
| (1) | Loans to the so-called non-bank finance companies are generally included in “Banks and other financial institutions.” Non-bank finance companies are primarily engaged in consumer lending, factoring and credit card businesses. |
| (2) | The above table includes loans held for sale of ¥102,268 million, ¥65,162 million, ¥46,634 million, ¥35,261 million and ¥46,635 million at March 31, 2010, 2011, 2012, 2013 and 2014, respectively, which are carried at the lower of cost or fair value. |
A-8
Table of Contents
Maturities and Sensitivities of Loans to Changes in Interest Rates
The following table shows the maturities of our loan portfolio at March 31, 2014:
| Maturity | ||||||||||||||||
| One year or less | One to five years | Over five years | Total | |||||||||||||
| (in millions) | ||||||||||||||||
|
Domestic: |
||||||||||||||||
|
Manufacturing |
¥ | 7,011,961 | ¥ | 3,571,732 | ¥ | 957,060 | ¥ | 11,540,753 | ||||||||
|
Construction |
676,176 | 264,227 | 40,474 | 980,877 | ||||||||||||
|
Real estate |
2,471,744 | 4,260,429 | 4,257,389 | 10,989,562 | ||||||||||||
|
Services |
1,221,450 | 1,067,701 | 404,410 | 2,693,561 | ||||||||||||
|
Wholesale and retail |
5,852,693 | 2,074,391 | 548,059 | 8,475,143 | ||||||||||||
|
Banks and other financial institutions |
2,422,036 | 1,388,374 | 174,696 | 3,985,106 | ||||||||||||
|
Communication and information services |
437,430 | 539,569 | 466,467 | 1,443,466 | ||||||||||||
|
Other industries |
9,933,598 | 2,003,841 | 1,559,324 | 13,496,763 | ||||||||||||
|
Consumer |
2,206,736 | 3,554,048 | 11,160,568 | 16,921,352 | ||||||||||||
|
|
|
|
|
|
|
|
|
|||||||||
|
Total Domestic |
32,233,824 | 18,724,312 | 19,568,447 | 70,526,583 | ||||||||||||
|
|
|
|
|
|
|
|
|
|||||||||
|
Foreign |
15,112,594 | 15,930,407 | 8,966,917 | 40,009,918 | ||||||||||||
|
|
|
|
|
|
|
|
|
|||||||||
|
Total |
¥ | 47,346,418 | ¥ | 34,654,719 | ¥ | 28,535,364 | ¥ | 110,536,501 | ||||||||
|
|
|
|
|
|
|
|
|
|||||||||
The above loans due after one year which had predetermined interest rates and floating or adjustable interest rates at March 31, 2014 are shown below:
| Domestic | Foreign | Total | ||||||||||
| (in millions) | ||||||||||||
|
Predetermined rate |
¥ | 11,634,415 | ¥ | 3,176,182 | ¥ | 14,810,597 | ||||||
|
Floating or adjustable rate |
26,658,344 | 21,721,142 | 48,379,486 | |||||||||
|
|
|
|
|
|
|
|||||||
|
Total |
¥ | 38,292,759 | ¥ | 24,897,324 | ¥ | 63,190,083 | ||||||
|
|
|
|
|
|
|
|||||||
Nonaccrual, Past Due and Restructured Loans
We generally discontinue the accrual of interest income on loans when substantial doubt exists as to the full and timely collection of either principal or interest, when principal or interest is contractually past due one month or more with respect to loans within all classes of the Commercial segment, three months or more with respect to loans within the Card, MUAH, and Krungsri segments, and six months or more with respect to loans within the Residential segment.
Generally, accruing loans that are modified in a troubled debt restructuring (“TDR”) remain as accruing loans subsequent to the modification, and nonaccrual loans remain as nonaccrual. However, if a nonaccrual loan has been restructured as a TDR, the borrower is not delinquent under the restructured terms, and demonstrates that its financial condition has improved, we may reclassify the loan to accrual status. This determination is generally performed at least once a year through a detailed internal credit rating review process. Once a restructured nonaccrual loan is deemed to be a TDR, we will continue to designate the loan as a TDR even if the loan is reclassified to accrual status.
A-9
Table of Contents
The following table shows the distribution of our nonaccrual loans, restructured loans and accruing loans which are contractually past due 90 days or more as to principal or interest payments at March 31 of each of the five fiscal years ended March 31, 2014, based on the domicile and type of industry of the borrowers:
| At March 31, | ||||||||||||||||||||
| 2010 | 2011 | 2012 | 2013 | 2014 | ||||||||||||||||
| (in millions) | ||||||||||||||||||||
|
Nonaccrual loans: |
||||||||||||||||||||
|
Domestic: |
||||||||||||||||||||
|
Manufacturing |
¥ | 111,235 | ¥ | 137,987 | ¥ | 200,074 | ¥ | 213,181 | ¥ | 167,962 | ||||||||||
|
Construction |
33,449 | 48,479 | 40,098 | 37,530 | 30,202 | |||||||||||||||
|
Real estate |
214,367 | 152,317 | 127,824 | 205,959 | 154,766 | |||||||||||||||
|
Services |
79,517 | 76,597 | 86,015 | 87,103 | 72,851 | |||||||||||||||
|
Wholesale and retail |
135,523 | 172,712 | 237,977 | 250,241 | 212,356 | |||||||||||||||
|
Banks and other financial institutions |
2,322 | 7,238 | 7,802 | 13,993 | 7,234 | |||||||||||||||
|
Communication and information services |
73,615 | 33,198 | 33,418 | 32,125 | 24,956 | |||||||||||||||
|
Other industries |
116,741 | 37,335 | 49,212 | 43,585 | 36,861 | |||||||||||||||
|
Consumer |
355,040 | 321,823 | 288,402 | 269,641 | 227,476 | |||||||||||||||
|
|
|
|
|
|
|
|
|
|
|
|||||||||||
|
Total domestic |
1,121,809 | 987,686 | 1,070,822 | 1,153,358 | 934,664 | |||||||||||||||
|
|
|
|
|
|
|
|
|
|
|
|||||||||||
|
Foreign: |
||||||||||||||||||||
|
Governments and official institutions |
70,529 | 62,683 | 93 | 66 | 43 | |||||||||||||||
|
Banks and other financial institutions |
19,880 | 21,452 | 20,188 | 21,814 | 24,091 | |||||||||||||||
|
Commercial and industrial |
135,622 | 73,707 | 72,750 | 87,628 | 87,808 | |||||||||||||||
|
Other |
21,169 | 23,651 | 25,982 | 32,247 | 68,840 | |||||||||||||||
|
|
|
|
|
|
|
|
|
|
|
|||||||||||
|
Total foreign |
247,200 | 181,493 | 119,013 | 141,755 | 180,782 | |||||||||||||||
|
|
|
|
|
|
|
|
|
|
|
|||||||||||
|
Total |
¥ | 1,369,009 | ¥ | 1,169,179 | ¥ | 1,189,835 | ¥ | 1,295,113 | ¥ | 1,115,446 | ||||||||||
|
|
|
|
|
|
|
|
|
|
|
|||||||||||
|
Restructured loans: |
||||||||||||||||||||
|
Domestic |
¥ | 565,008 | ¥ | 800,620 | ¥ | 830,853 | ¥ | 847,728 | ¥ | 718,027 | ||||||||||
|
Foreign |
47,184 | 38,930 | 92,276 | 138,119 | 153,204 | |||||||||||||||
|
|
|
|
|
|
|
|
|
|
|
|||||||||||
|
Total |
¥ | 612,192 | ¥ | 839,550 | ¥ | 923,129 | ¥ | 985,847 | ¥ | 871,231 | ||||||||||
|
|
|
|
|
|
|
|
|
|
|
|||||||||||
|
Accruing loans contractually past due 90 days or more: |
||||||||||||||||||||
|
Domestic |
¥ | 25,871 | ¥ | 55,549 | ¥ | 65,446 | ¥ | 41,216 | ¥ | 47,759 | ||||||||||
|
Foreign (1) |
547 | 199 | 131 | 328 | 961 | |||||||||||||||
|
|
|
|
|
|
|
|
|
|
|
|||||||||||
|
Total |
¥ | 26,418 | ¥ | 55,748 | ¥ | 65,577 | ¥ | 41,544 | ¥ | 48,720 | ||||||||||
|
|
|
|
|
|
|
|
|
|
|
|||||||||||
|
Total (2) |
¥ | 2,007,619 | ¥ | 2,064,477 | ¥ | 2,178,541 | ¥ | 2,322,504 | ¥ | 2,035,397 | ||||||||||
|
|
|
|
|
|
|
|
|
|
|
|||||||||||
Notes:
| (1) | Foreign accruing loans contractually past due 90 days or more do not include ¥25,425 million, ¥12,827 million, ¥10,736 million and ¥13,068 million of FDIC covered loans held by MUAH which are subject to the guidance on loans and debt securities acquired with deteriorated credit quality at March 31, 2011, 2012, 2013 and 2014, respectively. |
| (2) | The sum of nonaccrual and restructured loans and accruing loans contractually past due 90 days or more includes large groups of smaller-balance homogenous loans that have not been modified and are collectively evaluated for impairment, and accruing loans contractually past due 90 days or more. However, these loans are excluded from the impaired loan balances of ¥2,200,766 million and ¥1,861,027 million, at March 31, 2013 and 2014, respectively, disclosed in Note 4 to our consolidated financial statements included elsewhere in this Annual Report. |
Gross interest income which would have been accrued at the original terms on domestic nonaccrual and restructured loans outstanding during the fiscal year ended March 31, 2014 was approximately ¥67.1 billion, of which ¥33.4 billion was included in the results of operations for the fiscal year. Gross interest income which would have been accrued at the original terms on foreign nonaccrual and restructured loans outstanding for the fiscal year ended March 31, 2014 was approximately ¥27.3 billion, of which ¥16.4 billion was included in the results of operations for the fiscal year.
A-10
Table of Contents
Potential Problem Loans
We do not have potential problem loans where known information about possible credit problems of borrowers causes management to have serious doubts as to the borrowers’ ability to comply with the present loan repayment terms that are not disclosed as nonaccrual, restructured loans and accruing loans past due 90 days or more.
Foreign Loans Outstanding
We had no cross-border outstandings to borrowers in any foreign country which in total exceeded 0.75% of consolidated total assets at March 31, 2012, 2013 and 2014. Cross-border outstandings are defined, for this purpose, as loans (including accrued interest), acceptances, interest-earning deposits with other banks, other interest-earning investments and any other monetary assets denominated in Japanese yen or other non-local currencies. Material local currency loans outstanding which are neither hedged nor funded by local currency borrowings are included in cross-border outstandings.
Guarantees of outstandings to borrowers domiciled in other countries are considered to be outstandings of the guarantor. Loans made to, or deposits placed with, a branch of a foreign bank located outside the foreign bank’s home country are considered to be loans to, or deposits with, the foreign bank. Outstandings of a country do not include principal or interest amounts of which are supported by written, legally enforceable guarantees by guarantors of other countries or the amounts of outstandings to the extent that they are secured by tangible, liquid collateral held and realizable by BTMU, MUTB and their subsidiaries outside the country in which they operate.
In addition to credit risk, cross-border outstandings are subject to country risk that as a result of political or economic conditions in a country, borrowers may be unable or unwilling to pay principal and interest according to contractual terms. Other risks related to cross-border outstandings include the possibility of insufficient foreign exchange and restrictions on its availability.
In order to manage country risk, we establish various risk management measures internally. Among other things, we regularly monitor economic conditions and other factors globally and assess country risk in each country where we have cross-border exposure. For purposes of monitoring and controlling the amount of credit exposed to country risk, we set a country limit, the maximum amount of credit exposure for an individual country, in consideration of the level of country risk and our ability to bear such potential risk. We also determine our credit policy for each country in accordance with our country risk level and our business plan with regard to the country. Assessment of country risk, establishment of country limits, and determination of country credit policies are subject to review and approval by our senior management and are updated periodically.
Loan Concentrations
At March 31, 2014, there were no concentrations of loans to a single industry group of borrowers, as defined by the Bank of Japan industry segment loan classifications, which exceeded 10% of our consolidated total loans, except for loans in a category disclosed in the table of loans outstanding above.
Credit Risk Management
We have a credit rating system, under which borrowers and transactions are graded on a worldwide basis. We calculate probability of default by statistical means and manage our credit portfolio based on this credit rating system. For a detailed description of this system and other elements of our risk management structure, see “Item 11. Quantitative and Qualitative Disclosures about Credit, Market and Other Risk—Credit Risk Management.”
A-11
Table of Contents
| IV. | Summary of Loan Loss Experience |
The following table shows an analysis of our loan loss experience by industry of the borrower for each of the five fiscal years ended March 31, 2014:
| Fiscal years ended March 31, | ||||||||||||||||||||
| 2010 | 2011 | 2012 | 2013 | 2014 | ||||||||||||||||
| (in millions, except percentages) | ||||||||||||||||||||
|
Allowance for credit losses at beginning of fiscal year |
¥ | 1,156,638 | ¥ | 1,315,615 | ¥ | 1,240,456 | ¥ | 1,285,507 | ¥ | 1,335,987 | ||||||||||
|
Provision (credit) for credit losses |
647,793 | 292,035 | 223,809 | 144,542 | (106,371 | ) | ||||||||||||||
|
Charge-offs: |
||||||||||||||||||||
|
Domestic: |
||||||||||||||||||||
|
Manufacturing |
41,933 | 32,162 | 35,577 | 21,510 | 52,579 | |||||||||||||||
|
Construction |
22,707 | 7,414 | 11,034 | 7,378 | 2,985 | |||||||||||||||
|
Real estate |
75,446 | 14,453 | 7,001 | 4,413 | 17,124 | |||||||||||||||
|
Services |
29,264 | 22,112 | 10,526 | 5,404 | 13,555 | |||||||||||||||
|
Wholesale and retail |
76,407 | 54,498 | 39,676 | 28,902 | 39,218 | |||||||||||||||
|
Banks and other financial institutions |
542 | 608 | 377 | 160 | 243 | |||||||||||||||
|
Communication and information services |
23,540 | 36,871 | 8,754 | 3,100 | 5,061 | |||||||||||||||
|
Other industries |
7,225 | 62,711 | 1,778 | 2,984 | 3,312 | |||||||||||||||
|
Consumer |
124,792 | 107,473 | 67,969 | 49,947 | 27,888 | |||||||||||||||
|
|
|
|
|
|
|
|
|
|
|
|||||||||||
|
Total domestic |
401,856 | 338,302 | 182,692 | 123,798 | 161,965 | |||||||||||||||
|
Total foreign |
118,916 | 47,468 | 34,107 | 20,739 | 29,133 | |||||||||||||||
|
|
|
|
|
|
|
|
|
|
|
|||||||||||
|
Total |
520,772 | 385,770 | 216,799 | 144,537 | 191,098 | |||||||||||||||
|
|
|
|
|
|
|
|
|
|
|
|||||||||||
|
Recoveries: |
||||||||||||||||||||
|
Domestic |
48,269 | 34,653 | 37,002 | 23,310 | 27,105 | |||||||||||||||
|
Foreign |
4,103 | 9,017 | 6,427 | 8,365 | 10,245 | |||||||||||||||
|
|
|
|
|
|
|
|
|
|
|
|||||||||||
|
Total |
52,372 | 43,670 | 43,429 | 31,675 | 37,350 | |||||||||||||||
|
|
|
|
|
|
|
|
|
|
|
|||||||||||
|
Net charge-offs |
468,400 | 342,100 | 173,370 |
|
112,862
|
|
153,748 | |||||||||||||
|
Others (1) |
(20,416 | ) | (25,094 | ) | (5,388 | ) | 18,800 | 18,552 | ||||||||||||
|
|
|
|
|
|
|
|
|
|
|
|||||||||||
|
Allowance for credit losses at end of fiscal year |
¥ | 1,315,615 | ¥ | 1,240,456 | ¥ | 1,285,507 | ¥ | 1,335,987 | ¥ | 1,094,420 | ||||||||||
|
|
|
|
|
|
|
|
|
|
|
|||||||||||
|
Allowance for credit losses applicable to foreign activities: |
||||||||||||||||||||
|
Balance at beginning of fiscal year |
¥ | 307,343 | ¥ | 327,568 | ¥ | 185,871 | ¥ | 170,812 | ¥ | 207,111 | ||||||||||
|
|
|
|
|
|
|
|
|
|
|
|||||||||||
|
Balance at end of fiscal year |
¥ | 327,568 | ¥ | 185,871 | ¥ | 170,812 | ¥ | 207,111 | ¥ | 184,460 | ||||||||||
|
|
|
|
|
|
|
|
|
|
|
|||||||||||
|
Provision (credit) for credit losses |
¥ | 134,966 | ¥ | (86,674 | ) | ¥ | 17,108 | ¥ | 30,859 | ¥ | (21,727 | ) | ||||||||
|
|
|
|
|
|
|
|
|
|
|
|||||||||||
|
Ratio of net charge-offs during the fiscal year to average loans outstanding during the fiscal year |
0.49 | % | 0.39 | % | 0.20 | % | 0.12 | % | 0.15 | % | ||||||||||
Note:
| (1) | Others principally include losses (gains) from foreign exchange translation. In addition, for the fiscal year ended March 31, 2010, others include adjustments related to restructuring of business operations. |
A-12
Table of Contents
The following table shows an allocation of our allowance for credit losses at March 31 of each of the five fiscal years ended March 31, 2014:
| At March 31, | ||||||||||||||||||||||||||||||||||||||||
| 2010 | 2011 | 2012 | 2013 | 2014 | ||||||||||||||||||||||||||||||||||||
| Amount |
% of
loans in each category to total loans |
Amount |
% of
loans in each category to total loans |
Amount |
% of
loans in each category to total loans |
Amount |
% of
loans in each category to total loans |
Amount |
% of
loans in each category to total loans |
|||||||||||||||||||||||||||||||
| (in millions, except percentages) | ||||||||||||||||||||||||||||||||||||||||
|
Domestic: |
||||||||||||||||||||||||||||||||||||||||
|
Manufacturing |
¥ | 177,753 | 13.03 | % | ¥ | 202,505 | 12.84 | % | ¥ | 252,397 | 12.40 | % | ¥ | 296,798 | 11.92 | % | ¥ | 239,461 | 10.44 | % | ||||||||||||||||||||
|
Construction |
31,764 | 1.55 | 41,012 | 1.46 | 29,663 | 1.25 | 32,396 | 1.07 | 25,447 | 0.89 | ||||||||||||||||||||||||||||||
|
Real estate |
112,154 | 13.29 | 98,873 | 13.31 | 91,195 | 11.92 | 91,046 | 11.29 | 81,685 | 9.94 | ||||||||||||||||||||||||||||||
|
Services |
88,435 | 4.02 | 92,336 | 3.90 | 92,921 | 3.51 | 82,220 | 2.92 | 69,511 | 2.44 | ||||||||||||||||||||||||||||||
|
Wholesale and retail |
148,637 | 9.32 | 197,296 | 9.64 | 245,101 | 9.19 | 258,161 | 8.44 | 207,281 | 7.67 | ||||||||||||||||||||||||||||||
|
Banks and other financial institutions |
20,015 | 4.51 | 26,505 | 3.91 | 23,928 | 3.83 | 28,895 | 3.67 | 21,110 | 3.61 | ||||||||||||||||||||||||||||||
|
Communication and information services |
67,273 | 1.45 | 32,570 | 1.43 | 28,795 | 1.39 | 27,775 | 1.33 | 20,196 | 1.31 | ||||||||||||||||||||||||||||||
|
Other industries |
110,545 | 10.18 | 58,539 | 9.60 | 70,112 | 11.25 | 68,530 | 12.35 | 59,770 | 12.20 | ||||||||||||||||||||||||||||||
|
Consumer |
213,889 | 20.69 | 280,665 | 21.02 | 270,088 | 19.08 | 233,531 | 17.36 | 177,384 | 15.30 | ||||||||||||||||||||||||||||||
|
Foreign: |
||||||||||||||||||||||||||||||||||||||||
|
Governments and official institutions |
70,017 | 0.53 | 28,406 | 0.59 | 26,800 | 0.60 | 30,377 | 0.68 | 28,599 | 0.73 | ||||||||||||||||||||||||||||||
|
Banks and other financial institutions |
29,030 | 4.23 | 26,853 | 5.10 | 24,454 | 6.36 | 26,869 | 7.35 | 26,921 | 8.86 | ||||||||||||||||||||||||||||||
|
Commercial and industrial |
203,611 | 14.94 | 114,352 | 14.99 | 107,899 | 16.98 | 137,780 | 18.98 | 119,204 | 22.20 | ||||||||||||||||||||||||||||||
|
Other |
24,910 | 2.26 | 16,260 | 2.21 | 11,659 | 2.24 | 12,085 | 2.64 | 9,736 | 4.41 | ||||||||||||||||||||||||||||||
|
Unallocated |
17,582 | — | 24,284 | — | 10,495 | — | 9,524 | — | 8,115 | — | ||||||||||||||||||||||||||||||
|
|
|
|
|
|
|
|
|
|
|
|
|
|
|
|
|
|
|
|
|
|||||||||||||||||||||
|
Total |
¥ | 1,315,615 | 100.00 | % | ¥ | 1,240,456 | 100.00 | % | ¥ | 1,285,507 | 100.00 | % | ¥ | 1,335,987 | 100.00 | % | ¥ | 1,094,420 | 100.00 | % | ||||||||||||||||||||
|
|
|
|
|
|
|
|
|
|
|
|
|
|
|
|
|
|
|
|
|
|||||||||||||||||||||
|
Allowance as a percentage of loans |
1.43 | % | 1.42 | % | 1.39 | % | 1.36 | % | 0.99 | % | ||||||||||||||||||||||||||||||
|
Allowance as a percentage of nonaccrual and restructured loans and accruing loans contractually past due 90 days or more |
65.53 | % | 60.09 | % | 59.01 | % | 57.52 | % | 53.77 | % | ||||||||||||||||||||||||||||||
While the allowance for credit losses contains amounts allocated to components of specifically identified loans as well as a group on a portfolio of loans, the allowance for credit losses covers the credit losses of the entire loan portfolio and the allocations shown above are not intended to be restricted to the specific loan category. Accordingly, as the evaluation of credit risks changes, allocations of the allowance will be adjusted to reflect current conditions and various other factors.
A-13
Table of Contents
| V. | Deposits |
The following table shows the average amount of, and the average rate paid on, the following deposit categories for the fiscal years ended March 31, 2012, 2013 and 2014:
| Fiscal years ended March 31, | ||||||||||||||||||||||||
| 2012 | 2013 | 2014 | ||||||||||||||||||||||
|
Average
amount |
Average
rate |
Average
amount |
Average
rate |
Average
amount |
Average
rate |
|||||||||||||||||||
| (in millions, except percentages) | ||||||||||||||||||||||||
|
Domestic offices: |
||||||||||||||||||||||||
|
Non-interest-bearing demand deposits |
¥ | 13,787,387 | — | % | ¥ | 14,184,561 | — | % | ¥ | 14,806,715 | — | % | ||||||||||||
|
Interest-bearing demand deposits |
49,780,056 | 0.02 | 51,319,383 | 0.02 | 54,341,944 | 0.02 | ||||||||||||||||||
|
Deposits at notice |
1,360,019 | 0.06 | 1,224,245 | 0.02 | 1,165,323 | 0.03 | ||||||||||||||||||
|
Time deposits |
41,594,652 | 0.20 | 41,664,771 | 0.14 | 41,571,358 | 0.12 | ||||||||||||||||||
|
Certificates of deposit |
5,218,531 | 0.13 | 5,675,633 | 0.13 | 5,775,861 | 0.10 | ||||||||||||||||||
|
Foreign offices: |
||||||||||||||||||||||||
|
Non-interest-bearing demand deposits |
2,505,338 | — | 2,794,262 | — | 3,832,932 | — | ||||||||||||||||||
|
Interest-bearing deposits, principally time deposits and certificates of deposit |
19,678,674 | 0.65 | 23,436,714 | 0.57 | 30,453,791 | 0.53 | ||||||||||||||||||
|
|
|
|
|
|
|
|||||||||||||||||||
|
Total |
¥ | 133,924,657 | ¥ | 140,299,569 | ¥ | 151,947,924 | ||||||||||||||||||
|
|
|
|
|
|
|
|||||||||||||||||||
Deposits at notice represent interest-bearing demand deposits which require the depositor to give two or more days notice in advance of withdrawal.
The average amounts of total deposits by foreign depositors included in domestic offices for the fiscal years ended March 31, 2012, 2013 and 2014 were ¥457,525 million, ¥785,562 million and ¥558,229 million, respectively.
At March 31, 2014, the balances and remaining maturities of time deposits and certificates of deposit issued by domestic offices in amounts of ¥10 million (approximately U.S.$97 thousand at the Federal Reserve Bank of New York’s noon buying rate on March 31, 2014) or more and total foreign deposits issued in amounts of U.S.$100,000 or more are shown in the following table:
|
Time
deposits |
Certificates of
deposit |
Total | ||||||||||
| (in millions) | ||||||||||||
|
Domestic offices: |
||||||||||||
|
Three months or less |
¥ | 8,079,015 | ¥ | 4,384,075 | ¥ | 12,463,090 | ||||||
|
Over three months through six months |
5,659,091 | 792,729 | 6,451,820 | |||||||||
|
Over six months through twelve months |
4,493,860 | 289,469 | 4,783,329 | |||||||||
|
Over twelve months |
3,710,866 | 146,282 | 3,857,148 | |||||||||
|
|
|
|
|
|
|
|||||||
|
Total |
¥ | 21,942,832 | ¥ | 5,612,555 | ¥ | 27,555,387 | ||||||
|
|
|
|
|
|
|
|||||||
|
Foreign offices |
¥ | 26,026,728 | ||||||||||
|
|
|
|||||||||||
A-14
Table of Contents
| VI. | Short-Term Borrowings |
The following table shows certain additional information with respect to our short-term borrowings for the fiscal years ended March 31, 2012, 2013 and 2014:
| Fiscal years ended March 31, | ||||||||||||
| 2012 | 2013 | 2014 | ||||||||||
| (in millions, except percentages) | ||||||||||||
|
Call money, funds purchased, and payables under repurchase agreements and securities lending transactions: |
||||||||||||
|
Average balance outstanding during the fiscal year |
¥ | 21,511,773 | ¥ | 24,232,422 | ¥ | 28,448,106 | ||||||
|
Maximum balance outstanding at any month-end during the fiscal year |
22,618,035 | 25,868,941 | 33,513,317 | |||||||||
|
Balance at end of fiscal year |
21,347,850 | 23,703,926 | 30,206,245 | |||||||||
|
Weighted average interest rate during the fiscal year |
0.44 | % | 0.26 | % | 0.16 | % | ||||||
|
Weighted average interest rate on balance at end of fiscal year |
0.30 | % | 0.18 | % | 0.11 | % | ||||||
|
Due to trust account: |
||||||||||||
|
Average balance outstanding during the fiscal year |
¥ | 608,061 | ¥ | 590,150 | ¥ | 506,466 | ||||||
|
Maximum balance outstanding at any month-end during the fiscal year |
1,117,699 | 661,633 | 750,210 | |||||||||
|
Balance at end of fiscal year |
627,331 | 633,029 | 750,210 | |||||||||
|
Weighted average interest rate during the fiscal year |
0.11 | % | 0.11 | % | 0.10 | % | ||||||
|
Weighted average interest rate on balance at end of fiscal year |
0.08 | % | 0.09 | % | 0.08 | % | ||||||
|
Other short-term borrowings: |
||||||||||||
|
Average balance outstanding during the fiscal year |
¥ | 10,059,100 | ¥ | 10,540,612 | ¥ | 11,897,255 | ||||||
|
Maximum balance outstanding at any month-end during the fiscal year |
12,103,569 | 11,608,598 | 12,264,988 | |||||||||
|
Balance at end of fiscal year |
10,881,525 | 11,608,598 | 11,106,071 | |||||||||
|
Weighted average interest rate during the fiscal year |
0.28 | % | 0.21 | % | 0.19 | % | ||||||
|
Weighted average interest rate on balance at end of fiscal year |
0.23 | % | 0.20 | % | 0.25 | % | ||||||
A-15
Table of Contents
CONSOLIDATED FINANCIAL STATEMENTS
| Page | ||||
| F-3 | ||||
| F-4 | ||||
|
Consolidated Statements of Income for the Fiscal Years ended March 31, 2012, 2013 and 2014 |
F-6 | |||
| F-8 | ||||
|
Consolidated Statements of Equity for the Fiscal Years ended March 31, 2012, 2013 and 2014 |
F-9 | |||
|
Consolidated Statements of Cash Flows for the Fiscal Years ended March 31, 2012, 2013 and 2014 |
F-11 | |||
| F-13 | ||||
|
1. Basis of Financial Statements and Summary of Significant Accounting Policies |
F-13 | |||
| F-29 | ||||
| F-34 | ||||
| F-42 | ||||
| F-59 | ||||
| F-60 | ||||
| F-62 | ||||
| F-67 | ||||
| F-69 | ||||
| F-69 | ||||
| F-70 | ||||
| F-70 | ||||
| F-73 | ||||
| F-86 | ||||
|
15. Offsetting of Derivatives, Repurchase Agreements, and Securities Lending Transactions |
F-88 | |||
| F-89 | ||||
| F-91 | ||||
| F-92 | ||||
| F-94 | ||||
| F-98 | ||||
| F-98 | ||||
|
22. Earnings per Common Share Applicable to Common Shareholders of MUFG |
F-104 | |||
| F-105 | ||||
|
24. Obligations Under Guarantees and Other Off-balance Sheet Instruments |
F-112 | |||
| F-117 | ||||
| F-127 | ||||
| F-129 | ||||
| F-129 | ||||
| F-130 | ||||
| F-133 | ||||
| F-135 | ||||
| F-157 | ||||
| F-160 | ||||
|
34. SEC Registered Funding Vehicles Issuing Non-dilutive Preferred Securities |
F-162 | |||
| F-163 | ||||
F-1
Table of Contents
(This page is intentionally left blank)
F-2
Table of Contents
REPORT OF INDEPENDENT REGISTERED PUBLIC ACCOUNTING FIRM
To the Board of Directors and Shareholders of
Mitsubishi UFJ Financial Group, Inc.
(Kabushiki Kaisha Mitsubishi UFJ Financial Group):
We have audited the accompanying consolidated balance sheets of Mitsubishi UFJ Financial Group, Inc. (Kabushiki Kaisha Mitsubishi UFJ Financial Group) (“MUFG”) and subsidiaries (together, the “MUFG Group”) as of March 31, 2013 and 2014, and the related consolidated statements of income, comprehensive income, equity and cash flows for each of the three years in the period ended March 31, 2014 (all expressed in Japanese Yen). These financial statements are the responsibility of the MUFG Group’s management. Our responsibility is to express an opinion on these financial statements based on our audits.
We conducted our audits in accordance with the standards of the Public Company Accounting Oversight Board (United States). Those standards require that we plan and perform the audit to obtain reasonable assurance about whether the financial statements are free of material misstatement. An audit includes examining, on a test basis, evidence supporting the amounts and disclosures in the financial statements. An audit also includes assessing the accounting principles used and significant estimates made by management, as well as evaluating the overall financial statement presentation. We believe that our audits provide a reasonable basis for our opinion.
In our opinion, such consolidated financial statements present fairly, in all material respects, the financial position of MUFG and subsidiaries as of March 31, 2013 and 2014, and the results of their operations and their cash flows for each of the three years in the period ended March 31, 2014, in conformity with accounting principles generally accepted in the United States of America.
We have also audited, in accordance with the standards of the Public Company Accounting Oversight Board (United States), the MUFG Group’s internal control over financial reporting as of March 31, 2014, based on the criteria established in Internal Control—Integrated Framework (1992) issued by the Committee of Sponsoring Organizations of the Treadway Commission and our report dated July 18, 2014 expressed an unqualified opinion on the MUFG Group’s internal control over financial reporting.
/s/ Deloitte Touche Tohmatsu LLC
Tokyo, Japan
July 18, 2014
F-3
Table of Contents
MITSUBISHI UFJ FINANCIAL GROUP, INC. AND SUBSIDIARIES
CONSOLIDATED BALANCE SHEETS
MARCH 31, 2013 AND 2014
| (in millions) | 2013 | 2014 | ||||||
|
ASSETS |
||||||||
|
Cash and due from banks (Note 8) |
¥ | 3,619,253 | ¥ | 3,689,228 | ||||
|
Interest-earning deposits in other banks (Notes 8 and 31) |
8,111,887 | 20,500,676 | ||||||
|
Call loans and funds sold (Note 10) |
618,596 | 919,132 | ||||||
|
Receivables under resale agreements (Notes 15 and 31) |
5,659,512 | 7,300,037 | ||||||
|
Receivables under securities borrowing transactions (Note 15) |
2,615,172 | 4,210,057 | ||||||
|
Trading account assets (including assets pledged that secured parties are permitted to sell or repledge of ¥11,847,846 and ¥12,984,404 in 2013 and 2014) (including ¥16,290,536 and ¥18,251,847 measured at fair value under fair value option in 2013 and 2014) (Notes 8, 15, 23 and 31) |
40,826,384 | 40,646,275 | ||||||
|
Investment securities (Notes 3, 8 and 31): |
||||||||
|
Securities available-for-sale—carried at fair value (including assets pledged that secured parties are permitted to sell or repledge of ¥1,974,928 and ¥3,053,872 in 2013 and 2014) |
58,844,069 | 51,885,652 | ||||||
|
Securities being held-to-maturity—carried at amortized cost (including assets pledged that secured parties are permitted to sell or repledge of ¥300,821 and ¥110,100 in 2013 and 2014) (fair value of ¥2,188,070 and ¥2,735,127 in 2013 and 2014) |
2,131,164 | 2,706,982 | ||||||
|
Other investment securities |
889,952 | 737,617 | ||||||
|
|
|
|
|
|||||
|
Total investment securities |
61,865,185 | 55,330,251 | ||||||
|
|
|
|
|
|||||
|
Loans, net of unearned income, unamortized premiums and deferred loan fees (including assets pledged that secured parties are permitted to sell or repledge of ¥1,952,868 and ¥1,608,498 in 2013 and 2014) (Notes 4 and 8) |
98,590,229 | 110,276,411 | ||||||
|
Allowance for credit losses (Note 4) |
(1,335,987 | ) | (1,094,420 | ) | ||||
|
|
|
|
|
|||||
|
Net loans |
97,254,242 | 109,181,991 | ||||||
|
|
|
|
|
|||||
|
Premises and equipment—net (Note 5) |
1,059,054 | 1,236,648 | ||||||
|
Accrued interest |
255,192 | 277,222 | ||||||
|
Customers’ acceptance liability |
90,216 | 126,838 | ||||||
|
Intangible assets—net (Notes 2 and 6) |
866,153 | 1,133,354 | ||||||
|
Goodwill (Notes 2 and 6) |
417,956 | 728,515 | ||||||
|
Deferred tax assets (Notes 7 and 14) |
514,679 | 362,267 | ||||||
|
Other assets (including ¥3,006 and ¥2,000 measured at fair value under fair value option in 2013 and 2014) (Notes 8, 13, 14 and 31) |
6,785,795 | 8,018,586 | ||||||
|
|
|
|
|
|||||
|
Total assets |
¥ | 230,559,276 | ¥ | 253,661,077 | ||||
|
|
|
|
|
|||||
|
Assets of consolidated VIEs included in total assets above that can be used only to settle obligations of consolidated VIEs (Note 25) |
||||||||
|
Cash and due from banks |
¥ | 2,692 | ¥ | 3,167 | ||||
|
Interest-earning deposits in other banks |
26,087 | 33,158 | ||||||
|
Trading account assets |
2,376,590 | 2,219,754 | ||||||
|
Investment securities |
701,873 | 867,779 | ||||||
|
Loans |
6,814,877 | 7,019,653 | ||||||
|
All other assets |
254,978 | 236,131 | ||||||
|
|
|
|
|
|||||
|
Total assets of consolidated VIEs |
¥ | 10,177,097 | ¥ | 10,379,642 | ||||
|
|
|
|
|
|||||
F-4
Table of Contents
MITSUBISHI UFJ FINANCIAL GROUP, INC. AND SUBSIDIARIES
CONSOLIDATED BALANCE SHEETS—(Continued)
MARCH 31, 2013 AND 2014
| (in millions, except shares) | 2013 | 2014 | ||||||
| LIABILITIES AND EQUITY | ||||||||
|
Deposits (Notes 8 and 9): |
||||||||
|
Domestic offices: |
||||||||
|
Non-interest-bearing |
¥ | 15,327,957 | ¥ | 16,644,469 | ||||
|
Interest-bearing |
103,003,820 | 104,860,603 | ||||||
|
Overseas offices: |
||||||||
|
Non-interest-bearing |
3,481,750 | 4,478,271 | ||||||
|
Interest-bearing |
26,396,212 | 36,534,443 | ||||||
|
|
|
|
|
|||||
|
Total deposits |
148,209,739 | 162,517,786 | ||||||
|
|
|
|
|
|||||
|
Call money and funds purchased (Notes 8 and 10) |
4,010,582 | 3,417,455 | ||||||
|
Payables under repurchase agreements (Notes 8 and 15) |
15,700,394 | 21,268,072 | ||||||
|
Payables under securities lending transactions (Notes 8 and 15) |
3,992,950 | 5,520,718 | ||||||
|
Due to trust account (Note 11) |
633,029 | 750,210 | ||||||
|
Other short-term borrowings (including ¥5,041 and ¥28,875 measured at fair value under fair value option in 2013 and 2014) (Notes 8, 12 and 31) |
11,608,598 | 11,106,071 | ||||||
|
Trading account liabilities (Notes 15, 23 and 31) |
14,969,482 | 11,981,978 | ||||||
|
Obligations to return securities received as collateral (Notes 15 and 31) |
3,034,547 | 3,971,454 | ||||||
|
Bank acceptances outstanding |
90,216 | 126,838 | ||||||
|
Accrued interest |
136,712 | 143,362 | ||||||
|
Long-term debt (including ¥564,845 and ¥687,927 measured at fair value under fair value option in 2013 and 2014) (Notes 8, 12 and 31) |
12,182,358 | 14,498,678 | ||||||
|
Other liabilities (Notes 1, 7, 8, 13, 14 and 26) |
5,048,689 | 5,607,011 | ||||||
|
|
|
|
|
|||||
|
Total liabilities |
219,617,296 | 240,909,633 | ||||||
|
|
|
|
|
|||||
|
Commitments and contingent liabilities (Notes 24 and 26) |
||||||||
|
Mitsubishi UFJ Financial Group shareholders’ equity (Note 21): |
||||||||
|
Capital stock (Notes 16 and 17): |
||||||||
|
Preferred stock—aggregate liquidation preference of ¥390,001 in 2013 and 2014, with no stated value |
442,100 | 442,100 | ||||||
|
Common stock—authorized, 33,000,000,000 shares; issued, 14,158,585,720 shares and 14,164,026,420 shares in 2013 and 2014, with no stated value |
1,646,035 | 1,647,145 | ||||||
|
Capital surplus (Note 17) |
6,348,133 | 6,363,413 | ||||||
|
Retained earnings (Notes 18 and 35): |
||||||||
|
Appropriated for legal reserve |
239,571 | 239,571 | ||||||
|
Unappropriated retained earnings |
1,361,620 | 2,157,639 | ||||||
|
Accumulated other comprehensive income, net of taxes (Note 19) |
574,347 | 1,357,682 | ||||||
|
Treasury stock, at cost—4,374,857 common shares and 3,389,416 common shares in 2013 and 2014 |
(3,011 | ) | (2,510 | ) | ||||
|
|
|
|
|
|||||
|
Total Mitsubishi UFJ Financial Group shareholders’ equity |
10,608,795 | 12,205,040 | ||||||
|
Noncontrolling interests (Note 20) |
333,185 | 546,404 | ||||||
|
|
|
|
|
|||||
|
Total equity |
10,941,980 | 12,751,444 | ||||||
|
|
|
|
|
|||||
|
Total liabilities and equity |
¥ | 230,559,276 | ¥ | 253,661,077 | ||||
|
|
|
|
|
|||||
|
Liabilities of consolidated VIEs for which creditors or beneficial interest holders do not have recourse to the general credit of Mitsubishi UFJ Financial Group (Note 25) |
||||||||
|
Other short-term borrowings |
¥ | 39,773 | ¥ | 44,221 | ||||
|
Long-term debt |
1,166,694 | 966,838 | ||||||
|
All other liabilities |
378,679 | 259,404 | ||||||
|
|
|
|
|
|||||
|
Total liabilities of consolidated VIEs |
¥ | 1,585,146 | ¥ | 1,270,463 | ||||
|
|
|
|
|
|||||
See the accompanying notes to Consolidated Financial Statements.
F-5
Table of Contents
MITSUBISHI UFJ FINANCIAL GROUP, INC. AND SUBSIDIARIES
FOR THE FISCAL YEARS ENDED MARCH 31, 2012, 2013 AND 2014
| (in millions) | 2012 | 2013 | 2014 | |||||||||
|
Interest income: |
||||||||||||
|
Loans, including fees (Note 4) |
¥ | 1,595,097 | ¥ | 1,577,770 | ¥1,663,742 | |||||||
|
Deposits in other banks |
39,963 | 27,304 | 47,056 | |||||||||
|
Investment securities: |
||||||||||||
|
Interest |
307,812 | 266,640 | 229,732 | |||||||||
|
Dividends |
104,634 | 104,187 | 112,605 | |||||||||
|
Gain on conversion rate adjustment of convertible preferred stock (Note 2) |
139,320 | — | — | |||||||||
|
Trading account assets |
315,742 | 394,788 | 407,415 | |||||||||
|
Call loans and funds sold |
6,918 | 7,046 | 10,074 | |||||||||
|
Receivables under resale agreements and securities borrowing transactions |
86,470 | 49,786 | 51,659 | |||||||||
|
|
|
|
|
|
|
|||||||
|
Total |
2,595,956 | 2,427,521 | 2,522,283 | |||||||||
|
|
|
|
|
|
|
|||||||
|
Interest expense: |
||||||||||||
|
Deposits |
228,858 | 212,067 | 226,655 | |||||||||
|
Call money and funds purchased |
8,157 | 6,961 | 6,841 | |||||||||
|
Payables under repurchase agreements and securities lending transactions |
86,947 | 56,862 | 39,329 | |||||||||
|
Due to trust account |
647 | 665 | 519 | |||||||||
|
Other short-term borrowings and trading account liabilities |
61,657 | 52,342 | 57,501 | |||||||||
|
Long-term debt |
253,873 | 227,521 | 230,127 | |||||||||
|
|
|
|
|
|
|
|||||||
|
Total |
640,139 | 556,418 | 560,972 | |||||||||
|
|
|
|
|
|
|
|||||||
|
Net interest income |
1,955,817 | 1,871,103 | 1,961,311 | |||||||||
|
Provision (credit) for credit losses (Note 4) |
223,809 | 144,542 | (106,371 | ) | ||||||||
|
|
|
|
|
|
|
|||||||
|
Net interest income after provision (credit) for credit losses |
1,732,008 | 1,726,561 | 2,067,682 | |||||||||
|
|
|
|
|
|
|
|||||||
|
Non-interest income: |
||||||||||||
|
Fees and commissions income (Note 27) |
1,099,963 | 1,160,874 | 1,294,116 | |||||||||
|
Foreign exchange gains (losses)—net (Note 28) |
34,302 | (38,955 | ) | (61,755 | ) | |||||||
|
Trading account profits (losses)—net (Note 28) |
667,285 | 570,276 | (33,886 | ) | ||||||||
|
Investment securities gains—net (Note 3) (1) |
19,384 | 155,957 | 303,520 | |||||||||
|
Equity in earnings (losses) of equity method investees—net (Notes 2
|
(499,427 | ) | 60,210 | 110,520 | ||||||||
|
Gains on sales of loans (Note 4) |
15,645 | 14,773 | 17,680 | |||||||||
|
Government grant for transfer of substitutional portion of Employees’ Pension Fund Plans (Note 13) |
— | — | 115,210 | |||||||||
|
Other non-interest income (Note 20) |
103,424 | 144,774 | 75,676 | |||||||||
|
|
|
|
|
|
|
|||||||
|
Total |
1,440,576 | 2,067,909 | 1,821,081 | |||||||||
|
|
|
|
|
|
|
|||||||
|
Non-interest expense: |
||||||||||||
|
Salaries and employee benefits (Note 13) |
900,144 | 932,399 | 1,029,580 | |||||||||
|
Occupancy expenses—net (Notes 5 and 26) |
150,808 | 151,138 | 158,393 | |||||||||
|
Fees and commission expenses |
204,734 | 209,782 | 222,038 | |||||||||
|
Outsourcing expenses, including data processing |
191,089 | 198,134 | 216,737 | |||||||||
|
Depreciation of premises and equipment (Note 5) |
94,777 | 94,035 | 103,714 | |||||||||
|
Amortization of intangible assets (Note 6) |
212,229 | 207,568 | 198,147 | |||||||||
|
Impairment of intangible assets (Note 6) |
30,986 | 3,378 | 312 | |||||||||
|
Insurance premiums, including deposit insurance |
115,376 | 98,711 | 101,135 | |||||||||
|
Communications |
49,276 | 47,095 | 50,868 | |||||||||
|
Taxes and public charges |
65,641 | 66,862 | 69,457 | |||||||||
|
Other non-interest expenses (Notes 2, 4, 5, 6, 20 and 26) |
307,582 | 369,497 | 317,939 | |||||||||
|
|
|
|
|
|
|
|||||||
|
Total |
2,322,642 | 2,378,599 | 2,468,320 | |||||||||
|
|
|
|
|
|
|
|||||||
F-6
Table of Contents
MITSUBISHI UFJ FINANCIAL GROUP, INC. AND SUBSIDIARIES
CONSOLIDATED STATEMENTS OF INCOME—(Continued)
FOR THE FISCAL YEARS ENDED MARCH 31, 2012, 2013 AND 2014
| (in millions, except per share amount) | 2012 | 2013 | 2014 | |||||||||
|
Income before income tax expense |
849,942 | 1,415,871 | 1,420,443 | |||||||||
|
Income tax expense (Note 7) |
429,191 | 296,020 | 337,917 | |||||||||
|
|
|
|
|
|
|
|||||||
|
Net income before attribution of noncontrolling interests |
420,751 | 1,119,851 | 1,082,526 | |||||||||
|
Net income attributable to noncontrolling interests |
4,520 | 50,727 | 67,133 | |||||||||
|
|
|
|
|
|
|
|||||||
|
Net income attributable to Mitsubishi UFJ Financial Group |
¥ | 416,231 | ¥ | 1,069,124 | ¥ | 1,015,393 | ||||||
|
|
|
|
|
|
|
|||||||
|
Income allocated to preferred shareholders: |
||||||||||||
|
Cash dividends paid |
¥ | 17,940 | ¥ | 17,940 | ¥ | 17,940 | ||||||
|
Changes in a foreign affiliated company’s interests in its subsidiary |
— | — | 3,301 | |||||||||
|
|
|
|
|
|
|
|||||||
|
Earnings applicable to common shareholders of Mitsubishi UFJ Financial Group |
¥ | 398,291 | ¥ | 1,051,184 | ¥ | 994,152 | ||||||
|
|
|
|
|
|
|
|||||||
|
Earnings per common share applicable to common shareholders of Mitsubishi UFJ Financial Group (Notes 18 and 22): |
||||||||||||
|
Basic earnings per common share—Earnings applicable to common shareholders of Mitsubishi UFJ Financial Group |
¥ | 28.17 | ¥ | 74.30 | ¥ | 70.21 | ||||||
|
Diluted earnings per common share—Earnings applicable to common shareholders of Mitsubishi UFJ Financial Group |
28.09 | 74.16 | 69.98 | |||||||||
|
(1) The following credit losses are included in Investment securities gains—net: |
||||||||||||
| (in millions) | 2012 | 2013 | 2014 | |||||||||
|
Decline in fair value |
¥ | 11,704 | ¥ | 7,457 | ¥ | 2,321 | ||||||
|
Other comprehensive income—net |
2,078 | 872 | 284 | |||||||||
|
|
|
|
|
|
|
|||||||
|
Total credit losses |
¥ | 13,782 | ¥ | 8,329 | ¥ | 2,605 | ||||||
|
|
|
|
|
|
|
|||||||
See the accompanying notes to Consolidated Financial Statements.
F-7
Table of Contents
MITSUBISHI UFJ FINANCIAL GROUP, INC. AND SUBSIDIARIES
CONSOLIDATED STATEMENTS OF COMPREHENSIVE INCOME
FOR THE FISCAL YEARS ENDED MARCH 31, 2012, 2013 AND 2014
| (in millions) | 2012 | 2013 | 2014 | |||||||||
|
Net income before attribution of noncontrolling interests |
¥ | 420,751 | ¥ | 1,119,851 | ¥ | 1,082,526 | ||||||
|
Other comprehensive income (loss), net of tax (Note 19): |
||||||||||||
|
Net unrealized gains on investment securities (1) |
174,839 | 628,470 | 141,519 | |||||||||
|
Net unrealized gains (losses) on derivatives qualifying for cash flow hedges |
437 | 3,423 | (361 | ) | ||||||||
|
Defined benefit plans |
(94,215 | ) | 79,997 | 117,648 | ||||||||
|
Foreign currency translation adjustments |
(49,543 | ) | 467,259 | 508,130 | ||||||||
|
|
|
|
|
|
|
|||||||
|
Total |
31,518 | 1,179,149 | 766,936 | |||||||||
|
|
|
|
|
|
|
|||||||
|
Comprehensive income |
452,269 | 2,299,000 | 1,849,462 | |||||||||
|
Net income attributable to noncontrolling interests |
4,520 | 50,727 | 67,133 | |||||||||
|
Other comprehensive income (loss) attributable to noncontrolling interests |
(743 | ) | 8,402 | (16,399 | ) | |||||||
|
|
|
|
|
|
|
|||||||
|
Comprehensive income attributable to Mitsubishi UFJ Financial Group |
¥ | 448,492 | ¥ | 2,239,871 | ¥ | 1,798,728 | ||||||
|
|
|
|
|
|
|
|||||||
| (1) | Includes unrealized gains of ¥1,234 million, ¥555 million and ¥183 million, net of tax, related to debt securities with credit component realized in earnings for the fiscal years ended March 31, 2012, 2013 and 2014, respectively. |
See the accompanying notes to Consolidated Financial Statements.
F-8
Table of Contents
MITSUBISHI UFJ FINANCIAL GROUP, INC. AND SUBSIDIARIES
CONSOLIDATED STATEMENTS OF EQUITY
FOR THE FISCAL YEARS ENDED MARCH 31, 2012, 2013 AND 2014
| (in millions, except per share amount) | 2012 | 2013 | 2014 | |||||||||
|
Preferred stock (Note 16): |
||||||||||||
|
Balance at beginning of fiscal year |
¥ | 442,100 | ¥ | 442,100 | ¥ | 442,100 | ||||||
|
|
|
|
|
|
|
|||||||
|
Balance at end of fiscal year |
¥ | 442,100 | ¥ | 442,100 | ¥ | 442,100 | ||||||
|
|
|
|
|
|
|
|||||||
|
Common stock (Note 17): |
||||||||||||
|
Balance at beginning of fiscal year |
¥ | 1,644,132 | ¥ | 1,645,144 | ¥ | 1,646,035 | ||||||
|
Issuance of new shares of common stock by way of exercise of stock acquisition rights |
1,012 | 891 | 1,110 | |||||||||
|
|
|
|
|
|
|
|||||||
|
Balance at end of fiscal year |
¥ | 1,645,144 | ¥ | 1,646,035 | ¥ | 1,647,145 | ||||||
|
|
|
|
|
|
|
|||||||
|
Capital surplus (Note 17): |
||||||||||||
|
Balance at beginning of fiscal year |
¥ | 6,395,705 | ¥ | 6,378,619 | ¥ | 6,348,133 | ||||||
|
Stock-based compensation expense (Note 32) |
1,370 | 1,233 | 129 | |||||||||
|
Issuance of new shares of common stock by way of exercise of stock acquisition rights |
1,010 | 889 | 1,108 | |||||||||
|
Issuance of new shares of Mitsubishi UFJ Morgan Stanley Securities Co., Ltd. (Note 2) |
(20,000 | ) | — | — | ||||||||
|
Purchase of shares of Mitsubishi UFJ Merrill Lynch PB Securities Co., Ltd. from noncontrolling interest shareholders (Note 2) |
— | (30,655 | ) | — | ||||||||
|
Changes in a foreign affiliated company’s interests in its subsidiary |
— | (1,816 | ) | — | ||||||||
|
Reorganization of Mitsubishi UFJ Morgan Stanley PB Securities Co., Ltd. (Note 2) |
— | — | 13,839 | |||||||||
|
Other—net |
534 | (137 | ) | 204 | ||||||||
|
|
|
|
|
|
|
|||||||
|
Balance at end of fiscal year |
¥ | 6,378,619 | ¥ | 6,348,133 | ¥ | 6,363,413 | ||||||
|
|
|
|
|
|
|
|||||||
|
Retained earnings appropriated for legal reserve (Note 18): |
||||||||||||
|
Balance at beginning of fiscal year |
¥ | 239,571 | ¥ | 239,571 | ¥ | 239,571 | ||||||
|
|
|
|
|
|
|
|||||||
|
Balance at end of fiscal year |
¥ | 239,571 | ¥ | 239,571 | ¥ | 239,571 | ||||||
|
|
|
|
|
|
|
|||||||
|
Unappropriated retained earnings (Note 18): |
||||||||||||
|
Balance at beginning of fiscal year |
¥ | 254,103 | ¥ | 482,535 | ¥ | 1,361,620 | ||||||
|
Net income attributable to Mitsubishi UFJ Financial Group |
416,231 | 1,069,124 | 1,015,393 | |||||||||
|
Cash dividends: |
||||||||||||
|
Common stock—¥12.00 in 2012 and 2013, and ¥14.00 in 2014 per share |
(169,776 | ) | (169,819 | ) | (198,191 | ) | ||||||
|
Preferred stock (Class 5)—¥115.00 in 2012, 2013, and 2014 per share |
(17,940 | ) | (17,940 | ) | (17,940 | ) | ||||||
|
Gains (losses) on sales of shares of treasury stock |
(218 | ) | (2,280 | ) | 58 | |||||||
|
Effect of adopting new guidance on embedded credit derivatives (Note 1) |
135 | — | — | |||||||||
|
Changes in a foreign affiliated company’s interests in its subsidiary |
— | — | (3,301 | ) | ||||||||
|
|
|
|
|
|
|
|||||||
|
Balance at end of fiscal year (Note 35) |
¥ | 482,535 | ¥ | 1,361,620 |
¥
|
2,157,639
|
|
|||||
|
|
|
|
|
|
|
|||||||
F-9
Table of Contents
MITSUBISHI UFJ FINANCIAL GROUP, INC. AND SUBSIDIARIES
CONSOLIDATED STATEMENTS OF EQUITY—(Continued)
FOR THE FISCAL YEARS ENDED MARCH 31, 2012, 2013 AND 2014
| (in millions) | 2012 | 2013 | 2014 | |||||||||
|
Accumulated other comprehensive income (loss), net of taxes: |
||||||||||||
|
Balance at beginning of fiscal year |
¥ | (628,661 | ) | ¥ | (596,400 | ) | ¥ | 574,347 | ||||
|
Net change during the fiscal year |
32,261 | 1,170,747 | 783,335 | |||||||||
|
|
|
|
|
|
|
|||||||
|
Balance at end of fiscal year |
¥ | (596,400 | ) | ¥ | 574,347 | ¥ | 1,357,682 | |||||
|
|
|
|
|
|
|
|||||||
|
Treasury stock: |
||||||||||||
|
Balance at beginning of fiscal year |
¥ | (11,251 | ) | ¥ | (8,411 | ) | ¥ | (3,011 | ) | |||
|
Purchases of shares of treasury stock (Note 17) |
(18 | ) | (19 | ) | (74 | ) | ||||||
|
Sales of shares of treasury stock |
849 | 4,888 | 753 | |||||||||
|
Net decrease (increase) resulting from changes in interests in consolidated subsidiaries, consolidated variable interest entities, and affiliated companies |
2,009 | 531 | (178 | ) | ||||||||
|
|
|
|
|
|
|
|||||||
|
Balance at end of fiscal year |
¥ | (8,411 | ) | ¥ | (3,011 | ) | ¥ | (2,510 | ) | |||
|
|
|
|
|
|
|
|||||||
|
Total Mitsubishi UFJ Financial Group shareholders’ equity |
¥ | 8,583,158 | ¥ | 10,608,795 | ¥ | 12,205,040 | ||||||
|
|
|
|
|
|
|
|||||||
|
Noncontrolling interests: |
||||||||||||
|
Balance at beginning of fiscal year |
¥ | 327,213 | ¥ | 275,289 | ¥ | 333,185 | ||||||
|
Initial subscriptions of noncontrolling interests (Note 2) |
9,991 | 30,009 | 237,307 | |||||||||
|
Transactions between the consolidated subsidiaries and the related noncontrolling interest shareholders |
(7,440 | ) | (3,262 | ) | 2,117 | |||||||
|
Decrease in noncontrolling interests related to deconsolidation of subsidiaries |
(67,276 | ) | (8,090 | ) | (48,524 | ) | ||||||
|
Decrease in noncontrolling interests related to disposition of subsidiaries |
(4,609 | ) | (2,327 | ) | (139 | ) | ||||||
|
Purchase of shares of Mitsubishi UFJ Merrill Lynch PB Securities Co., Ltd. from noncontrolling interest shareholders (Note 2) |
— | (8,345 | ) | — | ||||||||
|
Issuance of new shares of Mitsubishi UFJ Morgan Stanley Securities Co., Ltd. (Note 2) |
30,000 | — | — | |||||||||
|
Net income attributable to noncontrolling interests |
4,520 | 50,727 | 67,133 | |||||||||
|
Dividends paid to noncontrolling interests |
(16,487 | ) | (9,243 | ) | (14,347 | ) | ||||||
|
Reorganization of Mitsubishi UFJ Morgan Stanley PB Securities Co., Ltd. (Note 2) |
— | — | (13,839 | ) | ||||||||
|
Other comprehensive income (loss), net of taxes |
(743 | ) | 8,402 | (16,399 | ) | |||||||
|
Other—net |
120 | 25 | (90 | ) | ||||||||
|
|
|
|
|
|
|
|||||||
|
Balance at end of fiscal year |
¥ | 275,289 | ¥ | 333,185 | ¥ | 546,404 | ||||||
|
|
|
|
|
|
|
|||||||
|
Total equity |
¥ | 8,858,447 | ¥ | 10,941,980 | ¥ | 12,751,444 | ||||||
|
|
|
|
|
|
|
|||||||
See the accompanying notes to Consolidated Financial Statements.
F-10
Table of Contents
MITSUBISHI UFJ FINANCIAL GROUP, INC. AND SUBSIDIARIES
FOR THE FISCAL YEARS ENDED MARCH 31, 2012, 2013 AND 2014
| (in millions) | 2012 | 2013 | 2014 | |||||||||
|
Cash flows from operating activities: |
||||||||||||
|
Net income before attribution of noncontrolling interests |
¥ | 420,751 | ¥ | 1,119,851 | ¥ | 1,082,526 | ||||||
|
Adjustments to reconcile net income before attribution of noncontrolling interests to net cash provided by (used in) operating activities: |
||||||||||||
|
Depreciation and amortization |
307,006 | 301,603 | 301,861 | |||||||||
|
Impairment of intangible assets (Note 6) |
30,986 | 3,378 | 312 | |||||||||
|
Provision (credit) for credit losses (Note 4) |
223,809 | 144,542 | (106,371 | ) | ||||||||
|
Employee benefit cost for severance indemnities and pension plans (Note 13) |
48,823 | 64,970 | 79,036 | |||||||||
|
Government grant for transfer of substitutional portion of Employees’ Pension Fund Plans (Note 13) |
— | — | (115,210 | ) | ||||||||
|
Investment securities gains—net |
(19,384 | ) | (155,957 | ) | (303,520 | ) | ||||||
|
Amortization of premiums on investment securities |
81,384 | 91,252 | 115,980 | |||||||||
|
Changes in financial instruments measured at fair value under fair value option, excluding trading account securities—net (Note 31) |
35,297 | (21,734 | ) | (91,410 | ) | |||||||
|
Foreign exchange losses (gains)—net |
280,997 | (1,059,276 | ) | (1,090,193 | ) | |||||||
|
Equity in losses (earnings) of equity method investees—net (Note 2) |
499,427 | (60,210 | ) | (110,520 | ) | |||||||
|
Provision (credit) for deferred income tax expense |
193,114 | 133,054 | (8,047 | ) | ||||||||
|
Gain on conversion rate adjustment of convertible preferred stock (Note 2) |
(139,320 | ) | — | — | ||||||||
|
Decrease (increase) in trading account assets, excluding foreign exchange contracts |
(3,188,559 | ) | (3,269,053 | ) | 2,894,475 | |||||||
|
Increase (decrease) in trading account liabilities, excluding foreign exchange contracts |
2,326,503 | 796,656 | (2,622,957 | ) | ||||||||
|
Increase (decrease) in unearned income, unamortized premiums and deferred loan fees |
10,754 | (13 | ) | 5,214 | ||||||||
|
Increase in accrued interest receivable and other receivables |
(110,209 | ) | (82,575 | ) | (95,966 | ) | ||||||
|
Increase in accrued interest payable and other payables |
36,425 | 4,162 | 100,760 | |||||||||
|
Net increase (decrease) in accrued income taxes and decrease (increase) in income tax receivables |
116,180 | (125,309 | ) | 158,268 | ||||||||
|
Decrease in allowance for repayment of excess interest |
(37,452 | ) | (21,777 | ) | (23,503 | ) | ||||||
|
Net decrease (increase) in collateral for derivative transactions |
(618,295 | ) | (179,028 | ) | 528,901 | |||||||
|
Partial withdrawal of assets from employee retirement benefit trusts (Note 13) |
— | 44,851 | — | |||||||||
|
Other—net |
94,642 | 105,703 | 209,812 | |||||||||
|
|
|
|
|
|
|
|||||||
|
Net cash provided by (used in) operating activities |
592,879 | (2,164,910 | ) | 909,448 | ||||||||
|
|
|
|
|
|
|
|||||||
|
Cash flows from investing activities: |
||||||||||||
|
Proceeds from sales of investment securities available-for-sale (including proceeds from securities under fair value option) (Note 3) |
172,325,724 | 149,910,832 | 105,488,089 | |||||||||
|
Proceeds from maturities of investment securities available-for-sale (including proceeds from securities under fair value option) (Note 3) |
12,863,545 | 15,343,140 | 33,894,330 | |||||||||
|
Purchases of investment securities available-for-sale (including purchases of securities under fair value option) (Note 3) |
(192,356,659 | ) | (163,273,113 | ) | (132,922,207 | ) | ||||||
|
Proceeds from maturities of investment securities being held-to-maturity |
835,356 | 811,024 | 626,109 | |||||||||
|
Purchases of investment securities being held-to-maturity |
(263,300 | ) | (442,016 | ) | (473,345 | ) | ||||||
|
Proceeds from sales of other investment securities |
37,397 | 31,094 | 228,983 | |||||||||
|
MUB’s acquisition of PB Capital Corporation’s institutional commercial real estate lending division (Note 2) |
— | — | (358,040 | ) | ||||||||
|
Purchase of common stock investment in VietinBank, an affiliated company of BTMU (Note 2) |
— | — | (75,136 | ) | ||||||||
|
Acquisition of Mitsubishi UFJ Fund Services Holdings Limited (formerly Butterfield Fulcrum Group), a subsidiary of MUTB (Note 2) |
— | — | (30,191 | ) | ||||||||
|
Acquisition of Krungsri, a subsidiary of BTMU, net of cash acquired (Note 2) |
— | — | (398,841 | ) | ||||||||
|
Purchases of other investment securities |
(46,861 | ) | (8,034 | ) | (18,767 | ) | ||||||
|
Net increase in loans |
(5,609,261 | ) | (2,543,816 | ) | (4,426,839 | ) | ||||||
|
Net decrease (increase) in interest-earning deposits in other banks |
1,344,430 | (1,706,642 | ) | (11,738,061 | ) | |||||||
|
Net decrease (increase) in call loans, funds sold, and receivables under resale agreements and securities borrowing transactions |
471,372 | 106,337 | (2,062,236 | ) | ||||||||
|
Proceeds from sales of premises and equipment |
20,618 | 36,015 | 30,420 | |||||||||
|
Capital expenditures for premises and equipment |
(131,187 | ) | (139,756 | ) | (158,492 | ) | ||||||
|
Purchases of intangible assets |
(155,308 | ) | (161,090 | ) | (211,942 | ) | ||||||
|
Proceeds from sales and dispositions of investments in equity method investees |
125,690 | 78,983 | 34,424 | |||||||||
|
Proceeds from sales of consolidated VIEs and subsidiaries—net |
1,297 | 20,951 | 164,674 | |||||||||
|
Proceeds from a repayment of deposits with Government-led Loan Restructuring Program (Note 4) |
161,435 | 204,956 | — | |||||||||
|
Other—net |
11,462 | (69,120 | ) | 5,241 | ||||||||
|
|
|
|
|
|
|
|||||||
|
Net cash used in investing activities |
(10,364,250 | ) | (1,800,255 | ) | (12,401,827 | ) | ||||||
|
|
|
|
|
|
|
|||||||
F-11
Table of Contents
MITSUBISHI UFJ FINANCIAL GROUP, INC. AND SUBSIDIARIES
CONSOLIDATED STATEMENTS OF CASH FLOWS—(Continued)
FOR THE FISCAL YEARS ENDED MARCH 31, 2012, 2013 AND 2014
| (in millions) | 2012 | 2013 | 2014 | |||||||||
|
Cash flows from financing activities: |
||||||||||||
|
Net increase in deposits |
3,242,703 | 4,491,412 | 7,056,761 | |||||||||
|
Net increase in call money, funds purchased, and payables under repurchase agreements and securities lending transactions |
4,745,245 | 448,370 | 4,074,607 | |||||||||
|
Net increase (decrease) in due to trust account |
(6,210 | ) | 5,698 | 117,181 | ||||||||
|
Net increase (decrease) in other short-term borrowings |
2,409,172 | 429,163 | (1,031,642 | ) | ||||||||
|
Proceeds from issuance of long-term debt |
1,875,591 | 2,187,511 | 4,036,415 | |||||||||
|
Repayment of long-term debt |
(2,263,232 | ) | (3,025,310 | ) | (2,540,895 | ) | ||||||
|
Proceeds from sales of treasury stock |
130 | 22 | 845 | |||||||||
|
Payments to acquire treasury stock (Note 17) |
(18 | ) | (19 | ) | (74 | ) | ||||||
|
Payments for purchase of shares of Mitsubishi UFJ Merrill Lynch PB Securities Co., Ltd. from noncontrolling interest shareholders (Note 2) |
— | (39,000 | ) | — | ||||||||
|
Dividends paid |
(187,561 | ) | (187,720 | ) | (216,054 | ) | ||||||
|
Dividends paid to noncontrolling interests |
(16,445 | ) | (9,243 | ) | (14,347 | ) | ||||||
|
Other—net |
(11,523 | ) | (9,351 | ) | (7,702 | ) | ||||||
|
|
|
|
|
|
|
|||||||
|
Net cash provided by financing activities |
9,787,852 | 4,291,533 | 11,475,095 | |||||||||
|
|
|
|
|
|
|
|||||||
|
Effect of exchange rate changes on cash and cash equivalents |
(16,876 | ) | 62,476 | 87,259 | ||||||||
|
|
|
|
|
|
|
|||||||
|
Net increase (decrease) in cash and cash equivalents |
(395 | ) | 388,844 | 69,975 | ||||||||
|
|
|
|
|
|
|
|||||||
|
Cash and cash equivalents at beginning of fiscal year |
3,230,804 | 3,230,409 | 3,619,253 | |||||||||
|
|
|
|
|
|
|
|||||||
|
Cash and cash equivalents at end of fiscal year |
¥ | 3,230,409 | ¥ | 3,619,253 | ¥ | 3,689,228 | ||||||
|
|
|
|
|
|
|
|||||||
|
Supplemental disclosure of cash flow information: |
||||||||||||
|
Cash paid during the fiscal year for: |
||||||||||||
|
Interest |
¥ | 683,034 | ¥ | 605,608 | ¥ | 601,626 | ||||||
|
Income taxes, net of refunds |
119,897 | 288,275 | 187,696 | |||||||||
|
Non-cash investing and financing activities: |
||||||||||||
|
Obtaining assets by entering into capital lease |
16,198 | 7,584 | 4,211 | |||||||||
|
MUB’s acquisitions (Note 2): |
||||||||||||
|
Fair value of assets acquired |
— | 626,921 | 416,059 | |||||||||
|
Fair value of liabilities assumed |
— | 502,437 | 58,019 | |||||||||
|
Acquisition of Krungsri, a subsidiary of BTMU (Note 2): |
||||||||||||
|
Fair value of assets acquired, excluding cash and cash equivalents |
— | — | 3,997,518 | |||||||||
|
Fair value of liabilities assumed |
— | — | 3,396,454 | |||||||||
|
Fair value of noncontrolling interests |
— | — | 202,223 | |||||||||
|
Conversion of Morgan Stanley’s convertible preferred stock (Note 2) |
808,266 | — | — | |||||||||
|
Transfer to investment securities being held to maturity from investment securities available for sale (Note 3) |
— | 12,356 | 411,535 | |||||||||
See the accompanying notes to Consolidated Financial Statements.
F-12
Table of Contents
MITSUBISHI UFJ FINANCIAL GROUP, INC. AND SUBSIDIARIES
NOTES TO CONSOLIDATED FINANCIAL STATEMENTS
| 1. | BASIS OF FINANCIAL STATEMENTS AND SUMMARY OF SIGNIFICANT ACCOUNTING POLICIES |
Description of Business
Mitsubishi UFJ Financial Group, Inc. (“MUFG”) is a holding company for The Bank of Tokyo-Mitsubishi UFJ, Ltd. (“BTMU”), Mitsubishi UFJ Trust and Banking Corporation (“MUTB”), Mitsubishi UFJ Securities Holdings Co., Ltd. (“MUSHD”), Mitsubishi UFJ NICOS Co., Ltd. (“Mitsubishi UFJ NICOS”), and other subsidiaries. MUSHD is an intermediate holding company for Mitsubishi UFJ Morgan Stanley Securities Co., Ltd. (“MUMSS”). See Note 2 for more information on the securities joint venture with Morgan Stanley. Through its subsidiaries and affiliated companies, MUFG engages in a broad range of financial operations, including commercial banking, investment banking, trust banking and asset management services, securities businesses, and credit card businesses, and it provides related services to individual and corporate customers. See Note 29 for more information by business segment.
Effective July 1, 2014, BTMU operations in the Americas region were integrated with UnionBanCal Corporation (“UNBC”), an indirect wholly-owned subsidiary in the United States, and UNBC was renamed MUFG Americas Holdings Corporation (“MUAH”). Also effective July 1, 2014, the principal subsidiary of UNBC, Union Bank, N.A. (“Union Bank”) was renamed MUFG Union Bank, N.A. (“MUB”). Throughout these financial statements, the new corporate names, MUAH and MUB are used in place of UNBC and Union Bank, respectively.
Basis of Financial Statements
The accompanying consolidated financial statements are presented in Japanese yen, the currency of the country in which MUFG is incorporated and principally operates. The accompanying consolidated financial statements have been prepared on the basis of accounting principles generally accepted in the United States of America (“U.S. GAAP”). In certain respects, the accompanying consolidated financial statements reflect adjustments which are not included in the consolidated financial statements issued by MUFG and certain of its subsidiaries in accordance with applicable statutory requirements and accounting practices in their respective countries of incorporation. The major adjustments include those relating to (1) investment securities, (2) derivative financial instruments, (3) allowance for credit losses, (4) income taxes, (5) consolidation, (6) premises and equipment, (7) transfer of financial assets, (8) accrued severance indemnities and pension liabilities, (9) goodwill and other intangible assets and (10) lease transactions.
Fiscal years of certain subsidiaries, which end on December 31, and MUFG’s fiscal year, which ends on March 31, have been treated as coterminous. For the fiscal years ended March 31, 2012, 2013 and 2014, the effect of recording intervening events for the three-month periods ended March 31 on MUFG’s proportionate equity in net income of subsidiaries with fiscal years ended on December 31, would have resulted in a decrease of ¥1.56 billion, an increase of ¥1.48 billion, and an increase of ¥6.79 billion to net income attributable to Mitsubishi UFJ Financial Group, respectively. No intervening events occurred during each of the three-month periods ended March 31, 2012, 2013 and 2014 which, if recorded, would have had material effects on consolidated total assets, loans, total liabilities, deposits or total equity as of March 31, 2012, 2013 and 2014.
Use of Estimates
The preparation of consolidated financial statements in conformity with U.S. GAAP requires management to make estimates and assumptions that affect the reported amounts of assets and liabilities and disclosures of contingent assets and liabilities at the date of the consolidated financial statements and the reported amounts of revenues and expenses during the reporting period. Actual results could differ from those estimates. Material estimates that are particularly susceptible to management judgment primarily relate to the allowance for credit
F-13
Table of Contents
MITSUBISHI UFJ FINANCIAL GROUP, INC. AND SUBSIDIARIES
NOTES TO CONSOLIDATED FINANCIAL STATEMENTS—(Continued)
losses, the valuation allowances of deferred tax assets, recognition and measurement of uncertain tax positions, the valuation of financial instruments, the accounting for goodwill and intangible assets, impairment of investment securities, the allowances for repayment of excess interest and accrued severance indemnities and pension liabilities.
Summary of Significant Accounting Policies
Significant accounting policies applied in the accompanying consolidated financial statements are summarized below:
Consolidation —The accompanying consolidated financial statements include the accounts of MUFG, its subsidiaries and certain variable interest entities (“VIE”s) (together, the “MUFG Group”). In situations in which the MUFG Group has a controlling financial interest in other entities, including certain VIEs, such entities are consolidated and noncontrolling interests are recorded in Total equity. Intercompany items have been eliminated. Investments in affiliated companies (companies over which the MUFG Group has the ability to exercise significant influence) are accounted for by the equity method of accounting and are reported in Other assets. The MUFG Group’s equity interest in the earnings (losses) of these equity investees and other-than-temporary impairment are reported in Equity in earnings (losses) of equity method investees-net. The MUFG Group recognizes an impairment loss on investments in equity method investees that is other-than-temporary. The MUFG Group determines whether loss on investments is other-than-temporary, through consideration of various factors, such as the length of time and the extent to which the fair value has been less than cost, the financial condition and near-term prospects of the investees, and the intent and ability to retain its investment in the investees for a period of time sufficient to allow for any anticipated recovery in the fair value. The MUFG Group also evaluates additional factors, such as the condition and trend of the economic cycle, and trends in the general market.
The MUFG Group consolidates VIEs if it has the power to direct the activities of a VIE which most significantly impact the VIE’s economic performance and has the obligation to absorb losses or the right to receive benefits that could potentially be significant to the entity, except certain VIEs that are deemed as investment companies. For VIEs that are considered investment companies, the MUFG Group determines whether it is the primary beneficiary by evaluation of whether it absorbs a majority of expected losses, receives a majority of expected residual returns or both.
Assets that the MUFG Group holds in an agency, fiduciary or trust capacity are not assets of the MUFG Group and, accordingly, are not included in the accompanying consolidated balance sheets.
Cash Flows —For the purposes of reporting cash flows, cash and cash equivalents are defined as those amounts included in the accompanying consolidated balance sheets under the caption Cash and due from banks with original maturities of 90 days or less. Cash flows from qualified hedging activities are classified in the same category as the items being hedged.
Translation of Foreign Currency Financial Statements and Foreign Currency Transactions —Financial statements of overseas entities are translated into Japanese yen using the respective fiscal year-end exchange rates for assets and liabilities. Income and expense items are translated at average rates of exchange for the respective fiscal years.
Foreign currency translation gains and losses related to the financial statements of overseas entities of the MUFG Group, net of related income tax effects, are credited or charged directly to Foreign currency translation adjustments, a component of Accumulated other comprehensive income (loss) (“Accumulated OCI”). Tax effects of gains and losses on foreign currency translation of the financial statements of overseas entities are not recognized unless it is apparent that the temporary differences will reverse in the foreseeable future.
F-14
Table of Contents
MITSUBISHI UFJ FINANCIAL GROUP, INC. AND SUBSIDIARIES
NOTES TO CONSOLIDATED FINANCIAL STATEMENTS—(Continued)
Foreign currency-denominated assets and liabilities are translated into the functional currencies of the individual entities included in consolidation at the respective fiscal year-end foreign exchange rates. Foreign currency-denominated income and expenses are translated using average rates of exchange for the respective fiscal years. Gains and losses from such translation are included in Foreign exchange gains (losses)—net, as appropriate.
Repurchase Agreements, Securities Lending and Other Secured Financing Transactions —Securities sold with agreements to repurchase (“repurchase agreements”), securities purchased with agreements to resell (“resale agreements”) and securities lending and borrowing transactions are accounted for as secured financing or lending transactions, if the transferor has not surrendered control over the securities. If they meet the relevant conditions for the surrender of control, they are accounted for as sales of securities with related off-balance sheet forward repurchase commitments or purchases of securities with related off-balance sheet forward resale commitments. For the fiscal years ended March 31, 2012, 2013 and 2014, there were no such transactions accounted for as sales.
Collateral— For secured lending transactions, including resale agreements, securities borrowing transactions, commercial lending and derivative transactions, the MUFG Group, as a secured party, generally has the right to require the counterparties to provide collateral, including letters of credit, cash, securities and other financial assets. For most securities lending transactions, the MUFG Group maintains strict levels of collateralization governed by a daily mark-to-market analysis. Financial assets pledged as collateral are generally negotiable financial instruments and are permitted to be sold or repledged by secured parties. If the MUFG Group sells these financial assets received as collateral, it recognizes the proceeds from the sale and its obligation to return the collateral. For secured borrowing transactions, principally repurchase agreements and securities lending transactions and derivative transactions, where the secured party has the right to sell or repledge financial assets pledged as collateral, the MUFG Group separately discloses those financial assets pledged as collateral in the accompanying consolidated balance sheets.
Trading Account Securities— Securities and money market instruments held in anticipation of short-term market movements and for resale to customers are included in Trading account assets, and short trading positions of these instruments are included in Trading account liabilities. Trading positions are carried at fair value in the accompanying consolidated balance sheets and recorded on a trade date basis. Changes in the fair value of trading positions are recognized currently in Trading account profits—net, as appropriate. The MUFG Group has elected the fair value option for certain foreign securities. See Note 31 for a further discussion of fair value option.
Investment Securities— Debt securities for which the MUFG Group has both the ability and positive intent to hold to maturity are classified as Securities being held-to-maturity and are carried at amortized cost. Debt securities that the MUFG Group may not hold to maturity and marketable equity securities, other than those classified as Trading account securities, are classified as Securities available-for-sale, and are carried at their fair values, with unrealized gains and losses reported on a net-of-tax basis within Accumulated OCI, net of taxes, which is a component of equity. Other investment securities include nonmarketable equity securities carried at their acquisition cost and investment securities held by subsidiaries that are investment companies or brokers and dealers. Such securities held by those subsidiaries are subject to the specialized industry accounting principles for investment companies and brokers and dealers applicable for those subsidiaries. Securities of those subsidiaries are carried at their fair values.
For marketable equity securities, an other-than-temporary impairment is recognized in earnings when a decline in fair value below the cost is deemed other than temporary. For debt securities, an other-than-temporary impairment is recognized in earnings for a security if the MUFG Group has intent to sell such a debt security or if it is more likely than not the MUFG Group will be required to sell such a debt security before recovery of its
F-15
Table of Contents
MITSUBISHI UFJ FINANCIAL GROUP, INC. AND SUBSIDIARIES
NOTES TO CONSOLIDATED FINANCIAL STATEMENTS—(Continued)
amortized cost basis. If not, the credit component of an other-than-temporary impairment is recognized in earnings, but the noncredit component is recognized in Accumulated OCI. In determining other-than-temporary declines in fair value to be recognized as an impairment loss on investment securities, the MUFG Group generally considers factors such as the ability and positive intent to hold the investments for a period of time sufficient to allow for anticipated recovery in fair value, the financial condition of the issuer, the extent of decline in fair value, and the length of time that the decline in fair value below cost has existed. Interest and dividends on investment securities are reported in Interest income. Dividends are recognized when the shareholder right to receive the dividend is established. Gains and losses on disposition of investment securities are computed using the average cost method and are recognized on the trade date.
Derivative Financial Instruments— The MUFG Group engages in derivative activities involving swaps, forwards, futures, options, and other types of derivative contracts. Derivatives are used in trading activities to generate trading revenues and fee income for its own account and to respond to the customers’ financial needs. Derivatives are also used to manage counterparty credit risk and market risk exposures to fluctuations in interest and foreign exchange rates, equity and commodity prices.
Derivatives entered into for trading purposes are carried at fair value and are reported as Trading account assets or Trading account liabilities, as appropriate. The fair values of derivative contracts executed with the same counterparty under legally enforceable master netting agreements are presented on a gross basis. Changes in the fair value of such contracts are recognized currently in Foreign exchange gains (losses)—net with respect to foreign exchange contracts and in Trading account profits—net with respect to interest rate contracts and other types of contracts.
Embedded features that are not clearly and closely related to the host contracts and meet the definition of derivatives are separated from the host contracts and measured at fair value unless the contracts embedding the derivatives are measured at fair value in their entirety.
Derivatives are also used to manage exposures to fluctuations in interest and foreign exchange rates arising from mismatches of asset and liability positions. Certain of those derivatives are designated as hedging instruments and qualify for hedge accounting. The MUFG Group designates a derivative as a hedging instrument at the inception of each such hedge relationship, and it documents, for such individual hedging relationships, the risk management objective and strategy, including the item being hedged, the specific risk being hedged and the method used to assess the hedge effectiveness. In order for a hedging relationship to qualify for hedge accounting, the changes in the fair value of the derivative instruments must be highly effective in achieving offsetting changes in fair values or variable cash flows of the hedged items attributable to the risk being hedged. Any ineffectiveness, which arises during the hedging relationship, is recognized in Non-interest income or expense in the period in which it arises. All qualifying hedging derivatives are valued at fair value and included in Other assets or Other liabilities, as appropriate. For cash flow hedges, the unrealized changes in fair value to the extent effective are recognized in Accumulated OCI. Amounts realized on cash flow hedges related to variable rate loans are recognized in Net interest income in the period when the cash flow from the hedged item is realized. The fair value of cash flow hedges related to forecasted transactions, if any, is recognized in Non-interest income or expense in the period when the forecasted transaction occurs. Any difference that arises from gains or losses on hedging derivatives offsetting corresponding gains or losses on the hedged items, and gains and losses on derivatives attributable to the risks excluded from the assessment of hedge effectiveness are recognized in Non-interest income or expense.
Loans— Loans originated by the MUFG Group (“originated loans”) are carried at the principal amount outstanding, adjusted for unearned income and deferred net nonrefundable loan fees and costs. Originated loans held and intended for dispositions or sales in secondary markets are transferred to the held-for-sale classification and carried at the lower of cost or estimated fair value generally on an individual loan basis. Loan origination
F-16
Table of Contents
MITSUBISHI UFJ FINANCIAL GROUP, INC. AND SUBSIDIARIES
NOTES TO CONSOLIDATED FINANCIAL STATEMENTS—(Continued)
fees, net of certain direct origination costs, are deferred and recognized over the contractual life of the loan as an adjustment to yield using a method that approximates the interest method. Interest income on loans that are not impaired is accrued and credited to interest income as it is earned. Unearned income and discounts or premiums on purchased loans are deferred and recognized over the remaining contractual terms of the loans using a method that approximates the interest method when such purchased loans are outside the scope of the guidance on loans and debt securities acquired with deteriorated credit quality as described below.
The MUFG Group classifies its loan portfolio into the following portfolio segments—Commercial, Residential, Card, MUAH, and Bank of Ayudhya Public Company Limited (“Krungsri”) based on the grouping used by the MUFG Group to determine the allowance for credit losses. The MUFG Group further classifies the Commercial segment into classes based on initial measurement attributes, risk characteristics, and its method of monitoring and assessing credit risk.
Originated loans are considered impaired when, based on current information and events, it is probable that the MUFG Group will be unable to collect all the scheduled payments of principal or interest when due according to the contractual terms of the loan agreement. Past due status is determined based on the contractual terms of the loan and the actual number of days since the last payment date, and is considered in determining impairment. Originated loans that experience insignificant payment delays and payment shortfalls generally are not classified as impaired. Management determines the significance of payment delays and payment shortfalls on a case-by-case basis, taking into consideration all of the circumstances surrounding the loan and the borrower, including the length of the delay, the reasons for the delay, the borrower’s prior payment record, and the amount of the shortfall in relation to the principal and interest owed. Impairment is generally evaluated on a loan-by-loan basis by either the present value of expected future cash flows discounted at the loan’s effective interest rate, the loan’s observable market price, or the fair value of the collateral if the loan is collateral dependent.
Originated loans are generally placed on nonaccrual status when substantial doubt exists as to the full and timely collection of either principal or interest, specifically when principal or interest is contractually past due one month or more with respect to loans within all classes of the Commercial segment, three months or more with respect to loans within the Card, MUAH, and Krungsri segments, and six months or more with respect to loans within the Residential segment. A nonaccrual loan may be restored to an accrual status when interest and principal payments become current and management expects that the borrower will make future contractual payments as scheduled. When a loan is placed on nonaccrual status, interest accrued but not received is generally reversed against interest income. Cash receipts on nonaccrual loans, for which the ultimate collectibility of principal is uncertain, are applied as principal reductions; otherwise, such collections are credited to income.
The MUFG Group modifies certain loans in conjunction with its loss-mitigation activities. Through these modifications, concessions are granted to a borrower who is experiencing financial difficulty, generally in order to minimize economic loss, to avoid foreclosure or repossession of collateral, and to ultimately maximize payments received from the borrower. The concessions granted vary by portfolio segment, by program, and by borrower-specific characteristics, and may include interest rate reductions, term extensions, payment deferrals, and partial principal forgiveness. Loan modifications that represent concessions made to borrowers who are experiencing financial difficulties are identified as troubled debt restructurings (“TDRs”).
Generally, accruing loans that are modified in a TDR remain as accruing loans subsequent to the modification, and nonaccrual loans remain as nonaccrual. However, if a nonaccrual loan has been restructured as a TDR, the borrower is not delinquent under the restructured terms, and demonstrates that its financial condition has improved, the MUFG Group may reclassify the loan to accrual status. This determination is generally performed at least once a year through a detailed internal credit rating review process. Once a restructured nonaccrual loan is deemed to be a TDR, the MUFG Group will continue to designate the loan as a TDR even if the loan is reclassified to accrual status.
F-17
Table of Contents
MITSUBISHI UFJ FINANCIAL GROUP, INC. AND SUBSIDIARIES
NOTES TO CONSOLIDATED FINANCIAL STATEMENTS—(Continued)
A loan that has been modified into a TDR is considered to be impaired until it matures, is repaid, or is otherwise liquidated, regardless of whether the borrower performs under the modified terms. Because loans modified in TDRs are considered to be impaired, these loans are measured for impairment using the MUFG Group’s established asset-specific allowance methodology, which considers the expected default rates for the modified loans. See “ Allowance for Credit Losses” for a discussion for each portfolio segment .
In accordance with the guidance on loans and debt securities acquired with deteriorated credit quality, impaired loans acquired for which it is probable that the MUFG Group will be unable to collect all contractual receivables are initially recorded at the present value of amounts expected to be received. For these impaired loans, the related valuation allowances are not carried over or created initially. Accretable yield is limited to the excess of the investor’s estimate of undiscounted cash flows over the investor’s initial investment in the loan. Subsequent increases in cash flows expected to be collected are recognized prospectively through adjustment of the loan’s yield over its remaining life after reduction of any remaining allowance for credit losses for the loan established after its acquisition, if any, while any decrease in such cash flows below those initially expected at acquisition plus additional cash flows expected to be collected arising from changes in estimate after acquisition is recognized as an impairment.
Loan Securitization —The MUFG Group securitizes and services commercial, industrial, and residential loans in the normal course of business. The MUFG Group accounts for a transfer of loans in a securitization transaction as a sale if it meets relevant conditions for the surrender of control. Otherwise, the transfer is accounted for as a collateralized borrowing transaction. When a securitization is accounted for as a sale, the proceeds from a sale of financial assets consist of the cash and any other assets obtained, including beneficial interests and separately recognized servicing assets, in the transfer less any liabilities incurred, including separately recognized servicing liabilities. All proceeds and reductions of proceeds from a sale shall be initially measured at fair value.
Allowance for Credit Losses —The MUFG Group maintains an allowance for credit losses to absorb probable losses inherent in the loan portfolio. Actual credit losses (amounts deemed uncollectible, in whole or in part), net of recoveries, are generally determined based on detailed loan reviews and a credit assessment by management at each balance sheet date, and are deducted from the allowance for credit losses as net charge-offs. The MUFG Group generally applies its charge-off policy to all loans in its portfolio regardless of the type of borrower. Management believes that the provision for credit losses is adequate and the allowance is at the appropriate amount to absorb probable losses inherent in the loan portfolio. During the fiscal year ended March 31, 2014, the MUFG Group did not make any significant changes to the methodologies or policies used to determine its allowance for credit losses.
Key elements relating to the policies and discipline used in determining the allowance for credit losses are credit classification and the related borrower categorization process. The categorization is based on conditions that may affect the ability of borrowers to service their debt, taking into consideration current financial information, historical payment experience, credit documentation, public information, analyses of relevant industry segments or existing economic conditions. In determining the appropriate level of the allowance, the MUFG Group evaluates the probable loss by collateral value, historical loss experience, probability of insolvency and category of loan based on its type and characteristics. The MUFG Group updates these conditions and probable loss on a regular basis and upon the occurrence of unexpected change in the economic environment.
F-18
Table of Contents
MITSUBISHI UFJ FINANCIAL GROUP, INC. AND SUBSIDIARIES
NOTES TO CONSOLIDATED FINANCIAL STATEMENTS—(Continued)
The methodologies used to estimate the allowance and the charge-off policy for each portfolio segment are as follows:
Commercial segment
In the Commercial segment, the methodology for assessing the appropriateness of the allowance consists of several key elements, which include the allocated allowance for individual loans specifically identified for evaluation, the formula allowance, the allocated allowance for country risk exposure, and the allocated allowance for large groups of smaller-balance homogeneous loans.
The allocated allowance for individual loans specifically identified for evaluation represents the impairment allowance determined in accordance with the guidance on accounting by creditors for impairment of a loan. The factors considered by management in determining impairment are the internal credit rating assigned to each borrower which represents the borrower’s creditworthiness determined based on payment status, number of delinquencies, and the probability of collecting principal and interest payments when due. The impairment of a loan is measured based on the present value of expected future cash flows discounted at the loan’s effective interest rate, or on the loan’s observable market price, or based on the fair value of the collateral if the loan is collateral dependent.
The formula allowance is applied to loans that are categorized as Normal or Close Watch, excluding loans identified as a TDR, based on the internal credit rating and historical loss factors which are based on the loss experience. See Note 4 for the information on loans to borrowers categorized based on the internal borrower rating. Estimated losses inherent in the loans at the balance sheet date are calculated by multiplying the default ratio by the nonrecoverable ratio (determined as a complement of the recovery ratio). The default ratio is determined by each internal credit rating, taking into account the historical number of defaults of borrowers within each internal credit rating divided by the total number of borrowers. The recovery ratio is mainly determined by the historical experience of collections against loans in default. The default ratio, the recovery ratio and other indicators are continually reviewed to determine the appropriate level of the allowance. Because the evaluation of inherent loss for these loans involves a high degree of uncertainty, subjectivity and judgment, the estimation of the formula allowance is back-tested by comparing the allowance with the actual results subsequent to the balance sheet date. The results of such back-testing are evaluated by management to determine whether the manner and level of formula allowance needs to be changed in subsequent years.
The allocated allowance for country risk exposure is a country-specific allowance for Normal and Close Watch loans, excluding loans identified as a TDR. The allowance is established to supplement the formula allowance for these loans, based on an estimate of probable losses relating to the exposure to countries that are identified by management to have a high degree of transfer risk. The measurement is based on a function of default probability and the recovery ratio with reference to external credit ratings. For the allowance for individual cross-border loans specifically identified for evaluation, the MUFG Group incorporates transfer risk in its determination of the related allowance.
The allocated allowance for large groups of smaller-balance homogeneous loans is established through a process that begins with estimates of probable losses inherent in the portfolio. These estimates are based upon various analyses, including historical delinquency and historical loss experience.
Loans that have been modified into a TDR are treated as impaired loans. For nonaccrual TDRs, the allowance for credit losses is provided for these loans using the discounted cash flow method, or based on the fair value of the collateral. For TDRs accounted for as accruing loans, the allowance for credit losses is determined by discounting the estimated future cash flows using the effective interest rate of the loans prior to modification.
F-19
Table of Contents
MITSUBISHI UFJ FINANCIAL GROUP, INC. AND SUBSIDIARIES
NOTES TO CONSOLIDATED FINANCIAL STATEMENTS—(Continued)
In relation to loans categorized as Legally/Virtually Bankrupt, the amount of loans less estimated value of the collateral and guaranteed amount is generally considered uncollectible, and is charged off.
Residential segment
In the Residential segment, the loans are comprised of smaller-balance homogeneous loans that are pooled by their internal credit ratings based on the number of delinquencies. The loans in this segment are generally secured by collateral. Collateral values are based on internal valuation sources, and the allowance is determined for unsecured amounts. The allowance for the nondelinquent group of loans is determined based on historical loss experience. For delinquent groups of loans, the MUFG Group determines the allowance based on the probability of insolvency by the number of actual delinquencies and historical loss experience.
Loans that have been modified into a TDR are treated as impaired loans. For nonaccrual TDRs, the allowance for credit losses is provided for these loans using the discounted cash flow method, or based on the fair value of the collateral. For TDRs accounted for as accruing loans, the allowance for credit losses is determined by discounting the estimated future cash flows using the effective interest rate of the loans prior to modification.
In relation to loans that are in past due status over a certain period of time and deemed uncollectible, the amount of loans less estimated value of the collateral and guaranteed amount is generally considered uncollectible and charged off.
Card segment
In the Card segment, the loans are smaller-balance homogeneous loans that are pooled by their internal credit rating based on the number of delinquencies. The allowance for loans in this segment is generally determined based on the probability of insolvency by the number of actual delinquencies and historical loss experience. For calculating the allocated allowance for loans specifically identified for evaluation, impaired loans are aggregated for the purpose of measuring impairment using historical loss factors.
Loans that have been modified into a TDR are treated as impaired loans, and the allowance for credit losses is determined using the discounted cash flow method whereby the estimated future cash flows are discounted using the effective interest rate of the loans prior to modification.
In relation to loans that are in past due status over a certain period of time and deemed uncollectible, the amount of loans is generally fully charged off.
MUAH segment
In the MUAH segment, the methodology for assessing the appropriateness of the allowance consists of several key elements, which include the allocated allowance for individual loans specifically identified for evaluation, the formula allowance, the allocated allowance for large groups of smaller-balance homogeneous loans, and the unallocated allowance.
The allocated allowance for individual loans specifically identified for evaluation is established for loans when management determines that the MUFG Group will be unable to collect all amounts due according to the contractual terms of the loan agreement, including interest payments. Impaired loans are carried at the lower of the recorded investment in the loan, the present value of expected future cash flows discounted at the loan’s effective rate, the loan’s observable market price, or the fair value of the collateral, if the loan is collateral dependent.
F-20
Table of Contents
MITSUBISHI UFJ FINANCIAL GROUP, INC. AND SUBSIDIARIES
NOTES TO CONSOLIDATED FINANCIAL STATEMENTS—(Continued)
The formula allowance is calculated by applying historical loss factors to outstanding loans. Historical loss factors are based on the historical loss experience and may be adjusted for significant factors that, in management’s judgment, affect the collectibility of the portfolio as of the balance sheet date.
The allocated allowance for large groups of smaller-balance homogeneous loans is established for consumer loans as well as for smaller balance commercial loans. These loans are managed by a pool basis, and loss factors are based on expected net charge-off ranges.
The unallocated allowance represents an estimate of additional losses inherent in the loan portfolio and is composed of attribution factors, which are based upon management’s evaluation of various conditions that are not directly measured in the determination of the allocated allowance. The conditions used for consideration of the unallocated allowance at each balance sheet date include factors such as, existing general economic and business conditions affecting the key lending areas and products of the MUFG Group, credit quality trends and risk identification, collateral values, loan volumes, underwriting standards and concentrations, specific industry conditions, recent loss experience and the duration of the current business cycle. The MUFG Group reviews these conditions and has an internal discussion with senior credit officers on a quarterly basis.
Loans that have been modified into a TDR are treated as impaired loans. For nonaccrual TDRs, the allowance for credit losses is provided for these loans using the discounted cash flow method, or based on the fair value of the collateral. For TDRs accounted for as accruing loans, the allowance for credit losses is determined by using the discounted cash flow method whereby the estimated future cash flows are discounted using the effective interest rate of the loans prior to modification.
Commercial loans are generally considered uncollectible based on an evaluation of the financial condition of a borrower as well as the value of any collateral and, when considered to be uncollectible, loans are charged off in whole or in part. Consumer loans are generally considered uncollectible based on past due status and the value of any collateral and, when considered to be uncollectible, loans are charged off in whole or in part.
Krungsri segment
In the Krungsri segment, the methodology for assessing the appropriateness of the allowance consists of several key elements, which include the allocated allowance for individual loans specifically identified for evaluation, the formula allowance, and the allocated allowance for large groups of smaller-balance homogeneous loans.
The allocated allowance for individual loans specifically identified for evaluation is established for loans when management determines that the MUFG Group will be unable to collect all amounts due according to the contractual terms of the loan agreement, including interest payments. Impaired loans are carried at the lower of the recorded investment in the loan, the present value of expected future cash flows discounted at the loan’s effective rate, the loan’s observable market price, or the fair value of the collateral, if the loan is collateral dependent.
The formula allowance is calculated by applying historical loss factors to outstanding loans. Historical loss factors are based on the historical loss experience and may be adjusted for significant factors that, in management’s judgment, affect the collectibility of the portfolio as of the balance sheet date.
The allocated allowance for large groups of smaller-balance homogeneous loans is established for smaller balance loans such as housing loans, credit card loans, and personal loans. These loans are managed by a pool basis, and loss factors are based on expected net charge-off ranges.
F-21
Table of Contents
MITSUBISHI UFJ FINANCIAL GROUP, INC. AND SUBSIDIARIES
NOTES TO CONSOLIDATED FINANCIAL STATEMENTS—(Continued)
Loans that have been modified into a TDR are treated as impaired loans. For nonaccrual TDRs, the allowance for credit losses is provided for these loans using the discounted cash flow method, or based on the fair value of the collateral. For TDRs accounted for as accruing loans, the allowance for credit losses is determined by using the discounted cash flow method whereby the estimated future cash flows are discounted using the effective interest rate of the loans prior to modification.
Loans to customers are charged off in the year that they are determined to be uncollectible considering the financial condition of a borrower.
Allowance for Off-Balance Sheet Credit Instruments —The MUFG Group maintains an allowance for credit losses on off-balance sheet credit instruments, including commitments to extend credit, guarantees, standby letters of credit and other financial instruments. The allowance is recorded as a liability in Other liabilities. The MUFG Group adopts the same methodology used in determining the allowance for credit losses on loans. Potential credit losses related to derivatives are considered in the fair value of the derivatives.
Net changes in the allowance for off-balance sheet credit instruments are accounted for as Other non-interest expenses.
Premises and Equipment —Premises and equipment are stated at cost less accumulated depreciation and amortization. Depreciation is charged to operations over the estimated useful lives of the related assets. Leasehold improvements are depreciated over the terms of the respective leases or the estimated useful lives of the improvements, whichever is shorter. MUFG, BTMU and MUTB apply the declining-balance method in depreciating their premises and equipment, while other subsidiaries mainly apply the straight-line method, at rates principally based on the following estimated useful lives:
| Years | ||||
|
Buildings |
15 to 50 | |||
|
Equipment and furniture |
2 to 20 | |||
|
Leasehold improvements |
10 to 39 | |||
Maintenance, repairs and minor improvements are charged to operations as incurred. Major improvements are capitalized. Net gains or losses on dispositions of premises and equipment are included in Other non-interest income or expense, as appropriate.
Long-lived assets are reviewed for impairment whenever events or changes in circumstances indicate that the carrying amount of an asset may not be recoverable. Recoverability of an asset to be held and used is measured by a comparison of the carrying amount to future undiscounted net cash flows expected to be generated by the asset. If an asset is considered to be impaired, the impairment to be recognized is measured by the amount by which the carrying amount of the asset exceeds the fair value. For purposes of recognition and measurement of an impairment loss, a long-lived asset or assets are grouped with other assets and liabilities at the lowest level with independent and identifiable cash flows. Assets to be disposed of by sale are reported at the lower of the carrying amount or fair value less estimated cost to sell.
Asset retirement obligations related to restoration of certain leased properties upon lease termination are recorded in Other liabilities with a corresponding increase in leasehold improvements. The amounts represent the present value of expected future cash flows associated with returning such leased properties to their original condition. The difference between the gross and present value of expected future cash flows is accreted over the life of the related leases as a non-interest expense.
F-22
Table of Contents
MITSUBISHI UFJ FINANCIAL GROUP, INC. AND SUBSIDIARIES
NOTES TO CONSOLIDATED FINANCIAL STATEMENTS—(Continued)
Goodwill —The MUFG Group recognizes goodwill, as of the acquisition date, measured as the excess of the purchase price over the fair value of the net assets acquired. Goodwill related to investments in equity method investees is included in Other assets as a part of the carrying amount of investments in equity method investees.
Goodwill arising from a business combination is not amortized but is tested at least annually for impairment. Goodwill is recorded at a designated reporting unit level for the purpose of assessing impairment. A reporting unit is an operating segment, or an identified business unit one level below an operating segment. An impairment loss is recognized to the extent that the carrying amount of goodwill exceeds its implied fair value.
Intangible assets —Intangible assets consist of software, core deposit intangibles, customer relationships, trade names and other intangible assets. These are amortized over their estimated useful lives unless they have indefinite useful lives. Amortization of intangible assets is computed in a manner that best reflects the economic benefits of the intangible assets as follows:
|
Useful lives
(years) |
Amortization method |
|||||
|
Software |
2 to 10 |
Straight-line |
||||
|
Core deposit intangibles |
4 to 19 |
Declining-balance |
||||
|
Customer relationships |
7 to 27 |
Straight-line, Declining-balance |
||||
|
Trade names |
2 to 40 |
Straight-line |
||||
Intangible assets having indefinite useful lives are not amortized but are subject to annual impairment tests. An impairment exists if the carrying value of an indefinite-lived intangible asset exceeds its fair value. For other intangible assets subject to amortization, an impairment is recognized if the carrying amount is not recoverable and the carrying amount exceeds the fair value of the intangible asset.
The MUFG Group capitalizes certain costs associated with the acquisition or development of internal-use software. Costs subject to capitalization are salaries and employee benefits for employees who are directly associated with and who devote time to the internal-use computer software project, to the extent of time spent directly on the project. Once the software is ready for its intended use, the MUFG Group begins to amortize capitalized costs on a straight-line basis.
Accrued Severance and Pension Liabilities —The MUFG Group has defined benefit pension plans and other postretirement benefit plans, including severance indemnities plans. The liabilities related to these plans are computed and recognized based on actuarial computations. Net actuarial gains and losses that arise from differences between actual experience and assumptions are generally amortized over the average remaining service period of participating employees if it exceeds the corridor, which is defined as the greater of 10% of plan assets or the projected benefit obligation. Under the guidance related to employers’ accounting for defined benefit pension and other postretirement plans, the MUFG Group recognizes a net liability or asset to report the funded status of its defined benefit pension and other postretirement plans in the accompanying consolidated balance sheets and recognizes changes in the funded status of defined benefit pension and other postretirement plans in the year in which the changes occur in Accumulated OCI. The costs of the plans, based on actuarial computations of current and future employee benefits, were charged to Salaries and employee benefits. The MUFG Group measures plan assets and benefit obligations as of the date of the consolidated balance sheets.
Long-Term Debt —Premiums, discounts and issuance costs of long-term debt are amortized based on the method that approximates the interest method over the terms of the long-term debt.
F-23
Table of Contents
MITSUBISHI UFJ FINANCIAL GROUP, INC. AND SUBSIDIARIES
NOTES TO CONSOLIDATED FINANCIAL STATEMENTS—(Continued)
Obligations under Guarantees —The MUFG Group provides customers with a variety of guarantees and similar arrangements, including standby letters of credit, financial and performance guarantees, credit protection, and liquidity facilities. The MUFG Group recognizes guarantee fee income over the guarantee period based on the contractual terms of the guarantee contracts. It is the MUFG Group’s business practice to receive a guarantee fee at the inception of the guarantee, which approximates market value of the guarantee and is initially recorded as a liability, which is then recognized as guarantee fee income ratably over the guarantee period.
Allowance for Repayment of Excess Interest —The MUFG Group maintains an allowance for repayment of excess interest based on an analysis of past experience of reimbursement of excess interest, borrowers’ profile, recent trend of borrowers’ claims for reimbursement, and management’s future forecasts. The allowance is recorded as a liability in Other liabilities.
Fees and Commissions —Revenue recognition of major components of fees and commissions is as follows:
| Ÿ | Fees on funds transfer and collection services, service charges on deposit accounts, fees and commissions on securities business, fees on real estate business, insurance commissions, fees and commissions on stock transfer agency services, fees on investment funds business, and fees and commissions from other services are generally recognized as revenue when the related services are performed or recognized over the period that the service is provided. |
| Ÿ | Fees from trade-related financing services are recognized over the period of the financing. |
| Ÿ | Trust fees are recognized on an accrual basis, generally based on the volume of trust assets under management and/or the operating performance for the accounting period of each trust account. With respect to the trust accounts with guarantee of trust principal, trust fees are determined based on the profits earned by individual trust account during the trust accounting period, less deductions, including provision for reserve, impairment for individual investments and dividends paid to beneficiary certificate holders. The trust fees for these trust accounts are accrued based on the amounts expected to be earned during the accounting period of each trust account. |
| Ÿ | Annual fees and royalty and other service charges related to credit card business are recorded on a straight-line basis as services are provided. |
| Ÿ | Interchange income from the credit card business is recognized as billed. |
| Ÿ | Fees on guarantees are generally recognized over the contractual periods of the respective guarantees. Amounts initially recorded as a liability corresponding to the obligations at fair value are generally recognized as revenue over the terms of the guarantees as the MUFG Group is deemed to be released from the risk under guarantees. |
Income Taxes —The MUFG Group accounts for income taxes under the asset and liability method, which requires the recognition of deferred tax assets and deferred tax liabilities for the expected future tax consequences of events that have been included in the accompanying consolidated financial statements. Under this method, deferred tax assets and deferred tax liabilities are determined based on the differences between the financial statements and tax basis of assets and liabilities using enacted tax rates in effect for the year in which the differences are expected to reverse. The effect of a change in tax rates on deferred tax assets and deferred tax liabilities is recognized in income in the period that includes the enactment date.
The MUFG Group records net deferred tax assets to the extent these assets will more likely than not be realized. In making such determination, all available positive and negative evidence is considered, including future reversals of existing taxable temporary differences, projected future taxable income, tax planning
F-24
Table of Contents
MITSUBISHI UFJ FINANCIAL GROUP, INC. AND SUBSIDIARIES
NOTES TO CONSOLIDATED FINANCIAL STATEMENTS—(Continued)
strategies and recent financial operations. In the event the MUFG Group were to determine that it would be able to realize deferred tax assets in the future in excess of their net recorded amount, the MUFG Group would make an adjustment to the valuation allowance, which would reduce the provision for income taxes.
Uncertain tax positions are recorded on the basis of a two-step process whereby (1) it is determined whether it is more likely than not that the tax position will be sustained on the basis of its technical merits, and (2) for those tax positions that meet the more-likely-than-not recognition threshold, the MUFG Group recognizes the largest amount of tax benefit that is more than 50% likely to be realized upon ultimate settlement with the related tax authority. The MUFG Group recognizes interest and penalties related to unrecognized tax benefits within the income tax expense. Accrued interest and penalties are included within Other liabilities.
Free Distributions of Common Shares —As permitted by the Company Law of Japan (the “Company Law”), Japanese companies, upon approval by the Board of Directors, may make a free distribution of shares, in the form of a “stock split” as defined, to shareholders. In accordance with generally accepted accounting practice in Japan, such distribution does not give rise to any change in capital stock or capital surplus accounts. Common shares distributed are recorded as shares issued on the distribution date. See Note 17 for further information.
Earnings per Common Share —Basic earnings per share (“EPS”) excludes dilutive effects of potential common shares and is computed by dividing earnings applicable to common stock shareholders by the weighted average number of common shares outstanding for the period, while diluted EPS gives effect to all dilutive potential common shares that were outstanding during the period. See Note 22 for the computation of basic and diluted EPS.
Treasury Stock —The MUFG Group presents its treasury stock, including shares of MUFG owned by its subsidiaries and affiliated companies, as a reduction of equity on the accompanying consolidated balance sheets at cost and accounts for treasury stock transactions under an average cost method. Gains (losses) on sales of treasury stock are charged to capital surplus and unappropriated retained earnings.
Comprehensive Income (Loss) —Comprehensive income (loss) includes net income (loss) before attribution to noncontrolling interests and other comprehensive income (“OCI”). All changes in unrealized gains and losses on investment securities, unrealized gains and losses on derivatives qualifying for cash flow hedges, defined benefit plans and foreign currency translation adjustments constitute OCI and are presented, with related income tax effects, in the accompanying consolidated statements of comprehensive income.
Stock-Based Compensation —MUFG and certain of its subsidiaries have stock-based compensation plans. Stock-based compensation expenses are recognized based on the grant date fair value of share based compensation over the period during which an employee is required to provide service in accordance with the terms of the plans. See Note 32 for further discussion of stock-based compensation plans.
Reclassifications
Certain reclassifications and format changes have been made to the consolidated financial statements for the fiscal years ended March 31, 2012 and 2013 to conform to the presentation for the fiscal year ended March 31, 2014.
These reclassifications and format changes include the integration of “Provision (reversal) for repayment of excess interest” into “Other non-interest expenses” which had previously been presented as a separate line item in non-interest expense in the accompanying consolidated statements of income for the fiscal years ended March 31, 2012 and 2013.
These reclassifications and format changes did not result in a change to previously reported financial positions and results of operations.
F-25
Table of Contents
MITSUBISHI UFJ FINANCIAL GROUP, INC. AND SUBSIDIARIES
NOTES TO CONSOLIDATED FINANCIAL STATEMENTS—(Continued)
Accounting Changes
Amendments to Accounting Scope of Embedded Credit Derivatives —In March 2010, the FASB issued new guidance which clarifies the scope exception related to embedded credit derivatives. This guidance addresses how to determine which embedded credit derivative features, including those in collateralized debt obligations (“CDOs”) and synthetic CDOs, are considered to be embedded derivatives that are exempt from potential bifurcation and separate accounting requirement. This guidance is effective for the first interim reporting period beginning after June 15, 2010 with early application permitted at the beginning of the first interim reporting period beginning after the issuance of this new guidance. In initially adopting this new guidance, an entity may elect the fair value option for any investment in a beneficial interest in a securitized financial asset. The election of the fair value option is irrevocable and should be determined on an instrument-by-instrument basis at the beginning of the reporting period of initial adoption. The MUFG Group adopted this guidance on April 1, 2011, and recorded a ¥135 million increase to retained earnings as a cumulative effect adjustment.
Amendments to the Presentation of Comprehensive Income —In February 2013, the FASB issued new guidance which requires an entity to present separately for each component of OCI, current period reclassifications out of Accumulated OCI and other amounts of current period OCI. In addition, the guidance requires an entity to report the effect of significant reclassifications out of Accumulated OCI on the respective line items in net income if the amount being reclassified is required under U.S. GAAP to be reclassified in its entirety to net income. For other amounts that are not required under U.S. GAAP to be reclassified in their entirety to net income in the same reporting period, an entity is required to cross-reference other disclosures required under U.S. GAAP that provide additional detail about those amounts. The amendments in this guidance are effective for fiscal years, and interim periods within those years, beginning after December 15, 2012. Early adoption is permitted. The MUFG Group adopted this guidance on April 1, 2013. As a result of the adoption of this guidance, the presentation of the MUFG Group’s consolidated statements of comprehensive income and consolidated statements of equity were changed, while disclosures related to Accumulated OCI were added. This guidance had no impact on its financial position and result of operations. See Note 19 for further details of the required disclosures.
Disclosures about Offsetting Assets and Liabilities —In December 2011, the FASB issued new guidance which requires that entities disclose both gross information and net information about both instruments and transactions eligible for offset in the statement of financial position and instruments and transactions subject to an agreement similar to a master netting arrangement. In January 2013, the FASB issued further guidance which provides clarification that the scope of the guidance on disclosures about offsetting assets and liabilities applies to derivatives, including bifurcated embedded derivatives, repurchase agreements and reverse repurchase agreements, and securities borrowing and securities lending transactions that are either offset in accordance with existing guidance or subject to an enforceable master netting arrangement or similar agreement. An entity should provide the disclosures required by those amendments retrospectively for all comparative periods presented. The MUFG Group adopted this guidance on April 1, 2013, which had no impact on its financial position and results of operations. See Note 15 for further details of the required disclosures.
Subsequent Accounting for an Indemnification Asset Recognized at the Acquisition Date as a Result of a Government-Assisted Acquisition of a Financial Institution —In October 2012, the FASB issued new guidance, which clarifies the accounting guidance for subsequently measuring an indemnification asset recognized as a result of a government-assisted acquisition of a financial institution when a change in cash flows expected to be collected occurs. This guidance specifies that an entity shall subsequently account for the change in measurement of the indemnification asset on the same basis as the change in assets subject to the indemnification and limit any amortization of changes in value to the lesser of the contractual term of the indemnification agreement or the remaining life of the indemnified assets. This guidance is effective for fiscal years, and interim periods within those years, beginning on or after December 15, 2012. Early adoption is permitted. The MUFG Group adopted this guidance on April 1, 2013, which had no impact on its financial position and results of operations.
F-26
Table of Contents
MITSUBISHI UFJ FINANCIAL GROUP, INC. AND SUBSIDIARIES
NOTES TO CONSOLIDATED FINANCIAL STATEMENTS—(Continued)
Recently Issued Accounting Pronouncements
Obligations Resulting from Joint and Several Liability Arrangements for Which the Total Amount of the Obligation Is Fixed at the Reporting Date —In February 2013, the FASB issued new guidance for the recognition, measurement, and disclosure of obligations resulting from joint and several liability arrangements for which the total amount of the obligation within the scope of this guidance is fixed at the reporting date, except for obligations addressed within existing guidance in U.S. GAAP. This guidance is effective for fiscal years, and interim periods within those years, beginning after December 15, 2013. The MUFG Group does not expect that the adoption of the guidance will have a material impact on its financial position and results of operations.
Parent’s Accounting for the Cumulative Translation Adjustment upon Derecognition of Certain Subsidiaries or Groups of Assets within a Foreign Entity or of an Investment in a Foreign Entity —In March 2013, the FASB issued new guidance which requires the release of an entity’s cumulative translation adjustment into net income only if the sale or transfer results in the complete or substantially complete liquidation of the foreign entity in which the subsidiary or group of assets had resided. This guidance is effective for fiscal years, and interim periods within those years, beginning after December 15, 2013. The MUFG Group does not expect that the adoption of the guidance will have a material impact on its financial position and results of operations.
Amendments to the Scope, Measurement, and Disclosure Requirements for Investment Companies —In June 2013, the FASB issued guidance that changed the approach for determining whether an entity is an investment company under U.S. GAAP, and set forth certain measurement and disclosure requirements. This guidance changes the approach to the investment company assessment, clarifies the characteristics of an investment company, and provides comprehensive guidance for assessing whether an entity is an investment company. In addition, this guidance requires an investment company to measure noncontrolling ownership interests in other investment companies at fair value rather than using the equity method of accounting. Also, this guidance requires additional disclosures about an entity’s status as an investment company and financial support provided or contractually required to be provided by an investment company to its investees. This guidance is effective for fiscal years, and interim periods within those years, beginning after December 15, 2013. Early adoption of this guidance is prohibited. The MUFG Group does not expect that the adoption of the guidance will have a material impact on its financial position and results of operations.
Accounting for Investments in Qualified Affordable Housing Projects —In January 2014, the FASB issued guidance on accounting for investments by a reporting entity in flow-through limited liability entities that manage or invest in affordable housing projects that qualify for the low-income housing tax credit. The guidance permit reporting entities to make an accounting policy election to account for their investments in qualified affordable housing projects using the proportional amortization method if certain conditions are met. Under the proportional amortization method, an entity amortizes the initial cost of the investment in proportion to the tax credits and other tax benefits received and recognizes the net investment performance in the income statement as a component of income tax expense (benefit). For those investments in qualified affordable housing projects not accounted for using the proportional amortization method, the investment should be accounted for as an equity method investment or a cost method investment. This guidance is effective for fiscal years, and interim periods within those years, beginning after December 15, 2014 and should be applied retrospectively to all periods presented. The MUFG Group has not completed the study of what effect this guidance will have on its financial position and results of operations.
Reclassification of Residential Real Estate Collateralized Consumer Mortgage Loans upon Foreclosure —In January 2014, the FASB issued guidance that clarifies that an in substance repossession or foreclosure occurs, and a creditor is considered to have received physical possession of residential real estate property collateralizing
F-27
Table of Contents
MITSUBISHI UFJ FINANCIAL GROUP, INC. AND SUBSIDIARIES
NOTES TO CONSOLIDATED FINANCIAL STATEMENTS—(Continued)
a consumer mortgage loan, upon either (1) the creditor obtaining legal title to the residential real estate property upon completion of a foreclosure or (2) the borrower conveying all interest in the residential real estate property to the creditor to satisfy that loan through completion of a deed in lieu of foreclosure or through a similar legal agreement. Additionally, the amendments require interim and annual disclosures of both the amount of foreclosed residential real estate property held by the creditor and the recorded investment in consumer mortgage loans collateralized by residential real estate property that are in the process of foreclosure according to local requirements of the applicable jurisdiction. This guidance is effective for fiscal years, and interim periods within those years, beginning after December 15, 2014. Early adoption of this guidance is permitted. The MUFG Group has not completed the study of what effect this guidance will have on its financial position and results of operations.
Reporting Discontinued Operations and Disclosures of Disposals of Components of an Entity —In April 2014, the FASB issued new guidance that changes the requirements for reporting discontinued operations. A disposal of a component of an entity or a group of components of an entity is required to be reported in discontinued operations if the disposal represents a strategic shift that has (or will have) a major effect on an entity’s operations and financial results when the component of an entity or group of components of an entity meets certain criteria to be classified as held for sale or disposed. This guidance requires an entity to present, for each comparative period, the assets and liabilities of a disposal group that includes a discontinued operation separately in the asset and liability sections, respectively, of the statement of financial position and additional disclosures. Also, this guidance requires an entity to provide disclosures about a disposal of an individually significant component of an entity that does not qualify for discontinued operations presentation in the financial statements. This guidance is effective for all disposals (or classifications as held for sale) of components of an entity that occur within annual periods beginning on or after December 15, 2014, and interim periods within those years and all businesses that, on acquisition, are classified as held for sale that occur within annual periods beginning on or after December 15, 2014, and interim periods within those years. The MUFG Group does not expect that the adoption of the guidance will have a material impact on its financial position and results of operations. In case there will be discontinued operations, the MUFG Group should provide related disclosures as required in this guidance.
Revenue from Contracts with Customers— In May 2014, the FASB issued new guidance which supersedes the current revenue recognition requirements, including most industry-specific guidance. The core principle of the guidance is that an entity should recognize revenue to depict the transfers of promised goods or services to customers in an amount that reflects the consideration to which the entity expects to be entitled in exchange for those goods or services. The guidance also requires additional disclosures about the nature, amount, timing and uncertainty of revenue and cash flows arising from contracts with customers, including significant judgments and changes in judgments, and assets recognized from the costs incurred to obtain or fulfill a contract. This guidance is effective for annual reporting periods beginning after December 15, 2016, including interim periods within that reporting period. Early application is not permitted. The MUFG Group has not completed the study of what effect this guidance will have on its financial position and results of operations.
Repurchase-to-Maturity Transactions, Repurchase Financings, and Disclosures— In June 2014, the FASB issued new guidance which changes the accounting for both repurchase-to-maturity transactions and repurchase financing arrangements. The guidance also requires an entity to disclose information about certain transactions accounted for as a sale in which the transferor retains substantially all of the exposure to the economic return on the transferred financial assets through an agreement with the same counterparty, and information about repurchase agreements, securities lending transactions, and repurchase-to-maturity transactions that are accounted for as secured borrowings. This guidance is effective for interim and annual periods beginning after December 15, 2014, except for the disclosure requirement about repurchase agreements, securities lending
F-28
Table of Contents
MITSUBISHI UFJ FINANCIAL GROUP, INC. AND SUBSIDIARIES
NOTES TO CONSOLIDATED FINANCIAL STATEMENTS—(Continued)
transactions, and repurchase-to-maturity transactions accounted for as secured borrowings, that is effective for annual periods beginning after December 15, 2014, and for interim periods beginning after March 15, 2015. The MUFG Group has not completed the study of what effect this guidance will have on its financial position and results of operations.
| 2. | BUSINESS DEVELOPMENTS |
MUFG Americas Holdings Corporation
On December 1, 2012, MUB, a subsidiary of MUAH, acquired certain assets and assumed certain liabilities of Pacific Capital Bancorp, a bank holding company headquartered in Santa Barbara, California, for ¥124,484 million in cash, and thereby recorded goodwill of ¥33,875 million and intangible assets of ¥6,093 million.
On June 24, 2013, MUB acquired PB Capital Corporation’s institutional commercial real estate (“CRE”) lending division for ¥358,040 million in cash, and thereby recorded goodwill of ¥22,077 million. The purpose of this transaction is to expand the MUAH’s CRE presence in the U.S., and provide geographic and asset class diversification. The assets acquired and liabilities assumed were recorded at their estimated fair values on the acquisition date. These fair value estimates are considered provisional and are subject to change pending the receipt of additional information relative to closing date fair values, but not to exceed a period of one year after the closing date of the acquisition. During the year ended March 31, 2014, measurement period adjustments were applied to the acquisition date fair values, which increased goodwill by ¥1,038 million.
Investment in Morgan Stanley
On September 29, 2008, the MUFG Group and Morgan Stanley completed a final agreement to enter into a strategic capital alliance aiming to build a global strategic alliance primarily in the corporate and investment bank fields. On October 13, 2008, the MUFG Group purchased shares of preferred stock issued by Morgan Stanley. The investment in Morgan Stanley’s preferred stock consisted of Series B Non-cumulative Non-voting Perpetual Convertible Preferred Stock (“Series B Preferred Stock”) and Series C Non-cumulative Non-voting Perpetual Preferred Stock. On April 21, 2011, the MUFG Group and Morgan Stanley entered into an agreement to convert the Series B Preferred Stock with a face value of ¥808,266 million, into Morgan Stanley’s common stock. On June 30, 2011, the MUFG Group converted the Series B Preferred Stock for approximately 385 million shares of Morgan Stanley’s common stock, including approximately 75 million additional shares resulting from the adjustment to the conversion rate pursuant to the agreement. The adjustment to the conversion rate was recognized as a gain of ¥139,320 million, which was included in Gain on conversion rate adjustment of convertible preferred stock in Interest income on investment securities in the accompanying consolidated statement of income for the fiscal year ended March 31, 2012.
Prior to the conversion, the MUFG Group held approximately 3.0% of Morgan Stanley’s common stock and the investment was included in Investment securities available-for-sale. As a result of the conversion, the MUFG Group held approximately 22.4% of Morgan Stanley’s common stock, giving the MUFG Group the ability to exercise significant influence over the operations of Morgan Stanley. Accordingly, the MUFG Group has adopted the equity method of accounting for its investment in Morgan Stanley from June 30, 2011. The MUFG Group’s investments, results of operations and retained earnings were adjusted retroactively on a step-by-step basis as if the equity method of accounting had been in effect during all previous periods. The MUFG Group’s retroactive adjustment was applied to the existing approximately 3.0% investment in Morgan Stanley’s common stock through June 30, 2011. Following the conversion, the MUFG Group began recognizing its approximately 22.4% interest in Morgan Stanley’s common stock as an investment in an equity method investee included in Other assets.
F-29
Table of Contents
MITSUBISHI UFJ FINANCIAL GROUP, INC. AND SUBSIDIARIES
NOTES TO CONSOLIDATED FINANCIAL STATEMENTS—(Continued)
Upon qualifying for the equity method of accounting on June 30, 2011, the MUFG Group performed a valuation of its Morgan Stanley investment. As a result of the valuation, the carrying amount of the MUFG Group’s investment in common stock exceeded the underlying equity in net assets of Morgan Stanley and the excess was recognized as goodwill.
At September 30, 2011, the quoted market price of Morgan Stanley’s common stock had declined 41% from the quoted market price at June 30, 2011. The quoted market price at September 30, 2011 represented less than half of the MUFG Group’s carrying amount on a per share basis. The MUFG Group evaluated this stock price decline to determine whether the investment in Morgan Stanley was other than temporarily impaired. The MUFG Group determined that the decline in the stock price was other than temporary in light of the increasingly stringent regulatory environment and the existing adverse economic events in Europe. More specifically, new and pending regulations, such as the U.S. Dodd-Frank Wall Street Reform and Consumer Protection Act (“the Dodd-Frank Act”) and the global regulatory framework often referred to as “Basel III,” were expected to impose significant constraints on the business activities of financial institutions, including the prohibition on certain transactions, the enhancement of risk management frameworks, and the increase in capital adequacy requirements. Rules designed to further regulate the business operations of financial institutions were being adopted, or were at the time scheduled soon to be adopted, by government agencies, including the rules relating to resolution plans and rules generally referred to as the Volcker Rule under the Dodd-Frank Act. Furthermore, the impact of the prolonged European economic crisis had resulted in negative long-term prospects for the global financial market. The events in Europe had an immediate effect on financial institutions holding sovereign securities and were also expected to have long-term consequences for financial institutions with operations in Europe. Given these uncertain economic environment and increasing regulatory challenges, and the significant excess of the carrying amount per share over the quoted market price of Morgan Stanley’s common stock, the MUFG Group recorded an other-than-temporary impairment loss of ¥579,468 million at September 30, 2011. The MUFG Group’s investment in Morgan Stanley’s common stock was adjusted to the quoted market price of Morgan Stanley’s common stock as of September 30, 2011, and the impairment loss was reflected in Equity in earnings (losses) of equity method investees-net in the accompanying consolidated statement of income for the fiscal year ended March 31, 2012. The MUFG Group recorded no additional other-than-temporary impairment loss during the fiscal year ended March 31, 2013 and 2014. See Note 14 for more information.
Reorganization of Mitsubishi UFJ Morgan Stanley PB Securities Co., Ltd.
On December 26, 2012, MUSHD and BTMU acquired the remaining 49% ownership of Mitsubishi UFJ Merrill Lynch PB Securities Co., Ltd., which had been 51% owned subsidiary of the MUFG Group. As a result, it became a wholly-owned subsidiary of MUFG. The acquisition was accounted for as an equity transaction, and the excess of the cash consideration paid over the Noncontrolling interest was recognized as a reduction of Capital surplus. The purpose of making Mitsubishi UFJ Merrill Lynch PB Securities Co., Ltd. a wholly-owned subsidiary is to further strengthen private banking services for high-net-worth customers.
On March 20, 2014, MUMSS acquired 75% ownership of Mitsubishi UFJ Merrill Lynch PB Securities Co., Ltd., of which 51% ownership and 24% ownership were from MUSHD and BTMU, respectively, resulting in BTMU holding the remaining 25% ownership. 40% of the difference between the cash paid by MUMSS and the cost basis of assets and liabilities was ¥13,839 million, which was allocated as a reduction in Noncontrolling interests with a corresponding increase in Capital surplus. The purpose of the reorganization are to leverage MUFG’s broad customer base, utilize Morgan Stanley’s global and high quality insight, and further its collaborations with other group companies by strengthening its coordination with MUMSS. In connection with the reorganization, Mitsubishi UFJ Merrill Lynch PB Securities Co., Ltd. entered into a new service agreement with Morgan Stanley, and changed its name to Mitsubishi UFJ Morgan Stanley PB Securities Co., Ltd.
F-30
Table of Contents
MITSUBISHI UFJ FINANCIAL GROUP, INC. AND SUBSIDIARIES
NOTES TO CONSOLIDATED FINANCIAL STATEMENTS—(Continued)
Securities Joint Venture with Morgan Stanley
On March 30, 2010, the MUFG Group and Morgan Stanley entered into a securities joint venture agreement to integrate their securities business. The purpose of the joint venture is to collaborate in providing capital markets services to investment banking clients of the MUFG Group and Morgan Stanley and in offering a wide range of products and services, including Morgan Stanley’s global products and services, to the MUFG Group’s retail and middle market customers in Japan as well as to investment banking clients of both parties. The two joint venture companies will continue to offer products and services in sales and trading and research areas separately.
In relation to the integration of the securities companies in Japan, the former Mitsubishi UFJ Securities Co., Ltd. (“MUS”) was restructured into an intermediate holding company, MUSHD, and a securities business subsidiary, MUS. On May 1, 2010, MUS changed its name to MUMSS and the MUFG Group’s ownership interest in MUMSS also changed from 100% to 60%, with Morgan Stanley holding the remaining 40% voting and economic interest. Since the MUFG Group has retained control of MUMSS, the change in the MUFG Group’s ownership interest has been accounted for as an equity transaction and the MUFG Group has recorded ¥127 billion and ¥21 billion of noncontrolling interests and capital surplus, respectively. MUMSS continues the existing Japan based retail, middle markets, capital markets and sales and trading businesses of the former MUS while integrating the investment banking team of the former Morgan Stanley Japan Securities Co., Ltd. (“MSJS”).
Also, on May 1, 2010, MSJS was renamed to Morgan Stanley MUFG Securities Co., Ltd. (“MSMS”). MSMS continues to provide the existing sales and trading and capital markets operations of the former MSJS. The MUFG Group holds a 49% voting interest and a 60% economic interest in MSMS while Morgan Stanley holds the remaining 51% voting interest and 40% economic interest. The MUFG Group applies the equity method of accounting to MSMS due to its significant influence.
Per the shareholders’ agreement between the MUFG Group and Morgan Stanley, to the extent that losses incurred by MUMSS or MSMS result in a requirement to restore its capital, the controlling shareholder is solely responsible for providing additional capital to a minimum level and the noncontrolling shareholder is not obligated to contribute additional capital.
On April 22, 2011, due to losses incurred by MUMSS in the fiscal year ended March 31, 2011, the MUFG Group contributed ¥30 billion of new capital to MUMSS by acquiring newly issued shares of MUMSS. In October 2011, MUMSS implemented an early retirement program to reduce expenditures and improve operating performance. MUMSS recorded employee termination expenses of ¥20 billion in the second half of the fiscal year ended March 31, 2012. On November 24, 2011, the MUFG Group contributed ¥20 billion of new capital to MUMSS by acquiring newly issued shares of MUMSS in order to restore its capital adversely affected by the expenses during the fiscal year ended March 31, 2012. The additional capital in MUMSS improves and strengthens its capital base and restores its capital adequacy level. The new MUMSS shares have no voting rights and do not change the proportion of voting interests in MUMSS or change the right to participate in MUMSS’ earnings. In order to reflect the existing 60% economic interest in MUMSS after the MUFG Group’s capital contribution, 40% of the new share issuance on April 2011 and November 2011, or ¥12 billion and ¥8 billion, respectively, was recognized as an increase in noncontrolling interest and a reduction of capital surplus, given that the rights to participate in the residual assets of MUMSS will be distributed to the MUFG Group and Morgan Stanley in proportion to their percentage ownership interests.
To the extent that MUMSS is required to increase its capital level due to factors other than losses, such as future regulatory capital changes, both the MUFG Group and Morgan Stanley are required to contribute the necessary capital based upon their economic interests as set forth above. In this context, to meet an anticipated
F-31
Table of Contents
MITSUBISHI UFJ FINANCIAL GROUP, INC. AND SUBSIDIARIES
NOTES TO CONSOLIDATED FINANCIAL STATEMENTS—(Continued)
change in regulatory capital requirements for MUMSS, the MUFG Group contributed ¥15 billion and Morgan Stanley contributed ¥10 billion of additional proportionate capital investments on November 24, 2011, and the contribution by Morgan Stanley was recognized as an increase of noncontrolling interest.
MUTB’s Acquisition of Butterfield Fulcrum Group
On September 20, 2013, MUTB acquired 100% ownership of FGL Lux Holdings, S.a r.l., a holding company of Butterfield Fulcrum Group headquartered in Bermuda for ¥30,191 million in cash, and thereby recorded goodwill of ¥20,274 million. Butterfield Fulcrum Group is a global alternative fund administrator. MUTB has focused on strengthening its global trust banking business based on its medium-term management plan, and conducted several strategic investments in overseas asset managers. The purpose of this transaction, through the investment in a fund administration company, is to expand MUTB’s overseas asset administration capabilities. The assets acquired and liabilities assumed were recorded at their estimated fair values on the acquisition date. During the year ended March 31, 2014, measurement period adjustments were applied to the acquisition date fair values, which decreased goodwill by ¥5,831 million and recorded intangible assets of ¥21,646 million. After this transaction, Butterfield Fulcrum Group was renamed Mitsubishi UFJ Fund Services Holdings Limited.
BTMU’s Acquisition of Vietnam Joint Stock Commercial Bank for Industry and Trade
In May 2013, BTMU acquired approximately 20% of the ordinary shares of Vietnam Joint Stock Commercial Bank for Industry and Trade (“VietinBank”) for ¥75,136 million. VietinBank is one of the major Vietnamese state-owned commercial banks in terms of assets. Considering both BTMU’s ownership of the common stock and representation on the board of directors, the MUFG Group has determined that BTMU has the ability to exercise significant influence over the operating and financial policies of VietinBank and applied the equity method of accounting for its investment.
BTMU’s Acquisition of Bank of Ayudhya Public Company Limited
On December 18, 2013, BTMU completed a Voluntary Tender Offer (“VTO”) for Krungsri shares at Thai baht 39 per share. Upon the completion of VTO, BTMU purchased 72.01% of Krungsri’s total outstanding shares for ¥545,840 million in cash. As a result of the acquisition of a majority stake in Krungsri by BTMU, Krungsri has become a subsidiary of BTMU. The MUFG Group recorded goodwill of ¥217,386 million and intangible assets of ¥214,607 million. The MUFG Group also recorded noncontrolling interests of ¥202,223 million at fair value determined by a quoted market price as of the acquisition date. During the fiscal year ended March 31, 2014, the MUFG Group incurred ¥2,267 million of acquisition-related costs. These expenses are included in Other non-interest expenses in the accompanying consolidated statements of income for the fiscal year ended March 31, 2014. The results of operations of Krungsri and its subsidiaries since the acquisition date were not material to the MUFG Group for the fiscal year ended March 31, 2014.
Krungsri is a commercial bank in Thailand offering diversified financial services while holding wide range of client base and market knowledge. As a part of a strategy designed to further develop BTMU’s businesses in Asia, the investment in Krungsri aims to establish a full-fledged commercial banking platform in Asia. The purpose of the acquisition is to strengthen the business foundation in Asia with BTMU’s existing branch in Thailand by providing comprehensive financial services for various local customers and multinational corporate customers.
F-32
Table of Contents
MITSUBISHI UFJ FINANCIAL GROUP, INC. AND SUBSIDIARIES
NOTES TO CONSOLIDATED FINANCIAL STATEMENTS—(Continued)
The following table summarizes the estimated fair values of the assets acquired and liabilities assumed of Krungsri and its subsidiaries as of the acquisition date:
| (in millions) | ||||
|
Loans |
¥ | 2,934,656 | ||
|
Goodwill |
217,386 | |||
|
Intangible assets (1) |
214,607 | |||
|
Total assets |
4,144,517 | |||
|
Deposits—Total deposits |
2,488,862 | |||
|
Total liabilities |
3,396,454 | |||
Note:
| (1) | Intangible assets primarily include ¥124,290 million of customer relationships and ¥59,891 million of core deposit intangibles with weighted average amortization periods of 11 years. |
Included in the table above are loans with fair values totaling ¥2,883,981 million, which were not subject to the guidance on loans and debt securities acquired with deteriorated credit quality. As of the acquisition date, the gross contractual amounts receivable for these loans totaled ¥2,945,857 million, of which ¥91,404 million is not expected to be collected.
Pro forma statements of income
The following unaudited pro forma statements of income present the result of operations as if the acquisition of Krungsri had occurred on April 1, 2012:
| Fiscal years ended March 31, | ||||||||
| 2013 | 2014 | |||||||
| (in millions) | ||||||||
|
Statement of income data: |
||||||||
|
Net interest income |
¥ | 1,967,113 | ¥ | 2,102,038 | ||||
|
Non-interest income—Total |
2,127,990 | 1,903,620 | ||||||
|
Net income attributable to Mitsubishi UFJ Financial Group |
1,084,373 | 1,035,502 | ||||||
The unaudited pro forma statements of income include the pro forma adjustments to reflect the impact of amortizing certain acquisition accounting adjustments such as intangible assets subject to amortization of ¥12,871 million and ¥16,060 million for the fiscal years ended March 31, 2013 and 2014, respectively.
F-33
Table of Contents
MITSUBISHI UFJ FINANCIAL GROUP, INC. AND SUBSIDIARIES
NOTES TO CONSOLIDATED FINANCIAL STATEMENTS—(Continued)
| 3. | INVESTMENT SECURITIES |
The table below presents the amortized cost, gross unrealized gains and losses and fair value of investment securities available-for-sale and being held-to-maturity at March 31, 2013 and 2014:
|
At March 31, 2013: |
Amortized
cost |
Gross
unrealized gains |
Gross
unrealized losses |
Fair value | ||||||||||||
| (in millions) | ||||||||||||||||
|
Securities available-for-sale: |
||||||||||||||||
|
Debt securities: |
||||||||||||||||
|
Japanese national government and Japanese government agency bonds |
¥ | 49,159,827 | ¥ | 323,725 | ¥ | 3,598 | ¥ | 49,479,954 | ||||||||
|
Japanese prefectural and municipal bonds |
207,227 | 9,852 | 4 | 217,075 | ||||||||||||
|
Foreign governments and official institutions bonds |
701,504 | 17,814 | 3,022 | 716,296 | ||||||||||||
|
Corporate bonds |
1,868,599 | 55,044 | 697 | 1,922,946 | ||||||||||||
|
Residential mortgage-backed securities |
1,204,219 | 20,902 | 1,501 | 1,223,620 | ||||||||||||
|
Commercial mortgage-backed securities |
260,057 | 9,895 | 570 | 269,382 | ||||||||||||
|
Asset-backed securities |
813,312 | 1,132 | 3,766 | 810,678 | ||||||||||||
|
Other debt securities (1) |
109,365 | 2,247 | 4,898 | 106,714 | ||||||||||||
|
Marketable equity securities |
2,224,060 | 1,874,159 | 815 | 4,097,404 | ||||||||||||
|
|
|
|
|
|
|
|
|
|||||||||
|
Total |
¥ | 56,548,170 | ¥ | 2,314,770 | ¥ | 18,871 | ¥ | 58,844,069 | ||||||||
|
|
|
|
|
|
|
|
|
|||||||||
|
Securities being held-to-maturity: |
||||||||||||||||
|
Debt securities: |
||||||||||||||||
|
Japanese national government and Japanese government agency bonds |
¥ | 232,881 | ¥ | 1,883 | ¥ | — | ¥ | 234,764 | ||||||||
|
Foreign governments and official institutions bonds |
284,315 | 2,409 | — | 286,724 | ||||||||||||
|
Corporate bonds |
23,555 | 173 | — | 23,728 | ||||||||||||
|
Residential mortgage-backed securities |
86,722 | 1,056 | (2) | 11 | 87,767 | |||||||||||
|
Asset-backed securities |
1,503,691 | 51,396 | — | (3) | 1,555,087 | |||||||||||
|
|
|
|
|
|
|
|
|
|||||||||
|
Total |
¥ | 2,131,164 | ¥ | 56,917 | ¥ | 11 | ¥ | 2,188,070 | ||||||||
|
|
|
|
|
|
|
|
|
|||||||||
Notes:
| (1) | Other debt securities in the table above include ¥106,699 million of private placement debt conduit bonds. |
| (2) | The MUFG Group reclassified residential mortgage-backed securities, which totaled ¥12,356 million at fair value, from Securities available-for-sale to Securities being held-to-maturity during the fiscal year ended March 31, 2013. As a result of the reclassification, the unrealized gains before taxes at the date of reclassification remaining in Accumulated OCI in the accompanying consolidated balance sheets was ¥395 million at March 31, 2013 and not included in the table above. |
| (3) | MUAH reclassified collateralized loan obligations (“CLOs”), which totaled ¥111,895 million at fair value, from Securities available-for-sale to Securities being held-to-maturity during the fiscal year ended March 31, 2010. As a result of the reclassification, the unrealized losses before taxes at the date of reclassification remaining in Accumulated OCI in the accompanying consolidated balance sheets was ¥1,460 million at March 31, 2013 and not included in the table above. |
F-34
Table of Contents
MITSUBISHI UFJ FINANCIAL GROUP, INC. AND SUBSIDIARIES
NOTES TO CONSOLIDATED FINANCIAL STATEMENTS—(Continued)
|
At March 31, 2014: |
Amortized
cost |
Gross
unrealized gains |
Gross
unrealized losses |
Fair value | ||||||||||||
| (in millions) | ||||||||||||||||
|
Securities available-for-sale: |
||||||||||||||||
|
Debt securities: |
||||||||||||||||
|
Japanese national government and Japanese government agency bonds |
¥ | 41,388,592 | ¥ | 201,539 | ¥ | 1,122 | ¥ | 41,589,009 | ||||||||
|
Japanese prefectural and municipal bonds |
195,176 | 7,979 | 24 | 203,131 | ||||||||||||
|
Foreign governments and official institutions bonds |
1,272,181 | 13,460 | 14,220 | 1,271,421 | ||||||||||||
|
Corporate bonds |
1,523,026 | 38,920 | 817 | 1,561,129 | ||||||||||||
|
Residential mortgage-backed securities |
1,011,644 | 665 | 31,714 | 980,595 | ||||||||||||
|
Commercial mortgage-backed securities |
208,690 | 826 | 9,370 | 200,146 | ||||||||||||
|
Asset-backed securities |
1,060,844 | 2,747 | 5,547 | 1,058,044 | ||||||||||||
|
Other debt securities (1) |
184,495 | 3,650 | 3,199 | 184,946 | ||||||||||||
|
Marketable equity securities |
2,456,992 | 2,384,949 | 4,710 | 4,837,231 | ||||||||||||
|
|
|
|
|
|
|
|
|
|||||||||
|
Total |
¥ | 49,301,640 | ¥ | 2,654,735 | ¥ | 70,723 | ¥ | 51,885,652 | ||||||||
|
|
|
|
|
|
|
|
|
|||||||||
|
Securities being held-to-maturity: |
||||||||||||||||
|
Debt securities: |
||||||||||||||||
|
Japanese national government and Japanese government agency bonds |
¥ | 214,968 | ¥ | 870 | ¥ | — | ¥ | 215,838 | ||||||||
|
Foreign governments and official institutions bonds |
22,091 | 1,099 | — | 23,190 | ||||||||||||
|
Corporate bonds |
5,548 | 7 | — | 5,555 | ||||||||||||
|
Residential mortgage-backed securities |
526,431 | 883 | (2) | 7,304 | (3) | 520,010 | ||||||||||
|
Commercial mortgage-backed securities |
159,532 | 343 | 1,282 | (3) | 158,593 | |||||||||||
|
Asset-backed securities |
1,778,412 | 35,908 | 2,379 | 1,811,941 | ||||||||||||
|
|
|
|
|
|
|
|
|
|||||||||
|
Total |
¥ | 2,706,982 | ¥ | 39,110 | ¥ | 10,965 | ¥ | 2,735,127 | ||||||||
|
|
|
|
|
|
|
|
|
|||||||||
Notes:
| (1) | Other debt securities in the table above include ¥182,613 million of private placement debt conduit bonds. |
| (2) | As a result of the reclassification during the fiscal year ended March 31, 2013, the unrealized gains before taxes at the date of reclassification remaining in Accumulated OCI in the accompanying consolidated balance sheets were ¥355 million at March 31, 2014 and not included in the table above. |
| (3) | MUAH reclassified residential mortgage-backed securities and commercial mortgage-backed securities, which were carried at fair value of ¥273,195 million and ¥138,340 million, respectively, from Securities available-for-sale to Securities being held-to-maturity during the fiscal year ended March 31, 2014. As a result of the reclassification, the unrealized losses before taxes at the date of reclassification remaining in Accumulated OCI in the accompanying consolidated balance sheets were ¥7,702 million and ¥9,663 million, respectively, at March 31, 2014 and not included in the table above. |
Other Securities
Investment securities other than Securities available-for-sale or being held-to-maturity (i.e., nonmarketable equity securities presented in Other investment securities) were primarily carried at cost of ¥864,052 million and ¥711,416 million at March 31, 2013 and 2014, respectively, because their fair values were not readily determinable.
The remaining balances were investment securities held by certain subsidiaries subject to specialized industry accounting principles for investment companies and brokers and dealers and carried at fair value of ¥25,900 million and ¥26,201 million at March 31, 2013 and 2014, respectively. See Note 31 for the valuation techniques and inputs used to estimate the fair values.
F-35
Table of Contents
MITSUBISHI UFJ FINANCIAL GROUP, INC. AND SUBSIDIARIES
NOTES TO CONSOLIDATED FINANCIAL STATEMENTS—(Continued)
With respect to cost-method investments of ¥357,805 million and ¥159,556 million at March 31, 2013 and 2014, respectively, the MUFG Group has estimated a fair value using commonly accepted valuation techniques to determine whether the investment is impaired in each reporting period. See Note 31 for the details of these commonly accepted valuation techniques. If the fair value of the investment is less than the cost of the investment, the MUFG Group proceeds to evaluate whether the impairment is other-than-temporary.
With respect to cost-method investments of ¥506,247 million and ¥551,860 million at March 31, 2013 and 2014, respectively, the MUFG Group performed a test to determine whether any impairment indicator existed for each investment in each reporting period. If an impairment indicator exists, the MUFG Group estimates the fair value of the cost-method investment. If the fair value of the investment is less than the cost of the investment, the MUFG Group performs evaluation of whether the impairment is other-than-temporary. The primary method the MUFG Group uses to identify impairment indicators is a comparison of the MUFG Group’s share in an investee’s net assets to the cost of the MUFG Group’s investment in the investee. The MUFG Group also considers whether significant adverse changes in the regulatory, economic or technological environment have occurred with respect to the investee. The MUFG Group periodically monitors the status of each investee including the credit rating, which is generally updated once a year based on the annual financial statements of the issuer. In addition, if an event that could impact the credit rating of an investee occurs, the MUFG Group reassesses the appropriateness of the credit rating assigned to the issuer in order to maintain an updated credit rating. The MUFG Group did not estimate the fair value of those cost-method investments, which had aggregated costs of ¥503,671 million and ¥548,679 million at March 31, 2013 and 2014, respectively, since it was not practical and the MUFG Group identified no impairment indicators.
Based on the procedures described above, the MUFG Group recognized other-than-temporary impairment losses on the cost-method investment of ¥5,829 million, ¥2,364 million and ¥3,628 million for the fiscal years ended March 31, 2012, 2013 and 2014, respectively. Each impairment loss was recognized based on the specific circumstances of each individual company. No impairment loss was individually material.
Contractual Maturities
The amortized cost and fair values of debt securities being held-to-maturity and the fair values of debt securities available-for-sale at March 31, 2014 by contractual maturity are shown below. Expected maturities may be shorter than contractual maturities because issuers of debt securities may have the right to call or prepay obligations with or without penalties. Debt securities not due at a single maturity date and securities embedded with call or prepayment options, such as mortgage-backed securities, are included in the table below based on their contractual maturities.
| Held-to-maturity | Available-for-sale | |||||||||||
|
Amortized
cost |
Fair value | Fair value | ||||||||||
| (in millions) | ||||||||||||
|
Due in one year or less |
¥ | 214,084 | ¥ | 214,812 | ¥ | 15,899,122 | ||||||
|
Due from one year to five years |
77,117 | 77,455 | 21,777,591 | |||||||||
|
Due from five years to ten years |
1,403,762 | 1,436,763 | 6,414,994 | |||||||||
|
Due after ten years |
1,012,019 | 1,006,097 | 2,956,714 | |||||||||
|
|
|
|
|
|
|
|||||||
|
Total |
¥ | 2,706,982 | ¥ | 2,735,127 | ¥ | 47,048,421 | ||||||
|
|
|
|
|
|
|
|||||||
F-36
Table of Contents
MITSUBISHI UFJ FINANCIAL GROUP, INC. AND SUBSIDIARIES
NOTES TO CONSOLIDATED FINANCIAL STATEMENTS—(Continued)
Realized Gains and Losses and Transfers of Investment Securities
For the fiscal years ended March 31, 2012, 2013 and 2014, gross realized gains on sales of investment securities available-for-sale were ¥233,253 million, ¥282,609 million and ¥261,384 million, respectively, and gross realized losses on sales of investment securities available-for-sale were ¥56,226 million, ¥31,906 million and ¥54,921 million, respectively.
In the second half of the fiscal year ended March 31, 2012, the MUFG Group determined that it no longer had the intent to hold a certain security, which had a carrying value of ¥7,856 million, to maturity in response to a significant deterioration in the issuer’s creditworthiness. As a result, the MUFG Group transferred from Securities being held-to-maturity to Securities available-for-sale. The MUFG Group sold all amount of such security by March 31, 2012. The realized losses resulting from the sale of the security recognized in the second half of the fiscal year ended March 31, 2012 were ¥691 million.
For the fiscal year ended March 31, 2013, the MUFG Group determined that it no longer had the intent to hold certain securities, which had a carrying value of ¥47,566 million, to maturity in response to a significant deterioration in the issuers’ creditworthiness. As a result, the MUFG Group transferred these securities from Securities being held-to-maturity to Securities available-for-sale. These securities were sold and the MUFG Group recorded a loss of ¥1,518 million for the fiscal year ended March 31, 2013.
On September 30, 2012, MUAH transferred certain CLOs with a carrying amount of ¥88,799 million from Securities being held-to-maturity to Securities available-for-sale, due to a significant increase in the risk weights of debt securities used for regulatory capital purposes under rules proposed by the U.S. federal banking agencies in June 2012. The Notices of Proposed Rulemaking (“NPRs”) would revise regulatory capital rules for U.S. Banking organizations and align them with the Basel III capital framework issued by the Basel Committee on Banking Supervision. Although the NPRs had not been formally adopted, MUAH was required to include in its 2013 annual capital plan certain capital projections pursuant to the NPRs that adversely affected the risk weights of the transferred CLOs. These regulatory capital changes were not foreseeable when MUAH initially transferred the CLOs from Securities available-for-sale to Securities being held-to-maturity during the fiscal year ended March 31, 2010. Accordingly, MUAH no longer intended to hold these securities to maturity. The carrying amount of the CLOs immediately prior to the transfer on September 30, 2012, totaled ¥88,799 million, which included ¥24,026 million of unrealized losses in unamortized OCI. Following the transfer, the securities were recorded at fair value, with an unrealized loss of ¥4,949 million recorded in OCI.
The MUFG Group transferred Securities available-for-sale of ¥12,356 million to Securities being held-to-maturity during the fiscal year ended March 31, 2013. The MUFG Group has asserted the positive intent and ability to hold these securities to maturity.
For the fiscal year ended March 31, 2014, MUAH transferred certain residential mortgage-backed securities and commercial mortgage-backed securities of ¥411,535 million from Securities available-for-sale to Securities being held-to-maturity to reduce the impact of price volatility on Accumulated OCI and in consideration of changes to regulatory capital requirements under U.S. Basel III rules.
Other-than-temporary Impairments of Securities Available-for-Sale and Being Held-to-Maturity
For the fiscal years ended March 31, 2012, 2013 and 2014, losses resulting from impairment of investment securities to reflect the decline in value considered to be other-than-temporary were ¥195,684 million, ¥124,172 million and ¥6,534 million, respectively, which were included in Investment securities gains—net in the accompanying consolidated statements of income. The losses of ¥195,684 million for the fiscal year ended
F-37
Table of Contents
MITSUBISHI UFJ FINANCIAL GROUP, INC. AND SUBSIDIARIES
NOTES TO CONSOLIDATED FINANCIAL STATEMENTS—(Continued)
March 31, 2012 included losses of ¥13,782 million from debt securities available-for-sale mainly classified as corporate bonds and ¥176,073 million from marketable equity securities. The losses of ¥124,172 million for the fiscal year ended March 31, 2013 included losses of ¥8,329 million from debt securities available-for-sale mainly classified as corporate bonds, and ¥113,479 million from marketable equity securities. The losses of ¥6,534 million for the fiscal year ended March 31, 2014 included losses of ¥2,605 million from debt securities available-for-sale mainly classified as corporate bonds, and ¥3,628 million from nonmarketable equity securities.
Gross Unrealized Losses and Fair Value
The following tables show the unrealized gross losses and fair values of investment securities available-for-sale and being held-to-maturity at March 31, 2013 and 2014 by length of time that individual securities in each category have been in a continuous loss position:
| Less than 12 months | 12 months or more | Total | ||||||||||||||||||||||||||
|
At March 31, 2013: |
Fair value |
Gross
unrealized losses |
Fair value |
Gross
unrealized losses |
Fair value |
Gross
unrealized losses |
Number of
securities |
|||||||||||||||||||||
| (in millions, except number of securities) | ||||||||||||||||||||||||||||
|
Securities available-for-sale: |
||||||||||||||||||||||||||||
|
Debt securities: |
||||||||||||||||||||||||||||
|
Japanese national government and Japanese government agency bonds |
¥ | 6,859,342 | ¥ | 672 | ¥ | 584,048 | ¥ | 2,926 | ¥ | 7,443,390 | ¥ | 3,598 | 33 | |||||||||||||||
|
Japanese prefectural and municipal bonds |
1,486 | 4 | — | — | 1,486 | 4 | 1 | |||||||||||||||||||||
|
Foreign governments and official institutions bonds |
157,287 | 2,867 | 11,332 | 155 | 168,619 | 3,022 | 108 | |||||||||||||||||||||
|
Corporate bonds |
76,521 | 306 | 56,953 | 391 | 133,474 | 697 | 1,360 | |||||||||||||||||||||
|
Residential mortgage-backed securities |
102,511 | 276 | 25,766 | 1,225 | 128,277 | 1,501 | 182 | |||||||||||||||||||||
|
Commercial mortgage-backed securities |
58,459 | 530 | 12,134 | 40 | 70,593 | 570 | 24 | |||||||||||||||||||||
|
Asset-backed securities |
17,239 | 37 | 85,069 | 3,729 | 102,308 | 3,766 | 131 | |||||||||||||||||||||
|
Other debt securities |
71,217 | 4,898 | — | — | 71,217 | 4,898 | 49 | |||||||||||||||||||||
|
Marketable equity securities |
15,143 | 694 | 870 | 121 | 16,013 | 815 | 23 | |||||||||||||||||||||
|
|
|
|
|
|
|
|
|
|
|
|
|
|
|
|||||||||||||||
|
Total |
¥ | 7,359,205 | ¥ | 10,284 | ¥ | 776,172 | ¥ | 8,587 | ¥ | 8,135,377 | ¥ | 18,871 | 1,911 | |||||||||||||||
|
|
|
|
|
|
|
|
|
|
|
|
|
|
|
|||||||||||||||
|
Securities being held-to-maturity: |
||||||||||||||||||||||||||||
|
Debt securities: |
||||||||||||||||||||||||||||
|
Residential mortgage-backed securities |
¥ | 3,370 | ¥ | 11 | ¥ | — | ¥ | — | ¥ | 3,370 | ¥ | 11 | 10 | |||||||||||||||
|
|
|
|
|
|
|
|
|
|
|
|
|
|
|
|||||||||||||||
|
Total |
¥ | 3,370 | ¥ | 11 | ¥ | — | ¥ | — | ¥ | 3,370 | ¥ | 11 | 10 | |||||||||||||||
|
|
|
|
|
|
|
|
|
|
|
|
|
|
|
|||||||||||||||
F-38
Table of Contents
MITSUBISHI UFJ FINANCIAL GROUP, INC. AND SUBSIDIARIES
NOTES TO CONSOLIDATED FINANCIAL STATEMENTS—(Continued)
| Less than 12 months | 12 months or more | Total | ||||||||||||||||||||||||||
|
At March 31, 2014: |
Fair value |
Gross
unrealized losses |
Fair value |
Gross
unrealized losses |
Fair value |
Gross
unrealized losses |
Number of
securities |
|||||||||||||||||||||
| (in millions, except number of securities) | ||||||||||||||||||||||||||||
|
Securities available-for-sale: |
||||||||||||||||||||||||||||
|
Debt securities: |
||||||||||||||||||||||||||||
|
Japanese national government and Japanese government agency bonds |
¥ | 10,469,832 | ¥ | 1,122 | — | — | ¥ | 10,469,832 | ¥ | 1,122 | 49 | |||||||||||||||||
|
Japanese prefectural and municipal bonds |
12,555 | 24 | — | — | 12,555 | 24 | 6 | |||||||||||||||||||||
|
Foreign governments and official institutions bonds |
527,706 | 9,084 | 110,015 | 5,136 | 637,721 | 14,220 | 150 | |||||||||||||||||||||
|
Corporate bonds |
136,296 | 709 | 29,242 | 108 | 165,538 | 817 | 815 | |||||||||||||||||||||
|
Residential mortgage-backed securities |
904,239 | 31,094 | 28,406 | 620 | 932,645 | 31,714 | 431 | |||||||||||||||||||||
|
Commercial mortgage-backed securities |
135,014 | 8,427 | 8,235 | 943 | 143,249 | 9,370 | 155 | |||||||||||||||||||||
|
Asset-backed securities |
213,683 | 5,518 | 1,078 | 29 | 214,761 | 5,547 | 103 | |||||||||||||||||||||
|
Other debt securities |
46,835 | 1,203 | 68,630 | 1,996 | 115,465 | 3,199 | 51 | |||||||||||||||||||||
|
Marketable equity securities |
175,884 | 4,692 | 1 | 18 | 175,885 | 4,710 | 42 | |||||||||||||||||||||
|
|
|
|
|
|
|
|
|
|
|
|
|
|
|
|||||||||||||||
|
Total |
¥ | 12,622,044 | ¥ | 61,873 | ¥ | 245,607 | ¥ | 8,850 | ¥ | 12,867,651 | ¥ | 70,723 | 1,802 | |||||||||||||||
|
|
|
|
|
|
|
|
|
|
|
|
|
|
|
|||||||||||||||
|
Securities being held-to-maturity: |
||||||||||||||||||||||||||||
|
Debt securities: |
||||||||||||||||||||||||||||
|
Residential mortgage-backed securities |
¥ | 408,244 | ¥ | 7,187 | ¥ | 5,681 | ¥ | 117 | ¥ | 413,925 | ¥ | 7,304 | 198 | |||||||||||||||
|
Commercial mortgage-backed securities |
107,048 | 1,033 | 51,545 | 249 | 158,593 | 1,282 | 28 | |||||||||||||||||||||
|
Asset-backed securities |
500,695 | 2,379 | — | — | 500,695 | 2,379 | 22 | |||||||||||||||||||||
|
|
|
|
|
|
|
|
|
|
|
|
|
|
|
|||||||||||||||
|
Total |
¥ | 1,015,987 | ¥ | 10,599 | ¥ | 57,226 | ¥ | 366 | ¥ | 1,073,213 | ¥ | 10,965 | 248 | |||||||||||||||
|
|
|
|
|
|
|
|
|
|
|
|
|
|
|
|||||||||||||||
Evaluating Investment Securities for Other-than-temporary Impairments
The following describes the nature of the MUFG Group’s investments and the conclusions reached in determining whether the unrealized losses were temporary or other-than-temporary.
Japanese national government and Japanese government agency bonds, Foreign governments and official institutions bonds
As of March 31, 2014, unrealized losses associated with these securities were deemed to be attributable to changes in market interest rates rather than a deterioration in the creditworthiness of the underlying obligor. The MUFG Group expects to recover the entire amortized cost basis of these securities. Accordingly, such changes are considered to be temporary and no impairment loss has been recorded.
Residential and commercial mortgage-backed securities
As of March 31, 2014, unrealized losses associated with these securities were deemed to be attributable to changes in market interest rates rather than a deterioration in the creditworthiness of the underlying obligor. Based on a consideration of factors, including cash flow analysis, the MUFG Group expects to recover the entire amortized cost basis of these securities. Accordingly, such changes are considered to be temporary and no impairment loss has been recorded.
F-39
Table of Contents
MITSUBISHI UFJ FINANCIAL GROUP, INC. AND SUBSIDIARIES
NOTES TO CONSOLIDATED FINANCIAL STATEMENTS—(Continued)
Asset-backed securities
As of March 31, 2014, unrealized losses on these securities are primarily driven by certain CLOs, highly illiquid securities for which fair values are difficult to determine. Unrealized losses arise from widening credit spreads, deterioration of the credit quality of the underlying collateral, uncertainty regarding the valuation of such securities and the market’s view of the performance of the fund managers. When the fair value of a security is lower than its amortized cost or when any security is subject to a deterioration in credit rating, the MUFG Group undertakes a cash flow analysis of the underlying collateral to estimate the other-than-temporary impairment. Based on the analysis performed no other-than-temporary impairment was identified as of March 31, 2014 and no impairment loss was therefore recorded.
Corporate bonds
As of March 31, 2014, the unrealized losses associated with corporate bonds are primarily related to private placement bonds issued by Japanese non-public companies. The credit loss component recognized in earnings is identified as the amount of principal cash flows not expected to be received over the remaining terms of the bonds as estimated using the MUFG Group’s cash flow projections. The key assumptions include probability of default based on credit ratings of the bond issuers and a loss given default.
The following table presents a roll-forward of the credit loss component recognized in earnings. The balance at the beginning of each fiscal year represents the credit loss component for which an other-than-temporary impairment occurred on debt securities in prior periods. The additions represent the first time a debt security was credit impaired or when subsequent credit impairment has occurred. The credit loss component is reduced when the corporate bonds mature or are sold. Additionally, the credit loss component is reduced if the MUFG Group receives or expects to receive cash flows in excess of what the MUFG Group previously expected to receive over the remaining life of the credit impaired debt securities.
| 2012 | 2013 | 2014 | ||||||||||
| (in millions) | ||||||||||||
|
Balance at beginning of fiscal year |
¥ | 35,458 | ¥ | 30,066 | ¥ | 24,525 | ||||||
|
Additions: |
||||||||||||
|
Initial credit impairments |
8,596 | 5,347 | 1,466 | |||||||||
|
Subsequent credit impairments |
5,186 | 2,982 | 1,139 | |||||||||
|
Reductions: |
||||||||||||
|
Securities sold or matured |
(19,174 | ) | (13,870 | ) | (14,574 | ) | ||||||
|
|
|
|
|
|
|
|||||||
|
Balance at end of fiscal year |
¥ | 30,066 | ¥ | 24,525 | ¥ | 12,556 | ||||||
|
|
|
|
|
|
|
|||||||
The cumulative decline in fair value of the credit impaired debt securities, which were mainly corporate bonds, held at March 31, 2013 and 2014 was ¥13,047 million and ¥4,933 million, respectively. Of which, the credit loss component recognized in earnings was ¥24,525 million and ¥12,556 million, and the remaining amount related to all other factors recognized in Accumulated OCI before taxes was ¥11,479 million and ¥7,625 million at March 31, 2013 and 2014, respectively.
Other debt securities
As of March 31, 2014, other debt securities primarily consist of private placement debt conduit bonds, which are not rated by external credit rating agencies. The unrealized losses on these bonds resulted from a higher return on capital expected by the secondary market compared with the return on capital required at the time of origination when the bonds were purchased. The MUFG Group estimated loss projections for each security by assessing the underlying collateral of each security. The MUFG Group estimates the portion of loss
F-40
Table of Contents
MITSUBISHI UFJ FINANCIAL GROUP, INC. AND SUBSIDIARIES
NOTES TO CONSOLIDATED FINANCIAL STATEMENTS—(Continued)
attributable to credit based on the expected cash flows of the underlying collateral using estimates of current key assumptions such as probability of default and loss severity. Cash flow analysis of the underlying collateral provides an estimate of other-than-temporary impairment, which is performed when the fair value of a security is lower than its amortized cost and potential impairment is identified. Based on the analysis, no other-than-temporary impairment loss was recorded in the accompanying consolidated statements of income.
Marketable equity securities
The MUFG Group determines whether unrealized losses on marketable equity securities are temporary based on its ability and positive intent to hold the investments for a period of time sufficient to allow for any anticipated recovery and the results of its review conducted to identify and evaluate investments that have indications of possible impairment. Impairment is evaluated considering various factors, and their relative significance varies from case to case. The MUFG Group’s review includes, but is not limited to, consideration of the following factors:
The length of time that fair value of the investment has been below cost —The MUFG Group generally deems a continued decline of fair value below cost for six months or more to be other-than-temporary.
The extent to which the fair value of investments has been below cost as of the end of the reporting period —The MUFG Group’s investment portfolio is exposed to volatile equity prices affected by many factors including investors’ perspectives as to future economic prospects and the issuers’ performance. The MUFG Group generally deems the decline in fair value below cost of 20% or more as an indicator of an other-than-temporary decline in fair value.
The financial condition and near-term prospects of the issuer —The MUFG Group considers the financial condition and near-term prospects of the issuer primarily based on the credit standing of the issuers as determined by its credit rating system.
At March 31, 2014, unrealized losses on marketable equity securities which have been in a continuous loss position are considered temporary based on the evaluation as described above, and the fact that the MUFG Group primarily makes these investments for strategic purposes to maintain long-term relationships with its customers.
F-41
Table of Contents
MITSUBISHI UFJ FINANCIAL GROUP, INC. AND SUBSIDIARIES
NOTES TO CONSOLIDATED FINANCIAL STATEMENTS—(Continued)
| 4. | LOANS AND ALLOWANCE FOR CREDIT LOSSES |
Loans at March 31, 2013 and 2014 by domicile and industry of the borrower are summarized below. Classification of loans by industry is based on the industry segment loan classifications as defined by the Bank of Japan.
| 2013 | 2014 | |||||||
| (in millions) | ||||||||
|
Domestic: |
||||||||
|
Manufacturing |
¥ | 11,767,352 | ¥ | 11,540,753 | ||||
|
Construction |
1,056,276 | 980,877 | ||||||
|
Real estate |
11,143,777 | 10,989,562 | ||||||
|
Services |
2,881,666 | 2,693,561 | ||||||
|
Wholesale and retail |
8,330,553 | 8,475,143 | ||||||
|
Banks and other financial institutions (1) |
3,622,021 | 3,985,106 | ||||||
|
Communication and information services |
1,314,505 | 1,443,466 | ||||||
|
Other industries |
12,191,566 | 13,496,763 | ||||||
|
Consumer |
17,132,396 | 16,921,352 | ||||||
|
|
|
|
|
|||||
|
Total domestic |
69,440,112 | 70,526,583 | ||||||
|
|
|
|
|
|||||
|
Foreign: |
||||||||
|
Governments and official institutions |
673,548 | 811,475 | ||||||
|
Banks and other financial institutions (1) |
7,258,978 | 9,792,255 | ||||||
|
Commercial and industrial |
18,738,731 | 24,533,816 | ||||||
|
Other |
2,601,338 | 4,872,372 | ||||||
|
|
|
|
|
|||||
|
Total foreign |
29,272,595 | 40,009,918 | ||||||
|
|
|
|
|
|||||
|
Unearned income, unamortized premiums—net and deferred loan fees—net |
(122,478 | ) | (260,090 | ) | ||||
|
|
|
|
|
|||||
|
Total (2) |
¥ | 98,590,229 | ¥ | 110,276,411 | ||||
|
|
|
|
|
|||||
Notes:
| (1) | Loans to the so-called non-bank finance companies are generally included in the “Banks and other financial institutions” category. Non-bank finance companies are primarily engaged in consumer lending, factoring and credit card businesses. |
| (2) | The above table includes loans held for sale of ¥35,261 million and ¥46,635 million at March 31, 2013 and 2014, respectively, which are carried at the lower of cost or estimated fair value. |
Nonaccrual Loans
Originated loans are generally placed on nonaccrual status when substantial doubt exists as to the full and timely collection of either principal or interest, when principal or interest is contractually past due one month or more with respect to loans within all classes of the Commercial segment, three months or more with respect to loans within the Card, MUAH, and Krungsri segments, and six months or more with respect to loans within the Residential segment. See Note 1 for further information.
F-42
Table of Contents
MITSUBISHI UFJ FINANCIAL GROUP, INC. AND SUBSIDIARIES
NOTES TO CONSOLIDATED FINANCIAL STATEMENTS—(Continued)
The nonaccrual status of loans by class at March 31, 2013 and 2014 is shown below:
| 2013 | 2014 | |||||||
| (in millions) | ||||||||
|
Commercial |
||||||||
|
Domestic |
¥ | 911,700 | ¥ | 737,896 | ||||
|
Manufacturing |
211,975 | 167,859 | ||||||
|
Construction |
37,381 | 30,093 | ||||||
|
Real estate |
185,597 | 141,974 | ||||||
|
Services |
85,987 | 72,059 | ||||||
|
Wholesale and retail |
249,251 | 211,770 | ||||||
|
Banks and other financial institutions |
13,993 | 7,234 | ||||||
|
Communication and information services |
31,941 | 24,956 | ||||||
|
Other industries |
42,513 | 35,959 | ||||||
|
Consumer |
53,062 | 45,992 | ||||||
|
Foreign-excluding MUAH and Krungsri |
98,085 | 82,617 | ||||||
|
Residential |
130,830 | 111,252 | ||||||
|
Card |
88,045 | 72,483 | ||||||
|
MUAH |
43,670 | 46,574 | ||||||
|
Krungsri |
— | 25,973 | ||||||
|
|
|
|
|
|||||
|
Total (1) |
¥ | 1,272,330 | ¥ | 1,076,795 | ||||
|
|
|
|
|
|||||
Note:
| (1) | The above table does not include loans held for sale of ¥818 million and nil at March 31, 2013 and 2014, respectively, and loans acquired with deteriorated credit quality of ¥21,965 million and ¥38,651 million at March 31, 2013 and 2014, respectively. |
Impaired Loans
The MUFG Group’s impaired loans primarily include nonaccrual loans and TDRs. The following table shows information about impaired loans by class at March 31, 2013 and 2014:
| Recorded Loan Balance | ||||||||||||||||||||
|
At March 31, 2013: |
Requiring
an Allowance for Credit Losses |
Not Requiring
an Allowance for Credit Losses (1) |
Total (2) |
Unpaid
Principal Balance |
Related
Allowance for Credit Losses |
|||||||||||||||
| (in millions) | ||||||||||||||||||||
|
Commercial |
||||||||||||||||||||
|
Domestic |
¥ | 1,158,927 | ¥ | 318,028 | ¥ | 1,476,955 | ¥ | 1,537,180 | ¥ | 662,347 | ||||||||||
|
Manufacturing |
400,946 | 55,819 | 456,765 | 475,946 | 221,124 | |||||||||||||||
|
Construction |
35,581 | 16,921 | 52,502 | 59,411 | 22,577 | |||||||||||||||
|
Real estate |
139,146 | 100,670 | 239,816 | 247,657 | 55,286 | |||||||||||||||
|
Services |
122,792 | 37,774 | 160,566 | 166,510 | 67,171 | |||||||||||||||
|
Wholesale and retail |
309,892 | 62,274 | 372,166 | 380,292 | 209,634 | |||||||||||||||
|
Banks and other financial institutions |
15,201 | 121 | 15,322 | 17,425 | 8,040 | |||||||||||||||
|
Communication and information services |
40,233 | 12,954 | 53,187 | 55,021 | 23,719 | |||||||||||||||
|
Other industries |
42,991 | 9,794 | 52,785 | 53,754 | 33,485 | |||||||||||||||
|
Consumer |
52,145 | 21,701 | 73,846 | 81,164 | 21,311 | |||||||||||||||
|
Foreign-excluding MUAH |
199,890 | 299 | 200,189 | 200,517 | 122,371 | |||||||||||||||
|
Loans acquired with deteriorated credit quality |
30,927 | 76 | 31,003 | 47,916 | 9,944 | |||||||||||||||
|
Residential |
300,231 | 13,756 | 313,987 | 363,439 | 118,753 | |||||||||||||||
|
Card |
123,567 | 806 | 124,373 | 139,196 | 37,901 | |||||||||||||||
|
MUAH |
31,293 | 22,966 | 54,259 | 60,732 | 3,645 | |||||||||||||||
|
|
|
|
|
|
|
|
|
|
|
|||||||||||
|
Total (4) |
¥ | 1,844,835 | ¥ | 355,931 | ¥ | 2,200,766 | ¥ | 2,348,980 | ¥ | 954,961 | ||||||||||
|
|
|
|
|
|
|
|
|
|
|
|||||||||||
F-43
Table of Contents
MITSUBISHI UFJ FINANCIAL GROUP, INC. AND SUBSIDIARIES
NOTES TO CONSOLIDATED FINANCIAL STATEMENTS—(Continued)
| Recorded Loan Balance | ||||||||||||||||||||
|
At March 31, 2014: |
Requiring
an Allowance for Credit Losses |
Not Requiring
an Allowance for Credit Losses (1) |
Total (2) |
Unpaid
Principal Balance |
Related
Allowance for Credit Losses |
|||||||||||||||
| (in millions) | ||||||||||||||||||||
|
Commercial |
||||||||||||||||||||
|
Domestic |
¥ | 1,006,333 | ¥ | 257,215 | ¥ | 1,263,548 | ¥ | 1,312,320 | ¥ | 544,224 | ||||||||||
|
Manufacturing |
368,866 | 55,003 | 423,869 | 431,745 | 181,389 | |||||||||||||||
|
Construction |
30,537 | 13,298 | 43,835 | 45,323 | 18,731 | |||||||||||||||
|
Real estate |
141,225 | 63,625 | 204,850 | 212,353 | 52,814 | |||||||||||||||
|
Services |
101,969 | 27,342 | 129,311 | 139,299 | 54,469 | |||||||||||||||
|
Wholesale and retail |
248,932 | 58,633 | 307,565 | 317,614 | 169,523 | |||||||||||||||
|
Banks and other financial institutions |
8,295 | 94 | 8,389 | 8,403 | 6,954 | |||||||||||||||
|
Communication and information services |
25,443 | 11,509 | 36,952 | 39,292 | 16,473 | |||||||||||||||
|
Other industries |
36,821 | 9,634 | 46,455 | 47,866 | 26,903 | |||||||||||||||
|
Consumer |
44,245 | 18,077 | 62,322 | 70,425 | 16,968 | |||||||||||||||
|
Foreign-excluding MUAH and Krungsri |
193,360 | 2,360 | 195,720 | 195,935 | 96,218 | |||||||||||||||
|
Loans acquired with deteriorated credit quality |
18,787 | 186 | 18,973 | 32,078 | 6,111 | |||||||||||||||
|
Residential |
203,600 | 11,563 | 215,163 | 255,627 | 70,393 | |||||||||||||||
|
Card |
102,852 | 762 | 103,614 | 115,819 | 29,244 | |||||||||||||||
|
MUAH |
39,552 | 24,457 | 64,009 | 71,210 | 4,131 | |||||||||||||||
|
Krungsri (3) |
— | — | — | — | — | |||||||||||||||
|
|
|
|
|
|
|
|
|
|
|
|||||||||||
|
Total (4) |
¥ | 1,564,484 | ¥ | 296,543 | ¥ | 1,861,027 | ¥ | 1,982,989 | ¥ | 750,321 | ||||||||||
|
|
|
|
|
|
|
|
|
|
|
|||||||||||
Notes:
| (1) | These loans do not require an allowance for credit losses because the fair values of the impaired loans equal or exceed the recorded investments in the loans. |
| (2) | Included in impaired loans at March 31, 2013 and 2014 are accrual TDRs as follows: ¥671,083 million and ¥642,408 million—Commercial; ¥ 178,576 million and ¥99,359 million—Residential; ¥61,195 million and ¥51,834 million—Card; and ¥34,769million and ¥38,666 million—MUAH, respectively. |
| (3) | For the Krungsri segment, acquired loans were recorded at their fair values as of the acquisition date, and there have been no indications that allowance for credit loss is necessary for these loans since then. Therefore, no impaired loans were stated in the above table. |
| (4) | In addition to impaired loans presented in the above table, there were loans held for sale that were impaired of ¥818 million and nil at March 31, 2013 and 2014, respectively. |
F-44
Table of Contents
MITSUBISHI UFJ FINANCIAL GROUP, INC. AND SUBSIDIARIES
NOTES TO CONSOLIDATED FINANCIAL STATEMENTS—(Continued)
The following table shows information regarding the average recorded loan balance and recognized interest income on impaired loans for the fiscal years ended March 31, 2012, 2013 and 2014:
| Fiscal years ended March 31, | ||||||||||||||||||||||||
| 2012 | 2013 | 2014 | ||||||||||||||||||||||
|
Average
Recorded Loan Balance |
Recognized
Interest Income |
Average
Recorded Loan Balance |
Recognized
Interest Income |
Average
Recorded Loan Balance |
Recognized
Interest Income |
|||||||||||||||||||
| (in millions) | ||||||||||||||||||||||||
|
Commercial |
||||||||||||||||||||||||
|
Domestic |
¥ | 1,270,856 | ¥ | 21,356 | ¥ | 1,414,309 | ¥ | 24,051 | ¥ | 1,359,635 | ¥ | 23,283 | ||||||||||||
|
Manufacturing |
333,409 | 5,656 | 418,402 | 7,017 | 430,415 | 6,954 | ||||||||||||||||||
|
Construction |
63,215 | 1,370 | 54,687 | 1,174 | 47,818 | 982 | ||||||||||||||||||
|
Real estate |
173,739 | 2,476 | 198,102 | 2,747 | 228,045 | 3,472 | ||||||||||||||||||
|
Services |
176,047 | 3,203 | 170,025 | 3,214 | 140,627 | 2,806 | ||||||||||||||||||
|
Wholesale and retail |
326,440 | 5,239 | 376,001 | 6,215 | 339,619 | 5,857 | ||||||||||||||||||
|
Banks and other financial institutions |
9,812 | 85 | 11,506 | 162 | 10,719 | 170 | ||||||||||||||||||
|
Communication and information services |
55,387 | 1,152 | 51,897 | 1,061 | 44,417 | 945 | ||||||||||||||||||
|
Other industries |
57,612 | 927 | 58,081 | 1,271 | 49,612 | 985 | ||||||||||||||||||
|
Consumer |
75,195 | 1,248 | 75,608 | 1,190 | 68,363 | 1,112 | ||||||||||||||||||
|
Foreign-excluding MUAH and Krungsri |
138,900 | 1,016 | 172,471 | 2,487 | 187,656 | 2,848 | ||||||||||||||||||
|
Loans acquired with deteriorated credit quality |
35,307 | 1,983 | 32,964 | 2,028 | 30,101 | 1,659 | ||||||||||||||||||
|
Residential |
318,512 | 6,549 | 320,183 | 6,006 | 264,277 | 5,153 | ||||||||||||||||||
|
Card |
149,255 | 6,972 | 135,581 | 6,504 | 113,993 | 5,218 | ||||||||||||||||||
|
MUAH |
45,297 | 1,354 | 46,957 | 1,720 | 60,943 | 3,468 | ||||||||||||||||||
|
Krungsri |
— | — | — | — | — | — | ||||||||||||||||||
|
|
|
|
|
|
|
|
|
|
|
|
|
|||||||||||||
|
Total |
¥ | 1,958,127 | ¥ | 39,230 | ¥ | 2,122,465 | ¥ | 42,796 | ¥ | 2,016,605 | ¥ | 41,629 | ||||||||||||
|
|
|
|
|
|
|
|
|
|
|
|
|
|||||||||||||
Interest income on nonaccrual loans for all classes was recognized on a cash basis when ultimate collectibility of principal was certain. Otherwise, cash receipts were applied as principal reductions. Interest income on accruing impaired loans, including TDRs, was recognized on an accrual basis to the extent that the collectibility of interest income was reasonably certain based on management’s assessment.
F-45
Table of Contents
MITSUBISHI UFJ FINANCIAL GROUP, INC. AND SUBSIDIARIES
NOTES TO CONSOLIDATED FINANCIAL STATEMENTS—(Continued)
The following table shows a rollforward of accrual TDRs and other impaired loans (including nonaccrual TDRs) for the fiscal years ended March 31, 2013 and 2014:
| Fiscal years ended March 31, | ||||||||
| 2013 | 2014 | |||||||
| (in millions) | ||||||||
|
Accrual TDRs: |
||||||||
|
Balance at beginning of fiscal year |
¥ | 892,823 | ¥ | 945,623 | ||||
|
Additions (new accrual TDR status) |
302,267 | 231,063 | ||||||
|
Transfers to other impaired loans (including nonaccrual TDRs) |
(56,064 | ) | (48,295 | ) | ||||
|
Loans sold |
(49 | ) | (7,698 | ) | ||||
|
Principal payments and other |
(193,354 | ) | (288,426 | ) | ||||
|
|
|
|
|
|||||
|
Balance at end of fiscal year |
¥ | 945,623 | ¥ | 832,267 | ||||
|
|
|
|
|
|||||
|
Other impaired loans (including nonaccrual TDRs): |
||||||||
|
Balance at beginning of fiscal year |
¥ | 1,139,045 | ¥ | 1,255,143 | ||||
|
Additions (new other impaired loans (including nonaccrual TDRs) status) (1) |
500,063 | 313,086 | ||||||
|
Charge-off |
(46,835 | ) | (123,037 | ) | ||||
|
Transfers to accrual TDRs |
(28,474 | ) | (63,828 | ) | ||||
|
Loans sold |
(18,618 | ) | (39,879 | ) | ||||
|
Principal payments and other |
(290,038 | ) | (312,725 | ) | ||||
|
|
|
|
|
|||||
|
Balance at end of fiscal year |
¥ | 1,255,143 | ¥ | 1,028,760 | ||||
|
|
|
|
|
|||||
Note:
| (1) | Included in additions of other impaired loans for the fiscal years ended March 31, 2013 and 2014 are nonaccrual TDRs as follows: ¥16,903 million and ¥11,054 million—Card; and ¥17,513 million and ¥16,228 million—MUAH, respectively. |
F-46
Table of Contents
MITSUBISHI UFJ FINANCIAL GROUP, INC. AND SUBSIDIARIES
NOTES TO CONSOLIDATED FINANCIAL STATEMENTS—(Continued)
Troubled Debt Restructurings
The following tables summarize the MUFG Group’s TDRs by class during the fiscal years ended March 31, 2013 and 2014 and outstanding recorded investment balances of TDRs by class at March 31, 2013 and 2014:
| Fiscal year ended March 31, 2013 |
At March 31,
2013 |
|||||||||||||||
|
Troubled Debt
Restructurings (4) |
Troubled Debt Restructurings
That Subsequently Defaulted |
Troubled Debt
Restructurings |
||||||||||||||
|
Pre-
Modification Outstanding Recorded Investment |
Post-
Modification Outstanding Recorded Investment |
Recorded
Investment |
Outstanding
recorded investment balances (2) |
|||||||||||||
| (in millions) | ||||||||||||||||
|
Commercial (1)(3) |
||||||||||||||||
|
Domestic |
¥ | 222,125 | ¥ | 222,125 | ¥ | 6,741 | ¥ | 567,926 | ||||||||
|
Manufacturing |
131,105 | 131,105 | 2,729 | 247,133 | ||||||||||||
|
Construction |
3,921 | 3,921 | — | 15,130 | ||||||||||||
|
Real estate |
17,409 | 17,409 | 1,444 | 54,221 | ||||||||||||
|
Services |
12,564 | 12,564 | 295 | 74,777 | ||||||||||||
|
Wholesale and retail |
42,061 | 42,061 | 1,024 | 122,986 | ||||||||||||
|
Banks and other financial institutions |
889 | 889 | 330 | 1,329 | ||||||||||||
|
Communication and information services |
8,442 | 8,442 | 434 | 21,246 | ||||||||||||
|
Other industries |
1,927 | 1,927 | 415 | 10,321 | ||||||||||||
|
Consumer |
3,807 | 3,807 | 70 | 20,783 | ||||||||||||
|
Foreign-excluding MUAH |
10,142 | 10,142 | 419 | 103,157 | ||||||||||||
|
Loans acquired with deteriorated credit quality |
524 | 524 | 509 | — | ||||||||||||
|
Residential (1)(3) |
50,005 | 50,005 | 349 | 178,576 | ||||||||||||
|
Card (2)(3) |
26,409 | 26,055 | 4,507 | 124,373 | ||||||||||||
|
MUAH (2) (3) |
30,091 | 27,832 | 2,155 | 52,848 | ||||||||||||
|
|
|
|
|
|
|
|
|
|||||||||
|
Total |
¥ | 339,296 | ¥ | 336,683 | ¥ | 14,680 | ¥ | 1,026,880 | ||||||||
|
|
|
|
|
|
|
|
|
|||||||||
Notes:
| (1) | TDRs for the Commercial and Residential segments include accruing loans with concessions granted, and do not include nonaccrual loans with concessions granted. |
| (2) | TDRs for the Card and MUAH segments include accrual and nonaccrual loans. Included in the outstanding recorded investment balances as of March 31, 2013 are nonaccrual TDRs as follows: ¥63,178 million—Card and ¥18,079 million—MUAH, respectively. |
| (3) | For the fiscal year ended March 31, 2013, extension of the stated maturity date of loans was the primary concession type in the Commercial and Residential segments, whereas reduction in the stated rate and payment deferrals were the primary concession types in the Card and MUAH segments, respectively. |
| (4) | From the fiscal year ended March 31, 2014, the MUFG Group started to report the amounts of TDRs which include only the first modification for those which are modified more than once during the same period, in place of the previously reported amounts which include accumulated loan modification activity, such as reduction in stated rate or extension of stated maturity date, that may occur on multiple occasions during the same period. The amounts for the fiscal year ended March 31, 2013 were revised to conform to the current year presentation and enable comparisons between the relevant amounts for the fiscal years ended March 31, 2013 and 2014, respectively. |
F-47
Table of Contents
MITSUBISHI UFJ FINANCIAL GROUP, INC. AND SUBSIDIARIES
NOTES TO CONSOLIDATED FINANCIAL STATEMENTS—(Continued)
| Fiscal year ended March 31, 2014 |
At March 31,
2014 |
|||||||||||||||
|
Troubled Debt
Restructurings (4) |
Troubled Debt Restructurings
That Subsequently Defaulted |
Troubled Debt
Restructurings |
||||||||||||||
|
Pre-
Modification Outstanding Recorded Investment |
Post-
Modification Outstanding Recorded Investment |
Recorded
Investment |
Outstanding
recorded investment balances (2) |
|||||||||||||
| (in millions) | ||||||||||||||||
|
Commercial (1)(3) |
||||||||||||||||
|
Domestic |
¥ | 175,011 | ¥ | 151,505 | ¥ | 22,503 | ¥ | 528,133 | ||||||||
|
Manufacturing |
93,968 | 70,462 | 11,644 | 257,049 | ||||||||||||
|
Construction |
3,435 | 3,435 | 86 | 13,751 | ||||||||||||
|
Real estate |
21,977 | 21,977 | 1,174 | 64,028 | ||||||||||||
|
Services |
13,149 | 13,149 | 1,481 | 57,480 | ||||||||||||
|
Wholesale and retail |
32,458 | 32,458 | 5,834 | 95,809 | ||||||||||||
|
Banks and other financial institutions |
1 | 1 | — | 1,156 | ||||||||||||
|
Communication and information services |
1,802 | 1,802 | 1,639 | 11,996 | ||||||||||||
|
Other industries |
4,414 | 4,414 | 152 | 10,496 | ||||||||||||
|
Consumer |
3,807 | 3,807 | 493 | 16,368 | ||||||||||||
|
Foreign-excluding MUAH and Krungsri |
20,175 | 20,175 | — | 114,275 | ||||||||||||
|
Loans acquired with deteriorated credit quality |
7,616 | 7,616 | — | — | ||||||||||||
|
Residential (1)(3) |
32,777 | 32,777 | 474 | 99,359 | ||||||||||||
|
Card (2)(3) |
17,141 | 16,869 | 4,015 | 103,614 | ||||||||||||
|
MUAH (2)(3) |
29,945 | 29,403 | 2,912 | 62,363 | ||||||||||||
|
Krungsri (2) |
— | — | — | — | ||||||||||||
|
|
|
|
|
|
|
|
|
|||||||||
|
Total |
¥ | 282,665 | ¥ | 258,345 | ¥ | 29,904 | ¥ | 907,744 | ||||||||
|
|
|
|
|
|
|
|
|
|||||||||
Notes:
| (1) | TDRs for the Commercial and Residential segments include accruing loans with concessions granted, and do not include nonaccrual loans with concessions granted. |
| (2) | TDRs for the Card, MUAH and Krungsri segments include accrual and nonaccrual loans. Included in the outstanding recorded investment balances as of March 31, 2014 are nonaccrual TDRs as follows: ¥51,780 million—Card and ¥23,697 million—MUAH, respectively. |
| (3) | For the fiscal year ended March 31, 2014, extension of the stated maturity date of loans was the primary concession type in the Commercial and Residential segments, whereas reduction in the stated rate and payment deferrals were the primary concession types in the Card and MUAH segments, respectively. |
| (4) | From the fiscal year ended March 31, 2014, the MUFG Group started to report the amounts of TDRs which include only the first modification for those which are modified more than once during the same period, in place of the previously reported amounts which include accumulated loan modification activity, such as reduction in stated rate or extension of stated maturity date, that may occur on multiple occasions during the same period. |
A modification of terms of a loan under a TDR mainly involves: (i) a reduction in the stated interest rate applicable to the loan, (ii) an extension of the stated maturity date of the loan, (iii) a partial forgiveness of the principal of the loan, or (iv) a combination of all of these. Those loans are also considered impaired loans, and hence the allowance for credit losses is separately established for each loan. As a result, the amount of allowance for credit losses increases in many cases upon classification as a TDR loan. The amount of pre-modification outstanding recorded investment and post-modification outstanding recorded investment may differ due to write-
F-48
Table of Contents
MITSUBISHI UFJ FINANCIAL GROUP, INC. AND SUBSIDIARIES
NOTES TO CONSOLIDATED FINANCIAL STATEMENTS—(Continued)
offs made as part of the concession, and the impact of write-offs associated with TDRs on the MUFG Group’s results of operations for the fiscal years ended March 31, 2013 and 2014 was not material.
TDRs for the Commercial and Residential segments in the above table include accruing loans with concessions granted, and do not include nonaccrual loans with concessions granted. Once a loan is classified as a nonaccrual loan, a modification would have little likelihood of resulting in the recovery of the loan in view of the severity of the financial difficulty of the borrower. Therefore even if a nonaccrual loan is modified, the loan continues to be classified as a nonaccrual loan. The vast majority of modifications to nonaccrual loans are temporary extensions of the maturity dates, typically for periods up to 90 days, and continually made as the borrower is unable to repay or refinance the loan at the extended maturity. Accordingly, the impact of such TDRs on the outstanding recorded investment is immaterial, and the vast majority of nonaccrual TDRs have subsequently defaulted.
TDRs that subsequently defaulted in the Commercial and Residential segments of the above table includes those accruing loans that became past due one month or more within the Commercial segment and six months or more within the Residential segment, and those accruing loans reclassified to nonaccrual loans due to financial difficulties even without delinquencies. This is because classification as nonaccrual loan is regarded as default under the MUFG Group’s credit policy. Also, the MUFG Group defines default as payment default for the purpose of the disclosure.
Regarding the Card, MUAH and Krungsri segments, the TDRs in the above table represent modified nonaccrual and accruing loans, and the defaulted loans in the above table represent nonaccruing and accruing loans that became past due one month or more within the Card segment, 60 days or more within the MUAH segment, and six months or more within the Krungsri segment.
Historical payment defaults are one of the factors considered when projecting future cash flows in determining the allowance for credit losses for each segment.
The MUFG Group provided commitments to extend credit to customers with TDRs. The amounts of such commitments were ¥10,662 million and ¥44,116 million at March 31, 2013 and 2014, respectively. See Note 24 for further discussion of commitments to extend credit.
F-49
Table of Contents
MITSUBISHI UFJ FINANCIAL GROUP, INC. AND SUBSIDIARIES
NOTES TO CONSOLIDATED FINANCIAL STATEMENTS—(Continued)
Credit Quality Indicator
Credit quality indicators of loans by class at March 31, 2013 and 2014 are shown below:
|
At March 31, 2013: |
Normal |
Close
Watch |
Likely to become
Bankrupt or Legally/Virtually Bankrupt |
Total (1) | ||||||||||||
| (in millions) | ||||||||||||||||
|
Commercial |
||||||||||||||||
|
Domestic |
¥ | 48,099,471 | ¥ | 4,476,760 | ¥ | 911,868 | ¥ | 53,488,099 | ||||||||
|
Manufacturing |
10,062,399 | 1,481,403 | 211,975 | 11,755,777 | ||||||||||||
|
Construction |
797,513 | 220,465 | 37,381 | 1,055,359 | ||||||||||||
|
Real estate |
9,570,082 | 898,619 | 185,678 | 10,654,379 | ||||||||||||
|
Services |
2,417,737 | 362,719 | 85,987 | 2,866,443 | ||||||||||||
|
Wholesale and retail |
7,297,267 | 747,938 | 249,253 | 8,294,458 | ||||||||||||
|
Banks and other financial institutions |
3,239,735 | 367,189 | 13,993 | 3,620,917 | ||||||||||||
|
Communication and information services |
1,183,208 | 98,722 | 31,941 | 1,313,871 | ||||||||||||
|
Other industries |
11,951,463 | 192,291 | 42,592 | 12,186,346 | ||||||||||||
|
Consumer |
1,580,067 | 107,414 | 53,068 | 1,740,549 | ||||||||||||
|
Foreign-excluding MUAH |
22,340,927 | 1,530,191 | 89,832 | 23,960,950 | ||||||||||||
|
Loans acquired with deteriorated credit quality |
30,972 | 52,007 | 18,334 | 101,313 | ||||||||||||
|
|
|
|
|
|
|
|
|
|||||||||
|
Total |
¥ | 70,471,370 | ¥ | 6,058,958 | ¥ | 1,020,034 | ¥ | 77,550,362 | ||||||||
|
|
|
|
|
|
|
|
|
|||||||||
| Accrual | Nonaccrual | Total (1) | ||||||||||
| (in millions) | ||||||||||||
|
Residential |
¥ | 15,067,823 | ¥ | 133,410 | ¥ | 15,201,233 | ||||||
|
Card |
¥ | 582,510 | ¥ | 89,095 | ¥ | 671,605 | ||||||
|
Credit Quality Based on
the Number of Delinquencies |
Credit Quality Based on
Internal Credit Ratings |
|||||||||||||||||||||||
| Accrual | Nonaccrual | Pass |
Special
Mention |
Classified | Total (1)(2) | |||||||||||||||||||
| (in millions) | ||||||||||||||||||||||||
|
MUAH |
¥ | 2,260,777 | ¥ | 31,342 | ¥ | 2,745,365 | ¥ | 69,437 | ¥ | 80,433 | ¥ | 5,187,354 | ||||||||||||
F-50
Table of Contents
MITSUBISHI UFJ FINANCIAL GROUP, INC. AND SUBSIDIARIES
NOTES TO CONSOLIDATED FINANCIAL STATEMENTS—(Continued)
|
At March 31, 2014: |
Normal | Close Watch |
Likely to become
Bankrupt or Legally/Virtually Bankrupt |
Total (1) | ||||||||||||
| (in millions) | ||||||||||||||||
|
Commercial |
||||||||||||||||
|
Domestic |
¥ | 50,608,911 | ¥ | 3,549,135 | ¥ | 737,692 | ¥ | 54,895,738 | ||||||||
|
Manufacturing |
10,032,892 | 1,329,356 | 167,859 | 11,530,107 | ||||||||||||
|
Construction |
786,640 | 163,313 | 30,093 | 980,046 | ||||||||||||
|
Real estate |
9,747,076 | 716,302 | 141,774 | 10,605,152 | ||||||||||||
|
Services |
2,279,379 | 328,142 | 72,059 | 2,679,580 | ||||||||||||
|
Wholesale and retail |
7,582,548 | 651,659 | 211,770 | 8,445,977 | ||||||||||||
|
Banks and other financial institutions |
3,959,266 | 18,494 | 7,234 | 3,984,994 | ||||||||||||
|
Communication and information services |
1,349,217 | 68,863 | 24,956 | 1,443,036 | ||||||||||||
|
Other industries |
13,274,021 | 182,727 | 36,054 | 13,492,802 | ||||||||||||
|
Consumer |
1,597,872 | 90,279 | 45,893 | 1,734,044 | ||||||||||||
|
Foreign-excluding MUAH and Krungsri |
28,399,163 | 1,132,038 | 84,849 | 29,616,050 | ||||||||||||
|
Loans acquired with deteriorated credit quality |
32,430 | 33,100 | 10,210 | 75,740 | ||||||||||||
|
|
|
|
|
|
|
|
|
|||||||||
|
Total |
¥ | 79,040,504 | ¥ | 4,714,273 | ¥ | 832,751 | ¥ | 84,587,528 | ||||||||
|
|
|
|
|
|
|
|
|
|||||||||
| Accrual | Nonaccrual | Total (1) | ||||||||||
| (in millions) | ||||||||||||
|
Residential |
¥ | 14,864,856 | ¥ | 113,449 | ¥ | 14,978,305 | ||||||
|
Card |
¥ | 535,511 | ¥ | 73,110 | ¥ | 608,621 | ||||||
|
Credit Quality Based on
the Number of Delinquencies |
Credit Quality Based on
Internal Credit Ratings |
|||||||||||||||||||||||
| Accrual | Nonaccrual | Pass |
Special
Mention |
Classified | Total (1)(2) | |||||||||||||||||||
| (in millions) | ||||||||||||||||||||||||
|
MUAH |
¥ | 3,003,826 | ¥ | 34,989 | ¥ | 3,946,961 | ¥ | 98,645 | ¥ | 95,167 | ¥ | 7,179,588 | ||||||||||||
| Normal |
Special
Mention |
Substandard or
Doubtful or Doubtful of Loss |
Total (1) | |||||
| (in millions) | ||||||||
|
Krungsri |
¥2,923,087 | ¥101,184 | ¥51,590 | ¥3,075,861 | ||||
Notes:
| (1) | Total loans in the above table do not include loans held for sale. |
| (2) | Total loans of MUAH do not include Federal Deposit Insurance Corporation (“FDIC”) covered loans and small business loans which are not individually rated totaling ¥66,892 million and ¥59,963 million as of March 31, 2013 and 2014, respectively. The MUFG Group will be reimbursed for a substantial portion of any future losses on FDIC covered loans under the terms of the FDIC loss share agreements. |
The MUFG Group classifies loans into risk categories based on relevant information about the ability of borrowers to service their debt, including, but not limited to, historical and current financial information, historical and current payment experience, credit documentation, public and non-public information about borrowers and current economic trends as deemed appropriate to each segment.
The primary credit quality indicator for loans within all classes of the Commercial segment is the internal credit rating assigned to each borrower based on the MUFG Group’s internal borrower ratings of 1 through 15,
F-51
Table of Contents
MITSUBISHI UFJ FINANCIAL GROUP, INC. AND SUBSIDIARIES
NOTES TO CONSOLIDATED FINANCIAL STATEMENTS—(Continued)
with the rating of 1 assigned to a borrower with the highest quality of credit. When assigning a credit rating to a borrower, the MUFG Group evaluates the borrower’s expected debt-service capability based on various information, including financial and operating information of the borrower as well as information on the industry in which the borrower operates, and the borrower’s business profile, management and compliance system. In evaluating a borrower’s debt-service capability, the MUFG Group also conducts an assessment of the level of earnings and an analysis of the borrower’s net worth. Based on the internal borrower rating, loans within the Commercial segment are categorized as Normal (internal borrower ratings of 1 through 9), Close Watch (internal borrower ratings of 10 through 12), and Likely to become Bankrupt or Legally/Virtually Bankrupt (internal borrower ratings of 13 through 15).
Loans to borrowers categorized as Normal represent those that are not deemed to have collectibility issues.
Loans to borrowers categorized as Close Watch represent those that require close monitoring as the borrower has begun to exhibit elements of potential concern with respect to its business performance and financial condition, the borrower has begun to exhibit elements of serious concern with respect to its business performance and financial condition, including business problems requiring long-term solutions, or the borrower’s loans are TDRs or loans contractually past due 90 days or more for special reasons.
Loans to borrowers categorized as Likely to become Bankrupt or Legally/Virtually Bankrupt represent those that have a higher probability of default than those categorized as Close Watch due to serious debt repayment problems with poor progress in achieving restructuring plans, the borrower being considered virtually bankrupt with no prospects for an improvement in business operations, or the borrower being legally bankrupt with no prospects for continued business operations because of non-payment, suspension of business, voluntary liquidation or filing for legal liquidation.
The accrual status is a primary credit quality indicator for loans within the Residential segment, the Card segment and consumer loans within the MUAH segment. The accrual status of these loans is determined based on the number of delinquent payments. See Note 1 for further details of categorization of Accrual and Nonaccrual.
Commercial loans within the MUAH segment are categorized as either pass or criticized based on the internal credit rating assigned to each borrower. Criticized credits are those that are internally risk graded as special mention, substandard or doubtful. Special mention credits are potentially weak, as the borrower has begun to exhibit deteriorating trends, which, if not corrected, may jeopardize repayment of the loan and result in further downgrade. Classified credits are those that are internally risk graded as substandard or doubtful. Substandard credits have well-defined weaknesses, which, if not corrected, could jeopardize the full satisfaction of the debt. A credit classified as doubtful has critical weaknesses that make full collection improbable on the basis of currently existing facts and conditions.
Loans within the Krungsri segment are categorized as Normal, Special mention, Substandard, Doubtful, and Doubtful of loss primarily based on their delinquency status. Loans categorized as Special mention generally represent those that have the overdue principal or interest payments for a cumulative period exceeding one month commencing from the contractual due date. Loans categorized as Substandard, Doubtful or Doubtful of loss generally represent those that have the overdue principal or interest payments for a cumulative period exceeding three months commencing from the contractual due date.
For the Commercial, Residential and Card segments, credit quality indicators are based on information as of March 31. For the MUAH and Krungsri segment, credit quality indicators are generally based on information as of December 31.
F-52
Table of Contents
MITSUBISHI UFJ FINANCIAL GROUP, INC. AND SUBSIDIARIES
NOTES TO CONSOLIDATED FINANCIAL STATEMENTS—(Continued)
Past Due Analysis
Ages of past due loans by class at March 31, 2013 and 2014 are shown below:
|
At March 31, 2013: |
1-3 months
Past Due |
Greater
Than 3 months |
Total
Past Due |
Current |
Total
Loans (1)(2) |
Recorded
Investment> 90 Days and Accruing |
||||||||||||||||||
| (in millions) | ||||||||||||||||||||||||
|
Commercial |
||||||||||||||||||||||||
|
Domestic |
¥ | 45,915 | ¥ | 84,823 | ¥ | 130,738 | ¥ | 53,357,361 | ¥ | 53,488,099 | ¥ | 7,545 | ||||||||||||
|
Manufacturing |
6,963 | 15,307 | 22,270 | 11,733,507 | 11,755,777 | 24 | ||||||||||||||||||
|
Construction |
2,118 | 1,881 | 3,999 | 1,051,360 | 1,055,359 | 37 | ||||||||||||||||||
|
Real estate |
5,339 | 15,071 | 20,410 | 10,633,969 | 10,654,379 | 2,255 | ||||||||||||||||||
|
Services |
12,215 | 7,537 | 19,752 | 2,846,691 | 2,866,443 | 80 | ||||||||||||||||||
|
Wholesale and retail |
10,106 | 24,050 | 34,156 | 8,260,302 | 8,294,458 | 82 | ||||||||||||||||||
|
Banks and other financial institutions |
— | 72 | 72 | 3,620,845 | 3,620,917 | 2 | ||||||||||||||||||
|
Communication and information services |
2,286 | 2,835 | 5,121 | 1,308,750 | 1,313,871 | 12 | ||||||||||||||||||
|
Other industries |
1,592 | 6,809 | 8,401 | 12,177,945 | 12,186,346 | 11 | ||||||||||||||||||
|
Consumer |
5,296 | 11,261 | 16,557 | 1,723,992 | 1,740,549 | 5,042 | ||||||||||||||||||
|
Foreign-excluding MUAH |
19,806 | 17,686 | 37,492 | 23,923,458 | 23,960,950 | 206 | ||||||||||||||||||
|
Residential |
91,148 | 55,132 | 146,280 | 15,037,723 | 15,184,003 | 32,918 | ||||||||||||||||||
|
Card |
23,680 | 39,796 | 63,476 | 594,896 | 658,372 | — | ||||||||||||||||||
|
MUAH |
30,736 | 17,922 | 48,658 | 5,102,991 | 5,151,649 | 69 | ||||||||||||||||||
|
|
|
|
|
|
|
|
|
|
|
|
|
|||||||||||||
|
Total |
¥ | 211,285 | ¥ | 215,359 | ¥ | 426,644 | ¥ | 98,016,429 | ¥ | 98,443,073 | ¥ | 40,738 | ||||||||||||
|
|
|
|
|
|
|
|
|
|
|
|
|
|||||||||||||
|
At March 31, 2014: |
1-3 months
Past Due |
Greater
Than 3 months |
Total
Past Due |
Current |
Total
Loans (1)(2) |
Recorded
Investment> 90 Days and Accruing |
||||||||||||||||||
| (in millions) | ||||||||||||||||||||||||
|
Commercial |
||||||||||||||||||||||||
|
Domestic |
¥ | 26,210 | ¥ | 53,632 | ¥ | 79,842 | ¥ | 54,815,896 | ¥ | 54,895,738 | ¥ | 6,543 | ||||||||||||
|
Manufacturing |
5,363 | 7,192 | 12,555 | 11,517,552 | 11,530,107 | — | ||||||||||||||||||
|
Construction |
718 | 664 | 1,382 | 978,664 | 980,046 | 1 | ||||||||||||||||||
|
Real estate |
4,859 | 9,689 | 14,548 | 10,590,604 | 10,605,152 | 2,233 | ||||||||||||||||||
|
Services |
4,315 | 2,781 | 7,096 | 2,672,484 | 2,679,580 | 10 | ||||||||||||||||||
|
Wholesale and retail |
4,624 | 22,829 | 27,453 | 8,418,524 | 8,445,977 | 3 | ||||||||||||||||||
|
Banks and other financial institutions |
1 | 52 | 53 | 3,984,941 | 3,984,994 | — | ||||||||||||||||||
|
Communication and information services |
680 | 1,371 | 2,051 | 1,440,985 | 1,443,036 | — | ||||||||||||||||||
|
Other industries |
667 | 1,554 | 2,221 | 13,490,581 | 13,492,802 | — | ||||||||||||||||||
|
Consumer |
4,983 | 7,500 | 12,483 | 1,721,561 | 1,734,044 | 4,296 | ||||||||||||||||||
|
Foreign-excluding MUAH and Krungsri |
3,283 | 7,109 | 10,392 | 29,605,658 | 29,616,050 | 357 | ||||||||||||||||||
|
Residential |
85,549 | 54,462 | 140,011 | 14,822,995 | 14,963,006 | 40,500 | ||||||||||||||||||
|
Card |
21,653 | 33,381 | 55,034 | 540,886 | 595,920 | — | ||||||||||||||||||
|
MUAH |
30,036 | 14,333 | 44,369 | 7,078,621 | 7,122,990 | 527 | ||||||||||||||||||
|
Krungsri |
66,871 | 22,121 | 88,992 | 2,936,194 | 3,025,186 | — | ||||||||||||||||||
|
|
|
|
|
|
|
|
|
|
|
|
|
|||||||||||||
|
Total |
¥ | 233,602 | ¥ | 185,038 | ¥ | 418,640 | ¥ | 109,800,250 | ¥ | 110,218,890 | ¥ | 47,927 | ||||||||||||
|
|
|
|
|
|
|
|
|
|
|
|
|
|||||||||||||
Notes:
| (1) | Total loans in the above table do not include loans held for sale and loans acquired with deteriorated credit quality. |
| (2) | Total loans of MUAH do not include ¥2,039 million and ¥1,600 million of FDIC covered loans at March 31, 2013 and 2014, respectively, which are not subject to the guidance on loans and debt securities acquired with deteriorated credit quality. |
F-53
Table of Contents
MITSUBISHI UFJ FINANCIAL GROUP, INC. AND SUBSIDIARIES
NOTES TO CONSOLIDATED FINANCIAL STATEMENTS—(Continued)
Allowance for Credit Losses
Changes in the allowance for credit losses by portfolio segment for the fiscal years ended March 31, 2012, 2013 and 2014 are shown below:
|
Fiscal year ended March 31, 2012: |
Commercial | Residential | Card | MUAH | Total | |||||||||||||||
| (in millions) | ||||||||||||||||||||
|
Allowance for credit losses: |
||||||||||||||||||||
|
Balance at beginning of fiscal year: |
¥ | 895,611 | ¥ | 165,215 | ¥ | 82,607 | ¥ | 97,023 | ¥ | 1,240,456 | ||||||||||
|
Provision (credit) for credit losses |
181,449 | 29,481 | 27,883 | (15,004 | ) | 223,809 | ||||||||||||||
|
Charge-offs |
126,157 | 23,075 | 43,073 | 24,494 | 216,799 | |||||||||||||||
|
Recoveries |
36,043 | 216 | 1,486 | 5,684 | 43,429 | |||||||||||||||
|
|
|
|
|
|
|
|
|
|
|
|||||||||||
|
Net charge-offs |
90,114 | 22,859 | 41,587 | 18,810 | 173,370 | |||||||||||||||
|
Others (1) |
(2,638 | ) | — | — | (2,750 | ) | (5,388 | ) | ||||||||||||
|
|
|
|
|
|
|
|
|
|
|
|||||||||||
|
Balance at end of fiscal year |
¥ | 984,308 | ¥ | 171,837 | ¥ | 68,903 | ¥ | 60,459 | ¥ | 1,285,507 | ||||||||||
|
|
|
|
|
|
|
|
|
|
|
|||||||||||
|
Fiscal year ended March 31, 2013: |
Commercial | Residential | Card | MUAH | Total | |||||||||||||||
| (in millions) | ||||||||||||||||||||
|
Allowance for credit losses: |
||||||||||||||||||||
|
Balance at beginning of fiscal year: |
¥ | 984,308 | ¥ | 171,837 | ¥ | 68,903 | ¥ | 60,459 | ¥ | 1,285,507 | ||||||||||
|
Provision for credit losses |
127,874 | 1,302 | 12,379 | 2,987 | 144,542 | |||||||||||||||
|
Charge-offs |
80,534 | 16,283 | 32,135 | 15,585 | 144,537 | |||||||||||||||
|
Recoveries |
23,410 | 353 | 2,723 | 5,189 | 31,675 | |||||||||||||||
|
|
|
|
|
|
|
|
|
|
|
|||||||||||
|
Net charge-offs |
57,124 | 15,930 | 29,412 | 10,396 | 112,862 | |||||||||||||||
|
Others (1) |
13,405 | — | — | 5,395 | 18,800 | |||||||||||||||
|
|
|
|
|
|
|
|
|
|
|
|||||||||||
|
Balance at end of fiscal year |
¥ | 1,068,463 | ¥ | 157,209 | ¥ | 51,870 | ¥ | 58,445 | ¥ | 1,335,987 | ||||||||||
|
|
|
|
|
|
|
|
|
|
|
|||||||||||
|
Fiscal year ended March 31, 2014: |
Commercial | Residential | Card | MUAH | Krungsri (2) | Total | ||||||||||||||||||
| (in millions) | ||||||||||||||||||||||||
|
Allowance for credit losses: |
||||||||||||||||||||||||
|
Balance at beginning of fiscal year: |
¥ | 1,068,463 | ¥ | 157,209 | ¥ | 51,870 | ¥ | 58,445 | ¥ | — | ¥ | 1,335,987 | ||||||||||||
|
Provision (credit) for credit losses |
(70,091 | ) | (35,952 | ) | 5,617 | (5,945 | ) | — | (106,371 | ) | ||||||||||||||
|
Charge-offs |
158,875 | 4,577 | 20,125 | 7,521 | — | 191,098 | ||||||||||||||||||
|
Recoveries |
29,478 | 230 | 3,264 | 4,378 | — | 37,350 | ||||||||||||||||||
|
|
|
|
|
|
|
|
|
|
|
|
|
|||||||||||||
|
Net charge-offs |
129,397 | 4,347 | 16,861 | 3,143 | — | 153,748 | ||||||||||||||||||
|
Others (1) |
7,882 | 3 | — | 10,667 | — | 18,552 | ||||||||||||||||||
|
|
|
|
|
|
|
|
|
|
|
|
|
|||||||||||||
|
Balance at end of fiscal year |
¥ | 876,857 | ¥ | 116,913 | ¥ | 40,626 | ¥ | 60,024 | ¥ | — | ¥ | 1,094,420 | ||||||||||||
|
|
|
|
|
|
|
|
|
|
|
|
|
|||||||||||||
Notes:
| (1) | Others are principally comprised of gains or losses from foreign exchange translation. |
| (2) | For the Krungsri segment, the acquired loans were recorded at their fair values as of the acquisition date, and there have been no indications that allowance for credit loss is necessary for these loans since then. Therefore, no allowance for credit loss was stated in the above table. |
F-54
Table of Contents
MITSUBISHI UFJ FINANCIAL GROUP, INC. AND SUBSIDIARIES
NOTES TO CONSOLIDATED FINANCIAL STATEMENTS—(Continued)
Allowance for credit losses and recorded investment in loans by portfolio segment at March 31, 2013 and 2014 are shown below:
|
At March 31, 2013: |
Commercial | Residential | Card | MUAH | Total | |||||||||||||||
| (in millions) | ||||||||||||||||||||
|
Allowance for credit losses: |
||||||||||||||||||||
|
Individually evaluated for impairment |
¥ | 784,718 | ¥ | 117,670 | ¥ | 37,901 | ¥ | 3,645 | ¥ | 943,934 | ||||||||||
|
Collectively evaluated for impairment |
248,798 | 37,360 | 13,809 | 54,705 | 354,672 | |||||||||||||||
|
Loans acquired with deteriorated credit quality |
34,947 | 2,179 | 160 | 95 | 37,381 | |||||||||||||||
|
|
|
|
|
|
|
|
|
|
|
|||||||||||
|
Total |
¥ | 1,068,463 | ¥ | 157,209 | ¥ | 51,870 | ¥ | 58,445 | ¥ | 1,335,987 | ||||||||||
|
|
|
|
|
|
|
|
|
|
|
|||||||||||
|
Loans: |
||||||||||||||||||||
|
Individually evaluated for impairment |
¥ | 1,677,144 | ¥ | 309,408 | ¥ | 123,519 | ¥ | 54,259 | ¥ | 2,164,330 | ||||||||||
|
Collectively evaluated for impairment |
75,771,905 | 14,874,595 | 534,853 | 5,099,429 | 96,280,782 | |||||||||||||||
|
Loans acquired with deteriorated credit quality |
101,313 | 17,230 | 13,233 | 100,558 | 232,334 | |||||||||||||||
|
|
|
|
|
|
|
|
|
|
|
|||||||||||
|
Total (1) |
¥ | 77,550,362 | ¥ | 15,201,233 | ¥ | 671,605 | ¥ | 5,254,246 | ¥ | 98,677,446 | ||||||||||
|
|
|
|
|
|
|
|
|
|
|
|||||||||||
|
At March 31, 2014: |
Commercial | Residential | Card | MUAH | Krungsri (2) | Total | ||||||||||||||||||
| (in millions) | ||||||||||||||||||||||||
|
Allowance for credit losses: |
||||||||||||||||||||||||
|
Individually evaluated for impairment |
¥ | 640,442 | ¥ | 69,613 | ¥ | 29,244 | ¥ | 4,131 | ¥ | — | ¥ | 743,430 | ||||||||||||
|
Collectively evaluated for impairment |
209,117 | 45,355 | 11,312 | 55,777 | — | 321,561 | ||||||||||||||||||
|
Loans acquired with deteriorated credit quality |
27,298 | 1,945 | 70 | 116 | — | 29,429 | ||||||||||||||||||
|
|
|
|
|
|
|
|
|
|
|
|
|
|||||||||||||
|
Total |
¥ | 876,857 | ¥ | 116,913 | ¥ | 40,626 | ¥ | 60,024 | ¥ | — | ¥ | 1,094,420 | ||||||||||||
|
|
|
|
|
|
|
|
|
|
|
|
|
|||||||||||||
|
Loans: |
||||||||||||||||||||||||
|
Individually evaluated for impairment |
¥ | 1,459,268 | ¥ | 211,802 | ¥ | 102,930 | ¥ | 64,009 | ¥ | — | ¥ | 1,838,009 | ||||||||||||
|
Collectively evaluated for impairment |
83,052,520 | 14,751,204 | 492,990 | 7,060,581 | 3,025,186 | 108,382,481 | ||||||||||||||||||
|
Loans acquired with deteriorated credit quality |
75,740 | 15,299 | 12,701 | 114,961 | 50,675 | 269,376 | ||||||||||||||||||
|
|
|
|
|
|
|
|
|
|
|
|
|
|||||||||||||
|
Total (1) |
¥ | 84,587,528 | ¥ | 14,978,305 | ¥ | 608,621 | ¥ | 7,239,551 | ¥ | 3,075,861 | ¥ | 110,489,866 | ||||||||||||
|
|
|
|
|
|
|
|
|
|
|
|
|
|||||||||||||
Notes:
| (1) | Total loans in the above table do not include loans held for sale and represent balances without adjustments in relation to unearned income, unamortized premiums and deferred loan fees. |
| (2) | For the Krungsri segment, acquired loans were recorded at their fair values as of the acquisition date, and there have been no indications that allowance for credit loss is necessary for these loans since then. Therefore, no allowance for credit loss was stated in the above table. |
Nonperforming loans were actively disposed of by sales during recent years. The allocated allowance for credit losses for such loans was removed from the allowance for credit losses and transferred to the valuation allowance for loans held for sale upon a decision to sell. Net charge-offs in the above table include a decrease in the allowance for credit losses due to loan disposal activity amounting to ¥1.2 billion, ¥0.4 billion and ¥16.2 billion for the fiscal years ended March 31, 2012, 2013 and 2014, respectively.
F-55
Table of Contents
MITSUBISHI UFJ FINANCIAL GROUP, INC. AND SUBSIDIARIES
NOTES TO CONSOLIDATED FINANCIAL STATEMENTS—(Continued)
The MUFG Group sold ¥706 billion, ¥884 billion and ¥906 billion of loans within the Commercial segment during the fiscal years ended March 31, 2012, 2013 and 2014, respectively.
The MUFG Group purchased ¥337 billion of loans within the MUAH segment during the fiscal year ended March 31, 2014. See Note 2 for MUB’s acquisition of PB Capital Corporation’s institutional CRE lending division.
Loans Acquired in a Transfer
In accordance with the guidance on loans and debt securities acquired with deteriorated credit quality, the following table sets forth information regarding loans acquired in connection with mergers, for which it is probable, at acquisition, that the MUFG Group will be unable to collect all contractually required payments receivable.
| 2013 | 2014 | |||||||
| (in millions) | ||||||||
|
Loans acquired during the fiscal year: |
||||||||
|
Contractually required payments receivable at acquisitions |
¥ | 117,468 | ¥ | 186,268 | ||||
|
Cash flows expected to be collected at acquisitions |
77,417 | 116,218 | ||||||
|
Fair value of loans at acquisition |
63,731 | 93,845 | ||||||
|
Accretable yield for loans within the scope of the guidance on loans and debt securities acquired with deteriorated credit quality: |
||||||||
|
Balance at beginning of fiscal year |
¥ | 86,877 | ¥ | 95,178 | ||||
|
Additions |
13,686 | 22,373 | ||||||
|
Accretion |
(39,981 | ) | (49,155 | ) | ||||
|
Disposals |
— | — | ||||||
|
Reclassifications from nonaccretable difference |
29,721 | 15,760 | ||||||
|
Foreign currency translation adjustments |
4,875 | 9,465 | ||||||
|
|
|
|
|
|||||
|
Balance at end of fiscal year |
¥ | 95,178 | ¥ | 93,621 | ||||
|
|
|
|
|
|||||
|
Loans within the scope of the guidance on loans and debt securities acquired with deteriorated credit quality: |
||||||||
|
Outstanding balance at beginning of fiscal year |
¥ | 493,111 | ¥ | 497,265 | ||||
|
Outstanding balance at end of fiscal year |
497,265 | 531,327 | ||||||
|
Carrying amount at beginning of fiscal year |
212,702 | 232,334 | ||||||
|
Carrying amount at end of fiscal year |
232,334 | 269,376 | ||||||
|
Nonaccruing loans within the scope of the guidance on loans and debt securities acquired with deteriorated credit quality: |
||||||||
|
Carrying amount at acquisition date during fiscal year |
¥ | 826 | ¥ | 25,952 | ||||
|
Carrying amount at end of fiscal year |
21,965 | 38,651 | ||||||
|
Allowance for credit losses within the scope of the guidance on loans and debt securities acquired with deteriorated credit quality: |
||||||||
|
Balance of allowance for credit losses at beginning of fiscal year |
¥ | 36,391 | ¥ | 37,381 | ||||
|
Additional provisions during fiscal year |
5,784 | 4,982 | ||||||
|
Reductions of allowance during fiscal year |
2,066 | 1,129 | ||||||
|
Balance of allowance for credit losses at end of fiscal year |
37,381 | 29,429 | ||||||
The MUFG Group considered prepayments in the determination of contractual cash flows and cash flows expected to be collected based on historical results.
F-56
Table of Contents
MITSUBISHI UFJ FINANCIAL GROUP, INC. AND SUBSIDIARIES
NOTES TO CONSOLIDATED FINANCIAL STATEMENTS—(Continued)
Lease Receivables
As part of its financing activities, the MUFG Group enters into leasing arrangements with customers. The MUFG Group’s leasing operations are conducted through leasing subsidiaries and consist principally of direct financing leases involving various types of data processing equipment, office equipment and transportation equipment. As a result of the acquisition of Krungsri, the MUFG Group’s lease receivables increased by ¥912,366 million.
As of March 31, 2013 and 2014, the components of the investment in direct financing leases were as follows:
| 2013 | 2014 | |||||||
| (in millions) | ||||||||
|
Minimum lease payments receivable |
¥ | 677,959 | ¥ | 1,498,755 | ||||
|
Estimated residual values of leased property |
22,384 | 18,261 | ||||||
|
Less—unearned income |
(69,196 | ) | (202,755 | ) | ||||
|
|
|
|
|
|||||
|
Net investment in direct financing leases |
¥ | 631,147 | ¥ | 1,314,261 | ||||
|
|
|
|
|
|||||
Future minimum lease payment receivables under noncancelable leasing agreements as of March 31, 2014 were as follows:
|
Direct
Financing Leases |
||||
| (in millions) | ||||
|
Fiscal year ending March 31: |
||||
|
2015 |
¥ | 440,086 | ||
|
2016 |
337,044 | |||
|
2017 |
267,306 | |||
|
2018 |
191,112 | |||
|
2019 |
106,385 | |||
|
2020 and thereafter |
156,822 | |||
|
|
|
|||
|
Total minimum lease payment receivables |
¥ | 1,498,755 | ||
|
|
|
|||
Government-led Loan Restructuring Program
Under the legislation enacted by the Japanese Diet in June 1996, which incorporates the restructuring program for the loans of seven failed housing-loan companies (the “Jusen”), the Deposit Insurance Corporation (“DIC”) established a Housing Loan Administration Corporation (“HLAC”) to collect and dispose of the loans of the liquidated Jusen. In 1999, HLAC merged with the Resolution and Collection Bank Limited to create the Resolution and Collection Corporation (“RCC”), which is wholly owned by the DIC.
Financial institutions, including the MUFG Group, waived the repayment of substantial amounts of the loans to the Jusen and transferred the remaining balances to HLAC. Financial institutions were requested to make loans to HLAC to finance its collection activities, and in the fiscal year ended March 31, 1997, the MUFG Group made loans of ¥407,078 million with an original maturity term of 15 years. The 15-year term loans to HLAC, which were guaranteed by the DIC under the legislation and the loan agreements, matured in 2011 and earned interest at TIBOR (Tokyo Interbank Offered Rate) plus 0.125%. On October 1, 2005, the MUFG Group acquired, at fair value, loans of the UFJ Holdings Group to HLAC in connection with the merger with UFJ Holdings.
F-57
Table of Contents
MITSUBISHI UFJ FINANCIAL GROUP, INC. AND SUBSIDIARIES
NOTES TO CONSOLIDATED FINANCIAL STATEMENTS—(Continued)
Under this restructuring program, a Financial Stabilization Fund (the “Special Fund”) was established within the DIC, and the Bank of Japan and other financial institutions established another fund (the “New Fund”). These funds were principally invested in Japanese government bonds. The MUFG Group made non-interest-earning deposits of ¥176,089 million with the Special Fund and the New Fund in the fiscal year ended March 31, 1997, and expected all collection activities to be completed by December 2011, after 15 years of collection activities of the Jusen loans by RCC.
As the end of RCC’s operations was approaching, the amount of the loss (so-called “stage two loss”), which might have ultimately been incurred through the collection activities, became clearer. In May 2011, the Japanese Diet enacted a law to partially revise the Deposit Insurance Act. Although it had already been decided that the loss should be shared equally between the Japanese government and private financial institutions, the revised law clarified the details of how the Japanese government would absorb its half of the loss. On the other hand, the second half of the loss, which had to be absorbed by private financial institutions, would be covered by the investment income earned by the Special Fund during the 15 years.
In September 2011, the deposits of ¥161,435 million with the New Fund were fully collected according to their terms. In June 2012, the entire deposits of ¥204,956 million with the Special Fund were fully collected as well.
Sales of Loans
The MUFG Group originates various types of loans to corporate and individual borrowers in Japan and overseas in the normal course of business. In order to improve its loan quality, BTMU and MUTB actively disposed of nonperforming loans. Most of such nonperforming loans were disposed of by sales to third parties without any continuing involvement. Management of BTMU and MUTB generally approves disposals after significant sales terms, including prices, are negotiated. As such, loans are disposed of by sales shortly after the loans are transferred to the held-for-sale classification. The net gains on the sales of loans were ¥16,256 million, ¥14,274 million and ¥18,984 million for the fiscal years ended March 31, 2012, 2013 and 2014, respectively.
Related Party Loans
In some cases, the banking subsidiaries of MUFG make loans to related parties, including their directors and executive officers, in the course of their normal commercial banking business. At March 31, 2013 and 2014, outstanding loans to such related parties were not material.
In the opinion of management, these related party loans were made on substantially the same terms, including interest rates and collateral requirements, as those terms prevailing at the date these loans were made. For the fiscal years ended March 31, 2012, 2013 and 2014, there were no loans to related parties that were charged-off. Additionally, at March 31, 2012, 2013, and 2014, there were no loans to related parties that were impaired.
F-58
Table of Contents
MITSUBISHI UFJ FINANCIAL GROUP, INC. AND SUBSIDIARIES
NOTES TO CONSOLIDATED FINANCIAL STATEMENTS—(Continued)
| 5. | PREMISES AND EQUIPMENT |
Premises and equipment at March 31, 2013 and 2014 consisted of the following:
| 2013 | 2014 | |||||||
| (in millions) | ||||||||
|
Land |
¥ | 379,943 | ¥ | 403,184 | ||||
|
Buildings |
723,902 | 747,998 | ||||||
|
Equipment and furniture |
767,733 | 929,939 | ||||||
|
Leasehold improvements |
236,353 | 251,875 | ||||||
|
Construction in progress |
17,976 | 27,606 | ||||||
|
|
|
|
|
|||||
|
Total |
2,125,907 | 2,360,602 | ||||||
|
Less accumulated depreciation |
1,066,853 | 1,123,954 | ||||||
|
|
|
|
|
|||||
|
Premises and equipment-net |
¥ | 1,059,054 |
¥
|
1,236,648
|
|
|||
|
|
|
|
|
|||||
Premises and equipment include capitalized leases, principally related to data processing equipment, which amounted to ¥43,222 million and ¥41,907 million at March 31, 2013 and 2014, respectively. Accumulated depreciation on such capitalized leases at March 31, 2013 and 2014 amounted to ¥29,385 million and ¥29,769 million, respectively.
BTMU has entered into sales agreements to sell its buildings and land and, under separate agreements, leased those properties back for its business operations, including bank branches. BTMU either provided nonrecourse financings to the buyers for the sales proceeds or invested in the equities of the buyers. As a result, BTMU was considered to have continuing involvement with the properties. For accounting and reporting purposes, these transactions were accounted for under the financing method with the sales proceeds recognized as a financing obligation. The properties were reported on the accompanying consolidated balance sheets and depreciated. The financing obligation at March 31, 2013 and 2014 was ¥47,435 million and ¥46,339 million, respectively.
For the fiscal years ended March 31, 2012, 2013 and 2014, the MUFG Group recognized ¥10,913 million, ¥3,975 million and ¥13,850 million, respectively, of impairment losses for long-lived assets, primarily real estate which was either formerly used for its banking operations and is no longer used or real estate that is being used where recovery of the carrying amount is doubtful. In addition, ¥5,209 million, ¥1,932 million and ¥226 million of impairment losses were recognized for real estate held for sale for the fiscal years ended March 31, 2012, 2013 and 2014, respectively. These losses are included in Other non-interest expenses. In computing the amount of impairment losses, fair value was determined primarily based on market prices, if available, or the estimated price based on an appraisal.
F-59
Table of Contents
MITSUBISHI UFJ FINANCIAL GROUP, INC. AND SUBSIDIARIES
NOTES TO CONSOLIDATED FINANCIAL STATEMENTS—(Continued)
| 6. | GOODWILL AND OTHER INTANGIBLE ASSETS |
Goodwill
The table below presents the movement in the carrying amount of goodwill by business segment during the fiscal years ended March 31, 2013 and 2014:
|
Integrated
Retail Banking Business Group |
Integrated
Corporate Banking Business Group |
Integrated
Trust Assets Business Group |
Integrated Global Business
Group |
Krungsri |
Global
Markets |
Total | ||||||||||||||||||||||||||||||
|
Other than
MUAH |
MUAH | Total | ||||||||||||||||||||||||||||||||||
| (in millions) | ||||||||||||||||||||||||||||||||||||
|
Balance at March 31, 2012: |
||||||||||||||||||||||||||||||||||||
|
Goodwill |
¥ | 840,055 | ¥ | 885,234 | ¥ | 22,527 | ¥ | 152,203 | ¥ | 192,520 | ¥ | 344,723 | ¥ | — | ¥ | 2,300 | ¥ | 2,094,839 | ||||||||||||||||||
|
Accumulated impairment losses |
(840,055 | ) | (885,234 | ) | (14,735 | ) | (532 | ) | — | (532 | ) | — | — | (1,740,556 | ) | |||||||||||||||||||||
|
|
|
|
|
|
|
|
|
|
|
|
|
|
|
|
|
|
|
|||||||||||||||||||
| — | — | 7,792 | 151,671 | 192,520 | 344,191 | 2,300 | 354,283 | |||||||||||||||||||||||||||||
|
Goodwill acquired during the
|
— | — | — | — | 39,683 | 39,683 | — | — | 39,683 | |||||||||||||||||||||||||||
|
Foreign currency translation adjustments and other |
— | — | — | — | 23,990 | 23,990 | — | — | 23,990 | |||||||||||||||||||||||||||
|
|
|
|
|
|
|
|
|
|
|
|
|
|
|
|
|
|
|
|||||||||||||||||||
|
Balance at March 31, 2013: |
||||||||||||||||||||||||||||||||||||
|
Goodwill |
840,055 | 885,234 | 22,527 | 152,203 | 256,193 | 408,396 | — | 2,300 | 2,158,512 | |||||||||||||||||||||||||||
|
Accumulated impairment losses |
(840,055 | ) | (885,234 | ) | (14,735 | ) | (532 | ) | — | (532 | ) | — | — | (1,740,556 | ) | |||||||||||||||||||||
|
|
|
|
|
|
|
|
|
|
|
|
|
|
|
|
|
|
|
|||||||||||||||||||
| — | — | 7,792 | 151,671 | 256,193 | 407,864 | — | 2,300 | 417,956 | ||||||||||||||||||||||||||||
|
Goodwill acquired during the
|
— | — | 14,443 | — | 26,181 | 26,181 | 217,386 | — | 258,010 | |||||||||||||||||||||||||||
|
Impairment loss |
— | — | (7,792 | ) | — | — | — | — | — | (7,792 | ) | |||||||||||||||||||||||||
|
Foreign currency translation adjustments and other |
— | — | 825 | — | 59,516 | 59,516 | — | — | 60,341 | |||||||||||||||||||||||||||
|
|
|
|
|
|
|
|
|
|
|
|
|
|
|
|
|
|
|
|||||||||||||||||||
|
Balance at March 31, 2014: |
||||||||||||||||||||||||||||||||||||
|
Goodwill |
840,055 | 885,234 | 37,795 | 152,203 | 341,890 | 494,093 | 217,386 | 2,300 | 2,476,863 | |||||||||||||||||||||||||||
|
Accumulated impairment losses |
(840,055 | ) | (885,234 | ) | (22,527 | ) | (532 | ) | — | (532 | ) | — | — | (1,748,348 | ) | |||||||||||||||||||||
|
|
|
|
|
|
|
|
|
|
|
|
|
|
|
|
|
|
|
|||||||||||||||||||
| ¥ | — | ¥ | — | ¥ | 15,268 | ¥ | 151,671 | ¥ | 341,890 | ¥ | 493,561 | ¥ | 217,386 | ¥ | 2,300 | ¥ | 728,515 | |||||||||||||||||||
|
|
|
|
|
|
|
|
|
|
|
|
|
|
|
|
|
|
|
|||||||||||||||||||
Notes:
| (1) | See Note 29 for the business segment information of the MUFG Group. |
| (2) | See Note 2 for the goodwill acquired in connection with principal acquisitions. |
There were no impairment losses recognized for the fiscal years ended March 31, 2012 and 2013.
For the fiscal year ended March 31, 2014, the MUFG Group recognized ¥7,792 million in impairment of goodwill relating to the Integrated Trust Assets Business Group segment. The MUFG Group readjusted its future projection of a reporting unit in this segment, considering a subsidiary’s recent business performance. As a result, the fair value of this reporting unit, which is based on discounted future cash flows, fell below the carrying amount of the reporting unit, and the impairment loss was recognized on the related goodwill. The impairment loss was included in Other non-interest expenses in the accompanying consolidated statements of income.
F-60
Table of Contents
MITSUBISHI UFJ FINANCIAL GROUP, INC. AND SUBSIDIARIES
NOTES TO CONSOLIDATED FINANCIAL STATEMENTS—(Continued)
Other Intangible Assets
The table below presents the gross carrying amount, accumulated amortization and net carrying amount, in total and by major class of intangible assets at March 31, 2013 and 2014:
| 2013 | 2014 | |||||||||||||||||||||||
|
Gross
carrying amount |
Accumulated
amortization |
Net
carrying amount |
Gross
carrying amount |
Accumulated
amortization |
Net
carrying amount |
|||||||||||||||||||
| (in millions) | ||||||||||||||||||||||||
|
Intangible assets subject to amortization: |
||||||||||||||||||||||||
|
Software |
¥ | 1,640,297 | ¥ | 1,105,783 | ¥ | 534,514 | ¥1,858,371 | ¥1,245,657 | ¥612,714 | |||||||||||||||
|
Core deposit intangibles |
638,863 | 456,339 | 182,524 | 712,188 | 497,219 | 214,969 | ||||||||||||||||||
|
Customer relationships |
233,360 | 136,603 | 96,757 | 380,674 | 147,774 | 232,900 | ||||||||||||||||||
|
Trade names |
52,562 | 14,430 | 38,132 | 72,788 | 16,995 | 55,793 | ||||||||||||||||||
|
Other |
4,899 | 2,744 | 2,155 | 8,754 | 2,562 | 6,192 | ||||||||||||||||||
|
|
|
|
|
|
|
|
|
|
|
|
|
|||||||||||||
|
Total |
¥ | 2,569,981 | ¥ | 1,715,899 | 854,082 | ¥3,032,775 | ¥1,910,207 | 1,122,568 | ||||||||||||||||
|
|
|
|
|
|
|
|
|
|||||||||||||||||
|
Intangible assets not subject to amortization: |
||||||||||||||||||||||||
|
Indefinite-lived trade names |
3,037 | 3,037 | ||||||||||||||||||||||
|
Other |
9,034 | 7,749 | ||||||||||||||||||||||
|
|
|
|
|
|||||||||||||||||||||
|
Total |
12,071 | 10,786 | ||||||||||||||||||||||
|
|
|
|
|
|||||||||||||||||||||
|
Total |
¥ | 866,153 | ¥1,133,354 | |||||||||||||||||||||
|
|
|
|
|
|||||||||||||||||||||
Intangible assets subject to amortization acquired during the fiscal year ended March 31, 2013 amounted to ¥171,650 million, which primarily consisted of ¥163,748 million of software. The weighted average amortization period for these assets is 5 years. There is no significant residual value estimated for these assets. Intangible assets not subject to amortization acquired during the fiscal year ended March 31, 2013 amounted to ¥50 million.
Intangible assets subject to amortization acquired during the fiscal year ended March 31, 2014 amounted to ¥455,843 million, which primarily consisted of ¥225,108 million of software, ¥61,629 million of core deposit intangibles, ¥145,936 million of customer relationships and ¥18,083 million of trade names. The weighted average amortization period for these assets are 5 years, 11 years, 13 years and 22 years, respectively. There is no significant residual value estimated for these assets. Intangible assets not subject to amortization acquired during the fiscal year ended March 31, 2014 amounted to ¥289 million. See Note 2 for further details of acquired intangible assets.
For the fiscal years ended March 31, 2012, 2013 and 2014, the MUFG Group recognized ¥30,986 million, ¥3,378 million and ¥312 million, respectively, of impairment losses for intangible assets whose carrying amounts exceeded their fair value. In computing the amount of impairment losses, fair value was determined primarily based on the present value of expected future cash flows, the estimated value based on appraisals, or market prices.
The impairment loss for the fiscal year ended March 31, 2012 included a loss of ¥8,334 million relating to the contractual rights of a business alliance reported under the Integrated Retail Banking Business Group, which were not subject to amortization, and a loss of ¥18,554 million relating to the customer relationships from fund contracts under the Integrated Trust Assets Business Group, which were reclassified from intangible assets not
F-61
Table of Contents
MITSUBISHI UFJ FINANCIAL GROUP, INC. AND SUBSIDIARIES
NOTES TO CONSOLIDATED FINANCIAL STATEMENTS—(Continued)
subject to amortization to those subject to amortization at September 30, 2011. The intangible assets were valued based on discounted expected future cash flows. The MUFG Group reflected the business environment of the credit card business, which has recently experienced further deterioration, in the future cash flows projection for the contractual rights above. Also, the estimated future cash flows of the customer relationships above from fund contracts were revised downward due to the recent global financial market instability and its adverse impact on the expected growth prospects of trust assets. Accordingly, the MUFG Group reevaluated the intangible assets and recognized impairment losses.
The estimated aggregate amortization expense for intangible assets for the next five fiscal years is as follows:
| (in millions) | ||||
|
Fiscal year ending March 31: |
||||
|
2015 |
¥ | 231,427 | ||
|
2016 |
198,788 | |||
|
2017 |
170,098 | |||
|
2018 |
135,245 | |||
|
2019 |
95,218 | |||
| 7. | INCOME TAXES |
Income (loss) before Income Tax Expense
Income (loss) before income tax expense by jurisdiction for the fiscal years ended March 31, 2012, 2013 and 2014 was as follows:
| 2012 | 2013 | 2014 | ||||||||||
| (in millions) | ||||||||||||
|
Domestic income |
¥ | 1,037,891 | ¥ | 898,596 | ¥ | 1,012,551 | ||||||
|
Foreign income (loss) |
(187,949 | ) (1) | 517,275 | 407,892 | ||||||||
|
|
|
|
|
|
|
|||||||
|
Total |
¥ | 849,942 | ¥ | 1,415,871 | ¥ | 1,420,443 | ||||||
|
|
|
|
|
|
|
|||||||
Note:
| (1) | An other-than-temporary impairment loss of Morgan Stanley’s common stock was included in Foreign income (loss). See Note 2 for further details of an other-than-temporary impairment loss of Morgan Stanley’s common stock. |
F-62
Table of Contents
MITSUBISHI UFJ FINANCIAL GROUP, INC. AND SUBSIDIARIES
NOTES TO CONSOLIDATED FINANCIAL STATEMENTS—(Continued)
Income Tax Expense (Benefit)
The detail of current and deferred income tax expense for the fiscal years ended March 31, 2012, 2013 and 2014 was as follows:
| 2012 | 2013 | 2014 | ||||||||||
| (in millions) | ||||||||||||
|
Current: |
||||||||||||
|
Domestic |
¥ | 156,764 | ¥ | 102,357 | ¥ | 243,648 | ||||||
|
Foreign |
79,313 | 60,609 | 102,316 | |||||||||
|
|
|
|
|
|
|
|||||||
|
Total |
236,077 | 162,966 | 345,964 | |||||||||
|
|
|
|
|
|
|
|||||||
|
Deferred: |
||||||||||||
|
Domestic |
171,889 | 122,804 | (5,523 | ) | ||||||||
|
Foreign |
21,225 | 10,250 | (2,524 | ) | ||||||||
|
|
|
|
|
|
|
|||||||
|
Total |
193,114 | 133,054 | (8,047 | ) | ||||||||
|
|
|
|
|
|
|
|||||||
|
Income tax expense |
429,191 | 296,020 | 337,917 | |||||||||
|
Income tax expense (benefit) reported in Accumulated OCI relating to: |
||||||||||||
|
Investment securities |
116,997 | 336,531 | 96,422 | |||||||||
|
Derivatives qualifying for cash flow hedges |
235 | 2,217 | (235 | ) | ||||||||
|
Defined benefit plans |
(66,573 | ) | 43,213 | 69,515 | ||||||||
|
Foreign currency translation adjustments |
13,230 | 18,537 | 51,414 | |||||||||
|
|
|
|
|
|
|
|||||||
|
Total |
63,889 | 400,498 | 217,116 | |||||||||
|
|
|
|
|
|
|
|||||||
|
Total |
¥ | 493,080 | ¥ | 696,518 | ¥ | 555,033 | ||||||
|
|
|
|
|
|
|
|||||||
On November 30, 2011, the Japanese Diet enacted two tax related laws: “Amendment to the 2011 Tax Reform” and “Special Measures to Secure the Financial Resources to Implement the Restoration from The Great East Japan Earthquake.” The changes under the new laws include a limitation on the use of net operating loss carryforwards to 80% of taxable income, a two-year increase in the carryforward period of certain net operating loss carryforwards to a nine-year period, and an approximately 5% reduction in the effective statutory rate of corporate income tax from 40.6% to 35.6%. While the reduction in the effective statutory rate was effective for fiscal years beginning on or after April 1, 2012, a temporary surtax levied on corporate income taxes to fund the earthquake recovery efforts caused the effective statutory rate of corporate income tax to be approximately 38.0% for the three year period between April 1, 2012 and March 31, 2015. The change in tax laws resulted in an increase of ¥77,997 million in income tax expense for the fiscal year ended March 31, 2012.
On March 20, 2014, the Japanese Diet enacted the “2014 Tax Reform” which terminated the temporary surtax levied on corporate income taxes one year earlier than the change in tax law on November 30, 2011 as described above. As a result, the effective statutory rate of corporate income tax for the fiscal year ending March 31, 2015 was set at approximately 35.6%. The change in tax law resulted in an increase of ¥16,687 million in income tax expense for the fiscal year ended March 31, 2014.
The MUFG Group has changed to filing on a consolidated basis for corporate income taxes within Japan beginning with the fiscal year ending March 31, 2015. A consolidated basis for corporate income taxes results in the reporting of taxable income or loss based upon the combined profits or losses of the parent company and its wholly-owned domestic subsidiaries.
F-63
Table of Contents
MITSUBISHI UFJ FINANCIAL GROUP, INC. AND SUBSIDIARIES
NOTES TO CONSOLIDATED FINANCIAL STATEMENTS—(Continued)
Reconciliation of Effective Income Tax Rate
Income taxes in Japan applicable to the MUFG Group are imposed by the national, prefectural and municipal governments, and in the aggregate resulted in a normal effective statutory rate of approximately 40.6% for the fiscal year ended March 31, 2012 and approximately 38.0% for the fiscal years ended March 31, 2013 and 2014. Foreign subsidiaries are subject to income taxes of the countries in which they operate.
A reconciliation of the effective income tax rates reflected in the accompanying consolidated statements of income to the combined normal effective statutory tax rates for the fiscal years ended March 31, 2012, 2013 and 2014 is as follows:
| 2012 | 2013 | 2014 | ||||||||||
|
Combined normal effective statutory tax rate |
40.6 | % | 38.0 | % | 38.0 | % | ||||||
|
Nondeductible expenses |
0.2 | 0.1 | 0.2 | |||||||||
|
Dividends from foreign subsidiaries |
0.1 | 0.0 | 0.0 | |||||||||
|
Foreign tax credit and payments |
(2.1 | ) | (0.8 | ) | (0.6 | ) | ||||||
|
Lower tax rates applicable to income of subsidiaries |
(0.5 | ) | (0.5 | ) | (0.4 | ) | ||||||
|
Change in valuation allowance |
2.3 | (7.3 | ) | (12.4 | ) | |||||||
|
Realization of previously unrecognized tax effects of subsidiaries |
0.0 | (10.7 | ) (1) | (0.1 | ) | |||||||
|
Nontaxable dividends received |
(3.4 | ) | (2.3 | ) | (3.3 | ) | ||||||
|
Undistributed earnings of subsidiaries |
0.2 | 1.5 | 0.5 | |||||||||
|
Tax and interest expense for uncertainty in income taxes |
0.1 | (0.1 | ) | — | ||||||||
|
Expiration of loss carryforward |
4.8 | 2.1 | — | |||||||||
|
Effect of changes in tax laws |
9.1 | — | 1.2 | |||||||||
|
Other—net |
(0.9 | ) | 0.9 | 0.7 | ||||||||
|
|
|
|
|
|
|
|||||||
|
Effective income tax rate |
50.5 | % | 20.9 | % | 23.8 | % | ||||||
|
|
|
|
|
|
|
|||||||
Note:
| (1) | In April 2012, one of the wholly-owned subsidiaries of BTMU was liquidated. The liquidation resulted in the realization of tax benefits that were not previously recognized as deferred tax assets, resulting in a ¥151,309 million reduction of income tax expense and a 10.7% reduction in the effective tax rate for the fiscal year ended March 31, 2013. |
F-64
Table of Contents
MITSUBISHI UFJ FINANCIAL GROUP, INC. AND SUBSIDIARIES
NOTES TO CONSOLIDATED FINANCIAL STATEMENTS—(Continued)
Deferred Tax Assets and Liabilities
Deferred tax assets and liabilities are computed for each tax jurisdiction using currently enacted tax rates applicable to periods when the temporary differences are expected to reverse. The tax effects of the items comprising the MUFG Group’s net deferred tax assets at March 31, 2013 and 2014 were as follows:
| 2013 | 2014 | |||||||
| (in millions) | ||||||||
|
Deferred tax assets: |
||||||||
|
Allowance for credit losses |
¥ | 774,612 | ¥ | 650,069 | ||||
|
Operating loss carryforwards |
106,856 | 102,260 | ||||||
|
Loans |
14,360 | 7,632 | ||||||
|
Accrued liabilities and other |
355,337 | 309,327 | ||||||
|
Premises and equipment, including sale-and-leaseback transactions |
102,217 | 94,652 | ||||||
|
Derivative financial instruments |
64,583 | 94,514 | ||||||
|
Accrued severance indemnities and pension plans |
164,797 | 44,810 | ||||||
|
Valuation allowance |
(483,006 | ) | (308,561 | ) | ||||
|
|
|
|
|
|||||
|
Total deferred tax assets |
1,099,756 | 994,703 | ||||||
|
|
|
|
|
|||||
|
Deferred tax liabilities: |
||||||||
|
Investment securities (including trading account assets at fair value under fair value option) |
488,728 | 574,807 | ||||||
|
Intangible assets |
104,736 | 159,330 | ||||||
|
Lease transactions |
54,025 | 77,542 | ||||||
|
Other |
64,806 | 74,471 | ||||||
|
|
|
|
|
|||||
|
Total deferred tax liabilities |
712,295 | 886,150 | ||||||
|
|
|
|
|
|||||
|
Net deferred tax assets |
¥ | 387,461 | ¥ | 108,553 | ||||
|
|
|
|
|
|||||
The valuation allowance was provided primarily against deferred tax assets recorded at MUFG and its subsidiaries with operating loss carryforwards. The amount of valuation allowance is determined based on future reversals of existing taxable temporary differences and future taxable income exclusive of reversing temporary differences. Future taxable income is developed from forecasted operating results, based on recent historical trends and approved business plans, the eligible carryforward periods and other relevant factors.
For the fiscal year ended March 31, 2014, the MUFG Group recorded a valuation allowance release, on the basis of management’s reassessment of the amount of its deferred tax assets that were more likely than not to be realized. As of March 31, 2014, management considered new evidence, both positive and negative, that could impact management’s view with regard to future realization of deferred tax assets.
Among others, a release of valuation allowance of ¥91,070 million was due to the application of the consolidated corporate-tax system beginning with the fiscal year ending March 31, 2015. This is because MUFG would be able to utilize income in more profitable subsidiaries to realize the benefit of net operating loss carryforwards and existing deductible temporary differences recorded at MUFG. Management believes that the net operating loss carryforwards related to corporate taxes will be fully utilized by the application of the consolidated corporate-tax system.
Among others, a release of valuation allowance of ¥45,922 million was due to the profitability improvement of a certain subsidiary. Management considered various factors, including the improved operating performance and cumulative operating results over the prior several years of the subsidiary as well as the outlook regarding prospective operating performance of the subsidiary, and determined that sufficient positive evidence exists as of March 31, 2014, to conclude that it is more likely than not that additional deferred tax assets would be realizable.
F-65
Table of Contents
MITSUBISHI UFJ FINANCIAL GROUP, INC. AND SUBSIDIARIES
NOTES TO CONSOLIDATED FINANCIAL STATEMENTS—(Continued)
For certain subsidiaries where strong negative evidence exists, such as the existence of significant amounts of operating loss carryforwards, cumulative losses and the expiration of unused operating loss carryforwards in recent years, a valuation allowance was recognized against the deferred tax assets as of March 31, 2013 and 2014 to the extent that it is more likely than not that they will not be realized.
Income taxes are not provided on undistributed earnings of certain foreign subsidiaries that are considered to be indefinitely reinvested in the operations of such subsidiaries. At March 31, 2013 and 2014, the undistributed earnings of such foreign subsidiaries amounted to approximately ¥28,644 million and ¥37,498 million, respectively. Determination of the amount of unrecognized deferred tax liabilities with respect to these undistributed earnings is not practicable because of the complexity associated with its hypothetical calculation including foreign withholding taxes and foreign tax credits. MUFG has neither plans nor the intention to dispose of investments in such foreign subsidiaries and, accordingly, does not expect to record capital gains or losses, or otherwise monetize the undistributed earnings of such foreign subsidiaries.
Operating Loss and Tax Credit Carryforwards
At March 31, 2014, the MUFG Group had operating loss carryforwards for corporate tax of ¥302,033 million and tax credit carryforwards of ¥6,442 million for tax purposes. Such carryforwards, if not utilized, are scheduled to expire as follows:
|
Operating loss
carryforwards |
Tax credit
carryforwards |
|||||||
| (in millions) | ||||||||
|
Fiscal year ending March 31: |
||||||||
|
2015 |
¥ | 1,808 | ¥ | 579 | ||||
|
2016 |
— | 47 | ||||||
|
2017 |
— | 27 | ||||||
|
2018 |
31,619 | 52 | ||||||
|
2019 |
6,412 | 56 | ||||||
|
2020 |
34,370 | 96 | ||||||
|
2021 and thereafter |
216,288 | 3,900 | ||||||
|
No definite expiration date |
11,536 | 1,685 | ||||||
|
|
|
|
|
|||||
|
Total |
¥ | 302,033 | ¥ | 6,442 | ||||
|
|
|
|
|
|||||
Uncertainty in Income Tax
The following is a roll-forward of the MUFG Group’s unrecognized tax benefits for the fiscal years ended March 31, 2012, 2013 and 2014:
| 2012 | 2013 | 2014 | ||||||||||
| (in millions) | ||||||||||||
|
Balance at beginning of fiscal year |
¥ | 61,297 | ¥ | 58,588 | ¥ | 30,956 | ||||||
|
Gross amount of increases for current year’s tax positions |
455 | 366 | 439 | |||||||||
|
Gross amount of decreases for current year’s tax positions |
(339 | ) | (49 | ) | — | |||||||
|
Gross amount of increases for prior years’ tax positions |
2,887 | 2,765 | 333 | |||||||||
|
Gross amount of decreases for prior years’ tax positions |
(312 | ) | (35,119 | ) (1) | (25,318 | ) (2) | ||||||
|
Net amount of changes relating to settlements with tax authorities |
(2,515 | ) | 760 | (244 | ) | |||||||
|
Decreases due to lapse of applicable statutes of limitations |
(1,123 | ) | — | — | ||||||||
|
Foreign exchange translation and others |
(1,762 | ) | 3,645 | 7,827 | ||||||||
|
|
|
|
|
|
|
|||||||
|
Balance at end of fiscal year |
¥ | 58,588 | ¥ | 30,956 | ¥ | 13,993 | ||||||
|
|
|
|
|
|
|
|||||||
F-66
Table of Contents
MITSUBISHI UFJ FINANCIAL GROUP, INC. AND SUBSIDIARIES
NOTES TO CONSOLIDATED FINANCIAL STATEMENTS—(Continued)
Notes:
| (1) | The decrease was primarily because, during the fiscal year ended March 31, 2013, the MUFG Group closed an examination with U.S. tax authorities on issues related to prior years’ tax positions. |
| (2) | The decrease related to prior year tax positions is primarily from the resolution of uncertain tax positions in the U.S. for both federal income taxes and California state tax. |
The total amount of unrecognized tax benefits at March 31, 2012, 2013 and 2014 that, if recognized, would affect the effective tax rate are ¥9,170 million, ¥9,632 million and ¥3,570 million, respectively. The remainder of the uncertain tax positions have offsetting amounts in other jurisdictions or are temporary differences.
The MUFG Group classifies interest and penalties, if applicable, related to income taxes as Income tax expense. Accrued interest and penalties (not included in the “unrecognized tax benefits” above) are a component of Other liabilities. The following is a roll-forward of the interest and penalties recognized in the accompanying consolidated financial statements for the fiscal years ended March 31, 2012, 2013 and 2014:
| 2012 | 2013 | 2014 | ||||||||||
| (in millions) | ||||||||||||
|
Balance at beginning of fiscal year |
¥ | 7,033 | ¥ | 6,934 | ¥ | 4,528 | ||||||
|
Total interest and penalties in the consolidated statements of income |
27 | (2,975 | ) | (698 | ) | |||||||
|
Total cash settlements, foreign exchange translation and others |
(126 | ) | 569 | 2,116 | ||||||||
|
|
|
|
|
|
|
|||||||
|
Balance at end of fiscal year |
¥ | 6,934 | ¥ | 4,528 | ¥ | 5,946 | ||||||
|
|
|
|
|
|
|
|||||||
The MUFG Group is subject to ongoing tax examinations by the tax authorities of the various jurisdictions in which it operates. The following are the major tax jurisdictions in which the MUFG Group operates and the status of years under audit or open to examination:
|
Jurisdiction |
Tax years | |||
|
Japan |
2013 and forward | |||
|
United States—Federal |
2007 and forward | |||
|
United States—California |
2009 and forward | |||
|
Thailand |
2009 and forward | |||
The MUFG Group is currently under continuous examinations by the tax authorities in various domestic and foreign jurisdictions and many of these examinations are resolved every year. It is reasonably possible that the unrecognized tax benefits will decrease by approximately ¥3.0 billion during the next twelve months, since resolved items will be removed from the balance whether their resolution results in payment or recognition.
| 8. | PLEDGED ASSETS AND COLLATERAL |
Pledged Assets
At March 31, 2014, assets mortgaged, pledged, or otherwise subject to lien were as follows:
| 2014 | ||||
| (in millions) | ||||
|
Trading account securities |
¥ | 13,654,793 | ||
|
Investment securities |
4,728,870 | |||
|
Loans |
8,087,278 | |||
|
Other |
84,291 | |||
|
|
|
|||
|
Total |
¥ | 26,555,232 | ||
|
|
|
|||
F-67
Table of Contents
MITSUBISHI UFJ FINANCIAL GROUP, INC. AND SUBSIDIARIES
NOTES TO CONSOLIDATED FINANCIAL STATEMENTS—(Continued)
The above pledged assets were classified by type of liabilities to which they related as follows:
| 2014 | ||||
| (in millions) | ||||
|
Deposits |
¥ | 552,503 | ||
|
Call money and funds purchased |
708,086 | |||
|
Payables under repurchase agreements and securities lending transactions |
15,436,764 | |||
|
Other short-term borrowings and long-term debt |
9,657,563 | |||
|
Other |
200,316 | |||
|
|
|
|||
|
Total |
¥ | 26,555,232 | ||
|
|
|
|||
In addition, at March 31, 2014, certain investment securities, principally Japanese national government and Japanese government agency bonds, loans, and other assets aggregating to ¥20,812,386 million were pledged as collateral for acting as a collection agent of public funds, for settlement of exchange at the Bank of Japan and the Tokyo Bankers Association, for derivative transactions and for certain other purposes.
The MUFG Group engages in on-balance sheet securitizations. These securitizations of mortgage and apartment loans, which do not qualify for sales treatment, are accounted for as secured borrowings. The amount of loans in the table above represents the carrying amount of these transactions with the carrying amount of the associated liabilities included in Other short-term borrowings and Long-term debt.
Under Japanese law, Japanese banks are required to maintain certain reserves on deposit with the Bank of Japan based on the amount of deposit balances and certain other factors. There are similar reserve deposit requirements for foreign offices engaged in banking businesses in foreign countries. At March 31, 2013 and 2014 the reserve funds maintained by the MUFG Group, which are included in Cash and due from banks and Interest-earning deposits in other banks, were ¥5,697,318 million and ¥13,007,902 million, respectively. Average reserves during the fiscal years ended March 31, 2013 and 2014 were ¥4,566,092 million and ¥12,313,722 million, respectively.
Collateral
The MUFG Group accepts and provides financial assets as collateral for transactions, principally commercial loans, repurchase agreements and securities lending transactions, call money, and derivatives. Financial assets eligible for such collateral include, among others, marketable equity securities, trade and notes receivable and certificates of deposit.
Secured parties, including creditors and counterparties to certain transactions with the MUFG Group, may sell or repledge financial assets provided as collateral. Certain contracts, however, may not be specific about the secured party’s right to sell or repledge collateral under the applicable statutes and, therefore, whether or not the secured party is permitted to sell or repledge collateral would differ depending on the interpretations of specific provisions of the existing statutes, contract or certain market practices. If the MUFG Group determines, based on available information, that a financial asset provided as collateral might not be sold or repledged by the secured parties, such collateral is not separately reported in the accompanying consolidated balance sheets. If a secured party is permitted to sell or repledge financial assets provided as collateral by contract or custom under the existing statutes, the MUFG Group reports such pledged financial assets separately on the face of the accompanying consolidated balance sheets. At March 31, 2014, the MUFG Group pledged ¥29,528 billion of assets that may not be sold or repledged by the secured parties.
F-68
Table of Contents
MITSUBISHI UFJ FINANCIAL GROUP, INC. AND SUBSIDIARIES
NOTES TO CONSOLIDATED FINANCIAL STATEMENTS—(Continued)
Certain banking subsidiaries accept collateral for commercial loans and certain banking transactions under a standardized agreement with customers, which provides that these banking subsidiaries may require the customers to provide collateral or guarantees with respect to the loans and other banking transactions. Financial assets pledged as collateral are generally negotiable and transferable instruments, and such negotiability and transferability is authorized by applicable legislation. In principle, Japanese legislation permits these banking subsidiaries to repledge financial assets accepted as collateral unless otherwise prohibited by contract or relevant statutes. Nevertheless, the MUFG Group did not sell or repledge nor does it plan to sell or repledge such collateral accepted in connection with commercial loans before a debtor’s default or other credit events specified in the agreements as it is not customary within the banking industry in Japan to dispose of collateral before a debtor’s default and other specified credit events. Derivative agreements commonly used in the marketplace do not prohibit a secured party’s disposition of financial assets received as collateral, and in resale agreements and securities borrowing transactions, securities accepted as collateral may be sold or repledged by the secured parties. At March 31, 2013 and 2014, the fair value of the collateral accepted by the MUFG Group that is permitted to be sold or repledged was ¥11,873 billion and ¥18,637 billion, respectively, of which ¥8,190 billion and ¥14,011 billion, respectively, was sold or repledged.
At March 31, 2013 and 2014, the cash collateral pledged for derivative transactions, which is included in Other assets, was ¥1,573,698 million and ¥1,045,851 million, respectively, and the cash collateral received for derivative transactions, which is included in Other liabilities, was ¥366,544 million and ¥454,506 million, respectively.
| 9. | DEPOSITS |
The balances of time deposits, including certificates of deposit (“CDs”), issued in amounts of ¥10 million (approximately U.S.$97 thousand at the Federal Reserve Bank of New York’s noon buying rate on March 31, 2014) or more with respect to domestic deposits and issued in amounts of U.S.$100,000 or more with respect to foreign deposits were ¥28,267,100 million and ¥19,783,917 million, respectively, at March 31, 2013, and ¥27,555,387 million and ¥26,026,728 million, respectively, at March 31, 2014.
The maturity information at March 31, 2014 for domestic and foreign time deposits, including CDs, is summarized as follows:
| Domestic | Foreign | |||||||
| (in millions) | ||||||||
|
Due in one year or less |
¥ | 35,654,357 | ¥ | 25,819,867 | ||||
|
Due after one year through two years |
6,307,843 | 421,138 | ||||||
|
Due after two years through three years |
2,813,975 | 145,802 | ||||||
|
Due after three years through four years |
611,214 | 121,113 | ||||||
|
Due after four years through five years |
807,890 | 130,491 | ||||||
|
Due after five years |
464,856 | 23,225 | ||||||
|
|
|
|
|
|||||
|
Total |
¥ | 46,660,135 | ¥ | 26,661,636 | ||||
|
|
|
|
|
|||||
| 10. | CALL MONEY AND FUNDS PURCHASED |
A summary of funds transactions for the fiscal years ended March 31, 2013 and 2014 is as follows:
| 2013 | 2014 | |||||||
| (in millions, except percentages and days) | ||||||||
|
Outstanding at end of fiscal year: |
||||||||
|
Amount |
¥ | 4,010,582 | ¥ | 3,417,455 | ||||
|
Principal range of maturities |
1 day to 30 days | 1 day to 30 days | ||||||
|
Weighted average interest rate |
0.18 | % | 0.18 | % | ||||
F-69
Table of Contents
MITSUBISHI UFJ FINANCIAL GROUP, INC. AND SUBSIDIARIES
NOTES TO CONSOLIDATED FINANCIAL STATEMENTS—(Continued)
| 11. | DUE TO TRUST ACCOUNT |
MUTB holds assets on behalf of its customers in an agent, fiduciary or trust capacity. Such trust account assets are not the MUFG Group’s proprietary assets and are managed and accounted for separately.
However, excess cash funds of individual trust accounts are often placed with MUTB which manages the funds together with its own funds in its proprietary account. Due to trust account reflects a temporary placement of the excess funds from individual trust accounts and, in view of the MUFG Group’s funding, due to trust account is similar to short-term funding, including demand deposits and other overnight funds purchased. The balance changes in response to the day-to-day changes in the excess funds placed by the trust accounts. A summary of due to trust account transactions for the fiscal years ended March 31, 2013 and 2014 is as follows:
| 2013 | 2014 | |||||||
| (in millions, except percentages) | ||||||||
|
Amount outstanding at end of fiscal year |
¥ | 633,029 | ¥ | 750,210 | ||||
|
Weighted average interest rate on outstanding balance at end of fiscal year |
0.09 | % | 0.08 | % | ||||
| 12. | SHORT-TERM BORROWINGS AND LONG-TERM DEBT |
At March 31, 2013 and 2014, the MUFG Group had unused lines of credit for short-term financing amounting to ¥11,282,220 million and ¥10,750,175 million, respectively. The amounts principally consist of the lines of collateralized intraday overdrafts without interest charges and collateralized overnight loans on bills at the official discount rate granted by the Bank of Japan, which are used to cover shortages in the Bank of Japan account and to meet liquidity needs. The MUFG Group may borrow from the Bank of Japan on demand up to the total amount of collateral eligible for credit extension.
Other short-term borrowings at March 31, 2013 and 2014 were comprised of the following:
| 2013 | 2014 | |||||||
| (in millions, except percentages) | ||||||||
|
Domestic offices: |
||||||||
|
Commercial paper |
¥ | 1,358,067 | ¥ | 1,235,525 | ||||
|
Borrowings from the Bank of Japan |
7,466,717 | 5,888,541 | ||||||
|
Borrowings from other financial institutions |
203,120 | 224,676 | ||||||
|
Other |
49,500 | 59,501 | ||||||
|
|
|
|
|
|||||
|
Total domestic offices |
9,077,404 | 7,408,243 | ||||||
|
|
|
|
|
|||||
|
Foreign offices: |
||||||||
|
Commercial paper |
2,125,851 | 3,091,977 | ||||||
|
Borrowings from other financial institutions |
386,068 | 333,116 | ||||||
|
Short-term debentures |
— | 119,837 | ||||||
|
Other |
19,389 | 153,074 | ||||||
|
|
|
|
|
|||||
|
Total foreign offices |
2,531,308 | 3,698,004 | ||||||
|
|
|
|
|
|||||
|
Total |
11,608,712 | 11,106,247 | ||||||
|
Less unamortized discount |
114 | 176 | ||||||
|
|
|
|
|
|||||
|
Other short-term borrowings—net |
¥ | 11,608,598 | ¥ | 11,106,071 | ||||
|
|
|
|
|
|||||
|
Weighted average interest rate on outstanding balance at end of fiscal year |
0.20 | % | 0.25 | % | ||||
F-70
Table of Contents
MITSUBISHI UFJ FINANCIAL GROUP, INC. AND SUBSIDIARIES
NOTES TO CONSOLIDATED FINANCIAL STATEMENTS—(Continued)
Long-term debt (with original maturities of more than one year) at March 31, 2013 and 2014 was comprised of the following:
| 2013 | 2014 | |||||||
| (in millions) | ||||||||
|
MUFG: |
||||||||
|
Obligations under capital leases |
¥ | 59 | ¥ | 78 | ||||
|
Subordinated debt (1) : |
||||||||
|
Adjustable rate bonds, payable in Japanese yen, no stated maturity, principally 3.92%-4.42% |
380,500 | 380,500 | ||||||
|
Adjustable rate borrowings, payable in Japanese yen, no stated maturity, principally 3.42%-4.78% |
1,500 | 1,500 | ||||||
|
Adjustable rate borrowings, payable in US dollars, no stated maturity, principally 6.25% |
470 | 515 | ||||||
|
Adjustable rate borrowings, payable in Euro, no stated maturity, principally 4.75%-5.17% |
1,207 | 1,416 | ||||||
|
Adjustable rate borrowings, payable in other currencies excluding Japanese yen, US dollars, Euro, no stated maturity, principally 6.20% (2) |
430 | 514 | ||||||
|
|
|
|
|
|||||
|
Total |
384,166 | 384,523 | ||||||
|
|
|
|
|
|||||
|
BTMU: |
||||||||
|
Obligations under capital leases |
¥ | 15,294 | ¥ | 12,260 | ||||
|
Obligation under sale-and-leaseback transactions |
47,435 | 46,339 | ||||||
|
Unsubordinated debt (1) : |
||||||||
|
Fixed rate bonds, payable in Japanese yen, due 2014-2027, principally 0.16%-2.69% |
1,337,900 | 1,311,801 | ||||||
|
Fixed rate bonds, payable in US dollars, due 2015-2044, principally 1.00%-4.70% |
639,679 | 1,109,470 | ||||||
|
Fixed rate bonds, payable in other currencies excluding Japanese yen, US dollars, due 2014-2017, principally 4.05%-4.91% (2) |
126,709 | 71,439 | ||||||
|
Fixed rate borrowings, payable in Japanese yen, due 2014-2028, principally 0.10%-0.50% |
10,297 | 1,163,291 | ||||||
|
Fixed rate borrowings, payable in US dollars, due 2018, principally 7.49% |
383 | 342 | ||||||
|
Fixed rate borrowings, payable in other currencies excluding Japanese yen, US dollars, due 2013-2014, principally 2.13%-5.65% (2) |
384 | — | ||||||
|
Adjustable rate bonds, payable in Japanese yen, due 2014, principally 1.57% |
20,000 | — | ||||||
|
Floating rate bonds, payable in US dollars, due 2016-2017, principally 0.65%-0.85% |
93,667 | 226,424 | ||||||
|
Floating rate bonds, payable in other currencies excluding Japanese yen, US dollars, due 2015-2017, principally 3.77%-4.00% (2) |
29,379 | 90,431 | ||||||
|
Floating rate borrowings, payable in US dollars, due 2014-2024, principally 0.33%-0.67% |
780,410 | 942,215 | ||||||
|
Floating rate borrowings, payable in Euro, due 2014-2021, principally 0.45%-0.48% (2) |
7,839 | 7,497 | ||||||
|
|
|
|
|
|||||
|
Total |
3,046,647 | 4,922,910 | ||||||
|
Subordinated debt (1) : |
||||||||
|
Fixed rate bonds, payable in Japanese yen, due 2014-2031, principally 0.93%-2.91% |
1,579,037 | 1,336,892 | ||||||
|
Fixed rate borrowings, payable in Japanese yen, due 2016-2035, principally 0.56%-2.24% |
233,419 | 233,400 | ||||||
|
Fixed rate borrowings, payable in US dollars, due 2013, principally 6.76% |
118,177 | — | ||||||
|
Adjustable rate bonds, payable in Japanese yen, due 2019, principally 1.20% |
93,700 | 31,000 | ||||||
|
Adjustable rate borrowings, payable in Japanese yen, due 2017-2028, principally 0.25%-2.86% |
395,600 | 245,800 | ||||||
|
Adjustable rate borrowings, payable in Japanese yen, no stated maturity, principally 0.97%-4.78% |
891,199 | 845,400 | ||||||
|
Adjustable rate borrowings, payable in US dollars, no stated maturity, principally 6.25% |
221,018 | 241,862 | ||||||
|
Adjustable rate borrowings, payable in Euro, no stated maturity, principally 4.75%-5.17% |
158,760 | 186,270 | ||||||
|
Adjustable rate borrowings, payable in other currencies excluding Japanese yen, US dollars, Euro, no stated maturity, principally 6.20% (2) |
80,885 | 96,790 | ||||||
|
Floating rate borrowings, payable in Japanese yen, due 2020-2027, principally 0.36%-0.86% |
41,900 | 41,900 | ||||||
|
|
|
|
|
|||||
|
Total |
3,813,695 | 3,259,314 | ||||||
|
Obligations under loan securitization transaction accounted for as secured borrowings due 2014-2044, principally 0.24%-5.90% |
1,516,893 | 1,146,638 | ||||||
|
Payable under repurchase agreements due 2016-2018, principally 0.63%-1.48% |
188,100 | 360,220 | ||||||
|
|
|
|
|
|||||
|
Total |
8,628,064 | 9,747,681 | ||||||
|
|
|
|
|
|||||
F-71
Table of Contents
MITSUBISHI UFJ FINANCIAL GROUP, INC. AND SUBSIDIARIES
NOTES TO CONSOLIDATED FINANCIAL STATEMENTS—(Continued)
| 2013 | 2014 | |||||||
| (in millions) | ||||||||
|
Other subsidiaries: |
||||||||
|
Obligations under capital leases |
¥ | 10,286 | ¥ | 7,781 | ||||
|
Unsubordinated debt (1) : |
||||||||
|
Fixed rate borrowings, bonds and notes, payable in Japanese yen, due 2014-2044, principally 0.00%-16.00% |
547,746 | 915,357 | ||||||
|
Fixed rate borrowings, bonds and notes, payable in US dollars, due 2014-2038, principally 0.00%-13.10% |
46,849 | 396,704 | ||||||
|
Fixed rate bonds and notes, payable in Euro, due 2018, principally 4.21% |
— | 6,514 | ||||||
|
Fixed rate bonds and notes, payable in Thai baht, due 2014-2018, principally 0.00%-4.80% |
1,437 | 269,219 | ||||||
|
Fixed rate borrowings, bonds and notes, payable in other currencies excluding Japanese yen, US dollars, Euro, Thai baht, due 2014-2037, principally 0.50%-10.75% (2) |
8,952 | 35,011 | ||||||
|
Floating/Adjustable rate borrowings, bonds and notes, payable in Japanese yen, due 2014-2044, principally 0.00%-24.00% |
1,199,685 | 1,426,933 | ||||||
|
Floating/Adjustable rate borrowings, bonds and notes, payable in US dollars, due 2014-2038, principally 0.00%-7.30% |
403,809 | 276,402 | ||||||
|
Floating rate bonds and notes, payable in Euro, due 2014-2018, principally 0.00%-1.76% |
22,492 | 34,281 | ||||||
|
Floating rate borrowings, bonds and notes, payable in other currencies excluding Japanese yen, US dollars, Euro, due 2014-2037, principally 0.00%-1.10% (2) |
2,006 | 2,055 | ||||||
|
|
|
|
|
|||||
|
Total |
2,232,976 | 3,362,476 | ||||||
|
Subordinated debt (1) : |
||||||||
|
Fixed rate borrowings, bonds and notes, payable in Japanese yen, due 2014-2030, principally 0.56%-2.98% |
435,544 | 484,194 | ||||||
|
Fixed rate bonds and notes, payable in US dollars, due 2014-2019, principally 5.38%-11.33% |
105,096 | 77,330 | ||||||
|
Fixed rate bonds and notes, payable in Thai baht, due 2020-2022, principally 4.51%-4.70% |
— | 111,682 | ||||||
|
Adjustable rate borrowings, bonds and notes, payable in Japanese yen, due 2020, principally 1.76% |
72,300 | 5,000 | ||||||
|
Adjustable rate borrowings, bonds and notes, payable in Japanese yen, no stated maturity, principally 1.93%-3.50% |
105,744 | 105,667 | ||||||
|
Floating rate borrowings, bonds and notes, payable in Japanese yen, due 2014-2021, principally 0.57%-1.52% |
192,391 | 204,926 | ||||||
|
Floating rate borrowings, bonds and notes, payable in US dollars, due 2033-2036, principally 1.95%-3.50% |
— | 6,972 | ||||||
|
|
|
|
|
|||||
|
Total |
911,075 | 995,771 | ||||||
|
Obligations under loan securitization transaction accounted for as secured borrowings due 2014-2018, principally 0.95%-2.71% |
15,791 | 446 | ||||||
|
|
|
|
|
|||||
|
Total |
3,170,128 | 4,366,474 | ||||||
|
|
|
|
|
|||||
|
Total |
¥ | 12,182,358 | ¥ | 14,498,678 | ||||
|
|
|
|
|
|||||
Notes:
| (1) | Adjustable rate debts are debts where interest rates are reset in accordance with the terms of the debt agreements, and floating rate debts are debts where interest rates are repriced in accordance with movements of markets indices. |
| (2) | Minor currencies, such as Australian dollar, British pound, Indonesian rupiah, Brazilian real, Russian ruble etc, have been summarized into the “Other currencies” classification. |
The MUFG Group uses derivative financial instruments to manage its interest rate and currency exposures for certain debts. The derivative financial instruments include swaps, forwards, options and other types of derivatives. As a result of these derivative instruments, the effective rates reflected in the table above may differ from the coupon rates. The interest rates for the adjustable and floating rate debt shown in the above table are those in effect at March 31, 2013 and 2014.
Certain debt agreements permit the MUFG Group to redeem the related debt, in whole or in part, prior to maturity at the option of the issuer on terms specified in the respective agreements.
F-72
Table of Contents
MITSUBISHI UFJ FINANCIAL GROUP, INC. AND SUBSIDIARIES
NOTES TO CONSOLIDATED FINANCIAL STATEMENTS—(Continued)
The following is a summary of maturities of long-term debt subsequent to March 31, 2014:
| MUFG | BTMU |
Other
subsidiaries |
Total | |||||||||||||
| (in millions) | ||||||||||||||||
|
Fiscal year ending March 31: |
||||||||||||||||
|
2015 |
¥ | 20 | ¥ | 1,111,236 | ¥ | 575,174 | ¥ | 1,686,430 | ||||||||
|
2016 |
18 | 931,103 | 646,907 | 1,578,028 | ||||||||||||
|
2017 |
13 | 2,295,298 | 585,917 | 2,881,228 | ||||||||||||
|
2018 |
6 | 891,232 | 353,487 | 1,244,725 | ||||||||||||
|
2019 |
3 | 529,641 | 544,859 | 1,074,503 | ||||||||||||
|
2020 and thereafter |
384,463 | 3,989,171 | 1,660,130 | 6,033,764 | ||||||||||||
|
|
|
|
|
|
|
|
|
|||||||||
|
Total |
¥ | 384,523 | ¥ | 9,747,681 | ¥ | 4,366,474 | ¥ | 14,498,678 | ||||||||
|
|
|
|
|
|
|
|
|
|||||||||
| 13. | SEVERANCE INDEMNITIES AND PENSION PLANS |
Defined Benefit Pension Plans
The MUFG Group has funded contributory and non-contributory defined benefit pension plans (“pension benefits”), which cover substantially all of its employees and provide for lifetime annuity payments commencing at age 65 based on eligible compensation at the time of severance, rank, years of service and other factors.
BTMU and certain domestic subsidiaries, MUSHD, Mitsubishi UFJ NICOS and some subsidiaries of MUFG have non-contributory Corporate Defined Benefit Pension plans (“CDBPs”) which provide benefits to all their domestic employees. In addition, MUTB had a contributory CDBP similar to these non-contributory CDBPs until a transfer of its remaining corporate portion into a non-contributory CDBP subsequent to the separation process as described below.
In December 2011, in accordance with the Defined Benefit Corporate Pension Plan Act, which permits each employer and employees’ pension fund plan to separate the substitutional portion of the employees’ pension fund from the rest of the fund and transfer the related obligation and assets to the Japanese government, MUTB obtained an approval from the Minister of Health, Labor and Welfare for an exemption from the obligation to pay benefits for future employee services related to the substitutional portion of the governmental welfare pension program. In January 2013, MUTB also obtained an approval for an exemption from the obligation to pay benefits for past employee services related to the substitutional portion. To complete the separation process, the substitutional obligation and the related plan assets were transferred to the Japanese government on February 17, 2014. In accordance with the guidance, which addresses the accounting for the transfer to the Japanese government of a substitutional portion of employee pension fund liabilities, MUTB accounted for the entire separation process, upon completion of transfer of the plan assets to the government, as a single settlement transaction. During the fiscal year ended March 31, 2014, MUTB recognized (1) the difference of ¥115,210 million between the accumulated benefit obligations settled and the assets transferred to the Japanese Government as a government subsidy, which was recognized as a gain in the accompanying consolidated statements of income, (2) the proportionate amount of the net unrealized loss of ¥42,435 million for the substitutional portion as settlement loss, and (3) the difference of ¥1,770 million between the projected benefit obligations and the accumulated benefit obligations related to the substitutional portion, as gain on derecognition of previously accrued salary progression. The settlement loss and gain on derecognition of previously accrued salary progression were included in Salaries and employee benefits in the accompanying consolidated statements of income. The remaining portion of the employees’ pension fund (that is, the corporate portion) continued to exist as a CDBP, although, from a legal regulatory perspective, it is deemed to have been dissolved and a CDBP
F-73
Table of Contents
MITSUBISHI UFJ FINANCIAL GROUP, INC. AND SUBSIDIARIES
NOTES TO CONSOLIDATED FINANCIAL STATEMENTS—(Continued)
is deemed newly established when the separation process is completed. Subsequent to the separation process, MUTB transferred the remaining corporate portion of the employees’ pension fund into a non-contributory CDBP.
In addition to the CDBPs, BTMU and MUTB had non-contributory closed Tax-Qualified Pension Plans (“closed TQPPs”), which were defined benefit pension plans that provide benefits to certain retired employees, excluding directors in Japan, based on eligible compensation at the time of severance, years of service and other factors. MUTB also had a contributory closed TQPP in addition to the non-contributory closed TQPPs. In March 2012, Tax-Qualified Pension Plans were abolished pursuant to the Amendment to the 2011 Tax Reform enacted in 2011. Prior to the abolishment, the contributory and non-contributory closed TQPPs held by BTMU and MUTB were integrated into their non-contributory CDBPs. The balances of projected benefit obligations and plan assets of the closed TQPPs were directly transferred with no impact on the MUFG Group’s financial position and results of operations.
The MUFG Group also offers qualified and nonqualified defined benefit pension plans in foreign offices and subsidiaries for their employees. The qualified plans are non-contributory defined pension plans, which provide benefits upon retirement based on years of service and average compensation and cover substantially all of the employees of such foreign offices and subsidiaries. With respect to the offices and subsidiaries in the United States of America, the qualified plans are funded on a current basis in compliance with the requirement of the Employee Retirement Income Security Act of the United States of America. The nonqualified plans are non-contributory defined benefit pension plans, under which certain employees earn pay and interest credits on compensation amounts above the maximum stipulated by applicable laws under the qualified plans.
Severance Indemnities Plans
The MUFG Group has severance indemnities plans (“SIPs”) under which their employees in Japan, other than those who are directors, are entitled, under most circumstances, upon mandatory retirement at normal retirement age or earlier termination of employment, to lump-sum severance indemnities based on eligible compensation at the time of severance, rank, years of service and other factors. Under SIPs, benefit payments in the form of a lump-sum cash payment with no option to receive annuity payments, upon mandatory retirement at normal retirement age or earlier termination of employment, are provided. When a benefit is paid in a single payment to a benefit payee under the plans, the payment represents final relief of the obligation.
Other Postretirement Plans
The MUFG Group’s foreign offices and subsidiaries, primarily in the United States of America, provide their employees with certain postretirement medical and life insurance benefits (“other benefits”).
F-74
Table of Contents
MITSUBISHI UFJ FINANCIAL GROUP, INC. AND SUBSIDIARIES
NOTES TO CONSOLIDATED FINANCIAL STATEMENTS—(Continued)
Net periodic cost of pension benefits and other benefits for the fiscal years ended March 31, 2012, 2013 and 2014 includes the following components:
| Domestic subsidiaries | Foreign offices and subsidiaries | |||||||||||||||||||||||||||||||||||
| 2012 | 2013 | 2014 | 2012 | 2013 | 2014 | |||||||||||||||||||||||||||||||
|
Pension
benefits and SIP |
Pension
benefits and SIP |
Pension
benefits and SIP |
Pension
benefits |
Other
benefits |
Pension
benefits |
Other
benefits |
Pension
benefits |
Other
benefits |
||||||||||||||||||||||||||||
| (in millions) | ||||||||||||||||||||||||||||||||||||
|
Service cost—benefits earned during the fiscal year |
¥ | 39,709 | ¥ | 38,840 | ¥ | 39,309 | ¥ | 6,328 | ¥ | 968 | ¥ | 8,098 | ¥ | 1,114 | ¥ | 12,215 | ¥ | 1,526 | ||||||||||||||||||
|
Interest cost on projected benefit obligation |
31,509 | 26,648 | 22,464 | 10,649 | 1,192 | 10,716 | 1,135 | 13,467 | 1,352 | |||||||||||||||||||||||||||
|
Expected return on plan assets |
(55,336 | ) | (48,106 | ) | (54,222 | ) | (14,216 | ) | (1,106 | ) | (14,169 | ) | (1,030 | ) | (19,928 | ) | (1,423 | ) | ||||||||||||||||||
|
Amortization of net actuarial loss |
29,424 | 42,496 | 23,941 | 6,221 | 514 | 8,030 | 715 | 9,808 | 776 | |||||||||||||||||||||||||||
|
Amortization of prior service cost |
(11,534 | ) | (12,309 | ) | (11,793 | ) | 35 | (57 | ) | 54 | (59 | ) | 157 | (69 | ) | |||||||||||||||||||||
|
Amortization of net obligation at transition |
— | — | — | — | 105 | — | 105 | — | — | |||||||||||||||||||||||||||
|
Loss (gain) on settlements and curtailment |
4,378 | 2,600 | 41,456 | 40 | — | 95 | (3 | ) | — | — | ||||||||||||||||||||||||||
|
|
|
|
|
|
|
|
|
|
|
|
|
|
|
|
|
|
|
|||||||||||||||||||
|
Net periodic benefit cost |
¥ | 38,150 | ¥ | 50,169 | ¥ | 61,155 | ¥ | 9,057 | ¥ | 1,616 | ¥ | 12,824 | ¥ | 1,977 | ¥ | 15,719 | ¥ | 2,162 | ||||||||||||||||||
|
|
|
|
|
|
|
|
|
|
|
|
|
|
|
|
|
|
|
|||||||||||||||||||
The following table summarizes the assumptions used in computing the present value of the projected benefit obligations and the net periodic benefit cost:
| Domestic subsidiaries | Foreign offices and subsidiaries | |||||||||||||||||||||||||||||||||||
| 2012 | 2013 | 2014 | 2012 | 2013 | 2014 | |||||||||||||||||||||||||||||||
|
Pension
benefits and SIP |
Pension
benefits and SIP |
Pension
benefits and SIP |
Pension
benefits |
Other
benefits |
Pension
benefits |
Other
benefits |
Pension
benefits |
Other
benefits |
||||||||||||||||||||||||||||
|
Weighted-average assumptions used: |
||||||||||||||||||||||||||||||||||||
|
Discount rates in determining expense |
1.91 | % | 1.55 | % | 1.25 | % | 5.67 | % | 5.36 | % | 4.73 | % | 4.70 | % | 4.25 | % | 4.01 | % | ||||||||||||||||||
|
Discount rates in determining benefit obligation |
1.55 | 1.25 | 1.23 | 4.73 | 4.70 | 4.25 | 4.01 | 4.87 | 4.63 | |||||||||||||||||||||||||||
|
Rates of increase in future compensation level for determining expense |
3.23 | 3.31 | 3.07 | 4.67 | — | 4.60 | — | 4.58 | — | |||||||||||||||||||||||||||
|
Rates of increase in future compensation level for determining benefit obligation |
3.31 | 3.07 | 3.36 | 4.60 | — | 4.58 | — | 4.64 | — | |||||||||||||||||||||||||||
|
Expected rates of return on plan assets |
3.11 | 2.78 | 2.83 | 7.49 | 8.00 | 6.92 | 7.50 | 6.98 | 7.50 | |||||||||||||||||||||||||||
F-75
Table of Contents
MITSUBISHI UFJ FINANCIAL GROUP, INC. AND SUBSIDIARIES
NOTES TO CONSOLIDATED FINANCIAL STATEMENTS—(Continued)
The following tables present the assumed health care cost trend rates for foreign offices and subsidiaries, which are used to measure the expected cost of benefits for the next year, and the effect of a one-percentage-point change in the assumed health care cost trend rate:
| MUAH | Other than MUAH | |||||||||||||||
| 2013 (1) | 2014 (1) | 2013 (1) | 2014 (1) | |||||||||||||
|
Initial trend rate |
8.31 | % | 7.71 | % | 7.50 | % | 8.00 | % | ||||||||
|
Ultimate trend rate |
4.50 | % | 4.50 | % | 4.50 | % | 5.00 | % | ||||||||
|
Year the rate reaches the ultimate trend rate |
2021 | 2021 | 2017 | 2019 | ||||||||||||
| MUAH | Other than MUAH | |||||||||||||||
|
One-percentage-
point increase |
One-percentage-
point decrease |
One-percentage-
point increase |
One-percentage-
point decrease |
|||||||||||||
| (in millions) | ||||||||||||||||
|
Effect on total of service and interest cost components |
¥422 | ¥ | (422 | ) | ¥79 | ¥ | (61 | ) | ||||||||
|
Effect on postretirement benefit obligation |
3,478 | (2,951 | ) | 1,128 | (885 | ) | ||||||||||
Note:
| (1) | Fiscal years of MUAH and foreign subsidiaries end on December 31. Therefore, the above tables present the rates and amounts at December 31, 2012 and 2013, respectively. |
F-76
Table of Contents
MITSUBISHI UFJ FINANCIAL GROUP, INC. AND SUBSIDIARIES
NOTES TO CONSOLIDATED FINANCIAL STATEMENTS—(Continued)
The following table sets forth the combined funded status and amounts recognized in the accompanying consolidated balance sheets at March 31, 2013 and 2014:
| Domestic subsidiaries | Foreign offices and subsidiaries | |||||||||||||||||||||||||||||||
| 2013 | 2014 | 2013 | 2014 | |||||||||||||||||||||||||||||
|
Non-contributory
pension benefits and SIP |
Contributory
pension benefits |
Non-contributory
pension benefits and SIP |
Contributory
pension benefits |
Pension
benefits |
Other
benefits |
Pension
benefits |
Other
benefits |
|||||||||||||||||||||||||
| (in millions) | ||||||||||||||||||||||||||||||||
|
Change in benefit obligation: |
||||||||||||||||||||||||||||||||
|
Benefit obligation at beginning of fiscal year |
¥ | 1,383,933 | ¥ | 389,264 | ¥ | 1,433,161 | ¥ | 404,427 | ¥ | 225,361 | ¥ | 24,701 | ¥ | 283,224 | ¥ | 30,002 | ||||||||||||||||
|
Service cost |
34,182 | 4,658 | 36,147 | 3,162 | 8,098 | 1,114 | 12,215 | 1,526 | ||||||||||||||||||||||||
|
Interest cost |
20,510 | 6,138 | 17,448 | 5,016 | 10,716 | 1,135 | 13,467 | 1,352 | ||||||||||||||||||||||||
|
Plan participants’ contributions |
— | — | — | — | 14 | 450 | 5 | 648 | ||||||||||||||||||||||||
|
Acquisitions/ Divestitures |
8 | — | (807 | ) | — | — | — | 9,359 | — | |||||||||||||||||||||||
|
Amendments |
— | — | (32 | ) | — | 302 | — | 980 | — | |||||||||||||||||||||||
|
Actuarial loss (gain) |
65,369 | 15,583 | 26,417 | (8,984 | ) | 23,154 | 975 | (24,716 | ) | (2,966 | ) | |||||||||||||||||||||
|
Benefits paid |
(55,396 | ) | (11,216 | ) | (55,608 | ) | (11,202 | ) | (13,161 | ) | (1,673 | ) | (9,851 | ) | (2,136 | ) | ||||||||||||||||
|
Lump-sum payment |
(15,445 | ) | — | (14,313 | ) | — | (440 | ) | — | (158 | ) | — | ||||||||||||||||||||
|
Translation adjustments and other |
— | — | 224,238 | (2) | (392,419 | ) (2) | 29,180 | 3,300 | 61,356 | 5,920 | ||||||||||||||||||||||
|
|
|
|
|
|
|
|
|
|
|
|
|
|
|
|
|
|||||||||||||||||
|
Benefit obligation at end of fiscal year |
1,433,161 | 404,427 | 1,666,651 | — | 283,224 | 30,002 | 345,881 | 34,346 | ||||||||||||||||||||||||
|
|
|
|
|
|
|
|
|
|
|
|
|
|
|
|
|
|||||||||||||||||
|
Change in plan assets: |
||||||||||||||||||||||||||||||||
|
Fair value of plan assets at beginning of fiscal year |
1,317,074 | 433,710 | 1,462,406 | 458,171 | 182,791 | 13,370 | 233,081 | 18,185 | ||||||||||||||||||||||||
|
Actual return (loss) on plan assets |
174,467 | 64,893 | 124,355 | 34,472 | 24,787 | 1,866 | 43,561 | 3,611 | ||||||||||||||||||||||||
|
Employer contributions |
26,314 | 15,635 | 31,640 | 12,843 | 14,807 | 1,144 | 41,423 | 1,313 | ||||||||||||||||||||||||
|
Acquisitions/ Divestitures |
(53 | ) | — | 176 | — | — | — | — | — | |||||||||||||||||||||||
|
Plan participants’ contributions |
— | — | — | — | 14 | 450 | 5 | 648 | ||||||||||||||||||||||||
|
Benefits paid |
(55,396 | ) | (11,216 | ) | (55,608 | ) | (11,202 | ) | (13,161 | ) | (1,673 | ) | (9,851 | ) | (2,136 | ) | ||||||||||||||||
|
Translation adjustments and other |
— | (44,851 | ) (1) | 441,360 | (2) | (494,284 | ) (2) | 23,843 | 3,028 | 59,876 | 4,224 | |||||||||||||||||||||
|
|
|
|
|
|
|
|
|
|
|
|
|
|
|
|
|
|||||||||||||||||
|
Fair value of plan assets at end of fiscal year |
1,462,406 | 458,171 | 2,004,329 | — | 233,081 | 18,185 | 368,095 | 25,845 | ||||||||||||||||||||||||
|
|
|
|
|
|
|
|
|
|
|
|
|
|
|
|
|
|||||||||||||||||
|
Amounts recognized in the consolidated balance sheets: |
||||||||||||||||||||||||||||||||
|
Prepaid benefit cost |
¥ | 60,279 | ¥ | 53,744 | ¥ | 357,817 | ¥ | — | ¥ | 3,850 | ¥ | — | ¥ | 54,600 | ¥ | — | ||||||||||||||||
|
Accrued benefit cost |
(31,034 | ) | — | (20,139 | ) | — | (53,993 | ) | (11,817 | ) | (32,386 | ) | (8,501 | ) | ||||||||||||||||||
|
|
|
|
|
|
|
|
|
|
|
|
|
|
|
|
|
|||||||||||||||||
|
Net amount recognized |
¥ | 29,245 | ¥ | 53,744 | ¥ | 337,678 | ¥ | — | ¥ | (50,143 | ) | ¥ | (11,817 | ) | ¥ | 22,214 | ¥ | (8,501 | ) | |||||||||||||
|
|
|
|
|
|
|
|
|
|
|
|
|
|
|
|
|
|||||||||||||||||
Notes:
| (1) | MUTB partially withdrew assets from employee retirement benefit trusts, amount of ¥44,851 million, which were established for the payment of employees’ pension benefits. The related plan remains in an overfunded status as of March 31, 2013. No gains or losses have been recognized as a consequence of this transaction. |
| (2) | MUTB separated the substitutional portion of its contributory CDBP and transferred the related obligation and assets to the Japanese government. The transferred obligation and assets to the Japanese government were ¥169,951 million and ¥52,971 million, respectively. Subsequent to the separation process, MUTB transferred the remaining corporate portion of its contributory CDBP into a non-contributory CDBP. The transferred obligation and assets to the non-contributory CDBP were ¥224,238 million and ¥441,313 million, respectively. |
F-77
Table of Contents
MITSUBISHI UFJ FINANCIAL GROUP, INC. AND SUBSIDIARIES
NOTES TO CONSOLIDATED FINANCIAL STATEMENTS—(Continued)
The aggregated accumulated benefit obligations of these plans at March 31, 2013 and 2014 were as follows:
|
Domestic
subsidiaries |
Foreign offices
and subsidiaries |
|||||||||||||||
| 2013 | 2014 | 2013 | 2014 | |||||||||||||
| (in millions) | ||||||||||||||||
|
Aggregated accumulated benefit obligations |
¥ | 1,808,001 | ¥ | 1,639,563 | ¥ | 262,200 | ¥ | 318,971 | ||||||||
The projected benefit obligations, accumulated benefit obligations and fair value of plan assets for the plans with accumulated benefit obligations in excess of plan assets at March 31, 2013 and 2014 were as follows:
|
Domestic
subsidiaries |
Foreign offices
and subsidiaries |
|||||||||||||||
| 2013 | 2014 | 2013 | 2014 | |||||||||||||
| (in millions) | ||||||||||||||||
|
Projected benefit obligations |
¥ | 96,622 | ¥ | 55,684 | ¥ | 264,204 | ¥ | 57,972 | ||||||||
|
Accumulated benefit obligations |
89,166 | 52,578 | 243,268 | 54,499 | ||||||||||||
|
Fair value of plan assets |
65,601 | 37,033 | 210,793 | 25,812 | ||||||||||||
BTMU, MUTB, MUSHD, Mitsubishi UFJ NICOS and other subsidiaries paid special lump-sum termination benefits which are not a part of pension plans to certain early-terminated employees. The amounts charged to operations for such early termination benefits for the fiscal years ended March 31, 2012, 2013 and 2014 were ¥34,600 million, ¥11,234 million and ¥7,358 million, respectively. The ¥34,600 million charged to operations for the fiscal year ended March 31, 2012 mainly consisted of ¥20,512 million related to MUSHD.
The following table presents the amounts recognized in Accumulated OCI of the MUFG Group at March 31, 2013 and 2014:
| Domestic subsidiaries | Foreign offices and subsidiaries | |||||||||||||||||||||||
| 2013 | 2014 | 2013 | 2014 | |||||||||||||||||||||
|
Pension
benefits and SIP |
Pension
benefits and SIP |
Pension
benefits |
Other
benefits |
Pension
benefits |
Other
benefits |
|||||||||||||||||||
| (in millions) | ||||||||||||||||||||||||
|
Net actuarial loss |
¥ | 488,936 | ¥ | 336,312 | ¥ | 98,654 | ¥ | 8,314 | ¥ | 57,474 | ¥ | 3,585 | ||||||||||||
|
Prior service cost |
(46,580 | ) | (34,787 | ) | 386 | (100 | ) | 1,129 | (41 | ) | ||||||||||||||
|
|
|
|
|
|
|
|
|
|
|
|
|
|||||||||||||
|
Gross amount recognized in Accumulated OCI |
442,356 | 301,525 | 99,040 | 8,214 | 58,603 | 3,544 | ||||||||||||||||||
|
Taxes |
(183,884 | ) | (133,606 | ) | (38,585 | ) | (3,212 | ) | (23,063 | ) | (767 | ) | ||||||||||||
|
|
|
|
|
|
|
|
|
|
|
|
|
|||||||||||||
|
Net amount recognized in Accumulated OCI |
¥ | 258,472 | ¥ | 167,919 | ¥ | 60,455 | ¥ | 5,002 | ¥ | 35,540 | ¥ | 2,777 | ||||||||||||
|
|
|
|
|
|
|
|
|
|
|
|
|
|||||||||||||
F-78
Table of Contents
MITSUBISHI UFJ FINANCIAL GROUP, INC. AND SUBSIDIARIES
NOTES TO CONSOLIDATED FINANCIAL STATEMENTS—(Continued)
The following table presents OCI in the fiscal years ended March 31, 2013 and 2014:
| Domestic subsidiaries | Foreign offices and subsidiaries | |||||||||||||||||||||||
| 2013 | 2014 | 2013 | 2014 | |||||||||||||||||||||
|
Pension
benefits and SIP |
Pension
benefits and SIP |
Pension
benefits |
Other
benefits |
Pension
benefits |
Other
benefits |
|||||||||||||||||||
| (in millions) | ||||||||||||||||||||||||
|
Net actuarial loss (gain) arising during the year |
¥ | (110,303 | ) | ¥ | (87,227 | ) | ¥ | 11,326 | ¥ | 141 | ¥ | (47,687 | ) | ¥ | (5,130 | ) | ||||||||
|
Prior service cost arising during the year |
— | — | 270 | — | 862 | — | ||||||||||||||||||
|
Losses (gains) due to amortization: |
||||||||||||||||||||||||
|
Net actuarial loss |
(42,496 | ) | (23,941 | ) | (8,030 | ) | (715 | ) | (9,808 | ) | (776 | ) | ||||||||||||
|
Prior service cost |
12,309 | 11,793 | (54 | ) | 59 | (157 | ) | 69 | ||||||||||||||||
|
Net obligation at transition |
— | — | — | (105 | ) | — | — | |||||||||||||||||
|
Curtailment and settlement |
(2,600 | ) | (41,456 | ) | (95 | ) | 3 | — | — | |||||||||||||||
|
Foreign currency translation adjustments |
— | — | 10,112 | 895 | 16,353 | 1,167 | ||||||||||||||||||
|
|
|
|
|
|
|
|
|
|
|
|
|
|||||||||||||
|
Total changes in Accumulated OCI |
¥ | (143,090 | ) | ¥ | (140,831 | ) | ¥ | 13,529 | ¥ | 278 | ¥ | (40,437 | ) | ¥ | (4,670 | ) | ||||||||
|
|
|
|
|
|
|
|
|
|
|
|
|
|||||||||||||
The following table presents the expected amounts that will be amortized from Accumulated OCI as components of net periodic benefit cost, before taxes, for the fiscal year ending March 31, 2015:
|
Domestic
subsidiaries |
Foreign offices
and subsidiaries |
|||||||||||
|
Pension
benefits and SIP |
Pension
benefits |
Other
benefits |
||||||||||
| (in millions) | ||||||||||||
|
Net actuarial loss |
¥ | 14,265 | ¥ | 6,402 | ¥ | 117 | ||||||
|
Prior service cost |
(8,932 | ) | 109 | (24 | ) | |||||||
|
|
|
|
|
|
|
|||||||
|
Total |
¥ | 5,333 | ¥ | 6,511 | ¥ | 93 | ||||||
|
|
|
|
|
|
|
|||||||
Investment policies
MUFG’s investment policy for plan assets is based on an asset liability matching strategy which is intended to maintain adequate liquidity for benefit payments and to achieve a stable increase in the plan assets in the medium and long term through proper risk control and return maximization. As a general rule, investment policies for plan assets are reviewed periodically for some plans and in the following situations for all plans: (1) large fluctuations in pension plan liabilities caused by modifications to pension plans, or (2) changes in the market environment. The plan assets allocation strategies are the principal determinant in achieving expected investment returns on the plan assets. Actual asset allocations may fluctuate within acceptable ranges due to market value variability. Plan assets are managed by a combination of internal and external asset management companies and are rebalanced when market fluctuations cause an asset category to fall outside of its strategic asset allocation range. Performance of each plan asset category is compared against established indices and similar plan asset groups to evaluate whether the risk associated with the portfolio is appropriate for the level of return.
F-79
Table of Contents
MITSUBISHI UFJ FINANCIAL GROUP, INC. AND SUBSIDIARIES
NOTES TO CONSOLIDATED FINANCIAL STATEMENTS—(Continued)
The weighted-average target asset allocation of plan assets for the pension benefits and other benefits at March 31, 2014 was as follows:
|
Domestic
subsidiaries |
Foreign offices
and subsidiaries |
|||||||||||
|
Asset category |
Pension
benefits and SIP |
Pension
benefits |
Other
benefits |
|||||||||
|
Japanese equity securities |
37.4 | % | 0.4 | % | — | % | ||||||
|
Japanese debt securities |
39.5 | — | — | |||||||||
|
Non-Japanese equity securities |
11.8 | 57.9 | 70.0 | |||||||||
|
Non-Japanese debt securities |
4.7 | 27.9 | 30.0 | |||||||||
|
Real estate |
— | 9.7 | — | |||||||||
|
Short-term assets |
6.6 | 4.1 | — | |||||||||
|
|
|
|
|
|
|
|||||||
|
Total |
100.0 | % | 100.0 | % | 100.0 | % | ||||||
|
|
|
|
|
|
|
|||||||
Basis and procedure for estimating long-term return of each asset category
MUFG’s expected long-term rate of return on plan assets for domestic defined benefit pension plans and SIPs is based on a building-block methodology, which calculates the total long-term rate of return of the plan assets by aggregating the weighted rate of return derived from both long-term historical performance and forward-looking return expectations from each asset category.
MUFG has determined the expected long-term rate of return for each asset category as below:
| Ÿ | Japanese equity securities: the rate for Japanese debt securities plus a premium for the risk associated with Japanese equity securities |
| Ÿ | Japanese debt securities: economic growth rate of Japan |
| Ÿ | Non-Japanese equity securities: the rate for non-Japanese debt securities plus a premium for the risk associated with non-Japanese equity securities |
| Ÿ | Non-Japanese debt securities: global economic growth rate |
Foreign offices and subsidiaries periodically reconsider the expected long-term rate of return for their plan assets. They evaluate the investment return volatility of different asset categories and compare the liability structure of their pension and other benefits to those of other companies, while considering their funding policy to maintain a funded status sufficient to meet participants’ benefit obligations, and reduce long-term funding requirements and pension costs. Based on this information, foreign offices and subsidiaries update the expected long-term rate of return.
Cash flows
The MUFG Group expects to contribute to the plan assets for the fiscal year ending March 31, 2015 based upon its current funded status and expected asset return assumptions as follows:
|
For the pension benefits of domestic subsidiaries |
¥ | 39.4 billion | ||
|
For the pension benefits of foreign offices and subsidiaries |
14.3 billion | |||
|
For the other benefits of foreign offices and subsidiaries |
2.3 billion |
F-80
Table of Contents
MITSUBISHI UFJ FINANCIAL GROUP, INC. AND SUBSIDIARIES
NOTES TO CONSOLIDATED FINANCIAL STATEMENTS—(Continued)
Estimated future benefit payments
The following table presents benefit payments expected to be paid, which include the effect of expected future service for the fiscal years indicated:
|
Domestic
subsidiaries |
Foreign offices
and subsidiaries |
|||||||||||
|
Pension
benefits and SIP |
Pension
benefits |
Other
benefits |
||||||||||
| (in millions) | ||||||||||||
|
Fiscal year ending March 31: |
||||||||||||
|
2015 |
¥ | 79,808 | ¥ | 11,242 | ¥ | 1,819 | ||||||
|
2016 |
81,641 | 12,173 | 1,935 | |||||||||
|
2017 |
82,599 | 13,517 | 2,036 | |||||||||
|
2018 |
82,740 | 14,614 | 2,160 | |||||||||
|
2019 |
82,608 | 15,906 | 2,255 | |||||||||
|
Thereafter (2020-2024) |
410,139 | 108,484 | 12,778 | |||||||||
Fair value measurement of the plan assets
The following is a description of the valuation methodologies used for plan assets measured at fair value as well as the classification of the plan assets pursuant to the fair value hierarchy described in Note 31:
Government bonds and other debt securities
When quoted prices are available in an active market, the MUFG Group adopts the quoted prices to measure the fair value of securities and such securities are classified in Level 1 of the fair value hierarchy. Level 1 securities include Japanese government bonds, most of non-Japanese government bonds and certain corporate bonds. When quoted prices are available but not traded actively, such securities are classified in Level 2 of the fair value hierarchy. When quoted prices are not available, the MUFG Group generally estimates fair values by using non-binding prices obtained from independent pricing vendors. Such securities are generally classified in Level 2 of the fair value hierarchy. Level 2 securities include certain non-Japanese government bonds, official institutions bonds and corporate bonds. When there is lack of liquidity for securities or significant inputs adopted to the fair value measurements are unobservable, such securities are classified in Level 3 of the fair value hierarchy. Such Level 3 securities mainly consist of non-Japanese corporate bonds.
Marketable equity securities
When quoted prices are available in an active market, the MUFG Group adopts the quoted prices to measure the fair value of marketable equity securities and such securities are classified in Level 1 of the fair value hierarchy. When quoted prices are available but not traded actively, such securities are classified in Level 2 of the fair value hierarchy.
Japanese pooled funds
Japanese pooled funds are investment fund vehicles designed for Japanese pension plan investments under Japanese pension trust fund regulations. Based upon the nature of the funds’ investments, Japanese pooled funds are categorized into four major fund types: Japanese marketable equity securities type, Japanese debt securities
F-81
Table of Contents
MITSUBISHI UFJ FINANCIAL GROUP, INC. AND SUBSIDIARIES
NOTES TO CONSOLIDATED FINANCIAL STATEMENTS—(Continued)
type, Non-Japanese marketable equity securities type and Non-Japanese debt securities type. The other types of funds invest in short-term financial instruments or loans receivable. Japanese pooled funds are generally readily redeemable at their net asset values. The fair values of Japanese pooled funds are measured at their net asset values and generally classified in Level 2 of the fair value hierarchy. Japanese pooled funds classified in Level 3 of the fair value hierarchy have underlying investments in non-Japanese debt securities and loans receivable whose fair values are measured by using significant unobservable inputs and there is inherent lack of the funds’ liquidity.
Other investment funds
Other investment funds include mutual funds, private investments funds, common collective funds, private equity funds and real estate funds. The listed investment funds or mutual funds are valued at quoted prices and classified in Level 1 or Level 2 of the fair value hierarchy. When there is no available market quotation, the fair values are generally determined at net asset values. The funds for which the fair values are measured at their net asset value are classified either in Level 2 or Level 3 depending on the nature of any restrictions on the investor’s ability to redeem its investments at the measurement date or in the near future. Other investment funds classified in Level 3 of the fair value hierarchy mainly consist of certain private investment funds and real estate funds whose fair values are not measured at their net asset values but by using significant unobservable inputs and there is inherent lack of the funds’ liquidity.
Japanese general accounts of life insurance companies
These instruments are contracts with life insurance companies that guarantee return of a certain level of fixed income, which are mainly invested in assets with low market risk such as Japanese debt securities. They are measured at conversion value and classified in Level 2 in the fair value hierarchy.
Other investments
Other investments mainly consist of call loans and the rest consist of miscellaneous accounts such as deposits with banks and short term investments. These instruments are generally classified in Level 1 or Level 2 of the fair value hierarchy depending on observability of the inputs to measure their fair values.
F-82
Table of Contents
MITSUBISHI UFJ FINANCIAL GROUP, INC. AND SUBSIDIARIES
NOTES TO CONSOLIDATED FINANCIAL STATEMENTS—(Continued)
The following table presents the fair value of each major category of plan assets as of March 31, 2013 and 2014:
Pension benefits and SIP Investments:
|
At March 31, 2013 |
Domestic subsidiaries | Foreign offices and subsidiaries | ||||||||||||||||||||||||||||||
|
Assets category |
Level 1 | Level 2 | Level 3 | Total | Level 1 | Level 2 | Level 3 | Total | ||||||||||||||||||||||||
| (in millions) | ||||||||||||||||||||||||||||||||
|
Japanese government bonds |
¥ | 76,763 | ¥ | — | ¥ | — | ¥ | 76,763 | ¥ | — | ¥ | — | ¥ | — | ¥ | — | ||||||||||||||||
|
Non-Japanese government bonds |
13,898 | 2,761 | — | 16,659 | — | 7,600 | — | 7,600 | ||||||||||||||||||||||||
|
Other debt securities (1) |
151 | 18,517 | 6,134 | 24,802 | — | 33,315 | — | 33,315 | ||||||||||||||||||||||||
|
Japanese marketable equity securities (2) |
661,832 | 148 | — | 661,980 | — | — | — | — | ||||||||||||||||||||||||
|
Non-Japanese marketable equity securities |
19,386 | 207 | — | 19,593 | 13,720 | — | — | 13,720 | ||||||||||||||||||||||||
|
Japanese pooled funds: |
||||||||||||||||||||||||||||||||
|
Japanese marketable equity securities (2) |
— | 46,175 | — | 46,175 | — | — | — | — | ||||||||||||||||||||||||
|
Japanese debt securities (1) |
— | 403,006 | — | 403,006 | — | — | — | — | ||||||||||||||||||||||||
|
Non-Japanese marketable equity securities |
— | 190,367 | — | 190,367 | — | — | — | — | ||||||||||||||||||||||||
|
Non-Japanese debt securities |
— | 65,087 | 6,846 | 71,933 | — | — | — | — | ||||||||||||||||||||||||
|
Other |
— | 17,623 | — | 17,623 | — | — | — | — | ||||||||||||||||||||||||
|
|
|
|
|
|
|
|
|
|
|
|
|
|
|
|
|
|||||||||||||||||
|
Total pooled funds |
— | 722,258 | 6,846 | 729,104 | — | — | — | — | ||||||||||||||||||||||||
|
|
|
|
|
|
|
|
|
|
|
|
|
|
|
|
|
|||||||||||||||||
|
Other investment funds |
— | 98,520 | 48,631 | 147,151 | 91,582 | 65,068 | 14,486 | 171,136 | (4) | |||||||||||||||||||||||
|
Japanese general account of life insurance companies (3) |
— | 163,503 | — | 163,503 | — | — | — | — | ||||||||||||||||||||||||
|
Other investments |
1,636 | 79,386 | — | 81,022 | 839 | 4,488 | 1,983 | 7,310 | ||||||||||||||||||||||||
|
|
|
|
|
|
|
|
|
|
|
|
|
|
|
|
|
|||||||||||||||||
|
Total |
¥ | 773,666 | ¥ | 1,085,300 | ¥ | 61,611 | ¥ | 1,920,577 | ¥ | 106,141 | ¥ | 110,471 | ¥ | 16,469 | ¥ | 233,081 | ||||||||||||||||
|
|
|
|
|
|
|
|
|
|
|
|
|
|
|
|
|
|||||||||||||||||
F-83
Table of Contents
MITSUBISHI UFJ FINANCIAL GROUP, INC. AND SUBSIDIARIES
NOTES TO CONSOLIDATED FINANCIAL STATEMENTS—(Continued)
|
At March 31, 2014 |
Domestic subsidiaries | Foreign offices and subsidiaries | ||||||||||||||||||||||||||||||
|
Assets category |
Level 1 | Level 2 | Level 3 | Total | Level 1 | Level 2 | Level 3 | Total | ||||||||||||||||||||||||
| (in millions) | ||||||||||||||||||||||||||||||||
|
Japanese government bonds |
¥ | 65,309 | ¥ | — | ¥ | — | ¥ | 65,309 | ¥ | — | ¥ | — | ¥ | — | ¥ | — | ||||||||||||||||
|
Non-Japanese government bonds |
19,799 | 2,041 | — | 21,840 | — | 13,443 | — | 13,443 | ||||||||||||||||||||||||
|
Other debt securities (1) |
523 | 11,798 | 5,983 | 18,304 | — | 52,463 | — | 52,463 | ||||||||||||||||||||||||
|
Japanese marketable equity securities (2) |
713,152 | 127 | — | 713,279 | — | — | — | — | ||||||||||||||||||||||||
|
Non-Japanese marketable equity securities |
12,166 | 1,122 | — | 13,288 | 24,515 | — | — | 24,515 | ||||||||||||||||||||||||
|
Japanese pooled funds: |
||||||||||||||||||||||||||||||||
|
Japanese marketable equity securities (2) |
— | 26,792 | — | 26,792 | — | — | — | — | ||||||||||||||||||||||||
|
Japanese debt securities (1) |
— | 400,132 | — | 400,132 | — | — | — | — | ||||||||||||||||||||||||
|
Non-Japanese marketable equity securities |
— | 176,710 | — | 176,710 | — | — | — | — | ||||||||||||||||||||||||
|
Non-Japanese debt securities |
— | 91,642 | 7,342 | 98,984 | — | — | — | — | ||||||||||||||||||||||||
|
Other |
— | 13,026 | — | 13,026 | — | — | — | — | ||||||||||||||||||||||||
|
|
|
|
|
|
|
|
|
|
|
|
|
|
|
|
|
|||||||||||||||||
|
Total pooled funds |
— | 708,302 | 7,342 | 715,644 | — | — | — | — | ||||||||||||||||||||||||
|
|
|
|
|
|
|
|
|
|
|
|
|
|
|
|
|
|||||||||||||||||
|
Other investment funds |
— | 132,105 | 43,446 | 175,551 | 155,637 | 87,103 | 26,740 | 269,480 | (4) | |||||||||||||||||||||||
|
Japanese general account of life insurance companies (3) |
— | 173,398 | — | 173,398 | — | — | — | — | ||||||||||||||||||||||||
|
Other investments |
2,038 | 105,678 | — | 107,716 | 620 | 4,673 | 2,901 | 8,194 | ||||||||||||||||||||||||
|
|
|
|
|
|
|
|
|
|
|
|
|
|
|
|
|
|||||||||||||||||
|
Total |
¥ | 812,987 | ¥ | 1,134,571 | ¥ | 56,771 | ¥ | 2,004,329 | ¥ | 180,772 | ¥ | 157,682 | ¥ | 29,641 | ¥ | 368,095 | ||||||||||||||||
|
|
|
|
|
|
|
|
|
|
|
|
|
|
|
|
|
|||||||||||||||||
Notes:
| (1) | These debt securities include debt securities issued by the MUFG Group in the amount of ¥471 million (0.02% of plan assets) and ¥401 million (0.02% of plan assets) to the pension benefits and SIPs at March 31, 2013 and 2014, respectively. |
| (2) | Japanese marketable equity securities include common stocks issued by the MUFG Group in the amount of ¥6,864 million (0.32% of plan assets) and ¥7,354 million (0.31% of plan assets) to the pension benefits and SIPs at March 31, 2013 and 2014, respectively. |
| (3) | “Japanese general accounts of life insurance companies” is a contract with life insurance companies that guarantees a return of approximately 1.17% from April 1, 2012 to March 31, 2013 and 1.24% from April 1, 2013 to March 31, 2014. |
| (4) | Other investment funds of the foreign offices and subsidiaries are mainly comprised of ¥87,243 million of mutual funds and ¥13,531 million of real estate funds, and of ¥148,360 million of mutual funds and ¥25,486 million of real estate funds, which were held by MUAH at December 31, 2012 and 2013, respectively. |
Other post retirement plan investments:
| Foreign offices and subsidiaries | ||||||||||||||||||||||||||||||||
| March 31, 2013 | March 31, 2014 | |||||||||||||||||||||||||||||||
|
Assets category |
Level 1 | Level 2 | Level 3 | Total | Level 1 | Level 2 | Level 3 | Total | ||||||||||||||||||||||||
| (in millions) | ||||||||||||||||||||||||||||||||
|
Other debt securities |
¥ | — | ¥ | 3,619 | ¥ | — | ¥ | 3,619 | ¥ | — | ¥ | 5,548 | ¥ | — | ¥ | 5,548 | ||||||||||||||||
|
Other investment funds (1) |
8,901 | — | — | 8,901 | 13,531 | — | — | 13,531 | ||||||||||||||||||||||||
|
Other investments |
— | 5,665 | — | 5,665 | — | 6,766 | — | 6,766 | ||||||||||||||||||||||||
|
|
|
|
|
|
|
|
|
|
|
|
|
|
|
|
|
|||||||||||||||||
|
Total |
¥ | 8,901 | ¥ | 9,284 | ¥ | — | ¥ | 18,185 | ¥ | 13,531 | ¥ | 12,314 | ¥ | — | ¥ | 25,845 | ||||||||||||||||
|
|
|
|
|
|
|
|
|
|
|
|
|
|
|
|
|
|||||||||||||||||
Note:
| (1) | Other investment funds mainly consist of mutual funds and common collective funds. |
F-84
Table of Contents
MITSUBISHI UFJ FINANCIAL GROUP, INC. AND SUBSIDIARIES
NOTES TO CONSOLIDATED FINANCIAL STATEMENTS—(Continued)
The following tables present a reconciliation of plan assets measured at fair value using significant unobservable inputs (Level 3) during the fiscal years ended March 31, 2013 and 2014:
Pension benefits and SIP Investments:
| Domestic subsidiaries | ||||||||||||||||||||||||||||
|
Assets category |
March 31,
2012 |
Realized
gains (losses) |
Unrealized
gains (losses) |
Purchase,
sales and settlements |
Transfer
into Level 3 |
Transfer
out of Level 3 |
March 31,
2013 |
|||||||||||||||||||||
| (in millions) | ||||||||||||||||||||||||||||
|
Other debt securities |
¥ | 5,995 | ¥ | 18 | ¥ | 409 | ¥ | (248 | ) | ¥ | — | ¥ | (40 | ) | ¥ | 6,134 | ||||||||||||
|
Non-Japanese marketable equity securities |
87 | 30 | — | (117 | ) | — | — | — | ||||||||||||||||||||
|
Japanese pooled funds: |
||||||||||||||||||||||||||||
|
Non-Japanese debt securities |
5,807 | — | 1,042 | (3 | ) | — | — | 6,846 | ||||||||||||||||||||
|
Other |
2,501 | — | — | — | — | (2,501 | ) | — | ||||||||||||||||||||
|
|
|
|
|
|
|
|
|
|
|
|
|
|
|
|||||||||||||||
|
Total pooled funds |
8,308 | — | 1,042 | (3 | ) | — | (2,501 | ) | 6,846 | |||||||||||||||||||
|
|
|
|
|
|
|
|
|
|
|
|
|
|
|
|||||||||||||||
|
Other investment funds |
41,097 | (389 | ) | 3,997 | (4,503 | ) | 8,429 | — | 48,631 | |||||||||||||||||||
|
|
|
|
|
|
|
|
|
|
|
|
|
|
|
|||||||||||||||
|
Total |
¥ | 55,487 | ¥ | (341 | ) | ¥ | 5,448 | ¥ | (4,871 | ) | ¥ | 8,429 | ¥ | (2,541 | ) | ¥ | 61,611 | |||||||||||
|
|
|
|
|
|
|
|
|
|
|
|
|
|
|
|||||||||||||||
| Foreign offices and subsidiaries | ||||||||||||||||||||||||||||
|
Assets category |
March 31,
2012 |
Realized
gains (losses) |
Unrealized
gains (losses) |
Purchase,
sales and settlements |
Transfer
into Level 3 |
Transfer
out of Level 3 |
March 31,
2013 |
|||||||||||||||||||||
| (in millions) | ||||||||||||||||||||||||||||
|
Other investment funds |
¥ | 12,282 | ¥ | — | ¥ | 1,075 | ¥ | 1,129 | ¥ | — | ¥ | — | ¥ | 14,486 | ||||||||||||||
|
Other investments |
344 | — | 1,208 | 431 | — | — | 1,983 | |||||||||||||||||||||
|
|
|
|
|
|
|
|
|
|
|
|
|
|
|
|||||||||||||||
|
Total |
¥ | 12,626 | ¥ | — | ¥ | 2,283 | ¥ | 1,560 | ¥ | — | ¥ | — | ¥ | 16,469 | ||||||||||||||
|
|
|
|
|
|
|
|
|
|
|
|
|
|
|
|||||||||||||||
| Domestic subsidiaries | ||||||||||||||||||||||||||||
|
Assets category |
March 31,
2013 |
Realized
gains (losses) |
Unrealized
gains (losses) |
Purchase,
sales and settlements |
Transfer
into Level 3 |
Transfer
out of Level 3 |
March 31,
2014 |
|||||||||||||||||||||
| (in millions) | ||||||||||||||||||||||||||||
|
Other debt securities |
¥ | 6,134 | ¥ | (4 | ) | ¥ | (85 | ) | ¥ | (12 | ) | ¥ | — | ¥ | (50 | ) | ¥ | 5,983 | ||||||||||
|
Japanese pooled funds: |
||||||||||||||||||||||||||||
|
Non-Japanese debt securities |
6,846 | — | 483 | 13 | — | — | 7,342 | |||||||||||||||||||||
|
|
|
|
|
|
|
|
|
|
|
|
|
|
|
|||||||||||||||
|
Total pooled funds |
6,846 | — | 483 | 13 | — | — | 7,342 | |||||||||||||||||||||
|
|
|
|
|
|
|
|
|
|
|
|
|
|
|
|||||||||||||||
|
Other investment funds |
48,631 | (2,616 | ) | 1,381 | (3,950 | ) | — | — | 43,446 | |||||||||||||||||||
|
|
|
|
|
|
|
|
|
|
|
|
|
|
|
|||||||||||||||
|
Total |
¥ | 61,611 | ¥ | (2,620 | ) | ¥ | 1,779 | ¥ | (3,949 | ) | ¥ | — | ¥ | (50 | ) | ¥ | 56,771 | |||||||||||
|
|
|
|
|
|
|
|
|
|
|
|
|
|
|
|||||||||||||||
| Foreign offices and subsidiaries | ||||||||||||||||||||||||||||
|
Assets category |
March 31,
2013 |
Realized
gains (losses) |
Unrealized
gains (losses) |
Purchase,
sales and settlements |
Transfer
into Level 3 |
Transfer
out of Level 3 |
March 31,
2014 |
|||||||||||||||||||||
| (in millions) | ||||||||||||||||||||||||||||
|
Other investment funds |
¥ | 14,486 | ¥ | — | ¥ | 6,688 | ¥ | 5,566 | ¥ | — | ¥ | — | ¥ | 26,740 | ||||||||||||||
|
Other investments |
1,983 | 11 | 864 | 43 | — | — | 2,901 | |||||||||||||||||||||
|
|
|
|
|
|
|
|
|
|
|
|
|
|
|
|||||||||||||||
|
Total |
¥ | 16,469 | ¥ | 11 | ¥ | 7,552 | ¥ | 5,609 | ¥ | — | ¥ | — | ¥ | 29,641 | ||||||||||||||
|
|
|
|
|
|
|
|
|
|
|
|
|
|
|
|||||||||||||||
F-85
Table of Contents
MITSUBISHI UFJ FINANCIAL GROUP, INC. AND SUBSIDIARIES
NOTES TO CONSOLIDATED FINANCIAL STATEMENTS—(Continued)
Defined Contribution Plans
The MUFG Group maintains several qualified defined contribution plans in its domestic and foreign offices and subsidiaries, all of which are administered in accordance with applicable local laws and regulations. Each office and subsidiary matches eligible employee contributions up to a certain percentage of benefits-eligible compensation per pay period, subject to plan and legal limits. Terms of the plan, including matching percentage and vesting periods, are individually determined by each office and subsidiary.
The cost of these defined contribution plans charged to operations for the fiscal years ended March 31, 2012, 2013 and 2014 was ¥5,775 million, ¥6,396 million and ¥8,443 million, respectively.
| 14. | OTHER ASSETS AND LIABILITIES |
Major components of other assets and liabilities at March 31, 2013 and 2014 were as follows:
| 2013 | 2014 | |||||||
| (in millions) | ||||||||
|
Other assets: |
||||||||
|
Accounts receivable: |
||||||||
|
Receivables from brokers, dealers and customers for securities transactions |
¥ | 1,217,164 | ¥ | 2,073,499 | ||||
|
Other |
956,000 | 1,135,009 | ||||||
|
Investments in equity method investees |
1,273,847 | 1,620,168 | ||||||
|
Prepaid benefit cost (Note 13) |
117,873 | 412,417 | ||||||
|
Cash collateral pledged (Note 8) |
1,573,698 | 1,045,851 | ||||||
|
Other |
1,647,213 | 1,731,642 | ||||||
|
|
|
|
|
|||||
|
Total |
¥ | 6,785,795 | ¥ | 8,018,586 | ||||
|
|
|
|
|
|||||
|
Other liabilities: |
||||||||
|
Accounts payable: |
||||||||
|
Payables to brokers, dealers and customers for securities transactions |
¥ | 1,047,514 | ¥ | 583,845 | ||||
|
Other |
1,053,294 | 1,499,191 | ||||||
|
Deferred tax liabilities |
127,218 | 253,714 | ||||||
|
Allowance for off-balance sheet credit instruments |
55,915 | 69,871 | ||||||
|
Accrued benefit cost (Note 13) |
96,844 | 61,026 | ||||||
|
Guarantees and indemnifications |
50,433 | 44,824 | ||||||
|
Cash collateral received (Note 8) |
366,544 | 454,506 | ||||||
|
Accrued and other liabilities |
2,250,927 | 2,640,034 | ||||||
|
|
|
|
|
|||||
|
Total |
¥ | 5,048,689 | ¥ | 5,607,011 | ||||
|
|
|
|
|
|||||
Investments in equity method investees include marketable equity securities carried at ¥788,250 million and ¥1,033,806 million at March 31, 2013 and 2014, respectively. Corresponding aggregated market values were ¥1,203,241 million and ¥1,789,053 million, respectively. Investments in equity method investees also include investments in MSMS at ¥174,935 million and ¥163,520 million, and in Morgan Stanley at ¥664,031 million and ¥825,385 million at March 31, 2013 and 2014, respectively. As of March 31, 2014, the MUFG Group held approximately 21.91% of Morgan Stanley’s common stock.
The MUFG Group periodically evaluates whether a loss in value of investments in equity method investees is other-than-temporary. As a result of evaluations, the MUFG Group recognized other-than-temporary declines
F-86
Table of Contents
MITSUBISHI UFJ FINANCIAL GROUP, INC. AND SUBSIDIARIES
NOTES TO CONSOLIDATED FINANCIAL STATEMENTS—(Continued)
in the value of an investment and recorded impairment losses related to certain affiliated companies of ¥580,474 million, ¥14,635 million and ¥32,824 million for the fiscal years ended March 31, 2012, 2013 and 2014, respectively. The impairment losses are included in Equity in earnings (losses) of equity method investees—net in the accompanying consolidated statements of income. See Note 2 for further details of the impairment losses recorded on investments in Morgan Stanley for the fiscal year ended March 31, 2012.
Summarized Financial Information of the MUFG Group’s equity method investees
Summarized financial information of Morgan Stanley, the largest portion of the MUFG Group’s equity method investees, as of March 31, 2013 and 2014, and for each of the three years in the period ended March 31, 2014 is as follows:
| 2013 | 2014 | |||||||
| (in billions) | ||||||||
|
Trading assets |
¥ | 25,134 | ¥ | 26,712 | ||||
|
Federal funds sold and securities purchased under agreements to resell |
13,206 | 11,072 | ||||||
|
Securities borrowed |
12,765 | 15,190 | ||||||
|
Total assets |
75,370 | 85,566 | ||||||
|
Trading liabilities |
12,459 | 11,485 | ||||||
|
Securities sold under agreements to repurchase and Securities loaned |
15,012 | 15,083 | ||||||
|
Long-term borrowings |
15,532 | 15,785 | ||||||
|
Total liabilities |
68,740 | 78,334 | ||||||
|
Nonredeemable noncontrolling interests |
317 | 329 | ||||||
| 2012 | 2013 | 2014 | ||||||||||
| (in billions) | ||||||||||||
|
Net revenues |
¥ | 2,517 | ¥ | 2,271 | ¥ | 3,333 | ||||||
|
Total non-interest expenses |
2,084 | 2,105 | 2,812 | |||||||||
|
Income from continuing operations before income taxes |
433 | 166 | 521 | |||||||||
|
Net income applicable to Morgan Stanley |
244 | 100 | 349 | |||||||||
Summarized financial information of the MUFG Group’s equity method investees, other than Morgan Stanley as of March 31, 2013 and 2014, and for each of the three years in the period ended March 31, 2014 is as follows:
| 2013 | 2014 | |||||||
| (in billions) | ||||||||
|
Net loans |
¥ | 7,673 | ¥ | 9,493 | ||||
|
Total assets |
12,906 | 16,277 | ||||||
|
Deposits |
2,729 | 4,674 | ||||||
|
Total liabilities |
9,455 | 12,247 | ||||||
|
Noncontrolling interests |
181 | 457 | ||||||
| 2012 | 2013 | 2014 | ||||||||||
| (in billions) | ||||||||||||
|
Total interest income |
¥ | 475 | ¥ | 444 | ¥ | 543 | ||||||
|
Total interest expense |
98 | 92 | 165 | |||||||||
|
Net interest income |
377 | 352 | 378 | |||||||||
|
Provision for credit losses |
51 | 55 | 59 | |||||||||
|
Income before income tax expense |
128 | 163 | 214 | |||||||||
|
Net income |
75 | 124 | 159 | |||||||||
F-87
Table of Contents
MITSUBISHI UFJ FINANCIAL GROUP, INC. AND SUBSIDIARIES
NOTES TO CONSOLIDATED FINANCIAL STATEMENTS—(Continued)
| 15. | OFFSETTING OF DERIVATIVES, REPURCHASE AGREEMENTS, AND SECURITIES LENDING TRANSACTIONS |
The following tables present, as of March 31, 2013 and 2014, the gross and net of the derivatives, resale and repurchase agreements, and securities borrowing and lending transactions, including the related gross amount subject to an enforceable master netting arrangement or similar agreement not offset in the consolidated balance sheet. The MUFG Group primarily enters into International Swaps and Derivatives Association master netting agreements, master repurchase agreements and master securities lending agreements or similar agreements for derivative contracts, resale and repurchase agreements, and securities borrowing and lending transactions. In the event of default on or termination of any one contract, these agreements provide the contracting parties with the right to net a counterparty’s rights and obligations and to liquidate and setoff collateral against any net amount owed by the counterparty. Generally, as the MUFG Group has elected to present such amounts on a gross basis, the amounts subject to these agreements are included in “Gross amounts not offset in the consolidated balance sheet” column in the tabular disclosure below. For certain transactions where a legal opinion with respect to the enforceability of netting has not been sought or obtained, the related amounts are not subject to enforceable master netting agreements and not included in “Gross amounts not offset in the consolidated balance sheet” column in the tabular disclosure below.
|
At March 31, 2013 |
Gross amounts of
recognized assets/liabilities |
Gross amounts
offset in the consolidated balance sheet |
Net amounts
presented in the consolidated balance sheet |
Gross amounts not offset in
the consolidated balance sheet |
Net amounts | |||||||||||||||||||
|
Financial
instruments |
Cash collateral
received/pledged |
|||||||||||||||||||||||
| (in billions) | ||||||||||||||||||||||||
|
Financial assets: |
||||||||||||||||||||||||
|
Derivative assets |
¥ | 14,648 | ¥ | — | ¥ | 14,648 | ¥ | (12,341 | ) | ¥ | (283 | ) | ¥ | 2,024 | ||||||||||
|
Receivables under resale agreements |
6,960 | (1,300 | ) | 5,660 | (4,849 | ) | — | 811 | ||||||||||||||||
|
Receivables under securities borrowing transactions |
2,615 | — | 2,615 | (1,815 | ) | — | 800 | |||||||||||||||||
|
|
|
|
|
|
|
|
|
|
|
|
|
|||||||||||||
|
Total |
¥ | 24,223 | ¥ | (1,300 | ) | ¥ | 22,923 | ¥ | (19,005 | ) | ¥ | (283 | ) | ¥ | 3,635 | |||||||||
|
|
|
|
|
|
|
|
|
|
|
|
|
|||||||||||||
|
Financial liabilities: |
||||||||||||||||||||||||
|
Derivative liabilities |
¥ | 14,867 | ¥ | — | ¥ | 14,867 | ¥ | (12,134 | ) | ¥ | (1,207 | ) | ¥ | 1,526 | ||||||||||
|
Payables under repurchase
|
17,188 | (1,300 | ) | 15,888 | (15,804 | ) | — | 84 | ||||||||||||||||
|
Payables under securities lending transactions |
3,993 | — | 3,993 | (1,695 | ) | — | 2,298 | |||||||||||||||||
|
Obligations to return securities received as collateral |
3,035 | — | 3,035 | (374 | ) | — | 2,661 | |||||||||||||||||
|
|
|
|
|
|
|
|
|
|
|
|
|
|||||||||||||
|
Total |
¥ | 39,083 | ¥ | (1,300 | ) | ¥ | 37,783 | ¥ | (30,007 | ) | ¥ | (1,207 | ) | ¥ | 6,569 | |||||||||
|
|
|
|
|
|
|
|
|
|
|
|
|
|||||||||||||
F-88
Table of Contents
MITSUBISHI UFJ FINANCIAL GROUP, INC. AND SUBSIDIARIES
NOTES TO CONSOLIDATED FINANCIAL STATEMENTS—(Continued)
|
Gross amounts
of recognized assets/ liabilities |
Gross amounts
offset in the consolidated balance sheet |
Net amounts
presented in the consolidated balance sheet |
Gross amounts not offset in
the consolidated balance sheet |
Net amounts | ||||||||||||||||||||
|
At March 31, 2014 |
Financial
instruments |
Cash collateral
received/pledged |
||||||||||||||||||||||
| (in billions) | ||||||||||||||||||||||||
|
Financial assets: |
||||||||||||||||||||||||
|
Derivative assets |
¥ | 11,810 | ¥ | — | ¥ | 11,810 | ¥ | (9,552 | ) | ¥ | (360 | ) | ¥ | 1,898 | ||||||||||
|
Receivables under resale agreements |
10,346 | (3,046 | ) | 7,300 | (6,502 | ) | (7 | ) | 791 | |||||||||||||||
|
Receivables under securities borrowing transactions |
4,210 | — | 4,210 | (3,614 | ) | — | 596 | |||||||||||||||||
|
|
|
|
|
|
|
|
|
|
|
|
|
|||||||||||||
|
Total |
¥ | 26,366 | ¥ | (3,046 | ) | ¥ | 23,320 | ¥ | (19,668 | ) | ¥ | (367 | ) | ¥ | 3,285 | |||||||||
|
|
|
|
|
|
|
|
|
|
|
|
|
|||||||||||||
|
Financial liabilities: |
||||||||||||||||||||||||
|
Derivative liabilities |
¥ | 11,765 | ¥ | — | ¥ | 11,765 | ¥ | (9,437 | ) | ¥ | (984 | ) | ¥ | 1,344 | ||||||||||
|
Payables under repurchase agreements (1) |
24,674 | (3,046 | ) | 21,628 | (21,345 | ) | (5 | ) | 278 | |||||||||||||||
|
Payables under securities lending transactions |
5,521 | — | 5,521 | (4,795 | ) | (9 | ) | 717 | ||||||||||||||||
|
Obligations to return securities received as collateral |
3,971 | — | 3,971 | (220 | ) | — | 3,751 | |||||||||||||||||
|
|
|
|
|
|
|
|
|
|
|
|
|
|||||||||||||
|
Total |
¥ | 45,931 | ¥ | (3,046 | ) | ¥ | 42,885 | ¥ | (35,797 | ) | ¥ | (998 | ) | ¥ | 6,090 | |||||||||
|
|
|
|
|
|
|
|
|
|
|
|
|
|||||||||||||
Note:
| (1) | Payables under repurchase agreements in the above table include those under long-term repurchase agreements of ¥188,100 million and ¥360,220 million at March 31, 2013 and 2014, respectively, which are included in Long-term debt in the accompanying consolidated balance sheets. |
| 16. | PREFERRED STOCK |
Pursuant to the Articles of Incorporation, MUFG had been authorized to issue 400,000,000 shares of Class 5 Preferred Stock, 200,000,000 shares of Class 6 Preferred Stock, 200,000,000 shares of Class 7 Preferred Stock and 1,000 shares of Class 11 Preferred Stock without par value as of March 31, 2014.
All classes of preferred stock are non-voting and have preference over common stock for the payment of dividends and the distribution of assets in the event of a liquidation or dissolution of MUFG. They are all non-cumulative and non-participating with respect to dividend payments. Shareholders of Class 5 and 11 Preferred Stock have the right to receive a liquidation distribution at ¥2,500 and ¥1,000 per share, respectively, and do not have the right to participate in any further liquidation distributions.
F-89
Table of Contents
MITSUBISHI UFJ FINANCIAL GROUP, INC. AND SUBSIDIARIES
NOTES TO CONSOLIDATED FINANCIAL STATEMENTS—(Continued)
The number of shares of preferred stock issued and outstanding at March 31, 2012, 2013 and 2014 was as follows:
|
Outstanding at
March 31, 2012 |
Net change |
Outstanding at
March 31, 2013 |
Net change |
Outstanding at
March 31, 2014 |
||||||||||||||||
| (number of shares) | ||||||||||||||||||||
|
Preferred stock: |
||||||||||||||||||||
|
Class 5 |
156,000,000 | — | 156,000,000 | — | 156,000,000 | |||||||||||||||
|
Class 11 |
1,000 | — | 1,000 | — | 1,000 | |||||||||||||||
|
|
|
|
|
|
|
|
|
|
|
|||||||||||
|
Total |
156,001,000 | — | 156,001,000 | — | 156,001,000 | |||||||||||||||
|
|
|
|
|
|
|
|
|
|
|
|||||||||||
None of the Class 6 and 7 Preferred Stock has been issued.
The aggregate liquidation preference of preferred stock issued and outstanding at March 31, 2012, 2013 and 2014 was as follows:
|
Aggregate amount at
March 31, 2012 |
Net change |
Aggregate amount at
March 31, 2013 |
Net change |
Aggregate amount at
March 31, 2014 |
||||||||||||||||
| (in millions) | ||||||||||||||||||||
|
Preferred stock: |
||||||||||||||||||||
|
Class 5 |
¥ | 390,000 | ¥ | — | ¥ | 390,000 | ¥ | — | ¥ | 390,000 | ||||||||||
|
Class 11 |
1 | — | 1 | — | 1 | |||||||||||||||
|
|
|
|
|
|
|
|
|
|
|
|||||||||||
|
Total |
¥ | 390,001 | ¥ | — | ¥ | 390,001 | ¥ | — | ¥ | 390,001 | ||||||||||
|
|
|
|
|
|
|
|
|
|
|
|||||||||||
Preferred stock included in Capital stock on the accompanying consolidated balance sheets at March 31, 2013 and 2014 was ¥442,100 million, which consisted of ¥122,100 million of Class 1, ¥125,000 million of Class 3 and ¥195,000 million of Class 5 Preferred Stock.
On June 27, 2013, amendments to the Articles of Incorporation were made with respect to Class 3 Preferred Stock. As a result, the aggregate number of shares authorized to be issued by MUFG was reduced from 120,000,000 shares to nil and the authority to issue Class 3 Preferred Shares was removed.
The portion of proceeds from the sale of shares that is designated as capital stock is determined by resolution of the Board of Directors of MUFG, however, at least 50% of the issue price of newly issued shares is required to be designated as capital stock at the time of incorporation or share issuance under the Company Law. Proceeds in excess of amounts designated as capital stock are designated as capital surplus. However, these provisions are not applied in a company reorganization, such as a merger, company split and share exchange. Preferred Stock Classes 8 through 12 were issued in exchange for UFJ Holdings’ preferred stock and recorded in Capital surplus.
Preferred Stock Outstanding as of March 31, 2014
Class 5 Preferred Stock
Class 5 Preferred Stock is redeemable at the option of MUFG. At the time of issuance, the Board of Directors determines an issue price, an annual dividend (not to exceed ¥250 per share), and redemption terms, including a redemption price.
F-90
Table of Contents
MITSUBISHI UFJ FINANCIAL GROUP, INC. AND SUBSIDIARIES
NOTES TO CONSOLIDATED FINANCIAL STATEMENTS—(Continued)
Class 5 Preferred Stock was issued by means of a third-party allocation to Nippon Life Insurance Company, Meiji Yasuda Life Insurance Company, TAIYO LIFE INSURANCE COMPANY, DAIDO LIFE INSURANCE COMPANY, Tokio Marine & Nichido Fire Insurance Co., Ltd., NIPPONKOA Insurance Company, Limited and Aioi Nissay Dowa Insurance Company, Limited. The preferred stock does not have voting rights at any general meetings of shareholders, unless otherwise provided by applicable laws and regulations. Preferred dividends are set to be ¥115 per share annually, except as of March 31, 2009. Preferred dividends were ¥43 per share as of March 31, 2009.
Class 11 Preferred Stock
Class 11 preferred stockholders are entitled to receive annual non-cumulative dividends of ¥5.30 per share with priority over common stockholders.
Class 11 Preferred Stock is convertible into fully paid shares of MUFG common stock at the election of holders from establishment of MUFG to July 31, 2014, except during certain excluded periods, at an initial conversion price of ¥918.70 per share of common stock, subject to anti-dilution adjustments. The conversion price was subject to reset annually on July 15 from 2006 to 2013 to the average market price of the common stock for the 30 trading day period, if the average market price was less than the conversion price prior to the reset but not less than ¥918.70 per share. The acquisition price and the acquisition floor price of Class 11 Preferred Stock were adjusted as ¥889.60 per share on December 15, 2008, ¥888.40 per share on January 14, 2009, ¥867.60 per share on December 21, 2009, and ¥865.90 per share on December 25, 2009, in accordance with the provisions relating to the adjustment of the acquisition price set forth in the terms and conditions of Class 11 Preferred Stock.
All Class 11 Preferred Stock outstanding on August 1, 2014 will be mandatorily converted into shares of common stock at a conversion ratio of ¥1,000 divided by the higher of the average market price of the common stock for the 30 trading day period beginning 45 trading days prior to August 1, 2014 or ¥802.60.
| 17. | COMMON STOCK AND CAPITAL SURPLUS |
The changes in the number of issued shares of common stock during the fiscal years ended March 31, 2012, 2013 and 2014 were as follows:
| 2012 | 2013 | 2014 | ||||||||||
| (shares) | ||||||||||||
|
Balance at beginning of fiscal year |
14,150,894,620 | 14,154,534,220 | 14,158,585,720 | |||||||||
|
Issuance of new shares of common stock by way of exercise of the stock acquisition rights |
3,639,600 | 4,051,500 | 5,440,700 | |||||||||
|
|
|
|
|
|
|
|||||||
|
Balance at end of fiscal year |
14,154,534,220 | 14,158,585,720 | 14,164,026,420 | |||||||||
|
|
|
|
|
|
|
|||||||
Under the Company Law, issuances of common stock, including conversions of bonds and notes, are required to be credited to the common stock account for at least 50% of the proceeds and to the legal capital surplus account (“legal capital surplus”) for the remaining amounts.
The Company Law permits Japanese companies, upon approval by the Board of Directors, to issue shares in the form of a “stock split,” as defined in the Company Law. Also, prior to April 1, 1991, Japanese companies were permitted to issue free share distributions. BTMU and MUTB from time to time made free share distributions. These free distributions usually ranged from 5% to 10% of outstanding common stock and
F-91
Table of Contents
MITSUBISHI UFJ FINANCIAL GROUP, INC. AND SUBSIDIARIES
NOTES TO CONSOLIDATED FINANCIAL STATEMENTS—(Continued)
publicly-owned corporations in the United States issuing shares in similar transactions would be required to account for them as stock dividends as of the shareholders’ record date by reducing retained earnings and increasing the appropriate capital accounts by an amount equal to the fair value of the shares issued. The application of such United States accounting practice to the cumulative free distributions made by BTMU and MUTB at March 31, 2014, would have increased capital accounts by ¥1,910,106 million with a corresponding decrease in unappropriated retained earnings.
The Company Law permits that common stock, legal reserve, additional paid-in capital, and other capital surplus and retained earnings can be transferred among these accounts under certain conditions upon the approval of a shareholders’ meeting. The Company Law limits the increase of paid in capital in case disposition of treasury stock and issuance of common stock are performed at the same time.
As for Capital surplus, the fee retained by MUFG’s subsidiary as underwriting compensation, net of stock issue expense, was included in the total Capital surplus balance.
Treasury Stock
The Company Law permits Japanese companies to effect purchases of their own shares pursuant to a resolution by the shareholders at an annual general meeting until the conclusion of the following ordinary general meeting of shareholders, and to hold such shares as their treasury stock indefinitely regardless of purpose. However, the Company Law requires the amount of treasury stock purchased should be within the amount of retained earnings available for dividends. Disposition of treasury stock is subject to the approval of the Board of Directors and is to follow the procedures similar to a public offering of shares for subscription.
Parent Company Shares Held by Subsidiaries and Affiliated Companies
At March 31, 2014, certain subsidiaries and affiliated companies owned shares of common stock of MUFG. Such shares are included in treasury stock in the accompanying consolidated balance sheets and deducted from the MUFG’s shareholders’ equity.
| 18. | RETAINED EARNINGS, LEGAL RESERVE AND DIVIDENDS |
In addition to the Company Law, Japanese banks, including BTMU and MUTB, are required to comply with the Banking Law of Japan (the “Banking Law”).
Legal Reserve Set Aside as Appropriation of Retained Earnings and Legal Capital Surplus
Under the Company Law
The Company Law provides that an amount at least equal to 10% of the aggregate amount of cash dividends and certain appropriations of retained earnings associated with cash outlays applicable to each period shall be appropriated and set aside as a legal reserve until the aggregate amount of legal reserve set aside as an appropriation of retained earnings and the legal capital surplus equals 25% of stated capital as defined in the Company Law.
Under the Banking Law
The Banking Law provides that an amount at least equal to 20% of the aggregate amount of cash dividends and certain appropriations of retained earnings associated with cash outlays applicable to each fiscal year shall be appropriated and set aside as a legal reserve until the aggregate amount of legal reserve set aside as appropriation of retained earnings and the legal capital surplus equals 100% of stated capital as defined in the Company Law.
F-92
Table of Contents
MITSUBISHI UFJ FINANCIAL GROUP, INC. AND SUBSIDIARIES
NOTES TO CONSOLIDATED FINANCIAL STATEMENTS—(Continued)
Transfer of Legal Reserve
Under the Company Law
Under the Company Law, Japanese companies, including MUFG, were permitted, pursuant to a resolution by the shareholders at a general meeting, to make legal reserve set aside as appropriation of retained earnings and legal capital surplus available for dividends until the aggregate amount of the legal reserve and legal capital surplus equals 25% of stated capital as defined in the Company Law.
Under the Company Law, Japanese companies, including MUFG, BTMU and MUTB, are permitted, primarily pursuant to a resolution by the shareholders at a general meeting, to transfer legal capital surplus and legal reserve to stated capital and/or retained earnings without limitations of thresholds, thereby effectively removing the thresholds provided for in the Company Law and Banking Law at the company’s discretion.
Under the Banking Law
Under the Banking Law, Japanese banks, including BTMU and MUTB, were permitted, pursuant to a resolution by the shareholders at a general meeting, to make legal reserve set aside as an appropriation of retained earnings and legal capital surplus available for dividends until the aggregate amount of the legal reserve and legal capital surplus equals 100% of stated capital as defined in the Company Law.
Unappropriated Retained Earnings and Dividends
In addition to the provision that requires an appropriation for legal reserve as described above, the Company Law and the Banking Law impose certain limitations on the amount available for dividends.
Under the Company Law, the amount available for dividends is based on the amount recorded in MUFG’s general books of account maintained in accordance with accounting principles generally accepted in Japan (“Japanese GAAP”). The adjustments included in the accompanying consolidated financial statements but not recorded in MUFG’s general books of account, as explained in Note 1, have no effect on the determination of retained earnings available for dividends under the Company Law. Under the Banking Law, MUFG, BTMU and MUTB have to meet the minimum capital adequacy requirements and distributions of retained earnings of MUFG, BTMU and MUTB, which are otherwise distributable to shareholders, are restricted in order to maintain the minimum capital requirements.
MUFG was established on April 2, 2001 with common stock of ¥924,400 million, preferred stock of ¥222,100 million, legal capital surplus of ¥2,838,693 million and no retained earnings in accordance with the Commercial Code of Japan (“the Code”), which was replaced by the Company Law, and Japanese GAAP.
On October 1, 2005, MUFG started with common stock and preferred stock of ¥1,383,052 million, legal capital surplus of ¥3,577,570 million and retained earnings of ¥757,458 million in accordance with the Code and Japanese GAAP.
MUFG’s amount available for dividends, at March 31, 2014, was ¥4,402,718 million, which is based on the amount recorded in MUFG’s general books of account under Japanese GAAP.
Annual dividends, including those for preferred stock, are approved by the shareholders at an annual general meeting held subsequent to the fiscal year to which the dividends are applicable. In addition, a semi-annual interim dividend payment may be made by resolution of the Board of Directors, subject to limitations imposed by the Company Law and the Banking Law.
F-93
Table of Contents
MITSUBISHI UFJ FINANCIAL GROUP, INC. AND SUBSIDIARIES
NOTES TO CONSOLIDATED FINANCIAL STATEMENTS—(Continued)
In the accompanying consolidated statements of equity, dividends and appropriations to legal reserve shown for each fiscal year represent dividends approved and paid during the fiscal year and the related appropriation to legal reserve.
| 19. | ACCUMULATED OTHER COMPREHENSIVE INCOME (LOSS) |
The following table presents the changes in Accumulated OCI, net of tax and net of noncontrolling interests, for the fiscal years ended March 31, 2012, 2013 and 2014:
| 2012 | 2013 | 2014 | ||||||||||
| (in millions) | ||||||||||||
|
Accumulated other comprehensive income (loss), net of taxes: |
||||||||||||
|
Net unrealized gains on investment securities: |
||||||||||||
|
Balance at beginning of fiscal year |
¥ | 308,071 | ¥ | 482,434 | ¥ | 1,106,316 | ||||||
|
Net change during the fiscal year |
174,363 | 623,882 | 166,407 | |||||||||
|
|
|
|
|
|
|
|||||||
|
Balance at end of fiscal year |
¥ | 482,434 | ¥ | 1,106,316 | ¥ | 1,272,723 | ||||||
|
|
|
|
|
|
|
|||||||
|
Net unrealized gains (losses) on derivatives qualifying for cash flow hedges: |
||||||||||||
|
Balance at beginning of fiscal year |
¥ | (1,690 | ) | ¥ | (1,253 | ) | ¥ | 2,170 | ||||
|
Net change during the fiscal year |
437 | 3,423 | (361) | |||||||||
|
|
|
|
|
|
|
|||||||
|
Balance at end of fiscal year |
¥ | (1,253 | ) | ¥ | 2,170 | ¥ | 1,809 | |||||
|
|
|
|
|
|
|
|||||||
|
Defined benefit plans: |
||||||||||||
|
Balance at beginning of fiscal year |
¥ | (307,711 | ) | ¥ | (401,923 | ) | ¥ | (322,537 | ) | |||
|
Net change during the fiscal year |
(94,212 | ) | 79,386 | 116,201 | ||||||||
|
|
|
|
|
|
|
|||||||
|
Balance at end of fiscal year |
¥ | (401,923 | ) | ¥ | (322,537 | ) | ¥ | (206,336) | ||||
|
|
|
|
|
|
|
|||||||
|
Foreign currency translation adjustments: |
||||||||||||
|
Balance at beginning of fiscal year |
¥ | (627,331 | ) | ¥ | (675,658 | ) | ¥ | (211,602 | ) | |||
|
Net change during the fiscal year |
(48,327 | ) | 464,056 | 501,088 | ||||||||
|
|
|
|
|
|
|
|||||||
|
Balance at end of fiscal year |
¥ | (675,658 | ) | ¥ | (211,602 | ) | ¥ | 289,486 | ||||
|
|
|
|
|
|
|
|||||||
|
Balance at end of fiscal year |
¥ | (596,400 | ) | ¥ | 574,347 | ¥ | 1,357,682 | |||||
|
|
|
|
|
|
|
|||||||
F-94
Table of Contents
MITSUBISHI UFJ FINANCIAL GROUP, INC. AND SUBSIDIARIES
NOTES TO CONSOLIDATED FINANCIAL STATEMENTS—(Continued)
The following table presents the before tax and net of tax changes in each component of Accumulated OCI for the fiscal years ended March 31, 2012, 2013 and 2014:
| 2012 | 2013 | 2014 | ||||||||||||||||||||||||||||||||||
| Before tax |
Tax
(expense) or benefit |
Net of tax | Before tax |
Tax
(expense) or benefit |
Net of tax | Before tax |
Tax
(expense) or benefit |
Net of tax | ||||||||||||||||||||||||||||
| (in millions) | ||||||||||||||||||||||||||||||||||||
|
Net unrealized gains (losses) on investment securities: |
||||||||||||||||||||||||||||||||||||
|
Net unrealized gains on investment securities |
¥ | 296,347 | ¥ | (118,638 | ) | ¥ | 177,709 | ¥ | 1,108,665 | ¥ | (390,387 | ) | ¥ | 718,278 | ¥ | 453,494 | ¥ | (178,200 | ) | ¥ | 275,294 | |||||||||||||||
|
Reclassification adjustment for gains included in net income before attribution of noncontrolling interests |
(4,511 | ) | 1,641 | (2,870 | ) | (143,664 | ) | 53,856 | (89,808 | ) | (215,553 | ) | 81,778 | (133,775 | ) | |||||||||||||||||||||
|
|
|
|
|
|
|
|
|
|
|
|
|
|
|
|
|
|
|
|||||||||||||||||||
|
Net change |
291,836 | (116,997 | ) | 174,839 | 965,001 | (336,531 | ) | 628,470 | 237,941 | (96,422 | ) | 141,519 | ||||||||||||||||||||||||
|
Net unrealized gains (losses) on investment securities attributable to noncontrolling interests |
476 | 4,588 | (24,888 | ) | ||||||||||||||||||||||||||||||||
|
|
|
|
|
|
|
|||||||||||||||||||||||||||||||
|
Net unrealized gains on investment securities attributable to Mitsubishi UFJ Financial Group |
174,363 | 623,882 | 166,407 | |||||||||||||||||||||||||||||||||
|
|
|
|
|
|
|
|||||||||||||||||||||||||||||||
|
Net unrealized gains (losses) on derivatives qualifying for cash flow hedges: |
||||||||||||||||||||||||||||||||||||
|
Net unrealized gains (losses) on derivatives qualifying for cash flow
|
(178 | ) | 99 | (79 | ) | 6,850 | (2,693 | ) | 4,157 | 3,615 | (1,419 | ) | 2,196 | |||||||||||||||||||||||
|
Reclassification adjustment for losses (gains) included in net income before attribution of noncontrolling interests |
850 | (334 | ) | 516 | (1,210 | ) | 476 | (734 | ) | (4,211 | ) | 1,654 | (2,557 | ) | ||||||||||||||||||||||
|
|
|
|
|
|
|
|
|
|
|
|
|
|
|
|
|
|
|
|||||||||||||||||||
|
Net change |
672 | (235 | ) | 437 | 5,640 | (2,217 | ) | 3,423 | (596 | ) | 235 | (361 | ) | |||||||||||||||||||||||
|
Net unrealized gains on derivatives qualifying for cash flow hedges attributable to noncontrolling interests |
— | — | — | |||||||||||||||||||||||||||||||||
|
|
|
|
|
|
|
|||||||||||||||||||||||||||||||
|
Net unrealized gains (losses) on derivatives qualifying for cash flow hedges attributable to Mitsubishi UFJ Financial Group |
437 | 3,423 | (361 | ) | ||||||||||||||||||||||||||||||||
|
|
|
|
|
|
|
|||||||||||||||||||||||||||||||
F-95
Table of Contents
MITSUBISHI UFJ FINANCIAL GROUP, INC. AND SUBSIDIARIES
NOTES TO CONSOLIDATED FINANCIAL STATEMENTS—(Continued)
| 2012 | 2013 | 2014 | ||||||||||||||||||||||||||||||||||
| Before tax |
Tax
(expense) or benefit |
Net of tax | Before tax |
Tax
(expense) or benefit |
Net of tax | Before tax |
Tax
(expense) or benefit |
Net of tax | ||||||||||||||||||||||||||||
| (in millions) | ||||||||||||||||||||||||||||||||||||
|
Defined benefit plans: |
||||||||||||||||||||||||||||||||||||
|
Defined benefit plans |
(189,916 | ) | 77,992 | (111,924 | ) | 81,568 | (27,506 | ) | 54,062 | 122,644 | (45,709 | ) | 76,935 | |||||||||||||||||||||||
|
Reclassification adjustment for losses included in net income before attribution of noncontrolling interests |
29,128 | (11,419 | ) | 17,709 | 41,642 | (15,707 | ) | 25,935 | 64,519 | (23,806 | ) | 40,713 | ||||||||||||||||||||||||
|
|
|
|
|
|
|
|
|
|
|
|
|
|
|
|
|
|
|
|||||||||||||||||||
|
Net change |
(160,788 | ) | 66,573 | (94,215 | ) | 123,210 | (43,213 | ) | 79,997 | 187,163 | (69,515 | ) | 117,648 | |||||||||||||||||||||||
|
Defined benefit plans attributable to noncontrolling interests |
(3 | ) | 611 | 1,447 | ||||||||||||||||||||||||||||||||
|
|
|
|
|
|
|
|||||||||||||||||||||||||||||||
|
Defined benefit plans attributable to Mitsubishi UFJ Financial Group |
(94,212 | ) | 79,386 | 116,201 | ||||||||||||||||||||||||||||||||
|
|
|
|
|
|
|
|||||||||||||||||||||||||||||||
|
Foreign currency translation adjustments: |
||||||||||||||||||||||||||||||||||||
|
Foreign currency translation adjustments |
(68,269 | ) | (1,528 | ) | (69,797 | ) | 437,485 | 406 | 437,891 | 557,941 | (50,516 | ) | 507,425 | |||||||||||||||||||||||
|
Reclassification adjustment for losses included in net income before attribution of noncontrolling interests |
31,956 | (11,702 | ) | 20,254 | 48,311 | (18,943 | ) | 29,368 | 1,603 | (898 | ) | 705 | ||||||||||||||||||||||||
|
|
|
|
|
|
|
|
|
|
|
|
|
|
|
|
|
|
|
|||||||||||||||||||
|
Net change |
(36,313 | ) | (13,230 | ) | (49,543 | ) | 485,796 | (18,537 | ) | 467,259 | 559,544 | (51,414 | ) | 508,130 | ||||||||||||||||||||||
|
Foreign currency translation adjustments attributable to noncontrolling interests |
(1,216 | ) | 3,203 | 7,042 | ||||||||||||||||||||||||||||||||
|
|
|
|
|
|
|
|||||||||||||||||||||||||||||||
|
Foreign currency translation adjustments attributable to Mitsubishi UFJ Financial Group |
(48,327 | ) | 464,056 | 501,088 | ||||||||||||||||||||||||||||||||
|
|
|
|
|
|
|
|||||||||||||||||||||||||||||||
|
Other comprehensive income attributable to Mitsubishi UFJ Financial Group |
¥ | 32,261 | ¥ | 1,170,747 | ¥ | 783,335 | ||||||||||||||||||||||||||||||
|
|
|
|
|
|
|
|||||||||||||||||||||||||||||||
F-96
Table of Contents
MITSUBISHI UFJ FINANCIAL GROUP, INC. AND SUBSIDIARIES
NOTES TO CONSOLIDATED FINANCIAL STATEMENTS—(Continued)
The following table presents the effect of the reclassification of significant items out of Accumulated OCI on the respective line items of the accompanying consolidated statements of income for the fiscal year ended March 31, 2014:
|
Details of Accumulated OCI components |
Amount reclassified out of
Accumulated OCI |
Line items in the consolidated
|
||||
| (in millions) | ||||||
|
Net unrealized losses (gains) on investment securities |
||||||
|
Net gains on sales and redemptions of securities available-for-sale |
¥ | (218,150 | ) | Investment securities gains—net | ||
|
Impairment losses on investment securities |
2,622 | Investment securities gains—net | ||||
|
Other |
(25 | ) | ||||
|
|
|
|||||
| (215,553 | ) | Total before tax | ||||
| 81,778 | Income tax expense | |||||
|
|
|
|||||
| ¥ | (133,775 | ) | Net of tax | |||
|
|
|
|||||
|
Net unrealized losses (gains) on derivatives qualifying for cash flow hedges |
||||||
|
Interest rate contracts |
¥ | (4,289 | ) | Interest income on Loans, including fees | ||
|
Other |
78 | |||||
|
|
|
|||||
| (4,211 | ) | Total before tax | ||||
| 1,654 | Income tax expense | |||||
|
|
|
|||||
| ¥ | (2,557 | ) | Net of tax | |||
|
|
|
|||||
|
Defined benefit plans |
||||||
|
Net actuarial loss |
¥ | 34,525 | (1) | |||
|
Prior service cost |
(11,705 | ) (1) | ||||
|
Loss on settlements and curtailment, and other |
41,699 | (1) | ||||
|
|
|
|||||
| 64,519 | Total before tax | |||||
| (23,806 | ) | Income tax expense | ||||
|
|
|
|||||
| ¥ | 40,713 | Net of tax | ||||
|
|
|
|||||
|
Foreign currency translation adjustments |
¥ | 1,603 | Other non-interest expenses | |||
|
|
|
|||||
| 1,603 | Total before tax | |||||
| (898 | ) | Income tax expense | ||||
|
|
|
|||||
| ¥ | 705 | Net of tax | ||||
|
|
|
|||||
|
Total reclassifications for the period |
¥ | (153,642 | ) | Total before tax | ||
| 58,728 | Income tax expense | |||||
|
|
|
|||||
| ¥ | (94,914 | ) | Net of tax | |||
|
|
|
|||||
Note:
| (1) | These Accumulated OCI components are included in the computation of net periodic benefit cost. See Note 13 for more information. |
F-97
Table of Contents
MITSUBISHI UFJ FINANCIAL GROUP, INC. AND SUBSIDIARIES
NOTES TO CONSOLIDATED FINANCIAL STATEMENTS—(Continued)
| 20. | NONCONTROLLING INTERESTS |
Deconsolidation of Subsidiaries
The gains and losses due to deconsolidation of subsidiaries were recognized under “Other non-interest income” and “Other non-interest expenses,” respectively, in the accompanying consolidated statements of income. The amounts of net losses were ¥9,492 million and ¥17,585 million for the fiscal years ended March 31, 2012 and 2013 respectively, and the amount of net gains was ¥3,142 million for the fiscal year ended March 31, 2014.
Changes in MUFG’s Ownership Interests in Subsidiaries
The following table presents the effect on the MUFG’s shareholders’ equity from changes in ownership of subsidiaries resulting from transactions with the noncontrolling interest shareholders during the fiscal years ended March 31, 2012, 2013 and 2014:
| 2012 | 2013 | 2014 | ||||||||||
| (in millions) | ||||||||||||
|
Net income attributable to Mitsubishi UFJ Financial Group |
¥ | 416,231 | ¥ | 1,069,124 | ¥ | 1,015,393 | ||||||
|
Transactions between Mitsubishi UFJ Financial Group and the noncontrolling interest shareholders: |
||||||||||||
|
Issuance of new shares of Mitsubishi UFJ Morgan Stanley Securities Co., Ltd. (Note 2) |
(20,000 | ) | — | — | ||||||||
|
Purchase of shares of Mitsubishi UFJ Merrill Lynch PB Securities Co., Ltd. from noncontrolling interest shareholders (Note 2) |
— | (30,655 | ) | — | ||||||||
|
Reorganization of Mitsubishi UFJ Morgan Stanley PB Securities Co., Ltd. (Note 2) |
— | — | 13,839 | |||||||||
|
Other |
759 | (412 | ) | 204 | ||||||||
|
|
|
|
|
|
|
|||||||
|
Net transfers from (to) the noncontrolling interest shareholders |
(19,241 | ) | (31,067 | ) | 14,043 | |||||||
|
|
|
|
|
|
|
|||||||
|
Change from net income attributable to Mitsubishi UFJ Financial Group and transactions between Mitsubishi UFJ Financial Group and the noncontrolling interest shareholders |
¥ | 396,990 | ¥ | 1,038,057 | ¥ | 1,029,436 | ||||||
|
|
|
|
|
|
|
|||||||
| 21. | REGULATORY CAPITAL REQUIREMENTS |
Japan
MUFG, BTMU, MUTB and MUSHD are subject to various regulatory capital requirements promulgated by the regulatory authorities of the countries in which they operate. Failure to meet minimum capital requirements will initiate certain mandatory actions by regulators that, if undertaken, could have a direct material effect on MUFG’s consolidated financial statements.
In Japan, MUFG, BTMU, and MUTB are subject to regulatory capital requirements promulgated by the Financial Services Agency of Japan (“FSA”) in accordance with the provisions of the Banking Law and related regulations. A banking institution is subject to the minimum capital requirements both on a consolidated basis and a stand-alone basis, and is required to maintain the minimum capital irrespective of whether it operates independently or as a subsidiary under the control of another company. When a bank holding company manages operations of its banking subsidiaries, it is required to maintain the minimum capital adequacy ratio on a consolidated basis in the same manner as its subsidiary banks. The FSA provides two sets of capital adequacy guidelines. One is a set of guidelines applicable to Japanese banks and bank holding companies with their foreign offices conducting international operations, as defined, and the other is applicable to Japanese banks and bank holding companies that are not engaged in international operations conducted by their foreign offices.
F-98
Table of Contents
MITSUBISHI UFJ FINANCIAL GROUP, INC. AND SUBSIDIARIES
NOTES TO CONSOLIDATED FINANCIAL STATEMENTS—(Continued)
Under the capital adequacy guidelines applicable to a Japanese banking institution with international operations conducted by its foreign offices, from March 31, 2013 until March 30, 2014, the required minimum capital ratio is 3.5% for Common Equity Tier 1, 4.5% for Tier 1, and 8.0% for total capital, from March 31, 2014 until March 30, 2015, the required minimum capital ratio is 4.0% for Common Equity Tier 1, 5.5% for Tier 1, and 8.0% for total capital, and the requirement will be raised progressively over time.
The Basel Committee on Banking Supervision (“BCBS”) of the Bank for International Settlements (“BIS”) sets capital adequacy standards for all internationally active banks to ensure minimum level of capitals.
The Basel Committee revised the 1988 Accord (“Basel I”) in June 2004 and released “International Convergence of Capital Measurement and Capital Standards: A Revised Framework” (“Basel II”). In addition, the Group of Central Bank Governors and Heads of Supervision reached an agreement on the new global regulatory framework, which has been referred to as “Basel III,” in July and September 2010. In December 2010, the Basel Committee agreed on the details of the Basel III rules. Effective as of March 31, 2013, Basel III was adopted by the FSA with transitional measures for Japanese banking institutions with international operations conducted by their foreign offices. MUFG calculated capital ratios as of March 31, 2013 and 2014 in accordance with Basel III.
Capital Ratios
Basel III, as same as Basel II, is based on “three pillars”: (1) minimum capital requirements, (2) the self-regulation of financial institutions based on supervisory review process, and (3) market discipline through the disclosure of information. The framework of the 1988 Accord, Basel I is improved and expanded to be included in “minimum capital requirements” as the first pillar of Basel II and Basel III.
As for the denominator of the capital ratio, Basel framework provides a few kinds of risk-sensitive approaches and a range of options for determining the risk-weighted assets.
“Credit Risk”
The Basel framework provides options for determining the risk-weighted assets for credit risk to allow banks to select approaches that are most appropriate for their level of risk assessment. Banks choose one of three approaches: “Standardized Approach,” “Foundation Internal Ratings-Based Approach (“FIRB”)” or “Advanced Internal Ratings-Based Approach (“AIRB”).”
“Market Risk”
In the “Amendment to the Capital Accord to incorporate market risks” of the year 1996, a choice between two methodologies “the Standardized Measurement Method” and “Internal Models Approach” is permitted. “Combination of Internal Models Approach and the Standardized Measurement Method” is also allowed under certain conditions. This is unchanged in Basel III.
“Operational Risk”
Operational risk, which is defined as the risk of loss resulting from inadequate or failed internal processes, people and systems or from external events, is newly added in Basel II. Basel framework presents three methods for calculating operational risk capital charges: (i) the Basic Indicator Approach; (ii) the Standardized Approach; or (iii) Advanced Measurement Approaches (“AMA”). Banks adopt one of the three approaches to determine the risk-weighted assets for operational risk.
F-99
Table of Contents
MITSUBISHI UFJ FINANCIAL GROUP, INC. AND SUBSIDIARIES
NOTES TO CONSOLIDATED FINANCIAL STATEMENTS—(Continued)
Banks need to obtain approval from their supervisors prior to adopting the following approaches to calculate capital requirements for each risk:
| Ÿ | the Internal Ratings-Based (“IRB”) Approach for credit risk |
| Ÿ | the Internal Models Approach for market risk |
| Ÿ | the Standardized Approach and AMA for operational risk |
MUFG and most of its major subsidiaries adopt AIRB to calculate capital requirements for credit risk, adopt the AMA to calculate capital requirements for operational risk, as for market risk, adopt the Internal Models Approach mainly to calculate general market risk and adopt the Standardized Measurement Method to calculate specific risk.
The MUFG Group’s proprietary assets do not include trust assets under management and administration in a capacity of agent or fiduciary and, accordingly trust account assets are generally not included in the capital measure. However, guarantees for trust principal are counted as off-balance sheet items requiring a capital charge in accordance with the capital adequacy guidelines.
Under Basel III, as adopted by the FSA, MUFG’s risk-weighted assets increased, largely reflecting the new capital charge of the credit valuation adjustment (CVA), the credit risk related to asset value correlation multiplier for large financial institutions, and the 250% risk-weighted threshold items not deducted from Common Equity Tier 1 capital, as well as the conversion of certain Basel II capital deductions to risk-weighted assets, such as securitizations.
On the other hand, as for the numerator of the capital ratio, there are three primary regulatory capital ratios used to assess capital adequacy, Common Equity Tier 1, Tier 1 and Total capital ratios, which are determined by dividing applicable capital components by risk-weighted assets. Tier 1 capital is redefined, and consists of Common Equity Tier 1 capital and Additional Tier 1 capital. Common Equity Tier 1 capital is a new category of capital primarily consisting of common stocks, capital surplus, retained earnings, and Accumulated OCI. Regulatory adjustments including certain intangible fixed assets, such as goodwill, and defined-benefit pension fund assets will be deducted from Common Equity Tier 1. The amount of adjustments to be deducted will increase progressively over time. Additional Tier 1 capital generally consists of Basel III compliant preferred securities, other capital that meets Tier I requirements under Basel II standards, and net of regulatory adjustments. Subject to transitional measures, adjustments are made to Additional Tier 1 capital for items including intangible fixed assets, such as goodwill, and foreign currency translation adjustments, with the amounts of such adjustments to Additional Tier 1 capital progressively decreasing over time. Tier 2 capital generally consists of Basel III compliant deferred obligations, such as subordinated debts, capital that meet Tier II requirements under Basel II standards, certain allowances for credit losses and non-controlling interests in subsidiaries’ Tier 2 instruments. Subject to transitional measures, certain items including 45% of unrealized profit on securities available for sale and revaluation of land are deducted from Tier 2 capital with the deduction amounts progressively decreasing over time. Total capital is defined as the sum of Tier 1 and Tier 2 capital.
Basel III will be adopted in accordance with transition arrangements. Examples of these transition arrangements include initially lower capital adequacy ratios that will increase progressively up to the Basel III adequacy levels as issued by BCBS. In addition, individual elements of capital will be phased out progressively over the same period of time to arrive at a capital base that is consistent with that defined by BCBS in Basel III.
F-100
Table of Contents
MITSUBISHI UFJ FINANCIAL GROUP, INC. AND SUBSIDIARIES
NOTES TO CONSOLIDATED FINANCIAL STATEMENTS—(Continued)
The risk-adjusted capital amounts and ratios of MUFG, BTMU and MUTB presented in the following table are based on amounts calculated in accordance with Japanese GAAP as required by the FSA.
| Actual |
For capital
adequacy purposes |
|||||||||||||||
| Amount | Ratio | Amount | Ratio | |||||||||||||
| (in millions, except percentages) | ||||||||||||||||
|
Consolidated: |
||||||||||||||||
|
At March 31, 2013: |
||||||||||||||||
|
Total capital (to risk-weighted assets): |
||||||||||||||||
|
MUFG |
¥ | 14,673,951 | 16.68 | % | ¥ | 7,037,491 | 8.00 | % | ||||||||
|
BTMU |
12,034,152 | 17.51 | 5,497,550 | 8.00 | ||||||||||||
|
MUTB |
2,035,576 | 17.79 | 914,984 | 8.00 | ||||||||||||
|
Tier1 capital (to risk-weighted assets): |
||||||||||||||||
|
MUFG |
11,214,815 | 12.74 | 3,958,589 | 4.50 | ||||||||||||
|
BTMU |
9,015,774 | 13.11 | 3,092,372 | 4.50 | ||||||||||||
|
MUTB |
1,575,140 | 13.77 | 514,678 | 4.50 | ||||||||||||
|
Common Equity Tier1 capital (to risk-weighted assets): |
||||||||||||||||
|
MUFG |
10,300,558 | 11.70 | 3,078,902 | 3.50 | ||||||||||||
|
BTMU |
8,052,750 | 11.71 | 2,405,178 | 3.50 | ||||||||||||
|
MUTB |
1,500,578 | 13.12 | 400,305 | 3.50 | ||||||||||||
|
At March 31, 2014: |
||||||||||||||||
|
Total capital (to risk-weighted assets): |
||||||||||||||||
|
MUFG |
¥ | 15,394,342 | 15.53 | % | ¥ | 7,926,746 | 8.00 | % | ||||||||
|
BTMU |
12,256,176 | 15.57 | 6,294,248 | 8.00 | ||||||||||||
|
MUTB |
2,057,338 | 18.38 | 895,051 | 8.00 | ||||||||||||
|
Tier1 capital (to risk-weighted assets): |
||||||||||||||||
|
MUFG |
12,341,870 | 12.45 | 5,449,638 | 5.50 | ||||||||||||
|
BTMU |
9,611,553 | 12.21 | 4,327,295 | 5.50 | ||||||||||||
|
MUTB |
1,652,410 | 14.76 | 615,347 | 5.50 | ||||||||||||
|
Common Equity Tier1 capital (to risk-weighted assets): |
||||||||||||||||
|
MUFG |
11,153,032 | 11.25 | 3,963,373 | 4.00 | ||||||||||||
|
BTMU |
8,696,589 | 11.05 | 3,147,124 | 4.00 | ||||||||||||
|
MUTB |
1,590,690 | 14.21 | 447,525 | 4.00 | ||||||||||||
|
Stand-alone: |
||||||||||||||||
|
At March 31, 2013: |
||||||||||||||||
|
Total capital (to risk-weighted assets): |
||||||||||||||||
|
BTMU |
¥ | 11,501,001 | 18.52 | % | ¥ | 4,966,322 | 8.00 | % | ||||||||
|
MUTB |
2,039,037 | 17.94 | 908,852 | 8.00 | ||||||||||||
|
Tier1 capital (to risk-weighted assets): |
||||||||||||||||
|
BTMU |
8,685,464 | 13.99 | 2,793,556 | 4.50 | ||||||||||||
|
MUTB |
1,502,425 | 13.22 | 511,229 | 4.50 | ||||||||||||
|
Common Equity Tier1 capital (to risk-weighted assets): |
||||||||||||||||
|
BTMU |
7,301,380 | 11.76 | 2,172,766 | 3.50 | ||||||||||||
|
MUTB |
1,419,797 | 12.49 | 397,623 | 3.50 | ||||||||||||
|
At March 31, 2014: |
||||||||||||||||
|
Total capital (to risk-weighted assets): |
||||||||||||||||
|
BTMU |
¥ | 11,582,199 | 17.52 | % | ¥ | 5,287,273 | 8.00 | % | ||||||||
|
MUTB |
2,068,948 | 18.51 | 893,909 | 8.00 | ||||||||||||
|
Tier1 capital (to risk-weighted assets): |
||||||||||||||||
|
BTMU |
9,087,335 | 13.74 | 3,635,000 | 5.50 | ||||||||||||
|
MUTB |
1,606,684 | 14.37 | 614,563 | 5.50 | ||||||||||||
|
Common Equity Tier1 capital (to risk-weighted assets): |
||||||||||||||||
|
BTMU |
7,854,651 | 11.88 | 2,643,636 | 4.00 | ||||||||||||
|
MUTB |
1,533,733 | 13.72 | 446,955 | 4.00 | ||||||||||||
MUMSS and other securities subsidiaries in Japan and overseas are also subject to regulatory capital requirements of the countries or jurisdictions in which they operate. In Japan, the Financial Instruments and
F-101
Table of Contents
MITSUBISHI UFJ FINANCIAL GROUP, INC. AND SUBSIDIARIES
NOTES TO CONSOLIDATED FINANCIAL STATEMENTS—(Continued)
Exchange Law and related ordinance require financial instruments firms to maintain a minimum capital ratio of 120% calculated as a percentage of capital accounts less certain fixed assets, as determined in accordance with Japanese GAAP, against amounts equivalent to market, counterparty credit and operations risks. Specific guidelines are issued as a ministerial ordinance which details the definition of essential components of the capital ratios, including capital, deductible fixed asset items and risks, and related measures. Failure to maintain a minimum capital ratio will trigger mandatory regulatory actions. A capital ratio of less than 140% will call for regulatory reporting and a capital ratio of less than 100% may lead to a suspension of all or part of the business for a period of time and cancellation of a registration.
At March 31, 2013, MUMSS’s capital accounts less certain fixed assets of ¥388,163 million on a stand-alone basis were 315.9% of the total amounts equivalent to market, counterparty credit and operations risks. At March 31, 2014, its capital accounts less certain fixed assets of ¥377,325 million on a stand-alone basis and ¥400,570 million on a consolidated basis, were 292.9% and 295.0% of the total amounts equivalent to market, counterparty credit and operations risks, respectively. During the fiscal year ended March 31, 2014, Mitsubishi UFJ Morgan Stanley PB Securities Co., Ltd. became MUMSS’s consolidated subsidiary, and therefore was included in the calculation of the amounts and the ratios on a consolidated basis at March 31, 2014.
Management believes, as of March 31, 2014, that MUFG, BTMU, MUTB and other regulated securities subsidiaries met all capital adequacy requirements to which they are subject.
Note:
MUMSS’scapital ratio on a stand-alone basis calculated as a percentage of capital accounts less certain fixed assets against amounts equivalent to market, counterparty credit and operations risks at March 31, 2013 has been restated from 315.8% to 315.9%.
United States of America
In the United States of America, MUAH and its banking subsidiary MUB, BTMU’s largest subsidiaries operating outside Japan, are subject to various regulatory capital requirements administered by U.S. Federal banking agencies, including minimum capital requirements. Under the capital adequacy guidelines and the regulatory framework for prompt corrective action, MUAH and MUB must meet specific capital guidelines that involve quantitative measures of MUAH’s and MUB’s assets, liabilities, and certain off-balance sheet items as calculated under U.S. regulatory accounting practices. MUAH’s and MUB’s capital amounts and MUB’s prompt corrective action classification are also subject to qualitative judgments by the regulators about components, risk weightings and other factors.
Quantitative measures established by regulation to ensure capital adequacy require MUAH and MUB to maintain minimum ratios (set forth in the table below) of total and Tier I capital (as defined in the regulations) to risk-weighted assets (as defined) and of Tier I capital (as defined) to quarterly average assets (as defined).
As a result of a recent regulatory communication, which clarified the treatment of certain off-balance sheet credit exposures included in risk-weighted assets, MUAH updated the methodologies applied to the calculation of its regulatory capital ratios. MUAH applied the new methodology beginning with the MUAH’s December 31, 2012 capital ratios. As a result, the Tier 1 risk-based capital ratio decreased from 12.44% to 11.91% and the Total risk-based capital ratio decreased from 13.93% to 13.34% at December 31, 2012. The methodologies applied to the computation of MUB’s capital ratios were not affected.
F-102
Table of Contents
MITSUBISHI UFJ FINANCIAL GROUP, INC. AND SUBSIDIARIES
NOTES TO CONSOLIDATED FINANCIAL STATEMENTS—(Continued)
The figures on the tables below are calculated according to Basel I as MUAH and MUB do not meet the criteria in the new U.S. rules which would make adoption of the new Basel II rules mandatory. MUAH’s and the MUB’s actual capital amounts and ratios are presented as follows:
| Actual |
For capital
adequacy purposes |
|||||||||||||||
| Amount | Ratio | Amount | Ratio | |||||||||||||
| (in millions, except percentages) | ||||||||||||||||
|
MUAH: |
||||||||||||||||
|
At December 31, 2012: |
||||||||||||||||
|
Total capital (to risk-weighted assets) |
$ | 11,048 | 13.34 | % | $ | 6,628 | 8.00 | % | ||||||||
|
Tier I capital (to risk-weighted assets) |
9,864 | 11.91 | 3,314 | 4.00 | ||||||||||||
|
Tier I capital (to quarterly average assets) (1) |
9,864 | 11.18 | 3,531 | 4.00 | ||||||||||||
|
At December 31, 2013: |
||||||||||||||||
|
Total capital (to risk-weighted assets) |
$ | 13,499 | 14.61 | % | $ | 7,393 | 8.00 | % | ||||||||
|
Tier I capital (to risk-weighted assets) |
11,471 | 12.41 | 3,696 | 4.00 | ||||||||||||
|
Tier I capital (to quarterly average assets) (1) |
11,471 | 11.27 | 4,073 | 4.00 | ||||||||||||
| Actual |
For capital
adequacy purposes |
Ratios OCC
requires to be “well capitalized” |
||||||||||||||||||||||
| Amount | Ratio | Amount | Ratio | Amount | Ratio | |||||||||||||||||||
| (in millions, except percentages) | ||||||||||||||||||||||||
|
MUB: |
||||||||||||||||||||||||
|
At December 31, 2012: |
||||||||||||||||||||||||
|
Total capital (to risk-weighted assets) |
$ | 10,362 | 13.17 | % | $ | 6,294 | 8.00 | % | $ | 7,867 | 10.00 | % | ||||||||||||
|
Tier I capital (to risk-weighted assets) |
9,192 | 11.68 | 3,147 | 4.00 | 4,720 | 6.00 | ||||||||||||||||||
|
Tier I capital (to quarterly average assets) (1) |
9,162 | 10.51 | 3,498 | 4.00 | 4,373 | 5.00 | ||||||||||||||||||
|
At December 31, 2013: |
||||||||||||||||||||||||
|
Total capital (to risk-weighted assets) |
$ | 12,990 | 14.91 | % | $ | 6,970 | 8.00 | % | $ | 8,713 | 10.00 | % | ||||||||||||
|
Tier I capital (to risk-weighted assets) |
11,274 | 12.94 | 3,485 | 4.00 | 5,228 | 6.00 | ||||||||||||||||||
|
Tier I capital (to quarterly average assets) (1) |
11,274 | 11.13 | 4,051 | 4.00 | 5,063 | 5.00 | ||||||||||||||||||
Note:
| (1) | Excludes certain intangible assets. |
Management believes, as of December 31, 2013, that MUAH and MUB met all capital adequacy requirements to which they are subject.
As of December 31, 2012 and 2013, the notification from the U.S. Office of the Comptroller of the Currency (“OCC”) categorized MUB as “well capitalized” under the regulatory framework for prompt corrective action. To be categorized as “well capitalized,” MUB must maintain a minimum total risk-based capital ratio of 10%, a Tier I risk-based capital ratio of 6%, and a Tier I leverage ratio of 5% as set forth in the table. There are no conditions or events since that notification that management believes have changed MUB’s category.
F-103
Table of Contents
MITSUBISHI UFJ FINANCIAL GROUP, INC. AND SUBSIDIARIES
NOTES TO CONSOLIDATED FINANCIAL STATEMENTS—(Continued)
| 22. | EARNINGS PER COMMON SHARE APPLICABLE TO COMMON SHAREHOLDERS OF MUFG |
Reconciliations of net income and weighted average number of common shares outstanding used for the computation of basic EPS to the adjusted amounts for the computation of diluted EPS for the fiscal years ended March 31, 2012, 2013 and 2014 are as follows:
| 2012 | 2013 | 2014 | ||||||||||
| (in millions) | ||||||||||||
|
Income (Numerator): |
||||||||||||
|
Net income attributable to Mitsubishi UFJ Financial Group |
¥ | 416,231 | ¥ | 1,069,124 | ¥ | 1,015,393 | ||||||
|
Income allocable to preferred shareholders: |
||||||||||||
|
Cash dividends paid |
(17,940 | ) | (17,940 | ) | (17,940 | ) | ||||||
|
Changes in a foreign affiliated company’s interests in its subsidiary |
— | — | (3,301 | ) | ||||||||
|
|
|
|
|
|
|
|||||||
|
Earnings applicable to common shareholders of Mitsubishi UFJ Financial Group |
398,291 | 1,051,184 | 994,152 | |||||||||
|
|
|
|
|
|
|
|||||||
|
Effect of dilutive instruments: |
||||||||||||
|
Stock options and restricted stock units—Morgan Stanley |
— | (336 | ) | (1,875 | ) | |||||||
|
Convertible preferred stock—Mitsubishi UFJ Merrill Lynch PB Securities Co., Ltd. |
(589 | ) | — | — | ||||||||
|
|
|
|
|
|
|
|||||||
|
Earnings applicable to common shareholders of Mitsubishi UFJ Financial Group and assumed conversions |
¥ | 397,702 | ¥ | 1,050,848 | ¥ | 992,277 | ||||||
|
|
|
|
|
|
|
|||||||
| 2012 | 2013 | 2014 | ||||||||||
| (thousands of shares) | ||||||||||||
|
Shares (Denominator): |
||||||||||||
|
Weighted average common shares outstanding |
14,140,136 | 14,148,060 | 14,158,698 | |||||||||
|
Effect of dilutive instruments: |
||||||||||||
|
Convertible preferred stock |
1 | 1 | 1 | |||||||||
|
Stock options |
16,683 | 21,019 | 21,381 | |||||||||
|
|
|
|
|
|
|
|||||||
|
Weighted average common shares for diluted computation |
14,156,820 | 14,169,080 | 14,180,080 | |||||||||
|
|
|
|
|
|
|
|||||||
| 2012 | 2013 | 2014 | ||||||||||
| (in yen) | ||||||||||||
|
Earnings per common share applicable to common shareholders of Mitsubishi UFJ Financial Group: |
||||||||||||
|
Basic earnings per common share: |
||||||||||||
|
Earnings applicable to common shareholders of Mitsubishi UFJ Financial Group |
¥ | 28.17 | ¥ | 74.30 | ¥ | 70.21 | ||||||
|
|
|
|
|
|
|
|||||||
|
Diluted earnings per common share: |
||||||||||||
|
Earnings applicable to common shareholders of Mitsubishi UFJ Financial Group |
¥ | 28.09 | ¥ | 74.16 | ¥ | 69.98 | ||||||
|
|
|
|
|
|
|
|||||||
For the fiscal year ended March 31, 2012, stock options and restricted stock units issued by Morgan Stanley to purchase 57 million shares and convert into 21 million shares, respectively, could potentially dilute earnings per common share but were not included in the computation of diluted earnings per common share as they were antidilutive. All outstanding convertible preferred stock issued by Mitsubishi UFJ Merrill Lynch PB Securities Co., Ltd. were acquired by MUSHD and BTMU in December 2012 and converted into common stock.
F-104
Table of Contents
MITSUBISHI UFJ FINANCIAL GROUP, INC. AND SUBSIDIARIES
NOTES TO CONSOLIDATED FINANCIAL STATEMENTS—(Continued)
In computing the number of the potentially dilutive common shares for the fiscal years ended March 31, 2012, 2013 and 2014, Class 11 Preferred Stock has been based on the conversion price of ¥865.9 at March 31, 2012, 2013 and 2014.
| 23. | DERIVATIVE FINANCIAL INSTRUMENTS |
The MUFG Group uses various derivative financial instruments both for trading purposes and for purposes other than trading (primarily risk management purposes) in the normal course of business to meet the financial needs of its customers, as a source of revenue and to manage its exposures to a variety of risks.
Market risk is the possibility that future changes in market indices make the financial instruments less valuable. The MUFG Group is a party to derivative financial instruments, including swaps, forwards, options and other types of derivatives, dealing primarily with market risk associated with interest rates, foreign currencies, equity and commodity prices, and credit risk associated with counterparty’s nonperformance of transactions.
Credit risk is the possibility that a loss may result from a counterparty’s failure to perform according to the terms and conditions of the contract, which may exceed the value of underlying collateral. To reduce credit risk, the MUFG Group may require collateral or guarantees based on a case-by-case assessment of creditworthiness of each customer and evaluation of the instrument. The MUFG Group also uses master netting agreements in order to mitigate overall counterparty credit risk.
Trading Activities
The MUFG Group’s trading activities include dealing and customer accommodation activities. As part of its trading activities, the MUFG Group offers a variety of derivative financial instruments for managing interest rate and foreign exchange risk to its domestic and foreign corporate and financial institution customers. The MUFG Group also enters into other types of derivative transactions, including equity and credit-related contracts, for its own account.
Risk Management Activities
As part of the MUFG Group’s risk management activities, asset and liability management is viewed as one of the methods for the MUFG Group to manage its interest rate exposures on interest-bearing assets and liabilities. The MUFG Group uses certain derivative financial instruments in order to minimize significant unplanned fluctuations in earnings that are caused by interest rate volatility. For example, an increase or a decrease of interest income and interest expense on hedged variable rate assets and liabilities as a result of interest rate fluctuations are expected to substantially offset the variability in earnings by gains and losses on the derivative instruments that are linked to these hedged assets and liabilities.
The MUFG Group enters into interest rate swaps and other contracts primarily to manage the interest rate risk of its loans, investment securities and deposit liabilities. Interest rate contracts, which are generally non-leveraged generic interest rate and basis swaps, options and futures, allow the MUFG Group to effectively manage its interest rate risk position. Option contracts primarily consist of caps, floors, swaptions and options on index futures. Futures contracts used for asset and liability management activities are primarily index futures providing for cash payments based upon the movement of an underlying rate index.
The MUFG Group enters into forward exchange contracts, currency swaps and other contracts in response to currency exposures resulting from on-balance sheet assets and liabilities denominated in foreign currencies in order to limit the net foreign exchange position by currency to an appropriate level.
F-105
Table of Contents
MITSUBISHI UFJ FINANCIAL GROUP, INC. AND SUBSIDIARIES
NOTES TO CONSOLIDATED FINANCIAL STATEMENTS—(Continued)
Derivatives Designated as Hedges
The MUFG Group adopts hedging strategies and applies hedge accounting to certain derivative transactions entered by MUAH whose fiscal period ends on December 31.
Cash Flow Hedges
MUAH used interest rate swaps with a notional amount of ¥453.2 billion at December 31, 2013 to hedge the risk of changes in cash flows attributable to changes in the designated benchmark interest rate on LIBOR indexed loans. To the extent effective, payments received (or paid) under the swap contract offset fluctuations in interest income on loans caused by changes in the relevant LIBOR index. At December 31, 2013, the weighted average remaining life of the currently active cash flow hedges was approximately 4.02 years.
For cash flow hedges, the effective portion of the gain or loss on the hedging instruments is reported as a component of OCI and reclassified into earnings in the same period or periods during which the hedged cash flows are recognized in net interest income. Gains and losses representing hedge ineffectiveness are recognized in earnings in the period in which they arise. At December 31, 2013, MUAH expects to reclassify approximately ¥6.7 billion of income from Accumulated OCI to net interest income during the year ending December 31, 2014. This amount could differ from amounts actually realized due to changes in interest rates, hedge terminations and the addition of other hedges subsequent to December 31, 2013.
Notional Amounts of Derivative Contracts
The following table summarizes the notional amounts of derivative contracts at March 31, 2013 and 2014:
| Notional amounts (1) | ||||||||
| 2013 | 2014 | |||||||
| (in trillions) | ||||||||
|
Interest rate contracts |
¥ | 956.6 | ¥ | 962.5 | ||||
|
Foreign exchange contracts |
155.2 | 169.5 | ||||||
|
Equity contracts |
3.0 | 3.1 | ||||||
|
Commodity contracts |
2.2 | 2.5 | ||||||
|
Credit derivatives |
6.6 | 7.1 | ||||||
|
Others |
1.9 | 2.7 | ||||||
|
|
|
|
|
|||||
|
Total |
¥ | 1,125.5 | ¥ | 1,147.4 | ||||
|
|
|
|
|
|||||
Note:
| (1) | Includes both written and purchased position. |
F-106
Table of Contents
MITSUBISHI UFJ FINANCIAL GROUP, INC. AND SUBSIDIARIES
NOTES TO CONSOLIDATED FINANCIAL STATEMENTS—(Continued)
Impact of Derivatives on the Consolidated Balance Sheets
The following table summarizes fair value information on derivative instruments that are recorded on the MUFG Group’s consolidated balance sheets at March 31, 2013 and 2014:
| Fair value of derivative instruments | ||||||||||||||||||||||||
| March 31, 2013 (1)(5) | March 31, 2014 (1)(5) | |||||||||||||||||||||||
|
Not designated
as hedges (2) |
Designated
as hedges (3) |
Total
derivatives (4) |
Not designated
as hedges (2) |
Designated
as hedges (3) |
Total
derivatives (4) |
|||||||||||||||||||
| (in billions) | ||||||||||||||||||||||||
|
Derivative assets: |
||||||||||||||||||||||||
|
Interest rate contracts |
¥ | 11,214 | ¥ | 2 | ¥ | 11,216 | ¥ | 8,616 | ¥ | 1 | ¥ | 8,617 | ||||||||||||
|
Foreign exchange contracts |
3,193 | — | 3,193 | 2,916 | — | 2,916 | ||||||||||||||||||
|
Equity contracts |
104 | — | 104 | 149 | — | 149 | ||||||||||||||||||
|
Commodity contracts |
73 | — | 73 | 69 | — | 69 | ||||||||||||||||||
|
Credit derivatives |
62 | — | 62 | 57 | — | 57 | ||||||||||||||||||
|
Others (6) |
— | — | — | 2 | — | 2 | ||||||||||||||||||
|
|
|
|
|
|
|
|
|
|
|
|
|
|||||||||||||
|
Total derivative assets |
¥ | 14,646 | ¥ | 2 | ¥ | 14,648 | ¥ | 11,809 | ¥ | 1 | ¥ | 11,810 | ||||||||||||
|
|
|
|
|
|
|
|
|
|
|
|
|
|||||||||||||
|
Derivative liabilities: |
||||||||||||||||||||||||
|
Interest rate contracts |
¥ | 11,205 | ¥ | — | ¥ | 11,205 | ¥ | 8,522 | ¥ | 1 | ¥ | 8,523 | ||||||||||||
|
Foreign exchange contracts |
3,429 | — | 3,429 | 2,999 | — | 2,999 | ||||||||||||||||||
|
Equity contracts |
131 | — | 131 | 144 | — | 144 | ||||||||||||||||||
|
Commodity contracts |
64 | — | 64 | 60 | — | 60 | ||||||||||||||||||
|
Credit derivatives |
62 | — | 62 | 62 | — | 62 | ||||||||||||||||||
|
Others (6) |
(24 | ) | — | (24 | ) | (23 | ) | — | (23 | ) | ||||||||||||||
|
|
|
|
|
|
|
|
|
|
|
|
|
|||||||||||||
|
Total derivative liabilities |
¥ | 14,867 | ¥ | — | ¥ | 14,867 | ¥ | 11,764 | ¥ | 1 | ¥ | 11,765 | ||||||||||||
|
|
|
|
|
|
|
|
|
|
|
|
|
|||||||||||||
Notes:
| (1) | The fair value of derivative instruments is presented on a gross basis even when derivative instruments are subject to master netting agreements. Cash collateral payable and receivable associated with derivative instruments are not added to or netted against the fair value amounts. |
| (2) | The derivative instruments which are not designated as a hedging instrument are held for trading and risk management purposes, and are presented in Trading account assets/liabilities except for (6). |
| (3) | The MUFG Group adopts hedging strategies and applies hedge accounting to certain derivative transactions entered into by MUAH. The derivative instruments which are designated as hedging instruments are presented in Other assets or Other liabilities on the accompanying consolidated balance sheets. |
| (4) | This table does not include contracts with embedded derivatives for which the fair value option has been elected. |
| (5) | For more information about fair value measurement and assumptions used to measure the fair value of derivatives, see Note 31. |
| (6) | Others include mainly bifurcated embedded derivatives carried at fair value, which are presented in Deposits and Long-term debt. |
F-107
Table of Contents
MITSUBISHI UFJ FINANCIAL GROUP, INC. AND SUBSIDIARIES
NOTES TO CONSOLIDATED FINANCIAL STATEMENTS—(Continued)
Impact of Derivatives and Hedged Items on the Consolidated Statements of Income and Accumulated OCI
The following tables provide more detailed information regarding the derivative-related impact on the accompanying consolidated statements of income by accounting designation for the fiscal years ended March 31, 2012, 2013 and 2014:
Gains and losses for trading and risk management derivatives (not designated as hedging instruments)
|
Trading and risk management derivatives gains and losses
(Not designated as hedging instruments) |
||||||||||||
|
Foreign exchange
gains (losses)—net |
Trading account
profits (losses)—net |
Total | ||||||||||
| (in billions) | ||||||||||||
|
Fiscal year ended March 31, 2012: |
||||||||||||
|
Interest rate contracts |
¥ | — | ¥ | 160 | ¥ | 160 | ||||||
|
Foreign exchange contracts |
(94 | ) | — | (94 | ) | |||||||
|
Equity contracts |
— | (47 | ) | (47 | ) | |||||||
|
Commodity contracts |
— | (1 | ) | (1 | ) | |||||||
|
Credit derivatives |
— | 2 | 2 | |||||||||
|
Others |
(1 | ) | (36 | ) | (37 | ) | ||||||
|
|
|
|
|
|
|
|||||||
|
Total |
¥ | (95 | ) | ¥ | 78 | ¥ | (17 | ) | ||||
|
|
|
|
|
|
|
|||||||
|
Fiscal year ended March 31, 2013: |
||||||||||||
|
Interest rate contracts |
¥ | — | ¥ | 121 | ¥ | 121 | ||||||
|
Foreign exchange contracts |
(92 | ) | — | (92 | ) | |||||||
|
Equity contracts |
— | (138 | ) | (138 | ) | |||||||
|
Commodity contracts |
— | 4 | 4 | |||||||||
|
Credit derivatives |
— | (11 | ) | (11 | ) | |||||||
|
Others |
(2 | ) | (59 | ) | (61 | ) | ||||||
|
|
|
|
|
|
|
|||||||
|
Total |
¥ | (94 | ) | ¥ | (83 | ) | ¥ | (177 | ) | |||
|
|
|
|
|
|
|
|||||||
|
Fiscal year ended March 31, 2014: |
||||||||||||
|
Interest rate contracts |
¥ | — | ¥ | 30 | ¥ | 30 | ||||||
|
Foreign exchange contracts |
(51 | ) | — | (51 | ) | |||||||
|
Equity contracts |
— | (105 | ) | (105 | ) | |||||||
|
Commodity contracts |
— | 3 | 3 | |||||||||
|
Credit derivatives |
— | (6 | ) | (6 | ) | |||||||
|
Others |
(2 | ) | (6 | ) | (8 | ) | ||||||
|
|
|
|
|
|
|
|||||||
|
Total |
¥ | (53 | ) | ¥ | (84 | ) | ¥ | (137 | ) | |||
|
|
|
|
|
|
|
|||||||
F-108
Table of Contents
MITSUBISHI UFJ FINANCIAL GROUP, INC. AND SUBSIDIARIES
NOTES TO CONSOLIDATED FINANCIAL STATEMENTS—(Continued)
Gains and losses for derivatives designated as cash flow hedges
| For the fiscal year ended March 31, | ||||||||||||
| 2012 | 2013 | 2014 | ||||||||||
| (in billions) | ||||||||||||
|
Gains (losses) recognized in Accumulated OCI on derivative instruments (Effective portion) |
||||||||||||
|
Interest rate contracts |
¥ | — | ¥ | 7 | ¥ | 3 | ||||||
|
|
|
|
|
|
|
|||||||
|
Total |
¥ | — | ¥ | 7 | ¥ | 3 | ||||||
|
|
|
|
|
|
|
|||||||
|
Gains (losses) reclassified from Accumulated OCI into income (Effective portion) |
||||||||||||
|
Interest rate contracts (1) |
¥ | (1 | ) | ¥ | 1 | ¥ | 4 | |||||
|
|
|
|
|
|
|
|||||||
|
Total |
¥ | (1 | ) | ¥ | 1 | ¥ | 4 | |||||
|
|
|
|
|
|
|
|||||||
|
Gains (losses) recognized in income on derivative instruments (Ineffective portion and amount excluded from effectiveness testing) |
||||||||||||
|
Interest rate contracts |
¥ | — | ¥ | — | ¥ | — | ||||||
|
|
|
|
|
|
|
|||||||
|
Total |
¥ | — | ¥ | — | ¥ | — | ||||||
|
|
|
|
|
|
|
|||||||
Note:
| (1) | Included in Interest income. |
Embedded Derivatives
Features embedded in other non-derivative hybrid contracts are separated from the host contracts and measured at fair value when they are not clearly and closely related to the host contracts and meet the definition of a derivative. The change in the fair value of such an embedded derivative is recognized currently in earnings, unless it qualifies as a hedge. The fair value of the embedded derivative is presented in the accompanying consolidated balance sheets with the host contract. The MUFG Group accounts for credit-linked notes as host contracts with embedded derivatives and measures the entire contracts at fair value.
F-109
Table of Contents
MITSUBISHI UFJ FINANCIAL GROUP, INC. AND SUBSIDIARIES
NOTES TO CONSOLIDATED FINANCIAL STATEMENTS—(Continued)
Credit Derivatives
The MUFG Group enters into credit derivatives to manage its credit risk exposure, to facilitate client transactions, and for proprietary trading purposes, under which they provide the counterparty protection against the risk of default on a set of debt obligations issued by a specified reference entity or entities. Types of such credit derivatives primarily include single name credit default swaps, index and basket credit default swaps and credit-linked notes. The MUFG Group will have to perform under a credit derivative if a credit event as defined under the contract occurs. Such credit events include bankruptcy, dissolution or insolvency of the referenced entity, default and restructuring of the obligations of the referenced entity. The MUFG Group’s counterparties are banks, broker-dealers, insurance and other financial institutions. The contractual or notional amounts of these credit derivatives represent the maximum potential amounts of future payments without consideration of possible recoveries under recourse provisions or from collateral held or pledged. The table below summarizes certain information regarding protection sold through credit default swaps and credit-linked notes as of March 31, 2013 and 2014:
| Protection sold | ||||||||||||||||||||
|
Maximum potential/Notional amount
by expiration period |
Fair value | |||||||||||||||||||
|
At March 31, 2013: |
1 year
or less |
1-5 years |
Over
5 years |
Total |
(Asset)/
Liability (1) |
|||||||||||||||
| (in millions) | ||||||||||||||||||||
|
Single name credit default swaps: |
||||||||||||||||||||
|
Investment grade (2) |
¥ | 488,834 | ¥ | 1,775,720 | ¥ | 102,613 | ¥ | 2,367,167 | ¥ | (8,863 | ) | |||||||||
|
Non-investment grade |
75,959 | 164,215 | 13,793 | 253,967 | 9,275 | |||||||||||||||
|
Not rated |
10,807 | 4,024 | — | 14,831 | (73 | ) | ||||||||||||||
|
|
|
|
|
|
|
|
|
|
|
|||||||||||
|
Total |
575,600 | 1,943,959 | 116,406 | 2,635,965 | 339 | |||||||||||||||
|
|
|
|
|
|
|
|
|
|
|
|||||||||||
|
Index and basket credit default swaps held by BTMU: |
||||||||||||||||||||
|
Investment grade (2) |
34,479 | 47,599 | 116,173 | 198,251 | 600 | |||||||||||||||
|
Non-investment grade |
— | 940 | — | 940 | — | |||||||||||||||
|
|
|
|
|
|
|
|
|
|
|
|||||||||||
|
Total |
34,479 | 48,539 | 116,173 | 199,191 | 600 | |||||||||||||||
|
Index and basket credit default swaps held by MUSHD: |
||||||||||||||||||||
|
Investment grade (2) |
7,680 | 367,814 | 9,000 | 384,494 | (4,131 | ) | ||||||||||||||
|
Non-investment grade |
7,203 | 2,284 | — | 9,487 | (153 | ) | ||||||||||||||
|
Not rated |
— | 24,708 | — | 24,708 | 215 | |||||||||||||||
|
|
|
|
|
|
|
|
|
|
|
|||||||||||
|
Total |
14,883 | 394,806 | 9,000 | 418,689 | (4,069 | ) | ||||||||||||||
|
|
|
|
|
|
|
|
|
|
|
|||||||||||
|
Total index and basket credit default swaps sold |
49,362 | 443,345 | 125,173 | 617,880 | (3,469 | ) | ||||||||||||||
|
|
|
|
|
|
|
|
|
|
|
|||||||||||
|
Total credit default swaps sold |
¥ | 624,962 | ¥ | 2,387,304 | ¥ | 241,579 | ¥ | 3,253,845 | ¥ | (3,130 | ) | |||||||||
|
|
|
|
|
|
|
|
|
|
|
|||||||||||
|
Credit-linked notes (3) |
¥ | 7,500 | ¥ | 1,505 | ¥ | 4,517 | ¥ | 13,522 | ¥ | (12,741 | ) | |||||||||
F-110
Table of Contents
MITSUBISHI UFJ FINANCIAL GROUP, INC. AND SUBSIDIARIES
NOTES TO CONSOLIDATED FINANCIAL STATEMENTS—(Continued)
| Protection sold | ||||||||||||||||||||
|
Maximum potential/Notional amount
by expiration period |
Fair value | |||||||||||||||||||
|
At March 31, 2014: |
1 year
or less |
1-5
years |
Over
5 years |
Total |
(Asset)/
Liability (1) |
|||||||||||||||
| (in millions) | ||||||||||||||||||||
|
Single name credit default swaps: |
||||||||||||||||||||
|
Investment grade (2) |
¥ | 422,991 | ¥ | 1,952,552 | ¥ | 78,741 | ¥ | 2,454,284 | ¥ | (30,634 | ) | |||||||||
|
Non-investment grade |
49,579 | 180,168 | 2,750 | 232,497 | 1,326 | |||||||||||||||
|
Not rated |
1,132 | 4,221 | — | 5,353 | (74 | ) | ||||||||||||||
|
|
|
|
|
|
|
|
|
|
|
|||||||||||
|
Total |
473,702 | 2,136,941 | 81,491 | 2,692,134 | (29,382 | ) | ||||||||||||||
|
|
|
|
|
|
|
|
|
|
|
|||||||||||
|
Index and basket credit default swaps held by BTMU: |
||||||||||||||||||||
|
Investment grade (2) |
940 | 83,816 | 166,629 | 251,385 | (3,316 | ) | ||||||||||||||
|
Non-investment grade |
— | — | — | — | — | |||||||||||||||
|
|
|
|
|
|
|
|
|
|
|
|||||||||||
|
Total |
940 | 83,816 | 166,629 | 251,385 | (3,316 | ) | ||||||||||||||
|
Index and basket credit default swaps held by MUSHD: |
||||||||||||||||||||
|
Investment grade (2) |
122,837 | 339,606 | 1,000 | 463,443 | (5,520 | ) | ||||||||||||||
|
Non-investment grade |
— | 7,407 | — | 7,407 | (779 | ) | ||||||||||||||
|
Not rated |
— | 51,527 | — | 51,527 | (487 | ) | ||||||||||||||
|
|
|
|
|
|
|
|
|
|
|
|||||||||||
|
Total |
122,837 | 398,540 | 1,000 | 522,377 | (6,786 | ) | ||||||||||||||
|
|
|
|
|
|
|
|
|
|
|
|||||||||||
|
Total index and basket credit default swaps sold |
123,777 | 482,356 | 167,629 | 773,762 | (10,102 | ) | ||||||||||||||
|
|
|
|
|
|
|
|
|
|
|
|||||||||||
|
Total credit default swaps sold |
¥ | 597,479 | ¥ | 2,619,297 | ¥ | 249,120 | ¥ | 3,465,896 | ¥ | (39,484 | ) | |||||||||
|
|
|
|
|
|
|
|
|
|
|
|||||||||||
|
Credit-linked notes (3) |
¥ | — | ¥ | — | ¥ | 4,546 | ¥ | 4,546 | ¥ | (4,368 | ) | |||||||||
Notes:
| (1) | Fair value amounts are shown on a gross basis prior to cash collateral or counterparty netting. |
| (2) | The MUFG Group considers ratings of Baa3/BBB- or higher to meet the definition of investment grade. |
| (3) | Fair value amounts shown represent the fair value of the hybrid instruments. |
Single name credit default swaps —A credit default swap protects the buyer against the loss of principal on a bond or loan in case of a default by the issuer. The protection buyer pays a premium to the MUFG Group and is protected for the period of the credit default swap. As the seller of protection, the MUFG Group in turn will have to perform under a credit default swap if a credit event as defined under the contracts occurs. In order to provide an indication of the current payment/performance risk of the credit default swaps, the external credit ratings, primarily those provided by Moody’s and Standard & Poor’s (“S&P”), of the underlying reference entity of the credit default swaps are disclosed.
Index and basket credit default swaps —Index and basket credit default swaps are credit default swaps that reference multiple names through underlying baskets or portfolios of single name credit default swaps. Typically, in the event of a default on one of the underlying names, the MUFG Group, as the seller of protection, will have to pay a pro rata portion of the total notional amount of the credit default index or basket contract. In order to provide an indication of the current payment/performance risk of these credit default swaps, BTMU and MUSHD rating scale based upon the entity’s internal ratings, which generally correspond to ratings defined by primarily Moody’s and S&P, of the underlying reference entities comprising the basket or index were calculated and disclosed.
F-111
Table of Contents
MITSUBISHI UFJ FINANCIAL GROUP, INC. AND SUBSIDIARIES
NOTES TO CONSOLIDATED FINANCIAL STATEMENTS—(Continued)
Credit-linked notes (“CLNs”) —The MUFG Group has invested in CLNs, which are hybrid instruments containing embedded derivatives, in which credit protection has been sold to the issuers of the notes. If there is a credit event of the reference entity underlying the CLN, the principal balance of the note may not be repaid in full to the MUFG Group. As part of its financing activities, MUSHD and other securities subsidiaries in Japan and overseas issue CLNs.
The MUFG Group may economically hedge its exposure to credit derivatives by entering into offsetting derivative contracts. The carrying value and notional amounts of credit protection sold in which the MUFG Group held purchased protection with identical underlying referenced entities were approximately ¥3 billion and ¥2,779 billion, respectively, at March 31, 2013, and approximately ¥35 billion and ¥3,048 billion, respectively, at March 31, 2014.
Collateral is held by the MUFG Group in relation to these instruments. Collateral requirements are determined at the counterparty level and cover numerous transactions and products as opposed to individual contracts.
Credit Risk, Liquidity Risk and Credit-risk-related Contingent Features
Certain of the MUFG Group’s derivative instruments contain provisions that require the MUFG Group’s debt to maintain an investment grade credit rating from each of the major credit rating agencies. If the MUFG Group’s debt were to fall below investment grade, it would be in violation of these provisions, and the counterparties to the derivative instruments could request payments on early termination or demand immediate and ongoing full overnight collateralization on derivative instruments in net liability positions. The aggregate fair value of all derivative instruments with credit-risk-related contingent features that were in a liability position at March 31, 2013 and 2014 was approximately ¥3.6 trillion and ¥2.5 trillion, respectively, for which the MUFG Group has posted collateral of approximately ¥579 billion and ¥253 billion, respectively, in the normal course of business. The amount of additional collateral and early termination amount which could be requested if the MUFG Group’s debt falls below investment grade was ¥116 billion and ¥23 billion, respectively, as of March 31, 2013 and ¥125 billion and ¥43 billion, respectively, as of March 31, 2014.
| 24. | OBLIGATIONS UNDER GUARANTEES AND OTHER OFF-BALANCE SHEET INSTRUMENTS |
Obligations under Guarantees
The MUFG Group provides customers with a variety of guarantees and similar arrangements, including standby letters of credit, financial and performance guarantees, credit protection, liquidity facilities, other off-balance sheet credit-related support and similar instruments, in order to meet the customers’ financial and business needs. The tables below present the contractual or notional amounts of such guarantees at March 31, 2013 and 2014. The contractual or notional amounts of these instruments represent the maximum potential amounts of future payments without consideration of possible recoveries under recourse provisions or from collateral held or pledged.
For certain types of derivatives, such as written interest rate options and written currency options, the maximum potential future payments are unlimited. Accordingly, it is impracticable to estimate the maximum potential amount of future payments. As such, the notional amounts of the related contracts, other than the maximum potential payments, are included in the table.
The MUFG Group mitigates its credit risk exposure resulting from guarantees by utilizing various techniques, including collateralization in the form of cash, securities, and real estate properties based on management’s credit assessment of the guaranteed parties and the related credit profile. In order to manage the
F-112
Table of Contents
MITSUBISHI UFJ FINANCIAL GROUP, INC. AND SUBSIDIARIES
NOTES TO CONSOLIDATED FINANCIAL STATEMENTS—(Continued)
credit risk exposure, the MUFG Group also enters into sub-participation contracts with third parties who will fund a portion of the credit facility and bear its share of the loss to be incurred in the event that the borrower fails to fulfill its obligations. The following table includes guarantees of ¥160.7 billion and ¥183.7 billion at March 31, 2013 and 2014, respectively, which are syndicated out to third parties. The contractual or notional amounts summarized in the following table do not necessarily bear any direct relationship to the future actual credit exposure, primarily because of risk management techniques of the MUFG Group.
|
Maximum
potential/ Contractual or Notional amount |
Amount by expiration period | |||||||||||||||
|
At March 31, 2013: |
1 year
or less |
1-5 years |
Over
5 years |
|||||||||||||
| (in billions) | ||||||||||||||||
|
Standby letter of credit and financial guarantees |
¥ | 3,849 | ¥ | 2,101 | ¥ | 1,094 | ¥ | 654 | ||||||||
|
Performance guarantees |
2,214 | 1,509 | 627 | 78 | ||||||||||||
|
Derivative instruments (1) |
144,471 | 99,846 | 35,784 | 8,841 | ||||||||||||
|
Liabilities of trust accounts |
4,839 | 3,969 | 300 | 570 | ||||||||||||
|
|
|
|
|
|
|
|
|
|||||||||
|
Total |
¥ | 155,373 | ¥ | 107,425 | ¥ | 37,805 | ¥ | 10,143 | ||||||||
|
|
|
|
|
|
|
|
|
|||||||||
|
Maximum
potential/ Contractual or Notional amount |
Amount by expiration period | |||||||||||||||
|
At March 31, 2014: |
1 year
or less |
1-5 years |
Over
5 years |
|||||||||||||
| (in billions) | ||||||||||||||||
|
Standby letter of credit and financial guarantees |
¥ | 3,774 | ¥ | 2,082 | ¥ | 1,116 | ¥ | 576 | ||||||||
|
Performance guarantees |
2,571 | 1,766 | 727 | 78 | ||||||||||||
|
Derivative instruments (1) |
68,811 | 33,281 | 26,432 | 9,098 | ||||||||||||
|
Liabilities of trust accounts |
7,751 | 6,580 | 343 | 828 | ||||||||||||
|
|
|
|
|
|
|
|
|
|||||||||
|
Total |
¥ | 82,907 | ¥ | 43,709 | ¥ | 28,618 | ¥ | 10,580 | ||||||||
|
|
|
|
|
|
|
|
|
|||||||||
Note:
| (1) | Credit derivatives sold by the MUFG Group are excluded from this presentation. |
Nature of Guarantee Contracts
Standby letters of credit and financial guarantees generally include an obligation of an issuer or a designated third-party to guarantee the performance of the customer to the beneficiary under the terms of contracts such as lending contracts and other similar financial transactions. The MUFG Group is required to make payments to the guaranteed parties in the event that the customers fail to fulfill the obligations under the contracts. The guarantees whose contractual maturities are over 5 years are mainly comprised of guarantees of housing loans.
Performance guarantees are contracts that contingently require the MUFG Group to make payments to the guaranteed party based on another party’s failure to perform under an obligating agreement, except financial obligation. For example, performance guarantees include guarantees of completion of construction projects.
Derivative instruments that are deemed to be included within the definition of guarantees as prescribed in the guidance on guarantees include certain written options and credit default swaps. In order for the MUFG Group to determine if those derivative instruments meet the definition of guarantees as prescribed in the guidance on guarantees, the MUFG Group tracks whether the counterparties are actually exposed to losses that will result
F-113
Table of Contents
MITSUBISHI UFJ FINANCIAL GROUP, INC. AND SUBSIDIARIES
NOTES TO CONSOLIDATED FINANCIAL STATEMENTS—(Continued)
from the adverse change in the underlyings. Accordingly, the MUFG Group has disclosed information on all credit default swaps and certain written options for which there is a possibility of meeting the definition of guarantees as prescribed in the guidance on guarantees, regardless of whether the counterparties have assets or liabilities related to the underlyings of the derivatives. However, credit derivatives sold by the MUFG Group at March 31, 2013 and 2014 are excluded from this presentation, as they are disclosed in Note 23.
Liabilities of trust accounts represent the trustee’s potential responsibility for temporary payments to creditors of liabilities of trust accounts making use of funds of the MUFG Group, unless there are the certain agreements with trust creditors that have provisions limiting the MUFG Group’s responsibility as a trustee to the trust account assets. A trust may incur external liabilities to obtain certain services during the terms of the trust arrangement. While, in principle, any liabilities of a trust are payable by the trust account and its beneficiaries, a trustee’s responsibility may be interpreted to encompass temporary payments for the trust account liabilities when the trust account does not maintain sufficient liquidity available for such liabilities unless the agreement with trust creditors limits the trustee’s responsibility to the trust account assets. At March 31, 2013 and 2014, there were liabilities of ¥4,839 billion and ¥7,751 billion, respectively, in the segregated records of trust accounts including the amounts related to liabilities with provisions limiting trustee responsibility. Liabilities of trust accounts principally included obligations to return collateral under security lending transactions. The MUFG Group has experienced no significant losses on such responsibilities and its exposure to the risk associated with the temporary payments is judged to be remote because trust account liabilities are generally covered by the corresponding trust account assets; the MUFG Group continuously monitors the liabilities of trust accounts and assesses the trust account’s ability to perform its obligations to prevent any unfavorable outcomes; and the MUFG Group claims its recourse for its temporary payments against the trust account assets and the beneficiaries.
Carrying Amount
At March 31, 2013 and 2014, the carrying amounts of the liabilities related to guarantees and similar instruments set forth above were ¥1,695,799 million and ¥1,441,092 million, respectively, which are included in Other liabilities and Trading account liabilities. The guarantees and similar instruments comprising the largest components of the total were options sold in the amount of ¥1,645,258 million and ¥1,396,178 million as of March 31, 2013 and 2014, respectively. Credit derivatives sold by the MUFG Group at March 31, 2013 and 2014 are excluded from this presentation, as they are disclosed in Note 23. In addition, Other liabilities also include an allowance for off-balance sheet instruments of ¥27,721 million and ¥35,457 million at March 31, 2013 and 2014, respectively, related to these transactions.
Performance Risk
The MUFG Group monitors performance risk of its guarantees using the same credit rating system utilized for estimating probabilities of default with its loan portfolio. The MUFG Group’s credit rating system is consistent with both the method of evaluating credit risk under Basel III and those of third-party credit rating agencies. On certain underlying referenced credits or entities, ratings are not available. Such referenced credits are included in the “Not rated” category in the following tables.
F-114
Table of Contents
MITSUBISHI UFJ FINANCIAL GROUP, INC. AND SUBSIDIARIES
NOTES TO CONSOLIDATED FINANCIAL STATEMENTS—(Continued)
Presented in the tables below is the maximum potential amount of future payments classified based upon internal credit ratings as of March 31, 2013 and 2014. The determination of the maximum potential future payments is based on the notional amount of the guarantees without consideration of possible recoveries under recourse provisions or from collateral held or pledged. Such amounts bear no relationship to the anticipated losses, if any, on these guarantees.
| Amount by borrower grade | ||||||||||||||||||||
|
At March 31, 2013: |
Maximum
potential/ Contractual or Notional amount |
Normal |
Close
Watch (1) |
Likely to
become Bankrupt or Legally/ Virtually Bankrupt (2) |
Not
rated |
|||||||||||||||
| (in billions) | ||||||||||||||||||||
|
Standby letters of credit and financial guarantees |
¥ | 3,849 | ¥ | 3,540 | ¥ | 182 | ¥ | 11 | ¥ | 116 | ||||||||||
|
Performance guarantees |
2,214 | 2,152 | 43 | 2 | 17 | |||||||||||||||
|
|
|
|
|
|
|
|
|
|
|
|||||||||||
|
Total |
¥ | 6,063 | ¥ | 5,692 | ¥ | 225 | ¥ | 13 | ¥ | 133 | ||||||||||
|
|
|
|
|
|
|
|
|
|
|
|||||||||||
| Amount by borrower grade | ||||||||||||||||||||
|
At March 31, 2014: |
Maximum
potential/ Contractual or Notional amount |
Normal |
Close
Watch (1) |
Likely to
become Bankrupt or Legally/ Virtually Bankrupt (2) |
Not
rated |
|||||||||||||||
| (in billions) | ||||||||||||||||||||
|
Standby letters of credit and financial guarantees |
¥ | 3,774 | ¥ | 3,500 | ¥ | 171 | ¥ | 9 | ¥ | 94 | ||||||||||
|
Performance guarantees |
2,571 | 2,493 | 53 | 8 | 17 | |||||||||||||||
|
|
|
|
|
|
|
|
|
|
|
|||||||||||
|
Total |
¥ | 6,345 | ¥ | 5,993 | ¥ | 224 | ¥ | 17 | ¥ | 111 | ||||||||||
|
|
|
|
|
|
|
|
|
|
|
|||||||||||
Notes:
| (1) | Borrowers classified as Close Watch represent those that require close monitoring as the borrower has begun to exhibit elements of potential concern with respect to its business performance and financial condition, the borrower has begun to exhibit elements of serious concern with respect to its business performance and financial condition, including business problems requiring long-term solutions, or the borrower’s loans are TDRs or loans contractually past due 90 days or more for special reasons. |
| (2) | Borrowers classified as Likely to become Bankrupt or Legally/Virtually Bankrupt represent those that have a higher probability of default than those categorized as Close Watch due to serious debt repayment problems with poor progress in achieving restructuring plans, the borrower being considered virtually bankrupt with no prospects for an improvement in business operations, or the borrower being legally bankrupt with no prospects for continued business operations because of non-payment, suspension of business, voluntary liquidation or filing for legal liquidation. |
The guarantees the MUFG Group does not classify based upon internal credit ratings are as follows.
The MUFG Group records all derivative contracts at fair value. Aggregate market risk limits have been established, and market risk measures are routinely monitored against these limits. The MUFG Group also manages its exposure to these derivative contracts through a variety of risk mitigation strategies, including, but not limited to, offsetting economic hedge positions. The MUFG Group expects the risk of loss to be remote and believes that the notional amounts of the derivative contracts generally exceed its exposure.
Liabilities of trust accounts represent the trustee’s potential responsibility for temporary payments to creditors of liabilities of trust accounts making use of funds of the MUFG Group. The MUFG Group has experienced no significant losses on such responsibilities and its exposure to the risk associated with the temporary payments is judged to be remote because trust account liabilities are generally covered by the corresponding trust account assets.
F-115
Table of Contents
MITSUBISHI UFJ FINANCIAL GROUP, INC. AND SUBSIDIARIES
NOTES TO CONSOLIDATED FINANCIAL STATEMENTS—(Continued)
The MUFG Group conducts securities lending transactions for institutional customers as a fully disclosed agent. At times, securities lending indemnifications are issued to guarantee that a security lending customer will be made whole in the event the borrower does not return the security subject to the lending agreement and collateral held is insufficient to cover the market value of the security. All lending transactions are collateralized, primarily by cash. At March 31, 2014, the MUFG Group had no exposure that would require it to pay under this securities lending indemnification, since the collateral market value exceeds the securities lent.
Other Off-balance Sheet Instruments
In addition to obligations under guarantees and similar arrangements set forth above, the MUFG Group issues other off-balance sheet instruments to meet the financial needs of its customers and for purposes other than trading. Such off-balance sheet instruments consist of lending-related commitments, including commitments to extend credit and commercial letters of credit that the MUFG Group provides to meet the financing needs of its customers. Once the MUFG Group issues these financial instruments, the MUFG Group is required to extend credit to or make certain payments to the customers or beneficiaries specified pursuant to the underlying contracts unless otherwise provided in the contracts. Since many of these commitments expire without being drawn upon, the total commitment amounts do not necessarily represent future cash requirements. At March 31, 2014, approximately 68% of these commitments will expire within one year, 30% from one year to five years and 2% after five years. The table below presents the contractual amounts with regard to such instruments at March 31, 2013 and 2014:
| 2013 | 2014 | |||||||
| (in billions) | ||||||||
|
Commitments to extend credit |
¥ | 66,702 | ¥ | 72,240 | ||||
|
Commercial letters of credit |
706 | 855 | ||||||
|
Commitments to make investments |
94 | 81 | ||||||
|
Other |
— | 21 | ||||||
Commitments to extend credit, which generally have fixed expiration dates or other termination clauses, are legally binding agreements to lend to customers. Commitments are different from guarantees in that the commitments are generally revocable or have provisions that enable the MUFG Group to avoid payments in the event of violations of any conditions of the contracts and certain deterioration of the potential borrowers’ financial condition.
Commercial letters of credit, generally used for trade transactions, are typically secured by the underlying goods. The MUFG Group continually monitors the type and amount of collateral and other securities, and requires counterparties to provide additional collateral or guarantors as necessary.
Commitments to make investments are legally binding contracts to make additional contributions to corporate recovery or private equity investment funds in accordance with limited partnership agreements. Some of these funds, in which the MUFG Group has significant variable interests, are described in Note 25.
F-116
Table of Contents
MITSUBISHI UFJ FINANCIAL GROUP, INC. AND SUBSIDIARIES
NOTES TO CONSOLIDATED FINANCIAL STATEMENTS—(Continued)
| 25. | VARIABLE INTEREST ENTITIES |
In the normal course of business, the MUFG Group has financial interests and other contractual obligations in various entities which may be deemed to be VIEs such as asset-backed conduits, various investment funds, special purpose entities created for structured financing, repackaged instruments, entities created for the securitization of the MUFG Group’s assets, and trust arrangements.
The following tables present the assets and liabilities of consolidated VIEs recorded on the accompanying consolidated balance sheets at March 31, 2013 and 2014:
|
Consolidated VIEs |
Consolidated assets | |||||||||||||||||||||||||||
|
At March 31, 2013: |
Total |
Cash and
due from banks |
Interest-earning
deposits in other banks |
Trading
account assets |
Investment
securities |
Loans |
All other
assets |
|||||||||||||||||||||
| (in millions) | ||||||||||||||||||||||||||||
|
Asset-backed conduits |
¥ | 5,641,295 | ¥ | 25,520 | ¥ | 72,968 | ¥ | 966 | ¥ | 601,444 | ¥ | 4,927,509 | ¥ | 12,888 | ||||||||||||||
|
Investment funds |
2,567,049 | 47,176 | 18,113 | 2,322,430 | 8,643 | 173 | 170,514 | |||||||||||||||||||||
|
Special purpose entities created for structured financing |
175,627 | 1,427 | 2,188 | — | — | 156,903 | 15,109 | |||||||||||||||||||||
|
Repackaged instruments |
56,902 | — | — | 54,154 | — | 2,748 | — | |||||||||||||||||||||
|
Securitization of the MUFG Group’s assets |
1,756,940 | — | — | — | — | 1,720,066 | 36,874 | |||||||||||||||||||||
|
Trust arrangements |
1,006,961 | — | 3,601 | 277 | 91,707 | 909,146 | 2,230 | |||||||||||||||||||||
|
Others |
100,013 | 295 | 681 | — | 85 | 64,948 | 34,004 | |||||||||||||||||||||
|
|
|
|
|
|
|
|
|
|
|
|
|
|
|
|||||||||||||||
|
Total consolidated assets before elimination |
11,304,787 | 74,418 | 97,551 | 2,377,827 | 701,879 | 7,781,493 | 271,619 | |||||||||||||||||||||
|
The amounts eliminated in consolidation |
(1,127,690 | ) | (71,726 | ) | (71,464 | ) | (1,237 | ) | (6 | ) | (966,616 | ) | (16,641 | ) | ||||||||||||||
|
|
|
|
|
|
|
|
|
|
|
|
|
|
|
|||||||||||||||
|
Total consolidated assets |
¥ | 10,177,097 | ¥ | 2,692 | ¥ | 26,087 | ¥ | 2,376,590 | ¥ | 701,873 | ¥ | 6,814,877 | ¥ | 254,978 | ||||||||||||||
|
|
|
|
|
|
|
|
|
|
|
|
|
|
|
|||||||||||||||
F-117
Table of Contents
MITSUBISHI UFJ FINANCIAL GROUP, INC. AND SUBSIDIARIES
NOTES TO CONSOLIDATED FINANCIAL STATEMENTS—(Continued)
| Consolidated liabilities | ||||||||||||||||||||
| Total | Deposits |
Other short-term
borrowings |
Long-term
debt |
All other
liabilities |
||||||||||||||||
| (in millions) | ||||||||||||||||||||
|
Asset-backed conduits |
¥ | 5,645,471 | ¥ | — | ¥ | 4,868,648 | ¥ | 330,171 | ¥ | 446,652 | ||||||||||
|
Investment funds |
232,533 | — | 1,348 | 12,246 | 218,939 | |||||||||||||||
|
Special purpose entities created for structured financing |
173,928 | — | 5,241 | 166,810 | 1,877 | |||||||||||||||
|
Repackaged instruments |
57,452 | — | — | 56,236 | 1,216 | |||||||||||||||
|
Securitization of the MUFG Group’s assets |
1,741,837 | — | 25,000 | 1,715,823 | 1,014 | |||||||||||||||
|
Trust arrangements |
1,003,916 | 1,001,815 | — | — | 2,101 | |||||||||||||||
|
Others |
99,505 | — | 64,216 | 35,143 | 146 | |||||||||||||||
|
|
|
|
|
|
|
|
|
|
|
|||||||||||
|
Total consolidated liabilities before elimination |
8,954,642 | 1,001,815 | 4,964,453 | 2,316,429 | 671,945 | |||||||||||||||
|
The amounts eliminated in consolidation |
(4,251,981 | ) | — | (3,078,982 | ) | (1,146,963 | ) | (26,036 | ) | |||||||||||
|
The amount of liabilities with recourse to the general credit of MUFG Group |
(3,117,515 | ) | (1,001,815 | ) | (1,845,698 | ) | (2,772 | ) | (267,230 | ) | ||||||||||
|
|
|
|
|
|
|
|
|
|
|
|||||||||||
|
Liabilities of consolidated VIEs for which creditors or beneficial interest holders do not have recourse to the general credit of the MUFG Group |
¥ | 1,585,146 | ¥ | — | ¥ | 39,773 | ¥ | 1,166,694 | ¥ | 378,679 | ||||||||||
|
|
|
|
|
|
|
|
|
|
|
|||||||||||
|
Consolidated VIEs |
Consolidated assets | |||||||||||||||||||||||||||
|
At March 31, 2014: |
Total |
Cash and
due from banks |
Interest-earning
deposits in other banks |
Trading
account assets |
Investment
securities |
Loans |
All other
assets |
|||||||||||||||||||||
| (in millions) | ||||||||||||||||||||||||||||
|
Asset-backed conduits |
¥ | 6,202,924 | ¥ | 30,484 | ¥ | 117,116 | ¥ | 1,783 | ¥ | 762,103 | ¥ | 5,277,749 | ¥ | 13,689 | ||||||||||||||
|
Investment funds |
2,433,575 | 46,198 | 36,076 | 2,190,419 | 10,270 | — | 150,612 | |||||||||||||||||||||
|
Special purpose entities created for structured financing |
257,874 | 1,840 | 2,794 | — | — | 236,115 | 17,125 | |||||||||||||||||||||
|
Repackaged instruments |
29,296 | — | — | 29,296 | — | — | — | |||||||||||||||||||||
|
Securitization of the MUFG Group’s assets |
1,473,901 | — | — | — | — | 1,439,002 | 34,899 | |||||||||||||||||||||
|
Trust arrangements |
1,325,602 | — | 1,528 | 139 | 95,339 | 1,226,221 | 2,375 | |||||||||||||||||||||
|
Others |
84,882 | 342 | 680 | — | 73 | 48,914 | 34,873 | |||||||||||||||||||||
|
|
|
|
|
|
|
|
|
|
|
|
|
|
|
|||||||||||||||
|
Total consolidated assets before elimination |
11,808,054 | 78,864 | 158,194 | 2,221,637 | 867,785 | 8,228,001 | 253,573 | |||||||||||||||||||||
|
The amounts eliminated in consolidation |
(1,428,412) | (75,697) | (125,036) | (1,883) | (6) | (1,208,348) | (17,442) | |||||||||||||||||||||
|
|
|
|
|
|
|
|
|
|
|
|
|
|
|
|||||||||||||||
|
Total consolidated assets |
¥ | 10,379,642 | ¥ | 3,167 | ¥ | 33,158 | ¥ | 2,219,754 | ¥ | 867,779 | ¥ | 7,019,653 | ¥ | 236,131 | ||||||||||||||
|
|
|
|
|
|
|
|
|
|
|
|
|
|
|
|||||||||||||||
F-118
Table of Contents
MITSUBISHI UFJ FINANCIAL GROUP, INC. AND SUBSIDIARIES
NOTES TO CONSOLIDATED FINANCIAL STATEMENTS—(Continued)
| Consolidated liabilities | ||||||||||||||||||||
| Total | Deposits |
Other short-term
borrowings |
Long-term
debt |
All other
liabilities |
||||||||||||||||
| (in millions) | ||||||||||||||||||||
|
Asset-backed conduits |
¥ | 6,227,784 | ¥ | — | ¥ | 5,239,304 | ¥ | 467,005 | ¥ | 521,475 | ||||||||||
|
Investment funds |
87,702 | — | — | 422 | 87,280 | |||||||||||||||
|
Special purpose entities created for structured financing |
174,055 | — | 1,993 | 169,231 | 2,831 | |||||||||||||||
|
Repackaged instruments |
29,181 | — | — | 29,000 | 181 | |||||||||||||||
|
Securitization of the MUFG Group’s assets |
1,452,857 | — | 23,800 | 1,428,202 | 855 | |||||||||||||||
|
Trust arrangements |
1,322,103 | 1,320,209 | — | — | 1,894 | |||||||||||||||
|
Others |
84,527 | — | 48,368 | 36,025 | 134 | |||||||||||||||
|
|
|
|
|
|
|
|
|
|
|
|||||||||||
|
Total consolidated liabilities before elimination |
9,378,209 | 1,320,209 | 5,313,465 | 2,129,885 | 614,650 | |||||||||||||||
|
The amounts eliminated in consolidation |
(4,196,910 | ) | — | (2,988,582 | ) | (1,163,047 | ) | (45,281 | ) | |||||||||||
|
The amount of liabilities with recourse to the general credit of MUFG Group |
(3,910,836 | ) | (1,320,209) | (2,280,662 | ) | — | (309,965 | ) | ||||||||||||
|
|
|
|
|
|
|
|
|
|
|
|||||||||||
|
Liabilities of consolidated VIEs for which creditors or beneficial interest holders do not have recourse to the general credit of the MUFG Group |
¥ | 1,270,463 | ¥ | — | ¥ | 44,221 | ¥ | 966,838 | ¥ | 259,404 | ||||||||||
|
|
|
|
|
|
|
|
|
|
|
|||||||||||
In general, the creditors or beneficial interest holders of consolidated VIEs have recourse only to the assets of those VIEs of which they are creditors or beneficial interest holders, and do not have recourse to other assets of the MUFG Group, except where the MUFG Group is also contractually required to provide credit enhancement or program-wide liquidity.
The following tables present the total assets of non-consolidated VIEs, the maximum exposure to loss resulting from the MUFG Group’s involvement with non-consolidated VIEs and the assets and liabilities which relate to the MUFG’s variable interests in non-consolidated VIEs at March 31, 2013 and 2014:
|
Non-consolidated VIEs |
On-balance sheet assets |
On-balance sheet
liabilities |
||||||||||||||||||||||||||||||||||
|
At March 31, 2013: |
Total assets |
Maximum
exposure |
Total |
Trading
account assets |
Investment
securities |
Loans |
All
other assets |
Total |
All other
liabilities |
|||||||||||||||||||||||||||
| (in millions) | ||||||||||||||||||||||||||||||||||||
|
Asset-backed conduits |
¥ | 12,926,458 | ¥ | 3,072,591 | ¥ | 2,256,903 | ¥ | 3,384 | ¥ | 363,521 | ¥ | 1,889,998 | ¥ | — | ¥ | — | ¥ | — | ||||||||||||||||||
|
Investment funds |
25,517,222 | 744,935 | 634,662 | 168,580 | 149,036 | 317,046 | — | 1,186 | 1,186 | |||||||||||||||||||||||||||
|
Special purpose entities created for structured financing |
20,978,132 | 3,048,178 | 2,346,557 | 136,118 | 85,254 | 2,124,202 | 983 | 466 | 466 | |||||||||||||||||||||||||||
|
Repackaged instruments |
13,097,513 | 1,638,067 | 1,546,726 | 106,661 | 1,181,828 | 258,237 | — | — | — | |||||||||||||||||||||||||||
|
Trust arrangements |
14,866 | 13,589 | 12,740 | — | — | 12,740 | — | 5,739 | 5,739 | |||||||||||||||||||||||||||
|
Others |
29,381,902 | 2,174,939 | 1,714,409 | 66,563 | 286,937 | 1,353,826 | 7,083 | 99 | 99 | |||||||||||||||||||||||||||
|
|
|
|
|
|
|
|
|
|
|
|
|
|
|
|
|
|
|
|||||||||||||||||||
|
Total |
¥ | 101,916,093 | ¥ | 10,692,299 | ¥ | 8,511,997 | ¥ | 481,306 | ¥ | 2,066,576 | ¥ | 5,956,049 | ¥ | 8,066 | ¥ | 7,490 | ¥ | 7,490 | ||||||||||||||||||
|
|
|
|
|
|
|
|
|
|
|
|
|
|
|
|
|
|
|
|||||||||||||||||||
F-119
Table of Contents
MITSUBISHI UFJ FINANCIAL GROUP, INC. AND SUBSIDIARIES
NOTES TO CONSOLIDATED FINANCIAL STATEMENTS—(Continued)
|
Non-consolidated VIEs |
On-balance sheet assets |
On-balance sheet
liabilities |
||||||||||||||||||||||||||||||||||
|
At March 31, 2014: |
Total assets |
Maximum
exposure |
Total |
Trading
account assets |
Investment
securities |
Loans |
All
other assets |
Total |
All other
liabilities |
|||||||||||||||||||||||||||
| (in millions) | ||||||||||||||||||||||||||||||||||||
|
Asset-backed conduits |
¥ | 16,114,320 | ¥ | 3,826,653 | ¥ | 2,879,545 | ¥ | 1,851 | ¥ | 512,835 | ¥ | 2,364,858 | ¥ | 1 | ¥ | 217 | ¥ | 217 | ||||||||||||||||||
|
Investment funds |
24,216,292 | 844,762 | 735,423 | 100,099 | 300,295 | 326,860 | 8,169 | — | — | |||||||||||||||||||||||||||
|
Special purpose entities created for structured financing |
27,811,920 | 3,305,869 | 2,586,162 | 138,023 | 84,964 | 2,361,243 | 1,932 | 1,788 | 1,788 | |||||||||||||||||||||||||||
|
Repackaged instruments |
9,106,418 | 2,132,268 | 2,034,180 | 202,209 | 1,536,859 | 295,112 | — | — | — | |||||||||||||||||||||||||||
|
Trust arrangements |
26,795 | 23,680 | 22,940 | — | — | 22,940 | — | 5,471 | 5,471 | |||||||||||||||||||||||||||
|
Others |
50,444,297 | 2,720,245 | 2,113,300 | 129,020 | 100,000 | 1,884,280 | — | 125 | 125 | |||||||||||||||||||||||||||
|
|
|
|
|
|
|
|
|
|
|
|
|
|
|
|
|
|
|
|||||||||||||||||||
|
Total |
¥ | 127,720,042 | ¥ | 12,853,477 | ¥ | 10,371,550 | ¥ | 571,202 | ¥ | 2,534,953 | ¥ | 7,255,293 | ¥ | 10,102 | ¥ | 7,601 | ¥ | 7,601 | ||||||||||||||||||
|
|
|
|
|
|
|
|
|
|
|
|
|
|
|
|
|
|
|
|||||||||||||||||||
Maximum exposure to loss on each type of entity is determined based on the carrying amount of any on-balance sheet assets and any off-balance sheet liabilities held, net of any recourse liabilities. Therefore, the maximum exposure to loss represents the maximum loss the MUFG Group could possibly incur at each balance sheet date and does not reflect the likelihood of such a loss being incurred. The difference between the amount of on-balance sheet assets and the maximum exposure to loss primarily comprises the remaining undrawn commitments.
Analysis of Each Transaction Category
Asset-Backed Conduits
This category primarily comprises the following:
Multi-Seller Conduits (MUFG-sponsored Asset-Backed Commercial Paper (“ABCP”) Conduits and Other ABCP Conduits)
The MUFG Group administers several conduits under asset-backed financing programs under which the conduits purchase financial assets, primarily trade accounts receivable, from the MUFG Group’s customers by issuing short-term financing instruments, primarily commercial paper, to third-party investors. Under the asset-backed financing programs, the MUFG Group acts as an agent for the conduits, which enter into agreements with the MUFG Group’s customers where the customers transfer financial assets to the conduits in exchange for monetary consideration. The MUFG Group also underwrites commercial paper for the conduits that is secured by the assets held by them and provides program-wide liquidity and credit enhancement facilities to the conduits. The MUFG Group receives fees related to the services it provides to the conduits and the program-wide liquidity and credit enhancement. The MUFG Group considers itself to be the primary beneficiary of the multi-seller conduits because, as an agent and sponsor, the MUFG Group has the power to direct activities of the conduits that most significantly impact the conduits’ economic performance and also has the obligation to absorb losses of the conduits that could potentially be significant to the conduits through the program-wide liquidity and credit enhancement. Consequently, the MUFG Group consolidates the conduits.
In addition to the entities described above, the MUFG Group participates as a provider of financing to several conduits that are administered by third parties. Most of these conduits are established under a multi-seller
F-120
Table of Contents
MITSUBISHI UFJ FINANCIAL GROUP, INC. AND SUBSIDIARIES
NOTES TO CONSOLIDATED FINANCIAL STATEMENTS—(Continued)
asset-backed financing program and the MUFG Group provides financing along with other financial institutions. With respect to these conduits, the MUFG Group is not considered as the primary beneficiary because the MUFG Group’s participation to the conduits is only to provide financing along with other third-party financial institutions and it does not have the power to direct the activities of the conduits. Consequently, the MUFG Group does not consolidate the conduits.
Asset-Backed Conduits (MUFG-sponsored Asset-Backed Loan (“ABL”) Programs and Other Programs)
The MUFG Group administers several conduits under asset-backed financing programs where the MUFG Group provides financing to fund the conduits’ purchases of financial assets, comprising primarily trade accounts receivable, from its customers. The MUFG Group acts as an agent and sponsor for the conduits, which enter into agreements with the MUFG Group’s customers where the customers transfer assets to the conduits in exchange for monetary consideration. In most cases the MUFG Group is the sole provider of financing that is secured by the assets held by the conduits. The MUFG Group considers itself to be the primary beneficiary of the conduits because, as an agent and sponsor for the conduits, the MUFG Group has the power to direct activities of the conduits, such as selection of the assets to be purchased and condition for purchases, and debt collection from the original obligors, that most significantly impact the conduits’ economic performance, and also has the obligation to absorb losses of the conduits that could potentially be significant to the conduits through financing it provides. Consequently, the MUFG Group consolidates the conduits.
In addition, the MUFG Group is involved with entities, which take in most cases the form of a trust, where originators of financial assets, which primarily comprise lease receivables, entrust the assets with trust banks and receive beneficial certificates in trusts in exchange. The originators then transfer the beneficiary certificates to the MUFG Group in exchange for cash. The originators of the financial assets entrusted continue to be involved in the assets as servicers. Because the originators are deemed to have the power to direct activities of the entities that most significantly impact the entities’ economic performance through their role as a servicer, the MUFG Group is not considered as the primary beneficiary of these entities. Consequently, the MUFG Group does not consolidate these entities.
The MUFG Group also participates as a provider of financing to the ABL programs that are managed by third parties. The MUFG Group is not considered as the primary beneficiary of the entities used in these programs as the MUFG Group’s participation to the entities is only to provide financing with other third parties and it does not have the power to direct the activities of the conduits. Consequently, the MUFG Group does not consolidate the entities used in these programs.
Investment Funds
On February 2010, the FASB issued an accounting standards update that indefinitely defers the application of the current guidance for consolidation of VIEs on entities that are deemed as investment companies, which include most of corporate recovery funds, private equity funds, and investment trusts. For VIEs that are considered investment companies, the MUFG Group determines whether it is the primary beneficiary by evaluation of whether it absorbs a majority of expected losses, receives a majority of expected residual returns, or both.
This category primarily comprises the following:
Corporate Recovery Funds
These entities are established by fund managers, which are unrelated to the MUFG Group, for the purpose of investing in debt or equity instruments issued by distressed companies. After investment, the fund managers
F-121
Table of Contents
MITSUBISHI UFJ FINANCIAL GROUP, INC. AND SUBSIDIARIES
NOTES TO CONSOLIDATED FINANCIAL STATEMENTS—(Continued)
work closely with the management of the issuers and attempt to enhance corporate value by various means including corporate restructuring and reorganization. Their exit strategies include, among others, sales to others and initial public offerings.
Typically, these entities take the form of a limited partnership which is entirely funded by general and limited partner interests. In some cases, the general partners of the partnerships are entities that have no substantive decision making ability. The fund managers that establish these partnerships assume investment management and day-to-day operation by entering into asset management contracts with the general partners. These partnerships are, therefore, financing vehicles and as such are considered as VIEs. In other cases, the general partners have substantive decision making ability but the partnerships are considered as VIEs when the general partners’ equity investments in the partnerships are considered as non-substantive, usually based on the percentage interest held, and they do not have substantive limited partner interests.
The MUFG Group mostly serves as a limited partner in corporate recovery funds. While the MUFG Group’s share in partnership interest is generally insignificant, in certain cases, the MUFG Group is the only limited partner and it consolidates these partnerships as the primary beneficiary.
Private Equity Funds
The MUFG Group is involved in venture capital funds that are established by either the MUFG Group’s entities or fund managers unrelated to the MUFG Group. These entities have specific investment objectives in connection with their acquisition of equity interests, such as providing financing and other support to start-up businesses, medium and small entities in a particular geographical area, and to companies with certain technology or companies in a high-growth industry.
These entities typically take the form of a limited partnership and usually are entirely funded by general and limited partner interests. The general partners of the partnerships in some cases are entities that have no substantive decision making ability. The fund managers that establish these partnerships assume investment management and day-to-day operation by entering into asset management contracts with the general partners. These partnerships are, therefore, financing vehicles and as such are considered as VIEs. In other cases, the general partners have substantive decision making ability but the partnerships are considered VIEs because the general partners’ equity investments in the partnerships are disproportionate to their voting rights and the limited partners have the majority of the economics without any voting rights. The MUFG Group consolidates the private equity funds when it owns a majority of the interests issued by the private equity funds.
The MUFG Group participates in these partnerships as a general partner or limited partner. While the MUFG Group’s share in partnership interests is generally limited, in certain cases, the MUFG Group provides most of the financing to the partnership. The MUFG Group consolidates these funds as the primary beneficiary because it absorbs a majority of the expected losses or receives a majority of the expected residual returns.
Investment Trusts
The MUFG Group invests in investment trusts that are professionally managed collective investment schemes which pool money from many investors and invest in, among others, equity and debt securities. Most of these funds take the form of a trust where there is a separation in investment decisions, which is assumed by an investment manager who has no investment in a trust, and ownership through beneficiary interests issued by a trust are owned by investors. Therefore, these investment trusts are considered as VIEs. Based on the deferral requirements of the current guidance, the MUFG Group consolidates investment trusts when it absorbs a majority of the expected losses or receives a majority of the expected residual returns.
F-122
Table of Contents
MITSUBISHI UFJ FINANCIAL GROUP, INC. AND SUBSIDIARIES
NOTES TO CONSOLIDATED FINANCIAL STATEMENTS—(Continued)
Buy-out Financing Vehicles
The MUFG Group provides financing to buy-out vehicles. The buy-out vehicles are established by equity investments from, among others, private equity funds or the management of target companies for the purpose of purchasing the equity shares of target companies. Along with other financial institutions, the MUFG Group provides financing to the buy-out vehicles in the form of loans. While the buy-out vehicles’ equity is normally substantive in its amount and the rights and obligations associated with it, in some cases, the vehicles have equity that is insufficient to absorb expected variability primarily because the amount provided by equity investors is nominal in nature. These vehicles engage in non-investment activities, and are considered as VIEs. Assessment as to whether the MUFG Group is the primary beneficiary is required under the current guidance. In most cases, the MUFG Group’s participation to these vehicles is only to provide financing to the vehicles, and the power to direct the activities that most significantly impact the economic performance of the vehicles is held by the management of target companies. As a result, the MUFG Group is not considered as the primary beneficiary of these vehicles and does not consolidate them.
Other Investment Funds
The MUFG Group’s investments in VIEs through MUAH primarily consist of equity investments in low income housing credit (“LIHC”) structures, designed to generate a return primarily through the realization of federal tax credits. MUAH considers itself as the primary beneficiary of certain types of LIHC investments.
LIHC Unguaranteed Syndicated Investment Funds
MUAH creates the investment funds, serves as the managing investor member, and sells limited investor member interests to third parties. MUAH receives benefits through income from the structuring of these funds, servicing fees for managing the funds and, as an investor member, tax benefits and tax credits to reduce the MUAH tax liability. MUAH considers itself to be the primary beneficiary and consolidated them upon adoption of the current guidance because, as a sponsor and managing member of the funds, it has the power to direct activities that most significantly impact the funds’ economic performance and also has the obligation to absorb losses of the funds that could potentially be significant to the funds.
LIHC Guaranteed Syndicated Investment Funds
MUAH also forms limited liability companies, which in turn invest in LIHC operating partnerships, to create LIHC guaranteed syndicated investment funds. Interests in these funds are sold to third parties who pay a premium for a guaranteed return. MUAH earns structuring fees from the sale of these funds and asset management fees. MUAH serves as the funds’ sponsor and non-member asset manager, and also guarantees a minimum rate of return throughout the investment term, therefore, it directs the activities that most significantly impact the funds’ economic performance and also has an obligation to absorb losses pertaining to its minimum rate of return guarantee to investors. Therefore, the MUFG Group is considered as the primary beneficiary of these funds and consolidates them.
Special Purpose Entities Created for Structured Financing
This category primarily comprises the following:
Leveraged Leasing Vehicles
These entities are established to raise funds to purchase or build equipment and machinery including, among others, commercial vessels, passenger and cargo aircraft, and production equipment for the purpose of leasing
F-123
Table of Contents
MITSUBISHI UFJ FINANCIAL GROUP, INC. AND SUBSIDIARIES
NOTES TO CONSOLIDATED FINANCIAL STATEMENTS—(Continued)
them to lessees who use the equipment and machinery as part of their business operations. These entities typically take the form of a limited partnership or a special purpose company where they fund their purchases of equipment and machinery via senior and subordinate financing. In some cases, the entities are funded only by senior financing or there is a guarantee provided to the senior financing by parties unrelated to those providing the senior financing. In most cases, the MUFG Group participates in the senior financing and does not participate in the subordinate financing or provide guarantees. Generally, because the MUFG Group’s participation in these entities is only to provide financing, it does not have the power to direct the activities of the entities that most significantly impact the economic performance of the entities. Therefore, the MUFG Group does not consider itself to be the primary beneficiary of these entities and does not consolidate them, except for limited circumstances where the MUFG Group is directly involved with the structuring of the transaction and has the power to direct the activities of the entities that most significantly impact the economic performance of the entities.
Project Financing Vehicles
These entities are established to raise funds in connection with, among others, production of natural resources, construction and development of urban infrastructure (including power plants and grids, highways and ports), and the development of real estate properties or complexes. These projects typically involve special purpose companies which issue senior and subordinate financing to raise funds in connection with the various projects. The subordinate financing is usually provided by parties that will ultimately make use of the assets constructed or developed. By contrast, the senior financing is typically provided by financial institutions, including the MUFG Group. Because the MUFG Group’s participation to these entities is only to provide financing, it does not have the power to direct the activities that most significantly impact the economic performance of these entities. Therefore, the MUFG Group is not considered as the primary beneficiary of these entities and does not consolidate them.
Sale and Leaseback Vehicles
The MUFG Group is involved with vehicles that acquire assets, primarily real estate, from the MUFG Group’s clients and other unrelated parties where the sellers of the assets continue to use the assets through leaseback agreements. These vehicles typically take the form of a limited partnership where the general partner effectively has no power to direct the activities that most significantly impact the economic performance because an equity holder of the general partner serves a perfunctory role. Therefore, these vehicles are considered as VIEs. The subordinated financing of these vehicles is usually provided by the sellers of the assets, with the MUFG Group providing senior financing for the vehicles. Because the MUFG Group’s participation to these vehicles is only to provide financing, it does not have the power to direct the activities that most significantly impact the economic performance of these entities. Therefore, the MUFG Group is not considered as the primary beneficiary and does not consolidate them.
Securitization of Client Real Estate Properties
These entities are established for the purpose of securitizing real estate properties held by the MUFG Group’s customers. In most cases, these entities take the form of a limited partnership or a special purpose company. These entities are designed to have non-substantive power to direct the activities that most significantly impact the economic performance because the general partner or an equity holder serves a perfunctory role. The entities are typically funded by senior and subordinated financing where the original owners of the properties provide the subordinated financing, primarily in the form of partnership interests or subordinated notes, and financial institutions, including the MUFG Group, provide senior financing in the form
F-124
Table of Contents
MITSUBISHI UFJ FINANCIAL GROUP, INC. AND SUBSIDIARIES
NOTES TO CONSOLIDATED FINANCIAL STATEMENTS—(Continued)
of senior loans. Because the MUFG Group’s participation to these vehicles is only to provide financing, it does not have the power to direct the activities that most significantly impact the economic performance of these entities. Therefore, the MUFG Group is not considered as the primary beneficiary and does not consolidate these entities.
Repackaged Instruments
This category primarily comprises the following:
Investments in Financially-Engineered Products
The MUFG Group is involved in special purpose entities that have been established to issue financial products through the engineering and repackaging of existing financial instruments, such as CDOs and synthetic CDOs. These special purpose entities are considered as VIEs because the holders of the equity investment at risk do not have the power to direct the activities that most significantly impact the economic performance. These special purpose entities are generally arranged and managed by parties that are not related to the MUFG Group. The MUFG Group’s involvement with the entities arranged and managed by third parties is for investment purposes. In these cases, the MUFG Group participates as one of many other investors and the MUFG Group typically holds investments in senior tranches or tranches with high credit ratings. Therefore, the MUFG Group does not have the power to direct activities of the entities that most significantly impact the entities’ economic performance, and thus is not considered as the primary beneficiary of these entities and does not consolidate these entities.
In certain instances, special purpose entities have been established and are managed by the MUFG Group. The MUFG Group’s involvement includes establishing and arranging the transaction and underwriting securities issued by the entities to general investors. For these entities, the MUFG Group has the power to direct activities that most significantly impact the economic performance and it has the obligation to absorb losses or receive benefits that could potentially be significant to the entities. As such, the MUFG Group considers itself as the primary beneficiary of these entities and consolidates them.
Investments in Securitized Financial Instruments
The MUFG Group holds investments in special purpose entities that issue securitized financial products. The assets held by the special purpose entities include credit card receivables and residential mortgage loans. These entities are established and managed by parties that are unrelated to the MUFG Group and the MUFG Group’s involvement with these entities is for its own investment purposes. In all cases, the MUFG Group participates as one of many other investors and the MUFG Group does not have the power to direct activities of the entities that most significantly impact the entities’ economic performance. Therefore, the MUFG Group is not considered as the primary beneficiary of these entities and does not consolidate them.
Securitization of the MUFG Group’s Assets
The MUFG Group establishes entities to securitize its own financial assets that include, among others, corporate and retail loans and lease receivables. The entities used for securitization, which typically take the form of a special purpose company or a trust, are established by the MUFG Group and, in most cases, issue senior and subordinate interests or financing. After securitization, the MUFG Group typically continues to service securitized assets as a servicer. The MUFG Group may also retain subordinate interests or financing or other interests. The MUFG Group is considered as the primary beneficiary and consolidates the entities used for
F-125
Table of Contents
MITSUBISHI UFJ FINANCIAL GROUP, INC. AND SUBSIDIARIES
NOTES TO CONSOLIDATED FINANCIAL STATEMENTS—(Continued)
securitization since it has the obligation to absorb losses through subordinate interests, and also has the power for determining and implementing of policies as servicer that give it the ability to manage the entities’ assets that become delinquent or are in default in order to improve the economic performance of the entities.
Trust Arrangements
The MUFG Group offers, primarily through its wholly-owned trust banking subsidiary, MUTB, a variety of trust products and services including securities investment trusts, pension trusts and trusts used as securitization vehicles. In a typical trust arrangement, however, the MUFG Group manages and administers assets on behalf of the customers in an agency, fiduciary and trust capacity and does not assume risks associated with the entrusted assets. The trusts are generally considered as VIEs because the trust beneficiaries, who provide all of the equity at risk, usually do not have power to direct the activities that most significantly impact its economic performance in the arrangements. The MUFG Group, however, is not considered as the primary beneficiary, except for the case mentioned below, because it merely receives fees for compensation of its services on terms that are customary for these activities and the fees are insignificant relative to the total amount of the entities’ economic performance and variability. Therefore, the MUFG Group does not consolidate these entities.
With respect to the jointly operated designated money in trusts, MUTB pools money from investors or trust beneficiaries and determines how best to invest it. MUTB typically invests in high-quality financial assets, including government bonds, corporate bonds and corporate loans including loans to MUTB and receives fees as compensation for services. In this role as a sponsor of these products, MUTB provides guarantees under which it is required to compensate a loss on the stated principal of the trust beneficial interests. MUTB is considered as the primary beneficiary of these products because it is exposed to a potentially significant amount of losses and also has the power to direct activities of these products that most significantly impact the economic performance. Upon consolidation of the jointly operated designated money in trusts, the certificates issued to the trust beneficiaries are accounted for as deposit liabilities as the products are structured and marketed to customers similar to MUTB’s term deposit products.
MUTB considers the likelihood of incurring losses on the face value guarantee to be highly remote. In the trusts’ operational history that extends over decades, the face value guarantee has never been called upon. The variability in fair value of the net assets of jointly operated designated money in trusts has been primarily affected by the fluctuations in interest rates, and the majority of such variability has been absorbed by general investors.
Others
This category primarily comprises the following:
Financing Vehicles of the MUFG Group’s Customers
The MUFG Group is involved with several entities that are established by the MUFG Group’s customers. These entities borrow funds from financial institutions and extend loans to their group entities. These entities effectively work as fund-raising vehicles for their respective group companies and enable the groups to achieve efficient financing by integrating their financing activities into a single entity. In all cases the MUFG Group is not considered as the primary beneficiary because the MUFG Group’s participation to these entities is only to provide financing, and the customers effectively hold the power to direct activities of these entities that most significantly impact the economic performance of the entities. Consequently, the MUFG Group does not consolidate these entities.
F-126
Table of Contents
MITSUBISHI UFJ FINANCIAL GROUP, INC. AND SUBSIDIARIES
NOTES TO CONSOLIDATED FINANCIAL STATEMENTS—(Continued)
Funding Vehicles
The MUFG Group has established several wholly-owned, off-shore vehicles which issue securities, typically preferred stock that is fully guaranteed by the MUFG Group, to investors unrelated to the MUFG Group to fund purchases of debt instruments issued by the MUFG Group. These entities are considered as VIEs because the MUFG Group’s investment in the vehicles’ equity is not considered at risk and substantive as the entire amount raised by the vehicles was used to purchase debt instruments issued by the MUFG Group. Because the MUFG Group does not have variable interests in these financing vehicles, these financing vehicles are not considered as the MUFG Group’s subsidiaries.
Troubled Borrowers
During the normal course of business, the borrowers from the MUFG Group may experience financial difficulties and sometimes enter into certain transactions that require the MUFG Group to assess whether they would be considered as VIEs due to their difficult financial position. While in most cases such borrowers are not considered as VIEs when the transactions take place, in limited circumstances they are considered as VIEs due to insufficient equity investment at risk. In all cases, however, the MUFG Group is not considered as the primary beneficiary because the power to direct activities that most significantly impact the economic performance of the troubled borrowers resides with management of the troubled borrowers, and the MUFG Group, as a lender, does not have power over or assume any role in management. Therefore, the MUFG Group does not consolidate these troubled borrowers.
| 26. | COMMITMENTS AND CONTINGENT LIABILITIES |
Lease Commitments
The MUFG Group leases certain technology systems, office space and equipment under noncancelable agreements expiring through the fiscal year 2046.
Future minimum rental commitments for noncancelable leases at March 31, 2014 were as follows:
|
Capitalized
leases |
Operating
leases |
|||||||
| (in millions) | ||||||||
|
Fiscal year ending March 31: |
||||||||
|
2015 |
¥ | 7,640 | ¥ | 85,660 | ||||
|
2016 |
4,561 | 71,855 | ||||||
|
2017 |
3,271 | 63,872 | ||||||
|
2018 |
1,640 | 59,021 | ||||||
|
2019 |
893 | 53,614 | ||||||
|
2020 and thereafter |
4,642 | 390,208 | ||||||
|
|
|
|
|
|||||
|
Total minimum lease payments |
22,647 | ¥ | 724,230 | (1) | ||||
|
|
|
|||||||
|
Amount representing interest |
(2,528 | ) | ||||||
|
|
|
|||||||
|
Present value of minimum lease payments |
¥ | 20,119 | ||||||
|
|
|
|||||||
Note:
| (1) | One of MUFG’s subsidiaries has entered into non-cancelable operating lease agreements which will commence in April, 2016. The total minimum lease payments of ¥30,247 million under these commitments have been included in the above. |
Total rental expense for the fiscal years ended March 31, 2012, 2013 and 2014 was ¥97,105 million, ¥99,817 million and ¥103,754 million, respectively.
F-127
Table of Contents
MITSUBISHI UFJ FINANCIAL GROUP, INC. AND SUBSIDIARIES
NOTES TO CONSOLIDATED FINANCIAL STATEMENTS—(Continued)
Repayment of Excess Interest
The Japanese government implemented regulatory reforms affecting the consumer lending industry. In December 2006, the Diet passed legislation to reduce the maximum permissible interest rate under the Investment Deposit and Interest Rate Law from 29.2% per annum to 20% per annum. The reduction in interest rates was implemented in June 2010. The regulatory reforms also included amendments to the Money Lending Business Act which, effective June 18, 2010, abolished the so-called “gray-zone interest.” Gray-zone interest refers to interest rates exceeding the limits stipulated by the Interest Rate Restriction Act (between 15% per annum to 20% per annum depending on the amount of principal). Under the regulatory reforms, all interest rates for loans originated after this reform are subject to the lower limits imposed by the Interest Rate Restriction Act. Furthermore, the new regulations require stringent review procedures for consumer finance companies before lending, and with the exception of certain provisions, one of those new regulations introduces a limit on aggregate credit extensions to one-third of the borrower’s annual income.
Formerly, consumer finance companies were able to charge interest rates exceeding the limits stipulated by the Interest Rate Restriction Act so long as the payment was made voluntarily by the borrowers, and the lender complied with various notice and other requirements. Accordingly, MUFG’s consumer finance subsidiaries and equity method investees offered loans at interest rates above the Interest Rate Restriction Act. Upon the implementation of the regulatory reforms in June 2010, they lowered the interest rates for loans originated after this reform to below the Interest Rate Restriction Act.
In 2006, the Supreme Court of Japan passed decisions in a manner more favorable to borrowers requiring reimbursement of previously paid interest exceeding the limits stipulated by the Interest Rate Restriction Act in certain circumstances. Borrowers’ claims for reimbursement of excess interest arose after such decisions and other regulatory changes. The MUFG Group maintains an allowance for repayment of excess interest based on an analysis of past experience of reimbursement of excess interest, borrowers’ profile, recent trend of borrowers’ claims for reimbursement, and management future forecasts. Management believes that the provision for repayment of excess interest is adequate and the allowance is at the appropriate amount to absorb probable losses, so that the impact of future claims for reimbursement of excess interest will not have a material adverse effect on the MUFG Group’s financial position and results of operations. The allowance for repayment of excess interest established by MUFG’s consumer finance subsidiaries, which was included in Other liabilities, was ¥77,640 million and ¥54,068 million as of March 31, 2013 and 2014, respectively. Provision (reversal) related to the allowance is included in Other non-interest expenses in the accompanying consolidated statements of income. For the fiscal years ended March 31, 2012, 2013 and 2014, an MUFG’s equity method investee had a negative impact of ¥19,326 million, ¥17,014 million and ¥18,014 million, respectively, on Equity in earnings (losses) of equity method investees—net in the accompanying consolidated statements of income.
Litigation
The MUFG Group is subject to various litigation matters. Based upon the current knowledge and the results of consultation with counsel, liabilities for losses from litigation matters are recorded when they are determined to be both probable in their occurrences and can be reasonably estimated. Management believes that the eventual outcome of such litigation matters will not have a material adverse effect on the MUFG Group’s financial position, results of operations or cash flows.
F-128
Table of Contents
MITSUBISHI UFJ FINANCIAL GROUP, INC. AND SUBSIDIARIES
NOTES TO CONSOLIDATED FINANCIAL STATEMENTS—(Continued)
| 27. | FEES AND COMMISSIONS INCOME |
Details of fees and commissions income for the fiscal years ended March 31, 2012, 2013 and 2014 were as follows:
| 2012 | 2013 | 2014 | ||||||||||
| (in millions) | ||||||||||||
|
Trust fees |
¥ | 95,037 | ¥ | 92,525 | ¥ | 105,721 | ||||||
|
Fees on funds transfer and service charges for collections |
139,840 | 137,338 | 139,974 | |||||||||
|
Fees and commissions on international business |
57,688 | 58,905 | 68,273 | |||||||||
|
Fees and commissions on credit card business |
149,946 | 149,671 | 157,227 | |||||||||
|
Service charges on deposits |
18,216 | 16,727 | 20,451 | |||||||||
|
Fees and commissions on securities business |
128,436 | 155,983 | 221,791 | |||||||||
|
Fees on real estate business |
23,610 | 28,041 | 34,715 | |||||||||
|
Insurance commissions |
33,686 | 33,472 | 39,669 | |||||||||
|
Fees and commissions on stock transfer agency services |
49,283 | 49,137 | 49,394 | |||||||||
|
Guarantee fees |
58,393 | 55,427 | 52,634 | |||||||||
|
Fees on investment funds business |
126,601 | 130,006 | 155,572 | |||||||||
|
Other fees and commissions |
219,227 | 253,642 | 248,695 | |||||||||
|
|
|
|
|
|
|
|||||||
|
Total |
¥ | 1,099,963 | ¥ | 1,160,874 | ¥ | 1,294,116 | ||||||
|
|
|
|
|
|
|
|||||||
Trust fees consist primarily of fees earned by fiduciary asset management and administration services for corporate pension plans, investment funds, etc. Fees on funds transfer and service charges for collection are earned by providing settlement services such as domestic fund remittances and domestic collection services. Fees and commissions on international business primarily consist of fees from international fund transfer and collection services, and trade-related financing services. Fees and commissions on credit card business are composed of interchange income, annual fees, royalty and other service charges from franchisees. Service charges on deposits are fees charged for deposits such as checking account deposits. Fees and commissions on securities business include underwriting, brokerage and advisory services and arrangement fees on securitizations. Fees on real estate business primarily consist of fees from real estate agent services. Insurance commissions are earned by acting as agent for insurance companies to sell insurance products. Fees and commissions on stock transfer agency services consist of fees earned primarily by stock title transfers and agency services for the calculation and payment of dividends. Guarantee fees are earned by providing guarantees on residential mortgage loans. Fees on investment funds business primarily consist of management fees for investment funds. Other fees and commissions include various arrangement fees and agent fees excluding the fees mentioned above.
| 28. | TRADING ACCOUNT PROFITS AND LOSSES |
The MUFG Group performs trading activities through market-making, sales and arbitrage, while maintaining risk levels within appropriate limits in accordance with its risk management policy.
The MUFG Group has trading account securities and trading derivative assets and liabilities for this purpose. In addition, the trading account securities include foreign currency-denominated debt securities such as foreign government or official institution bonds, corporate bonds and mortgage-backed securities, which are mainly comprised of securities measured at fair value under the fair value option.
F-129
Table of Contents
MITSUBISHI UFJ FINANCIAL GROUP, INC. AND SUBSIDIARIES
NOTES TO CONSOLIDATED FINANCIAL STATEMENTS—(Continued)
Net trading gains (losses) for the fiscal years ended March 31, 2012, 2013 and 2014 were comprised of the following:
| 2012 | 2013 | 2014 | ||||||||||
| (in millions) | ||||||||||||
|
Interest rate and other derivative contracts |
¥ | 77,698 | ¥ | (82,684 | ) | ¥ | (84,408 | ) | ||||
|
Trading account securities, excluding derivatives |
589,587 | 652,960 | 50,522 | |||||||||
|
|
|
|
|
|
|
|||||||
|
Trading account profits (losses)—net |
667,285 | 570,276 | (33,886 | ) | ||||||||
|
Foreign exchange derivative contracts (1) |
(94,853 | ) | (94,223 | ) | (52,737 | ) | ||||||
|
|
|
|
|
|
|
|||||||
|
Net trading gains (losses) |
¥ | 572,432 | ¥ | 476,053 | ¥ | (86,623 | ) | |||||
|
|
|
|
|
|
|
|||||||
Note:
| (1) | Gains (losses) on foreign exchange derivative contracts are included in Foreign exchange gains (losses)—net in the accompanying consolidated statements of income. Foreign exchange gains (losses)—net in the accompanying consolidated statements of income are also comprised of foreign exchange gains (losses) other than derivative contracts and foreign exchange gains (losses) related to the fair value option. |
For further information on the methodologies and assumptions used to estimate fair value, see Note 31, which also shows fair values of trading account securities by major category. Note 23 discloses further information regarding the derivative-related impact on Trading account profits (losses)—net by major category.
| 29. | BUSINESS SEGMENTS |
The business segment information, set forth below, is derived from the internal management reporting system used by management to measure the performance of the MUFG Group’s business segments. In addition, the business segment information is based on the financial information prepared in accordance with Japanese GAAP as adjusted in accordance with internal management accounting rules and practices. Accordingly, the format and information is not consistent with the accompanying consolidated financial statements prepared on the basis of U.S. GAAP. A reconciliation is provided for the total amounts of segments’ operating profit with income before income tax expense under U.S. GAAP.
See Note 30 for financial information relating to the MUFG Group’s operations by geographic area. The geographic financial information is consistent with the basis of the accompanying consolidated financial statements.
The following is a brief explanation of the MUFG Group’s business segments:
Integrated Retail Banking Business Group —Covers all domestic retail businesses, including commercial banking, trust banking and securities businesses. This business group integrates the retail business of BTMU, MUTB, MUMSS, Mitsubishi UFJ NICOS and other subsidiaries as well as retail product development, promotion and marketing in a single management structure. At the same time, the business group has developed and implemented MUFG Plaza, a one-stop, comprehensive financial services concept that provides integrated banking, trust and securities services.
Integrated Corporate Banking Business Group —Covers all domestic corporate businesses, including commercial banking, investment banking, trust banking and securities business. Through the integration of these business lines, diverse financial products and services are provided to the MUFG Group’s corporate clients. The business group has clarified strategic domains, sales channels and methods to match the different growth stages and financial needs of the MUFG Group’s corporate clients.
F-130
Table of Contents
MITSUBISHI UFJ FINANCIAL GROUP, INC. AND SUBSIDIARIES
NOTES TO CONSOLIDATED FINANCIAL STATEMENTS—(Continued)
Integrated Trust Assets Business Group —Covers asset management and administration services for products such as pension trusts and security trusts by integrating the trust banking expertise of MUTB and the global network of BTMU. The business group provides a full range of services to corporate and other pension funds, including stable and secure pension fund management and administration, advice on pension schemes, and payment of benefits to scheme members.
Integrated Global Business Group —Covers businesses outside Japan, including commercial banking such as loans, deposits and cash management services, investment banking, retail banking, trust banking and securities businesses (with the retail banking and trust assets businesses being conducted through MUB), through a global network of more than 500 offices outside Japan to provide customers with financial products and services that meet their increasingly diverse and sophisticated financing needs. MUB is one of the largest commercial banks in California by both total assets and total deposits. MUB provides a wide range of financial services to consumers, small businesses, middle market companies and major corporations, primarily in California, Oregon and Washington but also nationally and internationally. MUB’s parent company is MUAH, which is a bank holding company in the United States.
Global Markets —Covers asset and liability management and strategic investment of BTMU and MUTB, and sales and trading of financial products of BTMU, MUTB and MUSHD.
Other —Consists mainly of the corporate centers of MUFG, BTMU, MUTB and MUMSS. The elimination of duplicated amounts of net revenue among business segments is also reflected in Other.
Management does not use information on segments’ total assets to allocate resources and assess performance. Accordingly, business segment information on total assets is not presented.
Effective April 1, 2013 and October 1, 2013, in order to further streamline and integrate managerial accounting methodologies on a group-wide basis, the MUFG Group made modifications to such methodologies, which mainly affected the Integrated Retail Banking Business Group and the Corporate Banking Business Group. These modifications had no impact on total operating profit for the fiscal years ended March 31, 2012 and 2013, but affected net revenue and operating expenses allocations among segments.
F-131
Table of Contents
MITSUBISHI UFJ FINANCIAL GROUP, INC. AND SUBSIDIARIES
NOTES TO CONSOLIDATED FINANCIAL STATEMENTS—(Continued)
The table set forth below has been reclassified to enable comparisons between the relevant amounts for the fiscal years ended March 31, 2012, 2013 and 2014, respectively:
|
Integrated
Retail Banking Business Group |
Integrated
Corporate Banking Business Group |
Integrated
Trust Assets Business Group |
Integrated Global Business
Group |
Global
Markets |
Other | Total | ||||||||||||||||||||||||||||||
|
Other
than MUAH |
MUAH | Total | ||||||||||||||||||||||||||||||||||
| (in billions) | ||||||||||||||||||||||||||||||||||||
|
Fiscal year ended March 31, 2012: |
||||||||||||||||||||||||||||||||||||
|
Net revenue: |
¥ | 1,227.1 | ¥ | 870.7 | ¥ | 140.1 | ¥ | 364.6 | ¥ | 252.0 | ¥ | 616.6 | ¥ | 727.9 | ¥ | (1.3 | ) | ¥ | 3,581.1 | |||||||||||||||||
|
BTMU and MUTB: |
583.0 | 778.2 | 55.7 | 286.1 | — | 286.1 | 645.8 | 0.6 | 2,349.4 | |||||||||||||||||||||||||||
|
Net interest income |
467.7 | 402.8 | — | 128.2 | — | 128.2 | 309.0 | 39.6 | 1,347.3 | |||||||||||||||||||||||||||
|
Net fees |
105.6 | 303.1 | 55.7 | 122.6 | — | 122.6 | (16.4 | ) | (27.3 | ) | 543.3 | |||||||||||||||||||||||||
|
Other |
9.7 | 72.3 | — | 35.3 | — | 35.3 | 353.2 | (11.7 | ) | 458.8 | ||||||||||||||||||||||||||
|
Other than BTMU and
|
644.1 | 92.5 | 84.4 | 78.5 | 252.0 | 330.5 | 82.1 | (1.9 | ) | 1,231.7 | ||||||||||||||||||||||||||
|
Operating expenses |
915.8 | 440.5 | 87.3 | 196.5 | 173.0 | 369.5 | 128.1 | 161.4 | 2,102.6 | |||||||||||||||||||||||||||
|
|
|
|
|
|
|
|
|
|
|
|
|
|
|
|
|
|
|
|||||||||||||||||||
|
Operating profit (loss) |
¥ | 311.3 | ¥ | 430.2 | ¥ | 52.8 | ¥ | 168.1 | ¥ | 79.0 | ¥ | 247.1 | ¥ | 599.8 | ¥ | (162.7 | ) | ¥ | 1,478.5 | |||||||||||||||||
|
|
|
|
|
|
|
|
|
|
|
|
|
|
|
|
|
|
|
|||||||||||||||||||
|
Fiscal year ended March 31, 2013: |
||||||||||||||||||||||||||||||||||||
|
Net revenue: |
¥ | 1,207.8 | ¥ | 864.0 | ¥ | 138.8 | ¥ | 465.4 | ¥ | 288.5 | ¥ | 753.9 | ¥ | 763.0 | ¥ | (10.8 | ) | ¥ | 3,716.7 | |||||||||||||||||
|
BTMU and MUTB: |
561.5 | 767.9 | 55.4 | 358.4 | — | 358.4 | 655.7 | (8.6 | ) | 2,390.3 | ||||||||||||||||||||||||||
|
Net interest income |
428.1 | 382.2 | — | 181.5 | — | 181.5 | 262.1 | 64.1 | 1,318.0 | |||||||||||||||||||||||||||
|
Net fees |
124.8 | 312.6 | 55.4 | 141.6 | — | 141.6 | (19.2 | ) | (32.8 | ) | 582.4 | |||||||||||||||||||||||||
|
Other |
8.6 | 73.1 | — | 35.3 | — | 35.3 | 412.8 | (39.9 | ) | 489.9 | ||||||||||||||||||||||||||
|
Other than BTMU and
|
646.3 | 96.1 | 83.4 | 107.0 | 288.5 | 395.5 | 107.3 | (2.2 | ) | 1,326.4 | ||||||||||||||||||||||||||
|
Operating expenses |
917.3 | 434.4 | 88.3 | 246.8 | 205.4 | 452.2 | 142.5 | 174.4 | 2,209.1 | |||||||||||||||||||||||||||
|
|
|
|
|
|
|
|
|
|
|
|
|
|
|
|
|
|
|
|||||||||||||||||||
|
Operating profit (loss) |
¥ | 290.5 | ¥ | 429.6 | ¥ | 50.5 | ¥ | 218.6 | ¥ | 83.1 | ¥ | 301.7 | ¥ | 620.5 | ¥ | (185.2 | ) | ¥ | 1,507.6 | |||||||||||||||||
|
|
|
|
|
|
|
|
|
|
|
|
|
|
|
|
|
|
|
|||||||||||||||||||
|
Fiscal year ended March 31, 2014: |
||||||||||||||||||||||||||||||||||||
|
Net revenue: |
¥ | 1,290.6 | ¥ | 924.5 | ¥ | 159.2 | ¥ | 567.9 | ¥ | 375.9 | ¥ | 943.8 | ¥ | 568.6 | ¥ | (13.6 | ) | ¥ | 3,873.1 | |||||||||||||||||
|
BTMU and MUTB: |
569.9 | 801.0 | 65.5 | 443.1 | — | 443.1 | 411.6 | (4.4 | ) | 2,286.7 | ||||||||||||||||||||||||||
|
Net interest income |
398.1 | 374.8 | — | 235.8 | — | 235.8 | 219.5 | 79.6 | 1,307.8 | |||||||||||||||||||||||||||
|
Net fees |
163.5 | 337.5 | 65.5 | 164.7 | — | 164.7 | (23.1 | ) | (62.0 | ) | 646.1 | |||||||||||||||||||||||||
|
Other |
8.3 | 88.7 | — | 42.6 | — | 42.6 | 215.2 | (22.0 | ) | 332.8 | ||||||||||||||||||||||||||
|
Other than BTMU and
|
720.7 | 123.5 | 93.7 | 124.8 | 375.9 | 500.7 | 157.0 | (9.2 | ) | 1,586.4 | ||||||||||||||||||||||||||
|
Operating expenses |
961.9 | 438.4 | 94.4 | 299.5 | 266.9 | 566.4 | 176.5 | 172.4 | 2,410.0 | |||||||||||||||||||||||||||
|
|
|
|
|
|
|
|
|
|
|
|
|
|
|
|
|
|
|
|||||||||||||||||||
|
Operating profit (loss) |
¥ | 328.7 | ¥ | 486.1 | ¥ | 64.8 | ¥ | 268.4 | ¥ | 109.0 | ¥ | 377.4 | ¥ | 392.1 | ¥ | (186.0 | ) | ¥ | 1,463.1 | |||||||||||||||||
|
|
|
|
|
|
|
|
|
|
|
|
|
|
|
|
|
|
|
|||||||||||||||||||
| Note: |
| (1) | Includes MUFG and its subsidiaries other than BTMU and MUTB. |
Reconciliation
As set forth above, the measurement bases and the income and expense items of the internal management reporting system are different from the accompanying consolidated statements of income. Therefore, it is impracticable to present reconciliations of all of the business segments’ information, other than operating profit, to corresponding items in the accompanying consolidated statements of income.
F-132
Table of Contents
MITSUBISHI UFJ FINANCIAL GROUP, INC. AND SUBSIDIARIES
NOTES TO CONSOLIDATED FINANCIAL STATEMENTS—(Continued)
A reconciliation of operating profit under the internal management reporting system for the fiscal years ended March 31, 2012, 2013 and 2014 above to income before income tax expense shown on the accompanying consolidated statements of income is as follows:
| 2012 | 2013 | 2014 | ||||||||||
| (in billions) | ||||||||||||
|
Operating profit: |
¥ | 1,479 | ¥ | 1,508 | ¥ | 1,463 | ||||||
|
Credit (provision) for credit losses |
(224 | ) | (145 | ) | 106 | |||||||
|
Trading account profits (losses)—net |
372 | 285 | (394 | ) | ||||||||
|
Equity investment securities gains (losses)—net |
(95 | ) | (22 | ) | 170 | |||||||
|
Debt investment securities losses—net |
(153 | ) | (153 | ) | (6 | ) | ||||||
|
Foreign exchange gains (losses)—net |
21 | (53 | ) | (48 | ) | |||||||
|
Equity in earnings (losses) of equity method investees—net |
(499 | ) | 60 | 111 | ||||||||
|
Impairment of goodwill |
— | — | (8 | ) | ||||||||
|
Impairment of intangible assets |
(31 | ) | (3 | ) | — | |||||||
|
Other—net |
(20 | ) | (61 | ) | 26 | |||||||
|
|
|
|
|
|
|
|||||||
|
Income before income tax expense |
¥ | 850 | ¥ | 1,416 | ¥ | 1,420 | ||||||
|
|
|
|
|
|
|
|||||||
| 30. | FOREIGN ACTIVITIES |
Foreign operations include the business conducted by overseas offices, as well as international business conducted from domestic offices, principally several international banking-related divisions of BTMU’s and MUTB’s Head Office in Tokyo, and involve various transactions with debtors and customers residing outside Japan. Close integration of the MUFG Group’s foreign and domestic activities makes precise estimates of the amounts of assets, liabilities, income and expenses attributable to foreign operations difficult and necessarily subjective. Assets, income and expenses attributable to foreign operations are allocated to geographical areas based on the domicile of the debtors and customers.
F-133
Table of Contents
MITSUBISHI UFJ FINANCIAL GROUP, INC. AND SUBSIDIARIES
NOTES TO CONSOLIDATED FINANCIAL STATEMENTS—(Continued)
Generally, interest rates with respect to funds borrowed and loaned between domestic and foreign operations are based on prevailing money market rates appropriate for the transactions. In general, the MUFG Group has allocated all direct expenses and a proportionate share of general and administrative expenses to income derived from foreign loans and other transactions by the MUFG Group’s foreign operations. The following table sets forth estimated total assets at March 31, 2012, 2013 and 2014, and estimated total revenue, total expense, income (loss) before income tax expense (benefit) and net income (loss) attributable to Mitsubishi UFJ Financial Group for the respective fiscal years then ended:
| Domestic | Foreign | Total | ||||||||||||||||||||||
| Japan |
United
States of America |
Europe |
Asia/Oceania
excluding Japan |
Other
areas (1) |
||||||||||||||||||||
| (in millions) | ||||||||||||||||||||||||
|
Fiscal year ended March 31, 2012: |
||||||||||||||||||||||||
|
Total revenue (2)(4) |
¥ | 2,936,875 | ¥ | 192,775 | ¥ | 290,482 | ¥ | 450,651 | ¥ | 165,749 | ¥ | 4,036,532 | ||||||||||||
|
Total expense (3) |
2,438,729 | 284,557 | 151,077 | 223,253 | 88,974 | 3,186,590 | ||||||||||||||||||
|
Income (loss) before income tax expense (benefit) |
498,146 | (91,782 | ) | 139,405 | 227,398 | 76,775 | 849,942 | |||||||||||||||||
|
Net income (loss) attributable to Mitsubishi UFJ Financial Group |
163,334 | (119,829 | ) | 113,593 | 192,753 | 66,380 | 416,231 | |||||||||||||||||
|
Total assets at end of fiscal year |
148,702,461 | 28,457,027 | 18,620,484 | 12,410,540 | 7,012,002 | 215,202,514 | ||||||||||||||||||
|
Fiscal year ended March 31, 2013: |
||||||||||||||||||||||||
|
Total revenue (2) |
¥ | 3,016,008 | ¥ | 426,377 | ¥ | 256,495 | ¥ | 585,474 | ¥ | 211,076 | ¥ | 4,495,430 | ||||||||||||
|
Total expense (3) |
2,248,856 | 327,565 | 160,061 | 268,349 | 74,728 | 3,079,559 | ||||||||||||||||||
|
Income before income tax expense |
767,152 | 98,812 | 96,434 | 317,125 | 136,348 | 1,415,871 | ||||||||||||||||||
|
Net income attributable to Mitsubishi UFJ Financial Group |
499,125 | 95,565 | 78,442 | 274,951 | 121,041 | 1,069,124 | ||||||||||||||||||
|
Total assets at end of fiscal year |
151,999,696 | 30,730,705 | 23,224,502 | 15,938,673 | 8,665,700 | 230,559,276 | ||||||||||||||||||
|
Fiscal year ended March 31, 2014: |
||||||||||||||||||||||||
|
Total revenue (2) |
¥ | 3,110,050 | ¥ | 218,953 | ¥ | 155,022 | ¥ | 569,018 | ¥ | 290,321 | ¥ | 4,343,364 | ||||||||||||
|
Total expense (3) |
1,952,250 | 426,084 | 143,417 | 315,203 | 85,967 | 2,922,921 | ||||||||||||||||||
|
Income (loss) before income tax expense (benefit) |
1,157,800 | (207,131 | ) | 11,605 | 253,815 | 204,354 | 1,420,443 | |||||||||||||||||
|
Net income (loss) attributable to Mitsubishi UFJ Financial Group |
859,846 | (131,566 | ) | 6,484 | 149,417 | 131,212 | 1,015,393 | |||||||||||||||||
|
Total assets at end of fiscal year |
158,809,701 | 40,625,000 | 22,352,446 | 22,312,805 | 9,561,125 | 253,661,077 | ||||||||||||||||||
| Notes: |
| (1) | Other areas primarily include Canada, Latin America, the Caribbean and the Middle East. |
| (2) | Total revenue is comprised of Interest income and Non-interest income. |
| (3) | Total expense is comprised of Interest expense, Provision for credit losses and Non-interest expense. |
| (4) | For the fiscal year ended March 31, 2012, Total revenue of United States of America includes an other-than-temporary impairment loss of Morgan Stanley’s common stock. See Note 2 for further details of an other-than-temporary impairment loss of Morgan Stanley’s common stock. |
F-134
Table of Contents
MITSUBISHI UFJ FINANCIAL GROUP, INC. AND SUBSIDIARIES
NOTES TO CONSOLIDATED FINANCIAL STATEMENTS—(Continued)
The following is an analysis of certain asset and liability accounts related to foreign activities at March 31, 2013 and 2014:
| 2013 | 2014 | |||||||
| (in millions) | ||||||||
|
Cash and due from banks |
¥ | 676,833 | ¥ | 804,617 | ||||
|
Interest-earning deposits in other banks |
3,830,923 | 9,020,949 | ||||||
|
|
|
|
|
|||||
|
Total |
¥ | 4,507,756 | ¥ | 9,825,566 | ||||
|
|
|
|
|
|||||
|
Trading account assets |
¥ | 28,450,804 | ¥ | 28,319,251 | ||||
|
|
|
|
|
|||||
|
Investment securities |
¥ | 6,960,616 | ¥ | 4,749,265 | ||||
|
|
|
|
|
|||||
|
Loans—net of unearned income, unamortized premiums and deferred loan fees |
¥ | 29,174,592 | ¥ | 39,763,643 | ||||
|
|
|
|
|
|||||
|
Deposits |
¥ | 29,317,297 | ¥ | 40,648,813 | ||||
|
|
|
|
|
|||||
|
Funds borrowed: |
||||||||
|
Call money, funds purchased |
¥ | 254,796 | ¥ | 201,606 | ||||
|
Payables under repurchase agreements |
6,857,970 | 8,995,939 | ||||||
|
Payables under securities lending transactions |
77,428 | 96,202 | ||||||
|
Other short-term borrowings |
2,531,308 | 3,698,004 | ||||||
|
Long-term debt |
2,847,585 | 3,376,761 | ||||||
|
|
|
|
|
|||||
|
Total |
¥ | 12,569,087 | ¥ | 16,368,512 | ||||
|
|
|
|
|
|||||
|
Trading account liabilities |
¥ | 7,012,658 | ¥ | 5,876,702 | ||||
|
|
|
|
|
|||||
| 31. | FAIR VALUE |
Fair value is defined as the price that would be received to sell an asset or paid to transfer a liability in an orderly transaction between market participants at the measurement date. The guidance on fair value measurements also specifies a fair value hierarchy that prioritizes the inputs to valuation techniques used to measure fair value into three broad levels. The fair value hierarchy gives the highest priority to quoted prices in active markets and the lowest priority to unobservable inputs, for example, the reporting entity’s own data. Based on the observability of the inputs used in the valuation techniques, the following three-level hierarchy is specified by the guidance:
| Ÿ | Level 1—Unadjusted quoted prices for identical instruments in active markets. |
| Ÿ | Level 2—Observable inputs other than Level 1 prices for substantially the full term of the instruments, such as quoted prices for similar instruments in active markets; quoted prices for identical or similar instruments in markets that are not active; other inputs that are observable; or market-corroborated inputs. |
| Ÿ | Level 3—Unobservable inputs that are supported by little or no market activity and that are significant to the fair value of the instruments. |
A financial instrument’s categorization within the fair value hierarchy is based upon the lowest level of input that is significant to the fair value measurement.
The MUFG Group has an established and documented process for determining fair values in accordance with the guidance. When available, quoted prices are used to determine fair value. If quoted prices are not
F-135
Table of Contents
MITSUBISHI UFJ FINANCIAL GROUP, INC. AND SUBSIDIARIES
NOTES TO CONSOLIDATED FINANCIAL STATEMENTS—(Continued)
available, fair value is based upon valuation techniques that use observable or unobservable inputs. The fair values of liabilities are determined by discounting future cash flows at a rate which incorporates the MUFG Group’s own creditworthiness. In addition, valuation adjustments may be made to ensure the financial instruments are recorded at fair value. These adjustments include, but are not limited to, amounts that reflect counterparty credit quality, liquidity risk and model risk.
The following section describes the valuation techniques used by the MUFG Group to measure fair values of certain financial instruments. The discussion includes the general classification of such financial instruments in accordance with the fair value hierarchy, a brief explanation of the valuation techniques, the significant inputs to those valuation techniques, and any additional significant assumptions.
Interest-earning Deposits in Other Banks
Cash flows are estimated based on the terms of the contracts and discounted using the market interest rates applicable to the maturity of the contracts, which are adjusted to reflect credit risks on counterparties. As the inputs into the valuation techniques are readily observable, these deposits are classified in Level 2 of the fair value hierarchy.
Receivables Under Resale Agreements
Certain receivables under resale agreements are measured at fair value upon election of the fair value option and fair value is measured using discounted cash flows. Cash flows are estimated based on the terms of the contracts and discounted using the market interest rates applicable to the maturity of the contracts, which are adjusted to reflect credit risks on counterparties. These receivables are classified in Level 2 of the fair value hierarchy.
Trading Account Assets and Liabilities—Trading Account Securities
When quoted prices are available in an active market, the MUFG Group uses quoted prices to measure the fair values of securities and such securities are classified in Level 1 of the fair value hierarchy. Examples of Level 1 securities include certain Japanese and foreign government bonds, and marketable equity securities.
When quoted prices are available but the securities are not traded in active markets, such securities are classified in Level 2 of the fair value hierarchy. These securities include certain Japanese government agency bonds, Japanese prefectural and municipal bonds, foreign governments and official institutions bonds, corporate bonds, residential mortgage-backed securities and equity securities.
When quoted prices are not available, the MUFG Group estimates fair values by using internal valuation techniques, quoted prices of securities with similar characteristics or non-binding prices obtained from independent pricing vendors. Such securities include certain commercial paper, corporate bonds, asset-backed securities and residential mortgage-backed securities. For commercial paper, the MUFG Group estimates fair value using discounted cash flows. The cash flows are estimated in accordance with the terms of contracts and discounted using a discount rate based on the yield curve estimated from market interest rates appropriate to the securities. Commercial paper is generally classified in Level 2 of the fair value hierarchy. For corporate bonds, the MUFG Group estimates fair value by using internal valuation techniques. Key inputs to the internal valuation techniques include estimated cash flows based on the terms of the contracts, yield curves based on market interest rates and volatilities. Corporate bonds which are valued using internal valuation techniques are generally classified in Level 2 of the fair value hierarchy. If any such key inputs are unobservable, they are classified in Level 3 of the fair value hierarchy. Certain investments in funds valued at net assets value are classified in Level 2 if they can be redeemed at their net asset value at the measurement date.
F-136
Table of Contents
MITSUBISHI UFJ FINANCIAL GROUP, INC. AND SUBSIDIARIES
NOTES TO CONSOLIDATED FINANCIAL STATEMENTS—(Continued)
When there is less liquidity for securities or significant inputs used in the fair value measurements are unobservable, such securities are classified in Level 3 of the fair value hierarchy. Examples of such Level 3 securities include CLOs backed by general corporate loans, which are classified in asset-backed securities. The fair value of CLOs is measured by weighting the estimated fair value amounts from internal valuation techniques and the non-binding quotes from the independent broker-dealers. The weight of the quotes from independent broker-dealer is determined based on the result of inquiries with the broker-dealers to understand their basis of fair value calculation with consideration given to transaction volume. Key inputs to the internal valuation techniques include projected cash flows through an analysis of underlying loans, probability of default which incorporates market indices such as LCDX (which is an index of loan credit default swaps), repayment rates and discount rates reflecting liquidity premiums based on historical market data.
Trading Account Assets and Liabilities—Derivatives
Exchange-traded derivatives valued using quoted prices are classified in Level 1 of the fair value hierarchy. Examples of Level 1 derivatives include stock futures index and interest rate futures. However, the majority of the derivative contracts entered into by the MUFG Group are traded over-the-counter and valued using valuation techniques as there are no quoted prices for such derivatives. The valuation techniques and inputs vary depending on the types and contractual terms of the derivatives. The principal valuation techniques used to value derivatives include discounted cash flows, the Black-Scholes model and the Hull-White model. The key inputs include interest rate yield curve, foreign currency exchange rate, volatility, credit quality of the counterparty or the MUFG Group and spot price of the underlying. These models are commonly accepted in the financial industry and key inputs to the models are generally readily observable in an active market. Derivatives valued using such valuation techniques and inputs are generally classified in Level 2 of the fair value hierarchy. Examples of such Level 2 derivatives include plain-vanilla interest rate swaps, foreign currency forward contracts and currency option contracts.
Derivatives that are valued using valuation techniques with significant unobservable inputs are classified in Level 3 of the fair value hierarchy. Examples of Level 3 derivatives include long-term interest rate or currency swaps and certain credit derivatives, where significant inputs such as volatility, credit curves and correlation of such inputs are unobservable.
Investment Securities
Investment securities include available-for-sale debt and equity securities, whose fair values are measured using the same valuation techniques as the trading account securities described above except for certain private placement bonds issued by Japanese non-public companies. Fair values of private placement bonds issued by Japanese non-public companies are measured based on discounted cash flow method using discount rates applicable to the maturity of the bonds, which are adjusted to reflect credit risk of issuers. Credit risk of issuers is reflected in the future cash flows being discounted by the interest rates applicable to the maturity of the bonds. The private placement bonds are generally utilized to finance medium or small size non-public companies. These bonds are classified in either Level 2 or Level 3 of the fair value hierarchy, depending on the significance of the adjustments for unobservable input of credit worthiness. Investment securities also include investments in nonmarketable equity securities which are subject to specialized industry accounting principles. The valuation of such nonmarketable equity securities involves significant management judgment due to the absence of quoted prices, lack of liquidity and the long term nature of these investments. Further, there may be restriction on transfers of nonmarketable equity securities. The MUFG Group values such securities initially at transaction price and subsequently adjusts such valuations, considering evidence such as current sales transactions of similar securities, initial public offerings, recent equity issuances and change in financial condition of the investee company. Nonmarketable equity securities are included in Level 3 of the fair value hierarchy.
F-137
Table of Contents
MITSUBISHI UFJ FINANCIAL GROUP, INC. AND SUBSIDIARIES
NOTES TO CONSOLIDATED FINANCIAL STATEMENTS—(Continued)
Other Assets
Other assets measured at fair value mainly consist of securities received as collateral that may be sold or repledged under securities lending transactions, money in trust for segregating cash deposited by customers on security transactions and derivatives designated as hedging instruments. The securities received as collateral under lending transactions mainly consist of certain Japanese and foreign government bonds which are valued using the valuation techniques previously described in the section entitled “Trading Accounts Assets and Liabilities—Trading Account Securities” above.
Money in trust for segregating cash deposited by customers on security transactions mainly consists of certain Japanese government bonds which are valued using the valuation techniques described in the “Trading Account Assets and Liabilities—Trading Account Securities” above and is included in Level 1 or Level 2 of the fair value hierarchy depending on the component assets.
The fair values of derivatives designated as hedging instruments are measured using the valuation techniques described in the “Trading Account Assets and Liabilities—Derivatives” above.
Obligations to Return Securities Received as Collateral
Obligations to return securities received as collateral under securities lending transactions are measured at the fair values of the securities received as collateral. The securities received as collateral consist primarily of certain Japanese and foreign government bonds, whose fair values are measured using the valuation techniques described in the “Trading Account Assets and Liabilities—Trading Account Securities” above.
Other Short-term Borrowings and Long-term Debt
Certain short-term borrowings and long-term debt are measured at fair value due to the election of the fair value option. The fair value of these instruments are measured principally based on the discounted cash flows. Where the inputs into the valuation techniques are mainly based on observable inputs, these instruments are classified in Level 2 of the fair value hierarchy. Where significant inputs are unobservable, they are classified in Level 3 of the fair value hierarchy.
Market Valuation Adjustments
Counterparty credit risk adjustments are made to certain financial assets such as over-the-counter derivatives. As not all counterparties have the same credit rating, it is necessary to take into account the actual credit rating of a counterparty to arrive at the fair value. In addition, the counterparty credit risk adjustment takes into account the effect of credit risk mitigation such as pledged collateral and legal right of offsets with the counterparty.
For own credit risk adjustments, the MUFG Group takes into consideration all the facts and circumstances, including its own credit rating, the difference between its funding rate and market interest rate, and the existence of collateralization or netting agreements. As a result of these analyses, the MUFG Group considered that own credit risk adjustments for financial liabilities were not material.
Liquidity adjustments are applied mainly to the instruments classified in Level 3 of the fair value hierarchy when recent prices of such instruments are unobservable or traded in inactive or less active markets. The liquidity adjustments are based on the facts and circumstances of the markets including the availability of external quotes and the time since the latest available quote.
F-138
Table of Contents
MITSUBISHI UFJ FINANCIAL GROUP, INC. AND SUBSIDIARIES
NOTES TO CONSOLIDATED FINANCIAL STATEMENTS—(Continued)
Model valuation adjustments such as unobservable parameter valuation adjustments may be provided when the fair values of instruments are determined based on internally developed valuation techniques. Examples of such adjustments include adjustments to the model price of certain derivatives where parameters such as correlation are unobservable. Unobservable parameter valuation adjustments are applied to mitigate the possibility of error in the model-based estimated value.
Investments in Certain Entities That Calculate Net Asset Value per Share
The MUFG Group has interests in investment funds mainly hedge funds, private equity funds, and real estate funds that are measured at fair value on a recurring or nonrecurring basis.
Hedge funds are primarily multi-disciplinary hedge funds that employ a fundamental bottom-up investment approach across various asset classes and strategies. The MUFG Group’s investments in hedge funds are generally redeemable on a monthly-quarterly basis with 30-90 days advance notice.
Private equity funds have specific investment objectives in connection with their acquisition of equity interests, such as providing financing and other support to start-up businesses, medium and small entities in a particular geographical area, and to companies with certain technology or companies in a high-growth industry. Generally, these investments cannot be redeemed with the funds, and the return of invested capital and its gains are derived from distributions received upon the liquidation of the underlying assets of the fund. It is estimated that the underlying assets of the fund would be liquidated within a ten-year period.
Real estate funds invest globally and primarily in real estate companies, debt recapitalizations and direct property. These investments are generally not redeemable with the funds. Distributions from each fund will be received as the underlying investments of the funds are liquidated. It is estimated that the underlying assets of the funds would be liquidated within a four-year period.
F-139
Table of Contents
MITSUBISHI UFJ FINANCIAL GROUP, INC. AND SUBSIDIARIES
NOTES TO CONSOLIDATED FINANCIAL STATEMENTS—(Continued)
Assets and Liabilities Measured at Fair Value on a Recurring Basis
The following tables present the financial instruments carried at fair value by level within the fair value hierarchy as of March 31, 2013 and 2014:
| March 31, 2013 | ||||||||||||||||
| Level 1 | Level 2 | Level 3 | Fair Value | |||||||||||||
| (in millions) | ||||||||||||||||
|
Assets |
||||||||||||||||
|
Trading account assets: |
||||||||||||||||
|
Trading securities (1) |
¥ | 15,613,802 | ¥ | 9,935,591 | ¥ | 631,113 | ¥ | 26,180,506 | ||||||||
|
Debt securities |
||||||||||||||||
|
Japanese national government and Japanese government agency bonds |
4,420,457 | 182,098 | — | 4,602,555 | ||||||||||||
|
Japanese prefectural and municipal bonds |
— | 129,974 | — | 129,974 | ||||||||||||
|
Foreign governments and official institutions bonds |
9,983,023 | 2,144,396 | 96,255 | 12,223,674 | ||||||||||||
|
Corporate bonds |
— | 2,729,892 | 77,089 | 2,806,981 | ||||||||||||
|
Residential mortgage-backed securities |
— | 3,220,036 | 9,881 | 3,229,917 | ||||||||||||
|
Asset-backed securities |
— | 80,447 | 396,071 | 476,518 | ||||||||||||
|
Other debt securities |
— | 11,597 | 29,526 | 41,123 | ||||||||||||
|
Commercial paper |
— | 1,129,508 | — | 1,129,508 | ||||||||||||
|
Equity securities (2) |
1,210,322 | 307,643 | 22,291 | 1,540,256 | ||||||||||||
|
Trading derivative assets |
52,242 | 14,520,461 | 73,175 | 14,645,878 | ||||||||||||
|
Interest rate contracts |
6,770 | 11,175,763 | 31,794 | 11,214,327 | ||||||||||||
|
Foreign exchange contracts |
511 | 3,171,002 | 21,131 | 3,192,644 | ||||||||||||
|
Equity contracts |
34,062 | 53,874 | 15,735 | 103,671 | ||||||||||||
|
Commodity contracts |
10,899 | 59,075 | 3,628 | 73,602 | ||||||||||||
|
Credit derivatives |
— | 60,747 | 887 | 61,634 | ||||||||||||
|
Investment securities: |
||||||||||||||||
|
Securities available-for-sale |
52,347,228 | 6,024,714 | 472,127 | 58,844,069 | ||||||||||||
|
Debt securities |
||||||||||||||||
|
Japanese national government and Japanese government agency bonds |
48,069,738 | 1,410,216 | — | 49,479,954 | ||||||||||||
|
Japanese prefectural and municipal bonds |
— | 217,075 | — | 217,075 | ||||||||||||
|
Foreign governments and official institutions bonds |
319,176 | 248,398 | 148,722 | 716,296 | ||||||||||||
|
Corporate bonds |
— | 1,830,100 | 92,846 | 1,922,946 | ||||||||||||
|
Residential mortgage-backed securities |
— | 1,202,128 | 21,492 | 1,223,620 | ||||||||||||
|
Commercial mortgage-backed securities |
— | 269,343 | 39 | 269,382 | ||||||||||||
|
Asset-backed securities |
— | 708,428 | 102,250 | 810,678 | ||||||||||||
|
Other debt securities |
— | — | 106,714 | 106,714 | ||||||||||||
|
Marketable equity securities |
3,958,314 | 139,026 | 64 | 4,097,404 | ||||||||||||
|
Other investment securities |
— | 1,105 | 24,795 | 25,900 | ||||||||||||
|
Others (3)(4) |
455,012 | 134,569 | 8,418 | 597,999 | ||||||||||||
|
|
|
|
|
|
|
|
|
|||||||||
|
Total |
¥ | 68,468,284 | ¥ | 30,616,440 | ¥ | 1,209,628 | ¥ | 100,294,352 | ||||||||
|
|
|
|
|
|
|
|
|
|||||||||
|
Liabilities |
||||||||||||||||
|
Trading account liabilities: |
||||||||||||||||
|
Trading securities sold, not yet purchased |
¥ | 72,756 | ¥ | 6,057 | ¥ | — | ¥ | 78,813 | ||||||||
|
Trading derivative liabilities |
124,431 | 14,672,597 | 93,641 | 14,890,669 | ||||||||||||
|
Interest rate contracts |
43,946 | 11,126,837 | 34,044 | 11,204,827 | ||||||||||||
|
Foreign exchange contracts |
274 | 3,390,222 | 37,937 | 3,428,433 | ||||||||||||
|
Equity contracts |
67,551 | 49,312 | 14,354 | 131,217 | ||||||||||||
|
Commodity contracts |
12,660 | 46,753 | 4,432 | 63,845 | ||||||||||||
|
Credit derivatives |
— | 59,473 | 2,874 | 62,347 | ||||||||||||
|
Obligation to return securities received as collateral |
2,887,425 | 147,122 | — | 3,034,547 | ||||||||||||
|
Others (5) |
— | 431,773 | 121,932 | 553,705 | ||||||||||||
|
|
|
|
|
|
|
|
|
|||||||||
|
Total |
¥ | 3,084,612 | ¥ | 15,257,549 | ¥ | 215,573 | ¥ | 18,557,734 | ||||||||
|
|
|
|
|
|
|
|
|
|||||||||
F-140
Table of Contents
MITSUBISHI UFJ FINANCIAL GROUP, INC. AND SUBSIDIARIES
NOTES TO CONSOLIDATED FINANCIAL STATEMENTS—(Continued)
| March 31, 2014 | ||||||||||||||||
| Level 1 | Level 2 | Level 3 | Fair Value | |||||||||||||
| (in millions) | ||||||||||||||||
|
Assets |
||||||||||||||||
|
Trading account assets: |
||||||||||||||||
|
Trading securities (1) |
¥ | 20,102,994 | ¥ | 8,075,408 | ¥ | 658,917 | ¥ | 28,837,319 | ||||||||
|
Debt securities |
||||||||||||||||
|
Japanese national government and Japanese government agency bonds |
5,688,374 | 235,944 | — | 5,924,318 | ||||||||||||
|
Japanese prefectural and municipal bonds |
— | 89,017 | — | 89,017 | ||||||||||||
|
Foreign governments and official institutions bonds |
13,133,023 | 1,784,478 | 15,450 | 14,932,951 | ||||||||||||
|
Corporate bonds |
— | 3,160,057 | 132,518 | 3,292,575 | ||||||||||||
|
Residential mortgage-backed securities |
— | 1,483,547 | 11,601 | 1,495,148 | ||||||||||||
|
Asset-backed securities |
— | 215,686 | 439,664 | 655,350 | ||||||||||||
|
Other debt securities |
— | 20,285 | 32,565 | 52,850 | ||||||||||||
|
Commercial paper |
— | 794,868 | — | 794,868 | ||||||||||||
|
Equity securities (2) |
1,281,597 | 291,526 | 27,119 | 1,600,242 | ||||||||||||
|
Trading derivative assets |
90,740 | 11,640,992 | 77,224 | 11,808,956 | ||||||||||||
|
Interest rate contracts |
22,677 | 8,565,213 | 28,202 | 8,616,092 | ||||||||||||
|
Foreign exchange contracts |
507 | 2,909,201 | 6,471 | 2,916,179 | ||||||||||||
|
Equity contracts |
50,425 | 65,827 | 32,434 | 148,686 | ||||||||||||
|
Commodity contracts |
17,131 | 43,826 | 10,102 | 71,059 | ||||||||||||
|
Credit derivatives |
— | 56,925 | 15 | 56,940 | ||||||||||||
|
Investment securities: |
||||||||||||||||
|
Securities available for sale |
45,302,514 | 6,038,450 | 544,688 | 51,885,652 | ||||||||||||
|
Debt securities |
||||||||||||||||
|
Japanese national government and Japanese government agency bonds |
39,852,612 | 1,736,397 | — | 41,589,009 | ||||||||||||
|
Japanese prefectural and municipal bonds |
— | 203,131 | — | 203,131 | ||||||||||||
|
Foreign governments and official institutions bonds |
794,822 | 324,952 | 151,647 | 1,271,421 | ||||||||||||
|
Corporate bonds |
— | 1,485,280 | 75,849 | 1,561,129 | ||||||||||||
|
Residential mortgage-backed securities |
— | 961,337 | 19,258 | 980,595 | ||||||||||||
|
Commercial mortgage-backed securities |
— | 197,034 | 3,112 | 200,146 | ||||||||||||
|
Asset-backed securities |
— | 948,168 | 109,876 | 1,058,044 | ||||||||||||
|
Other debt securities |
— | — | 184,946 | 184,946 | ||||||||||||
|
Marketable equity securities |
4,655,080 | 182,151 | — | 4,837,231 | ||||||||||||
|
Other investment securities |
— | — | 26,201 | 26,201 | ||||||||||||
|
Others (3)(4) |
489,356 | 28,169 | 5,598 | 523,123 | ||||||||||||
|
|
|
|
|
|
|
|
|
|||||||||
|
Total |
¥ | 65,985,604 | ¥ | 25,783,019 | ¥ | 1,312,628 | ¥ | 93,081,251 | ||||||||
|
|
|
|
|
|
|
|
|
|||||||||
|
Liabilities |
||||||||||||||||
|
Trading account liabilities: |
||||||||||||||||
|
Trading securities sold, not yet purchased |
¥ | 189,524 | ¥ | 4,719 | ¥ | — | ¥ | 194,243 | ||||||||
|
Trading derivative liabilities |
108,059 | 11,611,316 | 68,360 | 11,787,735 | ||||||||||||
|
Interest rate contracts |
25,293 | 8,481,947 | 14,526 | 8,521,766 | ||||||||||||
|
Foreign exchange contracts |
3,997 | 2,981,272 | 13,509 | 2,998,778 | ||||||||||||
|
Equity contracts |
57,464 | 57,892 | 28,239 | 143,595 | ||||||||||||
|
Commodity contracts |
21,305 | 30,029 | 10,724 | 62,058 | ||||||||||||
|
Credit derivatives |
— | 60,176 | 1,362 | 61,538 | ||||||||||||
|
Obligation to return securities received as collateral |
3,914,441 | 57,013 | — | 3,971,454 | ||||||||||||
|
Others (5) |
— | 612,124 | 92,867 | 704,991 | ||||||||||||
|
|
|
|
|
|
|
|
|
|||||||||
|
Total |
¥ | 4,212,024 | ¥ | 12,285,172 | ¥ | 161,227 | ¥ | 16,658,423 | ||||||||
|
|
|
|
|
|
|
|
|
|||||||||
Notes:
| (1) | Includes securities measured under the fair value option. |
| (2) | Includes investments valued at net asset value of ¥38,959 million and ¥28,922 million at March 31, 2013 and 2014, respectively. The unfunded commitments related to these investments at March 31, 2013 and 2014 were ¥8,644 million and ¥11,373 million, respectively. These investments were mainly hedge funds. |
| (3) | Mainly comprised of securities received as collateral that may be sold or repledged under securities lending transactions, money in trust for segregating cash deposited by customers on security transactions and derivatives designated as hedging instruments. |
| (4) | Includes investments valued at net asset value of real estate funds, hedge funds and private equity funds, whose fair values at March 31, 2013 were ¥4,276 million, ¥3,189 million and ¥2,943 million, respectively, and those at March 31, 2014 were ¥1,669 million, ¥1,232 million and ¥2,441 million, respectively. The amounts of unfunded commitments related to these real estate funds, hedge funds and private equity funds at March 31, 2013 were nil, ¥1,221 million and ¥2,028 million, respectively, and those at March 31, 2014 were nil, ¥104 million and ¥1,871 million, respectively. |
| (5) | Includes other short-term borrowings, long-term debt, bifurcated embedded derivatives carried at fair value and derivative liabilities designated as hedging instruments. |
F-141
Table of Contents
MITSUBISHI UFJ FINANCIAL GROUP, INC. AND SUBSIDIARIES
NOTES TO CONSOLIDATED FINANCIAL STATEMENTS—(Continued)
Transfers Between Level 1 and Level 2
During the fiscal years ended March 31, 2013 and 2014, the transfers between Level 1 and Level 2 were as follows:
| Fiscal years ended March 31, | ||||||||||||||||
| 2013 | 2014 | |||||||||||||||
|
Transfers out of
Level 1 into Level 2 (1) |
Transfers out of
Level 2 into Level 1 (1) |
Transfers out of
Level 1 into Level 2 (1) |
Transfers out of
Level 2 into Level 1 (1) |
|||||||||||||
| (in millions) | ||||||||||||||||
|
Assets |
||||||||||||||||
|
Trading account assets: |
||||||||||||||||
|
Trading securities |
||||||||||||||||
|
Debt securities |
||||||||||||||||
|
Japanese national government and Japanese government agency bonds |
¥ | — | ¥ | 10,717 | ¥ | 7,420 | ¥ | — | ||||||||
|
Foreign governments and official institutions bonds |
— | 1,289 | — | — | ||||||||||||
|
Residential mortgage-backed securities |
3,247,522 | — | — | — | ||||||||||||
|
Equity securities |
5,308 | — | 13,762 | — | ||||||||||||
|
Investment securities: |
||||||||||||||||
|
Securities available-for-sale |
||||||||||||||||
|
Debt securities |
||||||||||||||||
|
Foreign governments and official institutions bonds |
413,515 | — | — | — | ||||||||||||
|
Marketable equity securities |
19,026 | 13,737 | 19,011 | 13,252 | ||||||||||||
Note:
| (1) | All transfers between Level 1 and Level 2 were assumed to have occurred at the beginning of the first-half or the second-half of the fiscal year. |
In general, the transfers from Level 1 into Level 2 represented securities whose fair values were measured at quoted prices in active markets at the beginning of the period but such quoted prices were not available at the end of the period. The transfers from Level 2 into Level 1 represented securities for which quoted prices in active markets became available at the end of the period even though such quoted prices were not available at the beginning of the period. For the first-half of the fiscal year ended March 31, 2013, certain residential mortgage-backed securities which are accounted for as trading securities were transferred from Level 1 to Level 2 based on an analysis of the then-current market activity. In addition, a certain subsidiary, based on its analysis, transferred its U.S. government sponsored agency securities, which are accounted for as Securities available-for-sale, from Level 1 to Level 2.
F-142
Table of Contents
MITSUBISHI UFJ FINANCIAL GROUP, INC. AND SUBSIDIARIES
NOTES TO CONSOLIDATED FINANCIAL STATEMENTS—(Continued)
Changes in Level 3 Recurring Fair Value Measurements
The following tables present a reconciliation of the assets and liabilities measured at fair value on a recurring basis using significant unobservable inputs (Level 3) during the fiscal years ended March 31, 2013 and 2014. The determination to classify a financial instrument within Level 3 is based upon the significance of the unobservable inputs to overall fair value measurement. However, Level 3 financial instruments typically include, in addition to the unobservable or Level 3 input, observable inputs (that is, inputs that are actively quoted and can be validated to external sources). Accordingly, the gains and losses in the tables below include changes in fair value due in part to observable inputs used in the valuation techniques.
|
March 31,
2012 |
Total gains (losses)
for the period |
Purchases | Issues | Sales | Settlements |
Transfers
into Level 3 (5) |
Transfers
out of Level 3 (5) |
March 31,
2013 |
Change in
unrealized gains (losses) included in earnings for assets and liabilities still held at March 31, 2013 |
|||||||||||||||||||||||||||||||||||
|
Included
in earnings |
Included
in other comprehensive income |
|||||||||||||||||||||||||||||||||||||||||||
| (in millions) | ||||||||||||||||||||||||||||||||||||||||||||
|
Assets |
||||||||||||||||||||||||||||||||||||||||||||
|
Trading account assets: |
||||||||||||||||||||||||||||||||||||||||||||
|
Trading securities (1) |
¥ | 1,076,657 | ¥ | 77,239 | (2) | ¥ | — | ¥ | 518,698 | ¥ | — | ¥ | (360,580 | ) | ¥ | (378,767 | ) | ¥ | 49,521 | ¥ | (351,655 | ) | ¥ | 631,113 | ¥ | 64,764 | (2) | |||||||||||||||||
|
Debt securities |
||||||||||||||||||||||||||||||||||||||||||||
|
Foreign governments and official institutions bonds |
149,731 | 19,142 | — | 179,907 | — | (205,581 | ) | (24,043 | ) | 23,202 | (46,103 | ) | 96,255 | 11,831 | ||||||||||||||||||||||||||||||
|
Corporate bonds |
501,895 | 3,354 | — | 55,147 | — | (2,089 | ) | (223,088 | ) | 26,315 | (6) | (284,445 | ) (6)(7) | 77,089 | 5,206 | |||||||||||||||||||||||||||||
|
Residential mortgage-backed securities |
10,124 | 1,677 | — | 12,050 | — | (12,042 | ) | (1,928 | ) | — | — | 9,881 | 1,599 | |||||||||||||||||||||||||||||||
|
Asset-backed securities |
395,198 | 44,365 | — | 239,598 | — | (132,275 | ) | (129,708 | ) | — | (21,107 | ) | 396,071 | 41,748 | ||||||||||||||||||||||||||||||
|
Other debt securities |
— | 4,358 | — | 25,168 | — | — | — | — | — | 29,526 | 4,358 | |||||||||||||||||||||||||||||||||
|
Equity securities |
19,709 | 4,343 | — | 6,828 | — | (8,593 | ) | — | 4 | — | 22,291 | 22 | ||||||||||||||||||||||||||||||||
|
Trading derivatives—net |
(27,458 | ) | 20,344 | (2) | (5,408 | ) | 1,379 | (2,775 | ) | — | (24,964 | ) | 29,392 | (10,976 | ) | (20,466 | ) | 17,466 | (2) | |||||||||||||||||||||||||
|
Interest rate contracts—net |
(44,904 | ) | 42,457 | 233 | 2 | (4 | ) | — | (8,468 | ) | 8,431 | 3 | (2,250 | ) | 38,552 | |||||||||||||||||||||||||||||
|
Foreign exchange contracts—net |
23,907 | (28,164 | ) | (5,517 | ) | 448 | (1,852 | ) | — | (16,150 | ) | 21,644 | (11,122 | ) | (16,806 | ) | (27,532 | ) | ||||||||||||||||||||||||||
|
Equity contracts—net |
(7,019 | ) | 9,275 | 10 | 444 | (434 | ) | — | (833 | ) | (62 | ) | — | 1,381 | 9,449 | |||||||||||||||||||||||||||||
|
Commodity contracts—net |
162 | (438 | ) | (19 | ) | 485 | (485 | ) | — | (52 | ) | (600 | ) | 143 | (804 | ) | (140 | ) | ||||||||||||||||||||||||||
|
Credit derivatives—net |
396 | (2,786 | ) | (115 | ) | — | — | — | 539 | (21 | ) | — | (1,987 | ) | (2,863 | ) | ||||||||||||||||||||||||||||
|
Investment securities: |
||||||||||||||||||||||||||||||||||||||||||||
|
Securities available-for-sale |
1,673,387 | 3,218 | (3) | 16,083 | 230,505 | — | (14,809 | ) | (211,058 | ) | 113,491 | (1,338,690 | ) | 472,127 | (4,380 | ) (3) | ||||||||||||||||||||||||||||
|
Debt securities |
||||||||||||||||||||||||||||||||||||||||||||
|
Foreign governments and official institutions bonds |
130,720 | — | 2,582 | 23,158 | — | (31 | ) | (7,707 | ) | — | — | 148,722 | — | |||||||||||||||||||||||||||||||
|
Corporate bonds |
1,460,489 | 1,629 | (1,855 | ) | 11,465 | — | (12,843 | ) | (140,840 | ) | 113,491 | (6) | (1,338,690 | ) (6)(7) | 92,846 | (4,370 | ) | |||||||||||||||||||||||||||
|
Residential mortgage-backed securities |
22,351 | (27 | ) | 100 | 4,500 | — | — | (5,432 | ) | — | — | 21,492 | (1 | ) | ||||||||||||||||||||||||||||||
|
Commercial mortgage-backed securities |
3,802 | 1,090 | (126 | ) | — | — | (1,855 | ) | (2,872 | ) | — | — | 39 | — | ||||||||||||||||||||||||||||||
|
Asset-backed securities |
54,947 | 606 | 8,400 | 85,469 | — | — | (47,172 | ) | — | — | 102,250 | 30 | ||||||||||||||||||||||||||||||||
|
Other debt securities |
964 | (84 | ) | 6,980 | 105,889 | — | — | (7,035 | ) | — | — | 106,714 | (43 | ) | ||||||||||||||||||||||||||||||
|
Marketable equity securities |
114 | 4 | 2 | 24 | — | (80 | ) | — | — | — | 64 | 4 | ||||||||||||||||||||||||||||||||
|
Other investment securities |
32,321 | (505 | ) (4) | — | 875 | — | (3,092 | ) | (16 | ) | — | (4,788 | ) | 24,795 | (618 | ) (4) | ||||||||||||||||||||||||||||
|
Others |
10,368 | (597 | ) (4) | — | 637 | — | (1,990 | ) | — | — | — | 8,418 | 129 | (4) | ||||||||||||||||||||||||||||||
|
|
|
|
|
|
|
|
|
|
|
|
|
|
|
|
|
|
|
|
|
|
|
|||||||||||||||||||||||
|
Total |
¥ | 2,765,275 | ¥ | 99,699 | ¥ | 10,675 | ¥ | 752,094 | ¥ | (2,775 | ) | ¥ | (380,471 | ) | ¥ | (614,805 | ) | ¥ | 192,404 | ¥ | (1,706,109 | ) | ¥ | 1,115,987 | ¥ | 77,361 | ||||||||||||||||||
|
|
|
|
|
|
|
|
|
|
|
|
|
|
|
|
|
|
|
|
|
|
|
|||||||||||||||||||||||
|
Liabilities |
||||||||||||||||||||||||||||||||||||||||||||
|
Others |
43,536 | (74,957 | ) (4) | (20,590 | ) | 239 | 2,432 | — | (20,907 | ) | 1,181 | (96 | ) | 121,932 | (61,188 | ) (4) | ||||||||||||||||||||||||||||
|
|
|
|
|
|
|
|
|
|
|
|
|
|
|
|
|
|
|
|
|
|
|
|||||||||||||||||||||||
|
Total |
¥ | 43,536 | ¥ | (74,957 | ) | ¥ | (20,590 | ) | ¥ | 239 | ¥ | 2,432 | ¥ | — | ¥ | (20,907 | ) | ¥ | 1,181 | ¥ | (96 | ) | ¥ | 121,932 | ¥ | (61,188 | ) | |||||||||||||||||
|
|
|
|
|
|
|
|
|
|
|
|
|
|
|
|
|
|
|
|
|
|
|
|||||||||||||||||||||||
F-143
Table of Contents
MITSUBISHI UFJ FINANCIAL GROUP, INC. AND SUBSIDIARIES
NOTES TO CONSOLIDATED FINANCIAL STATEMENTS—(Continued)
|
March 31,
2013 |
Total gains (losses)
for the period |
Issues | Sales | Settlements |
Transfers
into Level 3 (5) |
Transfers
out of Level 3 (5) |
March 31,
2014 |
Change in
unrealized gains (losses) included in earnings for assets and liabilities still held at March 31, 2014 |
||||||||||||||||||||||||||||||||||||
|
Included
in earnings |
Included
in other comprehensive income |
Purchases | ||||||||||||||||||||||||||||||||||||||||||
| (in millions) | ||||||||||||||||||||||||||||||||||||||||||||
|
Assets |
||||||||||||||||||||||||||||||||||||||||||||
|
Trading account assets: |
||||||||||||||||||||||||||||||||||||||||||||
|
Trading securities (1) |
¥ | 631,113 | ¥ | 50,809 | (2) | ¥ | — | ¥ | 499,143 | ¥ | — | ¥ | (302,363 | ) | ¥ | (173,816 | ) | ¥ | 12,574 | ¥ | (58,543 | ) | ¥ | 658,917 | ¥ | 36,144 | (2) | |||||||||||||||||
|
Debt securities |
||||||||||||||||||||||||||||||||||||||||||||
|
Foreign governments and official institutions bonds |
96,255 | 4,905 | — | 65,828 | — | (72,059 | ) | (32,354 | ) | 2,414 | (49,539 | ) | 15,450 | 232 | ||||||||||||||||||||||||||||||
|
Corporate bonds |
77,089 | 4,916 | — | 100,011 | — | (43,326 | ) | (7,242 | ) | 10,074 | (6) | (9,004 | ) (6) | 132,518 | 4,922 | |||||||||||||||||||||||||||||
|
Residential mortgage-backed securities |
9,881 | 1,187 | — | 83,179 | — | (81,698 | ) | (948 | ) | — | — | 11,601 | 702 | |||||||||||||||||||||||||||||||
|
Asset-backed securities |
396,071 | 32,794 | — | 245,342 | — | (101,271 | ) | (133,272 | ) | — | — | 439,664 | 27,252 | |||||||||||||||||||||||||||||||
|
Other debt securities |
29,526 | 3,039 | — | — | — | — | — | — | — | 32,565 | 3,039 | |||||||||||||||||||||||||||||||||
|
Equity securities |
22,291 | 3,968 | — | 4,783 | — | (4,009 | ) | — | 86 | — | 27,119 | (3 | ) | |||||||||||||||||||||||||||||||
|
Trading derivatives—net |
(20,466 | ) | 30,791 | (2) | (3,463 | ) | 4,732 | (4,889 | ) | — | (2,252 | ) | 15,116 | (10,705 | ) | 8,864 | 15,146 | (2) | ||||||||||||||||||||||||||
|
Interest rate contracts—net |
(2,250 | ) | 19,554 | 714 | 878 | — | — | (4,762 | ) | 6,712 | (7,170 | ) | 13,676 | 14,695 | ||||||||||||||||||||||||||||||
|
Foreign exchange contracts—net |
(16,806 | ) | 9,615 | (3,835 | ) | 770 | (1,215 | ) | — | (431 | ) | 8,432 | (3,568 | ) | (7,038 | ) | 460 | |||||||||||||||||||||||||||
|
Equity contracts—net |
1,381 | 4,125 | 34 | 1,323 | (1,323 | ) | — | (1,345 | ) | — | — | 4,195 | 202 | |||||||||||||||||||||||||||||||
|
Commodity contracts—net |
(804 | ) | 109 | (10 | ) | 1,761 | (2,351 | ) | — | 668 | (28 | ) | 33 | (622 | ) | 809 | ||||||||||||||||||||||||||||
|
Credit derivatives —net |
(1,987 | ) | (2,612 | ) | (366 | ) | — | — | — | 3,618 | — | — | (1,347 | ) | (1,020 | ) | ||||||||||||||||||||||||||||
|
Investment securities: |
||||||||||||||||||||||||||||||||||||||||||||
|
Securities available-for-sale |
472,127 | 3,950 | (3) | 51,538 | 256,776 | — | (10,961 | ) | (218,806 | ) | 4,744 | (14,680 | ) | 544,688 | (869 | ) (3) | ||||||||||||||||||||||||||||
|
Debt securities |
||||||||||||||||||||||||||||||||||||||||||||
|
Foreign governments and official institutions bonds |
148,722 | — | 3,393 | 5,574 | — | — | (6,042 | ) | — | — | 151,647 | — | ||||||||||||||||||||||||||||||||
|
Corporate bonds |
92,846 | 4,059 | (51 | ) | 5,046 | — | (1,367 | ) | (14,772 | ) | 4,744 | (6) | (14,656 | ) (6) | 75,849 | (873 | ) | |||||||||||||||||||||||||||
|
Residential mortgage-backed securities |
21,492 | 3 | 83 | 3,015 | — | (609 | ) | (4,726 | ) | — | — | 19,258 | — | |||||||||||||||||||||||||||||||
|
Commercial mortgage-backed securities |
39 | — | (153 | ) | 3,265 | — | (39 | ) | — | — | — | 3,112 | — | |||||||||||||||||||||||||||||||
|
Asset-backed securities |
102,250 | (120 | ) | 17,636 | 178,735 | — | (8,751 | ) | (179,874 | ) | — | — | 109,876 | 4 | ||||||||||||||||||||||||||||||
|
Other debt securities |
106,714 | — | 30,630 | 61,118 | — | (195 | ) | (13,321 | ) | — | — | 184,946 | — | |||||||||||||||||||||||||||||||
|
Marketable equity securities |
64 | 8 | — | 23 | — | — | (71 | ) | — | (24 | ) | — | — | |||||||||||||||||||||||||||||||
|
Other investment securities |
24,795 | 1,751 | (4) | 14 | 2,879 | — | (2,126 | ) | (2 | ) | — | (1,110 | ) | 26,201 | 1,258 | (4) | ||||||||||||||||||||||||||||
|
Others |
8,418 | 432 | (4) | — | 336 | — | (3,588 | ) | — | — | — | 5,598 | 163 | (4) | ||||||||||||||||||||||||||||||
|
|
|
|
|
|
|
|
|
|
|
|
|
|
|
|
|
|
|
|
|
|
|
|||||||||||||||||||||||
|
Total |
¥ | 1,115,987 | ¥ | 87,733 | ¥ | 48,089 | ¥ | 763,866 | ¥ | (4,889 | ) | ¥ | (319,038 | ) | ¥ | (394,876 | ) | ¥ | 32,434 | ¥ | (85,038 | ) | ¥ | 1,244,268 | ¥ | 51,842 | ||||||||||||||||||
|
|
|
|
|
|
|
|
|
|
|
|
|
|
|
|
|
|
|
|
|
|
|
|||||||||||||||||||||||
|
Liabilities |
||||||||||||||||||||||||||||||||||||||||||||
|
Others |
121,932 | (19,097 | ) (4) | (24,145 | ) | — | 302 | — | (28,498 | ) | (10 | ) | (44,101 | ) | 92,867 | (10,707 | ) (4) | |||||||||||||||||||||||||||
|
|
|
|
|
|
|
|
|
|
|
|
|
|
|
|
|
|
|
|
|
|
|
|||||||||||||||||||||||
|
Total |
¥ | 121,932 | ¥ | (19,097 | ) | ¥ | (24,145 | ) | ¥ | — | ¥ | 302 | ¥ | — | ¥ | (28,498 | ) | ¥ | (10 | ) | ¥ | (44,101 | ) | ¥ | 92,867 | ¥ | (10,707 | ) | ||||||||||||||||
|
|
|
|
|
|
|
|
|
|
|
|
|
|
|
|
|
|
|
|
|
|
|
|||||||||||||||||||||||
Notes:
| (1) | Includes Trading securities under fair value option. |
| (2) | Included in Trading account profits (losses)—net and in Foreign exchange gains (losses)—net. |
| (3) | Included in Investment securities gains—net. |
| (4) | Included in Trading account profits (losses)—net. |
| (5) | All transfers out of Level 3 or into Level 3 were assumed to have occurred at the beginning of the first-half or the second-half of the fiscal year. |
| (6) | Transfers out of and transfers into Level 3 for corporate bonds were due principally to changes in the impact of unobservable credit worthiness inputs of the private placement bonds. |
| (7) | Certain private placement bonds issued by non-public companies which are accounted for as trading account securities amounted to ¥223,938 million and securities available-for-sale amounted to ¥1,209,272 million were transferred from Level 3 to Level 2 during the fiscal year ended March 31, 2013. These transfers were due to change in the significance of the unobservable inputs used to measure fair value of the private placement bonds. |
F-144
Table of Contents
MITSUBISHI UFJ FINANCIAL GROUP, INC. AND SUBSIDIARIES
NOTES TO CONSOLIDATED FINANCIAL STATEMENTS—(Continued)
Quantitative Information about Level 3 Fair Value Measurements
The following tables present information on the valuation techniques, significant unobservable inputs and their ranges for each major category of assets and liabilities measured at fair value on a recurring basis and classified in Level 3:
|
March 31, 2013 |
Fair value (1) |
Valuation technique |
Significant unobservable inputs |
Range |
Weighted
Average (2) |
|||||||||
| (in millions) | ||||||||||||||
|
Assets |
||||||||||||||
|
Trading securities and Investment securities: |
||||||||||||||
|
Foreign governments and official institutions bonds |
¥ |
33,649 |
|
Monte Carlo method |
Correlation between interest rate and foreign exchange rate |
32.5%~51.9% | 36.0 | % | ||||||
| Correlation between interest rates | 41.3%~63.3% | 62.1 | % | |||||||||||
| 19,699 | Return on equity method | Probability of default | 0.0%~8.0% | 0.7 | % | |||||||||
| Recovery rate | 25.0%~90.0% | 56.2 | % | |||||||||||
| Market-required return on capital | 15.0%~17.0% | 15.7 | % | |||||||||||
|
Corporate bonds |
62,788 | Discounted cash flow | Probability of default | 0.1%~14.2% | 4.2 | % | ||||||||
| Recovery rate | 15.0%~100.0% | 44.9 | % | |||||||||||
| 1,986 | Monte Carlo method |
Correlation between interest rate and foreign exchange rate |
32.5%~37.9% | 35.2 | % | |||||||||
| Correlation between interest rates | 63.3% | 63.3 | % | |||||||||||
| 9,059 | Internal model | Liquidity premium | 1.5%~2.5% | 2.3 | % | |||||||||
|
Residential mortgage-backed securities, Commercial mortgage-backed securities and Asset-backed securities |
72,640 | Discounted cash flow | Discount factor | 1.0%~1.2% | 1.1 | % | ||||||||
| Prepayment rate | 6.2%~14.8% | 8.8 | % | |||||||||||
| Probability of default | 0.0%~5.2% | 4.9 | % | |||||||||||
| Recovery rate | 0.0%~76.0% | 65.4 | % | |||||||||||
| 289,398 | Internal model | Asset correlations | 11.0%~14.0% | 13.5 | % | |||||||||
| Discount factor | 1.0%~4.8% | 1.5 | % | |||||||||||
| Prepayment rate | 3.9%~38.3% | 32.6 | % | |||||||||||
| Probability of default | 0.0%~84.6% | — | (3) | |||||||||||
| Recovery rate | 53.6%~69.8% | 67.5 | % | |||||||||||
|
Other debt securities |
29,526 | Discounted cash flow | Liquidity premium | 0.5%~0.8% | 0.8 | % | ||||||||
| 104,957 | Return on equity method | Probability of default | 0.0%~8.0% | 0.6 | % | |||||||||
| Recovery rate | 25.0%~90.0% | 64.8 | % | |||||||||||
| Market-required return on capital | 15.0%~17.0% | 16.5 | % | |||||||||||
F-145
Table of Contents
MITSUBISHI UFJ FINANCIAL GROUP, INC. AND SUBSIDIARIES
NOTES TO CONSOLIDATED FINANCIAL STATEMENTS—(Continued)
|
March 31, 2013 |
Fair value (1) | Valuation technique |
Significant unobservable inputs |
Range | ||||||||||
| (in millions) | ||||||||||||||
|
Trading derivatives—net: |
||||||||||||||
|
Interest rate contracts—net |
(2,533) | Option model | Probability of default | 0.3 | %~12.5% | |||||||||
| Correlation between interest rates | (0.1 | )%~97.6% | ||||||||||||
|
Correlation between interest rate and foreign exchange rate |
32.5 | %~60.2% | ||||||||||||
| Recovery rate | 40.0 | %~51.0% | ||||||||||||
| Volatility | 29.1 | %~58.3% | ||||||||||||
| Prepayment rate | 0.0 | %~2.3% | ||||||||||||
|
Foreign exchange contracts—net |
(16,806 | ) | Option model | Probability of default | 0.4 | %~14.2% | ||||||||
| Correlation between interest rates | 28.2 | %~80.6% | ||||||||||||
|
Correlation between interest rate and foreign exchange rate |
22.2 | %~66.3% | ||||||||||||
| Correlation between underlying assets | 44.1 | %~82.8% | ||||||||||||
| Recovery rate | 40.0 | %~51.0% | ||||||||||||
|
Equity contracts—net |
1,381 | Option model |
Correlation between interest rate and equity |
10.6 | %~52.0% | |||||||||
|
Credit derivative contracts—net |
(1,987 | ) | Option model | Recovery rate | 20.0 | %~36.8% | ||||||||
| Correlation between underlying assets | 11.6 | %~88.2% | ||||||||||||
F-146
Table of Contents
MITSUBISHI UFJ FINANCIAL GROUP, INC. AND SUBSIDIARIES
NOTES TO CONSOLIDATED FINANCIAL STATEMENTS—(Continued)
|
March 31, 2014 |
Fair value (1) | Valuation technique |
Significant unobservable inputs |
Range |
Weighted
Average (2) |
|||||||||
| (in millions) | ||||||||||||||
|
Assets |
||||||||||||||
|
Trading securities and Investment securities: |
||||||||||||||
|
Foreign governments and official institutions bonds |
¥
|
6,876
|
|
Monte Carlo method
|
Correlation between interest rate and foreign exchange rate |
32.6%~48.3% | 37.3 | % | ||||||
|
Correlation between interest rates |
42.1%~59.8% | 58.1 | % | |||||||||||
| 23,983 | Return on equity method |
Probability of default |
0.3%~1.9% | 0.9 | % | |||||||||
|
Recovery rate |
60.0%~80.0% | 73.0 | % | |||||||||||
|
Market-required return on capital |
8.0%~10.0% | 9.4 | % | |||||||||||
|
Corporate bonds |
126,101 | Discounted cash flow |
Probability of default |
0.1%~14.0% | 0.9 | % | ||||||||
|
Recovery rate |
14.0%~68.4% | 40.7 | % | |||||||||||
| 269 | Monte Carlo method |
Correlation between interest rate and foreign exchange rate |
32.6%~44.6% | 36.9 | % | |||||||||
|
Correlation between interest rates |
52.2%~59.8% | 59.5 | % | |||||||||||
| 9,064 | Internal model |
Liquidity premium |
1.5%~2.5% | 2.3 | % | |||||||||
|
Residential mortgage-backed securities, Commercial mortgage-backed securities and Asset-backed securities |
90,420 | Discounted cash flow |
Probability of default |
4.6%~5.1% | 5.0 | % | ||||||||
|
Recovery rate |
65.0%~76.0% | 68.0 | % | |||||||||||
| 430,386 | Internal model |
Asset correlations |
11.0%~14.0% | 13.7 | % | |||||||||
|
Discount factor |
1.5%~5.8% | 1.9 | % | |||||||||||
|
Prepayment rate |
4.5%~44.8% | 40.9 | % | |||||||||||
|
Probability of default |
0.0%~88.8% | — | (3) | |||||||||||
|
Recovery rate |
54.5%~79.2% | 77.7 | % | |||||||||||
|
Other debt securities |
32,565 | Discounted cash flow |
Liquidity premium |
0.6%~0.8% | 0.8 | % | ||||||||
| 182,613 | Return on equity method |
Probability of default |
0.0%~25.0% | 0.7 | % | |||||||||
|
Recovery rate |
25.0%~90.0% | 66.9 | % | |||||||||||
|
Market-required return on capital |
8.0%~10.0% | 9.7 | % | |||||||||||
F-147
Table of Contents
MITSUBISHI UFJ FINANCIAL GROUP, INC. AND SUBSIDIARIES
NOTES TO CONSOLIDATED FINANCIAL STATEMENTS—(Continued)
|
March 31, 2014 |
Fair value (1) | Valuation technique |
Significant unobservable inputs |
Range | ||||||||||
| (in millions) | ||||||||||||||
|
Trading derivatives—net: |
||||||||||||||
|
Interest rate contracts—net |
12,366 | Option model |
Probability of default |
0.0 | %~14.0% | |||||||||
|
Correlation between interest rates |
22.8 | %~99.4% | ||||||||||||
|
Correlation between interest rate and foreign exchange rate |
31.2 | %~48.3% | ||||||||||||
|
Recovery rate |
40.0 | %~47.0% | ||||||||||||
|
Volatility |
27.1 | %~39.5% | ||||||||||||
|
Foreign exchange contracts—net |
(7,038 | ) | Option model |
Probability of default |
0.1 | %~14.0% | ||||||||
|
Correlation between interest rates |
38.8 | %~78.7% | ||||||||||||
|
Correlation between interest rate and foreign exchange rate |
31.2 | %~58.7% | ||||||||||||
|
Correlation between underlying assets |
49.9 | %~85.0% | ||||||||||||
|
Recovery rate |
40.0 | %~47.0% | ||||||||||||
|
Equity contracts—net |
4,548 | Option model |
Correlation between interest rate and equity |
24.9 | %~49.0% | |||||||||
|
Credit derivative contracts—net |
(1,347 | ) | Option model |
Recovery rate |
37.0 | %~37.0% | ||||||||
|
Correlation between underlying assets |
11.4 | %~87.3% | ||||||||||||
Notes:
| (1) | The fair value as of March 31, 2013 and 2014 excludes the fair value of investments valued using vendor prices. |
| (2) | Weighted averages are calculated by weighting each input by the relative fair value of the respective financial instruments. |
| (3) | See “Probability of default” in “Sensitivity to and range of unobservable inputs”. |
Sensitivity to and range of unobservable inputs
Probability of default —Probability of default is an estimate of the likelihood that the default event will occur and the MUFG Group will be unable to collect the contractual amounts. A significant increase (decrease) in the default rate would result in a significant decrease (increase) in a fair value through a decrease (increase) in the estimated cash flows. Probability of default used in Internal model of Residential mortgage-backed securities, Commercial mortgage-backed securities and Asset-backed securities represents that of underlying assets, whereas probability of default used in other valuation techniques represents the counterparty default risks, determined through the MUFG Group’s credit rating system.
The wide range of probability of default used in Internal model of Residential mortgage-backed securities, Commercial mortgage-backed securities and Asset-backed securities is mainly caused by Asset-backed securities. Asset-backed securities have a large number of underlying loans, mainly corporate loans, in several industries. The MUFG Group primarily makes investments in the senior tranches of such securities, with no investments in the equity portion. Thus, the MUFG Group’s investments have higher priority of payments than mezzanine and equity and even if some of underlying loans become default status, the MUFG Group may still be able to receive the full contractual payments.
For derivative contracts, the MUFG Group holds positions with a large number of counterparties with various credit quality, which results in wider range of probability of default. However, the majority of counterparties have higher ratings, categorized as “Normal” in the internal credit rating system, the inputs used to estimate fair value of derivative contracts are concentrated in the lower end of the range.
Discount factor and Liquidity premium —Discount factor and liquidity premium are adjustments to discount rates to reflect uncertainty of cash flows and liquidity of the instruments. When recent prices of similar instruments are unobservable in inactive or less active markets, discount rates are adjusted based on facts and circumstances of the markets including the availability of quotes and the time since the latest available quotes. A significant increase (decrease) in discount rate would result in a significant decrease (increase) in a fair value.
F-148
Table of Contents
MITSUBISHI UFJ FINANCIAL GROUP, INC. AND SUBSIDIARIES
NOTES TO CONSOLIDATED FINANCIAL STATEMENTS—(Continued)
Recovery rate and Prepayment rate —Recovery rate is the proportion of the total outstanding balance of a bond or loan that is expected to be collected in a liquidation scenario. For many credit securities (such as asset-backed securities), there is no directly observable market input for recovery, but indications of recovery levels are available from third-party pricing services. The assumed recovery of a security may differ from its actual recovery that will be observable in the future. Prepayment rate represents the proportion of principal that is expected to be paid prematurely in each period on a security or pool of securities. Prepayment rates change the future cash flows for the investor and thereby change the fair value of the security. Recovery rate and prepayment rate would affect estimation of future cash flows to a certain extent and changes in these inputs could result in a significant increase or decrease in fair value.
Volatility —Volatility is a measure of the speed and severity of market price changes and is a key factor in pricing. Typically, instruments can become more expensive if volatility increases. A significant increase (decrease) in volatility would result in a significant increase (decrease) in fair value through a significant increase (decrease) in the value of an option.
The level of volatility generally depends on the tenor of the underlying instrument and the strike price or level defined in the contract. Volatilities for certain combinations of tenor and strike are not observable. The volatility inputs used to estimate fair value of interest rate contracts are distributed throughout the range.
Correlation —Correlation is a measure of the co-movement between two variables. A variety of correlation-related assumptions are required for a wide range of instruments including foreign governments and official institutions bonds, asset-backed securities, corporate bonds, derivatives and certain other instruments. In most cases, correlations used are not observable in the market and must be estimated using historical information. Changes in correlation inputs can have a major impact, favorable or unfavorable, on the value of an instrument, depending on its nature. In addition, the wide range of correlation inputs are primarily due to the complex and unique nature of these instruments. There are many different types of correlation inputs, including cross-asset correlation (such as correlation between interest rate and equity), and same-asset correlation (such as correlation between interest rates). Correlation levels are highly dependent on market conditions and could have a relatively wide range of levels within or across asset classes.
For interest rate contracts and foreign exchange contracts, the diversity in the portfolio held by the MUFG Group is reflected in wide ranges of correlation, as the fair values of transactions with a variety of currencies and tenors are determined using several foreign exchange and interest rate curves. For equity derivative contracts, the wide range of correlation between interest rate and equity is primarily due to the large number of correlation pairs with different maturities of contracts. For credit derivative contracts, the wide range of correlation between underlying assets is primarily due to factors such as reference assets with different maturities, capital structure subordinations, and credit quality.
Valuation Process for Level 3 Fair Value Measurements
The MUFG Group establishes valuation policies and procedures for measuring fair value, for which the risk management departments ensure that the valuation techniques used are logical, appropriate and consistent with market information. The financial accounting offices ensure that the valuation techniques are consistent with the accounting policies.
In accordance with the valuation policies and procedures, fair value is determined by the risk management departments or similar sections that are independent of the front offices in order to ensure objectivity and validity of measuring fair value. An analysis performed on the determined fair value is periodically reported to the management.
F-149
Table of Contents
MITSUBISHI UFJ FINANCIAL GROUP, INC. AND SUBSIDIARIES
NOTES TO CONSOLIDATED FINANCIAL STATEMENTS—(Continued)
When valuation techniques are used to measure fair value, the valuation techniques are required to be pre-approved by the risk management departments. If the risk management departments determine that the techniques are not consistent with market practice, the valuation techniques are modified as necessary.
Fair value measurements are verified for reasonableness by the risk management departments which are responsible to perform an analytical review of the fair value measurements which includes a comparison with market trends and information.
For broker-dealer quotes, internal price verification procedures are performed by the risk management departments. Such verification procedures include analytical review of periodic price changes, comparison analysis between periodic price changes and changes of indices such as a credit default swap index, or inquiries regarding the underlying inputs and assumptions used by the broker-dealers such as probability of default, prepayment rate and discount margin.
Unobservable inputs used in a level 3 fair value measurement are internally estimated by the risk management departments based upon the market information such as observable inputs. The reasonableness of the inputs is validated by other risk management departments by comparison analysis between the market value of financial instruments using such level 3 inputs and the internally estimated fair value, to the extent necessary.
Assets and Liabilities Measured at Fair Value on a Nonrecurring Basis
Certain assets and liabilities may be measured at fair value on a nonrecurring basis in periods subsequent to their initial recognition. These assets are subject to fair value adjustments that result from the application of the lower of cost or fair value accounting or write-downs of individual assets. The following table presents the carrying value of assets measured at fair value on a nonrecurring basis by level within the fair value hierarchy as of March 31, 2013 and 2014:
| March 31, 2013 | March 31, 2014 | |||||||||||||||||||||||||||||||
| Level 1 | Level 2 | Level 3 |
Total
carrying value |
Level 1 | Level 2 | Level 3 |
Total
carrying value |
|||||||||||||||||||||||||
| (in millions) | ||||||||||||||||||||||||||||||||
|
Assets |
||||||||||||||||||||||||||||||||
|
Investment securities (1) |
¥ | — | ¥ | — | ¥ | 6,466 | ¥ | 6,466 | ¥ | — | ¥ | — | ¥ | 5,469 | ¥ | 5,469 | ||||||||||||||||
|
Loans |
11,757 | 18,236 | 351,584 | 381,577 | 11,510 | 15,834 | 303,757 | 331,101 | ||||||||||||||||||||||||
|
Loans held for sale |
— | — | 4,104 | 4,104 | — | 549 | 6,890 | 7,439 | ||||||||||||||||||||||||
|
Collateral dependent loans |
11,757 | 18,236 | 347,480 | 377,473 | 11,510 | 15,285 | 296,867 | 323,662 | ||||||||||||||||||||||||
|
Premises and equipment |
— | — | 8,938 | 8,938 | — | — | 6,264 | 6,264 | ||||||||||||||||||||||||
|
Intangible assets |
— | — | 549 | 549 | — | — | 228 | 228 | ||||||||||||||||||||||||
|
Other assets |
17,105 | — | 16,340 | 33,445 | 15,138 | 60,833 | 10,161 | 86,132 | ||||||||||||||||||||||||
|
Investments in equity method investees (1) |
17,105 | — | 11,751 | 28,856 | 15,138 | 60,833 | 7,902 | 83,873 | ||||||||||||||||||||||||
|
Other |
— | — | 4,589 | 4,589 | — | — | 2,259 | 2,259 | ||||||||||||||||||||||||
|
|
|
|
|
|
|
|
|
|
|
|
|
|
|
|
|
|||||||||||||||||
|
Total |
¥ | 28,862 | ¥ | 18,236 | ¥ | 383,877 | ¥ | 430,975 | ¥ | 26,648 | ¥ | 76,667 | ¥ | 325,879 | ¥ | 429,194 | ||||||||||||||||
|
|
|
|
|
|
|
|
|
|
|
|
|
|
|
|
|
|||||||||||||||||
Note:
| (1) | Includes investments valued at net asset value of ¥4,354 million and ¥3,483 million at March 31, 2013 and 2014, respectively. The unfunded commitments related to these investments are ¥1,603 million and ¥864 million at March 31, 2013 and 2014, respectively. These investments are private equity funds. |
F-150
Table of Contents
MITSUBISHI UFJ FINANCIAL GROUP, INC. AND SUBSIDIARIES
NOTES TO CONSOLIDATED FINANCIAL STATEMENTS—(Continued)
The following table presents losses recorded as a result of nonrecurring changes in fair value for the fiscal years ended March 31, 2013 and 2014:
|
Losses for
the fiscal year ended March 31, |
||||||||
| 2013 | 2014 | |||||||
| (in millions) | ||||||||
|
Investment securities |
¥ | 2,387 | ¥ | 4,113 | ||||
|
Loans |
92,438 | 58,660 | ||||||
|
Loans held for sale |
380 | 106 | ||||||
|
Collateral dependent loans |
92,058 | 58,554 | ||||||
|
Premises and equipment |
5,536 | 13,899 | ||||||
|
Intangible assets |
3,378 | 312 | ||||||
|
Goodwill |
— | 7,792 | ||||||
|
Other assets |
16,820 | 33,905 | ||||||
|
Investments in equity method investees |
14,635 | 32,824 | ||||||
|
Other |
2,185 | 1,081 | ||||||
|
|
|
|
|
|||||
|
Total |
¥ | 120,559 | ¥ | 118,681 | ||||
|
|
|
|
|
|||||
Investment securities primarily include impaired cost-method investments which were written down to fair value during the period. The fair values are determined based on recent net asset value and projected future cash flows of investees.
Loans include loans held for sale and collateral dependent loans. Loans held for sale are recorded at the lower of cost or estimated fair value. The fair value of the loans held for sale is based on secondary market prices, recent transactions or discounted cash flows. These loans are principally classified in Level 3 of the fair value hierarchy, and when quoted prices are available but not traded actively, such loans held for sale are classified in Level 2 of the fair value hierarchy. Collateral dependent loans are measured at fair value of the underlying collateral. Collateral is comprised mainly of real estate and exchange-traded equity securities. The MUFG Group maintains an established process for internally determining the fair value of real estate, using the following valuation techniques and assumptions. Collateral dependent loans that are measured based on underlying real estate collateral are classified in Level 3 of the fair value hierarchy.
| Ÿ | Replacement cost approach. The replacement cost approach is primarily used for buildings and the land they are built on. This approach calculates the fair value of the collateral using the replacement cost of the property as of the valuation date. Replacement cost tables and useful life tables used for this approach are developed by subsidiaries of MUFG. |
| Ÿ | Sales comparison approach. The sales comparison approach is mainly used for land. The fair value of the collateral is based on Japanese government official land prices and standard land prices, considering the results of comparison analysis between the official roadside value which is used for tax purposes and the related government official land and standard land prices. |
| Ÿ | Income approach. The income approach is, as a general rule, applied to all rental properties based on the highest and best use concept. This approach calculates the fair value of the collateral using expected future cash flows. In this approach, the expected annual net operating income is discounted using the related capitalization yield. The significant assumptions within the income approach are the expected annual net operating income and capitalization yield. The expected annual net operating income is estimated based on rental income of the property. The capitalization yield is determined based on the location and use of the property by subsidiaries of MUFG. The capitalization yield may be adjusted to reflect the trends in locations, occupancy rates and rent level and other factors. |
F-151
Table of Contents
MITSUBISHI UFJ FINANCIAL GROUP, INC. AND SUBSIDIARIES
NOTES TO CONSOLIDATED FINANCIAL STATEMENTS—(Continued)
Premises and equipment consist of those assets which were written down to fair value. The fair values are determined based on prices obtained from an appraiser or discounted cash flows. These impaired premises and equipment are classified as Level 3 of the fair value hierarchy.
Intangible assets consist of those assets which were written down to fair value. The fair values are determined based on discounted cash flows. These impaired intangible assets are classified as Level 3 of the fair value hierarchy.
Other assets mainly consist of investments in equity method investees which were written down to fair value due to impairment. The MUFG Group records impairment losses when a decline in fair value below cost is other-than-temporary. The impairment losses are included in Equity in earnings (losses) of equity method investees—net in the accompanying consolidated statements of income. When investments in equity method investees are marketable equity securities, the fair values are determined based on quoted prices. Impaired investments in equity method investees which are marketable equity securities are classified in either Level 1 or Level 2 of the fair value hierarchy. When investments in equity method investees are nonmarketable equity securities, the fair values are determined using the same methodologies as impaired nonmarketable equity securities described above. Impaired investments in equity method investees which are nonmarketable equity securities are classified in Level 3 of the fair value hierarchy.
Fair Value Option
The MUFG Group elected the fair value option for foreign currency-denominated debt securities and equity securities held by BTMU and MUTB. The election was made to mitigate accounting mismatches related to fluctuations of foreign exchange rates by allowing the gains and losses on translation of these securities to be included in current earnings. Had the fair value option not been elected, the gains and losses on translation of these securities would have been reflected in OCI, while the gains and losses on translation of foreign currency-denominated financial liabilities would have been included in current earnings.
The MUFG Group also elected the fair value option for certain financial instruments held by MUSHD’s foreign subsidiaries because those financial instruments are managed on a fair value basis, and these exposures are considered to be trading-related positions. These financial assets are included in Other assets. These financial liabilities are mainly included in Other short-term borrowings and Long-term debt. Unrealized gains and losses on such financial instruments are recognized in the accompanying consolidated statements of income.
F-152
Table of Contents
MITSUBISHI UFJ FINANCIAL GROUP, INC. AND SUBSIDIARIES
NOTES TO CONSOLIDATED FINANCIAL STATEMENTS—(Continued)
The following table presents the gains or losses recorded during the fiscal years ended March 31, 2013 and 2014 related to the eligible instruments for which the MUFG Group elected the fair value option:
| For the fiscal years ended March 31, | ||||||||||||||||||||||||
| 2013 | 2014 | |||||||||||||||||||||||
|
Trading
account profits (losses) |
Foreign
exchange gains (losses) |
Total
changes in fair value |
Trading
account profits (losses) |
Foreign
exchange gains (losses) |
Total
changes in fair value |
|||||||||||||||||||
| (in millions) | ||||||||||||||||||||||||
|
Financial assets: |
||||||||||||||||||||||||
|
Receivables under resale agreements (1) |
¥ | (1,436 | ) | ¥ | — | ¥ | (1,436 | ) | ¥ | — | ¥ | — | ¥ | — | ||||||||||
|
Trading account securities |
311,827 | 2,185,903 | 2,497,730 | (225,985 | ) | 2,017,311 | 1,791,326 | |||||||||||||||||
|
Other assets |
(469 | ) | — | (469 | ) | (531 | ) | — | (531 | ) | ||||||||||||||
|
|
|
|
|
|
|
|
|
|
|
|
|
|||||||||||||
|
Total |
¥ | 309,922 | ¥ | 2,185,903 | ¥ | 2,495,825 | ¥ | (226,516 | ) | ¥ | 2,017,311 | ¥ | 1,790,795 | |||||||||||
|
|
|
|
|
|
|
|
|
|
|
|
|
|||||||||||||
|
Financial liabilities: |
||||||||||||||||||||||||
|
Other short-term borrowings (1) |
¥ | 1,542 | ¥ | — | ¥ | 1,542 | ¥ | 4,064 | ¥ | — | ¥ | 4,064 | ||||||||||||
|
Long-term debt (1) |
22,097 | — | 22,097 | 87,877 | — | 87,877 | ||||||||||||||||||
|
|
|
|
|
|
|
|
|
|
|
|
|
|||||||||||||
|
Total |
¥ | 23,639 | ¥ | — | ¥ | 23,639 | ¥ | 91,941 | ¥ | — | ¥ | 91,941 | ||||||||||||
|
|
|
|
|
|
|
|
|
|
|
|
|
|||||||||||||
Note:
| (1) | Change in value attributable to the instrument-specific credit risk related to those financial assets and liabilities are not material. |
The following table presents the differences between the aggregate fair value and the aggregate remaining contractual principal balance outstanding as of March 31, 2013 and 2014 for long-term receivables and debt instruments for which the fair value option has been elected:
| 2013 | 2014 | |||||||||||||||||||||||
|
Remaining
aggregate contractual amounts outstanding |
Fair value |
Fair value
over (under) remaining aggregate contractual amounts outstanding |
Remaining
aggregate contractual amounts outstanding |
Fair value |
Fair value
over (under) remaining aggregate contractual amounts outstanding |
|||||||||||||||||||
| (in millions) | ||||||||||||||||||||||||
|
Financial assets: |
||||||||||||||||||||||||
|
Other assets |
¥ | 3,000 | ¥ | 3,006 | ¥ | 6 | ¥ | 2,000 | ¥ | 2,000 | ¥ | — | ||||||||||||
|
|
|
|
|
|
|
|
|
|
|
|
|
|||||||||||||
|
Total |
¥ | 3,000 | ¥ | 3,006 | ¥ | 6 | ¥ | 2,000 | ¥ | 2,000 | ¥ | — | ||||||||||||
|
|
|
|
|
|
|
|
|
|
|
|
|
|||||||||||||
|
Financial liabilities: |
||||||||||||||||||||||||
|
Long-term debt |
¥ | 650,382 | ¥ | 564,845 | ¥ | (85,537 | ) | ¥ | 728,385 | ¥ | 687,927 | ¥ | (40,458 | ) | ||||||||||
|
|
|
|
|
|
|
|
|
|
|
|
|
|||||||||||||
|
Total |
¥ | 650,382 | ¥ | 564,845 | ¥ | (85,537 | ) | ¥ | 728,385 | ¥ | 687,927 | ¥ | (40,458 | ) | ||||||||||
|
|
|
|
|
|
|
|
|
|
|
|
|
|||||||||||||
Interest income and expense and dividend income related to the assets and liabilities for which the fair value option is elected are measured based on the contractual rates and reported in the accompanying consolidated statements of income as either interest income or expense, depending on the nature of the related asset or liability.
F-153
Table of Contents
MITSUBISHI UFJ FINANCIAL GROUP, INC. AND SUBSIDIARIES
NOTES TO CONSOLIDATED FINANCIAL STATEMENTS—(Continued)
Estimated Fair Value of Financial Instruments
The following is a summary of carrying amounts and estimated fair values by level within the fair value hierarchy of financial instruments which are not carried at fair value on the accompanying consolidated balance sheets as of March 31, 2013 and 2014:
| March 31, 2013 | ||||||||||||||||||||
|
Carrying
amount |
Estimated fair value | |||||||||||||||||||
| Total | Level 1 | Level 2 | Level 3 | |||||||||||||||||
| (in billions) | ||||||||||||||||||||
|
Financial assets: |
||||||||||||||||||||
|
Cash and due from banks |
¥ | 3,619 | ¥ | 3,619 | ¥ | 3,619 | ¥ | — | ¥ | — | ||||||||||
|
Interest-earning deposits in other banks |
8,112 | 8,112 | — | 8,112 | — | |||||||||||||||
|
Call loans and funds sold |
619 | 619 | — | 619 | — | |||||||||||||||
|
Receivables under resale agreements |
5,660 | 5,660 | — | 5,660 | — | |||||||||||||||
|
Receivables under securities borrowing transactions |
2,615 | 2,615 | — | 2,615 | — | |||||||||||||||
|
Investment securities (1) |
2,492 | 2,778 | 272 | 495 | 2,011 | |||||||||||||||
|
Loans, net of allowance for credit losses (2) |
97,254 | 98,729 | 12 | 284 | 98,433 | |||||||||||||||
|
Other financial assets |
5,132 | 5,132 | — | 5,132 | — | |||||||||||||||
|
Financial liabilities: |
||||||||||||||||||||
|
Deposits |
||||||||||||||||||||
|
Non-interest-bearing |
¥ | 18,810 | ¥ | 18,810 | ¥ | — | ¥ | 18,810 | ¥ | — | ||||||||||
|
Interest-bearing |
129,420 | 129,480 | — | 129,480 | — | |||||||||||||||
|
Total deposits |
148,230 | 148,290 | — | 148,290 | — | |||||||||||||||
|
Call money and funds purchased |
4,011 | 4,011 | — | 4,011 | — | |||||||||||||||
|
Payables under repurchase agreements |
15,700 | 15,700 | — | 15,700 | — | |||||||||||||||
|
Payables under securities lending transactions |
3,993 | 3,993 | — | 3,993 | — | |||||||||||||||
|
Due to trust account |
633 | 633 | — | 633 | — | |||||||||||||||
|
Other short-term borrowings |
11,604 | 11,604 | — | 11,604 | — | |||||||||||||||
|
Long-term debt |
11,622 | 11,980 | — | 11,969 | 11 | |||||||||||||||
|
Other financial liabilities |
4,753 | 4,753 | — | 4,753 | — | |||||||||||||||
F-154
Table of Contents
MITSUBISHI UFJ FINANCIAL GROUP, INC. AND SUBSIDIARIES
NOTES TO CONSOLIDATED FINANCIAL STATEMENTS—(Continued)
| March 31, 2014 | ||||||||||||||||||||
|
Carrying
amount |
Estimated fair value | |||||||||||||||||||
| Total | Level 1 | Level 2 | Level 3 | |||||||||||||||||
| (in billions) | ||||||||||||||||||||
|
Financial assets: |
||||||||||||||||||||
|
Cash and due from banks |
¥ | 3,689 | ¥ | 3,689 | ¥ | 3,689 | ¥ | — | ¥ | — | ||||||||||
|
Interest-earning deposits in other banks |
20,501 | 20,501 | — | 20,501 | — | |||||||||||||||
|
Call loans and funds sold |
919 | 919 | — | 919 | — | |||||||||||||||
|
Receivables under resale agreements |
7,300 | 7,300 | — | 7,300 | — | |||||||||||||||
|
Receivables under securities borrowing transactions |
4,210 | 4,210 | — | 4,210 | — | |||||||||||||||
|
Investment securities (1) |
2,870 | 2,908 | 220 | 701 | 1,987 | |||||||||||||||
|
Loans, net of allowance for credit losses (2) |
109,182 | 110,577 | 11 | 307 | 110,259 | |||||||||||||||
|
Other financial assets |
5,832 | 5,832 | — | 5,832 | — | |||||||||||||||
|
Financial liabilities: |
||||||||||||||||||||
|
Deposits |
||||||||||||||||||||
|
Non-interest-bearing |
¥ | 21,123 | ¥ | 21,123 | ¥ | — | ¥ | 21,123 | ¥ | — | ||||||||||
|
Interest-bearing |
141,406 | 141,447 | — | 141,447 | — | |||||||||||||||
|
Total deposits |
162,529 | 162,570 | — | 162,570 | — | |||||||||||||||
|
Call money and funds purchased |
3,417 | 3,417 | — | 3,417 | — | |||||||||||||||
|
Payables under repurchase agreements |
21,268 | 21,268 | — | 21,268 | — | |||||||||||||||
|
Payables under securities lending transactions |
5,521 | 5,521 | — | 5,521 | — | |||||||||||||||
|
Due to trust account |
750 | 750 | — | 750 | — | |||||||||||||||
|
Other short-term borrowings |
11,077 | 11,077 | — | 11,077 | — | |||||||||||||||
|
Long-term debt |
13,823 | 14,118 | — | 14,118 | — | |||||||||||||||
|
Other financial liabilities |
5,123 | 5,123 | — | 5,123 | — | |||||||||||||||
| Notes: |
| (1) | Includes impaired securities measured at fair value on a nonrecurring basis. Refer to “Assets and Liabilities Measured at Fair Value on a Nonrecurring Basis” for the details of the level classification. |
| (2) | Includes loans held for sale and collateral dependent loans measured at fair value on a nonrecurring basis. Refer to “Assets and Liabilities Measured at Fair Value on a Nonrecurring Basis” for the details of the level classification. |
The following section describes the valuation techniques adopted by the MUFG Group to estimate fair values of financial instruments that are not recorded at fair value on the accompanying consolidated balance sheets.
Cash and due from banks, Interest-earning deposits in other banks, Call loans and funds sold, Receivables under resale agreements and Receivable under securities borrowing transactions —For cash and due from banks, interest-earning deposits in other banks, call loans and funds sold, receivables under resale agreements and receivable under securities borrowing transactions, the carrying amounts are a reasonable estimate of the fair values because of their short-term nature and limited credit risk.
Investment securities —The fair values of investment securities other than those classified as available-for-sale or being held-to-maturity (i.e., nonmarketable equity securities) are not readily determinable as they do not have readily available quoted prices or secondary market prices. The fair values of certain nonmarketable equity securities, such as preferred stock convertible to marketable common stock issued by public companies are determined by utilizing commonly accepted valuation techniques to derive a fair value using the present value of dividend cash flows and option prices. For option prices, the Trinomial Tree Method determines possible paths of future stock prices using a forward rate for a common stock, and the price is calculated by multiplying the possible paths of future stock prices by the expected cash flows generated from the probability of exercising
F-155
Table of Contents
MITSUBISHI UFJ FINANCIAL GROUP, INC. AND SUBSIDIARIES
NOTES TO CONSOLIDATED FINANCIAL STATEMENTS—(Continued)
options or upon exercising of the options. Inputs used in the valuation include but are not limited to stock price, volatility and credit spread. The valuation is performed on a quarterly basis. At the time of any sale, the MUFG Group generally separately calculates a valuation to be used in sales price negotiations with the counterparty. The price agreed between the MUFG Group and a counterparty is also used as a reference for validating the appropriateness of previous valuations of the investment. The MUFG Group performs periodic validation of the valuation techniques. Specifically, the sensitivity and appropriateness of the inputs are verified by using different valuation techniques employed by the MUFG Group. It is not practicable for the MUFG Group to estimate the fair value of other nonmarketable securities issued by nonpublic companies for which a quoted price is not available. For these securities, the MUFG Group is unable to estimate fair value without incurring undue cost because they comprise investments in numerous nonpublic companies and each investment represents an insignificant percentage relative to each company. Therefore, the above summary does not include the carrying amounts of such investment securities. The carrying amounts not included in the above summary are ¥504 billion and ¥549 billion at March 31, 2013 and 2014, respectively.
Loans —The fair value of loans is estimated by discounting expected future cash flows based on types of loans, internal ratings and possibility of prepayment using the discount rates which include adjustments to reflect the expectations about possible variations to the current market rates. For certain residential loans with variable interest rates provided to individual home owners, the carrying amount is presented as the fair value since such carrying amount approximates the fair value, unless the creditworthiness of the borrower has changed significantly since the loan origination. Where quoted prices or estimated fair values are available, primarily for loans to refinancing countries, loans held for sales and certain other foreign loans, the fair values are based on such market prices and estimated fair values, including secondary market prices. For receivables from bankrupt, virtually bankrupt, and likely to become bankrupt borrowers, credit loss is estimated based mainly on the expected amount to be collected from collateral and guarantees. The carrying amount is presented as the fair value since the fair value approximates such carrying amount.
Other financial assets —The estimated fair values of other financial assets, which primarily include accrued interest receivable, customers’ acceptance liabilities and accounts receivable, approximate their carrying amounts. The above summary does not include the carrying amounts of investments in equity method investees amounting to ¥1,274 billion and ¥1,620 billion at March 31, 2013 and 2014, respectively.
Non-interest-bearing deposits, Call money and funds purchased, Payables under repurchase agreements and Payable under securities lending transactions —For non-interest-bearing deposits, the amount payable on demand as of the consolidated balance sheet date (i.e., the carrying amount) is considered to be the fair value. For call money and funds purchased, payables under repurchase agreements and payable under securities lending transactions, the carrying amount are reasonable estimate of the fair value because of their short-term nature and limited credit risk.
Interest–bearing deposits —For variable rate time deposits, the carrying amount is presented as the fair value because the market interest rate is reflected in such deposits within a short time period. Fixed rate time deposits are grouped by certain maturity lengths. The fair value of such deposits are estimated by discounting expected future cash flows using the discount rates that would be applied to newly accepted deposits.
Due to trust account —Since these are cash deposits with no maturity, the carrying amount is presented as the fair value as the fair value approximates such carrying amount.
Other short-term borrowings —For most other short-term borrowings, the carrying amount is presented as the fair value since such carrying amount approximates the fair value because of their short-term nature and limited credit risk.
F-156
Table of Contents
MITSUBISHI UFJ FINANCIAL GROUP, INC. AND SUBSIDIARIES
NOTES TO CONSOLIDATED FINANCIAL STATEMENTS—(Continued)
Long-term debt —The fair value of corporate bonds issued by the MUFG Group is determined based on quoted prices of those corporate bonds. The fair value of fixed rate corporate bonds without quoted prices is the present value of expected future cash flows from these borrowings, which is discounted at an interest rate generally applicable to similar borrowings reflecting premium applicable to the MUFG Group. For variable rate corporate bonds without quoted prices, the carrying amount of such bonds is presented as the fair value since such carrying amount approximates the fair value. This is on the basis that the market interest rate is reflected in the fair value of such corporate bonds because such bond terms were set within a short time period and that there has been no significant impact on the fair value of those bonds.
Other financial liabilities —The estimated fair values of other financial liabilities, which primarily include accrued interest payable, bank acceptances, accounts payable and obligations under standby letters of credit and guarantees, approximate their carrying amounts. The fair values of obligations under standby letters of credit and guarantees are based on fees received or receivable by the MUFG Group.
The fair values of certain off-balance sheet financial instruments held for purposes other than trading, including commitments to extend credit and commercial letters of credit, are estimated using the fees currently charged to enter into similar agreements, taking into account the remaining terms of the agreements and the credit quality. The aggregate fair value of such instruments at March 31, 2013 and 2014 was not material.
The fair value estimates presented herein are based on pertinent information available to management at March 31, 2013 and 2014. These amounts have not been comprehensively reevaluated since that date, and therefore, current estimates of fair values may have changed significantly from the amounts presented herein.
| 32. | STOCK-BASED COMPENSATION |
The following describes the stock-based compensation plans of MUFG, BTMU, MUTB, MUSHD, MUMSS and MUAH.
MUFG, BTMU, MUTB, MUSHD and MUMSS
MUFG, BTMU, MUTB, MUSHD and MUMSS have a stock-based compensation plan for directors, executive officers, corporate auditors and senior fellows (“officers”).
The awards under the stock-based compensation plan are a type of stock option (referred to as “Stock Acquisition Rights”) to officers of MUFG, BTMU, MUTB, MUSHD and MUMSS. The Stock Acquisition Rights were normally issued and granted to these officers once a year until the fiscal year ended March 31, 2013. They are normally issued and granted to these officers except for corporate auditors once a year from the fiscal year ended March 31, 2014.
The class of shares to be issued or transferred on exercise of the Stock Acquisition Rights is common stock of MUFG. The number of shares to be issued or transferred on exercise of each Stock Acquisition Right (“number of granted shares”) is 100 shares. In the event of stock split or stock merger of common stock of MUFG, the number of granted shares shall be adjusted in accordance with the ratio of the stock split or stock merger. If any events occur that require the adjustment to the number of granted shares (e.g., mergers, consolidations, corporate separations or capital reductions of MUFG), MUFG shall appropriately adjust the number of granted shares to a reasonable extent.
The contractual term of the Stock Acquisition Rights is approximately 30 years from the date of grant. Some of the Stock Acquisition Rights vest on the date of grant and the rest of the rights graded-vest depending on the holders’ service periods as officers. The Stock Acquisition Rights are only exercisable after the date on which the following conditions are met: (1) holder as a director or an executive officer loses the status of both director and executive officer, and (2) holder as a corporate auditor loses the status of a corporate auditor, and (3) holder as a senior fellow loses the status of a senior fellow. The exercise price is ¥1 per share.
F-157
Table of Contents
MITSUBISHI UFJ FINANCIAL GROUP, INC. AND SUBSIDIARIES
NOTES TO CONSOLIDATED FINANCIAL STATEMENTS—(Continued)
The following is a summary of the Stock Acquisition Rights transactions of MUFG, BTMU, MUTB, MUSHD and MUMSS for the fiscal year ended March 31, 2014:
| Fiscal year ended March 31, 2014 | ||||||||||||||||
|
Number of
shares |
Weighted average
exercise price |
Weighted average
remaining contractual term |
Aggregate
intrinsic value |
|||||||||||||
| (in years) | (in millions) | |||||||||||||||
|
Outstanding, beginning of fiscal year |
23,574,800 | ¥ | 1 | |||||||||||||
|
Granted |
2,951,500 | 1 | ||||||||||||||
|
Exercised |
(5,440,700 | ) | 1 | |||||||||||||
|
Forfeited or Expired |
(45,700 | ) | 1 | |||||||||||||
|
|
|
|||||||||||||||
|
Outstanding, end of fiscal year |
21,039,900 | ¥ | 1 | 27.38 | ¥ | 11,909 | ||||||||||
|
|
|
|||||||||||||||
|
Exercisable, end of fiscal year |
— | ¥ | — | — | ¥ | — | ||||||||||
|
|
|
|||||||||||||||
The fair value of the Stock Acquisition Rights is estimated on the date of grant using the Black-Scholes option pricing model that uses the assumptions described in the following table. The risk-free rate is based on the Japanese government bonds yield curve in effect at the date of grant based on the expected term. The expected volatility is based on the historical data from traded common stock of MUFG. The expected term is based on the average service period of officers of MUFG, BTMU, MUTB, MUSHD and MUMSS, which represents the expected outstanding period of the Stock Acquisition Rights granted. The expected dividend yield is based on the dividend rate of common stock of MUFG at the date of grant.
| Fiscal years ended March 31, | ||||||||||||
| 2012 | 2013 | 2014 | ||||||||||
|
Risk-free interest rate |
0.29% | 0.11% | 0.22% | |||||||||
|
Expected volatility |
44.96% | 40.48% | 30.16% | |||||||||
|
Expected term |
4 years | 4 years | 4 years | |||||||||
|
Expected dividend yield |
3.13% | 3.18% | 1.96% | |||||||||
The weighted-average grant date fair value of the Stock Acquisition Rights granted for the fiscal years ended March 31, 2012, 2013 and 2014 was ¥33,700, ¥33,100 and ¥61,100 per 100 shares, respectively.
The MUFG Group recognized ¥2,771 million, ¥2,862 million and ¥2,069 million of compensation costs related to the Stock Acquisition Rights with ¥1,127 million, ¥1,088 million and ¥737 million of the corresponding tax benefit for the fiscal years ended March 31, 2012, 2013 and 2014, respectively. As of March 31, 2014, the total unrecognized compensation cost related to the Stock Acquisition Rights was ¥253 million and it is expected to be recognized over 3 months.
Cash received from the exercise of the Stock Acquisition Rights for the fiscal years ended March 31, 2012, 2013 and 2014 was ¥4 million, ¥4 million and ¥5 million, respectively. The actual tax benefit realized for the tax deductions from exercise of the Stock Acquisition Rights for the fiscal years ended March 31, 2012, 2013 and 2014 was ¥821 million, ¥675 million and ¥789 million, respectively.
MUAH
MUFG Americas Holdings Corporation Stock Bonus Plan (“Stock Bonus Plan”)
Effective as of April 27, 2010, MUAH adopted the Stock Bonus Plan. Under the Stock Bonus Plan, MUAH grants restricted stock units settled in American Depositary Shares (“ADSs”) representing shares of common
F-158
Table of Contents
MITSUBISHI UFJ FINANCIAL GROUP, INC. AND SUBSIDIARIES
NOTES TO CONSOLIDATED FINANCIAL STATEMENTS—(Continued)
stock of MUAH’s indirect parent company, MUFG, to key employees at the discretion of the Executive Compensation and Benefits Committee of the Board of Directors (“the Committee”). The Committee determines the number of shares, vesting requirements, and other features and conditions of the restricted stock units. Under the Stock Bonus Plan, MUFG ADSs are purchased in the open market upon the vesting of the restricted stock units, through a revocable trust. There is no amount authorized to be issued under the Plan since all shares are purchased in the open market. These awards generally vest pro-rata on each anniversary of the grant date and become fully vested three years from the grant date, provided that the employee has completed the specified continuous service requirement. Generally, the grants vest earlier if the employee dies, is permanently and totally disabled, retires under certain grant, age and service conditions, or terminates employment under certain conditions.
Under the Stock Bonus Plan, the restricted stock unit participants do not have dividend rights, voting rights or other stockholder rights. The grant date fair value of these awards is equal to the closing price of the MUFG ADSs on date of grant.
The following table is a summary of the Stock Bonus Plan:
|
Grant Date |
Units
Granted |
Fair Value
of Stock |
Vesting
Duration |
Pro-rata
Vesting Date |
||||||||||||
|
April 15, 2011 |
4,754,105 | $ | 4.69 | 3 years | April 15 | |||||||||||
|
July 15, 2011 |
180,740 | 4.94 | 3 years | July 15 | ||||||||||||
|
April 15, 2012 |
4,816,795 | 4.78 | 3 years | April 15 | ||||||||||||
|
July 15, 2012 |
74,175 | 4.72 | 3 years | July 15 | ||||||||||||
|
April 15, 2013 |
3,656,340 | 6.66 | 3 years | April 15 | ||||||||||||
|
July 15, 2013 |
78,725 | 6.67 | 3 years | July 15 | ||||||||||||
The following table is a rollforward of the restricted stock units under the Stock Bonus Plan for the fiscal years ended December 31, 2012 and 2013:
| Restricted Stock Units | ||||||||
| 2012 | 2013 | |||||||
|
Units outstanding, beginning of fiscal year |
7,138,334 | 8,857,884 | ||||||
|
Activity during the year: |
||||||||
|
Granted |
4,890,970 | 3,735,065 | ||||||
|
Vested |
(2,920,392 | ) | (4,325,661 | ) | ||||
|
Forfeited |
(251,028 | ) | (416,271 | ) | ||||
|
|
|
|
|
|||||
|
Units outstanding, end of fiscal year |
8,857,884 | 7,851,017 | ||||||
|
|
|
|
|
|||||
The following table is a summary of MUAH’s compensation costs, the corresponding tax benefit for the fiscal years ended December 31, 2011, 2012 and 2013, and unrecognized compensation costs as of December 31, 2011, 2012 and 2013:
| December 31, | ||||||||||||
| 2011 | 2012 | 2013 | ||||||||||
| (in millions) | ||||||||||||
|
Compensation costs |
¥ | 1,198 | ¥ | 1,437 | ¥ | 2,051 | ||||||
|
Tax benefit |
479 | 559 | 781 | |||||||||
|
Unrecognized compensation costs |
1,710 | 2,251 | 2,846 | |||||||||
F-159
Table of Contents
MITSUBISHI UFJ FINANCIAL GROUP, INC. AND SUBSIDIARIES
NOTES TO CONSOLIDATED FINANCIAL STATEMENTS—(Continued)
| 33. | PARENT COMPANY ONLY FINANCIAL INFORMATION |
Distributions of retained earnings of BTMU and MUTB are restricted in order to meet the minimum capital adequacy requirements under the Banking Law. Also, retained earnings of these banking subsidiaries are restricted, except for ¥5,511,969 million, in accordance with the statutory reserve requirements under the Company Law at March 31, 2014. See Notes 18 and 21 for further information.
The following table presents the parent company only financial information of MUFG:
Certain parent company condensed financial statement line items have been revised to conform to the current year presentation to separately present amounts for banking subsidiaries from amounts for subsidiaries and affiliated companies.
Condensed Balance Sheets
| 2013 | 2014 | |||||||
| (in millions) | ||||||||
|
Assets: |
||||||||
|
Cash and interest-earning deposits with banking subsidiaries |
¥ | 127,303 | ¥ | 130,338 | ||||
|
Investments in subsidiaries and affiliated companies |
12,849,434 | 14,439,803 | ||||||
|
Banking subsidiaries |
10,394,347 | 11,104,470 | ||||||
|
Non-banking subsidiaries and affiliated companies |
2,455,087 | 3,335,333 | ||||||
|
Other assets |
56,435 | 64,808 | ||||||
|
|
|
|
|
|||||
|
Total assets |
¥ | 13,033,172 | ¥ | 14,634,949 | ||||
|
|
|
|
|
|||||
|
Liabilities and Shareholders’ equity: |
||||||||
|
Short-term borrowings from banking subsidiaries |
¥ | 1,873,336 | ¥ | 1,917,647 | ||||
|
Long-term debt from non-banking subsidiaries and affiliated companies |
384,107 | 384,445 | ||||||
|
Long-term debt |
59 | 78 | ||||||
|
Other liabilities |
166,875 | 127,739 | ||||||
|
|
|
|
|
|||||
|
Total liabilities |
2,424,377 | 2,429,909 | ||||||
|
|
|
|
|
|||||
|
Total shareholders’ equity |
10,608,795 | 12,205,040 | ||||||
|
|
|
|
|
|||||
|
Total liabilities and shareholders’ equity |
¥ | 13,033,172 | ¥ | 14,634,949 | ||||
|
|
|
|
|
|||||
F-160
Table of Contents
MITSUBISHI UFJ FINANCIAL GROUP, INC. AND SUBSIDIARIES
NOTES TO CONSOLIDATED FINANCIAL STATEMENTS—(Continued)
Condensed Statements of Income
| 2012 | 2013 | 2014 | ||||||||||
| (in millions) | ||||||||||||
|
Income: |
||||||||||||
|
Dividends from subsidiaries and affiliated companies |
¥ | 270,923 | ¥ | 220,050 | ¥ | 255,175 | ||||||
|
Banking subsidiaries |
241,329 | 184,462 | 207,771 | |||||||||
|
Non-banking subsidiaries and affiliated companies |
29,594 | 35,588 | 47,404 | |||||||||
|
Gain on conversion rate adjustment of Morgan Stanley’s convertible preferred stock |
139,320 | — | — | |||||||||
|
Management fees from subsidiaries |
16,708 | 17,154 | 18,922 | |||||||||
|
Interest income |
99 | 77 | 73 | |||||||||
|
Foreign exchange gains (losses)—net |
32,237 | (59,375 | ) | (44,544 | ) | |||||||
|
Other income |
5,614 | 634 | 294 | |||||||||
|
|
|
|
|
|
|
|||||||
|
Total income |
464,901 | 178,540 | 229,920 | |||||||||
|
|
|
|
|
|
|
|||||||
|
Expense: |
||||||||||||
|
Operating expenses |
14,515 | 15,952 | 18,304 | |||||||||
|
Interest expense to subsidiaries and affiliated companies |
37,905 | 30,501 | 28,897 | |||||||||
|
Interest expense |
1,196 | 1,122 | 1,121 | |||||||||
|
Other expense |
923 | 2,620 | 591 | |||||||||
|
|
|
|
|
|
|
|||||||
|
Total expense |
54,539 | 50,195 | 48,913 | |||||||||
|
|
|
|
|
|
|
|||||||
|
Equity in undistributed net income of subsidiaries and affiliated companies—net |
55,139 | 937,673 | 793,548 | |||||||||
|
|
|
|
|
|
|
|||||||
|
Income before income tax expense (benefit) |
465,501 | 1,066,018 | 974,555 | |||||||||
|
Income tax expense (benefit) |
49,270 | (3,106 | ) | (40,838 | ) | |||||||
|
|
|
|
|
|
|
|||||||
|
Net income |
¥ | 416,231 | ¥ | 1,069,124 | ¥ | 1,015,393 | ||||||
|
|
|
|
|
|
|
|||||||
F-161
Table of Contents
MITSUBISHI UFJ FINANCIAL GROUP, INC. AND SUBSIDIARIES
NOTES TO CONSOLIDATED FINANCIAL STATEMENTS—(Continued)
Condensed Statements of Cash Flows
| 2012 | 2013 | 2014 | ||||||||||
| (in millions) | ||||||||||||
|
Operating activities: |
||||||||||||
|
Net income |
¥ | 416,231 | ¥ | 1,069,124 | ¥ | 1,015,393 | ||||||
|
Adjustments and other |
(133,368 | ) | (858,288 | ) | (790,050 | ) | ||||||
|
|
|
|
|
|
|
|||||||
|
Net cash provided by operating activities |
282,863 | 210,836 | 225,343 | |||||||||
|
|
|
|
|
|
|
|||||||
|
Investing activities: |
||||||||||||
|
Proceeds from sales and redemption of stock investment in subsidiaries and affiliated companies |
17,371 | 21,160 | — | |||||||||
|
Purchases of equity investments in subsidiaries and affiliated companies |
(20,000 | ) | (3,838 | ) | — | |||||||
|
Net decrease in interest-earning deposits with banks |
18,696 | 8,996 | 1,494 | |||||||||
|
Other—net |
(7,245 | ) | (10,623 | ) | (2,788 | ) | ||||||
|
|
|
|
|
|
|
|||||||
|
Net cash provided by (used in) investing activities |
8,822 | 15,695 | (1,294 | ) | ||||||||
|
|
|
|
|
|
|
|||||||
|
Financing activities: |
||||||||||||
|
Net increase (decrease) in short-term borrowings from subsidiaries |
66,600 | (34,989 | ) | (4 | ) | |||||||
|
Repayment of long-term debt |
(8 | ) | (20 | ) | (16 | ) | ||||||
|
Repayment of long-term debt to subsidiaries and affiliated companies |
(169,710 | ) | — | — | ||||||||
|
Proceeds from sales of treasury stock |
3 | 1 | 2 | |||||||||
|
Payments to acquire treasury stock |
(12 | ) | (16 | ) | (46 | ) | ||||||
|
Dividends paid |
(187,616 | ) | (187,778 | ) | (216,117 | ) | ||||||
|
Other—net |
(1,346 | ) | (212 | ) | (2,988 | ) | ||||||
|
|
|
|
|
|
|
|||||||
|
Net cash used in financing activities |
(292,089 | ) | (223,014 | ) | (219,169 | ) | ||||||
|
|
|
|
|
|
|
|||||||
|
Net increase (decrease) in cash and cash equivalents |
(404 | ) | 3,517 | 4,880 | ||||||||
|
Cash and cash equivalents at beginning of fiscal year |
11,026 | 10,622 | 14,139 | |||||||||
|
|
|
|
|
|
|
|||||||
|
Cash and cash equivalents at end of fiscal year |
¥ | 10,622 | ¥ | 14,139 | ¥ | 19,019 | ||||||
|
|
|
|
|
|
|
|||||||
| 34. | SEC REGISTERED FUNDING VEHICLES ISSUING NON-DILUTIVE PREFERRED SECURITIES |
In February 2006, MUFG established MUFG Capital Finance 1 Limited, MUFG Capital Finance 2 Limited and MUFG Capital Finance 3 Limited, wholly-owned funding vehicles in the Cayman Islands, for the issuance of preferred securities to enhance the flexibility of its capital management.
On March 17, 2006, MUFG Capital Finance 1 Limited, MUFG Capital Finance 2 Limited and MUFG Capital Finance 3 Limited registered with the SEC and issued $2,300,000,000 in 6.346% non-cumulative preferred securities, €750,000,000 in 4.850% non-cumulative preferred securities and ¥120,000,000,000 in 2.680% non-cumulative preferred securities (collectively, the “Preferred Securities”), respectively. Total net proceeds before expenses were approximately $4.17 billion. All of the ordinary shares of MUFG Capital Finance 1 Limited, MUFG Capital Finance 2 Limited and MUFG Capital Finance 3 Limited are owned by MUFG. MUFG fully and unconditionally guarantees the payment of dividends and payments on liquidation or redemption of the obligations under the Preferred Securities.
F-162
Table of Contents
MITSUBISHI UFJ FINANCIAL GROUP, INC. AND SUBSIDIARIES
NOTES TO CONSOLIDATED FINANCIAL STATEMENTS—(Continued)
The Preferred Securities entitle holders to receive a non-cumulative preferential cash dividend starting on July 25, 2006 and on January 25 and July 25 of each year thereafter. These funding vehicles will not be obligated to pay dividends on the Preferred Securities upon the occurrence of certain events relating to the financial condition of MUFG. From July 25, 2016, dividends on the Preferred Securities will be re-calculated at a floating rate per annum.
The dollar-denominated and euro-denominated preferred securities are subject to redemption on any dividend payment date on or after July 25, 2016. All the Preferred Securities are subject to redemption in whole (but not in part) at any time upon the occurrence of specified events, in each case at the option of each of the funding vehicles and subject to necessary government approvals.
The Preferred Securities are non-dilutive and not convertible into MUFG’s common shares. The Preferred Securities were included as part of MUFG’s Tier 1 capital at March 31, 2013 and 2014 under its capital adequacy requirements.
These funding vehicles are not consolidated as the MUFG Group’s subsidiaries. See Note 25 for discussion. The funds raised through such funding vehicles are primarily loaned to the MUFG Group and presented as Long-term debt in the accompanying consolidated balance sheet at March 31, 2013 and 2014.
On July 25, 2011, MUFG redeemed a total of ¥120,000,000,000 of non-cumulative and non-dilutive perpetual preferred securities issued by MUFG Capital Finance 3 Limited.
| 35. | SUBSEQUENT EVENTS |
Acquisition and Cancellation of First Series of Class 5 Preferred Stock
On April 1, 2014, MUFG acquired all of the First Series of Class 5 Preferred Stock issued in accordance with the provisions of Article 18, Paragraph 1 of the Articles of Incorporation of MUFG and Paragraph 14 of the Terms and Conditions of the said Preferred Stock, and canceled all the acquired shares in accordance with the provisions of Article 178 of the Company Law. As a result, the aggregate number of shares authorized to be issued by MUFG was decreased by 156,000,000 shares, and the aggregated number of First Series of Class 5 Preferred Stock authorized to be issued was deleted. Acquisition price was ¥2,500 per share, totaling ¥390,000 million.
Approval of Dividends
On June 27, 2014, the shareholders approved the payment of cash dividends to the shareholders of record on March 31, 2014, of ¥57.50 per share of Class 5 Preferred Stock, totaling ¥8,970 million, of ¥2.65 per share of Class 11 Preferred Stock, totaling ¥0 million, and ¥9 per share of Common stock, totaling ¥127,474 million.
Stock Acquisition Rights
On July 15, 2014, MUFG allotted the directors (excluding outside directors), executive officers and senior fellows of MUFG, BTMU, MUTB, MUSHD and MUMSS stock acquisition rights to acquire an aggregate amount of 3,019,400 shares of MUFG’s common stock. The stock acquisition rights have an exercise price of ¥1 per common share, and are exercisable until July 14, 2044.
* * * * *
F-163
Table of Contents
Signature
The registrant hereby certifies that it meets all of the requirements for filing on Form 20-F and that it has duly caused and authorized the undersigned to sign this Annual Report on its behalf.
|
MITSUBISHI UFJ FINANCIAL GROUP, INC. |
||
|
By: |
/s/ N OBUYUKI H IRANO |
|
| Name: | Nobuyuki Hirano | |
| Title: | President & Chief Executive Officer | |
Date: July 18, 2014
Table of Contents
EXHIBIT INDEX
|
Exhibit |
Description |
|
| 1(a) | Articles of Incorporation of Mitsubishi UFJ Financial Group, Inc., as amended on June 27, 2013. (English translation)* | |
| 1(b) | Board of Directors Regulations of Mitsubishi UFJ Financial Group, Inc., as amended on December 24, 2010. (English translation)** | |
| 1(c) | Corporation Meetings Regulations of Mitsubishi UFJ Financial Group, Inc., as amended on December 24, 2010. (English translation)** | |
| 1(d) | Share Handling Regulations of Mitsubishi UFJ Financial Group, Inc., as amended on June 26, 2009. (English Translation)*** | |
| 2(a) | Form of American Depositary Receipt.**** | |
| 2(b) | Form of Deposit Agreement, amended and restated as of December 22, 2004, among Mitsubishi Tokyo Financial Group, Inc. (subsequently renamed Mitsubishi UFJ Financial Group, Inc.), The Bank of New York Mellon and the holders from time to time of American Depositary Receipts issued thereunder.**** | |
| 8 | Subsidiaries of the Company—see “Item 4.C. Information on the Company—Organizational Structure.” | |
| 11 | Principles of Ethics and Conduct, Compliance Rules, Compliance Manual, and Rules of Employment of Mitsubishi UFJ Financial Group, Inc. applicable to its principal executive officer, principal financial officer, principal accounting officer and persons performing similar functions. (English translation of relevant sections)* | |
| 12 | Certifications required by Rule 13a-14(a) (17 CFR 240.13a-14(a)) or Rule 15d-14(a) (17 CFR 240.15d-14(a)). | |
| 13 | Certifications required by Rule 13a-14(b) (17 CFR 240.13a-14(b)) or Rule 15d-14(b) (17 CFR 240.15d-14(b)) and Section 1350 of Chapter 63 of Title 18 of the United States Code (18 U.S.C. 1350). | |
| 101.INS | XBRL Instance Document | |
| 101.SCH | XBRL Schema Document | |
| 101.CAL | XBRL Calculation Linkbase Document | |
| 101.DEF | XBRL Definition Linkbase Document | |
| 101.LAB | XBRL Label Linkbase Document | |
| 101.PRE | XBRL Presentation Linkbase Document | |
| Notes: |
| * | Incorporated by reference to our annual report on Form 20-F (File No. 000-54189) field on July 22, 2013. |
| ** | Incorporated by reference to our annual report on Form 20-F (File No. 000-54189) field on July 28, 2011. |
| *** | Incorporated by reference to our annual report on Form 20-F (File No. 333-98061-99) filed on September 2, 2009. |
| **** | Incorporated by reference to our annual report on Form 20-F (File No. 000-54189) field on July 23, 2012. |