Table of Contents
As filed with the Securities and Exchange Commission on July 10, 2019
UNITED STATES
SECURITIES AND EXCHANGE COMMISSION
WASHINGTON, D.C. 20549
FORM 20-F
☐ REGISTRATION STATEMENT PURSUANT TO SECTION 12(b) OR (g) OF
THE SECURITIES EXCHANGE ACT OF 1934
OR
☒ ANNUAL REPORT PURSUANT TO SECTION 13 OR 15(d) OF
THE SECURITIES EXCHANGE ACT OF 1934
For the fiscal year ended March 31, 2019
OR
☐ TRANSITION REPORT PURSUANT TO SECTION 13 OR 15(d) OF
THE SECURITIES EXCHANGE ACT OF 1934
For the transition period from to
OR
☐ SHELL COMPANY REPORT PURSUANT TO SECTION 13 OR 15(d) OF
THE SECURITIES EXCHANGE ACT OF 1934
Date of event requiring this shell company report
Commission file number 000-54189
KABUSHIKI KAISHA MITSUBISHI UFJ FINANCIAL GROUP
(Exact name of Registrant as specified in its charter)
MITSUBISHI UFJ FINANCIAL GROUP, INC.
(Translation of Registrant’s name into English)
Japan
(Jurisdiction of incorporation or organization)
7-1, Marunouchi 2-chome
Chiyoda-ku, Tokyo 100-8330
Japan
(Address of principal executive offices)
Masahisa Takahashi, +81-3-3240-8111, +81-3-3240-7073, same address as above
(Name, Telephone, Facsimile number and Address of Company Contact Person)
Securities registered or to be registered pursuant to Section 12(b) of the Act:
|
Title of each class |
Trading
symbol(s) |
Name of each exchange on which registered | ||||
|
Common stock, without par value |
New York Stock Exchange (1) | |||||
|
American depositary shares, each of which represents one share of common stock |
MUFG | New York Stock Exchange | ||||
| (1) |
The listing of the registrant’s common stock on the New York Stock Exchange is for technical purposes only and without trading privileges. |
Securities registered or to be registered pursuant to Section 12(g) of the Act: None
Securities for which there is a reporting obligation pursuant to Section 15(d) of the Act: None
Indicate the number of outstanding shares of each of the issuer’s classes of capital or common stock as of the close of the period covered by the annual report:
As of March 31, 2019,13,667,770,520 shares of common stock (including 745,921,774 shares of common stock held by the registrant and its consolidated subsidiaries as treasury stock)
Indicate by check mark if the registrant is a well-known seasoned issuer, as defined in Rule 405 of the Securities Act.
Yes ☒ No ☐
If this report is an annual or transition report, indicate by check mark if the registrant is not required to file reports pursuant to Section 13 or 15(d) of the Securities Exchange Act of 1934.
Yes ☐ No ☒
Note—Checking the box above will not relieve any registrant required to file reports pursuant to Section 13 or 15(d) of the Securities Exchange Act of 1934 from their obligations under those Sections.
Indicate by check mark whether the registrant (1) has filed all reports required to be filed by Section 13 or 15(d) of the Securities Exchange Act of 1934 during the preceding 12 months (or for such shorter period that the registrant was required to file such reports), and (2) has been subject to such filing requirements for the past 90 days.
Yes ☒ No ☐
Indicate by check mark whether the registrant has submitted electronically every Interactive Data File required to be submitted pursuant to Rule 405 of Regulation S-T (§232.405 of this chapter) during the preceding 12 months (or for such shorter period that the registrant was required to submit such files).
Yes ☒ No ☐
Indicate by check mark whether the registrant is a large accelerated filer, an accelerated filer, a non-accelerated filer, or an emerging growth company. See definition of “large accelerated filer,” “accelerated filer,” and “emerging growth company” in Rule 12b-2 of the Exchange Act.
|
Large accelerated filer ☒ |
Accelerated filer ☐ |
Non-accelerated filer ☐ | Emerging growth company ☐ |
If an emerging growth company that prepares its financial statements in accordance with U.S. GAAP, indicate by check mark if the registrant has elected not to use the extended transition period for complying with any new or revised financial accounting standards† provided pursuant to Section 13(a) of the Exchange Act. ☐
† The term “new or revised financial accounting standard” refers to any update issued by the Financial Accounting Standards Board to its Accounting Standards Codification after April 5, 2012.
Indicate by check mark which basis of accounting the registrant has used to prepare the financial statements included in this filing:
|
U.S. GAAP ☒ |
International Financial Reporting Standards as issued
by the International Accounting Standards Board ☐ |
Other ☐ |
If “Other” has been checked in response to the previous question, indicate by check mark which financial statement item the registrant has elected to follow.
Item 17 ☐ Item 18 ☐
If this is an annual report, indicate by check mark whether the registrant is a shell company (as defined in Rule 12b-2 of the Exchange Act).
Yes ☐ No ☒
Table of Contents
For purposes of this Annual Report, we have presented our consolidated financial statements in accordance with accounting principles generally accepted in the United States, or U.S. GAAP, except for risk-adjusted capital ratios, capital components, risk-weighted assets, business segment financial information and some other specifically identified information. Unless otherwise stated or the context otherwise requires, all amounts in our financial statements are expressed in Japanese yen.
In this Annual Report, unless otherwise indicated or the context otherwise requires, all figures are rounded to the figures shown except for the capital ratios, capital components, risk-weighted assets, leverage ratios and liquidity coverage ratios of MUFG and its domestic subsidiaries, which are rounded down and truncated to the figures shown. In some cases, figures presented in tables are adjusted to match the sum of the figures with the total amount, and such figures are also referred to in the related text.
When we refer in this Annual Report to “MUFG,” “we,” “us,” “our” and the “Group,” we generally mean Mitsubishi UFJ Financial Group, Inc. and its consolidated subsidiaries, but from time to time as the context requires, we mean Mitsubishi UFJ Financial Group, Inc. as an individual legal entity. In addition, our “commercial banking subsidiaries” refers to MUFG Bank, Ltd. (formerly, The Bank of Tokyo-Mitsubishi UFJ, Ltd.), or “BK,” and, as the context requires, its consolidated subsidiaries engaged in the commercial banking business. Our “trust banking subsidiaries” refers to Mitsubishi UFJ Trust and Banking Corporation, or “TB,” and, as the context requires, its consolidated subsidiaries engaged in the trust banking business. Our “banking subsidiaries” refers to MUFG Bank and Mitsubishi UFJ Trust and Banking and, as the context requires, their respective consolidated subsidiaries engaged in the banking business. Our “securities subsidiaries” refers to Mitsubishi UFJ Securities Holdings Co., Ltd., or “SCHD,” and as the context requires, its consolidated subsidiaries engaged in the securities business.
1
Table of Contents
References to “MUAH” and “BK(US)” are to MUFG Americas Holdings Corporation and MUFG Union Bank, N.A., as single entities, respectively, as well as to MUFG Americas Holdings and MUFG Union Bank and their respective consolidated subsidiaries, as the context requires.
References to “Krungsri” are to Bank of Ayudhya Public Company Limited, as a single entity, as well as to Bank of Ayudhya Public Company Limited and its respective consolidated subsidiaries, as the context requires. References to “Bank Danamon” are to PT Bank Danamon Indonesia, Tbk., as a single entity, as well as to PT Bank Danamon Indonesia, Tbk. and its respective consolidated subsidiaries, as the context requires.
References to the “FSA” are to the Financial Services Agency, an agency of the Cabinet Office of Japan.
References in this Annual Report to “yen” or “¥” are to Japanese yen, references to “U.S. dollars,” “U.S. dollar,” “dollars,” “U.S.$” or “$” are to United States dollars, references to “euro” or “€” are to the currency of the member states of the European Monetary Union, references to “THB” are to Thai baht, references to “AU$” are to Australian dollars, references to “HK$” are to Hong Kong dollars, and references to “IDR” are to Indonesian Rupiah.
Our fiscal year ends on March 31 of each year. References to years not specified as being fiscal years are to calendar years.
We usually hold the annual ordinary general meeting of shareholders of Mitsubishi UFJ Financial Group, Inc. in June of each year in Tokyo.
2
Table of Contents
We may from time to time make written or oral forward-looking statements. Written forward-looking statements may appear in documents filed with, or submitted to, the U.S. Securities and Exchange Commission, or SEC, including this Annual Report, and other reports to shareholders and other communications.
The U.S. Private Securities Litigation Reform Act of 1995 provides a “safe harbor” for forward-looking information to encourage companies to provide prospective information about themselves. We rely on this safe harbor in making these forward-looking statements.
Forward-looking statements appear in a number of places in this Annual Report and include statements regarding our current intent, business plan, targets, belief or expectations or the current belief or current expectations of our management with respect to our results of operations and financial condition, including, among other matters, our problem loans and loan losses. In many, but not all cases, we use words such as “anticipate,” “aim,” “believe,” “estimate,” “expect,” “intend,” “plan,” “probability,” “risk,” “will,” “may” and similar expressions, as they relate to us or our management, to identify forward-looking statements. These statements reflect our current views with respect to future events and are subject to risks, uncertainties and assumptions. Should one or more of these risks or uncertainties materialize or should underlying assumptions prove incorrect, actual results may vary materially from those which are aimed, anticipated, believed, estimated, expected, intended or planned, or otherwise stated.
Our forward-looking statements are not guarantees of future performance and involve risks and uncertainties. Actual results may differ from those in the forward-looking statements as a result of various factors. We identify in this Annual Report in “Item 3.D. Key Information—Risk Factors,” “Item 4.B. Information on the Company—Business Overview,” “Item 5. Operating and Financial Review and Prospects” and elsewhere, some, but not necessarily all, of the important factors that could cause these differences.
We are under no obligation, and disclaim any obligation, to update or alter our forward-looking statements, whether as a result of new information, future events or otherwise unless required by law.
3
Table of Contents
| Item 1. |
Identity of Directors, Senior Management and Advisers. |
Not applicable.
| Item 2. |
Offer Statistics and Expected Timetable. |
Not applicable.
| Item 3. |
Key Information. |
| A. |
Selected Financial Data |
The selected statement of income data and selected balance sheet data set forth below has been derived from our audited consolidated financial statements.
Except for risk-adjusted capital ratios, which are calculated in accordance with Japanese banking regulations based on information derived from our consolidated financial statements prepared in accordance with accounting principles generally accepted in Japan, or Japanese GAAP, the selected financial data set forth below are derived from our consolidated financial statements prepared in accordance with U.S. GAAP.
You should read the selected financial data set forth below in conjunction with “Item 5. Operating and Financial Review and Prospects,” “Selected Statistical Data” and our consolidated financial statements and other financial data included elsewhere in this Annual Report. These data are qualified in their entirety by reference to all of that information.
4
Table of Contents
| Fiscal years ended March 31, | ||||||||||||||||||||
| 2015 | 2016 | 2017 | 2018 | 2019 | ||||||||||||||||
| (in millions, except per share data and number of shares) | ||||||||||||||||||||
|
Statement of income data: |
||||||||||||||||||||
|
Interest income |
¥ | 2,894,645 | ¥ | 3,005,738 | ¥ | 2,990,767 | ¥ | 3,259,016 | ¥ | 3,813,379 | ||||||||||
|
Interest expense |
663,184 | 744,364 | 769,639 | 1,028,755 | 1,517,981 | |||||||||||||||
|
|
|
|
|
|
|
|
|
|
|
|||||||||||
|
Net interest income |
2,231,461 | 2,261,374 | 2,221,128 | 2,230,261 | 2,295,398 | |||||||||||||||
|
Provision for (reversal of) credit losses |
86,998 | 231,862 | 253,688 | (240,847 | ) | 34,330 | ||||||||||||||
|
|
|
|
|
|
|
|
|
|
|
|||||||||||
|
Net interest income after provision for (reversal of) credit losses |
2,144,463 | 2,029,512 | 1,967,440 | 2,471,108 | 2,261,068 | |||||||||||||||
|
Non-interest income |
2,845,078 | 2,407,690 | 1,196,706 | 1,935,091 | 1,595,244 | |||||||||||||||
|
Non-interest expense |
2,726,885 | 3,274,532 | 2,891,603 | 2,744,380 | 2,985,470 | |||||||||||||||
|
|
|
|
|
|
|
|
|
|
|
|||||||||||
|
Income before income tax expense |
2,262,656 | 1,162,670 | 272,543 | 1,661,819 | 870,842 | |||||||||||||||
|
Income tax expense |
666,020 | 369,432 | 94,453 | 407,823 | 133,237 | |||||||||||||||
|
|
|
|
|
|
|
|
|
|
|
|||||||||||
|
Net income before attribution of noncontrolling interests |
1,596,636 | 793,238 | 178,090 | 1,253,996 | 737,605 | |||||||||||||||
|
Net income (loss) attributable to noncontrolling interests |
65,509 | (9,094 | ) | (24,590 | ) | 25,836 | 18,960 | |||||||||||||
|
|
|
|
|
|
|
|
|
|
|
|||||||||||
|
Net income attributable to Mitsubishi UFJ Financial Group |
¥ | 1,531,127 | ¥ | 802,332 | ¥ | 202,680 | ¥ | 1,228,160 | ¥ | 718,645 | ||||||||||
|
|
|
|
|
|
|
|
|
|
|
|||||||||||
|
Earnings applicable to common shareholders of Mitsubishi UFJ Financial Group |
¥ | 1,522,157 | ¥ | 802,332 | ¥ | 202,680 | ¥ | 1,228,160 | ¥ | 718,645 | ||||||||||
|
|
|
|
|
|
|
|
|
|
|
|||||||||||
|
Amounts per share: |
||||||||||||||||||||
|
Basic earnings per common share—Earnings applicable to common shareholders of Mitsubishi UFJ Financial Group |
¥ | 107.81 | ¥ | 57.78 | ¥ | 14.93 | ¥ | 92.40 | ¥ | 55.03 | ||||||||||
|
Diluted earnings per common share—Earnings applicable to common shareholders of Mitsubishi UFJ Financial Group |
107.50 | 57.51 | 14.68 | 92.10 | 54.74 | |||||||||||||||
|
Number of shares used to calculate basic earnings per common share (in thousands) |
14,118,469 | 13,885,842 | 13,574,314 | 13,291,842 | 13,058,698 | |||||||||||||||
|
Number of shares used to calculate diluted earnings per common share (in thousands) (1) |
14,137,645 | 13,903,316 | 13,584,885 | 13,293,492 | 13,059,182 | |||||||||||||||
|
Cash dividends per share paid during the fiscal year: |
||||||||||||||||||||
|
—Common stock |
¥ | 18.00 | ¥ | 18.00 | ¥ | 18.00 | ¥ | 18.00 | ¥ | 21.00 | ||||||||||
| $ | 0.16 | $ | 0.15 | $ | 0.17 | $ | 0.16 | $ | 0.19 | |||||||||||
|
—Preferred stock (Class 5) (2) |
¥ | 57.50 | — | — | — | — | ||||||||||||||
| $ | 0.57 | — | — | — | — | |||||||||||||||
|
—Preferred stock (Class 11) (3) |
¥ | 2.65 | — | — | — | — | ||||||||||||||
| $ | 0.03 | — | — | — | — | |||||||||||||||
| As of March 31, | ||||||||||||||||||||
| 2015 | 2016 | 2017 | 2018 | 2019 | ||||||||||||||||
| (in millions) | ||||||||||||||||||||
|
Balance sheet data: |
||||||||||||||||||||
|
Total assets |
¥ | 280,875,706 | ¥ | 292,557,355 | ¥ | 297,185,019 | ¥ | 300,570,312 | ¥ | 305,228,899 | ||||||||||
|
Loans, net of allowance for credit losses |
117,209,723 | 121,679,828 | 117,032,784 | 116,271,771 | 116,225,757 | |||||||||||||||
|
Total liabilities |
265,594,365 | 277,709,088 | 282,420,311 | 284,924,497 | 289,244,151 | |||||||||||||||
|
Deposits |
171,991,267 | 181,438,087 | 190,401,623 | 195,674,593 | 199,280,789 | |||||||||||||||
|
Long-term debt (4) |
18,782,257 | 20,524,615 | 26,131,527 | 27,069,556 | 27,990,543 | |||||||||||||||
|
Total equity |
15,281,341 | 14,848,267 | 14,764,708 | 15,645,815 | 15,984,748 | |||||||||||||||
|
Capital stock |
2,090,270 | 2,090,270 | 2,090,270 | 2,090,270 | 2,090,270 | |||||||||||||||
5
Table of Contents
| Fiscal years ended March 31, | ||||||||||||||||||||
| 2015 | 2016 | 2017 | 2018 | 2019 | ||||||||||||||||
| (in millions, except percentages) | ||||||||||||||||||||
|
Other financial data: |
||||||||||||||||||||
|
Average balances: |
||||||||||||||||||||
|
Interest-earning assets |
¥ | 237,247,664 | ¥ | 252,715,743 | ¥ | 239,192,449 | ¥ | 239,048,981 | ¥ | 241,407,356 | ||||||||||
|
Interest-bearing liabilities |
210,091,493 | 221,135,208 | 223,522,296 | 233,857,052 | 234,643,197 | |||||||||||||||
|
Total assets |
277,547,638 | 299,270,873 | 307,938,699 | 320,589,932 | 321,292,847 | |||||||||||||||
|
Total equity |
13,002,955 | 15,285,766 | 15,010,829 | 15,423,078 | 16,076,679 | |||||||||||||||
|
Return on equity and assets: |
||||||||||||||||||||
|
Earnings applicable to common shareholders as a percentage of average total assets |
0.55 | % | 0.27 | % | 0.07 | % | 0.38 | % | 0.22 | % | ||||||||||
|
Earnings applicable to common shareholders as a percentage of average total equity |
11.71 | % | 5.25 | % | 1.35 | % | 7.96 | % | 4.47 | % | ||||||||||
|
Dividends per common share as a percentage of basic earnings per common share |
16.70 | % | 31.15 | % | 120.56 | % | 19.48 | % | 38.16 | % | ||||||||||
|
Average total equity as a percentage of average
|
4.68 | % | 5.11 | % | 4.87 | % | 4.81 | % | 5.00 | % | ||||||||||
|
Net interest income as a percentage of average total interest-earning assets |
0.94 | % | 0.89 | % | 0.93 | % | 0.93 | % | 0.95 | % | ||||||||||
|
Credit quality data: |
||||||||||||||||||||
|
Allowance for credit losses |
¥ | 1,055,479 | ¥ | 1,111,130 | ¥ | 1,182,188 | ¥ | 764,124 | ¥ | 658,184 | ||||||||||
|
Allowance for credit losses as a percentage of loans |
0.89 | % | 0.90 | % | 1.00 | % | 0.65 | % | 0.56 | % | ||||||||||
|
Impaired loans |
¥ | 1,686,806 | ¥ | 1,725,150 | ¥ | 1,715,850 | ¥ | 1,331,123 | ¥ | 1,209,791 | ||||||||||
|
Impaired loans as a percentage of loans |
1.43 | % | 1.40 | % | 1.45 | % | 1.14 | % | 1.04 | % | ||||||||||
|
Allowance for credit losses related to impaired loans as a percentage of impaired loans |
36.00 | % | 42.60 | % | 51.42 | % | 37.14 | % | 32.33 | % | ||||||||||
|
Net loan charge-offs |
¥ | 150,666 | ¥ | 156,959 | ¥ | 169,809 | ¥ | 180,999 | ¥ | 129,924 | ||||||||||
|
Net loan charge-offs as a percentage of average loans |
0.13 | % | 0.13 | % | 0.14 | % | 0.15 | % | 0.11 | % | ||||||||||
|
Average interest rate spread |
0.90 | % | 0.85 | % | 0.91 | % | 0.92 | % | 0.93 | % | ||||||||||
|
Risk-adjusted capital ratio calculated under Japanese GAAP (5) |
15.62 | % | 16.01 | % | 15.85 | % | 16.56 | % | 16.03 | % | ||||||||||
| Notes: |
| (1) | Includes the common shares that were potentially issuable upon conversion of the Class 11 Preferred Stock and stock acquisition rights. |
| (2) | Preferred dividends were ¥57.5 per share and paid semi-annually. In April 2014, we acquired and cancelled all of the issued shares of First Series of Class 5 Preferred Stock. As a result, there is currently no issued Class 5 Preferred Stock. See Note 17 to our audited consolidated financial statements included elsewhere in this Annual Report. |
| (3) | Preferred dividends were ¥2.65 per share and paid semi-annually. In August 2014, we acquired all of the issued shares of Class 11 Preferred Stock in exchange for 1,245 shares of our common stock held in treasury, and cancelled the acquired shares. As a result, there is currently no issued Class 11 Preferred Stock. See Note 17 to our audited consolidated financial statements included elsewhere in this Annual Report. |
| (4) | Reflects the changes in presentation adopted in the fiscal year ended March 31, 2018, where long-term payables under repurchase agreements are no longer included in long-term debt but are aggregated with short-term payables under repurchase agreements in payables under repurchase agreements, and applied to the fiscal years ended March 31, 2015, 2016 and 2017. |
| (5) | Risk-adjusted capital ratios have been calculated in accordance with Japanese banking regulations as applicable on the relevant calculation date, based on information derived from our consolidated financial statements prepared in accordance with Japanese GAAP. For a description of the applicable capital ratio calculation and other requirements applicable, see “Item 4.B. Information on the Company—Business Overview—Supervision and Regulation—Japan—Capital adequacy” and “Item 5.B. Operating and Financial Review and Prospects—Liquidity and Capital Resources—Capital Adequacy.” |
| B. |
Capitalization and Indebtedness |
Not applicable.
| C. |
Reasons for the Offer and Use of Proceeds |
Not applicable.
6
Table of Contents
| D. |
Risk Factors |
Investing in our securities involves a high degree of risk. You should carefully consider the risks described in this section, which is intended to disclose all of the risks that we consider material based on the information currently available to us, as well as all the other information in this Annual Report, including our consolidated financial statements and related notes, “Item 5. Operating and Financial Review and Prospects,” “Item 11. Quantitative and Qualitative Disclosures about Credit, Market and Other Risk” and “Selected Statistical Data.”
Our business, operating results and financial condition could be materially and adversely affected by any of the factors discussed below. The trading price of our securities could decline due to any of these factors. This Annual Report also contains forward-looking statements that involve risks and uncertainties. Our actual results could differ materially from those anticipated in these forward-looking statements as a result of various factors, including those described in this section and elsewhere in this Annual Report. See “Forward-Looking Statements.”
Risks Related to Our Business
Because a large portion of our assets as well as our business operations are in Japan, we may incur losses if economic conditions in Japan worsen.
Our performance is particularly affected by the general economic conditions of Japan where we are headquartered and conduct a significant amount of our business. As of March 31, 2019, 63.6% of our total assets were related to Japanese domestic assets, including Japanese national government and Japanese government agency bonds, which accounted for 56.0% of our total investment securities portfolio and 8.2% of our total assets, respectively. Interest and non-interest income in Japan represented 34.9% of our total interest and non-interest income for the fiscal year ended March 31, 2019. Furthermore, as of March 31, 2019, our loans in Japan accounted for 55.7% of our total loans outstanding.
There is significant uncertainty surrounding Japan’s economy. For example, Japan’s fiscal health and sovereign creditworthiness may deteriorate if the Japanese government’s economic measures and the Bank of Japan’s monetary policies prove ineffective or result in negative consequences. If the prices of Japanese government bonds decline rapidly, resulting in an unexpectedly sudden increase in interest rates, our investment securities portfolio as well as our lending, borrowing, trading and other operations may be negatively impacted. In addition, interest rates may suddenly increase as a result of a decision made by the Bank of Japan to end or modify its current interest rate policy, including the negative interest rate of minus 0.1% applied to certain current account amounts that financial institutions hold at the Bank of Japan and the Japanese government bond purchase program with an aim to keep the yield of 10-year Japanese government bonds around zero percent, or market expectations relating to any such decision. See “—Risks Related to Our Business—Fluctuations in interest rates could adversely affect the value or the yield of our bond portfolio.”
Instability in the Japanese stock market and foreign currency exchange rates may also have a significant adverse impact on our asset and liability management as well as our results of operations. Various other factors, including the decreasing and aging demographics in Japan, stagnation or deterioration of economic and market conditions in other countries, growing global competition and trade conflicts, may also have a material negative impact on the Japanese economy. For a detailed discussion on the business environment in Japan and abroad, see “Item 5. Operating and Financial Review and Prospects—Business Environment.”
Since our domestic loans in Japan accounted for a significant portion of our loan portfolio, deteriorating or stagnant economic conditions in Japan may cause adverse effects on our financial results, such as increases in credit costs, as the credit quality of some borrowers could deteriorate. For example, due to the intensifying global competition and weakening consumer spending in recent periods, some Japanese companies, including electronics manufacturers, have experienced significant financial difficulties. For a further discussion,
7
Table of Contents
see “—Risks Related to Our Business—We may suffer additional credit-related losses in the future if our borrowers are unable to repay their loans as expected or if the measures we take in reaction to, or in anticipation of, our borrowers’ deteriorating repayment abilities prove inappropriate or insufficient.”
Our domestic loan portfolio may also be adversely affected by interest rate fluctuations in Japan. For example, as a result of the Bank of Japan’s interest rate policy and measures to purchase Japanese government bonds in the market, the yield on many financial instruments and other market interest rates in Japan have declined to low or negative levels. If the Bank of Japan’s policy and measures are maintained for an extended period, or if the Bank of Japan’s negative interest rate is lowered from the current level, market interest rates may decline further, and our interest rate spread on our domestic loan portfolio may narrow further, reducing our net interest income.
If the global economy deteriorates, our credit-related losses may increase, and the value of the financial instruments we hold may decrease, resulting in losses.
Global economic conditions remain volatile, and it is uncertain how the global economy will evolve over time. Factors that could negatively impact the global market, both developed and emerging, include concerns over the possible negative impact on global economic activity resulting from changes in the trade policies of various countries, the potentially serious ramifications of the negotiations on the United Kingdom’s withdrawal from the European Union, the potential negative effect from the monetary policy changes in the United States, slowing economic growth in China in the midst of a shift in the government’s economic policy, possible adverse effects on economic conditions in commodity-exporting countries of a decline in oil and other commodity prices, and the political turmoil in various regions around world. As of March 31, 2019, based principally on the domicile of the obligors, assets related to the United States accounted for approximately 16.4% of our total assets, assets related to Asia and Oceania excluding Japan accounted for approximately 9.2% of our total assets, and assets related to Europe accounted for approximately 7.1% of our total assets. If the global economy deteriorates or the global economic recovery significantly slows down again, the availability of credit may become limited, and some of our borrowers may default on their loan obligations to us, increasing our credit losses. Some of our credit derivative transactions may also be negatively affected, including the protection we sold through single name credit default swaps, and index and basket credit default swaps. The notional amounts of these protections sold as of March 31, 2019 were ¥2.49 trillion and ¥0.66 trillion, respectively. In addition, if credit market conditions worsen, our capital funding structure may need to be adjusted or our funding costs may increase, which could have a material adverse impact on our financial condition and results of operations.
Furthermore, we have incurred losses, and may incur further losses, as a result of changes in the fair value of our financial instruments resulting from weakening market conditions. For example, we recorded ¥355.8 billion of net losses from marketable equity securities, which reflected unrealized losses, or holding losses, on marketable equity securities, and ¥0.6 billion of impairment losses on available-for-sale debt securities and other securities for the fiscal year ended March 31, 2019. As of March 31, 2019, approximately 26.6% of our total assets were financial instruments for which we measure fair value on a recurring basis, and less than 0.5% of our total assets were financial instruments for which we measure fair value on a non-recurring basis. Generally, in order to establish the fair value of these instruments, we rely on quoted prices. If the value of these financial instruments declines, a corresponding loss or write-down may be recognized in our consolidated statements of income. In addition, because we hold a large amount of investment securities, short-term fluctuations in the value of our securities may trigger losses or exit costs for us to manage our risk. For more information on our valuation method for financial instruments, see “Item 5. Operating and Financial Review and Prospects—Critical Accounting Estimates.”
8
Table of Contents
We may suffer additional credit-related losses in the future if our borrowers are unable to repay their loans as expected or if the measures we take in reaction to, or in anticipation of, our borrowers’ deteriorating repayment abilities prove inappropriate or insufficient.
When we lend money or commit to lend money, we incur credit risk, which is the risk of losses if our borrowers do not repay their loans. We may incur significant credit losses or have to provide for a significant amount of additional allowance for credit losses if:
| • |
large borrowers become insolvent or must be restructured; |
| • |
domestic or global economic conditions, either generally or in particular industries in which large borrowers operate, deteriorate; |
| • |
the value of the collateral we hold, such as real estate or securities, declines; or |
| • |
we are adversely affected by corporate credibility issues among our borrowers, to an extent that is worse than anticipated. |
As a percentage of total loans, impaired loans, which primarily include nonaccrual loans and troubled debt restructurings, or TDRs, ranged from 1.04% to 1.45% as of the five most recent fiscal year-ends. As of March 31, 2019, impaired loans were ¥1.21 trillion, representing 1.04% of our total outstanding loans. If the economic conditions in Japan or other parts of the world, or in particular industries, including the energy and real estate industries, to which we have significant credit risk exposure, worsen, our problem loans and credit-related expenses may increase. An increase in problem loans and credit-related expenses would adversely affect our results of operations, weaken our financial condition and erode our capital base.
We may provide additional loans, equity capital or other forms of support to troubled borrowers in order to facilitate their restructuring and revitalization efforts. We may also forbear from exercising some or all of our rights as a creditor against them, and we may forgive loans to them in conjunction with their debt restructurings. We may take these steps even when such steps might not be warranted from the perspective of our short-term or narrow economic interests or a technical analysis of our legal rights against those borrowers, in light of other factors such as our longer-term economic interests, and our commitment to supporting the Japanese economy. These practices may substantially increase our exposure to troubled borrowers and increase our losses. Credit losses may also increase if we elect, or are forced by economic or other considerations, to sell or write off our problem loans at a larger discount, in a larger amount or in a different time or manner, than we may otherwise want.
Although we, from time to time, enter into credit derivative transactions, including credit default swap contracts, to manage our credit risk exposure, such transactions may not provide the protection against credit defaults that we intended due to counterparty defaults or similar issues. The credit default swap contracts could also result in significant losses. As of March 31, 2019, the total notional amount of the protection we sold through single name credit default swaps and index and basket credit default swaps was ¥3.15 trillion. In addition, negative changes in financial market conditions may restrict the availability and liquidity of credit default swaps. For more information on our credit derivative transactions, see Note 24 to our consolidated financial statements included elsewhere in this Annual Report.
Our loan losses could prove to be materially different from our estimates and could materially exceed our current allowance for credit losses, in which case we may need to provide for additional allowance for credit losses and may also record credit losses beyond our allowance. Our allowance for credit losses in our loan portfolio is based on evaluations of customers’ creditworthiness and the value of collateral we hold. We recorded ¥34.3 billion of provision for credit losses for the fiscal year ended March 31, 2019. While we closely observe conditions of our individual borrowers and industry trends, our borrowers may incur financial and non-financial losses that exceed our estimations depending on, for example, domestic and international economic conditions or commodity price fluctuations. In such case, we may need to provide for additional allowance for credit losses.
9
Table of Contents
Also, the regulatory standards or guidance on establishing allowances may also change, causing us to change some of the evaluations used in determining the allowances. As a result, we may need to provide for additional allowance for credit losses.
Our efforts to diversify our portfolio to avoid any concentration of credit risk exposures to particular industries or counterparties may prove insufficient. For example, our credit exposures to the energy and real estate industries are relatively high in comparison to other industries. The credit quality of borrowers in this sector do not necessarily correspond to general economic conditions in Japan or other parts of the world, and adverse fluctuations in oil and other commodity prices or adverse developments in the real estate market may disproportionately increase our credit costs.
When we believe there is an improvement in asset quality, we may reverse the allowance for credit losses to a level management deems appropriate and record the amount of reversal in our consolidated statements of income. For example, for the fiscal year ended March 31, 2019, we recorded ¥43.9 billion and ¥4.5 billion of reversal of credit losses for the Commercial and Residential segments, respectively, of our loan portfolio. However, we have historically recorded provision for credit losses rather than recording reversal of credit losses in most periods, and in future periods we may need to recognize provision for credit losses for these and other segments of our loan portfolio.
For more information on our loan portfolio, see “Item 5.B. Operating and Financial Review and Prospects—Liquidity and Capital Resources—Financial Condition—Loan Portfolio.”
Fluctuations in interest rates could adversely affect the value or the yield of our bond portfolio.
The aggregate carrying amount of the Japanese government and corporate bonds and foreign bonds, including U.S. Treasury bonds, that we held as of March 31, 2019 was 9.5% of our total assets. In particular, the Japanese national government and Japanese government agency bonds accounted for 8.2% of our total assets as of March 31, 2019. For a detailed discussion of our bond portfolio, see “Selected Statistical Data—Investment Portfolio.”
The Bank of Japan has maintained a “quantitative and qualitative monetary easing with yield curve control” policy and applied a negative interest rate of minus 0.1% to the “Policy-Rate Balances,” which are a part of current account amounts held by financial institutions at the Bank of Japan, while purchasing Japanese government bonds to increase its aggregate holding of such bonds by approximately ¥80 trillion each year with an aim to keep the yield of 10-year Japanese government bonds around zero percent. If the policy is maintained in Japan for an extended period, or if the Bank of Japan’s negative interest rate or target long-term interest rate is lowered from the current level, market interest rates may decline further, and the yield on the Japanese government bonds and other financial instruments that we hold may also decline. On the other hand, the value of our investment portfolio may decrease if interest rates increase rapidly or significantly because of heightened market expectations for tapering or cessation of the current policy in Japan. Separate from the Bank of Japan’s monetary policies, interest rates could also significantly increase in the event that Japanese government bonds decline in value due to such factors as a decline in confidence in the Japanese government’s fiscal administration or further issuances of Japanese government bonds in connection with emergency economic measures or in the event that interest rates on U.S. Treasury securities rise due to such factors as instability in the U.S. government bond market, additional issuances of U.S. government bonds, or changes in the monetary policy of the Federal Reserve Board, or FRB, including an increase in the U.S. policy interest rate. If relevant interest rates increase for these or other reasons, particularly if such increase is unexpected or sudden, we may incur significant losses on sales of, and valuation losses on, our bond portfolio. Furthermore, if short-term interest rates rise to a larger extent than long-term interest rates or long-term interest rates decline to a larger extent than short-term interest rates in the United States due to the monetary policy of the FRB, concerns over the U.S. economic outlook or other reason, our interest income may be adversely affected. See “Item 5. Operating and Financial Review and Prospects—Business Environment.”
10
Table of Contents
Fluctuations in foreign currency exchange rates may result in transaction losses on translation of monetary assets and liabilities denominated in foreign currencies as well as foreign currency translation losses with respect to our foreign subsidiaries and equity method investees.
Fluctuations in foreign currency exchange rates against the Japanese yen create transaction gains or losses on the translation into Japanese yen of monetary assets and liabilities denominated in foreign currencies. To the extent that our foreign currency-denominated assets and liabilities are not matched in the same currency or appropriately hedged, we could incur losses due to future foreign exchange rate fluctuations. During the fiscal year ended March 31, 2019, the average balance of our foreign interest-earning assets was ¥96,128.3 billion and the average balance of our foreign interest-bearing liabilities was ¥61,443.6 billion, representing 39.8% of our average total interest-earning assets and 26.2% of our average total interest-bearing liabilities during the same period. Due to foreign currency exchange rate fluctuations, we may incur losses attributable to net transaction losses on the translation into Japanese yen of monetary assets and liabilities denominated in foreign currencies, net losses on currency derivative instruments entered into for trading purposes, and net losses on translation into Japanese yen of securities accounted for under the fair value option. In addition, we may incur foreign currency translation losses with respect to our foreign subsidiaries and equity method investees due to fluctuations in foreign currency exchange rates. The average exchange rate for the fiscal year ended March 31, 2019 was ¥110.91 per U.S.$1.00, compared to ¥110.85 per U.S.$1.00 for the previous fiscal year. The change in the average exchange rate of the Japanese yen against the U.S. dollar and other foreign currencies had the effect of decreasing total revenue by ¥21.6 billion, net interest income by ¥9.3 billion and income before income tax expense by ¥5.4 billion, respectively, while increasing the fair value of trading account securities accounted for under the fair value option by ¥186.6 billion, for the fiscal year ended March 31, 2019. The Japanese yen was ¥107.79 to the U.S. dollar on June 28, 2019. For more information on foreign exchange gains and losses and foreign currency translation gains and losses, see “Item 5. Operating and Financial Review and Prospects—Business Environment” and “Item 5.A. Operating and Financial Review and Prospects—Operating Results.”
If the Japanese stock market or other global markets decline in the future, we may incur losses on our securities portfolio and our capital ratios will be adversely affected.
A decline in Japanese stock prices could reduce the value of the Japanese domestic marketable equity securities that we hold, which accounted for 14.1% of our total investment securities portfolio, and 2.1% of our total assets, as of March 31, 2019. The Nikkei Stock Average, which is the average of 225 blue chip stocks listed on the Tokyo Stock Exchange, fluctuated throughout the fiscal year ended March 31, 2019, rising to an intra-day high of ¥24,448.07 on October 2, 2018, declining to an intra-day low of ¥18,948.58 on December 26, 2018, and rising again to ¥21,205.81 at the end of trading on March 29, 2019. As of June 28, 2019, the closing price of the Nikkei Stock Average was ¥21,275.92. The Nikkei Stock Average has increased in recent periods, and may fluctuate significantly and negatively in future periods, as the global economy remains volatile and investors continue to observe the changes in economic, monetary and trade policies mainly in Japan, the United States, China, the Eurozone and Asian countries. In addition, weakening or stagnant economic conditions in these and other regions may have a significant negative impact on Japanese companies, which in turn will cause their stock prices to decline. Concerns over the impact of geopolitical tensions and conflicts in various parts of the world on Japanese companies may also adversely affect stock prices in Japan. In addition, the global trend towards further reduction in risk assets could result in lower stock prices, and the recent trend in Japan towards strengthening corporate governance may subject public companies to stricter scrutiny. See “Item 5. Operating and Financial Review and Prospects—Business Environment” and “Item 5.B. Operating and Financial Review and Prospects—Liquidity and Capital Resources—Investment Portfolio.”
We may become subject to regulatory actions or other legal proceedings relating to our transactions or other aspects of our operations, which could result in significant financial losses, restrictions on our operations and damage to our reputation.
We conduct our business subject to ongoing regulation and associated regulatory and legal risks. Global financial institutions, including us, currently face heightened regulatory scrutiny as a result of the concerns
11
Table of Contents
developing in the global financial sector, and growing public pressure to demand even greater regulatory surveillance following several high-profile scandals and risk management failures in the financial industry. In the current regulatory environment, we are subject to various regulatory inquiries or investigations from time to time in connection with various aspects of our business and operations. In addition, multiple government authorities with overlapping jurisdiction more frequently conduct investigations and take other regulatory actions in coordination with one another or separately on the same or related matters.
In November 2014, MUFG Bank entered into a consent agreement with the New York State Department of Financial Services, or DFS, to resolve issues relating to instructions given to PricewaterhouseCoopers LLP, or PwC, and the disclosures made to DFS in connection with MUFG Bank’s 2007 and 2008 voluntary investigation of MUFG Bank’s U.S. dollar clearing activity toward countries under U.S. economic sanctions. MUFG Bank had hired PwC to conduct a historical transaction review report in connection with that investigation, and voluntarily submitted the report to DFS’s predecessor entity in 2008. Under the terms of the agreement with DFS, MUFG Bank made a payment of $315 million to DFS, and agreed to take actions on persons involved in the matter at that time, relocate its U.S. Bank Secrecy Act/Anti-Money Laundering, or BSA/AML, and Office of Foreign Assets Control, or OFAC, sanctions compliance programs to New York, and extend, if regarded as necessary by DFS, the period during which an independent consultant is responsible for assessing MUFG Bank’s internal controls regarding compliance with applicable laws and regulations related to U.S. economic sanctions. In June 2013, MUFG Bank reached an agreement with DFS regarding inappropriate operational processing of U.S. dollar clearing transactions with countries subject to OFAC sanctions during the period of 2002 to 2007. Under the terms of the June 2013 agreement, MUFG Bank made a payment of $250 million to DFS and retained an independent consultant to conduct a compliance review of the relevant controls and related matters in MUFG Bank’s current operations. In December 2012, MUFG Bank agreed to make a payment of approximately $8.6 million to OFAC to settle potential civil liability for apparent violations of certain U.S. sanctions regulations from 2006 to 2007.
On November 9, 2017, MUFG Bank entered into a Stipulation and Consent to the Issuance of a Consent Order with the U.S. Office of the Comptroller of the Currency, or OCC, under which MUFG Bank agreed to the entry by the OCC of a Consent Order that includes remedial terms and conditions that are substantively the same as those included in the consent agreements that MUFG Bank had reached with DFS in June 2013 and November 2014. This Consent Order, which the OCC executed, enables the OCC to supervise MUFG Bank’s plans to enhance its internal controls and compliance program relating to OFAC sanctions requirements. The Stipulation and Consent with the OCC followed MUFG’s conversion of the U.S. Branches and Agencies of MUFG Bank and Mitsubishi UFJ Trust and Banking, including MUFG Bank’s New York Branch, from state-licensed branches and agencies under the supervision of state regulatory agencies, including DFS, to federally licensed branches and agencies under the supervision of the OCC. Although, MUFG Bank was engaged in litigation with DFS with regard to the conversion of its New York Branch license as well as purported violations of law alleged to have occurred prior to the federal license conversion, in June 2019, MUFG Bank entered into a settlement with NYDFS to resolve this litigation and made a settlement payment. In February 2019, MUFG Bank entered into a Consent Order with the OCC relating to deficiencies identified by the OCC in the Bank Secrecy Act/Anti-Money Laundering compliance program of MUFG Bank’s U.S. branches in New York, Los Angeles, and Chicago. MUFG Bank is undertaking necessary actions relating to these matters. See “Item 8.A. Financial Information—Consolidated Statements and Other Financial Information—Legal Proceedings.”
We have received requests and subpoenas for information from government agencies in some jurisdictions that are conducting investigations into past submissions made by panel members, including us, to the bodies that set various interbank benchmark rates as well as investigations into foreign exchange related practices of global financial institutions. Some of the investigations into foreign exchange related practices resulted in our payment of monetary penalties to the relevant government agencies. We are cooperating with the ongoing investigations and have been conducting an internal investigation, among other things. In connection with these matters, we and other financial institutions are involved as defendants in a number of civil lawsuits, including putative class actions, in the United States.
12
Table of Contents
These developments or other similar matters may result in additional regulatory actions against us or agreements to make significant additional settlement payments. These developments or other matters to which we are subject from time to time may also expose us to substantial monetary damages, legal defense costs, criminal and civil liability, and restrictions on our business operations as well as damage to our reputation. The outcome of such matters, including the extent of the potential impact of any unfavorable outcome on our financial results, however, is inherently uncertain and difficult to predict. The extent of financial, human and other resources required to conduct any investigations or to implement any corrective or preventive measures is similarly uncertain and could be significant. Such resources may also be difficult for us to secure in a timely manner.
Legal and regulatory changes could have a negative impact on our business, financial condition and results of operations.
As a global financial services provider, our business is subject to ongoing changes in laws, regulations, rules, policies, voluntary codes of practice and interpretations in Japan and other markets where we operate. Major global financial institutions currently face an increasingly stricter set of laws, regulations and standards as a result of the concerns enveloping the global financial sector. There is also growing political pressure to demand even greater internal compliance and risk management systems following several high-profile scandals and risk management failures in the financial industry. We may not be able to enhance our compliance risk management systems and programs, which, in some cases, are supported by third-party service providers, in a timely manner or as planned. Our risk management systems and programs may not be fully effective in preventing all violations of laws, regulations and rules applicable locally or on a global basis to our subsidiaries, offices and branches.
Our failure or inability to comply fully with applicable laws and regulations could lead to fines, public reprimands, damage to reputation, civil liability, enforced suspension of operations or, in extreme cases, withdrawal of authorization to operate, adversely affecting our business and results of operations. Legal or regulatory compliance failure may also adversely affect our ability to obtain regulatory approvals for future strategic initiatives. Furthermore, failure to take necessary corrective action, or the discovery of violations of laws in the process of further review of any of the matters mentioned above or in the process of implementing any corrective measures, could result in further regulatory action.
We could also be required to incur significant expenses to comply with new or revised regulations. For example, benchmark rate reforms may result in significant costs for making necessary adjustments to our financial instruments and related operations and also in significant financial losses relating to instruments using such rates. If we adopt a new information technology system infrastructure in the future, for instance, we may be required to incur significant additional costs for establishing and implementing effective internal controls, which may materially and adversely affect our financial condition and results of operations.
Future developments or changes in laws, regulations, rules, policies, voluntary codes of practice and their effects are expected to require greater capital, human and technological resources as well as significant management attention, and may require us to modify our business strategies and plans. For example, we are subject to new bank regulatory standards that were finalized as part of the reforms to “Basel III: A global regulatory framework for more resilient banks and banking systems,” or Basel III, in December 2017. These new standards include a minimum leverage ratio requirement, which became applicable to us in March 2019 and which is expected to be raised in 2022, as well as revisions to risk measurement approaches, which are expected to be phased in from 2022. We also became subject to minimum total loss-absorbing capacity, or TLAC, requirements in March 2019, and the minimum requirements are expected to be raised in 2022. For more information, see “—Risks Related to Our Business—We may not be able to maintain our capital ratios above minimum required levels, which could result in the suspension of some or all of our operations.” and “Item 4.B. Information on the Company—Business Overview—Supervision and Regulation—Japan.”
Furthermore, regulatory reforms recently implemented, proposed and currently being debated in the United States may also significantly affect our business operations. For example, in July 2016, we established
13
Table of Contents
MUFG Americas Holdings as a U.S. intermediate holding company, or IHC, and reorganized our U.S. bank and non-bank subsidiaries under MUFG Americas Holdings pursuant to rules adopted by the FRB in February 2014. Under the FRB rules, MUFG Americas Holdings is also subject to U.S. capital requirements, capital stress testing, liquidity buffer requirements, and other enhanced prudential standards comparable to those applicable to top-tier U.S. bank holding companies of the same size. In April 2019, the FRB proposed modifications to such requirements and standards as applied to foreign banking organizations, which could result in stricter requirements and standards for MUFG Americas Holdings. We are continuing to devote resources and management attention on establishing an appropriate governance structure with effective internal control systems for MUFG Americas Holdings designed to ensure compliance with the rules on an on-going basis. See “Item 4.B. Information on the Company—Business Overview—Supervision and Regulation—United States.”
Any adverse changes in the business of MUFG Americas Holdings Corporation, a wholly owned subsidiary in the United States, could significantly affect our results of operations.
MUFG Americas Holdings, which is a wholly owned subsidiary in the United States formerly called UnionBanCal Corporation, or UNBC, and which is our IHC in the United States, has historically contributed to a significant portion of net income attributable to the Mitsubishi UFJ Financial Group. MUFG Americas Holdings reported net income of $990 million, $1,077 million and $1,073 million for the fiscal years ended December 31, 2016, 2017 and 2018 respectively. Any adverse developments which could arise at MUFG Americas Holdings may have a significant negative impact on our results of operations and financial condition. For more information, see “Item 4.B. Information on the Company—Business Overview—Global Commercial Banking Business Group—MUFG Union Bank, N.A.”
Factors that have negatively affected, and could continue to negatively affect, MUFG Americas Holdings’ results of operations include difficult economic conditions, such as a downturn in the real estate and housing industries in the United States, particularly in California, the fiscal challenges being experienced by the U.S. federal and California state governments, substantial competition in the banking markets in the United States and uncertainty over the U.S. economy, as well as negative trends in debt ratings and interest rate uncertainties. As was the case in recent periods, declining oil and gas prices could adversely affect the credit conditions of borrowers in the energy sector and related industries, resulting in an increase in credit costs. In addition, since the financial crisis in 2008 and 2009, the U.S. banking industry has operated in an extremely low interest rate environment as a result of the highly accommodative monetary policy of the FRB, which has placed downward pressure on the net interest margins of U.S. banks, including MUFG Americas Holdings. Although the FRB gradually raised its policy interest rate between December 2015 and December 2018, interest rates have remained at relatively low levels in the United States. Sudden fluctuations in interest rates may also negatively affect MUFG Americas Holdings’ results of operations.
Significant costs may arise from enterprise-wide compliance and risk management requirements under, or failure to comply with, applicable laws and regulations, such as the U.S. Bank Secrecy Act and related amendments under the USA PATRIOT Act, and any adverse impact of the implementation of the Dodd-Frank Act. In addition, the FRB and other U.S. bank regulators have adopted rules to implement the Basel III global regulatory framework for U.S. banks and bank holding companies which require higher quality of capital, as well as significantly revise the calculations for risk-weighted assets. The FRB has also adopted rules to implement various enhanced prudential standards required by the Dodd-Frank Act for larger U.S. bank holding companies, such as MUFG Americas Holdings. These standards require the larger bank holding companies to meet enhanced capital, liquidity and leverage standards. Further, the FRB has adopted regulations applicable to foreign banking organizations operating in the United States, which require MUFG’s and MUFG Bank’s U.S. operations to be restructured and, subject to certain exceptions, conducted under a single U.S. IHC, with its own capital and
liquidity requirements. Actions management may take in response to these regulatory changes may involve the issuance of additional capital or other measures. For more information, see “Item 4.B. Information on the Company—Business Overview—Supervision and Regulation—United States.”
14
Table of Contents
MUFG Union Bank, which is the principal subsidiary of MUFG Americas Holdings, and reportedly other financial institutions have been the targets of various denial-of-service or other cyber-attacks as part of what appears to be a coordinated effort to disrupt the operations of financial institutions and potentially test their cybersecurity in advance of future and more advanced cyber-attacks. These denial-of-service attacks may require substantial resources to defend against and affect customer satisfaction and behavior. Moreover, MUFG Union Bank’s information security measures may not be sufficient to defend against cyber-attacks and other information security breaches, in which case the consequences could be significant in terms of financial, reputational and other losses. In addition, there have been increasing efforts to breach data security at financial institutions as well as other types of companies, such as large retailers, or with respect to financial transactions, including through the use of social engineering schemes such as “phishing.” Even if cyber-attacks and similar tactics are not directed specifically at MUFG Union Bank, such attacks on other large institutions could disrupt the overall functioning of the U.S. or global financial system and undermine consumer confidence in banks generally to the detriment of other financial institutions, including MUFG Union Bank.
Any adverse changes in the business of Bank of Ayudhya, an indirect subsidiary in Thailand, or Bank Danamon, an indirect subsidiary in Indonesia, could significantly affect our results of operations.
Any adverse changes in the business or management of Bank of Ayudhya Public Company Limited, or Krungsri, a strategic subsidiary in Thailand in which we hold a 76.88% ownership interest as of March 31, 2019, or PT Bank Danamon Indonesia, Tbk, or Bank Danamon, a strategic subsidiary in Indonesia in which we hold a 94.1% ownership interest as of May 1, 2019, may negatively affect our financial condition and results of operations. Factors that may negatively affect the financial condition and results of operations of these subsidiaries include:
| • |
adverse economic conditions, substantial competition in the banking industry, volatile political and social conditions, natural disasters including floods, terrorism and armed conflicts, restrictions under applicable financial systems and regulations, or significant fluctuations in interest rates, foreign currency exchange rates, stock prices or commodity prices, in Southeast Asia, particularly in their respective home markets; |
| • |
the business performance of companies making investments in and entering into markets in the Southeast Asian region, as well as the condition of economies, financial systems, laws and financial markets in the countries where such companies primarily operate; |
| • |
losses from legal proceedings involving them; |
| • |
credit rating downgrades and declines in stock prices of their borrowers, and bankruptcies of their borrowers resulting from such factors; |
| • |
defaults on their loans to individuals; and |
| • |
costs incurred due to weaknesses in their internal controls and regulatory compliance systems or any of their subsidiaries. |
As of March 31, 2019, the balance of goodwill associated with the acquisition of Krungsri, including Krungsri’s acquisition of Hattha Kaksekar Limited, a microfinance institution in Cambodia, in September 2016, was ¥59.0 billion. In May 2019, we completed a series of transactions to increase our ownership interest in Bank Danamon to 94.1%, as a result of which Bank Danamon became our consolidated subsidiary. If the business of Krungsri or Bank Danamon deteriorates, we may be required to record impairment losses, which could have a material adverse effect on our results of operations and financial condition. See “—Risks Related to Our Business—If the goodwill recorded in connection with our acquisitions becomes impaired, we may be required to record impairment losses, which may adversely affect our financial results.”
15
Table of Contents
Our strategy to expand the range of our financial products and services and the geographic scope of our business globally may fail if we are unable to anticipate or manage new or expanded risks that entail such expansion.
We continue to seek opportunities to expand the range of our products and services beyond our traditional banking, trust, and securities businesses, through development and introduction of new products and services or through acquisitions of or investments in financial institutions with products and services that complement our business. For example, we continue to seek opportunities to expand our business outside of Japan. In addition, the sophistication of financial products and services and management systems has been growing significantly in recent years. As a result, we are exposed to new and increasingly complex risks, while market and regulatory expectations that we manage these risks properly continue to rise. Some of the activities that our subsidiaries are expected to engage in, such as credit extension to less conventional assets and operations as well as derivatives and foreign currency trading, present substantial risks. In some cases, we have only limited experience with the risks related to the expanded range of these products and services. In addition, we may not be able to successfully develop or operate the necessary information technology systems. As a result, we may not be able to foresee the risks relating to new products and services.
As we expand the geographic scope of our business, we will also be exposed to risks that are unique to particular jurisdictions or markets. For example, in an effort to further develop our operations in Asia, MUFG Bank purchased 72.01% of the outstanding shares of Krungsri in December 2013 and acquired additional shares in January 2015, increasing MUFG Bank’s ownership interest to 76.88%. MUFG Bank has also held an approximately 20% equity interest in Vietnam Joint Stock Commercial Bank of Industry and Trade since December 2012 and a 20.0% equity interest in Security Bank Corporation in the Philippines since April 2016. In addition, MUFG Bank acquired 19.9% of the shares of common stock of PT Bank Danamon Indonesia, Tbk in December 2017 and increased its shareholding in the bank to 94.1% in May 2019. As we seek to enter new markets or jurisdictions, we often seek to collaborate with a local business partner by becoming a shareholder as well as providing management expertise for the local market. In such circumstances, the local business partner may have business interests that are inconsistent with our interests and, as a result, we may be unable to achieve the goals initially set out in our strategy for that market. In addition, we may be unable to staff our newly expanded operations with qualified individuals familiar with local legal and regulatory requirements and business practices, exposing us to legal, regulatory, operational and other risks.
Our risk management systems may prove to be inadequate and may not work in all cases or to the degree required locally and globally for all of our subsidiaries, offices and branches. The increasing market, credit, compliance and regulatory risks in relation to the expanding scope of our products, services and trading activities or expanding our business beyond our traditional markets, could result in us incurring substantial losses. In addition, our efforts to offer new products and services or penetrate new markets may not succeed if product or market opportunities develop more slowly than expected, if our new products and services are not well accepted among customers, if the profitability of opportunities is undermined by competitive pressures or regulatory limitations, or if our planned acquisitions, investments or capital alliances are not approved by regulators. For more information on our recent acquisition and investment transactions, see “Item 5. Operating and Financial Review and Prospects—Recent Developments.”
Unanticipated economic changes in, and measures taken in response to such changes by, emerging market countries could result in additional losses.
We are increasingly active, through a network of branches and subsidiaries, in emerging market countries, particularly countries in Asia, Latin America, Central and Eastern Europe, and the Middle East. For example, based primarily on the domicile of the obligors, our assets in Europe, Asia and Oceania excluding Japan, and other areas excluding Japan and the United States, were ¥21,535.3 billion, ¥27,993.0 billion and ¥11,642.7 billion, representing 7.1%, 9.2% and 3.8% of our total assets as of March 31, 2019, respectively. The economies of emerging market countries can be volatile and susceptible to adverse changes and trends in the
16
Table of Contents
global financial markets. For example, a decline in the value of local currencies of these countries could negatively affect the creditworthiness of some of our borrowers in these countries. The loans we have made to borrowers and banks in these countries are often denominated in U.S. dollars, euro or other foreign currencies. These borrowers often do not hedge the loans to protect against fluctuations in the values of local currencies. A devaluation of the local currency would make it more difficult for a borrower earning income in that currency to pay its debts to us and other foreign lenders. In addition, some countries in which we operate may attempt to support the value of their currencies by raising domestic interest rates. If this happens, the borrowers in these countries would have to devote more of their resources to repaying their domestic obligations, which may adversely affect their ability to repay their debts to us and other foreign lenders. The limited credit availability resulting from these conditions may adversely affect economic conditions in some countries. This could cause a further deterioration of the credit quality of borrowers and banks in those countries and cause us to incur further losses. In addition, should there be excessively rapid economic growth and increasing inflationary pressure in some of the emerging market countries, such developments could adversely affect the wider regional and global economies. Some emerging market countries may also change their monetary or other economic policies in response to economic and political instabilities or pressures, which are difficult to predict. See “Item 5.B. Operating and Financial Review and Prospects—Liquidity and Capital Resources—Financial Condition.”
If our strategic alliance with Morgan Stanley fails, we could suffer financial or reputational loss.
We have a global strategic alliance with Morgan Stanley, under which we operate two joint venture securities companies in Japan, engage in joint corporate finance operations in the United States and pursue other cooperative opportunities. We hold approximately 24.0% of the voting rights in Morgan Stanley as of March 31, 2019 and continue to hold approximately $521.4 million of perpetual non-cumulative non-convertible preferred stock with a 10% dividend. In addition, we currently have two representatives on Morgan Stanley’s board of directors.
We initially entered into this strategic alliance in October 2008 with a view towards long-term cooperation with Morgan Stanley, and currently plan to deepen the strategic alliance. However, due to any unexpected changes in social, economic or financial conditions, changes in the regulatory environment, or any failure to integrate or share staff, products or services, or to operate, manage or implement the business strategy of the securities joint venture companies or other cooperative opportunities as planned, we may be unable to achieve the expected synergies from this alliance.
If our strategic alliance with Morgan Stanley is terminated, it could have a material negative impact on our business strategy, financial condition, and results of operations. For example, because we conduct our securities operations in Japan through the joint venture companies we have with Morgan Stanley, such termination may result in our inability to attain the planned growth in this line of business.
In addition, with our current investment in Morgan Stanley, we have neither a controlling interest in, nor control over the business operations of Morgan Stanley. If Morgan Stanley makes any business decisions that are inconsistent with our interests, we may be unable to achieve the goals initially set out for the strategic alliance. Furthermore, although we do not control Morgan Stanley, given the magnitude of our investment, if Morgan Stanley encounters financial or other business difficulties due to adverse changes in the economy, regulatory environment or other factors, we may suffer a financial loss on our investment or damage to our reputation. For example, we recorded an impairment loss of ¥579.5 billion on our investment in Morgan Stanley’s common stock for the fiscal year ended March 31, 2012.
We apply equity method accounting to our investment in Morgan Stanley in our consolidated financial statements. As a result, Morgan Stanley’s performance affects our results of operations, and Morgan Stanley has contributed to a significant portion of our net income in recent periods. Rule 3-09 of Regulation S-X requires Morgan Stanley’s financial statements to be included in this Annual Report. In addition fluctuations in Morgan
17
Table of Contents
Stanley’s stock price or in our equity ownership interest in Morgan Stanley may cause us to recognize additional losses on our investment in Morgan Stanley.
We may incur further losses as a result of financial difficulties relating to other financial institutions, both directly and through the effect they may have on the overall banking environment and on their borrowers.
Declining asset quality, capital adequacy and other financial problems of domestic and foreign financial institutions, including banks, non-bank lending and credit institutions, securities companies and insurance companies, may lead to severe liquidity and solvency problems, which have in the past resulted in the liquidation, government control or restructuring of affected institutions. In addition, allegations or governmental prosecution of improper trading activities or inappropriate business conduct of a specific financial institution could also negatively affect the public perception of other global financial institutions individually and the global financial industry as a whole. These developments may adversely affect our financial results.
Financial difficulties relating to financial institutions could adversely affect us because we have extended loans, some of which may need to be classified as impaired loans, to banks, securities companies, insurance companies and other financial institutions that are not our consolidated subsidiaries. Our loans to banks and other financial institutions have been more than 10% of our total loans as of each year-end in the three fiscal years ended March 31, 2019, with the percentage being 14.4% as of March 31, 2019. We may also be adversely affected because we are a shareholder of some other banks and financial institutions that are not our consolidated subsidiaries, including our shareholdings in Japanese regional banks and our 24.0% voting interest in Morgan Stanley as of March 31, 2019. If some of the financial institutions to which we have exposure experience financial difficulties, we may need to provide financial support to them even when such support might not be warranted from the perspective of our narrow economic interests because such institutions may be systemically important to the Japanese or global financial system.
We may also be adversely affected because we enter into transactions, such as derivative transactions, in the ordinary course of business, with other banks and financial institutions as counterparties. For example, we enter into credit derivatives with banks, broker-dealers, insurance companies and other financial institutions for managing credit risk exposures, for facilitating client transactions, and for proprietary trading purposes. The notional amount of the protection we sold through these instruments was ¥3.22 trillion as of March 31, 2019.
In addition, financial difficulties relating to financial institutions could indirectly have an adverse effect on us because:
| • |
we may be requested to participate in providing assistance to support distressed financial institutions that are not our consolidated subsidiaries; |
| • |
the government may elect to provide regulatory, tax, funding or other benefits to those financial institutions to strengthen their capital, facilitate their sale or otherwise, which in turn may increase their competitiveness against us; |
| • |
deposit insurance premiums could rise if deposit insurance funds prove to be inadequate; |
| • |
bankruptcies or government support or control of financial institutions could generally undermine confidence in financial institutions or adversely affect the overall banking environment; |
| • |
failures or financial difficulties experienced by other financial institutions could result in additional regulations or requirements that increase the cost of business for us; and |
| • |
negative media coverage of the financial industry, regardless of its accuracy and applicability to us, could affect customer or investor sentiment, harm our reputation and have a materially adverse effect on our business or the price of our securities. |
18
Table of Contents
Because of our loans to consumers and our shareholdings in companies engaged in consumer lending, changes in the business or regulatory environment for consumer finance companies in Japan may further adversely affect our financial results.
We have a large loan portfolio in the consumer lending industry as well as large shareholdings in subsidiaries and equity method investees in the consumer finance industry. Our domestic loans to consumers amount to approximately one-seventh of our total outstanding loans. Of this amount, the consumer loans provided by Mitsubishi UFJ NICOS, Co., Ltd., which is our primary consumer financing subsidiary, were ¥578.5 billion as of March 31, 2019, compared to ¥589.8 billion as of March 31, 2018.
Mitsubishi UFJ NICOS’s consumer loan portfolio has been adversely affected by a series of regulatory reforms that were introduced in Japan between 2006 and 2010, which have negatively affected the domestic consumer lending industry. In December 2006, the Japanese Diet passed legislation to reform the regulations relating to the consumer lending business, including amendments to the Act Regulating the Receipt of Contributions, the Receipt of Deposits, and Interest Rates, which, effective June 18, 2010, reduced the maximum permissible interest rate from 29.2% per annum to 20% per annum. The regulatory reforms also included amendments to the Money Lending Business Act, which, effective June 18, 2010, abolished the so-called “gray-zone interest.” Gray-zone interest refers to interest rates exceeding the limits stipulated by the Interest Rate Restriction Act (between 15% per annum to 20% per annum depending on the amount of principal). Prior to June 18, 2010, gray-zone interest was permitted under certain conditions set forth in the Money Lending Business Act. As a result of the regulatory reforms, all interest rates are now subject to the lower limits imposed by the Interest Rate Restriction Act, compelling lending institutions, including our consumer finance subsidiaries and equity method investees, to lower the interest rates they charge borrowers. The regulations that became effective on June 18, 2010 also have had a further negative impact on the business of consumer finance companies as one of the new regulations requires, among other things, consumer finance companies to limit their lending to a single customer to a maximum of one third of the customer’s annual income regardless of the customer’s repayment capability, significantly affecting consumer financing companies.
The regulations and regulatory reforms affecting the consumer finance business were one of the main factors that contributed to the decrease in interest income attributable to our consumer finance business. Our interest income attributable to the consumer finance business was approximately ¥190 billion and ¥160 billion for the fiscal years ended March 31, 2009 and 2010, respectively. However, following the regulatory changes in June 2010, our interest income attributable to the consumer finance business substantially decreased. For the fiscal year ended March 31, 2019, our interest income attributable to the consumer finance business was approximately ¥90 billion.
In addition, as a result of decisions by the Supreme Court of Japan prior to June 18, 2010 imposing stringent requirements under the Money Lending Business Act for charging gray-zone interest rates, consumer finance companies have experienced a significant increase in borrowers’ claims for reimbursement of previously collected interest payments in excess of the limits stipulated by the Interest Rate Restriction Act.
Following the various legal developments in June 2010 and other industry developments, Mitsubishi UFJ NICOS revised its estimate of allowance for repayment of excess interest by updating management’s future forecast to reflect new reimbursement claims information and other data. As of March 31, 2017, 2018 and 2019, we had ¥39.4 billion, ¥23.7 billion and ¥25.0 billion of allowance for repayment of excess interest, respectively. In recent periods, one of our equity method investees engaged in consumer lending, ACOM CO., LTD., had a negative impact on net equity in losses of equity method investees in our consolidated statements of income. For example, ACOM had a negative impact of ¥15.6 billion for the fiscal years ended March 31, 2019. We intend to carefully monitor future developments and trends.
These developments have adversely affected, and these and any future developments may further adversely affect, the operations and financial condition of our subsidiaries, equity method investees and borrowers which
19
Table of Contents
are engaged in consumer lending, which in turn may affect the value of our related shareholdings and loan portfolio.
Our business may be adversely affected by competitive pressures, which have partly increased due to regulatory changes and recent market changes in the financial industry domestically and globally.
In recent years, the Japanese financial system has been undergoing significant changes and regulatory barriers to competition have been reduced. Development of new technologies such as artificial intelligence, or AI, and blockchain has also allowed non-financial institutions to enter the financial services industry with alternative services such as electronic settlement services, and these new entrants could become substantial competition to us. We may be at a competitive disadvantage if we are unable to build a business infrastructure for new services through digitalization or otherwise as planned. In addition, mergers and restructuring in the financial sector in Japan may adversely affect our competitive position. Partly to deal with these developments, as part of our strategy to realign the functions of our subsidiaries, we transferred Mitsubishi UFJ Trust and Banking’s corporate and other loan-related business to MUFG Bank in April 2018. Our competitive position in the corporate loan-related market may weaken if we are unable to realize the expected benefits of this and other realignment measures.
In the overseas markets, development of new technologies such as AI and blockchain has also allowed non-financial institutions to enter the financial services industry, and such new entrants could become substantial competition to us. Competition may further increase as U.S. and European financial institutions have recently been regaining and enhancing their competitive strength. We also face intensifying competition in areas of our strategic expansion. For example, the Japanese mega banks, including us, and other major international banks have been expanding their operations in the Asian market, where leading local banks have recently been growing and increasing their presence. In addition, there has been significant consolidation and convergence among financial institutions domestically and globally, and this trend may continue in the future and further increase competition in the market. A number of large commercial banks and other broad-based financial services firms have merged or formed strategic alliances with, or have acquired, other financial institutions both in Japan and overseas. As a result of the strategic alliance and the joint venture companies that we formed with Morgan Stanley, we may be perceived as a competitor by some of the financial institutions with which we had a more cooperative relationship in the past. If we are unable to compete effectively in this more competitive and deregulated business environment, our business, results of operations and financial condition will be adversely affected. For a more detailed discussion of our competition in Japan, see “Item 4.B. Information on the Company—Business Overview—Competition.”
Future changes in accounting standards or methods could have a negative impact on our business and results of operations.
Future developments or changes in accounting standards are unpredictable and beyond our control. For example, in response to the recent instabilities in global financial markets, several international organizations which set accounting standards have released proposals to revise standards on accounting for financial instruments. Accounting standards applicable to financial instruments remain subject to debate and revision by international organizations which set accounting standards. If the current accounting standards change in the future, the reported values of some of our financial instruments may need to be modified, and such modification could have a significant impact on our financial results or financial condition. In addition, the bodies that interpret the accounting standards may change their interpretations, or we may elect to modify our accounting methods to improve our financial reporting, and such change or modification may also have a significant impact on our financial results or financial condition. For more information, see “Item 5. Operating and Financial Review and Prospects—Critical Accounting Estimates.”
We could also be required to incur significant expenses to comply with new accounting standards and regulations. For example, if we adopt a new accounting system in the future, we may be required to incur
20
Table of Contents
significant additional costs for establishing and implementing effective internal controls, which may materially and adversely affect our financial condition and results of operations.
Transactions with counterparties in countries designated by the U.S. Department of State as state sponsors of terrorism may lead some potential customers and investors in the United States and other countries to avoid doing business with us or investing in our shares.
We, through our subsidiaries, engage in limited business activities with entities in or affiliated with Iran, including transactions with counterparties owned or controlled by the Iranian government, and our commercial banking subsidiary has a representative office in Iran for information gathering purposes only. The U.S. Department of State has designated Iran and other countries as “state sponsors of terrorism,” and U.S. law generally prohibits U.S. persons from doing business with such countries. We currently have limited business activities conducted with entities in or affiliated with such countries. Such business activities are conducted in accordance with our policies and procedures designed to ensure compliance with regulations applicable in the jurisdictions in which we operate and with exemptions and general licenses available under U.S. law.
We have transactions with counterparties in or affiliated with countries designated as state sponsors of terrorism which consist of receiving deposits or holding assets on behalf of individuals residing in Japan who are citizens of countries designated as state sponsors of terrorism, processing payments to or from entities in or affiliated with these countries on behalf of our customers, and issuing letters of credit and guarantees in connection with transactions with entities in or affiliated with such countries by our customers. These transactions do not have a material impact on our business or financial condition. For a further discussion of transactions required to be disclosed under the U.S. Iran Threat Reduction and Syria Human Rights Act of 2012, see “Item 4.B. Information on the Company—Business Overview—Supervision and Regulation—United States—Disclosure pursuant to Section 13(r) of the Securities Exchange Act of 1934.”
We are aware of initiatives by U.S. governmental entities and non-government entities, including institutional investors such as pension funds, to adopt or consider adopting laws, regulations or policies prohibiting transactions with or investment in, or requiring divestment from, entities doing business with Iran and other countries identified as state sponsors of terrorism. It is possible that such initiatives may result in our being unable to gain or retain entities subject to such prohibitions as customers, counter-parties or investors in our shares. In addition, depending on socio-political developments, our reputation may suffer due to our transactions with counterparties in or affiliated with these countries. The above circumstances could have an adverse effect on our business and financial condition.
Global financial institutions, including us, have become subject to an increasingly complex set of sanctions laws and regulations in recent years, and this regulatory environment is expected to continue. Moreover, the measures proposed or adopted vary across the major jurisdictions, increasing the cost and resources necessary to design and implement an appropriate global compliance program. The U.S. federal government and some state governments in the United States have enacted legislation designed to limit economic and financial transactions with Iran by limiting the ability of financial institutions that may have engaged in any one of a broad range of activities related to Iran to conduct various transactions in the relevant jurisdictions. In addition, in May 2018, the United States withdrew from participation in the Joint Comprehensive Plan of Action. Under subsequently issued executive orders, the United States may impose secondary sanctions against non-U.S. persons who engage in or facilitate a broad range of transactions and activities involving Iran. The Japanese government has also implemented a series of measures under the Foreign Exchange and Foreign Trade Act, such as freezing the assets of persons involved in Iran’s sensitive nuclear activities and development of nuclear weapon delivery systems, and our most recently modified policies and procedures take into account the current Japanese regulatory requirements. We continue to implement measures to enhance our policies and procedures to comply with such legislative and regulatory requirements. There remains a risk of potential regulatory action against us, however, if regulators perceive the modified policies and procedures not to be in compliance with applicable legislation and regulations.
21
Table of Contents
We may not be able to maintain our capital ratios and other regulatory ratios above minimum required levels, which could result in various regulatory actions, including the suspension of some or all of our operations.
We, as a holding company, and our Japanese banking subsidiaries are required to maintain risk-weighted capital ratios and leverage ratios above the levels specified in the guidelines adopted by the FSA to implement the Basel III framework. As of March 31, 2019, our total risk-adjusted capital ratio was 16.03% compared to the minimum risk-adjusted capital ratio required of 12.04%, our Tier 1 capital ratio was 13.90% compared to the minimum Tier 1 capital ratio required of 10.04%, and our Common Equity Tier 1 capital ratio was 12.23% compared to the minimum Common Equity Tier 1 capital ratio required of 8.54%, each including a capital conservation buffer of 2.50%, a G-SIB surcharge of 1.50% and a countercyclical buffer of 0.04%. As of the same date, our leverage ratio was 4.94% compared to the minimum leverage ratio required of 3.00%. Our capital and leverage ratios are calculated in accordance with Japanese banking regulations based on information derived from our financial statements prepared in accordance with Japanese GAAP.
The Financial Stability Board has identified us as one of G-SIBs. The banks that are included in the list of G-SIBs are subject to a capital surcharge to varying degrees depending on the bucket to which each bank is allocated. As the list of G-SIBs is expected to be updated annually, we may be required to meet stricter capital ratio requirements.
In December 2017, the Basel Committee on Banking Supervision released the finalized Basel III reforms, which are designed, among other things, to improve various risk measurement approaches and add a leverage ratio surcharge for G-SIBs, including us. The finalized risk measurement requirements will be phased in from 2022 and the leverage ratio surcharge will become applicable in 2022.
If our or our Japanese banking subsidiaries’ capital ratios or leverage ratios fall below the required levels, including various capital buffers, the FSA may require us to take a variety of corrective actions, including abstention from making capital distributions and suspension of all or a part of our business operations.
In addition, some of our banking subsidiaries are subject to the local capital adequacy ratio and other regulatory ratio requirements of various foreign countries, including the United States, and if their ratios fall below the required levels, the local regulators will require them to take a variety of corrective actions.
Factors that will affect our and our bank subsidiaries’ capital ratios or leverage ratios include:
| • |
fluctuations in our or our banking subsidiaries’ portfolios due to deterioration in the creditworthiness of borrowers and the issuers of equity and debt securities; |
| • |
difficulty in refinancing or issuing instruments upon redemption or at maturity of such instruments to raise capital under terms and conditions similar to prior financings or issuances; |
| • |
declines in the value of our or our banking subsidiaries’ securities portfolios; |
| • |
adverse changes in foreign currency exchange rates; |
| • |
adverse revisions to the capital ratio and other regulatory ratio requirements; |
| • |
reductions in the value of our or our banking subsidiaries’ deferred tax assets; and |
| • |
other adverse developments. |
Under the FSA guidelines discussed above, there is a transitional measure relating to the inclusion as a capital item of capital raising instruments issued in or prior to March 2013, and such instruments qualify, and can be included, as a capital item when calculating capital ratios to the extent permitted by the transitional measure. Such capital raising instruments may require refinancing upon the expiration of the transition period during which such instruments can qualify, and can be included, as a capital item in the calculation of capital ratios.
22
Table of Contents
However, in order for newly issued capital raising instruments, other than common stock, to be included as a capital item in the calculation of capital ratios under the current FSA guidelines, such instruments must, among other things, have a clause in their terms and conditions that requires them to be written off or converted into common stock upon the occurrence of certain events, including when the issuing financial institution is deemed non-viable or when the issuing financial institution’s capital ratios decline below prescribed levels. As a result, under certain market conditions, we may be unable to refinance or issue capital raising instruments under terms and conditions similar to those of capital raising instruments issued in or prior to March 2013. If such circumstances arise, our and our banking subsidiaries’ capital could be reduced, and our and our bank subsidiaries’ capital ratios and leverage ratios could decrease.
In March 2019, we became subject to the FSA’s new regulations requiring G-SIBs in Japan to maintain certain minimum levels of capital and liabilities that are deemed to have loss-absorbing and recapitalization capacity, or External TLAC, and allocate a certain minimum level of External TLAC to any material subsidiary within their respective groups of companies, or Internal TLAC. As of March 31, 2019, we maintained 18.16% of External TLAC on a risk-weighted assets basis compared to the required minimum ratio of 16.00% and 7.90% of External TLAC on a leverage exposure basis compared to the required minimum ratio of 6.00%. The applicable minimum ratio requirements are expected to be raised to 18.00% on a risk-weighted assets basis and 6.75% on a leverage exposure basis on March 31, 2022. Within the MUFG Group, MUFG Bank, Mitsubishi UFJ Trust and Banking, Mitsubishi UFJ Morgan Stanley Securities Co., Ltd. and MUFG Americas Holdings are designated as our material subsidiaries. We may become subject to various regulatory actions, including restrictions on capital distributions, if we are unable to maintain our External TLAC ratios or the amount of Internal TLAC allocated to any of our material subsidiaries in Japan above the minimum levels required by the standards imposed by the FSA. Our External TLAC ratios and the amount of our Internal TLAC are affected by various factors that affect our capital ratios and leverage ratios described above. Although we plan to issue TLAC-qualified debt in an effort to meet the minimum required levels of External TLAC ratios and Internal TLAC amounts, we may fail to do so if we are unable to issue or refinance TLAC-qualified debt as planned.
For a discussion of the applicable regulatory guidelines and our capital ratios, see “Item 4.B. Information on the Company—Business Overview—Supervision and Regulation” and “Item 5.B. Operating and Financial Review and Prospects—Liquidity and Capital Resources—Capital Adequacy.”
If the goodwill recorded in connection with our acquisitions becomes impaired, we may be required to record impairment losses, which may adversely affect our financial results.
In accordance with U.S. GAAP, we account for our business combinations using the acquisition method of accounting. We recorded the excess of the purchase price over the fair value of the assets and liabilities of the acquired companies as goodwill. U.S. GAAP requires us to test goodwill for impairment at least annually, or more frequently if events or changes in circumstances indicate that goodwill may be impaired. As of March 31, 2019, the total balance of goodwill was ¥433.9 billion. As we expand our business through acquisitions and investments, we may record additional goodwill in connection with such acquisitions and investments, which may subsequently be impaired.
For the fiscal years ended March 31, 2016 and 2017, we recognized ¥4.3 billion and ¥6.6 billion, respectively, in impairment of goodwill relating to a reporting unit within the Trust Assets Business Group segment as we readjusted our future cash flow projection of the reporting unit in this segment, considering the relevant subsidiaries’ recent business performance. For the fiscal year ended March 31, 2016, we also recognized ¥151.7 billion in impairment of goodwill relating to the reporting unit other than MUFG Americas Holdings and Krungsri within the Global Business Group segment as our stock price decreased from ¥743.7 on March 31, 2015 to ¥521.5 on March 31, 2016. Our stock price was adversely impacted by the Bank of Japan’s announcement of implementation in January 2016 of the negative interest rate on certain current account amounts that financial institutions hold at the Bank of Japan, and the appreciation of the Japanese yen against other major currencies. In addition, we recognized ¥177.8 billion in impairment of goodwill relating to the Krungsri reporting unit within
23
Table of Contents
the Global Business Group segment as Krungsri’s stock price declined from THB44.75 on December 31, 2014 to THB29.75 on December 31, 2015. Krungsri’s stock price was adversely impacted by the slowing economic growth in Thailand. Accordingly, the fair values of these reporting units were considered to have fallen below their carrying amounts. As a result, the carrying amounts of the reporting units’ goodwill exceeded the implied fair values of the reporting units’ goodwill, and the impairment losses were recognized on the related goodwill. See “Item 5.B. Operating and Financial Review and Prospects—Operating Results—Impairment of goodwill.”
We may be required to record additional impairment losses relating to goodwill in future periods if the fair value of any of our reporting units declines below the fair value of related assets net of liabilities. Any additional impairment losses will negatively affect our financial results, and the price of our securities could be adversely affected. For a detailed discussion of our periodic testing of goodwill for impairment and the goodwill recorded, see “Item 5. Operating and Financial Review and Prospects—Critical Accounting Estimates—Accounting for Goodwill and Intangible Assets.”
A downgrade of our credit ratings could adversely affect our ability to access and maintain liquidity.
Any downgrade of the credit ratings assigned to us or our debt securities by Moody’s, Fitch, Standard & Poor’s or any other credit rating agency could increase the cost, or decrease the availability, of our funding, particularly in U.S. dollars and other foreign currencies, adversely affect our liquidity position or net interest margin, trigger additional collateral or funding obligations, and result in losses of depositors, investors and counterparties willing or permitted to transact with us, thereby reducing our ability to generate income and weakening our financial position.
Rating agencies regularly evaluate us and our major subsidiaries as well as our and their respective debt securities. Their ratings are based on a number of factors, including their assessment of the relative financial strength of MUFG or of the relevant subsidiary, as well as conditions generally affecting the financial services industry in Japan or on a global basis, some of which are not entirely within our control. As a result of changes in their evaluation of these factors or in their rating methodologies, rating agencies may downgrade our ratings or our subsidiaries’ ratings.
In November 2017, Standard and Poor’s downgraded the long-term credit ratings of MUFG and Mitsubishi UFJ Securities Holdings by one-notch from A to A-, the long-term credit ratings of MUFG Bank and Mitsubishi UFJ Trust and Banking by one-notch from A+ to A, and the short-term credit rating of Mitsubishi UFJ Securities Holdings by one-notch from A-1 to A-2.
Assuming all of the relevant credit rating agencies downgraded the credit ratings of MUFG, MUFG Bank, Mitsubishi UFJ Trust and Banking and Mitsubishi UFJ Securities Holdings by one-notch on March 31, 2019, we estimate that MUFG and its three main subsidiaries would have been required to provide additional collateral under their derivative contracts as of the same date of approximately ¥25.5 billion. Assuming a two-notch downgrade by all of the relevant credit rating agencies occurred on the same date, we estimate that the additional collateral requirements for MUFG, MUFG Bank, Mitsubishi UFJ Trust and Banking and Mitsubishi UFJ Securities Holdings under their derivative contracts as of the same date would have been approximately ¥51.1 billion. For additional information on the impact of recent downgrades, see “Item 5.B. Operating and Financial Review and Prospects—Liquidity and Capital Resources—Financial Condition—Sources of Funding and Liquidity.”
Our business operations are exposed to risks of natural disasters, terrorism and other disruptions caused by external events.
As a major financial institution incorporated in Japan and operating in major international financial markets, our business operations, automatic teller machines, or ATMs, and other information technology systems, personnel, and facilities and other physical assets are subject to the risks of earthquakes, typhoons, floods and
24
Table of Contents
other natural disasters, terrorism, and other political and social conflicts, abduction, health epidemics, and other disruptions caused by external events, which are beyond our control. As a consequence of such external events, we may be required to incur significant costs and expenses for remedial measures or compensation to customers or transaction counterparties for resulting losses. We may suffer loss of facility, human and other resources. We may also suffer loss of business. In addition, such external events may have various other significant adverse effects, including deterioration in economic conditions, declines in the business performance of our borrowers and decreases in stock prices, which may result in higher credit costs or impairment or valuation losses on the financial instruments we hold. These effects could materially and adversely affect our business, operating results and financial condition.
As with other Japanese companies, we are exposed to heightened risks of large-scale natural disasters, particularly earthquakes. In particular, a large-scale earthquake occurring in the Tokyo metropolitan area could result in market disruptions or significant damage to, or losses of, tangible or human assets relating to our business and counterparties because many of our important business functions and many of the major Japanese companies and financial markets are located in the area. In addition, such an earthquake could cause a longer-term economic slowdown and a downgrade of Japan’s sovereign credit rating due to increases in government spending for disaster recovery measures.
Our risk management policies and procedures may be insufficient to address the consequences of these external events, resulting in our inability to continue to operate a part or the whole of our business. In addition, our redundancy and backup measures may not be sufficient to avoid a material disruption in our operations, and our contingency and business continuity plans may not address all eventualities that may occur in the event of a material disruption caused by a large-scale natural disaster such as the March 2011 Great East Japan Earthquake, which led to tsunamis, soil liquefaction and fires, as well as electricity power supply shortages and electricity power conservation measures resulting from the suspension of the operations of the nuclear power plants.
Failure to safeguard personal and other confidential information may result in liability, reputational damage or financial losses.
As our operations expand in volume, complexity and geographic scope, we are exposed to increased risk of confidential information in our possession being lost, leaked, altered or falsified as a result of human or system error, misconduct, unlawful behavior or scheme, unauthorized access or natural or human-caused disasters. Our information systems and information management policies and procedures may not be sufficient to safeguard confidential information against such risks.
As a financial institution in possession of customer information, we are obligated to treat personal and other confidential information as required by the Act on the Protection of Personal Information, the Act on the Use of Personal Identification Numbers in the Administration of Government Affairs, the Banking Law and the Financial Instruments and Exchange Act of Japan, as well as other similar laws and regulations of other jurisdictions in which we operate. In the event that personal information in our possession about our customers or employees is leaked or improperly accessed and subsequently misused, we may be subject to liability and regulatory action. We may have to provide compensation for economic loss and emotional distress arising out of a failure to protect such information. In addition, such incidents could create a negative public perception of our operations, systems or brand, which may in turn decrease customer and market confidence and materially and adversely affect our business, operating results and financial condition.
Moreover, any loss, leakage, alteration or falsification of confidential information, or any malfunction or failure of our information systems, may result in significant disruptions to our business operations or plans or may require us to incur significant financial, human and other resources to implement corrective measures or enhance our information systems and information management policies and procedures.
25
Table of Contents
Our operations are highly dependent on our information, communications and transaction management systems and are subject to an increasing risk of cyber-attacks and other information security threats and to changes in the business and regulatory environment.
Our information, communications and transaction management systems, which include not only our own proprietary systems but also those third-party systems that are provided for our use or to which our systems are connected, constitute a core infrastructure for our operations. Given our global operations with an extensive network of branches and offices, the proper functioning of our information, communications and transaction management systems is critical to our ability to efficiently and accurately process a large volume of transactions, ensure adequate internal controls, appropriately manage various risks, and otherwise service our clients and customers.
Cyber-attacks, unauthorized access and computer viruses are becoming increasingly more sophisticated and more difficult to predict, detect and prevent. For instance, bank internal financial transaction systems or automatic teller machines may become the target of cyber-attacks for monetary gain, and bank internal information systems may become the target of confidential information theft. In addition, banks’ websites or customer internet banking systems may become the target of cyber-attacks for political and other purposes. These cyber threats, as well as our failure to appropriately and timely anticipate and deal with changes associated with technological advances and new systems and tools introduced in response to industry, regulatory and other developments, could cause disruptions to, and malfunctions of, such systems and result in unintended releases of confidential and proprietary information stored in or transmitted through the systems, interruptions in the operations of our clients, customers and counterparties, and deterioration in our ability to service our clients and customers. In addition, our banking and other transaction management systems may not meet all applicable business and regulatory requirements in an environment where such requirements are becoming increasingly sophisticated and complicated. Furthermore, our system development or improvement projects, many of which are critical to our ability to operate in accordance with market and regulatory standards, may not be completed as planned due to the complexity and other difficulty relating to such projects. These consequences could result in financial losses, including costs and expenses incurred in connection with countermeasures and improvements as well as compensation to affected parties, lead to regulatory actions, diminish our clients’ and customers’ satisfaction with and confidence in us, and harm our reputation in the market, which could in turn adversely affect our business, financial condition and results of operations. Moreover, significant financial, human and other resources may be required to design, implement and enhance measures to manage cyber and information security risks and comply with regulatory requirements.
Risks Related to Owning Our Shares
It may not be possible for investors to effect service of process within the United States upon us or our directors or management members, or to enforce against us or those persons judgments obtained in U.S. courts predicated upon the civil liability provisions of the U.S. federal or state securities laws.
We are a joint stock company incorporated under the laws of Japan. Almost all of our directors or management members reside outside the United States. Many of our assets and the assets of these persons are located in Japan and elsewhere outside the United States. It may not be possible, therefore, for U.S. investors to effect service of process within the United States upon us or these persons or to enforce, against us or these persons, judgments obtained in the U.S. courts predicated upon the civil liability provisions of the U.S. federal or state securities laws.
We believe there is doubt as to the enforceability in Japan, in original actions or in actions brought in Japanese courts to enforce judgments of U.S. courts, of claims predicated solely upon the U.S. federal or state securities laws mainly because the Civil Execution Act of Japan requires Japanese courts to deny requests for the enforcement of judgments of foreign courts if foreign judgments fail to satisfy the requirements prescribed by the Civil Execution Act, including:
| • |
the jurisdiction of the foreign court be recognized under laws, regulations, treaties or conventions; |
26
Table of Contents
| • |
proper service of process be made on relevant defendants, or relevant defendants be given appropriate protection if such service is not received; |
| • |
the judgment and proceedings of the foreign court not be repugnant to public policy as applied in Japan; and |
| • |
there exist reciprocity as to the recognition by a court of the relevant foreign jurisdiction of a final judgment of a Japanese court. |
Judgments obtained in the U.S. courts predicated upon the civil liability provisions of the U.S. federal or state securities laws may not satisfy these requirements.
Risks Related to Owning Our American Depositary Shares
As a holder of American Depositary Shares, you have fewer rights than a shareholder of record in our shareholder register since you must act through the depositary to exercise these rights.
The rights of our shareholders under Japanese law to take actions such as voting, receiving dividends and distributions, bringing derivative actions, examining our accounting books and records and exercising appraisal rights are available only to shareholders of record. Because the depositary, through its custodian, is the record holder of the shares underlying the American Depositary Shares, or ADSs, only the depositary can exercise shareholder rights relating to the deposited shares. ADS holders, in their capacity, will not be able to directly bring a derivative action, examine our accounting books and records and exercise appraisal rights. We have appointed The Bank of New York Mellon as depositary, and we have the authority to replace the depositary.
Pursuant to the deposit agreement among us, the depositary and a holder of ADSs, the depositary will make efforts to exercise voting or any other rights associated with shares underlying ADSs in accordance with the instructions given by ADS holders, and to pay to ADS holders dividends and distributions collected from us. However, the depositary can exercise reasonable discretion in carrying out the instructions or making distributions, and is not liable for failure to do so as long as it has acted in good faith. Therefore, ADS holders may not be able to exercise voting or any other rights in the manner that they had intended, or may lose some or all of the value of the dividends or the distributions. Moreover, the depositary agreement that governs the obligations of the depositary may be amended or terminated by us and the depositary without ADS holders’ consent, notice, or any reason. As a result, ADS holders may be prevented from having the rights in connection with the deposited shares exercised in the way ADS holders had wished or at all.
ADS holders are dependent on the depositary to receive our communications. We send to the depositary all of our communications to ADS holders, including annual reports, notices and voting materials, in Japanese. ADS holders may not receive all of our communications with shareholders of record in our shareholder register in the same manner or on an equal basis. In addition, ADS holders may not be able to exercise their rights as ADS holders due to delays in the depositary transmitting our shareholder communications to ADS holders. For a detailed discussion of the rights of ADS holders and the terms of the deposit agreement, see Exhibit 2(c) to this Annual Report.
27
Table of Contents
| Item 4. |
Information on the Company. |
| A. |
History and Development of the Company |
Mitsubishi UFJ Financial Group, Inc.
MUFG is a bank holding company incorporated as a joint stock company ( kabushiki kaisha ) under the Companies Act of Japan. We are the holding company for MUFG Bank, Ltd. (formerly, The Bank of Tokyo-Mitsubishi UFJ, Ltd.), Mitsubishi UFJ Trust and Banking Corporation, Mitsubishi UFJ Securities Holdings Co., Ltd., Mitsubishi UFJ Morgan Stanley Securities Co., Ltd., Mitsubishi UFJ NICOS Co., Ltd., and other companies engaged in a wide range of financial businesses.
On April 2, 2001, The Bank of Tokyo-Mitsubishi, Ltd., Mitsubishi Trust and Banking Corporation, or Mitsubishi Trust Bank, and Nippon Trust and Banking Co., Ltd. established Mitsubishi Tokyo Financial Group, Inc., or MTFG, to be a holding company for the three entities. Before that, each of the banks had been a publicly traded company. On April 2, 2001, through a stock-for-stock exchange, they became wholly-owned subsidiaries of MTFG, and the former shareholders of the three banks became shareholders of MTFG. Nippon Trust and Banking was later merged into Mitsubishi Trust Bank.
On June 29, 2005, the merger agreement between MTFG and UFJ Holdings, Inc. was approved at the general shareholders meetings of MTFG and UFJ Holdings. As the surviving entity, MTFG was renamed “Mitsubishi UFJ Financial Group, Inc.” The merger of the two bank holding companies was completed on October 1, 2005.
On September 30, 2007, Mitsubishi UFJ Securities Holdings, which was then called “Mitsubishi UFJ Securities Co., Ltd.,” or MUS, became our wholly-owned subsidiary through a share exchange transaction.
On October 13, 2008, we formed a global strategic alliance with Morgan Stanley and, as part of the alliance, made an equity investment in Morgan Stanley in the form of convertible and non-convertible preferred stock, and subsequently appointed a representative to Morgan Stanley’s board of directors.
On October 21, 2008, we completed a tender offer for outstanding shares of ACOM CO., LTD. common stock, raising our ownership in ACOM to approximately 40%.
On November 4, 2008, Bank of Tokyo-Mitsubishi UFJ completed the acquisition of all of the shares of common stock of UnionBanCal Corporation, or UNBC, not previously owned by Bank of Tokyo-Mitsubishi UFJ and, as a result, UNBC became a wholly-owned indirect subsidiary of MUFG.
On May 1, 2010, we and Morgan Stanley integrated our securities and investment banking businesses in Japan into two joint venture securities companies, one of which is Mitsubishi UFJ Morgan Stanley Securities. Mitsubishi UFJ Morgan Stanley Securities was created by spinning off the wholesale and retail securities businesses conducted in Japan from Mitsubishi UFJ Securities Holdings and subsequently assuming certain operations in Japan from a subsidiary of Morgan Stanley.
On June 30, 2011, we converted all of our Morgan Stanley’s convertible preferred stock into Morgan Stanley’s common stock, resulting in our holding approximately 22.4% of the voting rights in Morgan Stanley. Further, we appointed a second representative to Morgan Stanley’s board of directors on July 20, 2011. Following the conversion on June 30, 2011, Morgan Stanley became our equity-method affiliate. As of March 31, 2019, we held approximately 24.0% of the voting rights in Morgan Stanley and had two representatives appointed to Morgan Stanley’s board of directors. We and Morgan Stanley continue to pursue a variety of business opportunities in Japan and abroad in accordance with the global strategic alliance.
On December 18, 2013, we acquired approximately 72.0% of the total outstanding shares of Krungsri through Bank of Tokyo-Mitsubishi UFJ. As a result of the transaction, Krungsri has become a consolidated subsidiary of Bank of Tokyo-Mitsubishi UFJ.
28
Table of Contents
On July 1, 2014, we integrated Bank of Tokyo-Mitsubishi UFJ’s operations in the Americas region with UNBC’s operations, and changed UNBC’s corporate name to “MUFG Americas Holdings Corporation.” On the same day, Union Bank, N.A., which is MUFG Americas Holdings’ principal subsidiary and our primary operating subsidiary in the United States, was also renamed “MUFG Union Bank, N.A..” On July 1, 2016, MUFG Americas Holdings was designated as our U.S. intermediate holding company to comply with the FRB’s enhanced prudential standards.
On January 5, 2015, Bank of Tokyo-Mitsubishi UFJ integrated its Bangkok branch with Krungsri through a contribution in kind of the Bank of Tokyo-Mitsubishi UFJ Bangkok branch business to Krungsri, and Bank of Tokyo-Mitsubishi UFJ received newly issued shares of Krungsri common stock. As a result of this transaction, Bank of Tokyo-Mitsubishi UFJ’s ownership interest in Krungsri increased to 76.9%.
On October 1, 2017, we acquired all of the shares of common stock of Mitsubishi UFJ NICOS which we did not previously own and, as a result, Mitsubishi UFJ NICOS became a wholly-owned subsidiary of MUFG.
On December 29, 2017, Bank of Tokyo-Mitsubishi UFJ initially acquired 19.9% of the shares of common stock of PT Bank Danamon Indonesia, Tbk. On May 1, 2019, MUFG Bank, Ltd. completed a series of transactions to increase its ownership interest in Bank Danamon to 94.1%, as a result of which Bank Danamon became MUFG Bank’s consolidated subsidiary.
On April 1, 2018, we changed Bank of Tokyo-Mitsubishi UFJ’s corporate name to “MUFG Bank, Ltd.”
On April 16, 2018, we transferred Mitsubishi UFJ Trust and Banking’s corporate loan-related businesses to MUFG Bank. The corporate loan-related businesses include the corporate loan, project finance and real estate finance businesses, and any related foreign exchange and remittance services, but do not include pension-related services, the corporate agency business, or the real estate-related businesses.
On October 31, 2018, Mitsubishi UFJ Trust and Banking entered into a Share Sale Deed with Commonwealth Bank of Australia, or CBA, and its wholly-owned subsidiary Colonial First State Group Limited, or CFSGL, to acquire 100% of the shares in each of nine subsidiaries of CFSGL, which collectively represent CBA’s global asset management business known as Colonial First State Global Asset Management, or CFSGAM, from CFSGL for an aggregate purchase price of approximately AU$4.0 billion, or ¥328 billion, subject to certain conditions precedent, including required regulatory approvals.
On March 1, 2019, MUFG Bank agreed with DVB Bank SE in Germany to acquire DVB Bank’s aviation finance business, subject to regulatory approvals other conditions. The transaction is expected to be completed during the second half of the fiscal year ending March 31, 2020.
Our registered address is 7-1, Marunouchi 2-chome, Chiyoda-ku, Tokyo 100-8330, Japan, and our telephone number is 81-3-3240-8111.
For a discussion of recent developments, see “Item 5. Operating and Financial Review and Prospects—Recent Developments.”
MUFG Bank, Ltd.
MUFG Bank is a major commercial banking organization in Japan that provides a broad range of domestic and international banking services from its offices in Japan and around the world. MUFG Bank’s registered head office is located at 7-1, Marunouchi 2-chome, Chiyoda-ku, Tokyo 100-8388, Japan, and its telephone number is 81-3-3240-1111. MUFG Bank is a joint stock company ( kabushiki kaisha ) incorporated in Japan under the Companies Act. The bank changed its name to MUFG Bank, Ltd. from The Bank of Tokyo-Mitsubishi UFJ, Ltd. as of April 1, 2018.
29
Table of Contents
MUFG Bank was formed through the merger, on January 1, 2006, of Bank of Tokyo-Mitsubishi and UFJ Bank Limited after their respective parent companies, MTFG and UFJ Holdings, merged to form MUFG on October 1, 2005.
Bank of Tokyo-Mitsubishi was formed through the merger, on April 1, 1996, of The Mitsubishi Bank, Limited and The Bank of Tokyo, Ltd.
The origins of Mitsubishi Bank can be traced to the Mitsubishi Exchange Office, a money exchange house established in 1880 by Yataro Iwasaki, the founder of the Mitsubishi industrial, commercial and financial group. In 1895, the Mitsubishi Exchange Office was succeeded by the Banking Division of the Mitsubishi Goshi Kaisha, the holding company of the “Mitsubishi group” of companies. Mitsubishi Bank had been a principal bank to many of the Mitsubishi group companies but broadened its relationships to cover a wide range of Japanese industries, small and medium-sized companies and individuals.
Bank of Tokyo was established in 1946 as a successor to The Yokohama Specie Bank, Ltd., a special foreign exchange bank established in 1880. When the government of Japan promulgated the Foreign Exchange Bank Law in 1954, Bank of Tokyo became the only bank licensed under that law. Because of its license, Bank of Tokyo received special consideration from the Ministry of Finance in establishing its offices abroad and in many other aspects relating to foreign exchange and international finance.
UFJ Bank was formed through the merger, on January 15, 2002, of The Sanwa Bank, Limited and The Tokai Bank, Limited.
Sanwa Bank was established in 1933 when the three Osaka-based banks, the Konoike Bank, the Yamaguchi Bank, and the Sanjyushi Bank merged. Sanwa Bank was known as a city bank having the longest history in Japan, since the foundation of Konoike Bank can be traced back to the Konoike Exchange Office established in 1656. The origin of Yamaguchi Bank was also a money exchange house, established in 1863. Sanjyushi Bank was founded by influential fiber wholesalers in 1878. The corporate philosophy of Sanwa Bank had been the creation of premier banking services especially for small and medium-sized companies and individuals.
Tokai Bank was established in 1941 when the three Nagoya-based banks, the Aichi Bank, the Ito Bank, and the Nagoya Bank merged. In 1896, Aichi Bank took over businesses of the Jyuichi Bank established by wholesalers in 1877 and the Hyakusanjyushi Bank established in 1878. Ito Bank and Nagoya Bank were established in 1881 and 1882, respectively. Tokai Bank had expanded the commercial banking business to contribute to economic growth mainly of the Chubu area in Japan, which is known for its manufacturing industries, especially automobiles.
Mitsubishi UFJ Trust and Banking Corporation
Mitsubishi UFJ Trust and Banking is a major trust bank in Japan, providing trust and banking services to meet the financing and investment needs of clients in Japan and the rest of Asia, as well as in the United States and Europe. Mitsubishi UFJ Trust and Banking’s registered head office is located at 4-5, Marunouchi 1-chome, Chiyoda-ku, Tokyo 100-8212, Japan, and its telephone number is 81-3-3212-1211. Mitsubishi UFJ Trust and Banking is a joint stock company (kabushiki kaisha) incorporated in Japan under the Companies Act.
Mitsubishi UFJ Trust and Banking was formed on October 1, 2005 through the merger of Mitsubishi Trust Bank and UFJ Trust Bank Limited. As the surviving entity, Mitsubishi Trust Bank was renamed “Mitsubishi UFJ Trust and Banking Corporation.”
Mitsubishi Trust Bank traces its history to The Mitsubishi Trust Company, Limited, which was founded by the leading members of the Mitsubishi group companies in 1927. The Japanese banking and financial industry was reconstructed after World War II and, in 1948, Mitsubishi Trust Bank was authorized to engage in the commercial banking business, in addition to its trust business, under the new name Asahi Trust & Banking Corporation. In 1952, the bank changed its name again to “The Mitsubishi Trust and Banking Corporation.”
30
Table of Contents
Nippon Trust and Banking and The Tokyo Trust Bank, Ltd., which were previously subsidiaries of Bank of Tokyo-Mitsubishi, was merged into Mitsubishi Trust Bank on October 1, 2001.
UFJ Trust Bank was founded in 1959 as The Toyo Trust & Banking Company, Limited, or Toyo Trust Bank. The Sanwa Trust & Banking Company, Limited, which was a subsidiary of Sanwa Bank, was merged into Toyo Trust Bank on October 1, 1999. The Tokai Trust & Banking Company, Limited, which was a subsidiary of Tokai Bank, was merged into Toyo Trust Bank on July 1, 2001. Toyo Trust Bank was renamed “UFJ Trust Bank Limited” on January 15, 2002.
Mitsubishi UFJ Securities Holdings Co., Ltd.
Mitsubishi UFJ Securities Holdings is a wholly-owned subsidiary of MUFG. Mitsubishi UFJ Securities Holdings functions as an intermediate holding company of MUFG’s global securities and investment banking businesses. Mitsubishi UFJ Securities Holdings’ registered head office is located at 5-2, Marunouchi 2-chome, Chiyoda-ku, Tokyo 100-0005, Japan, and its telephone number is 81-3-6213-2550. Mitsubishi UFJ Securities Holdings is a joint stock company ( kabushiki kaisha ) incorporated in Japan under the Companies Act. Mitsubishi UFJ Securities Holdings has major overseas operating entities in London, New York, Hong Kong and Singapore. In March 2019, Mitsubishi UFJ Securities Holdings established a new indirect subsidiary, MUFG Securities (Europe) N.V., in Amsterdam and opened a new branch in Paris to provide securities services to its clients across Europe.
In April 2010, Mitsubishi UFJ Securities Holdings, which was previously called “Mitsubishi UFJ Securities Co., Ltd.,” or MUS, became an intermediate holding company by spinning off its securities and investment banking business operations to a wholly-owned operating subsidiary established in December 2009, currently Mitsubishi UFJ Morgan Stanley Securities Co., Ltd. Upon the consummation of the corporate spin-off transaction, the intermediate holding company was renamed “Mitsubishi UFJ Securities Holdings Co., Ltd.” and the operating subsidiary was renamed “Mitsubishi UFJ Securities Co., Ltd.” The operating subsidiary was subsequently renamed Mitsubishi UFJ Morgan Stanley Securities in May 2010 upon integration of our securities operations in Japan with those of Morgan Stanley.
MUS was formed through the merger between Mitsubishi Securities Co., Ltd. and UFJ Tsubasa Securities Co., Ltd. on October 1, 2005, with Mitsubishi Securities being the surviving entity. The surviving entity was renamed “Mitsubishi UFJ Securities Co., Ltd.” and, in September 2007, became our wholly-owned subsidiary through a share exchange transaction.
Mitsubishi Securities was formed in September 2002 through the merger of Bank of Tokyo-Mitsubishi’s securities subsidiaries and affiliate, KOKUSAI Securities Co., Ltd., Tokyo-Mitsubishi Securities Co., Ltd. and Tokyo-Mitsubishi Personal Securities Co., Ltd., and Mitsubishi Trust Bank’s securities affiliate, Issei Securities Co., Ltd. In July 2005, MTFG made Mitsubishi Securities a directly-held subsidiary by acquiring all of the shares of Mitsubishi Securities common stock held by Bank of Tokyo-Mitsubishi and Mitsubishi Trust Bank.
Mitsubishi UFJ Morgan Stanley Securities Co., Ltd.
Mitsubishi UFJ Morgan Stanley Securities is our core securities and investment banking subsidiary. Mitsubishi UFJ Morgan Stanley Securities was created in May 2010 as one of the two Japanese joint venture securities companies between Morgan Stanley and us as part of our global strategic alliance. Mitsubishi UFJ Morgan Stanley Securities succeeded to the investment banking operations conducted in Japan by a subsidiary of Morgan Stanley and the wholesale and retail securities businesses conducted in Japan by MUS. MUFG, through Mitsubishi UFJ Securities Holdings, holds 60% voting and economic interests in Mitsubishi UFJ Morgan Stanley Securities. Mitsubishi UFJ Morgan Stanley Securities’ registered head office is located at 5-2 Marunouchi 2-chome, Chiyoda-ku, Tokyo, 100-0005 Japan, and its telephone number is 81-3-6213-8500. Mitsubishi UFJ Morgan Stanley Securities is a joint stock company ( kabushiki kaisha ) incorporated in Japan under the Companies Act.
31
Table of Contents
In April 2019, Mitsubishi UFJ Morgan Stanley Securities and Mitsubishi UFJ Morgan Stanley PB Securities Co., Ltd., a subsidiary of Mitsubishi UFJ Morgan Stanley Securities holding 75% of its shares with the remaining 25% held by MUFG Bank, agreed on a merger whereby Mitsubishi UFJ Morgan Stanley Securities will be the surviving company. In connection with the planned merger, MUFG Bank is expected to transfer its 25% equity interest in Mitsubishi UFJ Morgan Stanley PB Securities to Mitsubishi UFJ Morgan Stanley Securities.
For more information on our joint venture securities companies, see “—B. Business Overview—Global Strategic Alliance with Morgan Stanley.”
Mitsubishi UFJ NICOS Co., Ltd.
Mitsubishi UFJ NICOS is a major credit card company in Japan that issues credit cards, including those issued under the MUFG, NICOS and DC brands, and provides a broad range of credit card and other related services for its card members in Japan. Mitsubishi UFJ NICOS is a consolidated subsidiary of MUFG. Mitsubishi UFJ NICOS’s registered head office is located at 33-5, Hongo 3-chome, Bunkyo-ku, Tokyo 113-8411, Japan, and its telephone number is 81-3-3811-3111. Mitsubishi UFJ NICOS is a joint stock company ( kabushiki kaisha ) incorporated in Japan under the Companies Act.
On August 1, 2008, Mitsubishi UFJ NICOS became a wholly-owned subsidiary of MUFG through a share exchange transaction. On the same day, we entered into a share transfer agreement with Norinchukin Bank under which we sold some of our shares of Mitsubishi UFJ NICOS common stock to Norinchukin Bank. In March 2011, we and Norinchukin Bank made additional equity investments in Mitsubishi UFJ NICOS in proportion to our and Norinchukin Bank’s respective beneficial ownership of approximately 85% and 15%, respectively. On October 1, 2017, MUFG acquired all of Norinchukin Bank’s ownership interest in Mitsubishi UFJ NICOS and, as a result, Mitsubishi UFJ NICOS is currently a wholly-owned subsidiary of MUFG.
Mitsubishi UFJ NICOS was formed through the merger, on April 1, 2007, of UFJ NICOS Co., Ltd. and DC Card Co., Ltd. As the surviving entity, UFJ NICOS Co., Ltd. was renamed “Mitsubishi UFJ NICOS Co., Ltd.”
UFJ NICOS was formed through the merger, on October 1, 2005, of Nippon Shinpan Co., Ltd. and UFJ Card Co., Ltd. Originally founded in 1951 and listed on the Tokyo Stock Exchange in 1961, Nippon Shinpan was a leading company in the consumer credit business in Japan. Nippon Shinpan became a subsidiary of MUFG at the time of the merger with UFJ Card.
Prior to the merger between MTFG and UFJ Holdings in October 2005, DC Card was a subsidiary of MTFG while UFJ Card was a subsidiary of UFJ Holdings.
32
Table of Contents
| B. | Business Overview |
We are one of the world’s largest and most diversified financial groups with total assets of ¥305.23 trillion as of March 31, 2019. The Group is comprised of MUFG Bank, Mitsubishi UFJ Trust and Banking, Mitsubishi UFJ Morgan Stanley Securities (through Mitsubishi UFJ Securities Holdings), Mitsubishi UFJ NICOS and other subsidiaries and affiliates, for which we are the holding company. As a bank holding company, we are regulated under the Banking Law of Japan. Our services include commercial banking, trust banking, securities, credit cards, consumer finance, asset management, leasing and many more fields of financial services. In Japan, we operate through approximately 600 business locations as of March 31, 2019. In addition, as of the same date, the Group had the largest overseas network among Japanese banks, consisting of approximately 1,200 business locations in more than 50 countries.
MUFG’s role as the holding company is to strategically manage and coordinate the activities of our business groups. Group-wide strategies are determined by the holding company and executed by our subsidiaries.
In May 2017, we announced “MUFG Re-Imaging Initiative” which was designed to achieve sustainable growth and enhance our corporate value through various measures, including an integrated group-based management approach and digitization and other technological enhancements. The measures also included realignment of the functions of our subsidiaries in an effort to increase effectiveness in accumulating and applying the expertise within the Group and to enhance efficiency in offering and providing a diverse array of sophisticated financial products and services to customers through collaboration among our subsidiaries. In May 2017, Mitsubishi UFJ Trust and Banking acquired MUFG Bank’s equity interest in Mitsubishi UFJ Investor Services & Banking (Luxembourg) S.A to make the Luxembourg company its wholly owned subsidiary. In April 2018, Mitsubishi UFJ Trust and Banking acquired MUFG Bank’s equity interest and Mitsubishi UFJ Securities Holdings’ equity interest in Mitsubishi UFJ Kokusai Asset Management Co., Ltd. to make the asset management company its wholly owned subsidiary. As a result, Mitsubishi UFJ Trust and Banking operates as the Group’s primary asset management and administration subsidiary. In April 2018, Mitsubishi UFJ Trust and Banking transferred its corporate loan-related businesses to MUFG Bank as part of an initiative to focus the corporate loan-related businesses within the Group at MUFG Bank. In addition, in April 2019, Mitsubishi UFJ Morgan Stanley Securities and Mitsubishi UFJ Morgan Stanley PB Securities Co., Ltd. agreed on a merger, whereby Mitsubishi UFJ Morgan Stanley Securities will be the surviving company, with an aim to strengthen our wealth management business.
In May 2018, we announced our new medium-term business plan for the three-year period ending March 31, 2021, which is discussed below in this Item 4.B. As part of our new medium-term business plan, we have reorganized our business groups in an effort to further integrate the expertise and capabilities of our subsidiaries to respond to the needs of our customers more effectively and efficiently.
Medium-Term Business Plan
Basic Company Policy
Under the current medium-term business plan for the three-year period ending March 31, 2021, we aim to deliver optimal value to all of our stakeholders through simple, speedy and transparent group-integrated operations.
We are seeking to improve our group management approach by shifting from our previous group collaboration and group-driven management approach to a new integrated group-based management approach. Specifically, in an effort to respond to constantly changing customer needs in an appropriate manner, we have reorganized our business groups into new customer-based business groups as discussed below. At the same time, we are seeking to clarify the roles of group companies through functional realignment, product and service quality enhancement as well as solutions capability improvement.
33
Table of Contents
We intend to deploy management resources necessary for achieving these goals with an enhanced focus during the three-year period, particularly during the first half of the period. During this three-year period, we will seek to lay a solid foundation for a new future-oriented business platform. We aim to establish a new business growth model which meets our stakeholders’ expectations by the end of the fiscal year ending March 31, 2024.
Group Business Strategy
Under our current medium-term business plan, we are implementing “Eleven Transformation Initiatives”—specific strategic initiatives designed to enable us to cope with adverse changes in the domestic or overseas business environment and to achieve sustainable growth. Each initiative constitutes a pillar for our strategy involving business operations that (1) have large growth potential, (2) allow us to expand on our group capabilities to the fullest extent, and, (3) are expected to grow as a core business of the group or a foundation for such a business. Our group operating companies, business groups and corporate center functions will collaborate on the implementation of these initiatives with an aim to improve our profitability.
Additionally, we have established a new business group focused on retail and small and medium-sized enterprise banking businesses outside of Japan with the goal to effectively capture the market growth in the United States and Southeast Asia. Under our previous medium-term business plan, we took strategic steps towards building a business platform in South East Asia through the expansion of Krungsri’s business in Thailand and our strategic investments in Security Bank in the Philippines and Bank Danamon in Indonesia. We seek to enhance the enterprise value of each of MUFG Union Bank in the United States and our strategic partner banks, including VietinBank in Vietnam and other banks in South East Asia, as well as our Japanese banking subsidiaries through synergies expected to be achieved by sharing and deploying across these banks their respective strengths and expertise.
Eleven Transformation Initiatives
(1) Digitalization Strategy
Enhanced use of digital technologies is a critical part of our overall transformation strategy, and we intend to develop and implement a wide range of measures to enhance our digital technology use to improve top-line
34
Table of Contents
performance and operational efficiency. We seek to improve our marketing and consulting capabilities through the use of big data, to increase the efficiency of the front-office operations at branches through an overhaul of our online banking system for corporate customers, and to enhance our productivity through migration to digital channels for the housing loan business and expanded use of robotics and artificial intelligence.
(2) Channel Strategy and Business Process Re-engineering (BPR)
We strive to enhance customer user interface, or the usability of our systems for customers, and user experience, or the experience of service recipients, while improving our productivity. We aim to achieve both of these goals through full utilization of digital technologies and business process re-engineering, or an overhaul of business operations through review and analysis of all existing business activities and work processes. We seek to advance our overall user channels combining Internet-based and physical branch channels by improving the usability of our Internet-based channels for transactions so as to increase customer use while establishing specialty bank branches called “MUFG NEXT,” streamlining our branch network and converting branches into integrated branches that offer services of MUFG Bank, Mitsubishi UFJ Trust and Banking, and Mitsubishi UFJ Morgan Stanley Securities at a single location.
(3) Wealth Management Strategy
We are pursuing a business structure focused on fee-based businesses to achieve stable profits by servicing the rising customer needs for asset management and administration services and inheritance services in Japan’s aging society with a declining birthrate through a collaboration between the corporate and retail units and through a group-based integrated approach. We seek to establish a business model where teams of professionals from MUFG Bank, Mitsubishi UFJ Trust and Banking, and Mitsubishi UFJ Morgan Stanley Securities will take the lead in providing various solutions at a one-stop location.
(4) Enhancement of Relationship Manager & Product Office (RM-PO) Model for Corporate Marketing
We seek to provide solutions optimized to meet customer needs by integrating the corporate lending operations of MUFG Bank and Mitsubishi UFJ Trust and Banking through functional realignment where relationship managers are expected to work on understanding the business management issues faced by customers as “RMs from MUFG” and the product office, a unit that is responsible for planning, developing and providing products and services, is expected to deepen its expertise.
(5) Real Estate Value Chain Strategy
We aim to provide solutions to meet various customer needs arising in the real estate value chain, or the business cycle for real estate assets including sale, purchase, development, tenant leasing and asset management, on a continuous basis through a group-based integrated approach. We endeavor to provide additional value through efforts made at our branches to gain knowledge on real estate needs and to use it to obtain brokerage and asset management businesses. In the asset management business, we seek to strengthen our real asset management capabilities.
(6) Asset Management Business
We seek to provide group-wide integrated asset management services to our customers. We aim to develop competitive products, expand our product line-up, and enhance our human resource portfolio necessary for such development and expansion. In addition, in an effort to become a globally recognized asset management institution, we endeavor to strengthen our asset management business by enhancing our human resources, products and solutions.
35
Table of Contents
(7) Institutional Investors Business
We aim to provide a wide range of services to satisfy diverse professional needs for asset management and administration services through a group-based integrated approach, while seeking to expand across the group the customer relationships maintained with institutional investors by each of MUFG Bank, Mitsubishi UFJ Trust and Banking, Mitsubishi UFJ Morgan Stanley Securities, and our business groups.
(8) Global Corporate & Investment Banking (GCIB) Business Model Reform
We seek to achieve sustainable growth for our global corporate and investment banking business, where we provide sophisticated financial services combining corporate banking services, including deposits and loans, and investment banking services, including capital markets financing and mergers and acquisitions. We aim to meet the needs of non-Japanese corporate customers conducting business globally and to improve the overall return on our portfolio by constantly adjusting loan and other assets. In addition, we intend to shift the focus of our management approach from quantity to quality through origination and distribution business operations under the integrated platform between MUFG Bank and Mitsubishi UFJ Morgan Stanley Securities.
(9) Enhancement of Overseas Operations
We plan to shift our management approach from the previous approach based on geographical regions and operating entities to a new approach based on customers and businesses and seek to strengthen our business-driven management approach across the group. In addition, in an effort to establish a business structure that enables us to flexibly adapt to changes in the business environment, we seek to reduce expenses, enhance our overseas branch and office network, and centralize and standardize our procedures and systems.
(10) Human Resources Strategy
We seek to manage our human resources globally in a group-based integrated manner through acceleration of personnel allocation and transfers across the group in line with our business strategy and establishment of a human resources division responsible for overseeing our domestic and overseas human resource management.
(11) Enhancement of Corporate Center Operations
We plan to shift our management of the corporate center operations from the previous approach of integrated management by MUFG and MUFG Bank to a new approach of integrated management by MUFG, MUFG Bank, Mitsubishi UFJ Trust and Banking, and Mitsubishi UFJ Morgan Stanley Securities in an effort to optimize the use of our management resources on a group-based integrated basis and achieve low cost operations.
Business Groups
Under the current medium-term business plan, our business groups are reorganized as follows in an effort to further integrate the expertise and capabilities of our subsidiaries to respond to the needs of our customers more effectively and efficiently.
Retail & Commercial Banking Business Group
The Retail & Commercial Banking Business Group integrates the domestic retail and commercial banking businesses of MUFG Bank, Mitsubishi UFJ Trust and Banking, Mitsubishi UFJ Securities Holdings, Mitsubishi UFJ NICOS and other group companies of MUFG. This business group offers retail and small and medium–sized enterprise customers in Japan an extensive array of commercial banking, trust banking and securities products and services.
36
Table of Contents
Business Environment and Strategy
In the domestic market in which we operate, unfavorable conditions remain such as the negative impact of the Bank of Japan’s negative interest rate policy on the financial market and intensified competition. In addition, demographic changes, including Japan’s aging population with a declining birthrate, and technological developments, including artificial intelligence and digitalization, can change the way banking and other financial services are used in Japan. With a goal of becoming “the top financial group in the retail and commercial banking business segment in Japan, achieving sustainable growth along with customers and society,” we seek to enhance and integrate the capabilities of our group companies to deliver value that exceeds customer expectations and improve customer satisfaction.
In the wealth management business, which is one of our key strategic focus areas, we are implementing measures to improve our group company structure for offering wealth management solutions, including asset management, asset and business succession transfer, and real estate services. For example, with an aim to strengthen our wealth management business, we plan to merge Mitsubishi UFJ Morgan Stanley Securities and Mitsubishi UFJ Morgan Stanley PB Securities.
Responding to the Needs of Retail Customers
For retail customers, we provide a wide range of products and services, such as bank deposits, loans, asset management and administration services, investment products and settlement services. We describe some of our products and services below.
| • |
Housing Loans. MUFG Bank offers housing loans with various loan terms and interest rates. MUFG Bank also offers “Loans with Supplemental Health Insurance for Seven Major Illnesses” through a third party insurance company to help with loan payments in case of unexpected major illnesses such as cancer or heart attacks. As part of our group-wide collaboration initiative, Mitsubishi UFJ Trust and Banking began to offer “Mitsubishi UFJ Net Home Loan” (a housing loan product of MUFG Bank available only online and exclusively to customers of Mitsubishi UFJ Trust and Banking) as an agent of MUFG Bank in April 2018. |
| • |
Consumer Loans. MUFG Bank offers “Card Loans” (consumer loans the proceeds of which are disbursed to approved borrowers with a bank-issued card through an automated machine) and “Purpose-Specific Term Loans,” depending on customers’ needs. |
| • |
Investment Products. In order to promote a shift in customer preference from savings to asset building, we seek to offer products that effectively serve the asset building and asset management needs of customers at various stages of their life. As part of this effort, MUFG Bank started to offer fund wrap products as an agent of Mitsubishi UFJ Trust and Banking in November 2017. In addition, in January 2018, MUFG Bank started to offer investment products that qualify for “Tsumitate NISA” tax exemption on capital gains and dividend income for the investment up to 0.4 million yen per year for up to 20 years under Japanese tax law. The original NISA, or Nippon Individual Savings Account, program was introduced in 2014, providing for tax exemption on capital gains and dividend income for the investment up to 1.2 million yen per year for up to 5 years. We offer investment products that qualify for tax exemption under the original NISA program as well. |
| • |
Products and Services for Payments. Mitsubishi UFJ NICOS offers a variety of credit cards. In addition, debit cards are available to MUFG Bank account holders. |
| • |
Insurance Products. MUFG Bank acts as a sales channel for a variety of insurance products, including annuity insurance, single premium whole life insurance, flat-rate premium whole life insurance, medical insurance, cancer insurance and nursing-care insurance, of insurance companies in Japan. |
| • |
Services Relating to Inheritance, Gift and Real Estate. Mitsubishi UFJ Trust and Banking offers testamentary trust, inheritance planning, inheritance procedure support, and other related services. |
37
Table of Contents
|
MUFG Bank and Mitsubishi UFJ Morgan Stanley Securities also offer inheritance-related products and services, serving as sales agents of Mitsubishi UFJ Trust and Banking. Mitsubishi UFJ Trust and Banking and Mitsubishi UFJ Real Estate Services offer real estate brokerage services for both investment and business properties and residential properties. |
We provide those services through an extensive network of branches in Japan, mostly in the greater Tokyo, Nagoya and Osaka areas. MUFG Bank and Mitsubishi UFJ Trust and Banking had a total of 733 branches in Japan as of March 31, 2019. MUFG Bank and Mitsubishi UFJ Trust and Banking also have a nationwide ATM network consisting of MUFG Bank’s and Mitsubishi UFJ Trust and Banking’s own ATMs located at their branches and third-party ATMs located at convenience stores and other locations.
We also offer direct banking channels. MUFG Bank and Mitsubishi UFJ Trust and Banking provide internet banking services which enable customers to perform a range of banking activities, such as checking account balances, making time deposits, transferring money and purchasing invest products, through the banks’ respective websites using personal computers and mobile devices. In addition, Jibun Bank, a direct bank which was founded by MUFG Bank in collaboration with KDDI Corporation in June 2008, offers bank deposits, housing loans, settlement services and other products and services through the internet and phone.
Responding to the Needs of Small and Medium-Sized Enterprises
For small and medium-sized enterprises, we provide various financial solutions, such as bank deposits, loans, and fund management, remittance and foreign exchange services. We also help our customers develop business strategies, such as overseas expansions, inheritance-related business transfers and stock listings.
In addition, we provide asset and business succession solutions to small and medium-sized enterprise owners. Based on our view that smooth succession of the businesses of small and medium-sized enterprises owned by aging owners is critical to the sustainability and development of Japanese industry, we offer solutions for successions of businesses to unrelated persons, including through mergers and acquisitions and initial public offerings, and for successions of businesses to related persons. We also offer solutions designed to assist business owners with successions of assets using testamentary trusts, real estate transactions and other means. Through further integration of the retail and commercial banking capabilities of MUFG Bank, Mitsubishi UFJ Trust and Banking, MUFG Securities Holdings and other group companies, we strive to provide seamless solutions on a group-wide basis.
Japanese Corporate & Investment Banking Business Group
The Corporate Banking Business Group covers the large Japanese corporate businesses of MUFG Bank, Mitsubishi UFJ Trust and Banking and Mitsubishi UFJ Securities Holdings, including the transaction banking, investment banking, trust banking and securities businesses. We offer large Japanese corporations advanced financial solutions designed to respond to their diversified and globalized needs and to contribute to their business and financial strategies. We provide those solutions through our global network of MUFG Group companies.
With our goal to “Be the First Call Business Partner for Large Japanese Corporate Clients,” we strive to strengthen our solutions capabilities through an approach designed to provide effective solutions using our specialized industry-specific expertise and knowledge and through further integration and more effective collaboration among the MUFG Group companies on a global basis.
Transaction Banking
We provide cash management, payment, trade finance and other commercial banking products and services for corporate business transactions. Through these products and services, we seek to provide sophisticated financial solutions that enable efficient execution of transactions to meet the strategic needs of our customers.
38
Table of Contents
Investment Banking
We provide mergers and acquisitions advisory, equity and bond underwriting, and other investment banking services to our Japanese corporate customers. A large part of our investment banking business in Japan is conducted by Mitsubishi UFG Morgan Stanley Securities, which was formed in May 2010 through the integration of the domestic wholesale and retail securities businesses previously conducted by Mitsubishi UFJ Securities and the investment banking business previously conducted by Morgan Stanley Japan. See “—Global Strategic Alliance with Morgan Stanley” below.
Trust Banking
We provide real estate brokerage, registrar and transfer agency, and other trust banking services to our Japanese corporate customers. Our solutions also include securitization of real estate, receivables and other assets. Mitsubishi UFJ Trust and Banking’s experience and know-how in real estate brokerage and appraisal services, corporate real estate strategy consulting, shareholder registry management services, shareholder and investor relations consulting, and consulting services relating to executive stock compensation programs using trust schemes enable us to offer solutions tailored to the financial strategies of each customer.
Asset Management & Investor Services Business Group
The Asset Management & Investor Services Business Group covers the asset management and asset administration businesses of Mitsubishi UFJ Trust and Banking and MUFG Bank. By integrating the trust banking expertise of Mitsubishi UFJ Trust and Banking and the global strengths of MUFG Bank. the business group offers a full range of asset management and administration services for corporations and pension funds, including pension fund management and administration, advice on pension structures, and payments to beneficiaries, and also offers investment trusts for retail customers.
We aim to expand our asset management and asset administration services business by enhancing the quality of our products and services, effectively utilizing the broad customer base of the MUFG Group, and improving our operational efficiency through IT technology.
Asset Management
Mitsubishi UFJ Trust and Banking, Mitsubishi UFJ Kokusai Asset Management, and MU Investments Co., Ltd provide institutional investors with a wide range of investment options such as equities, bonds and alternative products. In addition, Mitsubishi UFJ Trust and Banking and Mitsubishi UFJ Kokusai Asset Management provide retail investors with investment trust products through our group companies and business partners outside of the MUFG Group, such as securities companies and regional banks.
We are adopting an inorganic expansion strategy especially for our non-Japanese investment capability in an effort to be a global top-level asset manager with competitive products and solutions capabilities. Our existing strategic alliances through minority investments, including our alliances with AMP Capital Holdings Limited in Australia and SWS MU FUND MANAGEMENT in China, have contributed to our asset management business expansion.
In October 2018, Mitsubishi UFJ Trust and Banking entered into a Share Sale Deed with Commonwealth Bank of Australia, or CBA, and its wholly-owned subsidiary Colonial First State Group Limited, or CFSGL, to acquire 100% of the shares in each of nine subsidiaries of CFSGL, which collectively represent CBA’s global asset management business known as Colonial First State Global Asset Management, or CFSGAM, from CFSGL, subject to certain conditions precedent, including required regulatory approvals. This transaction is our first majority investment in an asset manager and is expected to close in mid-2019. CFSGAM is a global asset
39
Table of Contents
management firm with AU$212 billion, or ¥17.4 trillion in assets under management, or AuM, and is currently the third largest asset management firm by AuM in Asian markets excluding Japan. CFSGAM offers products across equities, alternatives and fixed income and has specialist capabilities in Asian and emerging markets as well as in the infrastructure field.
Asset Administration
Under the brand of “MUFG Investor Services,” Mitsubishi UFJ Trust and Banking, MUFG Bank, Mitsubishi UFJ Investor Services & Banking (Luxembourg), MUFG Investor Services Holdings Limited, MUFG Capital Analytics and MUFG Investor Services(US),LLC offer a full suite of global asset administration services, including fund administration, custody, securities lending, financing and foreign exchange services as a one-stop shop.
Global Corporate & Investment Banking Business Group
The Global Corporate & Investment Banking Business Group covers the corporate, investment and transaction banking businesses of MUFG Bank and Mitsubishi UFJ Securities Holdings. Through a global network of offices and branches, we provide non-Japanese large corporate and financial institution customers with a comprehensive set of solutions that meet their increasingly diverse and sophisticated financing needs.
Through the new integrated operations management structure between the Global Corporate & Investment Banking Business Group and the Global Markets Business Group, we aim to offer financing and investment opportunities based on our understanding of institutional investor needs.
The expansion of the global corporate and investment banking business has been an important pillar of the MUFG Group’s growth strategy. Aiming to further enhance our presence in the global financial market, we have shifted our strategic approach from one where each of our group companies individually promoted its global business to one where our group companies collaborate through integration of their capabilities. The new approach is designed to enable us to exercise our comprehensive expertise to provide our customers with value-added solutions and services more effectively.
In March 2019, MUFG Bank agreed to purchase from DVB Bank SE in Germany its aviation finance client lending portfolio and the related operating infrastructure. In connection with this agreement, BOT Lease Co., Ltd., a consolidated subsidiary of MUFG Bank, agreed to purchase from DVB Bank its aviation investment management and asset management business. The closing of these transactions are expected to occur during the second half of the fiscal year ending March 31, 2020, subject to regulatory approvals and other conditions. Aviation finance is a key growth pillar for us and, through the acquisition, we aim to enhance our Global Corporate & Investment Banking Business platform in terms of higher returns, portfolio diversification and solution offering to our clients.
Corporate Banking
Through our global network of offices and branches, we provide a full range of corporate banking solutions, such as project finance, export credit agency finance, and financing through asset-backed commercial paper. Our primary customers include large corporations, financial institutions, sovereign and multinational organizations, and institutional investors that are headquartered outside of Japan.
Investment Banking
We provide investment banking services such as debt and equity issuance and M&A-related services, to help our customers develop their financial strategies and realize their business goals. In order to meet customers’ various financing needs, we have established a customer-oriented coverage model through which our product
40
Table of Contents
experts coordinate with one another to offer innovative financing services globally. We have further integrated the management of the operations of our commercial banking and securities subsidiaries to enhance collaboration. We are one of the world’s top providers of project finance, one of the core businesses of the Global Corporate & Investment Banking Business Group. We provide sophisticated professional services in arranging limited-recourse finance and offering financial advice in various sectors, including natural resources, power, and infrastructure, backed by our experience, expertise, knowledge, and global network.
Transaction Banking
We provide commercial banking products and services for large corporations and financial institutions in managing and processing domestic and cross-border payments, mitigating risks in international trade, and providing working capital optimization. We have established a Transaction Banking Unit, which oversees the entire transaction banking operations globally, in order to enhance governance, management and quality of services in these operations. The Transaction Banking Unit provides customers with support for their domestic, regional and global trade finance and cash management programs through our extensive global network.
Global Commercial Banking Business Group
The Global Commercial Banking Business Group provides a comprehensive array of financial products and services such as loans, deposits, fund transfers, investments and asset management services for local retail, small and medium-sized enterprise, and corporate customers across the Asia-Pacific region through our major local commercial banking subsidiaries and affiliates outside of Japan referred to as “Partner Banks.” Our Partner Banks include MUFG Union Bank in the United States, Krungsri in Thailand, Bank Danamon in Indonesia, VietinBank in Vietnam and Security Bank in the Philippines.
The network among the Partner Banks covers a vast market, consisting of five countries with population totaling approximately 840 million. The market is expected to expand further as the GDP growth rates are relatively high in these countries and financial needs are expected to increase as average income rise in the ASEAN countries.
We believe that our network, which combines the global reach of the MUFG Group companies with strong regional presence of the Partner Banks each carrying an established brand, provides us with unique competitive advantages. Through sharing and integration of the expertise and capabilities of the Partner Banks, we seek to achieve synergy effects and capture the business opportunities arising from the economic growth of the region.
MUFG Union Bank, N.A.
MUFG Union Bank is the primary subsidiary of MUFG Americas Holdings, which is our wholly owned subsidiary and which is a bank holding company in the United States. MUFG Union Bank is the primary operating entity of MUFG Bank in the United States. MUFG Union Bank provides a comprehensive range of banking, consumer finance, investment, asset management, and other financial products and services to individual consumers, small and medium-sized enterprises, and large corporations primarily in California, Oregon, Washington, and Texas as well as nationally and internationally through 370 branches (consisting of 343 retail branches and five commercial branches, as well as 22 financial centers of PurePoint, an online banking division of MUFG Union Bank).
In July 2014, MUFG Bank’s operations in the Americas region were integrated with MUFG Americas Holdings’ operations. As a result, MUFG Americas Holdings oversees MUFG Bank’s operations in the Americas region.
In July 2016, MUFG Americas Holdings was designated as MUFG’s U.S. intermediate holding company, or IHC, to comply with the FRB’s enhanced prudential standards. As of that date, MUFG Bank, Mitsubishi UFJ
41
Table of Contents
Trust and Banking and Mitsubishi UFJ Securities Holdings transferred to MUFG Americas Holdings their ownership interests in their U.S. subsidiaries and affiliates, namely, BTMU Capital Corporation, BTMU Securities, Inc., MUFG Americas Capital Company, Morgan Stanley MUFG Loan Partners, LLC, MUFG Fund Services (USA) LLC, and MUFG Securities Americas Inc.
In July 2017, MUFG Bank and Mitsubishi UFJ Trust and Banking transferred to MUFG Americas Holdings their ownership interests in other U.S. subsidiaries and affiliates, namely, BTMU Leasing & Finance, Inc., BTMU LF Capital LLC, MUFG Capital Analytics, LLC, and MUFG Investors Services(US), LLC.
See “Item 3.D. Key Information—Risk Factors—Risks Related to Our Business—Any adverse changes in the business of MUFG Americas Holdings Corporation, an indirect wholly-owned subsidiary in the United States, could significantly affect our results of operations.”
Bank of Ayudhya Public Company Limited (Krungsri)
Krungsri is a strategic subsidiary of MUFG Bank in Thailand. Krungsri provides a comprehensive range of banking, consumer finance, investment, asset management, and other financial products and services to retail consumers, small and medium-sized enterprises, and large corporations mainly in Thailand through 701 branches (consisting 660 banking branches, 39 automobile finance business branches and two overseas branches) and other service outlets nationwide. In addition, Krungsri’s consolidated subsidiaries include the largest credit card issuer in Thailand with a total of 9.3 million credit card, sales finance and personal loan accounts in its portfolio, a major auto finance provider, a fast growing asset management company, and a leading microfinance service provider in Thailand.
MUFG owns a 76.88% ownership interest in Krungsri through MUFG Bank as of March 31, 2019. By combining Krungsri’s local franchise with competitive presence in the retail and small and medium-sized enterprise banking markets in Thailand with MUFG Bank’s global financial expertise, we seek to offer a wider range of high-value financial products and services to a more diverse and larger customer base.
In March 2017, Krungsri established a subsidiary, Krungsri Finnovate Company Limited, with a key mission to support and promote FinTech startups in Thailand and Southeast Asian countries in the forms of accelerator and academic collaboration, startup project management and corporate venture capital.
In September 2017, Krungsri was designated as a Domestic Systemically Important Bank by the Bank of Thailand based on the central bank’s assessment of Krungsri based on its asset size and its contribution to the country’s economy and financial system.
See “Item 3.D. Key Information—Risk Factors—Risks Related to Our Business—Any adverse changes in the business of Bank of Ayudhya, an indirect subsidiary in Thailand, or Bank Danamon, an indirect subsidiary in Indonesia, could significantly affect our results of operations.”
PT Bank Danamon Indonesia, Tbk. (“Bank Danamon”)
Bank Danamon is a strategic subsidiary of MUFG Bank in Indonesia. Bank Danamon provides a comprehensive range of banking and other financial products and services to retail consumers, small and medium-sized enterprises, and large corporations in Indonesia. It operates an extensive distribution network spread out from Aceh to Papua, with more than 1,100 branches and service outlets. In addition, Bank Danamon provides financing for automotive and consumer goods through PT Adira Dinamika Multi Finance Tbk, a subsidiary of Bank Danamon, as well as general insurance products through PT Asuransi Adira Dinamika, another subsidiary of Bank Danamon.
In December 2017, MUFG Bank acquired 19.9% of the outstanding shares of Bank Danamon. Subsequently, MUFG Bank increased its shareholding in Bank Danamon to 40.0% in August 2018 and further to 94.0% in April 2019. In addition, in April 2019, MUFG Bank acquired shares of common stock of PT Bank
42
Table of Contents
Nusantara Parahyangan Tbk, or Bank BNP, an Indonesia bank, increasing its shareholding in the bank from 7.9% to 99.9%. In May 2019, Bank BNP was merged into Bank Danamon. As a result of MUFG Bank’s acquisition of additional shares in Bank Danamon in April 2019, Bank Danamon became our consolidated subsidiary, effective as of April 29, 2019.
Our investment in Bank Danamon represents another milestone for our growth strategy in Southeast Asia with the goal of realizing our unique and unparalleled business model based on the established local networks of our Partner Banks, and MUFG’s global network to provide holistic financial services to a wider range of customers. Through this investment, we aim to diversify and expand our local retail and small and medium-sized enterprise business portfolio by seizing opportunities expected to arise from Indonesia’s current economic growth and long-term economic growth prospects.
See “Item 3.D. Key Information—Risk Factors—Risks Related to Our Business— Any adverse changes in the business of Bank of Ayudhya, an indirect subsidiary in Thailand, or Bank Danamon, an indirect subsidiary in Indonesia, could significantly affect our results of operations.” and “Item 5. Operating and Financial Review and Prospects—Recent Developments.”
Other Activities in Southeast Asia
We have been expanding our operations in Southeast Asia with an effort to further develop our businesses abroad. In addition to MUFG Union Bank, Krungsri and Bank Danamon, we have strategic business and capital alliances with other banks in Southeast Asia, including VietinBank in Vietnam and Security Bank in the Philippines, as our Partner Banks.
VietinBank provides a wide range of financial services to consumers, small businesses, middle-market and large companies through its branch network predominantly in Vietnam. We own a 19.7% equity interest in VietinBank.
Security Bank provides a wide range of financial services to consumers, small businesses, middle-market and large companies through its branch network in the Philippines. We own a 20% equity interest in Security Bank.
See “Item 5. Operating and Financial Review and Prospects—Recent Developments” and “Item 3.D. Key Information—Risk Factors—Risks Related to Our Business—Our strategy to expand the range of our financial products and services and the geographic scope of our business globally may fail if we are unable to anticipate or manage new or expanded risks that entail such expansion.”
Global Markets Business Group
The Global Markets Business Group covers the customer business and the treasury operations of MUFG Bank, Mitsubishi UFJ Trust and Banking and Mitsubishi UFJ Securities Holdings. The customer business includes sales and trading in fixed income instruments, currencies and equities as well as other investment products, and origination and distribution of financial products. The treasury operations include asset and liability management as well as global investments for the MUFG Group.
Customer Business
| • |
Sales and Trading in Fixed Income Instruments, Currencies and Equities. We provide financing, hedging, and investment solutions to our retail, corporate, institutional, and governmental customers through sales and trading in financial market products such as fixed income instruments, currencies, and equities. Our innovative financial products and services are designed to respond to increasingly sophisticated requirements of our diverse customers and are provided through our global network of offices and branches. |
43
Table of Contents
| • |
Investment Products for Non-Institutional Customers in Japan. We provide investment products such as mutual funds, and structured bonds, notes and deposits to non-institutional customers in Japan. We offer solutions using these investment products to help customers better manage their assets and liabilities. This business is conducted through the new integrated operations management structure among the Global Markets Business Group, the Asset Management & Investor Service Business Group, the Retail & Commercial Banking Business Group, and the Japanese Corporate and Investment Banking Business Group. To enhance our products and sales support capability, in the fiscal year ended March 31, 2019, the Global Markets Business Group started to collaborate with the Retail & Commercial Banking Business Group in the retail and small and medium-sized enterprise client businesses. |
| • |
Origination and Distribution. We provide financing solutions to institutional customers through origination and distribution of financial products such as syndicated loans and securities issuances. This business is conducted through the new integrated operations management structure between the Global Markets Business Group and the Global Corporate and Investment Banking Business Group. |
Treasury Operations
| • |
Asset and Liability Management. Through our treasury operations, we seek to manage interest rate and liquidity risks residing in our balance sheets through, among other things, transactions designed to manage the profit and loss impact attributable to market movements based on our balance sheet analyses and forecasts. Such transactions include investments in high quality liquid securities such as Japanese government bonds and U.S. Treasury bonds and trading in other financial products such as interest rate swaps and cross currency swaps. |
| • |
Global Investment. Through our treasury operations, we also seek to enhance our profitability by diversifying our portfolio and strategically investing in financial products including corporate bonds and funds. |
Strategy under the Current Medium-Term Business Plan
Under the current medium-term business plan, for the three-year period ending March 31, 2021, the Global Markets Business Group intends to undertake the following four initiatives designed to promote the MUFG Group’s structural reforms.
| • |
The Global Markets Business Group plans to improve its business portfolio by adjusting its focus to growth areas and new areas, including the sales and trading business targeting institutional customers as well as the origination and distribution business under the new integrated operations management structure with the Global Corporate and Investment Banking Business Group. In addition, the Global Markets Business Group plans to build a sustainable growth model for the investment products business targeting non-institutional investors in Japan under the new integrated operations management structure with the Asset Management & Investor Service Business Group, the Retail & Commercial Banking Business Group and the Japanese Corporate and Investment Banking Business Group. |
| • |
The Global Markets Business Group aims to reform the sales and trading business targeting corporate customers through enhancement of our financial solutions capabilities by more effectively coordinating capital markets transactions and global markets transactions and through reduction in transactions dependent on our balance sheets. |
| • |
The Global Markets Business Group strives to enhance the framework for collaboration and cooperation between MUFG’s treasury operations unit and its counterparts at MUFG’s major subsidiaries to support the MUFG Group’s sustainable growth by integrating the expertise in market risk management on a group-wide basis and applying a unified approach to liquidity risk management. |
44
Table of Contents
| • |
The Global Markets Business Group strives to establish business frameworks and infrastructure designed to optimize and enhance integration and flexibility of the booking functions for global markets transactions among MUFG’s major subsidiaries and to accelerate digitalization. |
Global Strategic Alliance with Morgan Stanley
As of March 31, 2019, we held approximately 405 million shares of Morgan Stanley’s common stock representing approximately 24.0 % of the voting rights in Morgan Stanley and Series C Preferred Stock with a face value of approximately $521.4 million and 10% dividend. As of the same date, we had two representatives appointed to Morgan Stanley’s board of directors. We adopted the equity method of accounting for our investment in Morgan Stanley beginning with the fiscal year ended March 31, 2012.
In conjunction with Morgan Stanley, we formed two securities joint venture companies in May 2010 to integrate our respective Japanese securities companies. We converted the wholesale and retail securities businesses conducted in Japan by Mitsubishi UFJ Securities into Mitsubishi UFJ Morgan Stanley Securities. Morgan Stanley contributed the investment banking operations conducted in Japan by its former wholly-owned subsidiary, Morgan Stanley Japan, to Mitsubishi UFJ Morgan Stanley Securities, and converted the sales and trading and capital markets businesses conducted in Japan by Morgan Stanley Japan into an entity called Morgan Stanley MUFG Securities, Co., Ltd. We hold a 60% economic interest in Mitsubishi UFJ Morgan Stanley Securities and Morgan Stanley MUFG Securities, and Morgan Stanley holds a 40% economic interest in Mitsubishi UFJ Morgan Stanley Securities and Morgan Stanley MUFG Securities. We hold a 60% voting interest and Morgan Stanley holds a 40% voting interest in Mitsubishi UFJ Morgan Stanley Securities, and we hold a 49% voting interest and Morgan Stanley holds a 51% voting interest in Morgan Stanley MUFG Securities. Morgan Stanley’s and our economic and voting interests in the securities joint venture companies are held through intermediate holding companies. We have retained control of Mitsubishi UFJ Morgan Stanley Securities and we account for our interest in Morgan Stanley MUFG Securities under the equity method due to our significant influence over Morgan Stanley MUFG Securities. The board of directors of Mitsubishi UFJ Morgan Stanley Securities has fifteen members, nine of whom are designated by us and six of whom are designated by Morgan Stanley. The board of directors of Morgan Stanley MUFG Securities has ten members, six of whom are designated by Morgan Stanley and four of whom are designated by us. The CEO of Mitsubishi UFJ Morgan Stanley Securities is designated by us and the CEO of Morgan Stanley MUFG Securities is designated by Morgan Stanley.
We have also expanded the scope of our global strategic alliance with Morgan Stanley into other geographies and businesses, including (1) a loan marketing joint venture that provides clients in the United States with access to the world-class lending and capital markets services from both companies, (2) business referral arrangements in Asia, Europe, the Middle East and Africa, covering capital markets, loans, fixed income sales and other businesses, (3) global commodities referral arrangements whereby MUFG Bank and its affiliates refer clients in need of commodities-related hedging solutions to certain affiliates of Morgan Stanley, and (4) an employee secondment program to share best practices and expertise in a wide range of business areas.
Mitsubishi UFJ Morgan Stanley PB Securities Co., Ltd., in which Mitsubishi UFJ Morgan Stanley Securities holds 75%, and MUFG Bank holds the remaining 25%, of the voting rights, has an agreement with Morgan Stanley. Mitsubishi UFJ Morgan Stanley PB Securities leverages MUFG’s broad customer base, utilizes Morgan Stanley’s global and high quality insight, and furthers its collaborations with other group companies by strengthening its coordination with Mitsubishi UFJ Morgan Stanley Securities. It aims for further development of its wealth management business, which is one of the largest in Japan. In April 2019, Mitsubishi UFJ Morgan Stanley Securities and Mitsubishi UFJ Morgan Stanley PB Securities agreed on a merger, whereby Mitsubishi UFJ Morgan Stanley Securities will be the surviving company.
See “Item 3.D. Key Information—Risk Factors—Risks Related to Our Business—If our strategic alliance with Morgan Stanley fails, we could suffer financial or reputational loss.”
45
Table of Contents
Competition
We face strong competition in all of our principal areas of operation. The structural reforms in financial industry regulations and recent developments in financial markets have resulted in some significant changes in the Japanese financial system and prompted banks to merge or reorganize their operations. In addition, development of new technologies such as artificial intelligence and blockchain has also allowed non-financial institutions to enter the financial services industry with alternative services, thus changing the nature of competition from other financial institutions as well as from other types of businesses. See “Item 3.D. Key Information—Risk Factors—Risks Related to Our Business—Our business may be adversely affected by competitive pressures, which have partly increased due to regulatory changes and recent market changes in the financial industry domestically and globally.”
Japan
Since their formation in 2000 and 2001, the so-called Japanese “mega bank” groups, including us, the Mizuho Financial Group and the Sumitomo Mitsui Financial Group, have continued to expand their businesses and take measures designed to enhance their financial group capabilities. For example, in July 2013, Mizuho Bank, Ltd. and Mizuho Corporate Bank, Ltd. merged, and the merged entity presently operates under the corporate name of “Mizuho Bank, Ltd.” In November 2015, SMBC Trust Bank, Ltd., a subsidiary of Sumitomo Mitsui Financial Group, acquired the retail banking business of Citibank Japan, Ltd.
Competition among the mega bank groups are expected to continue in various financial sectors as they have recently announced plans to expand, or have expanded, their respective businesses. For example, in the securities sector, in May 2010, in conjunction with Morgan Stanley, we created two securities joint venture companies in Japan, Mitsubishi UFJ Morgan Stanley Securities and Morgan Stanley MUFG Securities, by integrating the operations of Mitsubishi UFJ Securities and Morgan Stanley Japan. In January 2013, Mizuho Securities and Mizuho Investors Securities Co., Ltd. merged. For a discussion of the two securities joint venture companies created by us and Morgan Stanley, see “—B. Business Overview—Global Strategic Alliance with Morgan Stanley.”
In the retail business sector, customers often have needs for a broad range of financial products and services, such as investment trusts and insurance products. Recently, competition has increased due to the development of new products and distribution channels. For example, Japanese banks compete with one another by developing innovative proprietary computer technologies that allow them to deliver basic banking services in a more efficient manner and to create sophisticated new products in response to customer demand. Competition has also increased since the introduction in January 2014 of the Japanese individual savings account system, generally referred to as the NISA program, which currently offers tax exemptions on capital gains and dividend income for investments up to ¥1.2 million a year for a maximum of five years. In addition, in December 2015, Sumitomo Mitsui Trust Bank, Ltd. acquired Citi Cards Japan, Inc., which previously operated the credit card business of Citigroup Inc. in Japan.
In the private banking sector, competition among the mega bank groups has intensified as a result of recent corporate actions designed to strengthen their operations. We made Mitsubishi UFJ Merrill Lynch PB Securities Co., Ltd. a wholly owned subsidiary in December 2012 to enhance our private banking services for high net-worth customers, and changed its name to Mitsubishi UFJ Morgan Stanley PB Securities, Ltd. in March 2014. In April 2019, we announced a plan to merge Mitsubishi UFJ Morgan Stanley PB Securities into Mitsubishi UFJ Morgan Stanley Securities. Sumitomo Mitsui Banking Corporation acquired the former Société Générale Private Banking Japan, Ltd. from Société Générale S.A. and changed its name to SMBC Trust Bank, Ltd. in October 2013.
In the consumer finance sector, recent regulatory reforms and legal developments have negatively impacted the business environment, resulting in failures of several consumer finance companies and intensified
46
Table of Contents
competition among consumer finance companies that have remained in business, particularly among those affiliated with the mega banks. In April 2012, Promise Co., Ltd. became a wholly owned subsidiary of the Sumitomo Mitsui Financial Group, and changed its name as SMBC Consumer Finance Co., Ltd. in July 2012. See “Item 3.D. Key Information—Risk Factors—Risks Related to Our Business—Because of our loans to consumers and our shareholdings in companies engaged in consumer lending, changes in the business or regulatory environment for consumer finance companies in Japan may further adversely affect our financial results.”
The trust assets business is an area that is becoming increasingly competitive because of regulatory changes in the industry that have expanded the products and services that can be offered since the mid-2000s. In addition, there is growing corporate demand for changes in the trust regulatory environment, such as reforms of the pension system and related accounting regulations under Japanese GAAP. Competition may increase in the future as changes are made to respond to such corporate demand and regulatory barriers to entry are lowered. Competition is also expected to intensify as a result of recent integrations and entrants in the industry. For example, in August 2015, JP Asset Management Co., Ltd. was established as a joint venture with the Japan Post Group, Sumitomo Mitsui Trust Bank and Nomura Holdings, Inc. holding 50%, 30% and 20% equity interests, respectively, in the joint venture. In October 2016, the Mizuho Financial Group integrated Mizuho Asset Management Co., Ltd., Shinko Asset Management Co., Ltd. and the asset management business of Mizuho Trust & Banking Co., Ltd., all of which were asset management subsidiaries of the Mizuho Financial Group in Japan, and DIAM Co., Ltd., which was an asset management joint venture between the Mizuho Financial Group and Dai-ichi Life Insurance Company in Japan. In July 2016, the Sumitomo Mitsui Financial Group made Sumitomo Mitsui Asset Management Co., Ltd. a consolidated subsidiary through the acquisition of additional equity interest in the asset management company. In March 2017, the Mizuho Financial Group announced plans to integrate Trust and Custody Services Bank, Ltd., its trust bank subsidiary specialized in the asset administration business, with Japan Trustee Services Bank, Ltd., which is a trust bank joint venture between Sumitomo Mitsui Trust Holdings and Resona Bank, Ltd. specialized in the asset administration business. In May 2018, the Sumitomo Mitsui Financial Group announced a planned merger between Sumitomo Mitsui Asset Management and Daiwa SB Investments Ltd.
In recent years, the Japanese government has identified several governmental financial institutions as candidates to privatize. Under the current postal privatization law, Japan Post Bank and Japan Post Insurance may enter into new business areas upon obtaining government approvals, and if Japan Post Holdings’ equity holdings decrease to 50% or below, the two companies will be allowed to enter into new business areas upon submission of a notice to the government. In such case, the Japan Post Group companies may seek to enter into new financial businesses and increasingly compete with us. Japan Post Holdings currently holds approximately 89% of the shares of Japan Post Bank. Japan Post Holdings’ equity holding in Japan Post Insurance decreased from around 89% to around 64% through a public offering of shares in April 2019. In addition, the Japanese government is expected to decrease its shareholding in Japan Post Holdings to just above one-third, which is the minimum shareholding required for the Japanese government under the law, in September 2019. In addition, Japan Post Bank is one of the world’s largest holders of deposits, which provide a cost-effective source of funding for the bank. In April 2019, the cap imposed by law on the amount of deposits that Japan Post Bank may accept from each customer was raised from an aggregate of ¥13 million to ¥13 million in ordinary deposits plus ¥13 million in time deposits. See “—B. Business Overview—The Japanese Financial System—Government Financial Institutions.”
The mega bank groups face significant competition with other financial groups as well as companies that have traditionally not been engaged in banking services. For example, the Nomura Group has been a major player in the securities market in Japan. In addition, various Japanese non-bank financial institutions and non-financial companies have entered into the Japanese banking sector. For example, Orix Corporation, a non-bank financial institution, as well as the Seven & i Holdings Co., Ltd., Sony Corporation and Aeon Co., Ltd., which were non-financial companies, offer various banking services, often through non-traditional distribution channels. Further, development of new technologies such as artificial intelligence, or AI, and blockchain has also
47
Table of Contents
allowed non-financial institutions to enter financial services industry with alternative services such as electronic settlement services, and these new entrants could become substantial competition to us.
Foreign
In the United States, we face substantial competition in all aspects of our business. We face competition from other large U.S. and non-U.S. money-center banks, as well as from similar institutions that provide financial services. Through MUFG Union Bank, we currently compete principally with U.S. and non-U.S. money-center and regional banks, thrift institutions, asset management companies, investment advisory companies, consumer finance companies, credit unions and other financial institutions.
In other international markets, we face competition from commercial banks and similar financial institutions, particularly major international banks and the leading domestic banks in the local financial markets in which we conduct business. For example, Japanese mega banks, including us, and other major international banks have been expanding their operations in the Asian market, where leading local banks also have been growing and increasing their presence recently. Furthermore, we are aiming to expand our retail and small and medium-sized enterprise businesses along with our corporate banking business in Southeast Asia through our acquisition of Krungsri in Thailand and Bank Danamon in Indonesia as well as our strategic investments in VietinBank in Vietnam and Security Bank in the Philippines, and to compete with leading local banks in such businesses. See “Item 3.D. Key Information—Risk Factors—Risks Related to Our Business—Our strategy to expand the range of our financial products and services and the geographic scope of our business globally may fail if we are unable to anticipate or manage new or expanded risks that entail such expansion.” For a discussion of recent developments, see “Item 5. Operating and Financial Review and Prospects—Recent Developments.”
In addition, we may face further competition as a result of recent investments, mergers and other business tie-ups among global financial institutions, including, for example, our recent acquisitions of, and business and capital alliances with, asset management, administration and custody services companies.
The Japanese Financial System
Japanese financial institutions may be categorized into three types:
| • |
the central bank, namely the Bank of Japan; |
| • |
private banking institutions; and |
| • |
government financial institutions. |
The Bank of Japan
The Bank of Japan’s role is to maintain price stability and the stability of the financial system to ensure a solid foundation for sound economic development.
Private Banking Institutions
Private banking institutions in Japan are commonly classified into two categories (the following numbers are based on information published by the FSA available as of May 1, 2019):
| • |
ordinary banks (123 ordinary banks and 56 foreign commercial banks with ordinary banking operations); and |
| • |
trust banks (14 trust banks, including two Japanese subsidiaries of foreign financial institutions). |
Ordinary banks in turn are classified as city banks, of which there are four, including MUFG Bank, and regional banks, of which there are 104 and other banks, of which there are 15. In general, the operations of ordinary banks correspond to commercial banking operations in the United States. City banks and regional banks are distinguished based on head office location as well as the size and scope of their operations.
48
Table of Contents
The city banks are generally considered to constitute the largest and most influential group of banks in Japan. Generally, these banks are based in large cities, such as Tokyo and Osaka, and operate nationally through networks of branch offices. The city banks provide a wide variety of banking and other financial products and services to large corporate customers, including the major industrial companies in Japan, as well as small and medium-sized companies and retail customers.
With some exceptions, the regional banks tend to be much smaller in terms of total assets than the city banks. Each of the regional banks is based in one of the Japanese prefectures and extends its operations into neighboring prefectures. Their customers are mostly regional enterprises and local public utilities. The regional banks also lend to large corporations. In line with the recent trend among financial institutions toward mergers or business tie-ups, various regional banks have announced or are currently negotiating or pursuing integration transactions.
Trust banks, including Mitsubishi UFJ Trust and Banking, provide various trust services relating to money trusts, pension trusts and investment trusts and offer other services relating to real estate, stock transfer agency and testamentary services, as well as banking services.
In recent years, almost all of the city banks have consolidated with other city banks and, in some cases, integrated with trust banks. Consolidation or integration among these banks was achieved, in most cases, through the use of a bank holding company.
In addition to ordinary banks and trust banks, other private financial institutions in Japan, including banks operated by non-financial companies, shinkin banks, or credit associations, and credit cooperatives, are engaged primarily in making loans to small businesses and individuals.
Government Financial Institutions
There are a number of government financial institutions in Japan, which are corporations wholly owned or majority-owned by the government and operate under the government’s supervision. Their funds are provided mainly from government sources. Certain types of operations undertaken by these institutions have been or are planned to be assumed by, or integrated with the operations of, private corporations through privatizations and other measures.
Among them are the following:
| • |
The Development Bank of Japan, which was established for the purpose of contributing to the economic development of Japan by extending long-term loans, mainly to primary and secondary sector industries, and which was reorganized as a joint stock company in October 2008 as part of its ongoing privatization process, with the government being required by law to continue to hold 50% or more of the shares in the bank until the completion of certain specified investment operations, which the bank is required to endeavor to achieve by March 2026, and more than one-third for an unspecified period thereafter; |
| • |
Japan Finance Corporation, which was formed in October 2008, through the merger of the international financial operations of the former Japan Bank for International Cooperation, National Life Finance Corporation, Agriculture, Forestry and Fisheries Finance Corporation, and Japan Finance Corporation for Small and Medium Enterprise, for the primary purposes of supplementing and encouraging the private financing of exports, imports, overseas investments and overseas economic cooperation, and supplementing private financing to the general public, small and medium-sized enterprises and those engaged in agriculture, forestry and fishery. In April 2012, Japan Finance Corporation spun off its international operations to create Japan Bank for International Cooperation as a separate government-owned entity; |
| • |
Japan Housing Finance Agency, which was originally established in June 1950 as the Government Housing Loan Corporation for the purpose of providing housing loans to the general public, and which |
49
Table of Contents
|
was reorganized as an incorporated administrative agency and started to specialize in securitization of housing loans in April 2007; and |
| • |
The Japan Post Group companies, a group of joint stock companies including Japan Post Bank, which were formed in October 2007 as part of the Japanese government’s privatization plan for the former Japan Post, a government-run public services corporation, which had been the Postal Service Agency until March 2003. In November 2015, approximately 11% of the outstanding shares of each of Japan Post Bank, Japan Post Insurance and Japan Post Holdings were sold to the public, and these companies are currently listed on the Tokyo Stock Exchange. In September 2017, an additional 22% of the outstanding shares of Japan Post Holdings were sold to the public. The Japanese government is expected to further decrease its shareholding in Japan Post Holdings to just above one-third, which is the minimum shareholding required for the Japanese government by law, in September 2019. |
Supervision and Regulation
Japan
Supervision. The FSA is responsible for supervising and overseeing financial institutions, making policy for the overall Japanese financial system and conducting insolvency proceedings with respect to financial institutions. The Bank of Japan, as the central bank for financial institutions, also has supervisory authority over banks in Japan, based primarily on its contractual agreements and transactions with the banks.
The Banking Law . Among the various laws that regulate financial institutions, the Banking Law and its subordinated orders and ordinances are regarded as the fundamental law for ordinary banks and other private financial institutions. The Banking Law addresses capital adequacy, inspections and reporting to banks and bank holding companies, as well as the scope of business activities, disclosure, accounting, limitation on granting credit and standards for arm’s length transactions for them. Bank holding companies, banks and other financial institutions are required to establish an appropriate system to better cope with conflicts of interest that may arise from their business operations.
Legislation has recently been passed by, or introduced to, the Diet to amend various financial regulation related laws, including the Banking Law, which includes certain deregulations on restrictions for shareholdings by banks. For example, although a bank is generally prohibited from holding more than 5% of the outstanding shares of another company (other than certain financial institutions) under the Banking Law, the bank may be exempt from such requirement and allowed to hold more than 5% of the outstanding shares of such company under amendments to the Banking Law that became effective in April 2014, if, among other exempted cases, a bank’s shareholding contributes to revitalizing a company’s business or the local economy related to such company. In May 2016, the Diet passed legislation to amend the Banking Law to allow banks and bank holding companies with the FSA’s approval to hold controlling interests in certain financial technology companies. The amendments became effective as of April 1, 2017. As a result of the amendments, banks and bank holding companies may now acquire and hold more than 5% of the voting rights in certain financial technology companies, subject to the approval of the Commissioner of the FSA. In May 2017, a bill to amend the Banking Law was passed by the Diet, with the aim to promote affiliation and cooperation between financial institutions and financial technology companies while securing the protection of customers. The amendment became effective in June 2018. Further, a bill to amend the Banking Law was passed by the Diet in May 2019 and, under the amendments, it is expected that banks will be allowed to engage in certain information provision services relating to customer and other information.
Bank holding company regulations. A bank holding company is prohibited from carrying out any business other than the management of its subsidiaries and other incidental businesses. A bank holding company may have any of the following as a subsidiary: a bank, a securities company, an insurance company, a foreign subsidiary that is engaged in the banking, securities or insurance business and any company that is engaged in a finance-related business, such as a credit card company, a leasing company, investment advisory company, or financial
50
Table of Contents
technology company as permitted by the April 1, 2017 amendments to the Banking Law. Certain companies that are designated by a ministerial ordinance as those that cultivate new business fields may also become the subsidiaries of a bank holding company.
In addition, under the April 1, 2017 amendments to the Banking Law, a bank holding company (i) is required to perform certain specified functions as a bank holding company to ensure effective management of its subsidiaries and (ii) is allowed to engage in certain specified common operations of its subsidiaries so as to improve the efficiency of the operations of its group companies.
Capital adequacy. The capital adequacy guidelines adopted by the FSA that are applicable to Japanese bank holding companies and banks with international operations closely follow the risk-weighted approach introduced by the Basel Committee on Banking Supervision of the Bank for International Settlements.
Basel II, as adopted by the FSA, has been applied to Japanese banks since March 31, 2007. Basel III, as adopted by the FSA, has been applied to Japanese banking institutions with international operations conducted through their foreign offices since March 31, 2013. Basel III is built on “three pillars”: (1) minimum capital requirements, (2) the self-regulation of financial institutions based on supervisory review process, and (3) market discipline through the disclosure of information.
The Group of Central Bank Governors and Heads of Supervision reached an agreement on the new global regulatory framework, which has been referred to as “Basel III,” in July and September 2010. In December 2010, the Basel Committee agreed on the details of the Basel III rules. The agreement on Basel III includes the following: (1) raising the quality of capital to ensure banks are able to better absorb losses both on a going concern basis and on a gone concern basis, (2) increasing the risk coverage of the capital framework, in particular for trading activities, securitizations, exposures to off-balance sheet vehicles and counterparty credit exposures arising from derivatives, (3) raising the level of minimum capital requirements, including an increase in the minimum common equity requirement from 2% to 4.5%, which was phased in between January 1, 2013 and the end of the calendar year 2014, and a capital conservation buffer of 2.5%, which was phased in between January 1, 2016 and the end of the calendar year 2018, bringing the total common equity requirement to 7%, (4) introducing an internationally harmonized leverage ratio to serve as a backstop to the risk-based capital measure and to contain the build-up of excessive leverage in the system, (5) raising standards for the supervisory review process (Pillar 2) and public disclosures (Pillar 3), together with additional guidance in the areas of valuation practices, stress testing, liquidity risk management, corporate governance and compensation, (6) introducing minimum global liquidity standards consisting of both a short term liquidity coverage ratio and a longer term structural net stable funding ratio, and (7) promoting the build-up of capital buffers that can be drawn down in periods of stress, including both a capital conservation buffer and a countercyclical buffer to protect the banking sector from periods of excess credit growth.
Under Basel III, Common Equity Tier 1, Tier 1 and total capital ratios are used to assess capital adequacy, which ratios are determined by dividing applicable capital components by risk-weighted assets. Total capital is defined as the sum of Tier 1 and Tier 2 capital.
Under Basel III, Tier 1 capital is defined to include Common Equity Tier 1 and Additional Tier 1 capital. Common Equity Tier 1 capital is a new category of capital primarily consisting of:
| • |
common stock, |
| • |
capital surplus, |
| • |
retained earnings, and |
| • |
accumulated other comprehensive income. |
Regulatory adjustments including certain intangible fixed assets, such as goodwill, and defined benefit pension fund net assets (prepaid pension costs) will be deducted from Common Equity Tier 1 capital.
51
Table of Contents
Additional Tier 1 capital generally consists of Basel III compliant preferred securities and, during the transition period, other capital that meets Tier I requirements under the former Basel II standards, net of regulatory adjustments.
Tier 2 capital generally consists of:
| • |
Basel III compliant subordinated obligations, |
| • |
during the transition period, capital that meets Tier II requirements under the former Basel II standards, |
| • |
allowances for credit losses, and |
| • |
non-controlling interests in subsidiaries’ Tier 2 capital instruments. |
In order to qualify as Tier 1 or Tier 2 capital under Basel III, applicable instruments such as preferred shares and subordinated debt must have a clause in their terms and conditions that requires them to be written-off or forced to be converted into common stock upon the occurrence of certain trigger events.
Risk-weighted assets are the sum of risk-weighted assets compiled for credit risk purposes, quotient of dividing the amount equivalent to market risk by 8%, and quotient of dividing the amount equivalent to operational risk by 8%, and also include any amount to be added due to transitional measures as well as floor adjustments, if necessary. Risk-weighted assets include the capital charge of the credit valuation adjustment, or CVA, the credit risk related to asset value correlation multiplier for large financial institutions, the 250% risk-weighted threshold items not deducted from Common Equity Tier 1 capital, and certain Basel II capital deductions that were converted to risk-weighted assets under Basel III, such as securitizations and significant investments in commercial entities. Certain Basel III provisions were adopted by the FSA with transitional measures and became effective March 31, 2013.
The capital ratio standards applicable to us are as follows:
| • |
a minimum total capital ratio of 8.0%, |
| • |
a minimum Tier 1 capital ratio of 6.0%, and |
| • |
a minimum Common Equity Tier 1 capital ratio of 4.5%. |
These minimum capital ratios are applicable to MUFG on a consolidated basis and to MUFG Bank and Mitsubishi UFJ Trust and Banking on a consolidated as well as stand-alone basis.
We have been granted an approval by the FSA to exclude the majority of our investment in Morgan Stanley from being subject to double gearing adjustments. The approval was granted for a 10-year period, but the approval amount will be phased out by 20% each year starting from March 31, 2019. As of March 31, 2019, a full application of double gearing adjustments with respect to our investment in Morgan Stanley would have reduced our Common Equity Tier 1 capital ratio by approximately 0.9%.
The Financial Stability Board identified us as a global systematically important bank, or G-SIB, in its most recent annual report published in November 2018, and is expected to update the list of G-SIB annually. In December 2015, the FSA also designated us as a G-SIB as well as a domestic systemically important bank generally referred to as a “D-SIB.”
Effective March 31, 2016, the FSA’s capital conservation buffer, countercyclical buffer and G-SIB surcharge requirements became applicable to Japanese banking institutions with international operations conducted through foreign offices, including us. The requirements as of March 31, 2019 consist of a capital conservation buffer of 2.5%, a G-SIB surcharge of 1.5% and a countercyclical buffer of 0.04% in addition to the 4.50% minimum Common Equity Tier 1 capital ratio.
52
Table of Contents
In December 2017, the Group of Central Bank Governors and Heads of Supervision released final Basel III reforms. The reforms are designed, among other things, to help reduce excessive variability in risk-weighted assets among banks and improve the comparability and transparency of banks’ risk-based capital ratios. The reforms endorsed by the Group of Central Bank Governors and Heads of Supervision include the following elements:
| • |
a revised standardized approach for credit risk, which is designed to improve the robustness and risk sensitivity of the existing approach; |
| • |
revisions to the internal ratings-based approach for credit risk, where the use of the most advanced internally modelled approaches for low-default portfolios will be limited; |
| • |
revisions to CVA framework, including the removal of the internally modelled approach and the introduction of a revised standardized approach; |
| • |
a revised standardized approach for operational risk, which will replace the existing standardized approaches and the advanced measurement approaches; |
| • |
revisions to the measurement of the leverage ratio and a leverage ratio buffer for G-SIBs, which will take the form of a Tier 1 capital buffer set at 50% of a G-SIB’s risk-weighted capital buffer; and |
| • |
an aggregate output floor, which is designed to ensure that banks’ risk-weighted assets generated by internal models are no lower than 72.5% of risk-weighted assets as calculated by the Basel III framework’s standardized approaches. Banks will also be required to disclose their risk-weighted assets based on these standardized approaches. |
Most of the reforms are expected to become effective on January 1, 2022, subject to implementation through legislation and regulation in each of the relevant jurisdictions, including Japan.
In January 2019, the Group of Central Bank Governors and Heads of Supervision approved the Basel Committee on Banking Supervision’s finalized market risk capital framework. The approved market risk framework is expected to become effective on January 1, 2022, subject to implementation through legislation and regulation in each of the relevant jurisdictions, including Japan.
For a discussion on our capital ratios, see “Item 5.B. Operating and Financial Review and Prospects—Liquidity and Capital Resources—Capital Adequacy.”
Leverage ratio . Japanese banks and bank holding companies with international operations are required to disclose their leverage ratios calculated in accordance with the methodology prescribed in the FSA guidance that has been adopted to implement the relevant Basel III standard. The leverage ratio is designed for monitoring and preventing the build-up of excessive leverage in the banking sector and is expressed as the ratio of Tier 1 capital to total balance sheet assets adjusted in accordance with the FSA guidance. In December 2017, the Group of Central Bank Governors and Heads of Supervision announced final Basel III reforms. The announced reforms include the revisions to the measurement of the leverage ratio and a 3.00% minimum leverage ratio requirement, plus a G-SIB leverage ratio buffer equal to 50% of the applicable G-SIB capital surcharge. The announcement sets forth implementation dates of January 1, 2018 for the minimum leverage ratio requirement and January 1, 2022 for the G-SIB leverage ratio buffer requirement. In Japan, the minimum leverage ratio requirement as of March 31, 2019 is 3.00%.
Total loss-absorbing capacity . In November 2015, the Financial Stability Board issued the final Total Loss-Absorbing Capacity, or TLAC, standard for G-SIBs, including us. The Financial Stability Board’s TLAC standard is designed to ensure that if a G-SIB fails, it has sufficient loss-absorbing and recapitalization capacity available in resolution to implement an orderly resolution that minimizes impacts on financial stability, ensures the continuity of critical functions, and avoids exposing public funds to loss. The Financial Stability Board’s TLAC standard defines a minimum requirement for the instruments and liabilities that should be readily available to absorb losses in resolution.
53
Table of Contents
The Japanese TLAC Standard, which was published by the FSA in March 2019 and became applicable to G-SIBs in Japan on March 31, 2019, and the FSB’s TLAC standard require entities designated as Domestic Resolution Entities for Covered SIBs to meet certain minimum external total loss-absorbing capacity, or External TLAC, requirements and to cause any of their material subsidiaries in Japan deemed systemically important by the FSA or their foreign subsidiaries subject to TLAC or similar requirements in the relevant jurisdictions to maintain certain minimum level of capital and debt having internal total loss-absorbing and recapitalization capacity, or Internal TLAC.
In the Japanese TLAC Standard, the FSA has designated the relevant ultimate holding companies in Japan as Domestic Resolution Entities for the Covered SIBs and, in our case, MUFG as the Domestic Resolution Entity for our Group, making MUFG subject to the External TLAC requirements in Japan. The FSA has also designated MUFG Bank, Mitsubishi UFJ Trust and Banking and Mitsubishi UFJ Morgan Stanley Securities as MUFG’s material subsidiaries in Japan, which are subject to the Internal TLAC requirements applicable to MUFG.
External TLAC debt generally consists of Basel III compliant regulatory capital, including, during the transition period, capital that meets the applicable regulatory capital requirements under the former Basel II standards, and the Japanese TLAC Standard compliant obligations, net of regulatory adjustments. Internal TLAC debt generally consists of Basel III compliant regulatory capital, including, during the transition period, capital that meets the applicable regulatory capital requirements under the former Basel II standards, and the Japanese TLAC Standard compliant subordinated obligations, net of regulatory adjustments. The Japanese TLAC Standard does not require that, in order for unsecured senior debt issued by the Domestic Resolution Entity of a Japanese G-SIB to qualify as External TLAC debt, such debt be subject to any contractual write-down, write-off or conversion provisions or to any subordination provisions so long as its creditors are recognized as structurally subordinated to the creditors of its subsidiaries and affiliates by the FSA on the ground that the amount of excluded liabilities of such Domestic Resolution Entity ranking pari passu with, or junior to, its unsecured senior liabilities does not, in principle, exceed 5% of the aggregate amount of its External TLAC. In contrast, Internal TLAC debt incurred by a material subsidiary of a Japanese G-SIB is required to be subject to contractual loss absorption provisions and to be subordinated to such subsidiary’s excluded liabilities.
The Financial Stability Board’s TLAC standard requires a G-SIB to hold TLAC in an amount not less than 16% of its risk-weighted assets and 6% of the applicable Basel III leverage ratio denominator by January 1, 2019, and not less than 18% of its risk-weighted assets and 6.75% of the applicable Basel III leverage ratio denominator by January 1, 2022.
The Japanese TLAC Standard requires a Japanese G-SIB, including us, to hold external TLAC debt in an amount not less than 16% of its risk-weighted assets and 6% of the applicable Basel III leverage ratio denominator on and after March 31, 2019, and not less than 18% of its risk-weighted assets and 6.75% of the applicable Basel III leverage ratio denominator on and after March 31, 2022. Under the FSA TLAC Standard, Japanese G-SIBs are or will be allowed to count the Japanese Deposit Insurance Fund Reserves in an amount equivalent to 2.5% of their consolidated risk-weighted assets from 2019 and 3.5% of their consolidated risk-weighted assets from 2022 as external TLAC.
Under the Japanese TLAC Standard, the FSA may order the Domestic Resolution Entity of a Japanese G-SIB to submit a report outlining an improvement plan if the External TLAC ratio of the Domestic Resolution Entity or the Internal TLAC of its material subsidiaries in Japan falls below the minimum requirements. If the FSA further deems it necessary to ensure improvement, the FSA may issue a business improvement order to such Domestic Resolution Entity.
The Domestic Resolution Entity may also be subject to a capital distribution constraints plan if the capital buffers are used and reduced below the required level to make up for its required External TLAC on a risk-weighted assets basis.
See “Item 3.D Key Information—Risk Factors—Risks Related to Our Business—may not be able to maintain our capital ratios and other regulatory ratios above minimum required levels, which could result in various regulatory actions, including the suspension of some or all of our operations.”
54
Table of Contents
Prompt corrective action system . Under the prompt corrective action system, the FSA may take corrective action, if a bank or a bank holding company fails to meet the minimum capital adequacy ratio or leverage ratio. These actions include requiring such bank or bank holding company to formulate and implement capital improvement measures, requiring it to reduce assets or the bank’s business operations or take other specific actions, and issuing an order to dispose of shares of its subsidiaries or suspend all or part of the bank’s business operations.
Capital distribution constraints system. Under the capital distribution constraints system, the FSA may order a bank or a bank holding company to submit and carry out a capital distribution constraints plan, if the bank or the bank holding company fails to hold Common Equity Tier 1 capital required as applicable capital buffers. A capital distribution plan must be determined to be reasonably designed to restore the required capital buffers by restricting capital distributions, such as dividends, share buybacks and bonus payments, up to a certain amount depending on the level of the deficit in the required capital buffers of the bank or the bank holding company.
Prompt warning system . Under the prompt warning system, the FSA may take precautionary measures to maintain and promote the sound operations of financial institutions, even before those financial institutions become subject to prompt corrective actions. These measures require a financial institution to enhance profitability, credit risk management, stability and cash flows.
Deposit insurance system and government measures for troubled financial institutions . The Deposit Insurance Act is intended to protect depositors if a financial institution fails to meet its obligations. The Deposit Insurance Corporation was established in accordance with the Deposit Insurance Act.
City banks, including MUFG Bank, regional banks, trust banks, including Mitsubishi UFJ Trust and Banking, and various other credit institutions participate in the deposit insurance system on a compulsory basis.
Under the Deposit Insurance Act, the maximum amount of protection is ¥10 million per customer within one bank. The ¥10 million maximum applies to all deposits except for non-interest bearing deposits, which are non-interest bearing deposits redeemable on demand and maintained by depositors primarily in settlement accounts for payment and settlement purposes. Deposits in settlement accounts are fully protected without a maximum amount limitation. Certain types of deposits are not covered by the deposit insurance system, such as foreign currency deposits and negotiable certificates of deposit. As of April 1, 2019, the Deposit Insurance Corporation charged an insurance premium equal to 0.045% per year on the deposits in the settlement accounts, and a premium equal to 0.032% per year on the deposits in other accounts.
Under the Deposit Insurance Act, a Financial Reorganization Administrator can be appointed by the Prime Minister if a bank’s liabilities exceed its obligations or has suspended, or is likely to suspend, repayment of deposits. The Financial Reorganization Administrator will take control of the assets of the troubled bank, dispose of the assets and search for another institution willing to take over the troubled bank’s business. The troubled bank’s business may also be transferred to a “bridge bank” established by the Deposit Insurance Corporation to enable the troubled bank’s operations to be maintained and continue temporarily, and the bridge bank will seek to transfer the troubled bank’s assets to another financial institution or dissolve the troubled bank. The Deposit Insurance Corporation protects deposits, as described above, either by providing financial aid for costs incurred by the financial institution succeeding the insolvent bank or by paying insurance money directly to depositors. The financial aid provided by the Deposit Insurance Corporation may take the form of a monetary grant, loan or deposit of funds, purchase of assets, guarantee or assumption of debt, subscription for preferred stock, or loss sharing.
The Deposit Insurance Act also provides for exceptional measures to cope with systemic risk in the financial industry. Where the Prime Minister recognizes that the failure of a bank which falls into any of (i) through
55
Table of Contents
(iii) below may cause an extremely grave problem to the maintenance of the financial order in Japan or the region where such bank is operating, or systemic risk, if none of the measures described in (i) through (iii) below is implemented, the Prime Minister may, following deliberation by the Financial Crisis Response Council, confirm ( nintei ) the need to take any of the following measures: (i) if the bank does not fall into either of the categories described in (ii) or (iii) below, the Deposit Insurance Corporation may subscribe for shares or subordinated bonds of, or extend subordinated loans to the bank, or subscribe for shares of the bank holding company of the bank, in order to enhance the bank’s regulatory capital (“Item 1 measures” ( dai ichigo sochi )); (ii) if the bank has suspended, or is likely to suspend, repayment of deposits, or its liabilities exceed its assets, financial aid exceeding the pay-off cost may be made available to such bank (“Item 2 measures” ( dai nigo sochi )); and (iii) if the bank has suspended, or is likely suspend, repayment of deposits, and its liabilities exceed its assets, and the systemic risk cannot be avoided by the measures mentioned in (ii) above, the Deposit Insurance Corporation may acquire all of the bank’s shares (“Item 3 measures” ( dai sango sochi )). The expenses for the implementation of the above measures will be borne by the banking industry, with an exception under which the Japanese government may provide partial subsidies for such expenses.
Under the new orderly resolution regime established by amendments to the Deposit Insurance Act that were promulgated in June 2013 and became effective on March 6, 2014, financial institutions, including banks, insurance companies and securities companies and their holding companies, are subject to the regime. Further, where the Prime Minister recognizes that the failure of a financial institution which falls into either of (a) or (b) below may cause a significant disruption to the Japanese financial market or system in Japan if measures described in (a) or measures described in (b) are not taken, the Prime Minister may, following deliberation by the Financial Response Crisis Council, confirm ( nintei ) that any of the following measures need to be applied to the financial institution:
| (a) | if the financial institution is not a financial institution whose liabilities exceed its assets, the financial institution shall be placed under the special supervision by the Deposit Insurance Corporation over the financial institution’s business operations and management and the disposal of the financial institution’s assets, and the Deposit Insurance Corporation may provide the financial institution with loans or guarantees necessary to avoid the risk of significant disruption to the financial system in Japan, or subscribe for shares or subordinated bonds of, or extend subordinated loans to, the financial institution, taking into consideration the financial condition of the financial institution (“Specified Item 1 measures” ( tokutei dai ichigo sochi ) under Article 126-2, Paragraph 1, Item 1 of the Deposit Insurance Act); or |
| (b) | if the financial institution is a financial institution whose liabilities exceed, or are likely to exceed, its assets or which has suspended, or is likely to suspend, payments on its obligations, the financial institution shall be placed under the special supervision by the Deposit Insurance Corporation over the financial institution’s business operations and management and the disposal of the financial institution’s assets, and the Deposit Insurance Corporation may provide financial aid necessary to assist a merger, business transfer, corporate split or other reorganization in respect of such failed financial institution (“Specified Item 2 measures” ( tokutei dai nigo sochi ) under Article 126-2, Paragraph 1, Item 2 of the Deposit Insurance Act). |
If the Prime Minister confirms that any of the measures set out in (b) above needs to be applied to a failed financial institution, the Prime Minister may order that the failed financial institution’s business operations and management and the disposal of the failed financial institution’s assets be placed under the special control of the Deposit Insurance Corporation under Article 126-5 of the Deposit Insurance Act. The business or liabilities of the financial institution subject to the special supervision or the special control of the Deposit Insurance Corporation as set forth above may also be transferred to a “bridge financial institution” established by the Deposit Insurance Corporation to enable the financial institution’s operations to be maintained and continue temporarily, or the financial institution’s liabilities to be repaid, and the bridge financial institution will seek to transfer the financial institution’s business or liabilities to another financial institution or dissolve the financial institution. The financial aid provided by the Deposit Insurance Corporation to assist a merger, business transfer, corporate split or other reorganization in respect of the failed financial institution set out in (b) above may take the form of a
56
Table of Contents
monetary grant, loan or deposit of funds, purchase of assets, guarantee or assumption of debts, subscription for preferred stock or subordinated bonds, subordinated loan, or loss sharing. If the Deposit Insurance Corporation has provided such financial assistance, the Prime Minister may designate the movable assets and claims of the failed financial institution as not subject to attachment under Article 126-16 of the Deposit Insurance Act, and such merger, business transfer, corporate split or other reorganization may be conducted outside of the court-administrated insolvency proceedings. If the financial institution subject to the special supervision or the special control by the Deposit Insurance Corporation as set forth above has liabilities that exceed, or are likely to exceed, its assets, or has suspended, or is likely to suspend, payments on its obligations, the financial institution may transfer all or a material portion of its business or all or a material portion of shares of its subsidiaries or implement corporate split or certain other corporate actions with court permission in lieu of any shareholder resolutions under Article 126-13 of the Deposit Insurance Act. In addition, the Deposit Insurance Corporation must request other financial institution creditors of the failed financial institution to refrain from exercising their rights against the failed financial institution until measures necessary to avoid the risk of significant disruption to the financial system in Japan have been taken, if it is recognized that such exercise of their rights is likely to make the orderly resolution of the failed financial institution difficult.
The expenses for implementation of the measures under this regime will be borne by the financial industry, with an exception under which the Japanese government may provide partial subsidies for such expenses within the limit to be specified in the government budget in cases where it is likely to cause extremely serious hindrance to the maintenance of the credit system in Japan or significant turmoil in the Japanese financial market or system if such expenses are to be borne only by the financial industry.
According to the announcement made by the FSA in March 2014, (i) Additional Tier 1 instruments and Tier 2 instruments under Basel III issued by a bank must be written down or converted into common shares when the Prime Minister confirms ( nintei ) that Item 2 measures ( dai nigo sochi ), Item 3 measures ( dai sango sochi ), or Specified Item 2 measures ( tokutei dai nigo sochi ) need to be applied to the bank and (ii) Additional Tier 1 instruments and Tier 2 instruments under Basel III issued by a bank holding company must be written down or converted into common shares when the Prime Minister confirms ( nintei ) that Specified Item 2 measures ( tokutei dai nigo sochi ) need to be applied to the bank holding company.
Further, in an explanatory paper outlining the FSA’s approach for the introduction of the TLAC framework in Japan published by the FSA in April 2016 and revisions to the paper published by the FSA in April 2018, collectively the FSA TLAC Approach, and the TLAC standard set forth in the regulatory notices and related materials for the implementation of the TLAC requirements in Japan published by the FSA in March 2019, or the Japanese TLAC Standard, the FSA expressed its view that single point of entry, or SPE, resolution, in which a single national resolution authority applies its resolution tools to the ultimate holding company in Japan of a financial group, would be the preferred strategy for resolution of Japanese G-SIBs and a domestic systemically important bank, or D-SIBs, deemed to be in particular need for a cross-border resolution arrangement and of particular systemic significance to the Japanese financial system if it fails (such G-SIBs and D-SIBs, collectively, “Covered SIBs”). However, it is uncertain which measure is to be taken in a given case, including whether or not the SPE resolution strategy will actually be elected and implemented in a given case, and the actual measures to be taken will be determined on a case-by-case basis considering the actual condition of the relevant Japanese G-SIB in distress. Under a possible model of resolution of a Japanese G-SIB based on the SPE resolution strategy as described in the Japanese TLAC Standard, if the FSA determines that a material subsidiary in Japan of a financial institution that is a Japanese G-SIB is non-viable due to material deterioration in its financial condition and issues an order concerning restoration of financial soundness, including recapitalization and restoration of liquidity of such material subsidiary, to the ultimate holding company in Japan designated by the FSA as Domestic Resolution Entity for the financial institution under Article 52-33, Paragraph 1 of the Banking Act of Japan (Act No. 59 of 1981), the material subsidiary’s Internal TLAC instruments will be written off or, if applicable, converted into equity in accordance with the applicable contractual loss absorption provisions of such Internal TLAC instruments. Following the write-off or conversion of Internal TLAC instruments, if the Prime Minister recognizes that the financial institution’s liabilities exceed, or are likely to exceed, its assets, or that it has suspended, or is likely to suspend, payments on its obligations, as a result of the financial institution’s loans
57
Table of Contents
to, or other investment in, the material subsidiary becoming subject to loss absorption or otherwise, and further recognizes that the failure of such financial institution is likely to cause a significant disruption to the Japanese financial market or system, the Prime Minister may, following deliberation by the Financial Crisis Response Council, confirm that measures set forth in Article 126-2, Paragraph 1, Item 2 of the Deposit Insurance Act, generally referred to as Specified Item 2 Measures ( tokutei dai nigo sochi ), need to be applied to the financial institution for its orderly resolution. Any such confirmation by the Prime Minister also triggers the point of non-viability clauses of Additional Tier 1 and Tier 2 instruments issued by the financial institution, causing such instruments to be written off or, if applicable, converted into equity.
Upon the application of Specified Item 2 Measures ( tokutei dai nigo sochi ), a financial institution will be placed under the special supervision by, or if the Prime Minister so orders, under the special control of, the Deposit Insurance Corporation. In an orderly resolution, the Deposit Insurance Corporation would control the operation and management of a financial institution’s business, assets and liabilities, including the potential transfer to a bridge financial institution established by the Deposit Insurance Corporation as its subsidiary, or such other financial institution as the Deposit Insurance Corporation may determine, of the financial institution’s systemically important assets and liabilities, which we expect in the case of MUFG would include the shares of our material subsidiaries based on the Japanese TLAC Standard. The Prime Minister may prohibit creditors of the financial institution from attaching any of our assets and claims which are to be transferred to a bridge financial institution or another financial institution pursuant to Article 126-16 of the Deposit Insurance Act. Based on the Japanese TLAC Standard, it is currently expected that the External TLAC eligible senior notes issued by the financial institution will not be transferred to a bridge financial institution or other transferee in the orderly resolution process but will remain as such financial institution’s liabilities subject to court-administered insolvency proceedings. On the other hand, in an orderly resolution process, the shares of material subsidiaries of such financial institution may be transferred to a bridge financial institution or other transferee, and such financial institution would only be entitled to receive consideration representing the fair value of such shares, which could be significantly less than the book value of such shares. Following such business transfer, the recoverable value of such financial institution’s residual assets in court-administered insolvency proceedings may not be sufficient to fully satisfy any payment obligations that such financial institution may have under its liabilities, including the External TLAC eligible senior notes.
Recovery and resolution plan . In November 2018, the Financial Stability Board published the latest list of G-SIBs, which includes us. The list is annually updated by the Financial Stability Board. A recovery and resolution plan must be put in place for each G-SIB, and the plans must be regularly reviewed and updated. In Japan, under the Banking Law and the Comprehensive Guidelines for Supervision of Major Banks, etc., financial institutions identified as G-SIBs must, as part of their crisis management, prepare and submit a recovery plan, including triggers for the recovery plan and an analysis of recovery options, to the FSA. The Comprehensive Guidelines also provide that resolution plans for such financial institutions are prepared by the FSA. We submitted our recovery plan to the FSA in December 2018.
Liquidity Coverage Ratio. Japanese banks and bank holding companies with international operations are required to disclose their LCRs calculated in accordance with the methodology prescribed in the FSA guidance that has been adopted to implement the relevant Basel III standard. The LCR is a measure to determine whether a bank has a sufficient amount of high-quality liquid assets, which are assets that can be converted easily and immediately into cash in private markets in order to meet the bank’s liquidity needs, to survive in a 30-day financial stress scenario, including sizable deposit outflows, inability to issue new bonds or access the interbank market, stoppage of the collateralized funding market, need for additional collateral in connection with derivative transactions, and significant outflows of cash under commitment lines to customers. Once a bank or bank holding company fails to meet the minimum LCR of 100%, it is required to immediately report such failure to the FSA. If the FSA deems the financial condition of the bank or bank holding company to be serious, the FSA may issue a business improvement order. A minimum LCR of 100% is currently required.
Net Stable Funding Ratio. The NSFR is a measure to determine whether a bank has sustainable and long-term liabilities and capital for its assets and activities. The Basel Committee on Banking Supervision issued the
58
Table of Contents
final standard of NSFR in October 2014. In Japan, details of the NSFR requirements are currently under discussion.
Inspection and reporting . The FSA has the authority to order reporting from, and inspect, banks and banking holding companies in Japan. Based on its “Principles and Approaches of Inspection and Supervision,” the FSA seeks to evaluate the effectiveness of the operations and functions of financial institutions, supervise financial institutions based on proactive and forward-looking analyses, facilitate best practices among financial institutions, focus monitoring on high-priority issues, and integrate on- and off-site monitoring. The FSA is expected to abolish the Financial Institutions Inspection Manual which has traditionally been understood to set forth the minimum standard for the operations of financial institutions in Japan.
Furthermore, the Securities and Exchange Surveillance Commission of Japan, or SESC, inspects banks in connection with their securities business as well as financial instruments business operators, such as securities firms. The Bank of Japan also conducts inspections of banks. The Bank of Japan Law provides that the Bank of Japan and financial institutions may agree as to the form of inspection to be conducted by the Bank of Japan.
Laws limiting shareholdings of banks . The provisions of the Antimonopoly Act that generally prohibit a bank from holding more than 5% of another company’s voting rights do not apply to a bank holding company.
However, the Banking Law prohibits a bank holding company and its subsidiaries from holding, on an aggregated basis, more than 15% of the voting rights of companies other than those which can legally become subsidiaries of bank holding companies. There have recently been amendments to various financial regulation related laws, including the Banking Law, which includes certain deregulations on restrictions for shareholdings by banks, as described above.
In addition, a bank is prohibited from holding shares in other companies exceeding the aggregate of its Common Equity Tier 1 capital amount and Additional Tier 1 capital amount.
Restrictions on exposures to single large counterparties . The Banking Law prohibits banks and bank holding companies (on a consolidated basis with their subsidiaries and affiliates) from having exposures exceeding 25% of the sum of their Tier 1 and Tier 2 capital to a single counterparty (on a consolidated basis with its subsidiaries and specially related parties as defined in the law). The Enforcement Order and the Enforcement Ordinance of the Banking Law are expected to be amended in light of the Basel Committee on Banking Supervision’s final standard published in April 2014, which, among other things, prohibits a large exposure exceeding 25% of Tier 1 capital and a G-SIB’s exposure to another G-SIB exceeding 15% of Tier 1 capital, requires recognition of exposures to credit risk mitigation providers and introduces a look-through approach for exposures to collective investment undertakings.
Financial Instruments and Exchange Act. The Financial Instruments and Exchange Act provides protection for investors and also regulates sales of a wide range of financial instruments and services, requiring financial institutions to improve their sales rules and strengthen compliance frameworks and procedures. Among the instruments that the Japanese banks deal in, derivatives, foreign currency-denominated deposits, and variable insurance and annuity products are subject to regulations covered by the sales-related rules of conduct under the law.
Article 33 of the Financial Instruments and Exchange Act generally prohibits banks from engaging in securities transactions. However, bank holding companies and banks may, through a domestic or overseas securities subsidiary, conduct all types of securities businesses, with appropriate approval from the FSA. Similarly, registered banks are permitted to provide securities intermediation services and engage in certain other similar types of securities related transactions, including retail sales of investment funds and government and municipal bonds.
Subsidiaries of bank holding companies engaging in the securities business are subject to the supervision of the FSA as financial instruments business operators. The Prime Minister has the authority to regulate the
59
Table of Contents
securities industry and securities companies, which authority is delegated to the Commissioner of the FSA under the Financial Instruments and Exchange Act. In addition, the SESC, an external agency of the FSA, is independent from the FSA’s other bureaus and is vested with the authority to conduct day-to-day monitoring of the securities markets and to investigate irregular activities that hinder fair trading of securities, including inspections of securities companies as well as banks in connection with their securities business. Furthermore, the Commissioner of the FSA delegates certain authority to the Director General of the Local Finance Bureau to inspect local securities companies and their branches. A violation of applicable laws and ordinances may result in various administrative sanctions, including revocation of registration, suspension of business, administrative monetary penalty or an order to discharge any director or executive officer who has failed to comply with applicable laws and ordinances. Securities companies are also subject to the rules and regulations of the Japanese stock exchanges and the Japan Securities Dealers Association, a self-regulatory organization of securities companies.
Act on Sales, etc. of Financial Instruments. The Act on Sales, etc. of Financial Instruments was enacted to protect customers from incurring unexpected losses as a result of purchasing financial instruments. Under this act, sellers of financial instruments have a duty to their potential customers to explain important matters such as the nature and magnitude of risks involved regarding the financial instruments that they intend to sell. If a seller fails to comply with the duty, there is a rebuttable presumption that the loss suffered by the customer due to the seller’s failure to explain is equal to the amount of decrease in the value of the purchased financial instruments.
Anti-money laundering laws. Under the Act on Prevention of Transfer of Criminal Proceeds, specified business operators, including financial institutions, are required to verify customer identification data, preserve transaction records, and file Suspicions Transaction Reports with the FSA or other regulatory authorities in cases where any asset received through their business operations is suspected of being criminal proceeds.
Most recent amendments to the Act, which became effective on October 1, 2016, included, among others, (1) enhancement of customer due diligence including identification of beneficial owners who are natural persons controlling corporate customers through voting rights or other means, and (2) stricter requirements for the risk-based approach through assessment of money laundering and terrorist financing risks and application of adequate resources effectively to mitigate such risks.
In February 2018, the FSA issued “Guidelines on Anti-Money Laundering and Terrorist Financing” to require financial institutions to further strengthen their management of anti-money laundering and terrorist financing functions and their risk-based approach used in such functions.
Further, recent amendments to the Enforcement Ordinance of the Act introduced requirements relating to online KYC processes in November 2018 and are expected to strengthen the requirements for KYC processes for customers residing in remote areas in April 2020.
Acts concerning trust business conducted by financial institutions . Under the Trust Business Act, joint stock companies that are licensed by the Prime Minister as trust companies, including non-financial companies, are allowed to conduct trust business. In addition, under the Act on Provision, etc. of Trust Business by Financial Institutions, banks and other financial institutions, as permitted by the Prime Minister, are able to conduct trust business. The Trust Business Act provides for a separate type of registration for trustees who conduct only administration type trust business. The Trust Business Act also provides for various duties imposed on the trustee in accordance with and in addition to the Trust Act.
Regulatory developments relating to lending to small and medium-sized firms and others. The Act Concerning Temporary Measures to Facilitate Financing for Small and Medium-sized Firms and Others required financial institutions, among other things, to make an effort to reduce their customers’ burden of loan repayment by employing methods such as modifying the term of loans at the request of eligible borrowers, including small and medium-sized firms and individual home loan borrowers. This legislation also required financial institutions to internally establish a system to implement the requirements of the legislation and periodically make public
60
Table of Contents
disclosure of and report to the relevant authority on the status of implementation. Although this legislation expired on March 31, 2013, the FSA continues to encourage financial institutions to continue to provide support to small and medium-sized firms by the Supervisory Policy and Ordinance for Enforcement of the Baking Law in order to encourage financial institutions to modify the terms of loans, provide smooth financing, and take active roles in supporting operations of such firms.
Act on the Protection of Personal Information . With regard to protection of personal information, the Act on the Protection of Personal Information requires, among other things, Japanese banking institutions to limit the use of personal information to the stated purposes and to properly manage the personal information in their possession, and forbids them from providing personal information to third parties without consent. If a bank violates certain provisions of the act, the FSA may advise or order the bank to take proper action. In addition, the Banking Law and the Financial Instruments and Exchange Act contain certain provisions with respect to appropriate handling of customer information.
Act on the Use of Personal Identification Numbers in the Administration of Government Affairs. Pursuant to the Act on the Use of Personal Identification Numbers in the Administration of Government Affairs, which became effective in October 2015, the Japanese government has adopted a Social Security and Tax Number System, which is designed to (1) improve social security services, (2) enhance public convenience in obtaining government services, and (3) increase the efficiency of the administration of government affairs. Under this system, a 12-digit unique number is assigned to each resident of Japan to identify and manage information relating to the resident for government service and tax purposes. Financial institutions are required to implement measures to ensure that such customer information will be protected from inappropriate disclosure and other unauthorized use.
Act Concerning Protection of Depositors from Illegal Withdrawals Made by Counterfeit or Stolen Cards. The Act on Protection, etc. of Depositors and Postal Saving Holders from Unauthorized Automated Withdrawal, etc. Using Counterfeit Cards, etc. and Stolen Cards, etc. requires financial institutions to establish internal systems to prevent illegal withdrawals of deposits made using counterfeit or stolen bank cards. The act also requires a financial institution to compensate depositors for any amount illegally withdrawn using stolen bank cards except in certain cases, including those where the financial institution can verify that it acted in good faith without negligence and there was gross negligence on the part of the relevant depositor. In addition, the act provides that illegal withdrawals with counterfeit bank cards are invalid unless the financial institution acted in good faith without negligence and there was gross negligence on the part of the relevant account holder.
Government reforms to restrict maximum interest rates on consumer lending business. In December 2006, the Diet passed legislation to reform the regulations relating to the consumer lending business, including amendments to the Act Regulating the Receipt of Contributions, Receipt of Deposits and Interest Rates which, effective June 18, 2010, reduced the maximum permissible interest rate from 29.2% per annum to 20% per annum. The regulatory reforms also included amendments to the Law Concerning Lending Business which, effective June 18, 2010, abolished the so-called “gray-zone interest.” Gray-zone interest refers to interest rates exceeding the limits stipulated by the Interest Rate Restriction Act (between 15% per annum to 20% per annum depending on the amount of principal). Prior to June 18, 2010, gray-zone interests were permitted under certain conditions set forth in the Law Concerning Lending Business. As a result of the regulatory reforms, all interest rates are now subject to the lower limits imposed by the Interest Rate Restriction Act, compelling lending institutions, including our consumer finance subsidiaries and equity method investees, to lower the interest rates they charge borrowers. Furthermore, the new regulations, which became effective on June 18, 2010, require, among other things, consumer finance companies to limit their lending to a single customer to a maximum of one third of the customer’s annual income regardless of the customer’s repayment capability.
In addition, as a result of decisions made by the Supreme Court of Japan prior to June 18, 2010, imposing stringent requirements for charging such gray-zone interest rates, consumer finance companies have been responding to borrowers’ claims for reimbursement of previously collected interest payments in excess of the
61
Table of Contents
limits stipulated by the Interest Rate Restriction Act. See “Item 3.D. Key Information—Risk Factors—Risks Related to Our Business—Because of our loans to consumers and our shareholdings in companies engaged in consumer lending, changes in the business or regulatory environment for consumer finance companies in Japan may further adversely affect our financial results.”
Act on Special Provisions of the Income Tax Act, the Corporation Tax Act and the Local Tax Act Incidental to Enforcement of Tax Treaties. Pursuant to the Amendments to the Act on Special Provisions of the Income Tax Act, the Corporation Tax Act and the Local Tax Act Incidental to Enforcement of Tax Treaties, which became effective in January 2017, financial institutions are required to collect certain information from their accountholders, including jurisdictions of tax residence, and report such information to the National Tax Agency in accordance with the Common Reporting Standard as developed by the Organization for Economic Co-operation and Development.
Recent Regulatory Actions . In May 2019, we received a decision from the European Commission requiring MUFG Bank to pay a fine due to an infringement of European Union competition law in 2010 and 2011 by a forex trader formerly employed at MUFG Bank’s London Branch. In June 2019, we also received a decision from a Swiss regulator requiring MUFG Bank to pay a fine due to an infringement of Swiss competition law by the same forex trader. See “Item 3.D. Key Information—Risk Factors—Risks Related to Our Business—We may become subject to regulatory actions or other legal proceedings relating to our transactions or other aspects of our operations, which could result in significant financial losses, restrictions on our operations and damage to our reputation.”
United States
As a result of our operations in the United States, we are subject to extensive U.S. federal and state supervision and regulation.
Overall supervision and regulation . We are subject to supervision, regulation and examination with respect to our U.S. operations by the FRB pursuant to the U.S. Bank Holding Company Act of 1956, as amended, or the BHCA, and the International Banking Act of 1978, as amended, or the IBA, because we and MUFG Bank are bank holding companies and foreign banking organizations, as defined pursuant to those statutes. The FRB functions as our “umbrella” supervisor under amendments to the BHCA effected by the Gramm-Leach-Bliley Act of 1999, which among other things:
| • |
prohibited further expansion of the types of activities in which bank holding companies, acting directly or through non-bank subsidiaries, may engage; |
| • |
authorized qualifying bank holding companies to opt to become “financial holding companies,” and thereby acquire the authority to engage in an expanded list of activities; and |
| • |
modified the role of the FRB by specifying new relationships between the FRB and the functional regulators of non-bank subsidiaries of both bank holding companies and financial holding companies. |
The BHCA generally prohibits each of a bank holding company and a foreign banking organization that maintains branches or agencies in the United States from, directly or indirectly, acquiring more than 5% of the voting shares of any company engaged in non-banking activities in the United States unless the bank holding company or foreign banking organization has elected to become a financial holding company, as discussed above, or the FRB has determined, by order or regulation, that such activities are so closely related to banking as to be a proper incident thereto and has granted its approval to the bank holding company or foreign banking organization for such an acquisition. The BHCA also requires a bank holding company or foreign banking organization that maintains branches or agencies in the United States to obtain the prior approval of an appropriate federal banking authority before acquiring, directly or indirectly, the ownership of more than 5% of the voting shares or control of any U.S. bank or bank holding company. In addition, under the BHCA, a U.S. bank or a U.S. branch or agency of a foreign bank is prohibited from engaging in various tying arrangements involving it or its affiliates in connection with any extension of credit, sale or lease of any property or provision of any services.
62
Table of Contents
In October 2008, we, MUFG Bank, Mitsubishi UFJ Trust and Banking and MUFG Americas Holdings initially attained financial holding company status. In August 2016, Mitsubishi UFJ Trust and Banking relinquished its financial holding company status. Financial holding company status is subject to periodic regulatory review. A financial holding company is authorized to engage in an expanded list of activities deemed to be financial in nature or incidental to such financial activity as well as certain specified non-banking activities deemed to be closely related to banking. In order to maintain the status as a financial holding company, a bank holding company must continue to meet certain standards established by the FRB. Those standards require that a financial holding company exceed the minimum standards applicable to bank holding companies that have not elected to become financial holding companies. These higher standards include meeting the “well capitalized” and “well managed” standards for financial holding companies as defined in the regulations of the FRB. Failure to meet these standards, due to inadequate capital management or shortcomings in operations, results in restrictions on the ability to engage in expanded activities as a financial holding company. In addition, a financial holding company must ensure that its U.S. banking subsidiaries meet certain minimum standards under the Community Reinvestment Act of 1977.
U.S. branches and agencies of subsidiary Japanese banks. Under the authority of the IBA, our banking subsidiaries, MUFG Bank and Mitsubishi UFJ Trust and Banking, operate five branches, two agencies and seven representative offices in the United States. MUFG Bank operates branches in Los Angeles, California; Chicago, Illinois; and two branches in New York, New York; agencies in Houston and Dallas, Texas; and representative offices in Washington, D.C; San Francisco, California; Seattle, Washington; Atlanta, Georgia; Minnetonka, Minnesota; Jersey City, New Jersey; and Florence, Kentucky. Mitsubishi UFJ Trust and Banking operates a branch in New York, New York.
The IBA provides, among other things, that the FRB may examine U.S. branches and agencies of foreign banks, and each branch and agency shall be subject to on-site examination by the appropriate federal or state bank supervisor as frequently as would a U.S. bank. The IBA also provides that if the FRB determines that a foreign bank is not subject to comprehensive supervision or regulation on a consolidated basis by the appropriate authorities in its home country, or if there is reasonable cause to believe that the foreign bank or its affiliate has committed a violation of law or engaged in an unsafe or unsound banking practice in the United States, the FRB may order the foreign bank to terminate activities conducted at a branch or agency in the United States.
U.S. branches and agencies of foreign banks must be licensed, and are also supervised and regulated, by a state or by the Office of the Comptroller of the Currency, or the OCC, the federal regulator of U.S. national banks. The OCC is an independent bureau of the U.S. Department of the Treasury. Effective November 7, 2017, all of the branches and agencies of MUFG Bank and Mitsubishi UFJ Trust and Banking in the United States converted from state-licensed branches and agencies to federally-licensed branches and agencies supervised and regulated by the OCC. See “Item 8.A. Financial Information—Legal Proceedings.”
When opening a federal branch or agency, a foreign bank must establish and maintain a deposit account with an FRB member bank of at least (1) the amount of capital that would be required of a national bank being organized at the same location or (2) five percent of the total liabilities of the federal branch or agency, including acceptances but excluding (i) accrued expenses and (ii) amounts due and other liabilities to offices, branches, and subsidiaries of the foreign bank, whichever is greater. Federally-licensed branches and agencies must also submit written reports concerning their assets and liabilities and other matters, to the extent required by the OCC or the FRB, and are examined at periodic intervals by the OCC and the FRB.
U.S. banking subsidiaries. We indirectly own and control one U.S. bank, MUFG Union Bank, N.A. (known prior to July 1, 2014 as Union Bank, N.A.), through MUFG Bank and its subsidiary, MUFG Americas Holdings, a registered bank holding company.
MUFG Union Bank is a national bank subject to the supervision, examination and regulatory authority of the OCC pursuant to the National Bank Act.
63
Table of Contents
In regulating national banks such as MUFG Union Bank, the OCC has the power to examine those banks; approve or deny applications for new charters, branches, capital, or other changes in corporate or banking structure; take supervisory actions against national banks that do not comply with laws and regulations or that otherwise engage in unsound practices; remove officers and directors, negotiate agreements to change banking practices, and issue cease and desist orders as well as civil money penalties; and issue rules and regulations, legal interpretations, and corporate decisions governing investments, lending, and other practices. The OCC’s staff of bank examiners conducts on-site reviews and provides sustained supervision of national banks. Examiners analyze loan and investment portfolios, funds management, capital, earnings, liquidity, and sensitivity to market risk for national banks. Examiners also review internal controls, internal and external audit, and compliance with law, and evaluate management’s ability to identify and control risk.
In addition, the FDIC insures the deposits of MUFG Union Bank up to legally specified maximum amounts. In the event of a failure of an FDIC-insured bank, the FDIC is virtually certain to be appointed as receiver, and would resolve the failure under provisions of the Federal Deposit Insurance Act. In the liquidation or other resolution of a failed FDIC-insured depository institution, deposits in its U.S. offices and other claims for administrative expenses and employee compensation are afforded priority over other general unsecured claims, including deposits in offices outside the United States, non-deposit claims in all offices and claims of a parent company. Moreover, under longstanding FRB policy, a bank holding company is expected to act as a source of financial strength for its banking subsidiaries and to commit resources to support such banks.
Bank capital requirements and capital distributions . MUFG Union Bank is subject to applicable risk-based and leverage capital guidelines issued by U.S. regulators for banks and bank holding companies. In addition, MUFG Bank and Mitsubishi UFJ Trust and Banking, as foreign banking organizations that have U.S. branches and agencies and that are controlled by us, are subject to the FRB’s requirements that they be “well-capitalized” based on Japan’s risk based capital standards. MUFG Union Bank, MUFG Bank, Mitsubishi UFJ Trust and Banking, and MUFG Americas Holdings are all “well capitalized” as defined under, and otherwise comply with, all U.S. regulatory capital requirements applicable to them. The Federal Deposit Insurance Corporation Improvement Act of 1991, or FDICIA, provides, among other things, for expanded regulation of insured depository institutions, including banks, and their parent holding companies. As required by FDICIA, the federal banking agencies have established five capital tiers ranging from “well capitalized” to “critically undercapitalized” for insured depository institutions. As an institution’s capital position deteriorates, the federal banking regulators may take progressively stronger actions, such as further restricting affiliate transactions, activities, asset growth or interest payments. In addition, FDICIA generally prohibits an insured depository institution from making capital distributions, including the payment of dividends, or the payment of any management fee to its holding company, if the insured depository institution would be undercapitalized after making such distribution or paying such dividend or fee.
The availability of dividends from insured depository institutions in the United States is limited by various other statutes and regulations. The National Bank Act and other federal laws prohibit the payment of dividends by a national bank under various circumstances and limit the amount a national bank can pay without the prior approval of the OCC. In addition, state-chartered banking institutions are subject to dividend limitations imposed by applicable federal and state laws.
Other regulated U.S. subsidiaries. Our non-bank subsidiaries that engage in securities-related activities in the United States are regulated by appropriate functional regulators, such as the SEC, any self-regulatory organizations of which they are members, and the appropriate state regulatory agencies. These non-bank subsidiaries are required to meet separate minimum capital standards as imposed by those regulatory authorities.
Anti-Money Laundering Initiatives, the Bank Secrecy Act and the USA PATRIOT Act . A major focus of U.S. governmental policy relating to financial institutions in recent years has been, and continues to be, aimed at preventing money laundering and terrorist financing. The USA PATRIOT Act of 2001, as incorporated into the Bank Secrecy Act, substantially broadened the scope of U.S. anti-money laundering laws and regulations by imposing significant new compliance and due diligence obligations, creating new crimes and penalties and
64
Table of Contents
expanding the extra-territorial jurisdiction of the United States. The U.S. Department of the Treasury has issued a number of regulations that impose obligations on financial institutions to maintain appropriate policies, procedures and controls to detect, prevent and report potential money laundering and terrorist financing, including the collection of beneficial ownership information. The bank regulatory agencies carefully scrutinize the adequacy of an institution’s compliance with these regulations and, as a result, there have been an increased number of regulatory enforcement actions. A financial institution’s failure to maintain and implement adequate policies, procedures and controls to prevent and detect money laundering and terrorist financing could have serious legal and reputational consequences for the institution, including the incurrence of expenses to enhance the relevant programs, the imposition of limitations on the scope of its operations and the imposition of fines and other monetary penalties. See “Item 3.D. Key Information—Risk Factors—Risks Related to Our Business—We may become subject to regulatory actions or other legal proceedings relating to our transactions or other aspects of our operations, which could result in significant financial losses, restrictions on our operations and damage to our reputation.”
Foreign Corrupt Practices Act. In recent years, U.S. regulatory and enforcement agencies including the SEC and the U.S. Department of Justice have significantly increased their enforcement efforts of the Foreign Corrupt Practices Act, or the FCPA. The FCPA prohibits U.S. securities issuers, U.S. domestic entities, and parties doing substantial business within the United States (including their shareholders, directors, agents, officers, and employees) from giving, offering, or promising anything of value to foreign public officials in order to obtain or retain any business advantage. The FCPA also requires U.S. securities issuers to maintain adequate books and records in such a way that they fairly reflect all transactions and dispositions of assets. Enforcement efforts have targeted a wide range of U.S. and foreign-based entities and have been based on a broad variety of alleged fact patterns, and in a number of cases have resulted in the imposition of substantial criminal and civil penalties or in agreed payments in settlement of alleged violations. Failure to maintain adequate anti-bribery policies, procedures, internal controls, and books and records globally could have serious legal and reputational consequences for the institution, including the incurrence of expenses to enhance the relevant programs, as well as the imposition of civil and criminal penalties.
Regulatory Reform Legislation. In response to the global financial crisis and the perception that lax supervision of the financial industry in the United States may have been a contributing cause, legislation designed to reform the system for supervision and regulation of financial firms doing business in the United States, the so-called Dodd-Frank Act, was signed into law on July 21, 2010. The Dodd-Frank Act is complex and extensive in its coverage and contains a wide range of provisions that affect financial institutions operating in the United States, including our U.S. operations. Included among these provisions are sweeping reforms designed to reduce systemic risk presented by very large financial firms, promote enhanced supervision, regulation, and prudential standards for financial firms, establish comprehensive supervision of financial markets, impose new limitations on permissible financial institution activities and investments, expand regulation of the derivatives markets, protect consumers and investors from financial abuse, and provide the government with the tools needed to manage a financial crisis. Key provisions that impact our operations are summarized below. However, certain regulatory rules under the Dodd-Frank Act are not yet finalized, require further interpretive guidance by the relevant supervisory agencies, or do not yet require us to fully implement compliance procedures. Accordingly, while the legislation has an impact on our operations, including the imposition of significant compliance costs, we are unable to assess with certainty the full degree of impact of the Dodd-Frank Act on our operations at this time.
Among the components of the Dodd-Frank Act that have impacted or may impact our operations are the provisions relating to enhanced prudential standards, including capital, liquidity and structural requirements, the “Volcker Rule,” derivatives regulation, credit reporting, resolution plans, incentive-based compensation, the establishment of the Consumer Financial Protection Bureau, and debit interchange fees. Although certain of the regulatory rules regarding the foregoing components are still pending, as noted above, based on information currently available to us, other than the Volcker Rule and derivatives regulations as discussed below, the impact of these components is expected to be mainly limited to our U.S. operations and not to be material to us on a
65
Table of Contents
consolidated basis. We intend to continue to monitor developments relating to the Dodd-Frank Act and the potential impact on our activities inside and outside of the United States.
With respect to the Dodd-Frank Act provisions related to enhanced prudential standards, in February 2014 the FRB issued final rules that established enhanced prudential standards for the U.S. operations of foreign banking organizations such as MUFG. These rules required us to organize by July 1, 2016 all of our U.S. bank and non-bank subsidiaries, with certain limited exceptions, under a U.S. IHC that is subject to U.S. capital requirements and enhanced prudential standards comparable to those applicable to top-tier U.S. bank holding companies of the same size. Under these rules, we were required to change the structure of our U.S. operations, including the manner in which we oversee and manage those operations, and may be required to inject additional capital into our U.S. operations. We have designated MUFG Americas Holdings as our IHC.
MUFG Americas Holdings is subject to various U.S. prudential requirements and has become subject to others with the designation of MUFG Americas Holdings as our IHC as of July 1, 2016. MUFG Americas Holdings was previously subject to risk-based and leverage capital requirements, liquidity requirements, and other enhanced prudential standards applicable to large U.S. bank holding companies. MUFG Americas Holdings was also subject to capital planning and stress testing requirements. MUFG Americas Holdings is now subject to the capital planning and stress testing requirements and certain enhanced prudential standards applicable to IHCs. On June 22, 2017, the FRB released the results of the 2017 Dodd-Frank Act stress tests. It found that, even in the severely adverse economic stress test scenario, MUFG Americas Holdings would maintain capital ratios well above the required minimum levels. On June 28, 2017, the FRB announced that it had no objections to the capital plan submitted by MUFG Americas Holdings as part of the 2017 Comprehensive Capital Analysis and Review, or CCAR. The FRB announced early in 2017 that MUFG Americas Holdings would not be subject to the qualitative portion of the CCAR.
The FRB has the authority to examine an IHC and any of its subsidiaries. U.S. leverage requirements applicable to the IHC took effect beginning in January 2018. MUFG Americas Holdings is subject to a requirement to maintain an LCR equal to at least 100% based on total projected net cash outflows over a 30-calendar day period, effectively using net cash outflow assumptions equal to 70% of the outflow assumptions prescribed for internationally active banking organizations. Our combined U.S. operations, including MUFG Bank’s and Mitsubishi UFJ Trust and Banking’s branches, are also subject to certain requirements related to liquidity and risk management.
The Volcker Rule was issued in final form by the Federal Reserve in December 2013. Under the Volcker Rule, we are required to cease conducting certain proprietary trading activities, which means trading in securities and financial instruments for our own account, subject to certain exceptions, including market-making, hedging, and underwriting activities if such activities are conducted within a rigorous compliance framework. We are also restricted from engaging in certain activities regarding hedge funds and private equity funds, or covered funds. While the Volcker Rule excludes restrictions on such activities conducted solely outside of the United States, the regulatory definition of such exempted activities is narrow and complex and in some cases requires further clarification. Our proprietary trading and covered funds activities are generally executed outside of the United States, but certain activities within the United States could potentially have fallen within the scope of the Rule. We have undertaken steps that we believe are appropriate to bring our activities and investments into compliance with the Rule. In June 2018, the five Volcker Rule agencies each subsequently approved a notice of proposed rulemaking seeking comments and proposing certain modifications to certain aspects of the Volcker Rule. Although we are continuing to consider the effect of any proposed changes, given the limited amount of restricted activities in which we engage within the United States, we do not expect any final changes to the Volcker Rule to be material to our operations.
U.S. regulators continue to issue final regulations and regulatory determinations governing swaps and derivatives markets as contemplated by the Dodd-Frank Act. To date, MUFG Bank and Mitsubishi UFJ Securities International, plc, have registered as swap dealers with the U.S. Commodity Futures Trading Commission, or CFTC. Depending on the finalization of regulations and regulatory determinations governing
66
Table of Contents
swaps and derivatives markets under the Dodd-Frank Act, as well as the activities of our other subsidiaries located inside and outside of the United States, our other subsidiaries may have to register as swap dealers with, or be subject to the regulations of, the CFTC and/or SEC. Regulation of swap dealers by the CFTC and SEC imposes numerous corporate governance, business conduct, capital, margin, reporting, clearing, execution, and other regulatory requirements on our operations, which may adversely impact our derivatives businesses and make us less competitive than those competitors that are not subject to the same regulations. Although many regulations applicable to swap dealers are already in effect, it is difficult to assess the full impact of these requirements because some of the most important regulatory determinations have not yet been implemented or finalized. For example, U.S. regulators have adopted guidance and rules on the application of U.S. regulations to activities of registered swap dealers outside of the United States. The extraterritorial application of swap dealer regulatory requirements imposes significant operational and compliance burdens on our swaps activities outside of the United States.
On June 14, 2018, the FRB approved a final rule regarding single counterparty credit limits, or SCCL, for large banking organizations. The SCCL final rule is considered the last major piece of regulatory action needed to implement Section 165(e) of the Dodd-Frank Act. Section 165(e) was a response to the concern that failure or financial distress of one large, interconnected financial institution could cascade through the U.S. financial system and impair the financial condition of that firm’s counterparties, including other large, interconnected firms. Section 165(e) generally, and the SCCL final rule specifically, seek to mitigate this risk by limiting the aggregate exposure among such financial institutions and their counterparties. The deadlines for compliance with the requirements of the final rule are in 2020. We are currently implementing a risk and compliance program to satisfy the requirements as they relate to MUFG Americas Holdings, and we are continuing to analyze the requirements of the final rule and its impact on the combined U.S. operations of MUFG.
On April 8, 2019, the FRB issued two proposals that would (1) tailor the framework for application of enhanced prudential standards to foreign banking organizations and (2) modify the application of capital and liquidity requirements to the U.S. operations of foreign banking organizations. The proposals utilize the same framework as the October 2018 proposal applicable to U.S. BHCs but with a differing calibration for foreign banking organizations.
The first proposal, promulgated solely by the FRB, would determine the applicability of certain enhanced prudential standards requirements, including liquidity stress testing and management, capital planning and stress testing, risk management, single counterparty credit limits requirements, and related regulatory reporting by categorizing all foreign banking organizations with $100 billion or more in combined U.S. assets into three categories. The second proposal, to be issued jointly by the FRB, the OCC, and the FDIC, would similarly categorize foreign banking organizations and tailor the application of the agencies’ regulatory capital and standardized liquidity requirements on that basis. The comment period for both proposals ended on June 21, 2019. The final rule is expected to take effect at the same time as the domestic proposal currently on November 20, 2019.
The FRB also approved a third proposal, to be jointly issued with the FDIC, that would revise the joint regulation implementing the resolution planning requirements of Section 165(d) of the Dodd-Frank Act. The comment period ended on June 21, 2019, and the final rule is proposed to take effect on November 20, 2019.
Foreign Account Tax Compliance Act. The Hiring Incentives to Restore Employment Act was enacted in March 2010 and contains provisions commonly referred to as the Foreign Account Tax Compliance Act, or FATCA. The U.S. Treasury, acting through the Internal Revenue Service, or the IRS, issued final FATCA regulations in January 2013. FATCA created a new reporting and withholding regime for U.S. and foreign financial institutions, or FFIs, and certain non-financial foreign entities, or NFFEs.
In addition, the FATCA framework has been expanded with the introduction of Intergovernmental Agreements between the U.S. Treasury and foreign governments, which pursue a framework for
67
Table of Contents
intergovernmental cooperation to facilitate the implementation of FATCA. The United States has entered into various Intergovernmental Agreements with non-U.S. jurisdictions including Japan. FATCA and the Intergovernmental Agreements became effective from July 1, 2014.
In connection with FATCA, we have assessed and determined if our group entities are U.S. withholding agents, FFIs, or NFFEs. Each identified U.S. withholding agent and FFI has also evaluated pre-existing and new entity accounts to the extent required to determine their respective FATCA classifications. We have continuously developed internal procedures and processes that we believe address the regulatory requirements under FATCA.
However, FATCA compliance has required us to develop extensive systems capabilities and internal processes to identify and report U.S. account holders who are subject to FATCA requirements, which has been a complex and costly process requiring significant internal resources. If our procedures and processes are determined not to be adequate to meet the requirements of FATCA, we could potentially be subject to serious legal and reputational consequences, including the imposition of withholding taxes on certain amounts payable to us from U.S. sources, and could be required to expend additional resources to enhance our systems, procedures and processes and take other measures in response to such consequences.
Capital Adequacy . MUFG Americas Holdings and MUFG Union Bank are required to maintain minimum capital ratios in accordance with rules issued by the U.S. Federal banking agencies. In July 2013, the U.S. Federal banking agencies issued final rules to implement the Basel Committee on Banking Supervision’s capital guidance for U.S. banking organizations, or U.S. Basel III. These rules establish more restrictive capital definitions, create additional categories and higher risk weightings for certain asset classes and off-balance sheet exposures, higher minimum capital and leverage ratios and capital conservation buffers that will be added to the minimum capital requirements. These rules supersede the U.S. federal banking agencies’ general risk-based capital rules generally referred to as Basel I, the advanced approaches rules generally referred to as Basel II, which are applicable to certain large banking organizations, and leverage rules, and are subject to certain transition provisions. MUFG Americas Holdings became subject to the U.S. Basel III capital rules in January 2015, with certain provisions subject to a phase-in period, while MUFG Union Bank continues to be subject to the U.S. Basel III capital rules which became effective for advanced approaches institutions on January 1, 2014. The U.S. Basel III capital rules were substantially phased in by January 1, 2019.
Both MUFG Americas Holdings and MUFG Union Bank are subject to the following regulatory minimum risk-based capital ratios: (1) 4.5% Common Equity Tier 1 capital ratio, (2) 6.0% Tier 1 capital ratio and (3) 8.0% total capital ratio. Failure to meet minimum capital requirements can result in certain mandatory, and possibly additional discretionary, actions by regulators that, if undertaken, could have a material effect on MUFG Americas Holdings’ consolidated financial statements.
In addition to these regulatory minimum ratio requirements, MUFG Americas Holdings and MUFG Union Bank are subject to a fully phased-in capital conservation buffer requirement of 2.5%. MUFG Americas Holdings and MUFG Union Bank are also subject to a Tier 1 leverage ratio regulatory minimum requirement of 4% and a well-capitalized prompt corrective action standard of 5%.
In October 2015, the FRB proposed long-term debt and TLAC requirements for U.S. globally systemically important bank holding companies and U.S. IHCs of non-U.S. globally systemically important banks, including MUFG Americas Holdings. In December 2016, the FRB finalized rules imposing such requirements. Under the final rules, a covered IHC such as MUFG Americas Holdings is required to maintain a minimum amount of eligible long-term debt issued to a non-U.S. parent entity that could be cancelled or converted to equity in order to absorb losses and recapitalize the IHC’s operating subsidiaries at or near the point of resolution. A covered IHC is also required to maintain a minimum level of eligible TLAC issued to a non-U.S. parent entity consisting of regulatory capital and eligible long-term debt and maintain related buffers consisting of Common Equity Tier 1 capital. In addition, an IHC is restricted from issuing short-term debt and certain other types of liabilities that are structurally senior to eligible long-term debt. MUFG Americas Holdings became subject to these rules on
68
Table of Contents
January 1, 2019. Pursuant to 12 CFR § 252.164(a), we have certified to the FRB that we plan to follow an SPE resolution strategy, and that MUFG Americas Holdings would therefore be considered a “non-resolution covered IHC.”
For more information, see “Item 5.B. Operating and Financial Review and Prospects—Liquidity and Capital Resources—Capital Adequacy” and Note 22 to our audited consolidated financial statements included elsewhere in this Annual Report.
Disclosure pursuant to Section 13(r) of the US Securities Exchange Act of 1934
Section 13(r) of the U.S. Securities Exchange Act of 1934 (Exchange Act) requires an issuer to disclose whether it or any of its affiliates knowingly engaged in certain activities, transactions or dealings relating to Iran or with natural persons or entities designated by the U.S. government under specified Executive Orders. The scope of activities that must be reported includes activities not prohibited by U.S. law and conducted outside the United States in compliance with applicable local law.
During the fiscal year ended March 31, 2019, one of our non-U.S. subsidiaries engaged in business activities with entities in, or affiliated with, Iran, including counterparties owned or controlled by the Iranian government. Specifically, our non-U.S. banking subsidiary, MUFG Bank, issued letters of credit and guarantees and provided remittance and other settlement services mainly in connection with customer transactions related to the purchase and exportation of Iranian crude oil to Japan, and in some cases, in connection with other petroleum-related transactions with Iran by its customers. These transactions did not involve U.S. dollars nor clearing services of U.S. banks for the settlement of payments. For the fiscal year ended March 31, 2019, the aggregate interest and fee income relating to these transactions was less than ¥100 million, representing less than 0.005 percent of our total interest and fee income. Some of these transactions were conducted through the use of non-U.S. dollar correspondent accounts and other similar settlement accounts maintained with MUFG Bank outside the United States by Iranian financial institutions and other entities in, or affiliated with, Iran. In addition to such accounts, MUFG Bank receives deposits in Japan from, and provides settlement services in Japan to, fewer than 10 Iranian government-related entities and fewer than 100 Iranian government-related individuals such as Iranian diplomats in Japan, and maintains settlement accounts outside the United States for certain other financial institutions specified in Executive Order 13382, which settlement accounts were frozen in accordance with applicable laws and regulations. For the fiscal year ended March 31, 2019, the average aggregate balance of deposits held in these accounts represented less than 0.1 percent of the average balance of our total deposits. The fee income from the transactions attributable to these account holders was less than ¥20 million, representing less than 0.005 percent of our total fee income. Although there was no outstanding balance as of March 31, 2019, MUFG Bank had, during the fiscal year ended March 31, 2019, loans that were arranged prior to changes in applicable laws and regulations to borrowers in, or affiliated with, Iran, including entities owned by the Iranian government. For the fiscal year ended March 31, 2019, the agent fee income relating to these loan transactions was less than ¥20 million, representing less than 0.005 percent of our total interest and fee income.
MUFG Bank recognizes that following the withdrawal in May 2018 by the United States from the Joint Comprehensive Plan of Action, the United States has imposed secondary sanctions against non-U.S. persons who engage in or facilitate a broad range of transactions and activities involving Iran. MUFG Bank has taken the recent sanctions related developments into account and monitor any future transactions relating to Iran in order to comply with applicable U.S. and Japanese regulations as well as U.S., Japanese and other international sanctions.
69
Table of Contents
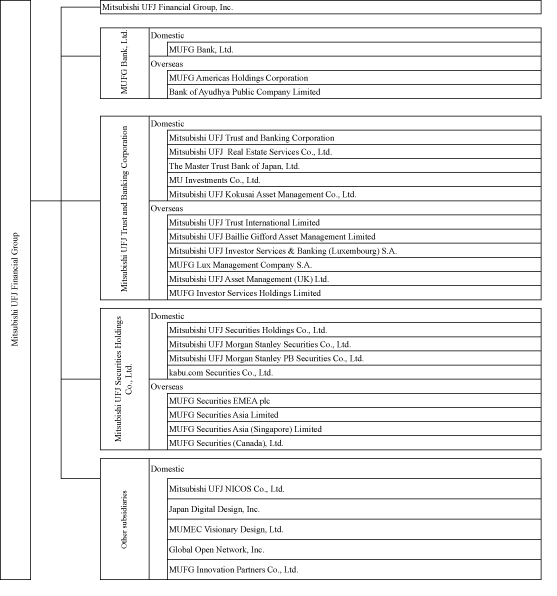
Table of Contents
Set forth below is a list of our principal consolidated subsidiaries as of March 31, 2019:
|
Name |
Country of
Incorporation |
Proportion of
Ownership Interest (%) |
Proportion of
Voting Interest (%) |
|||||||
|
MUFG Bank, Ltd. |
Japan | 100.00 | % | 100.00 | % | |||||
|
Mitsubishi UFJ Trust and Banking Corporation |
Japan | 100.00 | % | 100.00 | % | |||||
|
Mitsubishi UFJ Real Estate Services Co., Ltd. |
Japan | 100.00 | % | 100.00 | % | |||||
|
The Master Trust Bank of Japan, Ltd. |
Japan | 46.50 | % | 46.50 | % | |||||
|
MU Investments Co., Ltd. |
Japan | 100.00 | % | 100.00 | % | |||||
|
Mitsubishi UFJ Kokusai Asset Management Co., Ltd. |
Japan | 100.00 | % | 100.00 | % | |||||
|
Mitsubishi UFJ Securities Holdings Co., Ltd. |
Japan | 100.00 | % | 100.00 | % | |||||
|
Mitsubishi UFJ Morgan Stanley Securities Co., Ltd. |
Japan | 60.00 | % | 60.00 | % | |||||
|
Mitsubishi UFJ Morgan Stanley PB Securities Co., Ltd. |
Japan | 100.00 | % | 100.00 | % | |||||
|
kabu.com Securities Co., Ltd. |
Japan | 59.28 | % | 59.29 | % | |||||
|
Mitsubishi UFJ NICOS Co., Ltd. |
Japan | 100.00 | % | 100.00 | % | |||||
|
Japan Digital Design, Inc. |
Japan | 86.11 | % | 86.11 | % | |||||
|
MUMEC Visionary Design, Ltd. |
Japan | 60.00 | % | 60.00 | % | |||||
|
Global Open Network, Inc. |
Japan | 80.00 | % | 80.00 | % | |||||
|
MUFG Innovation Partners Co., Ltd. |
Japan | 100.00 | % | 100.00 | % | |||||
|
MUFG Americas Holdings Corporation |
USA | 100.00 | % | 100.00 | % | |||||
|
Bank of Ayudhya Public Company Limited |
Thailand | 76.88 | % | 76.88 | % | |||||
|
MUFG Bank (China), Ltd. |
China | 100.00 | % | 100.00 | % | |||||
|
MUFG Bank (Malaysia) Berhad |
Malaysia | 100.00 | % | 100.00 | % | |||||
|
MUFG Bank (Europe) N.V. |
Netherlands | 100.00 | % | 100.00 | % | |||||
|
Mitsubishi UFJ Trust International Limited |
UK | 100.00 | % | 100.00 | % | |||||
|
Mitsubishi UFJ Baillie Gifford Asset Management Limited |
UK | 51.00 | % | 51.00 | % | |||||
|
Mitsubishi UFJ Investor Services & Banking (Luxembourg) S.A. |
Luxembourg | 100.00 | % | 100.00 | % | |||||
|
MUFG Lux Management Company S.A. |
Luxembourg | 100.00 | % | 100.00 | % | |||||
|
Mitsubishi UFJ Asset Management (UK) Ltd. |
UK | 100.00 | % | 100.00 | % | |||||
|
MUFG Investor Services Holdings Limited |
Bermuda | 100.00 | % | 100.00 | % | |||||
|
MUFG Securities EMEA plc |
UK | 100.00 | % | 100.00 | % | |||||
|
MUFG Securities Asia Limited |
China | 100.00 | % | 100.00 | % | |||||
|
MUFG Securities Asia (Singapore) Limited |
Singapore | 100.00 | % | 100.00 | % | |||||
|
MUFG Securities (Canada), Ltd. |
Canada | 100.00 | % | 100.00 | % | |||||
| D. |
Property, Plant and Equipment |
Premises and equipment as of March 31, 2018 and 2019 consisted of the following:
| As of March 31, | ||||||||
| 2018 | 2019 | |||||||
| (in millions) | ||||||||
|
Land |
¥ | 370,669 | ¥ | 362,742 | ||||
|
Buildings |
739,665 | 829,606 | ||||||
|
Equipment and furniture |
659,699 | 648,598 | ||||||
|
Leasehold improvements |
311,645 | 305,281 | ||||||
|
Construction in progress |
119,195 | 34,002 | ||||||
|
|
|
|
|
|||||
|
Total |
2,200,873 | 2,180,229 | ||||||
|
Less accumulated depreciation |
1,187,285 | 1,206,629 | ||||||
|
|
|
|
|
|||||
|
Premises and equipment—net |
¥ | 1,013,588 | ¥ | 973,600 | ||||
|
|
|
|
|
|||||
71
Table of Contents
Our registered address is 7-1, Marunouchi 2-chome, Chiyoda-ku, Tokyo 100-8330, Japan. As of March 31, 2019, we and our subsidiaries conducted our operations either in premises we owned or in properties we leased.
The following table presents the book values of our material offices and other properties as of March 31, 2019:
| Book Value | ||||
| (in millions) | ||||
|
Owned land |
¥ | 362,742 | ||
|
Owned buildings |
258,711 | |||
The buildings and land we own are primarily used by us and our subsidiaries as offices and branches. Most of the buildings and land we own are free from material encumbrances.
During the fiscal year ended March 31, 2019, we invested approximately ¥126,479 million in premises and equipment, primarily for office renovations and relocation.
| Item 4A. |
Unresolved Staff Comments. |
None.
72
Table of Contents
| Item 5. |
Operating and Financial Review and Prospects. |
The following discussion and analysis should be read in conjunction with “Item 3.A. Key Information—Selected Financial Data,” “Selected Statistical Data” and our consolidated financial statements and related notes included elsewhere in this Annual Report.
| Page | ||||||
| 74 | ||||||
| 76 | ||||||
| 81 | ||||||
| 84 | ||||||
|
Accounting Changes and Recently Issued Accounting Pronouncements |
86 | |||||
|
A. |
Operating Results | 87 | ||||
| 87 | ||||||
| 96 | ||||||
| 103 | ||||||
|
Effect of Change in Exchange Rates on Foreign Currency Translation |
105 | |||||
|
B. |
Liquidity and Capital Resources | 105 | ||||
| 105 | ||||||
| 131 | ||||||
| 136 | ||||||
|
C. |
Research and Development, Patents and Licenses, etc. | 137 | ||||
|
D. |
Trend Information | 137 | ||||
|
E. |
Off-Balance Sheet Arrangements | 137 | ||||
|
F. |
Tabular Disclosure of Contractual Obligations | 138 | ||||
|
G. |
Safe Harbor | 138 | ||||
73
Table of Contents
Through our subsidiaries and affiliated companies, we engage in a broad range of financial businesses and services, including commercial banking, investment banking, trust assets and asset management services, securities businesses and credit card businesses, and provide related services to individuals primarily in Japan, the United States and Thailand and to corporate customers around the world. Our results of operations and financial condition are exposed to changes in various external economic factors, including:
| • |
general economic conditions, |
| • |
interest rates, |
| • |
foreign currency exchange rates, and |
| • |
stock and real estate prices. |
General Economic Conditions
During the fiscal year ended March 31, 2019, the global economy stayed on a moderately improving trend. Uncertainties grew, however, concerning future global economic trends in light of recent changes in economic, monetary and trade policies and geopolitical developments in various jurisdictions, which have contributed to higher volatility in the financial market.
Japan’s economic growth continued at a moderate pace, while showing a mixture of positive and negative trends, with the quarter-on-quarter real gross domestic product, or GDP, growth rate being 0.6% for the quarters ended June 30, 2018, negative 0.6% for the quarters ended September 30, 2018, and 0.5% for the quarter ended December 31, 2018, and 0.6% for the quarter ended March 31, 2019. The year-over-year real GDP growth rate was 1.5% for the quarter ended June 30, 2018, 0.1% for the quarter ended September 30, 2018, 0.3% for the quarter ended December 31, 2018 and 0.9% for the quarter ended March 31, 2019. Japan’s Consumer Price Index, or CPI, fluctuated between negative 0.3% and positive 0.5% on a month-on-month basis and between 0.2% and 1.4% on a year-over-year basis during the fiscal year ended March 31, 2019. During the same period, the unemployment rate in Japan remained low, fluctuating between 2.3% and 2.5%. According to Teikoku Databank, a Japanese research institution, the number of companies that filed for legal bankruptcy in Japan during the fiscal year ended March 31, 2019 was 8,057, a 2.8% decrease from the previous fiscal year. The total liabilities of companies that filed for legal bankruptcy during the fiscal year ended March 31, 2019 were ¥1,554 billion, a 40% decrease from the previous fiscal year. The Japanese economy remains subject to continuing deflationary pressure, increasing public debt, intensifying trade conflicts and global competition, declining domestic population, stagnant private consumption which may further decline once the consumption tax rate is raised from 8.0% to 10.0% in October 2019 as currently expected, and various other factors that could adversely affect its economic conditions.
The U.S. economy expanded with the quarter-on-quarter annualized real GDP growth rate being 4.2% for the quarter ended June 30, 2018, 3.4% for the quarter ended September 30, 2018, 2.2% for the quarter ended December 31, 2018 and 3.1% for the quarter ended March 31, 2019. The year-over-year real GDP growth rate was 2.9% for the quarter ended June 30, 2018, 3.0% for the quarter ended September 30, 2018, 3.0% for the quarter ended December 31, 2018 and 3.2% for the quarter ended March 31, 2019. The U.S. economic growth was supported by the improvement in the labor market, higher wages and increased corporate production activities. During the fiscal year ended March 31, 2019, the unemployment rate in the U.S. fluctuated between 3.7% and 4.0%. However, the long-term prospects of the U.S. economy remain uncertain in light of the changes in the government’s economic, monetary, trade and foreign relations policies under the Trump administration, and various other factors.
The Eurozone’s economic growth continued at a slow rate with the quarter-on-quarter real GDP growth rate being 0.4% for the quarter ended June 30, 2018, 0.1% for the quarter ended September 30, 2018, 0.2% for the
74
Table of Contents
quarter ended December 31, 2018 and 0.4% for the quarter ended March 31, 2019. The year-over-year real GDP growth rate was 2.2% for the quarter ended June 30, 2018, 1.7% for the quarter ended September 30, 2018, 1.2% for the quarter ended December 31, 2018 and 1.2% for the quarter ended March 31, 2019. During the fiscal year ended March 31, 2019, the unemployment rate in the Eurozone declined to 7.7% for March 2019. There are still uncertainties in the Eurozone economy, including the process and ramifications of the United Kingdom’s withdrawal from the European Union and the large accumulation of non-performing loans in some European peripheral countries.
In Asia excluding Japan, economic conditions in ASEAN (Association of Southeast Asian Nations) and NIEs (Newly Industrialized Economies) generally improved but the economic growth remained relatively modest during the fiscal year ended March 31, 2019. In China, economic conditions continued to improve at a moderate pace during the fiscal year, with some downward pressure on economic growth resulting from remaining structural adjustments. China’s quarter-on-quarter real GDP growth rate was 1.7% for the quarter ended June 30, 2018, 1.6% for the quarter ended September 30, 2018, 1.5% for the quarter ended December 31, 2018 and 1.4% for the quarter ended March 31, 2019. China’s year-over-year real GDP growth rate was 6.7% for the quarter ended June 30, 2018, 6.5% for the quarter ended September 30, 2018, 6.4% for the quarter ended December 31, 2018 and 6.4% for the quarter ended March 31, 2019. The Thai economy was on a gradually stabilizing trend during the fiscal year ended March 31, 2019, with varying degrees of impact on the financial conditions of consumers and small and medium-sized enterprises. Thailand’s quarter-on-quarter real GDP growth rate was 1.1% for the quarter ended June 30, 2018, negative 0.4% for the quarter ended September 30, 2018, 0.9% for the quarter ended December 31, 2018 and 1.0% for the quarter ended March 31, 2019. Thailand’s year-over-year real GDP growth rate was 4.7% for the quarter ended June 30, 2018, 3.2% for the quarter ended September 30, 2018, 3.6% for the quarter ended December 31, 2018 and 2.8% for the quarter ended March 31, 2019. Although there are some signs of further economic growth in ASEAN and NIEs, such as growth in exports to developed countries and larger investments in infrastructure projects in the region, uncertainties still remain in light of, among other things, intensifying trade conflicts and potential geopolitical issues.
Interest Rates
Interest rates remained at historically low levels in Japan under the Bank of Japan’s monetary policy. The yield on 10-year Japanese government bonds fluctuated between negative 0.090% and positive 0.161% during the fiscal year ended March 31, 2019. The Bank of Japan adopted its “quantitative and qualitative monetary easing” policy in April 2014 and commenced its “quantitative and qualitative monetary easing with negative interest rates” policy in January 2016. Under this policy, aiming to achieve the price stability target of 2.0%, the Bank of Japan applied a negative interest rate of minus 0.1% to the “Policy-Rate Balances,” which are a part of current account amounts held by financial institutions at the Bank of Japan, while increasing the Bank of Japan’s aggregate holding of Japanese government bonds by approximately ¥80 trillion each year. In September 2016, the Bank of Japan announced a new “quantitative and qualitative monetary easing with yield curve control” policy, adding to its monetary policy a Japanese government bond purchase program with an aim to keep the yield of 10-year Japanese government bonds around zero percent. In July 2018, the Bank of Japan slightly its modified monetary policy by adopting forward guidance on interest rates and adding language in its policy statement that long-term interest rates may fluctuate depending on economic and price developments. The yield on 10-year Japanese government bonds was 0.049% on March 30, 2018 and negative 0.081% on March 29, 2019. The yield currently fluctuates around negative 0.158%.
In the United States, the FRB raised the target range for the federal funds rate to between1.75% and 2.00% in June 2018, to between2.00% and 2.25% in September 2018, and further to between 2.25% and 2.50% in December 2018. However, following the Federal Open Market Committee in June 2019, several FRB members implied their willingness to reduce the rate at least by 25 basis points by the end of the calendar year 2019 in light of increasing uncertainty in the economic outlook. The 10-year U.S. Treasury bond yield decreased from 2.74% at the end of March 2018 to 2.406% at the end of March 2019, while fluctuating between 2.368% and 3.238% during the period. The yield currently fluctuates around 2.006%.
75
Table of Contents
The yield on 10-year German Bunds decreased from positive 0.497% at the end of March 2018 to negative 0.07% as of March 29, 2019, while fluctuating between negative 0.081% and positive 0.645% during the period. The yield currently fluctuates around negative 0.327%. The yield on 10-year French Obligations Assimilables du Trésor decreased from 0.721% at the end of March 2018 to 0.318% as of March 29, 2019, while fluctuating between 0.301% and 0.907% during the period. The yield currently fluctuates around negative 0.005%.
Foreign Currency Exchange Rates
The Japanese yen depreciated against the U.S. dollar from ¥106.28 to the U.S. dollar as of March 30, 2018 to ¥110.86 to the U.S. dollar as of March 29, 2019, while fluctuating between ¥105.89 to the U.S. dollar and ¥114.53 to the U.S. dollar during the period. The Japanese yen has since been fluctuating around ¥107.85 to the U.S. dollar.
The Japanese yen was on a generally appreciating trend against the euro during the fiscal year ended March 31, 2019, with the exchange rate being ¥124.35 to the euro as of March 29, 2019 compared to ¥130.97 to the euro as of March 30, 2018. The Japanese yen has been fluctuating around ¥122.66 to the euro since April 1, 2019.
The Japanese yen was on a generally depreciating trend against the Thai baht during the fiscal year ended March 31, 2019, with the exchange rate being ¥3.4929 to the Thai baht as of March 29, 2019 compared to ¥3.4076 to the Thai baht as of March 30, 2018. The Japanese yen has been fluctuating around ¥3.5162 to the Thai baht since April 1, 2019.
Stock and Real Estate Prices
The closing price of the Nikkei Stock Average, which is the average of 225 blue chip stocks listed on the Tokyo Stock Exchange, decreased from ¥21,454.30 on March 30, 2018 to ¥21,205.81 on March 29, 2019. The closing price of the Nikkei Stock Average reached ¥24,270.62, the highest closing price since November 1991, on October 2, 2018, and declined to ¥19,115.74 on December 25, 2018. The closing price of the Nikkei Stock Average has since risen and has been fluctuating around ¥21,275.92.
According to the latest land price survey conducted by the Japanese government, between January 1, 2018 and January 1, 2019, the average residential land price in Japan increased 0.6%, and the average commercial land price in Japan increased 2.8%. In the three major metropolitan areas of Tokyo, Osaka and Nagoya, between January 1, 2018 and January 1, 2019, the average residential land price increased 1.0% and the average commercial land price increased 5.1%. In the local regions of Japan, which consist of regions other than the three major metropolitan areas, between January 1, 2018 and January 1, 2019, the average residential land price increased 0.2% and the average commercial land price increased 1.0%.
Principal Sources of Income and Expenses
Net Interest Income
Net interest income is a function of:
| • |
the amount of interest-earning assets, |
| • |
the amount of interest-bearing liabilities, |
| • |
the general level of interest rates, |
| • |
the so-called “spread,” or the difference between the rate of interest earned on interest-earning assets and the rate of interest paid on interest-bearing liabilities, and |
| • |
the proportion of interest-earning assets financed by non-interest-bearing liabilities and equity. |
76
Table of Contents
Provision for (Reversal of) Credit Losses
Provision for (reversal of) credit losses is charged to operations to maintain the allowance for credit losses at a level deemed appropriate by management. For more information on our provision for (reversal of) credit losses and a description of the approach and methodology used to establish the allowance for credit losses, see “—B. Liquidity and Capital Resources—Financial Condition—Loan Portfolio—Allowance policy.”
Non-interest Income
Non-interest income consists of the following:
Fees and commissions income
Fees and commissions income consist of the following:
| • |
Fees and commissions on deposits consist of fees and commissions charged for ATM transactions and other deposit and withdrawal services. |
| • |
Fees and commissions on remittances and transfers consist of fees and commissions charged for settlement services such as domestic fund remittances, including those made through electronic banking. |
| • |
Fees and commissions on foreign trading business consist of fees and commissions charged for fund collection and financing services related to foreign trading business activities. |
| • |
Fees and commissions on credit card business consist of fees and commissions related to the credit card business such as interchange income, annual fees, royalty and other service charges from franchisees. |
| • |
Fees and commissions on security-related services primarily consist of fees and commissions for sales and transfers of securities, including investment funds, underwriting, brokerage and advisory services, securitization arrangement services, and agency services for the calculation and payment of dividends. |
| • |
Fees and commissions on administration and management services for investment funds primarily consist of fees and commissions earned on managing investment funds on behalf of clients. |
| • |
Trust fees consist primarily of fees earned on fiduciary asset management and administration services for corporate pension plans and investment funds. |
| • |
Guarantee fees consist of fees related to the guarantee business, including those charged for providing guarantees on residential mortgage loans and other loans. |
| • |
Insurance commissions consist of commissions earned by acting as an agent for insurance companies for the sale of insurance products. |
| • |
Fees and commissions on real estate business primarily consist of fees from real estate agent services. |
| • |
Other fees and commissions include various fees and commissions, such as arrangement fees and agent fees, other than the fees mentioned above. |
Net foreign exchange gains (losses)
Net foreign exchange gains (losses) consist of the following:
| • |
Net foreign exchange gains (losses) on derivative contracts are net gains (losses) primarily on currency derivative instruments entered into for trading purposes. For more information on our derivative contracts, see Note 24 to our consolidated financial statements included elsewhere in this Annual Report. |
| • |
Net foreign exchange gains (losses) on other than derivative contracts include foreign exchange trading gains (losses) as well as transaction gains (losses) on the translation into Japanese yen of monetary |
77
Table of Contents
|
assets and liabilities denominated in foreign currencies. The transaction gains (losses) on the translation into Japanese yen fluctuate from period to period depending upon the spot rates at the end of each fiscal year. In principle, all transaction gains (losses) on translation of monetary assets and liabilities denominated in foreign currencies are included in current earnings. |
| • |
Net foreign exchange gains (losses) related to the fair value option include transaction gains (losses) on the translation into Japanese yen of securities under the fair value option. For more information on the fair value option, see Note 32 to our consolidated financial statements included elsewhere in this Annual Report. |
Net trading account profits (losses)
Trading account assets and liabilities are carried at fair value and changes in the value of trading account assets and liabilities are recorded in net trading account profits (losses). Activities reported in our net trading account profits (losses) can generally be classified into two categories:
| • |
trading purpose activities, which are conducted mainly for the purpose of generating profits either through transaction fees or arbitrage gains and involve frequent and short-term selling and buying of securities, commodities or others; and |
| • |
trading account assets relating to the application of certain accounting rules, which are generally not related to trading purpose activities, but simply classified as trading accounts due to the application of certain accounting rules. |
Of the two categories, trading account assets relating to the application of certain accounting rules represent a larger portion of our trading account profits for the fiscal year ended March 31, 2019.
We generally do not separate, for financial reporting purposes, customer originated trading activities from non-customer related, proprietary trading activities. When an order for a financial product is placed by a customer, a dealer offers a price which includes certain transaction fees, often referred to as the “margin” to the market price. The margin is determined by considering factors such as administrative costs, transaction amount and liquidity of the applicable financial product. Once the customer agrees to the offered price, the deal is completed and the position is recorded in our ledger as a single entry without any separation of components. To manage the risk relating to the customer side position, we often enter into an offsetting transaction with the market. Unrealized gains and losses as of the period-end for both the customer side position and the market side position are recorded within the same trading account profits and losses.
Net trading account profits (losses) consist of net profits (losses) on interest rate and other derivative contracts and net profits (losses) on trading account securities, excluding derivatives.
Net profits (losses) on interest rate and other derivative contracts are reported for net profits (losses) on derivative instruments which primarily relate to trading purpose activities and include:
| • |
Interest rate contracts : Interest rate contracts are mainly utilized to manage interest rate risks which could arise from mismatches between assets and liabilities resulting from customer originated trading activities; |
| • |
Equity contracts : Equity contracts are mainly utilized to manage the risk that would arise from price fluctuations of stocks held in connection with customer transactions; |
| • |
Commodity contracts : Commodity contracts are mainly utilized to meet customers’ demand for hedging the risks relating to their transactions, and to diversify our portfolio; and |
| • |
Credit derivatives : Credit derivatives are mainly utilized as a part of our credit portfolio risk management. |
78
Table of Contents
Derivative instruments for trading purposes also include those used as hedges of net exposures rather than for specifically identified assets or liabilities, which do not meet the specific criteria for hedge accounting.
Net profits (losses) on trading account securities, excluding derivatives, consist of:
| • |
Net profits (losses) on trading account securities , which primarily consist of gains and losses on trading and valuation of trading securities which relate to trading purpose activities. Net profits (losses) on investment securities held by certain consolidated variable interest entities, or VIEs, are included in accordance with the applicable accounting rules. |
| • |
Net profits (losses) on trading account securities under the fair value option , which are classified into trading accounts profits (losses) in accordance with certain accounting rules. For more information on the fair value option, see Note 32 to our consolidated financial statements included elsewhere in this Annual Report. |
Net investment securities gains (losses)
Net investment securities gains (losses) include net gains (losses) on sales of marketable securities, particularly debt securities and marketable equity securities. Impairment losses are recognized and offset net investment securities gains when management concludes that declines in the fair value of investment securities are other than temporary. In addition, as a result of our adoption of new guidance on recognition and measurement of financial assets and financial liabilities on April 1, 2018, unrealized gains (losses), or holding gains (losses), on equity investments are reflected in net gains (losses) from marketable equity securities. This new guidance is not applied retrospectively to the fiscal years ended March 31, 2017 and 2018. Prior to adoption, such unrealized gains and losses were reflected in other comprehensive income. For more information, see Note 1 to our consolidated financial statements included elsewhere in this Annual Report.
Net equity in earnings (losses) of equity method investees
Net equity in earnings (losses) of equity method investees includes our equity interest in the earnings of our equity method investees and impairment losses on our investments in equity method investees.
Non-Interest Expense
Non-interest expense consists of:
| • |
salaries and employee benefits , which include the amount of money paid as salaries and bonuses as well as the cost of fringe-benefits, |
| • |
occupancy expenses—net , which include the amount of money paid as rents for offices and other facilities, |
| • |
fees and commissions expenses , which include the amount of money paid as fees and commissions on services received, |
| • |
outsourcing expenses, including data processing , which include the amount of money paid for the outsourcing services, including IT-related services, |
| • |
depreciation of premises and equipment , which includes the depreciation of the value of buildings, equipment and furniture through the passage of time, |
| • |
amortization of intangible assets , which includes the amount of deductions of the cost of investments in software and other intangible assets over their estimated useful lives, |
| • |
impairment of intangible assets , which includes the amount of reductions in the carrying amounts of intangible assets with indefinite useful lives in excess of their fair values, |
79
Table of Contents
| • |
insurance premiums, including deposits insurance , which include the amount of money paid as the insurance premiums including the deposit insurance premiums paid to the Deposit Insurance Corporation of Japan |
| • |
communications , which include the amount of money paid for communications such as postal services and telecommunications, |
| • |
taxes and public charges , which include the amount of tax payments and other public charges, |
| • |
impairment of goodwill , which includes the amount of reductions in the carrying amount of goodwill recorded in connection with the acquisition of companies in excess of their fair values, |
| • |
provision for (reversal of) off-balance sheet credit instruments , which includes the amount of money reserved for the estimated amount of losses on off-balance sheet credit instruments or reversal of any portion of such amount, and |
| • |
other non-interest expenses . |
80
Table of Contents
During the fiscal year ended March 31, 2019, we continued to pursue a strategy to improve our operational efficiency and financial performance and achieve sustainable growth. We sought to strengthen our management structure, while selectively reviewing and considering growth opportunities that would enhance our global competitiveness. We also continued to monitor regulatory developments and pursue prudent transactions that would create a strong capital structure to enable us to contribute to the real economy, both domestically and globally, as a provider of a stable source of funds and high-quality financial services. In addition, in order to respond to the increasingly complex market and legal risks, we continued to endeavor to enhance our compliance and internal control frameworks. Starting in the current fiscal year ending March 31, 2019, we launched our new three-year medium-term business plan, under which we aim to integrate the expertise and capabilities of our subsidiaries to build a foundation for future growth.
Implementation of Share Repurchase Programs and Cancellation of Purchased Shares
During November 2018 and December 2018, we repurchased 159,836,800 shares of our common stock for ¥99,999,974,078 under a share repurchase program that was adopted in November 2018 and completed in December 2018. Under the program, we were authorized by the Board of Directors to repurchase up to the lesser of an aggregate of 200,000,000 shares of our common stock and an aggregate of ¥100.0 billion between November 14, 2018 and December 31, 2018 and to cancel the repurchased shares. We cancelled all of the repurchased shares on January 22, 2019.
During May 2018 and June 2018, we repurchased 72,420,700 shares of our common stock for ¥49,999,969,714 under a share repurchase program that was adopted in May 2018 and completed in June 2018. Under the program, we were authorized by the Board of Directors to repurchase up to the lesser of an aggregate of 100,000,000 shares of our common stock and an aggregate of ¥50.0 billion between May 16, 2018 and June 30, 2018 and to cancel the repurchased shares. We cancelled all of the repurchased shares on July 20, 2018.
The purposes of the above two share repurchase programs were to enhance shareholder value, to improve our capital efficiency and to allow the implementation of flexible capital policies in response to changes in the business environment.
Issuances of Senior Debt Securities for TLAC Purposes
During and after the fiscal year ended March 31, 2019, we issued $13.2 billion, or ¥1,467.3 billion, €1.0 billion, or ¥124.6 billion, and HK$0.3 billion, or ¥4.3 billion, aggregate principal amount of senior notes that were intended to qualify as TLAC debt. As of March 31, 2019, our TLAC ratios were 18.16% on a risk-weighted assets basis and 7.90% on a leverage exposure basis. We are required to maintain External TLAC ratios of 16% on a risk-weighted assets basis and 6% on a leverage exposure basis from March 31, 2019 and 18% on a risk-weighted assets basis and 6.75% on a leverage exposure basis from March 31, 2022. See “—B. Liquidity and Capital Resources—Capital Adequacy” and “Item 4.B. Information on the Company—Business Overview—Supervision and Regulation—Japan—Total loss-absorbing capacity.”
Redemption of Preferred Securities Issued by Special Purpose Company
In May 2019, we decided to redeem in full ¥90.0 billion of Japanese yen-denominated non-cumulative preferred securities issued by an overseas special purpose company in the Cayman Islands called MUFG Capital Finance 8 Limited. The effective date of the planned redemption is July 25, 2019. Based on the Japanese GAAP information used to calculate our capital ratios as of March 31, 2019, we estimate that the planned redemption would result in a decline in each of our Tier 1 capital ratio and our total capital ratio by approximately 0.1 percentage point.
81
Table of Contents
In January 2019, we redeemed in full ¥222.0 billion of Japanese yen-denominated non-cumulative preferred securities issued by an overseas special purpose company in the Cayman Islands called MUFG Capital Finance 7 Limited.
Issuances of Basel III-Compliant Domestic Subordinated Bonds
In December 2018, we issued, in a public offering in Japan, ¥155.0 billion aggregate principal amount of unsecured perpetual subordinated Additional Tier 1 notes. These notes are subject to our discretion to cease interest payments and a write-down of the principal upon the occurrence of certain events, including when our Common Equity Tier 1 capital ratio declines below 5.125%, when we are deemed to be at risk of becoming non-viable or when we become subject to bankruptcy proceedings, but, following any write-down, the principal may be reinstated to the extent permitted by the Japanese banking regulator. See “Item 4.B. Information on the Company—Business Overview—Supervision and Regulation—Japan.”
Strategic Investment in Bank Danamon in Indonesia
In December 2017, MUFG Bank acquired an initial 19.9% equity interest in Bank Danamon for an aggregate purchase price of IDR 15.875 trillion, or ¥133.4 billion, based on a price of IDR 8,323, or ¥70, per share. In August 2018, MUFG Bank acquired an additional 20.1% equity interest for an aggregate purchase price of IDR 17.187 trillion, or ¥132.3 billion, based on a price of IDR 8,921, or ¥69, per share. As a result, MUFG Bank’s equity interest in Bank Danamon increased to 40%, and MUFG Bank started to apply the equity method of accounting to its investment in Bank Danamon during the six months ended September 30, 2018.
In April 2019, MUFG Bank further increased its shareholding in Bank Danamon from 40.0% to 94.0% by acquiring additional shares for an aggregate purchase price of IDR 49,620 billion, or ¥397.0 billion, based on a price of IDR 9,590, or ¥77, per share. In addition, in April 2019, MUFG Bank increased its shareholding in PT Bank Nusantara Parahyangan Tbk., or Bank BNP, in Indonesia from 7.9% to 99.9% by acquiring shares from ACOM Co., Ltd., our equity method affiliate, and other shareholders for an aggregate purchase price of IDR 3,011 billion, or ¥24.1 billion, based on a price of IDR 4,088, or ¥33, per share. As a result, Bank Danamon and Bank BNP became our consolidated subsidiaries. In May 2019, Bank BNP was merged into Bank Danamon through a share exchange transaction, resulting in our shareholding in Bank Danamon being 94.1%.
This investment is part of our strategic plan to expand our presence in Asia and Oceania and contribute to the economic growth in the region. The investment is expected to enable us to leverage our financial strength, relationships with Japan’s leading companies, and global network as well as our product and sectorial expertise to further enhance our growth strategy. In our capacity as a long-term shareholder, we aim to build on Bank Danamon’s established and respected brand franchise to foster synergies and enhance Bank Danamon’s position as a leading and prominent Indonesian bank that remains committed to delivering high quality services to its customers.
Bank Danamon, which was established in 1956, is the fifth most profitable Indonesian commercial bank in terms of net income. Bank Danamon provides banking and financial products and services to consumer, micro-finance, small and medium enterprise, and corporate customers, with a network of approximately 1,800 offices in Indonesia.
Acquisition of Aviation Finance Business from DVB Bank
In March 2019, MUFG Bank agreed to purchase from DVB Bank SE in Germany its aviation finance client lending portfolio, which was valued at approximately €5.6 billion, or approximately ¥716.3 billion, as of June 30, 2018, and the related operating infrastructure. In connection with this agreement, BOT Lease Co., Ltd., a consolidated subsidiary of MUFG Bank, agreed to purchase from DVB Bank its aviation investment management and asset management business. The closing of these transactions are expected to occur during the second half of the fiscal year ending March 31, 2020, subject to regulatory approvals and other conditions. We
82
Table of Contents
consider aviation finance to be a key growth pillar for us and, through the acquisition, we aim to enhance our Global Corporate & Investment Banking Business platform in terms of higher returns, portfolio diversification and solution offering to our clients.
Sale of Shares in Standard Life Aberdeen
In February 2019, Mitsubishi UFJ Trust and Banking sold all of the ordinary shares it held in Standard Life Aberdeen plc, a U.K.-based asset manager, for approximately £349.3 million, or approximately ¥49.4 billion. The sale was part of our strategy to optimize our capital management in light of tightened international financial regulations and changes in the business environment. Standard Life Aberdeen plc remains one of our most important partners.
Agreement to Acquire Shares in Colonial First State Group Limited Subsidiaries
In October 2018, Mitsubishi UFJ Trust and Banking entered into a Share Sale Deed with Commonwealth Bank of Australia, or CBA, and its wholly-owned subsidiary Colonial First State Group Limited, or CFSGL, to acquire 100% of the shares in each of nine subsidiaries of CFSGL, which collectively represent CBA’s global asset management business known as Colonial First State Global Asset Management, or CFSGAM, from CFSGL for an aggregate purchase price of approximately AU$4.0 billion, or ¥328 billion, subject to certain conditions precedent, including required regulatory approvals. The purpose of this transaction is to enhance Mitsubishi UFJ Trust and Banking’s asset management capabilities and product competitiveness in the global asset management market. The transaction is currently expected to be completed in mid-2019.
Sale of Shares in Banco Bradesco
In April 2018, MUFG Bank sold a portion of its equity interest in Banco Bradesco SA, a Brazil-based universal banking group in Latin America, for approximately 1,411 million Brazilian Real, or approximately ¥45.3 billion. Although MUFG Bank’s shareholding ratio decreased to 1.25% as a result of the transaction, Bradesco remains our important alliance partner in the Latin American region and continues to collaborate with MUFG Bank in a broad range of business areas.
Agreement concerning Capital Transfer and Merger between Mitsubishi UFJ Morgan Stanley Securities and Mitsubishi UFJ Morgan Stanley PB Securities
In April 2019, Mitsubishi UFJ Morgan Stanley Securities and Mitsubishi UFJ Morgan Stanley PB Securities Co., Ltd., a subsidiary of Mitsubishi UFJ Morgan Stanley Securities holding 75% of its shares with the remaining 25% held by MUFG Bank, agreed on a merger whereby Mitsubishi UFJ Morgan Stanley Securities will be the surviving company. In connection with the planned merger, MUFG Bank is expected to transfer its 25% equity interest in Mitsubishi UFJ Morgan Stanley PB Securities to Mitsubishi UFJ Morgan Stanley Securities. Through this transaction, Mitsubishi UFJ Morgan Stanley Securities aims to enhance its wealth management business.
Functional Realignment of Subsidiaries
In April 2018, Mitsubishi UFJ Trust and Banking’s corporate loan-related businesses were transferred to MUFG Bank. As a result, the corporate loan-related businesses within the Group are currently concentrated at MUFG Bank.
Also in April 2018, Mitsubishi UFJ Trust and Banking acquired MUFG Bank’s 15% equity interest and Mitsubishi UFJ Securities Holding’s 34% equity interest in Mitsubishi UFJ Kokusai Asset Management Co., Ltd. to make the asset management company a wholly owned subsidiary of Mitsubishi UFJ Trust and Banking. The acquisition followed the transfer to Mitsubishi UFJ Trust and Banking of the shares of Mitsubishi UFJ Investor
83
Table of Contents
Services & Banking (Luxembourg) S.A. held by MUFG Bank in May 2017 to make the Luxembourg company a wholly owned subsidiary of Mitsubishi UFJ Trust and Banking. As a result, Mitsubishi UFJ Trust and Banking currently operates as the Group’s primary asset management and administration subsidiary, and seeks to further strengthen its real estate, pension and estate administration services.
The realignment of these functions of our subsidiaries was executed as part of our strategy to increase the effectiveness in accumulating and applying the expertise of our subsidiaries and to enhance efficiency in offering and providing a diverse array of sophisticated financial products and services to customers through collaboration among our subsidiaries. See “Item 4.B—Information on the Company—Business Overview.”
Our consolidated financial statements included elsewhere in this Annual Report are prepared in accordance with U.S. GAAP. Certain accounting policies require management to make difficult, complex or subjective judgments regarding the valuation of assets and liabilities. The accounting policies are fundamental to understanding our operating and financial review and prospects. The notes to our consolidated financial statements included elsewhere in this Annual Report provide a summary of our significant accounting policies. The following is a summary of the critical accounting estimates:
Allowance for Credit Losses
The allowance for credit losses represents management’s best estimate of probable losses in our loan portfolio. The evaluation process, including credit-ratings and self-assessments, involves a number of estimates and judgments. The allowance is based on two principles of accounting guidance: (1) the guidance on contingencies requires that losses be accrued when they are probable of occurring and can be estimated, and (2) the guidance on accounting by creditors for impairment of a loan requires that losses be accrued based on the difference between the loan balance, on the one hand, and the present value of expected future cash flows discounted at the loan’s original effective interest rate, the fair value of collateral or the loan’s observable market value, on the other hand.
We divide our loan portfolio into the following segments—Commercial, Residential, Card, MUFG Americas Holdings and Krungsri—based on the segments used to determine the allowance for credit losses. We further divide the Commercial segment into classes based on initial measurement attributes, risk characteristics, and our approach to monitoring and assessing credit risk. We determine the appropriate level of the allowance for credit losses for each of our loan portfolios by evaluating various factors and assumptions, such as the borrower’s credit rating, collateral value and historical loss experience as well as existing economic conditions. We update these factors and assumptions on a regular basis and upon the occurrence of unexpected changes in the economic environment.
For all portfolio segments, key elements relating to the policies and discipline used in determining the allowance for credit losses are our credit classification and the related borrower categorization process. Each of these components is determined based on estimates subject to change when actual events occur. The categorization is based on conditions that may affect the ability of borrowers to service their debt, taking into consideration current financial information, historical payment experience, credit documentation, public information, analyses of relevant industry segments and current trends. In determining the appropriate level of allowance, we evaluate the probable loss by category of the loan based on its type and characteristics.
In addition to the allowance for credit losses on our loan portfolio, we maintain an allowance for credit losses on off-balance sheet credit instruments, including commitments to extend credit, a variety of guarantees and standby letters of credit and other financial instruments. This allowance is included in other liabilities.
Determining the adequacy of the allowance for credit losses requires the exercise of considerable judgment and the use of estimates, such as those discussed above. Our actual losses could be more or less than the
84
Table of Contents
estimates. To the extent that actual losses differ from management’s estimates, additional provisions for credit losses may be required that would adversely impact our operating results and financial condition in future periods. For further information regarding our methodologies used in establishing the allowance for credit losses by portfolio segments and allowance for credit losses policies, see Note 1 to our consolidated financial statements included elsewhere in this Annual Report and “—B. Liquidity and Capital Resources—Financial Condition—Loan Portfolio.”
For more information on our credit and borrower ratings, see “Item 11. Quantitative and Qualitative Disclosures about Credit, Market and Other Risk—Credit Risk Management.”
Allowance for Repayment of Excess Interest
We maintain an allowance for repayment of excess interest based on our estimate of the potential liability exposure. Our estimate of the potential liability exposure represents the estimated amount of claims for repayment of excess interest to be received in the future. We expect that any such claim will be made on the basis of a 2006 ruling of the Japanese Supreme Court, or the Ruling. Under the Ruling, lenders are generally required to reimburse borrowers for interest payments made in excess of the limits stipulated by the Interest Rate Restriction Act upon receiving claims for reimbursement, despite the then-effective provisions of the Law Concerning Lending Business that exempted a lender from this requirement if the lender provided required notices to the borrower and met other specified requirements, and the borrower voluntarily made the interest payment.
While we have not entered into any consumer loan agreement after April 2007 that imposes an interest rate exceeding the limits stipulated by the Interest Rate Restriction Act, we need to estimate the number of possible claims for reimbursement of excess interest payments. To determine the allowance for repayment of excess interest, we analyze the historical number of repayment claims we have received, the amount of such claims, borrowers’ profiles, the actual amount of reimbursements we have made, management’s future forecasts, and other events that are expected to possibly affect the repayment claim trends in order to arrive at our best estimate of the potential liability. We believe that the provision for repayment of excess interest is adequate and the allowance is at the appropriate amount to absorb probable losses, so that the impact of future claims for reimbursement of excess interest will not have a material adverse effect on our financial position and results of operations. The allowance is recorded as a liability in Other liabilities.
For further information, see Note 27 to our consolidated financial statements included elsewhere in this Annual Report and “Item 3.D. Key Information—Risk Factors—Risks Related to Our Business—Because of our loans to consumers and our shareholdings in companies engaged in consumer lending, changes in the business or regulatory environment for consumer finance companies in Japan may further adversely affect our financial results.”
Accounting for Goodwill and Intangible Assets
Accounting for Goodwill . U.S. GAAP requires us to test goodwill for impairment at least annually, or more frequently if events or changes in circumstances indicate that goodwill may be impaired, using a two-step process that begins with an estimation of the fair value of a reporting unit of our business, which is to be compared with the carrying amount of the unit, to identify potential impairment of goodwill. A reporting unit is an operating segment or component of an operating segment that constitutes a business for which discrete financial information is available and is regularly reviewed by management. The fair value of a reporting unit is defined as the amount at which the unit as a whole could be bought or sold in a current transaction between willing parties. For a reporting unit for which an observable quoted price is not available, the fair value is determined using an income approach. In the income approach, the present value of expected future cash flows is calculated by taking the net present value based on each reporting unit’s internal forecasts. A control premium factor is also considered in relation to market capitalization.
If the carrying amount of a reporting unit exceeds its estimated fair value, the second step of the goodwill impairment test is performed to measure the amount of impairment loss recorded in our consolidated statements of
85
Table of Contents
income. This test requires a comparison of the implied fair value of the unit’s goodwill with the carrying amount of that goodwill. The estimate of the implied fair value of the reporting unit’s goodwill requires us to allocate the fair value of a reporting unit to all of the assets and liabilities of that reporting unit, including unrecognized intangible assets, if any, since the implied fair value is determined as the excess of the fair value of a reporting unit over the net amounts assigned to its assets and liabilities in the allocation. Accordingly, the second step of the impairment test also requires an estimate of the fair value of individual assets and liabilities, including any unrecognized intangible assets that belong to that unit. A change in the estimation could have an impact on impairment recognition since it is driven by hypothetical assumptions, such as customer behavior and interest rate forecasts. The estimation is based on information available to management at the time the estimation is made.
Accounting for Intangible Assets . Intangible assets having indefinite useful lives are subject to annual impairment tests. An impairment exists if the carrying value of an indefinite lived asset exceeds its fair value. For other intangible assets subject to amortization, an impairment is recognized if the carrying amount is not recoverable and the carrying amount exceeds the fair value of the intangible asset. Management judgment is required to evaluate whether indications of potential impairment have occurred, and to test intangible assets for impairment if required.
Valuation of Financial Instruments
We measure certain financial assets and liabilities at fair value. The majority of such assets and liabilities are measured at fair value on a recurring basis, including trading securities, trading derivatives and investment securities. In addition, certain other assets and liabilities are measured at fair value on a non-recurring basis, including held for sale loans which are carried at the lower of cost or fair value, collateral dependent loans and nonmarketable equity securities subject to impairment.
We have elected the fair value option for certain foreign securities classified as available-for-sale debt securities, whose unrealized gains and losses are reported in income, and marketable equity securities.
The guidance on the measurement of fair value defines fair value as the price that would be received to sell an asset or paid to transfer a liability in an orderly transaction between market participants at the measurement date. We have an established and documented process for determining fair value in accordance with the guidance. To determine the fair value, we use quoted prices which include those provided from pricing vendors, where available. We generally obtain one price or quote per instrument and do not adjust it to determine the fair value of the instrument. We perform internal price verification procedures to ensure that the prices and quotes provided from the independent pricing vendors are reasonable. Such verification procedures include a comparison of pricing sources and analysis of variances among pricing sources. These verification procedures are periodically performed by independent risk management departments. For collateralized loan obligations, or CLOs, backed by general corporate loans, the fair value is determined by weighting the internal model valuation and the non-binding broker-dealer quotes. If quoted prices are not available to determine the fair value of derivatives, the fair value is based upon valuation techniques that use, where possible, current market-based or independently sourced parameters, such as interest rates, yield curves, foreign exchange rates, volatilities and credit curves. The fair values of trading liabilities are determined by discounting future cash flows at a rate which incorporates our own creditworthiness. In addition, valuation adjustments may be made to ensure that the financial instruments are recorded at fair value. These adjustments include, but are not limited to, amounts that reflect counterparty credit quality, funding cost, liquidity risk, and model risk. Our financial models are validated and periodically reviewed by risk management departments independent of divisions that created the models.
For a further discussion of the valuation techniques applied to the material assets or liabilities, see Note 32 to our consolidated financial statements included elsewhere in this Annual Report.
Accounting Changes and Recently Issued Accounting Pronouncements
See “Accounting Changes” and “Recently Issued Accounting Pronouncements” in Note 1 to our consolidated financial statements included elsewhere in this Annual Report.
86
Table of Contents
| A. | Operating Results |
The following discussion relates to our operating results for the fiscal years ended March 31, 2018 and 2019. For the discussion on our operating results for the fiscal year ended March 31, 2017, including certain comparative discussion on our operating results for the fiscal years ended March 31, 2017 and 2018, please refer to “Item 5. Operating and Financial Review and Prospectus—5.A. Operating Results” in our annual report on Form 20-F for the fiscal year ended March 31, 2018, filed with the SEC on July 12, 2018.
The following table sets forth a summary of our results of operations for the fiscal years ended March 31, 2018 and 2019:
| Fiscal years ended March 31, | ||||||||
| 2018 | 2019 | |||||||
| (in billions) | ||||||||
|
Interest income |
¥ | 3,259.0 | ¥ | 3,813.4 | ||||
|
Interest expense |
1,028.7 | 1,518.0 | ||||||
|
|
|
|
|
|||||
|
Net interest income |
2,230.3 | 2,295.4 | ||||||
|
|
|
|
|
|||||
|
Provision for (reversal of) credit losses |
(240.8 | ) | 34.3 | |||||
|
Non-interest income |
1,935.1 | 1,595.2 | ||||||
|
Non-interest expense |
2,744.4 | 2,985.5 | ||||||
|
|
|
|
|
|||||
|
Income before income tax expense |
1,661.8 | 870.8 | ||||||
|
Income tax expense |
407.8 | 133.2 | ||||||
|
|
|
|
|
|||||
|
Net income before attribution of noncontrolling interests |
¥ | 1,254.0 | ¥ | 737.6 | ||||
|
Net income (loss) attributable to noncontrolling interests |
25.8 | 19.0 | ||||||
|
|
|
|
|
|||||
|
Net income attributable to Mitsubishi UFJ Financial Group |
¥ | 1,228.2 | ¥ | 718.6 | ||||
|
|
|
|
|
|||||
Major components of our net income attributable to Mitsubishi UFJ Financial Group for the fiscal years ended March 31, 2018 and 2019 are discussed in further detail below.
87
Table of Contents
Net Interest Income
The following table is a summary of the interest rate spread for the fiscal years ended March 31, 2018 and 2019:
| Fiscal years ended March 31, | ||||||||||||||||||||||||
| 2018 | 2019 | |||||||||||||||||||||||
|
Average
balance |
Interest
income (expense) |
Average
rate |
Average
balance |
Interest
income (expense) |
Average
rate |
|||||||||||||||||||
| (in billions, except percentages) | ||||||||||||||||||||||||
|
Interest-earning assets: |
||||||||||||||||||||||||
|
Domestic |
¥ | 144,602.0 | ¥ | 1,002.0 | 0.69 | % | ¥ | 145,279.1 | ¥ | 1,048.6 | 0.72 | % | ||||||||||||
|
Foreign |
94,447.0 | 2,257.0 | 2.39 | 96,128.3 | 2,764.8 | 2.88 | ||||||||||||||||||
|
|
|
|
|
|||||||||||||||||||||
|
Total |
¥ | 239,049.0 | ¥ | 3,259.0 | 1.36 | % | ¥ | 241,407.4 | ¥ | 3,813.4 | 1.58 | % | ||||||||||||
|
|
|
|
|
|||||||||||||||||||||
|
Financed by: |
||||||||||||||||||||||||
|
Interest-bearing liabilities: |
||||||||||||||||||||||||
|
Domestic |
¥ | 173,166.0 | ¥ | (367.6 | ) | 0.21 | % | ¥ | 173,199.6 | ¥ | (504.2 | ) | 0.29 | % | ||||||||||
|
Foreign |
60,691.1 | (661.1 | ) | 1.09 | 61,443.6 | (1,013.8 | ) | 1.65 | ||||||||||||||||
|
|
|
|
|
|||||||||||||||||||||
|
Total |
233,857.1 | (1,028.7 | ) | 0.44 | 234,643.2 | (1,518.0 | ) | 0.65 | ||||||||||||||||
|
Non-interest-bearing liabilities |
5,191.9 | — | 6,764.2 | — | ||||||||||||||||||||
|
|
|
|
|
|||||||||||||||||||||
|
Total |
¥ | 239,049.0 | 0.43 | % | ¥ | 241,407.4 | 0.63 | % | ||||||||||||||||
|
|
|
|
|
|||||||||||||||||||||
|
Net interest income and interest rate spread |
¥ | 2,230.3 | 0.92 | % | ¥ | 2,295.4 | 0.93 | % | ||||||||||||||||
|
Net interest income as a percentage of total interest-earning assets |
0.93 | % | 0.95 | % | ||||||||||||||||||||
The following table shows changes in our net interest income by changes in volume and by changes in rates for the fiscal year ended March 31, 2019 compared to the fiscal year ended March 31, 2018:
|
Fiscal Year Ended March 31, 2018
versus Fiscal Year Ended March 31, 2019 |
||||||||||||
|
Increase (decrease)
due to changes in |
||||||||||||
| Volume (1) | Rate (1) | Net change | ||||||||||
| (in millions) | ||||||||||||
|
Domestic |
¥ | 8,801 | ¥ | (98,744 | ) | ¥ | (89,943 | ) | ||||
|
Foreign |
16,791 | 138,289 | 155,080 | |||||||||
|
|
|
|
|
|
|
|||||||
|
Total |
¥ | 25,592 | ¥ | 39,545 | ¥ | 65,137 | ||||||
|
|
|
|
|
|
|
|||||||
Note:
| (1) | Volume/rate variance is allocated based on the percentage relationship of changes in volume and changes in rate to the total “net change.” |
Our net interest income for each of the fiscal years ended March 31, 2018 and 2019 was not materially affected by gains or losses resulting from interest rate and other derivative contracts. We use such derivative instruments to manage the risks affecting the values of our financial assets and liabilities. Although these contracts are generally entered into for risk management purposes, a majority of them do not meet the specific conditions to qualify for hedge accounting under U.S. GAAP and thus are accounted for as trading assets or liabilities. Any gains or losses resulting from such derivative instruments are recorded as part of Trading account profits—net. For a detailed discussion of our risk management activities, see “—A. Operating Results—Results of Operations—Non-Interest Income” and “Item 11. Quantitative and Qualitative Disclosures about Credit, Market and Other Risk.”
88
Table of Contents
Fiscal Year Ended March 31, 2019 Compared to Fiscal Year Ended March 31, 2018
Net interest income increased ¥65.1 billion to ¥2,295.4 billion for the fiscal year ended March 31, 2019 from ¥2,230.3 billion for the fiscal year ended March 31, 2018. This increase was due to higher foreign interest income, mainly reflecting higher average interest rates on, and higher average balance of, interest-earning assets, particularly in the United States. This increase was partially offset by an increase in interest expense, primarily reflecting higher interest rates on deposits in the United States and higher U.S. dollar funding rates in Japan.
Interest income increased ¥554.4 billion to ¥3,813.4 billion for the fiscal year ended March 31, 2019 from ¥3,259.0 billion for the previous fiscal year. Domestic interest income increased ¥46.6 billion mainly due to higher interest rates on domestic loans, reflecting higher long-term interest rates in Japan during the first half of the fiscal year ended March 31, 2019. Foreign interest income increased ¥507.8 billion primarily due to higher interest rates on, and higher volumes of, foreign loans.
Interest expense increased ¥489.3 billion to ¥1,518.0 billion for the fiscal year ended March 31, 2019 from ¥1,028.7 billion for the previous fiscal year. Domestic interest expense increased ¥136.5 billion, and foreign interest expense increased ¥352.7 billion. The higher domestic interest expense was primarily attributable to higher short-term U.S. dollar funding rates in Japan. The higher foreign interest expense was mainly due to higher interest rates on deposits and higher money market interest rates in the United States.
Our average interest rate spread (which is the average interest rate on interest-earning assets less the average interest rate on interest-bearing liabilities) increased one basis point to 0.93% for the fiscal year ended March 31, 2019 from 0.92% for the previous fiscal year. The portion of our foreign interest-earning assets funded by domestic interest-bearing liabilities, which have lower interest rates than foreign interest-bearing liabilities, increased during the fiscal year ended March 31, 2019, compared to the previous fiscal year, resulting in the slight improvement in our overall interest spread. Between the same periods, the average interest rate spread on domestic activities decreased five basis points to 0.43% from 0.48%, and the average interest rate spread on foreign activities decreased seven basis points to 1.23% from 1.30%. The decrease in the average interest rate spread on domestic activities mainly reflected lower interest rates on our Japanese government bond portfolio and higher U.S. dollar funding rates in Japan. The decrease in the average interest rate spread on foreign activities mainly reflected higher money market interest rates in the United States and higher interest rates on foreign deposits.
The yield on 10-year Japanese government bonds fluctuated between 0% and positive 0.15% during the six months ended September 30, 2018, but subsequently declined to negative 0.1% towards March 31, 2019. During the previous fiscal year, the yield on such bonds fluctuated between negative 0.02% to positive 0.1%. In July 2018, the Bank of Japan slightly modified its monetary policy, which included negative 0.1 percent interest on the Policy-Rate Balances and a Japanese government bond purchase program with an aim to keep the yield of 10-year Japanese government bonds around zero percent, by adopting forward guidance on interest rates and adding language in its policy statement that long-term interest rates may fluctuate depending on economic and price developments. Long-term interest rates may fluctuate to a larger extent, causing additional uncertainty in the interest rates in Japan. In the United States, the FRB raised the target range for the federal funds rate to between 1.75% to 2.00% in June 2018, then to between 2.00% to 2.25% in September 2018, and further to between 2.25% to 2.50% in December 2018. The FRB is currently expected to maintain the federal funds rate at the current level or lower it during the calendar year 2019. See “—Business Environment.”
The average balance of interest-earning assets increased ¥2,358.4 billion to ¥241,407.4 billion for the fiscal year ended March 31, 2019 from ¥239,049.0 billion for the fiscal year ended March 31, 2018. The average balance of domestic interest-earning assets increased ¥677.1 billion to ¥145,279.1 billion mainly due to an increase in the average balance of our interest-earning deposits in other banks particularly because we deposited with the Bank of Japan a larger amount of cash received on sales and redemption of Japanese government bonds as we reduced our holdings of such bonds. The higher average balance of domestic interest-earning assets was also due to an increase in trading account assets. The average balance of foreign interest-earning assets increased
89
Table of Contents
¥1,681.3 billion primarily due to increases in foreign currency-denominated loans, deposits in other banks and investment securities, partially offset by a decrease in the average balance of trading account assets, particularly U.S. Treasury bonds as interest rates rose for the first nine months ended December 31, 2018, in the United States.
The average balance of interest-bearing liabilities increased ¥786.1 billion to ¥234,643.2 billion for the fiscal year ended March 31, 2019 from ¥233,857.1 billion for the fiscal year ended March 31, 2018. The average balance of domestic interest-bearing liabilities increased ¥33.6 billion mainly due to an increase in domestic deposits. The average balance of foreign interest-bearing liabilities increased ¥752.5 billion mainly due to an increase in other short-term borrowings, including such borrowings through commercial paper.
Provision for (reversal of) credit losses
Fiscal Year Ended March 31, 2019 Compared to Fiscal Year Ended March 31, 2018
We recorded ¥34.3 billion of provision for credit losses for the fiscal year ended March 31, 2019, compared to ¥240.8 billion of reversal of credit losses for the previous fiscal year. By segment, for the fiscal year ended March 31, 2019, ¥43.9 billion and ¥4.5 billion of reversal of credit losses were recorded in the Commercial and Residential segments respectively, while ¥23.9 billion, ¥9.3 billion and ¥49.5 billion of provision for credit losses were recorded in the Card, MUFG Americas Holdings and Krungsri segments respectively. For the previous fiscal year, ¥297.4 billion, ¥22.3 billion and ¥9.3 billion of reversal of credit losses were recorded in the Commercial, Residential and MUFG Americas Holdings segments respectively, while ¥23.4 billion and ¥64.8 billion of provision for credit losses were recorded in the Card and Krungsri segments, respectively.
The reversal of credit losses recorded in the Commercial segment for the fiscal year ended March 31, 2019 mainly reflected the improvements in the financial performance of a large borrower in the domestic electronics manufacturing industry. The reversal of credit losses in the Residential segment for the fiscal year ended March 31, 2019 primarily reflected, though to a lesser extent compared to the previous fiscal year, the improved credit quality of borrowers who were positively affected by the stable domestic corporate environment in recent periods.
The larger provision for credit losses in the Card segment for the fiscal year ended March 31, 2019 was primarily attributable to an increase in default borrowers who filed for bankruptcy as part of their debt workout efforts. Although the stable corporate environment in recent periods positively affected some individual borrowers, the positive trends did not meaningfully affect our consumer loan borrowers and, in some cases, the corporate efficiencies negatively affected some of our consumer loan borrowers. The provision for credit losses in the MUFG Americas Holdings segment for the fiscal year ended March 31, 2019 mainly reflected the bankruptcy filing of a large borrower in the electric power industry. The smaller provision for credit losses in the Krungsri segment mainly reflected the improved credit quality of the small and medium-sized enterprise loan portfolio where gradually stabilizing economic conditions in Thailand resulted in fewer borrowers experiencing deterioration in their financial performance.
We recorded ¥40.2 billion of reversal of credit losses for our domestic loan portfolio for the fiscal year ended March 31, 2019, compared to reversal of credit losses of ¥266.1 billion for the previous fiscal year. This reflected the improvement in the credit quality of a large borrower in the domestic manufacturing industry in the Commercial segment and the credit quality of borrowers in the Residential segment, partially offset by the weaker credit quality among consumer loan borrowers. We recorded ¥74.5 billion of provision for credit losses for our foreign portfolio for the fiscal year ended March 31, 2019, compared to ¥25.3 billion of provision for credit losses for the previous fiscal year. The larger provision primarily reflected the deteriorated financial condition of some large foreign borrowers who belong to the electric power industry and the construction industry in the Commercial and MUFG Americas Holdings segments.
For more information, see “—B. Liquidity and Capital Resources—Financial Condition—Loan Portfolio.”
90
Table of Contents
Non-Interest Income
The following table is a summary of our non-interest income for the fiscal years ended March 31, 2018 and 2019:
| Fiscal years ended March 31, | ||||||||
| 2018 | 2019 | |||||||
| (in billions) | ||||||||
|
Fees and commissions income: |
||||||||
|
Fees and commissions on deposits |
¥ | 53.5 | ¥ | 52.6 | ||||
|
Fees and commissions on remittances and transfers |
169.3 | 168.7 | ||||||
|
Fees and commissions on foreign trading business |
78.2 | 73.2 | ||||||
|
Fees and commissions on credit card business |
212.5 | 225.9 | ||||||
|
Fees and commissions on security-related services |
258.7 | 233.4 | ||||||
|
Fees and commissions on administration and management services for investment funds |
159.5 | 147.6 | ||||||
|
Trust fees |
112.4 | 115.0 | ||||||
|
Guarantee fees |
44.2 | 45.0 | ||||||
|
Insurance commissions |
49.2 | 46.9 | ||||||
|
Fees and commissions on real estate business |
40.6 | 45.2 | ||||||
|
Other fees and commissions |
284.7 | 285.1 | ||||||
|
|
|
|
|
|||||
|
Total |
1,462.8 | 1,438.6 | ||||||
|
Foreign exchange losses—net |
(49.6 | ) | (96.0 | ) | ||||
|
Trading account profits (losses)—net: |
||||||||
|
Net losses on interest rate and other derivative contracts |
(226.8 | ) | (24.0 | ) | ||||
|
Net profits (losses) on trading account securities, excluding derivatives |
153.7 | 192.9 | ||||||
|
|
|
|
|
|||||
|
Total |
(73.1 | ) | 168.9 | |||||
|
Investment securities gains (losses)—net: |
||||||||
|
Net gains on sales of available-for-sale securities: |
||||||||
|
Debt securities |
73.9 | 28.7 | ||||||
|
Marketable equity securities |
207.3 | — | ||||||
|
Impairment losses on available-for-sale securities: |
||||||||
|
Debt securities |
(0.1 | ) | (0.6 | ) | ||||
|
Marketable equity securities |
(6.7 | ) | — | |||||
|
Net losses from marketable equity securities (1) |
— | (355.8 | ) | |||||
|
Other |
12.5 | 75.4 | ||||||
|
|
|
|
|
|||||
|
Total |
286.9 | (252.3 | ) | |||||
|
Equity in earnings of equity method investees—net |
228.0 | 209.7 | ||||||
|
Gains on sales of loans |
16.1 | 22.7 | ||||||
|
Other non-interest income |
64.0 | 103.6 | ||||||
|
|
|
|
|
|||||
|
Total non-interest income |
¥ | 1,935.1 | ¥ | 1,595.2 | ||||
|
|
|
|
|
|||||
| Note: |
| (1) | As a result of our adoption of new guidance on recognition and measurement of financial assets and financial liabilities on April 1, 2018, equity securities are measured at fair value with unrealized gains (losses), or holding gains (losses), reflected in net gains (losses) from marketable equity securities. This new guidance is not applied retrospectively to the fiscal years ended March 31, 2018. Prior to adoption, such unrealized gains and losses were reflected in other comprehensive income. For more information, see Note 1 to our consolidated financial statements included elsewhere in this Annual Report. For the fiscal year ended March 31, 2019, net losses from marketable equity securities include net gains on sales of marketable equity securities. |
91
Table of Contents
Fiscal Year Ended March 31, 2019 Compared to Fiscal Year Ended March 31, 2018
Non-interest income decreased ¥339.9 billion to ¥1,595.2 billion for the fiscal year ended March 31, 2019 from ¥1,935.1 billion for the fiscal year ended March 31, 2018. This decrease was mainly attributable to ¥252.3 billion of investment securities losses, primarily due to net losses from marketable equity securities recorded as a result of our adoption of new guidance on recognition and measurement of financial assets and financial liabilities on April 1, 2018.
Fees and commissions income
Fees and commissions income decreased ¥24.2 billion to ¥1,438.6 billion for the fiscal year ended March 31, 2019 from ¥1,462.8 billion for the fiscal year ended March 31, 2018. This decrease was primarily due to a decrease in fees and commissions on securities-related services mainly due to lower volumes of selling and buying transactions by retail customers. This decrease was partially offset by an increase in fees and commissions on credit card business, reflecting an increase in payment processing fees and an increase in credit card issuance fees as credit card use grew in Japan.
Net foreign exchange gains (losses)
The following table sets forth the details of our foreign exchange gains and losses for the fiscal years ended March 31, 2018 and 2019:
| Fiscal years ended March 31, | ||||||||
| 2018 | 2019 | |||||||
| (in billions) | ||||||||
|
Foreign exchange losses—net: |
||||||||
|
Net foreign exchange losses on derivative contracts |
¥ | (160.0 | ) | ¥ | (354.4 | ) | ||
|
Net foreign exchange gains on other than derivative contracts |
377.9 | 71.8 | ||||||
|
Net foreign exchange gains (losses) related to the fair value option |
(267.5 | ) | 186.6 | |||||
|
|
|
|
|
|||||
|
Total |
¥ | (49.6 | ) | ¥ | (96.0 | ) | ||
|
|
|
|
|
|||||
Net foreign exchange losses for the fiscal year ended March 31, 2019 were ¥96.0 billion, compared to net losses of ¥49.6 billion for the fiscal year ended March 31, 2018. This was mainly due to smaller net foreign exchange gains on other than derivative contracts, reflecting the negative impact of fluctuations in the foreign currency exchange rates on the Japanese yen translated amounts of monetary liabilities of our commercial banking subsidiaries as the Japanese yen depreciated against other major currencies on a spot rate basis between March 31, 2018 and March 31, 2019. The larger total net foreign exchange losses also resulted from larger net foreign exchange losses on derivative contracts mainly due to the lower mark to market valuation on currency swaps entered in connection with our U.S. dollar funding, reflecting the wider gap between Japanese yen interest rates and U.S. dollar interest rates. These were substantially offset by an increase in net foreign exchange gains on foreign-denominated trading account securities, such as U.S. Treasury bonds, under the fair value option as the Japanese yen depreciated against the U.S. dollar from ¥106.24 to the U.S. dollar as of March 31, 2018 to ¥110.99 to the U.S. dollar as of March 31, 2019, while the Japanese yen appreciated against the U.S. dollar during the previous fiscal year resulting in net foreign exchange losses on U.S. dollar-denominated trading account securities under the fair value option.
92
Table of Contents
Net trading account profits (losses)
The following table sets forth details of our trading account profits and losses for the fiscal years ended March 31, 2018 and 2019:
| Fiscal years ended March 31, | ||||||||
| 2018 | 2019 | |||||||
| (in billions) | ||||||||
|
Trading account profits (losses)—net: |
||||||||
|
Net profits (losses) on interest rate and other derivative contracts |
||||||||
|
Interest rate contracts |
¥ | 51.0 | ¥ | 5.6 | ||||
|
Equity contracts |
(260.4 | ) | 80.1 | |||||
|
Commodity contracts |
6.3 | 0.3 | ||||||
|
Credit derivatives |
(1.8 | ) | (39.8 | ) | ||||
|
Other |
(21.9 | ) | (70.2 | ) | ||||
|
|
|
|
|
|||||
|
Total |
¥ | (226.8 | ) | ¥ | (24.0 | ) | ||
|
|
|
|
|
|||||
|
Net profits (losses) on trading account securities, excluding derivatives |
||||||||
|
Trading account securities |
¥ | 301.9 | ¥ | (16.0 | ) | |||
|
Trading account securities under the fair value option |
(148.2 | ) | 208.9 | |||||
|
|
|
|
|
|||||
|
Total |
¥ | 153.7 | ¥ | 192.9 | ||||
|
|
|
|
|
|||||
|
Total |
¥ | (73.1 | ) | ¥ | 168.9 | |||
|
|
|
|
|
|||||
Net trading account profits were ¥168.9 billion for the fiscal year ended March 31, 2019, compared to net trading account losses of ¥73.1 billion for the fiscal year ended March 31, 2018. This improvement was mainly due to smaller net losses on interest rate and other derivative contracts, which primarily reflected ¥80.1 billion of net profits on equity contracts for the fiscal year ended March 31, 2019, compared to ¥260.4 billion of net losses on such contracts for the fiscal year ended March 31, 2018, due to an increase in the market value of equity contracts designed to hedge against downside price fluctuations, as equity prices were on a declining trend in Japan particularly towards the end of the fiscal year ended March 31, 2019.
The ¥39.2 billion increase in net profits on trading account securities, excluding derivatives, resulted mainly from an improvement in net profits on trading account securities under the fair value option, particularly U.S. Treasury bonds, as long-term interest rates declined in the United States during the fiscal year ended March 31, 2019. The yield on 10-year U.S. Treasury bonds declined to around 2.4% as of March 31, 2019 from around 2.7% as of March 31, 2018, whereas the yield on such bonds rose to around 2.7% as of March 31, 2018 from around 2.4% as of March 31, 2017. This improvement was substantially offset by net losses on trading account securities as equity prices declined in Japan towards the end of the fiscal year ended March 31, 2019.
Net investment securities gains (losses)
Net investment securities losses were ¥252.3 billion for the fiscal year ended March 31, 2019, compared to net investment securities gains of ¥286.9 billion for the fiscal year ended March 31, 2018. This was mainly due to ¥355.8 billion of net losses from marketable equity securities recorded as a result of our adoption of new guidance on recognition and measurement of financial assets and financial liabilities on April 1, 2018. Under this guidance, equity securities are measured at fair value, and the unrealized gains (losses), or holding gains (losses), on such securities are reported as net investment securities gains (losses) in our consolidated statements of income. This new guidance is not applied retrospectively to the fiscal year ended March 31, 2018. Prior to adoption, such unrealized gains (losses) were reflected in other comprehensive income. For more information, see Note 1 to our consolidated financial statements included elsewhere in this Annual Report.
93
Table of Contents
The net losses from marketable equity securities for the fiscal year ended March 31, 2019 reflected lower equity prices in Japan. The net losses from marketable equity securities also included smaller net gains on sales of marketable equity securities.
Net equity in earnings of equity method investees
Net equity in earnings of equity method investees for the fiscal year ended March 31, 2019 was ¥209.7 billion, compared to ¥228.0 billion for the previous fiscal year, reflecting lower earnings of our equity method investees, including Morgan Stanley.
Non-Interest Expense
The following table shows a summary of our non-interest expense for the fiscal years ended March 31, 2018 and 2019:
| Fiscal years ended March 31, | ||||||||
| 2018 | 2019 | |||||||
| (in billions) | ||||||||
|
Salaries and employee benefits (1) |
¥ | 1,165.4 | ¥ | 1,175.4 | ||||
|
Occupancy expenses—net |
179.1 | 179.8 | ||||||
|
Fees and commissions expenses |
297.8 | 313.7 | ||||||
|
Outsourcing expenses, including data processing |
276.2 | 275.1 | ||||||
|
Depreciation of premises and equipment |
96.2 | 98.9 | ||||||
|
Amortization of intangible assets |
234.4 | 235.1 | ||||||
|
Impairment of intangible assets |
21.9 | 118.1 | ||||||
|
Insurance premiums, including deposit insurance |
91.8 | 93.8 | ||||||
|
Communications |
58.1 | 59.2 | ||||||
|
Taxes and public charges |
90.2 | 95.4 | ||||||
|
Impairment of goodwill |
— | — | ||||||
|
Provision for (reversal of) off-balance sheet credit instruments |
(96.1 | ) | 38.5 | |||||
|
Other non-interest expenses (1) |
329.4 | 302.5 | ||||||
|
|
|
|
|
|||||
|
Total non-interest expense |
¥ | 2,744.4 | ¥ | 2,985.5 | ||||
|
|
|
|
|
|||||
Note:
| (1) | As a result of our adoption of new guidance on the presentation of net periodic pension cost and net periodic postretirement benefit cost on April 1, 2018 on a retrospective basis, the service cost component continues to be presented in Salaries and employee benefits while other components of net pension benefit or cost (e.g., interest cost on projected benefit obligation, actual return on plan assets, amortization of prior service cost) are now presented in Other non-interest expenses. For more information, see Notes 1 and 13 to our consolidated financial statements included elsewhere in this Annual Report. |
Fiscal Year Ended March 31, 2019 Compared to Fiscal Year Ended March 31, 2018
Non-interest expense increased ¥241.1 billion to ¥2,985.5 billion for the fiscal year ended March 31, 2019 from ¥2,744.4 billion for the previous fiscal year. Major factors affecting this increase are discussed below.
Impairment of intangible assets
Impairment of intangible assets increased ¥96.2 billion to ¥118.1 billion. This was primarily attributable to ¥116.1 billion of impairment losses on system integration-related assets of Mitsubishi UFJ NICOS as we fundamentally revised our system integration plan, comprehensively taking into account the scale of, the complexity of, and the degree of difficulty in, developing the system and responding to rapid changes in payments market in an appropriate manner. For further discussion of impairment on intangible assets, see Note 6 to our audited consolidated financial statements included elsewhere in this Annual Report. See also “Item 3.D. Key Information-Risk Factors-Risks Related to Our Business-Our operations are highly dependent on our information, communications and transaction management systems and are subject to an increasing risk of cyber-attacks and other information security threats and to changes in the business and regulatory environment.”
94
Table of Contents
Provision for (reversal of) off-balance sheet credit instruments
We recorded ¥38.5 billion of provision for off-balance sheet credit instruments for the fiscal year ended March 31, 2019, compared to ¥96.1 billion of reversal for the previous fiscal year. This was primarily because a large domestic borrower in the services industry, in whose favor we have provided guarantees in substantial amounts, began to experience financial difficulty due to a delay of a plant construction project in the United States.
Income Tax Expense
The following table shows a summary of our income tax expense for the fiscal years ended March 31, 2018 and 2019:
| Fiscal years ended March 31, | ||||||||
| 2018 | 2019 | |||||||
| (in billions, except percentages) | ||||||||
|
Income before income tax expense |
¥ | 1,661.8 | ¥ | 870.8 | ||||
|
Income tax expense |
407.8 | 133.2 | ||||||
|
Effective income tax rate |
24.5 | % | 15.3 | % | ||||
|
Combined normal effective statutory tax rate |
30.6 | % | 30.6 | % | ||||
Reconciling items between the combined normal effective statutory tax rates and the effective income tax rates for the fiscal years ended March 31, 2018 and 2019 are summarized as follows:
| Fiscal years ended March 31, | ||||||||
| 2018 | 2019 | |||||||
|
Combined normal effective statutory tax rate |
30.6 | % | 30.6 | % | ||||
|
Increase (decrease) in taxes resulting from: |
||||||||
|
Nondeductible expenses |
0.2 | 0.5 | ||||||
|
Impairment of goodwill |
— | — | ||||||
|
Foreign tax credit and payments |
(1.7 | ) | (3.3 | ) | ||||
|
Lower tax rates applicable to income of subsidiaries |
(0.4 | ) | (2.5 | ) | ||||
|
Change in valuation allowance |
(3.0 | ) | (1.4 | ) | ||||
|
Nontaxable dividends received |
(2.0 | ) | (9.1 | ) | ||||
|
Undistributed earnings of subsidiaries |
0.7 | 0.6 | ||||||
|
Tax and interest expense for uncertainty in income taxes |
0.0 | 0.6 | ||||||
|
Noncontrolling interest income |
0.1 | 0.2 | ||||||
|
Effect of changes in tax laws |
(0.6 | ) | 0.0 | |||||
|
Other—net |
0.6 | (0.9 | ) | |||||
|
|
|
|
|
|||||
|
Effective income tax rate |
24.5 | % | 15.3 | % | ||||
|
|
|
|
|
|||||
Income taxes applicable to us in Japan are imposed by the national, prefectural and municipal governments, and the aggregate of these taxes resulted in a combined normal effective statutory tax rate of 30.6% and 30.6% for the fiscal years ended March 31, 2018 and 2019. Foreign subsidiaries are subject to income taxes of the jurisdictions in which they operate. These taxes are reflected in the effective income tax rate.
Fiscal Year Ended March 31, 2019
The effective income tax rate for the fiscal year ended March 31, 2019 was 15.3%, which was 15.3 percentage points lower than the combined normal effective statutory rate of 30.6%. This primarily reflected our receipt of nontaxable dividends, which resulted in a decrease of ¥79.6 billion in income tax expense and a decrease of 9.1 percentage points in the effective income tax rate for the fiscal year ended March 31, 2019. Under
95
Table of Contents
Japanese tax law, a certain percentage of dividends received is considered nontaxable and excluded from gross revenue in computing taxable income. This creates a permanent difference between our taxable income for Japanese tax purposes and our income before income tax expense reported under U.S. GAAP. Another factor contributing to the lower effective income tax rate was foreign tax credit, which resulted in a decrease of ¥28.5 billion in income tax expense and a decrease of 3.3 percentage points in the effective income tax rate for the fiscal year ended March 31, 2019.
Fiscal Year Ended March 31, 2018
The effective income tax rate for the fiscal year ended March 31, 2018 was 24.5%, which was 6.1 percentage points lower than the combined normal effective statutory rate of 30.6%. This primarily reflected a reduction in valuation allowance to the extent that it was more likely than not that the deferred tax assets would be realized mainly because a subsidiary was added to our consolidated tax payment system during the fiscal year ended March 31, 2018 after it was fully consolidated into our financial statements. The projected taxable income of the subsidiary, for which we had valuation allowance recorded on its deferred tax assets, significantly increased due to the application of our consolidated tax payment system to the subsidiary. As a result, the realizability of the subsidiary’s deferred tax assets became more likely than not, and the relevant valuation allowance was reduced to the extent of the improved realizability. The reduction in the relevant valuation allowance resulted in a decrease of ¥33.3 billion in income tax expense and a decrease of 2.0 percentage points in the effective income tax rate for the fiscal year ended March 31, 2018. Another factor contributing to the lower effective income tax rate was our receipt of nontaxable dividends, which resulted in a decrease of ¥32.6 billion in income tax expense and a decrease of 2.0 percentage points in the effective income tax rate for the fiscal year ended March 31, 2018. Under Japanese tax law, a certain percentage of dividends received is considered nontaxable and excluded from gross revenue in computing taxable income. This creates a permanent difference between our taxable income for Japanese tax purposes and our income before income tax expense reported under U.S. GAAP.
Net income (loss) attributable to noncontrolling interests
Fiscal Year Ended March 31, 2019 Compared to Fiscal Year Ended March 31, 2018
We recorded ¥19.0 billion of net income attributable to noncontrolling interests for the fiscal year ended March 31, 2019, compared to ¥25.8 billion of net income attributable to noncontrolling interests for the previous fiscal year. This mainly reflected decrease in net income of Mitsubishi UFJ Morgan Stanley Securities.
We measure the performance of each of our business segments primarily in terms of “operating profit.” Operating profit and other segment information in this Annual Report are based on the financial information prepared in accordance with Japanese GAAP as adjusted in accordance with internal management accounting rules and practices. Accordingly, the format and information are not consistent with our consolidated financial statements prepared in accordance with U.S. GAAP. For example, operating profit does not reflect items such as a component of the provision for (reversal of) credit losses (primarily equivalent to the formula allowance under U.S. GAAP), foreign exchange gains (losses) and investment securities gains (losses). For a reconciliation of operating profit under the internal management reporting system to income before income tax expense shown on the consolidated statements of income, see Note 30 to our consolidated financial statements included elsewhere in this Annual Report. We do not use information on the segments’ total assets to allocate our resources and assess performance. Accordingly, business segment information on total assets is not presented.
Starting this fiscal year ended March 31, 2019, as part of our current medium-term business plan, we have reorganized our business groups in an effort to further integrate the expertise and capabilities of our subsidiaries to respond to the needs of our customers more effectively and efficiently. We make and execute unified group-
96
Table of Contents
wide strategies based on customer characteristics and the nature of business and have accordingly integrated the operations of our group companies into six business groups—Retail & Commercial Banking, Japanese Corporate & Investment Banking, Global Corporate & Investment Banking, Global Commercial Banking, Asset Management & Investor Services, and Global Markets. Our reporting segments consist of these six business groups, which serve as the core sources of our revenue, as well as “Other,” which represents the operations that are not covered under the six core business groups and the elimination of duplicated amounts of net revenues among business segments, as further described below.
The following is a brief explanation of our business segments for the fiscal year ended March 31, 2019:
Retail & Commercial Banking Business Group —Covers the domestic retail and commercial banking businesses of MUFG Bank, Mitsubishi UFJ Trust and Banking, Mitsubishi UFJ Securities Holdings, Mitsubishi UFJ NICOS and other group companies of MUFG. This business group offers retail and small and medium-sized enterprise customers in Japan an extensive array of commercial banking, trust banking and securities products and services.
Japanese Corporate & Investment Banking Business Group —Covers the large Japanese corporate businesses of MUFG Bank, Mitsubishi UFJ Trust and Banking and Mitsubishi UFJ Securities Holdings, including the transaction banking, investment banking, trust banking and securities businesses. This business group offers large Japanese corporations advanced financial solutions designed to respond to their diversified and globalized needs and to contribute to their business and financial strategies through the global network of our group companies.
Global Corporate & Investment Banking Business Group —Covers the corporate, investment and transaction banking businesses of MUFG Bank and Mitsubishi UFJ Securities Holdings. Through a global network of offices and branches, this business group provides non-Japanese large corporate and financial institution customers outside Japan with a comprehensive set of solutions that meet their increasingly diverse and sophisticated financing needs.
Global Commercial Banking Business Group —Covers the retail and commercial banking businesses of MUFG Union Bank and Krungsri. This business group offers a comprehensive array of financial products and services such as loans, deposits, fund transfers, investments and asset management services for local retail, small and medium-sized enterprise, and corporate customers across the Asia-Pacific region.
Asset Management & Investor Services Business Group —Covers the asset management and asset administration businesses of Mitsubishi UFJ Trust and Banking and MUFG Bank. By integrating the trust banking expertise of Mitsubishi UFJ Trust and Banking and the global strengths of MUFG Bank, the business group offers a full range of asset management and administration services for corporations and pension funds, including pension fund management and administration, advice on pension structures, and payments to beneficiaries, and also offer investment trusts for retail customers.
Global Markets Business Group —Covers the customer business and the treasury operations of MUFG Bank, Mitsubishi UFJ Trust and Banking and Mitsubishi UFJ Securities Holdings. The customer business includes sales and trading in fixed income instruments, currencies, equities and other investment products as well as origination and distribution of financial products. The treasury operations include asset and liability management as well as global investments for the MUFG Group.
Other —Consists mainly of the corporate centers of MUFG, MUFG Bank, Mitsubishi UFJ Trust and Banking and Mitsubishi UFJ Morgan Stanley Securities. The elimination of duplicated amounts of net revenues among business segments was also reflected in Other.
Below we have restated our prior business segment information and relevant discussion to reflect the reorganization of our business groups described above and the transfer of corporate loan-related businesses of
97
Table of Contents
Mitsubishi UFJ Trust and Banking to MUFG Bank in April 2018 and to enable comparison between the relevant amounts for the fiscal years ended March 31, 2017, 2018 and 2019.
For further information, see Note 30 to our consolidated financial statements included elsewhere in this Annual Report.
The following tables set forth our business segment information for the fiscal years ended March 31, 2017, 2018 and 2019:
| Customer Business | ||||||||||||||||||||||||||||||||||||
|
Fiscal year ended March 31, 2017 |
Retail &
Commercial Banking Business Group |
Japanese
Corporate & Investment Banking Business Group |
Global
Corporate & Investment Banking Business Group |
Global
Commercial Banking Business Group |
Asset
Management & Investor Services Business Group |
Total |
Global
Markets Business Group |
Other | Total (1) | |||||||||||||||||||||||||||
| (in billions) | ||||||||||||||||||||||||||||||||||||
|
Net revenue |
¥ | 1,568.0 | ¥ | 527.1 | ¥ | 418.3 | ¥ | 628.6 | ¥ | 176.7 | ¥ | 3,318.7 | ¥ | 686.8 | ¥ | 56.3 | ¥ | 4,061.8 | ||||||||||||||||||
|
BK and TB (2) : |
817.0 | 446.9 | 275.6 | (1.8 | ) | 72.7 | 1,610.4 | 491.5 | 88.6 | 2,190.5 | ||||||||||||||||||||||||||
|
Net interest income |
482.0 | 143.8 | 107.3 | (1.7 | ) | — | 731.4 | 291.0 | 199.4 | 1,221.8 | ||||||||||||||||||||||||||
|
Net fees |
300.6 | 245.0 | 177.3 | — | 72.7 | 795.6 | (8.2 | ) | (98.8 | ) | 688.6 | |||||||||||||||||||||||||
|
Other |
34.4 | 58.1 | (9.0 | ) | (0.1 | ) | — | 83.4 | 208.7 | (12.0 | ) | 280.1 | ||||||||||||||||||||||||
|
Other than BK and TB |
751.0 | 80.2 | 142.7 | 630.4 | 104.0 | 1,708.3 | 195.3 | (32.3 | ) | 1,871.3 | ||||||||||||||||||||||||||
|
Operating expenses |
1,234.1 | 290.0 | 236.0 | 435.8 | 114.7 | 2,310.6 | 217.4 | 162.3 | 2,690.3 | |||||||||||||||||||||||||||
|
|
|
|
|
|
|
|
|
|
|
|
|
|
|
|
|
|
|
|||||||||||||||||||
|
Operating profit (loss) |
¥ | 333.9 | ¥ | 237.1 | ¥ | 182.3 | ¥ | 192.8 | ¥ | 62.0 | ¥ | 1,008.1 | ¥ | 469.4 | ¥ | (106.0 | ) | ¥ | 1,371.5 | |||||||||||||||||
|
|
|
|
|
|
|
|
|
|
|
|
|
|
|
|
|
|
|
|||||||||||||||||||
Notes:
| (1) | In accordance with internal management accounting rules and practices, the transfer of corporate loan-related businesses of Mitsubishi UFJ Trust and Banking to MUFG Bank in April 2018 resulted in a decrease of the total operating profit by ¥24.3 billion for the fiscal year ended March 31, 2017. |
| (2) | “BK and TB” is a sum of MUFG Bank on a stand-alone basis and Mitsubishi UFJ Trust and Banking on a stand-alone basis. |
| Customer Business | ||||||||||||||||||||||||||||||||||||
|
Fiscal year ended March 31, 2018 |
Retail &
Commercial Banking Business Group |
Japanese
Corporate & Investment Banking Business Group |
Global
Corporate & Investment Banking Business Group |
Global
Commercial Banking Business Group |
Asset
Management & Investor Services Business Group |
Total |
Global
Markets Business Group |
Other | Total (1) | |||||||||||||||||||||||||||
| (in billions) | ||||||||||||||||||||||||||||||||||||
|
Net revenue |
¥ | 1,584.3 | ¥ | 522.6 | ¥ | 378.6 | ¥ | 666.3 | ¥ | 190.4 | ¥ | 3,342.2 | ¥ | 565.2 | ¥ | 10.7 | ¥ | 3,918.1 | ||||||||||||||||||
|
BK and TB (2) : |
785.9 | 439.8 | 246.3 | (3.5 | ) | 83.8 | 1,552.3 | 368.6 | 109.0 | 2,029.9 | ||||||||||||||||||||||||||
|
Net interest income |
465.8 | 150.7 | 95.2 | (3.4 | ) | — | 708.3 | 182.0 | 229.4 | 1,119.7 | ||||||||||||||||||||||||||
|
Net fees |
288.4 | 233.2 | 153.1 | — | 83.8 | 758.5 | (12.2 | ) | (79.1 | ) | 667.2 | |||||||||||||||||||||||||
|
Other |
31.7 | 55.9 | (2.0 | ) | (0.1 | ) | — | 85.5 | 198.8 | (41.3 | ) | 243.0 | ||||||||||||||||||||||||
|
Other than BK and TB |
798.4 | 82.8 | 132.3 | 669.8 | 106.6 | 1,789.9 | 196.6 | (98.3 | ) | 1,888.2 | ||||||||||||||||||||||||||
|
Operating expenses |
1,227.6 | 295.6 | 242.8 | 463.6 | 119.4 | 2,349.0 | 225.7 | 142.8 | 2,717.5 | |||||||||||||||||||||||||||
|
|
|
|
|
|
|
|
|
|
|
|
|
|
|
|
|
|
|
|||||||||||||||||||
|
Operating profit (loss) |
¥ | 356.7 | ¥ | 227.0 | ¥ | 135.8 | ¥ | 202.7 | ¥ | 71.0 | ¥ | 993.2 | ¥ | 339.5 | ¥ | (132.1 | ) | ¥ | 1,200.6 | |||||||||||||||||
|
|
|
|
|
|
|
|
|
|
|
|
|
|
|
|
|
|
|
|||||||||||||||||||
Notes:
| (1) | In accordance with internal management accounting rules and practices, the transfer of corporate loan-related businesses of Mitsubishi UFJ Trust and Banking to MUFG Bank in April 2018 resulted in a decrease of the total operating profit by ¥23.5 billion for the fiscal year ended March 31, 2018. |
| (2) | “BK and TB” is a sum of MUFG Bank on a stand-alone basis and Mitsubishi UFJ Trust and Banking on a stand-alone basis. |
98
Table of Contents
| Customer Business | ||||||||||||||||||||||||||||||||||||
|
Fiscal year ended March 31, 2019 |
Retail &
Commercial Banking Business Group |
Japanese
Corporate & Investment Banking Business Group |
Global
Corporate & Investment Banking Business Group |
Global
Commercial Banking Business Group |
Asset
Management & Investor Services Business Group |
Total |
Global
Markets Business Group |
Other | Total | |||||||||||||||||||||||||||
| (in billions) | ||||||||||||||||||||||||||||||||||||
|
Net revenue |
¥ | 1,521.6 | ¥ | 541.5 | ¥ | 399.7 | ¥ | 706.9 | ¥ | 203.0 | ¥ | 3,372.7 | ¥ | 472.5 | ¥ | (32.8 | ) | ¥ | 3,812.4 | |||||||||||||||||
|
BK and TB (1) : |
738.6 | 421.6 | 266.6 | (1.4 | ) | 93.2 | 1,518.6 | 303.9 | 38.5 | 1,861.0 | ||||||||||||||||||||||||||
|
Net interest income |
460.4 | 152.1 | 113.6 | (1.4 | ) | — | 724.7 | 183.1 | 237.4 | 1,145.2 | ||||||||||||||||||||||||||
|
Net fees |
243.9 | 213.1 | 152.4 | — | 93.2 | 702.6 | (14.2 | ) | (67.5 | ) | 620.9 | |||||||||||||||||||||||||
|
Other |
34.3 | 56.4 | 0.6 | — | — | 91.3 | 135.0 | (131.4 | ) | 94.9 | ||||||||||||||||||||||||||
|
Other than BK and TB |
783.0 | 119.9 | 133.1 | 708.3 | 109.8 | 1,854.1 | 168.6 | (71.3 | ) | 1,951.4 | ||||||||||||||||||||||||||
|
Operating expenses |
1,222.8 | 291.8 | 247.0 | 486.5 | 124.6 | 2,372.7 | 221.3 | 146.1 | 2,740.1 | |||||||||||||||||||||||||||
|
|
|
|
|
|
|
|
|
|
|
|
|
|
|
|
|
|
|
|||||||||||||||||||
|
Operating profit (loss) |
¥ | 298.8 | ¥ | 249.7 | ¥ | 152.7 | ¥ | 220.4 | ¥ | 78.4 | ¥ | 1,000.0 | ¥ | 251.2 | ¥ | (178.9 | ) | ¥ | 1,072.3 | |||||||||||||||||
|
|
|
|
|
|
|
|
|
|
|
|
|
|
|
|
|
|
|
|||||||||||||||||||
Note:
| (1) | “BK and TB” is a sum of MUFG Bank on a stand-alone basis and Mitsubishi UFJ Trust and Banking on a stand-alone basis. |
Fiscal Year Ended March 31, 2019 Compared to Fiscal Year Ended March 31, 2018
Retail & Commercial Banking Business Group
Net revenue of the Retail & Commercial Banking Business Group decreased ¥62.7 billion to ¥1,521.6 billion for the fiscal year ended March 31, 2019 from ¥1,584.3 billion for the fiscal year ended March 31, 2018. The Retail & Commercial Banking Business Group’s net revenue mainly consists of interest income from lending and deposit-taking operations and fees relating to credit card settlement, consumer financing, real estate and stock transfer services for Japanese domestic individual and small to medium-sized corporate customers. The decrease in net revenue was mainly due to a decrease in investment products sales reflecting weaker retail customer demand for investment products under unfavorable market conditions. The decrease was partially offset by higher payment processing fees from the credit card business and higher fees from the consumer finance business as credit card use and consumer lending grew in Japan.
Operating expenses of the Retail & Commercial Banking Business Group decreased ¥4.8 billion to ¥1,222.8 billion for the fiscal year ended March 31, 2019 from ¥1,227.6 billion for the fiscal year ended March 31, 2018. The decrease primarily resulted from our cost reduction measures, partially offset by higher expenses relating to the “Channel Strategy and Business Process Re-engineering” project pursuant to our current medium-term business plan and the system integration for our consumer finance business.
As a result, operating profit of the Retail & Commercial Banking Business Group decreased ¥57.9 billion to ¥298.8 billion for the fiscal year ended March 31, 2019 from ¥356.7 billion for the fiscal year ended March 31, 2018.
Japanese Corporate & Investment Banking Business Group
Net revenue of the Japanese Corporate & Investment Banking Business Group increased ¥18.9 billion to ¥541.5 billion for the fiscal year ended March 31, 2019 from ¥522.6 billion for the fiscal year ended March 31, 2018. The Japanese Corporate & Investment Banking Business Group’s net revenue mainly consists of interest income from lending and deposit-taking operations and fees relating to financing, investment banking, real estate and stock transfer services for large Japanese corporate customers. The increase in net revenue was mainly due to higher net interest income from foreign currency-denominated loans and deposits reflecting higher interest rate spreads on such loans and deposits and larger balances of such deposits as well as higher fees and commissions from the investment banking business relating to M&A and IPO transactions.
99
Table of Contents
Operating expenses of the Japanese Corporate & Investment Banking Business Group decreased ¥3.8 billion to ¥291.8 billion for the fiscal year ended March 31, 2019 from ¥295.6 billion for the fiscal year ended March 31, 2018. The decrease mainly reflected the results of our cost reduction measures.
As a result, operating profit of the Japanese Corporate & Investment Banking Business Group increased ¥22.7 billion to ¥249.7 billion for the fiscal year ended March 31, 2019 from ¥227.0 billion for the fiscal year ended March 31, 2018.
Global Corporate & Investment Banking Business Group
Net revenue of the Global Corporate & Investment Banking Business Group increased ¥21.1 billion to ¥399.7 billion for the fiscal year ended March 31, 2019 from ¥378.6 billion for the fiscal year ended March 31, 2018. The Global Corporate & Investment Banking Business Group’s net revenue mainly consists of interest income from lending and deposit-taking operations and fees and commissions from investment banking services and foreign exchange and derivatives transactions for large non-Japanese corporate and institutional customers outside Japan. The increase in net revenue was mainly attributable to larger balances of loans and a decline in foreign currency-denominated mid- to long term funding costs as well as the closings of several large event-driven financing deals in the Americas and the Asia and Oceania region.
Operating expenses of the Global Corporate & Investment Banking Business Group increased ¥4.2 billion to ¥247.0 billion for the fiscal year ended March 31, 2019 from ¥242.8 billion for the fiscal year ended March 31, 2018. The increase was mainly attributable to higher expenses for system development and global financial regulatory compliance purposes.
As a result, operating profit of the Global Corporate & Investment Banking Business Group increased ¥16.9 billion to ¥152.7 billion for the fiscal year ended March 31, 2019 from ¥135.8 billion for the fiscal year ended March 31, 2018.
Global Commercial Banking Business Group
Net revenue of the Global Commercial Banking Business Group increased ¥40.6 billion to ¥706.9 billion for the fiscal year ended March 31, 2019 from ¥666.3 billion for the fiscal year ended March 31, 2018. The Global Commercial Banking Business Group’s net revenue mainly consists of interest income from lending and deposit-taking operations and fees from remittances and transfers, consumer finance and wealth-related services for individual and small to medium-sized corporate customers of MUFG Union Bank and Krungsri. The increase in net revenue was mainly due to higher net interest income reflecting an increase in Krungsri’s automobile loan portfolio. The increase in net revenue was also attributable to higher net interest income in MUFG Union Bank mainly reflecting an increase in its retail loan portfolio.
Operating expenses of the Global Commercial Banking Business Group increased ¥22.9 billion to ¥486.5 billion for the fiscal year ended March 31, 2019 from ¥463.6 billion for the fiscal year ended March 31, 2018. The increase was mainly attributable to an increase in expenses in Krungsri primarily reflecting larger volumes of business. The increase in operating expenses was also attributable to an increase in expenses for IT system development projects in the United States.
As a result, operating profit of the Global Commercial Banking Business Group increased ¥17.7 billion to ¥220.4 billion for the fiscal year ended March 31, 2019 from ¥202.7 billion for the fiscal year ended March 31, 2018.
Asset Management & Investor Services Business Group
Net revenue of the Asset Management & Investor Services Business Group increased ¥12.6 billion to ¥203.0 billion for the fiscal year ended March 31, 2019 from ¥190.4 billion for the fiscal year ended March 31,
100
Table of Contents
2018. The Asset Management & Investor Services Business Group’s net revenue mainly consists of fees from asset management and administration services for products, such as pension trusts and mutual funds. The increase in net revenue was primarily attributable to higher fees from investor services both in and outside Japan, reflecting a larger balance of assets under management as we expanded our services to global fund customers and started to offer services for new domestic investment products. The increase in net revenue was also attributable to an increase in investment products sales to domestic corporate investors.
Operating expenses of the Asset Management & Investor Services Business Group increased ¥5.2 billion to ¥124.6 billion for the fiscal year ended March 31, 2019 from ¥119.4 billion for the fiscal year ended March 31, 2018. The increase was mainly attributable to larger volumes of business.
As a result, operating profit of the Asset Management & Investor Services Business Group increased ¥7.4 billion to ¥78.4 billion for the fiscal year ended March 31, 2019 from ¥71.0 billion for the fiscal year ended March 31, 2018.
Global Markets Business Group
Net revenue of the Global Markets Business Group decreased ¥92.7 billion to ¥472.5 billion for the fiscal year ended March 31, 2019 from ¥565.2 billion for the fiscal year ended March 31, 2018. This was mainly due to lower net revenue from the asset and liability management operations, primarily reflecting tighter spreads between long-term and short-term interest rates in the United States as well as lower realized gains on sales of Japanese government bonds. In the fiscal year ended March 31, 2018, we recorded relatively higher realized gains on sales of Japanese government bonds executed in larger volumes in anticipation of greater fluctuations in interest rates in Japan. The decrease in net revenue was also attributable to a decline in customer business reflecting lower volatility in the bond and equity markets.
Operating expenses of the Global Markets Business Group decreased ¥4.4 billion to ¥221.3 billion for the fiscal year ended March 31, 2019 from ¥225.7 billion for the fiscal year ended March 31, 2018. This decrease primarily reflected the results of our cost reduction measures, partially offset by an increase in expenses for financial regulatory compliance purposes.
As a result, operating profit of the Global Markets Business Group decreased ¥88.3 billion to ¥251.2 billion for the fiscal year ended March 31, 2019 from ¥339.5 billion for the fiscal year ended March 31, 2018.
Fiscal Year Ended March 31, 2018 Compared to Fiscal Year Ended March 31, 2017
Retail & Commercial Banking Business Group
Net revenue of the Retail & Commercial Banking Business Group increased ¥16.3 billion to ¥1,584.3 billion for the fiscal year ended March 31, 2018 from ¥1,568.0 billion for the fiscal year ended March 31, 2017. The Retail & Commercial Banking Business Group’s net revenue mainly consists of interest income from lending and deposit-taking operations and fees relating to credit card settlement, consumer financing, real estate and stock transfer services for Japanese domestic individual and small to medium-sized corporate customers. The increase in net revenue was mainly due to an increase in payment processing fees and an increase in fees from the consumer finance business, reflecting growth in the volume of cashless payments. The increase in net revenue was also attributable to an increase in fees and commissions on sales of securities primarily due to stronger customer demand in response to the rising trend in equity prices. These increases in net revenues were partially offset by the lower net revenue related to operations funded by deposits due to tighter interest rate spreads in the near-zero interest rate environment in Japan.
Operating expenses of the Retail & Commercial Banking Business Group decreased ¥6.5 billion to ¥1,227.6 billion for the fiscal year ended March 31, 2018 from ¥1,234.1 billion for the fiscal year ended March 31, 2017, mainly resulting from our cost reduction measures.
101
Table of Contents
As a result, operating profit of the Retail & Commercial Banking Business Group increased ¥22.8 billion to ¥356.7 billion for the fiscal year ended March 31, 2018 from ¥333.9 billion for the fiscal year ended March 31, 2017.
Japanese Corporate & Investment Banking Business Group
Net revenue of the Japanese Corporate & Investment Banking Business Group decreased ¥4.5 billion to ¥522.6 billion for the fiscal year ended March 31, 2018 from ¥527.1 billion for the fiscal year ended March 31, 2017. The Japanese Corporate & Investment Banking Business Group’s net revenue mainly consists of interest income from lending and deposit-taking operations and fees relating to financing, investment banking, real estate and stock transfer services for large Japanese corporate customers. The lower net revenue mainly reflected a decrease in fee income from the sales of derivative instruments and lower net revenues from the M&A and underwriting businesses, mainly reflecting reduced corporate investment and financing activities due to uncertainties surrounding the financial market. The lower net revenue was also attributable to decreases in net interest income related to domestic operations funded by deposits and net revenue from loans to domestic corporate clients due to tighter interest rate spreads in the near-zero interest rate environment in Japan, which more than offset the increases in net interest income related to overseas operations funded by deposits and net revenue from loans to overseas corporate clients.
Operating expenses of the Japanese Corporate & Investment Banking Business Group increased ¥5.6 billion to ¥295.6 billion for the fiscal year ended March 31, 2018 from ¥290.0 billion for the fiscal year ended March 31, 2017. This increase was primarily due to the increased volume of overseas Japanese corporate business and higher expenses for global financial regulatory compliance purposes.
As a result, operating profit of the Japanese Corporate & Investment Banking Business Group decreased ¥10.1 billion to ¥227.0 billion for the fiscal year ended March 31, 2018 from ¥237.1 billion for the fiscal year ended March 31, 2017.
Global Corporate & Investment Banking Business Group
Net revenue of the Global Corporate & Investment Banking Business Group decreased ¥39.7 billion to ¥378.6 billion for the fiscal year ended March 31, 2018 from ¥418.3 billion for the fiscal year ended March 31, 2017. The Global Corporate & Investment Banking Business Group’s net revenue mainly consists of interest income from lending and deposit-taking operations and fees and commissions from investment banking services and foreign exchange and derivatives transactions for large non- Japanese corporate and institutional customers outside Japan. The lower net revenue was mainly due to a decrease in the volume of M&A finance business in the United States as well as the application of stricter business acceptance criteria as part of our effort to improve profitability.
Operating expenses of the Global Corporate & Investment Banking Business Group increased ¥6.8 billion to ¥242.8 billion for the fiscal year ended March 31, 2018 from ¥236.0 billion for the fiscal year ended March 31, 2017, reflecting higher expenses for global financial regulatory compliance purposes.
As a result, operating profit of the Global Corporate & Investment Banking Business Group decreased ¥46.5 billion to ¥135.8 billion for the fiscal year ended March 31, 2018 from ¥182.3 billion for the fiscal year ended March 31, 2017.
Global Commercial Banking Business Group
Net revenue of the Global Commercial Banking Business Group increased ¥37.7 billion to ¥666.3 billion for the fiscal year ended March 31, 2018 from ¥628.6 billion for the fiscal year ended March 31, 2017. The Global Commercial Banking Business Group’s net revenue mainly consists of interest income from lending and
102
Table of Contents
deposit-taking operations and fees from remittances and transfers, consumer finance and wealth-related services for individual and small to medium-sized corporate customers of MUFG Union Bank and Krungsri. The higher net revenue was mainly due to an increase in net interest income reflecting an increase in Krungsri’s automobile and consumer finance loan portfolio.
Operating expenses of the Global Commercial Banking Business Group increased ¥27.8 billion to ¥463.6 billion for the fiscal year ended March 31, 2018 from ¥435.8 billion for the fiscal year ended March 31, 2017, reflecting higher expenses in Krungsri primarily due to increased business volume.
As a result, operating profit of the Global Commercial Banking Business Group increased ¥9.9 billion to ¥202.7 billion for the fiscal year ended March 31, 2018 from ¥192.8 billion for the fiscal year ended March 31, 2017.
Asset Management & Investor Services Business Group
Net revenue of the Asset Management & Investor Services Business Group increased ¥13.7 billion to ¥190.4 billion for the fiscal year ended March 31, 2018 from ¥176.7 billion for the fiscal year ended March 31, 2017. The Asset Management & Investor Services Business Group’s net revenue mainly consists of fees from asset management and administration services for products, such as pension trusts and mutual funds. Net revenue of the Trust Assets Business Group increased mainly due to an increase in income from the fund administration and custody services globally, reflecting the contributions of our recently acquired overseas subsidiaries.
Operating expenses of the Asset Management & Investor Services Business Group increased ¥4.7 billion to ¥119.4 billion for the fiscal year ended March 31, 2018 from ¥114.7 billion for the fiscal year ended March 31, 2017. This was mainly due to the expansion of our fund administration and custody businesses globally through acquisitions.
As a result, operating profit of the Asset Management & Investor Services Business Group increased ¥9.0 billion to ¥71.0 billion for the fiscal year ended March 31, 2018 from ¥62.0 billion for the fiscal year ended March 31, 2017.
Global Markets Business Group
Net revenue of the Global Markets Business Group decreased ¥121.6 billion to ¥565.2 billion for the fiscal year ended March 31, 2018 from ¥686.8 billion for the fiscal year ended March 31, 2017. This was mainly due to a decrease in net revenue from the asset liability management operations, primarily reflecting a decrease in realized gains on sales of foreign government bonds as well as a decrease in interest income due to the reduction of our foreign government bond portfolio and the flattening of the yield curve of U.S. Treasury bonds. The decrease in net revenue was also attributable to lower net revenue from the sales and trading business in Japan, reflecting the low volatility in interest rates.
Operating expenses of the Global Markets Business Group increased ¥8.3 billion to ¥225.7 billion for the fiscal year ended March 31, 2018 from ¥217.4 billion for the fiscal year ended March 31, 2017, reflecting higher expenses in our overseas securities subsidiaries primarily with larger volumes of sales and trading business as well as higher expenses for financial regulatory compliance purposes.
As a result, operating profit of the Global Markets Business Group decreased ¥129.9 billion to ¥339.5 billion for the fiscal year ended March 31, 2018 from ¥469.4 billion for the fiscal year ended March 31, 2017.
The table below sets forth our total revenue, income (loss) before income tax expense (benefit) and net income (loss) attributable to Mitsubishi UFJ Financial Group on a geographic basis for the fiscal years ended
103
Table of Contents
March 31, 2018 and 2019. Assets, income and expenses attributable to foreign operations are allocated to geographical areas based on the domicile of the debtors and customers. In general, we have allocated all direct expenses and a proportionate share of general and administrative expenses to income derived from foreign loans and other transactions by our foreign operations to the relevant foreign geographical areas. Certain charges, such as most impairment charges on goodwill, are recognized as domestic expenses. For further information, see Note 31 to our consolidated financial statements included elsewhere in this Annual Report.
| Fiscal years ended March 31, | ||||||||
| 2018 | 2019 | |||||||
| (in billions) | ||||||||
|
Total revenue (interest income and non-interest income): |
||||||||
|
Domestic |
¥ | 2,127.3 | ¥ | 1,886.4 | ||||
|
|
|
|
|
|||||
|
Foreign: |
||||||||
|
United States of America |
1,337.5 | 1,637.6 | ||||||
|
Europe |
506.2 | 222.3 | ||||||
|
Asia/Oceania excluding Japan |
780.0 | 1,157.9 | ||||||
|
Other areas (1) |
443.1 | 504.4 | ||||||
|
|
|
|
|
|||||
|
Total foreign |
3,066.8 | 3,522.2 | ||||||
|
|
|
|
|
|||||
|
Total |
¥ | 5,194.1 | ¥ | 5,408.6 | ||||
|
|
|
|
|
|||||
|
Income (loss) before income tax expense (benefit): |
||||||||
|
Domestic |
¥ | 439.9 | ¥ | (317.7 | ) | |||
|
|
|
|
|
|||||
|
Foreign: |
||||||||
|
United States of America |
493.7 | 624.6 | ||||||
|
Europe |
332.5 | 48.3 | ||||||
|
Asia/Oceania excluding Japan |
128.9 | 265.2 | ||||||
|
Other areas (1) |
266.8 | 250.4 | ||||||
|
|
|
|
|
|||||
|
Total foreign |
1,221.9 | 1,188.5 | ||||||
|
|
|
|
|
|||||
|
Total |
¥ | 1,661.8 | ¥ | 870.8 | ||||
|
|
|
|
|
|||||
|
Net income (loss) attributable to Mitsubishi UFJ Financial Group |
||||||||
|
Domestic |
¥ | 140.1 | ¥ | (345.1 | ) | |||
|
|
|
|
|
|||||
|
Foreign: |
||||||||
|
United States of America |
447.9 | 573.7 | ||||||
|
Europe |
322.6 | 50.9 | ||||||
|
Asia/Oceania excluding Japan |
92.0 | 214.5 | ||||||
|
Other areas (1) |
225.6 | 224.6 | ||||||
|
|
|
|
|
|||||
|
Total foreign |
1,088.1 | 1,063.7 | ||||||
|
|
|
|
|
|||||
|
Total |
¥ | 1,228.2 | ¥ | 718.6 | ||||
|
|
|
|
|
|||||
Note:
| (1) | Other areas primarily include Canada, Latin America, the Caribbean and the Middle East. |
Fiscal Year Ended March 31, 2019 Compared to Fiscal Year Ended March 31, 2018
Domestic net loss attributable to Mitsubishi UFJ Financial Group for the fiscal year ended March 31, 2019 was ¥345.1 billion, compared to domestic net income attributable to Mitsubishi UFJ Financial Group of ¥140.1 billion for the fiscal year ended March 31, 2018. This was mainly attributable to investment securities losses recorded as a result of our adoption of new guidance on recognition and measurement of financial assets and financial liabilities on April 1, 2018, mainly reflecting lower equity prices in Japan.
104
Table of Contents
Foreign net income attributable to Mitsubishi UFJ Financial Group decreased ¥24.4 billion to ¥1,063.7 billion for the fiscal year ended March 31, 2019 from ¥1,088.1 billion for the fiscal year ended March 31, 2018. The decrease in foreign net income was mainly due to lower net trading account profits and lower foreign exchange gains in Europe, partially offset by higher net income in the United States and Asia/Oceania excluding Japan.
Effect of Change in Exchange Rates on Foreign Currency Translation
Fiscal Year Ended March 31, 2019 Compared to Fiscal Year Ended March 31, 2018
The average exchange rate for the fiscal year ended March 31, 2019 was ¥110.91 per U.S.$1.00, compared to the average exchange rate of ¥110.85 per U.S.$1.00 for the previous fiscal year. The average exchange rate for the conversion of the U.S. dollar financial statements of some of our foreign subsidiaries for the fiscal year ended December 31, 2018 was ¥110.43 per U.S.$1.00, compared to the average exchange rate for the fiscal year ended December 31, 2017 of ¥112.19 per U.S.$1.00.
The change in the average exchange rate of the Japanese yen against the U.S. dollar and other foreign currencies had the effect of decreasing total revenue by ¥21.6 billion, net interest income by ¥9.3 billion and income before income tax expense by ¥5.4 billion, respectively, for the fiscal year ended March 31, 2019.
| B. |
Liquidity and Capital Resources |
Total Assets
Our total assets as of March 31, 2019 were ¥305,228.9 billion, an increase of ¥4,658.6 billion from ¥300,570.3 billion as of March 31, 2018. The increase in total assets mainly reflected an increase in trading account assets of ¥5,389.9 billion and an increase in receivables under resale agreements of ¥5,248.8 billion, which were partially offset by a decrease in receivables under securities borrowing transactions of ¥6,510.2 billion.
The following table shows our total assets as of March 31, 2018 and 2019 by geographic region based principally on the domicile of the obligors:
| As of March 31, | ||||||||
| 2018 | 2019 | |||||||
| (in billions) | ||||||||
|
Japan |
¥ | 196,121.5 | ¥194,070.5 | |||||
|
Foreign: |
||||||||
|
United States |
44,831.7 | 49,987.4 | ||||||
|
Europe |
22,342.6 | 21,535.3 | ||||||
|
Asia/Oceania excluding Japan |
27,163.1 | 27,993.0 | ||||||
|
Other areas (1) |
10,111.4 | 11,642.7 | ||||||
|
|
|
|
|
|||||
|
Total foreign |
104,448.8 | 111,158.4 | ||||||
|
|
|
|
|
|||||
|
Total |
¥ | 300,570.3 | ¥305,228.9 | |||||
|
|
|
|
|
|||||
Note:
| (1) | Other areas primarily include Canada, Latin America, the Caribbean and the Middle East. |
We have allocated a substantial portion of our assets to international activities. As a result, reported amounts are affected by changes in the exchange rates of the Japanese yen against the U.S. dollar and other foreign currencies. Foreign assets are denominated primarily in the U.S. dollar. The Japanese yen amount of foreign
105
Table of Contents
currency-denominated assets increases as major foreign currencies appreciate against the Japanese yen. For example, as of March 31, 2019, the exchange rate was ¥110.99 per U.S.$1.00, as compared with ¥106.24 as of March 31, 2018. This depreciation of the Japanese yen against the U.S. dollar and other foreign currencies between March 31, 2018 and March 31, 2019 resulted in a ¥768.6 billion increase in the Japanese yen amount of our total assets as of March 31, 2019.
106
Table of Contents
Loan Portfolio
The following table sets forth our loans outstanding, before deduction of allowance for credit losses, as of March 31, 2018 and 2019, based on the industry segment loan classifications as defined by the Bank of Japan for regulatory reporting purposes, which is not necessarily based on the use of proceeds:
| As of March 31, | ||||||||
| 2018 | 2019 | |||||||
| (in billions) | ||||||||
|
Domestic: |
||||||||
|
Manufacturing |
¥ | 10,876.6 | ¥ | 11,154.0 | ||||
|
Construction |
781.3 | 717.7 | ||||||
|
Real estate |
11,763.8 | 11,706.4 | ||||||
|
Services |
2,689.1 | 2,653.2 | ||||||
|
Wholesale and retail |
7,989.1 | 7,643.4 | ||||||
|
Banks and other financial institutions (1) |
4,818.4 | 5,213.0 | ||||||
|
Communication and information services |
1,551.5 | 1,510.6 | ||||||
|
Other industries |
8,939.3 | 8,756.5 | ||||||
|
Consumer |
16,287.3 | 15,802.0 | ||||||
|
|
|
|
|
|||||
|
Total domestic |
65,696.4 | 65,156.8 | ||||||
|
|
|
|
|
|||||
|
Foreign: |
||||||||
|
Governments and official institutions |
920.5 | 841.7 | ||||||
|
Banks and other financial institutions (1) |
12,851.6 | 11,641.4 | ||||||
|
Commercial and industrial |
30,591.2 | 31,951.1 | ||||||
|
Other |
7,270.9 | 7,597.5 | ||||||
|
|
|
|
|
|||||
|
Total foreign |
51,634.2 | 52,031.7 | ||||||
|
|
|
|
|
|||||
|
Unearned income, unamortized premium—net and deferred loan fees—net |
(294.7 | ) | (304.6 | ) | ||||
|
|
|
|
|
|||||
|
Total (2) |
¥ | 117,035.9 | ¥ | 116,883.9 | ||||
|
|
|
|
|
|||||
Notes:
| (1) | Loans to so-called “non-bank finance companies” are generally included in the “Banks and other financial institutions” category. Non-bank finance companies are primarily engaged in consumer lending, factoring and credit card businesses. |
| (2) | The above table includes loans held for sale of ¥226.9 billion and ¥291.8 billion as of March 31, 2018 and 2019, respectively, which are carried at the lower of cost or fair value. |
Loans are one of our main uses of funds. For the fiscal year ended March 31, 2019, the average balance of loans was ¥118,102.2 billion, accounting for 48.9% of the average total interest-earning assets, compared to ¥117,765.1 billion, representing 49.3% of the average total interest-earning assets, for the previous fiscal year. As of March 31, 2019, our total loans were ¥116,883.9 billion, accounting for 38.3% of total assets, compared to ¥117,035.9 billion, accounting for 38.9% of total assets as of March 31, 2018. As a percentage of total loans before unearned income, net unamortized premiums and net deferred loan fees, between March 31, 2018 and March 31, 2019, domestic loans decreased from 56.0% to 55.6%, while foreign loans increased from 44.0% to 44.4%.
Our domestic loan balance decreased ¥539.6 billion, or 0.8%, between March 31, 2018 and March 31, 2019. This was mainly due to a decrease in residential loans, which are included in the consumer category in the above table, as repayments exceeded newly extended loans.
Our foreign loan balance increased ¥397.5 billion, or 0.8%, between March 31, 2018 and March 31, 2019. This was primarily due to increased lending activity in the United States and Asia excluding Japan where economic conditions continued to improve at a moderate pace. In particular, larger volumes of retail, consumer and residential loans in MUFG Union Bank and automobile loans in Krungsri contributed to the increase in the foreign loan balance.
107
Table of Contents
Particularly, retail, consumer and residential loans in MUFG Americas Holdings and automobile loans in Krungsri were attributable to growth of foreign loan balance.
Credit quality indicator
The following table sets forth credit quality indicators of loans by class as of March 31, 2018 and 2019:
|
As of March 31, 2018: |
Normal |
Close
Watch |
Likely to become
Bankrupt or Legally/ Virtually Bankrupt |
Total (1) | ||||||||||||
| (in billions) | ||||||||||||||||
|
Commercial |
||||||||||||||||
|
Domestic |
¥ | 49,050.3 | ¥ | 1,691.0 | ¥ | 271.4 | ¥ | 51,012.7 | ||||||||
|
Manufacturing |
10,215.5 | 596.7 | 57.7 | 10,869.9 | ||||||||||||
|
Construction |
727.9 | 43.7 | 9.1 | 780.7 | ||||||||||||
|
Real estate |
11,379.3 | 279.9 | 32.7 | 11,691.9 | ||||||||||||
|
Services |
2,467.5 | 175.8 | 24.1 | 2,667.4 | ||||||||||||
|
Wholesale and retail |
7,518.4 | 374.7 | 77.9 | 7,971.0 | ||||||||||||
|
Banks and other financial institutions |
4,800.3 | 10.9 | 1.1 | 4,812.3 | ||||||||||||
|
Communication and information services |
1,491.1 | 48.2 | 11.9 | 1,551.2 | ||||||||||||
|
Other industries |
8,780.5 | 120.5 | 37.0 | 8,938.0 | ||||||||||||
|
Consumer |
1,669.8 | 40.6 | 19.9 | 1,730.3 | ||||||||||||
|
Foreign-excluding MUFG Americas Holdings and Krungsri |
36,049.1 | 569.1 | 108.3 | 36,726.5 | ||||||||||||
|
Loans acquired with deteriorated credit quality |
12.0 | 11.7 | 3.6 | 27.3 | ||||||||||||
|
|
|
|
|
|
|
|
|
|||||||||
|
Total |
¥ | 85,111.4 | ¥ | 2,271.8 | ¥ | 383.3 | ¥ | 87,766.5 | ||||||||
|
|
|
|
|
|
|
|
|
|||||||||
| Accrual | Nonaccrual | Total (1) | ||||||||||
| (in billions) | ||||||||||||
|
Residential |
¥ | 14,012.9 | ¥ | 67.3 | ¥ | 14,080.2 | ||||||
|
Card |
¥ | 528.1 | ¥ | 61.7 | ¥ | 589.8 | ||||||
|
Credit Quality Based on
the Number of Delinquencies |
Credit Quality Based on
Internal Credit Ratings |
Total (1)(2) | ||||||||||||||||||||||
| Accrual | Nonaccrual | Pass |
Special
Mention |
Classified | ||||||||||||||||||||
| (in billions) | ||||||||||||||||||||||||
|
MUFG Americas Holdings |
¥ | 4,360.5 | ¥ | 14.2 | ¥ | 4,509.1 | ¥ | 59.9 | ¥ | 116.8 | ¥ | 9,060.5 | ||||||||||||
| Normal |
Special
Mention |
Substandard or Doubtful
or Doubtful of Loss |
Total (1) | |||||||||||||
| (in billions) | ||||||||||||||||
|
Krungsri |
¥ | 5,284.1 | ¥ | 198.5 | ¥ | 123.1 | ¥ | 5,605.7 | ||||||||
108
Table of Contents
|
As of March 31, 2019: |
Normal |
Close
Watch |
Likely to become
Bankrupt or Legally/ Virtually Bankrupt |
Total (1) | ||||||||||||
| (in billions) | ||||||||||||||||
|
Commercial |
||||||||||||||||
|
Domestic |
¥ | 49,392.0 | ¥ | 1,242.1 | ¥ | 217.7 | ¥ | 50,851.8 | ||||||||
|
Manufacturing |
10,819.6 | 279.9 | 47.9 | 11,147.4 | ||||||||||||
|
Construction |
672.1 | 37.2 | 7.9 | 717.2 | ||||||||||||
|
Real estate |
11,403.6 | 222.8 | 22.5 | 11,648.9 | ||||||||||||
|
Services |
2,436.4 | 174.8 | 20.0 | 2,631.2 | ||||||||||||
|
Wholesale and retail |
7,240.8 | 329.3 | 68.7 | 7,638.8 | ||||||||||||
|
Banks and other financial institutions |
5,199.9 | 7.6 | 0.9 | 5,208.4 | ||||||||||||
|
Communication and information services |
1,465.7 | 34.5 | 10.2 | 1,510.4 | ||||||||||||
|
Other industries |
8,610.5 | 119.6 | 24.9 | 8,755.0 | ||||||||||||
|
Consumer |
1,543.4 | 36.4 | 14.7 | 1,594.5 | ||||||||||||
|
Foreign-excluding MUFG Americas Holdings and Krungsri |
35,418.2 | 562.9 | 112.1 | 36,093.2 | ||||||||||||
|
Loans acquired with deteriorated credit quality |
11.7 | 10.8 | 3.8 | 26.3 | ||||||||||||
|
|
|
|
|
|
|
|
|
|||||||||
|
Total |
¥ | 84,821.9 | ¥ | 1,815.8 | ¥ | 333.6 | ¥ | 86,971.3 | ||||||||
|
|
|
|
|
|
|
|
|
|||||||||
| Accrual | Nonaccrual | Total (1) | ||||||||||
| (in billions) | ||||||||||||
|
Residential |
¥ | 13,661.8 | ¥ | 66.3 | ¥ | 13,728.1 | ||||||
|
Card |
¥ | 516.9 | ¥ | 61.6 | ¥ | 578.5 | ||||||
|
Credit Quality Based on
the Number of Delinquencies |
Credit Quality Based on
Internal Credit Ratings |
Total (1)(2) | ||||||||||||||||||||||
| Accrual | Nonaccrual | Pass |
Special
Mention |
Classified | ||||||||||||||||||||
| (in billions) | ||||||||||||||||||||||||
|
MUFG Americas Holdings |
¥ | 4,752.1 | ¥ | 15.5 | ¥ | 4,699.7 | ¥ | 51.9 | ¥ | 88.4 | ¥ | 9,607.6 | ||||||||||||
| Normal |
Special
Mention |
Substandard or Doubtful
or Doubtful of Loss |
Total (1) | |||||||||||||
| (in billions) | ||||||||||||||||
|
Krungsri |
¥ | 5,682.2 | ¥ | 199.1 | ¥ | 129.2 | ¥ | 6,010.5 | ||||||||
Notes:
| (1) | Total loans in the above table do not include loans held for sale, and represent balances without adjustments in relation to unearned income, unamortized premiums and deferred loan fees. |
| (2) | Total loans of MUFG Americas Holdings do not include FDIC covered loans and small business loans which are not individually rated totaling ¥0.9 billion and ¥0.7 billion as of March 31, 2018 and 2019, respectively. We will be reimbursed for a substantial portion of any future losses on FDIC covered loans under the terms of the FDIC loss share agreements. |
We classify loans into risk categories based on relevant information about the ability of borrowers to service their debt, including, but not limited to, historical and current financial information, historical and current payment experience, credit documentation, public and non-public information about borrowers and current economic trends as deemed appropriate to each segment.
The primary credit quality indicator for loans within all classes of the Commercial segment is the internal credit rating assigned to each borrower based on our internal borrower ratings of 1 through 15 with the rating of
109
Table of Contents
1 assigned to a borrower with the highest quality of credit. When assigning a credit rating to a borrower, we evaluate the borrower’s expected debt-service capability based on various information, including financial and operating information of the borrower as well as information on the industry in which the borrower operates, and the borrower’s business profile, management and compliance system. In evaluating a borrower’s debt-service capability, we also conduct an assessment of the level of earnings and an analysis of the borrower’s net worth. Based on the internal borrower rating, loans within the Commercial segment are categorized as Normal (internal borrower ratings of 1 through 9), Close Watch (internal borrower ratings of 10 through 12), and Likely to become Bankrupt or Legally/Virtually Bankrupt (internal borrower ratings of 13 through 15).
Loans to borrowers categorized as Normal represent those that are not deemed to have collectability issues. Loans to borrowers categorized as Close Watch represent those that require close monitoring as the borrower has begun to exhibit elements of potential concern with respect to its business performance and financial condition, the borrower has begun to exhibit elements of serious concern with respect to its business performance and financial condition, including business problems requiring long-term solutions, or the borrower’s loans are TDRs or loans contractually past due 90 days or more for special reasons. Loans to borrowers categorized as Likely to become Bankrupt or Legally/Virtually Bankrupt represent those that have a higher probability of default than those categorized as Close Watch due to serious debt repayment problems with poor progress in achieving restructuring plans, the borrower being considered virtually bankrupt with no prospects for an improvement in business operations, or the borrower being legally bankrupt with no prospects for continued business operations because of non-payment, suspension of business, voluntary liquidation or filing for legal liquidation.
For more information on our credit and borrower ratings, see “Item 11. Quantitative and Qualitative Disclosures about Credit, Market and Other Risk—Credit Risk Management.”
The accrual status is a primary credit quality indicator for loans within the Residential segment and the Card segment as well as consumer loans within the MUFG Americas Holdings segment. The accrual status of these loans is determined based on the number of delinquent payments.
Commercial loans within the MUFG Americas Holdings segment are categorized as either pass or criticized based on the internal credit rating assigned to each borrower. Criticized credits are those that are internally risk graded as Special Mention, Substandard or Doubtful. Special Mention credits are potentially weak, as the borrower has begun to exhibit deteriorating trends, which, if not corrected, may jeopardize repayment of the loan and result in a further downgrade. Classified credits are those that are internally risk graded as Substandard or Doubtful. Substandard credits have well-defined weaknesses, which, if not corrected, could jeopardize the full satisfaction of the debt. A credit classified as Doubtful has critical weaknesses that make full collection improbable on the basis of currently existing facts and conditions.
Loans within the Krungsri segment are categorized as Normal, Special Mention, and Substandard, which is further divided into Substandard, Doubtful and Doubtful of Loss, primarily based on their delinquency status. Loans categorized as Special Mention generally represent those that have overdue principal repayments or interest payments for a cumulative period exceeding one month commencing from the contractual due date. Loans categorized as Substandard, Doubtful or Doubtful of Loss generally represent those that have overdue principal repayments or interest payments for a cumulative period exceeding three months, commencing from the contractual due date.
For the Commercial, Residential and Card segments, credit quality indicators are based on information as of March 31. For the MUFG Americas Holdings and Krungsri segments, credit quality indicators are generally based on information as of December 31.
110
Table of Contents
Allowance for credit losses
The following table shows a summary of the changes in the allowance for credit losses by portfolio segment for the fiscal years ended March 31, 2018 and 2019:
|
Fiscal year ended March 31, 2018: |
Commercial | Residential | Card |
MUFG
Americas Holdings |
Krungsri | Total | ||||||||||||||||||
| (in billions) | ||||||||||||||||||||||||
|
Allowance for credit losses: |
||||||||||||||||||||||||
|
Balance at beginning of fiscal year |
¥ | 900.7 | ¥ | 67.3 | ¥ | 30.2 | ¥ | 73.7 | ¥ | 110.3 | ¥ | 1,182.2 | ||||||||||||
|
Provision for (reversal of) credit losses |
(297.4 | ) | (22.3 | ) | 23.4 | (9.3 | ) | 64.8 | (240.8 | ) | ||||||||||||||
|
Charge-offs |
134.8 | 3.8 | 22.7 | 14.7 | 56.1 | 232.1 | ||||||||||||||||||
|
Recoveries |
25.0 | 1.3 | 1.2 | 6.1 | 17.5 | 51.1 | ||||||||||||||||||
|
|
|
|
|
|
|
|
|
|
|
|
|
|||||||||||||
|
Net charge-offs |
109.8 | 2.5 | 21.5 | 8.6 | 38.6 | 181.0 | ||||||||||||||||||
|
Others (1) |
(2.4 | ) | — | — | (2.0 | ) | 8.1 | 3.7 | ||||||||||||||||
|
|
|
|
|
|
|
|
|
|
|
|
|
|||||||||||||
|
Balance at end of fiscal year |
¥ | 491.1 | ¥ | 42.5 | ¥ | 32.1 | ¥ | 53.8 | ¥ | 144.6 | ¥ | 764.1 | ||||||||||||
|
|
|
|
|
|
|
|
|
|
|
|
|
|||||||||||||
|
Fiscal year ended March 31, 2019: |
Commercial | Residential | Card |
MUFG
Americas Holdings |
Krungsri | Total | ||||||||||||||||||
| (in billions) | ||||||||||||||||||||||||
|
Allowance for credit losses: |
||||||||||||||||||||||||
|
Balance at beginning of fiscal year |
¥ | 491.1 | ¥ | 42.5 | ¥ | 32.1 | ¥ | 53.8 | ¥ | 144.6 | ¥ | 764.1 | ||||||||||||
|
Provision for (reversal of) credit losses |
(43.9 | ) | (4.5 | ) | 23.9 | 9.3 | 49.5 | 34.3 | ||||||||||||||||
|
Charge-offs |
76.6 | 0.3 | 24.3 | 13.2 | 59.6 | 174.0 | ||||||||||||||||||
|
Recoveries |
17.5 | 0.9 | 0.9 | 3.7 | 21.1 | 44.1 | ||||||||||||||||||
|
|
|
|
|
|
|
|
|
|
|
|
|
|||||||||||||
|
Net charge-offs |
59.1 | (0.6 | ) | 23.4 | 9.5 | 38.5 | 129.9 | |||||||||||||||||
|
Others (1) |
1.5 | — | — | (1.0 | ) | (10.8 | ) | (10.3 | ) | |||||||||||||||
|
|
|
|
|
|
|
|
|
|
|
|
|
|||||||||||||
|
Balance at end of fiscal year |
¥ | 389.6 | ¥ | 38.6 | ¥ | 32.6 | ¥ | 52.6 | ¥ | 144.8 | ¥ | 658.2 | ||||||||||||
|
|
|
|
|
|
|
|
|
|
|
|
|
|||||||||||||
Note:
| (1) | Others are principally comprised of gains or losses from foreign exchange translation. |
111
Table of Contents
Allowance for credit losses and recorded investment in loans by portfolio segment as of March 31, 2018 and 2019 are shown below:
|
As of March 31, 2018: |
Commercial | Residential | Card |
MUFG
Americas Holdings |
Krungsri | Total | ||||||||||||||||||
| (in billions) | ||||||||||||||||||||||||
|
Allowance for credit losses: |
||||||||||||||||||||||||
|
Individually evaluated for impairment |
¥ | 414.8 | ¥ | 16.6 | ¥ | 21.2 | ¥ | 7.7 | ¥ | 29.4 | ¥ | 489.7 | ||||||||||||
|
Collectively evaluated for impairment |
64.3 | 24.7 | 10.9 | 45.6 | 115.2 | 260.7 | ||||||||||||||||||
|
Loans acquired with deteriorated credit quality |
12.0 | 1.2 | 0.0 | 0.5 | 0.0 | 13.7 | ||||||||||||||||||
|
|
|
|
|
|
|
|
|
|
|
|
|
|||||||||||||
|
Total |
¥ | 491.1 | ¥ | 42.5 | ¥ | 32.1 | ¥ | 53.8 | ¥ | 144.6 | ¥ | 764.1 | ||||||||||||
|
|
|
|
|
|
|
|
|
|
|
|
|
|||||||||||||
|
Loans: |
||||||||||||||||||||||||
|
Individually evaluated for impairment |
¥ | 978.0 | ¥ | 110.2 | ¥ | 66.9 | ¥ | 82.5 | ¥ | 84.1 | ¥ | 1,321.7 | ||||||||||||
|
Collectively evaluated for impairment |
86,761.2 | 13,961.3 | 512.5 | 8,963.7 | 5,515.4 | 115,714.1 | ||||||||||||||||||
|
Loans acquired with deteriorated credit quality |
27.3 | 8.7 | 10.4 | 15.2 | 6.2 | 67.8 | ||||||||||||||||||
|
|
|
|
|
|
|
|
|
|
|
|
|
|||||||||||||
|
Total (1) |
¥ | 87,766.5 | ¥ | 14,080.2 | ¥ | 589.8 | ¥ | 9,061.4 | ¥ | 5,605.7 | ¥ | 117,103.6 | ||||||||||||
|
|
|
|
|
|
|
|
|
|
|
|
|
|||||||||||||
|
As of March 31, 2019: |
Commercial | Residential | Card |
MUFG
Americas Holdings |
Krungsri | Total | ||||||||||||||||||
| (in billions) | ||||||||||||||||||||||||
|
Allowance for credit losses: |
||||||||||||||||||||||||
|
Individually evaluated for impairment |
¥ | 313.0 | ¥ | 14.1 | ¥ | 21.8 | ¥ | 8.3 | ¥ | 28.3 | ¥ | 385.5 | ||||||||||||
|
Collectively evaluated for impairment |
63.3 | 23.4 | 10.8 | 44.3 | 116.5 | 258.3 | ||||||||||||||||||
|
Loans acquired with deteriorated credit quality |
13.3 | 1.1 | 0.0 | 0.0 | 0.0 | 14.4 | ||||||||||||||||||
|
|
|
|
|
|
|
|
|
|
|
|
|
|||||||||||||
|
Total |
¥ | 389.6 | ¥ | 38.6 | ¥ | 32.6 | ¥ | 52.6 | ¥ | 144.8 | ¥ | 658.2 | ||||||||||||
|
|
|
|
|
|
|
|
|
|
|
|
|
|||||||||||||
|
Loans: |
||||||||||||||||||||||||
|
Individually evaluated for impairment |
¥ | 880.0 | ¥ | 102.9 | ¥ | 64.8 | ¥ | 69.8 | ¥ | 83.2 | ¥ | 1,200.7 | ||||||||||||
|
Collectively evaluated for impairment |
86,065.0 | 13,617.8 | 510.4 | 9,527.3 | 5,921.4 | 115,641.9 | ||||||||||||||||||
|
Loans acquired with deteriorated credit quality |
26.3 | 7.4 | 3.3 | 11.2 | 5.9 | 54.1 | ||||||||||||||||||
|
|
|
|
|
|
|
|
|
|
|
|
|
|||||||||||||
|
Total (1) |
¥ | 86,971.3 | ¥ | 13,728.1 | ¥ | 578.5 | ¥ | 9,608.3 | ¥ | 6,010.5 | ¥ | 116,896.7 | ||||||||||||
|
|
|
|
|
|
|
|
|
|
|
|
|
|||||||||||||
Note:
| (1) | Total loans in the above table do not include loans held for sale, and represent balances without adjustments in relation to unearned income, unamortized premiums and deferred loan fees. |
We recorded ¥34.3 billion of provision for credit losses for the fiscal year ended March 31, 2019, compared to ¥240.8 billion of reversal of credit losses for the previous fiscal year. Our total allowance for credit losses as of March 31, 2019 was ¥658.2 billion, a decrease of ¥105.9 billion from ¥764.1 billion as of March 31, 2018. The total allowance for credit losses represented 0.56% of the total loan balance as of March 31, 2019, compared to 0.65% as of March 31, 2018. Significant trends in each portfolio segment are discussed below.
Commercial segment —We recorded ¥43.9 billion of reversal of credit losses for the fiscal year ended March 31, 2019, compared to ¥297.4 billion of reversal of credit losses for the previous fiscal year. The overall credit quality of domestic borrowers remained on an improving trend, though to a lesser extent, as their financial performance was positively affected by the continued gradual recovery of economic conditions in Japan. The
112
Table of Contents
reversal for the fiscal year ended March 31, 2019 reflected an improvement in the financial condition and the projected cash flows of a large borrower in the domestic electronics manufacturing industry. In addition, the financial performance of foreign borrowers particularly in the oil and gas sector that previously experienced deteriorated repayment ability improved as oil and other commodities prices were stabilizing. The financial performance of a broader number of small and medium-sized borrowers in the domestic manufacturing industry also improved due to the continued gradual recovery of economic conditions in Japan. As a result, the ratio of loans classified as Close Watch to total loans decreased to 2.09% as of March 31, 2019 from 2.59% as of March 31, 2018, and the ratio of loans classified as Likely to become Bankrupt and Legally/Virtually Bankrupt to total loans decreased to 0.38% as of March 31, 2019 from 0.44% as of March 31, 2018. The total allowance for credit losses for this segment represented 0.45% of the segment’s total loan balance as of Mach 31, 2019, compared to 0.56% as of March 31, 2018.
Residential segment —We recorded ¥4.5 billion of reversal of credit losses for the fiscal year ended March 31, 2019, compared to ¥22.3 billion of reversal of credit losses for the previous fiscal year. The stable domestic corporate environment in recent periods has generally contributed to higher income for residential borrowers, resulting in an overall improvement, though to a lesser extent compared to the previous fiscal year, in the credit quality of this segment. The ratio of loans classified as Nonaccrual to total loans in the segment was 0.48% as of March 31, 2019, unchanged from March 31, 2018. The ratio of total allowance for credit losses to the total loan balance in this segment decreased to 0.28% as of March 31, 2019 from 0.30% as of March 31, 2018.
Card segment —We recorded ¥23.9 billion of provision for credit losses for the fiscal year ended March 31, 2019, compared to ¥23.4 billion of the provision for credit losses for the previous fiscal year. The increase in provision for credit losses primarily reflected an increase in default borrowers who filed for bankruptcy as part of their debt workout efforts. Although the stable corporate environment in recent periods positively affected some individual borrowers, the positive trends did not meaningfully affect our consumer loan borrowers and, in some cases, the corporate efficiencies negatively affected some of our consumer loan borrowers. As a result, the ratio of loans classified as Nonaccrual to the total loans in the segment increased to 10.65% as of March 31, 2019, from 10.46% as of March 31, 2018. The ratio of total allowance for credit losses to the total loan balance in this segment increased to 5.63% as of March 31, 2019 from 5.45% as of March 31, 2018.
MUFG Americas Holdings segment —We recorded ¥9.3 billion of provision for credit losses for the fiscal year ended March 31, 2019, compared to ¥9.3 billion of reversal of credit losses for the previous fiscal year. The provision for credit losses mainly reflected the bankruptcy filing of a large borrower in the electric power industry whose financial condition deteriorated as a result of becoming liable for damages caused by wild fires. The reversal of credit losses for the previous fiscal year reflected the improved credit quality of the oil and gas loan portfolio. As the total loan balance increased, the ratio of loans classified as Special Mention or below and Nonaccrual to total loans in the segment decreased to 1.62% as of March 31, 2019 from 2.11% as of March 31, 2018. The ratio of total allowance for credit losses to the total loan balance in this segment decreased to 0.55% as of March 31, 2019 from 0.59% as of March 31, 2018.
Krungsri segment —We recorded ¥49.5 billion of provision for credit losses for the fiscal year ended March 31, 2019, compared to ¥64.8 billion of provision for credit losses for the previous fiscal year. The smaller provision for credit losses mainly reflected the improved credit quality of the small and medium-sized enterprise loan portfolio where gradually stabilizing economic conditions in Thailand resulted in fewer borrowers experiencing deterioration in their financial performance. The ratio of loans classified as Special Mention or below to total loans in the segment decreased to 5.46% as of March 31, 2019 from 5.74% as of March 31, 2018. The ratio of total allowance for credit losses to the total loan balance in this segment decreased to 2.41% as of March 31, 2019 from 2.58% as of March 31, 2018.
When there is an improvement in asset quality, reversal of credit losses is recorded in our consolidated statements of income to maintain the allowance for credit losses at a level management deems appropriate.
113
Table of Contents
Although we reversed allowance for credit losses in recent periods, we have historically provided for credit losses, and in future periods we may need to recognize a provision for credit losses. See “Item 3.D. Key Information—Risk Factors—Risks Related to Our Business—We may suffer additional credit-related losses in the future if our borrowers are unable to repay their loans as expected or if the measures we take in reaction to, or in anticipation of, our borrowers’ deteriorating repayment abilities prove inappropriate or insufficient.”
Allowance policy
We maintain an allowance for credit losses to absorb probable losses inherent in the loan portfolio. We have divided our allowance for credit losses into five portfolio segments—Commercial, Residential, Card, MUFG Americas Holdings and Krungsri.
For all portfolio segments, key elements relating to the policies and discipline used in determining the allowance for credit losses are our credit classification and related borrower categorization process, which are closely linked to the risk grading standards set by the Japanese regulatory authorities for asset evaluation and assessment, and are used as a basis for establishing the allowance for credit losses and charge-offs. The categorization is based on conditions that may affect the ability of borrowers to service their debt, such as current financial condition and results of operations, historical payment experience, credit documentation, other public information and current trends.
For more information on our credit and borrower ratings, see “Item 11. Quantitative and Qualitative Disclosures about Credit, Market and Other Risk—Credit Risk Management.”
For the Commercial, MUFG Americas Holdings and Krungsri segments, our allowance for credit losses primarily consists of allocated allowances. The allocated allowances consist of (1) an allowance for loans individually evaluated for impairment, (2) an allowance for large groups of smaller-balance homogeneous loans, and (3) a formula allowance. The allocated allowance within the Commercial segment also includes an allowance for country risk exposure. The allowance for credit losses within the MUFG Americas Holdings segment also includes an unallocated allowance which captures losses that are attributable to economic events in various industry or geographic sectors whose impact on our loan portfolios in these segments have occurred but have yet to be recognized in the allocated allowance. For the Residential and Card segments, the loans are smaller-balance homogeneous loans that are pooled by the risk ratings based on the number of delinquencies.
For more information on our methodologies used to estimate the allowance for each portfolio segment, see “Summary of Significant Accounting Policies” in Note 1 to our consolidated financial statements included elsewhere in this Annual Report and “—Critical Accounting Estimates—Allowance for Credit Losses” above.
During the fiscal year ended March 31, 2019, we did not make any significant changes to the methodologies and policies used to determine our allowance for credit losses.
Allowance for off-balance sheet credit instruments
We maintain an allowance for credit losses on off-balance sheet credit instruments, including commitments to extend credit, guarantees, standby letters of credit and other financial instruments. The allowance is included in other liabilities. We have adopted for such instruments the same methodology as that which is used in determining the allowance for credit losses on loans.
The allowance for credit losses on off-balance sheet credit instruments was ¥119.3 billion as of March 31, 2019, an increase of ¥37.6 billion from ¥81.7 billion as of March 31, 2018. This increase was primarily because a large domestic borrower in the services industry, in whose favor we have provided guarantees in substantial amounts, began to experience financial difficulty due to a delay of a plant construction project in the United States.
114
Table of Contents
Nonaccrual loans and troubled debt restructurings
We consider a loan to be a nonaccrual loan when substantial doubt exists as to the full and timely payment of interest on, or repayment of, the principal of the loan, which is a borrower condition that generally corresponds to borrowers in categories 13 and below in our internal rating system (which corresponds to “Likely to become Bankrupt,” “Virtually Bankrupt” and “Bankrupt or de facto Bankrupt” status under Japanese banking regulations). Substantially all nonaccrual loans are also impaired loans. Loans are also placed in nonaccrual status when principal or interest is contractually past due one month or more with respect to loans within all classes of the Commercial segment, three months or more with respect to loans within the Card, MUFG Americas Holdings and Krungsri segments, and six months or more with respect to loans within the Residential segment.
We modify certain loans in conjunction with our loss-mitigation activities. Through these modifications, concessions are granted to a borrower who is experiencing financial difficulty, generally in order to minimize economic loss, to avoid foreclosure or repossession of collateral, and to ultimately maximize payments received from the borrower. The concessions granted vary by portfolio segment, by program, and by borrower-specific characteristics, and may include interest rate reductions, term extensions, payment deferrals, and partial principal forgiveness. Loan modifications that represent concessions made to borrowers who are experiencing financial difficulties are identified as troubled debt restructurings, or TDRs. TDRs are also considered impaired loans, and an allowance for credit losses is separately established for each loan.
Generally, accruing loans that are modified in a TDR remain as accruing loans subsequent to the modification, and nonaccrual loans remain as nonaccrual. However, if a nonaccrual loan has been modified as a TDR and the borrower is not delinquent under the modified terms, and demonstrates that its financial condition has improved, we may reclassify the loan to accrual status. This determination is generally performed at least once a year through a detailed internal credit rating review process. Although we have not defined any minimum period to qualify for an upgrade, it is not common for a borrower to be able to demonstrate that its business problems have been resolved or can soon be resolved within a short period of time following a restructuring. If the borrower is upgraded to category 12 or higher in our internal rating system (which corresponds to “Normal” and “Close Watch” status under the Japanese banking regulations), a TDR would be reclassified to accrual status. Once a nonaccrual loan is deemed to be a TDR, we will continue to designate the loan as a TDR even if the loan is reclassified to accrual status.
A loan that has been modified into a TDR is considered to be impaired until it matures, is repaid, or is otherwise liquidated, regardless of whether the borrower performs under the modified terms.
For more information on our credit and borrower ratings, see “Item 11. Quantitative and Qualitative Disclosures about Credit, Market and Other Risk—Credit Risk Management.”
For more information on our TDRs, see Note 4 to our consolidated financial statements included elsewhere in this Annual Report.
115
Table of Contents
Nonaccrual loans
The following table shows information about the nonaccrual status of loans by class as of March 31, 2018 and 2019:
| As of March 31, | ||||||||
| 2018 | 2019 | |||||||
| (in billions) | ||||||||
|
Commercial |
||||||||
|
Domestic |
¥ | 333.0 | ¥ | 272.8 | ||||
|
Manufacturing |
77.2 | 65.9 | ||||||
|
Construction |
10.8 | 9.8 | ||||||
|
Real estate |
33.3 | 23.2 | ||||||
|
Services |
30.7 | 26.2 | ||||||
|
Wholesale and retail |
108.2 | 94.5 | ||||||
|
Banks and other financial institutions |
1.1 | 0.9 | ||||||
|
Communication and information services |
13.8 | 12.0 | ||||||
|
Other industries |
37.6 | 25.4 | ||||||
|
Consumer |
20.3 | 14.9 | ||||||
|
Foreign-excluding MUFG Americas Holdings and Krungsri |
109.5 | 111.0 | ||||||
|
Residential |
69.5 | 68.5 | ||||||
|
Card |
61.4 | 61.4 | ||||||
|
MUFG Americas Holdings |
52.3 | 46.5 | ||||||
|
Krungsri |
121.2 | 127.5 | ||||||
|
|
|
|
|
|||||
|
Total (1) |
¥ | 746.9 | ¥ | 687.7 | ||||
|
|
|
|
|
|||||
Note:
| (1) | The above table does not include loans held for sale of ¥0.1 billion and ¥12.7 billion as of March 31, 2018 and 2019, respectively, and loans acquired with deteriorated credit quality of ¥6.7 billion and ¥6.3 billion as of March 31, 2018 and 2019, respectively. |
Total nonaccrual loans decreased ¥59.2 billion between March 31, 2018 and March 31, 2019. Significant trends in each portfolio segment are discussed below.
Commercial segment —Nonaccrual loans in the domestic commercial category decreased ¥60.2 billion between March 31, 2018 and March 31, 2019. As economic conditions gradually improved in Japan, the amount of loans transferred from accrual status to nonaccrual status decreased. In addition, nonaccrual loans outstanding to medium-sized corporate borrowers decreased, primarily due to repayments and charge-offs. On the other hand, nonaccrual loans in the foreign excluding MUFG Americas Holdings and Krungsri category increased ¥1.5 billion primarily reflecting the deteriorated financial condition of some large borrowers who belong to the electric power industry and the construction industry, partially offset by the transfer to accrual status, or repayments, of loans outstanding to some borrowers in the oil, gas and natural resources sector.
Residential segment —Nonaccrual loans in the segment decreased ¥1.0 billion between March 31, 2018 and March 31, 2019 primarily due to the transfer from nonaccrual status to accrual status of loans to borrowers who became current with their interest payments as the stable corporate environment in recent periods has contributed to higher income for borrowers in the segment. In addition, our efforts to work with borrowers on their loan obligations contributed to the reduction in nonaccrual loans.
Card segment —Nonaccrual loans in the segment remained at the same level between March 31, 2018 and March 31, 2019. Some of our consumer loan borrowers were negatively affected by increased corporate efficiencies, resulting in an increase in nonaccrual loans. However, this increase was offset by the write-offs of loans to borrowers who filed for bankruptcy.
116
Table of Contents
MUFG Americas Holdings segment —Nonaccrual loans in the segment decreased ¥5.8 billion between March 31, 2018 and March 31, 2019. This was mainly due to repayments of loans outstanding to, and the improved repayment ability of, some borrowers in the oil and gas sector that were positively affected by stable oil and gas prices.
Krungsri segment —Nonaccrual loans in the segment increased ¥6.3 billion between March 31, 2018 and March 31, 2019. The increase mainly reflected the expansion of the automobile loan portfolio despite the improved credit quality of the small and medium-sized enterprise loan portfolio where gradually stabilizing economic conditions in Thailand resulted in fewer borrowers experiencing deterioration in their financial performance.
Troubled debt restructurings
The following table shows information about outstanding recorded investment balances of TDRs by class as of March 31, 2018 and 2019:
| As of March 31, | ||||||||
| 2018 | 2019 | |||||||
| (in billions) | ||||||||
|
Commercial (1) |
||||||||
|
Domestic |
¥ | 482.6 | ¥ | 445.4 | ||||
|
Manufacturing |
320.7 | 311.9 | ||||||
|
Construction |
7.4 | 4.6 | ||||||
|
Real estate |
33.3 | 27.7 | ||||||
|
Services |
24.0 | 17.1 | ||||||
|
Wholesale and retail |
70.1 | 69.4 | ||||||
|
Banks and other financial institutions |
0.0 | 0.1 | ||||||
|
Communication and information services |
12.8 | 3.8 | ||||||
|
Other industries |
9.7 | 6.4 | ||||||
|
Consumer |
4.6 | 4.4 | ||||||
|
Foreign-excluding MUFG Americas Holdings and Krungsri |
54.2 | 51.7 | ||||||
|
Residential (1) |
40.7 | 34.4 | ||||||
|
Card (2) |
67.3 | 65.0 | ||||||
|
MUFG Americas Holdings (2) |
65.4 | 48.1 | ||||||
|
Krungsri (2) |
54.0 | 63.0 | ||||||
|
|
|
|
|
|||||
|
Total |
¥ | 764.2 | ¥ | 707.6 | ||||
|
|
|
|
|
|||||
Notes:
| (1) | TDRs for the Commercial and Residential segments include accruing loans with concessions granted, and do not include nonaccrual loans with concessions granted. |
| (2) | TDRs for the Card, MUFG Americas Holdings and Krungsri segments include accrual and nonaccrual loans. Included in the outstanding recorded investment balances as of March 31, 2018 and 2019 are nonaccrual TDRs as follows: ¥38.8 billion and ¥38.8 billion—Card; ¥26.0 billion and ¥15.0 billion—MUFG Americas Holdings; and ¥24.9 billion and ¥31.1 billion—Krungsri, respectively. |
Total TDRs decreased ¥56.6 billion between March 31, 2018 and March 31, 2019. Significant trends in each portfolio segment are discussed below.
Commercial segment —TDRs in the domestic commercial category decreased ¥37.2 billion between March 31, 2018 and March 31, 2019. This was mainly due to a ¥9.0 billion decrease in the domestic communication and information services industry resulting from a charge-off of loans to a large borrower whose financial condition deteriorated. In addition, the decrease in TDRs was attributable to a ¥8.8 billion decrease in the domestic manufacturing industry, mainly reflecting repayments pursuant to restructured loan terms by some medium-sized corporate borrowers.
117
Table of Contents
Residential segment —TDRs in the segment decreased ¥6.3 billion between March 31, 2018 and March 31, 2019 primarily as a result of repayments of loans classified as TDRs pursuant to their respective restructured terms.
Card segment —TDRs in the segment decreased ¥2.3 billion between March 31, 2018 and March 31, 2019 mainly due to charge-offs resulting from borrowers filing for bankruptcy and repayments of loans classified as TDRs pursuant to their respective restructured terms.
MUFG Americas Holdings segment —TDRs in the segment decreased ¥17.3 billion between March 31, 2018 and March 31, 2019. The decrease was mainly due to repayments by borrowers in the oil and gas sector pursuant to their respective restructured loans.
Krungsri segment —TDRs in the segment increased ¥9.0 billion between March 31, 2018 and March 31, 2019. The increase mainly reflected the expansion of the automobile loan portfolio despite the improved credit quality of the small and medium-sized enterprise loan portfolio where gradually stabilizing economic conditions in Thailand resulted in fewer borrowers experiencing deterioration in their financial performance.
In the above table, TDRs for the Commercial and Residential segments include accruing loans with concessions granted, and do not include nonaccrual loans with concessions granted, whereas TDRs for the Card, MUFG Americas Holdings and Krungsri segments include accrual and nonaccrual loans. In the Commercial and Residential segments, once a loan is classified as a nonaccrual loan, a modification would have little likelihood of resulting in the recovery of the loan in view of the severity of the financial difficulty of the borrower. Therefore, even if a nonaccrual loan is modified, the loan continues to be classified as a nonaccrual loan. The vast majority of modifications to nonaccrual loans are temporary extensions of the maturity dates, typically for periods up to 90 days, and continually made as the borrower is unable to repay or refinance the loan at the extended maturity. Accordingly, the impact of such TDRs on the outstanding recorded investment is immaterial, and the vast majority of nonaccrual TDRs have subsequently defaulted.
For the fiscal year ended March 31, 2019, extensions of the stated maturity dates of loans were the primary concession type in the Commercial, Residential and Krungsri segments, reductions in the stated rates were the primary concession type in the Card segment, and loan forbearance was the primary concession type in the MUFG Americas Holdings segment.
Impaired loans and impairment allowance
Impaired loans primarily include nonaccrual loans and TDRs. We consider a loan to be impaired when, based on current information and events, it is probable that we will be unable to collect all of the scheduled payments of interest on, and repayment of, the principal of the loan when due according to the contractual terms of the loan agreement.
118
Table of Contents
The following tables show information about impaired loans by class as of March 31, 2018 and 2019:
| As of March 31, 2018 | ||||||||||||||||||||
| Recorded Loan Balance |
Unpaid
Principal Balance |
Related
Allowance for Credit Losses |
||||||||||||||||||
|
Requiring
an Allowance for Credit Losses |
Not Requiring
an Allowance for Credit Losses (1) |
Total (2) | ||||||||||||||||||
| (in billions) | ||||||||||||||||||||
|
Commercial |
||||||||||||||||||||
|
Domestic |
¥ | 626.5 | ¥ | 189.0 | ¥ | 815.5 | ¥ | 875.8 | ¥ | 331.9 | ||||||||||
|
Manufacturing |
361.2 | 36.6 | 397.8 | 408.1 | 166.1 | |||||||||||||||
|
Construction |
10.9 | 7.2 | 18.1 | 18.5 | 7.9 | |||||||||||||||
|
Real estate |
43.6 | 23.1 | 66.7 | 71.8 | 10.7 | |||||||||||||||
|
Services |
38.1 | 16.6 | 54.7 | 59.3 | 25.9 | |||||||||||||||
|
Wholesale and retail |
128.7 | 49.6 | 178.3 | 189.4 | 94.8 | |||||||||||||||
|
Banks and other financial institutions |
1.1 | 0.0 | 1.1 | 1.2 | 1.0 | |||||||||||||||
|
Communication and information services |
18.8 | 7.8 | 26.6 | 28.1 | 16.0 | |||||||||||||||
|
Other industries |
13.0 | 34.3 | 47.3 | 67.5 | 5.4 | |||||||||||||||
|
Consumer |
11.1 | 13.8 | 24.9 | 31.9 | 4.1 | |||||||||||||||
|
Foreign-excluding MUFG Americas Holdings and Krungsri |
122.3 | 40.2 | 162.5 | 190.5 | 82.9 | |||||||||||||||
|
Loans acquired with deteriorated credit quality |
7.8 | — | 7.8 | 15.5 | 4.3 | |||||||||||||||
|
Residential |
105.1 | 6.2 | 111.3 | 134.7 | 16.9 | |||||||||||||||
|
Card |
67.0 | 0.4 | 67.4 | 74.8 | 21.2 | |||||||||||||||
|
MUFG Americas Holdings |
48.8 | 33.7 | 82.5 | 94.6 | 7.7 | |||||||||||||||
|
Krungsri |
58.5 | 25.6 | 84.1 | 91.0 | 29.4 | |||||||||||||||
|
|
|
|
|
|
|
|
|
|
|
|||||||||||
|
Total (3) |
¥ | 1,036.0 | ¥ | 295.1 | ¥ | 1,331.1 | ¥ | 1,476.9 | ¥ | 494.3 | ||||||||||
|
|
|
|
|
|
|
|
|
|
|
|||||||||||
119
Table of Contents
| As of March 31, 2019 | ||||||||||||||||||||
| Recorded Loan Balance |
Unpaid
Principal Balance |
Related
Allowance for Credit Losses |
||||||||||||||||||
|
Requiring
an Allowance for Credit Losses |
Not Requiring
an Allowance for Credit Losses (1) |
Total (2) | ||||||||||||||||||
| (in billions) | ||||||||||||||||||||
|
Commercial |
||||||||||||||||||||
|
Domestic |
¥ | 560.5 | ¥ | 157.5 | ¥ | 718.0 | ¥ | 759.4 | ¥ | 227.0 | ||||||||||
|
Manufacturing |
349.6 | 28.2 | 377.8 | 384.3 | 92.9 | |||||||||||||||
|
Construction |
8.3 | 6.0 | 14.3 | 14.8 | 6.6 | |||||||||||||||
|
Real estate |
20.8 | 30.0 | 50.8 | 55.9 | 5.7 | |||||||||||||||
|
Services |
30.3 | 13.0 | 43.3 | 46.8 | 20.1 | |||||||||||||||
|
Wholesale and retail |
118.3 | 45.6 | 163.9 | 175.7 | 84.5 | |||||||||||||||
|
Banks and other financial institutions |
1.0 | 0.0 | 1.0 | 1.0 | 0.8 | |||||||||||||||
|
Communication and information services |
8.8 | 6.9 | 15.7 | 16.6 | 6.8 | |||||||||||||||
|
Other industries |
13.8 | 18.0 | 31.8 | 38.4 | 6.9 | |||||||||||||||
|
Consumer |
9.6 | 9.8 | 19.4 | 25.9 | 2.7 | |||||||||||||||
|
Foreign-excluding MUFG Americas Holdings and Krungsri |
127.5 | 34.5 | 162.0 | 183.1 | 86.0 | |||||||||||||||
|
Loans acquired with deteriorated credit quality |
8.1 | — | 8.1 | 15.0 | 5.5 | |||||||||||||||
|
Residential |
97.2 | 6.5 | 103.7 | 120.6 | 14.3 | |||||||||||||||
|
Card |
64.6 | 0.4 | 65.0 | 72.2 | 21.8 | |||||||||||||||
|
MUFG Americas Holdings |
46.6 | 23.2 | 69.8 | 83.3 | 8.3 | |||||||||||||||
|
Krungsri |
57.1 | 26.1 | 83.2 | 90.4 | 28.3 | |||||||||||||||
|
|
|
|
|
|
|
|
|
|
|
|||||||||||
|
Total (3) |
¥ | 961.6 | ¥ | 248.2 | ¥ | 1,209.8 | ¥ | 1,324.0 | ¥ | 391.2 | ||||||||||
|
|
|
|
|
|
|
|
|
|
|
|||||||||||
Notes:
| (1) | These loans do not require an allowance for credit losses because the recorded loan balance equal, or do not exceed, the present value of expected future cash flows discounted at the loans’ effective interest rate, loans’ observable market price, or the fair value of the collateral if the loan is a collateral-dependent loan. |
| (2) | Included in impaired loans as of March 31, 2018 and 2019 are accrual TDRs as follows: ¥536.8 billion and ¥ 497.1 billion—Commercial; ¥40.7 billion and ¥34.4 billion—Residential; ¥28.5 billion and ¥26.2 billion—Card; ¥39.4 billion and ¥33.1 billion—MUFG Americas Holdings; and ¥24.9 billion and ¥26.9 billion—Krungsri, respectively. |
| (3) | In addition to impaired loans presented in the above table, there were loans held for sale that were impaired of ¥0.1 billion and ¥12.7 billion as of March 31, 2018 and 2019, respectively. |
120
Table of Contents
The following table shows information regarding the average recorded loan balance and recognized interest income on impaired loans for the fiscal years ended March 31, 2018 and 2019:
| Fiscal years ended March 31, | ||||||||||||||||
| 2018 | 2019 | |||||||||||||||
|
Average
Recorded Loan Balance |
Recognized
Interest Income |
Average
Recorded Loan Balance |
Recognized
Interest Income |
|||||||||||||
| (in billions) | ||||||||||||||||
|
Commercial |
||||||||||||||||
|
Domestic |
¥ | 918.1 | ¥ | 9.4 | ¥ | 766.8 | ¥ | 12.4 | ||||||||
|
Manufacturing |
472.1 | 3.8 | 387.7 | 6.1 | ||||||||||||
|
Construction |
19.5 | 0.3 | 15.7 | 0.3 | ||||||||||||
|
Real estate |
74.0 | 1.1 | 57.9 | 1.1 | ||||||||||||
|
Services |
59.9 | 0.8 | 48.9 | 1.0 | ||||||||||||
|
Wholesale and retail |
186.4 | 2.3 | 171.7 | 2.9 | ||||||||||||
|
Banks and other financial institutions |
1.7 | 0.0 | 1.3 | 0.0 | ||||||||||||
|
Communication and information services |
25.5 | 0.4 | 22.5 | 0.5 | ||||||||||||
|
Other industries |
50.4 | 0.2 | 39.2 | 0.2 | ||||||||||||
|
Consumer |
28.6 | 0.5 | 21.9 | 0.3 | ||||||||||||
|
Foreign-excluding MUFG Americas Holdings and Krungsri |
209.3 | 4.2 | 160.0 | 3.1 | ||||||||||||
|
Loans acquired with deteriorated credit quality |
8.6 | 0.5 | 7.8 | 0.2 | ||||||||||||
|
Residential |
119.4 | 1.6 | 107.1 | 1.6 | ||||||||||||
|
Card |
69.8 | 2.0 | 66.2 | 1.6 | ||||||||||||
|
MUFG Americas Holdings |
83.5 | 2.0 | 71.2 | 2.3 | ||||||||||||
|
Krungsri |
75.4 | 3.9 | 83.2 | 5.0 | ||||||||||||
|
|
|
|
|
|
|
|
|
|||||||||
|
Total |
¥ | 1,484.1 | ¥ | 23.6 | ¥ | 1,262.3 | ¥ | 26.2 | ||||||||
|
|
|
|
|
|
|
|
|
|||||||||
121
Table of Contents
Past due analysis
Aging of past due loans by class as of March 31, 2018 and 2019 are shown below:
|
As of March 31, 2018: |
1-3 months
Past Due |
Greater
Than 3 months |
Total
Past Due |
Current |
Total
Loans (1) |
Recorded
Investment> 90 Days and Accruing |
||||||||||||||||||
| (in billions) | ||||||||||||||||||||||||
|
Commercial |
||||||||||||||||||||||||
|
Domestic |
¥ | 13.3 | ¥ | 43.9 | ¥ | 57.2 | ¥ | 50,955.5 | ¥ | 51,012.7 | ¥ | 6.4 | ||||||||||||
|
Manufacturing |
1.4 | 1.4 | 2.8 | 10,867.1 | 10,869.9 | — | ||||||||||||||||||
|
Construction |
0.4 | 0.4 | 0.8 | 779.9 | 780.7 | — | ||||||||||||||||||
|
Real estate |
2.1 | 3.2 | 5.3 | 11,686.6 | 11,691.9 | 1.6 | ||||||||||||||||||
|
Services |
1.0 | 0.6 | 1.6 | 2,665.8 | 2,667.4 | 0.0 | ||||||||||||||||||
|
Wholesale and retail |
3.9 | 4.2 | 8.1 | 7,962.9 | 7,971.0 | 1.3 | ||||||||||||||||||
|
Banks and other financial institutions |
— | 0.0 | 0.0 | 4,812.3 | 4,812.3 | — | ||||||||||||||||||
|
Communication and information services |
0.7 | 0.3 | 1.0 | 1,550.2 | 1,551.2 | — | ||||||||||||||||||
|
Other industries |
0.3 | 28.3 | 28.6 | 8,909.4 | 8,938.0 | — | ||||||||||||||||||
|
Consumer |
3.5 | 5.5 | 9.0 | 1,721.3 | 1,730.3 | 3.5 | ||||||||||||||||||
|
Foreign-excluding MUFG Americas Holdings and Krungsri |
12.5 | 19.7 | 32.2 | 36,694.3 | 36,726.5 | 1.1 | ||||||||||||||||||
|
Residential |
78.1 | 19.4 | 97.5 | 13,974.1 | 14,071.6 | 10.8 | ||||||||||||||||||
|
Card |
18.9 | 32.2 | 51.1 | 528.2 | 579.3 | — | ||||||||||||||||||
|
MUFG Americas Holdings |
23.1 | 13.6 | 36.7 | 9,009.5 | 9,046.2 | 0.8 | ||||||||||||||||||
|
Krungsri |
116.7 | 99.3 | 216.0 | 5,383.5 | 5,599.5 | — | ||||||||||||||||||
|
|
|
|
|
|
|
|
|
|
|
|
|
|||||||||||||
|
Total |
¥ | 262.6 | ¥ | 228.1 | ¥ | 490.7 | ¥ | 116,545.1 | ¥ | 117,035.8 | ¥ | 19.1 | ||||||||||||
|
|
|
|
|
|
|
|
|
|
|
|
|
|||||||||||||
122
Table of Contents
|
As of March 31, 2019: |
1-3 months
Past Due |
Greater
Than 3 months |
Total
Past Due |
Current |
Total
Loans (1) |
Recorded
Investment> 90 Days and Accruing |
||||||||||||||||||
| (in billions) | ||||||||||||||||||||||||
|
Commercial |
||||||||||||||||||||||||
|
Domestic |
¥ | 11.6 | ¥ | 30.6 | ¥ | 42.2 | ¥ | 50,809.6 | ¥ | 50,851.8 | ¥ | 6.9 | ||||||||||||
|
Manufacturing |
1.6 | 3.0 | 4.6 | 11,142.8 | 11,147.4 | — | ||||||||||||||||||
|
Construction |
0.2 | 0.1 | 0.3 | 716.9 | 717.2 | 0.0 | ||||||||||||||||||
|
Real estate |
2.1 | 4.2 | 6.3 | 11,642.6 | 11,648.9 | 2.5 | ||||||||||||||||||
|
Services |
0.7 | 0.6 | 1.3 | 2,629.9 | 2,631.2 | 0.0 | ||||||||||||||||||
|
Wholesale and retail |
2.8 | 2.4 | 5.2 | 7,633.6 | 7,638.8 | 0.1 | ||||||||||||||||||
|
Banks and other financial institutions |
— | 0.0 | 0.0 | 5,208.4 | 5,208.4 | — | ||||||||||||||||||
|
Communication and information services |
0.4 | 0.8 | 1.2 | 1,509.2 | 1,510.4 | — | ||||||||||||||||||
|
Other industries |
0.4 | 13.0 | 13.4 | 8,741.6 | 8,755.0 | — | ||||||||||||||||||
|
Consumer |
3.4 | 6.5 | 9.9 | 1,584.6 | 1,594.5 | 4.3 | ||||||||||||||||||
|
Foreign-excluding MUFG Americas Holdings and Krungsri |
10.9 | 20.0 | 30.9 | 36,062.3 | 36,093.2 | 0.2 | ||||||||||||||||||
|
Residential |
62.7 | 16.6 | 79.3 | 13,641.4 | 13,720.7 | 6.6 | ||||||||||||||||||
|
Card |
17.2 | 30.6 | 47.8 | 527.4 | 575.2 | — | ||||||||||||||||||
|
MUFG Americas Holdings |
28.6 | 10.9 | 39.5 | 9,557.6 | 9,597.1 | 2.3 | ||||||||||||||||||
|
Krungsri |
126.3 | 106.8 | 233.1 | 5,771.5 | 6,004.6 | — | ||||||||||||||||||
|
|
|
|
|
|
|
|
|
|
|
|
|
|||||||||||||
|
Total |
¥ | 257.3 | ¥ | 215.5 | ¥ | 472.8 | ¥ | 116,369.8 | ¥ | 116,842.6 | ¥ | 16.0 | ||||||||||||
|
|
|
|
|
|
|
|
|
|
|
|
|
|||||||||||||
Note:
| (1) | Total loans in the above table do not include loans held for sale or loans acquired with deteriorated credit quality and represent balances without adjustments in relation to unearned income, unamortized premiums and deferred loan fees. |
Sales of nonperforming loans
The following table presents comparative data relating to the principal amount of nonperforming loans sold and reversal of allowance for credit losses:
|
Principal
amount of loans (1) |
Allowance
for credit losses (2) |
Loans,
net of allowance |
Reversal of
allowance for credit losses |
|||||||||||||
| (in billions) | ||||||||||||||||
|
For the fiscal year ended March 31, 2018 |
¥ | 117.9 | ¥ | 18.5 | ¥ | 99.4 | ¥ | (6.3 | ) | |||||||
|
For the fiscal year ended March 31, 2019 |
¥ | 8.2 | ¥ | 0.5 | ¥ | 7.7 | ¥ | (15.6 | ) | |||||||
Notes:
| (1) | Represents principal amount after the deduction of charge-offs made before the sales of nonperforming loans. |
| (2) | Represents allowance for credit losses at the latest balance-sheet date. |
While we originate various types of loans to corporate and individual borrowers in Japan and overseas in the normal course of business, we dispose of nonperforming loans in order to improve our loan quality. Most of these nonperforming loans are disposed of by sales to third parties without any continuing involvement.
Through the sale of nonperforming loans to third parties, gains or losses may arise from factors such as a change in the credit quality of the borrowers or the value of the underlying collateral subsequent to the prior reporting date, and the risk appetite and investment policy of the purchasers.
123
Table of Contents
The principal amount of non-performing loans sold in the fiscal year ended March 31, 2019 decreased compared to the previous fiscal year mainly due to decreased sales of nonperforming loans outstanding to borrowers in the Foreign-excluding MUFG Americas Holdings and Krungsri in the Commercial segment.
In connection with the sale of loans, including performing loans, we recorded net gains of ¥2.9 billion and ¥ 20.7 billion for the fiscal years ended March 31, 2018 and 2019, respectively.
Investment Portfolio
Our investment securities primarily consist of Japanese government bonds and marketable equity securities. Japanese government bonds are mostly classified as available-for-sale debt securities. Our investment in Japanese government bonds is a part of our asset and liability management policy with respect to investing the amount of Japanese yen-denominated funds exceeding our net loans. The percentage of our holding of available-for-sale Japanese government bonds to the total investment securities decreased to 53.6% as of March 31, 2019 from 56.3% as of March 31, 2018. We also hold Japanese government bonds that are classified as held-to-maturity debt securities, which accounted for 2.4% of the total investment securities as of March 31, 2019.
Historically, we have held equity securities of some of our customers primarily for strategic purposes, in particular to maintain long-term relationships with these customers. We continue to focus on reducing our investment in equity securities for such purposes in order to reduce the price fluctuation risk in our equity portfolio from a risk management perspective and to respond to applicable regulatory requirements as well as increasing market expectations for us to reduce our equity portfolio. As of March 31, 2018 and 2019, the aggregate book value of our marketable equity securities under Japanese GAAP satisfied the requirements of the legislation prohibiting banks from holding equity securities in excess of their Tier 1 capital. In November 2015, we announced that we would aim to reduce the balance of equity securities held for strategic purposes valued under Japanese GAAP to approximately 10% of our Tier 1 capital over a five-year period. During the fiscal year ended March 31, 2019, we sold down ¥127 billion of equity securities held in our strategic equity investment portfolio valued under Japanese GAAP. As of March 31, 2019, the balance of such securities valued under Japanese GAAP represented 13.4% of our Tier 1 capital. However, various factors, including market conditions and changes in our Tier 1 capital ratio, may affect the amount of equity securities we should sell and our ability to achieve the target as planned.
Investment securities increased ¥1,283.8 billion to ¥44,938.0 billion as of March 31, 2019 from ¥43,654.2 billion as of March 31, 2018, primarily due to an increase in amortized cost of held-to-maturity debt securities, particularly asset-backed securities.
Investment securities other than available-for-sale debt securities, held-to-maturity debt securities and marketable equity securities consist of nonmarketable equity securities, which are included in equity securities on our consolidated balance sheets. Nonmarketable equity securities were primarily carried at cost of ¥619.1 billion as of March 31, 2019 and ¥566.6 billion as of March 31, 2018, respectively, because their fair values were not readily determinable.
Losses resulting from impairment of investment securities, which reflect the decline in value considered to be other than temporary, were ¥0.6 billion for the fiscal year ended March 31, 2019. Such losses were recorded substantially on available-for-sale debt securities, primarily corporate bonds. Losses resulting from impairment of investment securities for the fiscal year ended March 31, 2018 were ¥8.2 billion, consisting ¥6.7 billion of losses on marketable equity securities, ¥0.1 billion of losses on available-for-sale debt securities and ¥1.4 billion of losses on nonmarketable equity securities. Losses resulting from impairment of investment securities for the fiscal year ended March 31, 2019 no longer included impairment of marketable equity securities, which were instead reported as part of net gains or losses from marketable equity securities, pursuant to new guidance on recognition and measurement of financial assets and financial liabilities.
124
Table of Contents
On April 1, 2018, we began to report all of our marketable and nonmarketable equity investment securities as “equity securities” in a line-item separate from available-for-sale debt securities and held-to-maturity debt securities in our consolidated balance sheets. Previously, marketable equity securities were included in available-for-sale securities, and nonmarketable equity securities were included in other investment securities. This reclassification has been retrospectively reflected in the presentation of the relevant amounts as of March 31, 2018 in this Annual Report.
For more information on the relevant accounting changes, see Notes 1 and 3 to our consolidated financial statements included elsewhere in this Annual Report.
The following table shows information regarding the amortized cost, net unrealized gains (losses), and fair value of our available-for-sale debt securities and held-to-maturity debt securities as of March 31, 2018 and 2019.
| As of March 31, | ||||||||||||||||||||||||
| 2018 | 2019 | |||||||||||||||||||||||
|
Amortized
cost |
Fair value |
Net
unrealized gains (losses) |
Amortized
cost |
Fair value |
Net
unrealized gains (losses) |
|||||||||||||||||||
| (in billions) | ||||||||||||||||||||||||
|
Available-for-sale debt securities: |
||||||||||||||||||||||||
|
Japanese government and Japanese government agency bonds |
¥ | 24,272.3 | ¥ | 24,567.9 | ¥ | 295.6 | ¥ | 23,748.6 | ¥ | 24,077.7 | ¥ | 329.1 | ||||||||||||
|
Japanese prefectural and municipal bonds |
1,532.1 | 1,537.4 | 5.3 | 2,204.0 | 2,226.6 | 22.6 | ||||||||||||||||||
|
Foreign government and official institution bonds |
2,207.7 | 2,171.7 | (36.0 | ) | 2,648.9 | 2,641.4 | (7.5 | ) | ||||||||||||||||
|
Corporate bonds |
1,104.8 | 1,119.4 | 14.6 | 1,117.3 | 1,130.7 | 13.4 | ||||||||||||||||||
|
Mortgage-backed securities |
1,727.8 | 1,712.8 | (15.0 | ) | 1,768.2 | 1,746.3 | (21.9 | ) | ||||||||||||||||
|
Asset-backed securities |
1,547.0 | 1,558.3 | 11.3 | 1,494.6 | 1,502.9 | 8.3 | ||||||||||||||||||
|
Other debt securities |
165.0 | 165.6 | 0.6 | 192.9 | 192.9 | 0.0 | ||||||||||||||||||
|
|
|
|
|
|
|
|
|
|
|
|
|
|||||||||||||
|
Total available-for-sale debt securities |
¥ | 32,556.7 | ¥ | 32,833.1 | ¥ | 276.4 | ¥ | 33,174.5 | ¥ | 33,518.5 | ¥ | 344.0 | ||||||||||||
|
|
|
|
|
|
|
|
|
|
|
|
|
|||||||||||||
|
Held-to-maturity debt securities (1) |
¥ | 3,582.9 | ¥ | 3,620.7 | ¥ | 37.8 | ¥ | 4,441.9 | ¥ | 4,452.9 | ¥ | 11.0 | ||||||||||||
|
|
|
|
|
|
|
|
|
|
|
|
|
|||||||||||||
Note:
| (1) | See Note 3 to our consolidated financial statements included elsewhere in this Annual Report for more details. |
Net unrealized gains on available-for-sale debt securities increased ¥67.6 billion to ¥344.0 billion as of March 31, 2019 from ¥276.4 billion as of March 31, 2018. The increase was primarily attributable to a ¥33.5 billion increase in net unrealized gains on Japanese government and Japanese government agency bonds, reflecting a decline in the yield on such bonds. The increase was also attributable to an improvement in net unrealized losses on foreign government and official institutions bonds, reflecting generally declining trends in the yield on such bonds. The increase was offset in part by larger net unrealized losses on mortgage-backed securities.
The amortized cost of available-for-sale debt securities increased ¥617.8 billion to ¥33,174.5 billion as of March 31, 2019 from ¥32,556.7 billion as of March 31, 2018. This increase was mainly attributable to a ¥671.9 billion increase in Japanese prefectural and municipal bonds and a ¥441.2 billion increase in foreign government and official institution bonds. These increases were partially offset by a ¥523.7 billion decrease in Japanese government and Japanese government agency bonds.
125
Table of Contents
The amortized cost of held-to-maturity debt securities increased ¥859.0 billion to ¥4,441.9 billion as of March 31, 2019 from ¥3,582.9 billion as of March 31, 2018. The increase was mainly due to an increase in asset-backed securities.
The following table shows information relating to our equity securities as of March 31, 2018 and 2019:
| As of March 31, | ||||||||
| 2018 | 2019 | |||||||
| (in billions) | ||||||||
|
Equity securities: |
||||||||
|
Marketable equity securities (1) |
¥ | 6,671.6 | ¥ | 6,358.5 | ||||
|
Nonmarketable equity securities: |
||||||||
|
Unlisted preferred securities (2) |
391.1 | 393.3 | ||||||
|
Others (3) |
147.1 | 198.0 | ||||||
|
Investment securities held by investment companies and brokers and dealers (4) |
28.4 | 27.8 | ||||||
|
|
|
|
|
|||||
|
Total |
¥ | 7,238.2 | ¥ | 6,977.6 | ||||
|
|
|
|
|
|||||
Notes:
| (1) | As a result of our adoption of new guidance on recognition and measurement of financial assets and financial liabilities on April 1, 2018, equity securities are measured at fair value with unrealized gains (losses), or holding gains (losses), reflected in net income. This new guidance is not applied retrospectively to March 31, 2018. Prior to adoption, such unrealized gains (losses) were reflected in other comprehensive income. For more information, see Note 1 to our consolidated financial statements included elsewhere in this Annual Report. |
| (2) | These securities are mainly issued by public companies, including preferred stocks issued by Morgan Stanley, preferred securities issued by our non-consolidated funding vehicles, and other unlisted preferred securities issued by several Japanese public companies. Those securities are primarily carried at cost. |
| (3) | These securities are equity securities issued by unlisted companies other than unlisted preferred securities. Those securities are primarily carried at cost. |
| (4) | These investment securities are held by certain subsidiaries subject to specialized industry accounting principles for investment companies and brokers and dealers, and are measured at fair value. |
Equity securities decreased ¥260.6 billion to ¥6,977.6 billion as of March 31, 2019 from ¥7,238.2 billion as of March 31, 2018. The decrease was primarily attributable to a decrease in the fair value of marketable equity securities, as we sold down equity securities for asset and liability management purposes during the fiscal year ended March 31, 2019.
Cash, Due from Banks and Interest-earning Deposits in Other Banks
Cash and due from banks increased ¥1,275.9 billion to ¥33,924.3 billion as of March 31, 2019 from ¥32,648.4 billion as of March 31, 2018. This increase was primarily because we deposited with the Bank of Japan a larger amount of cash received from sales and redemption of Japanese government bonds as we reduced our holdings of such bonds.
Interest-earning deposits in other banks decreased ¥2,562.8 billion to ¥40,646.9 billion as of March 31, 2019 from ¥43,209.7 billion as of March 31, 2018. This decrease was mainly because of a decrease in the balance of our commercial banking subsidiaries’ interest-earning deposits with other banks.
Call Loans, Funds Sold, and Receivables under Resale Agreements
Call loans, funds sold, and receivables under resale agreements increased ¥5,462.4 billion to ¥12,084.7 billion as of March 31, 2019 from ¥6,622.3 billion as of March 31, 2018. This was mainly due to an increase in receivables under resale agreements in reaction to reduced Japanese government bond settlement risk resulting from the shortening of the settlement cycle for Japanese government bonds.
126
Table of Contents
Receivables under Securities Borrowing Transactions
Receivables under securities borrowing transactions decreased ¥6,510.2 billion to ¥2,758.6 billion as of March 31, 2019 from ¥9,268.8 billion as of March 31, 2018. This decrease was mainly in reaction to reduced Japanese government bond settlement risk resulting from the shortening of the settlement cycle for Japanese government bonds.
Trading Account Assets
Trading account assets increased ¥5,389.9 billion to ¥40,576.6 billion as of March 31, 2019 from ¥35,186.7 billion as of March 31, 2018. Trading account assets consist of trading account securities and trading derivative assets. Trading account securities increased ¥4,770.6 billion to ¥27,372.1 billion as of March 31, 2019 from ¥22,601.5 billion as of March 31, 2018. This increase was mainly due to the higher fair values of our trading residential mortgage-backed securities portfolio and foreign government and official institution bond portfolio. Trading derivative assets increased ¥619.3 billion to ¥13,204.5 billion as of March 31, 2019 from ¥12,585.2 billion as of March 31, 2018. This increase was mainly attributable to the higher fair values of interest rate derivatives.
Deferred Tax Assets and Deferred Tax Liabilities
Deferred tax assets and deferred tax liabilities as of March 31, 2019 were ¥89.7 billion and ¥624.1 billion, respectively, compared to ¥68.7 billion and ¥654.1 billion, respectively, as of March 31, 2018. Net deferred tax liabilities as of March 31, 2019 were ¥534.4 billion, compared to ¥585.3 billion as of March 31, 2018. The lower net deferred tax liabilities were primarily due to decreases in net realized gains on trading securities and investment securities.
For more information, see “—A. Operating Results—Results of Operations—Income Tax Expense” and Note 7 to our consolidated financial statements included elsewhere in this Annual Report.
Total Liabilities
As of March 31, 2019, total liabilities were ¥289,244.2 billion, an increase of ¥4,319.7 billion from ¥284,924.5 billion as of March 31, 2018. This was primarily due to an increase of ¥7,090.0 billion in payables under repurchase agreements and an increase of ¥3,606.2 billion in deposits, partially offset by a decrease of ¥7,257.1 billion in securities lending transactions.
Deposits
Deposits are our primary source of funds. The balance of deposits increased ¥3,606.2 billion to ¥199,280.8 billion as of March 31, 2019 from ¥195,674.6 billion as of March 31, 2018. The increase was mainly attributable to an increase in foreign interest-bearing deposits, primarily in the United States and Thailand.
The total average balance of interest-bearing deposits increased ¥2,044.7 billion to ¥166,607.5 billion for the fiscal year ended March 31, 2019 from ¥164,562.8 billion for the fiscal year ended March 31, 2018, mainly due to an increase in domestic deposits.
Payables under Repurchase Agreements
Payables under repurchase agreements increased ¥7,090.0 billion to ¥25,224.6 billion as of March 31, 2019 from ¥18,134.6 billion as of March 31, 2018. This increase was mainly in reaction to reduced Japanese government bond settlement risk resulting from the shortening of the settlement cycle for Japanese government bonds.
127
Table of Contents
Payables under Securities Lending Transactions
Payables under securities lending transactions decreased ¥7,257.1 billion to ¥913.1 billion as of March 31, 2019 from ¥8,170.2 billion as of March 31, 2018. This decrease was mainly in reaction to reduced Japanese government bond settlement risk resulting from the shortening of the settlement cycle for Japanese government bonds.
Long-term debt increased ¥920.9 billion to ¥27,990.5 billion as of March 31, 2019 from ¥27,069.6 billion as of March 31, 2018. This increase was due to additional issuances of bonds by us to meet applicable TLAC and other capital requirements. The average balance of long-term debt for the fiscal year ended March 31, 2019 was ¥28,667.5 billion, an increase of ¥735.5 billion from ¥27,932.0 billion for the previous fiscal year.
Sources of Funding and Liquidity
Our primary source of liquidity is from a large balance of deposits, mainly ordinary deposits, certificates of deposit and time deposits. Time deposits have historically shown a high rollover rate among our corporate customers and individual depositors. The average deposit balance increased to ¥196,393.3 billion for the fiscal year ended March 31, 2019 from ¥192,741.2 billion for the fiscal year ended March 31, 2018. These deposits provide us with a sizable source of stable and low-cost funds. Our average deposits, combined with our average total equity of ¥20,465.9 billion, funded 67.5% of our average total assets of ¥321,292.8 billion during the fiscal year ended March 31, 2019. Our deposits exceeded our loans before allowance for credit losses by ¥82,396.9 billion as of March 31, 2019 compared to ¥78,638.7 billion as of March 31, 2018. As part of our asset and liability management policy, a significant portion of the amount of Japanese yen-denominated funds exceeding our loans has been deposited with the Bank of Japan or invested in Japanese government bonds in recent periods.
The remaining funding was primarily provided by short-term borrowings and long-term senior and subordinated debt. Short-term borrowings consist of call money and funds purchased, payables under repurchase agreements, payables under securities lending transactions, due to trust account, and other short-term borrowings. From time to time, we have issued long-term instruments, including various fixed and floating interest rate senior and subordinated bonds with and without maturities. The balance of our short-term borrowings as of March 31, 2019 was ¥38,055.1 billion, and the average balance of short-term borrowings for the fiscal year ended March 31, 2019 was ¥36,281.9 billion. The balance of our long-term debt as of March 31, 2019 was ¥27,990.5 billion, and the average balance of long-term debt for the fiscal year ended March 31, 2019 was ¥28,667.5 billion. Liquidity may also be provided by the sale of financial assets, including available-for-sale debt securities, marketable equity securities, trading account securities and loans. Additional liquidity may be provided by the maturity of loans.
We manage liquidity separately at certain of our domestic and foreign banking and non-bank subsidiaries because they are subject to separate regulatory requirements, pursue different business models and have distinctive liquidity risk profiles. We manage our group-wide liquidity on a consolidated basis based on the tests and analyses conducted at the subsidiary level. Liquidity risk management measures at the subsidiary level include the following:
| • |
Domestic banking subsidiaries —Our major domestic banking subsidiaries, MUFG Bank and Mitsubishi UFJ Trust and Banking, set liquidity and funding limits designed to maintain their respective requirements for funding from market sources below pre-determined levels for certain periods (e.g., one-day, two-week and one-month). The major domestic banking subsidiaries also monitor the balance of buffer assets they respectively hold, including Japanese government bonds and U.S. Treasury bonds, which can be used for cash funding even in periods of stress. In addition, the major domestic banking subsidiaries regularly perform liquidity stress testing designed to evaluate the impact of |
128
Table of Contents
|
systemic market stress conditions and institution-specific stress events, including credit rating downgrades, on their liquidity positions; |
| • |
Foreign banking subsidiaries —Our major foreign banking subsidiaries, MUFG Americas Holdings and Krungsri, monitors various liquidity metrics, including total available liquidity, the net non-core funding dependence ratio, and minimum liquidity assets, as a tool to maintain a sufficient amount of liquidity and diversity of funding sources to allow the major foreign banking subsidiaries to meet expected obligations in both stable and adverse conditions. In addition, the major foreign banking subsidiaries regularly conduct stress testing, which incorporates both bank-specific and systemic market scenarios that would adversely affect its liquidity position, to facilitate the identification of appropriate remedial measures to help ensure that it maintains adequate liquidity in adverse conditions; |
| • |
Securities subsidiaries —Our securities subsidiaries implement liquidity and funding limits designed to maintain their requirements for funding from market sources below pre-determined levels for specified periods. In addition, the securities subsidiaries regularly conduct analyses designed to assess the period for which they can continue to meet their respective liquidity requirements by selling or pledging assets they respectively hold under scenarios where they are unable to access any additional sources of financing in the market; and |
| • |
Non-bank subsidiaries —Our non-bank subsidiaries, including Mitsubishi UFJ NICOS, regularly conduct cash flow analyses designed to assess their ability to generate sufficient liquidity for specified periods, considering the cash and cash equivalents as well as deposits they respectively hold, and their respective operating income and expenses under scenarios where they are no longer able to obtain funding from markets through issuance of commercial paper, bonds or other instruments. The non-bank subsidiaries also conduct analyses to ensure sufficient liquidity and funding are available from our bank subsidiaries and other financial institutions outside of our group of companies. |
We collect and evaluate the results of the stress tests individually performed by our major subsidiaries to ensure our ability to meet our liquidity requirements on a consolidated basis in stress scenarios.
We manage our funding sources by setting limits on, or targets for, our holdings of buffer assets, primarily Japanese government bonds. As of March 31, 2019, we held ¥24,077.7 billion of Japanese government bonds and government agency bonds as available-for-sale debt securities. We also regard deposits with the Bank of Japan as buffer assets. In addition, our commercial banking subsidiaries manage their funding sources through liquidity-supplying products such as commitment lines and through a liquidity gap, or the excess of cash inflows over cash outflows.
Any downgrade of the credit ratings assigned to us or our major subsidiaries could increase the cost, or decrease the availability, of our funding, particularly in U.S. dollars and other foreign currencies, adversely affect our liquidity position or net interest margin, trigger additional collateral or funding obligations, and result in losses of depositors, investors and counterparties willing or permitted to transact with us, thereby reducing our ability to generate income and weakening our financial position. See “Item 3.D. Key Information—Risk Factors—Risks Related to Our Business—A downgrade of our credit ratings could adversely affect our ability to access and maintain liquidity.”
Liquidity Requirements for Banking Institutions in Japan
We are required to calculate and disclose our LCR calculated in accordance with the methodology prescribed in the FSA guidance that has been adopted to implement the relevant Basel III standard. Starting in the calendar year 2019, we are required to maintain a minimum LCR of 100%. See “Item 4.B. Information on the Company—Business Overview—Supervision and Regulation—Japan—Liquidity Coverage Ratio” and “—B. Liquidity and Capital Resources—Capital Adequacy—Liquidity Coverage Ratios of MUFG and Major Banking Subsidiaries in Japan.”
129
Table of Contents
Total Equity
The following table presents a summary of our total equity as of March 31, 2018 and 2019:
| March 31, 2018 | March 31, 2019 | |||||||
| (in billions, except percentages) | ||||||||
|
Capital stock |
¥ | 2,090.3 | ¥ | 2,090.3 | ||||
|
Capital surplus |
5,740.2 | 5,577.2 | ||||||
|
Retained earnings |
5,185.3 | 8,333.6 | ||||||
|
Retained earnings appropriated for legal reserve |
239.6 | 239.6 | ||||||
|
Unappropriated retained earnings |
4,945.7 | 8,094.0 | ||||||
|
Accumulated net unrealized gains (losses) on investment securities, net of taxes |
2,270.3 | (369.4 | ) | |||||
|
Accumulated other comprehensive income, net of taxes, other than net unrealized gains on investment securities |
207.0 | 85.1 | ||||||
|
Treasury stock, at cost |
(522.9 | ) | (517.2 | ) | ||||
|
|
|
|
|
|||||
|
Total Mitsubishi UFJ Financial Group shareholders’ equity |
¥ | 14,970.2 | ¥ | 15,199.6 | ||||
|
Noncontrolling interests |
675.6 | 785.1 | ||||||
|
|
|
|
|
|||||
|
Total equity |
¥ | 15,645.8 | ¥ | 15,984.7 | ||||
|
|
|
|
|
|||||
|
Ratio of total equity to total assets |
5.21 | % | 5.24 | % | ||||
Mitsubishi UFJ Financial Group shareholders’ equity as of March 31, 2019 was ¥15,199.6 billion, an increase of ¥229.4 billion from ¥14,970.2 billion as of March 31, 2018.
Capital surplus decreased ¥163.0 billion to ¥5,577.2 billion as of March 31, 2019 from ¥5,740.2 billion as of March 31, 2018. This decrease was mainly due to repurchases of shares of our common stock and cancellation of the repurchased shares.
Retained earnings increased ¥3,148.3 billion to ¥8,333.6 billion as of March 31, 2019 from ¥5,185.3 billion as of March 31, 2018, whereas accumulated net unrealized losses on investment securities, net of taxes as of March 31, 2019 was ¥369.4 billion compared to accumulated net unrealized gains on investment securities, net of taxes as of March 31, 2018 of ¥2,270.3 billion. These changes primarily resulted from the adoption of the new accounting guidance described below. We decided to pay our year-end dividend of ¥11 per share of our common stock for the six months ended March 31, 2019, resulting in an annual dividend of ¥22 per share of our common stock for the fiscal year ended March 31, 2019.
Effective April 1, 2018, we adopted new guidance on recognition and measurement of financial assets and financial liabilities and began to measure equity securities at fair value with unrealized gains (losses), or holding gains (losses), on such securities being reflected in net investment securities gains or losses in our consolidated statements of income. Upon adoption, we also recorded an increase in the beginning balance of retained earnings as of April 1, 2018 of ¥2,702 billion, with a corresponding decrease in accumulated net unrealized gains (losses) on investment securities, net of taxes. For more information, see Note 1 to our consolidated financial statements included elsewhere in this Annual Report.
Accumulated other comprehensive income, net of taxes, other than accumulated net unrealized gains on investment securities decreased ¥121.9 billion to ¥85.1 billion as of March 31, 2019 from ¥207.0 billion as of March 31, 2018. The decrease was mainly due to ¥88.7 billion of negative net change in the balance of pension liability adjustments because the investment returns on our pension plans decreased.
As a result of the foregoing, total equity increased ¥338.9 billion to ¥15,984.7 billion as of March 31, 2019 from ¥15,645.8 billion as of March 31, 2018. The ratio of total equity to total assets increased 0.03 percentage points to 5.24% as of March 31, 2019 from 5.21% as of March 31, 2018.
130
Table of Contents
The following table presents information relating to the accumulated net unrealized gains, net of taxes, in respect of available-for-sale investment securities as of March 31, 2018 and 2019:
| March 31, 2018 | March 31, 2019 | |||||||
| (in billions, except percentages) | ||||||||
|
Accumulated net unrealized gains on investment securities, net of taxes (1) |
¥ | 2,270.3 | ¥ | (369.4 | ) | |||
|
Accumulated net unrealized gains on investment securities, net of taxes, to total equity |
14.51 | % | (2.31 | )% | ||||
Note:
| (1) | As a result of our adoption of new guidance on recognition and measurement of financial assets and financial liabilities on April 1, 2018, equity securities are measured at fair value with unrealized gains (losses), or holding gains (losses), reflected in net income. This new guidance is not applied retrospectively to March 31, 2018. Prior to adoption, such unrealized gains (losses) were reflected in other comprehensive income. For more information, see Note 1 to our consolidated financial statements included elsewhere in this Annual Report. |
We are subject to various regulatory capital requirements promulgated by the regulatory authorities of the countries in which we operate. Failure to meet minimum capital requirements can result in mandatory actions being taken by regulators that could have a direct material effect on our consolidated financial statements. Moreover, if our capital ratios are perceived to be low, our counterparties may avoid entering into transactions with us, which in turn could negatively affect our business and operations. For further information, see “Item 3.D. Key Information—Risk Factors—Risks Related to Our Business—We may not be able to maintain our capital ratios and other regulatory ratios above minimum required levels, which could result in various regulatory actions, including the suspension of some or all of our operations.”
We continually monitor our risk-adjusted capital ratios, leverage ratio and TLAC ratios closely, and manage our operations in consideration of the capital requirements. Factors that affect some or all of these ratios include fluctuations in the value of our assets, including our credit risk assets such as loans and equity securities, the risk weights of which depend on the borrowers’ or issuers’ internal ratings, and marketable securities, and fluctuations in the value of the Japanese yen against the U.S. dollar and other foreign currencies, as well as general price levels of Japanese equity securities.
Capital Requirements for Banking Institutions in Japan
Under Japanese regulatory capital requirements, our consolidated capital components, including Common Equity Tier 1, Tier 1, and Tier 2 capital and risk-weighted assets, are calculated based on our consolidated financial statements prepared under Japanese GAAP. Each of the consolidated and stand-alone capital components and risk-weighted assets of our banking subsidiaries in Japan is also calculated based on consolidated and non-consolidated financial statements prepared under Japanese GAAP.
As of March 31, 2019, we were required to maintain a capital conservation buffer of 2.5%, a G-SIB surcharge of 1.5% and a countercyclical buffer of 0.04% in addition to the 4.5% minimum Common Equity Tier 1 capital ratio. See “Item 4.B. Information on the Company—Business Overview—Supervision and Regulation—Japan—Capital adequacy.”
We have been granted approval by the FSA to exclude the majority of our investment in Morgan Stanley from being subject to double gearing adjustments. The approval was granted for a 10-year period, but the approval amount will be phased out by 20% each year starting from March 31, 2019. As of March 31, 2019, a full application of double gearing adjustments with respect to our investment in Morgan Stanley would have reduced our Common Equity Tier 1 capital ratio by approximately 0.9%.
131
Table of Contents
Leverage Requirements for Banking Institutions in Japan
Our consolidated leverage ratio is calculated in accordance with the methodology prescribed in the FSA guidance that has been adopted to implement the relevant Basel III standard. The leverage ratio is designed for monitoring and preventing the build-up of excessive leverage in the banking sector and is expressed as the ratio of Tier 1 capital to total balance sheet assets adjusted in accordance with the FSA guidance. As of March 31, 2019, we were required to maintain a minimum leverage ratio of 3.00%. A G-SIB leverage ratio buffer equal to 50% of the applicable G-SIB capital surcharge is expected to be applied to us in 2022. See “Item 4.B. Information on the Company—Business Overview—Supervision and Regulation—Japan—Leverage Ratio.”
TLAC Requirements for Banking Institutions in Japan
Our External TLAC ratios are calculated in accordance with the methodology prescribed in the FSA guidance that has been adopted to implement the TLAC Principle published by the FSB in November 2015. External TLAC ratios are expressed as the ratio of External TLAC amount to risk-weighted assets or leverage exposure in accordance with the FSA guidance. We are required to maintain External TLAC ratios of 16% on a risk-weighted assets basis and 6% on a leverage exposure basis from March 31, 2019 and 18% on a risk-weighted assets basis and 6.75% on a leverage exposure basis from March 31, 2022. See “Item 4.B. Information on the Company—Business Overview—Supervision and Regulation—Japan—Total loss-absorbing capacity.”
Capital Ratios, Leverage Ratio and TLAC Ratios of MUFG
The table below presents our consolidated total capital components, risk-weighted assets, risk-adjusted capital ratios, leverage ratio and TLAC ratios in accordance with Basel III as of March 31, 2018 and 2019. Underlying figures are calculated in accordance with Japanese banking regulations based on information derived from our consolidated financial statements prepared in accordance with Japanese GAAP, as required by the FSA. The figures in the table below are rounded down. For further information, see Note 22 to our consolidated financial statements included elsewhere in this Annual Report.
|
As of March 31,
2018 |
Minimum
ratios required (1) |
As of March 31,
2019 |
Minimum
ratios required (1) |
|||||||||||||
| (in billions, except percentages) | ||||||||||||||||
|
Capital components: |
||||||||||||||||
|
Common Equity Tier 1 |
¥ | 14,284.9 | ¥ | 14,322.4 | ||||||||||||
|
Additional Tier 1 |
1,966.8 | 1,953.8 | ||||||||||||||
|
Tier 1 capital |
16,251.7 | 16,276.3 | ||||||||||||||
|
Tier 2 capital |
2,543.7 | 2,493.4 | ||||||||||||||
|
Total capital |
¥ | 18,795.4 | ¥ | 18,769.7 | ||||||||||||
|
Risk-weighted assets |
¥ | 113,463.6 | ¥ | 117,091.1 | ||||||||||||
|
Capital ratios: |
||||||||||||||||
|
Common Equity Tier 1 capital |
12.58 | % | 7.51 | % | 12.23 | % | 8.54 | % | ||||||||
|
Tier 1 capital |
14.32 | 9.01 | 13.90 | 10.04 | ||||||||||||
|
Total capital |
16.56 | 11.01 | 16.03 | 12.04 | ||||||||||||
|
Leverage ratio |
5.01 | — | 4.94 | 3.00 | ||||||||||||
|
External TLAC ratios |
||||||||||||||||
|
Risk-weighted assets basis (2) |
— | — | 18.16 | 16.00 | ||||||||||||
|
Leverage exposure basis |
— | — | 7.90 | 6.00 | ||||||||||||
Note:
| (1) | The minimum capital ratios required as of March 31, 2018 include a capital conservation buffer of 1.875% and a G-SIB surcharge of 1.125% and a countercyclical buffer of 0.01%. The minimum capital ratios required as of March 31, 2019 include a capital conservation buffer of 2.5%, a G-SIB surcharge of 1.5% and a countercyclical buffer of 0.04%. |
| (2) | The TLAC ratio on a risk-weighted assets basis and the required minimum ratios as of March 31, 2019 do not include the regulatory capital buffers consisting of a capital conservation buffer of 2.5%, a G-SIB surcharge of 1.5% and a countercyclical buffer of 0.04%. |
132
Table of Contents
Management believes that, as of March 31, 2019, we were in compliance with all capital adequacy requirements to which we were subject.
Our Common Equity Tier 1 capital ratio as of March 31, 2019 was lower compared to the ratio as of March 31, 2018 due to an increase in our risk-weighted assets, more than offsetting the impact of larger Common Equity Tier 1 capital. The increase in risk-weighted assets mainly reflected the increase in credit risks for overseas subsidiaries. The increase in our Common Equity Tier 1 capital was mainly due to larger retained earnings, reflecting the net income.
Capital Ratios and Leverage Ratios of Major Banking Subsidiaries in Japan
The table below presents the risk-adjusted capital ratios and leverage ratios of MUFG Bank and Mitsubishi UFJ Trust and Banking in accordance with Basel III as of March 31, 2018 and 2019. Underlying figures are calculated in accordance with Japanese banking regulations based on information derived from each bank’s consolidated and non-consolidated financial statements prepared in accordance with Japanese GAAP, as required by the FSA. The figures in the table below are rounded down. For further information, see Note 22 to our consolidated financial statements included elsewhere in this Annual Report.
|
As of
March 31, 2018 |
Minimum capital
ratios required |
As of
March 31, 2019 |
Minimum capital
ratios required |
|||||||||||||
|
Consolidated: |
||||||||||||||||
|
MUFG Bank |
||||||||||||||||
|
Common Equity Tier 1 capital ratio |
11.85 | % | 4.50 | % | 10.83 | % | 4.50 | % | ||||||||
|
Tier 1 capital ratio |
13.59 | 6.00 | 12.46 | 6.00 | ||||||||||||
|
Total capital ratio |
15.90 | 8.00 | 14.42 | 8.00 | ||||||||||||
|
Leverage ratio |
4.81 | — | 4.63 | 3.00 | ||||||||||||
|
Mitsubishi UFJ Trust and Banking |
||||||||||||||||
|
Common Equity Tier 1 capital ratio |
16.21 | 4.50 | 19.57 | 4.50 | ||||||||||||
|
Tier 1 capital ratio |
17.67 | 6.00 | 21.26 | 6.00 | ||||||||||||
|
Total capital ratio |
20.03 | 8.00 | 24.40 | 8.00 | ||||||||||||
|
Leverage ratio |
4.71 | — | 5.09 | 3.00 | ||||||||||||
|
Stand-alone: |
||||||||||||||||
|
MUFG Bank |
||||||||||||||||
|
Common Equity Tier 1 capital ratio |
12.54 | 4.50 | 11.69 | 4.50 | ||||||||||||
|
Tier 1 capital ratio |
14.51 | 6.00 | 13.53 | 6.00 | ||||||||||||
|
Total capital ratio |
16.90 | 8.00 | 15.58 | 8.00 | ||||||||||||
|
Leverage ratio |
— | — | 4.84 | 3.00 | ||||||||||||
|
Mitsubishi UFJ Trust and Banking |
||||||||||||||||
|
Common Equity Tier 1 capital ratio |
16.18 | 4.50 | 19.42 | 4.50 | ||||||||||||
|
Tier 1 capital ratio |
17.55 | 6.00 | 21.12 | 6.00 | ||||||||||||
|
Total capital ratio |
19.88 | 8.00 | 24.25 | 8.00 | ||||||||||||
|
Leverage ratio |
— | — | 5.55 | 3.00 | ||||||||||||
Management believes that, as of March 31, 2019, our banking subsidiaries were in compliance with all capital adequacy requirements to which they were subject.
Liquidity Coverage Ratios of MUFG and Major Banking Subsidiaries in Japan
The following table presents the LCRs of MUFG, MUFG Bank and Mitsubishi UFJ Trust and Banking in accordance with Basel III as adopted by the FSA for the periods indicated. The figures underlying the ratios were calculated in accordance with Japanese banking regulations. The percentages in the table below are rounded
133
Table of Contents
down. The required minimum LCR was 90% during the calendar year 2018 and is 100% during the calendar year 2019.
| Three months ended | ||||||||||||||||||||
|
March 31,
2018 (1),(6) |
June 30,
2018 (2),(6) |
September 30,
2018 (3),(6) |
December 31,
2018 (4),(6) |
March 31,
2019 (5),(6) |
||||||||||||||||
|
MUFG (consolidated) |
144.8 | % | 140.3 | % | 138.4 | % | 136.0 | % | 141.2 | % | ||||||||||
|
MUFG Bank (consolidated) |
160.0 | 148.4 | 144.7 | 143.2 | 150.7 | |||||||||||||||
|
MUFG Bank (stand-alone) |
170.4 | 156.2 | 152.8 | 151.5 | 159.0 | |||||||||||||||
|
Mitsubishi UFJ Trust and Banking (consolidated) |
113.8 | 124.4 | 125.1 | 118.7 | 115.2 | |||||||||||||||
|
Mitsubishi UFJ Trust and Banking (stand-alone) |
127.7 | 151.3 | 157.0 | 143.1 | 141.5 | |||||||||||||||
Notes:
| (1) | Each of the ratios is calculated as the average balance of High-Quality Liquid Assets on the business days between January 4, 2018 and March 30 2018 divided by the average amount of net cash outflows for the same fifty-nine business days. |
| (2) | Each of the ratios is calculated as the average balance of High-Quality Liquid Assets on the business days between April 2, 2018 and June 29, 2018 divided by the average amount of net cash outflows for the same sixty-two business days. |
| (3) | Each of the ratios is calculated as the average balance of High-Quality Liquid Assets on the business days between July 2, 2018 and September 28, 2018 divided by the average amount of net cash outflows for the same sixty-two business days. |
| (4) | Each of the ratios is calculated as the average balance of High-Quality Liquid Assets on the business days between October 1, 2018 and December 28, 2018 divided by the average amount of net cash outflows for the same sixty-two business days. |
| (5) | Each of the ratios is calculated as the average balance of High-Quality Liquid Assets on the business days between January 4, 2019 and March 29, 2019 divided by the average amount of net cash outflows for the same fifty-eight business days. |
| (6) | The LCR is to be calculated as an average based on daily values in accordance with the Japanese banking regulations. |
See “—B. Liquidity and Capital Resources—Sources of Funding and Liquidity.”
Capital Requirements for Banking Institutions in the United States
In the United States, MUFG Americas Holdings and MUFG Union Bank are subject to various regulatory capital requirements administered by the U.S. Federal banking agencies. Failure to meet the applicable minimum capital requirements can initiate certain mandatory, and possibly additional discretionary, actions by regulators that, if undertaken, could have a material effect on MUFG Americas Holdings’ consolidated financial statements.
For a more detailed discussion of the applicable capital requirements, see “Item 4.B. Information on the Company—Business Overview—Supervision and Regulation—United States.” See also Note 22 to our consolidated financial statements included elsewhere in this Annual Report.
In addition, as foreign banking organizations that have U.S. branches and agencies and also as entities that are controlled by MUFG, MUFG Bank and Mitsubishi UFJ Trust and Banking are subject to the FRB’s requirements.
134
Table of Contents
Capital Ratios of Banking Subsidiaries in the United States
The table below presents the risk-adjusted capital ratios of MUFG Americas Holdings and MUFG Union Bank, both subsidiaries of MUFG Bank, calculated in accordance with applicable U.S. banking regulations as of December 31, 2017 and 2018:
|
As of
December 31, 2017 |
Minimum capital
ratios required as of December 31, 2017 (1) |
As of
December 31, 2018 |
Minimum capital
ratios required as of December 31, 2018 (2) |
Ratio OCC
requires to be “well capitalized” as of December 2018 |
||||||||||||||||
|
MUFG Americas Holdings: |
||||||||||||||||||||
|
Tier I capital (to risk-weighted assets) |
16.31 | % | 7.250 | % | 13.96 | % | 7.875 | % | — | |||||||||||
|
Tier I capital (to quarterly average assets) (3) |
10.06 | 4.000 | 8.77 | 4.000 | — | |||||||||||||||
|
Total capital (to risk-weighted assets) |
17.76 | 9.250 | 14.60 | 9.875 | — | |||||||||||||||
|
Common Equity Tier I Capital (to risk-weighted assets) |
16.31 | 5.750 | 13.96 | 6.375 | — | |||||||||||||||
|
MUFG Union Bank: |
||||||||||||||||||||
|
Tier I capital (to risk-weighted assets) |
16.17 | % | 7.250 | % | 14.45 | % | 7.875 | % | 8.0 | % | ||||||||||
|
Tier I capital (to quarterly average assets) (3) |
11.78 | 4.000 | 10.61 | 4.000 | 5.0 | |||||||||||||||
|
Total capital (to risk-weighted assets) |
17.68 | 9.250 | 15.09 | 9.875 | 10.0 | |||||||||||||||
|
Common Equity Tier I Capital (to risk-weighted assets) |
16.17 | 5.750 | 14.45 | 6.375 | 6.5 | |||||||||||||||
Notes:
| (1) | Beginning January 1, 2017, the minimum capital requirement includes a capital conservation buffer of 1.250%. |
| (2) | Beginning January 1, 2018, the minimum capital requirement includes a capital conservation buffer of 1.875%. |
| (3) | Excludes certain deductions. |
Management believes that, as of December 31, 2018, MUFG Americas Holdings and MUFG Union Bank were in compliance with all capital adequacy requirements to which they were subject.
As of December 31, 2017 and 2018, the OCC categorized MUFG Union Bank as “well-capitalized.” To be categorized as “well-capitalized,” MUFG Union Bank must maintain minimum ratios of Total and Tier I capital to risk-weighted assets and of Tier I capital to quarterly average assets (leverage ratio) as set forth in the table.
For further information, see Note 22 to our consolidated financial statements included elsewhere in this Annual Report.
Capital Requirements for Securities Firms in Japan and Overseas
We have securities subsidiaries in Japan and overseas, which are also subject to regulatory capital requirements. In Japan, the Financial Instruments and Exchange Act of Japan and related ordinances require financial instruments firms to maintain a minimum capital ratio of 120% calculated as a percentage of capital accounts less certain fixed assets, as determined in accordance with Japanese GAAP, against amounts equivalent to market, counterparty credit and operational risks. Specific guidelines are issued as a ministerial ordinance which details the definition of essential components of the capital ratios, including capital, deductible fixed asset
135
Table of Contents
items and risks, and related measures. Failure to maintain a minimum capital ratio will trigger mandatory regulatory actions. A capital ratio of less than 140% will call for additional regulatory reporting, a capital ratio of less than 120% may result in an order to change the method of business, and a capital ratio of less than 100% may lead to a suspension of all or part of the business for a period of time and cancellation of a registration. Overseas securities subsidiaries are subject to the relevant regulatory capital requirements of the countries or jurisdictions in which they operate.
Capital Ratio of Mitsubishi UFJ Morgan Stanley Securities
As of March 31, 2019, Mitsubishi UFJ Morgan Stanley Securities’ capital accounts less certain fixed assets of ¥446.6 billion on a stand-alone basis represented 331.6% of the total amounts equivalent to market, counterparty credit and operational risks. As of the same date, Mitsubishi UFJ Morgan Stanley Securities’ capital accounts less certain fixed assets of ¥469.3 billion on a consolidated basis represented 332.2% of the total amounts equivalent to market, counterparty credit and operational risks. As of March 31, 2018, Mitsubishi UFJ Morgan Stanley Securities’ capital accounts less certain fixed assets of ¥446.5 billion on a stand-alone basis represented 291.2% of the total amounts equivalent to market, counterparty credit and operational risks. As of the same date, Mitsubishi UFJ Morgan Stanley Securities’ capital accounts less certain fixed assets of ¥473.3 billion on a consolidated basis represented 293.2% of the total amounts equivalent to market, counterparty credit and operational risks. These figures are calculated in accordance with Japanese GAAP, pursuant to the Financial Instruments and Exchange Act of Japan.
For further information, see Note 22 to our consolidated financial statements included elsewhere in this Annual Report.
Non-exchange Traded Contracts Accounted for at Fair Value
The use of non-exchange traded or over-the-counter contracts provides us with the ability to adapt to the varied requirements of a wide customer base while mitigating market risks. Non-exchange traded contracts are accounted for at fair value, which is generally based on pricing models or quoted prices for instruments with similar characteristics. Gains or losses on non-exchange traded contracts are included in “Trading account profits (losses)—net” in our consolidated statements of income. The following table summarizes the changes in the fair value of non-exchange traded contracts for the fiscal years ended March 31, 2018 and 2019:
| Fiscal years ended March 31, | ||||||||
| 2018 | 2019 | |||||||
| (in millions) | ||||||||
|
Net fair value of contracts outstanding at beginning of fiscal year |
¥ | 4,373 | ¥ | 1,812 | ||||
|
Changes attributable to contracts realized or otherwise settled during the fiscal year |
(2,126 | ) | (1,212 | ) | ||||
|
Fair value of new contracts entered into during the fiscal year |
— | 356 | ||||||
|
Other changes in fair value, principally revaluation at end of fiscal year |
(435 | ) | 34 | |||||
|
|
|
|
|
|||||
|
Net fair value of contracts outstanding at end of fiscal year |
¥ | 1,812 | ¥ | 990 | ||||
|
|
|
|
|
|||||
136
Table of Contents
The following table summarizes the maturities of non-exchange traded contracts as of March 31, 2019:
| Net fair value of contracts—unrealized gains | ||||||||
|
Prices provided by
other external sources |
Prices based on models and
other valuation methods |
|||||||
| (in millions) | ||||||||
|
Maturity less than 1 year |
¥ | 695 | ¥ | (67 | ) | |||
|
Maturity less than 3 years |
10 | 352 | ||||||
|
Maturity less than 5 years |
— | — | ||||||
|
Maturity 5 years or more |
— | — | ||||||
|
|
|
|
|
|||||
|
Total fair value |
¥ | 705 | ¥ | 285 | ||||
|
|
|
|
|
|||||
| C. | Research and Development, Patents and Licenses, etc. |
Not applicable.
| D. | Trend Information |
See the discussions in “—Business Environment,” “—Recent Developments,” “—A. Operating Results” and “—B. Liquidity and Capital Resources.”
| E. | Off-Balance Sheet Arrangements |
In the normal course of business, we engage in several types of off-balance sheet arrangements to meet the financing needs of customers, including various types of guarantees, credit commitments and commercial letters of credit. The following table summarizes these commitments as of March 31, 2019:
| Amount of commitment by expiration period | ||||||||||||||||
|
1 year
or less |
1-5
years |
Over
5 years |
Total | |||||||||||||
| (in billions) | ||||||||||||||||
|
Guarantees: |
||||||||||||||||
|
Standby letters of credit and financial guarantees |
¥ | 2,792 | ¥ | 838 | ¥ | 271 | ¥ | 3,901 | ||||||||
|
Performance guarantees |
2,332 | 784 | 140 | 3,256 | ||||||||||||
|
Derivative instruments |
29,734 | 20,921 | 7,370 | 58,025 | ||||||||||||
|
Liabilities of trust accounts |
5,884 | 420 | 5,216 | 11,520 | ||||||||||||
|
Others |
12 | 13 | 28 | 53 | ||||||||||||
|
|
|
|
|
|
|
|
|
|||||||||
|
Total guarantees |
40,754 | 22,976 | 13,025 | 76,755 | ||||||||||||
|
|
|
|
|
|
|
|
|
|||||||||
|
Other off-balance sheet instruments: |
||||||||||||||||
|
Commitments to extend credit |
49,465 | 25,807 | 2,001 | 77,273 | ||||||||||||
|
Commercial letters of credit |
926 | 131 | — | 1,057 | ||||||||||||
|
Commitments to make investments |
8 | 81 | 151 | 240 | ||||||||||||
|
Others |
— | 5 | — | 5 | ||||||||||||
|
|
|
|
|
|
|
|
|
|||||||||
|
Total other off-balance sheet instruments |
¥ | 50,399 | ¥ | 26,024 | ¥ | 2,152 | ¥ | 78,575 | ||||||||
|
|
|
|
|
|
|
|
|
|||||||||
See Note 25 to our consolidated financial statements included elsewhere in this Annual Report for a description of the nature of our guarantees and other off-balance sheet instruments.
The contractual amounts of these guarantees and other off-balance sheet instruments represent the amounts at risk if the contracts were to be fully drawn upon as a result of a subsequent default by our customer and a decline in the value of the underlying collateral. Since many of these commitments expire without being drawn
137
Table of Contents
upon, the total contractual or notional amounts of these commitments do not necessarily represent our future cash requirements. As of March 31, 2019, approximately 58% of these commitments have an expiration date within one year, 32% have an expiration date from one year to five years, and 10% have an expiration date after five years. Risks relating to off-balance sheet instruments are monitored and managed as a part of our risk management system as set forth in “Item 11. Quantitative and Qualitative Disclosures about Credit, Market and Other Risk.” We evaluate off-balance sheet arrangements in the manner described in Note 1 to our consolidated financial statements included elsewhere in this Annual Report.
The fees generated specifically from off-balance sheet arrangements are not a dominant source of our overall fees and commissions.
Some of our off-balance sheet arrangements are related to activities of special purpose entities, most of which are VIEs. For further information, see Note 26 to our consolidated financial statements included elsewhere in this Annual Report.
| F. | Tabular Disclosure of Contractual Obligations |
The following table shows a summary of our contractual obligations outstanding as of March 31, 2019:
| Payments due by period | ||||||||||||||||||||
|
Less than
1 year |
1-3
years |
3-5
years |
Over
5 years |
Total | ||||||||||||||||
| (in billions) | ||||||||||||||||||||
|
Contractual obligations: |
||||||||||||||||||||
|
Time deposit obligations |
¥ | 56,911 | ¥ | 9,174 | ¥ | 1,283 | ¥ | 866 | ¥ | 68,234 | ||||||||||
|
Estimated interest expense on time deposit obligations (1) |
226 | 30 | 4 | 1 | 261 | |||||||||||||||
|
Long-term debt obligations |
3,048 | 14,183 | 2,981 | 7,771 | 27,983 | |||||||||||||||
|
Capital lease obligations |
6 | 10 | 4 | 3 | 23 | |||||||||||||||
|
Operating lease obligations |
94 | 150 | 107 | 271 | 622 | |||||||||||||||
|
Purchase obligations |
66 | 93 | 79 | 58 | 296 | |||||||||||||||
|
|
|
|
|
|
|
|
|
|
|
|||||||||||
|
Total (2)(3) |
¥ | 60,351 | ¥ | 23,640 | ¥ | 4,458 | ¥ | 8,970 | ¥ | 97,419 | ||||||||||
|
|
|
|
|
|
|
|
|
|
|
|||||||||||
Notes:
| (1) | Contractual obligations related to estimated interest expense on time deposit obligations are calculated by applying the March 31, 2019 weighted-average interest rate on outstanding time deposits. |
| (2) | The total amount of expected future pension payments is not included in the above table or the total amount of commitments outstanding as of March 31, 2019. We expect to contribute approximately ¥33.9 billion for pension and other benefits for our employees for the fiscal year ending March 31, 2020. For further information, see Note 13 to our consolidated financial statements included elsewhere in this Annual Report. |
| (3) | The above table does not include unrecognized tax benefits and interest and penalties related to income tax associated with the guidance on accounting for uncertainty in income taxes as we cannot estimate reasonably the timing of cash settlement of the liabilities for unrecognized tax benefits. The total amount of the liabilities for unrecognized tax benefits is ¥19.2 billion as of March 31, 2019. Among the liabilities for unrecognized tax benefits, it is reasonably possible that the unrecognized tax benefits will decrease by approximately ¥2.6 billion during the next twelve months. For further information, see Note 7 to our consolidated financial statements included elsewhere in this Annual Report. |
Purchase obligations include any legally binding contractual obligations that require us to spend more than ¥100 million annually under the contract. Purchase obligations in the table primarily include commitments to make investments into corporate recovery or private equity investment funds.
| G. | Safe Harbor |
See the discussion under “Forward-Looking Statements.”
138
Table of Contents
| Item 6. |
Directors, Senior Management and Employees. |
| A. |
Directors and Senior Management |
Members of the Board of Directors
The following table sets forth the members of our board of directors as of July 1, 2019, together with their respective dates of birth, positions and experience:
|
Name (Date of Birth) |
Position in MUFG |
Business Experience |
||||
|
Mariko Fujii
|
Member of the Board of Directors (Outside Director) |
April 1977 |
Joined Ministry of Finance |
|||
|
July 1997 |
Director, International Affairs and Research Division, Customs and Tariff Bureau |
|||||
|
April 1999 |
Associate Professor, Research Center for Advanced Science and Technology, The University of Tokyo |
|||||
|
March 2001 |
Professor, Research Center for Advanced Economic Engineering, The University of Tokyo |
|||||
|
April 2004 |
Professor, Research Center for Advanced Science and Technology, National University Corporation, The University of Tokyo |
|||||
|
June 2014 |
Outside director of Electric Power Development Co., Ltd. |
|||||
|
October 2015 |
Resigned from Professor of The University of Tokyo |
|||||
|
Resigned from an Outside director of Electric Power Development Co., Ltd. |
||||||
|
Ambassador Extraordinary and Plenipotentiary of Japan to Latvia |
||||||
|
January 2019 |
Retired from Ambassador Extraordinary and Plenipotentiary of Japan to Latvia |
|||||
|
June 2019 |
Outside director of NTT DATA CORPORATION (incumbent) |
|||||
|
Member of the Board of Directors (Outside director) of MUFG (incumbent) |
||||||
|
Kaoru Kato
|
Member of the Board of Directors (Outside Director) |
April 1977 |
Joined Nippon Telegraph and Telephone Public Corporation (NTT) |
|||
|
July 1999 |
General Manager of Plant Department of NTT Kansai Mobile Communications Network, Inc. |
|||||
|
April 2000 |
General Manager of Plant Department of NTT DoCoMo Kansai, Inc. |
|||||
|
June 2002 |
General Manager of Corporate Strategy and Planning Department, Member of the Board of Directors of NTT DoCoMo Kansai, Inc |
|||||
|
July 2005 |
Representative Director and Senior Corporate Executive Officer of Sumitomo Mitsui Card Co., Ltd. |
|||||
|
July 2007 |
Executive Vice President, General Manager of Corporate Strategy and Planning Department, Member of the Board of Directors of NTT DoCoMo Kansai, Inc. |
|||||
139
Table of Contents
|
Name (Date of Birth) |
Position in MUFG |
Business Experience |
||||
|
June 2008 |
Executive Vice President, General Manager of Corporate Strategy and Planning Department, Member of the Board of Directors of NTT DOCOMO, Inc. |
|||||
|
June 2012 |
President and Chief Executive Officer, Member of the Board of Directors of NTT DOCOMO, Inc. |
|||||
|
June 2016 |
Corporate Advisor, Member of the Board of Directors of NTT DOCOMO, Inc. |
|||||
|
June 2018 |
Corporate Advisor of NTT DOCOMO, Inc. (incumbent) |
|||||
|
June 2019 |
Member of the Board of Directors (Outside director) of MUFG (incumbent) |
|||||
|
Haruka Matsuyama
|
Member of the Board of Directors (Outside Director) |
April 1995 |
Assistant Judge, Tokyo District Court |
|||
|
July 2000 |
Registered as an attorney at law, member of the Daini Tokyo Bar Association |
|||||
|
Joined Hibiya Park Law Offices |
||||||
|
January 2002 |
Partner of Hibiya Park Law Offices (incumbent) |
|||||
|
June 2012 |
Outside Corporate Auditor of Vitec Co., Ltd. |
|||||
|
June 2013 |
Outside director of T&D Holdings, Inc. (incumbent) |
|||||
|
June 2014 |
External Audit & Supervisory Board member of MITSUI & CO., LTD. (incumbent) |
|||||
|
Member of the Board of Directors (Outside director) of MUFG (incumbent) |
||||||
|
June 2015 |
Outside director of Vitec Co., Ltd. (current Restar Holdings Corporation) (incumbent) |
|||||
|
Toby S. Myerson
|
Member of the Board of Directors (Outside Director) |
September 1977 |
Registered as an attorney at law, admitted in States of California and New York in the United States |
|||
|
October 1981 |
Joined Paul, Weiss, Rifkind, Wharton & Garrison LLP |
|||||
|
June 1983 |
Partner of Paul, Weiss, Rifkind, Wharton & Garrison LLP |
|||||
|
April 1989 |
Managing Director of Wesserstein Perella & Co. Inc. |
|||||
|
November 1990 |
Partner of Paul, Weiss, Rifkind, Wharton & Garrison LLP |
|||||
|
June 2014 |
Outside director of BK(US) (incumbent) |
|||||
|
December 2016 |
Retired from Paul, Weiss, Rifkind, Wharton & Garrison LLP |
|||||
|
January 2017 |
Chairman & CEO of Longsight Strategic Advisors LLC (incumbent) |
|||||
|
February 2017 |
Outside director of MUAH (incumbent) |
|||||
|
June 2017 |
Member of the Board of Directors (Outside director) of MUFG (incumbent) |
|||||
140
Table of Contents
|
Name (Date of Birth) |
Position in MUFG |
Business Experience |
||||
|
Hirofumi Nomoto
|
Member of the Board of Directors (Outside Director) |
April 1971 |
Joined Tokyu Corporation |
|||
|
April 2003 |
Executive General Manager of Media Business Headquarters of Tokyu Corporation |
|||||
|
April 2004 |
President & Representative Director of its communications Inc. |
|||||
|
June 2007 |
Director of Tokyu Corporation |
|||||
|
Executive Officer of Real Estate Development Business Unit of Tokyu Corporation |
||||||
|
January 2008 |
Managing Director of Tokyu Corporation |
|||||
|
June 2008 |
Senior Managing Director of Tokyu Corporation |
|||||
|
April 2010 |
Executive Officer & Senior Executive General Manager of Urban Life Produce Business Unit of Tokyu Corporation |
|||||
|
June 2010 |
Senior Managing Director & Representative Director of Tokyu Corporation |
|||||
|
April 2011 |
President & Representative Director of Tokyu Corporation |
|||||
|
April 2018 |
Chairman & Representative Director of Tokyu Corporation (incumbent) |
|||||
|
June 2019 |
Member of the Board of Directors (Outside director) of MUFG (incumbent) |
|||||
|
Tsutomu Okuda
|
Member of the Board of Directors (Outside Director) |
April 1964 |
Joined The Daimaru, Inc. |
|||
|
September 1991 |
Managing Director of Daimaru Australia Pty. Ltd. |
|||||
|
May 1995 |
Director of The Daimaru, Inc. |
|||||
|
May 1996 |
Managing Director of The Daimaru, Inc. |
|||||
|
March 1997 |
President of The Daimaru, Inc. |
|||||
|
May 2003 |
Chairman & CEO of The Daimaru, Inc. |
|||||
|
September 2007 |
Chairman of The Daimaru, Inc. |
|||||
|
President and Chief Executive Officer of J. Front Retailing Co., Ltd. |
||||||
|
March 2010 |
Chairman and Chief Executive Officer of J. Front Retailing Co., Ltd. |
|||||
|
April 2013 |
Director and Senior Advisor of J. Front Retailing Co., Ltd. |
|||||
|
May 2014 |
Senior Advisor of J. Front Retailing Co., Ltd. |
|||||
|
June 2014 |
Member of the Board of Directors (Outside director) of MUFG (incumbent) |
|||||
|
May 2018 |
Special Advisor of J. Front Retailing Co., Ltd. (incumbent) |
|||||
|
Yasushi Shingai
|
Member of the Board of Directors (Outside Director) |
April 1980 |
Joined Japan Tobacco and Salt Public Corporation (current Japan Tobacco Inc.) |
|||
|
July 2001 |
Vice President of Financial Planning Division of Japan Tobacco Inc. |
|||||
|
June 2004 |
Senior Vice President, Head of Finance Group of Japan Tobacco Inc. |
|||||
|
July 2004 |
Senior Vice President, Chief Financial Officer of Japan Tobacco Inc. |
|||||
141
Table of Contents
|
Name (Date of Birth) |
Position in MUFG |
Business Experience |
||||
|
June 2005 |
Member of the Board, Senior Vice President, and Chief Financial Officer of Japan Tobacco Inc. |
|||||
|
June 2006 |
Member of the Board of Japan Tobacco Inc., |
|||||
|
Executive Vice President and Deputy CEO of JT International S.A. |
||||||
|
June 2011 |
Representative Director and Executive Vice President of Japan Tobacco Inc. |
|||||
|
June 2014 |
External Board Director of Recruit Holdings Co., Ltd. |
|||||
|
January 2018 |
Member of the Board of Japan Tobacco Inc. |
|||||
|
March 2018 |
Outside Director of Asahi Group Holdings, Ltd. (incumbent) |
|||||
|
June 2018 |
Member of the Board of Directors (Outside director) of MUFG (incumbent) |
|||||
|
June 2019 |
Outside director of Dai-ichi Life Holdings, Inc. (incumbent) |
|||||
|
Tarisa Watanagase
|
Member of the Board of Directors (Outside Director) |
June 1975 |
Joined the Bank of Thailand |
|||
|
January 1988 |
Economist, International Monetary Fund (On the Secondment) |
|||||
|
October 2002 |
Deputy Governor of the Bank of Thailand |
|||||
|
November 2006 |
Governor of the Bank of Thailand |
|||||
|
September 2010 |
Retired from the Bank of Thailand |
|||||
|
March 2013 |
Outside director of the Siam Cement Public Company Limited (incumbent) |
|||||
|
June 2017 |
Member of the Board of Directors (Outside director) of MUFG (incumbent) |
|||||
|
Akira Yamate
|
Member of the Board of Directors (Outside Director) |
November 1977 |
Joined Price, Waterhouse & Co. Japan |
|||
|
March 1983 |
Registered as Certified Public Accountant in Japan |
|||||
|
July 1991 |
Representative Partner of Aoyama Audit Corporation |
|||||
|
Partner of Price Waterhouse |
||||||
|
April 2000 |
Representative Partner of Chuo Aoyama Audit Corporation |
|||||
|
Partner of PricewaterhouseCoopers |
||||||
|
September 2006 |
Representative Partner of PricewaterhouseCoopers Aarata |
|||||
|
June 2013 |
Resigned from PricewaterhouseCoopers Aarata |
|||||
|
External Audit & Supervisory Board member of Nomura Real Estate Holdings, Inc. |
||||||
|
External Audit & Supervisory Board member of Nomura Real Estate Development, Co., Ltd. |
||||||
|
June 2015 |
Retired from External Audit & Supervisory Board member of Nomura Real Estate Development, Co., Ltd. |
|||||
|
Member of the Board of Directors (Outside director) of MUFG (incumbent) |
||||||
142
Table of Contents
|
Name (Date of Birth) |
Position in MUFG |
Business Experience |
||||
|
External director of Nomura Real Estate Holdings, Inc. |
||||||
|
External member of Board of Statutory Auditors, Prudential Holdings of Japan, Inc. (incumbent) |
||||||
|
June 2019 |
Retired from External director of Nomura Real Estate Holdings, Inc. |
|||||
|
External director of Nomura Real Estate Development, Co., Ltd. (incumbent) |
||||||
|
Tadashi Kuroda
|
Member of the Board of Directors |
April 1981 |
Joined The Sanwa Bank, Limited |
|||
|
April 2008 |
Executive Officer of BK |
|||||
|
June 2011 |
Senior Managing Executive Officer of Mitsubishi UFJ Research and Consulting Co., Ltd. (MURC) |
|||||
|
Director and Senior Managing Executive Officer of MURC |
||||||
|
May 2013 |
Managing Executive Officer of BK |
|||||
|
May 2014 |
Managing Executive Officer of MUFG |
|||||
|
June 2014 |
Director of TB |
|||||
|
Member of the Board of Directors, Managing Executive Officer of MUFG |
||||||
|
May 2015 |
Member of the Board of Directors, Senior Managing Executive Officer of MUFG |
|||||
|
June 2015 |
Member of the Board of Directors, Senior Managing Executive Officer of BK |
|||||
|
Member of the Board of Directors, Senior Managing Corporate Executive of MUFG |
||||||
|
May 2018 |
Member of the Board of Directors of MUFG (incumbent) |
|||||
|
Junichi Okamoto
|
Member of the Board of Directors |
April 1980 |
Joined The Toyo Trust and Banking Company, Limited |
|||
|
June 2008 |
Executive Officer of TB |
|||||
|
June 2010 |
Managing Executive Officer of TB |
|||||
|
Executive Officer of MUFG |
||||||
|
June 2012 |
Senior Managing Executive Officer of TB |
|||||
|
June 2013 |
Director, Deputy President and Executive Officer of TB |
|||||
|
Member of the Board of Directors of MUFG |
||||||
|
June 2015 |
Senior Managing Corporate Executive of MUFG |
|||||
|
June 2017 |
Director of TB |
|||||
|
Member of the Board of Directors of MUFG (incumbent) |
||||||
|
Nobuyuki Hirano
|
Member of the Board of Directors Chairman (Corporate Executive) |
April 1974 |
Joined The Mitsubishi Bank, Limited |
|||
| June 2001 |
Executive Officer of Bank of Tokyo-Mitsubishi, Ltd. (BTM) |
|||||
| July 2004 |
Executive Officer of Mitsubishi Tokyo Financial Group, Inc. (MTFG) |
|||||
| May 2005 |
Managing Executive Officer of BTM |
|||||
143
Table of Contents
|
Name (Date of Birth) |
Position in MUFG |
Business Experience |
||||
| June 2005 |
Member of the Board of Directors, Managing Executive Officer of BTM |
|||||
|
Member of the Board of Directors of MTFG |
||||||
| January 2006 |
Member of the Board of Directors, Managing Executive Officer of BK |
|||||
| October 2008 |
Member of the Board of Directors, Senior Managing Executive Officer of BK |
|||||
| June 2009 |
Member of the Board of Directors, Deputy President of BK |
|||||
|
Managing Executive Officer of MUFG |
||||||
| June 2010 |
Member of the Board of Directors of MUFG |
|||||
| October 2010 |
Member of the Board of Directors, Deputy President of MUFG |
|||||
| April 2012 |
President & CEO of BK |
|||||
|
Member of the Board of Directors of MUFG |
||||||
| April 2013 |
President & CEO of MUFG |
|||||
| June 2015 |
Member of the Board of Directors, President & Group CEO of MUFG |
|||||
| November 2015 |
Director of Morgan Stanley |
|||||
| April 2016 |
Chairman of BK |
|||||
| April 2019 |
Member of the Board of Directors of BK (incumbent) |
|||||
|
Member of the Board of Directors, Chairman of MUFG (incumbent) |
||||||
|
Mikio Ikegaya
|
Member of the Board of Directors Deputy Chairman (Representative Corporate Executive) |
April 1981 |
Joined The Mitsubishi Trust and Banking Corporation (MTB) |
|||
| June 2008 |
Executive Officer of TB |
|||||
|
Executive Officer of MUFG |
||||||
| June 2011 |
Director and Managing Executive Office of TB |
|||||
|
Managing Executive Officer of MUFG |
||||||
| June 2012 |
Managing Executive Officer of TB |
|||||
|
Executive Officer of MUFG |
||||||
| June 2013 |
Senior Managing Executive Officer of TB |
|||||
| June 2015 |
Director and Senior Managing Executive Officer of TB |
|||||
|
Managing Executive Officer of MUFG |
||||||
| April 2016 |
President & CEO of TB (incumbent) |
|||||
|
Deputy Chairman of MUFG |
||||||
| June 2016 |
Member of the Board of Directors, Deputy Chairman of MUFG (incumbent) |
|||||
|
Saburo Araki
|
Member of the Board of Directors Deputy Chairman (Representative Corporate Executive) |
April 1981 | Joined The Mitsubishi Bank, Limited | |||
| June 2007 |
Executive Officer of BK |
|||||
| May 2009 |
Executive Officer of MUFG |
|||||
| May 2011 |
Managing Executive Officer of BK |
|||||
|
Managing Executive Officer of MUFG |
||||||
| June 2012 |
Member of the Board of Directors, Managing Executive Officer of BK |
|||||
|
Member of the Board of Directors of MUFG |
||||||
144
Table of Contents
|
Name (Date of Birth) |
Position in MUFG |
Business Experience |
||||
| June 2014 |
Managing Executive Officer of MUFG |
|||||
| May 2015 |
Member of the Board of Directors, Senior Managing Executive Officer of BK |
|||||
| June 2015 |
Senior Managing Corporate Executive of MUFG |
|||||
| May 2016 |
Member of the Board of Directors, Deputy President of BK |
|||||
| April 2018 |
President & CEO of SCHD (incumbent) |
|||||
|
President & CEO of MUMSS (incumbent) |
||||||
|
Deputy Chairman of MUFG |
||||||
| June 2018 |
Member of the Board of Directors, Deputy Chairman of MUFG (incumbent) |
|||||
|
Kanetsugu Mike
|
Member of the Board of Directors President & Group CEO (Representative Corporate Executive) |
April 1979 | Joined The Mitsubishi Bank, Limited | |||
| June 2005 |
Executive Officer of BTM |
|||||
|
Executive Officer of MTFG |
||||||
| May 2009 |
Managing Executive Officer of BK |
|||||
| May 2011 |
Managing Executive Officer of MUFG |
|||||
| June 2011 |
Member of the Board of Directors, Managing Executive Officer of BK |
|||||
| May 2013 |
Senior Managing Executive Officer of BK |
|||||
| October 2015 |
Executive Chairman of MUAH |
|||||
|
Executive Chairman of BK(US) |
||||||
| May 2016 |
Deputy President and Executive Officer of BK |
|||||
|
Senior Managing Corporate Executive of MUFG |
||||||
| June 2016 |
Member of the Board of Directors, Deputy President of BK |
|||||
| June 2017 |
President & CEO of BK (incumbent) |
|||||
|
Member of the Board of Directors, Deputy Chairman of MUFG |
||||||
| April 2019 |
Member of the Board of Directors, President & Group CEO of MUFG (incumbent) |
|||||
|
Hironori Kamezawa
|
Member of the Board of Directors Deputy President (Group Chief Operational Officer, or COO & Group Chief Digital Transformation Officer, or CDTO) (Representative Corporate Executive) |
April 1986 | Joined The Mitsubishi Bank, Limited | |||
| June 2010 |
Executive Officer of BK |
|||||
|
Executive Officer of MUFG |
||||||
| May 2014 |
Managing Executive Officer of BK |
|||||
|
Managing Executive Officer of MUFG |
||||||
| July 2014 |
Deputy CEO of Americas at BK(US) |
|||||
| May 2017 |
Managing Corporate Executive of MUFG |
|||||
| June 2017 |
Member of the Board of Directors, Managing Executive Officer of BK |
|||||
| May 2018 |
Member of the Board of Directors, Senior Managing Executive Officer of BK |
|||||
|
Senior Managing Corporate Executive of MUFG |
||||||
| December 2018 |
Representative of the Board of Directors & CEO of Global Open Network, Inc.(incumbent) |
|||||
| April 2019 |
Deputy President of MUFG |
|||||
145
Table of Contents
|
Name (Date of Birth) |
Position in MUFG |
Business Experience |
||||
|
Member of the Board of Directors, Deputy President of BK (incumbent) |
||||||
|
Representative of the Board of Directors & CEO of Global Open Network Japan, Inc. (incumbent) |
||||||
| June 2019 |
Member of the Board of Directors, Deputy President of MUFG (incumbent) |
|||||
|
Note: |
The following abbreviations are used in the table above: |
|
|
“BK”refers to MUFG Bank, Ltd. or its former name The Bank of Tokyo-Mitsubishi UFJ, Ltd. |
||
|
“TB”refers to Mitsubishi UFJ Trust and Banking Corporation. |
||
|
“SCHD”refers to Mitsubishi UFJ Securities Holdings Co., Ltd. |
||
|
“BK(US)”refers to MUFG Union Bank, N.A. |
||
|
“MUAH”refers to MUFG Americas Holdings Corporation. |
Corporate Executives
The following table sets forth our corporate executives as of July 1, 2019, together with their respective dates of birth, positions and experience:
|
Name (Date of Birth) |
Position in MUFG |
Business Experience |
||||
|
Nobuyuki Hirano
|
See “Members of the Board of Directors” under this Item 6.A. |
See “Members of the Board of Directors” under this Item 6.A. | ||||
|
Mikio Ikegaya
|
See “Members of the Board of Directors” under this Item 6.A. |
See “Members of the Board of Directors” under this Item 6.A. | ||||
|
Saburo Araki
|
See “Members of the Board of Directors” under this Item 6.A. |
See “Members of the Board of Directors” under this Item 6.A. | ||||
|
Kanetsugu Mike
|
See “Members of the Board of Directors” under this Item 6.A. |
See “Members of the Board of Directors” under this Item 6.A. | ||||
|
Hironori Kamezawa
|
See “Members of the Board of Directors” under this Item 6.A. |
See “Members of the Board of Directors” under this Item 6.A. | ||||
|
Muneaki Tokunari
|
Senior Managing Corporate Executive (Group CFO) |
April 1982 | Joined MTB | |||
| June 2009 | Executive Officer of TB | |||||
| Executive Officer of MUFG | ||||||
| June 2011 | Managing Executive Officer of TB | |||||
| April 2012 | Managing Director of TB | |||||
| June 2012 |
Member of the Board of Directors of MUFG |
|||||
| June 2013 | Senior Managing Director of TB | |||||
| June 2014 | Managing Officer of MUFG | |||||
| June 2015 | Managing Director of BK | |||||
|
Member of the Board of Directors, Managing Corporate Executive of MUFG |
||||||
| May 2016 |
Senior Managing Director of BK (incumbent) |
|||||
146
Table of Contents
|
Name (Date of Birth) |
Position in MUFG |
Business Experience |
||||
|
Member of the Board of Directors, Senior Managing Corporate Executive of MUFG |
||||||
| June 2018 |
Senior Managing Corporate Executive of MUFG (incumbent) |
|||||
|
Masamichi Yasuda
|
Senior Managing Corporate Executive (Group Head, Global Markets Business Group) |
April 1983 |
Joined The Bank of Tokyo, Ltd |
|||
| June 2009 |
Executive Officer of BK, seconded to Union Bank |
|||||
| May 2011 |
Executive Officer of MUFG |
|||||
| May 2014 |
Managing Executive Officer of BK |
|||||
| May 2015 |
Managing Executive Officer of MUFG |
|||||
| June 2015 |
Member of the Board of Directors, Managing Executive Officer of BK |
|||||
|
Member of the Board of Directors of SCHD |
||||||
|
Member of the Board of Directors, Managing Corporate Executive of MUFG |
||||||
| May 2017 |
Member of the Board of Directors, Senior Managing Executive Officer of BK |
|||||
|
Member of the Board of Directors, Senior Managing Corporate Executive of MUFG |
||||||
| June 2018 |
Senior Managing Corporate Executive of MUFG (incumbent) |
|||||
| April 2019 |
Senior Managing Executive Officer of SCHD (incumbent) |
|||||
|
Member of the Board of Directors, Deputy President of MUMSS (incumbent) |
||||||
|
Kenji Yabuta
|
Senior Managing Corporate Executive (Group Head, Japanese Corporate & Investment Banking Business Group Head of Research & Advisory Unit) |
April 1983 |
Joined The Mitsubishi Bank, Limited |
|||
| June 2009 |
Executive Officer of BK |
|||||
|
Executive Officer of MUFG |
||||||
| May 2013 |
Managing Executive Officer of BK |
|||||
| May 2017 |
Senior Managing Executive Officer of BK |
|||||
| April 2018 |
Senior Managing Corporate Executive of MUFG (incumbent) |
|||||
| May 2018 |
Deputy President of BK |
|||||
| June 2018 |
Member of the Board of Directors, Deputy President of BK (incumbent) |
|||||
|
Naoki Hori
|
Senior Managing Corporate Executive (Group Head, Retail & Commercial Banking Business Group) |
April 1983 |
Joined The Sanwa Bank, Limited |
|||
| June 2010 |
Executive Officer of BK |
|||||
|
Executive Officer of MUFG |
||||||
| May 2013 |
Managing Executive Officer of BK |
|||||
| May 2016 |
Managing Executive Officer of MUFG |
|||||
| June 2016 |
Member of the Board of Directors, Managing Executive Officer of BK |
|||||
| June 2017 |
Member of the Board of Directors, Senior Managing Executive Officer of BK |
|||||
| May 2018 |
Senior Managing Corporate Executive of MUFG (incumbent) |
|||||
147
Table of Contents
|
Name (Date of Birth) |
Position in MUFG |
Business Experience |
||||
| April 2019 |
Member of the Board of Directors, Deputy President of BK (incumbent) |
|||||
|
Masato Miyachi
|
Senior Managing Corporate Executive (Group Head, Global Corporate & Investment Banking Business Group) |
April 1984 |
Joined The Bank of Tokyo, Ltd. |
|||
| June 2010 |
Executive Officer of BK |
|||||
| May 2014 |
Managing Executive Officer of BK |
|||||
| October 2014 |
Managing Executive Officer of MUFG |
|||||
| May 2017 |
Chairman of MUAH (incumbent) |
|||||
|
Chairman of BK(US) (incumbent) |
||||||
| May 2018 |
Senior Managing Executive Officer of BK |
|||||
| June 2018 |
Member of the Board of Directors, Senior Managing Executive Officer of BK |
|||||
| July 2018 |
Senior Managing Corporate Executive of MUFG (incumbent) |
|||||
| April 2019 |
Member of the Board of Directors, Deputy President of BK (incumbent) |
|||||
|
Sunao Yokokawa
|
Senior Managing Corporate Executive (Group Head, Asset Management & Investor Services Business) |
April 1986 |
Joined MTB |
|||
| June 2012 |
Executive Officer of TB |
|||||
| May 2014 |
Executive Officer of MUFG |
|||||
| June 2015 |
Managing Executive Officer of TB |
|||||
| June 2017 |
Director and Managing Executive Officer of TB |
|||||
|
Managing Corporate Executive of MUFG |
||||||
| April 2019 |
Director and Senior Managing Executive Officer of TB (incumbent) |
|||||
|
Senior Managing Corporate Executive of MUFG (incumbent) |
||||||
|
Takayoshi Futae
|
Senior Managing Corporate Executive (Group Head, Global Commercial Banking Business Group Group Chief Operational Officer, or Group COO-I) |
April 1983 |
Joined The Sanwa Bank, Limited |
|||
| June 2010 |
Executive Officer of The Bank of BK |
|||||
| May 2014 |
Managing Executive Officer of BK |
|||||
| May 2016 |
Managing Executive Officer of MUFG |
|||||
| May 2017 |
Senior Managing Executive Officer of BK |
|||||
| April 2019 |
Senior Managing Corporate Executive of MUFG |
|||||
|
Senior Managing Executive Officer of SCHD (incumbent) |
||||||
| June 2019 |
Member of the Board of Directors, Senior Managing Executive Officer of BK (incumbent) |
|||||
|
Iwao Nagashima
|
Senior Managing Corporate Executive (Group Chief Human Resource Officer, or Group CHRO Group Deputy Chief Digital Transformation Officer, or Group Deputy CDTO) |
April 1985 |
Joined The Mitsubishi Trust and Banking Corporation |
|||
| June 2011 |
Executive Officer of TB |
|||||
| June 2013 |
Managing Executive Officer of TB |
|||||
|
Executive Officer of MUFG |
||||||
| June 2015 |
Director and Managing Executive Officer of TB |
|||||
|
Managing Executive Officer of TB |
||||||
| June 2016 |
Director and Senior Managing Executive Officer of TB |
|||||
148
Table of Contents
|
Name (Date of Birth) |
Position in MUFG |
Business Experience |
||||
| April 2019 |
Director, Deputy President, and Executive Officer of TB (incumbent) |
|||||
|
Senior Managing Corporate Executive of MUFG (incumbent) |
||||||
|
President & CEO of MU Trust Apple Planning Company, Ltd. (incumbent) |
||||||
|
Naomi Hayashi
|
Managing Corporate Executive (Group CSO in charge of Corporate Planning Division (excluding Budget & Resources Management and Global Business), Corporate Administration Division and sub-charge of Digital Transformation Division) |
April 1987 |
Joined The Mitsubishi Bank, Limited |
|||
| June 2013 |
Executive Officer of BK |
|||||
|
Executive Officer of MUFG |
||||||
| January 2017 |
Managing Executive Officer of BK |
|||||
| May 2018 |
Managing Corporate Executive of MUFG (incumbent) |
|||||
| June 2018 |
Member of the Board of Directors, Managing Executive Officer of BK (incumbent) |
|||||
|
Member of the Board of Directors of SCHD (incumbent) |
||||||
|
Junichi Hanzawa
|
Managing Corporate Executive (Group Chief Compliance Officer, or Group CCO) |
April 1988 |
Joined The Mitsubishi Bank, Limited |
|||
| June 2014 |
Executive Officer of BK |
|||||
|
Executive Officer of MUFG |
||||||
| May 2018 |
Managing Executive Officer of BK |
|||||
| April 2019 |
Managing Corporate Executive of MUFG (incumbent) |
|||||
| June 2019 |
Member of the Board of Directors, Managing Executive Officer of BK (incumbent) |
|||||
|
Hiroki Kameda
|
Managing Corporate Executive (Group Chief Information Officer, or CIO Group Chief Information Security Officer, or CISO) |
April 1988 |
Joined The Mitsubishi Bank, Limited |
|||
| June 2014 |
Executive Officer of BK |
|||||
|
Executive Officer of MUFG |
||||||
| June 2018 |
President & CEO of Mitsubishi UFJ Information Technology, Ltd. (incumbent) |
|||||
| April 2019 |
Managing Executive Officer of BK |
|||||
|
Managing Corporate Executive of MUFG (incumbent) |
||||||
| June 2019 |
Member of the Board of Directors, Managing Executive Officer of BK (incumbent) |
|||||
149
Table of Contents
|
Name (Date of Birth) |
Position in MUFG |
Business Experience |
||||
|
Ritsuo Ogura
|
Managing Corporate Executive (Group Chief Audit Officer, or CAO) Managing Director, Head of Internal Audit Division |
April 1986 |
Joined The Sanwa Bank, Limited |
|||
| June 2012 |
Executive Officer of BK |
|||||
|
Executive Officer of MUFG |
||||||
| May 2016 |
Managing Executive Officer of BK |
|||||
| May 2017 |
Managing Executive Officer of MUFG |
|||||
| April 2019 |
Managing Corporate Executive of MUFG (incumbent) |
|||||
|
Masahiro Kuwahara
|
Managing Corporate Executive (Group Chief Risk Officer, or CRO) |
April 1986 |
Joined The Mitsubishi Bank, Limited |
|||
| June 2012 |
Executive Officer of BK |
|||||
|
Executive Officer of MUFG |
||||||
| May 2016 |
Managing Executive Officer of BK |
|||||
|
Managing Executive Officer of MUFG |
||||||
| May 2019 |
Managing Corporate Executive of MUFG (incumbent) |
|||||
| June 2019 |
Member of the Board of Directors, Managing Executive Officer of BK (incumbent) |
|||||
|
Hiroshi Mori
|
Managing Corporate Executive (Group Chief Legal Officer, or CLO) |
April 1993 |
Seconded to Finance Bureau of Ministry of Home Affairs |
|||
| June 2003 |
Seconded to Tesac Corporation, a Company under reorganization Trustee representative, Manager of Corporate Planning Department |
|||||
| October 2006 |
Registered as attorney at law Joined Nishimura & Asahi |
|||||
| November 2010 |
Outside Director, USEN Corporation |
|||||
| January 2012 |
Partner at Nishimura & Asahi |
|||||
| June 2013 |
Substitute Auditor of KAGOME CO., LTD. |
|||||
| March 2016 |
Outside Director, Audit & Supervisory Committee Member of KAGOME CO., LTD. (incumbent) |
|||||
| June 2016 |
Outside Director, Audit & Supervisory Committee Member of SCHD |
|||||
| June 2019 |
Member of the Board of Directors, Managing Executive Officer of BK(incumbent) |
|||||
|
Managing Corporate Executive of MUFG (incumbent) |
||||||
|
Note: |
The following abbreviations are used in the table above: |
|
|
“BK”refers to MUFG Bank, Ltd. or its former name The Bank of Tokyo-Mitsubishi UFJ, Ltd. |
||
|
“TB”refers to Mitsubishi UFJ Trust and Banking Corporation. |
||
|
“SCHD”refers to Mitsubishi UFJ Securities Holdings Co., Ltd. |
||
|
“BK(US)”refers to MUFG Union Bank, N.A. |
||
|
“MUAH”refers to MUFG Americas Holdings Corporation. |
The board of directors and corporate executives may be contacted through our headquarters at Mitsubishi UFJ Financial Group, Inc., 7-1, Marunouchi 2-chome, Chiyoda-ku, Tokyo 100-8330, Japan.
No family relationship exists among any of our directors or corporate executives.
150
Table of Contents
| B. |
Compensation |
The aggregate amount of compensation paid, including benefits in kind granted and any contingent and deferred compensation, by MUFG and its subsidiaries during the fiscal year ended March 31, 2019 to our directors (excluding outside directors), to corporate executives and to outside directors, was ¥158 million, ¥2,006 million and ¥203 million, respectively.
The compensation paid by MUFG and its subsidiaries during the fiscal year ended March 31, 2019 to our directors and corporate executives consisted of annual base salaries, performance-based stock compensation, bonuses and other benefits. MUFG’s compensation committee determines the compensation paid to our directors and corporate executives.
The following table sets forth details of the aggregate compensation paid by MUFG and its subsidiaries during the fiscal year ended March 31, 2019 to our directors (excluding outside directors) and corporate executives:
| Non-Adjustable Compensation | Adjustable Compensation | |||||||||||||||||||||||||||
|
Number of
Corporate Executives (1) |
Aggregate
Compensation |
Annual
Base Salary |
Performance-
based Stock Compensation |
Cash Bonuses |
Performance-
based Stock Compensation |
Retirement
Allowances (2) |
Other | |||||||||||||||||||||
| (in millions) | ||||||||||||||||||||||||||||
|
24 |
¥ | 2,164 | ¥ | 1,209 | ¥ | 322 | ¥ | 393 | ¥ | 240 | — | ¥ | 0 | |||||||||||||||
Notes:
| (1) | Includes the current directors and corporate executives as well as those who retired during the fiscal year ended March 31, 2019 but excludes the outside directors. |
| (2) | Represents the aggregate amount of retirement allowances paid in cash during the fiscal year ended March 31, 2019, pursuant to a one-time shareholders’ approval in June 2007 for the retirement allowances to be paid to the directors and corporate auditors who were elected prior to that date at the time of their retirement. A reserve in the total amount of such retirement allowances was set aside as of September 30, 2007. For more information, see “—Retirement Allowances” below. |
151
Table of Contents
The following table sets forth the details of individual compensation paid, including benefits in kind granted but excluding retirement allowances paid, by MUFG and its subsidiaries in an amount equal to or exceeding ¥100 million during the fiscal year ended March 31, 2019:
|
Directors |
Aggregate
amount |
Paid by | Compensation paid | |||||||||||||||
|
Annual
Base Salary |
Performance-
based Stock Compensation |
Bonus | ||||||||||||||||
| (in millions) | ||||||||||||||||||
|
Kiyoshi Sono |
¥ | 152 | MUFG | ¥ | 48 | ¥ | 24 | ¥ | 14 | |||||||||
| BK | 33 | 25 | 8 | |||||||||||||||
|
Mikio Ikegaya |
¥ | 169 | MUFG | ¥ | 35 | ¥ | 19 | ¥ | 27 | |||||||||
| TB | 35 | 25 | 28 | |||||||||||||||
|
Kanetsugu Mike |
¥ | 181 | MUFG | ¥ | 50 | ¥ | 27 | ¥ | 28 | |||||||||
| BK | 33 | 25 | 18 | |||||||||||||||
|
Saburo Araki |
¥ | 131 | MUFG | ¥ | 25 | ¥ | 18 | ¥ | 28 | |||||||||
| SCHD | 13 | 7 | 10 | |||||||||||||||
| MUMSS | 12 | 7 | 10 | |||||||||||||||
| BK | — | 1 | 0 | |||||||||||||||
|
Nobuyuki Hirano |
¥ | 174 | MUFG | ¥ | 50 | ¥ | 30 | ¥ | 20 | |||||||||
| BK | 33 | 29 | 12 | |||||||||||||||
|
Eiichi Yoshikawa |
¥ | 106 | MUFG | ¥ | 34 | ¥ | 14 | ¥ | 8 | |||||||||
| BK | 21 | 11 | 4 | |||||||||||||||
| SCHD | 9 | 3 | 2 | |||||||||||||||
|
Kenji Yabuta |
¥ | 119 | MUFG | ¥ | 38 | ¥ | 14 | ¥ | 10 | |||||||||
| BK | 25 | 26 | 6 | |||||||||||||||
|
Hironori Kamezawa |
¥ | 116 | MUFG | ¥ | 32 | ¥ | 12 | ¥ | 9 | |||||||||
| BK | 22 | 35 | 6 | |||||||||||||||
|
Note: |
The following abbreviations are used in the table above: |
|
|
“BK”refers to MUFG Bank, Ltd. (or its former name The Bank of Tokyo-Mitsubishi UFJ, Ltd.) |
||
|
“TB”refers to Mitsubishi UFJ Trust and Banking Corporation. . |
||
|
“SCHD”refers to Mitsubishi UFJ Securities Holdings Co., Ltd. |
||
|
“MUMSS”refers to Mitsubishi UFJ Morgan Stanley Securities Co., Ltd. |
Annual Base Salary
Annual base salaries were paid to our directors (including outside directors) and corporate executives in the form of monthly cash installment payments. The aggregate annual base salary paid to our directors (excluding outside directors) and corporate executives for the fiscal year ended March 31, 2019 was ¥1,209 million. The aggregate annual base salary paid to our outside directors for the same period was ¥203 million.
Performance-based Stock Compensation Plans
Under our performance-based stock compensation plans, qualified directors (excluding outside directors and directors serving as audit committee members), corporate executives and others of MUFG and its major domestic subsidiaries are assigned, on a monthly basis, (1) points based on their job responsibilities, or non-adjustable points, and (2) additional points based on their job responsibilities which are adjusted at the end of each fiscal year and at the end of each plan period to reflect the extent to which a financial performance target determined by the compensation committee is attained, or adjustable points. Each plan period corresponds to the period covered by the three-year medium-term business plan of MUFG. Each accumulated point represents a right to receive one share of MUFG common stock from a trust established in Japan to administer the plan grants as determined by the compensation committee.
152
Table of Contents
The right to receive shares of MUFG common stock in exchange for non-adjustable points becomes vested and nonforfeitable, and the shares are delivered, upon the grantee’s departure from his or her job responsibilities based on which the right was granted. The right to receive shares of MUFG common stock in exchange for adjustable points becomes vested and nonforfeitable, and the shares are delivered, at the end of each plan period. The vesting in either case is subject to conditions imposed by the compensation committee, including non-engagement in misconduct. A portion of the shares subject to a grantee’s vested right may be delivered in cash.
The grantees are entitled to “dividend equivalent credits” on their granted but unvested rights under the plan when MUFG pays dividends to its shareholders. The credit is equal to the dividends that the grantees would have received on the shares had the shares been issued to the grantees in exchange for their granted but unvested rights under the plan, less expenses relating to the administration of the plan. Accumulated dividend equivalents are paid to grantees at the time of the delivery of the shares.
The shares to be delivered to grantees are purchased on the open market by the trustee of the trust pursuant to a trust agreement among MUFG, the trustee and the independent caretaker of the trust. Each plan is funded in cash up to a maximum aggregate amount determined by our compensation committee.
The initial performance-based stock compensation plan commenced on July 1, 2016. The grants under the plan were tied to MUFG’s previous medium-term business plan for the three-year period ended March 31, 2018. The trust for the plan was funded with ¥9.8 billion in cash, and 18,785,400 shares of MUFG common stock were purchased by the trustee of the plan trust in May 2016. The plan was adopted after our compensation committee decided in May 2016 to cease to provide any additional stock acquisition rights under our previous stock-based compensation structure and to introduce the performance-based stock compensation plan.
The second performance-based stock compensation plan commenced on December 1, 2016. The trust for the plan was funded with 8.8 billion in cash, and an aggregate of 13,004,300 shares of MUFG common stock were purchased by the trustee of the plan trust in November 2016 and May 2017. The plan was adopted to replace the outstanding stock acquisition rights under our previous stock-based compensation structure. Upon the adoption of the plan, the stock acquisition rights that had been allotted to grantees but remained unexercised under the then-outstanding stock-based compensation plans were exchanged for points under the performance-based stock compensation plan, and the rights to receive shares of MUFG common stock represented by these points were vested.
On May 15, 2018, the compensation committee approved new grants under the initial performance-based stock compensation plan, which was amended in connection with the launch of MUFG’s current medium-term business plan for the three-year period ending March 31, 2021. The trust period of the plan trust was extended until August 31, 2021, and the maximum amount of funds to be contributed to the plan trust was reset at ¥26.3 billion. The formula for determining adjustable points under the plan was also revised. In May 2018, the plan trust was funded with ¥9.6 billion in cash, and 13,049,600 shares of MUFG common stock were purchased by the trustee of the plan trust.
For more information on the Performance-based Stock Compensation Plans, see Note 33 to our consolidated financial statements included elsewhere in this Annual Report. See also “Item 16E. Purchases of Equity Securities by the Issuer and Affiliated Purchasers.”
Stock-based Compensation Plans
We previously issued stock acquisition rights to further motivate our directors (excluding outside directors) and certain of our officers to contribute to the improvement of our stock prices and profits. The number of stock acquisition rights granted to each director and officer was determined by comprehensively taking into account each grantee’s seniority of the position held at MUFG or its subsidiaries, experience and contribution to our
153
Table of Contents
performance throughout the period of the grantee’s service. On June 27, 2013, our shareholders approved modifications to the previous shareholder authorization for granting stock acquisition rights to our directors, corporate auditors and certain of our officers so that no outside directors or corporate auditors (including outside corporate auditors) would be eligible for any stock-based compensation plan adopted by the board of directors on or after that date.
In June 2015, our previous governance framework with the board of directors and a separate board of corporate auditors was replaced with our current governance framework with the board of directors and board committees. Under our previous governance framework, the maximum aggregate amount of each type of compensation for our directors and corporate auditors was approved at a general meeting of our shareholders. The amount and allocation of compensation for each director were then proposed to, and voted upon by, the board of directors. The amount and allocation of compensation for each corporate auditor were determined through discussions and agreement among the corporate auditors. The nomination and compensation committee deliberated and made proposals to the board of directors regarding matters relating to, among other things, the compensation of our directors. For information regarding our governance framework, see “—C. Board Practices.”
As part of our compensation structure, on June 29, 2010, the board of directors adopted another stock-based compensation plan entitled “Fourth Series of Stock Acquisition Rights of Mitsubishi UFJ Financial Group, Inc.” for our directors, corporate auditors and certain of our officers. Under the stock-based compensation plan, on July 16, 2010, we allotted an aggregate of 8,014 stock acquisition rights to our directors and an aggregate of 1,149 stock acquisition rights to our corporate auditors for their respective services to MUFG and its subsidiaries. Each stock acquisition right represents a right to purchase 100 shares of MUFG common stock at ¥1 per share of common stock. The stock acquisition rights are subject to a one-year vesting period. The rights are exercisable until July 15, 2040, but only after the date on which a grantee’s service as a director and an officer or as a corporate auditor of each of MUFG and the relevant subsidiaries terminates. The fair value of each stock acquisition right was ¥36,600.
As part of our compensation structure, on June 29, 2011, the board of directors adopted another stock-based compensation plan entitled “Fifth Series of Stock Acquisition Rights of Mitsubishi UFJ Financial Group, Inc.” for our directors, corporate auditors and certain of our officers. Under the stock-based compensation plan, on July 20, 2011, we allotted an aggregate of 7,740 stock acquisition rights to our directors and an aggregate of 1,160 stock acquisition rights to our corporate auditors for their respective services to MUFG and its subsidiaries. Each stock acquisition right represents a right to purchase 100 shares of MUFG common stock at ¥1 per share of common stock. The stock acquisition rights are subject to a one-year vesting period. The rights are exercisable until July 19, 2041, but only after the date on which a grantee’s service as a director and an officer or as a corporate auditor of each of MUFG and the relevant subsidiaries terminates. The fair value of each stock acquisition right was ¥33,700.
As part of our compensation structure, on June 28, 2012, the board of directors adopted another stock-based compensation plan entitled “Sixth Series of Stock Acquisition Rights of Mitsubishi UFJ Financial Group, Inc.” for our directors, corporate auditors and certain of our officers. Under the stock-based compensation plan, on July 18, 2012, we allotted an aggregate of 10,002 stock acquisition rights to our directors and an aggregate of 1,161 stock acquisition rights to our corporate auditors for their respective services to MUFG and its subsidiaries. Each stock acquisition right represents a right to purchase 100 shares of MUFG common stock at ¥1 per share of common stock. The stock acquisition rights are subject to a one-year vesting period. The rights are exercisable until July 17, 2042, but only after the date on which a grantee’s service as a director and an officer or as a corporate auditor of each of MUFG and the relevant subsidiaries terminates. The fair value of each stock acquisition right was ¥33,100.
As part of our compensation structure, on June 27, 2013, the board of directors adopted a stock-based compensation plan entitled “Seventh Series of Stock Acquisition Rights of Mitsubishi UFJ Financial Group,
154
Table of Contents
Inc.” for our directors (excluding outside directors) and certain of our officers. Under the stock-based compensation plan, on July 17, 2013, we allotted an aggregate of 4,103 stock acquisition rights to our directors (excluding outside directors) for their respective services to MUFG and its subsidiaries. Each stock acquisition right represents a right to purchase 100 shares of MUFG common stock at ¥1 per share of common stock. The stock acquisition rights are subject to a one-year vesting period. The rights are exercisable until July 16, 2043, but only after the date on which a grantee’s service as a director and an officer of each of MUFG and the relevant subsidiaries terminates. The fair value of each stock acquisition right was ¥61,100.
For more information on the Performance-based Stock Compensation Plans, see Note 33 to our consolidated financial statements included elsewhere in this Annual Report.
Bonuses
We from time to time pay cash bonuses to our directors and corporate executives to further motivate them to contribute to the improvement of our stock prices and profits if such bonuses are deemed appropriate based on a balanced scorecard approach taking into account the results of operations of the MUFG Group and each director’s or corporate executive’s individual performance of his or her duties as a director or corporate executive in light of both quantitative and qualitative criteria, including our medium-term strategy for improving our corporate value. None of the outside directors is eligible to receive a cash bonus. The compensation committee determines the cash bonus for each director and corporate executive based on our financial results and his or her job performance for the preceding fiscal year as well as his or her seniority and experience. The aggregate cash bonus paid to our directors and corporate executives for the fiscal year ended March 31, 2019 was ¥393 million.
Retirement Allowances
Prior to June 28, 2007, in accordance with customary Japanese practice, when a director or corporate auditor retired, a proposal to pay a retirement allowance was submitted at the annual ordinary general meeting of shareholders for approval. The retirement allowance consisted of a one-time payment of a portion of the allowance paid at the time of retirement and periodic payments of the remaining amount for a prescribed number of years. After the shareholders’ approval was obtained, the retirement allowance for a director or corporate auditor was fixed by the board of directors or by consultation among the corporate auditors in accordance with our internal regulations and practice and generally reflected the position of the director or corporate auditor at the time of retirement, the length of his service as a director or corporate auditor and his contribution to our performance. Historically, MUFG did not set aside reserves for any retirement payments for directors and corporate auditors made under this practice.
Pursuant to a one-time shareholders’ approval in June 2007, retirement allowances are paid in cash to the directors and corporate auditors who were elected prior to that date at the time of their retirement. A reserve in the total amount of such retirement allowances was set aside as of September 30, 2007. No retirement allowance was paid by MUFG and its subsidiaries pursuant to the one-time shareholder approval during the fiscal year ended March 31, 2019 to our directors (excluding outside directors), to corporate auditors (excluding outside corporate auditors) and to outside directors and corporate auditors, who have retired from their respective positions held at MUFG or, if such directors and corporate auditors concurrently held positions at MUFG’s subsidiaries, who have retired from such positions.
MUFG Americas Holdings Corporation Stock Bonus Plan
Upon the integration of the U.S. branch banking operations of MUFG Bank with MUFG Union Bank’s operations on July 1, 2014, MUFG Americas Holdings assumed the obligations under the Bank of Tokyo-Mitsubishi UFJ, Ltd. Headquarters for the Americas Stock Bonus Plan described below. Effective June 8, 2015, MUFG Americas Holdings amended and restated this plan as the MUFG Americas Holdings Corporation Stock Bonus Plan.
155
Table of Contents
Under the amended plan, qualified key employees of MUFG Americas Holdings are granted Restricted Share Units, or RSUs, representing a right to receive American Depositary Receipts, or ADRs, evidencing ADSs, each exchangeable for one share of MUFG common stock, from an independent trust established to administer the plan grants, upon the satisfaction of vesting conditions, to be determined pursuant to the plan as well as a Restricted Share Unit Agreement between MUFG Americas Holdings and the grantees.
Unless otherwise provided in the relevant Restricted Share Unit Agreement, RSUs become vested and nonforfeitable as follows: one-third (33 1/3%) of a grantee’s RSUs vests on each one year anniversary of the date of the grant such that all of the RSUs become fully vested after three years from the grant date so long as the grantee satisfies the specified continuous service requirements and any other conditions under the applicable plan documents, subject to certain clawback and notice period provisions.
Under the plan, the grantees are entitled to “dividend equivalent credits” on their granted but unvested RSUs when MUFG pays dividends to its shareholders. The credit is equal to the dividends that the grantees would have received on the shares had the shares been issued to the grantees in exchange for their granted but unvested RSUs. Accumulated dividend equivalents are paid to grantees in whole shares on an annual basis. Any fractional share will be paid to the participants in cash.
Grants made under the plan are not entitled to any dividend rights, voting rights, or other stockholder rights unless and until RSUs are vested and ADSs are delivered to grantees.
The ADSs to be delivered to grantees will be purchased on the open market by the trustee of the independent trust pursuant to a trust agreement between MUFG Americas Holdings and the trustee. As of June 30, 2019, 82,804,285 RSUs have been granted under the plan, of which 37,372,404 RSUs were outstanding as of June 30, 2019.
For more information on the plan, see Note 33 to our consolidated financial statements included elsewhere in this Annual Report. See also “Item 16E. Purchases of Equity Securities by the Issuer and Affiliated Purchasers.”
Share Ownership
As of July 1, 2019, our directors and corporate executives held the following numbers of shares of our common stock:
|
Directors |
Number of Shares
Registered |
|||
|
Mariko Fujii |
— | |||
|
Kaoru Kato |
— | |||
|
Haruka Matsuyama |
3,300 | |||
|
Toby S. Myerson |
368 | * | ||
|
Hirofumi Nomoto |
25,000 | |||
|
Tsutomu Okuda |
26,100 | |||
|
Yasushi Shingai |
— | |||
|
Tarisa Watanagase |
— | |||
|
Akira Yamate |
— | |||
|
Tadashi Kuroda |
124,600 | |||
|
Junichi Okamoto |
182,800 | |||
156
Table of Contents
|
Corporate Executives |
Number of Shares
Registered |
|||
|
Nobuyuki Hirano |
80,400 | |||
|
Mikio Ikegaya |
75,630 | |||
|
Saburo Araki |
210,980 | |||
|
Kanetsugu Mike |
49,055 | |||
|
Hironori Kamezawa |
25,500 | |||
|
Muneaki Tokunari |
254,900 | |||
|
Masamichi Yasuda |
35,800 | |||
|
Kenji Yabuta |
38,000 | |||
|
Naoki Hori |
41,800 | |||
|
Masato Miyachi |
6,800 | |||
|
Sunao Yokokawa |
21,800 | |||
|
Takayoshi Futae |
8,730 | |||
|
Iwao Nagashima |
81,000 | |||
|
Naomi Hayashi |
1,210 | |||
|
Junichi Hanzawa |
39,900 | |||
|
Hiroki Kameda |
40,600 | |||
|
Ritsuo Ogura |
16,400 | |||
|
Masahiro Kuwahara |
18,700 | |||
|
Hiroshi Mori |
— | |||
| * | Held in the form of ADRs. |
None of the shares of our common stock held by our directors and corporate executives have voting rights that are different from shares of our common stock held by any other shareholder.
For information on the performance-based stock compensation and stock-based compensation plans for our directors and corporate executives, see “—Performance-based Stock Compensation Plans” and “—Stock-based Compensation Plans.”
| C. |
Board Practices |
Our articles of incorporation provide for a board of directors with statutorily mandated nominating and governance committee, audit committee and compensation committee, each consisting of members of the board of directors. We have also elected, though not statutorily mandated under the Companies Act of Japan, to establish a risk committee consisting of directors and outside professionals. In May 2016, we established a U.S. risk committee pursuant to the U.S. enhanced prudential standards for foreign banking organizations. Our corporate executives are responsible for executing and managing our business operations based on a delegation of authority by the board of directors, and our directors set our key management policies and oversee the execution of duties by these corporate executives.
In June 2015, our shareholders approved an amendment to our articles of incorporation to adopt our current governance framework with a board of directors and board committees. We previously had a governance framework with a board of directors and a board of corporate auditors. The Companies Act permits three types of governance system for large companies such as MUFG: (1) a company with a nominating committee, an audit committee and a compensation committee, (2) a company with a board of corporate auditors, and (3) a company with an audit and supervisory committee. Our previous governance framework was based on the second system, and our newly adopted governance system is based on the first system.
With respect to companies adopting the first system, including MUFG, each of the nominating, audit and compensation committees must consist of members of the board of directors, and the majority of each committee must be outside directors as defined by the Companies Act. In addition, the board of directors must appoint corporate executives ( shikkoyaku ) to execute and manage the business operations of the company under the
157
Table of Contents
authority delegated by the board of directors. Based on this system, our current governance framework is designed to facilitate more flexible and swifter decision-making and increase transparency in our management processes.
An “outside director” is defined by the Companies Act as a person who meets all of the following conditions:
| • |
the person is not currently, and has not been in the ten years prior to his or her assumption of office as outside director, an executive director, who is a director concurrently performing an executive role ( gyomu shikko torishimariyaku ), a corporate executive, a manager ( shihainin ), or any other type of employee of the company or any of its subsidiaries; |
| • |
if the person has been a non-executive director, a corporate auditor, or an accounting adviser ( kaikei sanyo ) of the company or any of its subsidiaries within the ten years prior to his or her assumption of office as outside director, the person was not an executive director, a corporate executive, a manager or any other type of employee of the company or any of its subsidiary in the ten years prior to his or her assumption of office as such; |
| • |
the person is not a director, a corporate executive officer, a manager or any other type of employee of the company’s parent company, or a person who controls the company; |
| • |
the person is not an executive director, a corporate executive officer, a manager or any other type of employee of another subsidiary of the company’s parent company; and |
| • |
the person is not the spouse or a family member within the second degree of kinship of a director, a corporate executive, a manager, or any other type of important employee of the company or a person who controls the company. |
Board of Directors
Our board of directors consists of directors who are elected at a general meeting of shareholders. Under our articles of incorporation, the number of directors may not exceed 20. We currently have 16 directors, nine of whom are outside directors and two of whom are internal non-executive directors.
The regular term of office of a director is one year from the date of election, and directors may serve their terms until the close of the annual general meeting of shareholders held for the following year after their election. Directors may serve any number of consecutive terms.
Under the Companies Act, the board of directors has the authority to determine our basic management policy, make decisions on the execution and management of our business operations, and oversee the execution by the corporate executives of their duties. The board of directors may delegate, to the extent permitted by the Companies Act, the authority to make decisions on the execution and management of our business operations. Our board of directors has delegated most of this authority to the corporate executives.
The board of directors elects the Chairman and the Deputy Chairman from among its members and appoints key management members based on recommendations submitted to it by the nominating committee.
Under the Companies Act, a resolution of the board of directors is required if any director wishes to engage in any business that is in competition with us or any transaction with us. Additionally, no director may vote on a proposal, arrangement or contract in which that director is deemed to be particularly interested.
Neither the Companies Act nor our articles of incorporation contain special provisions as to the borrowing power exercisable by a director, the retirement age of our directors, or a requirement of our directors to hold any shares of our capital stock.
158
Table of Contents
Under the Companies Act and our articles of incorporation, we may exempt, by resolution of the board of directors, our directors from liabilities to MUFG arising in connection with their failure to execute their duties in good faith and without gross negligence within the limits stipulated by applicable laws and regulations. In addition, we have entered into a liability limitation agreement with each outside director and non-executive director which limits the maximum amount of their liability to MUFG arising in connection with a failure to execute their duties in good faith and without gross negligence to the greater of either ¥10 million or the aggregate sum of the amounts prescribed in Paragraph 1 of Article 425 of the Companies Act and Articles 113 and 114 of the Companies Act Enforcement Regulations.
None of our directors is party to a service contract with MUFG or any of its subsidiaries that provides for benefits upon end of their director term.
Nominating Committee
Our nominating committee, which we call the nominating and governance committee, determines the contents of proposals regarding the election and removal of director candidates to be submitted to general meetings of shareholders. The committee also considers and makes recommendations to the board of directors regarding the appointment and removal of the Chairman and the Deputy Chairman of the board of directors and the President & Group CEO of MUFG as well as the chairman and the deputy chairman of the board of directors, the president and others of each of our major subsidiaries. In addition, the committee discusses and makes recommendations to the board of directors on matters pertaining to our governance policy and framework.
Under the Companies Act, the nominating committee must consist of at least three directors, and the majority of its members must be outside directors. Our nominating and governance committee currently consists of five directors. The chairman of the committee is Tsutomu Okuda, an outside director. The other members of this committee are Mariko Fujii, Haruka Matsuyama and Hirofumi Nomoto, who are outside directors, and Kanetsugu Mike, Director, President & Group CEO. Between April 2018 and March 2019, the nominating and governance committee met 13 times.
Audit Committee
The audit committee determines the contents of proposals pertaining to the election, termination and non-appointment of our independent auditor to be submitted to general meetings of shareholders. The committee also monitors and audits the execution by the directors and the corporate executives of their duties and prepares audit reports to the board of directors. In order to effectively perform its duties, the committee reviews, inspects and investigates, as necessary, the management of the operations of MUFG and its subsidiaries, including financial reporting and internal controls. In addition, the committee has the power to consent to decisions on the compensation to be paid to our independent auditor.
Under the Companies Act, the audit committee must consist of at least three non-executive directors, and the majority of its members must be outside directors. Our committee currently has five members. The chairman of the committee is Akira Yamate, an outside director. The other members of the committee are Kaoru Kato and Yasushi Shingai, who are outside directors, and Tadashi Kuroda and Junichi Okamoto, who are non-executive directors. Between April 2018 and March 2019, the audit committee met 17 times.
On May 24, 2019, we became aware that a member of our audit committee did not meet the independence standard for audit committee members set forth in Rule 10A-3(b)(1) of the U.S. Securities Exchange Act of 1934 as a result of a ¥195,580 payment that such committee member received from Mitsubishi UFJ Research and Consulting Co., Ltd., our consolidated subsidiary, in connection with a one-time speaking engagement held on December 6, 2018. We promptly notified the NYSE of this matter. On June 6, 2019, the committee member returned the payment to the subsidiary. Based on subsequent discussions between us and the NYSE, in light of the fact that the violation was inadvertent and the committee member returned the payment to the subsidiary, the
159
Table of Contents
NYSE has indicated that it does not intend to take any further action relating to this matter. Since June 6, 2019, the committee member has satisfied the independence standard for audit committee members set forth in Rule 10A-3(b)(1) of the U.S. Securities Exchange Act of 1934.
Compensation Committee
The compensation committee establishes our policy regarding the determination of the compensation of MUFG’s directors, corporate executives, executive officers ( shikko yakuin ) and others and also determines the details of individual compensation based on the policy. The committee discusses and makes recommendations to the board of directors regarding the establishment, revision and abolition of compensation systems for the chairman, the deputy chairman, the president and others of each of our major subsidiaries.
Under the Companies Act, the compensation committee must consist of at least three directors, and the majority of its members must be outside directors. Our compensation committee currently consist of five directors. The chairman of the committee is Haruka Matsuyama, an outside director. The other members of this committee are Mariko Fujii, Hirofumi Nomoto and Tsutomu Okuda, who are outside directors, and Kanetsugu Mike, Director, President & Group CEO. Between April 2018 and March 2019, the compensation committee met 7 times.
Risk Committee
In addition to the foregoing three committees, which are mandated by the Companies Act, we have a risk committee, which was initially established under our previous governance framework and which we continue to have under our current governance framework on a voluntary basis. The risk committee deliberates and makes recommendations to the board of directors on matters regarding group-wide risk management as well as top risk matters.
MUFG Corporate Governance Policies provide that the committee shall consist of directors and outside professionals. Outside professionals are professionals with no prior employment relationship with any of the MUFG group companies. The committee currently has seven members. The chairperson of the committee is Mariko Fujii, an outside director. The other members of this committee are Toby S. Myerson, Yasushi Shingai and Tarisa Watanagase, who are outside directors, Naomi Hayashi, Managing Corporate Executive and Group CSO, and Kenzo Yamamoto and Naoko Nemoto, who are external experts. Between April 2018 and March 2019, the risk committee met four times.
U.S. Risk Committee
The U.S. risk committee oversees the risk management function for our combined U.S. operations. Its oversight role includes, but is not limited to, all roles and responsibilities required under the FRB’s final rules for Enhanced Prudential Standards for foreign banking organizations. The committee monitors liquidity and all other types of risk exposures, reviews the risk management policies and procedures, and oversees compliance with such policies and procedures for our combined U.S. operations. The committee is a subcommittee of the board of directors of MUFG, and reports and makes recommendations to MUFG’s board of directors and MUFG’s risk committee.
The members of the U.S. risk committee are appointed by MUFG’s board of directors after consideration of member candidates reviewed and recommended by MUFG’s risk committee and nominating and governance committee. The committee shall consist of members of the MUFG Americas Holdings Risk Committee, delegates from MUFG, the Chairman of the MUFG Americas Holdings Board and MUFG Americas Holdings’ CEO, with the chairperson of the committee being an outside director of MUFG Americas Holdings. The committee currently has eight members. The chairperson of the committee is Ann F. Jaedicke, an outside director of MUFG Americas Holdings. The other members of this committee are Dean A. Yoost, Suneel Kamlani, Toby
160
Table of Contents
Myerson and Roberta Bienfait, who are outside directors of MUFG Americas Holdings, Masato Miyachi, the Chairman of the MUFG Americas Holdings Board, Masahiro Kuwahara, Managing Corporate Executive and Group CRO of MUFG and Stephen Cummings, MUFG Americas Holdings’ CEO.
Corporate Executives
Our corporate executives are responsible for executing and managing our business operations within the scope of the authority delegated to them by the board of directors.
Under the Companies Act, at least one corporate executive must be appointed by a resolution of the board of directors. We currently have 19 corporate executives. Under our articles of incorporation, the board of directors shall appoint a president and a deputy president, who, as representative corporate executives, may represent us severally. The term of office of each corporate executive expires at the conclusion of the first meeting of the board of directors convened after the ordinary general meeting of shareholders for the last fiscal year that ends within one year following the corporate executive’s assumption of office.
Under the Companies Act, a resolution of the board of directors is required if any corporate executive wishes to engage in any business that is in competition with us or any transaction with us.
Under the Companies Act and our articles of incorporation, we may exempt, by resolution of the board of directors, our corporate executives from liabilities to MUFG arising in connection with their failure to execute their duties in good faith and without gross negligence within the limits stipulated by applicable laws and regulations. We, however, currently have no such arrangements with any of our corporate executives.
161
Table of Contents
| D. |
Employees |
As of March 31, 2019, we had approximately 112,700 employees, an increase of approximately 1,600 employees compared with the number of employees as of March 31, 2018. In addition, as of March 31, 2019, we had approximately 32,000 part-time and temporary employees. The following tables show the percentages of our employees across our different business units and in different locations as of March 31, 2019:
|
Business unit |
||||
|
MUFG Bank: |
||||
|
Retail & Commercial Banking Business Unit |
20 | % | ||
|
Japanese Corporate & Investment Banking Business Unit |
3 | |||
|
Global Corporate & Investment Banking Business Unit |
2 | |||
|
Global Commercial Banking Business Unit |
31 | |||
|
Global Markets Business Unit |
1 | |||
|
Corporate Center/Corporate Staff |
20 | |||
|
Mitsubishi UFJ Trust and Banking: |
||||
|
Trust-Banking |
4 | |||
|
Trust Assets |
4 | |||
|
Real Estate |
1 | |||
|
Global Markets |
1 | |||
|
Administration and subsidiaries |
2 | |||
|
Mitsubishi UFJ Securities Holdings: |
||||
|
Sales Marketing Business Unit |
3 | |||
|
Global Investment Banking Business Unit |
1 | |||
|
Global Markets Business Unit |
0 | |||
|
International Business Unit |
1 | |||
|
Corporate Center and Others |
2 | |||
|
Mitsubishi UFJ NICOS: |
||||
|
Business Marketing Division |
1 | |||
|
Credit Risk Management & Risk Assets Administration Division |
1 | |||
|
Operations Division |
0 | |||
|
Systems Division |
0 | |||
|
Corporate Division |
0 | |||
|
Others |
2 | |||
|
|
|
|||
| 100 | % | |||
|
|
|
|||
162
Table of Contents
|
Location |
||||
|
MUFG Bank: |
||||
|
Japan |
30 | % | ||
|
United States |
12 | |||
|
Europe |
2 | |||
|
Asia/Oceania excluding Japan |
33 | |||
|
Other areas |
1 | |||
|
Mitsubishi UFJ Trust and Banking: |
||||
|
Japan |
9 | |||
|
United States |
1 | |||
|
Europe |
1 | |||
|
Asia/Oceania excluding Japan |
0 | |||
|
Mitsubishi UFJ Securities Holdings: |
||||
|
Japan |
5 | |||
|
United States |
0 | |||
|
Europe |
1 | |||
|
Asia/Oceania excluding Japan |
0 | |||
|
Mitsubishi UFJ NICOS: |
||||
|
Japan |
3 | |||
|
United States |
0 | |||
|
Europe |
0 | |||
|
Asia/Oceania excluding Japan |
0 | |||
|
Others |
2 | |||
|
|
|
|||
| 100 | % | |||
|
|
|
|||
Most of our employees are members of an employees’ union, which negotiates on behalf of employees in relation to remuneration and working conditions. We believe our labor relations to be good.
| E. |
Share Ownership |
The information required by this item is set forth in “—B. Compensation.”
| Item 7. |
Major Shareholders and Related Party Transactions. |
| A. |
Major Shareholders |
Common Stock
As of March 31, 2019, we had 695,521 registered shareholders of our common stock. The ten largest holders of our common stock appearing on the register of shareholders as of March 31, 2019, and the number and the percentage of such shares held by each of them, were as follows:
|
Name |
Number of shares
held |
Percentage of
total shares in issue (3) |
||||||
|
The Master Trust Bank of Japan, Ltd. (Trust account) (1) |
738,305,200 | 5.40 | % | |||||
|
Japan Trustee Services Bank, Ltd. (Trust account) (1) |
679,609,600 | 4.97 | ||||||
|
SSBTC CLIENT OMNIBUS ACCOUNT |
338,906,515 | 2.47 | ||||||
|
Japan Trustee Services Bank, Ltd. (Trust account 5) (1) |
266,418,200 | 1.94 | ||||||
|
Japan Trustee Services Bank, Ltd. (Trust account 9) (1) |
205,451,700 | 1.50 | ||||||
|
Government of Norway |
194,590,625 | 1.42 | ||||||
|
JP Morgan Chace Bank 385151 |
193,449,305 | 1.41 | ||||||
|
State Street Bank West Client-Treaty 505234 |
189,409,851 | 1.38 | ||||||
|
Japan Trustee Services Bank, Ltd. (Trust account 1) (1) |
177,577,500 | 1.29 | ||||||
|
The Bank of New York Mellon as Depositary Bank for DR Holders (2) |
175,825,882 | 1.28 | ||||||
|
|
|
|
|
|||||
|
Total |
3,159,544,378 | 23.11 | % | |||||
|
|
|
|
|
|||||
163
Table of Contents
| Notes: |
| (1) | Includes the shares held in trust accounts, which do not disclose the names of beneficiaries. |
| (2) | An owner of record for our ADSs. |
| (3) | Numbers are truncated after two decimal points. |
| (4) | According to a beneficial ownership report on Schedule 13G filed with the SEC by BlackRock Inc. on February 6, 2019, BlackRock and its consolidated subsidiaries beneficially owned an aggregate of 5.6% of the outstanding shares of our common stock as of December 31, 2018. Other than as described in the table above, we have not independently confirmed this beneficial ownership information. |
As of March 31, 2019, 1,806,395 shares, representing approximately 0.01% of our outstanding common stock, were held by our directors and corporate executives.
As of March 31, 2019, 1,893,888,527 shares, representing 13.85% of our outstanding common stock, were owned by 408 U.S. shareholders of record who are resident in the United States, one of whom is the ADR depository’s nominee holding 175,825,882 shares, or 1.28%, of our total issued shares of common stock.
Our major shareholders do not have different voting rights.
| B. |
Related Party Transactions |
As of March 31, 2019, we held approximately 24.0% of the voting rights in Morgan Stanley and Series C Preferred Stock with a face value of approximately $521.4 million and 10% dividend. We also have two representatives appointed to Morgan Stanley’s board of directors. We adopted the equity method of accounting for our investment in Morgan Stanley beginning with the fiscal year ended March 31, 2012. In April 2018, we entered into a sales plan with Morgan Stanley and Morgan Stanley & Co. LLC, pursuant to which we will sell portions of the shares of Morgan Stanley common stock that we hold to Morgan Stanley through Morgan Stanley & Co. LLC acting as agent for Morgan Stanley to the extent necessary to ensure that our beneficial ownership will remain below 24. 9%.
We and Morgan Stanley have two securities joint venture companies, namely, Mitsubishi UFJ Morgan Stanley Securities and Morgan Stanley MUFG Securities, in Japan. We hold a 60% economic interest in Mitsubishi UFJ Morgan Stanley Securities and Morgan Stanley MUFG Securities, and Morgan Stanley holds a 40% economic interest in Mitsubishi UFJ Morgan Stanley Securities and Morgan Stanley MUFG Securities. We hold a 60% voting interest and Morgan Stanley holds a 40% voting interest in Mitsubishi UFJ Morgan Stanley Securities, and we hold a 49% voting interest and Morgan Stanley holds a 51% voting interest in Morgan Stanley MUFG Securities.
We and Morgan Stanley continue to pursue a variety of business opportunities in Japan and abroad in accordance with the global strategic alliance. For a detailed discussion of our global alliance with Morgan Stanley, see “Item 4.B. Information on the Company—Business Overview—Global Strategic Alliance with Morgan Stanley.”
We and our banking subsidiaries had, and expect to have in the future, banking transactions and other transactions in the ordinary course of business with our related parties. Although for the fiscal year ended March 31, 2019, such transactions included, but were not limited to, call money, loans, electronic data processing, leases and management of properties, those transactions were immaterial and were made at prevailing market rates, terms and conditions and do not involve more than the normal risk of collectability or present other unfavorable features.
None of our directors or corporate executives, nor any of the close members of their respective families, has had any transactions or has any presently proposed transactions that are material or any transactions that are unusual in their nature or conditions, involving goods, services or tangible or intangible assets, to which we were, are or will be a party.
164
Table of Contents
No loans have been made to our directors or corporate executives other than in the normal course of business, on substantially the same terms, including interest rates and collateral, as those prevailing at the time for comparable transactions with other persons, involving no more than the normal risk of collectability and presenting no other unfavorable features. In addition, no loans have been made to our directors or corporate executives other than as permitted under Section 13(k) of the U.S. Securities Exchange Act and Rule 13k-1 promulgated thereunder.
No family relationship exists among any of our directors or corporate executives. No arrangement or understanding exists between any of our directors or corporate executives and any other person pursuant to which any director or corporate executive was elected to their position at MUFG.
As part of our compensation structure, we have granted performance-based stock compensation rights and stock acquisition rights to our directors and corporate executives. For a detailed discussion of the stock acquisition rights, see “Item 6.B. Directors, Senior Management and Employees—Compensation.”
| C. |
Interests of Experts and Counsel |
Not applicable.
| Item 8. |
Financial Information. |
| A. |
Consolidated Statements and Other Financial Information |
The information required by this item is set forth in our consolidated financial statements starting on page F-1 of this Annual Report and in “Selected Statistical Data” starting on page A-1 of this Annual Report.
Pursuant to Rule 3-09 of Regulation S-X, the financial statements and supplementary data of Morgan Stanley, our equity method investee, as of and for the fiscal year ended December 31, 2018, are incorporated in this Annual Report as Exhibit 99(c) by reference to Morgan Stanley’s annual report on Form 10-K filed on February 26, 2019.
Legal Proceedings
From time to time, we are involved in various litigation matters and other legal proceedings, including regulatory actions. Although the final resolution of any such matters and proceedings could have a material effect on our consolidated operating results for a particular reporting period, based on our current knowledge and consultation with legal counsel, we believe the current litigation matters and other legal proceedings, when ultimately determined, will not materially affect our results of operations or financial position.
On November 8, 2017, MUFG Bank filed suit against the Superintendent of DFS in the U.S. District Court for the Southern District of New York, seeking declaratory and injunctive relief to prevent DFS from exercising further authority over MUFG Bank’s New York Branch and to confirm the validity of the New York Branch’s federal banking license issued by the OCC, effective November 7, 2017. On January 31, 2018, DFS filed an answer denying MUFG Bank’s allegations and asserting defenses to MUFG’s requests for relief, together with counterclaims seeking monetary penalties against MUFG Bank based on purported violations of law alleged to have occurred prior to the federal license conversion. On March 19, 2018, MUFG Bank moved to dismiss all of DFS’s counterclaims as preempted by federal law and for failure to state a claim under New York law. On June 24, 2019 in New York time, MUFG Bank reached a settlement with DFS to resolve the lawsuit. MUFG Bank paid a $33 million settlement payment. This settlement resolves the pending federal civil litigation in its entirety, and does not constitute a regulatory order or involve a monetary penalty.
For more information, see “Item 3.D. Key Information—Risk Factors—Risks Related to Our Business—We may become subject to regulatory actions or other legal proceedings relating to our transactions or other aspects of our operations, which could result in significant financial losses, restrictions on our operations and damage to our reputation.” and Note 27 to our consolidated financial statements included elsewhere in this Annual Report.
165
Table of Contents
Distributions
Our board of directors submits a recommendation for a year-end dividend for our shareholders’ approval at the ordinary general meeting of shareholders customarily held in June of each year. The year-end dividend is usually distributed immediately following shareholders’ approval to holders of record at the end of the preceding fiscal year. In addition to year-end dividends, we may make cash distributions by way of interim dividends to shareholders of record as of September 30 of each year as distribution of surplus by resolution of our board of directors. Year-end dividends in the amount of ¥11.0 per share of our common stock (in addition to interim dividends of ¥11.0 per share of our common stock) for the fiscal year ended March 31, 2019 were approved by shareholders at the ordinary general meeting of shareholders held on June 27, 2019.
See “Item 10.B. Additional Information—Memorandum and Articles of Association” for additional information on our dividends policy.
Under the Japanese foreign exchange regulations currently in effect, dividends paid on shares held by non-residents of Japan may be converted into any foreign currency and repatriated abroad. Under the terms of the deposit agreement pursuant to which ADSs are issued, the depositary is required, to the extent that in its judgment it can convert Japanese yen on a reasonable basis into U.S. dollars and transfer the resulting U.S. dollars to the United States, to convert all cash dividends that it receives in respect of deposited shares into U.S. dollars and to distribute the amount received, after deduction of any applicable withholding taxes, to the holders of ADSs. See “Item 10.D. Additional Information—Exchange Controls” and “Item 12.D. Description of Securities Other than Equity Securities—American Depositary Shares.”
| B. |
Significant Changes |
Other than as described in this Annual Report, no significant changes have occurred since the date of our consolidated financial statements included in this Annual Report.
| Item 9. |
The Offer and Listing. |
| A. |
Offer and Listing Details |
The principal market for our common stock is the Tokyo Stock Exchange in Japan. Our common stock is also listed on the Nagoya Stock Exchange in Japan. The listing code assigned to our common stock in Japan is 8306.
In the United States, ADSs, each representing one share of common stock, are quoted on the New York Stock Exchange under the symbol, “MUFG.”
| B. |
Plan of Distribution |
Not applicable.
| C. |
Markets |
The information required by this item is set forth in “—A. Offer and Listing Details.”
| D. |
Selling Shareholders |
Not applicable.
| E. |
Dilution |
Not applicable.
166
Table of Contents
| F. |
Expenses of the Issue |
Not applicable.
| Item 10. |
Additional Information. |
| A. |
Share Capital |
Not applicable.
| B. |
Memorandum and Articles of Association |
Our Corporate Purpose
Article 2 of our Articles of Incorporation provides that our corporate purpose is to carry on the following businesses:
| • |
administration of management of banks, trust banks, specialized securities companies, insurance companies or other companies which we may own as our subsidiaries under the Banking Law; |
| • |
any businesses incidental to the foregoing businesses mentioned in the preceding item; and |
| • |
any other businesses in which bank holding companies are permitted to engage under the Banking Law in addition to the foregoing businesses mentioned in the preceding two items. |
Board of Directors
For discussion of the provisions of our Articles of Incorporation as they apply to our directors, see “Item 6.C. Directors, Senior Management and Employees—Board Practices.”
Common Stock
As of March 31, 2019, a total of 13,667,770,520 shares of common stock (including 745,921,774 shares of common stock held by us and our consolidated subsidiaries as treasury stock) had been issued. Each of the shares issued and outstanding was fully paid and non-assessable.
For a description of our common stock, see Exhibit 2(c) to this Annual Report.
Preferred Stock
We currently have no shares of preferred stock issued.
For a description of preferred stock we are authorized to issue under our Articles of Incorporation, see Exhibit 2(c) to this Annual Report.
| C. |
Material Contracts |
Except as described elsewhere in this Annual Report, all material contracts entered into by us in the past two years preceding the filing of this Annual Report were entered into in the ordinary course of business.
| D. |
Exchange Controls |
Foreign Exchange and Foreign Trade Law
The Foreign Exchange and Foreign Trade Law of Japan and the cabinet orders and ministerial ordinances incidental thereto, collectively known as the Foreign Exchange Law, set forth, among other matters, regulations
167
Table of Contents
relating to the receipt by non-residents of Japan of payment with respect to shares to be issued by us and the acquisition and holding of shares by non-residents of Japan and foreign investors, both as defined below. It also applies in some cases to the acquisition and holding of ADSs representing such shares acquired and held by non-residents of Japan and foreign investors. Generally, the Foreign Exchange Law currently in effect does not affect the right of a non-resident of Japan to purchase or sell an ADS outside Japan for non-Japanese currency.
“Non-residents of Japan” are defined as individuals who are not resident in Japan and corporations whose principal offices are located outside Japan. Generally, the branches and offices of non-resident corporations which are located in Japan are regarded as residents of Japan while the branches and offices of Japanese corporations located outside Japan are regarded as non-residents of Japan.
“Foreign investors” are defined as:
| • |
natural persons who are non-resident of Japan; |
| • |
corporations which are organized under the laws of foreign countries or whose principal offices are located outside Japan; |
| • |
corporations of which 50% or more of the shares are directly or indirectly held by individuals not resident of Japan and corporations which are organized under the laws of foreign countries or whose principal offices are located outside Japan; and |
| • |
corporations, a majority of officers (or a majority of officers having the power of representation) of which are non-resident individuals. |
Dividends and Proceeds of Sales
Under the Foreign Exchange Law, dividends paid on, and the proceeds of sales in Japan of, shares held by non-residents of Japan may in general be converted into any foreign currency and repatriated abroad. The acquisition of our shares by non-residents of Japan by way of a stock split is not subject to any notification or reporting requirements.
Acquisition of Shares
In general, a non-resident of Japan who acquires shares from a resident of Japan is not subject to any prior filing requirement, although the Foreign Exchange Law empowers the Minister of Finance of Japan to require a prior approval for any such acquisition in certain limited circumstances.
If a foreign investor acquires our shares, and, together with parties who have a special relationship with that foreign investor, holds 10% or more of our issued shares as a result of such acquisition, the foreign investor must file a report of such acquisition with the Minister of Finance and any other competent Minister by the fifteenth day of the month immediately following the month to which the date of such acquisition belongs. In certain limited circumstances, however, a prior notification of such acquisition must be filed with the Minister of Finance and any other competent Minister, who may modify or prohibit the proposed acquisition.
Deposit and Withdrawal under American Depositary Facility
The deposit of shares with us, in our capacity as custodian and agent for the depositary, in Tokyo, the issuance of ADSs by the depositary to a non-resident of Japan in respect of the deposit and the withdrawal of the underlying shares upon the surrender of the ADSs are not subject to any of the formalities or restrictions referred to above. However, where as a result of a deposit or withdrawal the aggregate number of shares held by the depositary, including shares deposited with us as custodian for the depositary, or the holder surrendering ADSs, as the case may be, would be 10% or more of the total outstanding shares, a report will be required, and in specified circumstances, a prior notification may be required, as noted above.
168
Table of Contents
Reporting of Substantial Shareholdings
The Financial Instruments and Exchange Act of Japan requires any person who has become, beneficially and solely or jointly, a holder of more than 5% of the total issued shares of capital stock of a company listed on any Japanese financial instruments exchange or whose shares are traded on the over-the-counter market in Japan to file with the director of a competent finance bureau within five business days a report concerning such shareholdings.
A similar report must also be filed in respect of any subsequent change of 1% or more in any such holding ratio or any change in material matters set out in reports previously filed, with certain exceptions. For this purpose, shares issuable to such person upon exchange of exchangeable securities, conversion of convertible securities or exercise of share subscription warrants or stock acquisition rights (including those incorporated in bonds with stock acquisition rights) are taken into account in determining both the number of shares held by such holder and the issuer’s total issued shares of capital stock.
| E. |
Taxation |
Japanese Taxation
The following sets forth the material Japanese tax consequences to owners of shares of our common stock or ADSs who are non-resident individuals or non-Japanese corporations without a permanent establishment in Japan to which the relevant income is attributable, which we refer to as “non-resident holders” in this section. The statements regarding Japanese tax laws below are based on the laws in force and as interpreted by the Japanese taxation authorities as at the date of this Annual Report and are subject to changes in the applicable Japanese laws, double taxation treaties, conventions or agreements or interpretations thereof occurring after that date. This summary is not exhaustive of all possible tax considerations that may apply to a particular investor, and potential investors are advised to satisfy themselves as to the overall tax consequences of the acquisition, ownership and disposition of shares of our common stock or ADSs, including specifically the tax consequences under Japanese law, the laws of the jurisdiction of which they are resident and any tax treaty between Japan and their country of residence, by consulting their own tax advisers.
For the purpose of Japanese tax law and the Convention between the Government of the United States of America and Japan for the Avoidance of Double Taxation and the Prevention of Fiscal Evasion with Respect to Taxes on Income, or the Tax Convention, a U.S. holder of ADSs will be treated as the owner of the shares of our common stock underlying the ADSs evidenced by the ADRs.
Generally, a non-resident holder of shares of our common stock or ADSs is subject to Japanese withholding tax on dividends paid by us. In the absence of any applicable tax treaty, convention or agreement reducing the rate of withholding tax, the rate of Japanese withholding tax applicable to dividends paid by us to non-resident holders is (i) 15.315% for dividends to be paid on or before December 31, 2037 and (ii) 15% for dividends to be paid thereafter, except for dividends paid to any individual non-resident holder who holds 3% or more of our issued shares for which the applicable rate is (a) 20.42% for dividends to be paid on or before December 31, 2037 and (b) 20% for dividends to be paid thereafter, pursuant to Japanese tax law.
The Tax Convention establishes the maximum rate of Japanese withholding tax which may be imposed on dividends paid to a U.S. resident not having a permanent establishment in Japan. Under the Tax Convention, the maximum withholding rate for U.S. holders (as defined below) is generally set at 10% of the gross amount distributed. However, the maximum rate is 5% of the gross amount distributed if the recipient is a corporation and owns directly or indirectly, on the date on which entitlement to the dividends is determined, at least 10% of the voting shares of the paying corporation. Furthermore, the amount distributed shall not be taxed if the recipient is (i) a pension fund which is a U.S. resident, provided that such dividends are not derived from the carrying on of a business, directly or indirectly, by such pension fund or (ii) a parent company with a controlling interest in the paying company and satisfies certain other requirements. U.S. holders (as defined below) are urged to consult their own tax advisors with respect to their eligibility for benefits under the Tax Convention.
169
Table of Contents
Japanese tax law provides in general that if the Japanese statutory rate is lower than the maximum rate applicable under tax treaties, conventions or agreements, the Japanese statutory rate as stated above shall be applicable.
Non-resident holders of shares who are entitled to a reduced rate of Japanese withholding tax on payments of dividends on the shares of our common stock or ADSs by us are required to submit an Application Form for the Income Tax Convention regarding Relief from Japanese Income Tax on Dividends, or an Application Form for the Income Tax Convention, in advance through a paying handling agent to the relevant tax authority before the payment of dividends. A standing proxy for non-resident holders may provide this application service for the non-resident holders. In this regard, a certain simplified special filing procedure is available for non-resident holders to claim treaty benefits of exemption from or reduction of Japanese withholding tax with respect to dividends to be paid on or after January 1, 2014, by submitting a Special Application Form for Income Tax Convention regarding Relief from Japanese Income Tax and Special Income Tax for Reconstruction on Dividends of Listed Stocks (together with any other required forms and documents). With respect to ADSs, this reduced rate or exemption will be applicable to non-resident holders of ADSs if the depositary or its agent submits two Application Forms (one before payment of dividends and the other within eight months after the record date concerning such payment of dividends), together with certain other documents. To claim this reduced rate or exemption, non-resident holders of ADSs will be required to file a proof of taxpayer status, residence and beneficial ownership, as applicable, and to provide other information or documents as may be required by the depositary. Non-resident holders who are entitled, under any applicable tax treaty, to a reduced rate of Japanese withholding tax below the rate otherwise applicable under Japanese tax law, or exemption therefrom, as the case may be, but fail to submit the required application in advance may nevertheless be entitled to claim a refund from the relevant Japanese tax authority of withholding taxes withheld in excess of the rate under an applicable tax treaty (if such non-resident holders are entitled to a reduced treaty rate under the applicable tax treaty) or the full amount of tax withheld (if such non-resident holders are entitled to an exemption under the applicable tax treaty), as the case may be, by complying with a certain subsequent filing procedure. We do not assume any responsibility to ensure withholding at the reduced rate, or an exemption therefrom, for non-resident holders who would be so eligible under an applicable tax treaty but where the required procedures as stated above are not followed.
Gains derived from the sale or other disposition of shares of our common stock or ADSs by a non-resident holder are not, in general, subject to Japanese income or corporation taxes or other Japanese taxes.
Any deposits or withdrawals of shares of our common stock by a non-resident holder in exchange for ADSs are not subject to Japanese income or corporation tax.
Japanese inheritance and gift taxes, at progressive rates, may be payable by an individual who has acquired shares of our common stock or ADSs as legatee, heir or donee, even if none of the individual, the decedent or the donor is a Japanese resident.
U.S. Taxation
The following sets forth the material U.S. federal income tax consequences of the ownership of shares and ADSs by a U.S. holder, as defined below. This summary is based on U.S. federal income tax laws, including the U.S. Internal Revenue Code of 1986, or the Code, its legislative history, existing and proposed Treasury regulations thereunder, published rulings and court decisions, and the Tax Convention (as defined above), all of which are subject to change, possibly with retroactive effect.
The following summary is not a complete analysis or description of all potential U.S. federal income tax consequences to a particular U.S. holder. It does not address all U.S. federal income tax considerations that may be relevant to all categories of potential purchasers, certain of which (such as banks or other financial institutions, insurance companies, dealers in securities, tax-exempt entities, non-U.S. persons, persons holding a
170
Table of Contents
share or an ADS as part of a “straddle,” “hedge,” conversion or integrated transaction, holders whose “functional currency” is not the U.S. dollar, holders liable for alternative minimum tax, holders required to report income no later than when such income is reported on an “applicable financial statement,” and holders of 10% or more of our shares by vote or value) are subject to special tax treatment. This summary does not address any foreign, state, local or other tax consequences of investments in our shares or ADSs.
This summary addresses only shares or ADSs that are held as capital assets within the meaning of Section 1221 of the Code.
As used herein, a “U.S. holder” is a beneficial owner of shares or ADSs, as the case may be, that is:
| • |
a citizen or resident of the United States as determined for U.S. federal income tax purposes; |
| • |
a corporation or other entity taxable as a corporation created or organized under the laws of the United States, any state thereof or the District of Columbia; |
| • |
an estate, the income of which is subject to U.S. federal income tax regardless of its source; or |
| • |
a trust |
| • |
the administration of which is subject to (1) the supervision of a court within the United States and (2) the control of one or more U.S. persons as described in Section 7701(a)(30) of the Code; or |
| • |
that has a valid election in effect under applicable U.S. Treasury regulations to be treated as a U.S. person. |
If a partnership holds shares or ADSs, the tax treatment of a partner will generally depend on the status of the partner and the activities of the partnership. If you are a partner of a partnership holding shares or ADSs, you should consult your tax advisor.
We urge U.S. holders to consult their own tax advisors concerning the U.S. federal, state and local and other tax consequences to them of the purchase, ownership and disposition of shares or ADSs.
This summary is based in part on the assumption that each obligation under the deposit agreement and any related agreement will be performed in accordance with its respective terms. Subject to the discussion in the next paragraph, for U.S. federal income tax purposes, holders of ADSs will be treated as the owners of the shares represented by the ADSs. Accordingly, withdrawals or deposits of shares in exchange for ADSs generally will not be subject to U.S. federal income tax.
The U.S. Treasury has expressed concerns that intermediaries in the chain of ownership between the holder of an ADS and the issuer of the security underlying the ADS may be taking actions that are inconsistent with the beneficial ownership of the underlying shares (for example, pre-releasing ADSs to persons who do not have beneficial ownership of the securities underlying the ADSs). Accordingly, the discussion on the creditability of Japanese taxes and the availability of the reduced rate of tax for dividends received by certain non-corporate U.S. holders, each as described below, could be affected by actions taken by intermediaries in the chain of ownership between the holder of ADSs and us if, as a result of such actions, the holders of ADSs are not properly treated as beneficial owners of the underlying shares. We are not aware of any intention to take any such actions, and accordingly, the remainder of this discussion assumes that holders of ADSs will be properly treated as beneficial owners of the underlying shares.
Special adverse U.S. federal income tax rules apply if a U.S. holder holds shares or ADSs of a company that is treated as a “passive foreign investment company” (a “PFIC”) for any taxable year during which the U.S. holder held shares or ADSs, as discussed in more detail below. U.S. holders should consult their own tax advisors as to the potential application of the PFIC rules to their ownership and disposition of shares or ADSs.
171
Table of Contents
Taxation of Dividends
Subject to the application of the PFIC rules discussed below, U.S. holders will include the gross amount of any distribution received with respect to shares or ADSs (before reduction for Japanese withholding taxes), to the extent paid out of our current or accumulated earnings and profits (as determined for U.S. federal income tax purposes), as ordinary income in their gross income. As discussed below, for certain U.S. holders, dividends may be eligible for a reduced rate of taxation. The amount of distribution of property other than cash will be the fair market value of such property on the date of the distribution. Dividends received by a U.S. holder will not be eligible for the “dividends-received deduction” allowed to U.S. corporations in respect of dividends received from other U.S. corporations. To the extent that an amount received by a U.S. holder exceeds such holder’s allocable share of our current earnings and profits, such excess will be applied first to reduce such holder’s tax basis in its shares or ADSs, thereby increasing the amount of gain or decreasing the amount of loss recognized on a subsequent disposition of the shares or ADSs. Then, to the extent such distribution exceeds such U.S. holder’s tax basis, such excess will be treated as capital gain. However, we do not maintain calculations of our earnings and profits in accordance with U.S. federal income tax principles, and U.S. holders should therefore assume that any distribution by us with respect to shares or ADSs will constitute ordinary dividend income. The amount of the dividend will be the U.S. dollar value of the Japanese yen payments received. This value will be determined at the spot Japanese yen/U.S. dollar rate on the date the dividend is received by the depositary in the case of U.S. holders of ADSs, or by the shareholder in the case of U.S. holders of shares, regardless of whether the dividend payment is in fact converted into U.S. dollars at that time. If the Japanese yen received as a dividend are not converted into U.S. dollars on the date of receipt, a U.S. holder will have basis in such Japanese yen equal to their U.S. dollar value on the date of receipt, and any foreign currency gains or losses resulting from the conversion of the Japanese yen will generally be treated as U.S. source ordinary income or loss. If the Japanese yen received as a dividend are converted into U.S. dollars on the date of receipt, a U.S. holder will generally not be required to recognize foreign currency gain or loss in respect of the dividend income.
If a U.S. holder is eligible for benefits under the Tax Convention, the holder may be able to claim a reduced rate of Japanese withholding tax. All U.S. holders should consult their tax advisors about their eligibility for reduction of Japanese withholding tax. A U.S. holder may claim a deduction or a foreign tax credit, subject to other applicable limitations, only for tax withheld at the appropriate rate. A U.S. holder would be allowed a foreign tax credit for withholding tax for any portion of the tax that could have been avoided by claiming benefits under the Tax Convention. For foreign tax credit limitation purposes, the dividend will be income from sources outside the United States. The limitation on foreign taxes eligible for credit is calculated separately with respect to specific classes of income. For this purpose, dividends we pay will constitute “passive income” or, in the case of certain U.S. holders, “financial services income.” The rules governing U.S. foreign tax credits are very complex and U.S. holders should consult their tax advisors regarding the availability of foreign tax credits under their particular circumstances.
Subject to applicable exceptions with respect to short-term and hedged positions, qualified dividends received by non-corporate U.S. holders from a qualified corporation may be eligible for reduced rates of taxation. Qualified corporations include those foreign corporations eligible for the benefits of a comprehensive income tax treaty with the United States that the U.S. Treasury Department determines to be satisfactory for these purposes and that includes an exchange of information provision. The Tax Convention meets these requirements. Subject to the PFIC discussion below, we believe that we are a qualified foreign corporation and that dividends received by U.S. investors with respect to our shares or ADSs will be qualified dividends. Dividends received by U.S. investors from a foreign corporation that was a PFIC in either the taxable year of the distribution or the preceding taxable year are not qualified dividends.
Passive Foreign Investment Company Considerations
Special adverse U.S. federal income tax rules apply if a U.S. holder holds shares or ADSs of a company that is treated as a PFIC, for any taxable year during which the U.S. holder held shares or ADSs. A foreign
172
Table of Contents
corporation will be considered a PFIC for any taxable year in which (i) 75% or more of its gross income is passive income (the “income test”), or (ii) 50% or more of the average fair market value of its assets (determined quarterly) is attributable to assets that produce or are held for the production of passive income (the “asset test”). For this purpose, passive income generally includes dividends, interest, royalties, rents and certain gains from the sale of stock and securities. If a foreign corporation owns at least 25% (by value) of the stock of another corporation, the corporation will be treated, for purposes of the PFIC tests, as owning a proportionate share of the other corporation’s assets and receiving its proportionate share of the other corporation’s income. The determination of whether a foreign corporation is a PFIC is made annually.
Proposed Treasury regulations convert what would otherwise be passive income into non-passive income when such income is banking income earned by an active bank. Based upon these proposed Treasury regulations, and upon certain management estimates and assumptions, we do not believe that we were a PFIC for the year ended March 31, 2019 because we did not meet either the income test or the asset test. The determination of whether we are a PFIC must be made annually and involves a fact-intensive analysis based upon, among other things, the composition of our income and assets and the value of our assets from time to time. It is possible that we may become a PFIC in the fiscal year ending March 31, 2020 or any future taxable year due to changes in our income or asset composition and the expiration of the temporary IRS guidance described above. In addition, a decrease in the price of our shares may also result in our becoming a PFIC. Furthermore, there can be no assurance that the above-described proposed Treasury regulations will be finalized in their current form. Moreover, the application of the proposed Treasury regulations is not clear. If we were classified as a PFIC in any year during which a U.S. holder owns shares or ADSs and the U.S. holder does not make a “mark-to-market” election, as discussed below, we generally would continue to be treated as a PFIC as to such U.S. holder in all succeeding years, regardless of whether we continue to meet the income or asset test discussed above. U.S. Holders are urged to consult their own tax advisors with respect to the tax consequences to them if we were to become a PFIC for any taxable year in which they own our shares or ADSs.
If we were classified as a PFIC for any taxable year during which a U.S. holder holds our shares or ADSs, the U.S. holder would generally not receive capital gains treatment upon the sale of the shares or ADSs and would be subject to increased tax liability (generally including an interest charge) upon the sale or other disposition of the shares or ADSs or upon the receipt of certain distributions treated as “excess distributions,” unless the U.S. holder makes the mark-to-market election described below. An excess distribution generally would be any distribution to a U.S. holder with respect to shares or ADSs during a single taxable year that is greater than 125% of the average annual distributions received by a U.S. holder with respect to shares or ADSs during the three preceding taxable years or, if shorter, during the U.S. holder’s holding period for the shares or ADSs.
Mark-to-Market Election . If the shares or ADSs are regularly traded on a registered national securities exchange or certain other exchanges or markets, then such shares or ADSs would constitute “marketable stock” for purposes of the PFIC rules, and a U.S. holder would not be subject to the foregoing PFIC rules if such holder made a mark-to-market election. After making such an election, the U.S. holder generally would include as ordinary income each year during which the election is in effect and during which we are a PFIC the excess, if any, of the fair market value of our shares or ADSs at the end of the taxable year over such holder’s adjusted basis in such shares or ADSs. These amounts of ordinary income would not be eligible for the favorable tax rates applicable to qualified dividend income or long-term capital gains. A U.S. holder also would be allowed to take an ordinary loss in respect of the excess, if any, of the holder’s adjusted basis in our shares or ADSs over their fair market value at the end of the taxable year (but only to the extent of the net amount of income that was previously included as a result of the mark-to-market election). A U.S. holder’s tax basis in our shares or ADSs would be adjusted to reflect any income or loss amounts resulting from a mark-to-market election. If made, a mark-to-market election would be effective for the taxable year for which the election was made and for all subsequent taxable years unless the shares or ADSs cease to qualify as “marketable stock” for purposes of the PFIC rules or the IRS consented to the revocation of the election. In the event that we are classified as a PFIC,
173
Table of Contents
U.S. holders are urged to consult their tax advisors regarding the availability of the mark-to-market election, and whether the election would be advisable in the holder’s particular circumstances.
QEF Election . The PFIC rules outlined above also would not apply to a U.S. holder if such holder alternatively elected to treat us as a “qualified electing fund” or “QEF.” An election to treat us as a QEF will not be available, however, if we do not provide the information necessary to make such an election. We will not provide U.S. holders with the information necessary to make a QEF election, and thus, the QEF election will not be available with respect to our shares.
Notwithstanding any election made with respect to our shares, dividends received with respect to our shares will not constitute “qualified dividend income” if we are a PFIC in either the year of the distribution or the preceding taxable year. Dividends that do not constitute qualified dividend income are not eligible for taxation at the reduced tax rate described above in “—Taxation of Dividends.” Instead, such dividends would be subject to tax at ordinary income rates.
If a U.S. holder owns shares or ADSs during any year in which we are a PFIC, the U.S. holder must also file IRS Form 8621 regarding distributions received on the shares or ADSs, any gain realized on the shares or ADSs, and any “reportable election” in accordance with the instructions to such form. In addition, each U.S. holder is required to file a separate IRS Form 8621 if such U.S. holder owns shares or ADSs during any year in which we are a PFIC whether or not such U.S. holder received distributions on the shares or ADSs, realized a gain on the shares or ADSs or made a “reportable election” during such year. U.S. holders are urged to consult their own tax advisors concerning the U.S. federal income tax consequences of holding shares or ADSs if the Company were considered a PFIC in any taxable year.
Taxation of Capital Gains
Subject to the application of the PFIC rules discussed above, upon a sale or other disposition of shares or ADSs, a U.S. holder will recognize a gain or loss in an amount equal to the difference between the U.S. dollar value of the amount realized and the U.S. holder’s tax basis, determined in U.S. dollars, in such shares or ADSs. Such gains or losses will be capital gains or losses and will be long-term capital gains or losses if the U.S. holder’s holding period for such shares or ADSs exceeds one year. Long-term capital gains of non-corporate U.S. holders (including individuals) are generally eligible for reduced rates of taxation. A U.S. holder’s adjusted tax basis in its shares or ADSs will generally be the cost to the holder of such shares or ADSs. Any such gains or losses realized by a U.S. holder upon disposal of the shares or ADSs will generally be income or loss from sources within the United States for foreign tax credit limitation purposes. The deductibility of capital losses is subject to limitations under the Code.
Information Reporting and Backup Withholding
Dividends paid on shares or ADSs to a U.S. holder, or proceeds from a U.S. holder’s sale or other disposition of shares or ADSs, may be subject to information reporting requirements. Those dividends or proceeds from sale or disposition may also be subject to backup withholding unless the U.S. holder:
| • |
is a corporation or other exempt recipient, and, when required, demonstrates this fact; or |
| • |
provides a correct taxpayer identification number on a properly completed U.S. IRS Form W-9 or other appropriate form which certifies that the U.S. holder is not subject to backup withholding and otherwise complies with applicable requirements of the backup withholding rules. |
Backup withholding is not an additional tax. Any amount withheld under these rules will be creditable against the U.S. holder’s U.S. federal income tax liability or refundable to the extent that it exceeds such liability if the U.S. holder provides the required information to the IRS. If a U.S. holder is required to and does not provide a correct taxpayer identification number, the U.S. holder may be subject to penalties imposed by the IRS. All holders should consult their tax advisors as to their qualification for the exemption from backup withholding and the procedure for obtaining an exemption.
174
Table of Contents
In addition, certain U.S. holders who are individuals that hold certain foreign financial assets (which may include our shares or ADSs) are required to report information relating to such assets, subject to certain exceptions. U.S. holders should consult their tax advisors regarding the effect, if any, of this requirement on their ownership and disposition of our shares and ADSs.
Additional Tax on Investment Income
U.S. holders that are individuals, estates or trusts and whose income exceeds certain thresholds will be subject to an additional 3.8% tax on unearned income, including, among other things, dividends on, and capital gains from the sale or other taxable disposition of, shares or ADSs, subject to certain limitations and exceptions.
| F. |
Dividends and Paying Agents |
Not applicable.
| G. |
Statement by Experts |
Not applicable.
| H. |
Documents on Display |
We file periodic reports and other information with the SEC. You may read and copy any document that we file with the SEC at the SEC’s public reference room at 100 F Street, NE, Washington, DC 20549. Please call the SEC at 1-800-SEC-0330 for further information on the operation of its public reference room. The SEC also maintains a web site that contains reports, proxy and information statements and other information regarding registrants that file electronically with the SEC (http://www.sec.gov).
| I. |
Subsidiary Information |
Please refer to the discussion under “Item 4.C. Information on the Company—Organizational Structure.”
| Item 11. |
Quantitative and Qualitative Disclosures about Credit, Market and Other Risk. |
In the current market and regulatory environment, financial groups such as us are expected to ensure increasingly more sophisticated and comprehensive risk management. Risk management plays an increasingly important role in our operations as a financial group operating globally through various subsidiaries.
We identify various risks arising from businesses based on group-wide uniform criteria and implement integrated risk management to ensure a stronger financial condition and to maximize shareholder value. Based on this approach, we identify, measure, control and monitor a wide variety of risks so as to achieve a stable balance between earnings and risks. We undertake risk management to create an appropriate capital structure and to achieve optimal allocation of resources.
175
Table of Contents
Risk Classification
At the holding company level, we broadly classify and define risk categories faced by the Group, including those that are summarized below. Group companies perform more detailed risk management based on their respective operations.
|
Type of Risk |
Definition |
|
|
Credit Risk |
The risk of financial loss in credit assets (including off-balance sheet instruments) caused by deterioration in the credit conditions of counterparties. This category includes country risk. | |
|
Market Risk |
The risk of financial loss where the value of our assets and liabilities could be adversely affected by changes in market variables such as interest rates, securities prices and foreign exchange rates. Market liquidity risk is the risk of financial loss caused by the inability to secure market transactions at the required volume or price levels as a result of market turbulence or lack of trading liquidity. | |
|
Funding Liquidity Risk |
The risk of incurring loss if a poor financial position at a group company hampers the ability to meet funding requirements or necessitates fund procurement at interest rates markedly higher than normal. | |
|
Operational Risk |
The risk of loss resulting from inadequate or failed internal processes, people or systems, or from external events. | |
|
• Operations Risk |
The risk of incurring losses arising from negligence of correct operational processing, incidents or misconduct involving officers or staff, as well as risks similar to this risk. | |
|
• Information Risk |
The risk of loss caused by loss, alteration, falsification or leakage of personal or other confidential information, as well as risks similar to these risks. | |
|
• IT Risk |
The risk of loss arising from destruction, suspension, malfunction or misuse of IT, or unauthorized alteration and leakage of electronic data caused by insufficient IT systems planning, development or operations or by vulnerabilities of or external threats to IT system security, including cybersecurity, as well as risks similar to these risks. | |
|
• Tangible Asset Risk |
The risk of loss due to damage to tangible assets or deterioration in the operational environment caused by disasters or inadequate asset maintenance, as well as risks similar to this risk. Tangible assets include movable and immovable property, including owned or leased land and buildings, facilities incidental to buildings, and fixtures and fittings. | |
|
• Personnel Risk |
The risk of loss due to an outflow or loss of human resources or deterioration in employee morale, as well as risks similar to this risk. | |
|
• Incompliance with Laws and Regulations Risk |
The risk of loss due to failure to comply with laws and regulations, as well as risks similar to these risks. | |
|
• Legal Risk |
The risk of a loss due to failure to identify or address legal issues relating to contracts and other business operations or insufficient handling of lawsuits, as well as risks similar to these risks. | |
|
Reputation Risk |
The risk of harm to our corporate value arising from perceptions of our customers, shareholders, investors or other stakeholders and in the market or society that we deviate from their expectations or confidence. | |
|
Model Risk |
The risk of loss due to decision-making based on information provided by an inaccurate model or the misuse of a model. | |
176
Table of Contents
Risk Management System
We have adopted an integrated risk management system to promote close cooperation among the holding company and group companies. The holding company and the major subsidiaries (which include MUFG Bank, Mitsubishi UFJ Trust and Banking and Mitsubishi UFJ Securities Holdings) each appoint a chief risk officer and establish an independent risk management division. The board of directors of the holding company determines risk management policies for various types of risks based on the discussions at, and reports and recommendations from, committees established specially for risk management purposes. The holding company has established committees to oversee management in managing risks relevant to the Group. Following the fundamental risk management policies determined by the board of directors, each group company establishes its own systems and procedures for identifying, analyzing and managing various types of risks from both quantitative and qualitative perspectives. The holding company seeks to enhance group-wide risk identification, to integrate and improve the Group’s risk management system and related methods, to maintain asset quality, and to eliminate concentrations of specific risks.
177
Table of Contents
The following diagram summarizes our integrated risk management framework:
Risk Management System
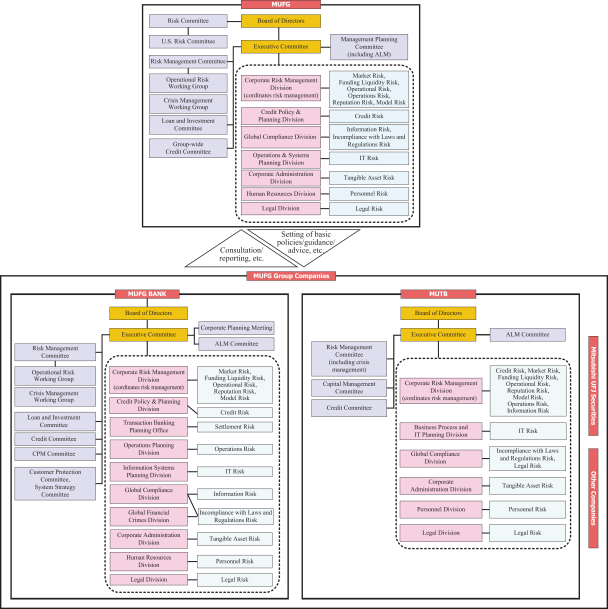
Crisis Management Framework
In order to have a clear critical response rationale and associated decision-making criteria, we have developed systems designed to ensure that our operations are not interrupted or can be restored to normal quickly in the event of a natural disaster or system failure so as to minimize any disruption to customers and markets. A crisis management team within the holding company is the central coordinating body in the event of any emergency. Based on information collected from crisis management personnel at the major subsidiaries, this central body would assess the overall impact of a crisis on the Group’s business and establish task forces that
178
Table of Contents
could implement all countermeasures to restore full operations. We have business continuity plans to maintain continuous operational viability in the event of natural disasters, system failures and other types of emergencies. Regular training drills are conducted to upgrade the practical effectiveness of these systems.
Recognizing that our operations, particularly in Japan, are subject to the risk of earthquakes and other natural disasters as well as accidents resulting from such disasters, including a sudden massive blackout in major metropolitan areas in Japan, and that our contingency plans may not address all eventualities that may occur in the event of a material disruption to our operations, we conduct a comprehensive review of our existing business continuity plan to more effectively respond to such extreme scenarios, and contemplate and implement measures to augment our current business continuity management framework, including enhancing our off-site back-up data storage and other information technology systems.
Implementation of Basel Standards
In determining capital ratios under the FSA guidelines implementing Basel III, we and our banking subsidiaries used the Advanced Internal Ratings-Based approach, or the AIRB approach, to calculate capital requirements for credit risk as of March 31, 2019. The Standardized Approach is used for some subsidiaries that are considered to be immaterial to the overall MUFG capital requirements, and MUFG Americas Holdings has adopted a phased rollout of the Internal Ratings-Based Approach. We reflect market risk in our risk-weighted assets by applying the Internal Models Approach to calculate general market risk and the Standardized Measurement Method to calculate specific risk. Under the Internal Models Approach, we principally use a historical simulation model to calculate value-at-risk, or VaR, amounts by estimating the profit and loss on our portfolio by applying actual fluctuations in historical market rates and prices over a fixed period. Under the FSA guidelines implementing Basel III, we reflect operational risk in our risk-weighted assets by using the Standardized Approach and the Advanced Measurement Approach.
Based on the Basel III framework, the Japanese capital ratio framework has been revised to implement the more stringent requirements, which are being implemented in phases beginning on March 31, 2013. Likewise, local banking regulators outside of Japan, such as those in the United States, have begun, or are expected, to revise the capital and liquidity requirements imposed on our subsidiaries and operations in those countries to implement the more stringent requirements of Basel III as adopted in those countries. We intend to carefully monitor further developments with an aim to enhance our corporate value and maximize shareholder value by integrating the various strengths within the Group. For more information on the Basel regulatory framework and requirements, see “Item 4.B. Information on the Company—Business Overview—Supervision and Regulation.”
Credit Risk Management
Credit risk is the risk of losses due to deterioration in the financial condition of a borrower. We have established risk management systems to maintain asset quality, manage credit risk exposure and achieve earnings commensurate with risk.
MUFG and its major banking subsidiaries apply a uniform credit rating system for asset evaluation and assessment, loan pricing, and quantitative measurement of credit risk. This system also underpins the calculation of capital requirements and the management of credit portfolios. We continually seek to our upgrade credit portfolio management, or CPM, expertise to achieve an improved risk-adjusted return based on the Group’s credit portfolio status and flexible response capability to economic and other external changes.
Credit Risk Management System
The credit portfolios of our major banking subsidiaries are monitored and assessed on a regular basis by the holding company to maintain and improve asset quality. A uniform credit rating and asset evaluation and assessment system is used to ensure timely and proper evaluation of all credit risks.
179
Table of Contents
Under our credit risk management system, each of our subsidiaries in the banking, securities, consumer finance, and leasing businesses, manages its respective credit risk on a consolidated basis based on the attributes of the risk, while the holding company oversees and manages credit risk on an overall group-wide basis. The holding company also convenes regular committee meetings to monitor credit risk management at banking subsidiaries and to issue guidance where necessary.
Each major banking subsidiary has in place a system of checks and balances in which a credit administration section that is independent of the business promotion sections screens individual transactions and manages the extension of credit. At the management level, regular meetings of the Credit & Investment Management Committee and related deliberative bodies ensure full discussion of important matters related to credit risk management. Besides such checks and balances and internal oversight systems, credit examination sections also undertake credit testing and evaluation to ensure appropriate credit risk management.
The following diagram summarizes the credit risk management framework for our major banking subsidiaries:
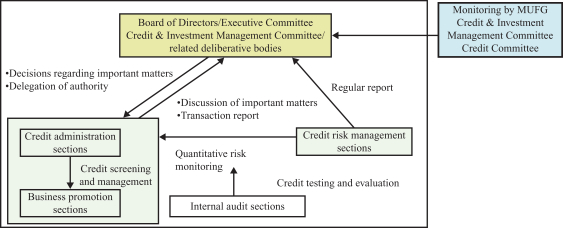
Credit Rating System
MUFG and its major banking subsidiaries use an integrated credit rating system to evaluate credit risk. The credit rating system consists primarily of borrower rating, facility risk rating, structured finance rating and asset securitization rating.
Country risk is also rated on a uniform group-wide basis. Our country risk rating is reviewed periodically to take into account relevant political and economic factors, including foreign currency availability.
Risk exposure for small retail loans, such as residential mortgage loans, is managed by grouping loans into various pools and assigning ratings at the pool level.
Borrower rating
Our borrower rating classifies borrowers into 15 grades based on evaluations of their expected debt-service capability over the next three to five years.
180
Table of Contents
The following table sets forth our borrower grades:
Definition of MUFG Borrower Rating
|
MUFG
Borrower
|
MUFG Borrower Rating Definition | |||||||
| 1 | The capacity to meet financial commitments is extremely certain, and the borrower has the highest level of creditworthiness. | |||||||
| 2 | The capacity to meet financial commitments is highly certain, but there are some elements that may result in lower creditworthiness in the future. | |||||||
| 3 | The capacity to meet financial commitments is sufficiently certain, but there is the possibility that creditworthiness may fall in the long run. | |||||||
| 4 | There are no problems concerning the capacity to meet financial commitments, but there is the possibility that creditworthiness may fall in the long run. | |||||||
| 5 | There are no problems concerning the capacity to meet financial commitments, and creditworthiness is in the middle range. | |||||||
| 6 | There are no problems concerning the capacity to meet financial commitments presently, but there are elements that require attention if the situation changes. | |||||||
| 7 | There are no problems concerning the capacity to meet financial commitments presently, but long-term stability is poor. | |||||||
| 8 | There are no problems concerning the capacity to meet financial commitments presently, but long-term stability is poor, and creditworthiness is relatively low. | |||||||
| 9 | The capacity to meet financial commitments is somewhat poor, and creditworthiness is the lowest among “Normal” customers. | |||||||
|
|
10 through 12
|
|
Borrowers who must be closely monitored because of the following business performance and financial conditions: | |||||
|
(1) Borrowers who have problematic business performance, such as virtually delinquent principal repayment or interest payment; |
||||||||
|
(2) Borrowers whose business performance is unsteady, or who have unfavorable financial conditions; |
||||||||
|
(3) Borrowers who have problems with loan conditions, for whom interest rates have been reduced or shelved. |
||||||||
| 10 | Although business problems are not serious or their improvement is seen to be remarkable, there are elements of potential concern with respect to the borrower’s management, and close monitoring is required. | |||||||
| 11 | Business problems are serious, or require long-term solutions. Serious elements concerning business administration of the borrower have emerged, and subsequent debt repayment needs to be monitored closely. | |||||||
| 12 | Borrowers who fall under the criteria of Rating 10 or 11 and have a loan concession granted. Borrowers who have “Loans contractually past due 90 days or more.” (As a rule, delinquent borrowers are categorized as “Likely to Become Bankrupt,” but the definition here applies to borrowers delinquent for 90 days or more because of inheritance and other special reasons.) | |||||||
| 13 | Borrowers who pose a serious risk with respect to debt repayment, loss is likely to occur in the course of transactions. While still not bankrupt, these borrowers are in financial difficulty, with poor progress in achieving restructuring plans, and are likely to become bankrupt in the future. | |||||||
| 14 | While not legally bankrupt, borrowers who are considered to be virtually bankrupt because they are in serious financial difficulty and have no prospects for an improvement in their business operations. | |||||||
| 15 | Borrowers who are legally bankrupt (i.e., who have no prospects for continued business operations because of non-payment, suspension of business, voluntary liquidation, or filing for legal liquidation). | |||||||
The Japanese regulatory authorities require Japanese banks to categorize borrowers as follows:
| • |
Normal borrowers (generally corresponding to borrowers in categories 1 through 9 in our ratings), which are borrowers that are performing well, with no significant financial concerns, |
| • |
Borrowers requiring close watch (generally corresponding to borrowers in categories 10 through 12 in our ratings), which include loans that have been amended to allow for delays or forgiveness of interest payments, borrowers experiencing difficulty in complying with loan terms and conditions and borrowers that are recording losses or performing badly, |
181
Table of Contents
| • |
Borrowers likely to become bankrupt (generally corresponding to borrowers in category 13 in our ratings), which relate to borrowers who pose a serious risk with respect to debt repayment and with whom loss is likely to occur in the course of transactions. While still not bankrupt, these borrowers are in financial difficulty, with poor progress in achieving restructuring plans, and are likely to become bankrupt in the future, |
| • |
Virtually bankrupt borrowers (generally corresponding to borrowers in category 14 in our ratings), which are not legally bankrupt, but borrowers who are considered to be virtually bankrupt because they are in serious financial difficulty and have no prospects for an improvement in their business operations, and |
| • |
Bankrupt borrowers or de facto bankrupt borrowers (generally corresponding to borrowers in category 15 in our ratings), which are borrowers who are legally bankrupt (i.e., who have no prospects for continued business operations because of non-payment, suspension of business, voluntary liquidation, or filing for legal liquidation proceedings). |
The primary data utilized in our assessment of borrowers include the borrower’s financial statements and notes thereto as well as other public disclosure made by the borrower. In addition, when appropriate and possible, we obtain non-public financial and operating information from borrowers, such as the borrower’s business plan, borrower’s self-evaluation of its operating assets and other borrower information about its business and products.
Based on the borrower and industry information, we assign borrower ratings mainly by applying financial scoring models—either developed internally or by third-party vendors, depending on the borrower’s attributes, whether the borrower is domestic or foreign, whether the borrower is a large corporation or a small and medium-sized corporation, and whether the borrower is a corporate entity or another type of legal entity (such as a school, hospital or fund).
For example, for domestic small and medium-sized corporations, which constitute the largest borrower attribute in our current loan portfolio in terms of number of borrowers, we have adopted an internally developed financial scoring model, exclusively designed and developed for such attribute. We have selected various financial ratios that we believe to be useful and meaningful to quantitatively measure and assess the borrowers’ financial standing and repayment capability. Such financial ratios represent, among other things, borrowers’ growth, profitability, stability, cash flow, company size and capital efficiency. The model is periodically tested against historical results. The following is an illustration of some of the financial ratios we utilize as part of our financial scoring model:
| • |
To measure growth: Sales growth, and growth in total assets, |
| • |
To measure profitability: Current profit to sales, and profit before tax to sales, and |
| • |
To measure stability: Equity ratio and current ratio. |
The financial score obtained through the models is reviewed and, when necessary, adjusted downward to reflect our qualitative assessment of the borrower’s financial strength and other factors that could affect the borrower’s ability to service the debt. For example, we take into account: capability of turning around the business (in case of borrowers with losses) or recovering positive net worth (in case of borrowers with negative net worth), industry risk, management risk, legal risk, as well as our assessment of the probability of receiving support from parent companies (if the borrower is a subsidiary of a large listed company).
When adjusting the results of primary financial scoring assigned to borrowers with losses, we consider the severity of losses and the possibility of improving operating results. We analyze and assess whether the loss is temporary, the trend in operating results is improving, or the loss is expected to continue for an extended period. When adjusting the results of primary financial scoring assigned to borrowers with losses or borrowers with negative net worth, we also analyze whether the borrower can return to a positive net worth, and the time period needed to achieve such recovery (one to two years, three to five years, or five years or more).
182
Table of Contents
In addition, adjustments based on industry risk are based on future prospects, applicable laws and regulations, and other factors surrounding the industry. Adjustments for management risk reflect our assessment of management’s track record, the composition of the management team including the board of directors, any management succession plan as well as the risk management and compliance framework of the borrower. Adjustments for legal risk are made when the borrower is facing a lawsuit and when there is a possibility of a significant claim payment related to product liability, intellectual property, environmental problems, building standard law, and other legal issues.
When assessing the probability of receiving support from parent companies, various factors are examined, such as the parent company’s credit standings, whether key management personnel are sent by the parent, whether the borrower is consolidated by the parent, and the proportion of the borrower in consolidated sales and profits of the parent.
In addition, we consider outside ratings, and our internal borrower ratings may be adjusted when deemed appropriate.
Facility risk rating
Facility risk rating is used to evaluate and classify the quality of individual credit facilities, including guarantees and collateral. Ratings are assigned by quantitatively measuring the estimated loss rate of a facility in the event of a default.
Structured finance rating and asset securitization rating
Structured finance rating and asset securitization rating are used to evaluate and classify the quality of individual credit facilities, including guarantees and collateral, and focus on the structure, including the applicable credit period, of each credit facility. In evaluating the debt service potential of a credit facility, we scrutinize its underlying structure to determine the likelihood of the planned future cash flows being achieved.
Pool assignment
Each major banking subsidiary has its own system for pooling and rating small retail loans designed to reflect the risk profile of its loan portfolios.
Asset evaluation and assessment system
The asset evaluation and assessment system is used to classify assets held by us according to the probability of collection and the risk of any impairment in value based on borrower classifications consistent with the borrower ratings and the status of collateral, guarantees, and other factors.
The system is used to conduct write-offs and allocate allowances against credit risk in a timely and adequate manner.
Quantitative Analysis of Credit Risk
MUFG and its major banking subsidiaries manage credit risk by monitoring credit amount and expected losses, and run simulations based on internal models to estimate the maximum amount of credit risk. These models are used for internal management purposes, including loan pricing and measuring economic capital.
When quantifying credit risk amounts using the internal models, MUFG and its major banking subsidiaries consider various parameters, including the probability of default, loss given default, and exposure at default used in their borrower ratings, facility risk ratings and pool assignments as well as any credit concentration risk in particular borrower groups or industry sectors. MUFG and its major banking subsidiaries also share credit portfolio data in appropriate cases.
183
Table of Contents
Loan Portfolio Management
We aim to achieve and maintain levels of earnings commensurate with credit risk exposure. Products are priced to take into account expected losses, based on the internal credit ratings.
We assess and monitor loan amounts and credit exposure by credit rating, industry and region. Portfolios are managed to limit concentrations of risk in specific categories in accordance with our Large Credit Guidelines.
To manage country risk, we have established specific credit ceilings by country. These ceilings are reviewed when there is a material change in a country’s credit standing, in addition to being subject to a regular periodic review.
Continuous CPM Improvement
With the prevalence of securitized products and credit derivatives in global markets, we seek to supplement conventional CPM techniques with advanced methods based on the use of such market-based instruments.
Through credit risk quantification and portfolio management, we aim to improve the risk return profile of the Group’s credit portfolio, using financial markets to rebalance credit portfolios in a dynamic and active manner based on an accurate assessment of credit risk.
Risk Management of Strategic Equity Portfolio
Strategic equity investment risk is the risk of loss caused by a decline in the prices of our equity investments.
We hold shares of various corporate clients for strategic purposes, in particular to maintain long-term relationships with these clients. These investments have the potential to increase business revenue and appreciate in value. At the same time, we are exposed to the risk of price fluctuation in the Japanese stock market. For that reason, in recent years, it has been a high priority for us to reduce our equity portfolio to limit the risks associated with holding a large equity portfolio, but also to respond to applicable regulatory requirements as well as increasing market expectations and demands for us to reduce our equity portfolio. We are required to comply with a regulatory framework that prohibits Japanese banks from holding an amount of shares in excess of their adjusted Tier 1 capital.
We use quantitative analysis to manage the risks associated with the portfolio of equities held for strategic purposes. According to internal calculations, the market value of our strategically held (Tokyo Stock Exchange-listed) stocks (excluding foreign stock exchange-listed stocks) as of March 31, 2019 was subject to a variation of approximately ¥3.1billion when TOPIX index moves one point in either direction.
We seek to manage and reduce strategic equity portfolio risk based on quantitative analysis such as the sensitivity analysis described above. The aim is to keep this risk at appropriate levels compared with Tier 1 capital while generating returns commensurate with the degree of risk exposure.
Market Risk Management
Market risk is the risk that the value of our assets and liabilities could be adversely affected by changes in market variables such as interest rates, securities prices, or foreign exchange rates.
Management of market risk at MUFG aims to control related risk exposure across the Group while ensuring that earnings are commensurate with levels of risk.
184
Table of Contents
Market Risk Management System
We have adopted an integrated system to manage market risk from our trading and non-trading activities. The holding company monitors group-wide market risk, while each of the major subsidiaries manages its market risks on a consolidated and global basis.
At each of the major subsidiaries, checks and balances are maintained through a system in which back and middle offices operate independently from front offices. In addition, separate Asset-Liability Management, or ALM, Committee and Risk Management Meetings are held at each of the major subsidiaries every month to deliberate important matters related to market risk and control.
The holding company and the major subsidiaries allocate economic capital commensurate with levels of market risk and determined within the scope of their capital bases. The major subsidiaries have established quantitative limits relating to market risk based on their allocated economic capital. In addition, in order to keep losses within predetermined limits, the major subsidiaries have also set limits for the maximum amount of losses arising from market activities. The following diagram summarizes the market risk management system of each major subsidiary:
Market Risk Management System of Our Major Subsidiaries
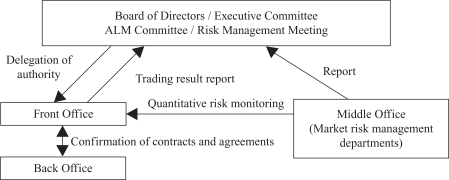
Market Risk Management and Control
At the holding company and the major subsidiaries, market risk exposure is reported to the Chief Risk Officers on a daily basis. At the holding company, the Chief Risk Officer monitors market risk exposure across the Group as well as the major subsidiaries’ control over their quantitative limits for market risk and losses. Meanwhile, the Chief Risk Officers at the major subsidiaries monitor their own market risk exposure and their control over their quantitative limits for market risk and losses. In addition, various analyses on risk profiles, including stress testing, are conducted and reported to the Executive Committees and the Corporate Risk Management Committees on a regular basis. At the business unit levels in the major subsidiaries, the market risks on their marketable assets and liabilities, such as interest rate risk and foreign exchange rate risk, are controlled by entering into various hedging transactions using marketable securities and derivatives.
As part of our market risk management activities, we use certain derivative financial instruments to manage our interest rate and currency exposures. We maintain an overall interest rate risk management strategy that incorporates the use of interest rate contracts to minimize significant unplanned fluctuations in earnings that are caused by interest rate volatility. We enter into interest rate swaps and other contracts as part of our interest rate risk management strategy primarily to alter the interest rate sensitivity of our loans, investment securities and deposit liabilities. Our principal objectives in risk management include asset and liability management. Asset and liability management is viewed as one of the methods for us to manage our interest rate exposures on interest-earning assets and interest-bearing liabilities. Interest rate contracts, which are generally non-leveraged generic
185
Table of Contents
interest rate and basis swaps, options and futures, allow us to effectively manage our interest rate risk position. Option contracts primarily consist of caps, floors, swaptions and options on index futures. Futures contracts used for asset and liability management activities are primarily index futures providing for cash payments based upon the movement of an underlying rate index. We enter into forward exchange contracts, currency swaps and other contracts in response to currency exposures resulting from on-balance sheet assets and liabilities denominated in foreign currencies in order to limit the net foreign exchange position by currency to an appropriate level.
These market risk management activities are performed in accordance with the predetermined rules and procedures. The internal auditors regularly verify the appropriateness of the management controls over these activities and the risk evaluation models adopted.
Market Risk Measurement Model
Market risks consist of general risks and specific risks. General market risks result from changes in entire markets, while specific risks relate to changes in the prices of individual stocks and bonds which are independent of the overall direction of the market.
To measure market risks, MUFG uses the VaR method which estimates changes in the market value of portfolios within a certain period by statistically analyzing past market data. Since the daily variation in market risk is significantly greater than that in other types of risk, MUFG measures and manages market risk using VaR on a daily basis.
Market risk for trading and non-trading activities is measured using a uniform market risk measurement model. The principal model used for these activities is a historical simulation, or HS, model (holding period, 10 business days; confidence interval, 99%; and observation period, 701 business days). The HS model calculates VaR amounts by estimating the profit and loss on the current portfolio by applying actual fluctuations in market rates and prices over a fixed period in the past. This method is designed to capture certain statistically infrequent movements, such as a fat tail, and accounts for the characteristics of financial instruments with non-linear behavior. The holding company and banking subsidiaries also use the HS model as part of the calculation of their Basel III regulatory capital adequacy ratios.
In calculating VaR using the HS method, we have implemented an integrated market risk measurement system throughout the Group. Our major subsidiaries calculate their VaR based on the risk and market data prepared by the information systems of their front offices and other departments. The major subsidiaries provide this risk data to the holding company, which calculates overall VaR, taking into account the diversification effect among all portfolios of the major subsidiaries.
For the purpose of internally evaluating capital adequacy on an economic capital basis in terms of market risk, we use this market risk measurement model to calculate risk amounts based on a holding period of one year and a confidence interval of 99.9%.
Monitoring and managing our sensitivity to interest rate fluctuations is the key to managing market risk in MUFG’s non-trading activities. The major banking subsidiaries take the following approach to measuring risks concerning core deposits, loan prepayments and early deposit withdrawals.
To measure interest rate risk relating to deposits without contract-based fixed maturities, the amount of “core deposits” is calculated through a statistical analysis based on deposit balance trend data and the outlook for interest rates on deposits, business decisions, and other factors. The amount of “core deposit” is categorized into various groups of maturity terms of up to ten years to recognize interest rate risk. The calculation assumptions and methods to determine the amount of core deposits and maturity term categorization are regularly reviewed.
Meanwhile, deposits and loans with contract-based maturities are sometimes cancelled or repaid before their maturity dates. To measure interest rate risk for these deposits and loans, we reflect these early termination
186
Table of Contents
events mainly by applying early termination rates calculated based on a statistical analysis of historical repayment and cancellation data together with historical market interest rate data.
Summaries of Market Risks (Fiscal Year Ended March 31, 2019)
Trading activities
The aggregate VaR for our total trading activities as of March 31, 2019 was ¥20.84 billion, comprising interest rate risk exposure of ¥20.58 billion, foreign exchange risk exposure of ¥4.44 billion, and equity-related risk exposure of ¥1.55 billion. Compared with the VaR as of March 31, 2018, we experienced an increase in market risk during the fiscal year ended March 31, 2019, primarily due to an increase in interest rate risk.
Our average daily VaR for the fiscal year ended March 31, 2019 was ¥14.25 billion. Based on a simple sum of figures across market risk categories, interest rate risk accounted for approximately 67%, foreign exchange risk for approximately 23% and equity-related risk for approximately 10%, of our total trading activity market risks.
Due to the nature of trading operations which involves frequent changes in trading positions, market risk varied substantially during the fiscal year, depending on our trading positions.
The following tables set forth the VaR related to our trading activities by risk category for the periods indicated:
|
April 1, 2017—March 31, 2018 |
Average | Maximum (1) | Minimum (1) | March 31, 2018 | ||||||||||||
| (in billions) | ||||||||||||||||
|
MUFG |
¥ | 13.58 | ¥ | 18.46 | ¥ | 11.29 | ¥ | 13.27 | ||||||||
|
Interest rate |
13.28 | 16.93 | 11.47 | 12.79 | ||||||||||||
|
Yen |
6.59 | 9.79 | 4.70 | 6.72 | ||||||||||||
|
U.S. Dollars |
5.96 | 8.46 | 3.94 | 4.63 | ||||||||||||
|
Foreign exchange |
4.66 | 7.69 | 2.62 | 3.83 | ||||||||||||
|
Equities |
1.81 | 5.72 | 0.62 | 1.99 | ||||||||||||
|
Commodities |
0.01 | 0.20 | 0.00 | 0.00 | ||||||||||||
|
Less diversification effect |
(6.18 | ) | — | — | (5.34 | ) | ||||||||||
|
April 1, 2018—March 31, 2019 |
Average | Maximum (1) | Minimum (1) | March 31, 2019 | ||||||||||||
| (in billions) | ||||||||||||||||
|
MUFG |
¥ | 14.25 | ¥ | 35.71 | ¥ | 11.42 | ¥ | 20.84 | ||||||||
|
Interest rate |
13.32 | 20.94 | 10.78 | 20.58 | ||||||||||||
|
Yen |
5.52 | 9.45 | 3.44 | 4.40 | ||||||||||||
|
U.S. Dollars |
5.28 | 11.23 | 3.27 | 11.03 | ||||||||||||
|
Foreign exchange |
4.52 | 7.26 | 3.10 | 4.44 | ||||||||||||
|
Equities |
2.06 | 26.66 | 0.98 | 1.55 | ||||||||||||
|
Commodities |
0.00 | 0.05 | 0.00 | 0.00 | ||||||||||||
|
Less diversification effect |
(5.65 | ) | — | — | (5.73 | ) | ||||||||||
|
Assumptions for VaR calculations: |
|
Historical simulation method |
|
Holding period: 10 business days |
|
Confidence interval: 99% |
|
Observation period: 701 business days |
| Note: |
| (1) | The maximum and minimum VaR overall and for various risk categories were taken from different days. A simple summation of VaR by risk category is not equal to total VaR due to the effect of diversification. |
187
Table of Contents
The average daily VaR by quarter in the fiscal year ended March 31, 2019 was as follows:
|
Quarter |
Daily average VaR | |||
| (in billions) | ||||
|
April—June 2018 |
¥ | 13.84 | ||
|
July—September 2018 |
13.71 | |||
|
October—December 2018 |
14.51 | |||
|
January—March 2019 |
14.96 | |||
The quantitative market risk figures from trading activities tend to fluctuate widely due to the market sensitive nature of the trading business. During the fiscal year ended March 31, 2019, the revenue from our trading activities has been relatively stable, keeping positive numbers in 244 days out of 259 trading days in the period. During the same period, there were 62 days with positive revenue exceeding ¥1 billion and 1 day with negative revenue exceeding minus ¥1 billion.
Non-trading Activities
The aggregate VaR for our total non-trading activities as of March 31, 2019, excluding market risks related to our strategic equity portfolio and measured using the same standards as trading activities, was ¥315.5 billion. Market risk related to interest rates equaled ¥283.1 billion and equities-related risk equaled ¥202.5 billion. Compared with the VaR as of March 31, 2018, we experienced a decrease in market risk during the fiscal year ended March 31, 2019, primarily due to a decrease in interest rate risk and equities-related risk. For a description of our strategic equity investment risk management, see “—Risk Management of Strategic Equity Portfolio.”
Based on a simple sum of figures across market risk categories, interest rate risks accounted for approximately 58% of our total non-trading activity market risks. Looking at a breakdown of interest rate related risk by currency, as of March 31, 2019, the yen accounted for approximately 44% while the U.S. dollar accounted for approximately 32%, and the euro approximately 24%.
The following tables set forth the VaR related to our non-trading activities by risk category for the periods indicated:
|
April 1, 2017—March 31, 2018 |
Average | Maximum (1) | Minimum (1) | March 31, 2018 | ||||||||||||
| (in billions) | ||||||||||||||||
|
Interest rate |
¥ | 305.2 | ¥ | 330.1 | ¥ | 270.1 | ¥ | 304.9 | ||||||||
|
Yen |
236.1 | 253.5 | 212.6 | 231.2 | ||||||||||||
|
U.S. Dollars |
146.2 | 174.1 | 116.5 | 128.5 | ||||||||||||
|
Foreign exchange |
8.0 | 10.8 | 3.4 | 10.0 | ||||||||||||
|
Equities (2) |
233.1 | 271.9 | 171.0 | 225.9 | ||||||||||||
|
Less diversification effect |
(151.7 | ) | — | — | (154.9 | ) | ||||||||||
|
Total |
394.6 | 440.5 | 348.4 | 385.9 | ||||||||||||
|
April 1, 2018—March 31, 2019 |
Average | Maximum (1) | Minimum (1) | March 31, 2019 | ||||||||||||
| (in billions) | ||||||||||||||||
|
Interest rate |
¥ | 290.3 | ¥ | 309.8 | ¥ | 265.2 | ¥ | 283.1 | ||||||||
|
Yen |
219.2 | 240.3 | 169.6 | 169.6 | ||||||||||||
|
U.S. Dollars |
114.0 | 140.8 | 85.9 | 122.2 | ||||||||||||
|
Foreign exchange |
9.5 | 11.2 | 2.8 | 4.0 | ||||||||||||
|
Equities (2) |
215.6 | 245.1 | 147.4 | 202.5 | ||||||||||||
|
Less diversification effect |
(170.1 | ) | — | — | (174.1 | ) | ||||||||||
|
Total |
345.3 | 399.2 | 308.0 | 315.5 | ||||||||||||
188
Table of Contents
|
Assumptions for VaR calculations: |
|
Historical simulation method |
|
Holding period: 10 business days |
|
Confidence interval: 99% |
|
Observation period: 701 business days |
| Notes: |
| (1) | The maximum and minimum VaR overall for each category and in total were taken from different days. A simple summation of VaR by risk category is not equal to total VaR due to the effect of diversification. |
| (2) | The equities-related risk figures do not include market risk exposure from our strategic equity portfolio. |
The average daily interest rate VaR by quarter in the fiscal year ended March 31, 2019 was as follows.
|
Quarter |
Daily average VaR | |||
| (in billions) | ||||
|
April—June 2018 |
¥ | 370.5 | ||
|
July—September 2018 |
352.0 | |||
|
October—December 2018 |
326.1 | |||
|
January—March 2019 |
332.7 | |||
Comparing the proportion of each currency’s interest rate VaR to the total interest rate VaR as of March 31, 2019 against that as of March 31, 2018, there was a 9 percentage point decrease in the Japanese yen from 53% to 44%, a 2 percentage point increase in the U.S. dollar from 30% to 32%, and a 7 percentage point increase in the euro from 17% to 24%.
Backtesting
We conduct backtesting in which a VaR is compared with hypothetical profits and losses on a daily basis to verify the accuracy of our VaR measurement model. We also conduct additional backtesting using other methods, including testing VaR against actual realized and unrealized losses and testing VaR by various changing parameters such as confidence intervals and observation periods used in the model.
Hypothetical losses never exceeded VaR in the fiscal year ended March 31, 2019. This means that our VaR model provided reasonably accurate measurements of market risk during the fiscal year.
189
Table of Contents
The following graph shows daily VaR of trading activities and the distribution of corresponding hypothetical profits and losses for the fiscal year ended March 31, 2019:
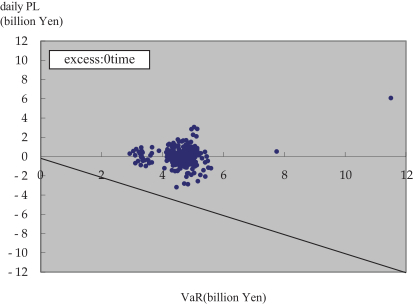
The following graph shows VaR of trading activities and hypothetical profits and losses on a daily basis for the fiscal year ended March 31, 2019:
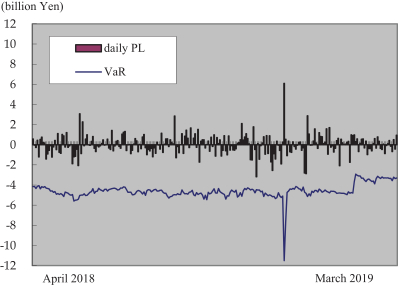
Stress Testing
We use an HS-VaR model, which calculates potential changes in the market value of our portfolio as a statistically possible amount of losses that could be incurred due to market fluctuations within a certain period (or holding period, of 10 business days) based on historical market volatility for a certain period (or observation period, of 701 business days, or approximately three years). Actual losses may exceed the value at risk obtained by the application of the model in the event, for example, that the market fluctuates to a degree not accounted for
190
Table of Contents
in the observation period, or that the correlations among various risk factors, including interest rates and foreign currency exchange rates, deviate from those assumed in the model.
In order to complement these weaknesses of the HS-VaR model and measure potential losses that the model is not designed to capture, we conduct stress testing. Through the daily stress testing, we estimate maximum potential losses in each market on the current trading portfolio based on the worst ten-day historical volatility recorded during the VaR observation period of 701 days. As of March 31, 2019, we held a total trading activity position subject to estimated maximum potential losses of ¥15.4 billion as compared to ¥8.8 billion as of March 31, 2018. In addition, the holding company and major subsidiaries conduct stress testing, as appropriate, by applying various stress scenarios, including those which take into account estimates regarding future market volatility, in order to better identify risks and manage our portfolio in a more stable and appropriate manner. The holding company and major subsidiaries also measure stressed VaR relating to their trading activities based on a one-year observation period with the highest VaR at least in the immediately preceding ten years.
Funding Liquidity Risk Management
Liquidity risk is the risk of incurring losses if a poor financial position hampers the ability to meet funding requirements, or necessitates fund procurement at interest rates markedly higher than normal.
Our major subsidiaries maintain appropriate liquidity in both Japanese yen and foreign currencies by managing their funding sources and mechanisms, such as liquidity gap, liquidity-supplying products such as commitment lines, and buffer assets.
We have established a group-wide system for managing liquidity risk by categorizing the risk in the following three stages: normal, concern and crisis. The front offices and risk management offices of the major subsidiaries and the holding company exchange information and data on liquidity risk even at the normal stage. At higher alert stages, we centralize information about liquidity risk and discuss issues relating to group-wide liquidity control actions among Group companies, if necessary. We have also established a system for liaison and consultation on funding in preparation for contingency, such as natural disasters, wars and terrorist attacks. The holding company and the major subsidiaries conduct group-wide contingency preparedness drills on a regular basis to ensure smooth implementation in the event of an emergency.
In addition, we have established a group-wide system for ensuring compliance with the minimum regulatory liquidity coverage ratio requirements by categorizing the risk in the following three stages: sufficient, concern and insufficient. The holding company and the major subsidiaries exchange information and data on LCR even at the sufficient stage. At higher alert stages, we hold group-wide LCR liaison meetings to discuss issues relating to LCR and, based on the discussion as well as the information and data that have been shared, take countermeasures to improve LCR as necessary.
For more information, see “Item 5.B. Operating and Financial Review and Prospects—Liquidity and Capital Resources—Financial Condition—Sources of Funding and Liquidity.”
Operational Risk Management
Operational risk refers to the risk of loss caused by either internal control issues such as inadequate operational processes or misconduct, system failures, or external factors such as serious political instability, major terrorist activity, health epidemics or natural disasters. The term includes a broad range of risks that could lead to losses, including operations risk, information risk, IT risk, tangible asset risk, personnel risk, incompliance with laws and regulations risk, and legal risk. These risks that comprise operational risk are referred to as sub-category risks.
The holding company has established, based on its Executive Committee’s determination, the MUFG Operational Risk Management Policy as a group-wide policy for managing operational risk. This policy sets
191
Table of Contents
forth the core principles regarding operational risk management, including the definition of operational risk, and the risk management system and processes. Under the policy, the board of directors and the Executive Committee formulate fundamental principles of operational risk management and establish and maintain an appropriate risk management system. The Chief Risk Management Officer is responsible for recognizing, evaluating, and appropriately managing operational risk in accordance with the fundamental principles formulated by the board of directors and the Executive Committee. A division in charge of operational risk management has been established that is independent of business promotion sections to manage overall operational risk in a comprehensive manner. These fundamental principles have also been approved by the boards of directors of the major subsidiaries, providing a consistent framework for operational risk management of the Group. The diagram below sets forth the operational risk management system of each major banking subsidiary:
Operational Risk Management System of Our Major Banking Subsidiaries
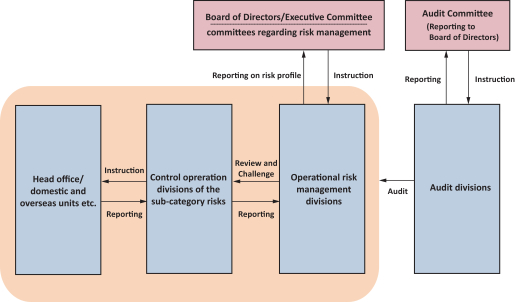
As set forth in the following diagram, we have established a risk management framework for loss data collection, control self-assessment, and measurement of operational risk in order to appropriately identify, recognize, evaluate, measure, control, monitor and report operational risk.
We have also established group-wide reporting guidelines with respect to loss data collection and its monitoring. We focus our efforts on ensuring accurate assessment of the status of operational risk losses and the implementation of appropriate countermeasures, while maintaining databases of internal and external loss events.
192
Table of Contents
The following diagram summarizes our operational risk management framework:
Operational Risk Management Framework
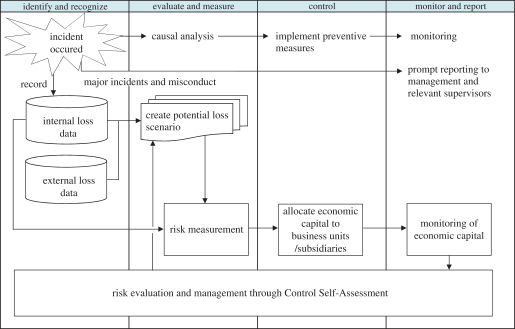
Operations Risk Management
Operations risk refers to the risk of incurring losses arising from negligence of correct operational processing, incidents or misconduct involving officers or staff, as well as risks similar to this risk. The Group companies offer a wide range of financial services, ranging from commercial banking products such as deposits, exchange services and loans to trust and related services covering pensions, securities, real estate and securitization, as well as transfer agent services. Cognizant of the potentially significant impact that operations risk-related events could have in terms of both economic losses and damage to our reputation, our banking subsidiaries continue to work on improving their management systems to create and apply appropriate operations risk-related controls.
Specific ongoing measures to reduce operations risk include the development of databases to manage, analyze and prevent the recurrence of related loss events; efforts to tighten controls over administrative procedures and related operating authority, while striving to improve human resources management, investments in systems to improve the efficiency of administrative operations, and programs to expand and upgrade internal auditing and operational guidance systems.
Senior management receives regular reports on the status of our businesses from an operations risk management perspective. We work to promote the sharing within the Group of information and expertise concerning any operational incidents and the measures implemented to prevent any recurrence.
Efforts to upgrade the management of operations risk continue with the aim of providing our customers with a variety of high-quality services.
Information Risk Management
Information risk refers to the risk of loss caused by loss, alteration, falsification or leakage of personal or other confidential information, as well as risks similar to these risks. We recognize our grave social and legal
193
Table of Contents
responsibility to handle customer information properly, and we continue to work on enhancing our framework to manage such risk.
Complying with laws and regulations requiring proper handling of customer information, we implement information security management measures, including the establishment of an information risk management framework, enhancement of our internal operational procedures, and training courses mandatory for all officers and staff.
We have also formulated our Personal Information Protection Policy as the basis for our ongoing programs designed to protect the confidentiality of personal information.
With the aim of preventing any recurrence and minimizing risk or loss, we also work to promote sharing on a group-wide basis of experience, knowledge and expertise related to information risk incidents.
IT Risk Management
IT risk refers to the risk of loss arising from destruction, suspension, malfunction or misuse of IT, or unauthorized alteration and leakage of electronic data caused by insufficient IT systems planning, development or operations or by vulnerabilities of or external threats to IT system security, including cybersecurity, as well as risks similar to these risks.
Systems planning, development and operations include appropriate design and extensive testing phases to ensure that systems are designed to help prevent failures while providing sufficient safeguards for the security of electronic data including personal information.
System development projects are managed and overseen by a team dedicated to perform such management and oversight functions, and the development status of any mission-critical IT systems is reported regularly to senior management.
We have developed disaster countermeasures systems and have also been investing in duplication of the Group’s IT infrastructure to minimize damage in the event of any system failure. Emergency drills are conducted to help increase staff preparedness.
With the aim of preventing any recurrence and minimizing risk or loss, we also work to promote sharing on a group-wide basis of experience, knowledge and expertise related to system failures.
In addition, the risk of increasingly sophisticated cyber-attacks is a significant focus of the Board of Directors, and the Board regularly receives reports on our cybersecurity program. We continue to work to strengthen measures designed to address and mitigate the risk, including the establishment of MUFG-CERT, our Computer Security Incident Response Team, implementation of multi-layered defense and detection measures, enhancement of monitoring systems through our Security Operation Centers, and cooperation with global organizations with relevant expertise. MUFG-CERT is charged with the responsibility of taking, coordinating and managing prompt action in response to cyber security incidents to mitigate their impact.
Tangible Asset Risk Management
Tangible asset risk refers to the risk of loss due to damage to tangible assets or deterioration in the operational environment caused by disasters or inadequate asset maintenance, as well as risks similar to this risk. Tangible assets include movable physical properties and immovable properties, owned or leased, such as land, buildings, equipment attached to buildings, fixtures and furniture. We recognize the potentially significant impact tangible asset risk-related events can have on the management and execution of the Group’s businesses, which in turn can result in economic losses to, or diminished market confidence in, the Group. Accordingly, we continue to improve our risk control framework designed to appropriately manage such risk.
194
Table of Contents
Personnel Risk Management
Personnel risk refers to the risk of loss due to an outflow or loss of human resources or deterioration in employee morale, as well as risks similar to this risk. We recognize the potentially significant impact personnel risk-related events can have on the management and execution of the Group’s businesses, which in turn can result in economic losses to, or diminished market confidence in, the Group. Accordingly, we continue to work on improving our risk control framework designed to appropriately manage such risk.
Incompliance with Laws and Regulations Risk Management
Incompliance with laws and regulations risk refers to the risk of loss due to failure to compliance with laws and regulations, as well as risks similar to these risks. We recognize the potentially significant impact compliance risk-related events can have on the management and execution of the Group’s businesses, which in turn can result in economic, reputation and other losses to, or diminished market confidence in, the Group. Accordingly, we continue to work on improving our compliance risk control framework designed to appropriately manage such risk.
Specifically, we have established our MUFG Group Code of Conduct as the basic guideline for the Group’s directors and employees. In addition, a compliance management division has been established at each of the holding company and the major subsidiaries. See “—Compliance” below.
Legal Risk Management
Legal risk refers to the risk of loss due to failure to identify or address legal issues relating to contracts and other business operations or insufficient handling of lawsuits, as well as risks similar to these risks.
The legal division at each of the holding company and the major subsidiaries centrally and uniformly evaluates legal issues prior to entering into contracts or commencing new business operations, deals with legal disputes and manages other legal matters. With the aim of effectively managing our legal risk arising from our globally expanding business operations, we have established a global and group-wide legal risk management framework and promote sharing of experience, knowledge and practices relating to legal risk issues on a global and group-wide basis.
Regulatory Capital Requirements for Operational Risk
(1) Adoption of the Advanced Measurement Approach (AMA)
We have employed the AMA since March 31, 2012, in place of the Standardized Approach that we had been using previously, for calculation of the operational risk equivalent amount in connection with measuring capital adequacy ratios based on the Basel Standards. On the other hand, we use the Basic Indicator Approach, or BIA, for entities that are deemed to be less important in the calculation of the operational risk equivalent amount and for entities that are still preparing to implement the AMA.
(2) Outline of AMA
We have established a measurement model designed to account for four data elements—internal loss data, external loss data, scenario analysis, and business environment and internal control factors, or BEICFs—and calculate the operational risk equivalent amount by estimating the maximum loss using a 99.9th percentile one-tailed confidence interval and a one-year holding period.
In calculating the operational risk equivalent amount, we exclude expected losses relating to the amount of allowance for repayment of excess interest associated with the consumer finance business of a subsidiary. We do not exclude any other expected losses and do not reflect the risk mitigating impact of insurance. In addition, we take into account credit risk-related events that are not reflected in the measurement of the credit risk equivalent amount.
195
Table of Contents
(3) Outline of Measurement Model
Our operational risk equivalent amount measured under the AMA is a simple sum of the amounts calculated separately for (1) MUFG Bank on a consolidated basis, (2) Mitsubishi UFJ Trust and Banking on a consolidated basis, and (3) the holding company and other principal consolidated subsidiaries, in accordance with applicable FSA rules. For each of MUFG Bank and Mitsubishi UFJ Trust and Banking on a consolidated basis, the operational risk equivalent amount is a simple sum of the amounts calculated based on the seven loss event types defined by the Basel Standards. For other Group companies, the operational risk equivalent amount is a simple sum of the amounts calculated based on eight loss event types consisting of the seven loss event types defined by the Basel Standards and an additional loss event type representing losses relating to repayment of excess interest associated with the consumer finance business of a subsidiary. We do not reflect the correlation effects among the loss event types in the calculation of our operational risk equivalent amount.
Outline of Measurement Model
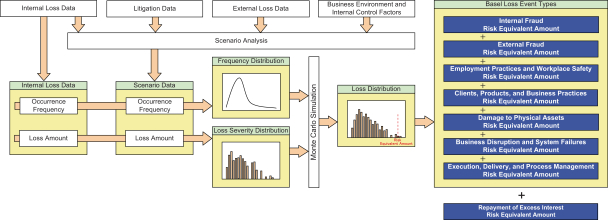
The risk equivalent amount for each loss event type represents the amount of maximum loss estimated with a 99.9th percentile one-tailed confidence interval and a one-year holding period based on the distribution of losses arising from all relevant risk events for a one-year period (Loss Distribution). A Loss Distribution combines a Frequency Distribution (through which the frequency of occurrence of risk events is expressed) and a Loss Severity Distribution (through which the amounts of losses resulting from risk events are expressed) through Monte Carlo simulations. The data used for this purpose include internal loss data and scenario data. scenario data are generated through a scenario analysis. External data and BEICFs are taken into account in the scenario analysis and reflected in scenario data. The Frequency Distribution is derived from the occurrence frequency information in internal loss data and scenario data expressed through a Poisson Distribution. The Loss Severity Distribution is derived from the amount information in internal loss data and scenario data expressed in a non-parametric manner (where no underlying distribution is assumed).
With respect to the risk of losses relating to repayment of excess interest associated with the consumer finance business of a subsidiary, the risk equivalent amount represents the amount of maximum loss estimated with a 99.9th percentile one–tailed confidence interval and a one-year holding period based on a normal distribution assumed by applying data on losses that arose in a given period, excluding any related expected losses.
We confirm the appropriateness of the measurement models by periodic verification and back testing.
(4) Outline of Scenario Analysis
As an initial step of our scenario analysis, we identify potential severe loss events that we have not experienced but may potentially experience in the future. In this identification process, we seek to ensure
196
Table of Contents
exhaustive coverage of potential severe loss events by comprehensively examining our experience relating to loss events and legal proceedings, external loss data, the control self-assessment results and other relevant information.
In the next step, we prepare scenario data for each identified severe loss event by quantifying the values depending on its occurrence frequency and loss severity, taking into account relevant transaction amounts and restructuring costs as well as BEICFs. In preparing scenario data, we apply an analysis method we deem appropriate for the type and nature of the operational risk involved.
In order to obtain an operational risk equivalent amount that is commensurate with, and appropriate for, our risk profile, we assess the need for an additional scenario or modification to our existing scenarios semi-annually.
We then reflect, as necessary, new risks arising as a result of changes in the business environment and the results of the implementation of measures to enhance our internal controls in response to newly identified risks in our scenario data.
Reputation Risk Management
Reputation risk refers to the risk of harm to our corporate value arising from perceptions of our customers, shareholders, investors or other stakeholders and in the market or society that we deviate from their expectations or confidence. We recognize that such risk, if materialized, can have a material negative impact on our business and continue to work on enhancing our framework designed to appropriately manage the risk based on our Corporate Vision, MUFG Group Code of Conduct, and other rules and codes of the Group.
Specifically, in order to manage our reputation risk effectively on a group-wide basis, we have established a risk management system designed to ensure mutual consultation and reporting if a reputation risk-related event occurs or is anticipated and, through this system, share relevant information within the Group.
Through the risk control framework and risk management system, we seek to prevent reputation risk-related events and minimize damage to the corporate value of the Group by promptly obtaining an accurate understanding of relevant facts relating to risk events and disclosing information concerning such events and the measures we take in response to such events in an appropriate and timely manner.
Model Risk Management
Model risk refers to the risk of loss due to decision-making based on information provided by an inaccurate model or the misuse of a model. We recognize the potentially significant impact model risk-related events can have on the management and execution of the Group’s businesses, which in turn can result in economic losses to, or diminished market confidence in, the Group. Models are used for increasingly wider and more important purposes, including valuing exposures, instruments and positions, measuring risks, and determining capital adequacy. Accordingly, we continue to work on improving our risk control framework.
Compliance
Basic Policy
We have clarified our mission, our vision and our values in the Corporate Vision and have expressed our commitment to meeting the expectations of customers and society as a whole. Furthermore, we have established MUFG Group Code of Conduct as the guidelines for how the Group’s directors and employees act to realize the Corporate Vision, in which we have expressed our commitment to complying with laws and regulations, to acting with honesty and integrity, and to behaving in a manner that supports and strengthens the trust and confidence of society.
197
Table of Contents
In addition, as we expand the geographic scope of our business globally, we are committed to keeping abreast of developments in laws and regulations of the jurisdictions in which we operate including anti-money laundering and anti-bribery, as well as paying attention to trends in financial crimes.
See “Item 3.D. Key Information—Risk Factors—Risks Related to Our Business—Legal and regulatory changes could have a negative impact on our business, financial condition and results of operations.” and “Item 3.D. Key Information—Risk Factors—Risks Related to Our Business—We may become subject to regulatory actions or other legal proceedings relating to our transactions or other aspects of our operations, which could result in significant financial losses, restrictions on our operations and damage to our reputation.” See also “Item 4.B. Information on the Company—Business Overview—Supervision and Regulation.”
MUFG Group Code of Conduct
The Code of Conduct encapsulates the standards that guide staff conduct and decision-making in our day-to-day business activities under the MUFG Corporate Vision. It is designed to provide guidance in times of doubt, or when we find it difficult to know if we are making the right choice.
Chapter 1 deals with the attitude we should adopt with our customers.
Acting with honesty and integrity and pursuing the best interests of our customers is a core component of our business practices.
Chapter 2 presents a set of standards designed to help us fulfill our responsibilities as a good corporate citizen.
MUFG’s reputation depends upon the trust and confidence of our customers and other stakeholders, including local communities, and we are responsible to society on a global level.
Chapter 3 describes the actions and mindset that will create a stimulating and supportive working environment as MUFG continues to grow.
Our success depends on building and maintaining a dynamic workplace where all staff can reach their full potential in ways that support our customers and make a valuable contribution to society as a whole.
Chapter 1.Customer Focus
Our customers are at the center of everything we do, and should always be the focus of our thoughts. Our aim should be to win the trust and confidence of our customers at all times. MUFG exists today because of the trust and confidence that customers have placed in us over many years. Our role is to increase and strengthen this bedrock of trust and confidence. Our activities are not driven by the prospect of short-term gains. Instead, we look to build ongoing relationships with our customers to support their long-term growth.
1-1 Honesty and Integrity
Our customers are at the center of everything we do. We carry out fair and transparent corporate activities with honesty and integrity. We treat customer assets with care and respect and strive always to ensure that our actions do not unjustly damage our customers’ interests.
1-2 Ensuring Quality
To build lasting relationships of trust and confidence with our customers, we listen carefully to what our customers are telling us, and maintain thoroughgoing quality control of all our products and services, from planning and development to provision and subsequent revisions, with a view to further enhancing quality.
198
Table of Contents
1-3 Exceeding Customer Expectations
We aim to meet the diverse needs of our customers worldwide, and to provide services exceeding their expectations through the highest standards of professionalism, by leveraging our global network and the consolidated strengths of the entire Group.
Chapter 2 Responsibility as a Corporate Citizen
As we develop our business globally, we comply with all the domestic and international laws and rules that may apply. We do all we can to maintain stability and confidence in the global financial system, and contribute to the sound and healthy growth of society. Aware of the responsibility each of us has as a member of MUFG, we carry out fair and transparent corporate activities with honesty and integrity, in a manner that supports and strengthens the trust and confidence MUFG has earned from society over many years.
2-1 Adherence to Laws and Rules
In addition to adhering strictly to all domestic and international laws and rules, we strive to do the right thing based on our strict code of ethics.
Violations of laws or rules damage the vital social infrastructure of the financial system and lead to a loss of trust in MUFG. We strictly abide by all laws and rules relating to our business, including the prohibition of insider trading, ban on unfair trading practices, anti-bribery and corruption and appropriate disclosure.
2-2 Prevention of Financial Crime
We have zero tolerance for financial crime or any attempt to circumvent the rules and procedures aimed at preventing financial crime. We take all reasonable steps possible to prevent our products and services being used by individuals or entities involved in illegal or improper activities such as money laundering and terrorist financing.
2-3 Contributing to Society
We respect the history, cultures, and customs of different countries and regions around the world, and work to contribute to the development of local and global communities and the protection of the environment throughout our corporate activities and the social volunteer efforts of our staff.
Chapter 3 Attitudes and Behaviors in the Workplace
We strive to respond and adapt promptly to the diversifying and evolving needs of our customers and the rapidly changing environment in which we work. The working environment at MUFG fosters mutual respect, enables individuals to make the most of their abilities as professionals, and maximizes the power of teamwork across regions and different areas of business, encouraging all staff to embrace new challenges. We work always to protect and maintain the tangible and intangible assets and property that MUFG has accumulated.
3-1 Challenge Ourselves to Grow
We strive to enhance our knowledge, expertise, and potential and maximize the power of teamwork. We believe that the changing business environment represents opportunity and are always ready to embrace new challenges in new fields.
3-2 Collaborative and Professional Working Environment
We respect the human rights and diversity of all MUFG staff. We do not engage in or tolerate any form of discrimination or harassment or any other behavior that infringes these beliefs.
199
Table of Contents
3-3 Protecting MUFG’s Assets and Property
We protect the tangible and intangible assets and property of MUFG and individual Group entities, and do not tolerate any behavior that might damage these assets.
3-4 Reporting Problem Situations and Seeking Advice
If you become aware of conduct that contravenes the law, company regulations, or the provisions of this Code of Conduct, or any other problem situations, you should promptly report the matter and seek advice from a supervisor or issue a report via MUFG’s whistleblowing system.
Compliance Framework
Management and coordination of compliance-related matters are the responsibility of separate compliance management divisions established at the holding company and the major subsidiaries. Each compliance management division formulates compliance programs and organizes training courses to promote compliance, and regularly reports to each company’s board of directors and Executive Committee on the status of compliance activities.
The holding company has established a Group Compliance Committee and each major subsidiary has established a Compliance Committee for deliberating key issues related to compliance. Additionally, the holding company has a Group Chief Compliance Officer, or CCO, Committee, which consists of the CCO of the holding company acting as committee chairman and the CCOs of the major subsidiaries. The Group CCO Committee deliberates important matters related to compliance and compliance-related issues for which the Group should share a common understanding.
200
Table of Contents
The following diagram summarizes our compliance framework:
Compliance Framework
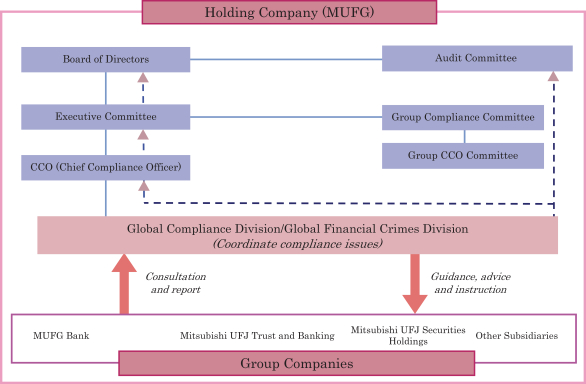
Internal Reporting System and Accounting Auditing Hotline
The major subsidiaries have established internal reporting systems that aim to identify compliance issues early so that any problems can be quickly rectified. This system includes an independent external compliance hotline. Furthermore, the holding company has set up an MUFG Group Compliance Helpline that acts in parallel with group-company internal reporting systems and provides a reporting channel for directors and employees of Group companies. In the holding company, the contents of the reported cases as well as the result of surveys is reported to the audit committee on a regular basis or whenever necessary.
In addition to these internal reporting systems, the holding company has also established an accounting auditing hotline that provides a means to report any problems related to MUFG accounting.
MUFG Accounting Auditing Hotline
MUFG has set up an accounting auditing hotline to be used to make reports related to instances of improper practices (violations of laws and regulations) and inappropriate practices, or of practices raising questions about such impropriety or inappropriateness, regarding accounting and internal control or audits related to accounting in Group companies. The audit committee oversees the reporting process to ensure the appropriateness and effectiveness of the reporting process and monitors the reports received through the hotline. The reporting process works as follows, and may be carried out via letter or e-mail:
Hokusei Law Office, P.C.
Address: Kojimachi 4-3-4, Chiyoda-ku, Tokyo
e-mail: MUFG-accounting-audit-hotline@hokusei-law.com
201
Table of Contents
When reporting information please pay attention to the following:
| • |
Matters subject to reporting are limited to instances regarding the Group companies. |
| • |
Please provide detailed information with respect to the matter. Without detailed factual information there is a limit to how much our investigations can achieve. |
| • |
Anonymous information will be accepted. |
| • |
No information regarding the identity of the informant will be passed on to third parties without the approval of the informant him- or herself. However, this excludes instances where disclosure is legally mandated, or to the extent that the information is necessary for surveys or reports, when data may be passed on following the removal of the informant’s name. |
| • |
Please submit reports in either Japanese or English. |
| • |
If the informant wishes, we will endeavor to report back to the informant on the response taken within a reasonable period of time following the receipt of specific information, but cannot promise to do so in all instances. |
Internal Audit
Role of Internal Audit
Internal Audit aims to evaluate and assist in the improvement of the effectiveness of governance, risk management and control processes with high proficiency and independence, thereby contributing to the enhancement of the corporate value of the MUFG Group and to the achievement of the Group’s corporate vision. Internal Audit covers all aspects of the Group’s business activities and discusses and evaluates the management and operational frameworks and the implementation of business operations from legal compliance, rationality and efficiency perspectives, beyond checking compliance with defined procedures.
In addition, Internal Audit provides instructions and recommendations for operational improvement to audited divisions and reports to senior management on such instructions and recommendations, thereby contributing to safeguarding and development of the Group’s assets.
Three Lines of Defense Framework
Risk management is conducted at multiple levels within a business organization, including front-office divisions in charge of managing specific categories of risk, a compliance division, and an internal audit division.
As for financial institutions, including the MUFG Group, based on the experience of past financial crises, the traditional risk management structure that was heavily dependent on front-office divisions has been under close scrutiny. As a result, there is an increasing expectation for financial institutions to achieve more effective risk management through, for example, appropriate allocation of risk management roles and responsibilities among various divisions.
202
Table of Contents
Cognizant of the importance of these developments, we have adopted the concept of “Three Lines of Defense” where the roles and responsibilities of each division in risk management are defined, classifying divisions within a financial institution into “the 1st Line of Defense”, “the 2nd Line of Defense” and “the 3rd Line of Defense”.
|
Line |
Divisions |
Roles |
||
|
The 1st Line of Defense |
Business divisions and client-facing divisions |
• Undertake risks within the extent of risk exposure assigned
• Responsible and accountable for identifying, evaluating and controlling business risks |
||
|
The 2nd Line of Defense |
Risk management division, compliance division, etc. |
• Ensure that risks are appropriately identified and managed by the 1st Line of Defense |
||
|
The 3rd Line of Defense |
Internal audit division |
• Independently evaluate the effectiveness of the governance, risk management, and control processes implemented by the 1st and 2nd Lines of Defense |
||
Internal Audit plays an essential role in the Group’s risk management through ongoing communications with the 1st and 2nd Lines of Defense, while maintaining independence.
Group Internal Audit Framework
The MUFG Group has internal audit functions at the holding company level as well as at the subsidiary level, which are designed to ensure proficiency and independence through effective collaboration.
The internal audit division of the holding company receives reports from the internal audit divisions of subsidiaries on the status and results of their internal audits and provides them with instructions and evaluations as needed.
Reports to the Audit Committee
The holding company has an audit committee within its board of directors as required by the Companies Act of Japan, and each of the major subsidiaries has established an audit and supervisory committee or an internal audit and compliance committee. Within each of the holding company and the major subsidiaries, the internal audit division reports to the committee on important matters, including governing principles for internal audit plans and the status and results of internal audits.
MUFG Internal Audit Activity Charter
In April 2019, we adopted “MUFG Internal Audit Activity Charter”, which defines our basic policies for Internal Audit, including its mission, purposes, responsibilities, and roles.
This charter is designed to encourage Internal Audit staff to conduct internal audits in accordance with the global standards set by the Institute of Internal Auditors, an international organization established for, among other purposes, formulating practical internal audit standards.
203
Table of Contents
| Item 12. |
Description of Securities Other than Equity Securities. |
| A. |
Debt Securities |
Not applicable.
| B. |
Warrants and Rights |
Not applicable.
| C. |
Other Securities |
Not applicable.
| D. |
American Depositary Shares |
For a description of ADSs, each representing one share of our common stock, see Exhibit 2(c) to this Annual Report.
Fees, charges and other payments relating to ADSs
As a holder of our ADSs, you will be required to pay to The Bank of New York Mellon, as depositary for the ADRs, or the Depositary, either directly or indirectly, the following fees or charges. The Depositary collects its fees for delivery and surrender of ADRs directly from investors depositing shares or surrendering ADRs for the purpose of withdrawal or from intermediaries acting for them. The Depositary collects fees for making distributions to investors by deducting those fees from the amounts distributed or by selling a portion of distributable property to pay the fees.
|
ADS holders must pay: |
For: |
|
|
$5.00 (or less) per 100 ADSs (or portion thereof) |
Each issuance of an ADR, including as a result of a distribution of shares or rights or other property
Each cancellation of an ADR, including if the agreement terminates |
|
|
$0.02 (or less) per ADS |
Any cash distribution, to the extent permitted by any securities exchange on which the ADSs may be listed for trading | |
| A fee equivalent to the fee that would be payable if securities distributed to the ADS holder had been shares and the shares had been deposited for issuance of ADRs | Distribution of securities distributed to holders of deposited securities which are distributed by the Depositary to registered ADS holders | |
|
Registration or transfer fees |
Transfer and registration of shares on the share register from your name to the name of The Bank of New York Mellon or its agent and vice versa when you deposit or withdraw shares | |
|
Expenses of The Bank of New York Mellon |
Conversion of foreign currency to U.S. dollars, as well as cable, telex and facsimile transmission expenses | |
| Taxes and other governmental charges The Bank of New York Mellon or MUFG Bank, as custodian, have to pay on any ADS or share underlying an ADS, for example, stock transfer taxes, stamp duty or withholding taxes | As necessary | |
204
Table of Contents
Fees Waived or Paid by the Depositary
The Depositary has agreed to waive the standard out-of-pocket administrative, maintenance and other expenses for providing services to the registered holders of our ADSs, which include the expenses relating to the delivery of annual reports, dividend fund remittances, stationery, postage and photocopying. For the fiscal year ended March 31, 2019, the Depositary waived $135,030.16 of standard out-of-pocket expenses.
The Depositary has also agreed to reimburse us for expenses related to the administration and maintenance of the ADS program, including investor relations expenses, the annual New York Stock Exchange listing fees and other program-related expenses. There is a limit on the amount of expenses for which the Depositary will reimburse us based and conditioned on the number of outstanding ADSs and the amount of dividend fees collected by the Depositary. For the fiscal year ended March 31, 2019, the Depositary reimbursed us $1.0 million for such expenses.
205
Table of Contents
| Item 13. |
Defaults, Dividend Arrearages and Delinquencies. |
None.
| Item 14. |
Material Modifications to the Rights of Security Holders and Use of Proceeds. |
None.
| Item 15. |
Controls and Procedures. |
Disclosure Controls and Procedures
An evaluation was carried out under the supervision and with the participation of our management, including the Chief Executive Officer, or CEO, and the Chief Financial Officer, or CFO, of the effectiveness of our disclosure controls and procedures, as defined in Rule 13a-15(e) under the U.S. Securities Exchange Act of 1934, as of the end of the period covered by this Annual Report.
Based on that evaluation, our CEO and CFO concluded that our disclosure controls and procedures were effective as of March 31, 2019.
Management’s Annual Report on Internal Control Over Financial Reporting
Our management is responsible for establishing and maintaining adequate internal control over financial reporting, as defined in Rule 13a-15(f) under the U.S. Securities Exchange Act of 1934. Our internal control over financial reporting is a process designed by, or under the supervision of, MUFG’s principal executive and principal financial officers, and effected by MUFG’s board of directors, management, and other personnel, to provide reasonable assurance regarding the reliability of financial reporting and the preparation of financial statements for external purposes in accordance with U.S. GAAP and includes those policies and procedures that:
| (i) | pertain to the maintenance of records that, in reasonable detail, accurately and fairly reflect the transactions and dispositions of the assets of MUFG, |
| (ii) | provide reasonable assurance that transactions are recorded as necessary to permit preparation of financial statements in accordance with generally accepted accounting principles, and that receipts and expenditures of MUFG are being made only in accordance with authorizations of management and directors of MUFG, and |
| (iii) | provide reasonable assurance regarding prevention or timely detection of unauthorized acquisition, use or disposition of MUFG’s assets that could have a material effect on the financial statements. |
Because of inherent limitations, internal control over financial reporting, no matter how well designed, may not prevent or detect misstatements. Also, projections of any evaluation of effectiveness to future periods are subject to the risk that controls may become inadequate because of changes in conditions, or that the degree of compliance with the policies or procedures may deteriorate.
Our management evaluated the effectiveness of our internal control over financial reporting as of March 31, 2019 based on the criteria established in “Internal Control—Integrated Framework (2013)” issued by the Committee of Sponsoring Organizations of the Treadway Commission. Based on the evaluation, management has concluded that MUFG maintained effective internal control over financial reporting as of March 31, 2019.
The effectiveness of our internal control over financial reporting as of March 31, 2019 has been audited by Deloitte Touche Tohmatsu LLC, an independent registered public accounting firm, as stated in its report, presented on page 208.
206
Table of Contents
Changes in Internal Control Over Financial Reporting
During the period covered by this Annual Report, there has been no change in our internal control over financial reporting that has materially affected or is reasonably likely to materially affect our internal control over financial reporting.
207
Table of Contents
REPORT OF INDEPENDENT REGISTERED PUBLIC ACCOUNTING FIRM
To the Board of Directors and the Shareholders of
Mitsubishi UFJ Financial Group, Inc.
(Kabushiki Kaisha Mitsubishi UFJ Financial Group)
Opinion on Internal Control over Financial Reporting
We have audited the internal control over financial reporting of Mitsubishi UFJ Financial Group, Inc. (Kabushiki Kaisha Mitsubishi UFJ Financial Group) (“MUFG”) and subsidiaries (together, the “MUFG Group”) as of March 31, 2019, based on criteria established in Internal Control — Integrated Framework (2013) issued by the Committee of Sponsoring Organizations of the Treadway Commission (“COSO”). In our opinion, the MUFG Group maintained, in all material respects, effective internal control over financial reporting as of March 31, 2019, based on criteria established in Internal Control — Integrated Framework (2013) issued by COSO.
We have also audited, in accordance with the standards of the Public Company Accounting Oversight Board (United States) (“PCAOB”), the consolidated financial statements as of and for the year ended March 31, 2019, of the MUFG Group and our report dated July 10, 2019, expressed an unqualified opinion on those financial statements.
Basis for Opinion
The MUFG Group’s management is responsible for maintaining effective internal control over financial reporting and for its assessment of the effectiveness of internal control over financial reporting, included in the accompanying Management’s Annual Report on Internal Control Over Financial Reporting. Our responsibility is to express an opinion on the MUFG Group’s internal control over financial reporting based on our audit. We are a public accounting firm registered with the PCAOB and are required to be independent with respect to the MUFG Group in accordance with the U.S. federal securities laws and the applicable rules and regulations of the Securities and Exchange Commission and the PCAOB.
We conducted our audit in accordance with the standards of the PCAOB. Those standards require that we plan and perform the audit to obtain reasonable assurance about whether effective internal control over financial reporting was maintained in all material respects. Our audit included obtaining an understanding of internal control over financial reporting, assessing the risk that a material weakness exists, testing and evaluating the design and operating effectiveness of internal control based on the assessed risk, and performing such other procedures as we considered necessary in the circumstances. We believe that our audit provides a reasonable basis for our opinion.
Definition and Limitations of Internal Control over Financial Reporting
A company’s internal control over financial reporting is a process designed to provide reasonable assurance regarding the reliability of financial reporting and the preparation of financial statements for external purposes in accordance with generally accepted accounting principles. A company’s internal control over financial reporting includes those policies and procedures that (1) pertain to the maintenance of records that, in reasonable detail, accurately and fairly reflect the transactions and dispositions of the assets of the company; (2) provide reasonable assurance that transactions are recorded as necessary to permit preparation of financial statements in accordance with generally accepted accounting principles, and that receipts and expenditures of the company are being made only in accordance with authorizations of management and directors of the company; and (3) provide reasonable assurance regarding prevention or timely detection of unauthorized acquisition, use, or disposition of the company’s assets that could have a material effect on the financial statements.
Because of its inherent limitations, internal control over financial reporting may not prevent or detect misstatements. Also, projections of any evaluation of effectiveness to future periods are subject to the risk that controls may become inadequate because of changes in conditions, or that the degree of compliance with the policies or procedures may deteriorate.
/s/ Deloitte Touche Tohmatsu LLC
Tokyo, Japan
July 10, 2019
208
Table of Contents
| Item 16A. |
Audit Committee Financial Expert. |
Our board of directors has determined that Mr. Akira Yamate, an outside director, is an “audit committee financial expert” as defined in Item 16A of Form 20-F and is, and has remained since his assumption of office as a member of our audit committee, “independent” as defined in the listing standards of the NYSE. Mr. Yamate has spent most of his professional carrier as a certified public accountant in Japan, auditing Japanese corporations, including those registered with the U.S. Securities and Exchange Commission. Mr. Yamate is also the chair of our audit committee.
| Item 16B. |
Code of Ethics. |
We have adopted a code of ethics, which consists of internal rules named MUFG Group Code of Conduct (formerly called Principles of Ethics and Conduct), compliance rules, compliance manual and rules of employment. Each of these rules applies to our principal executive officer, principal financial officer, principal accounting officer and persons performing similar functions. Our internal compliance rules were most recently amended on August 2, 2018, reflecting the establishment of a new division within MUFG. A copy of the MUFG Group Code of Conduct and the sections of our compliance rules, compliance manual and rules of employment relating to the “code of ethics” (as defined in paragraph (b) of Item 16B of Form 20-F) is attached as Exhibit 11 to this Annual Report.
No waivers of the MUFG Group Code of Conduct or the relevant sections of our compliance rules, compliance manual and rules of employment were granted to our principal executive officer, principal financial officer, principal accounting officer, directors or corporate auditors during the fiscal year ended March 31, 2019.
| Item 16C. |
Principal Accountant Fees and Services. |
Fees and Services of Deloitte Touche Tohmatsu LLC
The aggregate fees billed by Deloitte Touche Tohmatsu LLC, our independent registered public accounting firm and its affiliates, for the fiscal years ended March 31, 2018 and 2019 are presented in the following table:
| 2018 | 2019 | |||||||
| (in millions) | ||||||||
|
Audit fees |
¥ | 8,032 | ¥ | 8,079 | ||||
|
Audit-related fees |
199 | 119 | ||||||
|
Tax fees |
307 | 172 | ||||||
|
All other fees |
97 | 119 | ||||||
|
|
|
|
|
|||||
|
Total |
¥ | 8,635 | ¥ | 8,489 | ||||
|
|
|
|
|
|||||
The description of our fees billed for each category described above is as follows:
Audit fees —Audit fees are primarily for an annual audit of our financial statements, review of our semi-annual condensed financial statements, statutory audit of our financial statements and audits of our subsidiary financial statements and attestation services relating to the internal controls over financial reporting under Section 404 of the U.S. Sarbanes-Oxley Act of 2002.
Audit-related fees —Audit-related fees primarily include accounting consultations, agreed upon procedures on internal controls, employee benefit plan audit, and advisory services relating to internal control reviews.
Tax fees —Tax fees relate primarily to tax compliance, including assistance with preparation of tax return filings, tax advisory and tax planning services.
All other fees —All other fees primarily include fees for risk management and compliance advisory services.
209
Table of Contents
Pre-Approval Policies and Procedures for Services by Deloitte Touche Tohmatsu LLC
Our audit committee performs the pre-approval function required by applicable SEC rules and regulations. Our audit committee has established pre-approval policies and procedures that MUFG and its subsidiaries must follow before engaging Deloitte Touche Tohmatsu LLC to perform audit and permitted non-audit services.
When MUFG or a subsidiary intends to engage Deloitte Touche Tohmatsu LLC to perform audit and permitted non-audit services, it must make an application for pre-approval on either a periodic or case-by-case basis.
| • |
Periodic application is an application for pre-approval made each fiscal year for services that are expected to be provided by Deloitte Touche Tohmatsu LLC during the next fiscal year. |
| • |
Case-by-case application is an application for pre-approval made on a case-by-case basis for services to be provided by Deloitte Touche Tohmatsu LLC that are not covered by the periodic application. |
Pre-approval is resolved in principle by our audit committee prior to engagement, although if necessary a full-time member of our audit committee may consider any case-by-case application for pre-approval on behalf of the audit committee prior to the next scheduled audit committee meeting. Such decisions made individually by a full-time member of our audit committee are reported to the audit committee as appropriate at the next scheduled audit committee meeting.
Fees approved pursuant to the procedures described in paragraph 2-01(c)(7)(i)(C) of Regulation S-X, which provides for an exception to the general requirement for pre-approval in certain circumstances, were less than 0.1% of the total fees paid to Deloitte Touche Tohmatsu LLC for the fiscal year ended March 31, 2018 and approximately 0.3% of the total fees paid to Deloitte Touche Tohmatsu LLC for the fiscal year ended March 31, 2019.
| Item 16D. |
Exemptions from the Listing Standards for Audit Committees. |
Not applicable.
| Item 16E. |
Purchases of Equity Securities by the Issuer and Affiliated Purchasers. |
Issuer Purchases of Common Stock
|
Total
Number of Shares Purchased (1) |
Average Price
Paid per Share |
Total
Number of Shares Purchased as Part of Publicly Announced Plans or Programs |
Maximum
Number of Shares that May Yet Be Purchased Under the Plans or Programs (2) |
|||||||||||||
|
April 1 to April 30, 2018 |
2,201 | ¥ | 701.82 | — | — | |||||||||||
|
May 1 to May 31, 2018 |
1,468,484 | 710.73 | 37,173,600 | 62,826,400 | ||||||||||||
|
June 1 to June 30, 2018 |
1,880 | 670.07 | 35,247,100 | 27,579,300 | ||||||||||||
|
July 1 to July 31, 2018 |
5,778 | 647.41 | — | — | ||||||||||||
|
August 1 to August 31, 2018 |
5,168 | 676.63 | — | — | ||||||||||||
|
September 1 to September 30, 2018 |
2,458 | 688.15 | — | — | ||||||||||||
|
October 1 to October 31, 2018 |
195,987 | 713.55 | — | — | ||||||||||||
|
November 1 to November 30, 2018 |
108,019 | 639.05 | 74,549,800 | 125,450,200 | ||||||||||||
|
December 1 to December 31, 2018 |
30,509 | 613.94 | 85,287,000 | 40,163,200 | ||||||||||||
|
January 1 to January 31, 2019 |
31,068 | 570.64 | — | — | ||||||||||||
|
February 1 to February 28, 2019 |
18,478 | 580.40 | — | — | ||||||||||||
|
March 1 to March 31, 2019 |
9,202 | 572.09 | — | — | ||||||||||||
|
|
|
|
|
|
|
|
|
|||||||||
|
Total |
1,879,232 | ¥ | 646.45 | 232,257,500 | — | |||||||||||
210
Table of Contents
| Notes: |
| (1) | The shares purchased were shares constituting less than one unit (100 shares) purchased from registered holders of the shares and shares purchased pursuant to applicable Japanese law from shareholders who have not responded to communications sent to their registered addresses for five consecutive years or more and by whom dividend payments have not been received for five consecutive years, each at the current market price. |
| (2) | During May and June 2018, we repurchased 72,420,700 shares of our common stock for ¥49,999,969,714 under a share repurchase program that was adopted on May 15, 2018 and completed in June 2018. Under the program, we were authorized by the Board of Directors to repurchase up to the lesser of an aggregate of 100,000,000 shares of our common stock and an aggregate of ¥50.0 billion between May 16, 2018 and June 30, 2018. All of the repurchased shares were cancelled on July 20, 2018. |
| During November and December 2018, we repurchased 159,836,800 shares of our common stock for ¥99,999,974,078 under a share repurchase program that was adopted on November 13, 2018 and completed in December 2018. Under the program, we were authorized by the Board of Directors to repurchase up to the lesser of an aggregate of 200,000,000 shares of our common stock and an aggregate of ¥100.0 billion between November 14, 2018 and December 31, 2018. All of the repurchased shares were cancelled on January 22, 2019. |
We did not make any purchases of shares of our common stock other than as shown in the above table for the fiscal year ended March 31, 2019.
In May 2018, 13,049,600 shares were purchased by the trustee of the trust for the first performance-based stock compensation plan. In connection with the MUFG Americas Holdings Corporation Stock Bonus Plan, 8,149,808 ADSs were purchased by the trustee of the independent trust between April 1, 2018 and March 31, 2019. For descriptions of our stock compensation and bonus plans, see “Item 6.B. Directors, Senior Management and Employees—Compensation.”
| Item 16F. |
Change in Registrant’s Certifying Accountant. |
None.
| Item 16G. |
Corporate Governance. |
The NYSE allows NYSE-listed companies that are foreign private issuers, such as MUFG, with certain exceptions, to follow home-country practices in lieu of the corporate governance practices followed by U.S. companies pursuant to the NYSE’s Listed Company Manual. The following is a summary of the significant differences between MUFG’s corporate governance practices and those followed by U.S. listed companies under the NYSE’s Listed Company Manual.
1. A NYSE-listed U.S. company must have a majority of directors that meet the independence requirements under Section 303A of the NYSE’s Listed Company Manual.
As of the date of this Annual Report, we have nine outside directors as members of our board of directors, which consists of a total of sixteen members. Under our governance system, we are required to have outside directors on each of our nominating, audit and compensation committees, constituting a majority of its members. For a description of an outside director, see “Item 6.C. Directors and Senior Management—Board Practices.”
The Tokyo Stock Exchange rules require listed companies, including us, to identify at least one individual who the company believes is unlikely to have a conflict of interest with general shareholders and have such individual serve as an independent director or outside corporate auditor.
Further, a listed company with fewer than two outside directors who are considered independent based on such internal standards as the company establishes pursuant to the Tokyo Stock Exchange requirements must publicly disclose the reason for not having at least two such directors on its board of directors. In addition, if a listed company determines that at least one-third of the members of its board of directors should be independent outside directors, the listed company must disclose its policy relating to the determination. We have adopted and made public our corporate governance policy providing, among other things, that, in general, half of the members of our board of directors will be independent outside directors.
211
Table of Contents
2. A NYSE-listed U.S. company must have an audit committee composed entirely of independent directors.
Under the Companies Act, we are required to have an audit committee consisting of at least three non-executive directors, and the majority of its members must be outside directors. Currently, our audit committee consists of three outside directors and two non-executive directors. Our audit committee satisfies the requirements of Rule 10A-3 under the U.S. Securities Exchange Act of 1934, including the independence requirements thereunder except as disclosed in “Item 6.C. Directors, Senior Management and Employees—Board Practices—Audit Committee.”
3. A NYSE-listed U.S. company must have a compensation committee composed entirely of independent directors.
Under the Companies Act, we are required to have a compensation committee consisting of at least three directors, and the majority of its members must be outside directors. Currently, our compensation committee consists of five directors, four of whom are outside directors.
4. A NYSE-listed U.S. company must have a nominating or corporate governance committee composed entirely of independent directors.
Under the Companies Act, we are required to have a nominating committee consisting of at least three directors, and the majority of its members must be outside directors. Currently, our nominating committee, which we call the nominating and governance committee, consists of five directors, four of whom are outside directors.
5. A NYSE-listed U.S. company must obtain shareholder approval with respect to any equity compensation plan.
Under the Companies Act, an equity compensation plan for directors and corporate executives is deemed to be compensation for the services performed by the company’s directors and corporate executives. Our compensation committee establishes the policy with respect to the determination of the individual compensation of our directors and corporate executives, including equity compensation in the form of performance-based stock compensation plan, and determines individual compensation in accordance with the policy. Under the Companies Act, a public company with board audit, compensation and nominating committees seeking to introduce a performance-based stock compensation plan must obtain the approval of its compensation committee, not its shareholders.
6. A NYSE-listed U.S. company must adopt and disclose Corporate Governance Guidelines and a Code of Business Conduct and Ethics, and it must also disclose any exemptions granted to directors or executives.
Our corporate governance policies, which are called the “MUFG Corporate Governance Policies,” are based on applicable home-country rules, particularly the Tokyo Stock Exchange rules, which require listed companies, such as us, to adopt a corporate governance code setting forth fundamental principles designed to establish an effective corporate governance system or explain in their corporate governance reports the reasons for not adopting such a code. We disclose these policies on our website.
We have adopted a code of conduct, compliance rules, compliance manual and rules of employment, which meet the definition of “code of ethics” in “Item 16B. Code of Ethics.”
7. A NYSE-listed U.S. company must hold regularly scheduled executive sessions where participants are limited to non-management directors.
Under the Companies Act, Japanese corporations are not obliged to hold executive sessions where participants are limited to non-management directors. Such executive sessions are also not required under our internal corporate governance rules.
212
Table of Contents
Table of Contents
| Item 17. |
Financial Statements. |
In lieu of responding to this item, we have responded to Item 18 of this Annual Report.
| Item 18. |
Financial Statements. |
Our consolidated financial statements are included in this Annual Report, as required by this item, starting on page F-1.
Pursuant to Rule 3-09 of Regulation S-X, the financial statements and supplementary data of Morgan Stanley, our equity method investee, as of and for the fiscal year ended December 31, 2018, are incorporated in this Annual Report as Exhibit 99(c) by reference to Morgan Stanley’s annual report on Form 10-K filed on February 26, 2019.
| Item 19. |
Exhibits. |
|
Exhibit |
Description |
|
|
1(a) |
Articles of Incorporation of Mitsubishi UFJ Financial Group, Inc., as amended on July 6, 2018 (English translation)* | |
|
1(b) |
Board of Directors Regulations of Mitsubishi UFJ Financial Group, Inc., as amended on June 25, 2015 (English translation)* | |
|
1(c) |
Corporation Meetings Regulations of Mitsubishi UFJ Financial Group, Inc., as amended on July 1, 2018 (English translation)* | |
|
1(d) |
Share Handling Regulations of Mitsubishi UFJ Financial Group, Inc., as amended on June 25, 2015 (English Translation)** | |
|
1(e) |
Charter of the Audit Committee of Mitsubishi UFJ Financial Group, Inc., as amended on July 1, 2018 (English translation)* | |
|
1(f) |
Charter of the Compensation Committee of Mitsubishi UFJ Financial Group, Inc., as amended on July 1, 2018 (English translation)* | |
|
1(g) |
Charter of the Nominating and Governance Committee of Mitsubishi UFJ Financial Group, Inc., as amended on July 1, 2018 (English translation)* | |
|
1(h) |
Charter of the Risk Committee of Mitsubishi UFJ Financial Group, Inc., as amended on July 1, 2018 (English translation)* | |
|
2(a) |
Form of American Depositary Receipt* | |
|
2(b) |
Form of Deposit Agreement, amended and restated as of December 22, 2004, among Mitsubishi Tokyo Financial Group, Inc. (subsequently renamed Mitsubishi UFJ Financial Group, Inc.), The Bank of New York Mellon and the holders from time to time of American Depositary Receipts issued thereunder* | |
|
2(c) |
Description of Securities | |
|
8 |
Subsidiaries of the Company—see “Item 4.C. Information on the Company—Organizational Structure.” | |
|
11 |
MUFG Group Code of Conduct, Compliance Rules, Compliance Manual, and Rules of Employment of Mitsubishi UFJ Financial Group, Inc. applicable to its principal executive officer, principal financial officer, principal accounting officer and persons performing similar functions (English translation of relevant sections) | |
|
12 |
Certifications required by Rule 13a-14(a) (17 CFR 240.13a-14(a)) or Rule 15d-14(a) (17 CFR 240.15d-14(a)) | |
214
Table of Contents
|
Exhibit |
Description |
|
|
13 |
Certifications required by Rule 13a-14(b) (17 CFR 240.13a-14(b)) or Rule 15d-14(b) (17 CFR 240.15d-14(b)) and Section 1350 of Chapter 63 of Title 18 of the United States Code (18 U.S.C. 1350) | |
|
15(a) |
Consent of independent registered public accounting firm (Deloitte Touche Tohmatsu LLC) | |
|
15(b) |
Consent of independent registered public accounting firm (Deloitte & Touche LLP) | |
|
99(a) |
Capitalization and Indebtedness of Mitsubishi UFJ Financial Group, Inc. as of March 31, 2019*** | |
|
99(b) |
Unaudited Reverse Reconciliation of Selected Financial Information of Mitsubishi UFJ Financial Group, Inc. as of and for the fiscal year ended March 31, 2019**** | |
|
99(c) |
Financial Statements and Supplementary Data of Morgan Stanley***** | |
|
101.INS |
XBRL Instance Document | |
|
101.SCH |
XBRL Schema Document |
|
|
101.CAL |
XBRL Calculation Linkbase Document |
|
|
101.DEF |
XBRL Definition Linkbase Document |
|
|
101.LAB |
XBRL Label Linkbase Document |
|
|
101.PRE |
XBRL Presentation Linkbase Document |
|
| Notes: |
| * | Incorporated by reference to our annual report on Form 20-F (File No. 000-54189) filed on July 12, 2018. |
| ** | Incorporated by reference to our registration statement on Form S-8 (File No. 333-230590) filed on March 29, 2019. |
| *** | Deemed to be incorporated by reference into the registration statement on Form F-3 (No. 333-229697) of Mitsubishi UFJ Financial Group, Inc. and to be a part thereof. |
| **** | Deemed to be incorporated as Annex A to the registration statement on Form F-3 (No. 333-229697) of Mitsubishi UFJ Financial Group, Inc. and to be a part thereof. |
| ***** | Incorporated by reference to Morgan Stanley’s annual report on Form 10-K (File No. 001-11758) filed on February 26, 2019. |
215
Table of Contents
Due to close integration of our foreign and domestic activities, it is difficult to make a precise determination of the assets, liabilities, income and expenses of our foreign operations. The foreign operations as presented include the business conducted by overseas subsidiaries and branches, and the international business principally conducted by the international banking-related divisions headquartered in Japan. Our management believes that the results appropriately represent our domestic and foreign activities.
A-1
Table of Contents
| I. | Distribution of Assets, Liabilities and Equity; Interest Rates and Interest Differential |
The following table shows our average balances, interest and average interest rates for the fiscal years ended March 31, 2017, 2018 and 2019. Average balances are generally based on a daily average while a month-end average is used for certain average balances when it is not practicable to obtain applicable daily averages.
| Fiscal years ended March 31, | ||||||||||||||||||||||||||||||||||||
| 2017 | 2018 | 2019 | ||||||||||||||||||||||||||||||||||
|
Average
balance |
Interest
income |
Average
rate |
Average
balance |
Interest
income |
Average
rate |
Average
balance |
Interest
income |
Average
rate |
||||||||||||||||||||||||||||
| (in millions, except percentages) | ||||||||||||||||||||||||||||||||||||
|
Assets: |
||||||||||||||||||||||||||||||||||||
|
Interest-earning assets: |
||||||||||||||||||||||||||||||||||||
|
Interest-earning deposits in other banks: |
||||||||||||||||||||||||||||||||||||
|
Domestic |
¥ | 31,322,995 | ¥ | 28,975 | 0.09 | % | ¥ | 31,515,803 | ¥ | 26,391 | 0.08 | % | ¥ | 32,727,743 | ¥ | 31,287 | 0.10 | % | ||||||||||||||||||
|
Foreign |
7,118,443 | 49,760 | 0.70 | 7,889,777 | 100,217 | 1.27 | 9,025,391 | 152,040 | 1.68 | |||||||||||||||||||||||||||
|
|
|
|
|
|
|
|
|
|
|
|
|
|||||||||||||||||||||||||
|
Total |
38,441,438 | 78,735 | 0.20 | 39,405,580 | 126,608 | 0.32 | 41,753,134 | 183,327 | 0.44 | |||||||||||||||||||||||||||
|
|
|
|
|
|
|
|
|
|
|
|
|
|||||||||||||||||||||||||
|
Call loans, funds sold, and receivables under resale agreements and securities borrowing transactions: |
||||||||||||||||||||||||||||||||||||
|
Domestic |
5,825,863 | 2,116 | 0.04 | 7,703,606 | 7,246 | 0.09 | 6,429,788 | 5,920 | 0.09 | |||||||||||||||||||||||||||
|
Foreign |
8,259,160 | 59,263 | 0.72 | 7,873,112 | 77,447 | 0.98 | 7,594,119 | 149,788 | 1.97 | |||||||||||||||||||||||||||
|
|
|
|
|
|
|
|
|
|
|
|
|
|||||||||||||||||||||||||
|
Total |
14,085,023 | 61,379 | 0.44 | 15,576,718 | 84,693 | 0.54 | 14,023,907 | 155,708 | 1.11 | |||||||||||||||||||||||||||
|
|
|
|
|
|
|
|
|
|
|
|
|
|||||||||||||||||||||||||
|
Trading account assets: |
||||||||||||||||||||||||||||||||||||
|
Domestic |
3,818,370 | 24,262 | 0.64 | 4,737,292 | 27,126 | 0.57 | 5,204,308 | 31,284 | 0.60 | |||||||||||||||||||||||||||
|
Foreign |
23,111,674 | 431,598 | 1.87 | 20,012,444 | 405,469 | 2.03 | 19,467,632 | 468,440 | 2.41 | |||||||||||||||||||||||||||
|
|
|
|
|
|
|
|
|
|
|
|
|
|||||||||||||||||||||||||
|
Total |
26,930,044 | 455,860 | 1.69 | 24,749,736 | 432,595 | 1.75 | 24,671,940 | 499,724 | 2.03 | |||||||||||||||||||||||||||
|
|
|
|
|
|
|
|
|
|
|
|
|
|||||||||||||||||||||||||
|
Investment securities (1) : |
||||||||||||||||||||||||||||||||||||
|
Domestic |
35,863,993 | 219,443 | 0.61 | 34,659,859 | 183,622 | 0.53 | 35,073,801 | 202,755 | 0.58 | |||||||||||||||||||||||||||
|
Foreign |
6,583,759 | 151,701 | 2.30 | 6,891,939 | 160,279 | 2.33 | 7,782,349 | 195,448 | 2.51 | |||||||||||||||||||||||||||
|
|
|
|
|
|
|
|
|
|
|
|
|
|||||||||||||||||||||||||
|
Total |
42,447,752 | 371,144 | 0.87 | 41,551,798 | 343,901 | 0.83 | 42,856,150 | 398,203 | 0.93 | |||||||||||||||||||||||||||
|
|
|
|
|
|
|
|
|
|
|
|
|
|||||||||||||||||||||||||
|
Loans (2) : |
||||||||||||||||||||||||||||||||||||
|
Domestic |
68,348,115 | 743,683 | 1.09 | 65,985,440 | 757,623 | 1.15 | 65,843,445 | 777,306 | 1.18 | |||||||||||||||||||||||||||
|
Foreign |
48,940,077 | 1,279,966 | 2.62 | 51,779,709 | 1,513,596 | 2.92 | 52,258,780 | 1,799,111 | 3.44 | |||||||||||||||||||||||||||
|
|
|
|
|
|
|
|
|
|
|
|
|
|||||||||||||||||||||||||
|
Total |
117,288,192 | 2,023,649 | 1.73 | 117,765,149 | 2,271,219 | 1.93 | 118,102,225 | 2,576,417 | 2.18 | |||||||||||||||||||||||||||
|
|
|
|
|
|
|
|
|
|
|
|
|
|||||||||||||||||||||||||
|
Total interest-earning assets: |
||||||||||||||||||||||||||||||||||||
|
Domestic |
145,179,336 | 1,018,479 | 0.70 | 144,602,000 | 1,002,008 | 0.69 | 145,279,085 | 1,048,552 | 0.72 | |||||||||||||||||||||||||||
|
Foreign |
94,013,113 | 1,972,288 | 2.10 | 94,446,981 | 2,257,008 | 2.39 | 96,128,271 | 2,764,827 | 2.88 | |||||||||||||||||||||||||||
|
|
|
|
|
|
|
|
|
|
|
|
|
|||||||||||||||||||||||||
|
Total |
239,192,449 | 2,990,767 | 1.25 | 239,048,981 | 3,259,016 | 1.36 | 241,407,356 | 3,813,379 | 1.58 | |||||||||||||||||||||||||||
|
|
|
|
|
|
|
|
|
|
|
|
|
|||||||||||||||||||||||||
|
Non-interest-earning assets: |
||||||||||||||||||||||||||||||||||||
|
Cash and due from banks |
21,989,856 | 34,040,675 | 33,631,665 | |||||||||||||||||||||||||||||||||
|
Other non-interest-earning assets |
47,775,376 | 48,549,541 | 46,952,826 | |||||||||||||||||||||||||||||||||
|
Allowance for credit losses |
(1,018,982 | ) | (1,049,265 | ) | (699,000 | ) | ||||||||||||||||||||||||||||||
|
|
|
|
|
|
|
|||||||||||||||||||||||||||||||
|
Total non-interest-earning assets |
68,746,250 | 81,540,951 | 79,885,491 | |||||||||||||||||||||||||||||||||
|
|
|
|
|
|
|
|||||||||||||||||||||||||||||||
|
Total assets |
¥ | 307,938,699 | ¥ | 320,589,932 | ¥ | 321,292,847 | ||||||||||||||||||||||||||||||
|
|
|
|
|
|
|
|||||||||||||||||||||||||||||||
Notes:
| (1) | Tax-exempt income of tax-exempt investment securities has not been calculated on a tax equivalent basis because the effect of such calculation would not be material. |
| (2) | Average balances on loans outstanding include all nonaccrual and restructured loans. See “III. Loan Portfolio.” The amortized portion of net loan origination fees (costs) is included in interest income on loans, which accounts for an insignificant amount of an adjustment to the yields. |
A-2
Table of Contents
| Fiscal years ended March 31, | ||||||||||||||||||||||||||||||||||||
| 2017 | 2018 | 2019 | ||||||||||||||||||||||||||||||||||
|
Average
balance |
Interest
expense |
Average
rate |
Average
balance |
Interest
expense |
Average
rate |
Average
balance |
Interest
expense |
Average
rate |
||||||||||||||||||||||||||||
| (in millions, except percentages) | ||||||||||||||||||||||||||||||||||||
|
Liabilities and equity: |
||||||||||||||||||||||||||||||||||||
|
Interest-bearing liabilities: |
||||||||||||||||||||||||||||||||||||
|
Deposits: |
||||||||||||||||||||||||||||||||||||
|
Domestic |
¥ | 117,156,484 | ¥ | 45,790 | 0.04 | % | ¥ | 123,141,060 | ¥ | 58,779 | 0.05 | % | ¥ | 124,661,909 | ¥ | 67,948 | 0.05 | % | ||||||||||||||||||
|
Foreign |
38,411,021 | 301,640 | 0.79 | 41,421,717 | 456,089 | 1.10 | 41,945,626 | 649,418 | 1.55 | |||||||||||||||||||||||||||
|
|
|
|
|
|
|
|
|
|
|
|
|
|||||||||||||||||||||||||
|
Total |
155,567,505 | 347,430 | 0.22 | 164,562,777 | 514,868 | 0.31 | 166,607,535 | 717,366 | 0.43 | |||||||||||||||||||||||||||
|
|
|
|
|
|
|
|
|
|
|
|
|
|||||||||||||||||||||||||
|
Call money, funds purchased, and payables under repurchase agreements and securities lending transactions: |
||||||||||||||||||||||||||||||||||||
|
Domestic |
22,024,053 | 82,162 | 0.37 | 17,913,277 | 113,805 | 0.64 | 17,201,589 | 188,009 | 1.09 | |||||||||||||||||||||||||||
|
Foreign |
10,765,446 | 20,425 | 0.19 | 10,138,998 | 56,955 | 0.56 | 9,204,904 | 149,536 | 1.62 | |||||||||||||||||||||||||||
|
|
|
|
|
|
|
|
|
|
|
|
|
|||||||||||||||||||||||||
|
Total |
32,789,499 | 102,587 | 0.31 | 28,052,275 | 170,760 | 0.61 | 26,406,493 | 337,545 | 1.28 | |||||||||||||||||||||||||||
|
|
|
|
|
|
|
|
|
|
|
|
|
|||||||||||||||||||||||||
|
Due to trust account—Domestic |
3,122,190 | 207 | 0.01 | 3,065,511 | 109 | 0.00 | 3,062,655 | 124 | 0.00 | |||||||||||||||||||||||||||
|
|
|
|
|
|
|
|
|
|
|
|
|
|||||||||||||||||||||||||
|
Other short-term borrowings and trading account liabilities: |
||||||||||||||||||||||||||||||||||||
|
Domestic |
3,644,192 | 11,679 | 0.32 | 3,768,213 | 11,012 | 0.29 | 2,714,678 | 13,452 | 0.50 | |||||||||||||||||||||||||||
|
Foreign |
5,435,977 | 49,458 | 0.91 | 6,476,232 | 82,523 | 1.27 | 7,184,301 | 141,697 | 1.97 | |||||||||||||||||||||||||||
|
|
|
|
|
|
|
|
|
|
|
|
|
|||||||||||||||||||||||||
|
Total |
9,080,169 | 61,137 | 0.67 | 10,244,445 | 93,535 | 0.91 | 9,898,979 | 155,149 | 1.57 | |||||||||||||||||||||||||||
|
|
|
|
|
|
|
|
|
|
|
|
|
|||||||||||||||||||||||||
|
Long-term debt: |
||||||||||||||||||||||||||||||||||||
|
Domestic |
20,358,348 | 173,634 | 0.85 | 25,277,891 | 183,944 | 0.73 | 25,558,707 | 234,603 | 0.92 | |||||||||||||||||||||||||||
|
Foreign |
2,604,585 | 84,644 | 3.25 | 2,654,153 | 65,539 | 2.47 | 3,108,828 | 73,194 | 2.35 | |||||||||||||||||||||||||||
|
|
|
|
|
|
|
|
|
|
|
|
|
|||||||||||||||||||||||||
|
Total |
22,962,933 | 258,278 | 1.12 | 27,932,044 | 249,483 | 0.89 | 28,667,535 | 307,797 | 1.07 | |||||||||||||||||||||||||||
|
|
|
|
|
|
|
|
|
|
|
|
|
|||||||||||||||||||||||||
|
Total interest-bearing liabilities: |
||||||||||||||||||||||||||||||||||||
|
Domestic |
166,305,267 | 313,472 | 0.19 | 173,165,952 | 367,649 | 0.21 | 173,199,538 | 504,136 | 0.29 | |||||||||||||||||||||||||||
|
Foreign |
57,217,029 | 456,167 | 0.80 | 60,691,100 | 661,106 | 1.09 | 61,443,659 | 1,013,845 | 1.65 | |||||||||||||||||||||||||||
|
|
|
|
|
|
|
|
|
|
|
|
|
|||||||||||||||||||||||||
|
Total |
223,522,296 | 769,639 | 0.34 | 233,857,052 | 1,028,755 | 0.44 | 234,643,197 | 1,517,981 | 0.65 | |||||||||||||||||||||||||||
|
|
|
|
|
|
|
|
|
|
|
|
|
|||||||||||||||||||||||||
|
Non-interest-bearing liabilities |
69,405,574 | 71,309,802 | 70,572,971 | |||||||||||||||||||||||||||||||||
|
|
|
|
|
|
|
|||||||||||||||||||||||||||||||
|
Total equity |
15,010,829 | 15,423,078 | 16,076,679 | |||||||||||||||||||||||||||||||||
|
|
|
|
|
|
|
|||||||||||||||||||||||||||||||
|
Total liabilities and equity |
¥ | 307,938,699 | ¥ | 320,589,932 | ¥ | 321,292,847 | ||||||||||||||||||||||||||||||
|
|
|
|
|
|
|
|||||||||||||||||||||||||||||||
|
Net interest income and interest rate spread |
¥ | 2,221,128 | 0.91 | % | ¥ | 2,230,261 | 0.92 | % | ¥ | 2,295,398 | 0.93 | % | ||||||||||||||||||||||||
|
|
|
|
|
|
|
|
|
|
|
|
|
|||||||||||||||||||||||||
|
Net interest income as a percentage of total interest-earning assets |
0.93 | % | 0.93 | % | 0.95 | % | ||||||||||||||||||||||||||||||
|
|
|
|
|
|
|
|||||||||||||||||||||||||||||||
The percentage of total average assets attributable to foreign activities was 37.3%, 36.6% and 36.8%, respectively, for the fiscal years ended March 31, 2017, 2018 and 2019.
The percentage of total average liabilities attributable to foreign activities was 38.1%, 36.9% and 37.0%, respectively, for the fiscal years ended March 31, 2017, 2018 and 2019.
A-3
Table of Contents
Analysis of Net Interest Income
The following table shows changes in our net interest income by changes in volume and by changes in interest rate for the fiscal year ended March 31, 2018 compared to the fiscal year ended March 31, 2017, and the fiscal year ended March 31, 2019 compared to the fiscal year ended March 31, 2018.
|
Fiscal year ended March 31, 2017
versus fiscal year ended March 31, 2018 |
Fiscal year ended March 31, 2018
versus fiscal year ended March 31, 2019 |
|||||||||||||||||||||||
|
Increase (decrease)
due to changes in |
Net change |
Increase (decrease)
due to changes in |
Net change | |||||||||||||||||||||
| Volume (1) | Rate (1) | Volume (1) | Rate (1) | |||||||||||||||||||||
| (in millions) | ||||||||||||||||||||||||
|
Interest income: |
||||||||||||||||||||||||
|
Interest-earning deposits in other banks: |
||||||||||||||||||||||||
|
Domestic |
¥ | 177 | ¥ | (2,761 | ) | ¥ | (2,584 | ) | ¥ | 1,046 | ¥ | 3,850 | ¥ | 4,896 | ||||||||||
|
Foreign |
5,908 | 44,549 | 50,457 | 15,865 | 35,958 | 51,823 | ||||||||||||||||||
|
|
|
|
|
|
|
|
|
|
|
|
|
|||||||||||||
|
Total |
6,085 | 41,788 | 47,873 | 16,911 | 39,808 | 56,719 | ||||||||||||||||||
|
|
|
|
|
|
|
|
|
|
|
|
|
|||||||||||||
|
Call loans, funds sold, and receivables under resale agreements and securities borrowing transactions: |
||||||||||||||||||||||||
|
Domestic |
865 | 4,265 | 5,130 | (1,176 | ) | (150 | ) | (1,326 | ) | |||||||||||||||
|
Foreign |
(2,885 | ) | 21,069 | 18,184 | (2,838 | ) | 75,179 | 72,341 | ||||||||||||||||
|
|
|
|
|
|
|
|
|
|
|
|
|
|||||||||||||
|
Total |
(2,020 | ) | 25,334 | 23,314 | (4,014 | ) | 75,029 | 71,015 | ||||||||||||||||
|
|
|
|
|
|
|
|
|
|
|
|
|
|||||||||||||
|
Trading account assets: |
||||||||||||||||||||||||
|
Domestic |
5,430 | (2,566 | ) | 2,864 | 2,763 | 1,395 | 4,158 | |||||||||||||||||
|
Foreign |
(60,886 | ) | 34,757 | (26,129 | ) | (11,301 | ) | 74,272 | 62,971 | |||||||||||||||
|
|
|
|
|
|
|
|
|
|
|
|
|
|||||||||||||
|
Total |
(55,456 | ) | 32,191 | (23,265 | ) | (8,538 | ) | 75,667 | 67,129 | |||||||||||||||
|
|
|
|
|
|
|
|
|
|
|
|
|
|||||||||||||
|
Investment securities (2) : |
||||||||||||||||||||||||
|
Domestic |
(7,170 | ) | (28,651 | ) | (35,821 | ) | 2,216 | 16,917 | 19,133 | |||||||||||||||
|
Foreign |
7,156 | 1,422 | 8,578 | 21,730 | 13,439 | 35,169 | ||||||||||||||||||
|
|
|
|
|
|
|
|
|
|
|
|
|
|||||||||||||
|
Total |
(14 | ) | (27,229 | ) | (27,243 | ) | 23,946 | 30,356 | 54,302 | |||||||||||||||
|
|
|
|
|
|
|
|
|
|
|
|
|
|||||||||||||
|
Loans: |
||||||||||||||||||||||||
|
Domestic |
(26,254 | ) | 40,194 | 13,940 | (1,634 | ) | 21,317 | 19,683 | ||||||||||||||||
|
Foreign |
77,153 | 156,477 | 233,630 | 14,127 | 271,388 | 285,515 | ||||||||||||||||||
|
|
|
|
|
|
|
|
|
|
|
|
|
|||||||||||||
|
Total |
50,899 | 196,671 | 247,570 | 12,493 | 292,705 | 305,198 | ||||||||||||||||||
|
|
|
|
|
|
|
|
|
|
|
|
|
|||||||||||||
|
Total interest income: |
||||||||||||||||||||||||
|
Domestic |
(26,952 | ) | 10,481 | (16,471 | ) | 3,215 | 43,329 | 46,544 | ||||||||||||||||
|
Foreign |
26,446 | 258,274 | 284,720 | 37,583 | 470,236 | 507,819 | ||||||||||||||||||
|
|
|
|
|
|
|
|
|
|
|
|
|
|||||||||||||
|
Total |
¥ | (506 | ) | ¥ | 268,755 | ¥ | 268,249 | ¥ | 40,798 | ¥ | 513,565 | ¥ | 554,363 | |||||||||||
|
|
|
|
|
|
|
|
|
|
|
|
|
|||||||||||||
Notes:
| (1) | Volume/rate variance is allocated based on the percentage relationship of changes in volume and changes in rate to the total “net change.” |
| (2) | Tax-exempt income of tax-exempt investment securities has not been calculated on a tax equivalent basis because the effect of such calculation would not be material. |
A-4
Table of Contents
|
Fiscal year ended March 31, 2017
versus fiscal year ended March 31, 2018 |
Fiscal year ended March 31, 2018
versus fiscal year ended March 31, 2019 |
|||||||||||||||||||||||
|
Increase (decrease)
due to changes in |
Net change |
Increase (decrease)
due to changes in |
Net change | |||||||||||||||||||||
| Volume (1) | Rate (1) | Volume (1) | Rate (1) | |||||||||||||||||||||
| (in millions) | ||||||||||||||||||||||||
|
Interest expense: |
||||||||||||||||||||||||
|
Deposits: |
||||||||||||||||||||||||
|
Domestic |
¥ | 2,436 | ¥ | 10,553 | ¥ | 12,989 | ¥ | 734 | ¥ | 8,435 | ¥ | 9,169 | ||||||||||||
|
Foreign |
25,194 | 129,255 | 154,449 | 5,839 | 187,490 | 193,329 | ||||||||||||||||||
|
|
|
|
|
|
|
|
|
|
|
|
|
|||||||||||||
|
Total |
27,630 | 139,808 | 167,438 | 6,573 | 195,925 | 202,498 | ||||||||||||||||||
|
|
|
|
|
|
|
|
|
|
|
|
|
|||||||||||||
|
Call money, funds purchased, and payables under repurchase agreements and securities lending transactions: |
||||||||||||||||||||||||
|
Domestic |
(17,597 | ) | 49,240 | 31,643 | (4,692 | ) | 78,896 | 74,204 | ||||||||||||||||
|
Foreign |
(1,256 | ) | 37,786 | 36,530 | (5,708 | ) | 98,289 | 92,581 | ||||||||||||||||
|
|
|
|
|
|
|
|
|
|
|
|
|
|||||||||||||
|
Total |
(18,853 | ) | 87,026 | 68,173 | (10,400 | ) | 177,185 | 166,785 | ||||||||||||||||
|
|
|
|
|
|
|
|
|
|
|
|
|
|||||||||||||
|
Due to trust account—Domestic |
(4 | ) | (94 | ) | (98 | ) | — | 15 | 15 | |||||||||||||||
|
|
|
|
|
|
|
|
|
|
|
|
|
|||||||||||||
|
Other short-term borrowings and trading account liabilities: |
||||||||||||||||||||||||
|
Domestic |
388 | (1,055 | ) | (667 | ) | (3,693 | ) | 6,133 | 2,440 | |||||||||||||||
|
Foreign |
10,690 | 22,375 | 33,065 | 9,845 | 49,329 | 59,174 | ||||||||||||||||||
|
|
|
|
|
|
|
|
|
|
|
|
|
|||||||||||||
|
Total |
11,078 | 21,320 | 32,398 | 6,152 | 55,462 | 61,614 | ||||||||||||||||||
|
|
|
|
|
|
|
|
|
|
|
|
|
|||||||||||||
|
Long-term debt: |
||||||||||||||||||||||||
|
Domestic |
38,127 | (27,817 | ) | 10,310 | 2,065 | 48,594 | 50,659 | |||||||||||||||||
|
Foreign |
1,582 | (20,687 | ) | (19,105 | ) | 10,816 | (3,161 | ) | 7,655 | |||||||||||||||
|
|
|
|
|
|
|
|
|
|
|
|
|
|||||||||||||
|
Total |
39,709 | (48,504 | ) | (8,795 | ) | 12,881 | 45,433 | 58,314 | ||||||||||||||||
|
|
|
|
|
|
|
|
|
|
|
|
|
|||||||||||||
|
Total interest expense: |
||||||||||||||||||||||||
|
Domestic |
23,350 | 30,827 | 54,177 | (5,586 | ) | 142,073 | 136,487 | |||||||||||||||||
|
Foreign |
36,210 | 168,729 | 204,939 | 20,792 | 331,947 | 352,739 | ||||||||||||||||||
|
|
|
|
|
|
|
|
|
|
|
|
|
|||||||||||||
|
Total |
¥ | 59,560 | ¥ | 199,556 | ¥ | 259,116 | ¥ | 15,206 | ¥ | 474,020 | ¥ | 489,226 | ||||||||||||
|
|
|
|
|
|
|
|
|
|
|
|
|
|||||||||||||
|
Net interest income: |
||||||||||||||||||||||||
|
Domestic |
¥ | (50,302 | ) | ¥ | (20,346 | ) | ¥ | (70,648 | ) | ¥ | 8,801 | ¥ | (98,744 | ) | ¥ | (89,943 | ) | |||||||
|
Foreign |
(9,764 | ) | 89,545 | 79,781 | 16,791 | 138,289 | 155,080 | |||||||||||||||||
|
|
|
|
|
|
|
|
|
|
|
|
|
|||||||||||||
|
Total |
¥ | (60,066 | ) | ¥ | 69,199 | ¥ | 9,133 | ¥ | 25,592 | ¥ | 39,545 | ¥ | 65,137 | |||||||||||
|
|
|
|
|
|
|
|
|
|
|
|
|
|||||||||||||
Note:
| (1) | Volume/rate variance is allocated based on the percentage relationship of changes in volume and changes in rate to the total “net change.” |
A-5
Table of Contents
| II. | Investment Portfolio |
The following table shows information as to the value of our Available-for-sale debt securities, Held-to-maturity debt securities, and Marketable equity securities at March 31, 2017, 2018 and 2019:
| At March 31, | ||||||||||||||||||||||||||||||||||||
| 2017 | 2018 | 2019 | ||||||||||||||||||||||||||||||||||
|
Amortized
cost |
Fair value |
Net
unrealized gains (losses) |
Amortized
cost |
Fair value |
Net
unrealized gains (losses) |
Amortized
cost |
Fair value |
Net
unrealized gains (losses) |
||||||||||||||||||||||||||||
| (in millions) | ||||||||||||||||||||||||||||||||||||
|
Available-for-sale debt securities: |
||||||||||||||||||||||||||||||||||||
|
Domestic: |
||||||||||||||||||||||||||||||||||||
|
Japanese national government and Japanese government agency bonds |
¥25,435,570 | ¥25,826,288 | ¥ | 390,718 | ¥ | 24,272,345 | ¥ | 24,567,904 | ¥ | 295,559 | ¥ | 23,748,558 | ¥ | 24,077,696 | ¥ | 329,138 | ||||||||||||||||||||
|
Corporate bonds |
899,572 | 917,170 | 17,598 | 923,912 | 935,965 | 12,053 | 988,137 | 999,707 | 11,570 | |||||||||||||||||||||||||||
|
Other securities |
1,844,358 | 1,851,402 | 7,044 | 2,581,942 | 2,589,367 | 7,425 | 3,377,266 | 3,402,696 | 25,430 | |||||||||||||||||||||||||||
|
|
|
|
|
|
|
|
|
|
|
|
|
|
|
|
|
|
|
|||||||||||||||||||
|
Total domestic |
28,179,500 | 28,594,860 | 415,360 | 27,778,199 | 28,093,236 | 315,037 | 28,113,961 | 28,480,099 | 366,138 | |||||||||||||||||||||||||||
|
|
|
|
|
|
|
|
|
|
|
|
|
|
|
|
|
|
|
|||||||||||||||||||
|
Foreign: |
||||||||||||||||||||||||||||||||||||
|
U.S. Treasury and other U.S. government agencies bonds |
1,075,244 | 1,060,868 | (14,376 | ) | 1,400,997 | 1,366,456 | (34,541 | ) | 1,722,943 | 1,710,328 | (12,615 | ) | ||||||||||||||||||||||||
|
Other government and official institution bonds |
1,087,653 | 1,089,061 | 1,408 | 806,665 | 805,236 | (1,429 | ) | 925,931 | 931,091 | 5,160 | ||||||||||||||||||||||||||
|
Mortgage-backed securities |
913,118 | 898,301 | (14,817 | ) | 1,229,111 | 1,214,211 | (14,900 | ) | 1,138,101 | 1,115,714 | (22,387 | ) | ||||||||||||||||||||||||
|
Other securities |
1,303,443 | 1,308,595 | 5,152 | 1,341,697 | 1,353,975 | 12,278 | 1,273,551 | 1,281,271 | 7,720 | |||||||||||||||||||||||||||
|
|
|
|
|
|
|
|
|
|
|
|
|
|
|
|
|
|
|
|||||||||||||||||||
|
Total foreign |
4,379,458 | 4,356,825 | (22,633 | ) | 4,778,470 | 4,739,878 | (38,592 | ) | 5,060,526 | 5,038,404 | (22,122 | ) | ||||||||||||||||||||||||
|
|
|
|
|
|
|
|
|
|
|
|
|
|
|
|
|
|
|
|||||||||||||||||||
|
Total |
¥ | 32,558,958 | ¥ | 32,951,685 | ¥ | 392,727 | ¥ | 32,556,669 | ¥ | 32,833,114 | ¥ | 276,445 | ¥ | 33,174,487 | ¥ | 33,518,503 | ¥ | 344,016 | ||||||||||||||||||
|
|
|
|
|
|
|
|
|
|
|
|
|
|
|
|
|
|
|
|||||||||||||||||||
|
Held-to-maturity debt securities: |
||||||||||||||||||||||||||||||||||||
|
Domestic: |
||||||||||||||||||||||||||||||||||||
|
Japanese national government and Japanese government agency bonds |
¥1,100,955 | ¥ | 1,144,070 | ¥ | 43,115 | ¥ | 1,100,807 | ¥ | 1,141,019 | ¥ | 40,212 | ¥ | 1,100,701 | ¥ | 1,142,320 | ¥ | 41,619 | |||||||||||||||||||
|
Other securities |
100 | 100 | — | — | — | — | — | — | — | |||||||||||||||||||||||||||
|
|
|
|
|
|
|
|
|
|
|
|
|
|
|
|
|
|
|
|||||||||||||||||||
|
Total domestic |
1,101,055 | 1,144,170 | 43,115 | 1,100,807 | 1,141,019 | 40,212 | 1,100,701 | 1,142,320 | 41,619 | |||||||||||||||||||||||||||
|
|
|
|
|
|
|
|
|
|
|
|
|
|
|
|
|
|
|
|||||||||||||||||||
|
Foreign: |
||||||||||||||||||||||||||||||||||||
|
U.S. Treasury and other U.S. government agencies bonds |
60,910 | 62,023 | 1,113 | 59,330 | 59,610 | 280 | 138,731 | 138,712 | (19 | ) | ||||||||||||||||||||||||||
|
Other government and official institution bonds |
225 | 225 | — | — | — | — | — | — | — | |||||||||||||||||||||||||||
|
Mortgage-backed securities |
1,146,828 | 1,143,938 | (2,890 | ) | 1,057,612 | 1,047,635 | (9,977 | ) | 1,071,257 | 1,051,135 | (20,122 | ) | ||||||||||||||||||||||||
|
Asset-backed securities |
1,278,303 | 1,287,395 | 9,092 | 1,365,192 | 1,372,408 | 7,216 | 2,131,212 | 2,120,780 | (10,432 | ) | ||||||||||||||||||||||||||
|
|
|
|
|
|
|
|
|
|
|
|
|
|
|
|
|
|
|
|||||||||||||||||||
|
Total foreign |
2,486,266 | 2,493,581 | 7,315 | 2,482,134 | 2,479,653 | (2,481 | ) | 3,341,200 | 3,310,627 | (30,573 | ) | |||||||||||||||||||||||||
|
|
|
|
|
|
|
|
|
|
|
|
|
|
|
|
|
|
|
|||||||||||||||||||
|
Total |
¥ | 3,587,321 | ¥ | 3,637,751 | ¥ | 50,430 | ¥ | 3,582,941 | ¥ | 3,620,672 | ¥ | 37,731 | ¥ | 4,441,901 | ¥ | 4,452,947 | ¥ | 11,046 | ||||||||||||||||||
|
|
|
|
|
|
|
|
|
|
|
|
|
|
|
|
|
|
|
|||||||||||||||||||
|
Marketable equity securities: |
||||||||||||||||||||||||||||||||||||
|
Domestic: |
||||||||||||||||||||||||||||||||||||
|
Marketable equity securities |
— | ¥ | 6,115,213 | — | — | ¥ | 6,544,938 | — | — | ¥ | 6,331,815 | — | ||||||||||||||||||||||||
|
|
|
|
|
|
|
|
|
|
|
|
|
|
|
|
|
|
|
|||||||||||||||||||
|
Total domestic |
— | 6,115,213 | — | — | 6,544,938 | — | — | 6,331,815 | — | |||||||||||||||||||||||||||
|
|
|
|
|
|
|
|
|
|
|
|
|
|
|
|
|
|
|
|||||||||||||||||||
|
Foreign: |
||||||||||||||||||||||||||||||||||||
|
Marketable equity securities |
— | 23,201 | — | — | 126,646 | — | — | 26,728 | — | |||||||||||||||||||||||||||
|
|
|
|
|
|
|
|
|
|
|
|
|
|
|
|
|
|
|
|||||||||||||||||||
|
Total foreign |
— | 23,201 | — | — | 126,646 | — | — | 26,728 | — | |||||||||||||||||||||||||||
|
|
|
|
|
|
|
|
|
|
|
|
|
|
|
|
|
|
|
|||||||||||||||||||
|
Total |
— | ¥ | 6,138,414 | — | — | ¥ | 6,671,584 | — | — | ¥ | 6,358,543 | — | ||||||||||||||||||||||||
|
|
|
|
|
|
|
|
|
|
|
|
|
|
|
|
|
|
|
|||||||||||||||||||
A-6
Table of Contents
Nonmarketable equity securities presented in Equity securities in the accompanying consolidated financial statements were primarily carried at cost of ¥529,869 million, ¥538,251 million and ¥591,237 million, at March 31, 2017, 2018 and 2019, respectively. The corresponding fair values at those dates were not readily determinable. Investment securities held by certain subsidiaries subject to specialized industry accounting principles for investment companies and brokers and dealers presented in Equity securities were carried at fair value of ¥26,292 million, ¥28,359 million and ¥27,820 million, at March 31, 2017, 2018 and 2019, respectively.
The following table presents the book values, maturities and weighted average yields of Available-for-sale debt securities and Held-to-maturity debt securities at March 31, 2019. Weighted average yields are calculated based on amortized cost. Yields on tax-exempt obligations have not been calculated on a tax equivalent basis because the effect of such calculation would not be material:
|
Maturities within
one year |
Maturities after
one year but within five years |
Maturities after
five years but within ten years |
Maturities after
ten years |
Total | ||||||||||||||||||||||||||||||||||||
| Amount | Yield | Amount | Yield | Amount | Yield | Amount | Yield | Amount | Yield | |||||||||||||||||||||||||||||||
| (in millions, except percentages) | ||||||||||||||||||||||||||||||||||||||||
|
Available-for-sale debt securities: |
||||||||||||||||||||||||||||||||||||||||
|
Domestic: |
||||||||||||||||||||||||||||||||||||||||
|
Japanese national government and Japanese government agency bonds |
¥ | 11,552,613 | 0.10 | % | ¥ | 7,382,959 | 0.27 | % | ¥ | 2,096,074 | 0.48 | % | ¥ | 3,046,050 | 0.98 | % | ¥ | 24,077,696 | 0.29 | % | ||||||||||||||||||||
|
Corporate bonds |
138,369 | 0.26 | 688,730 | 0.17 | 131,541 | 0.45 | 41,067 | 0.68 | 999,707 | 0.24 | ||||||||||||||||||||||||||||||
|
Other securities |
119,015 | 0.34 | 623,929 | 0.20 | 2,050,169 | 0.23 | 609,583 | 0.27 | 3,402,696 | 0.23 | ||||||||||||||||||||||||||||||
|
|
|
|
|
|
|
|
|
|
|
|
|
|
|
|
|
|
|
|
|
|||||||||||||||||||||
|
Total domestic |
11,809,997 | 0.11 | 8,695,618 | 0.26 | 4,277,784 | 0.36 | 3,696,700 | 0.85 | 28,480,099 | 0.28 | ||||||||||||||||||||||||||||||
|
|
|
|
|
|
|
|
|
|
|
|
|
|
|
|
|
|
|
|
|
|||||||||||||||||||||
|
Foreign: |
||||||||||||||||||||||||||||||||||||||||
|
U.S. Treasury and other U.S. government agencies bonds |
149,312 | 1.40 | 794,520 | 1.93 | 766,496 | 2.23 | — | — | 1,710,328 | 2.02 | ||||||||||||||||||||||||||||||
|
Other government and official institution bonds |
290,403 | 1.83 | 613,530 | 1.97 | 19,967 | 3.18 | 7,191 | 1.80 | 931,091 | 1.95 | ||||||||||||||||||||||||||||||
|
Mortgage-backed securities |
34 | — | 26,283 | 1.50 | 149,751 | 2.25 | 939,646 | 2.97 | 1,115,714 | 2.83 | ||||||||||||||||||||||||||||||
|
Other securities |
290,000 | 1.30 | 718,039 | 2.21 | 102,286 | 3.30 | 170,946 | 3.15 | 1,281,271 | 2.22 | ||||||||||||||||||||||||||||||
|
|
|
|
|
|
|
|
|
|
|
|
|
|
|
|
|
|
|
|
|
|||||||||||||||||||||
|
Total foreign |
729,749 | 1.53 | 2,152,372 | 2.03 | 1,038,500 | 2.36 | 1,117,783 | 2.99 | 5,038,404 | 2.24 | ||||||||||||||||||||||||||||||
|
|
|
|
|
|
|
|
|
|
|
|
|
|
|
|
|
|
|
|
|
|||||||||||||||||||||
|
Total |
¥ | 12,539,746 | 0.19 | % | ¥ | 10,847,990 | 0.61 | % | ¥ | 5,316,284 | 0.76 | % | ¥ | 4,814,483 | 1.37 | % | ¥ | 33,518,503 | 0.58 | % | ||||||||||||||||||||
|
|
|
|
|
|
|
|
|
|
|
|
|
|
|
|
|
|
|
|
|
|||||||||||||||||||||
|
Held-to-maturity debt securities: |
||||||||||||||||||||||||||||||||||||||||
|
Domestic: |
||||||||||||||||||||||||||||||||||||||||
|
Japanese national government and Japanese government agency bonds |
¥ | — | — | % | ¥ | 199,816 | 0.60 | % | ¥ | 900,885 | 0.49 | % | ¥ | — | — | % | ¥ | 1,100,701 | 0.51 | % | ||||||||||||||||||||
|
|
|
|
|
|
|
|
|
|
|
|
|
|
|
|
|
|
|
|
|
|||||||||||||||||||||
|
Total domestic |
— | — | 199,816 | 0.60 | 900,885 | 0.49 | — | — | 1,100,701 | 0.51 | ||||||||||||||||||||||||||||||
|
|
|
|
|
|
|
|
|
|
|
|
|
|
|
|
|
|
|
|
|
|||||||||||||||||||||
|
Foreign: |
||||||||||||||||||||||||||||||||||||||||
|
U.S. Treasury and other U.S. government agencies bonds |
57,609 | 1.97 | 999 | 8.62 | 80,123 | 3.61 | — | — | 138,731 | 2.97 | ||||||||||||||||||||||||||||||
|
Mortgage-backed securities |
5,106 | 1.65 | 87,340 | 2.27 | 111,888 | 2.35 | 866,923 | 2.61 | 1,071,257 | 2.55 | ||||||||||||||||||||||||||||||
|
Asset-backed securities |
11,458 | 1.65 | 44,336 | 1.68 | 312,244 | 3.72 | 1,763,174 | 2.41 | 2,131,212 | 2.58 | ||||||||||||||||||||||||||||||
|
|
|
|
|
|
|
|
|
|
|
|
|
|
|
|
|
|
|
|
|
|||||||||||||||||||||
|
Total foreign |
74,173 | 1.90 | 132,675 | 2.12 | 504,255 | 3.40 | 2,630,097 | 2.48 | 3,341,200 | 2.59 | ||||||||||||||||||||||||||||||
|
|
|
|
|
|
|
|
|
|
|
|
|
|
|
|
|
|
|
|
|
|||||||||||||||||||||
|
Total |
¥ | 74,173 | 1.90 | % | ¥ | 332,491 | 1.21 | % | ¥ | 1,405,140 | 1.53 | % | ¥ | 2,630,097 | 2.48 | % | ¥ | 4,441,901 | 2.07 | % | ||||||||||||||||||||
|
|
|
|
|
|
|
|
|
|
|
|
|
|
|
|
|
|
|
|
|
|||||||||||||||||||||
Other than U.S. Treasury and other U.S. government agencies bonds and Japanese national government bonds, none of the individual issuers held in our investment securities portfolio exceeded 10% of the consolidated total Mitsubishi UFJ Financial Group shareholders’ equity at March 31, 2019.
A-7
Table of Contents
| III. | Loan Portfolio |
The following table shows our loans outstanding, before deduction of allowance for credit losses, by domicile and industry of the borrower at March 31 for each of the five fiscal years ended March 31, 2019. Classification of loans by industry is based on the industry segment loan classification as defined by the Bank of Japan for regulatory reporting purposes and is not necessarily based on the use of proceeds:
| At March 31, | ||||||||||||||||||||
| 2015 | 2016 | 2017 | 2018 | 2019 | ||||||||||||||||
| (in millions) | ||||||||||||||||||||
|
Domestic: |
||||||||||||||||||||
|
Manufacturing |
¥ | 11,703,428 | ¥ | 12,158,642 | ¥ | 11,796,803 | ¥ | 10,876,625 | ¥ | 11,153,996 | ||||||||||
|
Construction |
977,892 | 913,180 | 819,262 | 781,262 | 717,664 | |||||||||||||||
|
Real estate |
10,911,240 | 11,175,130 | 11,622,372 | 11,763,769 | 11,706,419 | |||||||||||||||
|
Services |
2,684,355 | 2,503,446 | 2,549,300 | 2,689,086 | 2,653,191 | |||||||||||||||
|
Wholesale and retail |
8,345,481 | 7,891,364 | 7,970,579 | 7,989,080 | 7,643,397 | |||||||||||||||
|
Banks and other financial institutions (1) |
4,329,964 | 5,146,932 | 5,223,906 | 4,818,364 | 5,213,020 | |||||||||||||||
|
Communication and information services |
1,527,811 | 1,509,858 | 1,634,584 | 1,551,533 | 1,510,596 | |||||||||||||||
|
Other industries |
12,674,004 | 14,739,826 | 8,898,712 | 8,939,291 | 8,756,483 | |||||||||||||||
|
Consumer |
16,720,590 | 16,397,560 | 16,491,010 | 16,287,332 | 15,802,024 | |||||||||||||||
|
|
|
|
|
|
|
|
|
|
|
|||||||||||
|
Total domestic |
69,874,765 | 72,435,938 | 67,006,528 | 65,696,342 | 65,156,790 | |||||||||||||||
|
|
|
|
|
|
|
|
|
|
|
|||||||||||
|
Foreign: |
||||||||||||||||||||
|
Governments and official institutions |
1,052,051 | 1,125,031 | 1,037,795 | 920,538 | 841,695 | |||||||||||||||
|
Banks and other financial institutions (1) |
11,973,021 | 13,654,335 | 13,844,964 | 12,851,570 | 11,641,373 | |||||||||||||||
|
Commercial and industrial |
29,593,255 | 30,056,474 | 30,279,641 | 30,591,173 | 31,951,169 | |||||||||||||||
|
Other |
6,065,782 | 5,818,747 | 6,334,551 | 7,270,928 | 7,597,502 | |||||||||||||||
|
|
|
|
|
|
|
|
|
|
|
|||||||||||
|
Total foreign |
48,684,109 | 50,654,587 | 51,496,951 | 51,634,209 | 52,031,739 | |||||||||||||||
|
|
|
|
|
|
|
|
|
|
|
|||||||||||
|
Total |
118,558,874 | 123,090,525 | 118,503,479 | 117,330,551 | 117,188,529 | |||||||||||||||
|
Unearned income, unamortized premiums—net and deferred loan fees—net |
(293,672 | ) | (299,567 | ) | (288,507 | ) | (294,656 | ) | (304,588 | ) | ||||||||||
|
|
|
|
|
|
|
|
|
|
|
|||||||||||
|
Total (2) |
¥ | 118,265,202 | ¥ | 122,790,958 | ¥ | 118,214,972 | ¥ | 117,035,895 | ¥ | 116,883,941 | ||||||||||
|
|
|
|
|
|
|
|
|
|
|
|||||||||||
Notes:
| (1) | Loans to so-called “non-bank finance companies” are generally included in the “Banks and other financial institutions” category. Non-bank finance companies are primarily engaged in consumer lending, factoring and credit card businesses. |
| (2) | The above table includes loans held for sale of ¥88,927 million, ¥100,889 million, ¥185,940 million, ¥226,923 million and ¥291,794 million at March 31, 2015, 2016, 2017, 2018 and 2019, respectively, which are carried at the lower of cost or fair value. |
A-8
Table of Contents
Maturities and Sensitivities of Loans to Changes in Interest Rates
The following table shows the maturities of our loan portfolio at March 31, 2019:
| Maturity | ||||||||||||||||
| One year or less | One to five years | Over five years | Total | |||||||||||||
| (in millions) | ||||||||||||||||
|
Domestic: |
||||||||||||||||
|
Manufacturing |
¥ | 6,212,225 | ¥ | 3,356,894 | ¥ | 1,584,877 | ¥ | 11,153,996 | ||||||||
|
Construction |
396,243 | 225,160 | 96,261 | 717,664 | ||||||||||||
|
Real estate |
2,828,822 | 4,000,616 | 4,876,981 | 11,706,419 | ||||||||||||
|
Services |
1,151,797 | 1,044,960 | 456,434 | 2,653,191 | ||||||||||||
|
Wholesale and retail |
5,430,996 | 1,735,157 | 477,244 | 7,643,397 | ||||||||||||
|
Banks and other financial institutions |
3,374,489 | 1,218,358 | 620,173 | 5,213,020 | ||||||||||||
|
Communication and information services |
328,360 | 751,835 | 430,401 | 1,510,596 | ||||||||||||
|
Other industries |
5,563,384 | 1,994,653 | 1,198,446 | 8,756,483 | ||||||||||||
|
Consumer |
2,166,861 | 3,008,857 | 10,626,306 | 15,802,024 | ||||||||||||
|
|
|
|
|
|
|
|
|
|||||||||
|
Total Domestic |
27,453,177 | 17,336,490 | 20,367,123 | 65,156,790 | ||||||||||||
|
|
|
|
|
|
|
|
|
|||||||||
|
Foreign |
20,923,818 | 18,992,979 | 12,114,942 | 52,031,739 | ||||||||||||
|
|
|
|
|
|
|
|
|
|||||||||
|
Total |
¥ | 48,376,995 | ¥ | 36,329,469 | ¥ | 32,482,065 | ¥ | 117,188,529 | ||||||||
|
|
|
|
|
|
|
|
|
|||||||||
The above loans due after one year which had predetermined interest rates and floating or adjustable interest rates at March 31, 2019 are shown below:
| Domestic | Foreign | Total | ||||||||||
| (in millions) | ||||||||||||
|
Predetermined rate |
¥ | 17,217,580 | ¥ | 4,668,477 | ¥ | 21,886,057 | ||||||
|
Floating or adjustable rate |
20,486,033 | 26,439,444 | 46,925,477 | |||||||||
|
|
|
|
|
|
|
|||||||
|
Total |
¥ | 37,703,613 | ¥ | 31,107,921 | ¥ | 68,811,534 | ||||||
|
|
|
|
|
|
|
|||||||
Nonaccrual, Past Due and Restructured Loans
We generally discontinue the accrual of interest income on loans when substantial doubt exists as to the full and timely collection of either principal or interest, when principal or interest is contractually past due one month or more with respect to loans within all classes of the Commercial segment, three months or more with respect to loans within the Card, MUFG Americas Holdings, and Krungsri segments, and six months or more with respect to loans within the Residential segment.
Generally, accruing loans that are modified in a troubled debt restructuring (“TDR”) remain as accruing loans subsequent to the modification, and nonaccrual loans remain as nonaccrual. However, if a nonaccrual loan has been restructured as a TDR, the borrower is not delinquent under the restructured terms, and demonstrates that its financial condition has improved, we may reclassify the loan to accrual status. This determination is generally performed at least once a year through a detailed internal credit rating review process. Once a nonaccrual loan is deemed to be a TDR, we will continue to designate the loan as a TDR even if the loan is reclassified to accrual status.
A-9
Table of Contents
The following table shows the distribution of our nonaccrual loans, restructured loans and accruing loans which are contractually past due 90 days or more as to principal or interest payments at March 31 of each of the five fiscal years ended March 31, 2019, based on the domicile and type of industry of the borrowers:
| At March 31, | ||||||||||||||||||||
| 2015 | 2016 | 2017 | 2018 | 2019 | ||||||||||||||||
| (in millions) | ||||||||||||||||||||
|
Nonaccrual loans: |
||||||||||||||||||||
|
Domestic: |
||||||||||||||||||||
|
Manufacturing |
¥ | 119,052 | ¥ | 372,875 | ¥ | 185,124 | ¥ | 77,188 | ¥ | 65,921 | ||||||||||
|
Construction |
20,150 | 15,256 | 15,248 | 10,922 | 9,877 | |||||||||||||||
|
Real estate |
85,625 | 66,210 | 50,142 | 37,853 | 26,513 | |||||||||||||||
|
Services |
54,801 | 41,056 | 38,977 | 31,733 | 27,115 | |||||||||||||||
|
Wholesale and retail |
158,454 | 132,858 | 131,545 | 108,639 | 94,990 | |||||||||||||||
|
Banks and other financial institutions |
5,715 | 675 | 2,432 | 1,145 | 898 | |||||||||||||||
|
Communication and information services |
23,204 | 20,270 | 18,711 | 13,815 | 11,955 | |||||||||||||||
|
Other industries |
19,094 | 29,715 | 10,352 | 37,677 | 26,110 | |||||||||||||||
|
Consumer |
199,665 | 174,106 | 161,680 | 149,491 | 143,668 | |||||||||||||||
|
|
|
|
|
|
|
|
|
|
|
|||||||||||
|
Total domestic |
685,760 | 853,021 | 614,211 | 468,463 | 407,047 | |||||||||||||||
|
|
|
|
|
|
|
|
|
|
|
|||||||||||
|
Foreign: |
||||||||||||||||||||
|
Governments and official institutions |
40 | 132 | — | — | — | |||||||||||||||
|
Banks and other financial institutions |
7,372 | 14,337 | 5,902 | 1,716 | 1,160 | |||||||||||||||
|
Commercial and industrial |
144,609 | 264,163 | 301,685 | 215,601 | 219,669 | |||||||||||||||
|
Other |
75,916 | 68,514 | 64,834 | 67,869 | 78,780 | |||||||||||||||
|
|
|
|
|
|
|
|
|
|
|
|||||||||||
|
Total foreign |
227,937 | 347,146 | 372,421 | 285,186 | 299,609 | |||||||||||||||
|
|
|
|
|
|
|
|
|
|
|
|||||||||||
|
Total |
¥ | 913,697 | ¥ | 1,200,167 | ¥ | 986,632 | ¥ | 753,649 | ¥ | 706,656 | ||||||||||
|
|
|
|
|
|
|
|
|
|
|
|||||||||||
|
Restructured loans: |
||||||||||||||||||||
|
Domestic |
¥ | 735,348 | ¥ | 459,294 | ¥ | 682,041 | ¥ | 557,368 | ¥ | 511,151 | ||||||||||
|
Foreign |
144,089 | 166,240 | 158,784 | 137,674 | 127,931 | |||||||||||||||
|
|
|
|
|
|
|
|
|
|
|
|||||||||||
|
Total |
¥ | 879,437 | ¥ | 625,534 | ¥ | 840,825 | ¥ | 695,042 | ¥ | 639,082 | ||||||||||
|
|
|
|
|
|
|
|
|
|
|
|||||||||||
|
Accruing loans contractually past due 90 days or more: |
||||||||||||||||||||
|
Domestic |
¥ | 48,050 | ¥ | 47,919 | ¥ | 37,650 | ¥ | 17,356 | ¥ | 13,621 | ||||||||||
|
Foreign (1) |
360 | 314 | 3,430 | 2,408 | 2,778 | |||||||||||||||
|
|
|
|
|
|
|
|
|
|
|
|||||||||||
|
Total |
¥ | 48,410 | ¥ | 48,233 | ¥ | 41,080 | ¥ | 19,764 | ¥ | 16,399 | ||||||||||
|
|
|
|
|
|
|
|
|
|
|
|||||||||||
|
Total (2) |
¥ | 1,841,544 | ¥ | 1,873,934 | ¥ | 1,868,537 | ¥ | 1,468,455 | ¥ | 1,362,137 | ||||||||||
|
|
|
|
|
|
|
|
|
|
|
|||||||||||
Notes:
| (1) | Foreign accruing loans contractually past due 90 days or more do not include ¥5,666 million, ¥1,930 million, ¥1,514 million, ¥549 million and ¥234 million of Federal Deposit Insurance Corporation (“FDIC”) covered loans held by MUFG Americas Holdings which are subject to the guidance on loans and debt securities acquired with deteriorated credit quality at March 31, 2015, 2016, 2017, 2018 and 2019, respectively. |
| (2) | The sum of nonaccrual loans, restructured loans and accruing loans contractually past due 90 days or more includes large groups of smaller-balance homogenous loans that have not been modified and are collectively evaluated for impairment, and accruing loans contractually past due 90 days or more. However, these loans are excluded from the impaired loan balances of ¥1,331,123 million and ¥1,209,791 million, at March 31, 2018 and 2019, respectively, disclosed in Note 4 to our consolidated financial statements included elsewhere in this Annual Report. |
Gross interest income which would have been accrued at the original terms on domestic nonaccrual and restructured loans outstanding during the fiscal year ended March 31, 2019 was approximately ¥33.8 billion, of which ¥16.3 billion was included in the results of operations for the fiscal year. Gross interest income which would have been accrued at the original terms on foreign nonaccrual and restructured loans outstanding for the fiscal year ended March 31, 2019 was approximately ¥29.9 billion, of which ¥15.9 billion was included in the results of operations for the fiscal year.
A-10
Table of Contents
Potential Problem Loans
We do not have potential problem loans where known information about possible credit problems of borrowers causes management to have serious doubts as to the borrowers’ ability to comply with the present loan repayment terms that are not disclosed as nonaccrual loans, restructured loans and accruing loans past due 90 days or more.
Foreign Loans Outstanding
We had no cross-border outstandings to borrowers domiciled in a foreign country which in total exceeded 0.75% of our consolidated total assets at March 31, 2017, 2018 and 2019. Cross-border outstandings are defined, for this purpose, as loans (including accrued interest), acceptances, interest-earning deposits with other banks, other interest-earning investments and any other monetary assets denominated in Japanese yen or other non-local currencies. Material local currency loans outstanding which are neither hedged nor funded by local currency borrowings are included in cross-border outstandings.
Guarantees of outstandings to borrowers domiciled in other countries are considered to be outstandings of the guarantor. Loans made to, or deposits placed with, a branch of a foreign bank located outside the foreign bank’s home country are considered to be loans to, or deposits with, the foreign bank. Outstandings of a country do not include principal or interest amounts which are supported by written, legally enforceable guarantees by guarantors of other countries or the amounts of outstandings to the extent that they are secured by tangible, liquid collateral held and realizable by MUFG Bank, Mitsubishi UFJ Trust and Banking and their subsidiaries outside the country in which they operate.
In addition to credit risk, cross-border outstandings are subject to country risk that as a result of political or economic conditions in a country, borrowers may be unable or unwilling to pay principal and interest according to contractual terms. Other risks related to cross-border outstandings include the possibility of insufficient foreign exchange and restrictions on its availability.
In order to manage country risk, we establish various risk management measures internally. Among other things, we regularly monitor economic conditions and other factors globally and assess country risk in each country where we have cross-border exposure. For the purposes of monitoring and controlling the amount of credit exposed to country risk, we set a country limit, the maximum amount of credit exposure for an individual country, in consideration of the level of country risk and our ability to bear such potential risk. We also determine our credit policy for each country in accordance with our country risk level and our business plan with regard to the country. The assessment of country risk, establishment of country limits, and determination of country credit policies are subject to review and approval by our senior management and are updated periodically.
Loan Concentrations
At March 31, 2019, there were no concentrations of loans to a single industry group of borrowers, as defined by the Bank of Japan industry segment loan classifications, which exceeded 10 % of our consolidated total loans, except for loans in a category disclosed in the table of loans outstanding above.
Credit Risk Management
We have a credit rating system, under which borrowers and transactions are graded on a worldwide basis. We calculate probability of default by statistical means and manage our credit portfolio based on this credit rating system. For a detailed description of this system and other elements of our risk management structure, see “Item 11. Quantitative and Qualitative Disclosures about Credit, Market and Other Risk—Credit Risk Management.”
A-11
Table of Contents
| IV. | Summary of Loan Loss Experience |
The following table shows an analysis of our loan loss experience by industry of the borrower for each of the five fiscal years ended March 31, 2019:
| Fiscal years ended March 31, | ||||||||||||||||||||
| 2015 | 2016 | 2017 | 2018 | 2019 | ||||||||||||||||
| (in millions, except percentages) | ||||||||||||||||||||
|
Allowance for credit losses at beginning of fiscal year |
¥ | 1,094,420 | ¥ | 1,055,479 | ¥ | 1,111,130 | ¥ | 1,182,188 | ¥ | 764,124 | ||||||||||
|
Provision for (reversal of) credit losses |
86,998 | 231,862 | 253,688 | (240,847 | ) | 34,330 | ||||||||||||||
|
Charge-offs: |
||||||||||||||||||||
|
Domestic: |
||||||||||||||||||||
|
Manufacturing |
28,413 | 50,813 | 30,549 | 10,621 | 10,525 | |||||||||||||||
|
Construction |
2,066 | 1,617 | 647 | 789 | 992 | |||||||||||||||
|
Real estate |
8,571 | 1,857 | 2,318 | 1,305 | 619 | |||||||||||||||
|
Services |
9,447 | 5,102 | 5,225 | 1,867 | 4,207 | |||||||||||||||
|
Wholesale and retail |
37,477 | 32,910 | 17,402 | 20,979 | 20,901 | |||||||||||||||
|
Banks and other financial institutions |
745 | 35 | — | 650 | 2,523 | |||||||||||||||
|
Communication and information services |
3,668 | 1,173 | 2,903 | 1,254 | 11,309 | |||||||||||||||
|
Other industries |
3,158 | 953 | 767 | 29,839 | 2,758 | |||||||||||||||
|
Consumer |
27,148 | 15,847 | 22,877 | 26,786 | 24,795 | |||||||||||||||
|
|
|
|
|
|
|
|
|
|
|
|||||||||||
|
Total domestic |
120,693 | 110,307 | 82,688 | 94,090 | 78,629 | |||||||||||||||
|
Total foreign |
56,468 | 88,464 | 131,070 | 138,019 | 95,412 | |||||||||||||||
|
|
|
|
|
|
|
|
|
|
|
|||||||||||
|
Total |
177,161 | 198,771 | 213,758 | 232,109 | 174,041 | |||||||||||||||
|
|
|
|
|
|
|
|
|
|
|
|||||||||||
|
Recoveries: |
||||||||||||||||||||
|
Domestic |
22,083 | 22,357 | 21,954 | 22,261 | 15,467 | |||||||||||||||
|
Foreign |
4,412 | 19,455 | 21,995 | 28,849 | 28,650 | |||||||||||||||
|
|
|
|
|
|
|
|
|
|
|
|||||||||||
|
Total |
26,495 | 41,812 | 43,949 | 51,110 | 44,117 | |||||||||||||||
|
|
|
|
|
|
|
|
|
|
|
|||||||||||
|
Net charge-offs |
150,666 | 156,959 | 169,809 | 180,999 | 129,924 | |||||||||||||||
|
Others (1) |
24,727 | (19,252 | ) | (12,821 | ) | 3,782 | (10,346 | ) | ||||||||||||
|
|
|
|
|
|
|
|
|
|
|
|||||||||||
|
Allowance for credit losses at end of fiscal year |
¥ | 1,055,479 | ¥ | 1,111,130 | ¥ | 1,182,188 | ¥ | 764,124 | ¥ | 658,184 | ||||||||||
|
|
|
|
|
|
|
|
|
|
|
|||||||||||
|
Allowance for credit losses applicable to foreign activities: |
||||||||||||||||||||
|
Balance at beginning of fiscal year |
¥ | 184,460 | ¥ | 267,293 | ¥ | 416,221 | ¥ | 387,250 | ¥ | 303,719 | ||||||||||
|
|
|
|
|
|
|
|
|
|
|
|||||||||||
|
Balance at end of fiscal year |
¥ | 267,293 | ¥ | 416,221 | ¥ | 387,250 | ¥ | 303,719 | ¥ | 303,867 | ||||||||||
|
|
|
|
|
|
|
|
|
|
|
|||||||||||
|
Provision for credit losses |
¥ | 110,494 | ¥ | 237,189 | ¥ | 92,689 | ¥ | 21,889 | ¥ | 77,338 | ||||||||||
|
|
|
|
|
|
|
|
|
|
|
|||||||||||
|
Ratio of net charge-offs during the fiscal year to average loans outstanding during the fiscal year |
0.13 | % | 0.13 | % | 0.14 | % | 0.15 | % | 0.11 | % | ||||||||||
Note:
| (1) | Others principally include losses (gains) from foreign exchange translation. |
A-12
Table of Contents
The following table shows an allocation of our allowance for credit losses at March 31 for each of the five fiscal years ended March 31, 2019:
| At March 31, | ||||||||||||||||||||||||||||||||||||||||
| 2015 | 2016 | 2017 | 2018 | 2019 | ||||||||||||||||||||||||||||||||||||
| Amount |
% of
loans in each category to total loans |
Amount |
% of
loans in each category to total loans |
Amount |
% of
loans in each category to total loans |
Amount |
% of
loans in each category to total loans |
Amount |
% of
loans in each category to total loans |
|||||||||||||||||||||||||||||||
| (in millions, except percentages) | ||||||||||||||||||||||||||||||||||||||||
|
Domestic: |
||||||||||||||||||||||||||||||||||||||||
|
Manufacturing |
¥ | 240,013 | 9.87 | % | ¥ | 321,412 | 9.88 | % | ¥ | 409,018 | 9.95 | % | ¥ | 179,799 | 9.27 | % | ¥ | 108,463 | 9.52 | % | ||||||||||||||||||||
|
Construction |
17,318 | 0.82 | 9,813 | 0.74 | 12,097 | 0.69 | 7,934 | 0.67 | 6,856 | 0.61 | ||||||||||||||||||||||||||||||
|
Real estate |
70,423 | 9.20 | 31,960 | 9.08 | 33,579 | 9.81 | 21,062 | 10.03 | 15,664 | 9.99 | ||||||||||||||||||||||||||||||
|
Services |
51,760 | 2.26 | 34,430 | 2.03 | 42,023 | 2.15 | 29,518 | 2.29 | 24,473 | 2.26 | ||||||||||||||||||||||||||||||
|
Wholesale and retail |
164,729 | 7.04 | 116,450 | 6.41 | 138,119 | 6.73 | 99,985 | 6.81 | 93,112 | 6.52 | ||||||||||||||||||||||||||||||
|
Banks and other financial institutions |
30,597 | 3.65 | 12,840 | 4.18 | 14,732 | 4.41 | 7,636 | 4.11 | 6,198 | 4.45 | ||||||||||||||||||||||||||||||
|
Communication and information services |
20,130 | 1.29 | 14,371 | 1.23 | 13,902 | 1.38 | 17,300 | 1.32 | 8,327 | 1.29 | ||||||||||||||||||||||||||||||
|
Other industries |
64,443 | 10.69 | 48,870 | 11.97 | 25,156 | 7.50 | 13,543 | 7.62 | 15,398 | 7.47 | ||||||||||||||||||||||||||||||
|
Consumer |
126,362 | 14.11 | 102,351 | 13.33 | 106,312 | 13.92 | 80,238 | 13.88 | 75,271 | 13.49 | ||||||||||||||||||||||||||||||
|
Foreign: |
||||||||||||||||||||||||||||||||||||||||
|
Governments and official institutions |
25,136 | 0.89 | 22,950 | 0.91 | 25,098 | 0.88 | 751 | 0.78 | 367 | 0.72 | ||||||||||||||||||||||||||||||
|
Banks and other financial institutions |
18,325 | 10.10 | 24,471 | 11.09 | 20,717 | 11.68 | 10,452 | 10.95 | 6,970 | 9.93 | ||||||||||||||||||||||||||||||
|
Commercial and industrial |
176,823 | 24.96 | 307,050 | 24.42 | 263,429 | 25.55 | 197,653 | 26.07 | 196,237 | 27.27 | ||||||||||||||||||||||||||||||
|
Other |
47,009 | 5.12 | 61,750 | 4.73 | 78,006 | 5.35 | 94,863 | 6.20 | 100,293 | 6.48 | ||||||||||||||||||||||||||||||
|
Unallocated |
2,411 | — | 2,412 | — | — | — | 3,390 | — | 555 | — | ||||||||||||||||||||||||||||||
|
|
|
|
|
|
|
|
|
|
|
|
|
|
|
|
|
|
|
|
|
|||||||||||||||||||||
|
Total |
¥ | 1,055,479 | 100.00 | % | ¥ | 1,111,130 | 100.00 | % | ¥ | 1,182,188 | 100.00 | % | ¥ | 764,124 | 100.00 | % | ¥ | 658,184 | 100.00 | % | ||||||||||||||||||||
|
|
|
|
|
|
|
|
|
|
|
|
|
|
|
|
|
|
|
|
|
|||||||||||||||||||||
|
Allowance as a percentage of loans |
0.89 | % | 0.90 | % | 1.00 | % | 0.65 | % | 0.56 | % | ||||||||||||||||||||||||||||||
|
Allowance as a percentage of nonaccrual loans, restructured loans and accruing loans contractually past due 90 days or more |
57.31 | % | 59.29 | % | 63.27 | % | 52.04 | % | 48.32 | % | ||||||||||||||||||||||||||||||
While the allowance for credit losses contains amounts allocated to components of specifically identified loans as well as a group on a portfolio of loans, the allowance for credit losses covers the credit losses of the entire loan portfolio and the allocations shown above are not intended to be restricted to the specific loan category. Accordingly, as the evaluation of credit risk changes, allocations of the allowance will be adjusted to reflect current conditions and various other factors.
A-13
Table of Contents
| V. | Deposits |
The following table shows the average amount of, and the average rate paid on, the following deposit categories for the fiscal years ended March 31, 2017, 2018 and 2019:
| Fiscal years ended March 31, | ||||||||||||||||||||||||
| 2017 | 2018 | 2019 | ||||||||||||||||||||||
|
Average
amount |
Average
rate |
Average
amount |
Average
rate |
Average
amount |
Average
rate |
|||||||||||||||||||
| (in millions, except percentages) | ||||||||||||||||||||||||
|
Domestic offices: |
||||||||||||||||||||||||
|
Non-interest-bearing demand deposits |
¥ | 20,034,315 | — | % | ¥ | 22,701,413 | — | % | ¥ | 24,429,358 | — | % | ||||||||||||
|
Interest-bearing demand deposits |
69,961,568 | 0.02 | 76,104,436 | 0.03 | 80,318,814 | 0.05 | ||||||||||||||||||
|
Deposits at notice |
1,704,160 | 0.00 | 1,773,780 | 0.00 | 1,658,467 | 0.01 | ||||||||||||||||||
|
Time deposits |
41,782,117 | 0.08 | 41,501,996 | 0.08 | 40,670,338 | 0.07 | ||||||||||||||||||
|
Certificates of deposit |
3,708,639 | 0.02 | 3,760,848 | 0.01 | 2,014,290 | 0.01 | ||||||||||||||||||
|
Foreign offices: |
||||||||||||||||||||||||
|
Non-interest-bearing demand deposits |
5,636,431 | — | 5,477,038 | — | 5,356,424 | — | ||||||||||||||||||
|
Interest-bearing deposits, principally time deposits and certificates of deposit |
38,411,021 | 0.79 | 41,421,717 | 1.10 | 41,945,626 | 1.55 | ||||||||||||||||||
|
|
|
|
|
|
|
|||||||||||||||||||
|
Total |
¥ | 181,238,251 | ¥ | 192,741,228 | ¥ | 196,393,317 | ||||||||||||||||||
|
|
|
|
|
|
|
|||||||||||||||||||
Deposits at notice represent interest-bearing demand deposits which require the depositor to give two or more days notice in advance of withdrawal.
The average amounts of total deposits by foreign depositors included in domestic offices for the fiscal years ended March 31, 2017, 2018 and 2019 were ¥886,274 million, ¥882,772 million and ¥820,311 million, respectively.
At March 31, 2019, the balances and remaining maturities of time deposits and certificates of deposit (“CDs”) issued by domestic offices in amounts of ¥10 million (approximately U.S.$90 thousand at the Federal Reserve Bank of New York’s noon buying rate on March 29, 2019) or more and total foreign deposits issued in amounts of U.S.$100,000 or more are shown in the following table:
|
Time
deposits |
Certificates of
deposit |
Total | ||||||||||
| (in millions) | ||||||||||||
|
Domestic offices: |
||||||||||||
|
Three months or less |
¥ | 6,329,422 | ¥ | 1,427,695 | ¥ | 7,757,117 | ||||||
|
Over three months through six months |
4,038,389 | 146,870 | 4,185,259 | |||||||||
|
Over six months through twelve months |
10,298,134 | 148,671 | 10,446,805 | |||||||||
|
Over twelve months |
3,439,282 | 71,317 | 3,510,599 | |||||||||
|
|
|
|
|
|
|
|||||||
|
Total |
¥ | 24,105,227 | ¥ | 1,794,553 | ¥ | 25,899,780 | ||||||
|
|
|
|
|
|
|
|||||||
|
Foreign offices |
¥ | 23,858,381 | ||||||||||
|
|
|
|||||||||||
A-14
Table of Contents
| VI | Short-Term Borrowings |
The following table shows certain additional information with respect to our short-term borrowings for the fiscal years ended March 31, 2017, 2018 and 2019:
| Fiscal years ended March 31, | ||||||||||||
| 2017 | 2018 | 2019 | ||||||||||
| (in millions, except percentages) | ||||||||||||
|
Call money, funds purchased, and payables under repurchase agreements and securities lending transactions: |
||||||||||||
|
Average balance outstanding during the fiscal year |
¥ | 32,789,499 | ¥ | 28,052,275 | ¥ | 26,406,493 | ||||||
|
Maximum balance outstanding at any month-end during the fiscal year |
32,927,067 | 28,757,355 | 31,395,497 | |||||||||
|
Balance at end of fiscal year |
25,217,396 | 28,757,355 | 28,588,039 | |||||||||
|
Weighted average interest rate during the fiscal year |
0.31 | % | 0.61 | % | 1.28 | % | ||||||
|
Weighted average interest rate on balance at end of fiscal year |
0.27 | % | 0.61 | % | 1.13 | % | ||||||
|
Due to trust account: |
||||||||||||
|
Average balance outstanding during the fiscal year |
¥ | 3,122,190 | ¥ | 3,065,511 | ¥ | 3,062,655 | ||||||
|
Maximum balance outstanding at any month-end during the fiscal year |
4,099,102 | 3,386,158 | 3,531,717 | |||||||||
|
Balance at end of fiscal year |
3,335,155 | 3,386,158 | 2,735,952 | |||||||||
|
Weighted average interest rate during the fiscal year |
0.01 | % | 0.00 | % | 0.00 | % | ||||||
|
Weighted average interest rate on balance at end of fiscal year |
0.00 | % | 0.00 | % | 0.00 | % | ||||||
|
Other short-term borrowings: |
||||||||||||
|
Average balance outstanding during the fiscal year |
¥ | 6,527,129 | ¥ | 7,491,384 | ¥ | 6,812,706 | ||||||
|
Maximum balance outstanding at any month-end during the fiscal year |
7,969,521 | 8,705,257 | 7,588,971 | |||||||||
|
Balance at end of fiscal year |
7,969,521 | 6,881,124 | 6,731,073 | |||||||||
|
Weighted average interest rate during the fiscal year |
0.58 | % | 0.92 | % | 1.82 | % | ||||||
|
Weighted average interest rate on balance at end of fiscal year |
0.66 | % | 1.29 | % | 1.97 | % | ||||||
A-15
Table of Contents
CONSOLIDATED FINANCIAL STATEMENTS
| Page | ||||
| F-3 | ||||
| F-4 | ||||
|
Consolidated Statements of Income for the Fiscal Years ended March 31, 2017, 2018 and 2019 |
F-6 | |||
| F-8 | ||||
|
Consolidated Statements of Equity for the Fiscal Years ended March 31, 2017, 2018 and 2019 |
F-9 | |||
|
Consolidated Statements of Cash Flows for the Fiscal Years ended March 31, 2017, 2018 and 2019 |
F-11 | |||
| F-13 | ||||
|
1. Basis of Financial Statements and Summary of Significant Accounting Policies |
F-13 | |||
| F-33 | ||||
| F-36 | ||||
| F-44 | ||||
| F-62 | ||||
| F-63 | ||||
| F-66 | ||||
| F-70 | ||||
| F-72 | ||||
| F-72 | ||||
| F-73 | ||||
| F-73 | ||||
| F-76 | ||||
| F-88 | ||||
|
15. Offsetting of Derivatives, Repurchase Agreements, and Securities Lending Transactions |
F-90 | |||
|
16. Repurchase Agreements, and Securities Lending Transactions Accounted for as Secured Borrowings |
F-91 | |||
| F-93 | ||||
| F-93 | ||||
| F-95 | ||||
| F-97 | ||||
| F-101 | ||||
| F-102 | ||||
|
23. Earnings per Common Share Applicable to Common Shareholders of MUFG |
F-109 | |||
| F-109 | ||||
|
25. Obligations Under Guarantees and Other Off-balance Sheet Instruments |
F-116 | |||
| F-120 | ||||
| F-131 | ||||
| F-133 | ||||
| F-134 | ||||
| F-135 | ||||
| F-138 | ||||
| F-140 | ||||
| F-159 | ||||
| F-164 | ||||
| F-167 | ||||
F-1
Table of Contents
(This page is intentionally left blank)
F-2
Table of Contents
REPORT OF INDEPENDENT REGISTERED PUBLIC ACCOUNTING FIRM
To the Board of Directors and the Shareholders of
Mitsubishi UFJ Financial Group, Inc.
(Kabushiki Kaisha Mitsubishi UFJ Financial Group)
Opinion on the Financial Statements
We have audited the accompanying consolidated balance sheets of Mitsubishi UFJ Financial Group, Inc. (Kabushiki Kaisha Mitsubishi UFJ Financial Group) (“MUFG”) and subsidiaries (together, the “MUFG Group”) as of March 31, 2018 and 2019, the related consolidated statements of income, comprehensive income, equity and cash flows for each of the three years in the period ended March 31, 2019, and the related notes (collectively referred to as the “financial statements”) (all expressed in Japanese yen). In our opinion, the financial statements present fairly, in all material respects, the financial position of the MUFG Group as of March 31, 2018 and 2019, and the results of its operations and its cash flows for each of the three years in the period ended March 31, 2019, in conformity with accounting principles generally accepted in the United States of America.
We have also audited, in accordance with the standards of the Public Company Accounting Oversight Board (United States) (“PCAOB”), the MUFG Group’s internal control over financial reporting as of March 31, 2019, based on criteria established in Internal Control — Integrated Framework (2013) issued by the Committee of Sponsoring Organizations of the Treadway Commission and our report dated July 10, 2019, expressed an unqualified opinion on the MUFG Group’s internal control over financial reporting.
Change in Accounting Principle
As discussed in Note 1 to the financial statements, the MUFG Group has changed its method of accounting for unrealized holding gains and losses on equity investment securities on April 1, 2018 due to the adoption of Financial Accounting Standards Board Accounting Standards Update 2016-01, Financial Instruments—Overall (Subtopic 825-10)—Recognition and Measurement of Financial Assets and Financial Liabilities.
Basis for Opinion
These financial statements are the responsibility of the MUFG Group’s management. Our responsibility is to express an opinion on the MUFG Group’s financial statements based on our audits. We are a public accounting firm registered with the PCAOB and are required to be independent with respect to the MUFG Group in accordance with the U.S. federal securities laws and the applicable rules and regulations of the Securities and Exchange Commission and the PCAOB.
We conducted our audits in accordance with the standards of the PCAOB. Those standards require that we plan and perform the audit to obtain reasonable assurance about whether the financial statements are free of material misstatement, whether due to error or fraud. Our audits included performing procedures to assess the risks of material misstatement of the financial statements, whether due to error or fraud, and performing procedures that respond to those risks. Such procedures included examining, on a test basis, evidence regarding the amounts and disclosures in the financial statements. Our audits also included evaluating the accounting principles used and significant estimates made by management, as well as evaluating the overall presentation of the financial statements. We believe that our audits provide a reasonable basis for our opinion.
/s/ Deloitte Touche Tohmatsu LLC
Tokyo, Japan
July 10, 2019
We have served as the MUFG Group’s auditor since 1976.
F-3
Table of Contents
MITSUBISHI UFJ FINANCIAL GROUP, INC. AND SUBSIDIARIES
CONSOLIDATED BALANCE SHEETS
AS OF MARCH 31, 2018 AND 2019
| (in millions) | 2018 | 2019 | ||||||
|
ASSETS |
||||||||
|
Cash and due from banks (Note 8) |
¥ | 32,648,387 | ¥ | 33,924,340 | ||||
|
Interest-earning deposits in other banks (Note 8) |
43,209,662 | 40,646,920 | ||||||
|
|
|
|
|
|||||
|
Cash, due from banks and interest-earning deposits in other banks |
75,858,049 | 74,571,260 | ||||||
|
|
|
|
|
|||||
|
Call loans and funds sold |
896,360 | 1,109,995 | ||||||
|
Receivables under resale agreements (Note 15) |
5,725,921 | 10,974,740 | ||||||
|
Receivables under securities borrowing transactions (Note 15) |
9,268,756 | 2,758,573 | ||||||
|
Trading account assets (including assets pledged that secured parties are permitted to sell or repledge of ¥6,558,587 and ¥7,512,025 in 2018 and 2019) (including ¥15,007,706 and ¥18,597,303 measured at fair value under the fair value option in 2018 and 2019) (Notes 8, 15, 24 and 32) |
35,186,689 | 40,576,618 | ||||||
|
Investment securities (Notes 3, 8 and 32): |
||||||||
|
Available-for-sale debt securities (including assets pledged that secured parties are permitted to sell or repledge of ¥11,358,439 and ¥6,981,664 in 2018 and 2019) |
32,833,114 | 33,518,503 | ||||||
|
Held-to-maturity debt securities (including assets pledged that secured parties are permitted to sell or repledge of ¥414,857 and ¥160,828 in 2018 and 2019) (fair value of ¥3,620,672 and ¥4,452,947 in 2018 and 2019) |
3,582,941 | 4,441,901 | ||||||
|
Equity securities (including assets pledged that secured parties are permitted to sell or repledge of ¥1,650 and ¥1,364 in 2018 and 2019) (including ¥6,699,943 and ¥6,413,867 in 2018 and 2019 measured at fair value) |
7,238,194 | 6,977,600 | ||||||
|
|
|
|
|
|||||
|
Total investment securities |
43,654,249 | 44,938,004 | ||||||
|
|
|
|
|
|||||
|
Loans, net of unearned income, unamortized premiums and deferred loan fees (including assets pledged that secured parties are permitted to sell or repledge of ¥898,186 and ¥802,185 in 2018 and 2019) (Notes 4 and 8) |
117,035,895 | 116,883,941 | ||||||
|
Allowance for credit losses (Note 4) |
(764,124 | ) | (658,184 | ) | ||||
|
|
|
|
|
|||||
|
Net loans |
116,271,771 | 116,225,757 | ||||||
|
|
|
|
|
|||||
|
Premises and equipment—net (Note 5) |
1,013,588 | 973,600 | ||||||
|
Accrued interest |
324,624 | 359,648 | ||||||
|
Customers’ acceptance liability |
183,084 | 247,996 | ||||||
|
Intangible assets—net (Notes 2 and 6) |
1,011,119 | 927,196 | ||||||
|
Goodwill (Notes 2 and 6) |
441,334 | 433,891 | ||||||
|
Deferred tax assets (Note 7) |
68,704 | 89,719 | ||||||
|
Other assets (Notes 8, 13, 14 and 32) |
10,666,064 | 11,041,902 | ||||||
|
|
|
|
|
|||||
|
Total assets |
¥ | 300,570,312 | ¥ | 305,228,899 | ||||
|
|
|
|
|
|||||
|
Assets of consolidated VIEs included in total assets above that can be used only to settle obligations of consolidated VIEs (Note 26) |
||||||||
|
Cash and due from banks |
¥ | 130 | ¥ | 7 | ||||
|
Interest-earning deposits in other banks |
23,161 | 23,655 | ||||||
|
Trading account assets |
477,583 | 528,690 | ||||||
|
Investment securities |
1,952,683 | 1,828,194 | ||||||
|
Loans |
16,550,107 | 15,545,328 | ||||||
|
All other assets |
187,329 | 294,212 | ||||||
|
|
|
|
|
|||||
|
Total assets of consolidated VIEs |
¥ | 19,190,993 | ¥ | 18,220,086 | ||||
|
|
|
|
|
|||||
F-4
Table of Contents
MITSUBISHI UFJ FINANCIAL GROUP, INC. AND SUBSIDIARIES
CONSOLIDATED BALANCE SHEETS—(Continued)
AS OF MARCH 31, 2018 AND 2019
| (in millions, except shares) | 2018 | 2019 | ||||||
| LIABILITIES AND EQUITY | ||||||||
|
Deposits (Notes 8 and 9): |
||||||||
|
Domestic offices: |
||||||||
|
Non-interest-bearing |
¥ | 24,406,759 | ¥ | 25,222,218 | ||||
|
Interest-bearing |
125,195,310 | 124,859,036 | ||||||
|
Overseas offices: |
||||||||
|
Non-interest-bearing |
5,455,677 | 5,220,557 | ||||||
|
Interest-bearing |
40,616,847 | 43,978,978 | ||||||
|
|
|
|
|
|||||
|
Total deposits |
195,674,593 | 199,280,789 | ||||||
|
|
|
|
|
|||||
|
Call money and funds purchased (Notes 8 and 10) |
2,452,543 | 2,450,320 | ||||||
|
Payables under repurchase agreements (Notes 8, 15 and 16) |
18,134,594 | 25,224,632 | ||||||
|
Payables under securities lending transactions (Notes 8, 15 and 16) |
8,170,218 | 913,087 | ||||||
|
Due to trust account (Note 11) |
3,386,158 | 2,735,952 | ||||||
|
Other short-term borrowings (including ¥264,783 and ¥289,755 measured at fair value under the fair value option in 2018 and 2019) (Notes 8, 12 and 32) |
6,881,124 | 6,731,073 | ||||||
|
Trading account liabilities (Notes 15, 24 and 32) |
12,222,331 | 13,009,492 | ||||||
|
Obligations to return securities received as collateral (Notes 15, 16 and 32) |
3,176,962 | 3,087,026 | ||||||
|
Bank acceptances outstanding |
183,084 | 247,996 | ||||||
|
Accrued interest |
165,921 | 214,735 | ||||||
|
Long-term debt (including ¥333,985 and ¥325,808 measured at fair value under the fair value option in 2018 and 2019) (Notes 8, 12 and 32) |
27,069,556 | 27,990,543 | ||||||
|
Other liabilities (Notes 1, 7, 8, 13, 14 and 27) |
7,407,413 | 7,358,506 | ||||||
|
|
|
|
|
|||||
|
Total liabilities |
284,924,497 | 289,244,151 | ||||||
|
|
|
|
|
|||||
|
Commitments and contingent liabilities (Notes 25 and 27) |
||||||||
|
Mitsubishi UFJ Financial Group shareholders’ equity: |
||||||||
|
Capital stock (Notes 17 and 18)—common stock authorized, 33,000,000,000 shares; common stock issued, 13,900,028,020 shares and 13,667,770,520 shares at March 31, 2018 and 2019, with no stated value |
2,090,270 | 2,090,270 | ||||||
|
Capital surplus (Note 18) |
5,740,165 | 5,577,186 | ||||||
|
Retained earnings (Notes 19 and 35): |
||||||||
|
Appropriated for legal reserve |
239,571 | 239,571 | ||||||
|
Unappropriated retained earnings |
4,945,733 | 8,094,026 | ||||||
|
Accumulated other comprehensive income, net of taxes (Note 20) |
2,477,315 | (284,269 | ) | |||||
|
Treasury stock, at cost—737,772,882 common shares and 745,921,774 common shares at March 31, 2018 and 2019 |
(522,872 | ) | (517,236 | ) | ||||
|
|
|
|
|
|||||
|
Total Mitsubishi UFJ Financial Group shareholders’ equity |
14,970,182 | 15,199,548 | ||||||
|
Noncontrolling interests (Note 21) |
675,633 | 785,200 | ||||||
|
|
|
|
|
|||||
|
Total equity |
15,645,815 | 15,984,748 | ||||||
|
|
|
|
|
|||||
|
Total liabilities and equity |
¥ | 300,570,312 | ¥ | 305,228,899 | ||||
|
|
|
|
|
|||||
|
Liabilities of consolidated VIEs for which creditors or beneficial interest holders do not have recourse to the general credit of Mitsubishi UFJ Financial Group (Note 26) |
||||||||
|
Other short-term borrowings |
¥ | 28,451 | ¥ | 20,535 | ||||
|
Long-term debt |
510,948 | 490,033 | ||||||
|
All other liabilities |
84,040 | 62,146 | ||||||
|
|
|
|
|
|||||
|
Total liabilities of consolidated VIEs |
¥ | 623,439 | ¥ | 572,714 | ||||
|
|
|
|
|
|||||
See the accompanying notes to Consolidated Financial Statements.
F-5
Table of Contents
MITSUBISHI UFJ FINANCIAL GROUP, INC. AND SUBSIDIARIES
FOR THE FISCAL YEARS ENDED MARCH 31, 2017, 2018 AND 2019
| (in millions) | 2017 | 2018 | 2019 | |||||||||
|
Interest income: |
||||||||||||
|
Loans, including fees (Note 4) |
¥ | 2,023,649 | ¥ | 2,271,219 | ¥ | 2,576,417 | ||||||
|
Deposits in other banks |
78,735 | 126,608 | 183,327 | |||||||||
|
Investment securities: |
||||||||||||
|
Interest |
235,638 | 198,715 | 237,378 | |||||||||
|
Dividends |
135,506 | 145,186 | 160,825 | |||||||||
|
Trading account assets |
455,860 | 432,595 | 499,724 | |||||||||
|
Call loans and funds sold |
11,023 | 10,808 | 10,354 | |||||||||
|
Receivables under resale agreements and securities borrowing transactions |
50,356 | 73,885 | 145,354 | |||||||||
|
|
|
|
|
|
|
|||||||
|
Total |
2,990,767 | 3,259,016 | 3,813,379 | |||||||||
|
|
|
|
|
|
|
|||||||
|
Interest expense: |
||||||||||||
|
Deposits |
347,430 | 514,868 | 717,366 | |||||||||
|
Call money and funds purchased |
1,791 | 5,248 | 3,913 | |||||||||
|
Payables under repurchase agreements and securities lending transactions |
100,796 | 165,512 | 333,632 | |||||||||
|
Due to trust account |
207 | 109 | 124 | |||||||||
|
Other short-term borrowings and trading account liabilities |
61,137 | 93,535 | 155,149 | |||||||||
|
Long-term debt |
258,278 | 249,483 | 307,797 | |||||||||
|
|
|
|
|
|
|
|||||||
|
Total |
769,639 | 1,028,755 | 1,517,981 | |||||||||
|
|
|
|
|
|
|
|||||||
|
Net interest income |
2,221,128 | 2,230,261 | 2,295,398 | |||||||||
|
Provision for (reversal of) credit losses (Note 4) |
253,688 | (240,847 | ) | 34,330 | ||||||||
|
|
|
|
|
|
|
|||||||
|
Net interest income after provision for (reversal of) credit losses |
1,967,440 | 2,471,108 | 2,261,068 | |||||||||
|
|
|
|
|
|
|
|||||||
|
Non-interest income: |
||||||||||||
|
Fees and commissions income (Note 28) |
1,414,893 | 1,462,792 | 1,438,578 | |||||||||
|
Foreign exchange losses—net (Note 29) |
(134,885 | ) | (49,561 | ) | (95,987 | ) | ||||||
|
Trading account profits (losses)—net (Notes 29 and 32) |
(639,184 | ) | (73,114 | ) | 168,900 | |||||||
|
Investment securities gains (losses)—net (Note 3) (1)(2) |
281,158 | 286,903 | (252,307 | ) | ||||||||
|
Equity in earnings of equity method investees—net (Note 14) |
197,821 | 227,984 | 209,732 | |||||||||
|
Gains on sales of loans (Note 4) |
13,286 | 16,109 | 22,663 | |||||||||
|
Other non-interest income (Note 21) |
63,617 | 63,978 | 103,665 | |||||||||
|
|
|
|
|
|
|
|||||||
|
Total |
1,196,706 | 1,935,091 | 1,595,244 | |||||||||
|
|
|
|
|
|
|
|||||||
|
Non-interest expense: |
||||||||||||
|
Salaries and employee benefits (Note 13) |
1,139,677 | 1,165,357 | 1,175,405 | |||||||||
|
Occupancy expenses—net (Notes 5 and 27) |
176,819 | 179,100 | 179,780 | |||||||||
|
Fees and commissions expenses |
273,675 | 297,847 | 313,745 | |||||||||
|
Outsourcing expenses, including data processing |
258,345 | 276,236 | 275,052 | |||||||||
|
Depreciation of premises and equipment (Note 5) |
99,774 | 96,180 | 98,867 | |||||||||
|
Amortization of intangible assets (Note 6) |
227,942 | 234,376 | 235,083 | |||||||||
|
Impairment of intangible assets (Note 6) |
5,803 | 21,900 | 118,108 | |||||||||
|
Insurance premiums, including deposit insurance |
91,881 | 91,847 | 93,756 | |||||||||
|
Communications |
55,274 | 58,067 | 59,166 | |||||||||
|
Taxes and public charges |
94,047 | 90,210 | 95,358 | |||||||||
|
Impairment of goodwill (Note 6) |
6,638 | — | — | |||||||||
|
Provision for (reversal of) off-balance sheet credit instruments |
106,556 | (96,054 | ) | 38,463 | ||||||||
|
Other non-interest expenses (Notes 5, 21 and 27) |
355,172 | 329,314 | 302,687 | |||||||||
|
|
|
|
|
|
|
|||||||
|
Total |
2,891,603 | 2,744,380 | 2,985,470 | |||||||||
|
|
|
|
|
|
|
|||||||
F-6
Table of Contents
MITSUBISHI UFJ FINANCIAL GROUP, INC. AND SUBSIDIARIES
CONSOLIDATED STATEMENTS OF INCOME—(Continued)
FOR THE FISCAL YEARS ENDED MARCH 31, 2017, 2018 AND 2019
| (in millions, except per share amount) | 2017 | 2018 | 2019 | |||||||||
|
Income before income tax expense |
272,543 | 1,661,819 | 870,842 | |||||||||
|
Income tax expense (Note 7) |
94,453 | 407,823 | 133,237 | |||||||||
|
|
|
|
|
|
|
|||||||
|
Net income before attribution of noncontrolling interests |
178,090 | 1,253,996 | 737,605 | |||||||||
|
Net income (loss) attributable to noncontrolling interests (Note 21) |
(24,590 | ) | 25,836 | 18,960 | ||||||||
|
|
|
|
|
|
|
|||||||
|
Net income attributable to Mitsubishi UFJ Financial Group |
¥ | 202,680 | ¥ | 1,228,160 | ¥ | 718,645 | ||||||
|
|
|
|
|
|
|
|||||||
|
Earnings applicable to common shareholders of Mitsubishi UFJ Financial Group |
¥ | 202,680 | ¥ | 1,228,160 | ¥ | 718,645 | ||||||
|
|
|
|
|
|
|
|||||||
|
Earnings per common share applicable to common shareholders of Mitsubishi UFJ Financial Group (Notes 19 and 23): |
||||||||||||
|
Basic earnings per common share—Earnings applicable to common shareholders of Mitsubishi UFJ Financial Group |
¥ | 14.93 | ¥ | 92.40 | ¥ | 55.03 | ||||||
|
Diluted earnings per common share—Earnings applicable to common shareholders of Mitsubishi UFJ Financial Group |
14.68 | 92.10 | 54.74 | |||||||||
|
Cash dividend per common share |
18.00 | 18.00 | 21.00 | |||||||||
|
Weighted average common shares outstanding |
13,574 | 13,292 | 13,059 | |||||||||
|
Weighted average diluted common shares outstanding |
13,585 | 13,293 | 13,059 | |||||||||
|
Notes: (1) The following credit losses are included in Investment securities gains (losses)—net: |
|
|||||||||||
| (in millions) | 2017 | 2018 | 2019 | |||||||||
|
Decline in fair value |
¥ | 706 | ¥ | 99 | ¥ | 596 | ||||||
|
Other comprehensive income—net |
35 | 15 | 10 | |||||||||
|
|
|
|
|
|
|
|||||||
|
Total credit losses |
¥ | 741 | ¥ | 114 | ¥ | 606 | ||||||
|
|
|
|
|
|
|
|||||||
| (2) | New guidance on recognition and measurement of financial assets and financial liabilities requires equity investments to be measured at fair value with changes in fair value recognized in net income for the fiscal year ended March 31, 2019. For additional information, refer to Note 1. |
See the accompanying notes to Consolidated Financial Statements.
F-7
Table of Contents
MITSUBISHI UFJ FINANCIAL GROUP, INC. AND SUBSIDIARIES
CONSOLIDATED STATEMENTS OF COMPREHENSIVE INCOME
FOR THE FISCAL YEARS ENDED MARCH 31, 2017, 2018 AND 2019
| (in millions) | 2017 | 2018 | 2019 | |||||||||
|
Net income before attribution of noncontrolling interests |
¥ | 178,090 | ¥ | 1,253,996 | ¥ | 737,605 | ||||||
|
Other comprehensive income (loss), net of tax (Note 20): |
||||||||||||
|
Net unrealized gains on investment securities (1) |
12,961 | 230,308 | 88,180 | |||||||||
|
Net debt valuation adjustments |
(8,552 | ) | (2,178 | ) | 9,729 | |||||||
|
Net unrealized losses on derivatives qualifying for cash flow hedges |
(13,245 | ) | (7,025 | ) | (4,890 | ) | ||||||
|
Defined benefit plans (Note 13) |
103,572 | 109,838 | (88,940 | ) | ||||||||
|
Foreign currency translation adjustments |
(143,210 | ) | (104,778 | ) | (42,212 | ) | ||||||
|
|
|
|
|
|
|
|||||||
|
Total |
(48,474 | ) | 226,165 | (38,133 | ) | |||||||
|
|
|
|
|
|
|
|||||||
|
Comprehensive income |
129,616 | 1,480,161 | 699,472 | |||||||||
|
Net income (loss) attributable to noncontrolling interests |
(24,590 | ) | 25,836 | 18,960 | ||||||||
|
Other comprehensive income (loss) attributable to noncontrolling interests |
(24,765 | ) | 1,320 | 21,209 | ||||||||
|
|
|
|
|
|
|
|||||||
|
Comprehensive income attributable to Mitsubishi UFJ Financial Group |
¥ | 178,971 | ¥ | 1,453,005 | ¥ | 659,303 | ||||||
|
|
|
|
|
|
|
|||||||
Note:
| (1) | Included unrealized gains (losses) related to only debt securities for the fiscal year ended March 31, 2019. |
See the accompanying notes to Consolidated Financial Statements.
F-8
Table of Contents
MITSUBISHI UFJ FINANCIAL GROUP, INC. AND SUBSIDIARIES
CONSOLIDATED STATEMENTS OF EQUITY
FOR THE FISCAL YEARS ENDED MARCH 31, 2017, 2018 AND 2019
| (in millions, except per share amount) | 2017 | 2018 | 2019 | |||||||||
|
Capital stock (Notes 17 and 18): |
||||||||||||
|
Balance at beginning of fiscal year |
¥ | 2,090,270 | ¥ | 2,090,270 | ¥ | 2,090,270 | ||||||
|
|
|
|
|
|
|
|||||||
|
Balance at end of fiscal year |
¥ | 2,090,270 | ¥ | 2,090,270 | ¥ | 2,090,270 | ||||||
|
|
|
|
|
|
|
|||||||
|
Capital surplus (Note 18): |
||||||||||||
|
Balance at beginning of fiscal year |
¥ | 5,958,929 | ¥ | 5,956,644 | ¥ | 5,740,165 | ||||||
|
Stock-based compensation (Note 33) |
(1,856 | ) | 315 | (180 | ) | |||||||
|
Purchase of shares of Mitsubishi UFJ NICOS from noncontrolling interest shareholder (Note 2) |
— | (34,751 | ) | — | ||||||||
|
Retirement of common stock |
— | (190,054 | ) | (162,720 | ) | |||||||
|
Other—net |
(429 | ) | 8,011 | (79 | ) | |||||||
|
|
|
|
|
|
|
|||||||
|
Balance at end of fiscal year |
¥ | 5,956,644 | ¥ | 5,740,165 | ¥ | 5,577,186 | ||||||
|
|
|
|
|
|
|
|||||||
|
Retained earnings appropriated for legal reserve (Note 19): |
||||||||||||
|
Balance at beginning of fiscal year |
¥ | 239,571 | ¥ | 239,571 | ¥ | 239,571 | ||||||
|
|
|
|
|
|
|
|||||||
|
Balance at end of fiscal year |
¥ | 239,571 | ¥ | 239,571 | ¥ | 239,571 | ||||||
|
|
|
|
|
|
|
|||||||
|
Unappropriated retained earnings (Note 19): |
||||||||||||
|
Balance at beginning of fiscal year |
¥ | 3,980,257 | ¥ | 3,931,612 | ¥ | 4,945,733 | ||||||
|
Net income attributable to Mitsubishi UFJ Financial Group |
202,680 | 1,228,160 | 718,645 | |||||||||
|
Cash dividends: |
||||||||||||
|
Common stock—¥18.00 per share in 2017 and 2018, and ¥21.00 per share in 2019 |
(246,338 | ) | (240,497 | ) | (275,551 | ) | ||||||
|
Losses on sales of shares of treasury stock |
(1,114 | ) | (8 | ) | — | |||||||
|
Effect of adopting new guidance by a foreign affiliated company |
— | (2,605 | ) (1) | 1,173 | (2) | |||||||
|
Effect of adopting new guidance on consolidation of certain variable interest entities (Note 26) |
(3,873 | ) | — | — | ||||||||
|
Effect of adopting new guidance on reclassification of certain tax effects |
— | 29,071 | — | |||||||||
|
Effect of adopting new guidance on recognition and measurement of financial assets and financial liabilities (Note 1) |
— | — | 2,702,242 | |||||||||
|
Effect of adopting new guidance on recognition of breakage for certain prepaid stored-value products (Note 1) |
— | — | 1,784 | |||||||||
|
|
|
|
|
|
|
|||||||
|
Balance at end of fiscal year |
¥ | 3,931,612 | ¥ | 4,945,733 | ¥ | 8,094,026 | ||||||
|
|
|
|
|
|
|
|||||||
F-9
Table of Contents
MITSUBISHI UFJ FINANCIAL GROUP, INC. AND SUBSIDIARIES
CONSOLIDATED STATEMENTS OF EQUITY—(Continued)
FOR THE FISCAL YEARS ENDED MARCH 31, 2017, 2018 AND 2019
| (in millions) | 2017 | 2018 | 2019 | |||||||||
|
Accumulated other comprehensive income (loss), net of taxes: |
||||||||||||
|
Balance at beginning of fiscal year |
¥ | 2,301,259 | ¥ | 2,281,423 | ¥ | 2,477,315 | ||||||
|
Net change during the fiscal year |
(23,709 | ) | 224,845 | (59,342 | ) | |||||||
|
Effect of adopting new guidance by a foreign affiliated company |
— | 118 | — | |||||||||
|
Effect of adopting new guidance on consolidation of certain variable interest entities (Note 26) |
3,873 | — | — | |||||||||
|
Effect of adopting new guidance on reclassification of certain tax effects |
— | (29,071 | ) | — | ||||||||
|
Effect of adopting new guidance on recognition and measurement of financial assets and financial liabilities (Note 1) |
— | — | (2,702,242 | ) | ||||||||
|
|
|
|
|
|
|
|||||||
|
Balance at end of fiscal year |
¥ | 2,281,423 | ¥ | 2,477,315 | ¥ | (284,269 | ) | |||||
|
|
|
|
|
|
|
|||||||
|
Treasury stock, at cost: |
||||||||||||
|
Balance at beginning of fiscal year |
¥ | (299,661 | ) | ¥ | (513,988 | ) | ¥ | (522,872 | ) | |||
|
Purchases of shares of treasury stock (Note 18) |
(217,803 | ) | (201,102 | ) | (161,043 | ) | ||||||
|
Sales of shares of treasury stock |
3,491 | 2,098 | 3,775 | |||||||||
|
Retirement of common stock |
— | 190,054 | 162,720 | |||||||||
|
Net decrease (increase) resulting from changes in interests in consolidated subsidiaries, consolidated variable interest entities, and affiliated companies |
(15 | ) | 66 | 184 | ||||||||
|
|
|
|
|
|
|
|||||||
|
Balance at end of fiscal year |
¥ | (513,988 | ) | ¥ | (522,872 | ) | ¥ | (517,236 | ) | |||
|
|
|
|
|
|
|
|||||||
|
Total Mitsubishi UFJ Financial Group shareholders’ equity |
¥ | 13,985,532 | ¥ | 14,970,182 | ¥ | 15,199,548 | ||||||
|
|
|
|
|
|
|
|||||||
|
Noncontrolling interests: |
||||||||||||
|
Balance at beginning of fiscal year |
¥ | 577,642 | ¥ | 779,176 | ¥ | 675,633 | ||||||
|
Initial subscriptions of noncontrolling interests |
112,644 | 48,828 | 108,235 | |||||||||
|
Transactions between the consolidated subsidiaries and the related noncontrolling interest shareholders |
113,878 | (120,216 | ) | (2,830 | ) | |||||||
|
Decrease in noncontrolling interests related to deconsolidation of subsidiaries |
(563,918 | ) | (22,556 | ) | (20,497 | ) | ||||||
|
Decrease in noncontrolling interests related to disposition of subsidiaries |
(1,026 | ) | — | — | ||||||||
|
Purchase of shares of Mitsubishi UFJ NICOS from noncontrolling interest shareholder (Note 2) |
— | (15,390 | ) | — | ||||||||
|
Net income (loss) attributable to noncontrolling interests |
(24,590 | ) | 25,836 | 18,960 | ||||||||
|
Dividends paid to noncontrolling interests |
(6,842 | ) | (21,675 | ) | (15,853 | ) | ||||||
|
Other comprehensive income (loss), net of taxes |
(24,765 | ) | 1,320 | 21,209 | ||||||||
|
Effect of adopting new guidance on consolidation of certain variable interest entities (Note 26) |
595,982 | — | — | |||||||||
|
Other—net |
171 | 310 | 343 | |||||||||
|
|
|
|
|
|
|
|||||||
|
Balance at end of fiscal year |
¥ | 779,176 | ¥ | 675,633 | ¥ | 785,200 | ||||||
|
|
|
|
|
|
|
|||||||
|
Total equity |
¥ | 14,764,708 | ¥ | 15,645,815 | ¥ | 15,984,748 | ||||||
|
|
|
|
|
|
|
|||||||
Notes:
| (1) | The effect mainly resulted from the adoption of new accounting guidance on “Targeted Improvements to Accounting for Hedging Activities”. See Note 14 for more information. |
| (2) | The effect resulted from the adoption of new accounting guidance on “Leases”. |
See the accompanying notes to Consolidated Financial Statements.
F-10
Table of Contents
MITSUBISHI UFJ FINANCIAL GROUP, INC. AND SUBSIDIARIES
FOR THE FISCAL YEARS ENDED MARCH 31, 2017, 2018 AND 2019
| (in millions) | 2017 (1) | 2018 (1) | 2019 | |||||||||
|
Cash flows from operating activities: |
||||||||||||
|
Net income before attribution of noncontrolling interests |
¥ | 178,090 | ¥ | 1,253,996 | ¥ | 737,605 | ||||||
|
Adjustments to reconcile net income before attribution of noncontrolling interests to net cash provided by operating activities: |
||||||||||||
|
Depreciation and amortization (Notes 5 and 6) |
327,716 | 330,556 | 333,950 | |||||||||
|
Impairment of goodwill (Note 6) |
6,638 | — | — | |||||||||
|
Impairment of intangible assets (Note 6) |
5,803 | 21,900 | 118,108 | |||||||||
|
Provision for (reversal of) credit losses (Note 4) |
253,688 | (240,847 | ) | 34,330 | ||||||||
|
Employee benefit cost (income) for severance indemnities and pension plans (Note 13) |
20,274 | (7,955 | ) | (19,839 | ) | |||||||
|
Investment securities (gains) losses—net |
(281,158 | ) | (286,903 | ) | 252,307 | |||||||
|
Amortization of premiums on investment securities |
95,091 | 118,863 | 78,509 | |||||||||
|
Changes in financial instruments measured at fair value under fair value option, excluding trading account securities—net (Note 32) |
103,845 | (13,456 | ) | 13,880 | ||||||||
|
Foreign exchange (gains) losses—net |
(136,976 | ) | (208,398 | ) | 565,304 | |||||||
|
Equity in earnings of equity method investees—net |
(197,821 | ) | (227,984 | ) | (209,732 | ) | ||||||
|
Provision (benefit) for deferred income tax expense |
(212,368 | ) | 120,595 | (47,796 | ) | |||||||
|
Decrease (increase) in trading account assets, excluding foreign exchange contracts |
42,609 | 5,653,904 | (2,695,035 | ) | ||||||||
|
Increase (decrease) in trading account liabilities, excluding foreign exchange contracts |
521,093 | (6,433,948 | ) | 1,370,846 | ||||||||
|
Decrease in unearned income, unamortized premiums and deferred loan fees |
(20,476 | ) | (35,857 | ) | (7,054 | ) | ||||||
|
Decrease (increase) in accrued interest receivable and other receivables |
49,783 | (172,599 | ) | (135,656 | ) | |||||||
|
Increase in accrued interest payable and other payables |
66,419 | 153,365 | 92,334 | |||||||||
|
Net increase (decrease) in accrued income taxes and decrease (increase) in income tax receivables |
(81,083 | ) | 1,212 | (136,047 | ) | |||||||
|
Increase (decrease) in allowance for repayment of excess interest |
(7,790 | ) | (15,658 | ) | 1,258 | |||||||
|
Net decrease (increase) in collateral for derivative transactions |
(276,476 | ) | 259,287 | (79,338 | ) | |||||||
|
Increase in cash collateral for the use of Bank of Japan’s settlement infrastructure |
(207,498 | ) | (643,568 | ) | (60,462 | ) | ||||||
|
Other—net |
441,026 | (190,341 | ) | 20,862 | ||||||||
|
|
|
|
|
|
|
|||||||
|
Net cash provided by (used in) operating activities |
690,429 | (563,836 | ) | 228,334 | ||||||||
|
|
|
|
|
|
|
|||||||
|
Cash flows from investing activities: |
||||||||||||
|
Proceeds from sales of Available-for-sale debt securities (including proceeds from debt securities under the fair value option) (Note 3) |
37,348,721 | 30,995,426 | 31,283,601 | |||||||||
|
Proceeds from maturities of Available-for-sale debt securities (including proceeds from debt securities under the fair value option) (Note 3) |
26,684,497 | 40,011,298 | 26,448,801 | |||||||||
|
Purchases of Available-for-sale debt securities (including purchases of debt securities under the fair value option) (Note 3) |
(54,588,932 | ) | (71,593,326 | ) | (62,309,072 | ) | ||||||
|
Proceeds from maturities of Held-to-maturity debt securities |
810,838 | 1,085,603 | 560,646 | |||||||||
|
Purchases of Held-to-maturity debt securities |
(632,116 | ) | (1,156,122 | ) | (1,192,989 | ) | ||||||
|
Proceeds from sales and redemption of Equity securities (including proceeds from equity securities under the fair value option) |
1,768,580 | 2,377,333 | 2,722,948 | |||||||||
|
Purchases of Equity securities (including purchases of equity securities under the fair value option) |
(1,727,841 | ) | (2,197,171 | ) | (2,770,356 | ) | ||||||
|
Acquisition of MUFG Capital Analytics LLC (formerly Capital Analytics II LLC), a subsidiary of TB, net of cash acquired (Note 2) |
(4,154 | ) | — | — | ||||||||
|
Purchase of common stock and preferred stock investment in Security Bank Corporation, an equity method investee of BK (Note 2) |
(91,993 | ) | — | — | ||||||||
|
Acquisition of MUFG Investor Services (US) (formerly Rydex Fund Services, LLC), a subsidiary of TB, net of cash acquired (Note 2) |
(17,175 | ) | — | — | ||||||||
|
Purchase of common stock in Hitachi Capital Corporation, an equity method investee of MUFG (Note 2) |
(91,877 | ) | — | — | ||||||||
|
Acquisition of Hattha Kaksekar Limited, a subsidiary of Krungsri, net of cash acquired (Note 2) |
(556 | ) | — | — | ||||||||
|
Purchase of common stock in Bank Danamon, an equity method investee of BK (Note 2) |
— | — | (132,335 | ) | ||||||||
|
Net decrease (increase) in loans |
2,514,824 | (169,478 | ) | 330,198 | ||||||||
|
Net decrease (increase) in call loans, funds sold, and receivables under resale agreements and securities borrowing transactions |
(6,971,016 | ) | 4,187,093 | 627,327 | ||||||||
|
Proceeds from sales of premises and equipment |
32,512 | 12,211 | 26,191 | |||||||||
|
Capital expenditures for premises and equipment |
(116,786 | ) | (159,003 | ) | (126,479 | ) | ||||||
|
Purchases of intangible assets |
(237,253 | ) | (239,755 | ) | (276,880 | ) | ||||||
|
Proceeds from sales and dispositions of investments in equity method investees |
66,729 | 39,710 | 161,566 | |||||||||
|
Proceeds from sales of consolidated VIEs and subsidiaries—net |
244,476 | 122,962 | 64,395 | |||||||||
|
Other—net |
(151,078 | ) | (72,765 | ) | (49,590 | ) | ||||||
|
|
|
|
|
|
|
|||||||
|
Net cash provided by (used in) investing activities |
4,840,400 | 3,244,016 | (4,632,028 | ) | ||||||||
|
|
|
|
|
|
|
|||||||
F-11
Table of Contents
MITSUBISHI UFJ FINANCIAL GROUP, INC. AND SUBSIDIARIES
CONSOLIDATED STATEMENTS OF CASH FLOWS—(Continued)
FOR THE FISCAL YEARS ENDED MARCH 31, 2017, 2018 AND 2019
| (in millions) | 2017 (1) | 2018 (1) | 2019 | |||||||||
|
Cash flows from financing activities: |
||||||||||||
|
Net increase in deposits |
10,902,923 | 5,720,011 | 3,602,674 | |||||||||
|
Net increase (decrease) in call money, funds purchased, and payables under repurchase agreements and securities lending transactions |
(2,790,342 | ) | 3,963,120 | (303,042 | ) | |||||||
|
Net increase (decrease) in due to trust account |
(3,002,999 | ) | 51,003 | (650,206 | ) | |||||||
|
Net decrease in other short-term borrowings |
(1,221,838 | ) | (957,705 | ) | (118,443 | ) | ||||||
|
Proceeds from issuance of long-term debt |
12,265,629 | 6,671,031 | 5,020,636 | |||||||||
|
Repayments of long-term debt |
(6,641,722 | ) | (5,485,894 | ) | (4,236,887 | ) | ||||||
|
Proceeds from sales of treasury stock |
256 | 1,316 | 2,322 | |||||||||
|
Payments for acquisition of treasury stock (Note 18) |
(217,803 | ) | (201,102 | ) | (159,962 | ) | ||||||
|
Payments for acquisition of shares of certain subsidiaries from noncontrolling interest shareholders |
(1,612 | ) | (318 | ) | — | |||||||
|
Payments for acquisition of shares of Mitsubishi UFJ NICOS from noncontrolling interest shareholders (Note 2) |
— | (50,000 | ) | — | ||||||||
|
Dividends paid |
(246,345 | ) | (240,514 | ) | (275,581 | ) | ||||||
|
Dividends paid by subsidiaries to noncontrolling interests |
(6,842 | ) | (21,675 | ) | (15,853 | ) | ||||||
|
Other—net |
105,995 | (87,067 | ) | 197,673 | ||||||||
|
|
|
|
|
|
|
|||||||
|
Net cash provided by financing activities |
9,145,300 | 9,362,206 | 3,063,331 | |||||||||
|
|
|
|
|
|
|
|||||||
|
Effect of exchange rate changes on cash and cash equivalents |
(334,793 | ) | (188,149 | ) | 43,975 | |||||||
|
|
|
|
|
|
|
|||||||
|
Net increase in cash and cash equivalents |
14,341,336 | 11,854,237 | (1,296,388 | ) | ||||||||
|
|
|
|
|
|
|
|||||||
|
Cash and cash equivalents at beginning of fiscal year |
49,677,883 | 64,019,219 | 75,873,456 | |||||||||
|
Cash and cash equivalents: |
||||||||||||
|
Cash, due from banks and interest-earning deposits in other banks |
64,009,770 | 75,858,049 | 74,571,260 | |||||||||
|
Restricted cash included in other assets |
9,449 | 15,407 | 5,808 | |||||||||
|
|
|
|
|
|
|
|||||||
|
Cash and cash equivalents at end of fiscal year |
¥ | 64,019,219 | ¥ | 75,873,456 | ¥ | 74,577,068 | ||||||
|
|
|
|
|
|
|
|||||||
|
Supplemental disclosure of cash flow information: |
||||||||||||
|
Cash paid during the fiscal year for: |
||||||||||||
|
Interest |
¥ | 779,239 | ¥ | 1,040,337 | ¥ | 1,488,136 | ||||||
|
Income taxes, net of refunds |
373,887 | 265,225 | 302,019 | |||||||||
|
Non-cash investing and financing activities: |
||||||||||||
|
Assets acquired under capital lease arrangements |
7,065 | 7,111 | 11,280 | |||||||||
| Adoption of new guidance on consolidation of certain variable interest entities (Note 26): | ||||||||||||
|
Increase in total assets, excluding cash and cash equivalents |
598,236 | — | — | |||||||||
|
Increase in total liabilities |
32,254 | — | — | |||||||||
|
Increase in noncontrolling interests |
595,982 | — | — | |||||||||
|
Acquisition of MUFG Capital Analytics LLC, a subsidiary of TB (Note 2): |
||||||||||||
|
Fair value of assets acquired, excluding cash and cash equivalents |
5,038 | — | — | |||||||||
|
Fair value of liabilities assumed |
884 | — | — | |||||||||
|
Acquisition of MUFG Investor Services (US), LLC, a subsidiary of TB (Note 2): |
||||||||||||
|
Fair value of assets acquired, excluding cash and cash equivalents |
17,847 | — | — | |||||||||
|
Fair value of liabilities assumed |
672 | — | — | |||||||||
|
Acquisition of Hattha Kaksekar Limited, a subsidiary of Krungsri (Note 2): |
||||||||||||
|
Fair value of assets acquired, excluding cash and cash equivalents |
54,186 | — | — | |||||||||
|
Fair value of liabilities assumed |
53,630 | — | — | |||||||||
|
Marketable Equity Securities issued by Bank Danamon transferred to investments in subsidiaries and affiliates (Note 2) |
— | — | 98,934 | |||||||||
|
Available-for-sale debt securities transferred to Held-to-maturity debt securities |
— | — | 221,537 | |||||||||
Note:
| (1) | The reclassification of certain items on the consolidated balance sheets resulted in reclassification of the consolidated statements of cash flows for the fiscal years ended March 31, 2017 and 2018, respectively. See Note 1 Reclassifications for further information. |
See the accompanying notes to Consolidated Financial Statements.
F-12
Table of Contents
MITSUBISHI UFJ FINANCIAL GROUP, INC. AND SUBSIDIARIES
NOTES TO CONSOLIDATED FINANCIAL STATEMENTS
| 1. | BASIS OF FINANCIAL STATEMENTS AND SUMMARY OF SIGNIFICANT ACCOUNTING POLICIES |
Description of Business
Mitsubishi UFJ Financial Group, Inc. (“MUFG”) is a holding company for MUFG Bank, Ltd. (formerly, The Bank of Tokyo-Mitsubishi UFJ, Ltd., “MUFG Bank” or “BK”), Mitsubishi UFJ Trust and Banking Corporation (“Mitsubishi UFJ Trust and Banking” or “TB”), Mitsubishi UFJ Securities Holdings Co., Ltd. (“Mitsubishi UFJ Securities Holdings” or “SCHD”), Mitsubishi UFJ NICOS Co., Ltd. (“Mitsubishi UFJ NICOS”), and other subsidiaries. Mitsubishi UFJ Securities Holdings is an intermediate holding company for Mitsubishi UFJ Morgan Stanley Securities Co., Ltd. (“Mitsubishi UFJ Morgan Stanley Securities”). Through its subsidiaries and affiliated companies, MUFG engages in a broad range of financial operations, including commercial banking, investment banking, trust banking and asset management services, securities businesses, and credit card businesses, and it provides related services to individual and corporate customers. See Note 30 for more information by business segment.
Basis of Financial Statements
The accompanying consolidated financial statements are presented in Japanese yen, the currency of the country in which MUFG is incorporated and principally operates. The accompanying consolidated financial statements have been prepared on the basis of accounting principles generally accepted in the United States of America (“U.S. GAAP”). In certain respects, the accompanying consolidated financial statements reflect adjustments which are not included in the consolidated financial statements issued by MUFG and certain of its subsidiaries in accordance with applicable statutory requirements and accounting practices in their respective countries of incorporation. The major adjustments include those relating to (1) investment securities, (2) derivative financial instruments, (3) allowance for credit losses, (4) income taxes, (5) consolidation, (6) premises and equipment, (7) transfer of financial assets, (8) accrued severance indemnities and pension liabilities, (9) goodwill and other intangible assets and (10) lease transactions.
Fiscal years of certain subsidiaries, which end on December 31, and MUFG’s fiscal year, which ends on March 31, have been treated as coterminous. For the fiscal years ended March 31, 2017, 2018 and 2019, the effect of recording intervening events for the three-month periods ended March 31 on MUFG’s proportionate equity in net income of subsidiaries with fiscal years ended on December 31, would have resulted in an increase of ¥10.22 billion, a decrease of ¥10.76 billion, and an increase of ¥19.97 billion to net income attributable to Mitsubishi UFJ Financial Group, respectively. No intervening events occurred during each of the three-month periods ended March 31, 2017, 2018 and 2019 which, if recorded, would have had material effects on consolidated total assets, loans, total liabilities, deposits or total equity as of March 31, 2017, 2018 and 2019.
Use of Estimates
The preparation of consolidated financial statements in conformity with U.S. GAAP requires management to make estimates and assumptions that affect the reported amounts of assets and liabilities and disclosures of contingent assets and liabilities at the date of the consolidated financial statements and the reported amounts of revenues and expenses during the reporting period. Actual results could differ from those estimates. Material estimates that are particularly susceptible to management judgment primarily relate to the allowance for credit losses, the valuation of deferred tax assets, the valuation of financial instruments, the accounting for goodwill and intangible assets, impairment of investment securities, the allowances for repayment of excess interest and accrued severance indemnities and pension liabilities.
F-13
Table of Contents
MITSUBISHI UFJ FINANCIAL GROUP, INC. AND SUBSIDIARIES
NOTES TO CONSOLIDATED FINANCIAL STATEMENTS—(Continued)
Summary of Significant Accounting Policies
Significant accounting policies applied in the accompanying consolidated financial statements are summarized below:
Consolidation —The accompanying consolidated financial statements include the accounts of MUFG, its subsidiaries and certain variable interest entities (“VIE”s) (together, the “MUFG Group”). In situations in which the MUFG Group has a controlling financial interest in other entities, including certain VIEs, such entities are consolidated and noncontrolling interests, if any, are recorded in Total equity. Intercompany transactions and balances have been eliminated. Investments in affiliated companies (companies over which the MUFG Group has the ability to exercise significant influence) are accounted for by the equity method of accounting and are reported in Other assets. The MUFG Group’s equity interest in the earnings of these equity investees and other-than-temporary impairment (“OTTI”) are reported in Equity in earnings of equity method investees-net. The MUFG Group recognizes an impairment loss on investments in equity method investees that is other-than-temporary. The MUFG Group determines whether loss on investments is other-than-temporary, through consideration of various factors, such as inability to recover the carrying amount of the investment, the inability of the investee to sustain an earnings capacity that would justify the carrying amount of the investment, the length of time and the extent to which the fair value has been less than cost, the financial condition and near-term prospects of the investees, and the intent and ability to retain its investment in the investees for a period of time sufficient to allow for any anticipated recovery in the fair value. The MUFG Group also evaluates additional factors, such as the condition and trend of the economic cycle, and trends in the general market.
The MUFG Group consolidates VIEs if it has the power to direct the activities of a VIE which most significantly impact the VIE’s economic performance and has the obligation to absorb losses or the right to receive benefits that could potentially be significant to the VIE. To assess whether a VIE should be consolidated or not, the MUFG Group considers all factors, such as the purpose and design of the VIE, contractual arrangements, and the MUFG Group’s involvement in both the establishment of the VIE and day-to-day activities of the VIE. The MUFG Group considers a right to make the most significant decisions affecting a VIE to determine whether it is deemed to have the power to direct the activities of the VIE. Furthermore, the MUFG Group considers its economic interests in the VIE, including investments in debt or equity instruments issued by the VIE, liquidity and credit enhancement, and guarantees to determine whether such interests are potentially significant to the VIE or not.
Assets that the MUFG Group holds in an agency, fiduciary or trust capacity are not assets of the MUFG Group and, accordingly, are not included in the accompanying consolidated balance sheets.
Cash Flows —For the purposes of reporting cash flows, cash and cash equivalents consist of Cash and due from banks, Interest-earning deposits in other banks, and certain restricted cash included in Other assets. Restricted cash included in cash and cash equivalents represents cash or deposits subject to withdrawal or usage restrictions, and mainly consist of reserves on deposits with the Bank of Japan and similar reserves required for foreign offices and subsidiaries engaged in banking businesses in foreign countries. Cash flows from qualified hedging activities are classified in the same category as the items being hedged.
Translation of Foreign Currency Financial Statements and Foreign Currency Transactions —Financial statements of overseas entities are translated into Japanese yen using the respective fiscal year-end exchange rates for assets and liabilities. Income and expense items are translated at average rates of exchange for the respective fiscal years.
Foreign currency translation gains and losses related to the financial statements of overseas entities of the MUFG Group, net of related income tax effects, are credited or charged directly to Foreign currency translation
F-14
Table of Contents
MITSUBISHI UFJ FINANCIAL GROUP, INC. AND SUBSIDIARIES
NOTES TO CONSOLIDATED FINANCIAL STATEMENTS—(Continued)
adjustments, a component of Accumulated other comprehensive income (“Accumulated OCI”). Tax effects of gains and losses on foreign currency translation of the financial statements of overseas entities are not recognized unless it is apparent that the temporary differences will reverse in the foreseeable future.
Foreign currency-denominated assets and liabilities are translated into the functional currencies of the individual entities included in consolidation at the respective fiscal year-end foreign exchange rates. Foreign currency-denominated income and expenses are translated using average rates of exchange for the respective fiscal years. Gains and losses from such translation are included in Foreign exchange gains (losses)—net, as appropriate.
Repurchase Agreements, Securities Lending and Other Secured Financing Transactions —Securities sold with agreements to repurchase (“repurchase agreements”), securities purchased with agreements to resell (“resale agreements”) and securities lending and borrowing transactions are accounted for as secured financing or lending transactions, if the transferor has not surrendered control over the securities. Repurchase agreements and resale agreements are generally carried at the amounts at which the securities will be subsequently sold or repurchased, and securities lending and borrowing transactions are generally carried at the amount of cash collateral advanced or received. If they meet the relevant conditions for the surrender of control, they are accounted for as sales of securities with related off-balance sheet forward repurchase commitments or purchases of securities with related off-balance sheet forward resale commitments. For the fiscal years ended March 31, 2017, 2018 and 2019, there were no such transactions accounted for as sales or purchases.
Collateral— For secured lending transactions, including resale agreements, securities borrowing transactions, commercial lending and derivative transactions, the MUFG Group, as a secured party, generally has the right to require the counterparties to provide collateral, including letters of credit, cash, securities and other financial assets. For most secured lending transactions, the MUFG Group maintains strict levels of collateralization governed by a daily mark-to-market analysis. Financial assets pledged as collateral are generally negotiable financial instruments and are permitted to be sold or repledged by secured parties. If the MUFG Group sells these financial assets received as collateral, it recognizes the proceeds from the sale and its obligation to return the collateral. For secured borrowing transactions, principally repurchase agreements and securities lending transactions and derivative transactions, where the secured party has the right to sell or repledge financial assets pledged as collateral, the MUFG Group separately discloses those financial assets pledged as collateral in the accompanying consolidated balance sheets.
Trading Account Securities— Securities and money market instruments held in anticipation of short-term market movements and for resale to customers are included in Trading account assets, and short trading positions of these instruments are included in Trading account liabilities. Trading positions are carried at fair value in the accompanying consolidated balance sheets and recorded on a trade date basis. Changes in the fair value of trading positions are recognized in Trading account profits (losses). The MUFG Group has elected the fair value option for certain foreign securities. See Note 32 for a further discussion of fair value option.
Investment Securities— Debt securities for which the MUFG Group has both the ability and positive intent to hold to maturity are classified as Held-to-maturity debt securities and are carried at amortized cost. Debt securities that the MUFG Group may not hold to maturity other than those classified as Trading account securities, are classified as Available-for-sale debt securities, and are carried at their fair values, with unrealized gains and losses reported on a net-of-tax basis within Accumulated OCI, net of taxes, which is a component of equity. For debt securities, an OTTI is recognized in earnings for a security if the MUFG Group has intent to sell such a debt security or if it is more likely than not the MUFG Group will be required to sell such a debt security before recovery of its amortized cost basis. If not, the credit component of an OTTI is recognized in earnings, but
F-15
Table of Contents
MITSUBISHI UFJ FINANCIAL GROUP, INC. AND SUBSIDIARIES
NOTES TO CONSOLIDATED FINANCIAL STATEMENTS—(Continued)
the noncredit component is recognized in Accumulated OCI. In determining other-than-temporary declines in fair value to be recognized as an impairment loss on debt securities, the MUFG Group generally considers factors such as the ability and positive intent to hold the investments for a period of time sufficient to allow for anticipated recovery in fair value, the financial condition of the issuer, the extent of decline in fair value, and the length of time that the decline in fair value below cost has existed.
Equity securities include marketable equity investment securities and nonmarketable equity investment securities. Marketable equity investment securities are measured at fair value with unrealized gains or losses reflected in net income. Nonmarketable equity investment securities are primarily measured at cost minus impairment, if any, plus or minus changes resulting from observable price changes. Nonmarketable equity investment securities held by subsidiaries that are investment companies or brokers and dealers, are subject to the specialized industry accounting principles for investment companies and brokers and dealers. Securities of those subsidiaries are carried at their fair values.
Interest and dividends on investment securities are reported in Interest income. Dividends are recognized when the shareholder right to receive the dividend is established. Gains and losses on disposition of investment securities are computed using the average cost method and are recognized on the trade date.
Derivative Financial Instruments— The MUFG Group engages in derivative activities involving swaps, forwards, futures, options, and other types of derivative contracts. Derivatives are used in trading activities to generate trading revenues and fee income for its own account and to respond to customers’ financial needs. Derivatives are also used to manage counterparty credit risk and market risk exposures to fluctuations in interest and foreign exchange rates, equity and commodity prices.
Derivatives entered into for trading purposes are carried at fair value and are reported as Trading account assets or Trading account liabilities, as appropriate. The fair values of derivative contracts executed with the same counterparty under legally enforceable master netting agreements are presented on a gross basis. Changes in the fair value of such contracts are recognized currently in Foreign exchange gains (losses)—net with respect to foreign exchange contracts and in Trading account profits (losses)—net with respect to interest rate contracts and other types of contracts.
Embedded features that are not clearly and closely related to the host contracts and meet the definition of derivatives are separated from the host contracts and measured at fair value unless the contracts embedding the derivatives are measured at fair value in their entirety.
Derivatives are also used to manage exposures to fluctuations in interest and foreign exchange rates arising from mismatches of asset and liability positions. Certain of those derivatives are designated as hedging instruments and qualify for hedge accounting. The MUFG Group designates a derivative as a hedging instrument at the inception of each such hedge relationship, and it documents, for such individual hedging relationships, the risk management objective and strategy, including the item being hedged, the specific risk being hedged and the method used to assess the hedge effectiveness. In order for a hedging relationship to qualify for hedge accounting, the changes in the fair value of the derivative instruments must be highly effective in achieving offsetting changes in fair values or variable cash flows of the hedged items attributable to the risk being hedged. Any ineffectiveness, which arises during the hedging relationship, is recognized in Non-interest income or expense in the period in which it arises. All qualifying hedging derivatives are valued at fair value and included in Other assets or Other liabilities, as appropriate. For cash flow hedges, the unrealized changes in fair value to the extent effective are recognized in Accumulated OCI. Amounts realized on cash flow hedges related to variable rate loans are recognized in Net interest income in the period when the cash flow from the hedged item
F-16
Table of Contents
MITSUBISHI UFJ FINANCIAL GROUP, INC. AND SUBSIDIARIES
NOTES TO CONSOLIDATED FINANCIAL STATEMENTS—(Continued)
is realized. The fair value of cash flow hedges related to forecasted transactions, if any, is recognized in Non-interest income or expense in the period when the forecasted transaction occurs. Any difference that arises from gains or losses on hedging derivatives offsetting corresponding gains or losses on the hedged items, and gains and losses on derivatives attributable to the risks excluded from the assessment of hedge effectiveness are recognized in Non-interest income or expense.
Loans— Loans originated by the MUFG Group (“originated loans”) are carried at the principal amount outstanding, adjusted for unearned income and deferred net nonrefundable loan fees and costs. Originated loans held and intended for dispositions or sale in secondary markets are transferred to the held-for-sale classification and carried at the lower of cost or estimated fair value generally on an individual loan basis. Loan origination fees, net of certain direct origination costs, are deferred and recognized over the contractual life of the loan as an adjustment to yield using a method that approximates the interest method. Interest income on loans that are not impaired is accrued and credited to interest income as it is earned. Unearned income and discounts or premiums on purchased loans are deferred and recognized over the remaining contractual terms of the loans using a method that approximates the interest method when such purchased loans are outside the scope of the guidance on loans and debt securities acquired with deteriorated credit quality as described below.
The MUFG Group classifies its loan portfolio into the following portfolio segments—Commercial, Residential, Card, MUFG Americas Holdings Corporation (“MUFG Americas Holdings ” or “MUAH”), and Bank of Ayudhya Public Company Limited (“Krungsri”) based on the grouping used by the MUFG Group to determine the allowance for credit losses. The MUFG Group further classifies the Commercial segment into classes based on initial measurement attributes, risk characteristics, and its method of monitoring and assessing credit risk.
Originated loans are considered impaired when, based on current information and events, it is probable that the MUFG Group will be unable to collect all the scheduled payments of principal or interest when due according to the contractual terms of the loan agreement. Past due status is determined based on the contractual terms of the loan and the actual number of days since the last payment date, and is considered in determining impairment. Originated loans that experience insignificant payment delays and payment shortfalls generally are not classified as impaired. Management determines the significance of payment delays and payment shortfalls on a case-by-case basis, taking into consideration all of the circumstances surrounding the loan and the borrower, including the length of the delay, the reasons for the delay, the borrower’s prior payment record, and the amount of the shortfall in relation to the principal and interest owed. Impairment is generally evaluated on a loan-by-loan basis by either the present value of expected future cash flows discounted at the loan’s effective interest rate, the loan’s observable market price, or the fair value of the collateral if the loan is collateral dependent.
Originated loans are generally placed on nonaccrual status when substantial doubt exists as to the full and timely collection of either principal or interest, specifically when principal or interest is contractually past due one month or more with respect to loans within all classes of the Commercial segment, three months or more with respect to loans within the Card, MUFG Americas Holdings, and Krungsri segments, and six months or more with respect to loans within the Residential segment. A nonaccrual loan may be restored to an accrual status when interest and principal payments become current and management expects that the borrower will make future contractual payments as scheduled. When a loan is placed on nonaccrual status, interest accrued but not received is generally reversed against interest income. Cash receipts on nonaccrual loans, for which the ultimate collectibility of principal is uncertain, are applied as principal reductions; otherwise, such collections are credited to income.
The MUFG Group modifies certain loans in conjunction with its loss-mitigation activities. Through these modifications, concessions are granted to a borrower who is experiencing financial difficulty, generally in order
F-17
Table of Contents
MITSUBISHI UFJ FINANCIAL GROUP, INC. AND SUBSIDIARIES
NOTES TO CONSOLIDATED FINANCIAL STATEMENTS—(Continued)
to minimize economic loss, to avoid foreclosure or repossession of collateral, and to ultimately maximize payments received from the borrower. The concessions granted vary by portfolio segment, by program, and by borrower-specific characteristics, and may include interest rate reductions, term extensions, payment deferrals, and partial principal forgiveness. Loan modifications that represent concessions made to borrowers who are experiencing financial difficulties are identified as troubled debt restructurings (“TDRs”).
Generally, accruing loans that are modified in a TDR remain as accruing loans subsequent to the modification, and nonaccrual loans remain as nonaccrual. However, if a nonaccrual loan has been modified as a TDR, the borrower is not delinquent under the modified terms, and demonstrates that its financial condition has improved, the MUFG Group may reclassify the loan to accrual status. This determination is generally performed at least once a year through a detailed internal credit rating review process. Once a nonaccrual loan is deemed to be a TDR, the MUFG Group will continue to designate the loan as a TDR even if the loan is reclassified to accrual status.
A loan that has been modified into a TDR is considered to be impaired until it matures, is repaid, or is otherwise liquidated, regardless of whether the borrower performs under the modified terms. Because loans modified in TDRs are considered to be impaired, these loans are measured for impairment using the MUFG Group’s established asset-specific allowance methodology, which considers the expected default rates for the modified loans. See “ Allowance for Credit Losses” for a discussion for each portfolio segment .
In accordance with the guidance on loans and debt securities acquired with deteriorated credit quality, impaired loans acquired for which it is probable that the MUFG Group will be unable to collect all contractual receivables are initially recorded at the present value of amounts expected to be received. For these impaired loans, the related valuation allowances are not carried over or created initially. Accretable yield is limited to the excess of the investor’s estimate of undiscounted cash flows over the investor’s initial investment in the loan. Subsequent increases in cash flows expected to be collected are recognized prospectively through adjustment of the loan’s yield over its remaining life after reduction of any remaining allowance for credit losses for the loan established after its acquisition, if any, while any decrease in such cash flows below those initially expected at acquisition plus additional cash flows expected to be collected arising from changes in estimate after acquisition is recognized as an impairment.
Loan Securitization —The MUFG Group securitizes and services commercial, industrial, and residential loans in the normal course of business. The MUFG Group accounts for a transfer of loans in a securitization transaction as a sale if it meets relevant conditions for the surrender of control. Otherwise, the transfer is accounted for as a collateralized borrowing transaction. When a securitization is accounted for as a sale, the proceeds from a sale of financial assets consist of the cash and any other assets obtained, including beneficial interests and separately recognized servicing assets, in the transfer less any liabilities incurred, including separately recognized servicing liabilities. All proceeds and reductions of proceeds from a sale shall be initially measured at fair value.
Allowance for Credit Losses —The MUFG Group maintains an allowance for credit losses to absorb probable losses inherent in the loan portfolio. Actual credit losses (amounts deemed uncollectible, in whole or in part), net of recoveries, are generally determined based on detailed loan reviews and a credit assessment by management at each balance sheet date, and are deducted from the allowance for credit losses as net charge-offs. The MUFG Group generally applies its charge-off policy to all loans in its portfolio regardless of the type of borrower. Management believes that the provision for credit losses is adequate and the allowance is at the appropriate amount to absorb probable losses inherent in the loan portfolio. During the fiscal year ended March 31, 2019, the MUFG Group did not make any significant changes to the methodologies or policies used to determine its allowance for credit losses.
F-18
Table of Contents
MITSUBISHI UFJ FINANCIAL GROUP, INC. AND SUBSIDIARIES
NOTES TO CONSOLIDATED FINANCIAL STATEMENTS—(Continued)
Key elements relating to the policies and discipline used in determining the allowance for credit losses are credit classification and the related borrower categorization process. The categorization is based on conditions that may affect the ability of borrowers to service their debt, taking into consideration current financial information, historical payment experience, credit documentation, public information, analyses of relevant industry segments or existing economic conditions. In determining the appropriate level of the allowance, the MUFG Group evaluates the probable loss by collateral value, historical loss experience, probability of insolvency and category of loan based on its type and characteristics. The MUFG Group calculates the allowance for credit losses over the loss emergence period that is a time between a loss occurring event and the subsequent confirmation of a loss. The MUFG Group updates these conditions and probable loss on a regular basis and upon the occurrence of unexpected change in the economic environment.
The methodologies used to estimate the allowance and the charge-off policy for each portfolio segment are as follows:
Commercial segment
In the Commercial segment, the methodology for assessing the appropriateness of the allowance consists of several key elements, which include the allocated allowance for loans individually evaluated for impairment, the formula allowance, and the allocated allowance for large groups of smaller-balance homogeneous loans.
The allocated allowance for loans individually evaluated for impairment represents the impairment allowance determined in accordance with the guidance on accounting by creditors for the impairment of a loan. The factors considered by management in determining impairment are the internal credit rating assigned to each borrower which represents the borrower’s creditworthiness determined based on payment status, the number of delinquencies, and the probability of collecting principal and interest payments when due. The impairment of a loan is measured based on the present value of expected future cash flows discounted at the loan’s original effective interest rate, or the loan’s observable market price, or the fair value of the collateral if the loan is collateral dependent.
The formula allowance is applied to loans that are categorized as Normal or Close Watch, excluding loans identified as a TDR, based on the internal credit rating and historical loss factors which are based on the loss experience. See Note 4 for the information on loans to borrowers categorized based on the internal borrower rating. Estimated losses inherent in the loans at the balance sheet date are calculated by multiplying the default ratio by the nonrecoverable ratio (determined as a complement of the recovery ratio). The default ratio is determined by each internal credit rating, taking into account the historical number of defaults of borrowers within each internal credit rating divided by the total number of borrowers. The recovery ratio is mainly determined by the historical experience of collections against loans in default. The default ratio, the recovery ratio and other indicators are continually reviewed to determine the appropriate level of the allowance. Because the evaluation of inherent loss for these loans involves an uncertainty, subjectivity and judgment, the estimation of the formula allowance is back-tested by comparing the allowance with the actual results subsequent to the balance sheet date. The results of such back-testing are evaluated by management to determine whether the manner and level of the formula allowance needs to be changed in subsequent years.
The allocated allowance for large groups of smaller-balance homogeneous loans is established through a process that begins with estimates of probable losses inherent in the portfolio. These estimates are based upon various analyses, including historical delinquency and historical loss experience.
Loans that have been modified into a TDR are treated as impaired loans. For nonaccrual TDRs, the allowance for credit losses is provided for these loans using the discounted cash flow method, or based on the fair
F-19
Table of Contents
MITSUBISHI UFJ FINANCIAL GROUP, INC. AND SUBSIDIARIES
NOTES TO CONSOLIDATED FINANCIAL STATEMENTS—(Continued)
value of the collateral. For TDRs accounted for as accruing loans, the allowance for credit losses is determined by discounting the estimated future cash flows using the original effective interest rate of the loans prior to modification.
In relation to loans categorized as Legally/Virtually Bankrupt, the carrying amount of loans less estimated value of the collateral and guaranteed amount is generally considered uncollectible, and is charged off.
Residential segment
In the Residential segment, the loans are comprised of smaller-balance homogeneous loans that are pooled by their internal credit ratings-based on the number of delinquencies. The loans in this segment are generally secured by collateral. Collateral values are based on internal valuation sources, and the allowance is determined for unsecured amounts. The allowance for the nondelinquent group of loans is determined based on historical loss experience. For delinquent groups of loans, the MUFG Group determines the allowance based on the probability of insolvency by the number of actual delinquencies and historical loss experience.
Loans that have been modified into a TDR are treated as impaired loans. For nonaccrual TDRs, the allowance for credit losses is provided for these loans using the discounted cash flow method, or based on the fair value of the collateral. For TDRs accounted for as accruing loans, the allowance for credit losses is determined by discounting the estimated future cash flows using the original effective interest rate of the loans prior to modification.
In relation to loans that are in past due status over a certain period of time and deemed uncollectible, the carrying amount of loans less estimated value of the collateral and guaranteed amount is generally considered uncollectible and charged off.
Card segment
In the Card segment, the loans are smaller-balance homogeneous loans that are pooled by their internal credit rating based on the number of delinquencies. The allowance for loans in this segment is generally determined based on the probability of insolvency by the number of actual delinquencies and historical loss experience. For calculating the allocated allowance for loans specifically identified for evaluation, impaired loans are aggregated for the purpose of measuring impairment using historical loss factors.
Loans that have been modified into a TDR are treated as impaired loans, and the allowance for credit losses is determined using the discounted cash flow method whereby the estimated future cash flows are discounted using the original effective interest rate of the loans prior to modification.
In relation to loans that are in past due status over a certain period of time and deemed uncollectible, the amount of loans is generally fully charged off.
MUFG Americas Holdings segment
In the MUFG Americas Holdings segment, the methodology for assessing the appropriateness of the allowance consists of several key elements, which include the allocated allowance for loans individually evaluated for impairment, the formula allowance, the allocated allowance for large groups of smaller-balance homogeneous loans, and the unallocated allowance.
F-20
Table of Contents
MITSUBISHI UFJ FINANCIAL GROUP, INC. AND SUBSIDIARIES
NOTES TO CONSOLIDATED FINANCIAL STATEMENTS—(Continued)
The allocated allowance for loans individually evaluated for impairment is established for loans when management determines that the MUFG Group will be unable to collect all amounts due according to the contractual terms of the loan agreement, including interest payments. Impaired loans are carried at the lower of the recorded investment in the loan, the present value of expected future cash flows discounted at the loan’s effective rate, the loan’s observable market price, or the fair value of the collateral, if the loan is collateral dependent.
The formula allowance is calculated by applying historical loss factors to outstanding loans. Historical loss factors are based on the historical loss experience and may be adjusted for significant factors that, in management’s judgment, affect the collectibility of the portfolio as of the balance sheet date.
The allocated allowance for large groups of smaller-balance homogeneous loans is established for consumer loans as well as for smaller balance commercial loans. These loans are managed on a pool basis, and loss factors are based on expected net charge-off ranges.
The unallocated allowance represents an estimate of additional losses inherent in the loan portfolio and is composed of attribution factors, which are based upon management’s evaluation of various conditions that are not directly measured in the determination of the allocated allowance. The conditions used for consideration of the unallocated allowance at each balance sheet date include factors, such as existing general economic and business conditions affecting the key lending areas and products of the MUFG Group, credit quality trends and risk identification, collateral values, loan volumes, underwriting standards and concentrations, specific industry conditions, recent loss experience and the duration of the current business cycle. The MUFG Group reviews these conditions and has an internal discussion with senior credit officers on a quarterly basis.
Loans that have been modified into a TDR are treated as impaired loans. For nonaccrual TDRs, the allowance for credit losses is provided for these loans using the discounted cash flow method, or based on the fair value of the collateral. For TDRs accounted for as accruing loans, the allowance for credit losses is determined by using the discounted cash flow method whereby the estimated future cash flows are discounted using the original effective interest rate of the loans prior to modification.
Commercial loans are generally considered uncollectible based on an evaluation of the financial condition of a borrower as well as the value of any collateral and, when considered to be uncollectible, loans are charged off in whole or in part. Consumer loans are generally considered uncollectible based on past due status and the value of any collateral and, when considered to be uncollectible, loans are charged off in whole or in part.
Krungsri segment
In the Krungsri segment, the methodology for assessing the appropriateness of the allowance consists of several key elements, which include the allocated allowance for loans individually evaluated for impairment, the formula allowance, and the allocated allowance for large groups of smaller-balance homogeneous loans.
The allocated allowance for loans individually evaluated for impairment is established for loans when management determines that the MUFG Group will be unable to collect all amounts due according to the contractual terms of the loan agreement, including interest payments. Impaired loans are carried at the lower of the recorded investment in the loan, the present value of expected future cash flows discounted at the loan’s effective rate, the loan’s observable market price, or the fair value of the collateral, if the loan is collateral dependent.
F-21
Table of Contents
MITSUBISHI UFJ FINANCIAL GROUP, INC. AND SUBSIDIARIES
NOTES TO CONSOLIDATED FINANCIAL STATEMENTS—(Continued)
The formula allowance is calculated by applying historical loss factors to outstanding loans. Historical loss factors are based on the historical loss experience and may be adjusted for significant factors that, in management’s judgment, affect the collectibility of the portfolio as of the balance sheet date.
The allocated allowance for large groups of smaller-balance homogeneous loans is established for smaller balance loans such as housing loans, credit card loans, and personal loans. These loans are managed on a pool basis, and loss factors are based on expected net charge-off ranges.
Loans that have been modified into a TDR are treated as impaired loans. For nonaccrual TDRs, the allowance for credit losses is provided for these loans using the discounted cash flow method, or based on the fair value of the collateral. For TDRs accounted for as accruing loans, the allowance for credit losses is determined by using the discounted cash flow method whereby the estimated future cash flows are discounted using the original effective interest rate of the loans prior to modification.
Loans to customers are charged off when they are determined to be uncollectible considering the financial condition of a borrower.
Allowance for Off-Balance Sheet Credit Instruments —The MUFG Group maintains an allowance for credit losses on off-balance sheet credit instruments, including commitments to extend credit, guarantees, standby letters of credit and other financial instruments. The allowance is recorded as a liability in Other liabilities. The MUFG Group adopts the same methodology used in determining the allowance for credit losses on loans. Potential credit losses related to derivatives are considered in the fair value of the derivatives.
Premises and Equipment —Premises and equipment are stated at cost less accumulated depreciation and amortization. Depreciation is charged to operations over the estimated useful lives of the related assets. Leasehold improvements are depreciated over the terms of the respective leases or the estimated useful lives of the improvements, whichever is shorter. MUFG, MUFG Bank and Mitsubishi UFJ Trust and Banking apply the declining-balance method in depreciating their premises and equipment, while other subsidiaries mainly apply the straight-line method, at rates principally based on the following estimated useful lives:
| Years | ||||
|
Buildings |
15 to 50 | |||
|
Equipment and furniture |
2 to 20 | |||
|
Leasehold improvements |
5 to 39 | |||
Maintenance, repairs and minor improvements are charged to operations as incurred. Major improvements are capitalized. Net gains or losses on dispositions of premises and equipment are included in Other non-interest income or expense, as appropriate.
Long-lived assets are reviewed for impairment whenever events or changes in circumstances indicate that the carrying amount of an asset may not be recoverable. Recoverability of an asset to be held and used is measured by a comparison of the carrying amount to future undiscounted net cash flows expected to be generated by the asset. If an asset is considered to be impaired, the impairment to be recognized is measured by the amount by which the carrying amount of the asset exceeds the fair value. For purposes of recognition and measurement of an impairment loss, a long-lived asset or assets are grouped with other assets and liabilities at the lowest level with independent and identifiable cash flows. Assets to be disposed of by sale are reported at the lower of the carrying amount or fair value less estimated cost to sell.
F-22
Table of Contents
MITSUBISHI UFJ FINANCIAL GROUP, INC. AND SUBSIDIARIES
NOTES TO CONSOLIDATED FINANCIAL STATEMENTS—(Continued)
Asset retirement obligations related to restoration of certain leased properties upon lease termination are recorded in Other liabilities with a corresponding increase in leasehold improvements. The amounts represent the present value of expected future cash flows associated with returning such leased properties to their original condition. The difference between the gross and present value of expected future cash flows is accreted over the life of the related leases as a non-interest expense.
Goodwill —The MUFG Group recognizes goodwill, as of the acquisition date, measured as the excess of the purchase price over the fair value of the net assets acquired. Goodwill related to investments in equity method investees is included in Other assets as a part of the carrying amount of investments in equity method investees.
Goodwill arising from a business combination is not amortized but is tested at least annually for impairment. Goodwill is recorded at a designated reporting unit level for the purpose of assessing impairment.
A reporting unit is an operating segment, or an identified business unit one level below an operating segment. An impairment loss is recognized to the extent that the carrying amount of goodwill exceeds its implied fair value.
Intangible assets —Intangible assets consist of software, core deposit intangibles, customer relationships, trade names and other intangible assets. These are amortized over their estimated useful lives unless they have indefinite useful lives. Amortization of intangible assets is computed in a manner that best reflects the economic benefits of the intangible assets as follows:
|
Useful lives
(years) |
Amortization method |
|||||
|
Software |
2 to 10 |
Straight-line |
||||
|
Core deposit intangibles |
10 to 16 |
Straight-line |
||||
|
Customer relationships |
7 to 27 |
Straight-line, Declining-balance |
||||
|
Trade names |
7 to 40 |
Straight-line |
||||
Intangible assets having indefinite useful lives are not amortized but are subject to annual impairment tests. An impairment exists if the carrying value of an indefinite-lived intangible asset exceeds its fair value. For other intangible assets subject to amortization, an impairment is recognized if the carrying amount is not recoverable and the carrying amount exceeds the fair value of the intangible asset.
The MUFG Group capitalizes certain costs associated with the acquisition or development of internal-use software. Costs subject to capitalization are salaries and employee benefits for employees who are directly associated with and who devote time to the internal-use computer software project, to the extent of time spent directly on the project. Once the software is ready for its intended use, the MUFG Group begins to amortize capitalized costs on a straight-line basis.
Accrued Severance and Pension Liabilities —The MUFG Group has defined benefit pension plans and other postretirement benefit plans, including severance indemnities plans (“SIPs”). The liabilities related to these plans are computed and recognized based on actuarial computations. Net actuarial gains and losses that arise from differences between actual experience and assumptions are generally amortized over the average remaining service period of participating employees if it exceeds the corridor, which is defined as the greater of 10% of plan assets or the projected benefit obligation. Under the guidance related to employers’ accounting for defined benefit pension and other postretirement plans, the MUFG Group recognizes a net liability or asset to report the funded status of its defined benefit pension and other postretirement plans in the accompanying consolidated balance sheets and mainly recognizes changes in the funded status of defined benefit pension and other postretirement plans in the year in which the changes occur in Accumulated OCI. Based on actuarial computations of current and future employee benefits, the service cost component is charged to Salaries and
F-23
Table of Contents
MITSUBISHI UFJ FINANCIAL GROUP, INC. AND SUBSIDIARIES
NOTES TO CONSOLIDATED FINANCIAL STATEMENTS—(Continued)
employee benefits while other components of net pension benefit/cost are charged to Other non-interest expenses. The MUFG Group measures plan assets and benefit obligations as of the date of the consolidated balance sheets.
Long-Term Debt —Premiums, discounts and issuance costs of long-term debt are amortized based on the method that approximates the interest method over the term of the long-term debt.
Obligations under Guarantees —The MUFG Group provides customers with a variety of guarantees and similar arrangements, including standby letters of credit, financial and performance guarantees, credit protection, and liquidity facilities. The MUFG Group recognizes guarantee fee income over the guarantee period based on the contractual terms of the guarantee contracts. It is the MUFG Group’s business practice to receive a guarantee fee at the inception of the guarantee, which approximates market value of the guarantee and is initially recorded as a liability, which is then recognized as guarantee fee income over the guarantee period.
Allowance for Repayment of Excess Interest —The MUFG Group maintains an allowance for repayment of excess interest based on an analysis of past experience of reimbursement of excess interest, borrowers’ profile, recent trend of borrowers’ claims for reimbursement, and management’s future forecasts. The allowance is recorded as a liability in Other liabilities.
Fees and Commissions —The MUFG Group recognizes revenue from contracts with customers in the amount of consideration it expects to receive upon the transfer of control of a good or service. The timing of recognition is dependent on whether the MUFG Group satisfies a performance obligation by transferring control of the product or service to a customer over time or at a point in time.
The following is an explanation of the MUFG Group’s key revenue from contracts with customers and the timing of its recognition.
Fees and commissions on deposits consist of fees and commissions charged for transaction-based services such as usage of automated teller machines and withdrawal services, and for periodic account maintenance services. The MUFG Group’s performance obligation for transaction-based services is satisfied and the fees and commissions are recognized at the point in time when the MUFG Group’s performance under the terms of a contractual arrangement is completed, which is at the settlement of a transaction, while the MUFG Group’s performance obligation for maintenance services is satisfied and the fees and commissions are recognized over the course of each month.
Fees and commissions on remittances and transfers consist of fees and commissions charged for settlement transactions such as domestic fund remittances, including electronic banking transactions, and are recognized at the point in time when the MUFG Group’s performance under the terms of a contractual arrangement is completed, which is at the settlement of a transaction.
Fees and commissions on foreign trading business consist of fees and commissions charged for fund collection and trade-related financing services related to foreign trading business, and are recognized in the period in which the related service is provided. If they arise from foreign trading business activities under which the customer consumes the related services at a point in time (e.g. foreign exchange fees), such fees are recognized at the same point in time. If they arise from foreign trading business activities under which the customer consumes the related services equally over the period of service (e.g. commercial letters of credit), such fees are recognized over the same period.
F-24
Table of Contents
MITSUBISHI UFJ FINANCIAL GROUP, INC. AND SUBSIDIARIES
NOTES TO CONSOLIDATED FINANCIAL STATEMENTS—(Continued)
Fees and commissions on credit card business consist of fees and commissions such as interchange income, royalty and other service charges from franchisees. Interchange income from the credit card business is recognized as processed transactions are settled through the associated payment networks, while royalty and other service charges related to the credit card business are recognized on a straight-line basis over the period of service.
Fees and commissions on security-related services primarily consist of fees and commissions for sales and transfers of securities including investment funds, underwriting, brokerage and advisory services, arrangement fees on securitizations, and agency services for the calculation and payment of dividends. Fees and commissions on security-related services are recognized in the period in which the related service is provided. If they arise from security-related services under which the customer consumes the related services at a point in time (e.g. sales and transfers of securities are executed at the customer’s direction; underwritings of debt and equity securities or securitizations are completed at the trade date; advice is provided to the clients; and dividends are calculated and then paid to investors), such fees are recognized at the same point in time. If they arise from security-related services under which the customer consumes the related services equally over the period of service (e.g. retainer fees on M&A advisory fees), such fees are recognized over the same period. The advisory fees which are paid upon meeting certain performance goals (e.g. success fees on M&A advisory fees) are recognized at the point in time when the performance goals are met.
Fees and commissions on administration and management services for investment funds primarily consist of fees and commissions earned from administrating and managing investment funds, including assets under management on behalf of clients. Such fees and commissions are recognized equally over the period of service at the amount calculated primarily based on the outstanding amount of each entrusted asset, the percentage of fees, and the extent of the service provided to administer the investment funds.
Trust fees consist primarily of fees earned by fiduciary asset management and administration services for corporate pension plans and investment funds, and are recognized on an accrual basis, generally based on the volume of trust assets under management and/or the operating performance for the accounting period of each trust account. With respect to the trust accounts with a guarantee of trust principal, trust fees are determined based on the profits earned by individual trust accounts during the trust accounting period, less deductions, including provision for reserves, impairment for individual investments and dividends paid to beneficiary certificate holders. The trust fees for these trust accounts are accrued based on the amounts expected to be earned during the accounting period of each trust account.
Guarantee fees consist of fees related to the guarantee business such as providing guarantees on residential mortgage loans and other loans, and are recognized over the contractual periods of the respective guarantees.
Insurance commissions consist of commissions earned from third-party insurance companies for marketing and selling insurance products and for the maintenance of insurance contracts. The former is recognized at the point in time which the associated service is fulfilled as the insurance contract is established by the insurance company, while the latter is recognized over the insurance period.
Fees and commissions on real estate business primarily consist of fees from real estate agent services, and are recognized in the period in which the related service is provided when assisting customers in the sales or purchase of real estate property.
Other fees and commissions include various fees and commissions earned on services to customers which have performance obligations that the MUFG Group completes in order to recognize revenue. The primary portion includes non-refundable financing related fees such as arrangement fees that are recognized when the service is provided.
F-25
Table of Contents
MITSUBISHI UFJ FINANCIAL GROUP, INC. AND SUBSIDIARIES
NOTES TO CONSOLIDATED FINANCIAL STATEMENTS—(Continued)
Income Taxes —The MUFG Group accounts for income taxes under the asset and liability method, which requires the recognition of deferred tax assets and deferred tax liabilities for the expected future tax consequences of events that have been included in the accompanying consolidated financial statements. Under this method, deferred tax assets and deferred tax liabilities are determined based on the differences between the financial statements and tax basis of assets and liabilities using enacted tax rates in effect for the year in which the differences are expected to reverse. The effect of a change in tax rates on deferred tax assets and deferred tax liabilities is recognized in income in the period that includes the enactment date.
The MUFG Group records net deferred tax assets to the extent these assets will more likely than not be realized. In making such determination, all available positive and negative evidence is considered, including future reversals of existing taxable temporary differences, projected future taxable income, tax planning strategies and recent financial operations. In the event the MUFG Group were to determine that it would be able to realize deferred tax assets in the future in excess of their net recorded amount, the MUFG Group would make an adjustment to the valuation allowance, which would reduce the provision for income taxes.
Uncertain tax positions are recorded on the basis of a two-step process whereby (1) it is determined whether it is more likely than not that the tax position will be sustained on the basis of its technical merits, and (2) for those tax positions that meet the more-likely-than-not recognition threshold, the MUFG Group recognizes the largest amount of tax benefit that is more than 50% likely to be realized upon ultimate settlement with the related tax authority. The MUFG Group recognizes interest and penalties related to unrecognized tax benefits within income tax expense. Accrued interest and penalties are included within Other liabilities.
Free Distributions of Common Shares —As permitted by the Companies Act of Japan (the “Companies Act”), Japanese companies, upon approval by the Board of Directors, may make a free distribution of shares, in the form of a “stock split” as defined, to shareholders. In accordance with generally accepted accounting practice in Japan, such distribution does not give rise to any change in capital stock or capital surplus accounts. Common shares distributed are recorded as shares issued on the distribution date. See Note 18 for further information.
Earnings per Common Share —Basic earnings per share (“EPS”) excludes dilutive effects of potential common shares and is computed by dividing earnings applicable to common stock shareholders by the weighted average number of common shares outstanding for the period, while diluted EPS gives effect to all dilutive potential common shares that were outstanding during the period. See Note 23 for the computation of basic and diluted EPS.
Treasury Stock —The MUFG Group presents its treasury stock, including shares of MUFG owned by its subsidiaries and affiliated companies, as a reduction of equity on the accompanying consolidated balance sheets at cost and accounts for treasury stock transactions under an average cost method. Gains (losses) on sales of treasury stock are charged to capital surplus and unappropriated retained earnings.
Comprehensive Income —Comprehensive income includes net income before attribution to noncontrolling interests and other comprehensive income (“OCI”). All changes in unrealized gains and losses on investment securities, unrealized gains and losses on derivatives qualifying for cash flow hedges, defined benefit plans and foreign currency translation adjustments constitute OCI and are presented, with related income tax effects, in the accompanying consolidated statements of comprehensive income. OCI also includes changes in the instrument-specific credit risk on financial liabilities (“debt valuation adjustments” or “DVA”) accounted for under the fair value option.
Stock-Based Compensation —MUFG and certain of its subsidiaries have a stock compensation-type stock option plan (“Stock Option Plan”) for directors (excluding outside directors and directors serving as audit
F-26
Table of Contents
MITSUBISHI UFJ FINANCIAL GROUP, INC. AND SUBSIDIARIES
NOTES TO CONSOLIDATED FINANCIAL STATEMENTS—(Continued)
committee members), corporate executives, executive officers and senior fellows (collectively, “officers”). Compensation costs under the Stock Option Plan are recognized based on the grant date fair value of the stock option (“Stock Acquisition Rights”) over the period during officers are required to provide service in accordance with the terms of the plan. MUFG and certain of its subsidiaries also have performance-based stock compensation plan (“the Board Incentive Plan”). The awards granted under the Board Incentive Plan are classified as either liability for the part of award which are provided to officers in cash or equity for the part of award which are provided to officers in the common shares of MUFG. Compensation costs are recognized over the requisite service period for the entire awards. For awards classified as liability, compensation costs are measured based on the fair value calculated by the quoted price of common shares of MUFG at the date of fiscal year-end and remeasured at the end of each reporting period. Changes in quoted prices of common shares of MUFG between the date of grant and the settlement of awards are recognized in the period which the changes occur. For awards classified as equity, compensation costs are measured based on the grant date fair value by the quoted price of the common shares of MUFG for employees or the fair value as of earlier of the date the performance commitment is reached or the date of completion of officers’ performance for nonemployees. See Note 33 for further discussion of stock-based compensation plans.
Reclassifications
Certain reclassifications and format changes have been made to the consolidated financial statements for the fiscal years ended March 31, 2017 and 2018 to conform to the presentation for the fiscal year ended March 31, 2019. These reclassifications and format changes include reclassifications of equity investment securities from “Available-for-sale securities” and “Other investment securities” to a new line labeled as “Equity securities” within Investment securities in the consolidated balance sheet to report all marketable and nonmarketable equity investment securities separately from Available-for-sale debt securities and Held-to-maturity debt securities. The related cash flows were also reclassified from “Proceeds from sales and maturities of Available-for-sale securities” and “Proceeds from sales and redemption of Other investment securities” to “Proceeds from sales and redemption of Equity securities”, and from “Purchases of Available-for-sale securities” and “Purchases of Other investment securities” to “Purchases of Equity securities” in cash flows from investing activities in the consolidated statements of cash flows. These reclassifications and format changes did not result in a change to previously reported financial condition, results of operations, and cash flows.
Accounting Changes
Revenue from Contracts with Customers— In May 2014, the FASB issued new guidance which supersedes the then-current revenue recognition requirements, including most industry-specific guidance. The core principle of the guidance is that an entity should recognize revenue to depict the transfer of promised goods or services to customers in an amount that reflects the consideration to which the entity expects to be entitled in exchange for those goods or services. The guidance also requires additional disclosures about the nature, amount, timing and uncertainty of revenue and cash flows arising from contracts with customers, including significant judgments and changes in judgments, and assets recognized from the costs incurred to obtain or fulfill a contract. In March 2016, the FASB issued further guidance related to the principal-versus-agent assessment which requires an entity to determine the nature of the promise to the customer by identifying each specified good or service to be provided and assessing whether an entity controls each specified good or service before that good or service is transferred to the customer. In addition, in April 2016, the FASB issued guidance clarifying certain aspects of identification of promised goods or services and provides implementation guidance on licensing of intellectual property. Furthermore, in May 2016, the FASB issued guidance which amends the guidance on assessing collectibility, presentation of sales taxes, noncash consideration, and contract modifications and completed contracts at transition, and on disclosure around transition. In December 2016, the FASB issued additional
F-27
Table of Contents
MITSUBISHI UFJ FINANCIAL GROUP, INC. AND SUBSIDIARIES
NOTES TO CONSOLIDATED FINANCIAL STATEMENTS—(Continued)
guidance which amends the new revenue standard to clarify certain aspects, including the scope and disclosure requirements. This guidance is effective for annual reporting periods beginning after December 15, 2017, including interim periods within that reporting period. The MUFG Group adopted the guidance on April 1, 2018 on a modified retrospective method, and there was no material impact on its financial position and results of operations. For additional information, see Note 28.
Recognition and Measurement of Financial Assets and Financial Liabilities— In January 2016, the FASB issued new guidance which requires equity investments, except those accounted for under the equity method of accounting or those that result in consolidation of the investee, to be measured at fair value with changes in fair value recognized in net income. However, for equity investments that do not have readily determinable fair values, the fair value may be measured at cost minus impairment, if any, plus or minus changes resulting from observable price changes in orderly transactions for the identical or a similar investment of the same issuer(“the measurement alternative”), and the impairment assessment is simplified by performing a qualitative assessment to identify impairments. For financial liabilities which were elected to measure at fair value in accordance with the fair value option, this guidance also requires an entity to present separately in other comprehensive income the portion of the changes in the fair value of financial liabilities resulting from a change in the instrument-specific credit risk. In addition, this guidance eliminates the requirement to disclose the methods and significant assumptions used to estimate the fair value for financial instruments measured at amortized cost, and clarifies, for disclosure purposes, the requirement for the use of an exit price notion in the determination of the fair value of financial instruments measured at amortized cost. This guidance also clarifies that an entity must evaluate the need for a valuation allowance on a deferred tax asset related to available-for-sale securities in combination with the entity’s other deferred tax assets. This guidance is effective for annual reporting periods beginning after December 15, 2017, including interim periods within that reporting period. Early adoption is not permitted except for the amendments related to the accounting for financial liabilities under the fair value option. In February 2018, the FASB issued additional guidance to improve certain aspects of the new guidance. The MUFG Group adopted the guidance on April 1, 2018. Upon adoption, the MUFG Group recorded an increase in the beginning balance of retained earnings as of April 1, 2018 of ¥2,702 billion, with a corresponding decrease in Accumulated OCI, net of taxes. Other amendments required under the new guidance did not have a material impact on the MUFG Group’s financial position and results of operations. As a result of adopting this guidance, marketable equity investment securities are measured at fair value with unrealized gains or losses reflected in net income. Prior to adoption, such unrealized gains and losses were reflected in other comprehensive income. Nonmarketable equity investment securities previously accounted for under the cost method of accounting are now measured at cost minus impairment, if any, plus or minus changes resulting from observable price changes.
Recognition of Breakage for Certain Prepaid Stored-Value Products— In March 2016, the FASB issued new guidance which clarifies that liabilities related to the sale of certain prepaid stored-value products are financial liabilities. The guidance also provides a narrow scope exception to the guidance on extinguishments of liabilities to require that breakage for those liabilities be accounted for consistent with the breakage model required by the guidance on revenue from contracts with customers for non-financial liabilities. This guidance is effective for fiscal years beginning after December 15, 2017, including interim periods within those fiscal years. Early application is permitted, including adoption in an interim period. The MUFG Group adopted this guidance on April 1, 2018. Upon adoption, the MUFG Group recorded an increase in the beginning balance of retained earnings as of April 1, 2018 of ¥1,784 million, net of taxes.
Classification of Certain Cash Receipts and Cash Payments— In August 2016, the FASB issued new guidance which provides specific guidance on eight cash flow classification issues to reduce diversity in practice. This guidance is effective for fiscal years beginning after December 15, 2017, including interim periods within those fiscal years. Early adoption is permitted. Since this guidance only impacts classification in the statement of
F-28
Table of Contents
MITSUBISHI UFJ FINANCIAL GROUP, INC. AND SUBSIDIARIES
NOTES TO CONSOLIDATED FINANCIAL STATEMENTS—(Continued)
cash flows, adoption will not affect the MUFG Group’s consolidated statements of income or consolidated balance sheets. The MUFG Group adopted this guidance on April 1, 2018, and there was no material impact on its consolidated statements of cash flows.
Intra-Entity Transfers of Assets Other Than Inventory— In October 2016, the FASB issued new guidance which simplifies the accounting for the income tax consequences of intra-entity transfers of assets other than inventory. Under current U.S. GAAP, the recognition of current and deferred income taxes for an intra-entity asset transfer is prohibited until the asset has been sold to an outside party. This guidance eliminates this exception for all intra-entity sales of assets other than inventory. This guidance is effective for annual reporting periods beginning after December 15, 2017, including interim periods within those annual reporting periods. Early adoption is permitted. The MUFG Group adopted this guidance on April 1, 2018, and there was no material impact on its financial position and results of operations.
Clarifying the Definition of a Business —In January 2017, the FASB issued new guidance which clarifies the definition of a business with the objective of adding guidance to assist entities with evaluating whether transactions should be accounted for as acquisitions (or disposals) of assets or businesses. This guidance requires that when substantially all of the fair value of the gross assets acquired (or disposed of) is concentrated in a single identifiable asset or a group of similar identifiable assets, an integrated set of assets and activities is not a business. This guidance also requires that to be considered a business, an integrated set of assets and activities must include, at a minimum, an input and a substantive process that together significantly contribute to the ability to create outputs, provides a framework to evaluate whether both an input and a substantive process are present, and removes the current requirement to assess if a market participant could replace any missing elements. Furthermore, this guidance narrows the definition of outputs so that the term is consistent with how outputs are described in the new revenue standard. This guidance is effective for annual periods beginning after December 15, 2017, including interim periods within those periods. Early application is permitted for transactions that occur in a period for which financial statements have not been issued. The MUFG Group adopted this guidance on April 1, 2018, and there was no material impact on its financial position and results of operations.
Clarifying the Scope of Asset Derecognition Guidance and Accounting for Partial Sales of Nonfinancial Assets —In February 2017, the FASB issued new guidance which clarifies the scope of the guidance on derecognition of nonfinancial assets and provides guidance on the accounting for partial sales of nonfinancial assets. This guidance defines an in substance nonfinancial asset, unifies guidance related to partial sales of nonfinancial assets, eliminates rules specifically addressing sales of real estate, removes exceptions to the financial asset derecognition model, and clarifies the accounting for contributions of nonfinancial assets to joint venture. The effective date and early adoption of this guidance will be the same as the effective date and early adoption of the new revenue standard. The MUFG Group adopted this guidance on April 1, 2018, and there was no material impact on its financial position and results of operations.
Improving the Presentation of Net Periodic Pension Cost and Net Periodic Postretirement Benefit Cost —In March 2017, the FASB issued new guidance which requires that an employer report the service cost component in the same line item or items as other compensation costs arising from services rendered by the pertinent employees during the period. The other components of net benefit cost are required to be presented in the income statement separately from the service cost component and outside a subtotal of income from operations, if one is presented. This guidance also allows only the service cost component to be eligible for capitalization when applicable. This guidance is effective for annual periods beginning after December 15, 2017, including interim periods within those annual periods. Early adoption is permitted as of the beginning of an annual period for which financial statements (interim or annual) have not been issued. The MUFG Group retrospectively adopted
F-29
Table of Contents
MITSUBISHI UFJ FINANCIAL GROUP, INC. AND SUBSIDIARIES
NOTES TO CONSOLIDATED FINANCIAL STATEMENTS—(Continued)
this guidance on April 1, 2018 using the practical expedient permitted by this guidance and reclassified the non-service cost components of net pension benefit/cost to Other non-interest expenses, and there was no material impact on its financial position and results of operation. See Note 13 for further information.
Scope of Modification Accounting —In May 2017, the FASB issued new guidance which clarifies when to account for a change to the terms or conditions of a share-based payment award as a modification. Under this guidance, modification accounting is required only if the fair value, the vesting conditions, or the classification of the award changes as a result of the change in terms or conditions. This guidance is effective for annual periods, and interim periods within those annual periods, beginning after December 15, 2017. Early adoption is permitted, including adoption in any interim period, for which financial statements have not yet been issued. The MUFG Group adopted this guidance on April 1, 2018, and there was no material impact on its financial position and results of operations.
Disclosure Framework — Changes to the Disclosure Requirements for Fair Value Measurement —In August 2018, the FASB issued new guidance which modifies the disclosure requirements on fair value measurements. This guidance removes disclosure requirements for the amount of and reasons for transfers between Level 1 and Level 2 of the fair value hierarchy, the policy for timing of transfers between levels, and valuation processes for Level 3 fair value measurements. In addition, the guidance modifies disclosure requirements for investments in certain entities that calculate net asset value and modifies disclosure requirements related to measurement uncertainty. Lastly, the guidance adds disclosure requirements for changes in unrealized gains and losses for the period that are included in other comprehensive income for recurring Level 3 fair value measurements held at the end of the reporting period, and the guidance adds disclosure requirements related to the range and weighted average of significant unobservable inputs used to develop Level 3 fair value measurements. This guidance is effective for fiscal years, and interim periods within those fiscal years, beginning after December 15, 2019. Early adoption is permitted upon issuance of this guidance. An entity is permitted to early adopt any removed or modified disclosures upon issuance of this guidance and delay adoption of the additional disclosures until their effective date. The MUFG Group early adopted removal disclosure requirements as of March 31, 2019 and will adopt other requirements of this guidance on or prior to the effective date. The guidance affected disclosures in the notes to the consolidated financial statements and did not affect its financial position and results of operations. See Note 32 for further information.
Recently Issued Accounting Pronouncements
Leases— In February 2016, the FASB issued new guidance which requires that lessees recognize in the statement of financial position a liability to make lease payments (the lease liability) and a right-of-use asset representing its right to use the underlying asset for the lease term. The accounting applied by lessors is largely unchanged, but the accounting model for leveraged leases is not retained for leases that commence after the effective date of this guidance. This guidance also requires entities to provide qualitative and quantitative disclosures about the amount, timing and uncertainty of cash flows arising from leases. This guidance is effective for fiscal years beginning after December 15, 2018, including interim periods within those fiscal years. Early application is permitted.
The MUFG Group adopted this guidance on April 1, 2019 under a modified retrospective approach, and recorded approximately ¥0.4 trillion of right-of-use assets and ¥0.5 trillion of lease liabilities on the MUFG Group’s consolidated balance sheet. The adoption of this guidance was not material to the MUFG Group’s results of operations.
Measurement of Credit Losses on Financial Instruments— In June 2016, the FASB issued new guidance which replaces the incurred loss impairment methodology in current U.S. GAAP with a methodology that reflects
F-30
Table of Contents
MITSUBISHI UFJ FINANCIAL GROUP, INC. AND SUBSIDIARIES
NOTES TO CONSOLIDATED FINANCIAL STATEMENTS—(Continued)
expected credit losses and requires consideration of a broader range of reasonable and supportable information to estimate credit losses. Under this guidance, the measurement of expected credit losses is based on relevant information about past events, including historical experience, current conditions, and reasonable and supportable forecasts that affect the collectibility of the reported amount of the financial asset (or a group of financial assets) measured at amortized cost basis. For available-for-sale debt securities, a credit loss is recorded through an allowance for credit losses and the amount of the allowance is limited to the amount by which fair value is below amortized cost. For purchased financial assets with a more-than-insignificant amount of credit deterioration since origination that are measured at amortized cost basis, the initial allowance for credit losses is added to the purchase price rather than being reported as a credit loss expense, only subsequent changes in the allowance are recorded as a credit loss expense, and interest income is recognized based on the effective interest rate, excluding the discount embedded in the purchase price that is attributable to the acquirer’s assessment of credit losses at acquisition. This guidance also expands the disclosure requirements regarding an entity’s assumptions, models, and methods for estimating the allowance, and requires the entity to disclose the amortized cost balance for each class of financial asset by credit quality indicator, disaggregated by the year of origination. In April 2019, the FASB issued additional guidance to improve certain aspects of this guidance. This guidance is effective for fiscal years beginning after December 15, 2019, including interim periods within those fiscal years. Early adoption is permitted for fiscal years beginning after December 15, 2018, including interim periods within those fiscal years. The MUFG Group is currently evaluating what effect the guidance above will have on its consolidated financial statements and related disclosures. The MUFG Group’s implementation efforts include identifying key interpretive issues, assessing the impact and developing credit forecasting models and processes.
Simplifying the Test for Goodwill Impairment —In January 2017, the FASB issued new guidance which simplifies how an entity is required to test goodwill for impairment by eliminating Step 2 from the goodwill impairment test. Under Step 2, an entity had to perform procedures to determine the fair value at the impairment testing date of its assets and liabilities (including unrecognized assets and liabilities) following the procedure that would be required in determining the fair value of assets acquired and liabilities assumed in a business combination. This guidance eliminates Step 2 and instead requires an entity to perform its goodwill impairment test by comparing the fair value of a reporting unit with its carrying amount. This guidance also eliminates the requirements for any reporting unit with a zero or negative carrying amount to perform a qualitative assessment and, if it fails that qualitative test, to perform Step 2 of the goodwill impairment test, and instead requires the disclosure of the amount of goodwill allocated to each reporting unit with a zero or negative carrying amount of net assets. This guidance is effective for its annual or any interim goodwill impairment tests in fiscal years beginning after December 15, 2019. Early adoption is permitted for interim or annual goodwill impairment tests performed on testing dates after January 1, 2017. The MUFG Group is currently evaluating what effect the guidance will have on its consolidated financial statements and related disclosures.
Premium Amortization on Purchased Callable Debt Securities —In March 2017, the FASB issued new guidance which shortens the amortization period for certain callable debt securities held at a premium, specifically requiring the premium to be amortized to the earliest call date. This guidance does not require an accounting change for securities held at a discount, and the discount continues to be amortized to maturity. This guidance is effective for fiscal years, and interim periods within those fiscal years, beginning after December 15, 2018. Early adoption is permitted, including adoption in an interim period. The MUFG Group is currently evaluating what effect the guidance will have on its consolidated financial statements and related disclosures.
Targeted Improvements to Accounting for Hedging Activities —In August 2017, the FASB issued new guidance which better aligns an entity’s risk management activities and financial reporting for hedging relationships through changes to both the designation and measurement guidance for qualifying hedging relationships and the presentation of hedge results. To meet that objective, this guidance expands and refines
F-31
Table of Contents
MITSUBISHI UFJ FINANCIAL GROUP, INC. AND SUBSIDIARIES
NOTES TO CONSOLIDATED FINANCIAL STATEMENTS—(Continued)
hedge accounting for both nonfinancial and financial risk components and aligns the recognition and presentation of the effects of the hedging instrument and the hedged item in the financial statements. In addition, this guidance includes certain targeted improvements to ease the application of current guidance related to the assessment of hedge effectiveness. This guidance also modifies the requirement to disclose the effect on the income statement of fair value and cash flow hedges, eliminates the requirement to disclose the ineffective portion of the change in fair value of hedging instruments, and requires new tabular disclosures related to cumulative basis adjustments for fair value hedges. This guidance is effective for fiscal years beginning after December 15, 2018, and interim periods within those fiscal years. Early application is permitted in any interim period after issuance of this guidance. The MUFG Group does not expect that the adoption of this guidance will have a material impact on its consolidated financial statements and related disclosures.
Improvements to Nonemployee Share-Based Payment Accounting —In June 2018, the FASB issued new guidance which largely aligns the accounting for share-based payment awards issued to employees and nonemployees. Under this guidance, equity-classified share-based payment awards issued to nonemployees are measured at the grant date, instead of the previous requirement to measure the awards at the earlier of the date at which the performance commitment is reached or the date of performance completion. For awards issued to nonemployees with performance conditions, compensation cost associated with the awards is recognized when achievement of the performance condition is probable, instead of the previous requirement to recognize the costs based on the lowest aggregate fair value. This guidance also eliminates the previous requirement to reassess the classification for certain nonemployee awards upon vesting. This guidance is effective for fiscal years beginning after December 15, 2018, including interim periods within that fiscal year. Early adoption is permitted, but no earlier than an entity’s adoption date of the new revenue standard. The MUFG Group is currently evaluating what effect the guidance will have on its consolidated financial statements and related disclosures.
Disclosure Framework—Changes to the Disclosure Requirements for Defined Benefit Plans —In August 2018, the FASB issued new guidance which modifies the disclosure requirements for employers that sponsor defined benefit pension or other postretirement plans. This guidance removes certain disclosure requirements, including amounts in Accumulated OCI expected to be recognized as components of net periodic benefit cost over the next fiscal year and the amount and timing of plan assets expected to be returned to the employer, clarifies disclosure requirements for defined benefit plans with projected or accumulated benefit obligations in excess of plan assets, and adds disclosure requirements for weighted-average interest crediting rates for cash balance plans and other plans with promised interest crediting rates as well as an explanation of the reasons for significant gains and losses related to changes in the benefit obligation for the period. This guidance is effective for fiscal years ending after December 15, 2020. Early adoption is permitted. The MUFG Group is currently evaluating what effect the guidance will have on its disclosures.
Customer’s Accounting for Implementation Costs Incurred in a Cloud Computing Arrangement That Is a Service Contract— In August 2018, the FASB issued new guidance which aligns the requirements for capitalizing implementation costs incurred in a hosting arrangement that is a service contract with the requirements for capitalizing implementation costs incurred to develop or obtain internal-use software. This guidance requires an entity (customer) in a hosting arrangement that is a service contract to follow the guidance on internal-use software to determine which implementation costs to capitalize as an asset related to the service contract and which costs to expense. This guidance also requires the entity (customer) to expense the capitalized implementation costs of a hosting arrangement that is a service contract over the term of the hosting arrangement, apply the existing impairment guidance on internal-use software to the capitalized implementation costs as if the costs were long-lived assets, and present the capitalized-implementation-cost-related items in the same line items in the financial statements as those relating to fees associated with the hosting element (service) of the arrangement. This guidance is effective for fiscal years beginning after December 15, 2019, and interim periods
F-32
Table of Contents
MITSUBISHI UFJ FINANCIAL GROUP, INC. AND SUBSIDIARIES
NOTES TO CONSOLIDATED FINANCIAL STATEMENTS—(Continued)
within those fiscal years. Early adoption is permitted, including adoption in any interim period. The MUFG Group is currently evaluating what effect the guidance will have on its consolidated financial statements and related disclosures.
Inclusion of the Secured Overnight Financing Rate (SOFR) Overnight Index Swap (OIS) Rate as a Benchmark Interest Rate for Hedge Accounting Purposes —In October 2018, the FASB issued new guidance which permits use of the Overnight Index Swap (“OIS”) rate based on Secured Overnight Financing Rate as a U.S. benchmark interest rate for hedge accounting purposes in addition to the interest rates on direct Treasury obligations of the U.S. government, the London Interbank Offered Rate (“LIBOR”), the OIS rate based on the Fed Funds Effective Rate, and the Securities Industry and Financial Markets Association Municipal Swap Rate. This guidance is effective for fiscal years beginning after December 15, 2018, and interim periods within those fiscal years. Early adoption is permitted in any interim period upon issuance of this guidance if an entity already has adopted the new hedge accounting standard. The MUFG Group is currently evaluating what effect the guidance will have on its consolidated financial statements and related disclosure.
| 2. | BUSINESS DEVELOPMENTS |
MUFG Bank’s Acquisition of Security Bank Corporation’s shares
On April 1, 2016, MUFG Bank acquired newly issued common shares and preferred shares with voting rights of Security Bank Corporation (“Security Bank”), representing in the aggregate approximately 20.0% of Security Bank’s equity interest for ¥91,993 million. Security Bank is listed on the Philippines Stock Exchange and is not part of any local conglomerate in the Philippines. Considering both MUFG Bank’s ownership of the common stock and preferred stock and representation on the board of directors, the MUFG Group has determined that MUFG Bank has the ability to exercise significant influence over the operating and financial policies of Security Bank and applied the equity method of accounting for its investment.
Mitsubishi UFJ Trust and Banking’s Acquisition of Capital Analytics II LLC
On April 30, 2016, Mitsubishi UFJ Trust and Banking acquired 100% ownership of Capital Analytics II LLC for ¥4,494 million in cash, and thereby recorded goodwill of ¥2,858 million and intangible assets of ¥1,388 million. Capital Analytics II LLC is an overseas fund management company that mainly provides fund administration services for private equity funds. The purpose of this acquisition is to meet the diversified global fund administration needs of its Japanese and overseas customers through the utilization of Capital Analytics II LLC’s unparalleled operational expertise and the MUFG Group’s extensive network. Upon conclusion of the acquisition, Capital Analytics II LLC was renamed MUFG Capital Analytics LLC. During the fiscal year ended March 31, 2017, measurement period adjustments were applied to the acquisition date fair values, which decreased goodwill by ¥115 million.
Krungsri’s Acquisition of Hattha Kaksekar Limited
On September 12, 2016, Krungsri acquired 100% ownership of Hattha Kaksekar Limited for ¥15,703 million in cash, and thereby recorded goodwill of ¥8,280 million and intangible assets of ¥476 million.
Hattha Kaksekar Limited is a financial institution in Cambodia providing financial services primarily to sole proprietors. The purpose of this acquisition is to enable the MUFG Group to tap into the growth of the Cambodian market by leveraging the knowhow of Ngern Tid Lor Co., Ltd., a subsidiary of Krungsri engaged in microfinance in Thailand, with an aim to promote and develop the microfinance business.
F-33
Table of Contents
MITSUBISHI UFJ FINANCIAL GROUP, INC. AND SUBSIDIARIES
NOTES TO CONSOLIDATED FINANCIAL STATEMENTS—(Continued)
MUFG’s Acquisition of Hitachi Capital Corporation’s shares
On October 3, 2016, MUFG acquired 23.0% of the common shares of Hitachi Capital Corporation (“Hitachi Capital”) for ¥91,877 million from Hitachi, Ltd. Considering both MUFG’s ownership of the common stock and representation on the board of directors, the MUFG Group has determined that MUFG has the ability to exercise significant influence over the operating and financial policies of Hitachi Capital and applied the equity method of accounting for its investment.
Mitsubishi UFJ Trust and Banking’s Acquisition of Rydex Fund Services, LLC
On October 4, 2016, Mitsubishi UFJ Trust and Banking acquired 100% ownership of Rydex Fund Services, LLC for ¥17,431 million in cash, and thereby recorded goodwill of ¥5,232 million and intangible assets of ¥11,507 million. Rydex Fund Services, LLC is an overseas fund management company that mainly provides fund administration services for funds established under the 1940 Investment Companies Act of the United States. The purpose of this acquisition is to meet the diversified global fund administration needs of its Japanese and overseas customers through the utilization of Rydex Fund Services, LLC’s unparalleled operational expertise and the MUFG Group’s extensive network. Upon conclusion of the acquisition, Rydex Fund Services, LLC was renamed MUFG Investor Services (US), LLC.
Mitsubishi UFJ NICOS Became a Wholly-Owned Subsidiary
On May 15, 2017, MUFG and its subsidiary Mitsubishi UFJ NICOS entered into a share exchange agreement for MUFG to acquire the remaining 15.02% ownership of Mitsubishi UFJ NICOS by agreeing, on October 2, 2017, to pay ¥50,000 million cash to the only holder of Mitsubishi UFJ NICOS common stock other than MUFG. The transaction was accounted for as a non-cancellable forward purchase contract. Accordingly, a liability of ¥50,000 million was recognized in Other liabilities on the accompanying consolidated balance sheet with a corresponding reduction in Noncontrolling interests of ¥15,390 million and Capital surplus of ¥34,751 million, and an increase in Accumulated OCI, net of taxes of ¥141 million. On October 2, 2017, MUFG settled Other liabilities of ¥50,000 million. The purpose of making a wholly-owned subsidiary is to effect a shift in posture enabling a more flexible response to changes in the business environment and the swift pursuit of group synergies.
Acquisition of shares in Bank Danamon in Indonesia
On December 26, 2017, MUFG Bank entered into conditional share purchase agreements with Asia Financial (Indonesia) Pte. Ltd. (“AFI”) and other affiliated entities (the “Sellers”) to acquire their 73.8% equity interests in an Indonesian bank, PT Bank Danamon Indonesia, Tbk. (“Danamon”), subject to applicable regulatory approvals.
Danamon, which was established in 1956, is the fifth most profitable Indonesian commercial bank in terms of net income. Danamon provides banking and financial products and services to consumer, micro-finance, small and medium enterprise (“SME”) and corporate customers, with a network of around 1,800 offices in Indonesia.
MUFG Bank intends to establish an integrated and comprehensive services platform that serves as a gateway for clients wishing to make inroads into Indonesia’s growing economy as well as local companies seeking to expand into the region. This investment is also expected to strategically allow MUFG Bank to benefit from Danamon’s foothold in the developing local retail and SME segments to deepen its banking franchise in Indonesia.
F-34
Table of Contents
MITSUBISHI UFJ FINANCIAL GROUP, INC. AND SUBSIDIARIES
NOTES TO CONSOLIDATED FINANCIAL STATEMENTS—(Continued)
This strategic investment by MUFG Bank will be executed through three steps (the “Proposed Transaction”), and the completion of the Proposed Transaction will result in MUFG Bank becoming the largest shareholder in Danamon and Danamon becoming a consolidated subsidiary of MUFG Bank.
In Step 1, MUFG Bank acquired an initial 19.9% equity interest in Danamon from the Sellers on December 29, 2017, based on a price of IDR 8,323 (approximately ¥70 (1) ) per share, for an investment amount of IDR 15,875 billion (approximately ¥133 billion (1) ). The price was based on a price book-value ratio of 2.0 calculated on the basis of Danamon’s net assets as of September 30, 2017 with certain adjustments applied. AFI continues to be the majority shareholder in Danamon after closing of Step 1. MUFG Bank classified Danamon’s equity securities as Available-for-sale securities on the acquisition date.
In Step 2, MUFG Bank acquired an additional 20.1% equity interest in Danamon from the Sellers on August 3, 2018, based on a price of IDR 8,921 (approximately ¥69 (2) ) per share, for an investment amount of IDR 17,187 billion (approximately ¥132.3 billion (2) ). The price was based on a price book-value ratio of 2.0 calculated on the basis of Danamon’s net assets as of June 30, 2018 with certain adjustments applied. As a result, equity interest in Danamon increased to 40%, and MUFG Bank started to apply the equity method of accounting for its investment in Danamon during the six months ended September 30, 2018.
In Step 3, MUFG Bank intends to seek the necessary approvals to increase its equity interest in Danamon beyond the 40%, and this will provide an opportunity for all other existing Danamon shareholders to either remain as shareholders or receive cash from MUFG Bank. With the closing of Step 3, MUFG Bank’s final equity interest in Danamon is expected to be above 73.8%. The prices for Danamon’s shares in Step 3 will be based on a similar approach as Step 1 and Step 2. See Note 35 for further developments on acquisition of shares in Danamon.
Notes:
| (1) | Calculated based on the exchange rate of IDR1 = ¥0.0084 |
| (2) | Calculated based on the exchange rate of IDR1 = ¥0.0077 |
Acquisition of Colonial First State Global Asset Management
On October 31, 2018, Mitsubishi UFJ Trust and Banking entered into a Share Sale Deed with Commonwealth Bank of Australia (“CBA”), and its wholly-owned subsidiary, Colonial First State Group Limited (the “Seller”) to acquire 100% of the shares in each of nine subsidiaries of the Seller, which collectively represent CBA’s global asset management business known as Colonial First State Global Asset Management (“CFSGAM”), for approximately ¥328 billion or approximately AUD 4.0 billion, subject to applicable regulatory and other approvals and certain conditions.
CFSGAM is the third largest asset management group by assets under management in Asian markets excluding Japan, offers a wide range of products including equities, fixed income and alternatives, and has specialist capabilities in Asian and emerging equity markets, alternatives (property and infrastructure), as well as passive and other products. The investment in CFSGAM aims to meet various client needs by expanding product lineup and enhancing presence as the largest asset management firm in the Asia and Oceania region.
Acquisition of DVB Bank SE’s Aviation Finance Division
On March 1, 2019, MUFG Bank and its consolidated subsidiary, BOT Lease Co., Ltd. (“BOT Lease”), entered into an agreement with DVB Bank SE (“DVB”) to transfer DVB’s aviation finance division to MUFG Bank and BOT Lease, subject to applicable regulatory and other approvals and certain conditions. Under the agreement, the entire aviation finance client lending portfolio of approximately ¥716.3 billion or approximately €5.6 billion, employees, and other parts of the operating infrastructure will be transferred to MUFG Bank. In addition, DVB’s aviation investment management and asset management businesses will be transferred to a newly established subsidiary of BOT Lease.
F-35
Table of Contents
MITSUBISHI UFJ FINANCIAL GROUP, INC. AND SUBSIDIARIES
NOTES TO CONSOLIDATED FINANCIAL STATEMENTS—(Continued)
The purpose of the transaction is to improve the MUFG Group’s ability to offer bespoke solutions to its clients by enhancing its global corporate investment banking business platform in terms of higher returns, diversifying its portfolio, broadening its customer base, and securing experienced professionals.
| 3. | INVESTMENT SECURITIES |
The following tables present the amortized cost, gross unrealized gains and losses, and fair value of Available-for-sale debt securities, Held-to-maturity debt securities, and Marketable equity securities included in Available-for-sale securities at March 31, 2018, and Available-for-sale debt securities and Held-to-maturity debt securities at March 31, 2019:
|
At March 31, 2018: |
Amortized
cost |
Gross
unrealized gains |
Gross
unrealized losses |
Fair value | ||||||||||||
| (in millions) | ||||||||||||||||
|
Available-for-sale debt securities: |
||||||||||||||||
|
Japanese national government and Japanese government agency bonds |
¥ | 24,272,345 | ¥ | 299,402 | ¥ | 3,843 | ¥ | 24,567,904 | ||||||||
|
Japanese prefectural and municipal bonds |
1,532,143 | 7,808 | 2,520 | 1,537,431 | ||||||||||||
|
Foreign government and official institution bonds |
2,207,662 | 8,938 | 44,908 | 2,171,692 | ||||||||||||
|
Corporate bonds |
1,104,799 | 15,589 | 1,028 | 1,119,360 | ||||||||||||
|
Residential mortgage-backed securities |
1,632,346 | 752 | 15,563 | 1,617,535 | ||||||||||||
|
Commercial mortgage-backed securities |
95,383 | 473 | 620 | 95,236 | ||||||||||||
|
Asset-backed securities |
1,546,989 | 12,775 | 1,415 | 1,558,349 | ||||||||||||
|
Other debt securities (1) |
165,002 | 3,635 | 3,030 | 165,607 | ||||||||||||
|
|
|
|
|
|
|
|
|
|||||||||
|
Total |
¥ | 32,556,669 | ¥ | 349,372 | ¥ | 72,927 | ¥ | 32,833,114 | ||||||||
|
|
|
|
|
|
|
|
|
|||||||||
|
Held-to-maturity debt securities: |
||||||||||||||||
|
Japanese national government and Japanese government agency bonds |
¥ | 1,100,807 | ¥ | 40,212 | ¥ | — | ¥ | 1,141,019 | ||||||||
|
Foreign government and official institution bonds |
59,330 | 383 | 103 | 59,610 | ||||||||||||
|
Residential mortgage-backed securities |
885,965 | 1,660 | 14,726 | (2) | 872,899 | |||||||||||
|
Commercial mortgage-backed securities |
171,647 | 4,107 | 1,018 | (2) | 174,736 | |||||||||||
|
Asset-backed securities |
1,365,192 | 8,438 | 1,222 | 1,372,408 | ||||||||||||
|
|
|
|
|
|
|
|
|
|||||||||
|
Total |
¥ | 3,582,941 | ¥ | 54,800 | ¥ | 17,069 | ¥ | 3,620,672 | ||||||||
|
|
|
|
|
|
|
|
|
|||||||||
|
Equity securities: |
||||||||||||||||
|
Marketable equity securities |
¥ | 2,789,392 | ¥ | 3,925,680 | ¥ | 43,488 | ¥ | 6,671,584 | ||||||||
|
|
|
|
|
|
|
|
|
|||||||||
|
Total |
¥ | 2,789,392 | ¥ | 3,925,680 | ¥ | 43,488 | ¥ | 6,671,584 | ||||||||
|
|
|
|
|
|
|
|
|
|||||||||
Notes:
| (1) | Other debt securities in the table above include ¥152,374 million of private placement debt conduit bonds. |
| (2) | MUFG Americas Holdings reclassified residential mortgage-backed securities and commercial mortgage-backed securities from Available-for-sale debt securities to Held-to-maturity debt securities during the fiscal year ended March 31, 2014. As a result of the reclassification of residential mortgage-backed securities and commercial mortgage-backed securities, the unrealized losses before taxes at the date of reclassification remaining in Accumulated OCI in the accompanying consolidated balance sheets were ¥3,457 million and ¥5,932 million, respectively, at March 31, 2018 and are not included in the table above. |
F-36
Table of Contents
MITSUBISHI UFJ FINANCIAL GROUP, INC. AND SUBSIDIARIES
NOTES TO CONSOLIDATED FINANCIAL STATEMENTS—(Continued)
|
At March 31, 2019: |
Amortized
cost |
Gross
unrealized gains |
Gross
unrealized losses |
Fair value | ||||||||||||
| (in millions) | ||||||||||||||||
|
Available-for-sale debt securities: |
||||||||||||||||
|
Japanese national government and Japanese government agency bonds |
¥ | 23,748,558 | ¥ | 330,115 | ¥ | 977 | ¥ | 24,077,696 | ||||||||
|
Japanese prefectural and municipal bonds |
2,203,978 | 22,593 | 5 | 2,226,566 | ||||||||||||
|
Foreign government and official institution bonds |
2,648,874 | 18,099 | 25,554 | 2,641,419 | ||||||||||||
|
Corporate bonds |
1,117,302 | 14,251 | 822 | 1,130,731 | ||||||||||||
|
Residential mortgage-backed securities |
1,635,220 | 1,469 | 21,338 | 1,615,351 | ||||||||||||
|
Commercial mortgage-backed securities |
132,996 | 310 | 2,351 | 130,955 | ||||||||||||
|
Asset-backed securities |
1,494,629 | 10,846 | 2,553 | 1,502,922 | ||||||||||||
|
Other debt securities (1) |
192,930 | 2,851 | 2,918 | 192,863 | ||||||||||||
|
|
|
|
|
|
|
|
|
|||||||||
|
Total |
¥ | 33,174,487 | ¥ | 400,534 | ¥ | 56,518 | ¥ | 33,518,503 | ||||||||
|
|
|
|
|
|
|
|
|
|||||||||
|
Held-to-maturity debt securities: |
||||||||||||||||
|
Japanese national government and Japanese government agency bonds |
¥ | 1,100,701 | ¥ | 41,619 | ¥ | — | ¥ | 1,142,320 | ||||||||
|
Foreign government and official institution bonds |
138,731 | 193 | 212 | 138,712 | ||||||||||||
|
Residential mortgage-backed securities |
910,990 | 1,209 | 21,202 | (2) | 890,997 | |||||||||||
|
Commercial mortgage-backed securities |
160,267 | 1,903 | 2,032 | (2) | 160,138 | |||||||||||
|
Asset-backed securities |
2,131,212 | 1,415 | 11,847 | 2,120,780 | ||||||||||||
|
|
|
|
|
|
|
|
|
|||||||||
|
Total |
¥ | 4,441,901 | ¥ | 46,339 | ¥ | 35,293 | ¥ | 4,452,947 | ||||||||
|
|
|
|
|
|
|
|
|
|||||||||
Notes:
| (1) | Other debt securities in the table above mainly include ¥112,822 million of private placement debt conduit bonds. |
| (2) | MUFG Americas Holdings reclassified residential mortgage-backed securities and commercial mortgage-backed securities from Available-for-sale debt securities to Held-to-maturity debt securities. As a result of the reclassification of residential mortgage-backed securities and commercial mortgage-backed securities, the unrealized losses before taxes at the date of reclassification remaining in Accumulated OCI in the accompanying consolidated balance sheets were ¥10,591 million and ¥4,667 million, respectively, at March 31, 2019 and are not included in the table above. |
F-37
Table of Contents
MITSUBISHI UFJ FINANCIAL GROUP, INC. AND SUBSIDIARIES
NOTES TO CONSOLIDATED FINANCIAL STATEMENTS—(Continued)
Contractual Maturities
The amortized cost and fair values of Held-to-maturity debt securities and the fair values of Available-for-sale debt securities at March 31, 2019 by contractual maturity are shown below. Expected maturities may be shorter than contractual maturities because issuers of debt securities may have the right to call or prepay obligations with or without penalties. Debt securities not due at a single maturity date and securities embedded with call or prepayment options, such as mortgage-backed securities, are included in the table below based on their contractual maturities.
|
Held-to-maturity
debt
securities |
Available-for-sale
debt securities |
|||||||||||
|
Amortized
cost |
Fair value | Fair value | ||||||||||
| (in millions) | ||||||||||||
|
Due in one year or less |
¥ | 74,173 | ¥ | 74,059 | ¥ | 12,539,746 | ||||||
|
Due from one year to five years |
332,491 | 341,814 | 10,847,990 | |||||||||
|
Due from five years to ten years |
1,405,140 | 1,434,699 | 5,316,284 | |||||||||
|
Due after ten years |
2,630,097 | 2,602,375 | 4,814,483 | |||||||||
|
|
|
|
|
|
|
|||||||
|
Total |
¥ | 4,441,901 | ¥ | 4,452,947 | ¥ | 33,518,503 | ||||||
|
|
|
|
|
|
|
|||||||
Realized Gains and Losses and Transfers of Investment Securities
For the fiscal years ended March 31, 2017 and 2018, gross realized gains on sales of Available-for-sale debt securities and marketable equity securities were ¥367,548 million and ¥330,508 million, respectively, and gross realized losses on sales of Available-for-sale debt securities and marketable equity securities were ¥63,031 million and ¥49,290 million, respectively.
For the fiscal year ended March 31, 2019, gross realized gains on sales of Available-for-sale debt securities were ¥45,244 million and gross realized losses on sales of Available-for-sale debt securities were ¥16,541 million.
For the fiscal year ended March 31, 2017, the MUFG Group transferred certain securities which had a carrying value of ¥14,142 million from Held-to-maturity securities to Available-for-sale securities in response to the Volcker Rule of the Dodd-Frank Act. These securities were sold and the MUFG Group recorded a profit of ¥669 million for the fiscal year ended March 31, 2017. The transfer was in accordance with the circumstances consistent with a Held-to-maturity classification, therefore, management has determined the transfer out of Held-to-maturity is consistent with the original designation and does not taint the remaining portfolio.
Other-than-temporary Impairments of Investment Securities
For the fiscal years ended March 31, 2017 and 2018, losses resulting from impairment of investment securities to reflect the decline in value considered to be other-than-temporary were ¥33,823 million and ¥8,196 million, respectively, which were included in Investment securities gains (losses)—net in the accompanying consolidated statements of income. The losses of ¥33,823 million for the fiscal year ended March 31, 2017 included losses of ¥32,038 million from marketable equity securities, ¥741 million from Available-for-sale debt securities which mainly comprised of corporate bonds, and ¥1,044 million from nonmarketable equity securities. The losses of ¥8,196 million for the fiscal year ended March 31, 2018 included losses of ¥6,660 million from marketable equity securities, ¥114 million from Available-for-sale debt securities which mainly comprised of corporate bonds, and ¥1,422 million from nonmarketable equity securities.
F-38
Table of Contents
MITSUBISHI UFJ FINANCIAL GROUP, INC. AND SUBSIDIARIES
NOTES TO CONSOLIDATED FINANCIAL STATEMENTS—(Continued)
For the fiscal year ended March 31, 2019, losses resulting from impairment of investment securities to reflect the decline in value considered to be other-than-temporary were ¥606 million, which were included in Investment securities gains (losses)—net in the accompanying consolidated statements of income. The losses of ¥606 million for the fiscal year ended March 31, 2019 was recorded substantially from Available-for-sale debt securities which mainly comprised of corporate bonds. Impairment of marketable equity securities is eliminated according to new guidance on recognition and measurement of financial assets and financial liabilities. The Available-for-sale securities (AFS category) is eliminated for equity securities and, therefore, OTTI review is not required for those securities.
Gross Unrealized Losses and Fair Value
The following tables show the gross unrealized losses and fair value of Available-for-sale debt securities, Held-to-maturity debt securities and Equity securities at March 31, 2018, and Available-for-sale debt securities, Held-to-maturity debt securities at March 31, 2019, by length of time that individual securities in each category have been in a continuous loss position:
| Less than 12 months | 12 months or more | Total | ||||||||||||||||||||||||||
|
At March 31, 2018: |
Fair value |
Gross
unrealized losses |
Fair value |
Gross
unrealized losses |
Fair value |
Gross
unrealized losses |
Number of
securities |
|||||||||||||||||||||
| (in millions, except number of securities) | ||||||||||||||||||||||||||||
|
Available-for-sale debt securities: |
||||||||||||||||||||||||||||
|
Japanese national government and Japanese government agency bonds |
¥ | 4,767,893 | ¥ | 2,701 | ¥ | 187,000 | ¥ | 1,142 | ¥ | 4,954,893 | ¥ | 3,843 | 140 | |||||||||||||||
|
Japanese prefectural and municipal bonds |
400,705 | 453 | 353,047 | 2,067 | 753,752 | 2,520 | 193 | |||||||||||||||||||||
|
Foreign government and official institution bonds |
846,818 | 16,955 | 818,937 | 27,953 | 1,665,755 | 44,908 | 157 | |||||||||||||||||||||
|
Corporate bonds |
312,993 | 856 | 74,717 | 172 | 387,710 | 1,028 | 150 | |||||||||||||||||||||
|
Residential mortgage-backed securities |
438,545 | 2,644 | 623,285 | 12,919 | 1,061,830 | 15,563 | 503 | |||||||||||||||||||||
|
Commercial mortgage-backed securities |
50,898 | 386 | 9,067 | 234 | 59,965 | 620 | 60 | |||||||||||||||||||||
|
Asset-backed securities |
144,073 | 1,403 | 5,345 | 12 | 149,418 | 1,415 | 29 | |||||||||||||||||||||
|
Other debt securities |
12,341 | 367 | 56,117 | 2,663 | 68,458 | 3,030 | 23 | |||||||||||||||||||||
|
|
|
|
|
|
|
|
|
|
|
|
|
|
|
|||||||||||||||
|
Total |
¥ | 6,974,266 | ¥ | 25,765 | ¥ | 2,127,515 | ¥ | 47,162 | ¥ | 9,101,781 | ¥ | 72,927 | 1,255 | |||||||||||||||
|
|
|
|
|
|
|
|
|
|
|
|
|
|
|
|||||||||||||||
|
Held-to-maturity debt securities: |
||||||||||||||||||||||||||||
|
Foreign government and official institution bonds |
¥ | 55,837 | ¥ | 103 | ¥ | — | ¥ | — | ¥ | 55,837 | ¥ | 103 | 10 | |||||||||||||||
|
Residential mortgage-backed securities |
299,286 | 3,487 | 451,968 | 11,239 | 751,254 | 14,726 | 332 | |||||||||||||||||||||
|
Commercial mortgage-backed securities |
2,150 | 2 | 169,065 | 1,016 | 171,215 | 1,018 | 32 | |||||||||||||||||||||
|
Asset-backed securities |
275,814 | 1,222 | — | — | 275,814 | 1,222 | 11 | |||||||||||||||||||||
|
|
|
|
|
|
|
|
|
|
|
|
|
|
|
|||||||||||||||
|
Total |
¥ | 633,087 | ¥ | 4,814 | ¥ | 621,033 | ¥ | 12,255 | ¥ | 1,254,120 | ¥ | 17,069 | 385 | |||||||||||||||
|
|
|
|
|
|
|
|
|
|
|
|
|
|
|
|||||||||||||||
|
Equity securities: |
||||||||||||||||||||||||||||
|
Marketable equity securities |
¥ | 448,489 | ¥ | 43,482 | ¥ | 28 | ¥ | 6 | ¥ | 448,517 | ¥ | 43,488 | 116 | |||||||||||||||
|
|
|
|
|
|
|
|
|
|
|
|
|
|
|
|||||||||||||||
|
Total |
¥ | 448,489 | ¥ | 43,482 | ¥ | 28 | ¥ | 6 | ¥ | 448,517 | ¥ | 43,488 | 116 | |||||||||||||||
|
|
|
|
|
|
|
|
|
|
|
|
|
|
|
|||||||||||||||
F-39
Table of Contents
MITSUBISHI UFJ FINANCIAL GROUP, INC. AND SUBSIDIARIES
NOTES TO CONSOLIDATED FINANCIAL STATEMENTS—(Continued)
| Less than 12 months | 12 months or more | Total | ||||||||||||||||||||||||||
|
At March 31, 2019: |
Fair value |
Gross
unrealized losses |
Fair value |
Gross
unrealized losses |
Fair value |
Gross
unrealized losses |
Number of
securities |
|||||||||||||||||||||
| (in millions, except number of securities) | ||||||||||||||||||||||||||||
|
Available-for-sale debt securities: |
||||||||||||||||||||||||||||
|
Japanese national government and Japanese government agency bonds |
¥ | 4,149,302 | ¥ | 976 | ¥ | 5,599 | ¥ | 1 | ¥ | 4,154,901 | ¥ | 977 | 39 | |||||||||||||||
|
Japanese prefectural and municipal bonds |
12,772 | 5 | — | — | 12,772 | 5 | 4 | |||||||||||||||||||||
|
Foreign government and official institution bonds |
397,718 | 1,125 | 1,160,671 | 24,429 | 1,558,389 | 25,554 | 179 | |||||||||||||||||||||
|
Corporate bonds |
163,615 | 776 | 79,758 | 46 | 243,373 | 822 | 92 | |||||||||||||||||||||
|
Residential mortgage-backed securities |
316,942 | 1,757 | 648,353 | 19,581 | 965,295 | 21,338 | 536 | |||||||||||||||||||||
|
Commercial mortgage-backed securities |
42,126 | 678 | 57,167 | 1,673 | 99,293 | 2,351 | 104 | |||||||||||||||||||||
|
Asset-backed securities |
164,738 | 2,553 | — | — | 164,738 | 2,553 | 87 | |||||||||||||||||||||
|
Other debt securities |
77,660 | 549 | 37,027 | 2,369 | 114,687 | 2,918 | 38 | |||||||||||||||||||||
|
|
|
|
|
|
|
|
|
|
|
|
|
|
|
|||||||||||||||
|
Total |
¥ | 5,324,873 | ¥ | 8,419 | ¥ | 1,988,575 | ¥ | 48,099 | ¥ | 7,313,448 | ¥ | 56,518 | 1,079 | |||||||||||||||
|
|
|
|
|
|
|
|
|
|
|
|
|
|
|
|||||||||||||||
|
Held-to-maturity debt securities: |
||||||||||||||||||||||||||||
|
Foreign government and official institution bonds |
¥ | — | ¥ | — | ¥ | 55,084 | ¥ | 212 | ¥ | 55,084 | ¥ | 212 | 10 | |||||||||||||||
|
Residential mortgage-backed securities |
74,180 | 1,199 | 798,165 | 20,003 | 872,345 | 21,202 | 457 | |||||||||||||||||||||
|
Commercial mortgage-backed securities |
3,154 | 37 | 155,011 | 1,995 | 158,165 | 2,032 | 32 | |||||||||||||||||||||
|
Asset-backed securities |
1,423,048 | 10,196 | 241,233 | 1,651 | 1,664,281 | 11,847 | 102 | |||||||||||||||||||||
|
|
|
|
|
|
|
|
|
|
|
|
|
|
|
|||||||||||||||
|
Total |
¥ | 1,500,382 | ¥ | 11,432 | ¥ | 1,249,493 | ¥ | 23,861 | ¥ | 2,749,875 | ¥ | 35,293 | 601 | |||||||||||||||
|
|
|
|
|
|
|
|
|
|
|
|
|
|
|
|||||||||||||||
Evaluating Investment Securities for Other-than-temporary Impairments
The following describes the nature of the MUFG Group’s investments and the conclusions reached in determining whether the unrealized losses were temporary or other-than-temporary.
Corporate bonds
As of March 31, 2019, unrealized losses associated with corporate bonds were primarily related to private placement bonds issued by Japanese non-public companies. The credit loss component recognized in earnings is identified as the amount of principal cash flows not expected to be received over the remaining terms of the bonds as estimated using the MUFG Group’s cash flow projections. The key assumptions include probability of default based on credit ratings of the bond issuers and loss given default.
F-40
Table of Contents
MITSUBISHI UFJ FINANCIAL GROUP, INC. AND SUBSIDIARIES
NOTES TO CONSOLIDATED FINANCIAL STATEMENTS—(Continued)
The following table presents a roll-forward of the credit loss component recognized in earnings. The balance at the beginning of each fiscal year represents the credit loss component for which OTTI occurred on debt securities in prior periods. The additions represent the first time a debt security was credit impaired or when subsequent credit impairment has occurred. The credit loss component is reduced when the corporate bonds mature or are sold.
| 2017 | 2018 | 2019 | ||||||||||
| (in millions) | ||||||||||||
|
Balance at beginning of fiscal year |
¥ | 6,691 | ¥ | 4,125 | ¥ | 3,499 | ||||||
|
Additions: |
||||||||||||
|
Initial credit impairments |
645 | 111 | 555 | |||||||||
|
Subsequent credit impairments |
96 | 3 | 51 | |||||||||
|
Reductions: |
||||||||||||
|
Securities sold or matured |
(3,307 | ) | (740 | ) | (2,344 | ) | ||||||
|
|
|
|
|
|
|
|||||||
|
Balance at end of fiscal year |
¥ | 4,125 | ¥ | 3,499 | ¥ | 1,761 | ||||||
|
|
|
|
|
|
|
|||||||
The cumulative declines in fair value of the credit impaired debt securities, which were mainly corporate bonds, held at March 31, 2018 and 2019 were ¥2,992 million and ¥1,069 million, respectively. Of which, the credit loss components recognized in earnings were ¥3,499 million and ¥1,761 million, and the remaining amounts related to all other factors recognized in Accumulated OCI before taxes were ¥507 million and ¥692 million at March 31, 2018 and 2019, respectively.
Residential mortgage-backed securities
As of March 31, 2019, unrealized losses on these securities were primarily driven by securities guaranteed by a U.S. government agency or a government-sponsored agency which are collateralized by residential mortgage loans. Unrealized losses mainly resulted from changes in interest rates and not from changes in credit quality. The MUFG Group analyzed that no OTTI was identified on such securities as of March 31, 2019 and no impairment loss has been recorded because the strength of the issuers’ guarantees through direct obligations or support from the U.S. government is expected to be sufficient to recover the entire amortized cost basis of these securities.
Asset-backed securities
As of March 31, 2019, unrealized losses on these securities were primarily driven by certain collateralized loan obligations (“CLOs”), highly illiquid securities for which fair values are difficult to determine. Unrealized losses arise from widening credit spreads, deterioration of the credit quality of the underlying collateral, uncertainty regarding the valuation of such securities and the market’s view of the performance of the fund managers. When the fair value of a security is lower than its amortized cost or when any security is subject to a deterioration in credit rating, the MUFG Group undertakes a cash flow analysis of the underlying collateral to estimate the OTTI and confirms the intent and ability to hold these securities until recovery. Based on the analysis performed, no OTTI was identified as of March 31, 2019 and no impairment loss has been recorded.
Other debt securities
As of March 31, 2019, other debt securities primarily consist of private placement debt conduit bonds, which are not rated by external credit rating agencies. The unrealized losses on these bonds result from a higher return on capital expected by the secondary market compared with the return on capital required at the time of
F-41
Table of Contents
MITSUBISHI UFJ FINANCIAL GROUP, INC. AND SUBSIDIARIES
NOTES TO CONSOLIDATED FINANCIAL STATEMENTS—(Continued)
origination when the bonds were purchased. The MUFG Group estimates loss projections for each security by assessing the underlying collateral of each security. The MUFG Group estimates the portion of loss attributable to credit based on the expected cash flows of the underlying collateral using estimates of current key assumptions such as probability of default and loss severity. Cash flow analysis of the underlying collateral provides an estimate of OTTI, which is performed when the fair value of a security is lower than its amortized cost and potential impairment is identified. Based on the analysis, no OTTI losses were recorded in the accompanying consolidated statements of income.
Marketable equity securities included in Equity Securities
The MUFG Group determines whether unrealized losses on marketable equity securities are temporary based on its ability and positive intent to hold the investments for a period of time sufficient to allow for any anticipated recovery and the results of its review conducted to identify and evaluate investments that have indications of possible impairment. Impairment is evaluated considering various factors, and their relative significance varies from case to case. The MUFG Group’s review includes, but is not limited to, consideration of the following factors:
The length of time that the fair value of the investment has been below cost —The MUFG Group generally deems a continued decline of fair value below cost for six months or more to be other-than-temporary.
The extent to which the fair value of investments has been below cost as of the end of the reporting period —The MUFG Group’s investment portfolio is exposed to volatile equity prices affected by many factors including investors’ perspectives as to future economic prospects and the issuers’ performance. The MUFG Group generally deems the decline in fair value below cost of 20% or more as an indicator of an other-than-temporary decline in fair value.
The financial condition and near-term prospects of the issuer —The MUFG Group considers the financial condition and near-term prospects of the issuer primarily based on the credit standing of the issuers as determined by its credit rating system.
At March 31, 2018, unrealized losses on marketable equity securities which have been in a continuous loss position are considered temporary based on the evaluation as described above.
OTTI of marketable equity securities is eliminated according to new guidance on recognition and measurement of financial assets and financial liabilities.
Equity Securities
The following table presents net realized losses on sales of equity securities, and net unrealized losses on equity securities still held at March 31, 2019.
|
Fiscal year ended
March 31, |
||||
| 2019 | ||||
| (in millions) | ||||
|
Net losses recognized during the period (1) |
¥ | (278,746 | ) | |
|
Less: |
||||
|
Net losses recognized during the period on equity securities sold during the period |
(3,303 | ) | ||
|
|
|
|||
|
Net unrealized losses recognized during the reporting period still held at the reporting date |
¥ | (275,443 | ) | |
|
|
|
|||
Note:
| (1) | Included in Investment securities gains (losses)—net. |
F-42
Table of Contents
MITSUBISHI UFJ FINANCIAL GROUP, INC. AND SUBSIDIARIES
NOTES TO CONSOLIDATED FINANCIAL STATEMENTS—(Continued)
Nonmarketable Equity Securities
Nonmarketable equity securities included in Equity securities were primarily carried at cost of ¥538,251 million at March 31, 2018, because their fair values were not readily determinable.
The remaining balances were nonmarketable equity securities included in Equity securities held by certain subsidiaries subject to specialized industry accounting principles for investment companies and broker-dealers and carried at fair value of ¥28,359 million at March 31, 2018. See Note 32 for the valuation techniques and inputs used to estimate the fair values.
With respect to cost-method investments of ¥97,586 million at March 31, 2018, the MUFG Group estimated a fair value using commonly accepted valuation techniques to determine whether the investments were impaired in each reporting period. See Note 32 for the details of these commonly accepted valuation techniques. If the fair value of the investment is less than the cost of the investment, the MUFG Group proceeds to evaluate whether the impairment is other-than-temporary.
With respect to cost-method investments of ¥440,665 million at March 31, 2018, the MUFG Group performed a test to determine whether any impairment indicators existed for each investment in each reporting period. If an impairment indicator exists, the MUFG Group estimates the fair value of the cost-method investment. If the fair value of the investment is less than the cost of the investment, the MUFG Group performs an evaluation of whether the impairment is other-than-temporary. The primary method the MUFG Group uses to identify impairment indicators is a comparison of the MUFG Group’s share of an investee’s net assets to the cost of the MUFG Group’s investment in the investee. The MUFG Group also considers whether significant adverse changes in the regulatory, economic or technological environment have occurred with respect to the investee. The MUFG Group periodically monitors the status of each investee including the credit rating, which is generally updated once a year based on the annual financial statements of the issuer. In addition, if an event that could impact the credit rating of an investee occurs, the MUFG Group reassesses the appropriateness of the credit rating assigned to the issuer in order to maintain an updated credit rating. The MUFG Group did not estimate the fair value of cost-method investments, which had aggregated costs of ¥437,486 million at March 31, 2018, since it was not practical and the MUFG Group identified no impairment indicators.
Based on the procedures described above, the MUFG Group recognized OTTI losses on the cost-method investments of ¥1,044 million and ¥1,422 million for the fiscal years ended March 31, 2017 and 2018, respectively. Each impairment loss was recognized based on the specific circumstances of each individual company. No impairment loss was individually material.
F-43
Table of Contents
MITSUBISHI UFJ FINANCIAL GROUP, INC. AND SUBSIDIARIES
NOTES TO CONSOLIDATED FINANCIAL STATEMENTS—(Continued)
Measurement Alternative of Equity Securities
The following table presents the carrying value of nonmarketable equity securities held at March 31, 2019, that were measured under the measurement alternative, and the related adjustments for these securities for the fiscal year ended March 31, 2019.
|
Fiscal year ended
March 31, |
||||
| 2019 | ||||
| (in millions) | ||||
|
Measurement alternative balance at March 31, 2019 |
¥ | 563,733 | ||
|
Measurement alternative impairment losses (1) |
¥ | (2,292 | ) | |
|
Measurement alternative downward changes for observable prices (1)(2) |
¥ | — | ||
|
Measurement alternative upward changes for observable prices (1)(2)(3) |
¥ | 53,077 | ||
Notes:
| (1) | Included in Investment securities gains (losses)—net. |
| (2) | Under the measurement alternative, nonmarketable equity securities are carried at cost plus or minus changes resulting from observable prices in orderly transactions for the identical or a similar investment of the same issuer. |
| (3) | The MUFG Group applied measurement alternative upward changes to certain nonmarketable equity securities, resulting from observable prices in orderly transactions, such as partial repurchase and transactions by other entities. |
| 4. | LOANS AND ALLOWANCE FOR CREDIT LOSSES |
Loans at March 31, 2018 and 2019 by domicile and industry of the borrower are summarized below. Classification of loans by industry is based on the industry segment loan classifications as defined by the Bank of Japan.
| 2018 | 2019 | |||||||
| (in millions) | ||||||||
|
Domestic: |
||||||||
|
Manufacturing |
¥ | 10,876,625 | ¥ | 11,153,996 | ||||
|
Construction |
781,262 | 717,664 | ||||||
|
Real estate |
11,763,769 | 11,706,419 | ||||||
|
Services |
2,689,086 | 2,653,191 | ||||||
|
Wholesale and retail |
7,989,080 | 7,643,397 | ||||||
|
Banks and other financial institutions (1) |
4,818,364 | 5,213,020 | ||||||
|
Communication and information services |
1,551,533 | 1,510,596 | ||||||
|
Other industries |
8,939,291 | 8,756,483 | ||||||
|
Consumer |
16,287,332 | 15,802,024 | ||||||
|
|
|
|
|
|||||
|
Total domestic |
65,696,342 | 65,156,790 | ||||||
|
|
|
|
|
|||||
|
Foreign: |
||||||||
|
Governments and official institutions |
920,538 | 841,695 | ||||||
|
Banks and other financial institutions (1) |
12,851,570 | 11,641,373 | ||||||
|
Commercial and industrial |
30,591,173 | 31,951,169 | ||||||
|
Other |
7,270,928 | 7,597,502 | ||||||
|
|
|
|
|
|||||
|
Total foreign |
51,634,209 | 52,031,739 | ||||||
|
|
|
|
|
|||||
|
Unearned income, unamortized premiums—net and deferred loan fees—net |
(294,656 | ) | (304,588 | ) | ||||
|
|
|
|
|
|||||
|
Total (2) |
¥ | 117,035,895 | ¥ | 116,883,941 | ||||
|
|
|
|
|
|||||
F-44
Table of Contents
MITSUBISHI UFJ FINANCIAL GROUP, INC. AND SUBSIDIARIES
NOTES TO CONSOLIDATED FINANCIAL STATEMENTS—(Continued)
Notes:
| (1) | Loans to so-called “non-bank finance companies” are generally included in the “Banks and other financial institutions” category. Non-bank finance companies are primarily engaged in consumer lending, factoring and credit card businesses. |
| (2) | The above table includes loans held for sale of ¥226,923 million and ¥291,794 million at March 31, 2018 and 2019, respectively. |
The MUFG Group classifies its loan portfolio into the following portfolio segments—Commercial, Residential, Card, MUFG Americas Holdings, and Krungsri based on the grouping used by the MUFG Group to determine the allowance for credit losses. See Note 1 for further information.
Nonaccrual Loans
Originated loans are generally placed on nonaccrual status when substantial doubt exists as to the full and timely collection of either principal or interest, when principal or interest is contractually past due one month or more with respect to loans within all classes of the Commercial segment, three months or more with respect to loans within the Card, MUFG Americas Holdings, and Krungsri segments, and six months or more with respect to loans within the Residential segment. See Note 1 for further information.
The nonaccrual loans by class at March 31, 2018 and 2019 is shown below:
| 2018 | 2019 | |||||||
| (in millions) | ||||||||
|
Commercial |
||||||||
|
Domestic |
¥ | 332,994 | ¥ | 272,777 | ||||
|
Manufacturing |
77,163 | 65,896 | ||||||
|
Construction |
10,791 | 9,813 | ||||||
|
Real estate |
33,317 | 23,152 | ||||||
|
Services |
30,717 | 26,188 | ||||||
|
Wholesale and retail |
108,175 | 94,531 | ||||||
|
Banks and other financial institutions |
1,145 | 898 | ||||||
|
Communication and information services |
13,815 | 11,955 | ||||||
|
Other industries |
37,549 | 25,406 | ||||||
|
Consumer |
20,322 | 14,938 | ||||||
|
Foreign-excluding MUAH and Krungsri |
109,516 | 111,002 | ||||||
|
Residential |
69,464 | 68,499 | ||||||
|
Card |
61,387 | 61,419 | ||||||
|
MUAH |
52,282 | 46,549 | ||||||
|
Krungsri |
121,286 | 127,424 | ||||||
|
|
|
|
|
|||||
|
Total (1) |
¥ | 746,929 | ¥ | 687,670 | ||||
|
|
|
|
|
|||||
| Note: |
| (1) | The above table does not include loans held for sale of ¥61 million and ¥12,702 million at March 31, 2018 and 2019, respectively, and loans acquired with deteriorated credit quality of ¥6,659 million and ¥6,284 million at March 31, 2018 and 2019, respectively. |
F-45
Table of Contents
MITSUBISHI UFJ FINANCIAL GROUP, INC. AND SUBSIDIARIES
NOTES TO CONSOLIDATED FINANCIAL STATEMENTS—(Continued)
Impaired Loans
The MUFG Group’s impaired loans primarily include nonaccrual loans and TDRs. The following table shows information about impaired loans by class at March 31, 2018 and 2019:
| Recorded Loan Balance | ||||||||||||||||||||
|
At March 31, 2018: |
Requiring
an Allowance for Credit Losses |
Not Requiring
an Allowance for Credit Losses (1) |
Total (2) |
Unpaid
Principal Balance |
Related
Allowance for Credit Losses |
|||||||||||||||
| (in millions) | ||||||||||||||||||||
|
Commercial |
||||||||||||||||||||
|
Domestic |
¥ | 626,469 | ¥ | 188,984 | ¥ | 815,453 | ¥ | 875,795 | ¥ | 331,851 | ||||||||||
|
Manufacturing |
361,268 | 36,566 | 397,834 | 408,124 | 166,098 | |||||||||||||||
|
Construction |
10,936 | 7,172 | 18,108 | 18,490 | 7,921 | |||||||||||||||
|
Real estate |
43,553 | 23,053 | 66,606 | 71,809 | 10,665 | |||||||||||||||
|
Services |
38,097 | 16,600 | 54,697 | 59,335 | 25,890 | |||||||||||||||
|
Wholesale and retail |
128,661 | 49,628 | 178,289 | 189,404 | 94,832 | |||||||||||||||
|
Banks and other financial institutions |
1,125 | 26 | 1,151 | 1,151 | 972 | |||||||||||||||
|
Communication and information services |
18,782 | 7,852 | 26,634 | 28,082 | 16,041 | |||||||||||||||
|
Other industries |
12,978 | 34,282 | 47,260 | 67,525 | 5,350 | |||||||||||||||
|
Consumer |
11,069 | 13,805 | 24,874 | 31,875 | 4,082 | |||||||||||||||
|
Foreign-excluding MUAH and Krungsri |
122,243 | 40,249 | 162,492 | 190,518 | 82,855 | |||||||||||||||
|
Loans acquired with deteriorated credit quality |
7,837 | — | 7,837 | 15,470 | 4,324 | |||||||||||||||
|
Residential (4) |
105,089 | 6,261 | 111,350 | 134,777 | 16,928 | |||||||||||||||
|
Card (4) |
66,964 | 388 | 67,352 | 74,840 | 21,223 | |||||||||||||||
|
MUAH (4) |
48,895 | 33,650 | 82,545 | 94,565 | 7,743 | |||||||||||||||
|
Krungsri (4) |
58,529 | 25,565 | 84,094 | 90,957 | 29,402 | |||||||||||||||
|
|
|
|
|
|
|
|
|
|
|
|||||||||||
|
Total (3) |
¥ | 1,036,026 | ¥ | 295,097 | ¥ | 1,331,123 | ¥ | 1,476,922 | ¥ | 494,326 | ||||||||||
|
|
|
|
|
|
|
|
|
|
|
|||||||||||
F-46
Table of Contents
MITSUBISHI UFJ FINANCIAL GROUP, INC. AND SUBSIDIARIES
NOTES TO CONSOLIDATED FINANCIAL STATEMENTS—(Continued)
| Recorded Loan Balance | ||||||||||||||||||||
|
At March 31, 2019: |
Requiring
an Allowance for Credit Losses |
Not Requiring
an Allowance for Credit Losses (1) |
Total (2) |
Unpaid
Principal Balance |
Related
Allowance for Credit Losses |
|||||||||||||||
| (in millions) | ||||||||||||||||||||
|
Commercial |
||||||||||||||||||||
|
Domestic |
¥ | 560,474 | ¥ | 157,465 | ¥ | 717,939 | ¥ | 759,399 | ¥ | 227,004 | ||||||||||
|
Manufacturing |
349,597 | 28,189 | 377,786 | 384,306 | 92,919 | |||||||||||||||
|
Construction |
8,366 | 5,975 | 14,341 | 14,779 | 6,574 | |||||||||||||||
|
Real estate |
20,848 | 29,961 | 50,809 | 55,943 | 5,704 | |||||||||||||||
|
Services |
30,239 | 13,020 | 43,259 | 46,838 | 20,059 | |||||||||||||||
|
Wholesale and retail |
118,253 | 45,620 | 163,873 | 175,714 | 84,503 | |||||||||||||||
|
Banks and other financial institutions |
1,012 | 21 | 1,033 | 1,033 | 830 | |||||||||||||||
|
Communication and information services |
8,794 | 6,929 | 15,723 | 16,587 | 6,817 | |||||||||||||||
|
Other industries |
13,772 | 17,989 | 31,761 | 38,342 | 6,874 | |||||||||||||||
|
Consumer |
9,593 | 9,761 | 19,354 | 25,857 | 2,724 | |||||||||||||||
|
Foreign-excluding MUAH and Krungsri |
127,521 | 34,484 | 162,005 | 183,133 | 85,966 | |||||||||||||||
|
Loans acquired with deteriorated credit quality |
8,136 | — | 8,136 | 14,990 | 5,450 | |||||||||||||||
|
Residential (4) |
97,176 | 6,495 | 103,671 | 120,526 | 14,357 | |||||||||||||||
|
Card (4) |
64,691 | 330 | 65,021 | 72,226 | 21,829 | |||||||||||||||
|
MUAH (4) |
46,552 | 23,208 | 69,760 | 83,300 | 8,294 | |||||||||||||||
|
Krungsri (4) |
57,066 | 26,193 | 83,259 | 90,377 | 28,254 | |||||||||||||||
|
|
|
|
|
|
|
|
|
|
|
|||||||||||
|
Total (3) |
¥ | 961,616 | ¥ | 248,175 | ¥ | 1,209,791 | ¥ | 1,323,951 | ¥ | 391,154 | ||||||||||
|
|
|
|
|
|
|
|
|
|
|
|||||||||||
Notes:
| (1) | These loans do not require an allowance for credit losses because the recorded loan balance equals, or does not exceed, the present value of expected future cash flows discounted at the loans’ original effective interest rate, loans’ observable market price, or the fair value of the collateral if the loan is a collateral-dependent loan. |
| (2) | Included in impaired loans at March 31, 2018 and 2019 are accrual TDRs as follows: ¥536,748 million and ¥497,013 million—Commercial; ¥40,734 million and ¥34,449 million—Residential; ¥28,541 million and ¥26,183 million—Card; ¥39,333 million and ¥33,155 million—MUFG Americas Holdings; and ¥24,899 million and ¥26,851 million—Krungsri, respectively. |
| (3) | In addition to impaired loans presented in the above table, there were impaired loans held for sale of ¥61 million and ¥12,702 million at March 31, 2018 and 2019, respectively. |
| (4) | Impaired Loans for Residential, Card, MUAH and Krungsri segments in the above table include loans acquired with deteriorated credit quality. |
F-47
Table of Contents
MITSUBISHI UFJ FINANCIAL GROUP, INC. AND SUBSIDIARIES
NOTES TO CONSOLIDATED FINANCIAL STATEMENTS—(Continued)
The following table shows information regarding the average recorded loan balance and recognized interest income on impaired loans for the fiscal years ended March 31, 2017, 2018 and 2019:
| 2017 | 2018 | 2019 | ||||||||||||||||||||||
|
Average
Recorded Loan Balance |
Recognized
Interest Income |
Average
Recorded Loan Balance |
Recognized
Interest Income |
Average
Recorded Loan Balance |
Recognized
Interest Income |
|||||||||||||||||||
| (in millions) | ||||||||||||||||||||||||
|
Commercial |
||||||||||||||||||||||||
|
Domestic |
¥ | 1,137,501 | ¥ | 14,116 | ¥ | 918,093 | ¥ | 9,441 | ¥ | 766,847 | ¥ | 12,383 | ||||||||||||
|
Manufacturing |
601,256 | 5,845 | 472,081 | 3,787 | 387,725 | 6,057 | ||||||||||||||||||
|
Construction |
26,684 | 434 | 19,465 | 281 | 15,721 | 291 | ||||||||||||||||||
|
Real estate |
96,229 | 1,593 | 74,087 | 1,146 | 57,850 | 1,069 | ||||||||||||||||||
|
Services |
81,967 | 1,236 | 59,916 | 794 | 48,945 | 1,044 | ||||||||||||||||||
|
Wholesale and retail |
238,798 | 3,466 | 186,356 | 2,347 | 171,687 | 2,848 | ||||||||||||||||||
|
Banks and other financial institutions |
2,272 | 11 | 1,729 | 8 | 1,330 | 8 | ||||||||||||||||||
|
Communication and information services |
27,531 | 570 | 25,461 | 388 | 22,478 | 491 | ||||||||||||||||||
|
Other industries |
24,709 | 397 | 50,377 | 215 | 39,178 | 234 | ||||||||||||||||||
|
Consumer |
38,055 | 564 | 28,621 | 475 | 21,933 | 341 | ||||||||||||||||||
|
Foreign-excluding MUAH and Krungsri |
291,612 | 5,132 | 209,297 | 4,244 | 159,999 | 3,127 | ||||||||||||||||||
|
Loans acquired with deteriorated credit quality |
9,974 | 432 | 8,591 | 492 | 7,814 | 182 | ||||||||||||||||||
|
Residential |
133,876 | 1,883 | 119,409 | 1,563 | 107,165 | 1,620 | ||||||||||||||||||
|
Card |
75,809 | 2,483 | 69,831 | 1,993 | 66,187 | 1,614 | ||||||||||||||||||
|
MUAH |
91,690 | 1,664 | 83,504 | 1,993 | 71,162 | 2,292 | ||||||||||||||||||
|
Krungsri |
51,597 | 2,201 | 75,370 | 3,899 | 83,165 | 4,995 | ||||||||||||||||||
|
|
|
|
|
|
|
|
|
|
|
|
|
|||||||||||||
|
Total |
¥ | 1,792,059 | ¥ | 27,911 | ¥ | 1,484,095 | ¥ | 23,625 | ¥ | 1,262,339 | ¥ | 26,213 | ||||||||||||
|
|
|
|
|
|
|
|
|
|
|
|
|
|||||||||||||
Interest income on nonaccrual loans for all classes was recognized on a cash basis when ultimate collectibility of principal was certain. Otherwise, cash receipts were applied as principal reductions. Interest income on accruing impaired loans, including TDRs, was recognized on an accrual basis to the extent that the collectibility of interest income was reasonably certain based on management’s assessment.
F-48
Table of Contents
MITSUBISHI UFJ FINANCIAL GROUP, INC. AND SUBSIDIARIES
NOTES TO CONSOLIDATED FINANCIAL STATEMENTS—(Continued)
The following table shows a roll-forward of accrual TDRs and other impaired loans (including nonaccrual TDRs) for the fiscal years ended March 31, 2017, 2018 and 2019:
| 2017 | 2018 | 2019 | ||||||||||
| (in millions) | ||||||||||||
|
Accrual TDRs: |
||||||||||||
|
Balance at beginning of fiscal year |
¥ | 613,844 | ¥ | 819,819 | ¥ | 670,255 | ||||||
|
Additions (new accrual TDR status) (1) |
492,269 | 144,368 | 71,033 | |||||||||
|
Transfers to other impaired loans (including nonaccrual TDRs) |
(40,182 | ) | (25,122 | ) | (19,053 | ) | ||||||
|
Loans sold |
(1,637 | ) | (39,378 | ) | (26 | ) | ||||||
|
Principal payments and other |
(244,475 | ) | (229,432 | ) | (104,558 | ) | ||||||
|
|
|
|
|
|
|
|||||||
|
Balance at end of fiscal year (1) |
¥ | 819,819 | ¥ | 670,255 | ¥ | 617,651 | ||||||
|
|
|
|
|
|
|
|||||||
|
Other impaired loans (including nonaccrual TDRs): |
||||||||||||
|
Balance at beginning of fiscal year |
¥ | 1,111,306 | ¥ | 896,031 | ¥ | 660,868 | ||||||
|
Additions (new other impaired loans (including nonaccrual TDRs) status) (1)(2) |
541,789 | 281,275 | 222,003 | |||||||||
|
Charge-off |
(106,097 | ) | (98,355 | ) | (55,309 | ) | ||||||
|
Transfers to accrual TDRs |
(333,478 | ) | (43,858 | ) | (22,110 | ) | ||||||
|
Loans sold |
(44,984 | ) | (31,581 | ) | (26,022 | ) | ||||||
|
Principal payments and other |
(272,505 | ) | (342,644 | ) | (187,290 | ) | ||||||
|
|
|
|
|
|
|
|||||||
|
Balance at end of fiscal year (1) |
¥ | 896,031 | ¥ | 660,868 | ¥ | 592,140 | ||||||
|
|
|
|
|
|
|
|||||||
Notes:
| (1) | For the fiscal year ended March 31, 2017, lease receivables of ¥875 million and ¥74 million in the Krungsri segment, which were accrual TDRs and nonaccrual TDRs, respectively, are excluded from the additions of accrual TDRs and other impaired loans, respectively, and the related ending balances of such TDRs amounting to ¥4,065 million and ¥389 million, are also excluded from the balance of accrual TDRs and other impaired loans, respectively, as of March 31, 2017. For the fiscal year ended March 31, 2018, lease receivables of ¥1,809 million and ¥113 million in the Krungsri segment, which were accrual TDRs and nonaccrual TDRs, respectively, are excluded from the additions of accrual TDRs and other impaired loans, respectively, and the related ending balances of such TDRs amounting to ¥4,282 million and ¥1,286 million, are also excluded from the balance of accrual TDRs and other impaired loans, respectively, as of March 31, 2018. For the fiscal year ended March 31, 2019, lease receivables of ¥2,947 million and ¥2,088 million in the Krungsri segment, which were accrual TDRs and nonaccrual TDRs, respectively, are excluded from the additions of accrual TDRs and other impaired loans, respectively, and the related ending balances of such TDRs amounting to ¥5,060 million and ¥3,361 million, are also excluded from the balance of accrual TDRs and other impaired loans, respectively, as of March 31, 2019. |
| (2) | Included in the additions of other impaired loans for the fiscal years ended March 31, 2017, 2018 and 2019 are nonaccrual TDRs as follows: ¥11,699 million, ¥12,002 million and ¥13,493 million—Card; ¥25,023 million, ¥12,799 million and ¥12,738 million—MUFG Americas Holdings; and ¥7,471 million, ¥12,280 million and ¥10,519 million—Krungsri, respectively. |
F-49
Table of Contents
MITSUBISHI UFJ FINANCIAL GROUP, INC. AND SUBSIDIARIES
NOTES TO CONSOLIDATED FINANCIAL STATEMENTS—(Continued)
Troubled Debt Restructurings
The following table summarizes the MUFG Group’s TDRs by class for the fiscal years ended March 31, 2017, 2018 and 2019:
| 2017 | 2018 | 2019 | ||||||||||||||||||||||
| Troubled Debt Restructurings | ||||||||||||||||||||||||
|
Pre-
Modification Outstanding Recorded Investment |
Post-
Modification Outstanding Recorded Investment |
Pre-
Modification Outstanding Recorded Investment |
Post-
Modification Outstanding Recorded Investment |
Pre-
Modification Outstanding Recorded Investment |
Post-
Modification Outstanding Recorded Investment |
|||||||||||||||||||
| (in millions) | ||||||||||||||||||||||||
|
Commercial (1)(3) |
||||||||||||||||||||||||
|
Domestic |
¥ | 377,563 | ¥ | 377,563 | ¥ | 70,380 | ¥ | 69,021 | ¥ | 36,693 | ¥ | 36,693 | ||||||||||||
|
Manufacturing |
335,347 | 335,347 | 35,954 | 35,954 | 11,654 | 11,654 | ||||||||||||||||||
|
Construction |
1,377 | 1,377 | 1,020 | 1,020 | 703 | 703 | ||||||||||||||||||
|
Real estate |
7,457 | 7,457 | 1,269 | 1,269 | 948 | 948 | ||||||||||||||||||
|
Services |
5,268 | 5,268 | 4,139 | 4,139 | 2,141 | 2,141 | ||||||||||||||||||
|
Wholesale and retail |
22,868 | 22,868 | 16,280 | 14,921 | 19,315 | 19,315 | ||||||||||||||||||
|
Banks and other financial institutions |
— | — | 246 | 246 | — | — | ||||||||||||||||||
|
Communication and information services |
2,405 | 2,405 | 9,643 | 9,643 | 268 | 268 | ||||||||||||||||||
|
Other industries |
1,493 | 1,493 | 761 | 761 | 472 | 472 | ||||||||||||||||||
|
Consumer |
1,348 | 1,348 | 1,068 | 1,068 | 1,192 | 1,192 | ||||||||||||||||||
|
Foreign-excluding MUAH and Krungsri |
58,178 | 58,178 | 25,522 | 25,522 | 5,692 | 5,692 | ||||||||||||||||||
|
Loans acquired with deteriorated credit quality |
1,030 | 1,030 | — | — | 50 | 50 | ||||||||||||||||||
|
Residential (1)(3) |
13,092 | 13,092 | 9,763 | 9,763 | 7,379 | 7,379 | ||||||||||||||||||
|
Card (2)(3) |
17,256 | 16,759 | 17,436 | 16,912 | 19,685 | 18,837 | ||||||||||||||||||
|
MUAH (2)(3) |
38,558 | 38,449 | 40,578 | 38,224 | 19,837 | 19,837 | ||||||||||||||||||
|
Krungsri (2)(3) |
32,340 | 32,340 | 24,015 | 23,929 | 24,392 | 24,330 | ||||||||||||||||||
|
|
|
|
|
|
|
|
|
|
|
|
|
|||||||||||||
|
Total |
¥ | 538,017 | ¥ | 537,411 | ¥ | 187,694 | ¥ | 183,371 | ¥ | 113,728 | ¥ | 112,818 | ||||||||||||
|
|
|
|
|
|
|
|
|
|
|
|
|
|||||||||||||
F-50
Table of Contents
MITSUBISHI UFJ FINANCIAL GROUP, INC. AND SUBSIDIARIES
NOTES TO CONSOLIDATED FINANCIAL STATEMENTS—(Continued)
| 2017 | 2018 | 2019 | ||||||||||
|
Troubled Debt Restructurings
That Subsequently defaulted |
||||||||||||
| Recorded Investment | ||||||||||||
| (in millions) | ||||||||||||
|
Commercial (1)(3) |
||||||||||||
|
Domestic |
¥ | 4,587 | ¥ | 4,067 | ¥ | 11,002 | ||||||
|
Manufacturing |
1,373 | 839 | 312 | |||||||||
|
Construction |
11 | — | 89 | |||||||||
|
Real estate |
38 | 10 | — | |||||||||
|
Services |
217 | 822 | 473 | |||||||||
|
Wholesale and retail |
2,530 | 2,231 | 1,713 | |||||||||
|
Banks and other financial institutions |
— | — | — | |||||||||
|
Communication and information services |
385 | 140 | 8,365 | |||||||||
|
Other industries |
— | — | 50 | |||||||||
|
Consumer |
33 | 25 | — | |||||||||
|
Foreign-excluding MUAH and Krungsri |
11,268 | — | — | |||||||||
|
Loans acquired with deteriorated credit quality |
— | — | — | |||||||||
|
Residential (1)(3) |
231 | 159 | 362 | |||||||||
|
Card (2)(3) |
3,661 | 4,191 | 3,442 | |||||||||
|
MUAH (2)(3) |
6,624 | 2,565 | 349 | |||||||||
|
Krungsri (2)(3) |
3,984 | 4,789 | 7,926 | |||||||||
|
|
|
|
|
|
|
|||||||
|
Total |
¥ | 30,355 | ¥ | 15,771 | ¥ | 23,081 | ||||||
|
|
|
|
|
|
|
|||||||
Notes:
| (1) | TDRs for the Commercial and Residential segments include accruing loans, and do not include nonaccrual loans. |
| (2) | TDRs for the Card, MUFG Americas Holdings and Krungsri segments include accrual and nonaccrual loans. |
| (3) | For the fiscal year ended March 31, 2017, extension of the stated maturity date of loans was the primary concession type in the Residential segment, reduction in the stated rate was the primary concession type in the Commercial and Card segments and payment deferrals were the primary concession type in the MUFG Americas Holdings and Krungsri segments. For the fiscal year ended March 31, 2018, extension of the stated maturity date of loans was the primary concession type in the Commercial, Residential and Krungsri segments, reduction in the stated rate was the primary concession type in the Card segment and payment deferrals were the primary concession type in the MUFG Americas Holdings segment. For the fiscal year ended March 31, 2019, extension of the stated maturity date of loans was the primary concession type in the Commercial, Residential and Krungsri segments, reduction in the stated rate was the primary concession type in the Card segment and forbearance was the primary concession type in the MUFG Americas Holdings segment. |
F-51
Table of Contents
MITSUBISHI UFJ FINANCIAL GROUP, INC. AND SUBSIDIARIES
NOTES TO CONSOLIDATED FINANCIAL STATEMENTS—(Continued)
The following table summarizes outstanding recorded investment balances of TDRs by class at March 31, 2018 and 2019:
| 2018 | 2019 | |||||||
| (in millions) | ||||||||
|
Commercial (1) |
||||||||
|
Domestic |
¥ | 482,566 | ¥ | 445,312 | ||||
|
Manufacturing |
320,702 | 311,890 | ||||||
|
Construction |
7,362 | 4,591 | ||||||
|
Real estate |
33,289 | 27,657 | ||||||
|
Services |
23,987 | 17,135 | ||||||
|
Wholesale and retail |
70,119 | 69,350 | ||||||
|
Banks and other financial institutions |
6 | 135 | ||||||
|
Communication and information services |
12,837 | 3,780 | ||||||
|
Other industries |
9,712 | 6,357 | ||||||
|
Consumer |
4,552 | 4,417 | ||||||
|
Foreign-excluding MUAH and Krungsri |
54,182 | 51,701 | ||||||
|
Residential (1) |
40,734 | 34,449 | ||||||
|
Card (2) |
67,352 | 65,021 | ||||||
|
MUAH (2) |
65,373 | 48,128 | ||||||
|
Krungsri (2) |
54,036 | 62,980 | ||||||
|
|
|
|
|
|||||
|
Total |
¥ | 764,243 | ¥ | 707,591 | ||||
|
|
|
|
|
|||||
Notes:
| (1) | TDRs for the Commercial and Residential segments include accruing loans, and do not include nonaccrual loans. |
| (2) | TDRs for the Card, MUFG Americas Holdings and Krungsri segments include accrual and nonaccrual loans. Included in the outstanding recorded investment balances as of March 31, 2018 and 2019 are nonaccrual TDRs as follows: ¥38,811 million and ¥38,838 million—Card; ¥26,040 million and ¥14,973 million—MUFG Americas Holdings; and ¥24,855 million and ¥31,069 million—Krungsri, respectively. |
A modification of terms of a loan under a TDR mainly involves: (i) a reduction in the stated interest rate applicable to the loan, (ii) an extension of the stated maturity date of the loan, (iii) a partial forgiveness of the principal of the loan, or (iv) a combination of all of these. Those loans are also considered impaired loans, and hence the allowance for credit losses is separately established for each loan. As a result, the amount of allowance for credit losses increases in many cases upon classification as a TDR loan. The amount of pre-modification outstanding recorded investment and post-modification outstanding recorded investment may differ due to write-offs made as part of the concession. The impact of write-offs associated with TDRs on the MUFG Group’s results of operations for the fiscal years ended March 31, 2017, 2018 and 2019 was not material.
TDRs for the Commercial and Residential segments in the above tables include accruing loans, and do not include nonaccrual loans. Once a loan is classified as a nonaccrual loan, a modification would have little likelihood of resulting in the recovery of the loan in view of the severity of the financial difficulty of the borrower. Therefore, even if a nonaccrual loan is modified, the loan continues to be classified as a nonaccrual loan. The vast majority of modifications to nonaccrual loans are temporary extensions of the maturity dates, typically for periods up to 90 days, and continually made as the borrower is unable to repay or refinance the loan at the extended maturity. Accordingly, the impact of such TDRs on the outstanding recorded investment is immaterial, and the vast majority of nonaccrual TDRs have subsequently defaulted.
TDRs that subsequently defaulted in the Commercial and Residential segments in the above tables include those accruing loans that became past due one month or more within the Commercial segment and six months or
F-52
Table of Contents
MITSUBISHI UFJ FINANCIAL GROUP, INC. AND SUBSIDIARIES
NOTES TO CONSOLIDATED FINANCIAL STATEMENTS—(Continued)
more within the Residential segment, and those accruing loans reclassified to nonaccrual loans due to financial difficulties even without delinquencies. This is because classification as a nonaccrual loan is regarded as default under the MUFG Group’s credit policy. Also, the MUFG Group defines default as payment default for the purpose of the disclosure.
In regards to the Card, MUFG Americas Holdings and Krungsri segments, the TDRs in the above tables represent nonaccrual and accruing loans, and the defaulted loans in the above table represent nonaccruing and accruing loans that became past due one month or more within the Card segment, 60 days or more within the MUFG Americas Holdings segment, and six months or more within the Krungsri segment.
Historical payment defaults are one of the factors considered when projecting future cash flows in determining the allowance for credit losses for each segment.
The MUFG Group provided commitments to extend credit to customers with TDRs. The amounts of such commitments were ¥172,159 million and ¥169,819 million at March 31, 2018 and 2019, respectively. See Note 25 for further discussion of commitments to extend credit.
Credit Quality Indicator
Credit quality indicators of loans by class at March 31, 2018 and 2019 are shown below:
|
At March 31, 2018: |
Normal |
Close
Watch |
Likely to become
Bankrupt or Legally/Virtually Bankrupt |
Total (1) | ||||||||||||
| (in millions) | ||||||||||||||||
|
Commercial |
||||||||||||||||
|
Domestic |
¥ | 49,050,274 | ¥ | 1,690,924 | ¥ | 271,456 | ¥ | 51,012,654 | ||||||||
|
Manufacturing |
10,215,497 | 596,662 | 57,730 | 10,869,889 | ||||||||||||
|
Construction |
727,932 | 43,673 | 9,116 | 780,721 | ||||||||||||
|
Real estate |
11,379,291 | 279,931 | 32,692 | 11,691,914 | ||||||||||||
|
Services |
2,467,540 | 175,733 | 24,081 | 2,667,354 | ||||||||||||
|
Wholesale and retail |
7,518,383 | 374,706 | 77,870 | 7,970,959 | ||||||||||||
|
Banks and other financial institutions |
4,800,281 | 10,923 | 1,145 | 4,812,349 | ||||||||||||
|
Communication and information services |
1,491,093 | 48,153 | 11,958 | 1,551,204 | ||||||||||||
|
Other industries |
8,780,517 | 120,466 | 36,951 | 8,937,934 | ||||||||||||
|
Consumer |
1,669,740 | 40,677 | 19,913 | 1,730,330 | ||||||||||||
|
Foreign-excluding MUAH and Krungsri |
36,049,123 | 569,137 | 108,276 | 36,726,536 | ||||||||||||
|
Loans acquired with deteriorated credit quality |
12,035 | 11,728 | 3,562 | 27,325 | ||||||||||||
|
|
|
|
|
|
|
|
|
|||||||||
|
Total |
¥ | 85,111,432 | ¥ | 2,271,789 | ¥ | 383,294 | ¥ | 87,766,515 | ||||||||
|
|
|
|
|
|
|
|
|
|||||||||
| Accrual | Nonaccrual | Total (1) | ||||||||||
| (in millions) | ||||||||||||
|
Residential |
¥ | 14,012,978 | ¥ | 67,258 | ¥ | 14,080,236 | ||||||
|
Card |
¥ | 528,108 | ¥ | 61,707 | ¥ | 589,815 | ||||||
F-53
Table of Contents
MITSUBISHI UFJ FINANCIAL GROUP, INC. AND SUBSIDIARIES
NOTES TO CONSOLIDATED FINANCIAL STATEMENTS—(Continued)
|
Credit Quality Based on
the Number of Delinquencies |
Credit Quality Based on
Internal Credit Ratings |
|||||||||||||||||||||||
| Accrual | Nonaccrual | Pass |
Special
Mention |
Classified | Total (1)(2) | |||||||||||||||||||
| (in millions) | ||||||||||||||||||||||||
|
MUAH |
¥ | 4,360,445 | ¥ | 14,238 | ¥ | 4,509,044 | ¥ | 59,890 | ¥ | 116,842 | ¥ | 9,060,459 | ||||||||||||
| Normal |
Special
Mention |
Substandard or
Doubtful or Doubtful of Loss |
Total (1) | |||||||||||||||||||||
| (in millions) | ||||||||||||||||||||||||
|
Krungsri |
|
¥ | 5,284,018 | ¥ | 198,526 | ¥ | 123,106 | ¥ | 5,605,650 | |||||||||||||||
|
At March 31, 2019: |
Normal | Close Watch |
Likely to become
Bankrupt or Legally/Virtually Bankrupt |
Total (1) | ||||||||||||||||||||
| (in millions) | ||||||||||||||||||||||||
|
Commercial |
|
|||||||||||||||||||||||
|
Domestic |
|
¥ | 49,391,991 | ¥ | 1,242,075 | ¥ | 217,745 | ¥ | 50,851,811 | |||||||||||||||
|
Manufacturing |
|
10,819,594 | 279,801 | 47,968 | 11,147,363 | |||||||||||||||||||
|
Construction |
|
672,152 | 37,236 | 7,857 | 717,245 | |||||||||||||||||||
|
Real estate |
|
11,403,613 | 222,791 | 22,515 | 11,648,919 | |||||||||||||||||||
|
Services |
|
2,436,489 | 174,784 | 19,953 | 2,631,226 | |||||||||||||||||||
|
Wholesale and retail |
|
7,240,801 | 329,249 | 68,736 | 7,638,786 | |||||||||||||||||||
|
Banks and other financial institutions |
|
5,199,889 | 7,654 | 898 | 5,208,441 | |||||||||||||||||||
|
Communication and information services |
|
1,465,652 | 34,542 | 10,172 | 1,510,366 | |||||||||||||||||||
|
Other industries |
|
8,610,464 | 119,581 | 24,947 | 8,754,992 | |||||||||||||||||||
|
Consumer |
|
1,543,337 | 36,437 | 14,699 | 1,594,473 | |||||||||||||||||||
|
Foreign-excluding MUAH and Krungsri |
|
35,418,267 | 562,854 | 112,103 | 36,093,224 | |||||||||||||||||||
|
Loans acquired with deteriorated credit quality |
|
11,622 | 10,833 | 3,790 | 26,245 | |||||||||||||||||||
|
|
|
|
|
|
|
|
|
|||||||||||||||||
|
Total |
|
¥ | 84,821,880 | ¥ | 1,815,762 | ¥ | 333,638 | ¥ | 86,971,280 | |||||||||||||||
|
|
|
|
|
|
|
|
|
|||||||||||||||||
| Accrual | Nonaccrual | Total (1) | ||||||||||||||||||||||
| (in millions) | ||||||||||||||||||||||||
|
Residential |
|
¥ | 13,661,794 | ¥ | 66,290 | ¥ | 13,728,084 | |||||||||||||||||
|
Card |
|
¥ | 516,983 | ¥ | 61,599 | ¥ | 578,582 | |||||||||||||||||
|
Credit Quality Based on
the Number of Delinquencies |
Credit Quality Based on
Internal Credit Ratings |
|||||||||||||||||||||||
| Accrual | Nonaccrual | Pass |
Special
Mention |
Classified | Total (1)(2) | |||||||||||||||||||
| (in millions) | ||||||||||||||||||||||||
|
MUAH |
¥ | 4,752,021 | ¥ | 15,540 | ¥ | 4,699,698 | ¥ | 51,948 | ¥ | 88,356 | ¥ | 9,607,563 | ||||||||||||
| Normal |
Special
Mention |
Substandard or
Doubtful or Doubtful of Loss |
Total (1) | |||||||||||||||||||||
| (in millions) | ||||||||||||||||||||||||
|
Krungsri |
|
¥ | 5,682,245 | ¥ | 199,070 | ¥ | 129,222 | ¥ | 6,010,537 | |||||||||||||||
F-54
Table of Contents
MITSUBISHI UFJ FINANCIAL GROUP, INC. AND SUBSIDIARIES
NOTES TO CONSOLIDATED FINANCIAL STATEMENTS—(Continued)
Notes:
| (1) | Total loans in the above table do not include loans held for sale, and represent balances without adjustments in relation to unearned income, unamortized premiums and deferred loan fees. |
| (2) | Total loans of MUFG Americas Holdings do not include FDIC covered loans which are not individually rated totaling ¥953 million and ¥689 million as of March 31, 2018 and 2019, respectively. The MUFG Group will be reimbursed for a substantial portion of any future losses on FDIC covered loans under the terms of the FDIC loss share agreements. |
The MUFG Group classifies loans into risk categories based on relevant information about the ability of borrowers to service their debt, including, but not limited to, historical and current financial information, historical and current payment experience, credit documentation, public and non-public information about borrowers and current economic trends as deemed appropriate to each segment.
The primary credit quality indicator for loans within all classes of the Commercial segment is the internal credit rating assigned to each borrower based on the MUFG Group’s internal borrower ratings of 1 through 15, with the rating of 1 assigned to a borrower with the highest quality of credit. When assigning a credit rating to a borrower, the MUFG Group evaluates the borrower’s expected debt-service capability based on various information, including financial and operating information of the borrower as well as information on the industry in which the borrower operates, and the borrower’s business profile, management and compliance system. In evaluating a borrower’s debt-service capability, the MUFG Group also conducts an assessment of the level of earnings and an analysis of the borrower’s net worth. Based on the internal borrower rating, loans within the Commercial segment are categorized as Normal (internal borrower ratings of 1 through 9), Close Watch (internal borrower ratings of 10 through 12), and Likely to become Bankrupt or Legally/Virtually Bankrupt (internal borrower ratings of 13 through 15).
Loans to borrowers categorized as Normal represent those that are not deemed to have collectibility issues.
Loans to borrowers categorized as Close Watch represent those that require close monitoring as the borrower has begun to exhibit elements of potential concern with respect to its business performance and financial condition, the borrower has begun to exhibit elements of serious concern with respect to its business performance and financial condition, including business problems requiring long-term solutions, or the borrower’s loans are TDRs or loans contractually past due 90 days or more for special reasons.
Loans to borrowers categorized as Likely to become Bankrupt or Legally/Virtually Bankrupt represent those that have a higher probability of default than those categorized as Close Watch due to serious debt repayment problems with poor progress in achieving restructuring plans, the borrower being considered virtually bankrupt with no prospects for an improvement in business operations, or the borrower being legally bankrupt with no prospects for continued business operations because of non-payment, suspension of business, voluntary liquidation or filing for legal liquidation.
The accrual status is a primary credit quality indicator for loans within the Residential segment, the Card segment and consumer loans within the MUFG Americas Holdings segment. The accrual status of these loans is determined based on the number of delinquent payments. See Note 1 for further details of categorization of Accrual and Nonaccrual.
Commercial loans within the MUFG Americas Holdings segment are categorized as either pass or criticized based on the internal credit rating assigned to each borrower. Criticized credits are those that are internally risk graded as Special Mention, Substandard or Doubtful. Special Mention credits are potentially weak, as the borrower has begun to exhibit deteriorating trends, which, if not corrected, may jeopardize repayment of the loan and result in further downgrade. Classified credits are those that are internally risk graded as Substandard or
F-55
Table of Contents
MITSUBISHI UFJ FINANCIAL GROUP, INC. AND SUBSIDIARIES
NOTES TO CONSOLIDATED FINANCIAL STATEMENTS—(Continued)
Doubtful. Substandard credits have well-defined weaknesses, which, if not corrected, could jeopardize the full satisfaction of the debt. A credit classified as Doubtful has critical weaknesses that make full collection improbable on the basis of currently existing facts and conditions.
Loans within the Krungsri segment are categorized as Normal, Special Mention, Substandard, Doubtful, and Doubtful of Loss primarily based on their delinquency status. Loans categorized as Special Mention generally represent those that have the overdue principal or interest payments for a cumulative period exceeding one month commencing from the contractual due date. Loans categorized as Substandard, Doubtful or Doubtful of Loss generally represent those that have the overdue principal or interest payments for a cumulative period exceeding three months commencing from the contractual due date.
For the Commercial, Residential and Card segments, credit quality indicators are based on information as of March 31. For the MUFG Americas Holdings and Krungsri segments, credit quality indicators are generally based on information as of December 31.
Past Due Analysis
Ages of past due loans by class at March 31, 2018 and 2019 are shown below:
|
At March 31, 2018: |
1-3 months
Past Due |
Greater
Than 3 months |
Total
Past Due |
Current |
Total
Loans (1) |
Recorded
Investment> 90 Days and Accruing |
||||||||||||||||||
| (in millions) | ||||||||||||||||||||||||
|
Commercial |
||||||||||||||||||||||||
|
Domestic |
¥ | 13,290 | ¥ | 43,913 | ¥ | 57,203 | ¥ | 50,955,451 | ¥ | 51,012,654 | ¥ | 6,419 | ||||||||||||
|
Manufacturing |
1,495 | 1,300 | 2,795 | 10,867,094 | 10,869,889 | — | ||||||||||||||||||
|
Construction |
359 | 437 | 796 | 779,925 | 780,721 | — | ||||||||||||||||||
|
Real estate |
2,090 | 3,225 | 5,315 | 11,686,599 | 11,691,914 | 1,633 | ||||||||||||||||||
|
Services |
1,025 | 620 | 1,645 | 2,665,709 | 2,667,354 | 26 | ||||||||||||||||||
|
Wholesale and retail |
3,886 | 4,198 | 8,084 | 7,962,875 | 7,970,959 | 1,349 | ||||||||||||||||||
|
Banks and other financial institutions |
— | 21 | 21 | 4,812,328 | 4,812,349 | — | ||||||||||||||||||
|
Communication and information services |
657 | 328 | 985 | 1,550,219 | 1,551,204 | — | ||||||||||||||||||
|
Other industries |
251 | 28,315 | 28,566 | 8,909,368 | 8,937,934 | — | ||||||||||||||||||
|
Consumer |
3,527 | 5,469 | 8,996 | 1,721,334 | 1,730,330 | 3,411 | ||||||||||||||||||
|
Foreign-excluding MUAH and Krungsri |
12,512 | 19,655 | 32,167 | 36,694,369 | 36,726,536 | 1,083 | ||||||||||||||||||
|
Residential |
78,073 | 19,399 | 97,472 | 13,974,118 | 14,071,590 | 10,806 | ||||||||||||||||||
|
Card |
18,887 | 32,218 | 51,105 | 528,284 | 579,389 | — | ||||||||||||||||||
|
MUAH |
23,145 | 13,648 | 36,793 | 9,009,426 | 9,046,219 | 771 | ||||||||||||||||||
|
Krungsri |
116,665 | 99,315 | 215,980 | 5,383,477 | 5,599,457 | — | ||||||||||||||||||
|
|
|
|
|
|
|
|
|
|
|
|
|
|||||||||||||
|
Total |
¥ | 262,572 | ¥ | 228,148 | ¥ | 490,720 | ¥ | 116,545,125 | ¥ | 117,035,845 | ¥ | 19,079 | ||||||||||||
|
|
|
|
|
|
|
|
|
|
|
|
|
|||||||||||||
F-56
Table of Contents
MITSUBISHI UFJ FINANCIAL GROUP, INC. AND SUBSIDIARIES
NOTES TO CONSOLIDATED FINANCIAL STATEMENTS—(Continued)
|
At March 31, 2019: |
1-3 months
Past Due |
Greater
Than 3 months |
Total
Past Due |
Current |
Total
Loans (1) |
Recorded
Investment> 90 Days and Accruing |
||||||||||||||||||
| (in millions) | ||||||||||||||||||||||||
|
Commercial |
||||||||||||||||||||||||
|
Domestic |
¥ | 11,551 | ¥ | 30,648 | ¥ | 42,199 | ¥ | 50,809,612 | ¥ | 50,851,811 | ¥ | 6,900 | ||||||||||||
|
Manufacturing |
1,597 | 3,036 | 4,633 | 11,142,730 | 11,147,363 | — | ||||||||||||||||||
|
Construction |
218 | 60 | 278 | 716,967 | 717,245 | 1 | ||||||||||||||||||
|
Real estate |
2,034 | 4,256 | 6,290 | 11,642,629 | 11,648,919 | 2,524 | ||||||||||||||||||
|
Services |
778 | 569 | 1,347 | 2,629,879 | 2,631,226 | 1 | ||||||||||||||||||
|
Wholesale and retail |
2,791 | 2,390 | 5,181 | 7,633,605 | 7,638,786 | 62 | ||||||||||||||||||
|
Banks and other financial institutions |
— | 21 | 21 | 5,208,420 | 5,208,441 | — | ||||||||||||||||||
|
Communication and information services |
411 | 758 | 1,169 | 1,509,197 | 1,510,366 | — | ||||||||||||||||||
|
Other industries |
365 | 13,037 | 13,402 | 8,741,590 | 8,754,992 | — | ||||||||||||||||||
|
Consumer |
3,357 | 6,521 | 9,878 | 1,584,595 | 1,594,473 | 4,312 | ||||||||||||||||||
|
Foreign-excluding MUAH and Krungsri |
10,881 | 19,993 | 30,874 | 36,062,350 | 36,093,224 | 236 | ||||||||||||||||||
|
Residential |
62,686 | 16,615 | 79,301 | 13,641,449 | 13,720,750 | 6,584 | ||||||||||||||||||
|
Card |
17,203 | 30,568 | 47,771 | 527,421 | 575,192 | — | ||||||||||||||||||
|
MUAH |
28,696 | 10,827 | 39,523 | 9,557,501 | 9,597,024 | 2,287 | ||||||||||||||||||
|
Krungsri |
126,313 | 106,777 | 233,090 | 5,771,541 | 6,004,631 | — | ||||||||||||||||||
|
|
|
|
|
|
|
|
|
|
|
|
|
|||||||||||||
|
Total |
¥
|
257,330
|
|
¥ | 215,428 | ¥ | 472,758 | ¥ | 116,369,874 | ¥ | 116,842,632 | ¥ | 16,007 | |||||||||||
|
|
|
|
|
|
|
|
|
|
|
|
|
|||||||||||||
Note:
| (1) | Total loans in the above table do not include loans held for sale and loans acquired with deteriorated credit quality and represent balances without adjustments in relation to unearned income, unamortized premiums and deferred loan fees. |
Allowance for Credit Losses
Changes in the allowance for credit losses by portfolio segment for the fiscal years ended March 31, 2017, 2018 and 2019 are shown below:
|
Fiscal year ended March 31, 2017: |
Commercial | Residential | Card | MUAH | Krungsri | Total | ||||||||||||||||||
| (in millions) | ||||||||||||||||||||||||
|
Allowance for credit losses: |
||||||||||||||||||||||||
|
Balance at beginning of fiscal year |
¥ | 816,559 | ¥ | 58,598 | ¥ | 31,187 | ¥ | 108,454 | ¥ | 96,332 | ¥ | 1,111,130 | ||||||||||||
|
Provision for (reversal of) credit losses |
177,295 | 12,224 | 13,289 | (62 | ) | 50,942 | 253,688 | |||||||||||||||||
|
Charge-offs |
108,262 | 5,339 | 16,309 | 32,074 | 51,774 | 213,758 | ||||||||||||||||||
|
Recoveries |
21,124 | 1,853 | 1,998 | 2,916 | 16,058 | 43,949 | ||||||||||||||||||
|
|
|
|
|
|
|
|
|
|
|
|
|
|||||||||||||
|
Net charge-offs |
87,138 | 3,486 | 14,311 | 29,158 | 35,716 | 169,809 | ||||||||||||||||||
|
Others (1) |
(6,030 | ) | — | — | (5,501 | ) | (1,290 | ) | (12,821 | ) | ||||||||||||||
|
|
|
|
|
|
|
|
|
|
|
|
|
|||||||||||||
|
Balance at end of fiscal year |
¥ | 900,686 | ¥ | 67,336 | ¥ | 30,165 | ¥ | 73,733 | ¥ | 110,268 | ¥ | 1,182,188 | ||||||||||||
|
|
|
|
|
|
|
|
|
|
|
|
|
|||||||||||||
F-57
Table of Contents
MITSUBISHI UFJ FINANCIAL GROUP, INC. AND SUBSIDIARIES
NOTES TO CONSOLIDATED FINANCIAL STATEMENTS—(Continued)
|
Fiscal year ended March 31, 2018: |
Commercial | Residential | Card | MUAH | Krungsri | Total | ||||||||||||||||||
| (in millions) | ||||||||||||||||||||||||
|
Allowance for credit losses: |
||||||||||||||||||||||||
|
Balance at beginning of fiscal year |
¥ | 900,686 | ¥ | 67,336 | ¥ | 30,165 | ¥ | 73,733 | ¥ | 110,268 | ¥ | 1,182,188 | ||||||||||||
|
Provision for (reversal of) credit losses |
(297,401 | ) | (22,291 | ) | 23,422 | (9,309 | ) | 64,732 | (240,847 | ) | ||||||||||||||
|
Charge-offs |
134,807 | 3,838 | 22,696 | 14,701 | 56,067 | 232,109 | ||||||||||||||||||
|
Recoveries |
24,913 | 1,339 | 1,228 | 6,140 | 17,490 | 51,110 | ||||||||||||||||||
|
|
|
|
|
|
|
|
|
|
|
|
|
|||||||||||||
|
Net charge-offs |
109,894 | 2,499 | 21,468 | 8,561 | 38,577 | 180,999 | ||||||||||||||||||
|
Others (1) |
(2,293 | ) | — | — | (2,098 | ) | 8,173 | 3,782 | ||||||||||||||||
|
|
|
|
|
|
|
|
|
|
|
|
|
|||||||||||||
|
Balance at end of fiscal year |
¥ | 491,098 | ¥ | 42,546 | ¥ | 32,119 | ¥ | 53,765 | ¥ | 144,596 | ¥ | 764,124 | ||||||||||||
|
|
|
|
|
|
|
|
|
|
|
|
|
|||||||||||||
|
Fiscal year ended March 31, 2019: |
Commercial | Residential | Card | MUAH | Krungsri | Total | ||||||||||||||||||
| (in millions) | ||||||||||||||||||||||||
|
Allowance for credit losses: |
||||||||||||||||||||||||
|
Balance at beginning of fiscal year |
¥ | 491,098 | ¥ | 42,546 | ¥ | 32,119 | ¥ | 53,765 | ¥ | 144,596 | ¥ | 764,124 | ||||||||||||
|
Provision for (reversal of) credit losses |
(43,850 | ) | (4,480 | ) | 23,809 | 9,277 | 49,574 | 34,330 | ||||||||||||||||
|
Charge-offs |
76,664 | 274 | 24,310 | 13,224 | 59,569 | 174,041 | ||||||||||||||||||
|
Recoveries |
17,565 | 834 | 932 | 3,733 | 21,053 | 44,117 | ||||||||||||||||||
|
|
|
|
|
|
|
|
|
|
|
|
|
|||||||||||||
|
Net charge-offs |
59,099 | (560 | ) | 23,378 | 9,491 | 38,516 | 129,924 | |||||||||||||||||
|
Others (1) |
1,466 | — | — | (970 | ) | (10,842 | ) | (10,346 | ) | |||||||||||||||
|
|
|
|
|
|
|
|
|
|
|
|
|
|||||||||||||
|
Balance at end of fiscal year |
¥ | 389,615 | ¥ | 38,626 | ¥ | 32,550 | ¥ | 52,581 | ¥ | 144,812 | ¥ | 658,184 | ||||||||||||
|
|
|
|
|
|
|
|
|
|
|
|
|
|||||||||||||
Note:
| (1) | Others are principally comprised of gains or losses from foreign exchange translation. |
F-58
Table of Contents
MITSUBISHI UFJ FINANCIAL GROUP, INC. AND SUBSIDIARIES
NOTES TO CONSOLIDATED FINANCIAL STATEMENTS—(Continued)
Allowance for credit losses and recorded investment in loans by portfolio segment at March 31, 2018 and 2019 are shown below:
|
At March 31, 2018: |
Commercial | Residential | Card | MUAH | Krungsri | Total | ||||||||||||||||||
| (in millions) | ||||||||||||||||||||||||
|
Allowance for credit losses: |
||||||||||||||||||||||||
|
Individually evaluated for impairment |
¥ | 414,706 | ¥ | 16,644 | ¥ | 21,223 | ¥ | 7,743 | ¥ | 29,402 | ¥ | 489,718 | ||||||||||||
|
Collectively evaluated for impairment |
64,375 | 24,718 | 10,884 | 45,571 | 115,161 | 260,709 | ||||||||||||||||||
|
Loans acquired with deteriorated credit quality (2) |
12,017 | 1,184 | 12 | 451 | 33 | 13,697 | ||||||||||||||||||
|
|
|
|
|
|
|
|
|
|
|
|
|
|||||||||||||
|
Total |
¥ | 491,098 | ¥ | 42,546 | ¥ | 32,119 | ¥ | 53,765 | ¥ | 144,596 | ¥ | 764,124 | ||||||||||||
|
|
|
|
|
|
|
|
|
|
|
|
|
|||||||||||||
|
Loans: |
||||||||||||||||||||||||
|
Individually evaluated for impairment |
¥ | 977,945 | ¥ | 110,197 | ¥ | 66,957 | ¥ | 82,545 | ¥ | 84,094 | ¥ | 1,321,738 | ||||||||||||
|
Collectively evaluated for impairment |
86,761,245 | 13,961,393 | 512,432 | 8,963,679 | 5,515,363 | 115,714,112 | ||||||||||||||||||
|
Loans acquired with deteriorated credit quality (2) |
27,325 | 8,646 | 10,426 | 15,188 | 6,193 | 67,778 | ||||||||||||||||||
|
|
|
|
|
|
|
|
|
|
|
|
|
|||||||||||||
|
Total (1) |
¥ | 87,766,515 | ¥ | 14,080,236 | ¥ | 589,815 | ¥ | 9,061,412 | ¥ | 5,605,650 | ¥ | 117,103,628 | ||||||||||||
|
|
|
|
|
|
|
|
|
|
|
|
|
|||||||||||||
|
At March 31, 2019: |
Commercial | Residential | Card | MUAH | Krungsri | Total | ||||||||||||||||||
| (in millions) | ||||||||||||||||||||||||
|
Allowance for credit losses: |
||||||||||||||||||||||||
|
Individually evaluated for impairment |
¥ | 312,970 | ¥ | 14,175 | ¥ | 21,829 | ¥ | 8,294 | ¥ | 28,254 | ¥ | 385,522 | ||||||||||||
|
Collectively evaluated for impairment |
63,366 | 23,413 | 10,708 | 44,282 | 116,529 | 258,298 | ||||||||||||||||||
|
Loans acquired with deteriorated credit quality (2) |
13,279 | 1,038 | 13 | 5 | 29 | 14,364 | ||||||||||||||||||
|
|
|
|
|
|
|
|
|
|
|
|
|
|||||||||||||
|
Total |
¥ | 389,615 | ¥ | 38,626 | ¥ | 32,550 | ¥ | 52,581 | ¥ | 144,812 | ¥ | 658,184 | ||||||||||||
|
|
|
|
|
|
|
|
|
|
|
|
|
|||||||||||||
|
Loans: |
||||||||||||||||||||||||
|
Individually evaluated for impairment |
¥ | 879,944 | ¥ | 102,948 | ¥ | 64,752 | ¥ | 69,760 | ¥ | 83,259 | ¥ | 1,200,663 | ||||||||||||
|
Collectively evaluated for impairment |
86,065,091 | 13,617,802 | 510,440 | 9,527,264 | 5,921,372 | 115,641,969 | ||||||||||||||||||
|
Loans acquired with deteriorated credit quality (2) |
26,245 | 7,334 | 3,390 | 11,228 | 5,906 | 54,103 | ||||||||||||||||||
|
|
|
|
|
|
|
|
|
|
|
|
|
|||||||||||||
|
Total (1) |
¥ | 86,971,280 | ¥ | 13,728,084 | ¥ | 578,582 | ¥ | 9,608,252 | ¥ | 6,010,537 | ¥ | 116,896,735 | ||||||||||||
|
|
|
|
|
|
|
|
|
|
|
|
|
|||||||||||||
Notes:
| (1) | Total loans in the above table do not include loans held for sale, and represent balances without adjustments in relation to unearned income, unamortized premiums and deferred loan fees. |
| (2) | Loans acquired with deteriorated credit quality in the above table include impaired loans which are individually evaluated for impairment. |
F-59
Table of Contents
MITSUBISHI UFJ FINANCIAL GROUP, INC. AND SUBSIDIARIES
NOTES TO CONSOLIDATED FINANCIAL STATEMENTS—(Continued)
Nonperforming loans were actively disposed of by sales during recent years. The allocated allowance for credit losses for such loans was removed from the allowance for credit losses and transferred to the valuation allowance for loans held for sale upon a decision to sell. Net charge-offs in the above table include a decrease from charge-offs in the allowance for credit losses amounting to ¥11.0 billion and ¥12.2 billion for the fiscal years ended March 31, 2017 and 2018, respectively, and an increase from recoveries in the allowance for credit losses amounting to ¥15.1 billion for the fiscal year ended March 31, 2019 due to loan disposal activity.
The MUFG Group sold ¥833 billion, ¥1,409 billion and ¥1,769 billion of loans within the Commercial segment during the fiscal years ended March 31, 2017, 2018 and 2019, respectively.
Loans Acquired in a Transfer
In accordance with the guidance on loans and debt securities acquired with deteriorated credit quality, the following table sets forth information regarding loans acquired in connection with mergers, for which it is probable, at acquisition, that the MUFG Group will be unable to collect all contractually required payments receivable.
| 2018 | 2019 | |||||||
| (in millions) | ||||||||
|
Loans acquired during the fiscal year: |
||||||||
|
Contractually required payments receivable at acquisition |
¥ | 537 | ¥ | 3,880 | ||||
|
Cash flows expected to be collected at acquisition |
197 | 1,449 | ||||||
|
Fair value of loans at acquisition |
197 | 1,449 | ||||||
|
Accretable yield for loans within the scope of the guidance on loans and debt securities acquired with deteriorated credit quality: |
||||||||
|
Balance at beginning of fiscal year |
¥ | 40,917 | ¥ | 29,672 | ||||
|
Additions |
— | — | ||||||
|
Accretion |
(14,067 | ) | (7,178 | ) | ||||
|
Disposals |
(11 | ) | — | |||||
|
Reclassifications from (to) nonaccretable difference |
3,267 | 896 | ||||||
|
Foreign currency translation adjustments |
(434 | ) | (230 | ) | ||||
|
|
|
|
|
|||||
|
Balance at end of fiscal year |
¥ | 29,672 | ¥ | 23,160 | ||||
|
|
|
|
|
|||||
|
Loans within the scope of the guidance on loans and debt securities acquired with deteriorated credit quality: |
||||||||
|
Outstanding balance at beginning of fiscal year |
¥ | 223,695 | ¥ | 180,011 | ||||
|
Outstanding balance at end of fiscal year |
180,011 | 161,525 | ||||||
|
Carrying amount at beginning of fiscal year |
91,176 | 67,778 | ||||||
|
Carrying amount at end of fiscal year |
67,778 | 54,103 | ||||||
|
Nonaccruing loans within the scope of the guidance on loans and debt securities acquired with deteriorated credit quality: |
||||||||
|
Carrying amount at acquisition date during fiscal year |
¥ | 197 | ¥ | 1,449 | ||||
|
Carrying amount at end of fiscal year |
6,659 | 6,284 | ||||||
|
Allowance for credit losses within the scope of the guidance on loans and debt securities acquired with deteriorated credit quality: |
||||||||
|
Balance of allowance for credit losses at beginning of fiscal year |
¥ | 14,523 | ¥ | 13,697 | ||||
|
Additional provisions during fiscal year |
2,285 | 1,744 | ||||||
|
Reductions of allowance during fiscal year |
732 | 401 | ||||||
|
Balance of allowance for credit losses at end of fiscal year |
13,697 | 14,364 | ||||||
F-60
Table of Contents
MITSUBISHI UFJ FINANCIAL GROUP, INC. AND SUBSIDIARIES
NOTES TO CONSOLIDATED FINANCIAL STATEMENTS—(Continued)
The MUFG Group considered prepayments in the determination of contractual cash flows and cash flows expected to be collected based on historical results.
Lease Receivables
As part of its financing activities, the MUFG Group enters into leasing arrangements with customers. The MUFG Group’s leasing operations are conducted through leasing subsidiaries and consist principally of direct financing leases involving various types of data processing equipment, office equipment and transportation equipment.
As of March 31, 2018 and 2019, the components of the investment in direct financing leases were as follows:
| 2018 | 2019 | |||||||
| (in millions) | ||||||||
|
Minimum lease payments receivable |
¥ | 1,862,664 | ¥ | 1,922,339 | ||||
|
Estimated residual values of leased property |
31,650 | 27,468 | ||||||
|
Less—unearned income |
(279,081 | ) | (299,283 | ) | ||||
|
|
|
|
|
|||||
|
Net investment in direct financing leases |
¥ | 1,615,233 | ¥ | 1,650,524 | ||||
|
|
|
|
|
|||||
Future minimum lease payment receivables under noncancelable leasing agreements as of March 31, 2019 were as follows:
|
Direct
Financing Leases |
||||
| (in millions) | ||||
|
Fiscal year ending March 31: |
||||
|
2020 |
¥ | 510,439 | ||
|
2021 |
425,023 | |||
|
2022 |
353,355 | |||
|
2023 |
240,609 | |||
|
2024 |
171,286 | |||
|
2025 and thereafter |
221,627 | |||
|
|
|
|||
|
Total minimum lease payment receivables |
¥ | 1,922,339 | ||
|
|
|
|||
Sales of Loans
The MUFG Group originates various types of loans to corporate and individual borrowers in Japan and overseas in the normal course of business. In order to improve its loan quality, MUFG Bank and Mitsubishi UFJ Trust and Banking actively disposed of nonperforming loans. Most of the nonperforming loans were disposed of by sales to third parties without any continuing involvement. Management of MUFG Bank and Mitsubishi UFJ Trust and Banking generally approves disposals after significant sales terms, including prices, are negotiated. As such, loans are disposed of by sales shortly after the loans are transferred to the held-for-sale classification. The net gains on the sales of loans were ¥19,466 million, ¥2,976 million and ¥20,696 million for the fiscal years ended March 31, 2017, 2018 and 2019, respectively.
Related Party Loans
In some cases, the banking subsidiaries of MUFG make loans to related parties, including their directors and executive officers, in the course of their normal commercial banking business. At March 31, 2018 and 2019, outstanding loans to such related parties were not material.
F-61
Table of Contents
MITSUBISHI UFJ FINANCIAL GROUP, INC. AND SUBSIDIARIES
NOTES TO CONSOLIDATED FINANCIAL STATEMENTS—(Continued)
In the opinion of management, these related party loans were made on substantially the same terms, including interest rates and collateral requirements, as those terms prevailing at the date these loans were made. For the fiscal years ended March 31, 2017, 2018 and 2019, there were no loans to related parties that were charged off. Additionally, at March 31, 2017, 2018, and 2019, there were no loans to related parties that were impaired.
| 5. | PREMISES AND EQUIPMENT |
Premises and equipment at March 31, 2018 and 2019 consisted of the following:
| 2018 | 2019 | |||||||
| (in millions) | ||||||||
|
Land |
¥ | 370,669 | ¥ | 362,742 | ||||
|
Buildings |
739,665 | 829,606 | ||||||
|
Equipment and furniture |
659,699 | 648,598 | ||||||
|
Leasehold improvements |
311,645 | 305,281 | ||||||
|
Construction in progress |
119,195 | 34,002 | ||||||
|
|
|
|
|
|||||
|
Total |
2,200,873 | 2,180,229 | ||||||
|
Less accumulated depreciation |
1,187,285 | 1,206,629 | ||||||
|
|
|
|
|
|||||
|
Premises and equipment-net |
¥ | 1,013,588 | ¥ | 973,600 | ||||
|
|
|
|
|
|||||
Premises and equipment include capitalized leases, principally related to data processing equipment, which amounted to ¥31,458 million and ¥34,141 million at March 31, 2018 and 2019, respectively. Accumulated depreciation on such capitalized leases at March 31, 2018 and 2019 amounted to ¥17,298 million and ¥19,946 million, respectively.
MUFG Bank has entered into sales agreements to sell its buildings and land and, under separate agreements, leased those properties back for its business operations, including bank branches. MUFG Bank either provided nonrecourse financing to the buyers for the sales proceeds or invested in the equity or common stock of the buyers. As a result, MUFG Bank was considered to have continuing involvement with the properties. For accounting and reporting purposes, these transactions were accounted for under the financing method with the sales proceeds recognized as a financing obligation. The properties were reported on the accompanying consolidated balance sheets and depreciated. The financing obligation at March 31, 2018 and 2019 was ¥41,892 million and ¥40,732 million, respectively.
For the fiscal years ended March 31, 2017, 2018 and 2019, the MUFG Group recognized ¥5,964 million, ¥39,358 million and ¥31,345 million, respectively, of impairment losses for long-lived assets, primarily real estate which was either formerly used for its banking operations and is no longer used or real estate that is being used where recovery of the carrying amount is doubtful. In addition, ¥901 million, ¥213 million and ¥411 million of impairment losses were recognized for real estate held for sale for the fiscal years ended March 31, 2017, 2018 and 2019, respectively. These losses are included in Other non-interest expenses. In computing the amount of impairment losses, fair value was determined primarily based on market prices, if available, or the estimated price based on an appraisal.
Impairment losses for the fiscal year ended March 31, 2018 included ¥34,016 million of losses on long-lived assets used for MUFG Bank’s operations. In relation to a restructuring of operating divisions of MUFG Bank, which is a transformation of Corporate Banking Business Group and Retail Banking Business Group into Retail & Commercial Banking Business Group and Japanese Corporate & Investment Banking Business Group,
F-62
Table of Contents
MITSUBISHI UFJ FINANCIAL GROUP, INC. AND SUBSIDIARIES
NOTES TO CONSOLIDATED FINANCIAL STATEMENTS—(Continued)
based on an MUFG Re-Imagining Strategy published on May 15, 2017, and the new medium-term business plan, MUFG Bank reevaluated the profitability of some of its domestic operating assets. As a result of the reevaluation, it was determined that carrying amounts of these operating assets were unlikely to be recovered, and the impairment losses were recorded.
Impairment losses for the fiscal year ended March 31, 2019 included ¥21,096 million losses on long-lived assets, including land, buildings, and equipment and furniture, which were held by certain consumer finance subsidiary. See Note 6 for the details of these impairments.
| 6. | GOODWILL AND OTHER INTANGIBLE ASSETS |
Goodwill
The table below presents the movement in the carrying amount of goodwill by business segment during the fiscal years ended March 31, 2018 and 2019:
Effective April 1, 2018, the MUFG Group reorganized its business groups in an effort to further integrate the expertise and capabilities of its consolidated subsidiaries to respond to the needs of customers more effectively and efficiently, as part of its current medium-term business plan. To make and execute unified group-wide strategies based on customer characteristics and the nature of business, the MUFG Group integrated the operations of its consolidated subsidiaries into six business segments.—Retail & Commercial Banking, Japanese Corporate & Investment Banking, Global Corporate & Investment Banking, Global Commercial Banking, Asset Management & Investor Services, and Global Markets. See Note 30 for the business segment information of the MUFG Group.
|
Global
Commercial Banking Business Group |
Asset
Management & Investor Services Business Group |
Global
Markets Business Group |
Total | |||||||||||||
| (in millions) | ||||||||||||||||
|
Balance at March 31, 2017: |
||||||||||||||||
|
Goodwill (1) |
¥ | 611,827 | ¥ | 28,134 | ¥ | 2,300 | ¥ | 642,261 | ||||||||
|
Accumulated impairment losses (1) |
(177,750 | ) | (14,368 | ) | — | (192,118 | ) | |||||||||
|
|
|
|
|
|
|
|
|
|||||||||
| 434,077 | 13,766 | 2,300 | 450,143 | |||||||||||||
|
Foreign currency translation adjustments and other |
(8,399 | ) | (410 | ) | — | (8,809 | ) | |||||||||
|
|
|
|
|
|
|
|
|
|||||||||
|
Balance at March 31, 2018: |
||||||||||||||||
|
Goodwill |
603,428 | 27,724 | 2,300 | 633,452 | ||||||||||||
|
Accumulated impairment losses |
(177,750 | ) | (14,368 | ) | — | (192,118 | ) | |||||||||
|
|
|
|
|
|
|
|
|
|||||||||
| 425,678 | 13,356 | 2,300 | 441,334 | |||||||||||||
|
Foreign currency translation adjustments and other |
(7,206 | ) | (237 | ) | — | (7,443 | ) | |||||||||
|
|
|
|
|
|
|
|
|
|||||||||
|
Balance at March 31, 2019: |
||||||||||||||||
|
Goodwill |
596,222 | 27,487 | 2,300 | 626,009 | ||||||||||||
|
Accumulated impairment losses |
(177,750 | ) | (14,368 | ) | — | (192,118 | ) | |||||||||
|
|
|
|
|
|
|
|
|
|||||||||
| ¥ | 418,472 | ¥ | 13,119 | ¥ | 2,300 | ¥ | 433,891 | |||||||||
|
|
|
|
|
|
|
|
|
|||||||||
Note:
| (1) |
Effective April 1, 2018, the MUFG Group reorganized its business groups. Goodwill originally recognized for Retail Banking Business Group, Corporate Banking Business Group, Trust Assets Business Group and Global Business Group other than MUAH and Krungsri |
F-63
Table of Contents
MITSUBISHI UFJ FINANCIAL GROUP, INC. AND SUBSIDIARIES
NOTES TO CONSOLIDATED FINANCIAL STATEMENTS—(Continued)
|
was ¥1,900,019 million, which has been fully impaired before April 1, 2017. As these impairment losses recorded in past before the reorganization of the segment and are irrelevant to the annual impairment test under the new segment, the accumulated impaired loss is not allocated to new business segments after the reorganization of business group. |
U.S. GAAP requires to test goodwill for impairment at least annually, or more frequently if events or changes in circumstances indicate that goodwill may be impaired, using a two-step process that begins with an estimation of the fair value of a reporting unit, which is to be compared with the carrying amount of the reporting unit including goodwill, to identify potential impairment of goodwill. If the carrying amount of a reporting unit including goodwill exceeds its estimated fair value, the second step of the goodwill impairment test is performed to measure the amount of impairment loss recorded in the consolidated statements of income. This test requires comparison of the implied fair value of the reporting unit’s goodwill with the carrying amount of its goodwill.
For the fiscal years ended March 31, 2017, the MUFG Group recognized ¥6,638 million, in impairment of goodwill relating to reporting units within the Trust Assets Business Group segment. There were no impairment losses recognized for the fiscal years ended March 31, 2018 and 2019. The MUFG Group readjusted its future cash flow projection of the reporting units in this segment, considering the subsidiaries’ recent business performance. Due to the situation, the fair value of the reporting units, which were based on discounted future cash flows, fell below the carrying amounts of the reporting units. Accordingly, the second step of the goodwill impairment test was performed for the reporting units. As a result, the carrying amounts of the reporting units’ goodwill exceeded the implied fair value of the reporting units’ goodwill, and the impairment losses were recognized on the related goodwill.
Other Intangible Assets
The table below presents the gross carrying amount, accumulated amortization and net carrying amount, in total and by major class of other intangible assets at March 31, 2018 and 2019:
| 2018 | 2019 | |||||||||||||||||||||||
|
Gross
carrying amount |
Accumulated
amortization |
Net
carrying amount |
Gross
carrying amount |
Accumulated
amortization |
Net
carrying amount |
|||||||||||||||||||
| (in millions) | ||||||||||||||||||||||||
|
Intangible assets subject to amortization: |
||||||||||||||||||||||||
|
Software |
¥ | 2,585,161 | ¥ | 1,852,333 | ¥ | 732,828 | ¥ | 2,703,413 | ¥ | 2,029,775 | ¥ | 673,638 | ||||||||||||
|
Core deposit intangibles |
128,679 | 83,382 | 45,297 | 126,796 | 88,643 | 38,153 | ||||||||||||||||||
|
Customer relationships |
391,832 | 227,079 | 164,753 | 387,936 | 246,526 | 141,410 | ||||||||||||||||||
|
Trade names |
77,821 | 30,801 | 47,020 | 77,204 | 34,283 | 42,921 | ||||||||||||||||||
|
Other |
9,706 | 3,977 | 5,729 | 9,601 | 4,220 | 5,381 | ||||||||||||||||||
|
|
|
|
|
|
|
|
|
|
|
|
|
|||||||||||||
|
Total |
¥ | 3,193,199 | ¥ | 2,197,572 | 995,627 | ¥ | 3,304,950 | ¥ | 2,403,447 | 901,503 | ||||||||||||||
|
|
|
|
|
|
|
|
|
|||||||||||||||||
|
Intangible assets not subject to amortization: |
||||||||||||||||||||||||
|
Other (1) |
15,492 | 25,693 | ||||||||||||||||||||||
|
|
|
|
|
|||||||||||||||||||||
|
Total |
¥ | 1,011,119 | ¥ | 927,196 | ||||||||||||||||||||
|
|
|
|
|
|||||||||||||||||||||
Note:
| (1) | Intangible assets not subject to amortization includes ¥7,268 million and ¥17,431 million of mortgage servicing rights accounted for at fair value at March 31, 2018 and 2019, respectively. |
Intangible assets subject to amortization acquired during the fiscal year ended March 31, 2018 amounted to ¥242,017 million, which primarily consisted of ¥239,460 million of software and ¥2,200 million of customer
F-64
Table of Contents
MITSUBISHI UFJ FINANCIAL GROUP, INC. AND SUBSIDIARIES
NOTES TO CONSOLIDATED FINANCIAL STATEMENTS—(Continued)
relationships. The weighted average amortization periods for these assets are 5 years and 22 years, respectively. There is no significant residual value estimated for these assets. Intangible assets not subject to amortization acquired during the fiscal year ended March 31, 2018 amounted to ¥28 million.
Intangible assets subject to amortization acquired during the fiscal year ended March 31, 2019 amounted to ¥262,700 million, which primarily consisted of ¥262,408 million of software. The weighted average amortization periods for these assets are 6 years. There is no significant residual value estimated for these assets. Intangible assets not subject to amortization acquired during the fiscal year ended March 31, 2019 amounted to ¥11,172 million.
For the fiscal years ended March 31, 2017, 2018 and 2019, the MUFG Group recognized ¥5,803 million, ¥21,900 million and ¥118,108 million, respectively, of impairment losses for intangible assets whose carrying amounts exceeded their fair value. In computing the amount of impairment losses, fair value was determined primarily based on the present value of expected future cash flows, the estimated value based on appraisals, or market prices.
The impairment loss for the fiscal year ended March 31, 2018 included a loss of ¥11,121 million relating to the foreign subsidiary’s customer relationships under the Trust Asset Business Group segment. The intangible assets were valued based on discounted expected future cash flows. The estimated future cash flows of the above customer relationships were revised downward due to a decrease in acquired customer base. Accordingly, the MUFG group revaluated the intangible assets and recognized impairment losses.
The impairment loss for the fiscal year ended March 31, 2019 included a loss of ¥137,186 million relating to software held by certain consumer finance subsidiary under the Retail & Commercial Banking Business Group segment. The consumer finance subsidiary determined to fundamentally review its current system integration plan, comprehensively taking into account the scale, complexity and the degree of difficulty for the system development to respond rapid changes in payments market in an appropriate manner, at the meeting of the Board of Directors on March 25, 2019. The consumer finance subsidiary considered software under development unlikely to have cost reduction effect and remain in use in the future, and reevaluated the profitability of existing software in relation to its system integration plan. As a result, it was determined that carrying amounts of both system software under development and long lived assets group of credit business, including existing system software, land, buildings, and equipment and furniture exceeded their fair values, and ¥87,596 million and ¥28,494 million of impairment losses were recognized on system software under development and existing software, respectively. In computing the amount of impairment losses, the fair value was primarily estimated using an income approach. The income approach is based on the present value of expected cash flows, which represents market participant perspective. In addition to the impairments on software, ¥21,096 million of impairment losses on long-lived assets, including land, buildings, and equipment and furniture, were recognized.
The estimated aggregate amortization expense for intangible assets for the next five fiscal years is as follows:
| (in millions) | ||||
|
Fiscal year ending March 31: |
||||
|
2020 |
¥ | 230,962 | ||
|
2021 |
195,126 | |||
|
2022 |
160,504 | |||
|
2023 |
120,350 | |||
|
2024 |
83,523 | |||
F-65
Table of Contents
MITSUBISHI UFJ FINANCIAL GROUP, INC. AND SUBSIDIARIES
NOTES TO CONSOLIDATED FINANCIAL STATEMENTS—(Continued)
| 7. | INCOME TAXES |
Income before Income Tax Expense
Income before income tax expense by jurisdiction for the fiscal years ended March 31, 2017, 2018 and 2019 was as follows:
| 2017 | 2018 | 2019 | ||||||||||
| (in millions) | ||||||||||||
|
Domestic income (loss) |
¥ | (413,499 | ) | ¥ | 803,057 | ¥ | 228,018 | |||||
|
Foreign income |
686,042 | 858,762 | 642,824 | |||||||||
|
|
|
|
|
|
|
|||||||
|
Total |
¥ | 272,543 | ¥ | 1,661,819 | ¥ | 870,842 | ||||||
|
|
|
|
|
|
|
|||||||
Income Tax Expense (Benefit)
The detail of current and deferred income tax expense (benefit) for the fiscal years ended March 31, 2017, 2018 and 2019 was as follows:
| 2017 | 2018 | 2019 | ||||||||||
| (in millions) | ||||||||||||
|
Current: |
||||||||||||
|
Domestic |
¥ | 176,415 | ¥ | 180,109 | ¥ | 57,303 | ||||||
|
Foreign |
130,406 | 107,119 | 123,730 | |||||||||
|
|
|
|
|
|
|
|||||||
|
Total |
306,821 | 287,228 | 181,033 | |||||||||
|
|
|
|
|
|
|
|||||||
|
Deferred: |
||||||||||||
|
Domestic |
(217,485 | ) | 116,873 | (32,746 | ) | |||||||
|
Foreign |
5,117 | 3,722 | (15,050 | ) | ||||||||
|
|
|
|
|
|
|
|||||||
|
Total |
(212,368 | ) | 120,595 | (47,796 | ) | |||||||
|
|
|
|
|
|
|
|||||||
|
Income tax expense |
94,453 | 407,823 | 133,237 | |||||||||
|
Income tax expense (benefit) reported in Accumulated OCI relating to: |
||||||||||||
|
Investment securities |
20,237 | 120,588 | 15,590 | |||||||||
|
Debt valuation adjustments |
(3,926 | ) | (960 | ) | 4,293 | |||||||
|
Derivatives qualifying for cash flow hedges |
(9,443 | ) | (4,421 | ) | (1,845 | ) | ||||||
|
Defined benefit plans |
48,504 | 50,774 | (38,229 | ) | ||||||||
|
Foreign currency translation adjustments |
(1,957 | ) | (34,527 | ) | 15,148 | |||||||
|
|
|
|
|
|
|
|||||||
|
Total |
53,415 | 131,454 | (5,043 | ) | ||||||||
|
|
|
|
|
|
|
|||||||
|
Total |
¥ | 147,868 | ¥ | 539,277 | ¥ | 128,194 | ||||||
|
|
|
|
|
|
|
|||||||
The MUFG Group files tax returns on a consolidated basis for corporate income taxes within Japan. A consolidated basis for corporate income taxes results in the reporting of taxable income or loss based upon the combined profits or losses of the parent company and its wholly-owned domestic subsidiaries.
In June 2016, the Tokyo Metropolitan Government Bureau of Taxation promulgated revisions to the local tax law. The revision reduces the effective statutory rate of corporate income tax from approximately 31.5% as of March 31, 2016 to 30.6% for the fiscal year beginning on or after April 1, 2017. The revision resulted in a decrease of ¥26,820 million in income tax expense for the fiscal year ended March 31, 2017.
F-66
Table of Contents
MITSUBISHI UFJ FINANCIAL GROUP, INC. AND SUBSIDIARIES
NOTES TO CONSOLIDATED FINANCIAL STATEMENTS—(Continued)
In the United States of America, on December 22, 2017, the Tax Cuts & Jobs Act was signed into law reducing the federal corporate income tax rate from 35% to 21% effective January 1, 2018. As a result of the reduction in the corporate income tax rate, the MUFG Group revalued its net deferred tax liabilities at March 31, 2018, resulting in a one-time tax benefit of ¥10,395 million.
Reconciliation of Effective Income Tax Rate
Income taxes in Japan applicable to the MUFG Group are imposed by the national, prefectural and municipal governments, and in the aggregate resulted in a normal effective statutory rate of approximately 31.5%, 30.6%, and 30.6% for the fiscal years ended March 31, 2017, 2018 and 2019, respectively. Foreign subsidiaries are subject to income taxes of the countries in which they operate.
A reconciliation of the effective income tax rates reflected in the accompanying consolidated statements of income to the combined normal effective statutory tax rates for the fiscal years ended March 31, 2017, 2018 and 2019 is as follows:
| 2017 | 2018 | 2019 | ||||||||||
|
Combined normal effective statutory tax rate |
31.5 | % | 30.6 | % | 30.6 | % | ||||||
|
Nondeductible expenses |
2.0 | 0.2 | 0.5 | |||||||||
|
Impairment of goodwill |
0.8 | — | — | |||||||||
|
Foreign tax credit and payments |
(9.6 | ) | (1.7 | ) | (3.3 | ) | ||||||
|
Lower tax rates applicable to income of subsidiaries |
(0.2 | ) | (0.4 | ) | (2.5 | ) | ||||||
|
Change in valuation allowance |
25.4 | (3.0 | ) | (1.4 | ) | |||||||
|
Nontaxable dividends received |
(12.5 | ) | (2.0 | ) | (9.1 | ) | ||||||
|
Undistributed earnings of subsidiaries |
3.5 | 0.7 | 0.6 | |||||||||
|
Tax and interest expense for uncertainty in income taxes |
(0.6 | ) | 0.0 | 0.6 | ||||||||
|
Noncontrolling interest income |
5.4 | 0.1 | 0.2 | |||||||||
|
Effect of changes in tax laws |
(9.8 | ) | (0.6 | ) | 0.0 | |||||||
|
Other—net |
(1.2 | ) | 0.6 | (0.9 | ) | |||||||
|
|
|
|
|
|
|
|||||||
|
Effective income tax rate |
34.7 | % | 24.5 | % | 15.3 | % | ||||||
|
|
|
|
|
|
|
|||||||
F-67
Table of Contents
MITSUBISHI UFJ FINANCIAL GROUP, INC. AND SUBSIDIARIES
NOTES TO CONSOLIDATED FINANCIAL STATEMENTS—(Continued)
Deferred Tax Assets and Liabilities
Deferred tax assets and liabilities are computed for each tax jurisdiction using currently enacted tax rates applicable to periods when the temporary differences are expected to reverse. The tax effects of the items comprising the MUFG Group’s net deferred tax assets at March 31, 2018 and 2019 were as follows:
| 2018 | 2019 | |||||||
| (in millions) | ||||||||
|
Deferred tax assets: |
||||||||
|
Allowance for credit losses |
¥ | 337,718 | ¥ | 301,222 | ||||
|
Operating loss carryforwards |
167,355 | 177,143 | ||||||
|
Loans |
3,483 | 691 | ||||||
|
Accrued liabilities and other |
133,728 | 236,363 | ||||||
|
Premises and equipment, including sale-and-leaseback transactions |
120,505 | 158,144 | ||||||
|
Derivative financial instruments |
111,677 | 101,118 | ||||||
|
Defined benefit plans |
— | 5,238 | ||||||
|
Valuation allowance |
(215,130 | ) | (218,191 | ) | ||||
|
|
|
|
|
|||||
|
Total deferred tax assets |
659,336 | 761,728 | ||||||
|
|
|
|
|
|||||
|
Deferred tax liabilities: |
||||||||
|
Investment securities (including trading account assets at fair value under the fair value option) |
973,390 | 911,483 | ||||||
|
Intangible assets |
52,396 | 38,772 | ||||||
|
Lease transactions |
83,445 | 65,115 | ||||||
|
Defined benefit plans |
15,484 | — | ||||||
|
Other |
119,970 | 280,701 | ||||||
|
|
|
|
|
|||||
|
Total deferred tax liabilities |
1,244,685 | 1,296,071 | ||||||
|
|
|
|
|
|||||
|
Net deferred tax assets (liabilities) |
¥ | (585,349 | ) | ¥ | (534,343 | ) | ||
|
|
|
|
|
|||||
The valuation allowance was provided primarily against deferred tax assets recorded at MUFG and its subsidiaries with operating loss carryforwards. The valuation allowance is determined to reduce the measurement of deferred tax assets not expected to be realized. Management considers all available evidence, both positive and negative, to determine whether the valuation allowance is necessary based on the weight of that evidence. Management determines the amount of the valuation allowance based on future reversals of existing taxable temporary differences and future taxable income exclusive of reversing temporary differences. Future taxable income is developed from forecasted operating results, based on recent historical trends and approved business plans, the eligible carryforward periods and other relevant factors.
For certain subsidiaries where strong negative evidence exists, such as the existence of significant amounts of operating loss carryforwards, cumulative losses and the expiration of unused operating loss carryforwards in recent years, a valuation allowance was recognized against the deferred tax assets as of March 31, 2018 and 2019 to the extent that it is more likely than not that they will not be realized.
For the fiscal year ended March 31, 2018, the MUFG Group released a valuation allowance of ¥53,360 million which was mainly due to the commencement of a certain subsidiary’s application of the consolidated corporate-tax system. Management believes that the net operating loss carryforwards related to Japanese corporate taxes will be fully utilized by the application of the consolidated corporate-tax system.
F-68
Table of Contents
MITSUBISHI UFJ FINANCIAL GROUP, INC. AND SUBSIDIARIES
NOTES TO CONSOLIDATED FINANCIAL STATEMENTS—(Continued)
Income taxes are not provided on undistributed earnings of certain foreign subsidiaries that are considered to be indefinitely reinvested in the operations of such subsidiaries. At March 31, 2018 and 2019, the undistributed earnings of such foreign subsidiaries amounted to approximately ¥38,358 million and ¥48,103 million, respectively. Determination of the amount of unrecognized deferred tax liabilities with respect to these undistributed earnings is not practicable because of the complexity associated with its hypothetical calculation including foreign withholding taxes and foreign tax credits. MUFG has neither plans nor the intention to dispose of investments in such foreign subsidiaries and, accordingly, does not expect to record capital gains or losses, or otherwise monetize the undistributed earnings of such foreign subsidiaries.
Furthermore, under the Japanese tax law, 95% of a dividend received from a foreign company in which a domestic company has held generally at least 25% of the outstanding shares for a continuous period of six months or more ending on the date on which the dividend is declared can be excluded from the domestic company’s taxable income. Therefore, if undistributed earnings of certain foreign subsidiaries are repatriated through dividends, only 5% of the amount of dividends will be included in taxable income.
Operating Loss and Tax Credit Carryforwards
At March 31, 2019, the MUFG Group had operating loss carryforwards for corporate tax of ¥527,882 million and tax credit carryforwards of ¥52,546 million for tax purposes. Such carryforwards, if not utilized, are scheduled to expire as follows:
|
Operating loss
carryforwards |
Tax credit
carryforwards |
|||||||
| (in millions) | ||||||||
|
Fiscal year ending March 31: |
||||||||
|
2020 |
¥ | 33,066 | ¥ | 700 | ||||
|
2021 |
12,727 | 194 | ||||||
|
2022 |
23,346 | 230 | ||||||
|
2023 |
68,850 | 232 | ||||||
|
2024 |
105,110 | 182 | ||||||
|
2025 |
167,035 | 117 | ||||||
|
2026 and thereafter |
95,686 | 46,239 | ||||||
|
No definite expiration date |
22,062 | 4,652 | ||||||
|
|
|
|
|
|||||
|
Total |
¥ | 527,882 | ¥ | 52,546 | ||||
|
|
|
|
|
|||||
Uncertainty in Income Tax
The following is a roll-forward of the MUFG Group’s unrecognized tax benefits for the fiscal years ended March 31, 2017, 2018 and 2019:
| 2017 | 2018 | 2019 | ||||||||||
| (in millions) | ||||||||||||
|
Balance at beginning of fiscal year |
¥ | 9,950 | ¥ | 7,851 | ¥ | 12,917 | ||||||
|
Gross amount of increases for current year’s tax positions |
888 | 427 | 313 | |||||||||
|
Gross amount of increases for prior years’ tax positions |
1,014 | 6,642 | 8,836 | |||||||||
|
Gross amount of decreases for prior years’ tax positions |
(95 | ) | (455 | ) | (1,090 | ) | ||||||
|
Net amount of changes relating to settlements with tax authorities |
(39 | ) | (1,074 | ) | — | |||||||
|
Decreases due to lapse of applicable statutes of limitations |
(3,437 | ) | (253 | ) | (1,540 | ) | ||||||
|
Foreign exchange translation and others |
(430 | ) | (221 | ) | (276 | ) | ||||||
|
|
|
|
|
|
|
|||||||
|
Balance at end of fiscal year |
¥ | 7,851 | ¥ | 12,917 | ¥ | 19,160 | ||||||
|
|
|
|
|
|
|
|||||||
F-69
Table of Contents
MITSUBISHI UFJ FINANCIAL GROUP, INC. AND SUBSIDIARIES
NOTES TO CONSOLIDATED FINANCIAL STATEMENTS—(Continued)
The total amounts of unrecognized tax benefits for the years ended March 31, 2017, 2018 and 2019 that, if recognized, would affect the effective tax rate are ¥1,443 million, ¥6,518 million and ¥14,092 million, respectively. The remainder of the uncertain tax positions have offsetting amounts in other jurisdictions or are temporary differences.
The MUFG Group classifies interest and penalties, if applicable, related to income taxes as Income tax expense. Accrued interest and penalties (not included in the “unrecognized tax benefits” above) are a component of Other liabilities. The following is a roll-forward of the interest and penalties recognized in the accompanying consolidated financial statements for the fiscal years ended March 31, 2017, 2018 and 2019:
| 2017 | 2018 | 2019 | ||||||||||
| (in millions) | ||||||||||||
|
Balance at beginning of fiscal year |
¥ | 4,727 | ¥ | 4,054 | ¥ | 4,564 | ||||||
|
Total interest and penalties in the consolidated statements of income |
(591 | ) | 694 | (1,655 | ) | |||||||
|
Total cash settlements, foreign exchange translation and others |
(82 | ) | (184 | ) | 147 | |||||||
|
|
|
|
|
|
|
|||||||
|
Balance at end of fiscal year |
¥ | 4,054 | ¥ | 4,564 | ¥ | 3,056 | ||||||
|
|
|
|
|
|
|
|||||||
The MUFG Group is subject to ongoing tax examinations by the tax authorities of the various jurisdictions in which it operates. The following are the major tax jurisdictions in which the MUFG Group operates and the status of years under audit or open to examination:
|
Jurisdiction |
Tax years | |||
|
Japan |
2018 and forward | |||
|
United States—Federal |
2014 and forward | |||
|
United States—California |
2015 and forward | |||
|
Thailand |
2012 and forward | |||
|
Indonesia |
2017 and forward | |||
The MUFG Group is currently under continuous examinations by the tax authorities in various domestic and foreign jurisdictions and many of these examinations are resolved every year. The unrecognized tax benefits will decrease since resolved items will be removed from the balance regardless of whether their resolution results in payment or recognition. It is reasonably possible that the unrecognized tax benefits will decrease by approximately ¥2.6 billion during the next twelve months.
| 8. | PLEDGED ASSETS AND COLLATERAL |
Pledged Assets
At March 31, 2019, assets mortgaged, pledged, or otherwise subject to lien were as follows:
| 2019 | ||||
| (in millions) | ||||
|
Trading account securities |
¥ | 8,921,825 | ||
|
Investment securities |
7,907,010 | |||
|
Loans |
14,192,075 | |||
|
Other |
51,714 | |||
|
|
|
|||
|
Total |
¥ | 31,072,624 | ||
|
|
|
|||
F-70
Table of Contents
MITSUBISHI UFJ FINANCIAL GROUP, INC. AND SUBSIDIARIES
NOTES TO CONSOLIDATED FINANCIAL STATEMENTS—(Continued)
The above pledged assets were classified by type of liabilities to which they related as follows:
| 2019 | ||||
| (in millions) | ||||
|
Deposits |
¥ | 223,075 | ||
|
Payables under repurchase agreements and securities lending transactions |
16,316,732 | |||
|
Other short-term borrowings and long-term debt |
14,522,393 | |||
|
Other |
10,424 | |||
|
|
|
|||
|
Total |
¥ | 31,072,624 | ||
|
|
|
|||
At March 31, 2019, certain investment securities, principally Japanese national government and Japanese government agency bonds, loans, and other assets with a combined carrying value of ¥19,875,392 million were pledged for acting as a collection agent of public funds, for settlement of exchange at the Bank of Japan and Japanese Banks’ Payment Clearing Network, for derivative transactions and for certain other purposes.
The MUFG Group engages in on-balance sheet securitizations. These securitizations of mortgage and apartment loans, which do not qualify for sales treatment, are accounted for as secured borrowings. The amount of loans in the table above represents the carrying amount of these transactions with the carrying amount of the associated liabilities included in Other short-term borrowings and Long-term debt.
Under Japanese law, Japanese banks are required to maintain certain reserves on deposit with the Bank of Japan based on the amount of deposit balances and certain other factors. There are similar reserve deposit requirements for foreign offices and subsidiaries engaged in banking businesses in foreign countries. At March 31, 2018 and 2019 the reserve funds required to be maintained by the MUFG Group, which are included in Cash and due from banks and Interest-earning deposits in other banks, were ¥2,679,482 million and ¥2,568,340 million, respectively.
Collateral
The MUFG Group accepts and provides financial assets as collateral for transactions, principally commercial loans, repurchase agreements and securities lending transactions, call money, and derivatives. Financial assets eligible for such collateral include, among others, marketable equity securities, trade and notes receivable and CDs.
Secured parties, including creditors and counterparties to certain transactions with the MUFG Group, may sell or repledge financial assets provided as collateral. Certain contracts, however, may not be specific about the secured party’s right to sell or repledge collateral under the applicable statutes and, therefore, whether or not the secured party is permitted to sell or repledge collateral would differ depending on the interpretations of specific provisions of the existing statutes, contract or certain market practices.
If the MUFG Group determines, based on available information, that a financial asset provided as collateral might not be sold or repledged by the secured parties, such collateral is not separately reported in the accompanying consolidated balance sheets. If a secured party is permitted to sell or repledge financial assets provided as collateral by contract or custom under the existing statutes, the MUFG Group reports such pledged financial assets separately on the face of the accompanying consolidated balance sheets. At March 31, 2019, the MUFG Group pledged ¥30,204 billion of assets that may not be sold or repledged by the secured parties.
Certain banking subsidiaries accept collateral for commercial loans and certain banking transactions under a standardized agreement with customers, which provides that these banking subsidiaries may require the
F-71
Table of Contents
MITSUBISHI UFJ FINANCIAL GROUP, INC. AND SUBSIDIARIES
NOTES TO CONSOLIDATED FINANCIAL STATEMENTS—(Continued)
customers to provide collateral or guarantees with respect to the loans and other banking transactions. Financial assets pledged as collateral are generally negotiable and transferable instruments, and such negotiability and transferability are authorized by applicable legislation. In principle, Japanese legislation permits these banking subsidiaries to repledge financial assets accepted as collateral unless otherwise prohibited by contract or relevant statutes. Nevertheless, the MUFG Group did not sell or repledge nor does it plan to sell or repledge such collateral accepted in connection with commercial loans before a debtor’s default or other credit events specified in the agreements as it is not customary within the banking industry in Japan to dispose of collateral before a debtor’s default and other specified credit events. Derivative agreements commonly used in the marketplace do not prohibit a secured party’s disposition of financial assets received as collateral, and in resale agreements and securities borrowing transactions, securities accepted as collateral may be sold or repledged by the secured parties. At March 31, 2018 and 2019, the fair value of the collateral accepted by the MUFG Group that is permitted to be sold or repledged was ¥25,358 billion and ¥22,927 billion, respectively, of which ¥17,738 billion and ¥16,514 billion, respectively, was sold or repledged.
At March 31, 2018 and 2019, the cash collateral pledged for derivative transactions, which is included in Other assets, was ¥1,473,109 million and ¥1,276,897 million, respectively, and the cash collateral received for derivative transactions, which is included in Other liabilities, was ¥1,158,053 million and ¥844,234 million, respectively.
| 9. | DEPOSITS |
The balances of time deposits, including CDs, issued in amounts of ¥10 million (approximately U.S.$90 thousand at the Federal Reserve Bank of New York’s noon buying rate on March 29, 2019) or more with respect to domestic deposits and issued in amounts of U.S.$100,000 or more with respect to foreign deposits were ¥27,381,920 million and ¥22,386,612 million, respectively, at March 31, 2018, and ¥25,899,780 million and ¥23,858,381 million, respectively, at March 31, 2019.
The maturity information at March 31, 2019 for domestic and foreign time deposits, including CDs, is summarized as follows:
| Domestic | Foreign | |||||||
| (in millions) | ||||||||
|
Due in one year or less |
¥ | 33,351,324 | ¥ | 23,559,245 | ||||
|
Due after one year through two years |
4,987,763 | 1,145,596 | ||||||
|
Due after two years through three years |
2,688,960 | 351,794 | ||||||
|
Due after three years through four years |
539,629 | 146,985 | ||||||
|
Due after four years through five years |
574,244 | 22,104 | ||||||
|
Due after five years |
836,549 | 29,634 | ||||||
|
|
|
|
|
|||||
|
Total |
¥ | 42,978,469 | ¥ | 25,255,358 | ||||
|
|
|
|
|
|||||
| 10. | CALL MONEY AND FUNDS PURCHASED |
A summary of funds transactions for the fiscal years ended March 31, 2018 and 2019 is as follows:
| 2018 | 2019 | |||||||
| (in millions, except percentages and days) | ||||||||
|
Outstanding at end of fiscal year: |
||||||||
|
Amount |
¥ | 2,452,543 | ¥ | 2,450,320 | ||||
|
Principal range of maturities |
1 day to 30 days | 1 day to 30 days | ||||||
|
Weighted average interest rate |
0.31 | % | 0.12 | % | ||||
F-72
Table of Contents
MITSUBISHI UFJ FINANCIAL GROUP, INC. AND SUBSIDIARIES
NOTES TO CONSOLIDATED FINANCIAL STATEMENTS—(Continued)
| 11. | DUE TO TRUST ACCOUNT |
Mitsubishi UFJ Trust and Banking holds assets on behalf of its customers in an agent, fiduciary or trust capacity. Such trust account assets are not the MUFG Group’s proprietary assets and are managed and accounted for separately.
However, excess cash funds of individual trust accounts are often placed with Mitsubishi UFJ Trust and Banking which manages the funds together with its own funds in its proprietary account. Due to trust account reflects a temporary placement of the excess funds from individual trust accounts and, in view of the MUFG Group’s funding, due to trust account is similar to short-term funding, including demand deposits and other overnight funds purchased. The balance changes in response to the day-to-day changes in the excess funds placed by the trust accounts. A summary of due to trust account transactions at March 31, 2018 and 2019 is as follows:
| 2018 | 2019 | |||||||
| (in millions, except percentages) | ||||||||
|
Amount outstanding at end of fiscal year |
¥ | 3,386,158 | ¥ | 2,735,952 | ||||
|
Weighted average interest rate on outstanding balance at end of fiscal year |
0.00 | % | 0.00 | % | ||||
| 12. | SHORT-TERM BORROWINGS AND LONG-TERM DEBT |
At March 31, 2018 and 2019, the MUFG Group had unused lines of credit for financing amounting to ¥5,142,206 million and ¥5,525,069 million, respectively. The amounts principally consist of pooled collateral which are used to cover shortages in the Bank of Japan account and to meet liquidity needs. The MUFG Group may borrow from the Bank of Japan on demand up to the total amount of collateral eligible for credit extension.
Other short-term borrowings at March 31, 2018 and 2019 were comprised of the following:
| 2018 | 2019 | |||||||
| (in millions, except percentages) | ||||||||
|
Domestic offices: |
||||||||
|
Commercial paper |
¥ | 1,094,487 | ¥ | 1,033,568 | ||||
|
Borrowings from the Bank of Japan |
305,520 | 241,070 | ||||||
|
Borrowings from other financial institutions |
243,968 | 227,482 | ||||||
|
Other |
84,620 | 122,166 | ||||||
|
|
|
|
|
|||||
|
Total domestic offices |
1,728,595 | 1,624,286 | ||||||
|
|
|
|
|
|||||
|
Foreign offices: |
||||||||
|
Commercial paper |
4,275,278 | 3,929,636 | ||||||
|
Borrowings from other financial institutions |
784,949 | 967,901 | ||||||
|
Short-term debentures |
18,523 | 68,492 | ||||||
|
Other |
73,917 | 141,803 | ||||||
|
|
|
|
|
|||||
|
Total foreign offices |
5,152,667 | 5,107,832 | ||||||
|
|
|
|
|
|||||
|
Total |
6,881,262 | 6,732,118 | ||||||
|
Less unamortized discount |
138 | 1,045 | ||||||
|
|
|
|
|
|||||
|
Other short-term borrowings—net |
¥ | 6,881,124 | ¥ | 6,731,073 | ||||
|
|
|
|
|
|||||
|
Weighted average interest rate on outstanding balance at end of fiscal year |
1.29 | % | 1.97 | % | ||||
F-73
Table of Contents
MITSUBISHI UFJ FINANCIAL GROUP, INC. AND SUBSIDIARIES
NOTES TO CONSOLIDATED FINANCIAL STATEMENTS—(Continued)
Long-term debt (with original maturities of more than one year) at March 31, 2018 and 2019 was comprised of the following:
| 2018 | 2019 | |||||||
| (in millions) | ||||||||
|
MUFG: |
||||||||
|
Obligations under capital leases |
¥ | 1,973 | ¥ | 1,725 | ||||
|
Unsubordinated debt (1) : |
||||||||
|
Fixed rate bonds, payable in US dollars, due 2021-2039, principally 2.19%-4.29% |
1,737,809 | 2,949,022 | ||||||
|
Fixed rate bonds, payable in Euro, due 2021-2033, principally 0.40%-1.75% |
230,629 | 301,124 | ||||||
|
Fixed rate bonds, payable in other currencies, due 2025-2027, principally 3.55%-4.05% (2) |
17,639 | 21,257 | ||||||
|
Floating rate bonds, payable in US dollars, due 2021-2023, principally 3.31%-4.51% |
424,795 | 765,188 | ||||||
|
Floating rate bonds, payable in Euro, due 2023, principally 0.24% |
— | 43,596 | ||||||
|
|
|
|
|
|||||
|
Total |
2,410,872 | 4,080,187 | ||||||
|
|
|
|
|
|||||
|
Subordinated debt (1) : |
||||||||
|
Fixed rate bonds, payable in Japanese yen, due 2024-2030, principally 0.37%-1.39% |
482,662 | 618,925 | ||||||
|
Adjustable rate bonds, payable in Japanese yen, due 2024-2028, principally 0.30%-0.66% |
795,944 | 890,359 | ||||||
|
Adjustable rate bonds, payable in Japanese yen, no stated maturity, principally 1.03%-4.42% |
1,557,610 | 1,706,695 | ||||||
|
Adjustable rate borrowings, payable in Japanese yen, due 2025-2028, principally 0.46%-0.50% |
32,500 | 32,500 | ||||||
|
Adjustable rate borrowings, payable in Japanese yen, no stated maturity, principally 1.17%-4.78% |
1,500 | 45,960 | ||||||
|
Floating rate bonds, payable in Japanese yen, no stated maturity, principally 3.00% |
3,500 | 3,500 | ||||||
|
Floating rate borrowings, payable in Japanese yen, due 2025-2028, principally 0.57%-0.79% |
76,000 | 86,000 | ||||||
|
|
|
|
|
|||||
|
Total |
2,949,716 | 3,383,939 | ||||||
|
|
|
|
|
|||||
|
Total |
5,362,561 | 7,465,851 | ||||||
|
|
|
|
|
|||||
|
MUFG Bank: |
||||||||
|
Obligations under capital leases |
¥ | 6,906 | ¥ | 7,704 | ||||
|
Obligation under sale-and-leaseback transactions |
41,892 | 40,732 | ||||||
|
Unsubordinated debt (1) : |
||||||||
|
Fixed rate bonds, payable in Japanese yen, due 2019-2027, principally 0.22%-2.69% |
346,800 | 234,500 | ||||||
|
Fixed rate bonds, payable in US dollars, due 2019-2049, principally 0.00%-4.70% |
1,451,745 | 1,284,812 | ||||||
|
Fixed rate bonds, payable in Euro, due 2022-2037, principally 0.88%-2.06% |
111,956 | 112,687 | ||||||
|
Fixed rate bonds, payable in other currencies, due 2021-2047, principally 0.00%-5.30% (2) |
19,502 | 19,084 | ||||||
|
Fixed rate borrowings, payable in Japanese yen, due 2019-2028, principally 0.00%-0.25% |
9,561,784 | 10,786,372 | ||||||
|
Fixed rate borrowings, payable in US dollars, due 2018, principally 7.49% |
38 | — | ||||||
|
Fixed rate borrowings, payable in Euro, due 2026, principally 0.00% |
1,044 | — | ||||||
|
Fixed rate borrowings, payable in other currencies, due 2030, principally 2.93% (2) |
— | 9,483 | ||||||
|
Adjustable rate bonds, payable in US dollars, due 2030, principally 3.00% |
1,062 | 1,110 | ||||||
|
Floating rate bonds, payable in US dollars, due 2018, principally 3.13% |
53,120 | — | ||||||
|
Floating rate borrowings, payable in US dollars, due 2019-2031, principally 2.64%-3.34% |
1,071,239 | 1,008,949 | ||||||
|
Floating rate borrowings, payable in Euro, due 2021-2022, principally 0.00%-0.06% |
20,150 | 15,382 | ||||||
|
Floating rate borrowings, payable in other currencies, due 2028, principally 3.23% (2) |
— | 5,240 | ||||||
|
|
|
|
|
|||||
|
Total |
12,638,440 | 13,477,619 | ||||||
|
|
|
|
|
|||||
|
Subordinated debt (1) : |
||||||||
|
Fixed rate bonds, payable in Japanese yen, due 2019-2031, principally 1.31%-2.91% |
520,350 | 513,420 | ||||||
|
Fixed rate borrowings, payable in Japanese yen, due 2022-2035, principally 0.37%-2.24% |
98,400 | 73,400 | ||||||
|
Adjustable rate borrowings, payable in Japanese yen, due 2024-2028, principally 0.37%-2.56% |
73,000 | 20,000 | ||||||
F-74
Table of Contents
MITSUBISHI UFJ FINANCIAL GROUP, INC. AND SUBSIDIARIES
NOTES TO CONSOLIDATED FINANCIAL STATEMENTS—(Continued)
| 2018 | 2019 | |||||||
| (in millions) | ||||||||
|
Adjustable rate borrowings, payable in Japanese yen, no stated maturity, principally 2.67%-4.78% |
496,000 | 355,000 | ||||||
|
Floating rate borrowings, payable in Japanese yen, due 2027, principally 0.19% |
15,000 | 15,000 | ||||||
|
|
|
|
|
|||||
|
Total |
1,202,750 | 976,820 | ||||||
|
|
|
|
|
|||||
|
Obligations under loan securitization transaction accounted for as secured borrowings due 2019-2078, principally 0.13%-6.90% |
622,061 | 639,037 | ||||||
|
|
|
|
|
|||||
|
Total |
14,512,049 | 15,141,912 | ||||||
|
|
|
|
|
|||||
|
Other subsidiaries: |
||||||||
|
Obligations under capital leases |
¥ | 9,835 | ¥ | 13,107 | ||||
|
Unsubordinated debt (1) : |
||||||||
|
Fixed rate borrowings, bonds and notes, payable in Japanese yen, due 2019-2044, principally 0.00%-20.00% |
3,453,352 | 1,291,537 | ||||||
|
Fixed rate borrowings, bonds and notes, payable in US dollars, due 2019-2037, principally 0.00%-34.00% |
936,086 | 1,385,936 | ||||||
|
Fixed rate borrowings, bonds and notes, payable in Euro, due 2020-2026, principally 0.15%-1.28% |
2,619 | 2,479 | ||||||
|
Fixed rate borrowings, bonds and notes, payable in Thai baht, due 2019-2025, principally 0.01%-7.15% |
330,814 | 334,586 | ||||||
|
Fixed rate borrowings, bonds and notes, payable in other currencies, due 2019-2037, principally 0.00%-15.33% (2) |
190,567 | 219,781 | ||||||
|
Floating/Adjustable rate borrowings, bonds and notes, payable in Japanese yen, due 2019-2048, principally 0.00%-7.70% |
1,342,318 | 1,425,387 | ||||||
|
Floating rate borrowings, bonds and notes, payable in US dollars, due 2019-2028, principally 0.00%-27.00% |
186,515 | 244,253 | ||||||
|
Floating rate borrowings, bonds and notes, payable in other currencies, due 2019-2022, principally 1.43%-3.41% (2) |
5,420 | 6,241 | ||||||
|
|
|
|
|
|||||
|
Total |
6,447,691 | 4,910,200 | ||||||
|
|
|
|
|
|||||
|
Subordinated debt (1) : |
||||||||
|
Fixed rate borrowings, bonds and notes, payable in Japanese yen, due 2019-2030, principally 0.65%-2.61% |
364,326 | 269,373 | ||||||
|
Fixed rate bonds and notes, payable in US dollars, due 2019-2027, principally 7.50%-10.85% |
1,661 | 1,409 | ||||||
|
Fixed rate bonds and notes, payable in Thai baht, due 2020-2027, principally 3.40%-3.90% |
144,900 | 143,212 | ||||||
|
Fixed rate bonds and notes, payable in other currencies, due 2021, principally 0.00% (2) |
7,428 | 7,347 | ||||||
|
Adjustable rate borrowings, bonds and notes, payable in Japanese yen, no stated maturity, principally 2.83% |
104,500 | 4,500 | ||||||
|
Floating rate borrowings, bonds and notes, payable in Japanese yen, due 2019-2021, principally 0.53%-0.73% |
72,493 | 41,000 | ||||||
|
Floating rate bonds and notes, payable in US dollars, due 2019-2036, principally 4.49%-11.86% |
5,250 | 5,172 | ||||||
|
|
|
|
|
|||||
|
Total |
700,558 | 472,013 | ||||||
|
|
|
|
|
|||||
|
Obligations under loan securitization transaction accounted for as secured borrowings due 2020-2022, principally 1.10%-2.20% |
50,551 | 2,813 | ||||||
|
|
|
|
|
|||||
|
Total |
7,208,635 | 5,398,133 | ||||||
|
|
|
|
|
|||||
|
Total |
27,083,245 | 28,005,896 | ||||||
|
|
|
|
|
|||||
|
Debt Issuance Cost |
¥ | (13,689 | ) | ¥ | (15,353 | ) | ||
|
|
|
|
|
|||||
|
Total |
¥ | 27,069,556 | ¥ | 27,990,543 | ||||
|
|
|
|
|
|||||
Notes:
| (1) | Adjustable rate debts are debts where interest rates are reset in accordance with the terms of the debt agreements, and floating rate debts are debts where interest rates are repriced in accordance with movements of markets indices. |
F-75
Table of Contents
MITSUBISHI UFJ FINANCIAL GROUP, INC. AND SUBSIDIARIES
NOTES TO CONSOLIDATED FINANCIAL STATEMENTS—(Continued)
| (2) | Minor currencies, such as Australian dollars, British pounds, Indonesian rupiah, Brazilian real, Russian ruble, etc, have been summarized into the “other currencies” classification. |
The MUFG Group uses derivative financial instruments to manage its interest rate and currency exposures for certain debts. The derivative financial instruments include swaps, forwards, options and other types of derivatives. As a result of these derivative instruments, the effective rates reflected in the table above may differ from the coupon rates. The interest rates for the adjustable and floating rate debt shown in the above table are those in effect at March 31, 2018 and 2019.
Certain debt agreements permit the MUFG Group to redeem the related debt, in whole or in part, prior to maturity at the option of the issuer on terms specified in the respective agreements.
The following is a summary of maturities of long-term debt subsequent to March 31, 2019:
| MUFG | BK |
Other
subsidiaries |
Total | |||||||||||||
| (in millions) | ||||||||||||||||
|
Fiscal year ending March 31: |
||||||||||||||||
|
2020 |
¥ | 450 | ¥ | 1,551,272 | ¥ | 1,502,213 | ¥ | 3,053,935 | ||||||||
|
2021 |
685,348 | 8,552,229 | 895,647 | 10,133,224 | ||||||||||||
|
2022 |
1,172,368 | 2,166,840 | 720,272 | 4,059,480 | ||||||||||||
|
2023 |
746,235 | 663,227 | 580,257 | 1,989,719 | ||||||||||||
|
2024 |
265,873 | 315,828 | 414,380 | 996,081 | ||||||||||||
|
2025 and thereafter |
4,595,577 | 1,892,516 | 1,285,364 | 7,773,457 | ||||||||||||
|
|
|
|
|
|
|
|
|
|||||||||
|
Total |
¥ | 7,465,851 | ¥ | 15,141,912 | ¥ | 5,398,133 | ¥ | 28,005,896 | ||||||||
|
|
|
|
|
|
|
|
|
|||||||||
New Issuances of Bonds for Basel III
For the fiscal year ended March 31, 2019, the MUFG Group issued to institutional investors in Japan ¥155,000 million aggregate principal amount of unsecured perpetual subordinated Additional Tier 1 notes. These notes are subject to the MUFG Group’s discretion to cease interest payments and a write-down of the principal upon the occurrence of certain events, including when the MUFG Group’s Common Equity Tier 1 ratio declines below 5.125%, when the MUFG Group is deemed to be at risk of becoming non-viable or when the MUFG Group becomes subject to bankruptcy proceedings.
For the fiscal year ended March 31, 2019, the MUFG Group issued $13,220 million (approximately ¥1,467,288 million), €1,000 million (approximately ¥124,560 million) and HK$302 million (approximately ¥4,270 million) of bonds with an intent to count towards Total Loss-Absorbing Capacity (“TLAC”) to global institutional investors to meet the TLAC requirement under the standards issued by the Financial Stability Board (“FSB”). Under the FSB’s TLAC standard, the MUFG Group is required to hold TLAC debt in an amount not less than 16% of risk-weighted assets and 6% of the applicable Basel III leverage ratio denominator by January 1, 2019, and not less than 18% of risk-weighted assets and 6.75% of the applicable Basel III leverage ratio denominator by January 1, 2022.
| 13. | SEVERANCE INDEMNITIES AND PENSION PLANS |
Defined Benefit Pension Plans
The MUFG Group has funded non-contributory defined benefit pension plans, which cover substantially all of its employees and mainly provide for lifetime annuity payments commencing at age 65 (“pension benefits”) based on eligible compensation at the time of severance, rank, years of service and other factors.
F-76
Table of Contents
MITSUBISHI UFJ FINANCIAL GROUP, INC. AND SUBSIDIARIES
NOTES TO CONSOLIDATED FINANCIAL STATEMENTS—(Continued)
MUFG Bank and certain domestic subsidiaries, Mitsubishi UFJ Trust and Banking, Mitsubishi UFJ Securities Holdings, Mitsubishi UFJ NICOS and some subsidiaries of MUFG have non-contributory Corporate Defined Benefit Pension plans which provide benefits to all their domestic employees.
The MUFG Group also offers qualified and nonqualified defined benefit pension plans in foreign offices and subsidiaries for their employees. The qualified plans are non-contributory defined pension plans, which provide benefits upon retirement based on years of service and average compensation and cover substantially all of the employees of such foreign offices and subsidiaries. With respect to the offices and subsidiaries in the United States of America, the qualified plans are funded on a current basis in compliance with the requirement of the Employee Retirement Income Security Act of the United States of America. The nonqualified plans are non-contributory defined benefit pension plans, under which certain employees earn pay and interest credits on compensation amounts above the maximum stipulated by applicable laws under the qualified plans.
Severance Indemnities Plans
The MUFG Group has SIPs under which their employees in Japan, other than those who are directors, are entitled, under most circumstances, upon mandatory retirement at normal retirement age or earlier termination of employment, to lump-sum severance indemnities based on eligible compensation at the time of severance, rank, years of service and other factors. Under SIPs, benefit payments in the form of a lump-sum cash payment with no option to receive annuity payments, upon mandatory retirement at normal retirement age or earlier termination of employment, are provided. When a benefit is paid in a single payment to a benefit payee under the plans, the payment represents final relief of the obligation.
Other Postretirement Plans
The MUFG Group’s foreign offices and subsidiaries, primarily in the United States of America, provide their employees with certain postretirement medical and life insurance benefits (“other benefits”).
F-77
Table of Contents
MITSUBISHI UFJ FINANCIAL GROUP, INC. AND SUBSIDIARIES
NOTES TO CONSOLIDATED FINANCIAL STATEMENTS—(Continued)
Net periodic cost of pension benefits and other benefits for the fiscal years ended March 31, 2017, 2018 and 2019 include the following components:
| Domestic subsidiaries | Foreign offices and subsidiaries | |||||||||||||||||||||||||||||||||||
| 2017 | 2018 | 2019 | 2017 | 2018 | 2019 | |||||||||||||||||||||||||||||||
|
Pension
benefits and SIP |
Pension
benefits and SIP |
Pension
benefits and SIP |
Pension
benefits |
Other
benefits |
Pension
benefits |
Other
benefits |
Pension
benefits |
Other
benefits |
||||||||||||||||||||||||||||
| (in millions) | ||||||||||||||||||||||||||||||||||||
|
Service cost—benefits earned during the fiscal year |
¥ | 49,057 | ¥ | 47,064 | ¥ | 48,352 | ¥ | 13,107 | ¥ | 990 | ¥ | 10,169 | ¥ | 676 | ¥ | 12,395 | ¥ | 525 | ||||||||||||||||||
|
Interest cost on projected benefit obligation |
12,308 | 14,383 | 13,504 | 15,287 | 1,229 | 15,359 | 1,079 | 14,958 | 1,046 | |||||||||||||||||||||||||||
|
Expected return on plan assets |
(60,255 | ) | (68,432 | ) | (74,270 | ) | (29,339 | ) | (2,047 | ) | (32,110 | ) | (2,122 | ) | (33,266 | ) | (2,314 | ) | ||||||||||||||||||
|
Amortization of net actuarial loss |
17,764 | 7,309 | 731 | 12,707 | 1,366 | 8,847 | 1,124 | 9,993 | 707 | |||||||||||||||||||||||||||
|
Amortization of prior service cost |
(6,348 | ) | (1,094 | ) | (1,210 | ) | (2,045 | ) | (1,534 | ) | (3,090 | ) | (2,775 | ) | (3,039 | ) | (2,020 | ) | ||||||||||||||||||
|
Loss (gain) on settlements and curtailment |
(1,765 | ) | (4,394 | ) | (5,980 | ) | (208 | ) | — | 52 | — | 49 | — | |||||||||||||||||||||||
|
|
|
|
|
|
|
|
|
|
|
|
|
|
|
|
|
|
|
|||||||||||||||||||
|
Net periodic benefit cost (income) |
¥ | 10,761 | ¥ | (5,164 | ) | ¥ | (18,873 | ) | ¥ | 9,509 | ¥ | 4 | ¥ | (773 | ) | ¥ | (2,018 | ) | ¥ | 1,090 | ¥ | (2,056 | ) | |||||||||||||
|
|
|
|
|
|
|
|
|
|
|
|
|
|
|
|
|
|
|
|||||||||||||||||||
As a result of adopting the new guidance issued in March 2017, as described in Note 1, the service cost component continues to be presented in Salaries and employee benefits while other components of net pension benefit/cost (i.e., Interest cost on projected benefit obligation, Expected return on plan assets, Amortization of net actuarial loss, Amortization of prior service cost, and Loss (gain) on settlements and curtailment disclosed in the above table) are now presented in Other non-interest expenses.
F-78
Table of Contents
MITSUBISHI UFJ FINANCIAL GROUP, INC. AND SUBSIDIARIES
NOTES TO CONSOLIDATED FINANCIAL STATEMENTS—(Continued)
The following table summarizes the assumptions used in computing the present value of the projected benefit obligations and the net periodic benefit cost:
| Domestic subsidiaries | Foreign offices and subsidiaries | |||||||||||||||||||||||||||||||||||
| 2017 | 2018 | 2019 | 2017 | 2018 | 2019 | |||||||||||||||||||||||||||||||
|
Pension
benefits and SIP |
Pension
benefits and SIP |
Pension
benefits and SIP |
Pension
benefits |
Other
benefits |
Pension
benefits |
Other
benefits |
Pension
benefits |
Other
benefits |
||||||||||||||||||||||||||||
|
Weighted-average assumptions used: |
||||||||||||||||||||||||||||||||||||
|
Discount rates in determining expense |
0.68 | % | 0.82 | % | 0.76 | % | 3.90 | % | 3.03 | % | 3.52 | % | 3.61 | % | 3.19 | % | 3.27 | % | ||||||||||||||||||
|
Discount rates in determining benefit obligation |
0.82 | 0.76 | 0.61 | 3.81 | 3.86 | 3.38 | 3.43 | 3.87 | 3.99 | |||||||||||||||||||||||||||
|
Rates of increase in future compensation level for determining expense |
3.23 | 3.23 | 3.21 | 4.65 | — | 4.65 | — | 4.65 | — | |||||||||||||||||||||||||||
|
Rates of increase in future compensation level for determining benefit obligation |
3.23 | 3.21 | 3.21 | 4.65 | — | 4.65 | — | 5.01 | — | |||||||||||||||||||||||||||
|
Expected rates of return on plan assets |
2.75 | 2.87 | 2.83 | 6.80 | 7.50 | 6.71 | 7.50 | 6.70 | 7.50 | |||||||||||||||||||||||||||
The following tables present the assumed health care cost trend rates for foreign offices and subsidiaries, which are used to measure the expected cost of benefits for the next year, and the effect of a one-percentage-point change in the assumed health care cost trend rate:
| MUAH | Other than MUAH | |||||||||||||||
| 2018 (1) | 2019 (1) | 2018 (1) | 2019 (1) | |||||||||||||
|
Initial trend rate |
4.44 | % | 4.44 | % | 7.00 | % | 7.00 | % | ||||||||
|
Ultimate trend rate |
3.94 | % | 3.94 | % | 4.50 | % | 4.50 | % | ||||||||
|
Year the rate reaches the ultimate trend rate |
2026 | 2027 | 2026 | 2027 | ||||||||||||
| MUAH | Other than MUAH | |||||||||||||||
|
One-percentage-
point increase |
One-percentage-
point decrease |
One-percentage-
point increase |
One-percentage-
point decrease |
|||||||||||||
| (in millions) | ||||||||||||||||
|
Effect on total of service and interest cost components |
¥ | 183 | ¥ | (152 | ) | ¥ | 44 | ¥ | (35 | ) | ||||||
|
Effect on postretirement benefit obligation |
3,110 | (2,630 | ) | 812 | (644 | ) | ||||||||||
Note:
| (1) | Fiscal years of MUFG Americas Holdings and foreign subsidiaries end on December 31. Therefore, the above tables present the rates and amounts at December 31, 2017 and 2018, respectively. |
F-79
Table of Contents
MITSUBISHI UFJ FINANCIAL GROUP, INC. AND SUBSIDIARIES
NOTES TO CONSOLIDATED FINANCIAL STATEMENTS—(Continued)
The following table sets forth the combined funded status and amounts recognized in the accompanying consolidated balance sheets at March 31, 2018 and 2019:
| Domestic subsidiaries | Foreign offices and subsidiaries | |||||||||||||||||||||||
| 2018 | 2019 | 2018 | 2019 | |||||||||||||||||||||
|
Non-contributory
pension benefits and SIP |
Non-contributory
pension benefits and SIP |
Pension
benefits |
Other
benefits |
Pension
benefits |
Other
benefits |
|||||||||||||||||||
| (in millions) | ||||||||||||||||||||||||
|
Change in benefit obligation: |
||||||||||||||||||||||||
|
Benefit obligation at beginning of fiscal year |
¥ | 1,793,848 | ¥ | 1,821,794 | ¥ | 478,463 | ¥ | 35,222 | ¥ | 502,056 | ¥ | 34,347 | ||||||||||||
|
Service cost |
47,064 | 48,352 | 10,169 | 676 | 12,395 | 525 | ||||||||||||||||||
|
Interest cost |
14,383 | 13,504 | 15,359 | 1,079 | 14,958 | 1,046 | ||||||||||||||||||
|
Plan participants’ contributions |
— | — | 28 | 455 | 37 | 452 | ||||||||||||||||||
|
Acquisitions/ Divestitures |
(29 | ) | (160 | ) | — | — | (17 | ) | — | |||||||||||||||
|
Amendments |
— | — | — | — | 64 | — | ||||||||||||||||||
|
Actuarial loss (gain) |
49,678 | 43,527 | 25,519 | 506 | (28,466 | ) | (2,354 | ) | ||||||||||||||||
|
Benefits paid |
(67,913 | ) | (66,539 | ) | (19,388 | ) | (2,520 | ) | (19,894 | ) | (2,221 | ) | ||||||||||||
|
Lump-sum payment |
(15,237 | ) | (18,594 | ) | (861 | ) | — | (1,750 | ) | — | ||||||||||||||
|
Translation adjustments and other |
— | — | (7,233 | ) | (1,071 | ) | (10,303 | ) | (285 | ) | ||||||||||||||
|
|
|
|
|
|
|
|
|
|
|
|
|
|||||||||||||
|
Benefit obligation at end of fiscal year |
1,821,794 | 1,841,884 | 502,056 | 34,347 | 469,080 | 31,510 | ||||||||||||||||||
|
|
|
|
|
|
|
|
|
|
|
|
|
|||||||||||||
|
Change in plan assets: |
||||||||||||||||||||||||
|
Fair value of plan assets at beginning of fiscal year |
2,346,310 | 2,603,329 | 477,479 | 30,339 | 542,646 | 32,466 | ||||||||||||||||||
|
Actual return on plan assets |
250,704 | 13,664 | 75,824 | 4,890 | (21,353 | ) | (1,948 | ) | ||||||||||||||||
|
Employer contributions |
74,181 | 44,427 | 16,969 | 190 | 3,117 | 102 | ||||||||||||||||||
|
Acquisitions/ Divestitures |
47 | (93 | ) | — | — | — | — | |||||||||||||||||
|
Plan participants’ contributions |
— | — | 28 | 455 | 37 | 452 | ||||||||||||||||||
|
Benefits paid |
(67,913 | ) | (66,539 | ) | (19,388 | ) | (2,520 | ) | (19,894 | ) | (2,221 | ) | ||||||||||||
|
Translation adjustments and other |
— | — | (8,266 | ) | (888 | ) | (11,058 | ) | (593 | ) | ||||||||||||||
|
|
|
|
|
|
|
|
|
|
|
|
|
|||||||||||||
|
Fair value of plan assets at end of fiscal year |
2,603,329 | 2,594,788 | 542,646 | 32,466 | 493,495 | 28,258 | ||||||||||||||||||
|
|
|
|
|
|
|
|
|
|
|
|
|
|||||||||||||
|
Amounts recognized in the consolidated balance sheets: |
||||||||||||||||||||||||
|
Prepaid benefit cost |
¥ | 798,849 | ¥ | 770,564 | ¥ | 83,578 | ¥ | 2,552 | ¥ | 67,821 | ¥ | 1,372 | ||||||||||||
|
Accrued benefit cost |
(17,314 | ) | (17,660 | ) | (42,988 | ) | (4,433 | ) | (43,406 | ) | (4,624 | ) | ||||||||||||
|
|
|
|
|
|
|
|
|
|
|
|
|
|||||||||||||
|
Net amount recognized |
¥ | 781,535 | ¥ | 752,904 | ¥ | 40,590 | ¥ | (1,881 | ) | ¥ | 24,415 | ¥ | (3,252 | ) | ||||||||||
|
|
|
|
|
|
|
|
|
|
|
|
|
|||||||||||||
The aggregated accumulated benefit obligations of these plans at March 31, 2018 and 2019 were as follows:
|
Domestic
subsidiaries |
Foreign offices
and subsidiaries |
|||||||||||||||
| 2018 | 2019 | 2018 | 2019 | |||||||||||||
| (in millions) | ||||||||||||||||
|
Aggregated accumulated benefit obligations |
¥ | 1,784,837 | ¥ | 1,800,992 | ¥ | 475,522 | ¥ | 457,048 | ||||||||
The projected benefit obligations, accumulated benefit obligations and fair value of plan assets for the plans with accumulated benefit obligations in excess of plan assets at March 31, 2018 and 2019 were as follows:
|
Domestic
subsidiaries |
Foreign offices
and subsidiaries |
|||||||||||||||
| 2018 | 2019 | 2018 | 2019 | |||||||||||||
| (in millions) | ||||||||||||||||
|
Projected benefit obligations |
¥ | 22,445 | ¥ | 23,108 | ¥ | 62,511 | ¥ | 63,273 | ||||||||
|
Accumulated benefit obligations |
22,445 | 23,108 | 52,012 | 52,249 | ||||||||||||
|
Fair value of plan assets |
5,272 | 5,629 | 19,521 | 19,866 | ||||||||||||
F-80
Table of Contents
MITSUBISHI UFJ FINANCIAL GROUP, INC. AND SUBSIDIARIES
NOTES TO CONSOLIDATED FINANCIAL STATEMENTS—(Continued)
MUFG Bank, Mitsubishi UFJ Trust and Banking, Mitsubishi UFJ Securities Holdings, Mitsubishi UFJ NICOS and other subsidiaries paid special lump-sum termination benefits which are not a part of pension plans to certain early-terminated employees. The amounts charged to operations for such early termination benefits for the fiscal years ended March 31, 2017, 2018 and 2019 were ¥7,722 million, ¥10,153 million and ¥9,325 million, respectively.
The following table presents the amounts recognized in Accumulated OCI of the MUFG Group at March 31, 2018 and 2019:
| Domestic subsidiaries | Foreign offices and subsidiaries | |||||||||||||||||||||||
| 2018 | 2019 | 2018 | 2019 | |||||||||||||||||||||
|
Pension
benefits and SIP |
Pension
benefits and SIP |
Pension
benefits |
Other
benefits |
Pension
benefits |
Other
benefits |
|||||||||||||||||||
| (in millions) | ||||||||||||||||||||||||
|
Net actuarial loss |
¥ | 135,656 | ¥ | 245,037 | ¥ | 111,820 | ¥ | 7,449 | ¥ | 126,238 | ¥ | 8,628 | ||||||||||||
|
Prior service cost |
(6,669 | ) | (5,459 | ) | (17,936 | ) | (6,237 | ) | (14,536 | ) | (4,263 | ) | ||||||||||||
|
|
|
|
|
|
|
|
|
|
|
|
|
|||||||||||||
|
Gross amount recognized in Accumulated OCI |
128,987 | 239,578 | 93,884 | 1,212 | 111,702 | 4,365 | ||||||||||||||||||
|
Taxes |
(81,747 | ) | (115,816 | ) | (25,251 | ) | (358 | ) | (29,875 | ) | (1,282 | ) | ||||||||||||
|
|
|
|
|
|
|
|
|
|
|
|
|
|||||||||||||
|
Net amount recognized in Accumulated OCI |
¥ | 47,240 | ¥ | 123,762 | ¥ | 68,633 | ¥ | 854 | ¥ | 81,827 | ¥ | 3,083 | ||||||||||||
|
|
|
|
|
|
|
|
|
|
|
|
|
|||||||||||||
|
The following table presents OCI for the fiscal years ended March 31, 2018 and 2019: |
|
|||||||||||||||||||||||
| Domestic subsidiaries | Foreign offices and subsidiaries | |||||||||||||||||||||||
| 2018 | 2019 | 2018 | 2019 | |||||||||||||||||||||
|
Pension
benefits and SIP |
Pension
benefits and SIP |
Pension
benefits |
Other
benefits |
Pension
benefits |
Other
benefits |
|||||||||||||||||||
| (in millions) | ||||||||||||||||||||||||
|
Net actuarial loss (gain) arising during the year |
¥ | (132,593 | ) | ¥ | 104,132 | ¥ | (18,165 | ) | ¥ | (2,262 | ) | ¥ | 26,155 | ¥ | 1,908 | |||||||||
|
Prior service cost arising during the year |
— | — | — | — | 65 | — | ||||||||||||||||||
|
Losses (gains) due to amortization: |
||||||||||||||||||||||||
|
Net actuarial loss |
(7,309 | ) | (731 | ) | (8,847 | ) | (1,124 | ) | (9,993 | ) | (707 | ) | ||||||||||||
|
Prior service cost |
1,094 | 1,210 | 3,090 | 2,775 | 3,039 | 2,020 | ||||||||||||||||||
|
Curtailment and settlement |
4,394 | 5,980 | (52 | ) | — | (49 | ) | — | ||||||||||||||||
|
Foreign currency translation adjustments |
— | — | (3,502 | ) | (36 | ) | (1,399 | ) | (68 | ) | ||||||||||||||
|
|
|
|
|
|
|
|
|
|
|
|
|
|||||||||||||
|
Total changes in Accumulated OCI |
¥ | (134,414 | ) | ¥ | 110,591 | ¥ | (27,476 | ) | ¥ | (647 | ) | ¥ | 17,818 | ¥ | 3,153 | |||||||||
|
|
|
|
|
|
|
|
|
|
|
|
|
|||||||||||||
F-81
Table of Contents
MITSUBISHI UFJ FINANCIAL GROUP, INC. AND SUBSIDIARIES
NOTES TO CONSOLIDATED FINANCIAL STATEMENTS—(Continued)
The following table presents the expected amounts that will be amortized from Accumulated OCI as components of net periodic benefit cost, before taxes, for the fiscal year ending March 31, 2020:
|
Domestic
subsidiaries |
Foreign offices
and subsidiaries |
|||||||||||
|
Pension
benefits and SIP |
Pension
benefits |
Other
benefits |
||||||||||
| (in millions) | ||||||||||||
|
Net actuarial loss |
¥ | 5,395 | ¥ | 7,731 | ¥ | 1,130 | ||||||
|
Prior service cost |
(1,269 | ) | (3,056 | ) | (1,916 | ) | ||||||
|
|
|
|
|
|
|
|||||||
|
Total |
¥ | 4,126 | ¥ | 4,675 | ¥ | (786 | ) | |||||
|
|
|
|
|
|
|
|||||||
Investment policies
MUFG’s investment policy for plan assets is based on an asset liability matching strategy which is intended to maintain adequate liquidity for benefit payments and to achieve a stable increase in the plan assets in the medium and long-term through proper risk control and return maximization. As a general rule, investment policies for plan assets are reviewed periodically for some plans and in the following situations for all plans: (1) large fluctuations in pension plan liabilities caused by modifications to pension plans, or (2) changes in the market environment. The plan assets allocation strategies are the principal determinant in achieving expected investment returns on the plan assets. Actual asset allocations may fluctuate within acceptable ranges due to market value variability. Plan assets are managed by a combination of internal and external asset management companies and are rebalanced when market fluctuations cause an asset category to fall outside of its strategic asset allocation range. Performance of each plan asset category is compared against established indices and similar plan asset groups to evaluate whether the risk associated with the portfolio is appropriate for the level of return.
The weighted-average target asset allocation of plan assets for the pension benefits and other benefits at March 31, 2019 was as follows:
|
Domestic
subsidiaries |
Foreign offices
and subsidiaries |
|||||||||||
|
Asset category |
Pension
benefits and SIP |
Pension
benefits |
Other
benefits |
|||||||||
|
Japanese equity securities |
39.3 | % | 0.3 | % | — | % | ||||||
|
Japanese debt securities |
32.1 | — | — | |||||||||
|
Non-Japanese equity securities |
14.9 | 48.5 | 70.0 | |||||||||
|
Non-Japanese debt securities |
9.1 | 39.1 | 30.0 | |||||||||
|
Real estate |
1.3 | 9.9 | — | |||||||||
|
Short-term assets |
3.3 | 2.2 | — | |||||||||
|
|
|
|
|
|
|
|||||||
|
Total |
100.0 | % | 100.0 | % | 100.0 | % | ||||||
|
|
|
|
|
|
|
|||||||
Basis and procedure for estimating long-term return of each asset category
MUFG’s expected long-term rate of return on plan assets for domestic defined benefit pension plans and SIPs is based on a building-block methodology, which calculates the total long-term rate of return of the plan assets by aggregating the weighted rate of return derived from both long-term historical performance and forward-looking return expectations from each asset category.
F-82
Table of Contents
MITSUBISHI UFJ FINANCIAL GROUP, INC. AND SUBSIDIARIES
NOTES TO CONSOLIDATED FINANCIAL STATEMENTS—(Continued)
MUFG has determined the expected long-term rate of return for each asset category as follows:
| • |
Japanese equity securities: the rate for Japanese debt securities plus a premium for the risk associated with Japanese equity securities |
| • |
Japanese debt securities: economic growth rate of Japan |
| • |
Non-Japanese equity securities: the rate for non-Japanese debt securities plus a premium for the risk associated with non-Japanese equity securities |
| • |
Non-Japanese debt securities: global economic growth rate |
Foreign offices and subsidiaries periodically reconsider the expected long-term rate of return for their plan assets. They evaluate the investment return volatility of different asset categories and compare the liability structure of their pension and other benefits to those of other companies, while considering their funding policy to maintain a funded status sufficient to meet participants’ benefit obligations, and reduce long-term funding requirements and pension costs. Based on this information, foreign offices and subsidiaries update the expected long-term rate of return.
Cash flows
The MUFG Group expects to contribute to the plan assets for the fiscal year ending March 31, 2020 based upon its current funded status and expected asset return assumptions as follows:
|
For the pension benefits of domestic subsidiaries |
¥ | 32.7 billion | ||
|
For the pension benefits of foreign offices and subsidiaries |
0.7 billion | |||
|
For the other benefits of foreign offices and subsidiaries |
0.4 billion |
Estimated future benefit payments
The following table presents benefit payments expected to be paid, which include the effect of expected future service for the fiscal years indicated:
|
Domestic
subsidiaries |
Foreign offices
and subsidiaries |
|||||||||||
|
Pension
benefits and SIP |
Pension
benefits |
Other
benefits |
||||||||||
| (in millions) | ||||||||||||
|
Fiscal year ending March 31: |
||||||||||||
|
2020 |
¥ | 84,558 | ¥ | 19,923 | ¥ | 1,997 | ||||||
|
2021 |
82,297 | 20,928 | 2,072 | |||||||||
|
2022 |
82,320 | 21,903 | 2,129 | |||||||||
|
2023 |
81,710 | 22,881 | 2,177 | |||||||||
|
2024 |
81,684 | 23,726 | 2,205 | |||||||||
|
Thereafter (2025-2029) |
401,772 | 162,850 | 10,222 | |||||||||
F-83
Table of Contents
MITSUBISHI UFJ FINANCIAL GROUP, INC. AND SUBSIDIARIES
NOTES TO CONSOLIDATED FINANCIAL STATEMENTS—(Continued)
Fair value measurement of the plan assets
The following is a description of the valuation methodologies used for plan assets measured at fair value as well as the classification of the plan assets pursuant to the fair value hierarchy described in Note 32:
Government bonds and other debt securities
When quoted prices are available in an active market, the MUFG Group adopts the quoted prices to measure the fair value of securities and such securities are classified in Level 1 of the fair value hierarchy. Level 1 securities include Japanese government bonds, most non-Japanese government bonds and certain corporate bonds. When quoted prices are available but not traded actively, such securities are classified in Level 2 of the fair value hierarchy. When quoted prices are not available, the MUFG Group generally estimates fair values by using non-binding prices obtained from independent pricing vendors. Such securities are generally classified in Level 2 of the fair value hierarchy. Level 2 securities include certain non-Japanese government bonds, official institution bonds and corporate bonds. When there is lack of liquidity for securities or significant inputs adopted to the fair value measurements are unobservable, such securities are classified in Level 3 of the fair value hierarchy. Such Level 3 securities mainly consist of non-Japanese corporate bonds.
Marketable equity securities
When quoted prices are available in an active market, the MUFG Group adopts the quoted prices to measure the fair value of marketable equity securities and such securities are classified in Level 1 of the fair value hierarchy. When quoted prices are available but not traded actively, such securities are classified in Level 2 of the fair value hierarchy.
Japanese pooled funds
Japanese pooled funds are investment fund vehicles designed for Japanese pension plan investments under Japanese pension trust fund regulations. Based upon the nature of the funds’ investments, Japanese pooled funds are categorized into four major fund types: Japanese marketable equity securities type, Japanese debt securities type, Non-Japanese marketable equity securities type and Non-Japanese debt securities type. The other types of funds invest in short-term financial instruments or loans receivable. Japanese pooled funds are generally readily redeemable at their net asset values. The fair values of Japanese pooled funds are measured at their net asset values per share (or its equivalent) as a practical expedient.
Other investment funds
Other investment funds include mutual funds, private investments funds, common collective funds, private equity funds and real estate funds. The listed investment funds or mutual funds are valued at quoted prices and classified in Level 1 or Level 2 of the fair value hierarchy. When there is no available market quotation, the fair values are generally determined at net asset values per share (or its equivalent) as a practical expedient. Other investment funds classified in Level 3 of the fair value hierarchy consist of certain real estate funds whose fair values are not measured at their net asset values but by using significant unobservable inputs and there is inherent lack of the funds’ liquidity.
Japanese general accounts of life insurance companies
These instruments are contracts with life insurance companies that guarantee return of a certain level of fixed income, which are mainly invested in assets with low market risk such as Japanese debt securities. They are measured at conversion value and classified in Level 2 of the fair value hierarchy.
F-84
Table of Contents
MITSUBISHI UFJ FINANCIAL GROUP, INC. AND SUBSIDIARIES
NOTES TO CONSOLIDATED FINANCIAL STATEMENTS—(Continued)
Other investments
Other investments mainly consist of call loans and the rest consist of miscellaneous accounts such as deposits with banks and short-term investments. These instruments are generally classified in Level 1 or Level 2 of the fair value hierarchy depending on observability of the inputs to measure their fair values.
The following table presents the fair value of each major category of plan assets as of March 31, 2018 and 2019:
Pension benefits and SIP Investments:
|
At March 31, 2018 |
Domestic subsidiaries | Foreign offices and subsidiaries | ||||||||||||||||||||||||||||||
|
Assets category |
Level 1 | Level 2 | Level 3 | Total | Level 1 | Level 2 | Level 3 | Total | ||||||||||||||||||||||||
| (in millions) | ||||||||||||||||||||||||||||||||
|
Japanese government bonds |
¥ | 139,847 | ¥ | — | ¥ | — | ¥ | 139,847 | ¥ | — | ¥ | — | ¥ | — | ¥ | — | ||||||||||||||||
|
Non-Japanese government bonds |
15,552 | 944 | — | 16,496 | 17,945 | 4,081 | — | 22,026 | ||||||||||||||||||||||||
|
Other debt securities |
201 | 3,482 | 1,071 | 4,754 | — | 81,968 | — | 81,968 | ||||||||||||||||||||||||
|
Japanese marketable equity securities |
934,691 | — | — | 934,691 | 887 | — | — | 887 | ||||||||||||||||||||||||
|
Non-Japanese marketable equity securities |
71,729 | 255 | — | 71,984 | 42,166 | 815 | — | 42,981 | ||||||||||||||||||||||||
|
Other investment funds |
— | — | — | — | 99,798 | 9,997 | — | 109,795 | (2) | |||||||||||||||||||||||
|
Japanese general account of life insurance companies (1) |
— | 225,925 | — | 225,925 | — | — | — | — | ||||||||||||||||||||||||
|
Other investments |
3,485 | 23,195 | — | 26,680 | 2 | 4,867 | 155 | 5,024 | ||||||||||||||||||||||||
|
|
|
|
|
|
|
|
|
|
|
|
|
|
|
|
|
|||||||||||||||||
|
Total |
¥ | 1,165,505 | ¥ | 253,801 | ¥ | 1,071 | ¥ | 1,420,377 | ¥ | 160,798 | ¥ | 101,728 | ¥ | 155 | ¥ | 262,681 | ||||||||||||||||
|
|
|
|
|
|
|
|
|
|
|
|
|
|
|
|
|
|||||||||||||||||
|
At March 31, 2019 |
Domestic subsidiaries | Foreign offices and subsidiaries | ||||||||||||||||||||||||||||||
|
Assets category |
Level 1 | Level 2 | Level 3 | Total | Level 1 | Level 2 | Level 3 | Total | ||||||||||||||||||||||||
| (in millions) | ||||||||||||||||||||||||||||||||
|
Japanese government bonds |
¥ | 146,060 | ¥ | — | ¥ | — | ¥ | 146,060 | ¥ | — | ¥ | — | ¥ | — | ¥ | — | ||||||||||||||||
|
Non-Japanese government bonds |
8,570 | 656 | — | 9,226 | 38,687 | 4,615 | — | 43,302 | ||||||||||||||||||||||||
|
Other debt securities |
109 | 3,698 | 1,030 | 4,837 | — | 100,462 | — | 100,462 | ||||||||||||||||||||||||
|
Japanese marketable equity securities |
855,353 | — | — | 855,353 | — | — | — | — | ||||||||||||||||||||||||
|
Non-Japanese marketable equity securities |
64,957 | 234 | — | 65,191 | 20,569 | 652 | — | 21,221 | ||||||||||||||||||||||||
|
Other investment funds |
— | — | — | — | 73,286 | 9,044 | — | 82,330 | (2) | |||||||||||||||||||||||
|
Japanese general account of life insurance companies (1) |
— | 222,460 | — | 222,460 | — | — | — | — | ||||||||||||||||||||||||
|
Other investments |
917 | 18,626 | — | 19,543 | 18 | 4,415 | 188 | 4,621 | ||||||||||||||||||||||||
|
|
|
|
|
|
|
|
|
|
|
|
|
|
|
|
|
|||||||||||||||||
|
Total |
¥ | 1,075,966 | ¥ | 245,674 | ¥ | 1,030 | ¥ | 1,322,670 | ¥ | 132,560 | ¥ | 119,188 | ¥ | 188 | ¥ | 251,936 | ||||||||||||||||
|
|
|
|
|
|
|
|
|
|
|
|
|
|
|
|
|
|||||||||||||||||
Notes:
| (1) | “Japanese general accounts of life insurance companies” is a contract with life insurance companies that guarantees a return of approximately 1.24% from April 1, 2017 to March 31, 2018 and 1.24% from April 1, 2018 to March 31, 2019. |
| (2) | Other investment funds of the foreign offices and subsidiaries include mutual funds and real estate funds of ¥93,821 million and ¥516 million, respectively, which were held by MUFG Americas Holdings at December 31, 2017 and ¥68,556 million and nil, respectively, at December 31, 2018. |
F-85
Table of Contents
MITSUBISHI UFJ FINANCIAL GROUP, INC. AND SUBSIDIARIES
NOTES TO CONSOLIDATED FINANCIAL STATEMENTS—(Continued)
The following table presents fair values of certain investments valued at net asset value per share (or its equivalent) as a practical expedient that were excluded from the above table as of March 31, 2018 and 2019:
| Domestic subsidiaries |
Foreign offices and
subsidiaries |
|||||||||||||||
|
Assets category |
2018 | 2019 | 2018 | 2019 | ||||||||||||
| (in millions) | ||||||||||||||||
|
Japanese pooled funds: |
||||||||||||||||
|
Japanese marketable equity securities |
¥ | 83,205 | ¥ | 109,915 | ¥ | — | ¥ | — | ||||||||
|
Japanese debt securities |
252,730 | 184,121 | — | — | ||||||||||||
|
Non-Japanese marketable equity securities |
151,893 | 162,901 | — | — | ||||||||||||
|
Non-Japanese debt securities |
100,998 | 155,792 | — | — | ||||||||||||
|
Other |
135,275 | 134,306 | — | — | ||||||||||||
|
|
|
|
|
|
|
|
|
|||||||||
|
Total pooled funds |
724,101 | 747,035 | — | — | ||||||||||||
|
|
|
|
|
|
|
|
|
|||||||||
|
Other investment funds |
458,851 | (1) | 525,083 | (1) | 279,965 | (2) | 241,559 | (2) | ||||||||
|
|
|
|
|
|
|
|
|
|||||||||
|
Total |
¥ | 1,182,952 | ¥ | 1,272,118 | ¥ | 279,965 | ¥ | 241,559 | ||||||||
|
|
|
|
|
|
|
|
|
|||||||||
Notes:
| (1) | Other investment funds of the domestic subsidiaries include mutual funds and real estate funds of ¥433,221 million and ¥13,664 million, respectively, at March 31, 2018 and ¥500,850 million and ¥12,058 million, respectively, at March 31, 2019. |
| (2) | Other investment funds of the foreign offices and subsidiaries include mutual funds, real estate funds and common collective funds of ¥63,088 million, ¥40,205 million and ¥158,249 million, respectively, at March 31, 2018 and ¥53,775 million, ¥46,818 million and ¥140,728 million, respectively, at March 31, 2019. |
Other debt securities and Japanese debt securities in the above Pension benefits and SIP tables include ¥982 million (0.03% of plan assets) of debt securities issued by the MUFG Group at March 31, 2018 and ¥1,224 million (0.04% of plan assets) at March 31, 2019, respectively. Japanese marketable equity securities in the above Pension benefits and SIP tables include ¥7,596 million (0.24% of plan assets) of common stock issued by the MUFG Group at March 31, 2018 and ¥5,414 million (0.18% of plan assets) at March 31, 2019, respectively.
Other post retirement plan investments:
| Foreign offices and subsidiaries | ||||||||||||||||||||||||||||||||
| 2018 | 2019 | |||||||||||||||||||||||||||||||
|
Assets category |
Level 1 | Level 2 | Level 3 | Total | Level 1 | Level 2 | Level 3 | Total | ||||||||||||||||||||||||
| (in millions) | ||||||||||||||||||||||||||||||||
|
Non-Japanese government bonds |
¥ | 2,523 | ¥ | — | ¥ | — | ¥ | 2,523 | ¥ | 1,705 | ¥ | — | ¥ | — | ¥ | 1,705 | ||||||||||||||||
|
Other debt securities |
— | 5,797 | — | 5,797 | — | 6,124 | — | 6,124 | ||||||||||||||||||||||||
|
Non-Japanese marketable equity securities |
— | 7 | — | 7 | — | 6 | — | 6 | ||||||||||||||||||||||||
|
Other investment funds (1) |
6,082 | — | — | 6,082 | 5,487 | — | — | 5,487 | ||||||||||||||||||||||||
|
Other investments |
1 | 264 | — | 265 | — | 130 | — | 130 | ||||||||||||||||||||||||
|
|
|
|
|
|
|
|
|
|
|
|
|
|
|
|
|
|||||||||||||||||
|
Total |
¥ | 8,606 | ¥ | 6,068 | ¥ | — | ¥ | 14,674 | ¥ | 7,192 | ¥ | 6,260 | ¥ | — | ¥ | 13,452 | ||||||||||||||||
|
|
|
|
|
|
|
|
|
|
|
|
|
|
|
|
|
|||||||||||||||||
Note:
| (1) | Other investment funds mainly consist of mutual funds. |
F-86
Table of Contents
MITSUBISHI UFJ FINANCIAL GROUP, INC. AND SUBSIDIARIES
NOTES TO CONSOLIDATED FINANCIAL STATEMENTS—(Continued)
The following table presents fair values of certain investments valued at net asset value per share (or its equivalent) as a practical expedient that were excluded from the above table as of March 31, 2018 and 2019:
|
Foreign offices
and subsidiaries |
||||||||
|
Assets category |
2018 | 2019 | ||||||
| (in millions) | ||||||||
|
Other investment funds (1) |
¥ | 17,792 | ¥ | 14,806 | ||||
|
|
|
|
|
|||||
|
Total |
¥ | 17,792 | ¥ | 14,806 | ||||
|
|
|
|
|
|||||
Note:
| (1) | Other investment funds of the foreign offices and subsidiaries include mutual funds, common collective funds and pooled separate accounts with variable life insurance policies of ¥553 million, ¥11,332 million and ¥5,907 million, respectively, which were held by MUFG Americas Holdings at December 31, 2017 and ¥147 million, ¥9,583 million and ¥5,076 million, respectively, at December 31, 2018. |
The following tables present a reconciliation of plan assets measured at fair value using significant unobservable inputs (Level 3) during the fiscal years ended March 31, 2018 and 2019:
Pension benefits and SIP Investments:
| Domestic subsidiaries | ||||||||||||||||||||||||||||
|
Assets category |
March 31,
2017 |
Realized
gains (losses) |
Unrealized
gains (losses) |
Purchase,
sales and settlements |
Transfer
into Level 3 |
Transfer
out of Level 3 |
March 31,
2018 |
|||||||||||||||||||||
| (in millions) | ||||||||||||||||||||||||||||
|
Other debt securities |
¥ | 208 | ¥ | (6 | ) | ¥ | (18 | ) | ¥ | 887 | ¥ | — | ¥ | — | ¥ | 1,071 | ||||||||||||
|
Other investment funds |
206 | 36 | — | (242 | ) | — | — | — | ||||||||||||||||||||
|
|
|
|
|
|
|
|
|
|
|
|
|
|
|
|||||||||||||||
|
Total |
¥ | 414 | ¥ | 30 | ¥ | (18 | ) | ¥ | 645 | ¥ | — | ¥ | — | ¥ | 1,071 | |||||||||||||
|
|
|
|
|
|
|
|
|
|
|
|
|
|
|
|||||||||||||||
| Foreign offices and subsidiaries | ||||||||||||||||||||||||||||
|
Assets category |
March 31,
2017 |
Realized
gains (losses) |
Unrealized
gains (losses) |
Purchase,
sales and settlements |
Transfer
into Level 3 |
Transfer
out of Level 3 |
March 31,
2018 |
|||||||||||||||||||||
| (in millions) | ||||||||||||||||||||||||||||
|
Other investments |
¥ | 760 | ¥ | 51 | ¥ | (2 | ) | ¥ | (654 | ) | ¥ | — | ¥ | — | ¥ | 155 | ||||||||||||
|
|
|
|
|
|
|
|
|
|
|
|
|
|
|
|||||||||||||||
|
Total |
¥ | 760 | ¥ | 51 | ¥ | (2 | ) | ¥ | (654 | ) | ¥ | — | ¥ | — | ¥ | 155 | ||||||||||||
|
|
|
|
|
|
|
|
|
|
|
|
|
|
|
|||||||||||||||
| Domestic subsidiaries | ||||||||||||||||||||||||||||
|
Assets category |
March 31,
2018 |
Realized
gains (losses) |
Unrealized
gains (losses) |
Purchase,
sales and settlements |
Transfer
into Level 3 |
Transfer
out of Level 3 |
March 31,
2019 |
|||||||||||||||||||||
| (in millions) | ||||||||||||||||||||||||||||
|
Other debt securities |
¥ | 1,071 | ¥ | 4 | ¥ | 49 | ¥ | (94 | ) | ¥ | — | ¥ | — | ¥ | 1,030 | |||||||||||||
|
|
|
|
|
|
|
|
|
|
|
|
|
|
|
|||||||||||||||
|
Total |
¥ | 1,071 | ¥ | 4 | ¥ | 49 | ¥ | (94 | ) | ¥ | — | ¥ | — | ¥ | 1,030 | |||||||||||||
|
|
|
|
|
|
|
|
|
|
|
|
|
|
|
|||||||||||||||
| Foreign offices and subsidiaries | ||||||||||||||||||||||||||||
|
Assets category |
March 31,
2018 |
Realized
gains (losses) |
Unrealized
gains (losses) |
Purchase,
sales and settlements |
Transfer
into Level 3 |
Transfer
out of Level 3 |
March 31,
2019 |
|||||||||||||||||||||
| (in millions) | ||||||||||||||||||||||||||||
|
Other investments |
¥ | 155 | ¥ | — | ¥ | (3 | ) | ¥ | 36 | ¥ | — | ¥ | — | ¥ | 188 | |||||||||||||
|
|
|
|
|
|
|
|
|
|
|
|
|
|
|
|||||||||||||||
|
Total |
¥ | 155 | ¥ | — | ¥ | (3 | ) | ¥ | 36 | ¥ | — | ¥ | — | ¥ | 188 | |||||||||||||
|
|
|
|
|
|
|
|
|
|
|
|
|
|
|
|||||||||||||||
F-87
Table of Contents
MITSUBISHI UFJ FINANCIAL GROUP, INC. AND SUBSIDIARIES
NOTES TO CONSOLIDATED FINANCIAL STATEMENTS—(Continued)
Defined Contribution Plans
The MUFG Group maintains several qualified defined contribution plans in its domestic and foreign offices and subsidiaries, all of which are administered in accordance with applicable local laws and regulations. Each office and subsidiary matches eligible employee contributions up to a certain percentage of benefits-eligible compensation per pay period, subject to plan and legal limits. Terms of the plan, including matching percentage and vesting periods, are individually determined by each office and subsidiary.
The cost of these defined contribution plans charged to operations for the fiscal years ended March 31, 2017, 2018 and 2019 was ¥15,636 million, ¥17,413 million and ¥17,859 million, respectively.
| 14. | OTHER ASSETS AND LIABILITIES |
Major components of other assets and liabilities at March 31, 2018 and 2019 were as follows:
| 2018 | 2019 | |||||||
| (in millions) | ||||||||
|
Other assets: |
||||||||
|
Accounts receivable: |
||||||||
|
Receivables from brokers, dealers and customers for securities transactions |
¥ | 1,017,194 | ¥ | 1,141,075 | ||||
|
Other |
1,190,885 | 1,394,794 | ||||||
|
Investments in equity method investees |
2,219,196 | 2,487,389 | ||||||
|
Prepaid benefit cost (Note 13) |
884,979 | 839,757 | ||||||
|
Cash collateral pledged for derivative transactions (Note 8) |
1,473,109 | 1,276,897 | ||||||
|
Cash collateral for the use of Bank of Japan’s settlement infrastructure |
851,066 | 911,528 | ||||||
|
Other |
3,029,635 | 2,990,462 | ||||||
|
|
|
|
|
|||||
|
Total |
¥ | 10,666,064 | ¥ | 11,041,902 | ||||
|
|
|
|
|
|||||
|
Other liabilities: |
||||||||
|
Accounts payable: |
||||||||
|
Payables to brokers, dealers and customers for securities transactions |
¥ | 1,247,652 | ¥ | 1,289,672 | ||||
|
Other |
1,357,387 | 1,308,733 | ||||||
|
Deferred tax liabilities |
654,053 | 624,062 | ||||||
|
Allowance for off-balance sheet credit instruments |
81,739 | 119,307 | ||||||
|
Accrued benefit cost (Note 13) |
64,735 | 65,690 | ||||||
|
Guarantees and indemnifications |
41,349 | 45,346 | ||||||
|
Cash collateral received for derivative transactions (Note 8) |
1,158,053 | 844,234 | ||||||
|
Accrued and other liabilities |
2,802,445 | 3,061,462 | ||||||
|
|
|
|
|
|||||
|
Total |
¥ | 7,407,413 | ¥ | 7,358,506 | ||||
|
|
|
|
|
|||||
Investments in equity method investees include marketable equity securities carried at ¥1,627,896 million and ¥1,936,468 million at March 31, 2018 and 2019, respectively. Corresponding aggregated market values were ¥3,186,618 million and ¥2,702,838 million, respectively. Marketable equity securities include Morgan Stanley’s common stock carried at ¥1,206,998 million and ¥1,326,339 million at March 31, 2018 and 2019, respectively. As of March 31, 2019, the MUFG Group held approximately 24.01% of its common stock. Investments in equity method investees also include investments in Morgan Stanley MUFG Securities, Co., Ltd. at ¥174,459 million and ¥178,679 million at March 31, 2018 and 2019, respectively.
F-88
Table of Contents
MITSUBISHI UFJ FINANCIAL GROUP, INC. AND SUBSIDIARIES
NOTES TO CONSOLIDATED FINANCIAL STATEMENTS—(Continued)
The MUFG Group periodically evaluates whether a loss in value of investments in equity method investees is other-than-temporary. As a result of evaluations, the MUFG Group recognized other-than-temporary declines in the value of an investment and recorded impairment losses related to certain affiliated companies of ¥5,465 million, ¥29,442 million and ¥51,645 million for the fiscal years ended March 31, 2017, 2018 and 2019 respectively. The impairment losses are included in Equity in earnings of equity method investees—net in the accompanying consolidated statements of income.
Summarized Financial Information of the MUFG Group’s Equity Method Investees
Summarized financial information of Morgan Stanley, the largest portion of the MUFG Group’s equity method investees, as of March 31, 2018 and 2019, and for each of the three years ended March 31, 2019 is as follows:
| 2018 | 2019 | |||||||
| (in billions) | ||||||||
|
Trading assets |
¥ | 29,008 | ¥ | 29,392 | ||||
|
Securities purchased under agreements to resell |
8,525 | 10,718 | ||||||
|
Securities borrowed |
14,431 | 15,416 | ||||||
|
Total assets |
91,207 | 97,223 | ||||||
|
Deposits |
17,043 | 19,948 | ||||||
|
Customer and other payables |
20,709 | 21,431 | ||||||
|
Borrowings |
20,713 | 21,165 | ||||||
|
Total liabilities |
82,762 | 88,134 | ||||||
|
Noncontrolling interests |
155 | 130 | ||||||
| 2017 | 2018 | 2019 | ||||||||||
| (in billions) | ||||||||||||
|
Net revenues |
¥ | 3,939 | ¥ | 4,354 | ¥ | 4,365 | ||||||
|
Total non-interest expenses |
2,871 | 3,133 | 3,170 | |||||||||
|
Income from continuing operations before income taxes |
1,068 | 1,221 | 1,195 | |||||||||
|
Net income applicable to Morgan Stanley |
730 | 759 | 944 | |||||||||
Morgan Stanley early adopted the new accounting guidance on “Targeted Improvements to Accounting for Hedging Activities” on January 1, 2018. This resulted in recording a cumulative catch-up adjustment by Morgan Stanley, decreasing the MUFG Group’s proportionate share of Retained earnings as reflected on the MUFG Group’s consolidated statement of equity.
Summarized financial information of the MUFG Group’s equity method investees, other than Morgan Stanley as of March 31, 2018 and 2019, and for each of the three years ended March 31, 2019 is as follows:
| 2018 | 2019 | |||||||
| (in billions) | ||||||||
|
Net loans |
¥ | 14,343 | ¥ | 15,772 | ||||
|
Total assets |
26,008 | 28,910 | ||||||
|
Deposits |
7,783 | 9,103 | ||||||
|
Total liabilities |
21,209 | 23,423 | ||||||
|
Noncontrolling interests |
1,009 | 1,135 | ||||||
F-89
Table of Contents
MITSUBISHI UFJ FINANCIAL GROUP, INC. AND SUBSIDIARIES
NOTES TO CONSOLIDATED FINANCIAL STATEMENTS—(Continued)
| 2017 | 2018 | 2019 | ||||||||||
| (in billions) | ||||||||||||
|
Total interest income |
¥ | 777 | ¥ | 901 | ¥ | 1,036 | ||||||
|
Total interest expense |
252 | 329 | 430 | |||||||||
|
Net interest income |
525 | 572 | 606 | |||||||||
|
Provision for credit losses |
97 | 136 | 157 | |||||||||
|
Income before income tax expense |
147 | 337 | 205 | |||||||||
|
Net income |
97 | 229 | 135 | |||||||||
| 15. | OFFSETTING OF DERIVATIVES, REPURCHASE AGREEMENTS, AND SECURITIES LENDING TRANSACTIONS |
The following tables present, as of March 31, 2018 and 2019, the gross and net amounts of the derivatives, resale and repurchase agreements, and securities borrowing and lending transactions, including the related gross amounts subject to an enforceable master netting arrangement or similar agreement not offset in the consolidated balance sheets. The MUFG Group primarily enters into International Swaps and Derivatives Association master netting agreements, master repurchase agreements and master securities lending agreements or similar agreements for derivative contracts, resale and repurchase agreements, and securities borrowing and lending transactions. In the event of default on or termination of any one contract, these agreements provide the contracting parties with the right to net a counterparty’s rights and obligations and to liquidate and setoff collateral against any net amount owed by the counterparty. Generally, as the MUFG Group has elected to present such amounts on a gross basis, the amounts subject to these agreements are included in “Gross amounts not offset in the consolidated balance sheet” column in the tabular disclosure below. For certain transactions where a legal opinion with respect to the enforceability of netting has not been sought or obtained, the related amounts are not subject to enforceable master netting agreements and not included in “Gross amounts not offset in the consolidated balance sheet” column in the tabular disclosure below.
|
At March 31, 2018 |
Gross amounts of
recognized assets/liabilities |
Gross amounts
offset in the consolidated balance sheet |
Net amounts
presented in the consolidated balance sheet |
Gross amounts not offset in
the consolidated balance sheet |
Net amounts | |||||||||||||||||||
|
Financial
instruments |
Cash collateral
received/pledged |
|||||||||||||||||||||||
| (in billions) | ||||||||||||||||||||||||
|
Financial assets: |
||||||||||||||||||||||||
|
Derivative assets |
¥ | 12,585 | ¥ | — | ¥ | 12,585 | ¥ | (9,664 | ) | ¥ | (832 | ) | ¥ | 2,089 | ||||||||||
|
Receivables under resale agreements |
8,825 | (3,099 | ) | 5,726 | (5,171 | ) | (17 | ) | 538 | |||||||||||||||
|
Receivables under securities borrowing transactions |
9,305 | (36 | ) | 9,269 | (9,208 | ) | (1 | ) | 60 | |||||||||||||||
|
|
|
|
|
|
|
|
|
|
|
|
|
|||||||||||||
|
Total |
¥ | 30,715 | ¥ | (3,135 | ) | ¥ | 27,580 | ¥ | (24,043 | ) | ¥ | (850 | ) | ¥ | 2,687 | |||||||||
|
|
|
|
|
|
|
|
|
|
|
|
|
|||||||||||||
|
Financial liabilities: |
||||||||||||||||||||||||
|
Derivative liabilities |
¥ | 11,877 | ¥ | — | ¥ | 11,877 | ¥ | (9,631 | ) | ¥ | (1,126 | ) | ¥ | 1,120 | ||||||||||
|
Payables under repurchase agreements |
21,169 | (3,034 | ) | 18,135 | (17,890 | ) | (31 | ) | 214 | |||||||||||||||
|
Payables under securities lending transactions |
8,206 | (36 | ) | 8,170 | (8,139 | ) | (12 | ) | 19 | |||||||||||||||
|
Obligations to return securities received as collateral |
3,177 | — | 3,177 | (1,072 | ) | — | 2,105 | |||||||||||||||||
|
|
|
|
|
|
|
|
|
|
|
|
|
|||||||||||||
|
Total |
¥ | 44,429 | ¥ | (3,070 | ) | ¥ | 41,359 | ¥ | (36,732 | ) | ¥ | (1,169 | ) | ¥ | 3,458 | |||||||||
|
|
|
|
|
|
|
|
|
|
|
|
|
|||||||||||||
F-90
Table of Contents
MITSUBISHI UFJ FINANCIAL GROUP, INC. AND SUBSIDIARIES
NOTES TO CONSOLIDATED FINANCIAL STATEMENTS—(Continued)
|
At March 31, 2019 |
Gross amounts of
recognized assets/liabilities |
Gross amounts
offset in the consolidated balance sheet |
Net amounts
presented in the consolidated balance sheet |
Gross amounts not offset in
the consolidated balance sheet |
Net amounts | |||||||||||||||||||
|
Financial
instruments |
Cash collateral
received/pledged |
|||||||||||||||||||||||
| (in billions) | ||||||||||||||||||||||||
|
Financial assets: |
||||||||||||||||||||||||
|
Derivative assets |
¥ | 13,205 | ¥ | — | ¥ | 13,205 | ¥ | (10,752 | ) | ¥ | (590 | ) | ¥ | 1,863 | ||||||||||
|
Receivables under resale agreements |
13,885 | (2,910 | ) | 10,975 | (9,793 | ) | (20 | ) | 1,162 | |||||||||||||||
|
Receivables under securities borrowing transactions |
2,759 | — | 2,759 | (2,693 | ) | — | 66 | |||||||||||||||||
|
|
|
|
|
|
|
|
|
|
|
|
|
|||||||||||||
|
Total |
¥ | 29,849 | ¥ | (2,910 | ) | ¥ | 26,939 | ¥ | (23,238 | ) | ¥ | (610 | ) | ¥ | 3,091 | |||||||||
|
|
|
|
|
|
|
|
|
|
|
|
|
|||||||||||||
|
Financial liabilities: |
||||||||||||||||||||||||
|
Derivative liabilities |
¥ | 12,710 | ¥ | — | ¥ | 12,710 | ¥ | (10,671 | ) | ¥ | (933 | ) | ¥ | 1,106 | ||||||||||
|
Payables under repurchase agreements |
28,125 | (2,900 | ) | 25,225 | (24,930 | ) | (15 | ) | 280 | |||||||||||||||
|
Payables under securities lending transactions |
913 | — | 913 | (880 | ) | — | 33 | |||||||||||||||||
|
Obligations to return securities received as collateral |
3,087 | — | 3,087 | (1,244 | ) | — | 1,843 | |||||||||||||||||
|
|
|
|
|
|
|
|
|
|
|
|
|
|||||||||||||
|
Total |
¥ | 44,835 | ¥ | (2,900 | ) | ¥ | 41,935 | ¥ | (37,725 | ) | ¥ | (948 | ) | ¥ | 3,262 | |||||||||
|
|
|
|
|
|
|
|
|
|
|
|
|
|||||||||||||
| 16. | REPURCHASE AGREEMENTS, AND SECURITIES LENDING TRANSACTIONS ACCOUNTED FOR AS SECURED BORROWINGS |
The following tables present gross obligations for payables under repurchase agreements, payables under securities lending transactions and obligations to return securities received as collateral by remaining contractual maturity and class of collateral pledged at March 31, 2018 and 2019. Potential risks associated with these arrangements primarily relate to market and liquidity risks. To manage risks associated with market exposure, the MUFG Group generally revalues the collateral underlying its repurchase agreements and securities lending transactions on a daily basis and monitors the value of the underlying securities, consisting of primarily high-quality securities such as Japanese national government and Japanese government agency bonds, and foreign government and official institution bonds. In the event the market value of such securities falls below the related agreements at contract amounts plus accrued interest, the MUFG Group may be required to deposit additional collateral when appropriate. To address liquidity risks, the MUFG Group conducts stress tests to ensure the adequate level of liquidity is maintained in the event of a decline in the fair value of any collateral pledged.
| March 31, 2018 | ||||||||||||||||||||
| Remaining Contractual Maturity | ||||||||||||||||||||
|
Overnight
and open |
30 days
or less |
31-90
days |
Over
90 days |
Total | ||||||||||||||||
| (in billions) | ||||||||||||||||||||
|
Payables under repurchase agreements |
¥ | 2,290 | ¥ | 14,328 | ¥ | 2,004 | ¥ | 2,547 | ¥ | 21,169 | ||||||||||
|
Payables under securities lending transactions |
4,647 | 2,343 | 1,216 | — | 8,206 | |||||||||||||||
|
Obligations to return securities received as collateral |
2,855 | 202 | 120 | — | 3,177 | |||||||||||||||
|
|
|
|
|
|
|
|
|
|
|
|||||||||||
|
Total |
¥ | 9,792 | ¥ | 16,873 | ¥ | 3,340 | ¥ | 2,547 | ¥ | 32,552 | ||||||||||
|
|
|
|
|
|
|
|
|
|
|
|||||||||||
F-91
Table of Contents
MITSUBISHI UFJ FINANCIAL GROUP, INC. AND SUBSIDIARIES
NOTES TO CONSOLIDATED FINANCIAL STATEMENTS—(Continued)
| March 31, 2019 | ||||||||||||||||||||
| Remaining Contractual Maturity | ||||||||||||||||||||
|
Overnight
and open |
30 days
or less |
31-90
days |
Over
90 days |
Total | ||||||||||||||||
| (in billions) | ||||||||||||||||||||
|
Payables under repurchase agreements |
¥ | 3,892 | ¥ | 18,586 | ¥ | 2,824 | ¥ | 2,823 | ¥ | 28,125 | ||||||||||
|
Payables under securities lending transactions |
913 | — | — | — | 913 | |||||||||||||||
|
Obligations to return securities received as collateral |
2,572 | 396 | 117 | 2 | 3,087 | |||||||||||||||
|
|
|
|
|
|
|
|
|
|
|
|||||||||||
|
Total |
¥ | 7,377 | ¥ | 18,982 | ¥ | 2,941 | ¥ | 2,825 | ¥ | 32,125 | ||||||||||
|
|
|
|
|
|
|
|
|
|
|
|||||||||||
Secured borrowing by the class of collateral pledged at March 31, 2018 and 2019 was as follows:
| March 31, 2018 | ||||||||||||||||
|
Payables under
repurchase agreements |
Payables under
securities lending transactions |
Obligations
to return securities received as collateral |
Total | |||||||||||||
| (in billions) | ||||||||||||||||
|
Japanese national government and Japanese government agency bonds |
¥ | 2,462 | ¥ | 7,085 | ¥ | 1,242 | ¥ | 10,789 | ||||||||
|
Foreign government and official institution bonds |
14,316 | 36 | 1,344 | 15,696 | ||||||||||||
|
Corporate bonds |
570 | — | 84 | 654 | ||||||||||||
|
Residential mortgage-backed securities |
3,567 | — | — | 3,567 | ||||||||||||
|
Other debt securities |
121 | — | — | 121 | ||||||||||||
|
Marketable equity securities |
123 | 1,085 | 507 | 1,715 | ||||||||||||
|
Others |
10 | — | — | 10 | ||||||||||||
|
|
|
|
|
|
|
|
|
|||||||||
|
Total |
¥ | 21,169 | ¥ | 8,206 | ¥ | 3,177 | ¥ | 32,552 | ||||||||
|
|
|
|
|
|
|
|
|
|||||||||
| March 31, 2019 | ||||||||||||||||
|
Payables under
repurchase agreements |
Payables under
securities lending transactions |
Obligations
to return securities received as collateral |
Total | |||||||||||||
| (in billions) | ||||||||||||||||
|
Japanese national government and Japanese government agency bonds |
¥ | 8,306 | ¥ | 21 | ¥ | 856 | ¥ | 9,183 | ||||||||
|
Foreign government and official institution bonds |
14,291 | — | 1,286 | 15,577 | ||||||||||||
|
Corporate bonds |
705 | — | 172 | 877 | ||||||||||||
|
Residential mortgage-backed securities |
4,369 | — | — | 4,369 | ||||||||||||
|
Other debt securities |
238 | — | — | 238 | ||||||||||||
|
Marketable equity securities |
200 | 892 | 772 | 1,864 | ||||||||||||
|
Others |
16 | — | 1 | 17 | ||||||||||||
|
|
|
|
|
|
|
|
|
|||||||||
|
Total |
¥ | 28,125 | ¥ | 913 | ¥ | 3,087 | ¥ | 32,125 | ||||||||
|
|
|
|
|
|
|
|
|
|||||||||
F-92
Table of Contents
MITSUBISHI UFJ FINANCIAL GROUP, INC. AND SUBSIDIARIES
NOTES TO CONSOLIDATED FINANCIAL STATEMENTS—(Continued)
| 17. | PREFERRED STOCK |
Pursuant to the Articles of Incorporation, MUFG had been authorized to issue 400,000,000 shares of Class 5 Preferred Stock, 200,000,000 shares of Class 6 Preferred Stock, and 200,000,000 shares of Class 7 Preferred Stock without par value as of March 31, 2019.
All classes of preferred stock are non-voting and have preference over common stock for the payment of dividends and the distribution of assets in the event of a liquidation or dissolution of MUFG. They are all non-cumulative and non-participating with respect to dividend payments. Shareholders of all classes of preferred stock have the right to receive a liquidation distribution at ¥2,500 and do not have the right to participate in any further liquidation distributions.
As of March 31, 2017, 2018 and 2019, there was no preferred stock outstanding and the entire amount of Capital stock on the consolidated balance sheets consisted of only common stock.
| 18. | COMMON STOCK AND CAPITAL SURPLUS |
The changes in the number of issued shares of common stock during the fiscal years ended March 31, 2017, 2018 and 2019 were as follows:
| 2017 | 2018 | 2019 | ||||||||||
| (shares) | ||||||||||||
|
Balance at beginning of fiscal year |
14,168,853,820 | 14,168,853,820 | 13,900,028,020 | |||||||||
|
Retirement of shares of common stock |
— | (268,825,800 | ) | (232,257,500 | ) | |||||||
|
|
|
|
|
|
|
|||||||
|
Balance at end of fiscal year |
14,168,853,820 | 13,900,028,020 | 13,667,770,520 | |||||||||
|
|
|
|
|
|
|
|||||||
Under the Companies Act, issuances of common stock, including conversions of bonds and notes, are required to be credited to the common stock account for at least 50% of the proceeds and to the legal capital surplus account (“legal capital surplus”) for the remaining amounts.
The Companies Act permits Japanese companies, upon approval by the Board of Directors, to issue shares in the form of a “stock split,” as defined in the Companies Act. Also, prior to April 1, 1991, Japanese companies were permitted to issue free share distributions. MUFG Bank and Mitsubishi UFJ Trust and Banking from time to time made free share distributions. These free distributions usually ranged from 5% to 10% of outstanding common stock and publicly-owned corporations in the United States issuing shares in similar transactions would be required to account for them as stock dividends as of the shareholders’ record date by reducing retained earnings and increasing the appropriate capital accounts by an amount equal to the fair value of the shares issued. The application of such U.S. accounting practices to the cumulative free distributions made by MUFG Bank and Mitsubishi UFJ Trust and Banking at March 31, 2019, would have increased capital accounts by ¥1,910,106 million with a corresponding decrease in unappropriated retained earnings.
The Companies Act permits that common stock, legal reserve, additional paid-in capital, and other capital surplus and retained earnings can be transferred among these accounts under certain conditions upon the approval of a shareholders’ meeting. The Companies Act limits the increase of paid-in capital in case disposition of treasury stock and issuance of common stock are performed at the same time.
As for Capital surplus, the fee retained by MUFG’s subsidiary as underwriting compensation, net of stock issuance expense, was included in the total Capital surplus balance.
F-93
Table of Contents
MITSUBISHI UFJ FINANCIAL GROUP, INC. AND SUBSIDIARIES
NOTES TO CONSOLIDATED FINANCIAL STATEMENTS—(Continued)
Treasury Stock
The Companies Act permits Japanese companies to effect purchases of their own shares pursuant to a resolution by the shareholders at an annual general meeting until the conclusion of the following ordinary general meeting of shareholders, and to hold such shares as their treasury stock indefinitely regardless of purpose. However, the Companies Act requires the amount of treasury stock purchased should be within the amount of retained earnings available for dividends. Disposition of treasury stock is subject to the approval of the Board of Directors and is to follow the procedures similar to a public offering of shares for subscription.
From May 17, 2016 to June 13, 2016, MUFG repurchased 190,614,800 shares of MUFG’s common stock. These purchases were made through Off-Auction Own Share Repurchase Trading (ToSTNeT-3) of the Tokyo Stock Exchange and by market purchases based on the discretionary dealing contract regarding repurchase of own shares for approximately ¥100 billion in aggregate in satisfaction of the resolution adopted at the meeting of the Board of Directors of MUFG held on May 16, 2016. The repurchase plan as authorized by the Board of Directors of MUFG allowed for the repurchase of an aggregate amount of up to 230,000,000 shares, which represents the equivalent of 1.67% of the total number of common shares outstanding, or of an aggregate repurchase amount of up to ¥100 billion. The purpose of the repurchase is to enhance the return of earnings to shareholders, to improve capital efficiency, and to implement flexible capital policies.
From November 15, 2016 to December 22, 2016, MUFG repurchased 142,238,800 shares of MUFG’s common stock by market purchases based on the discretionary dealing contract regarding repurchase of own shares for approximately ¥100 billion in aggregate in satisfaction of the resolution adopted at the meeting of the Board of Directors of MUFG held on November 14, 2016. The repurchase plan, as authorized by the Board of Directors of MUFG, allowed for the repurchase of an aggregate amount of up to 230,000,000 shares, which represents the equivalent of 1.69% of the total number of common shares outstanding, or of an aggregate repurchase amount of up to ¥100 billion. The purpose of the repurchase is to enhance the return of earnings to shareholders, to improve capital efficiency, and to implement flexible capital policies.
From May 16, 2017 to June 21, 2017 MUFG repurchased 141,158,900 shares of MUFG’s common stock by market purchases based on the discretionary dealing contract regarding repurchase of own shares for approximately ¥100 billion in aggregate in satisfaction of the resolution adopted at the meeting of the Board of Directors of MUFG held on May 15, 2017. The repurchase plan as authorized by the Board of Directors of MUFG allowed for the repurchase of an aggregate amount of up to 200,000,000 shares, which represents the equivalent of 1.49% of the total number of common shares outstanding, or of an aggregate repurchase amount of up to ¥100 billion. The purpose of the repurchase is to enhance the return of earnings to shareholders, to improve capital efficiency, and to implement flexible capital policies. On July 20, 2017, MUFG cancelled all the acquired shares in satisfaction of the resolution adopted at the meeting of the Board of Directors of MUFG held on May 15, 2017.
From November 15, 2017 to December 22, 2017, MUFG repurchased 127,666,900 shares of MUFG’s common stock by market purchases based on the discretionary dealing contract regarding repurchase of own shares for approximately ¥100 billion, in aggregate, in satisfaction of the resolution adopted at the meeting of the Board of Directors of MUFG held on November 14, 2017. The repurchase plan as authorized by the Board of Directors of MUFG allowed for the repurchase of an aggregate amount of up to 200,000,000 shares, which represents the equivalent of 1.50% of the total number of common shares outstanding, or of an aggregate repurchase amount of up to ¥100 billion. The purpose of the repurchase is to enhance the return of earnings to shareholders, to improve capital efficiency, and to implement flexible capital policies. On January 22, 2018, MUFG cancelled all of the acquired shares in satisfaction of the resolution adopted at the meeting of the Board of Directors of MUFG held on November 14, 2017.
F-94
Table of Contents
MITSUBISHI UFJ FINANCIAL GROUP, INC. AND SUBSIDIARIES
NOTES TO CONSOLIDATED FINANCIAL STATEMENTS—(Continued)
From May 16, 2018 to June 4, 2018, MUFG repurchased 72,420,700 shares of MUFG’s common stock by market purchases based on the discretionary dealing contract regarding repurchase of own shares for approximately ¥50 billion, in aggregate, in satisfaction of the resolution adopted at the meeting of the Board of Directors of MUFG held on May 15, 2018. The repurchase plan as authorized by the Board of Directors of MUFG allowed for the repurchase of an aggregate amount of up to 100,000,000 shares, which represents the equivalent of 0.76% of the total number of common shares outstanding, or of an aggregate repurchase amount of up to ¥50 billion. The purpose of the repurchase is to enhance the return of earnings to shareholders, to improve capital efficiency, and to implement flexible capital policies. On July 20, 2018, MUFG cancelled all of the acquired shares in satisfaction of the resolution adopted at the meeting of the Board of Directors of MUFG held on May 15, 2018.
From November 14, 2018 to December 10, 2018, MUFG repurchased 159,836,800 shares of MUFG’s common stock by market purchases based on the discretionary dealing contract regarding repurchase of own shares for approximately ¥100 billion, in aggregate, in satisfaction of the resolution adopted at the meeting of the Board of Directors of MUFG held on November 13, 2018. The repurchase plan as authorized by the Board of Directors of MUFG allowed for the repurchase of an aggregate amount of up to 200,000,000 shares, which represents the equivalent of 1.52% of the total number of common shares outstanding, or of an aggregate repurchase amount of up to ¥100 billion. The purpose of the repurchase is to enhance the return of earnings to shareholders, to improve capital efficiency, and to implement flexible capital policies. On January 22, 2019, MUFG cancelled all of the acquired shares in satisfaction of the resolution adopted at the meeting of the Board of Directors of MUFG held on November 13, 2018.
Parent Company Shares Held by Subsidiaries and Affiliated Companies
At March 31, 2019, certain subsidiaries and affiliated companies owned shares of common stock of MUFG. Such shares are included in treasury stock in the accompanying consolidated balance sheets and deducted from the MUFG’s shareholders’ equity.
| 19. | RETAINED EARNINGS, LEGAL RESERVE AND DIVIDENDS |
In addition to the Companies Act, Japanese banks, including MUFG Bank and Mitsubishi UFJ Trust and Banking, are required to comply with the Banking Law of Japan (the “Banking Law”).
Legal Reserve Set Aside as Appropriation of Retained Earnings and Legal Capital Surplus
Under the Companies Act
The Companies Act provides that an amount at least equal to 10% of the aggregate amount of cash dividends and certain appropriations of retained earnings associated with cash outlays applicable to each period shall be appropriated and set aside as a legal reserve until the aggregate amount of legal reserve set aside as an appropriation of retained earnings and the legal capital surplus equals 25% of stated capital as defined in the Companies Act.
Under the Banking Law
The Banking Law provides that an amount at least equal to 20% of the aggregate amount of cash dividends and certain appropriations of retained earnings associated with cash outlays applicable to each fiscal year shall be appropriated and set aside as a legal reserve until the aggregate amount of legal reserve set aside as appropriation of retained earnings and the legal capital surplus equals 100% of stated capital as defined in the Companies Act.
F-95
Table of Contents
MITSUBISHI UFJ FINANCIAL GROUP, INC. AND SUBSIDIARIES
NOTES TO CONSOLIDATED FINANCIAL STATEMENTS—(Continued)
Transfer of Legal Reserve
Under the Companies Act
Under the Companies Act, Japanese companies, including MUFG, were permitted, pursuant to a resolution by the shareholders at a general meeting, to make legal reserve set aside as appropriation of retained earnings and legal capital surplus available for dividends until the aggregate amount of the legal reserve and legal capital surplus equals 25% of stated capital as defined in the Companies Act.
Under the Companies Act, Japanese companies, including MUFG, MUFG Bank and Mitsubishi UFJ Trust and Banking, are permitted, primarily pursuant to a resolution by the shareholders at a general meeting, to transfer legal capital surplus and legal reserve to stated capital and/or retained earnings without limitations of thresholds, thereby effectively removing the thresholds provided for in the Companies Act and Banking Law at the company’s discretion.
Under the Banking Law
Under the Banking Law, Japanese banks, including MUFG Bank and Mitsubishi UFJ Trust and Banking, were permitted, pursuant to a resolution by the shareholders at a general meeting, to set aside a legal reserve as an appropriation of retained earnings and legal capital surplus available for dividends until the aggregate amount of the legal reserve and legal capital surplus equals 100% of stated capital as defined in the Companies Act.
Unappropriated Retained Earnings and Dividends
In addition to the provision that requires an appropriation for legal reserve as described above, the Companies Act and the Banking Law impose certain limitations on the amount available for dividends.
Under the Companies Act, the amount available for dividends is based on the amount recorded in MUFG’s general books of account maintained in accordance with accounting principles generally accepted in Japan (“Japanese GAAP”). The adjustments included in the accompanying consolidated financial statements but not recorded in MUFG’s general books of account, as explained in Note 1, have no effect on the determination of retained earnings available for dividends under the Companies Act. Under the Banking Law, MUFG, MUFG Bank and Mitsubishi UFJ Trust and Banking have to meet the minimum capital adequacy requirements and distributions of retained earnings of MUFG, MUFG Bank and Mitsubishi UFJ Trust and Banking, which are otherwise distributable to shareholders, are restricted in order to maintain the minimum capital requirements.
MUFG, formerly known as Mitsubishi Tokyo Financial Group, was established on April 2, 2001 with common stock of ¥924,400 million, preferred stock of ¥222,100 million, legal capital surplus of ¥2,838,693 million and no retained earnings in accordance with the Commercial Code of Japan (“the Code”), which was replaced by the Companies Act, and Japanese GAAP.
On October 1, 2005, MUFG started with common stock and preferred stock of ¥1,383,052 million, a legal capital surplus of ¥3,577,570 million and retained earnings of ¥757,458 million in accordance with the Code and Japanese GAAP.
MUFG’s amount available for dividends, at March 31, 2019, was ¥4,221,793 million, which is based on the amount recorded in MUFG’s general books of account under Japanese GAAP.
Annual dividends, including those for preferred stock, are approved by the shareholders at an annual general meeting held subsequent to the fiscal year to which the dividends are applicable. In addition, a semi-annual interim dividend payment may be made by resolution of the Board of Directors, subject to limitations imposed by the Companies Act and the Banking Law.
F-96
Table of Contents
MITSUBISHI UFJ FINANCIAL GROUP, INC. AND SUBSIDIARIES
NOTES TO CONSOLIDATED FINANCIAL STATEMENTS—(Continued)
In the accompanying consolidated statements of equity, dividends and appropriations to legal reserve shown for each fiscal year represent dividends approved and paid during the fiscal year and the related appropriation to legal reserve.
| 20. | ACCUMULATED OTHER COMPREHENSIVE INCOME (LOSS) |
The following table presents the changes in Accumulated OCI, net of tax and net of noncontrolling interests, for the fiscal years ended March 31, 2017, 2018 and 2019:
| 2017 | 2018 | 2019 | ||||||||||
| (in millions) | ||||||||||||
|
Accumulated other comprehensive income (loss), net of taxes: |
||||||||||||
|
Net unrealized gains (losses) on investment securities (1) : |
||||||||||||
|
Balance at beginning of fiscal year |
¥ | 1,995,314 | ¥ | 2,032,807 | ¥ | 2,270,346 | ||||||
|
Net change during the fiscal year |
31,984 | 244,249 | 60,616 | |||||||||
|
Effect of adopting new guidance by a foreign affiliated company |
— | 118 | — | |||||||||
|
Effect of adopting new guidance on consolidation of certain variable interest entities (Note 26) |
5,509 | — | — | |||||||||
|
Effect of adopting new guidance on reclassification on certain tax effects |
— | (6,828 | ) | — | ||||||||
|
Effect of adopting new guidance on recognition and measurement of financial assets and financial liabilities (Note 1) |
— | — | (2,700,331 | ) | ||||||||
|
|
|
|
|
|
|
|||||||
|
Balance at end of fiscal year |
¥ | 2,032,807 | ¥ | 2,270,346 | ¥ | (369,369 | ) | |||||
|
|
|
|
|
|
|
|||||||
|
Net debt valuation adjustments: |
||||||||||||
|
Balance at beginning of fiscal year |
¥ | (2,080 | ) | ¥ | (10,632 | ) | ¥ | (16,488 | ) | |||
|
Net change during the fiscal year |
(8,552 | ) | (2,178 | ) | 9,729 | |||||||
|
Effect of adopting new guidance on reclassification on certain tax effects |
— | (3,678 | ) | — | ||||||||
|
Effect of adopting new guidance on recognition and measurement of financial assets and financial liabilities (Note 1) |
— | — | (1,911 | ) | ||||||||
|
|
|
|
|
|
|
|||||||
|
Balance at end of fiscal year |
¥ | (10,632 | ) | ¥ | (16,488 | ) | ¥ | (8,670 | ) | |||
|
|
|
|
|
|
|
|||||||
|
Net unrealized gains (losses) on derivatives qualifying for cash flow hedges: |
||||||||||||
|
Balance at beginning of fiscal year |
¥ | 4,516 | ¥ | (8,729 | ) | ¥ | (19,250 | ) | ||||
|
Net change during the fiscal year |
(13,245 | ) | (7,025 | ) | (4,890 | ) | ||||||
|
Effect of adopting new guidance on reclassification on certain tax effects |
— | (3,496 | ) | — | ||||||||
|
|
|
|
|
|
|
|||||||
|
Balance at end of fiscal year |
¥ | (8,729 | ) | ¥ | (19,250 | ) | ¥ | (24,140 | ) | |||
|
|
|
|
|
|
|
|||||||
|
Defined benefit plans: |
||||||||||||
|
Balance at beginning of fiscal year |
¥ | (317,422 | ) | ¥ | (214,062 | ) | ¥ | (119,593 | ) | |||
|
Net change during the fiscal year |
103,360 | 109,012 | (88,680 | ) | ||||||||
|
Effect of adopting new guidance on reclassification on certain tax effects |
— | (14,543 | ) | — | ||||||||
|
|
|
|
|
|
|
|||||||
|
Balance at end of fiscal year |
¥ | (214,062 | ) | ¥ | (119,593 | ) | ¥ | (208,273 | ) | |||
|
|
|
|
|
|
|
|||||||
|
Foreign currency translation adjustments: |
||||||||||||
|
Balance at beginning of fiscal year |
¥ | 620,931 | ¥ | 482,039 | ¥ | 362,300 | ||||||
|
Net change during the fiscal year |
(137,256 | ) | (119,213 | ) | (36,117 | ) | ||||||
|
Effect of adopting new guidance on consolidation of certain variable interest entities (Note 26) |
(1,636 | ) | — | — | ||||||||
|
Effect of adopting new guidance on reclassification on certain tax effects |
— | (526 | ) | — | ||||||||
|
|
|
|
|
|
|
|||||||
|
Balance at end of fiscal year |
¥ | 482,039 | ¥ | 362,300 | ¥ | 326,183 | ||||||
|
|
|
|
|
|
|
|||||||
|
Balance at end of fiscal year |
¥ | 2,281,423 | ¥ | 2,477,315 | ¥ | (284,269 | ) | |||||
|
|
|
|
|
|
|
|||||||
Note:
| (1) | Included unrealized gains (losses) related to only debt securities for the fiscal year ended March 31, 2019. |
F-97
Table of Contents
MITSUBISHI UFJ FINANCIAL GROUP, INC. AND SUBSIDIARIES
NOTES TO CONSOLIDATED FINANCIAL STATEMENTS—(Continued)
The following table presents the before tax and net of tax changes in each component of Accumulated OCI for the fiscal years ended March 31, 2017, 2018 and 2019:
| 2017 | 2018 | 2019 | ||||||||||||||||||||||||||||||||||
| Before tax |
Tax
(expense) or benefit |
Net of tax | Before tax |
Tax
(expense) or benefit |
Net of tax | Before tax |
Tax
(expense) or benefit |
Net of tax | ||||||||||||||||||||||||||||
| (in millions) | ||||||||||||||||||||||||||||||||||||
|
Net unrealized gains (losses) on investment securities: |
||||||||||||||||||||||||||||||||||||
|
Net unrealized gains on investment securities (1) |
¥ | 307,476 | ¥ | (107,082 | ) | ¥ | 200,394 | ¥ | 631,154 | ¥ | (204,916 | ) | ¥ | 426,238 | ¥ | 132,723 | ¥ | (24,690) | ¥ | 108,033 | ||||||||||||||||
|
Reclassification adjustment for gains included in net income before attribution of noncontrolling interests |
(274,278 | ) | 86,845 | (187,433 | ) | (280,258 | ) | 84,328 | (195,930 | ) | (28,953 | ) | 9,100 | (19,853 | ) | |||||||||||||||||||||
|
|
|
|
|
|
|
|
|
|
|
|
|
|
|
|
|
|
|
|||||||||||||||||||
|
Net change |
33,198 | (20,237 | ) | 12,961 | 350,896 | (120,588 | ) | 230,308 | 103,770 | (15,590 | ) | 88,180 | ||||||||||||||||||||||||
|
Net unrealized gains (losses) on investment securities attributable to noncontrolling interests |
(19,023 | ) | (13,941 | ) | 27,564 | |||||||||||||||||||||||||||||||
|
|
|
|
|
|
|
|||||||||||||||||||||||||||||||
|
Net unrealized gains on investment securities attributable to Mitsubishi UFJ Financial Group |
31,984 | 244,249 | 60,616 | |||||||||||||||||||||||||||||||||
|
|
|
|
|
|
|
|||||||||||||||||||||||||||||||
|
Net debt valuation adjustments: |
||||||||||||||||||||||||||||||||||||
|
Net debt valuation adjustments |
(12,693 | ) | 3,994 | (8,699 | ) | (3,555 | ) | 1,088 | (2,467 | ) | 13,006 | (3,982 | ) | 9,024 | ||||||||||||||||||||||
|
Reclassification adjustment for losses included in net income before attribution of noncontrolling interests |
215 | (68 | ) | 147 | 417 | (128 | ) | 289 | 1,016 | (311 | ) | 705 | ||||||||||||||||||||||||
|
|
|
|
|
|
|
|
|
|
|
|
|
|
|
|
|
|
|
|||||||||||||||||||
|
Net change |
(12,478 | ) | 3,926 | (8,552 | ) | (3,138 | ) | 960 | (2,178 | ) | 14,022 | (4,293 | ) | 9,729 | ||||||||||||||||||||||
|
Net debt valuation adjustments attributable to noncontrolling interests |
— | — | — | |||||||||||||||||||||||||||||||||
|
|
|
|
|
|
|
|||||||||||||||||||||||||||||||
|
Net debt valuation adjustments attributable to Mitsubishi UFJ Financial Group |
(8,552 | ) | (2,178 | ) | 9,729 | |||||||||||||||||||||||||||||||
|
|
|
|
|
|
|
|||||||||||||||||||||||||||||||
|
Net unrealized gains (losses) on derivatives qualifying for cash flow hedges: |
||||||||||||||||||||||||||||||||||||
|
Net unrealized losses on derivatives qualifying for cash flow hedges |
(4,321 | ) | 2,041 | (2,280 | ) | (3,430 | ) | 1,571 | (1,859 | ) | (10,397 | ) | 2,825 | (7,572 | ) | |||||||||||||||||||||
|
Reclassification adjustment for losses (gains) included in net income before attribution of noncontrolling interests |
(18,367 | ) | 7,402 | (10,965 | ) | (8,016 | ) | 2,850 | (5,166 | ) | 3,662 | (980 | ) | 2,682 | ||||||||||||||||||||||
|
|
|
|
|
|
|
|
|
|
|
|
|
|
|
|
|
|
|
|||||||||||||||||||
|
Net change |
(22,688 | ) | 9,443 | (13,245 | ) | (11,446 | ) | 4,421 | (7,025 | ) | (6,735 | ) | 1,845 | (4,890 | ) | |||||||||||||||||||||
|
Net unrealized gains on derivatives qualifying for cash flow hedges attributable to noncontrolling interests |
— | — | — | |||||||||||||||||||||||||||||||||
|
|
|
|
|
|
|
|||||||||||||||||||||||||||||||
|
Net unrealized losses on derivatives qualifying for cash flow hedges attributable to Mitsubishi UFJ Financial Group |
(13,245 | ) | (7,025 | ) | (4,890 | ) | ||||||||||||||||||||||||||||||
|
|
|
|
|
|
|
|||||||||||||||||||||||||||||||
F-98
Table of Contents
MITSUBISHI UFJ FINANCIAL GROUP, INC. AND SUBSIDIARIES
NOTES TO CONSOLIDATED FINANCIAL STATEMENTS—(Continued)
| 2017 | 2018 | 2019 | ||||||||||||||||||||||||||||||||||
| Before tax |
Tax
(expense) or benefit |
Net of tax | Before tax |
Tax
(expense) or benefit |
Net of tax | Before tax |
Tax
(expense) or benefit |
Net of tax | ||||||||||||||||||||||||||||
| (in millions) | ||||||||||||||||||||||||||||||||||||
|
Defined benefit plans: |
||||||||||||||||||||||||||||||||||||
|
Defined benefit plans |
131,971 | (41,852 | ) | 90,119 | 154,708 | (48,537 | ) | 106,171 | (126,001 | ) | 37,655 | (88,346 | ) | |||||||||||||||||||||||
|
Reclassification adjustment for losses (gains) included in net income before attribution of noncontrolling interests |
20,105 | (6,652 | ) | 13,453 | 5,904 | (2,237 | ) | 3,667 | (1,168 | ) | 574 | (594 | ) | |||||||||||||||||||||||
|
|
|
|
|
|
|
|
|
|
|
|
|
|
|
|
|
|
|
|||||||||||||||||||
|
Net change |
152,076 | (48,504 | ) | 103,572 | 160,612 | (50,774 | ) | 109,838 | (127,169 | ) | 38,229 | (88,940 | ) | |||||||||||||||||||||||
|
Defined benefit plans attributable to noncontrolling interests |
212 | 826 | (260 | ) | ||||||||||||||||||||||||||||||||
|
|
|
|
|
|
|
|||||||||||||||||||||||||||||||
|
Defined benefit plans attributable to Mitsubishi UFJ Financial Group |
103,360 | 109,012 | (88,680 | ) | ||||||||||||||||||||||||||||||||
|
|
|
|
|
|
|
|||||||||||||||||||||||||||||||
|
Foreign currency translation adjustments: |
||||||||||||||||||||||||||||||||||||
|
Foreign currency translation adjustments |
(148,460 | ) | 2,424 | (146,036 | ) | (137,811 | ) | 32,767 | (105,044 | ) | (18,062 | ) | (17,932 | ) | (35,994 | ) | ||||||||||||||||||||
|
Reclassification adjustment for losses (gains) included in net income before attribution of noncontrolling interests |
3,293 | (467 | ) | 2,826 | (1,494 | ) | 1,760 | 266 | (9,002 | ) | 2,784 | (6,218 | ) | |||||||||||||||||||||||
|
|
|
|
|
|
|
|
|
|
|
|
|
|
|
|
|
|
|
|||||||||||||||||||
|
Net change |
(145,167 | ) | 1,957 | (143,210 | ) | (139,305 | ) | 34,527 | (104,778 | ) | (27,064 | ) | (15,148 | ) | (42,212 | ) | ||||||||||||||||||||
|
Foreign currency translation adjustments attributable to noncontrolling interests |
(5,954 | ) | 14,435 | (6,095 | ) | |||||||||||||||||||||||||||||||
|
|
|
|
|
|
|
|||||||||||||||||||||||||||||||
|
Foreign currency translation adjustments attributable to Mitsubishi UFJ Financial Group |
(137,256 | ) | (119,213 | ) | (36,117 | ) | ||||||||||||||||||||||||||||||
|
|
|
|
|
|
|
|||||||||||||||||||||||||||||||
|
Other comprehensive income (loss) attributable to Mitsubishi UFJ Financial Group |
¥ | (23,709 | ) | ¥ | 224,845 | ¥ | (59,342 | ) | ||||||||||||||||||||||||||||
|
|
|
|
|
|
|
|||||||||||||||||||||||||||||||
Note:
| (1) | Included unrealized gains (losses) related to only debt securities for the fiscal year ended March 31, 2019. |
F-99
Table of Contents
MITSUBISHI UFJ FINANCIAL GROUP, INC. AND SUBSIDIARIES
NOTES TO CONSOLIDATED FINANCIAL STATEMENTS—(Continued)
The following table presents the effect of the reclassification of significant items out of Accumulated OCI on the respective line items of the accompanying consolidated statements of income for the fiscal years ended March 31, 2017, 2018 and 2019:
| 2017 | 2018 | 2019 | ||||||||||||
|
Details of Accumulated OCI components |
Amount reclassified out of
Accumulated OCI |
Line items in the consolidated
|
||||||||||||
| (in millions) | ||||||||||||||
|
Net unrealized losses (gains) on investment securities |
||||||||||||||
|
Net gains on sales and redemptions of Available-for-sale debt securities (1) |
¥ | (307,041 | ) | ¥ | (287,279 | ) | ¥ | (29,182 | ) |
Investment securities gains
(losses)—net |
||||
|
Impairment losses on investment securities |
32,744 | 6,759 | 596 |
Investment securities gains
(losses)—net |
||||||||||
|
Other |
19 | 262 | (367 | ) | ||||||||||
|
|
|
|
|
|
|
|||||||||
| (274,278 | ) | (280,258 | ) | (28,953 | ) | Total before tax | ||||||||
| 86,845 | 84,328 | 9,100 | Income tax expense | |||||||||||
|
|
|
|
|
|
|
|||||||||
| ¥ | (187,433 | ) | ¥ | (195,930 | ) | ¥ | (19,853 | ) | Net of tax | |||||
|
|
|
|
|
|
|
|||||||||
|
Net debt valuation adjustments |
¥ | 215 | ¥ | 417 | ¥ | 1,016 |
Equity in earnings of equity
method investees—net |
|||||||
|
|
|
|
|
|
|
|||||||||
| 215 | 417 | 1,016 | Total before tax | |||||||||||
| (68 | ) | (128 | ) | (311 | ) | Income tax expense | ||||||||
|
|
|
|
|
|
|
|||||||||
| ¥ | 147 | ¥ | 289 | ¥ | 705 | Net of tax | ||||||||
|
|
|
|
|
|
|
|||||||||
|
Net unrealized losses (gains) on derivatives qualifying for cash flow hedges |
||||||||||||||
|
Interest rate contracts |
¥ | (18,332 | ) | ¥ | (7,782 | ) | ¥ | 3,739 |
Interest income on Loans,
including fees |
|||||
|
Other |
(35 | ) | (234 | ) | (77 | ) | ||||||||
|
|
|
|
|
|
|
|||||||||
| (18,367 | ) | (8,016 | ) | 3,662 | Total before tax | |||||||||
| 7,402 | 2,850 | (980 | ) | Income tax expense | ||||||||||
|
|
|
|
|
|
|
|||||||||
| ¥ | (10,965 | ) | ¥ | (5,166 | ) | ¥ | 2,682 | Net of tax | ||||||
|
|
|
|
|
|
|
|||||||||
|
Defined benefit plans |
||||||||||||||
|
Net actuarial loss (2) |
¥ | 31,837 | ¥ | 17,280 | ¥ | 11,431 | Other non-interest expenses | |||||||
|
Prior service cost (2) |
(9,927 | ) | (6,959 | ) | (6,269 | ) | Other non-interest expenses | |||||||
|
Gain on settlements and curtailment, and other (2) |
(1,805 | ) | (4,417 | ) | (6,330 | ) | Other non-interest expenses | |||||||
|
|
|
|
|
|
|
|||||||||
| 20,105 | 5,904 | (1,168 | ) | Total before tax | ||||||||||
| (6,652 | ) | (2,237 | ) | 574 | Income tax expense | |||||||||
|
|
|
|
|
|
|
|||||||||
| ¥ | 13,453 | ¥ | 3,667 | ¥ | (594 | ) | Net of tax | |||||||
|
|
|
|
|
|
|
|||||||||
F-100
Table of Contents
MITSUBISHI UFJ FINANCIAL GROUP, INC. AND SUBSIDIARIES
NOTES TO CONSOLIDATED FINANCIAL STATEMENTS—(Continued)
| 2017 | 2018 | 2019 | ||||||||||||
|
Details of Accumulated OCI components |
Amount reclassified out of
Accumulated OCI |
Line items in the consolidated
|
||||||||||||
| (in millions) | ||||||||||||||
|
Foreign currency translation adjustments |
¥ | (39 | ) | ¥ | (5,743 | ) | ¥ | (9,004 | ) | Other non-interest income | ||||
| 3,332 | 4,249 | 2 | Other non-interest expenses | |||||||||||
|
|
|
|
|
|
|
|||||||||
| 3,293 | (1,494 | ) | (9,002 | ) | Total before tax | |||||||||
| (467 | ) | 1,760 | 2,784 | Income tax expense | ||||||||||
|
|
|
|
|
|
|
|||||||||
| ¥ | 2,826 | ¥ | 266 | ¥ | (6,218 | ) | Net of tax | |||||||
|
|
|
|
|
|
|
|||||||||
|
Total reclassifications for the period |
¥ | (269,032 | ) | ¥ | (283,447 | ) | ¥ | (34,445 | ) | Total before tax | ||||
| 87,060 | 86,573 | 11,167 | Income tax expense | |||||||||||
|
|
|
|
|
|
|
|||||||||
| ¥ | (181,972 | ) | ¥ | (196,874 | ) | ¥ | (23,278 | ) | Net of tax | |||||
|
|
|
|
|
|
|
|||||||||
Notes:
| (1) | Included unrealized gains (losses) related to only debt securities for the fiscal year ended March 31, 2019 while included unrealized gains (losses) related to both debt and equity securities for the fiscal years ended March 31, 2017 and 2018. |
| (2) | These Accumulated OCI components are components of net periodic benefit cost. See Note 13 for more information. |
| 21. |
NONCONTROLLING INTERESTS |
Deconsolidation of Subsidiaries
The gains and losses due to deconsolidation of subsidiaries were recognized under “Other non-interest income” and “Other non-interest expenses,” respectively, in the accompanying consolidated statements of income. The amount of net losses was ¥2,848 million for the fiscal year ended March 31, 2017, the amount of net gains was ¥4,448 million for the fiscal year ended March 31, 2018 and the amount of net gains was ¥7,228 million for the fiscal year ended March 31, 2019, respectively.
Changes in MUFG’s Ownership Interests in Subsidiaries
The following table presents the effect on MUFG’s shareholders’ equity from changes in ownership of subsidiaries resulting from transactions with the noncontrolling interest shareholders during the fiscal years ended March 31, 2017, 2018 and 2019:
| 2017 | 2018 | 2019 | ||||||||||
| (in millions) | ||||||||||||
|
Net income attributable to Mitsubishi UFJ Financial Group |
¥ | 202,680 | ¥ | 1,228,160 | ¥ | 718,645 | ||||||
|
Transactions between Mitsubishi UFJ Financial Group and the noncontrolling interest shareholders: |
||||||||||||
|
Purchase of shares of Mitsubishi UFJ NICOS from noncontrolling interest shareholder (Note 2) |
— | (34,751 | ) | — | ||||||||
|
Other |
(429 | ) | 8,006 | (78 | ) | |||||||
|
|
|
|
|
|
|
|||||||
|
Net transfers to the noncontrolling interest shareholders |
(429 | ) | (26,745 | ) | (78 | ) | ||||||
|
|
|
|
|
|
|
|||||||
|
Change from net income attributable to Mitsubishi UFJ Financial Group and transactions between Mitsubishi UFJ Financial Group and the noncontrolling interest shareholders |
¥ | 202,251 | ¥ | 1,201,415 | ¥ | 718,567 | ||||||
|
|
|
|
|
|
|
|||||||
F-101
Table of Contents
MITSUBISHI UFJ FINANCIAL GROUP, INC. AND SUBSIDIARIES
NOTES TO CONSOLIDATED FINANCIAL STATEMENTS—(Continued)
| 22. | REGULATORY CAPITAL REQUIREMENTS |
Japan
MUFG, MUFG Bank, Mitsubishi UFJ Trust and Banking and Mitsubishi UFJ Securities Holdings are subject to various regulatory capital requirements promulgated by the regulatory authorities of the countries in which they operate. Failure to meet minimum capital requirements will initiate certain mandatory actions by regulators that, if undertaken, could have a direct material effect on MUFG’s consolidated financial statements.
In Japan, MUFG, MUFG Bank, and Mitsubishi UFJ Trust and Banking are subject to regulatory capital requirements promulgated by the Financial Services Agency of Japan (“FSA”) in accordance with the provisions of the Banking Law and related regulations. A banking institution is subject to the minimum capital requirements both on a consolidated basis and a stand-alone basis, and is required to maintain the minimum capital irrespective of whether it operates independently or as a subsidiary under the control of another company. When a bank holding company manages operations of its banking subsidiaries, it is required to maintain the minimum capital adequacy ratio on a consolidated basis in the same manner as its subsidiary banks. The FSA provides two sets of capital adequacy guidelines. One is a set of guidelines applicable to Japanese banks and bank holding companies with their foreign offices conducting international operations, as defined, and the other is applicable to Japanese banks and bank holding companies that are not engaged in international operations conducted by their foreign offices.
The Basel Committee on Banking Supervision (“BCBS”) of the Bank for International Settlements (“BIS”) sets capital adequacy standards for all internationally active banks to ensure minimum levels of capital.
The Basel Committee revised the 1988 Accord (“Basel I”) in June 2004 and released “International Convergence of Capital Measurement and Capital Standards: A Revised Framework” (“Basel II”). In addition, the Group of Central Bank Governors and Heads of Supervision reached an agreement on the new global regulatory framework, which has been referred to as “Basel III,” in July and September 2010. In December 2010, the Basel Committee agreed on the details of the Basel III rules. Effective as of March 31, 2013, Basel III was adopted by the FSA with transitional measures for Japanese banking institutions with international operations conducted by their foreign offices. MUFG calculated capital ratios as of March 31, 2018 and 2019 in accordance with Basel III.
Capital Ratios
Basel III, the same as Basel II, is based on “three pillars”: (1) minimum capital requirements, (2) the self-regulation of financial institutions based on supervisory review process, and (3) market discipline through the disclosure of information. The framework of the 1988 Accord, Basel I is improved and expanded to be included in “minimum capital requirements” as the first pillar of Basel II and Basel III.
As for the denominator of the capital ratio, the Basel framework provides the following risk-based approaches and a range of options for determining risk-weighted assets.
“Credit Risk”
The Basel framework provides options for determining the risk-weighted assets for credit risk to allow banks to select approaches that are most appropriate for their level of risk assessment. Banks choose one of three approaches: “Standardized Approach,” “Foundation Internal Ratings-Based Approach” or “Advanced Internal Ratings-Based Approach (“AIRB”).”
F-102
Table of Contents
MITSUBISHI UFJ FINANCIAL GROUP, INC. AND SUBSIDIARIES
NOTES TO CONSOLIDATED FINANCIAL STATEMENTS—(Continued)
“Market Risk”
In the “Amendment to the Capital Accord to incorporate market risks” of the year 1996, a choice between two methodologies “the Standardized Measurement Method” and “Internal Models Approach” is permitted. “Combination of Internal Models Approach and the Standardized Measurement Method” is also allowed under certain conditions. This is unchanged in Basel III.
“Operational Risk”
Operational risk, which is defined as the risk of loss resulting from inadequate or failed internal processes, people and systems or from external events, is newly added in Basel II. The Basel framework presents three methods for calculating operational risk capital charges: (i) the Basic Indicator Approach; (ii) the Standardized Approach; or (iii) Advanced Measurement Approaches (“AMA”). Banks adopt one of the three approaches to determine the risk-weighted assets for operational risk.
Banks need to obtain approval from their supervisors prior to adopting the following approaches to calculate capital requirements for each risk:
| • |
the Advanced Internal Ratings-Based Approach for credit risk |
| • |
the Internal Models Approach for market risk |
| • |
the Standardized Approach and AMA for operational risk |
With approval from the FSA, MUFG and most of its major subsidiaries adopt AIRB to calculate capital requirements for credit risk, adopt the AMA to calculate capital requirements for operational risk, as for market risk, adopt the Internal Models Approach mainly to calculate general market risk and adopt the Standardized Measurement Method to calculate specific risk.
The MUFG Group’s proprietary assets do not include trust assets under management and administration in a capacity of agent or fiduciary and, accordingly trust account assets are generally not included in the capital measure. However, guarantees for trust principal are counted as off-balance sheet items requiring a capital charge in accordance with the capital adequacy guidelines.
Under Basel III, as adopted by the FSA, MUFG’s risk-weighted assets increased, largely reflecting the new capital charge of the credit valuation adjustment (CVA), the credit risk related to asset value correlation multiplier for large financial institutions, and the 250% risk-weighted threshold items not deducted from Common Equity Tier 1 capital, as well as the conversion of certain Basel II capital deductions to risk-weighted assets, such as securitizations.
On the other hand, as for the numerator of the capital ratio, there are three primary regulatory capital ratios used to assess capital adequacy, Common Equity Tier 1, Tier 1 and Total capital ratios, which are determined by dividing applicable capital components by risk-weighted assets. Tier 1 capital consists of Common Equity Tier 1 capital and Additional Tier 1 capital. Common Equity Tier 1 capital is primarily consisting of common stock, capital surplus, retained earnings, and Accumulated OCI. Regulatory adjustments including certain intangible fixed assets, such as goodwill, and defined-benefit pension fund assets, are made to Common Equity Tier 1. Additional Tier 1 capital generally consists of Basel III compliant preferred securities, and during the transition period, other capital that meets Tier 1 requirements under Basel II standards.
Tier 2 capital generally consists of Basel III compliant subordinated debts, capital that meets Tier 2 requirements under Basel II standards during the transition period, certain allowances for credit losses, and noncontrolling interests in subsidiaries’ Tier 2 instruments. Total capital is defined as the sum of Tier 1 and Tier 2 capital.
F-103
Table of Contents
MITSUBISHI UFJ FINANCIAL GROUP, INC. AND SUBSIDIARIES
NOTES TO CONSOLIDATED FINANCIAL STATEMENTS—(Continued)
Effective March 31, 2016, the FSA’s capital conservation buffer, countercyclical buffer and the Global Systematically Important Bank (“G-SIB”), as designated by the FSB, surcharge requirements became applicable to Japanese banking institutions with international operations conducted through foreign offices. The requirements had been phased in and fully implemented as of March 31, 2019. MUFG is required to maintain a capital conservation buffer of 1.875% and 2.5%, a G-SIB surcharge of 1.125% and 1.5%, and a countercyclical buffer of 0.01% and 0.04%, in addition to the 4.50% minimum Common Equity Tier 1 capital ratio, as of March 31, 2018 and 2019, respectively.
Leverage Ratios
The leverage ratio is designed for monitoring and preventing the build-up of excessive leverage in the banking sector and is expressed as the ratio of Tier 1 capital to both on and off-balance sheet assets adjusted in accordance with the FSA guidance. In December 2017, the Group of Central Bank Governors and Heads of Supervision announced final Basel III reforms. The announced reforms include revisions to the measurement of the leverage ratio and a 3% minimum leverage ratio requirement, plus a G-SIB leverage ratio buffer equal to 50% of the applicable G-SIB capital surcharge. The announcement sets forth implementation dates of January 1, 2018 for the minimum leverage ratio requirement and January 1, 2022 for the G-SIB leverage ratio buffer requirement. Effective as of March 31, 2019, the minimum leverage ratio requirement was adopted by the FSA.
The risk-adjusted capital amounts and ratios, and leverage ratios, of MUFG, MUFG Bank and Mitsubishi UFJ Trust and Banking presented in the following table are based on amounts calculated in accordance with Japanese GAAP as required by the FSA.
| Actual |
For capital
adequacy purposes |
|||||||||||||||
| Amount | Ratio | Amount | Ratio | |||||||||||||
| (in millions, except percentages) | ||||||||||||||||
|
Consolidated: |
||||||||||||||||
|
At March 31, 2018: |
||||||||||||||||
|
Total capital (to risk-weighted assets): |
||||||||||||||||
|
MUFG (1) |
¥ | 18,795,480 | 16.56 | % | ¥ | 12,492,344 | 11.01 | % | ||||||||
|
BK |
14,470,240 | 15.90 | 7,280,570 | 8.00 | ||||||||||||
|
TB |
2,545,648 | 20.03 | 1,016,420 | 8.00 | ||||||||||||
|
Tier1 capital (to risk-weighted assets): |
||||||||||||||||
|
MUFG (1) |
16,251,749 | 14.32 | 10,223,072 | 9.01 | ||||||||||||
|
BK |
12,374,074 | 13.59 | 5,460,427 | 6.00 | ||||||||||||
|
TB |
2,245,853 | 17.67 | 762,315 | 6.00 | ||||||||||||
|
Common Equity Tier1 capital (to risk-weighted assets): |
||||||||||||||||
|
MUFG (1) |
14,284,945 | 12.58 | 8,521,118 | 7.51 | ||||||||||||
|
BK |
10,788,381 | 11.85 | 4,095,321 | 4.50 | ||||||||||||
|
TB |
2,060,107 | 16.21 | 571,736 | 4.50 | ||||||||||||
|
At March 31, 2019: |
||||||||||||||||
|
Total capital (to risk-weighted assets): |
||||||||||||||||
|
MUFG (1) |
¥ | 18,769,793 | 16.03 | % | ¥ | 14,097,771 | 12.04 | % | ||||||||
|
BK |
14,632,620 | 14.42 | 8,114,105 | 8.00 | ||||||||||||
|
TB |
2,213,195 | 24.40 | 725,540 | 8.00 | ||||||||||||
|
Tier1 capital (to risk-weighted assets): |
||||||||||||||||
|
MUFG (1) |
16,276,301 | 13.90 | 11,755,949 | 10.04 | ||||||||||||
|
BK |
12,639,454 | 12.46 | 6,085,579 | 6.00 | ||||||||||||
|
TB |
1,928,955 | 21.26 | 544,155 | 6.00 | ||||||||||||
|
Common Equity Tier1 capital (to risk-weighted assets): |
||||||||||||||||
|
MUFG (1) |
14,322,407 | 12.23 | 9,999,582 | 8.54 | ||||||||||||
|
BK |
10,990,820 | 10.83 | 4,564,184 | 4.50 | ||||||||||||
|
TB |
1,775,565 | 19.57 | 408,116 | 4.50 | ||||||||||||
|
Leverage ratio (2) : |
||||||||||||||||
|
MUFG |
16,276,301 | 4.94 | 9,871,460 | 3.00 | ||||||||||||
|
BK |
12,639,454 | 4.63 | 8,189,494 | 3.00 | ||||||||||||
|
TB |
1,928,955 | 5.09 | 1,135,795 | 3.00 | ||||||||||||
F-104
Table of Contents
MITSUBISHI UFJ FINANCIAL GROUP, INC. AND SUBSIDIARIES
NOTES TO CONSOLIDATED FINANCIAL STATEMENTS—(Continued)
| Actual |
For capital
adequacy purposes |
|||||||||||||||
| Amount | Ratio | Amount | Ratio | |||||||||||||
| (in millions, except percentages) | ||||||||||||||||
|
Stand-alone: |
||||||||||||||||
|
At March 31, 2018: |
||||||||||||||||
|
Total capital (to risk-weighted assets): |
||||||||||||||||
|
BK |
¥ | 13,211,327 | 16.90 | % | ¥ | 6,252,458 | 8.00 | % | ||||||||
|
TB |
2,529,316 | 19.88 | 1,017,331 | 8.00 | ||||||||||||
|
Tier1 capital (to risk-weighted assets): |
||||||||||||||||
|
BK |
11,344,078 | 14.51 | 4,689,344 | 6.00 | ||||||||||||
|
TB |
2,232,760 | 17.55 | 762,998 | 6.00 | ||||||||||||
|
Common Equity Tier1 capital (to risk-weighted assets): |
||||||||||||||||
|
BK |
9,802,445 | 12.54 | 3,517,008 | 4.50 | ||||||||||||
|
TB |
2,057,760 | 16.18 | 572,249 | 4.50 | ||||||||||||
|
At March 31, 2019: |
||||||||||||||||
|
Total capital (to risk-weighted assets): |
||||||||||||||||
|
BK |
¥ | 13,560,583 | 15.58 | % | ¥ | 6,959,207 | 8.00 | % | ||||||||
|
TB |
2,195,098 | 24.25 | 723,953 | 8.00 | ||||||||||||
|
Tier1 capital (to risk-weighted assets): |
||||||||||||||||
|
BK |
11,773,839 | 13.53 | 5,219,405 | 6.00 | ||||||||||||
|
TB |
1,911,237 | 21.12 | 542,965 | 6.00 | ||||||||||||
|
Common Equity Tier1 capital (to risk-weighted assets): |
||||||||||||||||
|
BK |
10,172,206 | 11.69 | 3,914,554 | 4.50 | ||||||||||||
|
TB |
1,758,237 | 19.42 | 407,224 | 4.50 | ||||||||||||
|
Leverage ratio (2) : |
||||||||||||||||
|
BK |
11,773,839 | 4.84 | 7,284,812 | 3.00 | ||||||||||||
|
TB |
1,911,237 | 5.55 | 1,031,484 | 3.00 | ||||||||||||
Notes:
| (1) | Effective March 31, 2016, the FSA’s capital conservation buffer, countercyclical buffer and G-SIB surcharge requirements became applicable to Japanese banking institutions with international operations conducted through foreign offices. As a result, in addition to the 4.50% minimum Common Equity Tier 1 capital ratio, MUFG is required to maintain a capital conservation buffer of 1.875% and a G-SIB surcharge of 1.125% as of March 31, 2018 and a capital conservation buffer of 2.5% and a G-SIB surcharge of 1.5% as of March 31, 2019. As of the same date, the countercyclical buffer applicable to MUFG is 0.04%. |
| (2) | Effective as of March 31, 2019, the minimum leverage ratio requirement was adopted by the FSA. |
Mitsubishi UFJ Morgan Stanley Securities and other securities subsidiaries in Japan and overseas are also subject to regulatory capital requirements of the countries or jurisdictions in which they operate. In Japan, the Financial Instruments and Exchange Act and related ordinance require financial instruments firms to maintain a minimum capital ratio of 120% calculated as a percentage of capital accounts less certain fixed assets, as determined in accordance with Japanese GAAP, against amounts equivalent to market, counterparty credit and operational risks. Specific guidelines are issued as a ministerial ordinance which details the definition of essential components of the capital ratios, including capital, deductible fixed asset items and risks, and related measures. Failure to maintain a minimum capital ratio will trigger mandatory regulatory actions. A capital ratio of less than 140% will call for regulatory reporting and a capital ratio of less than 100% may lead to a suspension of all or part of the business for a period of time and cancellation of a registration.
At March 31, 2018, Mitsubishi UFJ Morgan Stanley Securities’s capital accounts less certain fixed assets of ¥446,539 million on a stand-alone basis and ¥473,296 million on a consolidated basis, were 291.2% and 293.2% of the total amounts equivalent to market, counterparty credit and operational risks, respectively. At March 31, 2019, its capital accounts less certain fixed assets of ¥446,609 million on a stand-alone basis and ¥469,272 million on a consolidated basis, were 331.6% and 332.2% of the total amounts equivalent to market, counterparty credit and operational risks, respectively.
Management believes, as of March 31, 2019, that MUFG, MUFG Bank, Mitsubishi UFJ Trust and Banking, Mitsubishi UFJ Morgan Stanley Securities and other regulated securities subsidiaries met all capital adequacy requirements to which they are subject.
F-105
Table of Contents
MITSUBISHI UFJ FINANCIAL GROUP, INC. AND SUBSIDIARIES
NOTES TO CONSOLIDATED FINANCIAL STATEMENTS—(Continued)
United States of America
In the United States of America, MUFG Americas Holdings and its banking subsidiary MUFG Union Bank, N.A. (“MUFG Union Bank” or “BK(US)”), MUFG Bank’s largest subsidiaries operating outside Japan, are subject to various regulatory capital requirements administered by the U. S. Federal banking agencies. Failure to meet minimum capital requirements can initiate certain mandatory, and possibly additional discretionary, actions by regulators that, if undertaken, could have a material effect on MUFG Americas Holdings’s consolidated financial statements. Under capital adequacy guidelines and the regulatory framework for prompt corrective action, MUFG Americas Holdings and MUFG Union Bank must meet specific capital guidelines that involve quantitative measures of MUFG Americas Holdings’s and MUFG Union Bank’s assets, liabilities, and certain off-balance sheet items as calculated under regulatory accounting practices. MUFG Americas Holdings’s capital amounts and MUFG Union Bank’s prompt corrective action classification are also subject to qualitative judgments by the regulators about components, risk-weightings and other factors. Prompt corrective action provisions are not applicable to bank holding companies such as MUFG Americas Holdings. MUFG Union Bank is subject to laws and regulations that limit the amount of dividends MUFG Union Bank can pay to MUFG Americas Holdings.
Quantitative measures established by regulation to help ensure capital adequacy require MUFG Americas Holdings and MUFG Union Bank to maintain minimum amounts and ratios (set forth in the tables below) of Total and Tier 1 capital (as defined in the regulations) to risk-weighted assets (as defined) and of Tier 1 capital (as defined) to quarterly average assets (as defined).
In July 2013, the Board of Governors of the Federal Reserve System and the other U.S. Federal banking agencies adopted final rules making significant changes to the U.S. regulatory capital framework for U.S. banking organizations (U.S. Basel III). The final rules are intended to conform this framework to the BCBS’ current international regulatory capital accord (Basel III). These rules replace the U.S. Federal banking agencies’ general risk-based capital rules (commonly known as “Basel I”), advanced approaches rules (commonly known as “Basel II”) that are applicable to certain large banking organizations (including MUFG Union Bank), and leverage rules, and are subject to certain transition provisions. Among other requirements, the U.S. Basel III rules revise the definition of capital, increase minimum capital ratios, and introduce a minimum Common Equity Tier 1 capital ratio of 4.5% and a capital conservation buffer of 2.5% (for a total minimum Common Equity Tier 1 capital ratio of 7.0%) and a potential countercyclical buffer of up to 2.5%, which would be imposed by regulators at their discretion if it is determined that a period of excessive credit growth is contributing to an increase in financial institution systemic risk; mandate a Tier 1 leverage ratio of 4% and introduce, for large and internationally active bank holding companies, a Tier 1 Supplementary Leverage Ratio that is currently set at 3% and which incorporates off-balance sheet exposures; revise Basel I rules for calculating risk-weighted assets under a standardized approach; modify the existing Basel II advanced approaches rules for calculating risk-weighted assets under U.S. Basel III; and eliminate, for advanced approaches institutions, over a four-year phase-in period beginning on January 1, 2014, the Accumulated OCI or loss exclusion that had applied under Basel I and Basel II rules.
As a result of the Federal Reserve’s approval of MUFG Americas Holdings’s request to opt out of the advanced approaches methodology in the fourth quarter of 2014, MUFG Americas Holdings calculated its regulatory capital ratios under U.S. Basel I rules at December 31, 2014 and became subject to the U.S. Basel III standardized approach on January 1, 2015, with certain provisions subject to phase-in periods. As permitted for institutions not subject to the advanced approaches methodology, MUFG Americas Holdings made a one-time permanent election in the first quarter of 2015 to exclude certain components of the Accumulated OCI from its regulatory capital calculations. MUFG Union Bank continues to be subject to the advanced approaches rules. Advanced approaches institutions were required to apply U.S. Basel III rules beginning on January 1, 2014. The
F-106
Table of Contents
MITSUBISHI UFJ FINANCIAL GROUP, INC. AND SUBSIDIARIES
NOTES TO CONSOLIDATED FINANCIAL STATEMENTS—(Continued)
U.S. Basel III rules are scheduled to be substantially phased in by January 1, 2019. Effective June 30, 2015, MUFG Americas Holdings updated the methodologies applied to the calculation of its regulatory capital ratios due to recent regulatory guidance, which clarified the treatment of certain off-balance sheet credit exposures. These methodologies were applied to MUFG Americas Holdings’s capital ratios and increased the ratios by approximately 50 basis points. This change did not affect MUFG Union Bank’s ratios as the U.S. Office of the Comptroller of the Currency (“OCC”) had previously adopted this guidance.
As required under U.S. Basel III rules, the 2.5% capital conservation buffer is being implemented on a phased-in basis in equal increments of 0.625% per year over a four-year period that commenced on January 1, 2016. MUFG Americas Holdings and MUFG Union Bank would satisfy the minimum capital requirements including the capital conservation buffer on a fully phased-in basis if those requirements were effective as of December 31, 2018.
The figures on the table below are calculated according to U.S. Basel III as of December 31, 2017 and 2018. MUFG Americas Holdings’s actual capital amounts and ratios are presented as follows:
| Actual |
Minimum capital
ratios required (1) |
|||||||||||||||
| Amount | Ratio | Amount | Ratio | |||||||||||||
| (in millions, except percentages) | ||||||||||||||||
|
MUAH: |
||||||||||||||||
|
At December 31, 2017: |
||||||||||||||||
|
Total capital (to risk-weighted assets) |
$ | 17,106 | 17.76 | % | $ | 8,910 | 9.250 | % | ||||||||
|
Tier 1 capital (to risk-weighted assets) |
15,708 | 16.31 | 6,984 | 7.250 | ||||||||||||
|
Tier 1 capital (to quarterly average assets) (2) |
15,708 | 10.06 | 6,245 | 4.000 | ||||||||||||
|
Common Equity Tier 1 capital (to risk-weighted assets) |
15,708 | 16.31 | 5,539 | 5.750 | ||||||||||||
|
At December 31, 2018: |
||||||||||||||||
|
Total capital (to risk-weighted assets) |
$ | 14,904 | 14.60 | % | $ | 10,081 | 9.875 | % | ||||||||
|
Tier 1 capital (to risk-weighted assets) |
14,256 | 13.96 | 8,039 | 7.875 | ||||||||||||
|
Tier 1 capital (to quarterly average assets) (2) |
14,256 | 8.77 | 6,502 | 4.000 | ||||||||||||
|
Common Equity Tier 1 capital (to risk-weighted assets) |
14,256 | 13.96 | 6,508 | 6.375 | ||||||||||||
Notes:
| (1) | The minimum capital requirement includes a capital conservation buffer of 1.250% at December 31, 2017 and 1.875% at December 31, 2018. |
| (2) | Excludes certain deductions. |
F-107
Table of Contents
MITSUBISHI UFJ FINANCIAL GROUP, INC. AND SUBSIDIARIES
NOTES TO CONSOLIDATED FINANCIAL STATEMENTS—(Continued)
The figures on the table below are calculated according to U.S. Basel III as of December 31, 2017 and 2018. MUFG Union Bank’s actual capital amounts and ratios are presented as follows:
| Actual |
Minimum capital
ratios required (1) |
Ratios OCC
requires to be “well capitalized” |
||||||||||||||||||||||
| Amount | Ratio | Amount | Ratio | Amount | Ratio | |||||||||||||||||||
| (in millions, except percentages) | ||||||||||||||||||||||||
|
BK(US): |
||||||||||||||||||||||||
|
At December 31, 2017: |
||||||||||||||||||||||||
|
Total capital (to risk-weighted assets) |
$ | 15,335 | 17.68 | % | $ | 8,023 | 9.250 | % | $ | 8,673 | 10.00 | % | ||||||||||||
|
Tier 1 capital (to risk-weighted assets) |
14,028 | 16.17 | 6,288 | 7.250 | 6,938 | 8.00 | ||||||||||||||||||
|
Tier 1 capital (to quarterly average assets) (2) |
14,028 | 11.78 | 4,762 | 4.000 | 5,953 | 5.00 | ||||||||||||||||||
|
Common Equity Tier 1 capital (to risk-weighted assets) |
14,028 | 16.17 | 4,987 | 5.750 | 5,637 | 6.50 | ||||||||||||||||||
|
At December 31, 2018: |
||||||||||||||||||||||||
|
Total capital (to risk-weighted assets) |
$ | 13,905 | 15.09 | % | $ | 9,102 | 9.875 | % | $ | 9,217 | 10.00 | % | ||||||||||||
|
Tier 1 capital (to risk-weighted assets) |
13,316 | 14.45 | 7,258 | 7.875 | 7,374 | 8.00 | ||||||||||||||||||
|
Tier 1 capital (to quarterly average assets) (2) |
13,316 | 10.61 | 5,018 | 4.000 | 6,273 | 5.00 | ||||||||||||||||||
|
Common Equity Tier 1 capital (to risk-weighted assets) |
13,316 | 14.45 | 5,876 | 6.375 | 5,991 | 6.50 | ||||||||||||||||||
Notes:
| (1) | Beginning January 1, 2017 and 2018, the minimum capital requirement includes a capital conservation buffer of 1.250% and 1.875%, respectively. |
| (2) | Excludes certain deductions. |
Management believes, as of December 31, 2018, that MUFG Americas Holdings and MUFG Union Bank met all capital adequacy requirements to which they are subject.
As of December 31, 2017 and 2018, the notification from the OCC categorized MUFG Union Bank as “well capitalized” under the regulatory framework for prompt corrective action. To be categorized as “well capitalized,” MUFG Union Bank must maintain a minimum total risk-based capital ratio of 10% as of December 31, 2017 and 2018, a Tier 1 risk-based capital ratio of 8% as of December 31, 2017 and 2018, a Tier 1 capital to quarterly average assets of 5% as of December 31, 2017 and 2018, and Common Equity Tier 1 risk-based capital ratio of 6.5% as of December 31, 2017 and 2018, as set forth in the table. There are no conditions or events since that notification that management believes have changed MUFG Union Bank’s category.
F-108
Table of Contents
MITSUBISHI UFJ FINANCIAL GROUP, INC. AND SUBSIDIARIES
NOTES TO CONSOLIDATED FINANCIAL STATEMENTS—(Continued)
| 23. | EARNINGS PER COMMON SHARE APPLICABLE TO COMMON SHAREHOLDERS OF MUFG |
Reconciliations of net income and weighted average number of common shares outstanding used for the computation of basic EPS to the adjusted amounts for the computation of diluted EPS for the fiscal years ended March 31, 2017, 2018 and 2019 are as follows:
| 2017 | 2018 | 2019 | ||||||||||
| (in millions) | ||||||||||||
|
Income (Numerator): |
||||||||||||
|
Net income attributable to Mitsubishi UFJ Financial Group |
¥ | 202,680 | ¥ | 1,228,160 | ¥ | 718,645 | ||||||
|
|
|
|
|
|
|
|||||||
|
Effect of dilutive instruments: |
||||||||||||
|
Stock acquisition rights and restricted stock units—Morgan Stanley |
(3,212 | ) | (3,826 | ) | (3,745 | ) | ||||||
|
|
|
|
|
|
|
|||||||
|
Earnings applicable to common shareholders of Mitsubishi UFJ Financial Group and assumed conversions |
¥ | 199,468 | ¥ | 1,224,334 | ¥ | 714,900 | ||||||
|
|
|
|
|
|
|
|||||||
| 2017 | 2018 | 2019 | ||||||||||
| (thousands of shares) | ||||||||||||
|
Shares (Denominator): |
||||||||||||
|
Weighted average common shares outstanding |
13,574,314 | 13,291,842 | 13,058,698 | |||||||||
|
Effect of dilutive instruments: |
||||||||||||
|
Stock acquisition rights and the common shares of MUFG under the Board Incentive Plan (1) |
10,571 | 1,650 | 484 | |||||||||
|
|
|
|
|
|
|
|||||||
|
Weighted average common shares for diluted computation |
13,584,885 | 13,293,492 | 13,059,182 | |||||||||
|
|
|
|
|
|
|
|||||||
| 2017 | 2018 | 2019 | ||||||||||
| (in yen) | ||||||||||||
|
Earnings per common share applicable to common shareholders of Mitsubishi UFJ Financial Group: |
||||||||||||
|
Basic earnings per common share: |
||||||||||||
|
Earnings applicable to common shareholders of Mitsubishi UFJ Financial Group |
¥ | 14.93 | ¥ | 92.40 | ¥ | 55.03 | ||||||
|
|
|
|
|
|
|
|||||||
|
Diluted earnings per common share: |
||||||||||||
|
Earnings applicable to common shareholders of Mitsubishi UFJ Financial Group (1) |
¥ | 14.68 | ¥ | 92.10 | ¥ | 54.74 | ||||||
|
|
|
|
|
|
|
|||||||
Note:
| (1) | For the fiscal year ended March 31, 2019, the performance-based plan under the Board Incentive Plan could potentially dilute earnings per common share but were not included in the computation of diluted earnings per common share due to their antidilutive effects. |
| 24. | DERIVATIVE FINANCIAL INSTRUMENTS |
The MUFG Group uses various derivative financial instruments both for trading purposes and for purposes other than trading (primarily risk management purposes) in the normal course of business to meet the financial needs of its customers, as a source of revenue and to manage its exposures to a variety of risks.
Market risk is the possibility that future changes in market indices make the financial instruments less valuable. The MUFG Group is a party to derivative financial instruments, including swaps, forwards, options and
F-109
Table of Contents
MITSUBISHI UFJ FINANCIAL GROUP, INC. AND SUBSIDIARIES
NOTES TO CONSOLIDATED FINANCIAL STATEMENTS—(Continued)
other types of derivatives, dealing primarily with market risk associated with interest rates, foreign currencies, equity and commodity prices, and credit risk associated with counterparty’s nonperformance of transactions.
Credit risk is the possibility that a loss may result from a counterparty’s failure to perform according to the terms and conditions of the contract, which may exceed the value of underlying collateral. To reduce credit risk, the MUFG Group may require collateral or guarantees based on a case-by-case assessment of creditworthiness of each customer and evaluation of the instrument. The MUFG Group also uses master netting agreements in order to mitigate overall counterparty credit risk.
Trading Activities
The MUFG Group’s trading activities include dealing and customer accommodation activities. As part of its trading activities, the MUFG Group offers a variety of derivative financial instruments for managing interest rate and foreign exchange risk to its domestic and foreign corporate and financial institution customers. The MUFG Group also enters into other types of derivative transactions, including equity and credit-related contracts, for its own account.
Risk Management Activities
As part of the MUFG Group’s risk management activities, asset and liability management is viewed as one of the methods for the MUFG Group to manage its interest rate exposures on interest-bearing assets and liabilities. The MUFG Group uses certain derivative financial instruments in order to minimize significant unplanned fluctuations in earnings that are caused by interest rate volatility. For example, an increase or a decrease in interest income and interest expense on hedged variable rate assets and liabilities as a result of interest rate fluctuations are expected to be substantially offset by the variability in earnings by gains and losses on the derivative instruments that are linked to these hedged assets and liabilities.
The MUFG Group enters into interest rate swaps and other contracts primarily to manage the interest rate risk of its loans, investment securities and deposit liabilities. Interest rate contracts, which are generally non-leveraged generic interest rate and basis swaps, options and futures, allow the MUFG Group to effectively manage its interest rate risk position. Option contracts primarily consist of caps, floors, swaptions and options on index futures. Futures contracts used for asset and liability management activities are primarily index futures providing for cash payments based upon the movement of an underlying rate index.
The MUFG Group enters into forward exchange contracts, currency swaps and other contracts in response to currency exposures resulting from on-balance sheet assets and liabilities denominated in foreign currencies in order to limit the net foreign exchange position by currency to an appropriate level.
Derivatives Designated as Hedges
The MUFG Group adopts hedging strategies and applies hedge accounting to certain derivative transactions entered by MUFG Americas Holdings whose fiscal period ends on December 31.
Cash Flow Hedges
At December 31, 2018, MUFG Americas Holdings used interest rate floors with a notional amount of ¥55.5 billion and interest rate swaps with a notional amount of ¥19.3 billion to hedge the risk of changes in cash flows attributable to changes in the designated benchmark interest rate on LIBOR indexed loans and LIBOR indexed short-term borrowings, respectively. At December 31, 2018, the weighted average remaining life of active cash flow hedges was 2.6 years.
F-110
Table of Contents
MITSUBISHI UFJ FINANCIAL GROUP, INC. AND SUBSIDIARIES
NOTES TO CONSOLIDATED FINANCIAL STATEMENTS—(Continued)
For cash flow hedges, the effective portion of the gain or loss on the hedging instruments is reported as a component of OCI and reclassified into earnings in the same period or periods during which the hedged cash flows are recognized in net interest income. Gains and losses representing hedge ineffectiveness are recognized in non-interest expense in the period in which they arise. At December 31, 2018, MUFG Americas Holdings expects to reclassify approximately ¥9.8 billion of losses from Accumulated OCI as a reduction to net interest income during the year ending December 31, 2019. This amount could differ from amounts actually realized due to changes in interest rates, hedge terminations and the addition of other hedges subsequent to December 31, 2018.
Fair Value Hedges
MUFG Americas Holdings engaged in an interest rate hedging strategy in which one or more interest rate swaps were associated with a specified interest bearing liability, in order to convert the liability from a fixed rate to a floating rate instrument. This strategy mitigated the changes in fair value of the hedged liability caused by changes in the designated benchmark interest rate, LIBOR.
For fair value hedges, any ineffectiveness is recognized in non-interest expense in the period in which it arises. The change in the fair value of the hedged item and the hedging instrument, to the extent completely effective, offsets with no impact on earnings. For the fiscal years ended December 31, 2017 and 2018, MUFG Americas Holdings recorded losses on the hedging instruments and gains on the hedged liability, both of which were less than ¥1 billion.
Notional Amounts of Derivative Contracts
The following table summarizes the notional amounts of derivative contracts at March 31, 2018 and 2019:
| Notional amounts (1) | ||||||||
| 2018 | 2019 | |||||||
| (in trillions) | ||||||||
|
Interest rate contracts |
¥ | 1,219.7 | ¥ | 1,409.6 | ||||
|
Foreign exchange contracts |
220.8 | 230.5 | ||||||
|
Equity contracts |
6.1 | 6.4 | ||||||
|
Commodity contracts |
0.3 | 0.2 | ||||||
|
Credit derivatives |
6.5 | 7.2 | ||||||
|
Others |
3.1 | 3.0 | ||||||
|
|
|
|
|
|||||
|
Total |
¥ | 1,456.5 | ¥ | 1,656.9 | ||||
|
|
|
|
|
|||||
Note:
| (1) | Includes both written and purchased positions. |
F-111
Table of Contents
MITSUBISHI UFJ FINANCIAL GROUP, INC. AND SUBSIDIARIES
NOTES TO CONSOLIDATED FINANCIAL STATEMENTS—(Continued)
Impact of Derivatives on the Consolidated Balance Sheets
The following table summarizes fair value information on derivative instruments that are recorded on the MUFG Group’s consolidated balance sheets at March 31, 2018 and 2019:
| Fair value of derivative instruments | ||||||||||||||||||||||||
| 2018 (1)(5) | 2019 (1)(5) | |||||||||||||||||||||||
|
Not designated
as hedges (2) |
Designated
as hedges (3) |
Total
derivatives (4) |
Not designated
as hedges (2) |
Designated
as hedges (3) |
Total
derivatives (4) |
|||||||||||||||||||
| (in billions) | ||||||||||||||||||||||||
|
Derivative assets: |
||||||||||||||||||||||||
|
Interest rate contracts |
¥ | 8,712 | ¥ | — | ¥ | 8,712 | ¥ | 10,108 | ¥ | 1 | ¥ | 10,109 | ||||||||||||
|
Foreign exchange contracts |
3,557 | — | 3,557 | 2,795 | — | 2,795 | ||||||||||||||||||
|
Equity contracts |
207 | — | 207 | 188 | — | 188 | ||||||||||||||||||
|
Commodity contracts |
35 | — | 35 | 27 | — | 27 | ||||||||||||||||||
|
Credit derivatives |
72 | — | 72 | 84 | — | 84 | ||||||||||||||||||
|
Others |
2 | — | 2 | 2 | — | 2 | ||||||||||||||||||
|
|
|
|
|
|
|
|
|
|
|
|
|
|||||||||||||
|
Total derivative assets |
¥ | 12,585 | ¥ | — | ¥ | 12,585 | ¥ | 13,204 | ¥ | 1 | ¥ | 13,205 | ||||||||||||
|
|
|
|
|
|
|
|
|
|
|
|
|
|||||||||||||
|
Derivative liabilities: |
||||||||||||||||||||||||
|
Interest rate contracts |
¥ | 8,674 | ¥ | 17 | ¥ | 8,691 | ¥ | 9,896 | ¥ | — | ¥ | 9,896 | ||||||||||||
|
Foreign exchange contracts |
3,000 | — | 3,000 | 2,671 | — | 2,671 | ||||||||||||||||||
|
Equity contracts |
227 | — | 227 | 183 | — | 183 | ||||||||||||||||||
|
Commodity contracts |
33 | — | 33 | 27 | — | 27 | ||||||||||||||||||
|
Credit derivatives |
71 | — | 71 | 69 | — | 69 | ||||||||||||||||||
|
Others (6) |
(145 | ) | — | (145 | ) | (136 | ) | — | (136 | ) | ||||||||||||||
|
|
|
|
|
|
|
|
|
|
|
|
|
|||||||||||||
|
Total derivative liabilities |
¥ | 11,860 | ¥ | 17 | ¥ | 11,877 | ¥ | 12,710 | ¥ | — | ¥ | 12,710 | ||||||||||||
|
|
|
|
|
|
|
|
|
|
|
|
|
|||||||||||||
Notes:
| (1) | The fair value of derivative instruments is presented on a gross basis even when derivative instruments are subject to master netting agreements. Cash collateral payable and receivable associated with derivative instruments are not added to or netted against the fair value amounts. |
| (2) | The derivative instruments which are not designated as a hedging instrument are held for trading and risk management purposes, and are presented in Trading account assets/liabilities except for (6). |
| (3) | The MUFG Group adopts hedging strategies and applies hedge accounting to certain derivative transactions entered into by MUFG Americas Holdings. The derivative instruments which are designated as hedging instruments are presented in Other assets or Other liabilities on the accompanying consolidated balance sheets. |
| (4) | This table does not include contracts with embedded derivatives for which the fair value option has been elected. |
| (5) | For more information about fair value measurement and assumptions used to measure the fair value of derivatives, see Note 32. |
| (6) | Others include mainly bifurcated embedded derivatives carried at fair value, which are presented in Deposits and Long-term debt. |
F-112
Table of Contents
MITSUBISHI UFJ FINANCIAL GROUP, INC. AND SUBSIDIARIES
NOTES TO CONSOLIDATED FINANCIAL STATEMENTS—(Continued)
Impact of Derivatives and Hedged Items on the Consolidated Statements of Income and Accumulated OCI
The following tables provide more detailed information regarding the derivative-related impact on the accompanying consolidated statements of income and Accumulated OCI by accounting designation for the fiscal years ended March 31, 2017, 2018 and 2019:
Gains and losses for trading and risk management derivatives (not designated as hedging instruments)
|
Trading and risk management derivatives gains and losses
(Not designated as hedging instruments) |
||||||||||||||||||||||||||||||||||||
| 2017 | 2018 | 2019 | ||||||||||||||||||||||||||||||||||
|
Foreign
exchange gains (losses) —net |
Trading
account profits (losses) —net |
Total |
Foreign
exchange gains (losses) —net |
Trading
account profits (losses) —net |
Total |
Foreign
exchange gains (losses) —net |
Trading
account profits (losses) —net |
Total | ||||||||||||||||||||||||||||
| (in billions) | ||||||||||||||||||||||||||||||||||||
|
Interest rate contracts |
¥ | — | ¥ | (137 | ) | ¥ | (137 | ) | ¥ | — | ¥ | 51 | ¥ | 51 | ¥ | — | ¥ | 6 | ¥ | 6 | ||||||||||||||||
|
Foreign exchange contracts |
(183 | ) | — | (183 | ) | (163 | ) | — | (163 | ) | (347 | ) | — | (347 | ) | |||||||||||||||||||||
|
Equity contracts |
— | (153 | ) | (153 | ) | — | (260 | ) | (260 | ) | — | 80 | 80 | |||||||||||||||||||||||
|
Commodity contracts |
— | 2 | 2 | — | 6 | 6 | — | — | — | |||||||||||||||||||||||||||
|
Credit derivatives |
— | 18 | 18 | — | (2 | ) | (2 | ) | — | (40 | ) | (40 | ) | |||||||||||||||||||||||
|
Others |
— | (55 | ) | (55 | ) | 3 | (22 | ) | (19 | ) | (7 | ) | (70 | ) | (77 | ) | ||||||||||||||||||||
|
|
|
|
|
|
|
|
|
|
|
|
|
|
|
|
|
|
|
|||||||||||||||||||
|
Total |
¥ | (183 | ) | ¥ | (325 | ) | ¥ | (508 | ) | ¥ | (160 | ) | ¥ | (227 | ) | ¥ | (387 | ) | ¥ | (354) | ¥ | (24 | ) | ¥ | (378 | ) | ||||||||||
|
|
|
|
|
|
|
|
|
|
|
|
|
|
|
|
|
|
|
|||||||||||||||||||
Gains and losses for derivatives designated as cash flow hedges
| 2017 | 2018 | 2019 | ||||||||||
| (in billions) | ||||||||||||
|
Losses recognized in Accumulated OCI on derivative instruments (Effective portion) |
||||||||||||
|
Interest rate contracts |
¥ | (3 | ) | ¥ | (4 | ) | ¥ | (11 | ) | |||
|
|
|
|
|
|
|
|||||||
|
Total |
¥ | (3 | ) | ¥ | (4 | ) | ¥ | (11 | ) | |||
|
|
|
|
|
|
|
|||||||
|
Gains (losses) reclassified from Accumulated OCI into income (Effective portion) |
||||||||||||
|
Interest rate contracts (1) |
¥ | 18 | ¥ | 8 | ¥ | (4 | ) | |||||
|
|
|
|
|
|
|
|||||||
|
Total |
¥ | 18 | ¥ | 8 | ¥ | (4 | ) | |||||
|
|
|
|
|
|
|
|||||||
Note:
| (1) | Included in Interest income. |
Embedded Derivatives
Features embedded in other non-derivative hybrid contracts are separated from the host contracts and measured at fair value when they are not clearly and closely related to the host contracts and meet the definition of a derivative. The change in the fair value of such an embedded derivative is recognized currently in earnings, unless it qualifies as a hedge. The fair value of the embedded derivative is presented in the accompanying consolidated balance sheets with the host contract.
F-113
Table of Contents
MITSUBISHI UFJ FINANCIAL GROUP, INC. AND SUBSIDIARIES
NOTES TO CONSOLIDATED FINANCIAL STATEMENTS—(Continued)
Credit Derivatives
The MUFG Group enters into credit derivatives to manage its credit risk exposure, to facilitate client transactions, and for proprietary trading purposes, under which they provide the counterparty protection against the risk of default on a set of debt obligations issued by a specified reference entity or entities. Types of such credit derivatives primarily include single name credit default swaps, index and basket credit default swaps. The MUFG Group will have to perform under a credit derivative if a credit event as defined under the contract occurs. Such credit events include bankruptcy, dissolution or insolvency of the referenced entity, default and restructuring of the obligations of the referenced entity. The MUFG Group’s counterparties are banks, broker-dealers, insurance and other financial institutions. The contractual or notional amounts of these credit derivatives represent the maximum potential amounts of future payments without consideration of possible recoveries under recourse provisions or from collateral held or pledged.
The table below summarizes certain information regarding protection sold through credit derivatives as of March 31, 2018 and 2019:
| Protection sold | ||||||||||||||||||||
|
Maximum potential/Notional amount
by expiration period |
Fair value | |||||||||||||||||||
|
At March 31, 2018: |
1 year
or less |
1-5 years |
Over
5 years |
Total |
(Asset)/
Liability (1) |
|||||||||||||||
| (in millions) | ||||||||||||||||||||
|
Single name credit default swaps: |
||||||||||||||||||||
|
Investment grade (2) |
¥ | 440,610 | ¥ | 1,199,269 | ¥ | 85,094 | ¥ | 1,724,973 | ¥ | (33,389 | ) | |||||||||
|
Non-investment grade |
168,102 | 259,497 | 4,775 | 432,374 | (3,431 | ) | ||||||||||||||
|
Not rated |
— | 45,425 | — | 45,425 | 8 | |||||||||||||||
|
|
|
|
|
|
|
|
|
|
|
|||||||||||
|
Total |
608,712 | 1,504,191 | 89,869 | 2,202,772 | (36,812 | ) | ||||||||||||||
|
|
|
|
|
|
|
|
|
|
|
|||||||||||
|
Index and basket credit default swaps held by BK: |
||||||||||||||||||||
|
Investment grade (2) |
3,000 | 118,359 | 37,781 | 159,140 | (3,381 | ) | ||||||||||||||
|
Non-investment grade |
7,000 | 82,867 | — | 89,867 | (1,311 | ) | ||||||||||||||
|
|
|
|
|
|
|
|
|
|
|
|||||||||||
|
Total |
10,000 | 201,226 | 37,781 | 249,007 | (4,692 | ) | ||||||||||||||
|
|
|
|
|
|
|
|
|
|
|
|||||||||||
|
Index and basket credit default swaps held by SCHD: |
||||||||||||||||||||
|
Investment grade (2) |
15,000 | 108,000 | 6,000 | 129,000 | (2,641 | ) | ||||||||||||||
|
Non-investment grade |
12,000 | 29,000 | — | 41,000 | (749 | ) | ||||||||||||||
|
Not rated |
42,439 | 260,951 | 1,863 | 305,253 | (16,294 | ) | ||||||||||||||
|
|
|
|
|
|
|
|
|
|
|
|||||||||||
|
Total |
69,439 | 397,951 | 7,863 | 475,253 | (19,684 | ) | ||||||||||||||
|
|
|
|
|
|
|
|
|
|
|
|||||||||||
|
Total index and basket credit default swaps sold |
79,439 | 599,177 | 45,644 | 724,260 | (24,376 | ) | ||||||||||||||
|
|
|
|
|
|
|
|
|
|
|
|||||||||||
|
Total credit default swaps sold |
688,151 | 2,103,368 | 135,513 | 2,927,032 | (61,188 | ) | ||||||||||||||
|
|
|
|
|
|
|
|
|
|
|
|||||||||||
|
Other credit derivatives sold (3) |
||||||||||||||||||||
|
Investment grade |
— | 74,368 | — | 74,368 | (24 | ) | ||||||||||||||
|
|
|
|
|
|
|
|
|
|
|
|||||||||||
|
Total credit derivatives |
¥ | 688,151 | ¥ | 2,177,736 | ¥ | 135,513 | ¥ | 3,001,400 | ¥ | (61,212 | ) | |||||||||
|
|
|
|
|
|
|
|
|
|
|
|||||||||||
F-114
Table of Contents
MITSUBISHI UFJ FINANCIAL GROUP, INC. AND SUBSIDIARIES
NOTES TO CONSOLIDATED FINANCIAL STATEMENTS—(Continued)
| Protection sold | ||||||||||||||||||||
|
Maximum potential/Notional amount
by expiration period |
Fair value | |||||||||||||||||||
|
At March 31, 2019: |
1 year
or less |
1-5 years |
Over
5 years |
Total |
(Asset)/
Liability (1) |
|||||||||||||||
| (in millions) | ||||||||||||||||||||
|
Single name credit default swaps: |
||||||||||||||||||||
|
Investment grade (2) |
¥ | 378,527 | ¥ | 1,603,962 | ¥ | 145,689 | ¥ | 2,128,178 | ¥ | (30,303 | ) | |||||||||
|
Non-investment grade |
112,901 | 238,330 | 5,672 | 356,903 | (127 | ) | ||||||||||||||
|
Not rated |
— | 5,097 | — | 5,097 | (47 | ) | ||||||||||||||
|
|
|
|
|
|
|
|
|
|
|
|||||||||||
|
Total |
491,428 | 1,847,389 | 151,361 | 2,490,178 | (30,477 | ) | ||||||||||||||
|
|
|
|
|
|
|
|
|
|
|
|||||||||||
|
Index and basket credit default swaps held by BK: |
||||||||||||||||||||
|
Investment grade (2) |
— | 120,854 | — | 120,854 | (82 | ) | ||||||||||||||
|
Non-investment grade |
— | 101,001 | — | 101,001 | (2,010 | ) | ||||||||||||||
|
|
|
|
|
|
|
|
|
|
|
|||||||||||
|
Total |
— | 221,855 | — | 221,855 | (2,092 | ) | ||||||||||||||
|
|
|
|
|
|
|
|
|
|
|
|||||||||||
|
Index and basket credit default swaps held by SCHD: |
||||||||||||||||||||
|
Investment grade (2) |
13,000 | 194,618 | 8,000 | 215,618 | (3,853 | ) | ||||||||||||||
|
Non-investment grade |
— | — | — | — | — | |||||||||||||||
|
Not rated |
8,863 | 206,832 | 3,444 | 219,139 | (3,043 | ) | ||||||||||||||
|
|
|
|
|
|
|
|
|
|
|
|||||||||||
|
Total |
21,863 | 401,450 | 11,444 | 434,757 | (6,896 | ) | ||||||||||||||
|
|
|
|
|
|
|
|
|
|
|
|||||||||||
|
Total index and basket credit default swaps sold |
21,863 | 623,305 | 11,444 | 656,612 | (8,988 | ) | ||||||||||||||
|
|
|
|
|
|
|
|
|
|
|
|||||||||||
|
Total credit default swaps sold |
513,291 | 2,470,694 | 162,805 | 3,146,790 | (39,465 | ) | ||||||||||||||
|
|
|
|
|
|
|
|
|
|
|
|||||||||||
|
Other credit derivatives sold (3) |
||||||||||||||||||||
|
Investment grade |
77,693 | — | — | 77,693 | (620 | ) | ||||||||||||||
|
|
|
|
|
|
|
|
|
|
|
|||||||||||
|
Total credit derivatives |
¥ | 590,984 | ¥ | 2,470,694 | ¥ | 162,805 | ¥ | 3,224,483 | ¥ | (40,085 | ) | |||||||||
|
|
|
|
|
|
|
|
|
|
|
|||||||||||
Notes:
| (1) | Fair value amounts are shown on a gross basis prior to cash collateral or counterparty netting. |
| (2) | The MUFG Group considers ratings of Baa3/BBB- or higher to meet the definition of investment grade. |
| (3) | Other credit derivatives primarily consist of total return swaps. |
Single name credit default swaps —Single name credit default swap protects the buyer against the loss of principal on a bond or loan in case of a default by the issuer. The protection buyer pays a premium to the MUFG Group and is protected for the period of the credit default swap. As the seller of protection, the MUFG Group in turn will have to perform under a credit default swap if a credit event as defined under the contracts occurs. In order to provide an indication of the current payment/performance risk of the credit default swaps, the external credit ratings, primarily those provided by Moody’s and Standard & Poor’s (“S&P”), of the underlying reference entity of the credit default swaps are disclosed.
Index and basket credit default swaps —Index and basket credit default swaps are credit default swaps that reference multiple names through underlying baskets or portfolios of single name credit default swaps. Typically, in the event of a default on one of the underlying names, the MUFG Group, as the seller of protection, will have to pay a pro-rata portion of the total notional amount of the credit default index or basket contract. In order to provide an indication of the current payment/performance risk of these credit default swaps, MUFG Bank and Mitsubishi UFJ Securities Holdings rating scale based upon the entity’s internal ratings, which generally correspond to ratings defined by primarily Moody’s and S&P, of the underlying reference entities comprising the basket or index were calculated and disclosed.
F-115
Table of Contents
MITSUBISHI UFJ FINANCIAL GROUP, INC. AND SUBSIDIARIES
NOTES TO CONSOLIDATED FINANCIAL STATEMENTS—(Continued)
The MUFG Group may economically hedge its exposure to credit derivatives by entering into offsetting derivative contracts. The carrying value and notional amounts of credit protection sold in which the MUFG Group held purchased protection with identical underlying referenced entities were approximately ¥52 billion and ¥2,416 billion, respectively, at March 31, 2018, and approximately ¥35 billion and ¥2,687 billion, respectively, at March 31, 2019.
Collateral is held by the MUFG Group in relation to these instruments. Collateral requirements are determined at the counterparty level and cover numerous transactions and products as opposed to individual contracts.
Credit Risk, Liquidity Risk and Credit-risk-related Contingent Features
Certain derivative instruments held by the MUFG Group contain provisions that require the MUFG Group’s debt to maintain an investment grade credit rating from each of the major credit rating agencies. If the MUFG Group’s debt were to fall below investment grade, it would be in violation of these provisions, and the counterparties to the derivative instruments could request payments on early termination or demand immediate and ongoing full overnight collateralization on derivative instruments in net liability positions. The aggregate fair value of all derivative instruments with credit-risk-related contingent features that were in a liability position at March 31, 2018 and 2019 was approximately ¥0.7 trillion and ¥0.6 trillion, respectively, for which the MUFG Group has posted collateral of approximately ¥127 billion and ¥85 billion, respectively, in the normal course of business. The amount of additional collateral and early termination amount which could be requested if the MUFG Group’s debt falls below investment grade was ¥78 billion and ¥65 billion, respectively, as of March 31, 2018 and ¥84 billion and ¥56 billion, respectively, as of March 31, 2019.
| 25. | OBLIGATIONS UNDER GUARANTEES AND OTHER OFF-BALANCE SHEET INSTRUMENTS |
Obligations under Guarantees
The MUFG Group provides customers with a variety of guarantees and similar arrangements, including standby letters of credit, financial and performance guarantees, credit protection, liquidity facilities, other off-balance sheet credit-related support and similar instruments, in order to meet the customers’ financial and business needs. The tables below present the contractual or notional amounts of such guarantees at March 31, 2018 and 2019. The contractual or notional amounts of these instruments represent the maximum potential amounts of future payments without consideration of possible recoveries under recourse provisions or from collateral held or pledged.
For certain types of derivatives, such as written interest rate options and written currency options, the maximum potential future payments are unlimited. Accordingly, it is impracticable to estimate the maximum potential amount of future payments. As such, the notional amounts of the related contracts, other than the maximum potential payments, are included in the table.
The MUFG Group mitigates its credit risk exposure resulting from guarantees by utilizing various techniques, including collateralization in the form of cash, securities, and real estate properties based on management’s credit assessment of the guaranteed parties and the related credit profile. In order to manage the credit risk exposure, the MUFG Group also enters into sub-participation contracts with third parties who will fund a portion of the credit facility and bear its share of the loss to be incurred in the event that the customer fails to fulfill its obligations. The following table includes guarantees of ¥403.2 billion and ¥468.9 billion at March 31, 2018 and 2019, respectively, which are syndicated out to third parties. The contractual or notional
F-116
Table of Contents
MITSUBISHI UFJ FINANCIAL GROUP, INC. AND SUBSIDIARIES
NOTES TO CONSOLIDATED FINANCIAL STATEMENTS—(Continued)
amounts summarized in the following table do not necessarily bear any direct relationship to the future actual credit exposure, primarily because of risk management techniques of the MUFG Group.
|
Maximum
potential/ Contractual or Notional amount |
Amount by expiration period |
|||||||||||||||
|
At March 31, 2018: |
1 year
or less |
1-5 years |
Over
5 years |
|||||||||||||
| (in billions) | ||||||||||||||||
|
Standby letters of credit and financial guarantees |
¥ | 4,311 | ¥ | 3,115 | ¥ | 850 | ¥ | 346 | ||||||||
|
Performance guarantees |
3,051 | 2,144 | 801 | 106 | ||||||||||||
|
Derivative instruments (1) |
40,513 | 15,230 | 18,314 | 6,969 | ||||||||||||
|
Liabilities of trust accounts |
9,444 | 6,017 | 558 | 2,869 | ||||||||||||
|
Others |
22 | 2 | 4 | 16 | ||||||||||||
|
|
|
|
|
|
|
|
|
|||||||||
|
Total |
¥ | 57,341 | ¥ | 26,508 | ¥ | 20,527 | ¥ | 10,306 | ||||||||
|
|
|
|
|
|
|
|
|
|||||||||
|
Maximum
potential/ Contractual or Notional amount |
Amount by expiration period |
|||||||||||||||
|
At March 31, 2019: |
1 year
or less |
1-5 years |
Over
5 years |
|||||||||||||
| (in billions) | ||||||||||||||||
|
Standby letters of credit and financial guarantees |
¥ | 3,901 | ¥ | 2,792 | ¥ | 838 | ¥ | 271 | ||||||||
|
Performance guarantees |
3,256 | 2,332 | 784 | 140 | ||||||||||||
|
Derivative instruments (1) |
58,025 | 29,734 | 20,921 | 7,370 | ||||||||||||
|
Liabilities of trust accounts |
11,520 | 5,884 | 420 | 5,216 | ||||||||||||
|
Others |
53 | 12 | 13 | 28 | ||||||||||||
|
|
|
|
|
|
|
|
|
|||||||||
|
Total |
¥ | 76,755 | ¥ | 40,754 | ¥ | 22,976 | ¥ | 13,025 | ||||||||
|
|
|
|
|
|
|
|
|
|||||||||
Note:
| (1) | Credit derivatives sold by the MUFG Group are excluded from this presentation. |
Nature of Guarantee Contracts
Standby letters of credit and financial guarantees generally include an obligation of an issuer or a designated third-party to guarantee the performance of the customer to the beneficiary under the terms of contracts such as lending contracts and other similar financial transactions. The MUFG Group is required to make payments to the guaranteed parties in the event that the customers fail to fulfill the obligations under the contracts. The guarantees whose contractual maturities are over 5 years are mainly comprised of guarantees of housing loans.
Performance guarantees are contracts that contingently require the MUFG Group to make payments to the guaranteed party based on another party’s failure to perform under an obligating agreement, except financial obligation. For example, performance guarantees include guarantees of completion of construction projects.
Derivative instruments that are deemed to be included within the definition of guarantees as prescribed in the guidance on guarantees include certain written options and credit default swaps. In order for the MUFG Group to determine if those derivative instruments meet the definition of guarantees, as prescribed in the guidance on guarantees, the MUFG Group has to track whether the counterparties are actually exposed to losses that will result from the adverse change in the underlyings. Accordingly, the MUFG Group has disclosed information on all credit default swaps and certain written options for which there is a possibility of meeting the definition of guarantees as prescribed in the guidance on guarantees, regardless of whether the counterparties
F-117
Table of Contents
MITSUBISHI UFJ FINANCIAL GROUP, INC. AND SUBSIDIARIES
NOTES TO CONSOLIDATED FINANCIAL STATEMENTS—(Continued)
have assets or liabilities related to the underlyings of the derivatives. However, credit derivatives sold by the MUFG Group at March 31, 2018 and 2019 are excluded from this presentation, as they are disclosed in Note 24.
Liabilities of trust accounts represent the trustee’s potential responsibility for temporary payments to creditors of liabilities of trust accounts making use of funds of the MUFG Group, unless there are certain agreements with trust creditors that have provisions limiting the MUFG Group’s exposure as a trustee to the trust account assets. A trust may incur external liabilities to obtain certain services during the terms of the trust arrangement. While in principle, any liabilities of a trust are payable by the trust account and its beneficiaries. A trustee’s responsibility may be interpreted to encompass temporary payments for the trust account liabilities when the trust account does not maintain sufficient liquidity available for such liabilities unless the agreement with trust creditors limits the trustee’s exposure to the trust account assets. At March 31, 2018 and 2019, there were liabilities of ¥9,444 billion and ¥11,520 billion, respectively, in the segregated records of trust accounts including the amounts related to liabilities with provisions limiting trustee responsibility. Liabilities of trust accounts principally includes obligations to return collateral under security lending transactions. The MUFG Group has experienced no significant losses on such responsibilities and its exposure to the risk associated with the temporary payments is judged to be remote because trust account liabilities are generally covered by the corresponding trust account assets. The MUFG Group continuously monitors the liabilities of trust accounts and assesses the trust account’s ability to perform its obligations to prevent any unfavorable outcomes; the MUFG Group claims its recourse for its temporary payments against the trust account assets and the beneficiaries.
Carrying Amount
At March 31, 2018 and 2019, the carrying amounts of the liabilities related to guarantees and similar instruments set forth above were ¥1,110,505 million and ¥1,051,297 million, respectively, which are included in Other liabilities and Trading account liabilities. The guarantees and similar instruments comprising the largest components of the total were options sold in the amount of ¥1,069,156 million and ¥1,005,951 million as of March 31, 2018 and 2019, respectively. Credit derivatives sold by the MUFG Group at March 31, 2018 and 2019 are excluded from this presentation, as they are disclosed in Note 24. In addition, Other liabilities include an allowance for off-balance sheet instruments of ¥31,101 million and ¥96,946 million at March 31, 2018 and 2019, respectively, related to these transactions.
Performance Risk
The MUFG Group monitors performance risk of its guarantees using the same credit rating system utilized for estimating probabilities of default with its loan portfolio. The MUFG Group’s credit rating system is consistent with both the method of evaluating credit risk under Basel III and those of third-party credit rating agencies. On certain underlying referenced credits or entities, ratings are not available. Such referenced credits are included in the “Not rated” category in the following tables.
F-118
Table of Contents
MITSUBISHI UFJ FINANCIAL GROUP, INC. AND SUBSIDIARIES
NOTES TO CONSOLIDATED FINANCIAL STATEMENTS—(Continued)
Presented in the tables below is the maximum potential amount of future payments classified based upon internal credit ratings as of March 31, 2018 and 2019. The determination of the maximum potential future payments is based on the notional amount of the guarantees without consideration of possible recoveries under recourse provisions or from collateral held or pledged. Such amounts do not represent the anticipated losses, if any, on these guarantees.
| Amount by borrower grade | ||||||||||||||||||||
|
At March 31, 2018: |
Maximum
potential/ Contractual or Notional amount |
Normal |
Close
Watch (1) |
Likely to
become Bankrupt or Legally/ Virtually Bankrupt (2) |
Not
rated |
|||||||||||||||
| (in billions) | ||||||||||||||||||||
|
Standby letters of credit and financial guarantees |
¥ | 4,311 | ¥ | 4,211 | ¥ | 83 | ¥ | 13 | ¥ | 4 | ||||||||||
|
Performance guarantees |
3,051 | 2,910 | 113 | 5 | 23 | |||||||||||||||
|
|
|
|
|
|
|
|
|
|
|
|||||||||||
|
Total |
¥ | 7,362 | ¥ | 7,121 | ¥ | 196 | ¥ | 18 | ¥ | 27 | ||||||||||
|
|
|
|
|
|
|
|
|
|
|
|||||||||||
| Amount by borrower grade | ||||||||||||||||||||
|
At March 31, 2019: |
Maximum
potential/ Contractual or Notional amount |
Normal |
Close
Watch (1) |
Likely to
become Bankrupt or Legally/ Virtually Bankrupt (2) |
Not
rated |
|||||||||||||||
| (in billions) | ||||||||||||||||||||
|
Standby letters of credit and financial guarantees |
¥ | 3,901 | ¥ | 3,779 | ¥ | 98 | ¥ | 21 | ¥ | 3 | ||||||||||
|
Performance guarantees |
3,256 | 3,070 | 79 | 78 | 29 | |||||||||||||||
|
|
|
|
|
|
|
|
|
|
|
|||||||||||
|
Total |
¥ | 7,157 | ¥ | 6,849 | ¥ | 177 | ¥ | 99 | ¥ | 32 | ||||||||||
|
|
|
|
|
|
|
|
|
|
|
|||||||||||
Notes:
| (1) | Borrowers classified as Close Watch represent those that require close monitoring as the borrower has begun to exhibit elements of potential concern with respect to its business performance and financial condition, the borrower has begun to exhibit elements of serious concern with respect to its business performance and financial condition, including business problems requiring long-term solutions, or the borrower’s loans are TDRs or loans contractually past due 90 days or more for special reasons. |
| (2) | Borrowers classified as Likely to become Bankrupt or Legally/Virtually Bankrupt represent those that have a higher probability of default than those categorized as Close Watch due to serious debt repayment problems with poor progress in achieving restructuring plans, the borrower being considered virtually bankrupt with no prospects for an improvement in business operations, or the borrower being legally bankrupt with no prospects for continued business operations because of non-payment, suspension of business, voluntary liquidation or filing for legal liquidation. |
The guarantees the MUFG Group does not classify based upon internal credit ratings are as follows.
The MUFG Group records all derivative contracts at fair value. Aggregate market risk limits have been established, and market risk measures are routinely monitored against these limits. The MUFG Group also manages its exposure to these derivative contracts through a variety of risk mitigation strategies, including, but not limited to, offsetting economic hedge positions. The MUFG Group expects the risk of loss to be remote and believes that the notional amounts of the derivative contracts generally exceed its exposure.
Liabilities of trust accounts represent the trustee’s potential responsibility for temporary payments to creditors of liabilities of trust accounts using funds of the MUFG Group. The MUFG Group has experienced no significant losses on such responsibilities and its exposure to the risk associated with the temporary payments is judged to be remote because trust account liabilities are generally covered by the corresponding trust account assets.
F-119
Table of Contents
MITSUBISHI UFJ FINANCIAL GROUP, INC. AND SUBSIDIARIES
NOTES TO CONSOLIDATED FINANCIAL STATEMENTS—(Continued)
The MUFG Group conducts securities lending transactions for institutional customers as a fully disclosed agent. At times, securities lending indemnifications are issued to guarantee that a security lending customer will be made whole in the event the borrower does not return the security subject to the lending agreement and collateral held is insufficient to cover the market value of the security. All lending transactions are collateralized, primarily by cash. At March 31, 2019, the MUFG Group had no exposure that would require it to pay under this securities lending indemnification, since the collateral market value exceeds the fair value of securities lent.
Other Off-balance Sheet Instruments
In addition to obligations under guarantees and similar arrangements set forth above, the MUFG Group issues other off-balance sheet instruments to meet the financial needs of its customers and for purposes other than trading. Such off-balance sheet instruments consist of lending-related commitments, including commitments to extend credit and commercial letters of credit that the MUFG Group provides to meet the financing needs of its customers. Once the MUFG Group issues these off-balance sheet instruments, the MUFG Group is required to extend credit to or make certain payments to the customers or beneficiaries specified pursuant to the underlying contracts unless otherwise provided in the contracts. Since many of these commitments expire without being drawn upon, the total commitment amounts do not necessarily represent future cash requirements. At March 31, 2019, approximately 64% of these commitments will expire within one year, 33% from one year to five years and 3% after five years. The table below presents the contractual amounts with regard to such instruments at March 31, 2018 and 2019:
| 2018 | 2019 | |||||||
| (in billions) | ||||||||
|
Commitments to extend credit |
¥ | 80,090 | ¥ | 77,273 | ||||
|
Commercial letters of credit |
1,191 | 1,057 | ||||||
|
Commitments to make investments |
183 | 240 | ||||||
|
Other |
13 | 5 | ||||||
Commitments to extend credit, which generally have fixed expiration dates or other termination clauses, are legally binding agreements to lend to customers. Commitments are different from guarantees in that the commitments are generally revocable or have provisions that enable the MUFG Group to avoid payments in the event of violations of any conditions of the contracts and certain deterioration of the potential borrowers’ financial condition.
Commercial letters of credit, generally used for trade transactions, are typically secured by the underlying goods. The MUFG Group continually monitors the type and amount of collateral and other securities, and requires counterparties to provide additional collateral or guarantors as necessary.
Commitments to make investments are legally binding contracts to make additional contributions to corporate recovery or private equity investment funds in accordance with limited partnership agreements. Some of these funds, in which the MUFG Group has significant variable interests, are described in Note 26.
| 26. | VARIABLE INTEREST ENTITIES |
In the normal course of business, the MUFG Group has financial interests and other contractual obligations in various entities which may be deemed to be VIEs such as asset-backed conduits, various investment funds, special purpose entities created for structured financing, repackaged instruments, entities created for the securitization of the MUFG Group’s assets and trust arrangements.
F-120
Table of Contents
MITSUBISHI UFJ FINANCIAL GROUP, INC. AND SUBSIDIARIES
NOTES TO CONSOLIDATED FINANCIAL STATEMENTS—(Continued)
The following tables present the assets and liabilities of consolidated VIEs recorded on the accompanying consolidated balance sheets at March 31, 2018 and 2019:
|
Consolidated VIEs |
Consolidated assets | |||||||||||||||||||||||||||
|
At March 31, 2018: |
Total |
Cash and
due from banks |
Interest-earning
deposits in other banks |
Trading
account assets |
Investment
securities |
Loans |
All other
assets |
|||||||||||||||||||||
| (in millions) | ||||||||||||||||||||||||||||
|
Asset-backed conduits |
¥ | 7,390,029 | ¥ | 52,703 | ¥ | 44,902 | ¥ | 2,273 | ¥ | 1,777,017 | ¥ | 5,502,892 | ¥ | 10,242 | ||||||||||||||
|
Investment funds |
598,662 | — | 10,300 | 461,036 | 19,895 | — | 107,431 | |||||||||||||||||||||
|
Special purpose entities created for structured financing |
198,484 | — | 2,332 | — | — | 149,194 | 46,958 | |||||||||||||||||||||
|
Repackaged instruments |
152,781 | 520 | — | 17,376 | 92,210 | 42,632 | 43 | |||||||||||||||||||||
|
Securitization of the MUFG Group’s assets |
10,852,539 | — | — | — | — | 10,827,488 | 25,051 | |||||||||||||||||||||
|
Trust arrangements |
7,177,407 | — | 10,541 | 702 | 152,277 | 7,011,255 | 2,632 | |||||||||||||||||||||
|
Others |
44,247 | 361 | 14,236 | — | 42 | 12,963 | 16,645 | |||||||||||||||||||||
|
|
|
|
|
|
|
|
|
|
|
|
|
|
|
|||||||||||||||
|
Total consolidated assets before elimination |
26,414,149 | 53,584 | 82,311 | 481,387 | 2,041,441 | 23,546,424 | 209,002 | |||||||||||||||||||||
|
The amounts eliminated in consolidation |
(7,223,156 | ) | (53,454 | ) | (59,150 | ) | (3,804 | ) | (88,758 | ) | (6,996,317 | ) | (21,673 | ) | ||||||||||||||
|
|
|
|
|
|
|
|
|
|
|
|
|
|
|
|||||||||||||||
|
Total consolidated assets |
¥ | 19,190,993 | ¥ | 130 | ¥ | 23,161 | ¥ | 477,583 | ¥ | 1,952,683 | ¥ | 16,550,107 | ¥ | 187,329 | ||||||||||||||
|
|
|
|
|
|
|
|
|
|
|
|
|
|
|
|||||||||||||||
| Consolidated liabilities | ||||||||||||||||||||
| Total | Deposits |
Other short-term
borrowings |
Long-term
debt |
All other
liabilities |
||||||||||||||||
| (in millions) | ||||||||||||||||||||
|
Asset-backed conduits |
¥ | 7,409,190 | ¥ | — | ¥ | 5,176,663 | ¥ | 1,708,354 | ¥ | 524,173 | ||||||||||
|
Investment funds |
11,735 | — | — | — | 11,735 | |||||||||||||||
|
Special purpose entities created for structured financing |
115,353 | — | 587 | 112,054 | 2,712 | |||||||||||||||
|
Repackaged instruments |
148,928 | — | 12,676 | 132,012 | 4,240 | |||||||||||||||
|
Securitization of the MUFG Group’s assets |
10,816,672 | — | 5,000 | 10,806,145 | 5,527 | |||||||||||||||
|
Trust arrangements |
7,171,852 | 7,103,738 | 655 | — | 67,459 | |||||||||||||||
|
Others |
43,030 | — | 24,747 | 1,603 | 16,680 | |||||||||||||||
|
|
|
|
|
|
|
|
|
|
|
|||||||||||
|
Total consolidated liabilities before elimination |
25,716,760 | 7,103,738 | 5,220,328 | 12,760,168 | 632,526 | |||||||||||||||
|
The amounts eliminated in consolidation |
(15,347,991 | ) | — | (3,028,987 | ) | (12,248,680 | ) | (70,324 | ) | |||||||||||
|
The amount of liabilities with recourse to the general credit of the MUFG Group |
(9,745,330 | ) | (7,103,738 | ) | (2,162,890 | ) | (540 | ) | (478,162 | ) | ||||||||||
|
|
|
|
|
|
|
|
|
|
|
|||||||||||
|
Liabilities of consolidated VIEs for which creditors or beneficial interest holders do not have recourse to the general credit of the MUFG Group |
¥ | 623,439 | ¥ | — | ¥ | 28,451 | ¥ | 510,948 | ¥ | 84,040 | ||||||||||
|
|
|
|
|
|
|
|
|
|
|
|||||||||||
F-121
Table of Contents
MITSUBISHI UFJ FINANCIAL GROUP, INC. AND SUBSIDIARIES
NOTES TO CONSOLIDATED FINANCIAL STATEMENTS—(Continued)
|
Consolidated VIEs |
Consolidated assets | |||||||||||||||||||||||||||
|
At March 31, 2019: |
Total |
Cash and
due from banks |
Interest-earning
deposits in other banks |
Trading
account assets |
Investment
securities |
Loans |
All other
assets |
|||||||||||||||||||||
| (in millions) | ||||||||||||||||||||||||||||
|
Asset-backed conduits |
¥ | 6,698,146 | ¥ | 92,310 | ¥ | 26,101 | ¥ | 3,005 | ¥ | 1,424,444 | ¥ | 5,124,462 | ¥ | 27,824 | ||||||||||||||
|
Investment funds |
680,922 | — | 14,113 | 477,239 | 18,118 | — | 171,452 | |||||||||||||||||||||
|
Special purpose entities created for structured financing |
203,458 | — | 2,214 | — | — | 127,243 | 74,001 | |||||||||||||||||||||
|
Repackaged instruments |
279,327 | 506 | — | 53,346 | 137,509 | 86,753 | 1,213 | |||||||||||||||||||||
|
Securitization of the MUFG Group’s assets |
10,208,496 | — | — | — | — | 10,183,624 | 24,872 | |||||||||||||||||||||
|
Trust arrangements |
7,888,210 | — | 8,953 | 202 | 311,412 | 7,565,862 | 1,781 | |||||||||||||||||||||
|
Others |
34,303 | 362 | 1,635 | — | 42 | 9,699 | 22,565 | |||||||||||||||||||||
|
|
|
|
|
|
|
|
|
|
|
|
|
|
|
|||||||||||||||
|
Total consolidated assets before elimination |
25,992,862 | 93,178 | 53,016 | 533,792 | 1,891,525 | 23,097,643 | 323,708 | |||||||||||||||||||||
|
The amounts eliminated in consolidation |
(7,772,776 | ) | (93,171 | ) | (29,361 | ) | (5,102 | ) | (63,331 | ) | (7,552,315 | ) | (29,496 | ) | ||||||||||||||
|
|
|
|
|
|
|
|
|
|
|
|
|
|
|
|||||||||||||||
|
Total consolidated assets |
¥ | 18,220,086 | ¥ | 7 | ¥ | 23,655 | ¥ | 528,690 | ¥ | 1,828,194 | ¥ | 15,545,328 | ¥ | 294,212 | ||||||||||||||
|
|
|
|
|
|
|
|
|
|
|
|
|
|
|
|||||||||||||||
| Consolidated liabilities | ||||||||||||||||||||
| Total | Deposits |
Other short-term
borrowings |
Long-term
debt |
All other
liabilities |
||||||||||||||||
| (in millions) | ||||||||||||||||||||
|
Asset-backed conduits |
¥ | 6,691,362 | ¥ | — | ¥ | 4,678,588 | ¥ | 1,552,572 | ¥ | 460,202 | ||||||||||
|
Investment funds |
6,852 | — | — | 5,158 | 1,694 | |||||||||||||||
|
Special purpose entities created for structured financing |
114,469 | — | 609 | 111,523 | 2,337 | |||||||||||||||
|
Repackaged instruments |
277,179 | — | 48,014 | 174,215 | 54,950 | |||||||||||||||
|
Securitization of the MUFG Group’s assets |
10,167,632 | — | — | 10,162,231 | 5,401 | |||||||||||||||
|
Trust arrangements |
7,881,332 | 7,616,575 | — | — | 264,757 | |||||||||||||||
|
Others |
32,584 | — | 8,611 | 1,474 | 22,499 | |||||||||||||||
|
|
|
|
|
|
|
|
|
|
|
|||||||||||
|
Total consolidated liabilities before elimination |
25,171,410 | 7,616,575 | 4,735,822 | 12,007,173 | 811,840 | |||||||||||||||
|
The amounts eliminated in consolidation |
(14,676,389 | ) | (50,396 | ) | (2,996,041 | ) | (11,517,019 | ) | (112,933 | ) | ||||||||||
|
The amount of liabilities with recourse to the general credit of the MUFG Group |
(9,922,307 | ) | (7,566,179 | ) | (1,719,246 | ) | (121 | ) | (636,761 | ) | ||||||||||
|
|
|
|
|
|
|
|
|
|
|
|||||||||||
|
Liabilities of consolidated VIEs for which creditors or beneficial interest holders do not have recourse to the general credit of the MUFG Group |
¥ | 572,714 | ¥ | — | ¥ | 20,535 | ¥ | 490,033 | ¥ | 62,146 | ||||||||||
|
|
|
|
|
|
|
|
|
|
|
|||||||||||
In general, the creditors or beneficial interest holders of consolidated VIEs have recourse only to the assets of those VIEs of which they are creditors or beneficial interest holders, and do not have recourse to other assets of the MUFG Group, except where the MUFG Group is also contractually required to provide credit enhancement or program-wide liquidity.
F-122
Table of Contents
MITSUBISHI UFJ FINANCIAL GROUP, INC. AND SUBSIDIARIES
NOTES TO CONSOLIDATED FINANCIAL STATEMENTS—(Continued)
The following tables present the total assets of non-consolidated VIEs, the maximum exposure to loss resulting from the MUFG Group’s involvement with non-consolidated VIEs and the assets and liabilities which relate to the MUFG’s variable interests in non-consolidated VIEs at March 31, 2018 and 2019:
|
Non-consolidated VIEs |
On-balance sheet assets |
On-balance sheet
liabilities |
||||||||||||||||||||||||||||||||||
|
At March 31, 2018: |
Total assets |
Maximum
exposure |
Total |
Trading
account assets |
Investment
securities |
Loans |
All
other assets |
Total |
All other
liabilities |
|||||||||||||||||||||||||||
| (in millions) | ||||||||||||||||||||||||||||||||||||
|
Asset-backed conduits |
¥ | 29,011,749 | ¥ | 5,721,627 | ¥ | 4,645,697 | ¥ | 620 | ¥ | 1,541,591 | ¥ | 3,103,486 | ¥ | — | ¥ | — | ¥ | — | ||||||||||||||||||
|
Investment funds |
45,090,381 | 1,776,366 | 1,525,127 | 213,722 | 891,062 | 413,855 | 6,488 | 17,919 | 17,919 | |||||||||||||||||||||||||||
|
Special purpose entities created for structured financing |
35,437,349 | 4,016,999 | 3,193,621 | 309,560 | 116,961 | 2,697,126 | 69,974 | 7,217 | 7,217 | |||||||||||||||||||||||||||
|
Repackaged instruments |
10,212,933 | 2,576,619 | 2,487,377 | 759,591 | 1,421,716 | 236,852 | 69,218 | — | — | |||||||||||||||||||||||||||
|
Others |
49,582,444 | 3,760,375 | 2,740,529 | 94,882 | 61,192 | 2,482,141 | 102,314 | 24,830 | 24,830 | |||||||||||||||||||||||||||
|
|
|
|
|
|
|
|
|
|
|
|
|
|
|
|
|
|
|
|||||||||||||||||||
|
Total |
¥ | 169,334,856 | ¥ | 17,851,986 | ¥ | 14,592,351 | ¥ | 1,378,375 | ¥ | 4,032,522 | ¥ | 8,933,460 | ¥ | 247,994 | ¥ | 49,966 | ¥ | 49,966 | ||||||||||||||||||
|
|
|
|
|
|
|
|
|
|
|
|
|
|
|
|
|
|
|
|||||||||||||||||||
|
Non-consolidated VIEs |
On-balance sheet assets |
On-balance sheet
liabilities |
||||||||||||||||||||||||||||||||||
|
At March 31, 2019: |
Total assets |
Maximum
exposure |
Total |
Trading
account assets |
Investment
securities |
Loans |
All
other assets |
Total |
All other
liabilities |
|||||||||||||||||||||||||||
| (in millions) | ||||||||||||||||||||||||||||||||||||
|
Asset-backed conduits |
¥29,621,609 | ¥ | 6,221,274 | ¥ | 4,982,357 | ¥ | 659 | ¥ | 1,704,553 | ¥ | 3,277,145 | ¥ | — | ¥ | — | ¥ | — | |||||||||||||||||||
|
Investment funds |
67,750,419 | 1,952,676 | 1,753,823 | 187,166 | 1,253,705 | 304,310 | 8,642 | 206 | 206 | |||||||||||||||||||||||||||
|
Special purpose entities created for structured financing |
42,676,571 | 3,972,450 | 3,015,593 | 252,597 | 48,895 | 2,709,008 | 5,093 | 9,827 | 9,827 | |||||||||||||||||||||||||||
|
Repackaged instruments |
12,885,367 | 3,477,545 | 3,383,161 | 690,305 | 2,169,798 | 478,252 | 44,806 | 6,087 | 6,087 | |||||||||||||||||||||||||||
|
Others |
60,074,743 | 3,482,153 | 2,454,807 | 123,595 | 65,451 | 2,145,665 | 120,096 | 57,567 | 57,567 | |||||||||||||||||||||||||||
|
|
|
|
|
|
|
|
|
|
|
|
|
|
|
|
|
|
|
|||||||||||||||||||
|
Total |
¥ | 213,008,709 | ¥ | 19,106,098 | ¥ | 15,589,741 | ¥ | 1,254,322 | ¥ | 5,242,402 | ¥ | 8,914,380 | ¥ | 178,637 | ¥73,687 | ¥73,687 | ||||||||||||||||||||
|
|
|
|
|
|
|
|
|
|
|
|
|
|
|
|
|
|
|
|||||||||||||||||||
Maximum exposure to loss on each type of entity is determined based on the carrying amount of any on-balance sheet assets and any off-balance sheet liabilities held, net of any recourse liabilities. Therefore, the maximum exposure to loss represents the maximum loss the MUFG Group could possibly incur at each balance sheet date and does not reflect the likelihood of such a loss being incurred. The difference between the amount of on-balance sheet assets and the maximum exposure to loss primarily comprises the remaining undrawn commitments.
In February 2015, the FASB issued new guidance which amends the consolidation analysis under the current consolidation guidance. The amendments change the VIE analysis for limited partnerships and similar
F-123
Table of Contents
MITSUBISHI UFJ FINANCIAL GROUP, INC. AND SUBSIDIARIES
NOTES TO CONSOLIDATED FINANCIAL STATEMENTS—(Continued)
legal entities, the criteria for evaluating whether fees paid to a decision maker or a service provider are a variable interest, the effect of fee arrangements and related parties on the primary beneficiary determination, and rescind the indefinite deferral provision that affects the consolidation evaluation for certain investment funds. The MUFG group adopted this new accounting guidance on April 1, 2016, which resulted in the consolidation and deconsolidation of certain investment funds. The net increase in the MUFG Group’s consolidated assets, liabilities and Noncontrolling interests, were ¥628,236 million, ¥32,254 million and ¥595,982 million, respectively, as of April 1, 2016. The cumulative effect on retained earnings was a decrease of ¥3,873 million upon the adoption.
Asset-Backed Conduits
This category primarily comprises the following:
Multi-Seller Conduits (MUFG-sponsored Asset-Backed Commercial Paper (“ABCP”) Conduits and Other ABCP Conduits)
The MUFG Group administers several conduits under asset-backed financing programs under which the conduits purchase financial assets, primarily trade accounts receivable, from the MUFG Group’s customers by issuing short-term financing instruments, primarily commercial paper, to third-party investors. Under the asset-backed financing programs, the MUFG Group acts as an agent for the conduits, which enter into agreements with the MUFG Group’s customers where the customers transfer financial assets to the conduits in exchange for monetary consideration. The MUFG Group also underwrites commercial paper for the conduits that is secured by the assets held by them and provides program-wide liquidity and credit enhancement facilities to the conduits. The MUFG Group receives fees related to the services it provides to the conduits and the program-wide liquidity and credit enhancement. The MUFG Group considers itself to be the primary beneficiary of the multi-seller conduits because, as an agent and sponsor, the MUFG Group has the power to direct activities of the conduits that most significantly impact the conduits’ economic performance and also has the obligation to absorb losses of the conduits that could potentially be significant to the conduits through the program-wide liquidity and credit enhancement. Consequently, the MUFG Group consolidates the conduits.
In addition to the entities described above, the MUFG Group participates as a provider of financing to several conduits that are administered by third parties. Most of these conduits are established under a multi-seller asset-backed financing program and the MUFG Group provides financing along with other financial institutions. With respect to these conduits, the MUFG Group is not considered as the primary beneficiary because the MUFG Group’s participation in the conduits is only to provide financing along with other third-party financial institutions and it does not have the power to direct the activities of the conduits. Consequently, the MUFG Group does not consolidate the conduits.
Asset-Backed Conduits (MUFG-sponsored Asset-Backed Loan (“ABL”) Programs and Other Programs)
The MUFG Group administers several conduits under asset-backed financing programs where the MUFG Group provides financing to fund the conduits’ purchases of financial assets, comprising primarily trade accounts receivable, from its customers. The MUFG Group acts as an agent and sponsor for the conduits, which enter into agreements with the MUFG Group’s customers where the customers transfer assets to the conduits in exchange for monetary consideration. In most cases, the MUFG Group is the sole provider of financing that is secured by the assets held by the conduits. The MUFG Group considers itself to be the primary beneficiary of the conduits because, as an agent and sponsor for the conduits, the MUFG Group has the power to direct activities of the conduits, such as selection of the assets to be purchased and condition for purchases, and debt collection from the
F-124
Table of Contents
MITSUBISHI UFJ FINANCIAL GROUP, INC. AND SUBSIDIARIES
NOTES TO CONSOLIDATED FINANCIAL STATEMENTS—(Continued)
original obligors, that most significantly impact the conduits’ economic performance, and also has the obligation to absorb losses of the conduits that could potentially be significant to the conduits through financing it provides. Consequently, the MUFG Group consolidates the conduits.
In addition, the MUFG Group is involved with entities, which take in most cases the form of a trust, where originators of financial assets, which primarily comprise lease receivables, entrust the assets with trust banks and receive beneficial certificates of trusts in exchange. The originators then transfer the beneficiary certificates to the MUFG Group in exchange for cash. The originators of the financial assets entrusted continue to be involved in the assets as servicers. Because the originators are deemed to have the power to direct activities of the entities that most significantly impact the entities’ economic performance through their role as a servicer, the MUFG Group is not considered as the primary beneficiary of these entities. Consequently, the MUFG Group does not consolidate these entities.
The MUFG Group also participates as a provider of financing to the ABL programs that are managed by third parties. The MUFG Group is not considered as the primary beneficiary of the entities used in these programs as the MUFG Group’s participation in the entities is only to provide financing along with other third parties and it does not have the power to direct the activities of the entities. Consequently, the MUFG Group does not consolidate the entities used in these programs.
Investment Funds
This category primarily comprises the following:
Corporate Recovery Funds
These entities are established by fund managers, which are unrelated to the MUFG Group, for the purpose of investing in debt or equity instruments issued by distressed companies. After investment, the fund managers work closely with the management of the entities and attempt to enhance corporate value by various means including corporate restructuring and reorganization. Their exit strategies include, among others, sales to others and initial public offerings.
Typically, these entities take the form of a limited partnership which is entirely funded by general and limited partner interests. These partnerships are considered as VIEs unless the limited partners hold substantive kick-out rights or participating rights.
The MUFG Group mostly serves as a limited partner in corporate recovery funds that are considered as VIEs, and does not have the power to direct the activities of these funds that most significantly impact the economic performance of these funds. Therefore, the MUFG Group does not consider itself to be the primary beneficiary of these funds and does not consolidate them.
Private Equity Funds
The MUFG Group is involved in venture capital funds that are established by either the MUFG Group’s entities or fund managers unrelated to the MUFG Group. These entities have specific investment objectives in connection with their acquisition of equity interests, such as providing financing and other support to start-up businesses, medium and small entities in a particular geographical area, and to companies with certain technology or companies in a high-growth industry.
F-125
Table of Contents
MITSUBISHI UFJ FINANCIAL GROUP, INC. AND SUBSIDIARIES
NOTES TO CONSOLIDATED FINANCIAL STATEMENTS—(Continued)
These entities typically take the form of a limited partnership and usually are entirely funded by general and limited partner interests. These partnerships are considered as VIEs unless the limited partners hold substantive kick-out rights or participating rights.
The MUFG Group participates in these partnerships as a general partner or limited partner. The MUFG Group consolidates these funds, which are considered as VIEs, if the MUFG Group has the power to direct the activities of these funds that most significantly impact the economic performance of these funds, and also has the obligation to absorb losses of these funds that could potentially be significant to these funds or the right to receive benefits from these funds that could potentially be significant to these funds.
Investment Trusts
The MUFG Group invests in investment trusts that are professionally managed collective investment schemes which pool money from many investors and invest in, among others, equity and debt securities. Most of these funds take the form of a trust where there is a separation in investment decisions, which is assumed by an investment manager who has no investment in a trust, and ownership through beneficiary interests issued by a trust are owned by investors. Therefore, these investment trusts are considered as VIEs. The MUFG Group consolidates these funds if the MUFG Group has the power to direct the activities of these funds that most significantly impact the economic performance of these funds, and also has the obligation to absorb losses of these funds that could potentially be significant to these funds or the right to receive benefits from these funds that could potentially be significant to these funds.
Buy-out Financing Vehicles
The MUFG Group provides financing to buy-out vehicles. The buy-out vehicles are established by equity investments from, among others, private equity funds or the management of target companies for the purpose of purchasing the equity shares of target companies. Along with other financial institutions, the MUFG Group provides financing to the buy-out vehicles in the form of loans. While the buy-out vehicles’ equity is normally substantive in its amount and the rights and obligations associated with it, in some cases, the vehicles have equity that is insufficient to absorb expected variability primarily because the amount provided by equity investors is nominal in nature. These vehicles engage in non-investment activities, and are considered as VIEs. In most cases, the MUFG Group’s participation in these vehicles is only to provide financing to the vehicles, and the power to direct the activities that most significantly impact the economic performance of the vehicles is held by the management of target companies. As a result, the MUFG Group is not considered as the primary beneficiary of these vehicles and does not consolidate them.
Other Investment Funds
The MUFG Group’s investments in VIEs through MUFG Americas Holdings primarily consist of equity investments in low-income housing credit (“LIHC”) structures, designed to generate a return primarily through the realization of federal tax credits. MUFG Americas Holdings considers itself as the primary beneficiary of certain types of LIHC investments.
LIHC Unguaranteed Syndicated Investment Funds
MUFG Americas Holdings creates the investment funds, serves as the managing investor member, and sells limited investor member interests to third parties. MUFG Americas Holdings receives benefits through income from the structuring of these funds, servicing fees for managing the funds and, as an investor member, tax
F-126
Table of Contents
MITSUBISHI UFJ FINANCIAL GROUP, INC. AND SUBSIDIARIES
NOTES TO CONSOLIDATED FINANCIAL STATEMENTS—(Continued)
benefits and tax credits to reduce the MUFG Americas Holdings tax liability. MUFG Americas Holdings considers itself to be the primary beneficiary and consolidates them upon adoption of the current guidance because, as a sponsor and managing member of the funds, it has the power to direct activities that most significantly impact the funds’ economic performance and also has the obligation to absorb losses of the funds that could potentially be significant to the funds.
LIHC Guaranteed Syndicated Investment Funds
MUFG Americas Holdings also forms limited liability companies, which in turn invest in LIHC operating partnerships, to create LIHC guaranteed syndicated investment funds. Interests in these funds are sold to third parties who pay a premium for a guaranteed return. MUFG Americas Holdings earns structuring fees from the sale of these funds and asset management fees. MUFG Americas Holdings serves as the funds’ sponsor and non-member asset manager, and also guarantees a minimum rate of return throughout the investment term, therefore, it directs the activities that most significantly impact the funds’ economic performance and also has an obligation to absorb losses pertaining to its minimum rate of return guarantee to investors. Therefore, the MUFG Group is considered as the primary beneficiary of these funds and consolidates them.
Special Purpose Entities Created for Structured Financing
This category primarily comprises the following:
Leasing Transaction Vehicles
These entities are established to raise funds to purchase or build equipment and machinery including, among others, commercial vessels, passenger and cargo aircraft, and production equipment for the purpose of leasing them to lessees who use the equipment and machinery as part of their business operations. These entities typically take the form of a limited partnership or a special purpose company where they fund their purchases of equipment and machinery via senior and subordinate financing. When entities take the form of a limited partnership, these entities are considered as VIEs unless limited partners hold substantive kick-out rights or participating rights. The entities considered as VIEs are typically funded only by senior financing or there is a guarantee provided to the senior financing by parties unrelated to those providing the senior financing. In most cases, the MUFG Group participates in the senior financing and does not participate in the subordinate financing or provide guarantees. Generally, because the MUFG Group’s participation in these entities is only to provide financing, it does not have the power to direct the activities of the entities that most significantly impact the economic performance of the entities. Therefore, the MUFG Group does not consider itself to be the primary beneficiary of these entities and does not consolidate them, except for limited circumstances where the MUFG Group is directly involved with the structuring of the transaction and has the power to direct the activities of the entities that most significantly impact the economic performance of the entities.
Project Financing Vehicles
These entities are established to raise funds in connection with, among others, production of natural resources, construction and development of urban infrastructure (including power plants and grids, highways and ports), and the development of real estate properties or complexes. These projects typically involve special purpose companies which issue senior and subordinate financing to raise funds in connection with the various projects. The subordinate financing is usually provided by parties that will ultimately make use of the assets constructed or developed. By contrast, the senior financing is typically provided by financial institutions, including the MUFG Group. Because the MUFG Group’s participation in these entities is only to provide
F-127
Table of Contents
MITSUBISHI UFJ FINANCIAL GROUP, INC. AND SUBSIDIARIES
NOTES TO CONSOLIDATED FINANCIAL STATEMENTS—(Continued)
financing, it does not have the power to direct the activities that most significantly impact the economic performance of these entities. Therefore, the MUFG Group is not considered as the primary beneficiary of these entities and does not consolidate them.
Sale-and-Leaseback Vehicles
The MUFG Group is involved with vehicles that acquire assets, primarily real estate, from the MUFG Group’s customers and other unrelated parties where the sellers of the assets continue to use the assets through leaseback agreements. These vehicles typically take the form of a limited partnership, and are considered as VIEs unless the limited partners hold substantive kick-out rights or participating rights. The subordinated financing of these vehicles considered as VIEs is usually provided by the sellers of the assets, with the MUFG Group providing senior financing for the vehicles. Because the MUFG Group’s participation in these vehicles is only to provide senior financing, it does not have the power to direct the activities that most significantly impact the economic performance of these vehicles. Therefore, the MUFG Group is not considered as the primary beneficiary and does not consolidate them.
Securitization of Client Real Estate Properties
These entities are established for the purpose of securitizing real estate properties held by the MUFG Group’s customers. In most cases, these entities take the form of a limited partnership or a special purpose company. When entities take the form of a limited partnership, these entities are considered as VIEs unless the limited partners hold substantive kick-out rights or participating rights. The entities considered as VIEs are typically funded by senior and subordinated financing where the original owners of the real estate properties provide the subordinated financing, primarily in the form of partnership interests or subordinated notes, and financial institutions, including the MUFG Group, provide senior financing in the form of senior loans. Because the MUFG Group’s participation in these vehicles is only to provide a portion of senior financing, it does not have the power to direct the activities that most significantly impact the economic performance of these entities. Therefore, the MUFG Group is not considered as the primary beneficiary and does not consolidate these entities.
Repackaged Instruments
This category primarily comprises the following:
Investments in Financially-Engineered Products
The MUFG Group is involved in special purpose entities that have been established to issue financial products through the engineering and repackaging of existing financial instruments such as collateralized debt obligations ( “ CDOs ” ). These entities are considered as VIEs because the holders of the equity investment at risk do not have the power to direct the activities that most significantly impact their economic performance. These entities are generally arranged and managed by parties that are not related to the MUFG Group. The MUFG Group’s involvement with the entities arranged and managed by third parties is for investment purposes. In these cases, the MUFG Group participates as one of many other investors and the MUFG Group typically holds investments in senior tranches or tranches with high credit ratings. Therefore, the MUFG Group does not have the power to direct activities of the entities that most significantly impact the entities’ economic performance, and thus is not considered as the primary beneficiary of these entities and does not consolidate these entities.
In certain instances, special purpose entities have been established and are managed by the MUFG Group. The MUFG Group’s involvement includes establishing and arranging the transaction and underwriting securities
F-128
Table of Contents
MITSUBISHI UFJ FINANCIAL GROUP, INC. AND SUBSIDIARIES
NOTES TO CONSOLIDATED FINANCIAL STATEMENTS—(Continued)
issued by the entities to general investors. For these entities, the MUFG Group has the power to direct activities that most significantly impact the economic performance and it has the obligation to absorb losses or receive benefits that could potentially be significant to the entities. As such, the MUFG Group considers itself as the primary beneficiary of these entities and consolidates them.
Investments in Securitized Financial Instruments
The MUFG Group holds investments in special purpose entities that issue securitized financial products. The assets held by the entities include credit card receivables and residential mortgage loans. These entities are established and managed by parties that are unrelated to the MUFG Group and the MUFG Group’s involvement with these entities is for its own investment purposes. In all cases, the MUFG Group participates as one of many other investors and the MUFG Group does not have the power to direct activities of the entities that most significantly impact the entities’ economic performance. Therefore, the MUFG Group is not considered as the primary beneficiary of these entities and does not consolidate them.
Securitization of the MUFG Group’s Assets
This category primarily comprises the following:
Securitization for issuing interests or financing
The MUFG Group establishes entities to securitize its own financial assets that include, among others, corporate and retail loans and lease receivables. The entities used for securitization, which typically take the form of a special purpose company or a trust, are established by the MUFG Group and, in most cases, issue senior and subordinate interests or financing. After securitization, the MUFG Group typically continues to service securitized assets as a servicer. The MUFG Group may also retain subordinate interests or financing or other interests. The MUFG Group is considered as the primary beneficiary and consolidates the entities used for securitization since it has the obligation to absorb losses through subordinate interests, and also has the power for determining and implementing policies as servicer that give it the ability to manage the entities’ assets that become delinquent or are in default in order to improve the economic performance of the entities.
Eligible beneficiary interests in housing loan trusts
The MUFG Group establishes trusts, which acquire the MUFG Group’s housing loans and in turn issue beneficiary interests to the MUFG Group, to pledge these beneficiary interests as collateral for borrowings from the Bank of Japan, as a result of the decision by the Bank of Japan on June 30, 2016 to accept these beneficial interests as collateral in the same way as it does for Japanese national government bonds. The MUFG Group is considered as the primary beneficiary and consolidates the trusts since it has the obligation to absorb losses through beneficiary interests, and also has the power for determining and implementing policies as servicer that give it the ability to manage housing loans owned by the trusts that become delinquent or are in default in order to improve the economic performance of the trusts.
Trust Arrangements
The MUFG Group offers, primarily through Mitsubishi UFJ Trust and Banking, a variety of trust products and services including securities investment trusts, pension trusts and trusts used as securitization vehicles. In a typical trust arrangement, however, the MUFG Group manages and administers assets on behalf of the customers in an agency, fiduciary and trust capacity and does not assume risks associated with the entrusted assets. The
F-129
Table of Contents
MITSUBISHI UFJ FINANCIAL GROUP, INC. AND SUBSIDIARIES
NOTES TO CONSOLIDATED FINANCIAL STATEMENTS—(Continued)
trusts are generally considered as VIEs because the trust beneficiaries, who provide all of the equity at risk, usually do not have power to direct the activities that most significantly impact its economic performance in the arrangements. The MUFG Group, however, is not considered as the primary beneficiary, except for the case mentioned below, because it merely receives fees for compensation for its services on terms that are customary for these activities and the fees are insignificant relative to the total amount of the trusts’ economic performance and variability. Therefore, the MUFG Group does not consolidate these entities.
With respect to the jointly operated designated money in trusts, Mitsubishi UFJ Trust and Banking pools money from investors and determines how best to invest it. In addition, certain investors, such as money reserve funds and investment funds, place excess funds in the jointly operated designated money trusts. Mitsubishi UFJ Trust and Banking typically invests in high-quality financial assets, including government bonds, corporate bonds and corporate loans including loans to Mitsubishi UFJ Trust and Banking and receives fees as compensation for services. In this role as a sponsor of these trusts’ Mitsubishi UFJ Trust and Banking provides guarantees under which it is required to compensate a loss on the stated principal of the trust beneficial interests. Mitsubishi UFJ Trust and Banking is considered as the primary beneficiary of these trusts’ because it is exposed to a potentially significant amount of losses and also has the power to direct activities of these trusts’ that most significantly impact their economic performance. Upon consolidation of the trusts, the certificates issued to the investors are accounted for as deposit liabilities as the products are structured and marketed to customers similar to Mitsubishi UFJ Trust and Banking’s term deposit products.
Mitsubishi UFJ Trust and Banking considers the likelihood of incurring losses on the stated principal guarantee to be highly remote. In the trusts’ operational history that extends over decades, the stated principal guarantee has never been called upon. The variability in fair value of the net assets of the trusts has been primarily affected by the fluctuations in interest rates, and the majority of such variability has been absorbed by investors or trust beneficiaries.
Others
This category primarily comprises the following:
Financing Vehicles of the MUFG Group’s Customers
The MUFG Group is involved with several entities that are established by the MUFG Group’s customers. These entities borrow funds from financial institutions and extend loans to their group entities. These entities effectively work as fund-raising vehicles for their respective group entities and enable the groups to achieve efficient financing by integrating their financing activities into a single entity. In all cases, the MUFG Group is not considered as the primary beneficiary because the MUFG Group’s participation in these entities is only to provide financing, and the customers effectively hold the power to direct activities of these entities that most significantly impact the economic performance of the entities. Consequently, the MUFG Group does not consolidate these entities.
Funding Vehicles
The MUFG Group has established several wholly-owned off-shore vehicles which issue securities, typically preferred stock that is fully guaranteed by the MUFG Group, to investors unrelated to the MUFG Group to fund purchases of debt instruments issued by the MUFG Group. These entities are considered as VIEs because the MUFG Group’s investment in the vehicles’ equity is not considered at risk and substantive as the entire amount raised by the vehicles was used to purchase debt instruments issued by the MUFG Group. Because the MUFG Group does not have variable interests in these vehicles, the MUFG Group does not consolidate these entities.
F-130
Table of Contents
MITSUBISHI UFJ FINANCIAL GROUP, INC. AND SUBSIDIARIES
NOTES TO CONSOLIDATED FINANCIAL STATEMENTS—(Continued)
Troubled Borrowers
During the normal course of business, the borrowers from the MUFG Group may experience financial difficulties and sometimes enter into certain transactions that require the MUFG Group to assess whether they would be considered as VIEs due to their difficult financial position. While in most cases such borrowers are not considered as VIEs when the transactions take place, in limited circumstances they are considered as VIEs due to insufficient equity investment at risk. In all cases, the MUFG Group is not considered as the primary beneficiary because the power to direct activities that most significantly impact the economic performance of the troubled borrowers resides with the management of the troubled borrowers, and the MUFG Group, as a lender, does not have power over or assume any role in management. Therefore, the MUFG Group does not consolidate these troubled borrowers.
| 27. | COMMITMENTS AND CONTINGENT LIABILITIES |
Lease Commitments
The MUFG Group leases certain technology systems, office space and equipment under noncancelable agreements which expire through the fiscal year 2048.
Future minimum rental commitments for noncancelable leases at March 31, 2019 were as follows:
|
Capital
leases |
Operating
leases |
|||||||
| (in millions) | ||||||||
|
Fiscal year ending March 31: |
||||||||
|
2020 |
¥ | 6,573 | ¥ | 94,422 | ||||
|
2021 |
5,957 | 81,431 | ||||||
|
2022 |
4,739 | 68,416 | ||||||
|
2023 |
3,287 | 56,471 | ||||||
|
2024 |
1,672 | 50,571 | ||||||
|
2025 and thereafter |
3,104 | 271,031 | ||||||
|
|
|
|
|
|||||
|
Total minimum lease payments |
¥ | 25,332 | ¥ | 622,342 | ||||
|
|
|
|||||||
|
Amount representing interest |
(2,797 | ) | ||||||
|
|
|
|||||||
|
Present value of minimum lease payments |
¥ | 22,535 | ||||||
|
|
|
|||||||
Total rental expense for the fiscal years ended March 31, 2017, 2018 and 2019 was ¥113,649 million, ¥119,208 million and ¥116,525million, respectively.
Repayment of Excess Interest
The Japanese government implemented regulatory reforms affecting the consumer lending industry. In December 2006, the Diet passed legislation to reduce the maximum permissible interest rate under the Act Regulating the Receipt of Contributions, the Receipt of Deposits, and Interest Rates from 29.2% per annum to 20% per annum. The reduction in interest rates was implemented in June 2010. The regulatory reforms also included amendments to the Money Lending Business Act which, effective June 18, 2010, abolished the so-called “gray-zone interest.” Gray-zone interest refers to interest rates exceeding the limits stipulated by the Interest Rate Restriction Act (between 15% per annum to 20% per annum depending on the amount of principal). Under the regulatory reforms, all interest rates for loans originated after this reform are subject to the lower limits
F-131
Table of Contents
MITSUBISHI UFJ FINANCIAL GROUP, INC. AND SUBSIDIARIES
NOTES TO CONSOLIDATED FINANCIAL STATEMENTS—(Continued)
imposed by the Interest Rate Restriction Act. Furthermore, the new regulations require stringent review procedures for consumer finance companies before lending, and with the exception of certain provisions, one of those new regulations introduces a limit on aggregate credit extensions to one-third of the borrower’s annual income.
Formerly, consumer finance companies were able to charge interest rates exceeding the limits stipulated by the Interest Rate Restriction Act so long as the payment was made voluntarily by the borrowers, and the lender complied with various notice and other requirements. Accordingly, MUFG’s consumer finance subsidiaries and equity method investees offered loans at interest rates above the Interest Rate Restriction Act. Upon the implementation of the regulatory reforms in June 2010, they lowered the interest rates for loans originated after this reform to below the Interest Rate Restriction Act.
In 2006, the Supreme Court of Japan passed decisions in a manner more favorable to borrowers requiring reimbursement of previously paid interest exceeding the limits stipulated by the Interest Rate Restriction Act in certain circumstances. Borrowers’ claims for reimbursement of excess interest arose after such decisions and other regulatory changes. The MUFG Group maintains an allowance for repayment of excess interest based on an analysis of past experience of reimbursement of excess interest, borrowers’ profile, recent trend of borrowers’ claims for reimbursement, and management future forecasts. Management believes that the provision for repayment of excess interest is adequate and the allowance is at the appropriate amount to absorb probable losses, so that the impact of future claims for reimbursement of excess interest will not have a material adverse effect on the MUFG Group’s financial position and results of operations. The allowance for repayment of excess interest established by MUFG’s consumer finance subsidiaries, which was included in Other liabilities, was ¥23,724 million and ¥24,983 million as of March 31, 2018 and 2019, respectively. Provision (reversal) related to the allowance is included in Other non-interest expenses in the accompanying consolidated statements of income. For the fiscal years ended March 31, 2017, 2018 and 2019, there was a negative impact of ¥56,911 million, nil and ¥15,632 million, respectively, on Equity in earnings of equity method investees—net in the accompanying consolidated statements of income.
Litigation
In the ordinary course of business, the MUFG Group is subject to various litigation and regulatory matters. In accordance with applicable accounting guidance, the MUFG Group establishes an accrued liability for loss contingencies arising from litigation and regulatory matters when they are determined to be probable in their occurrence and the probable loss amount can be reasonably estimated. Based upon current knowledge and consultation with counsel, management believes the eventual outcome of such litigation and regulatory matters, where losses are probable and the probable loss amounts can be reasonably estimated, would not have a material adverse effect on the MUFG Group’s financial position, results of operations or cash flows. Additionally, management believes the amount of loss that is reasonably possible, but not probable, from various litigation and regulatory matters is not material to the MUFG Group’s financial position, results of operations or cash flows.
F-132
Table of Contents
MITSUBISHI UFJ FINANCIAL GROUP, INC. AND SUBSIDIARIES
NOTES TO CONSOLIDATED FINANCIAL STATEMENTS—(Continued)
| 28. | FEES AND COMMISSIONS INCOME |
Disaggregation of Contract Revenue
Details of fees and commissions income for the fiscal years ended March 31, 2017, 2018 and 2019 were as follows:
| 2017 | 2018 | 2019 | ||||||||||
| (in millions) | ||||||||||||
|
Fees and commissions on deposits |
¥ | 53,891 | ¥ | 53,483 | ¥ | 52,624 | ||||||
|
Fees and commissions on remittances and transfers |
168,571 | 169,300 | 168,756 | |||||||||
|
Fees and commissions on foreign trading business |
75,024 | 78,239 | 73,176 | |||||||||
|
Fees and commissions on credit card business |
198,145 | 212,515 | 225,877 | |||||||||
|
Fees and commissions on security-related services |
239,516 | 258,728 | 233,448 | |||||||||
|
Fees and commissions on administration and management services for investment funds |
155,708 | 159,481 | 147,597 | |||||||||
|
Trust fees |
103,110 | 112,399 | 115,002 | |||||||||
|
Guarantee fees (1) |
41,818 | 44,160 | 44,962 | |||||||||
|
Insurance commissions |
59,853 | 49,223 | 46,918 | |||||||||
|
Fees and commissions on real estate business |
39,808 | 40,573 | 45,160 | |||||||||
|
Other fees and commissions (2) |
279,449 | 284,691 | 285,058 | |||||||||
|
|
|
|
|
|
|
|||||||
|
Total |
¥ | 1,414,893 | ¥ | 1,462,792 | ¥ | 1,438,578 | ||||||
|
|
|
|
|
|
|
|||||||
Notes:
| (1) | Guarantee fees are not within the scope of the guidance on revenue from contracts with customers. |
| (2) | Other fees and commissions include non-refundable financing related fees that are not within the scope of the guidance on revenue from contracts with customers. |
The following is an explanation of the relationship with revenue information disclosed for each reportable segment.
These revenues from contracts with customers are related to various reportable segments disclosed in Note 30. The business segment information is derived from the internal management reporting system used by management to measure the performance of the MUFG Group’s business segments. In addition, the business segment information is primarily based on the financial information prepared in accordance with accounting principles generally accepted in Japan as adjusted in accordance with internal management accounting rules and practices. Further, the format and information as disclosed in Note 30 are not consistent with the accompanying consolidated financial statements prepared on the basis of U.S. GAAP. For example, management does not use information on segments’ gross revenue to allocate resources and assess performance.
The majority of fees and commissions on deposits are from the business activities relevant to Retail & Commercial Banking Business Group (“R&C”), with Global Commercial Banking Group (“GCB”) providing a smaller impact.
The business activities relevant to fees and commissions on remittances and transfers are attributable to R&C, Japanese Corporate Investment Banking Group (“JCIB”), Global Corporate Investment Banking Group (“GCIB”), and GCB with no significant concentration in any particular segments.
The business activities relevant to fees and commissions on foreign trading business are attributable to R&C, JCIB, GCIB, and GCB with no significant concentration in any particular segments.
F-133
Table of Contents
MITSUBISHI UFJ FINANCIAL GROUP, INC. AND SUBSIDIARIES
NOTES TO CONSOLIDATED FINANCIAL STATEMENTS—(Continued)
The business activities relevant to fees and commissions on credit card business are substantially attributable to R&C.
The majority of fees and commissions on security-related services are from the business activities relevant to R&C, with JCIB and GCIB providing a smaller impact.
The business activities relevant to fees and commissions on administration and management services for investment funds are substantially attributable to Asset Management & Investor Service Business Group (“AM/IS”).
The business activities relevant to trust fees are attributable to R&C, JCIB, and AM/IS with no significant concentration in any particular segments.
The majority of insurance commissions are from the business activities relevant to R&C, with GCB providing a smaller impact.
The business activities relevant to fees and commissions on real estate business are attributable to R&C and JCIB with no significant concentration in any particular segments.
Contract Balances
Contract balances are recognized in the consolidated balance sheets in accordance with the definition of receivables and contract liabilities specified in the guidance on revenue from contracts with customers. Receivables include receivables for which the services are completed, and accrued income which represents the amount of consideration unpaid for the performance obligations that have been fulfilled pursuant to certain contracts under which the services are continuously provided. Contract liabilities include unearned revenue which represents the amount of consideration received for the performance obligations that have not been fulfilled pursuant to certain contracts under which the services are continuously provided.
As of March 31, 2019, receivables from contracts with customers of ¥185 billion were included primarily in Other assets, and contract liabilities of ¥8 billion were included in Other liabilities.
| 29. | TRADING ACCOUNT PROFITS AND LOSSES |
The MUFG Group performs trading activities through market-making, sales and arbitrage, while maintaining risk levels within appropriate limits in accordance with its risk management policy.
The MUFG Group has trading account securities and trading derivative assets and liabilities for this purpose. In addition, the trading account securities include foreign currency-denominated debt securities such as foreign government or official institution bonds, corporate bonds and mortgage-backed securities, which are mainly comprised of securities measured at fair value under the fair value option.
F-134
Table of Contents
MITSUBISHI UFJ FINANCIAL GROUP, INC. AND SUBSIDIARIES
NOTES TO CONSOLIDATED FINANCIAL STATEMENTS—(Continued)
Net trading gains (losses) for the fiscal years ended March 31, 2017, 2018 and 2019 were comprised of the following:
| 2017 | 2018 | 2019 | ||||||||||
| (in millions) | ||||||||||||
|
Interest rate and other derivative contracts |
¥ | (325,007 | ) | ¥ | (226,788 | ) | ¥ | (24,031 | ) | |||
|
Trading account securities, excluding derivatives |
(314,177 | ) | 153,674 | 192,931 | ||||||||
|
|
|
|
|
|
|
|||||||
|
Trading account profits (losses)—net |
(639,184 | ) | (73,114 | ) | 168,900 | |||||||
|
Foreign exchange derivative contracts (1) |
(183,159 | ) | (159,986 | ) | (354,401 | ) | ||||||
|
|
|
|
|
|
|
|||||||
|
Net trading losses |
¥ | (822,343 | ) | ¥ | (233,100 | ) | ¥ | (185,501 | ) | |||
|
|
|
|
|
|
|
|||||||
Note:
| (1) | Losses on foreign exchange derivative contracts are included in Foreign exchange losses—net in the accompanying consolidated statements of income. Foreign exchange losses—net in the accompanying consolidated statements of income are also comprised of foreign exchange gains other than derivative contracts and foreign exchange losses related to the fair value option. |
For further information on the methodologies and assumptions used to estimate fair value, see Note 32, which also shows fair values of trading account securities by major category. Note 24 discloses further information regarding the derivative-related impact on Trading account profits (losses)—net by major category.
| 30. | BUSINESS SEGMENTS |
The reportable segments of the MUFG Group are subject to the periodical review by the Executive Committee, which represents the MUFG Group’s chief operating decision maker, to determine the allocation of management resources and assess performance. The MUFG Group has established its business units according to the characteristics of customers and the nature of the underlying business. Each business unit engages in business activities based on comprehensive strategies developed for and aimed at respective targeted customers and businesses. The business segment information is primarily based on the financial information prepared in accordance with accounting principles generally accepted in Japan as adjusted in accordance with internal management accounting rules and practices. Accordingly, the format and information are not consistent with the accompanying consolidated financial statements prepared on the basis of U.S. GAAP. A reconciliation is provided for the total amounts of segments’ operating profit with income before income tax expense under U.S. GAAP.
See Note 31 for financial information relating to the MUFG Group’s operations by geographic area. The geographic financial information is consistent with the basis of the accompanying consolidated financial statements.
Effective April 1, 2018, the MUFG Group reorganized its business groups in an effort to further integrate the expertise and capabilities of its consolidated subsidiaries to respond to the needs of customers more effectively and efficiently, as part of its current medium-term business plan. To make and execute unified group-wide strategies based on customer characteristics and the nature of business, the MUFG Group integrated the operations of its consolidated subsidiaries into six business segments.—Retail & Commercial Banking, Japanese Corporate & Investment Banking, Global Corporate & Investment Banking, Global Commercial Banking, Asset Management & Investor Services, and Global Markets.
The following is a brief explanation of the MUFG Group’s business segments:
Retail & Commercial Banking Business Group —Covers the domestic retail and commercial banking businesses of MUFG Bank, Mitsubishi UFJ Trust and Banking, Mitsubishi UFJ Securities Holdings, Mitsubishi
F-135
Table of Contents
MITSUBISHI UFJ FINANCIAL GROUP, INC. AND SUBSIDIARIES
NOTES TO CONSOLIDATED FINANCIAL STATEMENTS—(Continued)
UFJ NICOS and other group companies of MUFG. This business group offers retail and small and medium-sized enterprise customers in Japan an extensive array of commercial banking, trust banking and securities products and services.
Japanese Corporate & Investment Banking Business Group —Covers the large Japanese corporate businesses of MUFG Bank, Mitsubishi UFJ Trust and Banking and Mitsubishi UFJ Securities Holdings, including the transaction banking, investment banking, trust banking and securities businesses. This business group offers large Japanese corporations advanced financial solutions designed to respond to their diversified and globalized needs and to contribute to their business and financial strategies through the global network of the MUFG group companies.
Global Corporate & Investment Banking Business Group —Covers the global corporate, investment and transaction banking businesses of MUFG Bank and Mitsubishi UFJ Securities Holdings. Through a global network of offices and branches, this business group provides non-Japanese large corporate and financial institution customers with a comprehensive set of solutions that meet their increasingly diverse and sophisticated financing needs.
Global Commercial Banking Business Group —Covers the retail and commercial banking businesses of MUFG Union Bank and Krungsri. This business group offers a comprehensive array of financial products and services such as loans, deposits, fund transfers, investments and asset management services for local retail, small and medium-sized enterprise, and corporate customers across the Asia-Pacific region.
Asset Management & Investor Services Business Group —Covers the asset management and asset administration businesses of Mitsubishi UFJ Trust and Banking and MUFG Bank. By integrating the trust banking expertise of Mitsubishi UFJ Trust and Banking and the global strengths of MUFG Bank, the business group offers a full range of asset management and administration services for corporations and pension funds, including pension fund management and administration, advice on pension structures, and payments to beneficiaries, and also offer investment trusts for retail customers.
Global Markets Business Group —Covers the customer business and the treasury operations of MUFG Bank, Mitsubishi UFJ Trust and Banking and Mitsubishi UFJ Securities Holdings. The customer business includes sales and trading in fixed income instruments, currencies and equities as well as other investment products, and origination and distribution of financial products. The treasury operations include asset and liability management as well as global investments for the MUFG Group.
Other —Consists mainly of the corporate centers of MUFG, MUFG Bank, Mitsubishi UFJ Trust and Banking and Mitsubishi UFJ Morgan Stanley Securities. The elimination of duplicated amounts of net revenues among business segments was also reflected in Other.
Management does not use information on segments’ total assets to allocate resources and assess performance. Accordingly, business segment information on total assets is not presented.
F-136
Table of Contents
MITSUBISHI UFJ FINANCIAL GROUP, INC. AND SUBSIDIARIES
NOTES TO CONSOLIDATED FINANCIAL STATEMENTS—(Continued)
Prior period business segment information has been restated to enable comparison between the relevant amounts for the fiscal years ended March 31, 2017, 2018 and 2019.
| Customer Business |
Global
Markets Business Group |
Other | Total (1) | |||||||||||||||||||||||||||||||||
|
Retail &
Commercial Banking Business Group |
Japanese
Corporate & Investment Banking Business Group |
Global
Corporate & Investment Banking Business Group |
Global
Commercial Banking Business Group |
Asset
Management & Investor Services Business Group |
Total | |||||||||||||||||||||||||||||||
| (in billions) | ||||||||||||||||||||||||||||||||||||
|
Fiscal year ended March 31, 2017: |
||||||||||||||||||||||||||||||||||||
|
Net revenue: |
¥ | 1,568.0 | ¥ | 527.1 | ¥ | 418.3 | ¥ | 628.6 | ¥ | 176.7 | ¥ | 3,318.7 | ¥ | 686.8 | ¥ | 56.3 | ¥ | 4,061.8 | ||||||||||||||||||
|
BK and TB (2) : |
817.0 | 446.9 | 275.6 | (1.8 | ) | 72.7 | 1,610.4 | 491.5 | 88.6 | 2,190.5 | ||||||||||||||||||||||||||
|
Net interest income |
482.0 | 143.8 | 107.3 | (1.7 | ) | — | 731.4 | 291.0 | 199.4 | 1,221.8 | ||||||||||||||||||||||||||
|
Net fees |
300.6 | 245.0 | 177.3 | — | 72.7 | 795.6 | (8.2 | ) | (98.8 | ) | 688.6 | |||||||||||||||||||||||||
|
Other |
34.4 | 58.1 | (9.0 | ) | (0.1 | ) | — | 83.4 | 208.7 | (12.0 | ) | 280.1 | ||||||||||||||||||||||||
|
Other than BK and TB |
751.0 | 80.2 | 142.7 | 630.4 | 104.0 | 1,708.3 | 195.3 | (32.3 | ) | 1,871.3 | ||||||||||||||||||||||||||
|
Operating expenses |
1,234.1 | 290.0 | 236.0 | 435.8 | 114.7 | 2,310.6 | 217.4 | 162.3 | 2,690.3 | |||||||||||||||||||||||||||
|
|
|
|
|
|
|
|
|
|
|
|
|
|
|
|
|
|
|
|||||||||||||||||||
|
Operating profit (loss) |
¥ | 333.9 | ¥ | 237.1 | ¥ | 182.3 | ¥ | 192.8 | ¥ | 62.0 | ¥ | 1,008.1 | ¥ | 469.4 | ¥ | (106.0 | ) | ¥ | 1,371.5 | |||||||||||||||||
|
|
|
|
|
|
|
|
|
|
|
|
|
|
|
|
|
|
|
|||||||||||||||||||
|
Fiscal year ended March 31, 2018: |
||||||||||||||||||||||||||||||||||||
|
Net revenue: |
¥ | 1,584.3 | ¥ | 522.6 | ¥ | 378.6 | ¥ | 666.3 | ¥ | 190.4 | ¥ | 3,342.2 | ¥ | 565.2 | ¥ | 10.7 | ¥ | 3,918.1 | ||||||||||||||||||
|
BK and TB (2) : |
785.9 | 439.8 | 246.3 | (3.5 | ) | 83.8 | 1,552.3 | 368.6 | 109.0 | 2,029.9 | ||||||||||||||||||||||||||
|
Net interest income |
465.8 | 150.7 | 95.2 | (3.4 | ) | — | 708.3 | 182.0 | 229.4 | 1,119.7 | ||||||||||||||||||||||||||
|
Net fees |
288.4 | 233.2 | 153.1 | — | 83.8 | 758.5 | (12.2 | ) | (79.1 | ) | 667.2 | |||||||||||||||||||||||||
|
Other |
31.7 | 55.9 | (2.0 | ) | (0.1 | ) | — | 85.5 | 198.8 | (41.3 | ) | 243.0 | ||||||||||||||||||||||||
|
Other than BK and TB |
798.4 | 82.8 | 132.3 | 669.8 | 106.6 | 1,789.9 | 196.6 | (98.3 | ) | 1,888.2 | ||||||||||||||||||||||||||
|
Operating expenses |
1,227.6 | 295.6 | 242.8 | 463.6 | 119.4 | 2,349.0 | 225.7 | 142.8 | 2,717.5 | |||||||||||||||||||||||||||
|
|
|
|
|
|
|
|
|
|
|
|
|
|
|
|
|
|
|
|||||||||||||||||||
|
Operating profit (loss) |
¥ | 356.7 | ¥ | 227.0 | ¥ | 135.8 | ¥ | 202.7 | ¥ | 71.0 | ¥ | 993.2 | ¥ | 339.5 | ¥ | (132.1 | ) | ¥ | 1,200.6 | |||||||||||||||||
|
|
|
|
|
|
|
|
|
|
|
|
|
|
|
|
|
|
|
|||||||||||||||||||
|
Fiscal year ended March 31, 2019: |
||||||||||||||||||||||||||||||||||||
|
Net revenue: |
¥ | 1,521.6 | ¥ | 541.5 | ¥ | 399.7 | ¥ | 706.9 | ¥ | 203.0 | ¥ | 3,372.7 | ¥ | 472.5 | ¥ | (32.8 | ) | ¥ | 3,812.4 | |||||||||||||||||
|
BK and TB (2) : |
738.6 | 421.6 | 266.6 | (1.4 | ) | 93.2 | 1,518.6 | 303.9 | 38.5 | 1,861.0 | ||||||||||||||||||||||||||
|
Net interest income |
460.4 | 152.1 | 113.6 | (1.4 | ) | — | 724.7 | 183.1 | 237.4 | 1,145.2 | ||||||||||||||||||||||||||
|
Net fees |
243.9 | 213.1 | 152.4 | — | 93.2 | 702.6 | (14.2 | ) | (67.5 | ) | 620.9 | |||||||||||||||||||||||||
|
Other |
34.3 | 56.4 | 0.6 | — | — | 91.3 | 135.0 | (131.4 | ) | 94.9 | ||||||||||||||||||||||||||
|
Other than BK and TB |
783.0 | 119.9 | 133.1 | 708.3 | 109.8 | 1,854.1 | 168.6 | (71.3 | ) | 1,951.4 | ||||||||||||||||||||||||||
|
Operating expenses |
1,222.8 | 291.8 | 247.0 | 486.5 | 124.6 | 2,372.7 | 221.3 | 146.1 | 2,740.1 | |||||||||||||||||||||||||||
|
|
|
|
|
|
|
|
|
|
|
|
|
|
|
|
|
|
|
|||||||||||||||||||
|
Operating profit (loss) |
¥ | 298.8 | ¥ | 249.7 | ¥ | 152.7 | ¥ | 220.4 | ¥ | 78.4 | ¥ | 1,000.0 | ¥ | 251.2 | ¥ | (178.9 | ) | ¥ | 1,072.3 | |||||||||||||||||
|
|
|
|
|
|
|
|
|
|
|
|
|
|
|
|
|
|
|
|||||||||||||||||||
Notes:
| (1) | Prior period business segment information has been restated to reflect the transfer of corporate loan-related businesses of Mitsubishi UFJ Trust and Banking to MUFG Bank. In accordance with internal management accounting rules and practices, the transfer resulted in a decrease of the total operating profit by ¥24.3 billion and ¥23.5 billion for fiscal years ended March 31, 2017 and 2018, respectively. |
| (2) | “BK and TB” is a sum of MUFG Bank on a stand-alone basis and Mitsubishi UFJ Trust and Banking on a stand-alone basis. |
F-137
Table of Contents
MITSUBISHI UFJ FINANCIAL GROUP, INC. AND SUBSIDIARIES
NOTES TO CONSOLIDATED FINANCIAL STATEMENTS—(Continued)
Reconciliation
As set forth above, the measurement basis and the income and expense items of the internal management reporting system are different from the accompanying consolidated statements of income. Therefore, it is impracticable to present reconciliations of all of the business segments’ information, other than operating profit, to corresponding items in the accompanying consolidated statements of income.
A reconciliation of operating profit under the internal management reporting system for the fiscal years ended March 31, 2017, 2018 and 2019 above to income before income tax expense shown in the accompanying consolidated statements of income is as follows:
| 2017 | 2018 | 2019 | ||||||||||
| (in billions) | ||||||||||||
|
Operating profit: |
¥ | 1,372 | ¥ | 1,201 | ¥ | 1,072 | ||||||
|
Reversal of (provision for) credit losses |
(254 | ) | 241 | (34 | ) | |||||||
|
Trading account profits (losses)—net |
(880 | ) | (287 | ) | 182 | |||||||
|
Equity investment securities gains (losses)—net |
181 | 215 | (305 | ) | ||||||||
|
Debt investment securities gains (losses)—net |
48 | 71 | (3 | ) | ||||||||
|
Foreign exchange gains (losses)—net |
(110 | ) | 7 | 47 | ||||||||
|
Equity in earnings of equity method investees—net |
198 | 228 | 210 | |||||||||
|
Impairment of goodwill |
(7 | ) | — | — | ||||||||
|
Impairment of intangible assets |
(6 | ) | (22 | ) | (118 | ) | ||||||
|
Reversal of (provision for) off-balance sheet credit instruments |
(107 | ) | 96 | (38 | ) | |||||||
|
Other—net |
(162 | ) | (88 | ) | (142 | ) | ||||||
|
|
|
|
|
|
|
|||||||
|
Income before income tax expense |
¥ | 273 | ¥ | 1,662 | ¥ | 871 | ||||||
|
|
|
|
|
|
|
|||||||
| 31. |
FOREIGN ACTIVITIES |
Foreign operations include the business conducted by overseas offices, as well as international business conducted from domestic offices, principally several international banking-related divisions of MUFG Bank’s and Mitsubishi UFJ Trust and Banking’s head office in Tokyo, and involve various transactions with debtors and customers residing outside Japan. Close integration of the MUFG Group’s foreign and domestic activities makes precise estimates of the amounts of assets, liabilities, income and expenses attributable to foreign operations difficult and necessarily subjective. Assets, income and expenses attributable to foreign operations are allocated to geographical areas based on the domicile of the debtors and customers.
F-138
Table of Contents
MITSUBISHI UFJ FINANCIAL GROUP, INC. AND SUBSIDIARIES
NOTES TO CONSOLIDATED FINANCIAL STATEMENTS—(Continued)
Generally, interest rates with respect to funds borrowed and loaned between domestic and foreign operations are based on prevailing money market rates appropriate for the transactions. In general, the MUFG Group has allocated all direct expenses and a proportionate share of general and administrative expenses to income derived from foreign loans and other transactions by the MUFG Group’s foreign operations. The following table sets forth estimated total assets at March 31, 2017, 2018 and 2019, and estimated total revenue, total expense, income (loss) before income tax expense (benefit) and net income (loss) attributable to Mitsubishi UFJ Financial Group for the respective fiscal years then ended:
| Domestic | Foreign | Total | ||||||||||||||||||||||
| Japan |
United
States of America |
Europe |
Asia/Oceania
excluding Japan |
Other
areas (1) |
||||||||||||||||||||
| (in millions) | ||||||||||||||||||||||||
|
Fiscal year ended March 31, 2017: |
||||||||||||||||||||||||
|
Total revenue (2) |
¥ | 1,903,336 | ¥ | 749,513 | ¥ | 330,751 | ¥ | 818,917 | ¥ | 384,956 | ¥ | 4,187,473 | ||||||||||||
|
Total expense (3) |
2,345,731 | 677,548 | 138,128 | 582,665 | 170,858 | 3,914,930 | ||||||||||||||||||
|
Income (loss) before income tax expense (benefit) |
(442,395 | ) | 71,965 | 192,623 | 236,252 | 214,098 | 272,543 | |||||||||||||||||
|
Net income (loss) attributable to Mitsubishi UFJ Financial Group |
(365,734 | ) | 119,189 | 216,584 | 102,803 | 129,838 | 202,680 | |||||||||||||||||
|
Total assets at end of fiscal year |
191,305,636 | 46,053,230 | 23,821,920 | 25,255,955 | 10,748,278 | 297,185,019 | ||||||||||||||||||
|
Fiscal year ended March 31, 2018: |
||||||||||||||||||||||||
|
Total revenue (2) |
¥ | 2,127,278 | ¥ | 1,337,529 | ¥ | 506,211 | ¥ | 779,983 | ¥ | 443,106 | ¥ | 5,194,107 | ||||||||||||
|
Total expense (3) |
1,687,344 | 843,885 | 173,665 | 651,125 | 176,269 | 3,532,288 | ||||||||||||||||||
|
Income before income tax expense |
439,934 | 493,644 | 332,546 | 128,858 | 266,837 | 1,661,819 | ||||||||||||||||||
|
Net income attributable to Mitsubishi UFJ Financial Group |
140,091 | 447,887 | 322,581 | 92,016 | 225,585 | 1,228,160 | ||||||||||||||||||
|
Total assets at end of fiscal year |
196,121,542 | 44,831,664 | 22,342,574 | 27,163,121 | 10,111,411 | 300,570,312 | ||||||||||||||||||
|
Fiscal year ended March 31, 2019: |
||||||||||||||||||||||||
|
Total revenue (2) |
¥ | 1,886,469 | ¥ | 1,637,569 | ¥ | 222,267 | ¥ | 1,157,946 | ¥ | 504,372 | ¥ | 5,408,623 | ||||||||||||
|
Total expense (3) |
2,204,147 | 1,012,978 | 173,934 | 892,729 | 253,993 | 4,537,781 | ||||||||||||||||||
|
Income (loss) before income tax expense (benefit) |
(317,678 | ) | 624,591 | 48,333 | 265,217 | 250,379 | 870,842 | |||||||||||||||||
|
Net income (loss) attributable to Mitsubishi UFJ Financial Group |
(345,148 | ) | 573,698 | 50,877 | 214,582 | 224,636 | 718,645 | |||||||||||||||||
|
Total assets at end of fiscal year |
194,070,495 | 49,987,389 | 21,535,278 | 27,992,986 | 11,642,751 | 305,228,899 | ||||||||||||||||||
Notes:
| (1) | Other areas primarily include Canada, Latin America, the Caribbean and the Middle East. |
| (2) | Total revenue is comprised of Interest income and Non-interest income. |
| (3) | Total expense is comprised of Interest expense, Provision for (reversal of) credit losses and Non-interest expense. |
F-139
Table of Contents
MITSUBISHI UFJ FINANCIAL GROUP, INC. AND SUBSIDIARIES
NOTES TO CONSOLIDATED FINANCIAL STATEMENTS—(Continued)
The following is an analysis of certain asset and liability accounts related to foreign activities at March 31, 2018 and 2019:
| 2018 | 2019 | |||||||
| (in millions) | ||||||||
|
Cash and due from banks |
¥ | 1,816,704 | ¥ | 828,839 | ||||
|
Interest-earning deposits in other banks |
8,560,283 | 8,453,191 | ||||||
|
|
|
|
|
|||||
|
Total |
¥ | 10,376,987 | ¥ | 9,282,030 | ||||
|
|
|
|
|
|||||
|
Trading account assets |
¥ | 23,904,678 | ¥ | 26,991,984 | ||||
|
|
|
|
|
|||||
|
Investment securities |
¥ | 7,692,969 | ¥ | 8,779,340 | ||||
|
|
|
|
|
|||||
|
Loans—net of unearned income, unamortized premiums and deferred loan fees |
¥ | 51,339,696 | ¥ | 51,678,674 | ||||
|
|
|
|
|
|||||
|
Deposits |
¥ | 45,818,648 | ¥ | 49,044,234 | ||||
|
|
|
|
|
|||||
|
Funds borrowed: |
||||||||
|
Call money, funds purchased |
¥ | 355,666 | ¥ | 67,246 | ||||
|
Payables under repurchase agreements |
8,181,347 | 9,459,547 | ||||||
|
Payables under securities lending transactions |
276,563 | 47,886 | ||||||
|
Other short-term borrowings |
5,152,667 | 5,107,832 | ||||||
|
Long-term debt |
2,223,246 | 2,697,463 | ||||||
|
|
|
|
|
|||||
|
Total |
¥ | 16,189,489 | ¥ | 17,379,974 | ||||
|
|
|
|
|
|||||
|
Trading account liabilities |
¥ | 4,251,049 | ¥ | 3,897,844 | ||||
|
|
|
|
|
|||||
| 32. |
FAIR VALUE |
Fair value is defined as the price that would be received to sell an asset or paid to transfer a liability in an orderly transaction between market participants at the measurement date. The guidance on fair value measurements also specifies a fair value hierarchy that prioritizes the inputs to valuation techniques used to measure fair value into three broad levels. The fair value hierarchy gives the highest priority to quoted prices in active markets and the lowest priority to unobservable inputs, for example, the reporting entity’s own data. Based on the observability of the inputs used in the valuation techniques, the following three-level hierarchy is specified by the guidance:
| • |
Level 1—Unadjusted quoted prices for identical instruments in active markets. |
| • |
Level 2—Observable inputs other than Level 1 prices for substantially the full term of the instruments, such as quoted prices for similar instruments in active markets; quoted prices for identical or similar instruments in markets that are not active; other inputs that are observable; or market-corroborated inputs. |
| • |
Level 3—Unobservable inputs that are supported by little or no market activity and that are significant to the fair value of the instruments. |
A financial instrument’s categorization within the fair value hierarchy is based upon the lowest level of input that is significant to the fair value measurement.
The MUFG Group has an established and documented process for determining fair values in accordance with the guidance. When available, quoted prices are used to determine fair value. If quoted prices are not
F-140
Table of Contents
MITSUBISHI UFJ FINANCIAL GROUP, INC. AND SUBSIDIARIES
NOTES TO CONSOLIDATED FINANCIAL STATEMENTS—(Continued)
available, fair value is based upon valuation techniques that use observable or unobservable inputs. The fair values of liabilities are determined by discounting future cash flows at a rate which incorporates the MUFG Group’s own creditworthiness. In addition, valuation adjustments may be made to ensure the financial instruments are recorded at fair value. These adjustments include, but are not limited to, amounts that reflect counterparty credit quality, funding cost, liquidity risk and model risk.
The following section describes the valuation techniques used by the MUFG Group to measure fair values of certain financial instruments. The discussion includes the general classification of such financial instruments in accordance with the fair value hierarchy, a brief explanation of the valuation techniques, the significant inputs to those valuation techniques, and any additional significant assumptions.
Trading Account Assets and Liabilities—Trading Account Securities
When quoted prices are available in an active market, the MUFG Group uses quoted prices to measure the fair values of securities and such securities are classified in Level 1 of the fair value hierarchy. Examples of Level 1 securities include certain Japanese and foreign government bonds, and marketable equity securities.
When quoted prices are available but the securities are not traded in active markets, such securities are classified in Level 2 of the fair value hierarchy. These securities include certain Japanese government agency bonds, Japanese prefectural and municipal bonds, foreign government and official institution bonds, corporate bonds, residential mortgage-backed securities and equity securities.
As for quoted prices provided by third-party vendors, independent price verification is performed by the MUFG group to determine the quality and reliability of the data for fair value measurement purposes. As part of its independent price verification procedures, the MUFG group obtains a sufficient understanding of the vendors’ pricing sources and valuation processes. Further, the MUFG group performs internal price verification procedures to ensure that the quoted prices provided from the third-party vendors are reasonable. Such verification procedures include comparison of pricing sources and analysis of variances beyond certain thresholds.
When quoted prices are not available, the MUFG Group estimates fair values by using an internal model, quoted prices of securities with similar characteristics or non-binding prices obtained from independent third parties. Such securities include certain commercial paper, corporate bonds, asset-backed securities and residential mortgage-backed securities. For commercial paper, the MUFG Group estimates fair value using discounted cash flows. The cash flows are estimated in accordance with the terms of contracts and discounted using a discount rate based on the yield curve estimated from market interest rates appropriate to the securities. Commercial paper is generally classified in Level 2 of the fair value hierarchy. For corporate bonds, the MUFG Group estimates fair value using discounted cash flows. The cash flows are estimated in accordance with the terms of contracts and discounted using discount rates applicable to the maturity of the bonds, which are adjusted to reflect credit risk of issuers. Credit risk of issuers is reflected in the future cash flows being discounted by the interest rate applicable to the maturity of the bonds. Corporate bonds are classified in either Level 2 or Level 3 of the fair value hierarchy, depending primarily on the significance of the adjustments to the unobservable input of credit worthiness. For residential mortgage-backed securities, the MUFG Group estimates fair value using non-binding prices obtained from independent third parties. Residential mortgage-backed securities are classified as level 2 unless otherwise significant unobservable input is used for the valuation.
When there is less liquidity for securities or significant inputs used in the fair value measurements are unobservable, such securities are classified in Level 3 of the fair value hierarchy. Examples of such Level 3 securities include CLOs backed by general corporate loans, which are classified in asset-backed securities. The
F-141
Table of Contents
MITSUBISHI UFJ FINANCIAL GROUP, INC. AND SUBSIDIARIES
NOTES TO CONSOLIDATED FINANCIAL STATEMENTS—(Continued)
fair value of CLOs is measured by weighing the estimated fair value amounts from the internal model and the non-binding quotes from the independent broker-dealers. The weight of the quotes from independent broker-dealers is determined based on the result of inquiries with the broker-dealers to understand their basis of fair value calculation with consideration given to transaction volume. Key inputs to the internal model include projected cash flows through an analysis of underlying loans, probability of default which incorporates market indices such as LCDX (which is an index of loan credit default swaps), prepayment rates and discount rates reflecting liquidity premiums based on historical market data.
Trading Account Assets and Liabilities—Derivatives
Exchange-traded derivatives valued using quoted prices are classified in Level 1 of the fair value hierarchy. Examples of Level 1 derivatives include stock futures index and interest rate futures. However, the majority of the derivative contracts entered into by the MUFG Group are traded over-the-counter and valued using valuation techniques as there are no quoted prices for such derivatives. The valuation techniques and inputs vary depending on the types and contractual terms of the derivatives. The principal valuation techniques used to value derivatives include discounted cash flows, the Black-Scholes model and the Hull-White model. The key inputs include interest rate yield curve, foreign currency exchange rate, volatility, credit quality of the counterparty or the MUFG Group and spot price of the underlying. These models are commonly accepted in the financial industry and key inputs to the models are generally readily observable in an active market. Derivatives valued using such valuation techniques and inputs are generally classified in Level 2 of the fair value hierarchy. Examples of such Level 2 derivatives include plain-vanilla interest rate swaps, foreign currency forward contracts and currency option contracts.
Derivatives that are valued using valuation techniques with significant unobservable inputs are classified in Level 3 of the fair value hierarchy. Examples of Level 3 derivatives include long-term interest rate or currency swaps and certain credit derivatives, where significant inputs such as volatility, credit curves and correlation of such inputs are unobservable.
Investment Securities
Investment securities include Available-for-sale debt and equity securities, whose fair values are measured using the same valuation techniques as the trading account securities described above. Investment securities also include investments in nonmarketable equity securities which are subject to specialized industry accounting principles. The valuation of such nonmarketable equity securities involves significant management judgment due to the absence of quoted prices, lack of liquidity and the long term nature of these investments. Further, there may be restriction on transfers of nonmarketable equity securities. The MUFG Group values such securities initially at transaction price and subsequently adjusts such valuations, considering evidence such as current sales transactions of similar securities, initial public offerings, recent equity issuances and change in financial condition of the investee company. Nonmarketable equity securities are included in Level 3 of the fair value hierarchy.
Other Assets
Other assets measured at fair value mainly consist of securities received as collateral that may be sold or repledged under securities lending transactions, money in trust for segregating cash deposited by customers on security transactions and derivatives designated as hedging instruments. The securities received as collateral under lending transactions mainly consist of certain Japanese and foreign government bonds which are valued using the valuation techniques previously described in the section entitled “Trading Accounts Assets and Liabilities—Trading Account Securities” above.
F-142
Table of Contents
MITSUBISHI UFJ FINANCIAL GROUP, INC. AND SUBSIDIARIES
NOTES TO CONSOLIDATED FINANCIAL STATEMENTS—(Continued)
Money in trust for segregating cash deposited by customers on security transactions mainly consists of certain Japanese government bonds which are valued using the valuation techniques described in the “Trading Account Assets and Liabilities—Trading Account Securities” above and is included in Level 1 or Level 2 of the fair value hierarchy depending on the component assets.
The fair values of derivatives designated as hedging instruments are measured using the valuation techniques described in the “Trading Account Assets and Liabilities—Derivatives” above.
Obligations to Return Securities Received as Collateral
Obligations to return securities received as collateral under securities lending transactions are measured at the fair values of the securities received as collateral. The securities received as collateral consist primarily of certain Japanese and foreign government bonds, whose fair values are measured using the valuation techniques described in the “Trading Account Assets and Liabilities—Trading Account Securities” above.
Other Short-term Borrowings and Long-term Debt
Certain short-term borrowings and long-term debt are measured at fair value due to the election of the fair value option. The fair value of these instruments are measured principally based on the discounted cash flows. Where the inputs into the valuation techniques are mainly based on observable inputs, these instruments are classified in Level 2 of the fair value hierarchy. Where significant inputs are unobservable, they are classified in Level 3 of the fair value hierarchy.
Market Valuation Adjustments
Counterparty credit risk adjustments are made to certain financial assets such as over-the-counter derivatives to factor in counterparty credit exposure. As not all counterparties have the same credit risk, it is necessary in calculating credit risk adjustments, to take into account probability of a default event occurring for each counterparty, which is primarily derived from observed or estimated spreads on credit default swaps. In addition, the counterparty credit risk adjustment takes into account the effect of credit risk mitigation such as pledged collateral and the legal right of offset with the counterparty.
Funding valuation adjustment (“FVA”) represents the adjustment to reflect the impact of uncollateralized funding. The FVA is calculated using the MUFG’s market funding spread and the funding exposure of any uncollateralized component of the over-the-counter derivative instrument. The MUFG Group’s FVA framework incorporates key inputs, such as the expected future funding requirements arising from the MUFG Group’s positions with each counterparty and collateral arrangements, and the estimated market funding cost in the principal market, which considers the MUFG Group’s credit risk.
Liquidity adjustments are applied mainly to the instruments classified in Level 3 of the fair value hierarchy when recent observable prices of such instruments are not available or such instruments are traded in inactive or less active markets. The liquidity adjustments are based on the facts and circumstances of the markets including the availability of external quotes and the time since the latest available quote.
Model valuation adjustments such as unobservable parameter valuation adjustments may be provided when the fair values of instruments are determined based on internally developed valuation techniques. Examples of such adjustments include adjustments to the model price of certain derivatives where parameters such as correlation are unobservable. Unobservable parameter valuation adjustments are applied to mitigate the uncertainty inherent in the resulting valuation estimate.
F-143
Table of Contents
MITSUBISHI UFJ FINANCIAL GROUP, INC. AND SUBSIDIARIES
NOTES TO CONSOLIDATED FINANCIAL STATEMENTS—(Continued)
Investments in Certain Entities That Calculate Net Asset Value per Share
The MUFG Group has interests in investment funds mainly private equity funds, and real estate funds that are measured at fair value on a recurring or nonrecurring basis.
Private equity funds have specific investment objectives in connection with their acquisition of equity interests, such as providing financing and other support to start-up businesses, medium and small entities in a particular geographical area, and to companies with certain technology or companies in a high-growth industry. Generally, these investments cannot be redeemed with the funds, and the return of invested capital and its gains are derived from distributions received upon the liquidation of the underlying assets of the fund, the timing of which is uncertain.
Real estate funds invest globally and primarily in real estate companies, debt recapitalizations and direct property. These investments are generally not redeemable with the funds. Distributions from each fund will be received as the underlying investments of the funds are liquidated, the timing of which is uncertain.
F-144
Table of Contents
MITSUBISHI UFJ FINANCIAL GROUP, INC. AND SUBSIDIARIES
NOTES TO CONSOLIDATED FINANCIAL STATEMENTS—(Continued)
Assets and Liabilities Measured at Fair Value on a Recurring Basis
The following tables present the financial instruments carried at fair value by level within the fair value hierarchy as of March 31, 2018 and 2019:
|
At March 31, 2018 |
Level 1 | Level 2 | Level 3 | Fair Value | ||||||||||||
| (in millions) | ||||||||||||||||
|
Assets |
||||||||||||||||
|
Trading account assets: |
||||||||||||||||
|
Trading securities (1) |
¥ | 10,876,424 | ¥ | 10,876,080 | ¥ | 827,493 | ¥ | 22,579,997 | ||||||||
|
Debt securities |
||||||||||||||||
|
Japanese national government and Japanese government agency bonds |
1,388,143 | 477,530 | — | 1,865,673 | ||||||||||||
|
Japanese prefectural and municipal bonds |
— | 189,756 | — | 189,756 | ||||||||||||
|
Foreign government and official institution bonds |
8,190,781 | 469,342 | 1,047 | 8,661,170 | ||||||||||||
|
Corporate bonds |
— | 3,255,503 | 23,092 | 3,278,595 | ||||||||||||
|
Residential mortgage-backed securities |
— | 4,432,307 | 41,141 | 4,473,448 | ||||||||||||
|
Asset-backed securities |
— | 186,351 | 684,637 | 870,988 | ||||||||||||
|
Other debt securities |
— | 2,800 | 33,450 | 36,250 | ||||||||||||
|
Commercial paper |
— | 1,210,775 | — | 1,210,775 | ||||||||||||
|
Equity securities (2) |
1,297,500 | 651,716 | 44,126 | 1,993,342 | ||||||||||||
|
Trading derivative assets |
71,175 | 12,420,100 | 93,900 | 12,585,175 | ||||||||||||
|
Interest rate contracts |
3,320 | 8,681,427 | 27,092 | 8,711,839 | ||||||||||||
|
Foreign exchange contracts |
1,890 | 3,543,413 | 12,118 | 3,557,421 | ||||||||||||
|
Equity contracts |
65,965 | 118,351 | 22,994 | 207,310 | ||||||||||||
|
Commodity contracts |
— | 6,239 | 30,753 | 36,992 | ||||||||||||
|
Credit derivatives |
— | 70,670 | 943 | 71,613 | ||||||||||||
|
Investment securities: |
||||||||||||||||
|
Available-for-sale debt securities |
23,105,682 | 9,376,772 | 350,660 | 32,833,114 | ||||||||||||
|
Japanese national government and Japanese government agency bonds |
21,522,128 | 3,045,776 | — | 24,567,904 | ||||||||||||
|
Japanese prefectural and municipal bonds |
— | 1,537,431 | — | 1,537,431 | ||||||||||||
|
Foreign government and official institution bonds |
1,583,554 | 567,946 | 20,192 | 2,171,692 | ||||||||||||
|
Corporate bonds |
— | 1,113,323 | 6,037 | 1,119,360 | ||||||||||||
|
Residential mortgage-backed securities |
— | 1,617,520 | 15 | 1,617,535 | ||||||||||||
|
Commercial mortgage-backed securities |
— | 92,806 | 2,430 | 95,236 | ||||||||||||
|
Asset-backed securities |
— | 1,397,177 | 161,172 | 1,558,349 | ||||||||||||
|
Other debt securities |
— | 4,793 | 160,814 | 165,607 | ||||||||||||
|
Equity securities (6) |
6,255,413 | 416,171 | 28,359 | 6,699,943 | ||||||||||||
|
Marketable equity securities |
6,255,413 | 416,171 | — | 6,671,584 | ||||||||||||
|
Nonmarketable equity securities |
— | — | 28,359 | 28,359 | ||||||||||||
|
Others (3)(4) |
955,548 | 93,042 | 8,660 | 1,057,250 | ||||||||||||
|
|
|
|
|
|
|
|
|
|||||||||
|
Total |
¥ | 41,264,242 | ¥ | 33,182,165 | ¥ | 1,309,072 | ¥ | 75,755,479 | ||||||||
|
|
|
|
|
|
|
|
|
|||||||||
|
Liabilities |
||||||||||||||||
|
Trading account liabilities: |
||||||||||||||||
|
Trading securities sold, not yet purchased |
¥ | 208,354 | ¥ | 7,060 | ¥ | — | ¥ | 215,414 | ||||||||
|
Trading derivative liabilities |
80,673 | 11,844,463 | 81,781 | 12,006,917 | ||||||||||||
|
Interest rate contracts |
3,085 | 8,659,042 | 12,496 | 8,674,623 | ||||||||||||
|
Foreign exchange contracts |
2,058 | 2,992,812 | 5,382 | 3,000,252 | ||||||||||||
|
Equity contracts |
75,530 | 117,572 | 33,679 | 226,781 | ||||||||||||
|
Commodity contracts |
— | 4,362 | 30,070 | 34,432 | ||||||||||||
|
Credit derivatives |
— | 70,675 | 154 | 70,829 | ||||||||||||
|
Obligation to return securities received as collateral |
3,030,974 | 145,988 | — | 3,176,962 | ||||||||||||
|
Others (5) |
— | 507,700 | (25,528 | ) | 482,172 | |||||||||||
|
|
|
|
|
|
|
|
|
|||||||||
|
Total |
¥ | 3,320,001 | ¥ | 12,505,211 | ¥ | 56,253 | ¥ | 15,881,465 | ||||||||
|
|
|
|
|
|
|
|
|
|||||||||
F-145
Table of Contents
MITSUBISHI UFJ FINANCIAL GROUP, INC. AND SUBSIDIARIES
NOTES TO CONSOLIDATED FINANCIAL STATEMENTS—(Continued)
|
At March 31, 2019 |
Level 1 | Level 2 | Level 3 | Fair Value | ||||||||||||
| (in millions) | ||||||||||||||||
|
Assets |
||||||||||||||||
|
Trading account assets: |
||||||||||||||||
|
Trading securities (1) |
¥ | 12,821,328 | ¥ | 13,725,079 | ¥ | 785,326 | ¥ | 27,331,733 | ||||||||
|
Debt securities |
||||||||||||||||
|
Japanese national government and Japanese government agency bonds |
2,117,841 | 512,134 | — | 2,629,975 | ||||||||||||
|
Japanese prefectural and municipal bonds |
— | 117,799 | — | 117,799 | ||||||||||||
|
Foreign government and official institution bonds |
9,264,028 | 454,365 | 792 | 9,719,185 | ||||||||||||
|
Corporate bonds |
— | 3,203,585 | 31,384 | 3,234,969 | ||||||||||||
|
Residential mortgage-backed securities |
— | 7,038,353 | 35,181 | 7,073,534 | ||||||||||||
|
Asset-backed securities |
— | 253,274 | 627,678 | 880,952 | ||||||||||||
|
Other debt securities |
— | 747 | 35,148 | 35,895 | ||||||||||||
|
Commercial paper |
— | 1,473,693 | — | 1,473,693 | ||||||||||||
|
Equity securities (2) |
1,439,459 | 671,129 | 55,143 | 2,165,731 | ||||||||||||
|
Trading derivative assets |
63,582 | 13,047,590 | 93,313 | 13,204,485 | ||||||||||||
|
Interest rate contracts |
23,430 | 10,067,719 | 17,307 | 10,108,456 | ||||||||||||
|
Foreign exchange contracts |
1,115 | 2,771,115 | 22,861 | 2,795,091 | ||||||||||||
|
Equity contracts |
39,037 | 139,666 | 9,000 | 187,703 | ||||||||||||
|
Commodity contracts |
— | 3,727 | 25,684 | 29,411 | ||||||||||||
|
Credit derivatives |
— | 65,363 | 18,461 | 83,824 | ||||||||||||
|
Investment securities: |
||||||||||||||||
|
Available-for-sale debt securities |
22,550,086 | 10,684,983 | 283,434 | 33,518,503 | ||||||||||||
|
Japanese national government and Japanese government agency bonds |
20,635,872 | 3,441,824 | — | 24,077,696 | ||||||||||||
|
Japanese prefectural and municipal bonds |
— | 2,226,566 | — | 2,226,566 | ||||||||||||
|
Foreign government and official institution bonds |
1,914,214 | 707,959 | 19,246 | 2,641,419 | ||||||||||||
|
Corporate bonds |
— | 1,126,535 | 4,196 | 1,130,731 | ||||||||||||
|
Residential mortgage-backed securities |
— | 1,615,336 | 15 | 1,615,351 | ||||||||||||
|
Commercial mortgage-backed securities |
— | 128,917 | 2,038 | 130,955 | ||||||||||||
|
Asset-backed securities |
— | 1,371,467 | 131,455 | 1,502,922 | ||||||||||||
|
Other debt securities |
— | 66,379 | 126,484 | 192,863 | ||||||||||||
|
Equity securities (6) |
5,982,629 | 375,914 | 27,820 | 6,386,363 | ||||||||||||
|
Marketable equity securities |
5,982,629 | 375,914 | — | 6,358,543 | ||||||||||||
|
Nonmarketable equity securities (7) |
— | — | 27,820 | 27,820 | ||||||||||||
|
Others (3)(4) |
807,193 | 42,184 | 32,378 | 881,755 | ||||||||||||
|
|
|
|
|
|
|
|
|
|||||||||
|
Total |
¥ | 42,224,818 | ¥ | 37,875,750 | ¥ | 1,222,271 | ¥ | 81,322,839 | ||||||||
|
|
|
|
|
|
|
|
|
|||||||||
|
Liabilities |
||||||||||||||||
|
Trading account liabilities: |
||||||||||||||||
|
Trading securities sold, not yet purchased |
¥ | 157,114 | ¥ | 5,796 | ¥ | — | ¥ | 162,910 | ||||||||
|
Trading derivative liabilities |
88,329 | 12,701,110 | 57,143 | 12,846,582 | ||||||||||||
|
Interest rate contracts |
35,179 | 9,839,618 | 21,496 | 9,896,293 | ||||||||||||
|
Foreign exchange contracts |
2,633 | 2,663,347 | 4,670 | 2,670,650 | ||||||||||||
|
Equity contracts |
50,517 | 126,737 | 6,138 | 183,392 | ||||||||||||
|
Commodity contracts |
— | 2,916 | 24,735 | 27,651 | ||||||||||||
|
Credit derivatives |
— | 68,492 | 104 | 68,596 | ||||||||||||
|
Obligation to return securities received as collateral |
2,912,355 | 174,671 | — | 3,087,026 | ||||||||||||
|
Others (5) |
— | 426,368 | 65,648 | 492,016 | ||||||||||||
|
|
|
|
|
|
|
|
|
|||||||||
|
Total |
¥ | 3,157,798 | ¥ | 13,307,945 | ¥ | 122,791 | ¥ | 16,588,534 | ||||||||
|
|
|
|
|
|
|
|
|
|||||||||
Notes:
| (1) | Includes securities measured under the fair value option. |
| (2) | Excludes certain investments valued at net asset value of private equity funds whose fair values were ¥21,517 million and ¥40,400 million at March 31, 2018 and 2019, respectively. The amounts of unfunded commitments related to these private equity funds were ¥61,463 million and ¥94,483 million at March 31, 2018 and 2019, respectively. |
F-146
Table of Contents
MITSUBISHI UFJ FINANCIAL GROUP, INC. AND SUBSIDIARIES
NOTES TO CONSOLIDATED FINANCIAL STATEMENTS—(Continued)
| (3) | Mainly comprises securities received as collateral that may be sold or repledged under securities lending transactions, money in trust for segregating cash deposited by customers on security transactions and derivative assets designated as hedging instruments. |
| (4) | Excludes certain investments valued at net asset value of private equity funds, whose fair values at March 31, 2018 was ¥35 million, and those at March 31, 2019 was nil, respectively. There was no amount of unfunded commitments related to these private equity funds at March 31, 2018 and 2019. |
| (5) | Includes other short-term borrowings, long-term debt, bifurcated embedded derivatives carried at fair value and derivative liabilities designated as hedging instruments. |
| (6) | The table above reflects changes in presentation that were made to equity investment securities at March 31, 2018. See Note 1 for further information. |
| (7) | Excludes certain investments valued at net asset value of real estate funds and private funds, whose fair values at March 31, 2019 were ¥17,583 million, and ¥9,921 million, respectively. The amounts of unfunded commitments related to these real estate funds and private funds at March 31, 2019 were ¥2,054 million, and nil, respectively. |
F-147
Table of Contents
MITSUBISHI UFJ FINANCIAL GROUP, INC. AND SUBSIDIARIES
NOTES TO CONSOLIDATED FINANCIAL STATEMENTS—(Continued)
Changes in Level 3 Recurring Fair Value Measurements
The following tables present a reconciliation of the assets and liabilities measured at fair value on a recurring basis using significant unobservable inputs (Level 3) during the fiscal years ended March 31, 2018 and 2019. The determination to classify a financial instrument within Level 3 is based upon the significance of the unobservable inputs to overall fair value measurement. However, Level 3 financial instruments typically include, in addition to the unobservable or Level 3 input, observable inputs (inputs that are actively quoted and can be validated to external sources). Accordingly, the gains and losses in the tables below include changes in fair value due in part to observable inputs used in the valuation techniques.
|
March 31,
2017 |
Total gains (losses)
|
Purchases | Issues | Sales | Settlements |
Transfers
into Level 3 |
Transfers
out of Level 3 |
March 31,
2018 |
Change in
unrealized gains (losses) included in earnings for assets and liabilities still held at March 31, 2018 |
|||||||||||||||||||||||||||||||||||
|
Included
in earnings |
Included
in other comprehensive income |
|||||||||||||||||||||||||||||||||||||||||||
| (in millions) | ||||||||||||||||||||||||||||||||||||||||||||
|
Assets |
||||||||||||||||||||||||||||||||||||||||||||
|
Trading account assets: |
||||||||||||||||||||||||||||||||||||||||||||
|
Trading securities (1) |
¥ | 799,493 | ¥ | (25,944 | ) (2) | ¥ | — | ¥ | 702,402 | ¥ | — | ¥ | (281,927 | ) | ¥ | (376,333 | ) | ¥ | 34,986 | ¥ | (25,184 | ) | ¥ | 827,493 | ¥ | (26,391 | ) (2) | |||||||||||||||||
|
Debt securities |
||||||||||||||||||||||||||||||||||||||||||||
|
Japanese national government and Japanese government agency bonds |
— | (4 | ) | — | 1,079 | — | — | — | — | (1,075 | ) | — | — | |||||||||||||||||||||||||||||||
|
Foreign government and official institution bonds |
1,836 | 720 | — | 107,685 | — | (107,157 | ) | (1,064 | ) | — | (973 | ) | 1,047 | (2 | ) | |||||||||||||||||||||||||||||
|
Corporate bonds |
25,521 | (6,424 | ) | — | 3,170 | — | (533 | ) | (10,391 | ) | 34,885 | (5) | (23,136 | ) (5) | 23,092 | (6,377 | ) | |||||||||||||||||||||||||||
|
Residential mortgage-backed securities |
47,914 | 1,014 | — | — | — | — | (7,787 | ) | — | — | 41,141 | 829 | ||||||||||||||||||||||||||||||||
|
Asset-backed securities |
654,814 | (21,124 | ) | — | 576,668 | — | (172,324 | ) | (353,397 | ) | — | — | 684,637 | (19,387 | ) | |||||||||||||||||||||||||||||
|
Other debt securities |
35,552 | (2,102 | ) | — | — | — | — | — | — | — | 33,450 | (2,102 | ) | |||||||||||||||||||||||||||||||
|
Equity securities |
33,856 | 1,976 | — | 13,800 | — | (1,913 | ) | (3,694 | ) | 101 | — | 44,126 | 648 | |||||||||||||||||||||||||||||||
|
Trading derivatives—net |
37,245 | 3,912 | (2) | 520 | 1,367 | (1,518 | ) | — | (23,699 | ) | (466 | ) | (5,242 | ) | 12,119 | (9,055 | ) (2) | |||||||||||||||||||||||||||
|
Interest rate contracts—net |
28,551 | (4,730 | ) | (42 | ) | — | — | — | (8,810 | ) | (2,433 | ) | 2,060 | 14,596 | (3,908 | ) | ||||||||||||||||||||||||||||
|
Foreign exchange contracts—net |
14,858 | (2,434 | ) | 294 | 26 | — | — | (67 | ) | 1,996 | (5) | (7,937 | ) | 6,736 | 1,713 | |||||||||||||||||||||||||||||
|
Equity contracts—net |
(6,312 | ) | 12,518 | 272 | 687 | (1,154 | ) | — | (17,302 | ) | (29 | ) (5) | 635 | (5) | (10,685 | ) | (5,446 | ) | ||||||||||||||||||||||||||
|
Commodity contracts—net |
370 | 30 | (4 | ) | 654 | (364 | ) | — | (3 | ) | — | — | 683 | 116 | ||||||||||||||||||||||||||||||
|
Credit derivatives—net |
(222 | ) | (1,472 | ) | — | — | — | — | 2,483 | — | — | 789 | (1,530 | ) | ||||||||||||||||||||||||||||||
|
Investment securities: |
||||||||||||||||||||||||||||||||||||||||||||
|
Available-for-sale debt securities |
337,526 | 4,831 | (3) | (15,344 | ) | 319,092 | — | (163 | ) | (264,616 | ) | 93 | (30,759 | ) | 350,660 | (167 | ) (3) | |||||||||||||||||||||||||||
|
Foreign government and official institution bonds |
20,099 | — | (186 | ) | 621 | — | — | (342 | ) | — | — | 20,192 | — | |||||||||||||||||||||||||||||||
|
Corporate bonds |
36,932 | 150 | (43 | ) | 521 | — | (52 | ) | (805 | ) | 93 | (5) | (30,759 | ) (5) | 6,037 | (167 | ) | |||||||||||||||||||||||||||
|
Residential mortgage-backed securities |
15 | — | — | — | — | — | — | — | — | 15 | — | |||||||||||||||||||||||||||||||||
|
Commercial mortgage-backed securities |
2,971 | — | 4 | — | — | — | (545 | ) | — | — | 2,430 | — | ||||||||||||||||||||||||||||||||
|
Asset-backed securities |
116,919 | 4,681 | (9,605 | ) | 306,680 | — | — | (257,503 | ) | — | — | 161,172 | — | |||||||||||||||||||||||||||||||
|
Other debt securities |
160,590 | — | (5,514 | ) | 11,270 | — | (111 | ) | (5,421 | ) | — | — | 160,814 | — | ||||||||||||||||||||||||||||||
|
Equity securities |
26,292 | 1,640 | (3) | — | 3,930 | — | (2,782 | ) | (7 | ) | — | (714 | ) | 28,359 | 300 | (3) | ||||||||||||||||||||||||||||
|
Nonmarketable equity securities |
26,292 | 1,640 | — | 3,930 | — | (2,782 | ) | (7 | ) | — | (714 | ) | 28,359 | 300 | ||||||||||||||||||||||||||||||
|
Others |
3,850 | (426 | ) (7) | (37 | ) | 5,584 | — | (311 | ) | — | — | — | 8,660 | (592 | ) (7) | |||||||||||||||||||||||||||||
|
|
|
|
|
|
|
|
|
|
|
|
|
|
|
|
|
|
|
|
|
|
|
|||||||||||||||||||||||
|
Total |
¥ | 1,204,406 | ¥ | (15,987 | ) | ¥ | (14,861 | ) | ¥ | 1,032,375 | ¥ | (1,518 | ) | ¥ | (285,183 | ) | ¥ | (664,655 | ) | ¥ | 34,613 | ¥ | (61,899 | ) | ¥ | 1,227,291 | ¥ | (35,905 | ) | |||||||||||||||
|
|
|
|
|
|
|
|
|
|
|
|
|
|
|
|
|
|
|
|
|
|
|
|||||||||||||||||||||||
|
Liabilities |
||||||||||||||||||||||||||||||||||||||||||||
|
Others |
¥ | 28,432 | ¥ | 4,508 | (4) | ¥ | (2,005 | ) | ¥ | — | ¥ | 6,601 | ¥ | — | ¥ | (27,824 | ) | ¥ | 1,056 | (6) | ¥ | (31,290 | ) (6) | ¥ | (25,528 | ) | ¥ | 35,010 | (4) | |||||||||||||||
|
|
|
|
|
|
|
|
|
|
|
|
|
|
|
|
|
|
|
|
|
|
|
|||||||||||||||||||||||
|
Total |
¥ | 28,432 | ¥ | 4,508 | ¥ | (2,005 | ) | ¥ | — | ¥ | 6,601 | ¥ | — | ¥ | (27,824 | ) | ¥ | 1,056 | ¥ | (31,290 | ) | ¥ | (25,528 | ) | ¥ | 35,010 | ||||||||||||||||||
|
|
|
|
|
|
|
|
|
|
|
|
|
|
|
|
|
|
|
|
|
|
|
|||||||||||||||||||||||
F-148
Table of Contents
MITSUBISHI UFJ FINANCIAL GROUP, INC. AND SUBSIDIARIES
NOTES TO CONSOLIDATED FINANCIAL STATEMENTS—(Continued)
|
March 31,
2018 |
Total gains (losses) for the period |
Purchases | Issues | Sales | Settlements |
Transfers
into Level 3 |
Transfers
out of Level 3 |
March 31,
2019 |
Change in
unrealized gains (losses) included in earnings for assets and liabilities still held at March 31, 2019 |
|||||||||||||||||||||||||||||||||||
|
Included
in earnings |
Included
in other comprehensive income |
|||||||||||||||||||||||||||||||||||||||||||
| (in millions) | ||||||||||||||||||||||||||||||||||||||||||||
|
Assets |
||||||||||||||||||||||||||||||||||||||||||||
|
Trading account assets: |
||||||||||||||||||||||||||||||||||||||||||||
|
Trading securities (1) |
¥ | 827,493 | ¥ | 23,848 | (2) | ¥ | (1,341 | ) | ¥ | 454,048 | ¥ | — | ¥ | (316,384 | ) | ¥ | (213,944 | ) | ¥ | 29,445 | ¥ | (17,839 | ) | ¥ | 785,326 | ¥ | 18,299 | (2) | ||||||||||||||||
|
Debt securities |
||||||||||||||||||||||||||||||||||||||||||||
|
Foreign government and official institution bonds |
1,047 | 863 | — | 117,619 | — | (118,377 | ) | (317 | ) | — | (43 | ) | 792 | 5 | ||||||||||||||||||||||||||||||
|
Corporate bonds |
23,092 | 611 | — | 2,040 | — | (1,798 | ) | (4,188 | ) | 29,423 | (5) | (17,796 | ) (5) | 31,384 | 286 | |||||||||||||||||||||||||||||
|
Residential mortgage-backed securities |
41,141 | (282 | ) | — | — | — | — | (5,678 | ) | — | — | 35,181 | (289 | ) | ||||||||||||||||||||||||||||||
|
Asset-backed securities |
684,637 | 18,692 | (1,341 | ) | 315,865 | — | (195,851 | ) | (194,324 | ) | — | — | 627,678 | 15,528 | ||||||||||||||||||||||||||||||
|
Other debt securities |
33,450 | 1,698 | — | — | — | — | — | — | — | 35,148 | 1,698 | |||||||||||||||||||||||||||||||||
|
Equity securities |
44,126 | 2,266 | — | 18,524 | — | (358 | ) | (9,437 | ) | 22 | — | 55,143 | 1,071 | |||||||||||||||||||||||||||||||
|
Trading derivatives—net |
12,119 | (5,871 | ) (2) | (744 | ) | 787 | (682 | ) | — | 37 | 20,192 | 10,332 | 36,170 | (25,241 | ) (2) | |||||||||||||||||||||||||||||
|
Interest rate contracts—net |
14,596 | 12,397 | 57 | — | (119 | ) | — | (25,601 | ) | (7,013 | ) | 1,494 | (4,189 | ) | 11,507 | |||||||||||||||||||||||||||||
|
Foreign exchange contracts—net |
6,736 | (10,997 | ) | (419 | ) | 210 | — | — | (322 | ) | 27,230 | (5) | (4,247 | ) | 18,191 | (10,451 | ) | |||||||||||||||||||||||||||
|
Equity contracts—net |
(10,685 | ) | 18,756 | (374 | ) | 13 | (228 | ) | — | (17,680 | ) | (25 | ) (5) | 13,085 | (5) | 2,862 | (752 | ) | ||||||||||||||||||||||||||
|
Commodity contracts—net |
683 | 32 | 6 | 564 | (335 | ) | — | (1 | ) | — | — | 949 | 795 | |||||||||||||||||||||||||||||||
|
Credit derivatives—net |
789 | (26,059 | ) | (14 | ) | — | — | — | 43,641 | — | — | 18,357 | (26,340 | ) | ||||||||||||||||||||||||||||||
|
Investment securities: |
||||||||||||||||||||||||||||||||||||||||||||
|
Available-for-sale debt securities |
350,660 | 6,415 | (3) | (9,791 | ) | 273,201 | — | — | (338,180 | ) | 1,456 | (327 | ) | 283,434 | (498 | ) (3) | ||||||||||||||||||||||||||||
|
Foreign government and official institution bonds |
20,192 | — | (876 | ) | 645 | — | — | (715 | ) | — | — | 19,246 | — | |||||||||||||||||||||||||||||||
|
Corporate bonds |
6,037 | (345 | ) | 3 | 3,450 | — | — | (6,078 | ) | 1,456 | (5) | (327 | ) (5) | 4,196 | (498 | ) | ||||||||||||||||||||||||||||
|
Residential mortgage-backed securities |
15 | — | — | — | — | — | — | — | — | 15 | — | |||||||||||||||||||||||||||||||||
|
Commercial mortgage-backed securities |
2,430 | — | (135 | ) | — | — | — | (257 | ) | — | — | 2,038 | — | |||||||||||||||||||||||||||||||
|
Asset-backed securities |
161,172 | 6,760 | (5,016 | ) | 263,587 | — | — | (295,048 | ) | — | — | 131,455 | — | |||||||||||||||||||||||||||||||
|
Other debt securities |
160,814 | — | (3,767 | ) | 5,519 | — | — | (36,082 | ) | — | — | 126,484 | — | |||||||||||||||||||||||||||||||
|
Equity securities |
28,359 | (2,298 | ) (3) | — | 3,795 | — | (1,418 | ) | — | — | (618 | ) | 27,820 | (3,060 | ) (3) | |||||||||||||||||||||||||||||
|
Nonmarketable equity securities |
28,359 | (2,298 | ) | — | 3,795 | — | (1,418 | ) | — | — | (618 | ) | 27,820 | (3,060 | ) | |||||||||||||||||||||||||||||
|
Others |
8,660 | (1,022 | ) (7) | (20 | ) | 24,961 | — | (206 | ) | — | 5 | — | 32,378 | (1,191 | ) (7) | |||||||||||||||||||||||||||||
|
|
|
|
|
|
|
|
|
|
|
|
|
|
|
|
|
|
|
|
|
|
|
|||||||||||||||||||||||
|
Total |
¥ | 1,227,291 | ¥ | 21,072 | ¥ | (11,896 | ) | ¥ | 756,792 | ¥ | (682 | ) | ¥ | (318,008 | ) | ¥ | (552,087 | ) | ¥ | 51,098 | ¥ | (8,452 | ) | ¥ | 1,165,128 | ¥ | (11,691 | ) | ||||||||||||||||
|
|
|
|
|
|
|
|
|
|
|
|
|
|
|
|
|
|
|
|
|
|
|
|||||||||||||||||||||||
|
Liabilities |
||||||||||||||||||||||||||||||||||||||||||||
|
Others |
¥ | (25,528 | ) | ¥ | (19,629 | ) (4) | ¥ | 6,670 | ¥ | — | ¥ | 16,759 | ¥ | — | ¥ | (18,499 | ) | ¥ | 44,727 | (6) | ¥ | 35,230 | (6) | ¥ | 65,648 | ¥ | (10,778 | ) (4) | ||||||||||||||||
|
|
|
|
|
|
|
|
|
|
|
|
|
|
|
|
|
|
|
|
|
|
|
|||||||||||||||||||||||
|
Total |
¥ | (25,528 | ) | ¥ | (19,629 | ) | ¥ | 6,670 | ¥ | — | ¥ | 16,759 | ¥ | — | ¥ | (18,499 | ) | ¥ | 44,727 | ¥ | 35,230 | ¥ | 65,648 | ¥ | (10,778 | ) | ||||||||||||||||||
|
|
|
|
|
|
|
|
|
|
|
|
|
|
|
|
|
|
|
|
|
|
|
|||||||||||||||||||||||
Notes:
| (1) | Includes Trading securities measured under the fair value option. |
| (2) | Included in Trading account profits (losses)—net and in Foreign exchange losses—net. |
| (3) | Included in Investment securities gains (losses)—net. |
| (4) | Included in Trading account profits (losses)—net. |
| (5) | Transfers into Level 3 for Foreign exchange contract were mainly caused by the valuation using certain unobservable input. Transfers into (out of) Level 3 for corporate bonds were caused by the decrease (increase) in liquidity or the availability of the quoted prices provided by third-party venders and Equity contracts—net were mainly caused by the change of valuation model and the change cease using certain unobservable input. |
| (6) | Transfers into (out of) Level 3 for bifurcated embedded derivatives in Others were mainly caused by the decrease (increase) in the observability of the key inputs to the valuation models and a corresponding increase (decrease) in the significance of the unobservable inputs. |
| (7) | Included in Other non-interest income. |
| (8) | The table above reflects changes in presentation that were made to equity investment securities at March 31, 2018. See Note 1 for further information. |
F-149
Table of Contents
MITSUBISHI UFJ FINANCIAL GROUP, INC. AND SUBSIDIARIES
NOTES TO CONSOLIDATED FINANCIAL STATEMENTS—(Continued)
Quantitative Information about Level 3 Fair Value Measurements
The following tables present information on the valuation techniques, significant unobservable inputs and their ranges for each major category of assets and liabilities measured at fair value on a recurring basis and classified in Level 3:
|
At March 31, 2018 |
Fair value (1) |
Valuation technique |
Significant unobservable inputs |
Range |
Weighted
Average (2) |
|||||||||
| (in millions) | ||||||||||||||
|
Assets |
||||||||||||||
|
Trading securities and Investment securities: |
||||||||||||||
|
Foreign government and official institution bonds |
¥ | 20,192 | Return on equity method |
Probability of default |
0.0%~0.4% | 0.2 | % | |||||||
|
Recovery rate |
60.0%~70.0% | 66.7 | % | |||||||||||
|
Market-required return on capital |
8.0%~10.0% | 9.5 | % | |||||||||||
|
Residential mortgage-backed securities, Commercial mortgage-backed securities and Asset-backed securities |
110,536 | Discounted cash flow |
Probability of default |
1.2%~5.3% | 4.5 | % | ||||||||
|
Recovery rate |
60.0%~76.0% | 66.3 | % | |||||||||||
| 684,586 | Internal model (4) |
Asset correlations |
9.0% | 9.0 | % | |||||||||
|
Discount factor |
1.0% | 1.0 | % | |||||||||||
|
Prepayment rate |
37.2% | 37.2 | % | |||||||||||
|
Probability of default |
0.0%~91.3% | — | (3) | |||||||||||
|
Recovery rate |
65.3% | 65.3 | % | |||||||||||
|
Other debt securities |
33,450 | Discounted cash flow |
Liquidity premium |
0.5%~2.4% | 0.8 | % | ||||||||
| 149,759 | Return on equity method |
Probability of default |
0.0%~25.0% | 0.3 | % | |||||||||
|
Recovery rate |
40.0%~90.0% | 72.5 | % | |||||||||||
|
Market-required return on capital |
8.0%~10.0% | 9.7 | % | |||||||||||
|
At March 31, 2018 |
Fair value (1) |
Valuation technique |
Significant unobservable inputs |
Range |
||||||
| (in millions) | ||||||||||
|
Trading derivatives—net: |
||||||||||
|
Interest rate contracts—net |
14,460 | Option model | Probability of default | 0.0%~12.5% | ||||||
| Correlation between interest rates | 34.1%~52.7% | |||||||||
|
Correlation between interest rate and foreign exchange rate |
19.7%~50.4% | |||||||||
| Recovery rate | 41.0%~46.0% | |||||||||
| Volatility | 13.4%~100.0% | |||||||||
| Probability of prepayment | 100.0% | |||||||||
|
Foreign exchange contracts—net |
6,779 | Option model | Probability of default | 0.0%~12.5% | ||||||
|
Correlation between interest rates |
40.3%~74.0% | |||||||||
|
Correlation between interest rate and foreign exchange rate |
28.1%~50.7% | |||||||||
|
Recovery rate |
41.0%~46.0% | |||||||||
|
Correlation between underlying assets |
85.0% | |||||||||
|
Volatility |
10.3%~16.2% | |||||||||
|
Equity contracts—net |
(16,600 | ) | Option model |
Correlation between interest rate and equity |
37.1%~39.0% | |||||
|
Correlation between foreign exchange rate and equity |
7.0%~65.2% | |||||||||
| Correlation between equities | 20.6%~81.7% | |||||||||
| Correlation between underlying assets | 76.0% | |||||||||
| 6,528 | Discounted cash flow | Term of litigation | 2.0 years | |||||||
F-150
Table of Contents
MITSUBISHI UFJ FINANCIAL GROUP, INC. AND SUBSIDIARIES
NOTES TO CONSOLIDATED FINANCIAL STATEMENTS—(Continued)
|
At March 31, 2019 |
Fair value (1) |
Valuation technique |
Significant unobservable inputs |
Range |
Weighted
Average (2) |
|||||||||
| (in millions) | ||||||||||||||
|
Assets |
||||||||||||||
|
Trading securities and Investment securities: |
||||||||||||||
|
Foreign government and official institution bonds |
¥ | 19,246 | Return on equity method |
Probability of default |
0.0%~0.4% | 0.3 | % | |||||||
|
Recovery rate |
60.0%~70.0% | 66.7 | % | |||||||||||
|
Market-required return on capital |
10.0% | 10.0 | % | |||||||||||
|
Residential mortgage-backed securities, Commercial mortgage-backed securities and Asset-backed securities |
109,213 | Discounted cash flow |
Probability of default |
1.2%~5.3% | 5.0 | % | ||||||||
|
Recovery rate |
60.0%~76.0% | 67.2 | % | |||||||||||
|
Loan price |
90.5%~100.3% | 95.4 | % | |||||||||||
| 587,577 | Internal model (4) |
Asset correlations |
10.0% | 10.0 | % | |||||||||
|
Discount factor |
1.0%~1.2% | 1.2 | % | |||||||||||
|
Prepayment rate |
22.7% | 22.7 | % | |||||||||||
|
Probability of default |
0.0%~90.1% | — | (3) | |||||||||||
|
Recovery rate |
64.3% | 64.3 | % | |||||||||||
|
Other debt securities |
35,148 | Discounted cash flow |
Liquidity premium |
1.0%~2.4% | 1.3 | % | ||||||||
| 112,822 | Return on equity method |
Probability of default |
0.0%~25.0% | 0.3 | % | |||||||||
|
Recovery rate |
40.0%~90.0% | 78.0 | % | |||||||||||
|
Market-required return on capital |
8.0%~10.0% | 9.5 | % | |||||||||||
|
At March 31, 2019 |
Fair value (1) |
Valuation technique |
Significant unobservable inputs |
Range |
||||||
| (in millions) | ||||||||||
|
Trading derivatives—net: |
||||||||||
|
Interest rate contracts—net |
(4,189 | ) | Option model | Probability of default | 0.0%~12.0% | |||||
| Correlation between interest rates | 29.2%~51.3% | |||||||||
|
Correlation between interest rate and foreign exchange rate |
22.8%~60.0% | |||||||||
| Recovery rate | 41.0%~48.0% | |||||||||
| Volatility | 11.0%~71.3% | |||||||||
|
Foreign exchange contracts—net |
18,198 | Option model | Probability of default | 0.0%~12.0% | ||||||
|
Correlation between interest rates |
35.0%~70.0% | |||||||||
|
Correlation between interest rate and foreign exchange rate |
14.8%~60.0% | |||||||||
|
Recovery rate |
41.0%~48.0% | |||||||||
|
Correlation between underlying assets |
65.0% | |||||||||
|
Volatility |
9.7%~18.2% | |||||||||
|
Equity contracts—net |
(2,727 | ) | Option model |
Correlation between foreign exchange rate and equity |
7.0%~64.1% | |||||
| Correlation between equities | 21.6%~80.3% | |||||||||
| Correlation between underlying assets | 51.7%~82.0% | |||||||||
| Volatility | 21.0%~30.0% | |||||||||
| 5,878 | Discounted cash flow | Term of litigation | 1.0 year | |||||||
Notes:
| (1) | The fair value as of March 31, 2018 and 2019 excludes the fair value of investments valued using vendor prices. |
| (2) | Weighted averages are calculated by weighing each input by the relative fair value of the respective financial instruments. |
| (3) | See “Probability of default” in “Sensitivity to and range of unobservable inputs.” |
| (4) | For further detail of Internal model, refer to the last paragraph of “Trading Account Assets and Liabilities—Trading Account Securities.” |
F-151
Table of Contents
MITSUBISHI UFJ FINANCIAL GROUP, INC. AND SUBSIDIARIES
NOTES TO CONSOLIDATED FINANCIAL STATEMENTS—(Continued)
Sensitivity to and range of unobservable inputs
Probability of default —Probability of default is an estimate of the likelihood that the default event will occur and the MUFG Group will be unable to collect the contractual amounts. A significant increase (decrease) in the default rate would result in a significant decrease (increase) in a fair value through a decrease (increase) in the estimated cash flows. Probability of default used in internal model of Residential mortgage-backed securities, Commercial mortgage-backed securities and Asset-backed securities represents that of underlying assets, whereas probability of default used in other valuation techniques represents the counterparty default risks, determined through the MUFG Group’s credit rating system.
The wide range of probability of default used in the internal model of Residential mortgage-backed securities, Commercial mortgage-backed securities and Asset-backed securities is mainly caused by Asset-backed securities. Asset-backed securities have a large number of underlying loans, mainly corporate loans, in several industries. The MUFG Group primarily makes investments in the senior tranches of such securities, with no investments in the equity portion. Thus, the MUFG Group’s investments have higher priority of payments than mezzanine and equity and even if some of underlying loans become default, the MUFG Group may still be able to receive the full contractual payments.
For derivative contracts, the MUFG Group holds positions with a large number of counterparties with various credit quality, which results in wider range of probability of default. However, the majority of counterparties have higher ratings, categorized as “Normal” in the internal credit rating system, the inputs used to estimate fair value of derivative contracts are concentrated in the lower end of the range.
Discount factor and Liquidity premium —Discount factor and liquidity premium are adjustments to discount rates to reflect uncertainty of cash flows and liquidity of the instruments. When recent prices of similar instruments are unobservable in inactive or less active markets, discount rates are adjusted based on the facts and circumstances of the markets including the availability of quotes and the time since the latest available quotes. A significant increase (decrease) in discount rate would result in a significant decrease (increase) in a fair value.
Recovery rate and Prepayment rate —Recovery rate is the proportion of the total outstanding balance of a bond or loan that is expected to be collected in a liquidation scenario. For many debt securities (such as asset-backed securities), there is no directly observable market input for recovery, but indications of recovery levels are available from third-party pricing services. The assumed recovery of a security may differ from its actual recovery that will be observable in the future. Prepayment rate represents the proportion of principal that is expected to be paid prematurely in each period on a security or pool of securities. Prepayment rates change the future cash flows for the investor and thereby change the fair value of the security. Recovery rate and prepayment rate would affect estimation of future cash flows to a certain extent and changes in these inputs could result in a significant increase or decrease in fair value.
Volatility —Volatility is a measure of the speed and severity of market price changes and is a key factor in pricing. Typically, instruments can become more expensive if volatility increases. A significant increase (decrease) in volatility would cause a significant increase (decrease) in the value of an option resulting in the significant increase (decrease) in fair value.
The level of volatility generally depends on the tenor of the underlying instrument and the strike price or level defined in the contract. Volatilities for certain combinations of tenor and strike price are not observable. The volatility inputs used to estimate fair value of interest rate contracts are distributed throughout the range.
F-152
Table of Contents
MITSUBISHI UFJ FINANCIAL GROUP, INC. AND SUBSIDIARIES
NOTES TO CONSOLIDATED FINANCIAL STATEMENTS—(Continued)
Correlation —Correlation is a measure of the relationship between the movements of two variables (i.e. how the change in one variable influences a change in the other variables). A variety of correlation-related assumptions are required for a wide range of instruments including foreign government and official institution bonds, asset-backed securities, corporate bonds, derivatives and certain other instruments. In most cases, correlations used are not observable in the market and must be estimated using historical information. Changes in correlation inputs can have a major impact, favorable or unfavorable, on the value of an instrument, depending on its nature. In addition, the wide range of correlation inputs are primarily due to the complex and unique nature of these instruments. There are many different types of correlation inputs, including cross-asset correlation (such as correlation between interest rate and equity), and same-asset correlation (such as correlation between interest rates). Correlation levels are highly dependent on market conditions and could have a relatively wide range of levels within or across asset classes.
For interest rate contracts and foreign exchange contracts, the diversity in the portfolio held by the MUFG Group is reflected in wide ranges of correlation, as the fair values of transactions with a variety of currencies and tenors are determined using several foreign exchange and interest rate curves. For equity derivative contracts, the wide range of correlation between interest rate and equity is primarily due to the large number of correlation pairs with different maturities of contracts. For credit derivative contracts, the wide range of correlation between underlying assets is primarily due to factors such as reference assets with different maturities, capital structure subordinations, and credit quality.
Term of litigation —Term of litigation is the estimated period until the resolution of a certain litigation matter that relates to an issuer’s restricted shares (“Covered Litigation”) that the MUFG Group purchased, which is referenced in certain swap transactions.
These swaps are valued using a discounted cash flow methodology and are dependent upon the final resolution of the Covered Litigation. The settlement timing of the Covered Litigation is not observable in the market, therefore the estimated term is classified as a level 3 input.
The restricted shares which the MUFG Group purchased will be convertible to listed shares of the issuer at the end of the Covered Litigation. The restricted shares will be diluted dependent upon the settlement amount of the Covered Litigation and the dilution of the restricted shares is accomplished through an adjustment to the conversion rate of the restricted shares. In order to hedge the reduction of the conversion rate, the MUFG Group entered into certain swaps with the seller which references the conversion rate. The value generated by these trades is subject to the ultimate term of the issuer’s litigation, subject to a minimum term referenced within the trade contracts.
Market-required return on capital —Market-required return on capital is the return on capital expected by the secondary market. A significant increase (decrease) in the market-required return on capital would result in a significant decrease (increase) in a fair value of a financial asset.
Loan Price —Loan price refers to independent valuations which are supported by a number of third-party quotes. A significant increase (decrease) in the loan price would result in a significant increase (decrease) in a fair value of a financial asset.
Assets and Liabilities Measured at Fair Value on a Nonrecurring Basis
Certain assets and liabilities may be measured at fair value on a nonrecurring basis in periods subsequent to their initial recognition. These assets are subject to fair value adjustments that result from the application of the
F-153
Table of Contents
MITSUBISHI UFJ FINANCIAL GROUP, INC. AND SUBSIDIARIES
NOTES TO CONSOLIDATED FINANCIAL STATEMENTS—(Continued)
lower of cost or fair value accounting, write-downs of individual assets or the measurement alternative for nonmarketable equity securities. The following table presents the carrying value of assets measured at fair value on a nonrecurring basis by level within the fair value hierarchy as of March 31, 2018 and 2019:
| 2018 | 2019 | |||||||||||||||||||||||||||||||
| Level 1 | Level 2 | Level 3 |
Total
carrying value |
Level 1 | Level 2 | Level 3 |
Total
carrying value |
|||||||||||||||||||||||||
| (in millions) | ||||||||||||||||||||||||||||||||
|
Assets |
||||||||||||||||||||||||||||||||
|
Investment securities (1)(2) |
¥ | — | ¥ | — | ¥ | 1,984 | ¥ | 1,984 | ¥ | — | ¥ | 80,779 | ¥ | 4,208 | ¥ | 84,987 | ||||||||||||||||
|
Loans |
3,458 | 8,329 | 239,653 | 251,440 | 2,656 | 9,104 | 250,678 | 262,438 | ||||||||||||||||||||||||
|
Loans held for sale |
— | — | 22,835 | 22,835 | — | — | 77,506 | 77,506 | ||||||||||||||||||||||||
|
Collateral dependent loans |
3,458 | 8,329 | 216,818 | 228,605 | 2,656 | 9,104 | 173,172 | 184,932 | ||||||||||||||||||||||||
|
Premises and equipment |
— | — | 34,326 | 34,326 | — | — | 35,352 | 35,352 | ||||||||||||||||||||||||
|
Intangible assets |
— | — | 9,402 | 9,402 | — | — | 19,635 | 19,635 | ||||||||||||||||||||||||
|
Other assets |
92,223 | — | 6,196 | 98,419 | 136,528 | 49,756 | 9,774 | 196,058 | ||||||||||||||||||||||||
|
Investments in equity method investees (1) |
92,223 | — | — | 92,223 | 136,528 | 49,756 | — | 186,284 | ||||||||||||||||||||||||
|
Other |
— | — | 6,196 | 6,196 | — | — | 9,774 | 9,774 | ||||||||||||||||||||||||
|
|
|
|
|
|
|
|
|
|
|
|
|
|
|
|
|
|||||||||||||||||
|
Total |
¥ | 95,681 | ¥ | 8,329 | ¥ | 291,561 | ¥ | 395,571 | ¥ | 139,184 | ¥ | 139,639 | ¥ | 319,647 | ¥ | 598,470 | ||||||||||||||||
|
|
|
|
|
|
|
|
|
|
|
|
|
|
|
|
|
|||||||||||||||||
Notes:
| (1) | Excludes certain investments valued at net asset value of ¥8,443 million and ¥8,866 million at March 31, 2018 and 2019, respectively. The unfunded commitments related to these investments are ¥1,544 million and ¥12,242 million at March 31, 2018 and 2019, respectively. These investments are in private equity funds and limited partnerships. |
| (2) | Includes certain nonmarketable equity securities that are measured at fair value on a nonrecurring basis, including impairment and observable price change for nonmarketable equity securities measured under the measurement alternative. |
The following table presents losses (gains) recorded as a result of changes in the fair value of assets measured at fair value on a nonrecurring basis for the fiscal years ended March 31, 2018 and 2019:
| 2018 | 2019 | |||||||
| (in millions) | ||||||||
|
Investment securities |
¥ | 1,423 | ¥ | (50,785 | ) | |||
|
Loans |
47,352 | 30,153 | ||||||
|
Loans held for sale |
990 | 4,762 | ||||||
|
Collateral dependent loans |
46,362 | 25,391 | ||||||
|
Premises and equipment |
39,361 | 31,345 | ||||||
|
Intangible assets |
21,900 | 118,108 | ||||||
|
Other assets |
30,852 | 59,557 | ||||||
|
Investments in equity method investees |
29,442 | 51,645 | ||||||
|
Other |
1,410 | 7,912 | ||||||
|
|
|
|
|
|||||
|
Total |
¥ | 140,888 | ¥ | 188,378 | ||||
|
|
|
|
|
|||||
F-154
Table of Contents
MITSUBISHI UFJ FINANCIAL GROUP, INC. AND SUBSIDIARIES
NOTES TO CONSOLIDATED FINANCIAL STATEMENTS—(Continued)
Investment securities for the year ended March 31, 2018 primarily include impaired cost-method investments which were written down to fair value during the period. The fair values are determined based on recent net asset value and projected future cash flows of investees. Investment securities for the year ended March 31, 2019 primarily include nonmarketable equity securities measured under the measurement alternative. See Note 3 for the details of the measurement alternative.
Loans include loans held for sale and collateral dependent loans. Loans held for sale are recorded at the lower of cost or estimated fair value. The fair value of the loans held for sale is based on secondary market prices, recent transactions or discounted cash flows. These loans are principally classified in Level 3 of the fair value hierarchy, and when quoted prices are available but not traded actively, such loans held for sale are classified in Level 2 of the fair value hierarchy. Collateral dependent loans are measured at fair value of the underlying collateral. Collateral is comprised mainly of real estate and exchange-traded equity securities. The MUFG Group maintains an established process for internally determining the fair value of real estate, using the following valuation techniques and assumptions. Collateral dependent loans that are measured based on underlying real estate collateral are classified in Level 3 of the fair value hierarchy.
| • |
Replacement cost approach . The replacement cost approach is primarily used for buildings and the land they are built on. This approach calculates the fair value of the collateral using the replacement cost of the property as of the valuation date. Replacement cost tables and useful life tables used for this approach are developed by subsidiaries of MUFG. |
| • |
Sales comparison approach . The sales comparison approach is mainly used for land. The fair value of the collateral located in Japan is based on Japanese government official land prices and standard land prices, considering the results of comparison analysis between the official roadside value which is used for tax purposes and the related government official land and standard land prices. |
| • |
Income approach . The income approach is, as a general rule, applied to all rental properties based on the highest and best use concept. This approach calculates the fair value of the collateral using expected future cash flows. In this approach, the expected annual net operating income is discounted using the related capitalization yield. The significant assumptions within the income approach are the expected annual net operating income and capitalization yield. The expected annual net operating income is estimated based on rental income of the property. The capitalization yield is determined based on the location and use of the property by subsidiaries of MUFG. The capitalization yield may be adjusted to reflect the trends in locations, occupancy rates and rent level and other factors. |
Premises and equipment consist of those assets which were written down to fair value. The fair values are determined based on prices obtained from an appraiser or discounted cash flows. These impaired premises and equipment are classified as Level 3 of the fair value hierarchy.
Intangible assets consist of those assets which were written down to fair value. The fair values are determined based on discounted cash flows. These impaired intangible assets are classified as Level 3 of the fair value hierarchy.
Other assets mainly consist of investments in equity method investees which were written down to fair value due to impairment. When investments in equity method investees are marketable equity securities, the fair values are determined based on quoted prices. Impaired investments in equity method investees which are marketable equity securities are classified in either Level 1 or Level 2 of the fair value hierarchy. When investments in equity method investees are nonmarketable equity securities, the fair values are determined using the same methodologies as those for impaired nonmarketable equity securities described above. Impaired investments in equity method investees which are nonmarketable equity securities are classified in Level 3 of the fair value hierarchy.
F-155
Table of Contents
MITSUBISHI UFJ FINANCIAL GROUP, INC. AND SUBSIDIARIES
NOTES TO CONSOLIDATED FINANCIAL STATEMENTS—(Continued)
Fair Value Option
The MUFG Group elected the fair value option for foreign currency-denominated debt securities and equity securities held by MUFG Bank and Mitsubishi UFJ Trust and Banking. The election was made to mitigate accounting mismatches related to fluctuations of foreign exchange rates by allowing the gains and losses on translation of these securities to be included in current earnings. The gains and losses on translation of debt securities without the fair value option, are included in OCI, while the gains and losses on translation of foreign currency-denominated financial liabilities are included in current earnings. As a result of adopting the new guidance issued in January 2016, as described in Note 1, the gains and losses on change in fair value of equity securities with or without fair value option are included in current earnings.
The MUFG Group also elected the fair value option for certain financial instruments held by Mitsubishi UFJ Securities Holdings’s foreign subsidiaries because those financial instruments are managed on a fair value basis, and these exposures are considered to be trading-related positions. These financial assets are included in Other assets. These financial liabilities are mainly included in Other short-term borrowings and Long-term debt. Unrealized gains and losses on such financial instruments are recognized in the accompanying consolidated statements of income.
The following table presents the gains or losses recorded for the fiscal years ended March 31, 2017, 2018 and 2019 related to the eligible instruments for which the MUFG Group elected the fair value option:
| 2017 | 2018 | 2019 | ||||||||||||||||||||||||||||||||||
|
Trading
account profits (losses) |
Foreign
exchange gains (losses) |
Total
changes in fair value |
Trading
account profits (losses) |
Foreign
exchange gains (losses) |
Total
changes in fair value |
Trading
account profits (losses) |
Foreign
exchange gains (losses) |
Total
changes in fair value |
||||||||||||||||||||||||||||
| (in millions) | ||||||||||||||||||||||||||||||||||||
|
Financial assets: |
||||||||||||||||||||||||||||||||||||
|
Trading account securities (1) |
¥ | (464,947 | ) | ¥ | (407,439 | ) | ¥ | (872,386 | ) | ¥ | (148,242 | ) | ¥ | (267,507 | ) | ¥ | (415,749 | ) | ¥ | 208,952 | ¥ | 186,578 | ¥ | 395,530 | ||||||||||||
|
|
|
|
|
|
|
|
|
|
|
|
|
|
|
|
|
|
|
|||||||||||||||||||
|
Total |
¥ | (464,947 | ) | ¥ | (407,439 | ) | ¥ | (872,386 | ) | ¥ | (148,242 | ) | ¥ | (267,507 | ) | ¥ | (415,749 | ) | ¥ | 208,952 | ¥ | 186,578 | ¥ | 395,530 | ||||||||||||
|
|
|
|
|
|
|
|
|
|
|
|
|
|
|
|
|
|
|
|||||||||||||||||||
|
Financial liabilities: |
||||||||||||||||||||||||||||||||||||
|
Other short-term borrowings (2) |
¥ | (10,380 | ) | ¥ | — | ¥ | (10,380 | ) | ¥ | 5,902 | ¥ | — | ¥ | 5,902 | ¥ | (5,559 | ) | ¥ | — | ¥ | (5,559 | ) | ||||||||||||||
|
Long-term debt (2) |
(93,464 | ) | — | (93,464 | ) | 7,554 | — | 7,554 | (8,322 | ) | — | (8,322 | ) | |||||||||||||||||||||||
|
|
|
|
|
|
|
|
|
|
|
|
|
|
|
|
|
|
|
|||||||||||||||||||
|
Total |
¥ | (103,844 | ) | ¥ | — | ¥ | (103,844 | ) | ¥ | 13,456 | ¥ | — | ¥ | 13,456 | ¥ | (13,881 | ) | ¥ | — | ¥ | (13,881 | ) | ||||||||||||||
|
|
|
|
|
|
|
|
|
|
|
|
|
|
|
|
|
|
|
|||||||||||||||||||
Notes:
| (1) | Excludes Danamon’s equity securities. See Note 2 for reference. |
| (2) | Change in value attributable to the instrument-specific credit risk related to those financial liabilities are not material. |
F-156
Table of Contents
MITSUBISHI UFJ FINANCIAL GROUP, INC. AND SUBSIDIARIES
NOTES TO CONSOLIDATED FINANCIAL STATEMENTS—(Continued)
The following table presents the differences between the aggregate fair value and the aggregate remaining contractual principal balance outstanding as of March 31, 2018 and 2019 for long-term debt instruments for which the fair value option has been elected:
| 2018 | 2019 | |||||||||||||||||||||||
|
Remaining
aggregate contractual amounts outstanding |
Fair value |
Fair value
over (under) remaining aggregate contractual amounts outstanding |
Remaining
aggregate contractual amounts outstanding |
Fair value |
Fair value
over (under) remaining aggregate contractual amounts outstanding |
|||||||||||||||||||
| (in millions) | ||||||||||||||||||||||||
|
Financial liabilities: |
||||||||||||||||||||||||
|
Long-term debt |
¥ | 347,002 | ¥ | 333,985 | ¥ | (13,017 | ) | ¥ | 358,730 | ¥ | 325,808 | ¥ | (32,922 | ) | ||||||||||
|
|
|
|
|
|
|
|
|
|
|
|
|
|||||||||||||
|
Total |
¥ | 347,002 | ¥ | 333,985 | ¥ | (13,017 | ) | ¥ | 358,730 | ¥ | 325,808 | ¥ | (32,922 | ) | ||||||||||
|
|
|
|
|
|
|
|
|
|
|
|
|
|||||||||||||
Interest income and expense related to the assets and liabilities for which the fair value option is elected are measured based on the contractual rates and dividend income related to these assets are recognized when the shareholder right to receive the dividend is established. These interest income and expense and dividend income are reported in the accompanying consolidated statements of income as either interest income or expense, depending on the nature of the related asset or liability.
F-157
Table of Contents
MITSUBISHI UFJ FINANCIAL GROUP, INC. AND SUBSIDIARIES
NOTES TO CONSOLIDATED FINANCIAL STATEMENTS—(Continued)
Estimated Fair Value of Financial Instruments
The following is a summary of carrying amounts and estimated fair values by level within the fair value hierarchy of financial instruments which are not carried at fair value on a recurring basis in the accompanying consolidated balance sheets as of March 31, 2018 and 2019:
|
Carrying
amount |
Estimated fair value | |||||||||||||||||||
|
At March 31, 2018 |
Total | Level 1 | Level 2 | Level 3 | ||||||||||||||||
| (in billions) | ||||||||||||||||||||
|
Financial assets: |
||||||||||||||||||||
|
Cash and due from banks |
¥ | 32,648 | ¥ | 32,648 | ¥ | 32,648 | ¥ | — | ¥ | — | ||||||||||
|
Interest-earning deposits in other banks |
43,210 | 43,210 | — | 43,210 | — | |||||||||||||||
|
Call loans and funds sold |
896 | 896 | — | 896 | — | |||||||||||||||
|
Receivables under resale agreements |
5,726 | 5,726 | — | 5,726 | — | |||||||||||||||
|
Receivables under securities borrowing transactions |
9,269 | 9,269 | — | 9,269 | — | |||||||||||||||
|
Investment securities (1)(2) |
3,684 | 3,797 | 1,197 | 1,051 | 1,549 | |||||||||||||||
|
Loans, net of allowance for credit losses (3) |
116,272 | 117,753 | 3 | 330 | 117,420 | |||||||||||||||
|
Other financial assets (4) |
7,000 | 7,000 | — | 7,000 | — | |||||||||||||||
|
Financial liabilities: |
||||||||||||||||||||
|
Deposits |
||||||||||||||||||||
|
Non-interest-bearing |
¥ | 29,862 | ¥ | 29,862 | ¥ | — | ¥ | 29,862 | ¥ | — | ||||||||||
|
Interest-bearing |
165,831 | 165,825 | — | 165,825 | — | |||||||||||||||
|
Total deposits |
195,693 | 195,687 | — | 195,687 | — | |||||||||||||||
|
Call money and funds purchased |
2,453 | 2,453 | — | 2,453 | — | |||||||||||||||
|
Payables under repurchase agreements |
18,135 | 18,135 | — | 18,135 | — | |||||||||||||||
|
Payables under securities lending transactions |
8,170 | 8,170 | — | 8,170 | — | |||||||||||||||
|
Due to trust account |
3,386 | 3,386 | — | 3,386 | — | |||||||||||||||
|
Other short-term borrowings |
6,617 | 6,617 | — | 6,617 | — | |||||||||||||||
|
Long-term debt |
26,861 | 26,919 | — | 26,919 | — | |||||||||||||||
|
Other financial liabilities |
6,642 | 6,642 | — | 6,642 | — | |||||||||||||||
F-158
Table of Contents
MITSUBISHI UFJ FINANCIAL GROUP, INC. AND SUBSIDIARIES
NOTES TO CONSOLIDATED FINANCIAL STATEMENTS—(Continued)
|
Carrying
amount |
Estimated fair value | |||||||||||||||||||
|
At March 31, 2019 |
Total | Level 1 | Level 2 | Level 3 | ||||||||||||||||
| (in billions) | ||||||||||||||||||||
|
Financial assets: |
||||||||||||||||||||
|
Cash and due from banks |
¥ | 33,924 | ¥ | 33,924 | ¥ | 33,924 | ¥ | — | ¥ | — | ||||||||||
|
Interest-earning deposits in other banks |
40,647 | 40,647 | — | 40,647 | — | |||||||||||||||
|
Call loans and funds sold |
1,110 | 1,110 | — | 1,110 | — | |||||||||||||||
|
Receivables under resale agreements |
10,975 | 10,975 | — | 10,975 | — | |||||||||||||||
|
Receivables under securities borrowing transactions |
2,759 | 2,759 | — | 2,759 | — | |||||||||||||||
|
Investment securities |
4,442 | 4,453 | 1,197 | 1,135 | 2,121 | |||||||||||||||
|
Loans, net of allowance for credit losses (3) |
116,213 | 117,064 | 3 | 247 | 116,814 | |||||||||||||||
|
Other financial assets (4) |
7,455 | 7,455 | — | 7,455 | — | |||||||||||||||
|
Financial liabilities: |
||||||||||||||||||||
|
Deposits |
||||||||||||||||||||
|
Non-interest-bearing |
¥ | 30,443 | ¥ | 30,443 | ¥ | — | ¥ | 30,443 | ¥ | — | ||||||||||
|
Interest-bearing |
168,846 | 168,899 | — | 168,899 | — | |||||||||||||||
|
Total deposits |
199,289 | 199,342 | — | 199,342 | — | |||||||||||||||
|
Call money and funds purchased |
2,450 | 2,450 | — | 2,450 | — | |||||||||||||||
|
Payables under repurchase agreements |
25,225 | 25,225 | — | 25,225 | — | |||||||||||||||
|
Payables under securities lending transactions |
913 | 913 | — | 913 | — | |||||||||||||||
|
Due to trust account |
2,736 | 2,736 | — | 2,736 | — | |||||||||||||||
|
Other short-term borrowings |
6,441 | 6,441 | — | 6,441 | — | |||||||||||||||
|
Long-term debt |
27,790 | 27,968 | — | 27,968 | — | |||||||||||||||
|
Other financial liabilities |
6,781 | 6,781 | — | 6,781 | — | |||||||||||||||
Notes:
| (1) | Includes impaired securities measured at fair value on a nonrecurring basis at March 31, 2018. Refer to “Assets and Liabilities Measured at Fair Value on a Nonrecurring Basis” for the details of the level classification. |
| (2) | Excludes cost-method investments of ¥437 billion at March 31, 2018, of which the MUFG Group did not estimate the fair value since it was not practical and no impairment indicators were identified. See Note 3 for the details of these cost-method investments. |
| (3) | Includes loans held for sale and collateral dependent loans measured at fair value on a nonrecurring basis. Refer to “Assets and Liabilities Measured at Fair Value on a Nonrecurring Basis” for the details of the level classification. |
| (4) | Excludes investments in equity method investees of ¥2,219 billion and ¥2,487 billion at March 31, 2018 and 2019, respectively. |
The fair values of certain off-balance sheet financial instruments held for purposes other than trading, including commitments to extend credit and commercial letters of credit, are estimated using the fees currently charged to enter into similar agreements, taking into account the remaining terms of the agreements and the credit quality. The aggregate fair value of such instruments at March 31, 2018 and 2019 was not material.
| 33. | STOCK-BASED COMPENSATION |
The following describes the stock-based compensation plans of MUFG, MUFG Bank, Mitsubishi UFJ Trust and Banking, Mitsubishi UFJ Securities Holdings, Mitsubishi UFJ Morgan Stanley Securities and MUFG Americas Holdings.
MUFG, MUFG Bank, Mitsubishi UFJ Trust and Banking, Mitsubishi UFJ Securities Holdings and Mitsubishi UFJ Morgan Stanley Securities
On May 16, 2016, MUFG introduced the Board Incentive Plan as a new incentive plan for officers of MUFG, MUFG Bank, Mitsubishi UFJ Trust and Banking, Mitsubishi UFJ Securities Holdings and Mitsubishi
F-159
Table of Contents
MITSUBISHI UFJ FINANCIAL GROUP, INC. AND SUBSIDIARIES
NOTES TO CONSOLIDATED FINANCIAL STATEMENTS—(Continued)
UFJ Morgan Stanley Securities. On November 14, 2016, MUFG expanded the Board Incentive Plan to officers who hold unexercised Stock Acquisition Rights granted under the Stock Option Plan. As a result of this transaction, the Stock Option Plan remains available to officers who are on overseas assignment as of the transition date and hold unexercised Stock Acquisition Rights. This transition which consists of the exchange of unexercised Stock Acquisition Rights for common share of MUFG under the Board Incentive Plan was treated as modification of the Stock Option Plan for accounting purpose and incremental compensation cost resulting from the modification was ¥2,028 million.
Stock Option Plan
MUFG, MUFG Bank, Mitsubishi UFJ Trust and Banking, Mitsubishi UFJ Securities Holdings and Mitsubishi UFJ Morgan Stanley Securities have the Stock Option Plan.
The Stock Acquisition Rights under the Stock Option Plan were normally issued and granted to officers once a year until the fiscal year ended March 31, 2013. They were normally issued and granted to officers except for outside directors and corporate auditors once a year from the fiscal year ended March 31, 2014.
The class of shares to be issued or transferred upon exercise of the Stock Acquisition Rights is common shares of MUFG. The number of shares to be issued or transferred upon exercise of each Stock Acquisition Right (“number of granted shares”) is 100 common shares of MUFG. In the event of a stock split or reverse stock split of common shares of MUFG, the number of granted shares shall be adjusted in accordance with the ratio of the stock split or reverse stock split. If any events occur that require the adjustment to the number of granted shares (e.g., mergers, consolidations, corporate separations or capital reductions of MUFG), MUFG shall appropriately adjust the number of granted shares to a reasonable extent.
The contractual term of the Stock Acquisition Rights is approximately 30 years from the date of grant. Some of the Stock Acquisition Rights vest on the date of grant and the rest of the Stock Acquisition Rights granted vest depending on the holders’ service periods as officers.
The Stock Acquisition Rights are only exercisable after the date on which the following conditions are met: (1) holder as a director, a corporate executive or an executive officer is no longer a director, a corporate executive and an executive officer, and (2) holder as a corporate auditor is no longer a corporate auditor, and (3) holder as a senior fellow is no longer a senior fellow. The exercise price is ¥1 per share.
The following is a summary of the Stock Acquisition Rights transactions of MUFG, MUFG Bank, Mitsubishi UFJ Trust and Banking, Mitsubishi UFJ Securities Holdings and Mitsubishi UFJ Morgan Stanley Securities for the fiscal year ended March 31, 2019:
|
Number of
shares |
Weighted average
exercise price |
Weighted average
remaining contractual term |
Aggregate
intrinsic value |
|||||||||||||
| (in years) | (in millions) | |||||||||||||||
|
Outstanding, beginning of fiscal year |
606,400 | ¥ | 1 | |||||||||||||
|
Transitioned to the Board Incentive Plan (1) |
(121,100 | ) | 1 | |||||||||||||
|
|
|
|||||||||||||||
|
Outstanding, end of fiscal year |
485,300 | ¥ | 1 | 22.86 | ¥ | 266 | ||||||||||
|
|
|
|||||||||||||||
|
Exercisable, end of fiscal year |
— | ¥ | — | — | ¥ | — | ||||||||||
|
|
|
|||||||||||||||
F-160
Table of Contents
MITSUBISHI UFJ FINANCIAL GROUP, INC. AND SUBSIDIARIES
NOTES TO CONSOLIDATED FINANCIAL STATEMENTS—(Continued)
Notes:
| (1) | All shares transitioned to the Board Incentive Plan were granted and vested. See the explanation of the following item, The Board Incentive Plan , for more information. |
| (2) | There were no issuances under the Stock Option Plan during the fiscal years ended March 31, 2017, 2018 and 2019. |
The MUFG Group recognized ¥252 million of compensation costs related to the Stock Acquisition Rights with ¥77 million of the corresponding tax benefit for the fiscal year ended March 31, 2017.
Cash received from the exercise of the Stock Acquisition Rights for the fiscal years ended March 31, 2017 and 2018 was ¥4 million and ¥0 million, respectively. The actual tax benefit realized for the tax deductions from exercise of the Stock Acquisition Rights for the fiscal years ended March 31, 2017 and 2018 was ¥651 million and ¥2 million, respectively.
The Board Incentive Plan
On May 16, 2016, MUFG’s compensation committee approved the introduction of a Board Incentive Plan as a new incentive plan for officers and covers the fiscal years corresponding to the medium-term business plan of MUFG under which common shares of MUFG and cash equivalent to the liquidation value of the common shares of MUFG together with dividends attributable to the common shares of MUFG are delivered and/or provided as compensation. The Board Incentive Plan uses the trust structure called a Board Incentive Plan Trust (“the BIP Trust”) and was authorized to purchase up to ¥15,800 million common shares of MUFG in the open market. The BIP Trust initially consisted of the BIP Trust I and the BIP Trust II and started on May 17, 2016, with the expiration date of August 31, 2018. These trusts period may be extended through the modification of the trust agreement and additional contributions to the trust.
On November 14, 2016, MUFG’s compensation committee also approved the introduction of the BIP Trust III, using the same structure as above for officers to implement the transition from the Stock Option Plan under which Stock Acquisition Rights had previously been granted but have not been exercised by officers to the Board Incentive Plan. The BIP Trust III was authorized to purchase up to ¥8,100 million common shares of MUFG in the open market. In addition, on May 15, 2017, The BIP Trust III was also authorized to additional purchase and was revised amount of trust money up to ¥9,600 million common shares of MUFG. The BIP Trust III started on November 15, 2016 and will end on November 30, 2019. If any beneficiary under the BIP Trust III remains as active officers at the initial expiration date, the trust period will be extended for additional three years. The extension of the trust period will be made in the same manner up to 30 years.
On May 15, 2018, MUFG’s compensation committee approved to continue with the Board Incentive Plan with amending it in part. As a result, the BIP Trust I and the BIP Trust II will be continued to August 31, 2021 by extending the trust period as approved at the compensation committee’s meeting. MUFG also approved to revise the limited amount of trust money for the BIP Trust I and the BIP Trust II up to ¥16,700 million from ¥15,800 million.
MUFG funded and established the BIP Trust, and from time to time, make contributions to the BIP Trust whose beneficiaries are officers of MUFG, MUFG Bank, Mitsubishi UFJ Trust and Banking, Mitsubishi UFJ Securities Holdings and Mitsubishi UFJ Morgan Stanley Securities within the limit approved by MUFG’s compensation committee. MUFG Bank, Mitsubishi UFJ Trust and Banking, Mitsubishi UFJ Securities Holdings and Mitsubishi UFJ Morgan Stanley Securities also reimburse MUFG for its contributions to the BIP Trust. The trustee of the BIP Trusts, Mitsubishi UFJ Trust and Banking, acquires common shares of MUFG in the open market in accordance with the instructions from the trust administrator, who is a third party that does not have any interest in MUFG, MUFG Bank, Mitsubishi UFJ Trust and Banking, Mitsubishi UFJ Securities Holdings and Mitsubishi UFJ Morgan Stanley Securities.
F-161
Table of Contents
MITSUBISHI UFJ FINANCIAL GROUP, INC. AND SUBSIDIARIES
NOTES TO CONSOLIDATED FINANCIAL STATEMENTS—(Continued)
During the period of the BIP Trust, certain points are awarded to officers. The number of the points will be determined based on each rank of officers, promotions to a higher rank in the BIP Trust I and based on single year financial results and the degree to which the medium-term business plan has been achieved in the BIP Trust II. At December 1, 2016, certain points were awarded to officers who have exchanged their unexercised stock acquisition rights at the transition from the Stock Option Plan to the BIP Trust III. Points of the BIP Trust III are awarded to officers who are on overseas assignment as of the transition date when the officers become domestic residents and waive their unexercised Stock Acquisition Rights.
One point corresponds to one common share of MUFG, and if the number of common share of MUFG owned by the BIP Trusts has increased or decreased due to a stock split, gratis allotment of shares, reverse stock split, etc., the number of common share of MUFG to be delivered and/or provided for one point will be adjusted accordingly.
Officers will receive common shares of MUFG in the number corresponding to a certain percentage of these points and cash equivalent to the liquidation value of the common shares of MUFG corresponding to the remaining points after they are liquidated within the BIP Trusts. As to the BIP Trust I and the BIP Trust III, common shares of MUFG and cash will be delivered and/or provided upon resignation of the officers. As to the BIP Trust II, common shares of MUFG and cash will be delivered and/or provided immediately following the last day of the fiscal years corresponding to the medium-term business plan of MUFG. Dividends arising from common share of MUFG will also be distributed to officers based on the number of the points or the beneficial interest of officers.
The following is a roll-forward of common share of MUFG under the BIP Trust I and the BIP Trust II of MUFG, MUFG Bank, Mitsubishi UFJ Trust and Banking, Mitsubishi UFJ Securities Holdings and Mitsubishi UFJ Morgan Stanley Securities for the fiscal year ended March 31, 2019. For the BIP Trust III, all shares were vested and there is no nonvested shares for the fiscal years ended March 31, 2017, 2018 and 2019:
| 2019 | ||||||||||||||||
| The BIP Trust I | The BIP Trust II | |||||||||||||||
|
Number of
Shares |
Weighted—
average grant—date fair value |
Number of
Shares |
Weighted—
average grant—date fair value |
|||||||||||||
|
Nonvested, beginning of fiscal year |
2,085,633 | ¥ | 533.17 | 7,045,349 | ¥ | 524.43 | ||||||||||
|
Granted |
6,959,500 | 722.10 | 6,090,100 | 722.10 | ||||||||||||
|
Vested |
(2,654,379 | ) | 630.44 | (1,825,882 | ) | 659.75 | ||||||||||
|
Forfeited |
(850,072 | ) | 544.77 | (6,566,937 | ) | 527.37 | ||||||||||
|
|
|
|
|
|
|
|
|
|||||||||
|
Nonvested, end of fiscal year |
5,540,682 | ¥ | 722.10 | 4,742,630 | ¥ | 722.10 | ||||||||||
|
|
|
|
|
|
|
|
|
|||||||||
The weighted-average grant date fair value of the common shares of MUFG held by the BIP Trust I and the BIP Trust II, that were granted during the year ended March 31, 2017 and 2018, were ¥521.60 and ¥721.50, respectively. The total fair value of the common shares of MUFG held by the BIP Trust I and the BIP Trust II that vested during the year ended March 31, 2017 were ¥1,940 million and ¥1,163 million, respectively, during the year ended March 31, 2018 were ¥2,378 million and ¥1,668 million, respectively, and during the year ended March 31, 2019 were ¥1,452 million and ¥900 million, respectively.
F-162
Table of Contents
MITSUBISHI UFJ FINANCIAL GROUP, INC. AND SUBSIDIARIES
NOTES TO CONSOLIDATED FINANCIAL STATEMENTS—(Continued)
The following is a summary of compensation costs, the corresponding tax benefit under the BIP Trust for the fiscal year ended March 31, 2017, 2018 and 2019 and unrecognized compensation costs as of March 31, 2017, 2018 and 2019:
| 2017 | 2018 | 2019 | ||||||||||||||||||||||||||||||||||
|
The BIP
Trust I |
The BIP
Trust II |
The BIP
Trust III |
The BIP
Trust I |
The BIP
Trust II |
The BIP
Trust III |
The BIP
Trust I |
The BIP
Trust II |
The BIP
Trust III |
||||||||||||||||||||||||||||
| (in millions) | ||||||||||||||||||||||||||||||||||||
|
Compensation costs |
¥1,238 | ¥1,039 | ¥2,112 | ¥2,514 | ¥1,452 | ¥218 | ¥1,601 | ¥723 | ¥520 | |||||||||||||||||||||||||||
|
Tax benefit |
379 | 318 | 385 | 770 | 445 | 67 | 490 | 221 | 159 | |||||||||||||||||||||||||||
|
Unrecognized compensation costs |
1,617 | 346 | — | 396 | 360 | — | 2,604 | 182 | — | |||||||||||||||||||||||||||
Unrecognized compensation costs are expected to be recognized over a weighted-average period of 2.3 years for the BIP Trust I and 0.3 years for the BIP Trust II.
MUFG Americas Holdings
MUFG Americas Holdings adopted the MUAH Plan on June 8, 2015. Under the MUAH Plan, MUFG Americas Holdings grants restricted stock units settled in ADRs representing shares of common stock of MUFG to key employees at the discretion of the Human Capital Committee of the Board of Directors (“the Committee”). The Committee determines the number of shares, vesting requirements and other features and conditions of the restricted stock units. Under the MUAH Plan, MUFG ADRs are purchased in the open market upon the vesting of the restricted stock units, through a revocable trust. There is no amount authorized to be issued under the MUAH Plan since all shares are purchased in the open market. These awards generally vest pro-rata on each anniversary of the grant date and become fully vested three years from the grant date, provided that the employee has completed the specified continuous service requirement. Generally, the grants vest earlier if the employee dies, is permanently and totally disabled, retires under certain grant, age and service conditions, or terminates employment under certain conditions. MUFG Americas Holdings also issues a small number of off-cycle grants each year, primarily for reasons related to recruitment of new employees. The weighted-average service period for grants issued under the MUAH Plan with outstanding restricted stock units as of December 31, 2018 was 3.0 years.
Participants in the MUAH Plan are entitled to “dividend equivalent credits” on their unvested restricted stock units when MUFG pays dividends to its shareholders. The credit is equal to the dividends that the participants would have received on the shares had the shares been issued to the participants when the restricted stock units were granted. “Dividend equivalent credits” arising from grants under the MUAH Plan are paid to participants in shares on an annual basis.
F-163
Table of Contents
MITSUBISHI UFJ FINANCIAL GROUP, INC. AND SUBSIDIARIES
NOTES TO CONSOLIDATED FINANCIAL STATEMENTS—(Continued)
The following table is a roll-forward of the restricted stock units under the MUAH Plan for the fiscal year ended December 31, 2018:
| Restricted Stock Units | ||||||||
| 2018 | ||||||||
| Number of Units |
Weighted Average Grant
Date Fair Value |
|||||||
|
Units outstanding, beginning of fiscal year |
27,838,414 | $ | 5.86 | |||||
|
Activity during fiscal year: |
||||||||
|
Granted |
14,667,730 | 5.89 | ||||||
|
Vested |
(13,198,540 | ) | 5.88 | |||||
|
Forfeited |
(864,534 | ) | 5.97 | |||||
|
|
|
|||||||
|
Units outstanding, end of fiscal year |
28,443,070 | 5.86 | ||||||
|
|
|
|||||||
The weighted-average grant date fair value of restricted stock units granted during the fiscal years ended December 31, 2016 and 2017 were $4.63 and $6.53, respectively. The total fair value of RSUs that vested during the fiscal years ended December 31, 2016, 2017, and 2018 were ¥5,333 million, ¥8,414 million, and ¥8,614 million, respectively.
The following table is a summary of MUFG Americas Holdings’ compensation costs, the corresponding tax benefit for the fiscal years ended December 31, 2016, 2017 and 2018, and unrecognized compensation costs as of December 31, 2016, 2017 and 2018:
| 2016 | 2017 | 2018 | ||||||||||
| (in millions) | ||||||||||||
|
Compensation costs |
¥ | 7,292 | ¥ | 7,405 | ¥ | 8,503 | ||||||
|
Tax benefit |
2,830 | 2,917 | 2,209 | |||||||||
|
Unrecognized compensation costs |
11,183 | 12,543 | 12,210 | |||||||||
At December 31, 2018, approximately ¥12,210 million (pretax) of compensation expense related to unvested grants had not yet been charged to net income. Unrecognized compensation costs as of December 31, 2018 are expected to be amortized into compensation expense over a weighted-average period of 1.4 years.
| 34. | PARENT COMPANY ONLY FINANCIAL INFORMATION |
Distributions of retained earnings of MUFG Bank and Mitsubishi UFJ Trust and Banking are restricted in order to meet the minimum capital adequacy requirements under the Banking Law. Additionally, retained earnings of these banking subsidiaries are restricted, except for approximately ¥5,819 billion and ¥6,077 billion, in accordance with the statutory reserve requirements under the Companies Act at March 31, 2018 and 2019, respectively. See Notes 19 and 22 for further information.
The Banking Law and related regulations restrict the ability of these banking subsidiaries to extend loans or credit to the parent company. Such loans or credits to the parent company are generally limited to 15% of the banking subsidiary’s consolidated total capital, as determined by the capital adequacy guidelines.
At March 31, 2018 and 2019, approximately ¥5,341 billion and ¥5,160 billion, respectively, of net assets of consolidated subsidiaries may be restricted as to payment of cash dividends and loans to the parent company.
F-164
Table of Contents
MITSUBISHI UFJ FINANCIAL GROUP, INC. AND SUBSIDIARIES
NOTES TO CONSOLIDATED FINANCIAL STATEMENTS—(Continued)
The following table presents the parent company only financial information of MUFG:
Condensed Balance Sheets
| As of March 31, | ||||||||
| 2018 | 2019 | |||||||
| (in millions) | ||||||||
|
Assets: |
||||||||
|
Cash and interest-earning deposits with banking subsidiaries |
¥ | 114,784 | ¥ | 203,713 | ||||
|
Investments in subsidiaries and affiliated companies |
16,720,286 | 16,668,232 | ||||||
|
Banking subsidiaries |
12,638,315 | 12,754,653 | ||||||
|
Non-banking subsidiaries and affiliated companies |
4,081,971 | 3,913,579 | ||||||
|
Loans to subsidiaries |
5,072,330 | 7,199,052 | ||||||
|
Banking subsidiaries |
4,885,830 | 6,864,309 | ||||||
|
Non-banking subsidiaries |
186,500 | 334,743 | ||||||
|
Other assets |
166,514 | 223,725 | ||||||
|
|
|
|
|
|||||
|
Total assets |
¥ | 22,073,914 | ¥ | 24,294,722 | ||||
|
|
|
|
|
|||||
|
Liabilities and Shareholders’ equity: |
||||||||
|
Short-term borrowings from banking subsidiaries |
¥ | 1,600,179 | ¥ | 1,425,682 | ||||
|
Long-term debt from non-banking subsidiaries and affiliated companies |
264,332 | 277,138 | ||||||
|
Long-term debt |
5,088,478 | 7,187,469 | ||||||
|
Other liabilities |
150,743 | 204,885 | ||||||
|
|
|
|
|
|||||
|
Total liabilities |
7,103,732 | 9,095,174 | ||||||
|
|
|
|
|
|||||
|
Total shareholders’ equity |
14,970,182 | 15,199,548 | ||||||
|
|
|
|
|
|||||
|
Total liabilities and shareholders’ equity |
¥ | 22,073,914 | ¥ | 24,294,722 | ||||
|
|
|
|
|
|||||
F-165
Table of Contents
MITSUBISHI UFJ FINANCIAL GROUP, INC. AND SUBSIDIARIES
NOTES TO CONSOLIDATED FINANCIAL STATEMENTS—(Continued)
Condensed Statements of Income
| Fiscal years ended March 31, | ||||||||||||
| 2017 | 2018 | 2019 | ||||||||||
| (in millions) | ||||||||||||
|
Income: |
||||||||||||
|
Dividends from subsidiaries and affiliated companies |
¥ | 608,504 | ¥ | 576,332 | ¥ | 306,879 | ||||||
|
Banking subsidiaries |
535,512 | 487,491 | 207,161 | |||||||||
|
Non-banking subsidiaries and affiliated companies |
72,992 | 88,841 | 99,718 | |||||||||
|
Management fees from subsidiaries |
26,095 | 26,073 | 28,305 | |||||||||
|
Interest income from subsidiaries |
48,665 | 80,670 | 127,117 | |||||||||
|
Foreign exchange gains (losses)—net |
3,614 | 24,726 | (20,598 | ) | ||||||||
|
Trading account losses—net |
(41,279 | ) | (26,749 | ) | (8,078 | ) | ||||||
|
Gains on sales of investment in subsidiaries and affiliated companies |
— | — | 252,253 | |||||||||
|
Other income |
1,427 | 1,508 | 3,199 | |||||||||
|
|
|
|
|
|
|
|||||||
|
Total income |
647,026 | 682,560 | 689,077 | |||||||||
|
|
|
|
|
|
|
|||||||
|
Expense: |
||||||||||||
|
Operating expenses |
25,692 | 26,016 | 28,168 | |||||||||
|
Interest expense to subsidiaries and affiliated companies |
28,867 | 31,426 | 34,594 | |||||||||
|
Interest expense |
35,689 | 65,068 | 108,756 | |||||||||
|
Other expense |
2,554 | 1,791 | 1,657 | |||||||||
|
|
|
|
|
|
|
|||||||
|
Total expense |
92,802 | 124,301 | 173,175 | |||||||||
|
|
|
|
|
|
|
|||||||
|
Equity in undistributed net income (loss) of subsidiaries and affiliated companies—net |
(362,899 | ) | 672,421 | 194,390 | ||||||||
|
|
|
|
|
|
|
|||||||
|
Income before income tax expense (benefit) |
191,325 | 1,230,680 | 710,292 | |||||||||
|
Income tax expense (benefit) |
(11,355 | ) | 2,520 | (8,353 | ) | |||||||
|
|
|
|
|
|
|
|||||||
|
Net income |
¥ | 202,680 | ¥ | 1,228,160 | ¥ | 718,645 | ||||||
|
|
|
|
|
|
|
|||||||
F-166
Table of Contents
MITSUBISHI UFJ FINANCIAL GROUP, INC. AND SUBSIDIARIES
NOTES TO CONSOLIDATED FINANCIAL STATEMENTS—(Continued)
Condensed Statements of Cash Flows
| Fiscal years ended March 31, | ||||||||||||
| 2017 | 2018 | 2019 | ||||||||||
| (in millions) | ||||||||||||
|
Operating activities: |
||||||||||||
|
Net income |
¥ | 202,680 | ¥ | 1,228,160 | ¥ | 718,645 | ||||||
|
Adjustments and other |
371,901 | (799,571 | ) | (351,775 | ) | |||||||
|
|
|
|
|
|
|
|||||||
|
Net cash provided by operating activities |
574,581 | 428,589 | 366,870 | |||||||||
|
|
|
|
|
|
|
|||||||
|
Investing activities: |
||||||||||||
|
Proceeds from sales of investment in subsidiaries and affiliated companies |
1,574 | — | 455,605 | |||||||||
|
Purchase of equity investment in subsidiaries and an affiliated company |
(91,877 | ) | (53,000 | ) | (18,346 | ) | ||||||
|
Net increase in loans to subsidiaries |
(1,802,664 | ) | (1,682,576 | ) | (2,112,711 | ) | ||||||
|
Other—net |
(2,659 | ) | (4,361 | ) | (9,009 | ) | ||||||
|
|
|
|
|
|
|
|||||||
|
Net cash used in investing activities |
(1,895,626 | ) | (1,739,937 | ) | (1,684,461 | ) | ||||||
|
|
|
|
|
|
|
|||||||
|
Financing activities: |
||||||||||||
|
Net decrease in short-term borrowings from subsidiaries |
(32,412 | ) | (41,402 | ) | (194,300 | ) | ||||||
|
Proceeds from issuance of long-term debt |
1,808,672 | 1,872,986 | 2,043,677 | |||||||||
|
Repayment of long-term debt |
(20 | ) | (112,184 | ) | (314 | ) | ||||||
|
Repayment of long-term debt to affiliated companies |
(1,136 | ) | (1,090 | ) | (500 | ) | ||||||
|
Proceeds from sales of treasury stock |
1 | 1 | 3 | |||||||||
|
Payments for acquisition of treasury stock |
(200,028 | ) | (200,038 | ) | (150,277 | ) | ||||||
|
Dividends paid |
(246,564 | ) | (241,067 | ) | (276,279 | ) | ||||||
|
Other—net |
(9,333 | ) | (9,677 | ) | (15,490 | ) | ||||||
|
|
|
|
|
|
|
|||||||
|
Net cash provided by financing activities |
1,319,180 | 1,267,529 | 1,406,520 | |||||||||
|
|
|
|
|
|
|
|||||||
|
Net increase (decrease) in cash and cash equivalents |
(1,865 | ) | (43,819 | ) | 88,929 | |||||||
|
Cash and cash equivalents at beginning of fiscal year |
160,468 | 158,603 | 114,784 | |||||||||
|
|
|
|
|
|
|
|||||||
|
Cash and cash equivalents at end of fiscal year |
¥ | 158,603 | ¥ | 114,784 | ¥ | 203,713 | ||||||
|
|
|
|
|
|
|
|||||||
| 35. | SUBSEQUENT EVENTS |
Approval of Dividends
On June 6, 2019, the shareholders approved the payment of cash dividends of ¥11 per share of Common stock, totaling ¥142,552 million, that were payable on June 28, 2019, to the shareholders of record on March 31, 2019.
Announcement to redeem “Non-dilutive” Preferred Securities Issued by a Special Purpose Company
On May 27, 2019, the Board of Directors of MUFG approved to redeem in total ¥90 billion of non-cumulative and non-dilutive perpetual preferred securities issued by MUFG Capital Finance 8 Limited, a special purpose company established in the Cayman Islands. MUFG plans to redeem these securities on July 25, 2019. The securities were previously accounted for as part of MUFG’s Tier 1 capital at March 31, 2019 under its capital adequacy requirements, subject to certain limitations.
F-167
Table of Contents
MITSUBISHI UFJ FINANCIAL GROUP, INC. AND SUBSIDIARIES
NOTES TO CONSOLIDATED FINANCIAL STATEMENTS—(Continued)
Acquisition of shares in Bank Danamon in Indonesia
On April 29, 2019, MUFG Bank acquired an additional 54.0% equity interest in Danamon from AFI and other shareholders, based on a price of IDR 9,590 (approximately ¥77 (1) ) per share, for an investment amount of IDR 50 trillion (approximately ¥397 billion). As a result, equity interest in Danamon increased to 94.0%, and Danamon became a consolidated subsidiary of MUFG Bank. In addition, MUFG Bank acquired an additional 92.1% equity interest in PT Bank Nusantara Parahyangan, Tbk. (“BNP”) from ACOM CO., LTD., an equity method investee of MUFG, and other shareholders, based on a price of IDR 4,088 (approximately ¥33 (1) ) per share, for an investment amount of IDR 3 trillion (approximately ¥24.1 billion). As a result, equity interest in BNP increased to 99.9%, and BNP became a consolidated subsidiary of MUFG Bank.
On May 1, 2019, MUFG Bank made BNP merged into Danamon, acquiring an additional equity interest in Danamon in exchange for its equity interest in BNP, which resulted in MUFG Bank holding 94.1% equity interest in Danamon.
The initial accounting for the business combination is incomplete and supplemental pro forma information of this acquisition could not be disclosed in the accompanying consolidated financial statements because this transaction occurred near the time of the issuance of such consolidated financial statements and the MUFG Group is still in the process of determining the fair value of assets acquired, liabilities assumed, and non-controlling interest.
See Note 2 for further information on the Acquisition of shares in Danamon.
Note:
| (1) | Calculated based on the exchange rate of IDR1 = ¥0.008 |
* * * * *
F-168
Table of Contents
EXHIBIT INDEX
Table of Contents
|
Exhibit |
Description |
|
|
101.SCH |
XBRL Schema Document |
|
|
101.CAL |
XBRL Calculation Linkbase Document |
|
|
101.DEF |
XBRL Definition Linkbase Document |
|
|
101.LAB |
XBRL Label Linkbase Document |
|
|
101.PRE |
XBRL Presentation Linkbase Document |
|
| Notes: |
| * | Incorporated by reference to our annual report on Form 20-F (File No. 000-54189) filed on July 12, 2018. |
| ** | Incorporated by reference to our registration statement on Form S-8 (File No. 333-230590) filed on March 29, 2019. |
| *** | Deemed to be incorporated by reference into the registration statement on Form F-3 (No. 333-229697) of Mitsubishi UFJ Financial Group, Inc. and to be a part thereof. |
| **** | Deemed to be incorporated as Annex A to the registration statement on Form F-3 (No. 333-229697) of Mitsubishi UFJ Financial Group, Inc. and to be a part thereof. |
| ***** | Incorporated by reference to Morgan Stanley’s annual report on Form 10-K (File No. 001-11758) filed on February 26, 2019. |
Table of Contents
Signature
The registrant hereby certifies that it meets all of the requirements for filing on Form 20-F and that it has duly caused and authorized the undersigned to sign this Annual Report on its behalf.
|
MITSUBISHI UFJ FINANCIAL GROUP, INC. |
||
|
By: |
/s/ K ANETSUGU M IKE |
|
| Name: | Kanetsugu Mike | |
| Title: | President & Group Chief Executive Officer | |
Date: July 10, 2019