MVB FINANCIAL CORP
10-Ks and 10-Qs
|
|
|
|
|
|
|
|
|
|
|
|
|
|
|
|
|
|
|
|
|
|
|
|
|
|
|
|
|
|
|
|
|
|
|
|
|
|
|
|
|
|
|
|
|
|
|
|
|
|
|
|
|
|
|
|
|
|
|
|
|
|
|
UNITED STATES
|
||
|
SECURITIES AND EXCHANGE COMMISSION
|
||
|
Washington, D.C. 20549
|
||
|
FORM 10-K
|
||
|
(Mark One)
|
||
|
☒ ANNUAL REPORT PURSUANT TO SECTION 13 or 15(d) OF THE SECURITIES EXCHANGE ACT OF 1934
|
||
|
For the fiscal year ended December 31, 2016
|
||
|
or
|
||
|
☐ TRANSITION REPORT PURSUANT TO SECTION 13 OR 15(d) OF THE SECURITIES EXCHANGE ACT OF 1934
|
||
|
For the transition period from __________ to __________.
|
||
|
Commission file Number 34603-9
|
||
|
MVB Financial Corp.
|
||
|
(Exact name of registrant as specified in its charter)
|
||
|
West Virginia
|
20-0034461
|
|
|
(State or other jurisdiction of
incorporation or organization)
|
(I.R.S. Employer Identification No.)
|
|
|
301 Virginia Avenue, Fairmont, WV
|
26554
|
|
|
(Address of principal executive offices)
|
(Zip Code)
|
|
|
Registrant's telephone number, including area code
(304) 363-4800
|
||
|
(Former name, former address and former fiscal year, if changed since last report)
[None]
|
||
|
Securities registered pursuant to Section 12(b) of the Act:
|
||
|
Title of each class
|
Name of each exchange on
which registered
|
|
|
Common Stock, $1.00 Par
|
None
|
|
|
Securities registered pursuant to Section 12(g) of the Act:
|
||
|
Common Stock, $1.00 Par
|
||
|
(Title of Class)
|
||
|
Preferred Stock, $1,000.00 Par
|
||
|
(Title of Class)
|
||
|
Indicate by check mark if the registrant is a well-known seasoned issuer, as defined in Rule 405 of the Securities Act. Yes ☐ No ☒.
|
|||
|
Indicate by check mark if the registrant is not required to file reports pursuant to Section 13 or 15(d) Act. Yes ☐ No ☒
|
|||
|
Indicate by check mark whether the registrant (1) has filed all reports required to be filed by Section 13 or 15(d) of the Securities Exchange Act of 1934 during the preceding 12 months (or for such shorter period that the registrant was required to file such reports), and (2) has been subject to such filing requirements for the past 90 days. Yes ☒ No ☐
|
|||
|
Indicate by check mark whether the registrant has submitted electronically and posted on its corporate Website, if any, every Interactive Data File required to be submitted and posted pursuant to Rule 405 of Regulation S-T during the preceding 12 months (or for such shorter period that the registrant was required to submit and post such files). Yes ☒ No ☐
|
|||
|
Indicate by check mark if disclosure of delinquent filers pursuant to Item 405 of Regulation S-K is not contained herein, and will not be contained, to the best of the registrant’s knowledge, in definitive proxy or information statements incorporated by reference in Part III of this Form 10-K or any amendment to this Form 10-K. ☐
|
|||
|
Indicate by check mark whether the registrant is a large accelerated filer, an accelerated filer, a non-accelerated filer, or a smaller reporting company. See the definitions of “large accelerated filer,” “accelerated filer” and “smaller reporting company” in Rule 12b-2 of the Exchange Act. (Check one):
|
|||
|
Large accelerated filer ☐
|
Accelerated filer ☒
|
Non-accelerated filer ☐
|
Smaller reporting company ☐
|
|
Indicate by check mark if the registrant is a shell company (as defined in Rule 12b-2 of the Exchange Act). Yes ☐ No ☒.
|
|||
Based upon the average selling price of sales known to the Registrant of the Registrant's common stock during the period through June 30,
2016
, the aggregate market value of the common shares of the Registrant held by non-affiliates during that time was
$88,431,005
. For this purpose, certain executive officers and directors are considered affiliates.
Portions of the Registrant’s definitive proxy statement relating to the Annual Meeting to be held May 16, 2017, are incorporated by reference into Part III of this Annual Report on Form 10-K.
As of
March 9, 2017
, the Registrant had
9,996,544
shares of common stock outstanding with a par value of $1.00 per share.
|
TABLE OF CONTENTS
|
||
|
Page
|
||
|
|
||
|
|
|
|
|
|
|
|
|
|
|
|
|
|
|
|
|
|
|
|
|
|
|
|
|
|
|
|
|
|
|
|
|
|
|
|
|
|
|
|
|
|
|
|
|
|
|
|
|
|
|
|
|
|
|
|
|
|
|
|
|
|
|
|
|
|
|
|
|
|
|
|
|
|
|
|
|
|
|
|
|
|
|
|
|
|
|
|
|
|
|
|
|
|
|
|
|
|
|
|
|
|
|
|
|
|
|
|
2
MVB Financial Corp., (the "Company") was formed on
May 29, 2003
and became a bank holding company under the laws of West Virginia on
January 1, 2004
, and, effective
December 19, 2012
, became a financial holding company. The Company features a subsidiary and multiple affiliated businesses, each of which is described in more detail below, including MVB Bank, Inc. (the "Bank") and its wholly-owned subsidiaries, MVB Mortgage and MVB Insurance, LLC ("MVB Insurance"). On
December 31, 2013
, three Company subsidiaries, MVB-Central, Inc. (a second-tier level holding company), MVB-East, Inc. (a second tier holding company) and Bank Compliance Solutions, Inc. (an inactive subsidiary) were merged into the Company.
The Bank was formed on
October 30, 1997
and chartered under the laws of the State of West Virginia. The Bank commenced operations on
January 4, 1999
. In
August of 2005
, the Bank opened a full-service office in neighboring Harrison County, West Virginia. During
October of 2005
, the Bank purchased a branch office in Jefferson County, West Virginia, situated in West Virginia’s eastern panhandle. During the
third quarter of 2007
, the Bank opened a full-service office in the Martinsburg area of Berkeley County, West Virginia. In the
second quarter of 2011
, the Bank opened a banking facility in the Cheat Lake area of Monongalia County, West Virginia. The Bank opened its second Harrison County, West Virginia location, the downtown Clarksburg office in the historic Empire Building during the
fourth quarter of 2012
.
During the
fourth quarter of 2012
, the Bank acquired Potomac Mortgage Group, Inc. (“PMG” which, following
July 15, 2013
, began doing business under the registered trade name “MVB Mortgage”), a mortgage company in the northern Virginia area, and
fifty percent
(
50%
) interest in a mortgage services company, Lender Service Provider, LLC (“LSP”). In the
third quarter of 2013
, this
fifty percent
(
50%
) interest in LSP was reduced to a
twenty-five percent
(
25%
) interest through a sale of a partial interest. MVB Mortgage has
eleven
mortgage only offices, located in Virginia, within the Washington, DC metropolitan area as well as North Carolina and South Carolina, and, in addition, has mortgage loan originators located at select Bank locations throughout West Virginia.
In the
first quarter of 2013
, the Bank opened its second Monongalia County location in the Sabraton area of Morgantown, West Virginia. In the s
econd quarter of 2013
, the Bank opened its second full-service office in Berkeley County, West Virginia, at Edwin Miller Boulevard. In addition, the Bank opened a loan production office at 184 Summers Street, Charleston, Kanawha County, West Virginia, which was subsequently moved to 400 Washington Street East, Charleston, West Virginia and later replaced during
March 2015
by a full-service branch at the same location.
In
2014
, the Bank opened a loan production office in Reston, Fairfax County, Virginia, which was replaced by a full-service branch in
October 2015
.
During
January 2015
, the Bank opened a location at 100 NASA Boulevard, Fairmont, Marion County, West Virginia, which replaced the 9789 Mall Loop, White Hall, Marion County, West Virginia location as the Technology Park location offers a drive-thru facility to better serve customers. During March 2015, the location at 9789 Mall Loop was closed. During August 2015, the Bank purchased two branch locations in Berkeley County, West Virginia, situated in West Virginia’s eastern panhandle at 704 Foxcroft Avenue, Martinsburg, West Virginia and 5091 Gerrardstown Road, Inwood, West Virginia.
Currently, the Bank operates
thirteen
full-service banking branches in West Virginia and Virginia, which are located at: 301 Virginia Avenue in Fairmont, Marion County; 100 NASA Boulevard in Fairmont, Marion County; 1000 Johnson Avenue in Bridgeport, Harrison County; 406 West Main St. in Clarksburg, Harrison County; 88 Somerset Boulevard in Charles Town, Jefferson County; 651 Foxcroft Avenue in Martinsburg, Berkeley County; 704 Foxcroft Avenue in Martinsburg, Berkeley County; 5091 Gerrardstown Road in Inwood, Berkeley County; 2400 Cranberry Square in Cheat Lake, Monongalia County; 10 Sterling Drive in Morgantown, Monongalia County; 231 Aikens Center in Martinsburg, Berkeley County; 400 Washington Street East in Charleston, Kanawha County; and 1801 Old Reston Avenue Reston, Fairfax County.
MVB Insurance was originally formed in
2000
and reinstated in
2005
, as a Bank subsidiary. Effective
June 1, 2013
, MVB Insurance became a direct subsidiary of the Company. MVB Insurance offered select insurance products such as title insurance, individual insurance, commercial insurance, employee benefits insurance, and professional liability insurance. On
June 30, 2016
, the Company entered into an Asset Purchase agreement with USI Insurance Services (“USI”), in which USI purchased substantially all of the assets and assumed certain liabilities of MVB Insurance, which resulted in a pre-tax gain of
$6.9 million
, and was reported in discontinued operations, as discussed in Note 23, "Discontinued Operations" of the Notes to the Consolidated Financial Statements included in Item 8, Financial Statements and Supplementary Data, of this Annual Report on Form 10-K.
3
MVB Insurance retained the assets related to, and continues to operate, its title insurance business. The title insurance business is immaterial in terms of revenue and the Company has reorganized MVB Insurance as a subsidiary of the Bank.
Subsequent to the sale of MVB Insurance, the Company’s primary business activities, through its subsidiary, are currently community banking, and mortgage banking. As a community-based bank, the Bank offers its customers a full range of products through various delivery channels. Such products and services include checking accounts, NOW accounts, money market and savings accounts, time certificates of deposit, commercial, installment, commercial real estate and residential real estate mortgage loans, debit cards, and safe deposit rental facilities. Services are provided through our walk-in offices, automated teller machines (“ATMs”), drive-in facilities, and internet and telephone banking. Additionally, the Bank offers non-deposit investment products through an association with a broker-dealer. Since the opening date of
January 4, 1999
, the Bank has experienced significant growth in assets, loans, and deposits due to strong community and customer support in the Marion County and Harrison County, West Virginia markets, expansion into Jefferson, Berkeley, Monongalia and Kanawha Counties, West Virginia and, most recently, into Fairfax County, Virginia. With the acquisition of PMG, mortgage banking is now a much more significant focus, which has opened increased market opportunities in the Washington, D.C. metropolitan region and added enough volume to further diversify the Company’s revenue stream.
At
December 31, 2016
, the Company had total assets of
$1.4 billion
, total loans of
$1.1 billion
, total deposits of
$1.1 billion
and total stockholders’ equity of
$145.6 million
.
At
December 31, 2016
, the Company had
382
full-time equivalent employees. The Company’s principal office is located at 301 Virginia Avenue, Fairmont, West Virginia 26554, and its telephone number is (304) 363-4800. The Company’s Internet web site is www.mvbbanking.com.
Segment Reporting
The Company has identified
three
reportable segments: commercial and retail banking; mortgage banking; and financial holding company. Insurance services was previously identified as a reportable segment until entering into the Asset Purchase Agreement with USI, as discussed below and in Note 23, "Discontinued Operations" of the Notes to the Consolidated Financial Statements included in Item 8, Financial Statements and Supplementary Data, of this Annual Report on Form 10-K. Revenue from commercial and retail banking activities consists primarily of interest earned on loans and investment securities and service charges on deposit accounts. Revenue from financial holding company activities is mainly comprised of intercompany service income and dividends.
Revenue from the mortgage banking activities is comprised of interest earned on loans and fees received as a result of the mortgage origination process. The mortgage banking services are conducted by MVB Mortgage. Revenue from insurance services is comprised mainly of commissions on the sale of insurance products. Due to the sale as discussed below and in Note 23, "Discontinued Operations" of the Notes to the Consolidated Financial Statements included in Item 8, Financial Statements and Supplementary Data, of this Annual Report on Form 10-K. None of the insurance services activity is included in continuing operations
On
June 30, 2016
, the Company entered into an Asset Purchase Agreement with USI Insurance Services (USI), in which USI purchased substantially all of the assets and assumed certain liabilities of MVB Insurance, which resulted in a pre-tax gain of
$6.9 million
, as discussed in Note 23, "Discontinued Operations" of the Notes to the Consolidated Financial Statements included in Item 8, Financial Statements and Supplementary Data, of this Annual Report on Form 10-K. MVB Insurance retained the assets related to, and continues to operate, its title insurance business. The title insurance business is immaterial in terms of revenue and the Company has reorganized MVB Insurance as a subsidiary of the Bank.
4
Information about the reportable segments and reconciliation to the consolidated financial statements for the years ended
December 31, 2016
,
2015
and
2014
are as follows:
|
2016
|
||||||||||||||||||||||||
|
(Dollars in thousands)
|
Commercial & Retail Banking
|
Mortgage Banking
|
Financial Holding Company
|
Insurance
|
Intercompany Eliminations
|
Consolidated
|
||||||||||||||||||
|
Revenues:
|
||||||||||||||||||||||||
|
Interest income
|
$
|
50,413
|
|
$
|
4,285
|
|
$
|
3
|
|
$
|
—
|
|
$
|
(578
|
)
|
$
|
54,123
|
|
||||||
|
Mortgage fee income
|
(252
|
)
|
36,960
|
|
—
|
|
—
|
|
(1,035
|
)
|
35,673
|
|
||||||||||||
|
Insurance and investment services income
|
420
|
|
—
|
|
—
|
|
—
|
|
—
|
|
420
|
|
||||||||||||
|
Other income
|
5,485
|
|
1,674
|
|
5,247
|
|
—
|
|
(5,294
|
)
|
7,112
|
|
||||||||||||
|
Total operating income
|
56,066
|
|
42,919
|
|
5,250
|
|
—
|
|
(6,907
|
)
|
97,328
|
|
||||||||||||
|
Expenses:
|
|
|
|
|
|
|
||||||||||||||||||
|
Interest expense
|
8,437
|
|
2,082
|
|
2,226
|
|
—
|
|
(1,613
|
)
|
11,132
|
|
||||||||||||
|
Salaries and employee benefits
|
11,592
|
|
27,696
|
|
5,937
|
|
—
|
|
—
|
|
45,225
|
|
||||||||||||
|
Provision for loan losses
|
3,632
|
|
—
|
|
—
|
|
—
|
|
—
|
|
3,632
|
|
||||||||||||
|
Other expense
|
18,009
|
|
8,125
|
|
3,144
|
|
—
|
|
(5,294
|
)
|
23,984
|
|
||||||||||||
|
Total operating expenses
|
41,670
|
|
37,903
|
|
11,307
|
|
—
|
|
(6,907
|
)
|
83,973
|
|
||||||||||||
|
Income (loss) from continuing operations, before income taxes
|
14,396
|
|
5,016
|
|
(6,057
|
)
|
—
|
|
—
|
|
13,355
|
|
||||||||||||
|
Income tax expense (benefit) - continuing operations
|
4,496
|
|
1,954
|
|
(2,072
|
)
|
—
|
|
—
|
|
4,378
|
|
||||||||||||
|
Net income (loss) from continuing operations
|
9,900
|
|
3,062
|
|
(3,985
|
)
|
—
|
|
—
|
|
8,977
|
|
||||||||||||
|
Income (loss) from discontinued operations
|
—
|
|
—
|
|
6,926
|
|
(580
|
)
|
—
|
|
6,346
|
|
||||||||||||
|
Income tax expense (benefit) - discontinued operations
|
$
|
—
|
|
$
|
—
|
|
$
|
2,629
|
|
$
|
(218
|
)
|
$
|
—
|
|
$
|
2,411
|
|
||||||
|
Net income (loss) from discontinued operations
|
$
|
—
|
|
$
|
—
|
|
$
|
4,297
|
|
$
|
(362
|
)
|
$
|
—
|
|
$
|
3,935
|
|
||||||
|
Net income (loss)
|
$
|
9,900
|
|
$
|
3,062
|
|
$
|
312
|
|
$
|
(362
|
)
|
$
|
—
|
|
$
|
12,912
|
|
||||||
|
Preferred stock dividends
|
—
|
|
—
|
|
1,128
|
|
—
|
|
—
|
|
1,128
|
|
||||||||||||
|
Net income (loss) available to common shareholders
|
9,900
|
|
3,062
|
|
(816
|
)
|
(362
|
)
|
—
|
|
11,784
|
|
||||||||||||
|
Capital Expenditures for the year ended December 31, 2016
|
$
|
1,145
|
|
$
|
220
|
|
$
|
303
|
|
$
|
—
|
|
$
|
—
|
|
$
|
1,668
|
|
||||||
|
Total Assets as of December 31, 2016
|
1,415,735
|
|
122,242
|
|
180,340
|
|
—
|
|
(299,513
|
)
|
1,418,804
|
|
||||||||||||
|
Goodwill as of December 31, 2016
|
1,598
|
|
16,882
|
|
—
|
|
—
|
|
—
|
|
18,480
|
|
||||||||||||
5
|
2015
|
||||||||||||||||||||||||
|
(Dollars in thousands)
|
Commercial & Retail Banking
|
Mortgage Banking
|
Financial Holding Company
|
Insurance
|
Intercompany Eliminations
|
Consolidated
|
||||||||||||||||||
|
Revenues:
|
||||||||||||||||||||||||
|
Interest income
|
$
|
40,524
|
|
$
|
3,882
|
|
$
|
2
|
|
$
|
—
|
|
$
|
(308
|
)
|
$
|
44,100
|
|
||||||
|
Mortgage fee income
|
7
|
|
30,560
|
|
—
|
|
—
|
|
(1,095
|
)
|
29,472
|
|
||||||||||||
|
Insurance and investment services income
|
338
|
|
—
|
|
—
|
|
—
|
|
—
|
|
338
|
|
||||||||||||
|
Other income
|
3,721
|
|
1,673
|
|
4,331
|
|
—
|
|
(4,580
|
)
|
5,145
|
|
||||||||||||
|
Total operating income
|
44,590
|
|
36,115
|
|
4,333
|
|
—
|
|
(5,983
|
)
|
79,055
|
|
||||||||||||
|
Expenses:
|
|
|
|
|
|
|
||||||||||||||||||
|
Interest expense
|
6,776
|
|
1,647
|
|
2,204
|
|
—
|
|
(1,402
|
)
|
9,225
|
|
||||||||||||
|
Salaries and employee benefits
|
11,049
|
|
20,774
|
|
4,250
|
|
—
|
|
—
|
|
36,073
|
|
||||||||||||
|
Provision for loan losses
|
2,493
|
|
—
|
|
—
|
|
—
|
|
—
|
|
2,493
|
|
||||||||||||
|
Other expense
|
16,132
|
|
7,471
|
|
2,534
|
|
—
|
|
(4,362
|
)
|
21,775
|
|
||||||||||||
|
Total operating expenses
|
36,450
|
|
29,892
|
|
8,988
|
|
—
|
|
(5,764
|
)
|
69,566
|
|
||||||||||||
|
Income (loss) from continuing operations, before income taxes
|
8,140
|
|
6,223
|
|
(4,655
|
)
|
—
|
|
(219
|
)
|
9,489
|
|
||||||||||||
|
Income tax expense (benefit) - continuing operations
|
2,176
|
|
2,394
|
|
(1,597
|
)
|
—
|
|
(87
|
)
|
2,886
|
|
||||||||||||
|
Net income (loss) from continuing operations
|
5,964
|
|
3,829
|
|
(3,058
|
)
|
—
|
|
(132
|
)
|
6,603
|
|
||||||||||||
|
Income (loss) from discontinued operations
|
—
|
|
—
|
|
—
|
|
134
|
|
219
|
|
353
|
|
||||||||||||
|
Income tax expense (benefit) - discontinued operations
|
$
|
—
|
|
$
|
—
|
|
$
|
—
|
|
$
|
53
|
|
$
|
87
|
|
$
|
140
|
|
||||||
|
Net income (loss) from discontinued operations
|
$
|
—
|
|
$
|
—
|
|
$
|
—
|
|
$
|
81
|
|
$
|
132
|
|
$
|
213
|
|
||||||
|
Net income (loss)
|
$
|
5,964
|
|
$
|
3,829
|
|
$
|
(3,058
|
)
|
$
|
81
|
|
$
|
—
|
|
$
|
6,816
|
|
||||||
|
Preferred stock dividends
|
—
|
|
—
|
|
575
|
|
—
|
|
—
|
|
575
|
|
||||||||||||
|
Net income (loss) available to common shareholders
|
5,964
|
|
3,829
|
|
(3,633
|
)
|
81
|
|
—
|
|
6,241
|
|
||||||||||||
|
Capital Expenditures for the year ended December 31, 2015
|
$
|
1,174
|
|
$
|
354
|
|
$
|
616
|
|
$
|
9
|
|
$
|
—
|
|
$
|
2,153
|
|
||||||
|
Total Assets as of December 31, 2015
|
1,378,988
|
|
125,227
|
|
148,509
|
|
5,017
|
|
(273,265
|
)
|
1,384,476
|
|
||||||||||||
|
Goodwill as of December 31, 2015
|
1,598
|
|
16,882
|
|
—
|
|
—
|
|
—
|
|
18,480
|
|
||||||||||||
6
|
|
2014
|
|||||||||||||||||||||||
|
(Dollars in thousands)
|
Commercial & Retail Banking
|
Mortgage Banking
|
Financial Holding Company
|
Insurance
|
Intercompany Eliminations
|
Consolidated
|
||||||||||||||||||
|
Revenues:
|
||||||||||||||||||||||||
|
Interest income
|
$
|
33,175
|
|
$
|
2,645
|
|
$
|
2
|
|
$
|
—
|
|
$
|
346
|
|
$
|
36,168
|
|
||||||
|
Mortgage fee income
|
64
|
|
18,691
|
|
—
|
|
—
|
|
(1,198
|
)
|
17,557
|
|
||||||||||||
|
Insurance and investment services income
|
328
|
|
—
|
|
—
|
|
—
|
|
—
|
|
328
|
|
||||||||||||
|
Other income
|
4,458
|
|
(2
|
)
|
4,357
|
|
—
|
|
(4,676
|
)
|
4,137
|
|
||||||||||||
|
Total operating income
|
38,025
|
|
21,334
|
|
4,359
|
|
—
|
|
(5,528
|
)
|
58,190
|
|
||||||||||||
|
Expenses:
|
|
|
|
|
|
|
||||||||||||||||||
|
Interest expense
|
5,663
|
|
1,063
|
|
1,703
|
|
—
|
|
(918
|
)
|
7,511
|
|
||||||||||||
|
Salaries and employee benefits
|
9,629
|
|
14,487
|
|
3,658
|
|
—
|
|
—
|
|
27,774
|
|
||||||||||||
|
Provision for loan losses
|
2,582
|
|
—
|
|
—
|
|
—
|
|
—
|
|
2,582
|
|
||||||||||||
|
Other expense
|
13,994
|
|
5,990
|
|
1,970
|
|
—
|
|
(4,534
|
)
|
17,420
|
|
||||||||||||
|
Total operating expenses
|
31,868
|
|
21,540
|
|
7,331
|
|
—
|
|
(5,452
|
)
|
55,287
|
|
||||||||||||
|
Income (loss) from continuing operations, before income taxes
|
6,157
|
|
(206
|
)
|
(2,972
|
)
|
—
|
|
(76
|
)
|
2,903
|
|
||||||||||||
|
Income tax expense (benefit) - continuing operations
|
1,326
|
|
(57
|
)
|
(993
|
)
|
—
|
|
(28
|
)
|
248
|
|
||||||||||||
|
Net income (loss) from continuing operations
|
4,831
|
|
(149
|
)
|
(1,979
|
)
|
—
|
|
(48
|
)
|
2,655
|
|
||||||||||||
|
Income (loss) from discontinued operations
|
—
|
|
—
|
|
—
|
|
(996
|
)
|
76
|
|
(920
|
)
|
||||||||||||
|
Income tax expense (benefit) - discontinued operations
|
$
|
—
|
|
$
|
—
|
|
$
|
—
|
|
$
|
(372
|
)
|
$
|
28
|
|
$
|
(344
|
)
|
||||||
|
Net income (loss) from discontinued operations
|
$
|
—
|
|
$
|
—
|
|
$
|
—
|
|
$
|
(624
|
)
|
$
|
48
|
|
$
|
(576
|
)
|
||||||
|
Net income (loss)
|
$
|
4,831
|
|
$
|
(149
|
)
|
$
|
(1,979
|
)
|
$
|
(624
|
)
|
$
|
—
|
|
$
|
2,079
|
|
||||||
|
Preferred stock dividends
|
—
|
|
—
|
|
332
|
|
—
|
|
—
|
|
332
|
|
||||||||||||
|
Net income (loss) available to common shareholders
|
4,831
|
|
(149
|
)
|
(2,311
|
)
|
(624
|
)
|
—
|
|
1,747
|
|
||||||||||||
|
Capital Expenditures for the year ended December 31, 2014
|
$
|
9,072
|
|
$
|
333
|
|
$
|
40
|
|
$
|
353
|
|
$
|
—
|
|
$
|
9,798
|
|
||||||
|
Total Assets as of December 31, 2014
|
1,048,101
|
|
101,791
|
|
146,137
|
|
4,031
|
|
(189,601
|
)
|
1,110,459
|
|
||||||||||||
|
Goodwill as of December 31, 2014
|
897
|
|
16,882
|
|
—
|
|
—
|
|
—
|
|
17,779
|
|
||||||||||||
Commercial & Retail Banking
For the year ended
December 31, 2016
, the Commercial & Retail Banking segment earned
$9.9 million
compared to
$6.0 million
in
2015
. Net interest income increased by
$8.2 million
, primarily the result of average loan balances increasing by
$179.0 million
. Noninterest income increased by
$1.6 million
, primarily the result of the following:
$818 thousand
improvement in performance of the interest rate cap,
$882 thousand
increase in gain on sale of securities,
$133 thousand
increase in other operating income, and
$199 thousand
increase in Visa debit card and interchange income, which was offset by
$371 thousand
decrease in gain on sale of portfolio loans and
$259 thousand
decrease in mortgage fee income. Noninterest expense increased by
$2.4 million
, primarily the result of the following:
$543 thousand
increase in salaries and employee benefits expense,
$494 thousand
increase in occupancy and equipment expense, and
$832 thousand
increase in data processing and communications expense, which was offset by
$776 thousand
decrease in professional fees. In addition, provision expense increased by
$1.1 million
.
7
Mortgage Banking
For the year ended
December 31, 2016
, the Mortgage Banking segment earned
$3.1 million
compared to
$3.8 million
in
2015
. Net interest income decreased
$32 thousand
, noninterest income increased by
$6.4 million
and noninterest expense increased by
$7.6 million
. The
$6.4 million
increase in noninterest income was all related to mortgage fee income and was offset by the
$7.6 million
increase in noninterest expense. The increase in noninterest expense was primarily the result of the following:
$6.9 million
increase in salaries and employee benefits expense, which was primarily due to a
26.4%
increase in origination volume as well as a
$1.8 million
increase in the earn out paid to management of the mortgage company related to the 2012 acquisition. Other items that impacted noninterest expense were as follows:
$197 thousand
increase in mortgage processing expense,
$98 thousand
increase in data processing and communications expense,
$117 thousand
in occupancy and equipment expense,
$133 thousand
increase in travel, entertainment, dues, and subscriptions expense, and
$134 thousand
in other operating expense, of which an increase of
$55 thousand
was related to loan expenses, which was offset by a
$115 thousand
decrease in marketing expense.
Financial Holding Company
For the year ended
December 31, 2016
, the Financial Holding Company reported a loss from continuing operations of
$4.0 million
compared to a loss of
$3.1 million
in
2015
. Interest expense increased
$22 thousand
, noninterest income increased
$916 thousand
and noninterest expense increased
$2.3 million
. In addition, the income tax benefit increased
$475 thousand
. The increase in noninterest expense was primarily due to a
$1.7 million
increase in salaries and employee benefits expense, a
$220 thousand
increase in professional fees, a
$259 thousand
increase in occupancy and equipment expense, and a
$66 thousand
increase in other operating expense.
Insurance
For the year ended
December 31, 2016
, the Insurance segment lost
$362 thousand
compared to earning
$81 thousand
in
2015
. In
June 2016
, primarily all the assets of the Insurance segment were sold and the segment was reorganized as a subsidiary of the Bank.
Market Area
The Company’s primary market areas are the Marion, Harrison, Jefferson, Berkeley, Monongalia, and Kanawha counties of West Virginia and Fairfax county of Virginia. In addition, MVB Mortgage has mortgage only offices located in Virginia, Washington, DC, as well as North Carolina and South Carolina and, in addition, has mortgage loan originators located at select Bank locations throughout West Virginia.
United States Census Bureau data indicates that the Fairmont and Marion County, West Virginia populations have had somewhat different trends from
1980
to
2015
. The population of Fairmont has fluctuated from
23,863
in
1980
;
20,210
in
1990
;
19,097
in
2000
;
18,704
in
2010
; and
18,733
in
2015
, or a net decline of
5,130
or
21.5%
.
Marion County increased its population from
1980
to
1990
,
55,789
to
57,249
, decreased to
56,598
in
2000
, decreased to
56,418
in
2010
and increased to
56,925
in
2015
. These changes resulted in a net increase of
2.0%
. The Marion County population includes that of Fairmont. The result is that over the last
35
years, there has not been any significant change in population. Harrison County’s population decreased from
69,371
in
1990
to
68,652
in
2000
, increased to
69,099
in
2010
, decreased to
68,714
in
2015
, while Bridgeport’s population has increased from
7,306
in
2000
to
7,896
in
2010
, to
8,359
in
2015
, indicating that while population change in Harrison County has been relatively flat, the Bridgeport area is growing. The population in Jefferson County has been on the rise in recent years, increasing from
42,190
in
2000
to
53,498
in
2010
, to
56,482
in
2015
. During this period, Charles Town has seen an increase in population of
102.9%
to
5,899
in
2015
. Berkeley County’s population has grown from
75,905
in
2000
to
104,169
in
2010
, to
111,901
in
2015
, making it the second-most populous county in West Virginia. Martinsburg’s population has increased
18.2%
since
2000
to
17,700
in
2015
. Monongalia County’s population has increased from
81,866
in
2000
to
96,189
in
2010
, to
104,236
in
2015
, an increase of
27.3%
. Morgantown’s population in
2015
was
30,708
, an increase of
3,899
or
14.5%
since
2000
. Kanawha County’s population decreased slightly from
200,073
in
2000
to
188,332
in
2015
, a decrease of
5.9%
. Charleston’s population in
2015
was
49,736
, a decrease of
3,685
or
6.9%
since
2000
. Fairfax County’s population increased from
969,749
in
2000
to
1,142,234
in
2015
. Based upon this data, management believes the Company’s offices are in some of the most desirable locations in the state of West Virginia and Virginia.
8
The current economic climate in the Company’s primary market areas reflect economic climates that are consistent with the general national climate. Unemployment in the United States was
4.5%
,
4.8%
and
5.4%
in December
2016
,
2015
and
2014
, respectively. The unemployment levels in the Company’s primary market areas were as follows for the periods indicated:
|
December 2016
|
December 2015
|
December 2014
|
|||||||
|
Berkeley County, WV
|
3.1
|
%
|
3.8
|
%
|
4.3
|
%
|
|||
|
Harrison County, WV
|
4.9
|
%
|
5.8
|
%
|
4.5
|
%
|
|||
|
Jefferson County, WV
|
2.6
|
%
|
3.1
|
%
|
3.5
|
%
|
|||
|
Marion County, WV
|
5.1
|
%
|
5.9
|
%
|
4.9
|
%
|
|||
|
Monongalia County, WV
|
3.2
|
%
|
3.8
|
%
|
3.5
|
%
|
|||
|
Kanawha County, WV
|
4.6
|
%
|
5.2
|
%
|
5.1
|
%
|
|||
|
Fairfax County, VA
|
3.0
|
%
|
3.1
|
%
|
3.5
|
%
|
|||
The numbers from the Company’s primary market areas continue to be slightly better than the national numbers. The Company and the Bank nonperforming loan information supports the fact that the Company’s primary market areas have not suffered as much as that of the nation as a whole. Nonperforming loans to total loans were
0.59%
,
0.99%
and
1.16%
as of
December 31, 2016
,
2015
and
2014
, respectively. Charge-offs to total loans were
0.24%
,
0.07%
and
0.16%
for each period respectively. The Company and the Bank continue to closely monitor economic and delinquency trends.
The Company originates various types of loans, including commercial and commercial real estate loans, residential real estate loans, home equity lines of credit, real estate construction loans, and consumer loans (loans to individuals). In general, the Company retains most of its originated loans (exclusive of certain long-term, fixed rate residential mortgages that are sold.) However, loans originated in excess of the Bank’s legal lending limit are participated to other banking institutions and the servicing of those loans is retained by the bank.
The energy industry, consisting of coal and natural gas, which has been negatively impacted by the decline in energy commodity prices, are elements of the West Virginia economy and numerous markets in which the Company operates. The Company has limited exposure in both the coal and natural gas industry. As of
December 31, 2016
and
2015
, the outstanding loan balances to coal and natural gas production clients were
$7.3 million
and
$7.3 million
, respectively.
Commercial Loans
At
December 31, 2016
, the Bank had outstanding approximately
$757.5 million
in commercial loans, including commercial, commercial real estate, financial and agricultural loans. These loans represented approximately
71.9%
of the total aggregate loan portfolio as of that date.
Lending Practices
. Commercial lending entails significant additional risks as compared with consumer lending (i.e., single-family residential mortgage lending, and installment lending). In addition, the payment experience on commercial loans typically depends on adequate cash flow of a business and thus may be subject, to a greater extent, to adverse conditions in the general economy or in a specific industry. Loan terms include amortization schedules commensurate with the purpose of each loan, the source of repayment and the risk involved. The primary analysis technique used in determining whether to grant a commercial loan is the review of a schedule of estimated cash flows to evaluate whether anticipated future cash flows will be adequate to service both interest and principal due. In addition, the Bank reviews collateral to determine its value in relation to the loan in the event of a foreclosure.
The Bank evaluates all new commercial loans and the Credit Department facilitates an annual loan review process that ensures that a significant portion of the commercial loan portfolio, typically a minimum of
50%
, is reviewed each year under a risk-based approach. If deterioration in credit worthiness has occurred, the Bank takes prompt action designed to assure repayment of the loan. Upon detection of the reduced ability of a borrower to meet original cash flow obligations, the loan is considered a classified loan and reviewed for possible downgrading or placement on non-accrual status.
Consumer Loans
At
December 31, 2016
, the Bank had outstanding consumer loans in an aggregate amount of approximately
$14.5 million
or approximately
1.4%
of the aggregate total loan portfolio.
9
Lending Practices
. Consumer loans generally involve more risk as to collectability than mortgage loans because of the type and nature of the collateral and, in certain instances, the absence of collateral. As a result, consumer lending collections are dependent upon the borrower’s continued financial stability, and thus are more likely to be adversely affected by employment loss, personal bankruptcy, or adverse economic conditions. Credit approval for consumer loans requires demonstration of sufficiency of income to repay principal and interest due, stability of employment, a positive credit record and sufficient collateral for secured loans. It is the policy of the Bank to review its consumer loan portfolio monthly and to charge-off loans that do not meet its standards and to adhere strictly to all laws and regulations governing consumer lending.
Real Estate Loans
At
December 31, 2016
, the Bank had approximately
$280.8 million
of residential real estate loans, home equity lines of credit, and construction mortgages outstanding, representing
26.7%
of total loans outstanding.
Lending Practices
. The Bank generally requires that the residential real estate loan amount be no more than
80%
of the purchase price or the appraised value of the real estate securing the loan, unless the borrower obtains private mortgage insurance for the percentage exceeding
80%
. Occasionally, the Bank may lend up to
100%
of the appraised value of the real estate. Loans made in this lending category are generally one to ten-year adjustable rate, fully amortizing to maturity mortgages. MVB Bank also originates fixed rate real estate loans and generally sells these loans in the secondary market. Most real estate loans are secured by first mortgages with evidence of title in favor of the Bank in the form of an attorney’s opinion of the title or a title insurance policy. MVB Bank also requires proof of hazard insurance with the Bank named as the mortgagee and as the loss payee. Full appraisals are obtained from licensed appraisers for the majority of loans secured by real estate.
Home Equity Loans
. Home equity lines of credit are generally made as second mortgages by MVB Bank. The maximum amount of a home equity line of credit is generally limited to
80%
of the appraised value of the property less the balance of the first mortgage. The Bank will lend up to
89.9%
of the appraised value of the property at higher interest rates which are considered compatible with the additional risk assumed in these types of loans. The home equity lines of credit are written with 10 year terms, but are subject to review upon request for renewal.
Construction Loans
. Construction financing is generally considered to involve a higher degree of risk of loss than long-term financing on improved, occupied real estate. Risk of loss on a construction loan is dependent largely upon the accuracy of the initial estimate of the property’s value at completion of construction and the estimated cost (including interest) of construction. If the estimate of construction cost proves to be inaccurate, MVB may advance funds beyond the amount originally committed to permit completion of the project. Also, note that with respect to construction loans, the bank generally makes loans to the homeowner and not to builders. At
December 31, 2016
, residential mortgage construction loans to individuals totaled approximately
$112.1 million
with an average life of
7
months and are generally refinanced to a permanent loan upon completion of the construction.
Competition
The Company experiences significant competition in attracting depositors and borrowers. Competition in lending activities comes principally from other commercial banks, savings associations, insurance companies, governmental agencies, credit unions, brokerage firms and pension funds. The primary factors in competing for loans are interest rate and overall lending services. Competition for deposits comes from other commercial banks, savings associations, money market funds and credit unions as well as from insurance companies and brokerage firms. The primary factors in competing for deposits are interest rates paid on deposits, account liquidity, convenience of office location and overall financial condition. The Company believes that its community approach provides flexibility, which enables the Bank to offer an array of banking products and services. MVB Mortgage faces significant competition from both traditional financial institutions and other national and local mortgage banking operations.
The Company primarily focuses on the Marion, Harrison, Jefferson, Berkeley, Monongalia and Kanawha County markets in West Virginia and the northern Virginia area for its products and services. Management believes it has developed a level of expertise in serving this area.
The Company operates under a “needs-based” selling approach that management believes has proven successful in serving the financial needs of most customers. It is not the Company’s strategy to compete solely on the basis of interest rates. Management believes that a focus on customer relationships and service will promote our customers’ continued use of our financial products and services and will lead to enhanced revenue opportunities.
10
Supervision and Regulation
The Company, the Bank and its subsidiaries are subject to extensive regulation under federal and state laws. The Company’s earnings are affected by general economic conditions, management policies, changes in state and federal laws and regulations and actions of various regulatory authorities, including those referred to in this section. The following discussion describes elements of an extensive regulatory framework applicable to bank holding companies, financial holding companies, and banks and contains specific information about the Company. Regulation of banks, bank holding companies, and financial holding companies is intended primarily for the protection of depositors, the insurance fund of the Federal Deposit Insurance Corporation (“FDIC”) and the stability of the financial system, rather than for the protection of shareholders and creditors. In addition to banking laws, regulations and regulatory agencies, the Company is subject to various other laws, regulations, supervision and examination by other regulatory agencies, all of which directly or indirectly affect the operations and management of the Company and its ability to make distributions to shareholders. State and federal law govern the activities in which the Bank engages, the investments it makes, and the aggregate amount of loans that may be granted to one borrower. Various consumer and compliance laws and regulations also affect the Company’s operations. This discussion is qualified in its entirety by reference to the full text of the statutes, regulations and policies that are described. Such statutes, regulations and policies are continually under review by Congress and state legislatures and federal and state regulatory agencies. The likelihood and timing of any such changes and the impact such changes may have on the Company is impossible to determine with any certainty. A change in statutes, regulations or regulatory policies applicable to the Company and its subsidiary could have a material effect on our business, financial condition or our results of operations.
Financial Regulatory Reform
During the past several years, there has been a significant increase in regulation and regulatory oversight for U.S. financial services firms, primarily resulting from the enactment of the Dodd-Frank Wall Street Reform and Consumer Protection Act (the “Dodd-Frank Act”) in 2010. The Dodd-Frank Act is extensive, complicated, and comprehensive legislation that impacts practically all aspects of a banking organization, representing a significant overhaul of many aspects of the regulation of the financial services industry. The Dodd-Frank Act implements numerous and far-reaching changes that affect financial companies, including banks, bank holding companies, and financial holding companies such as the Company. The Dodd-Frank Act imposes new prudential regulation on depository institutions and their holding companies. As such, the Company is subject to more stringent standards and requirements with respect to (1) bank and nonbank acquisitions and mergers, (2) the “financial activities” in which it engages as a financial holding company, (3) affiliate transactions and (4) proprietary trading, among other provisions.
Many of the provisions of the Dodd-Frank Act and other laws are subject to further rulemaking, guidance and interpretation by the applicable federal regulators. The Company will continue to evaluate the impact of any new regulations so promulgated, including changes in regulatory costs and fees, modifications to consumer products or disclosures required by the Consumer Financial Protection Bureau (“CFPB”) and the requirements of the enhanced supervision provisions, among others.
Regulatory Agencies
The Company is a legal entity separate and distinct from the Bank and the Bank's wholly-owned subsidiaries. As a financial holding company and a bank holding company, the Company is regulated under the Bank Holding Company Act of 1956, as amended (“BHCA”), and it and its subsidiary are subject to inspection, examination and supervision by the Board of Governors of the Federal Reserve System (“Federal Reserve Board”). The BHCA provides generally for “umbrella” regulation of financial holding companies such as the Company by the Federal Reserve Board, and for functional regulation of banking activities by bank regulators, securities activities by securities regulators, and insurance activities by insurance regulators. The Company is also under the jurisdiction of the Securities and Exchange Commission (“SEC”) and is subject to the disclosure and regulatory requirements of the Securities Act of 1933, as amended, and the Securities Exchange Act of 1934, as amended, as administered by the SEC.
The Bank is a West Virginia state chartered bank. The Bank is not a member bank of the Federal Reserve System (“non-member bank”). Accordingly, the West Virginia Division of Financial Institutions and the FDIC are the primary regulators of the Bank.
Bank Holding Company Activities
In general, the BHCA limits the business of bank holding companies to banking, managing or controlling banks and other activities that the Federal Reserve Board has determined to be so closely related to banking as to be a proper incident thereto. In addition, bank holding companies that qualify and elect to be financial holding companies may engage in any activity, or acquire and retain the shares of a company engaged in any activity, that is either (i) financial in nature or incidental to such financial
11
activity (as determined by the Federal Reserve Board in consultation with the Secretary of the Treasury) or (ii) complementary to a financial activity and does not pose a substantial risk to the safety and soundness of depository institutions or the financial system generally (as solely determined by the Federal Reserve Board), without prior approval of the Federal Reserve Board. Activities that are financial in nature include securities underwriting and dealing, insurance underwriting and making merchant banking investments. Under current federal law, as a bank holding company, the Company has elected to become a financial holding company.
Most of the financial activities that are permissible for financial holding companies also are permissible for a bank’s “financial subsidiary,” except for insurance underwriting, insurance company portfolio investments, real estate investments and development, and merchant banking, which must be conducted by a financial holding company. In order for a financial subsidiary of a bank to engage in permissible financial activities, federal law requires the parent bank (and its sister-bank affiliates) to be well capitalized and well managed; the aggregate consolidated assets of all of that bank’s financial subsidiaries may not exceed the lesser of
45%
of its consolidated total assets or
$50 billion
; the bank must have at least a satisfactory CRA rating.
To maintain financial holding company status, a financial holding company and all of its depository institution subsidiaries must be “well capitalized” and “well managed” under applicable Federal Reserve Board regulations. A depository institution subsidiary is considered to be “well capitalized” if it satisfies the requirements for this status discussed in the sections captioned “Capital Requirements” and “Prompt Corrective Action,” included elsewhere in this item. A depository institution subsidiary is considered “well managed” if it received a composite rating and management rating of at least “satisfactory” in its most recent examination. If a financial holding company ceases to meet these capital and management requirements, the Federal Reserve Board’s regulations provide that the financial holding company must enter into an agreement with the Federal Reserve Board to comply with all applicable capital and management requirements. Until the financial holding company returns to compliance, the Federal Reserve Board may impose limitations or conditions on the conduct of its activities, and the company may not commence any of the broader financial activities permissible for financial holding companies or acquire a company engaged in such financial activities without prior approval of the Federal Reserve Board. If the company does not return to compliance within 180 days, the Federal Reserve Board may require divestiture of the holding company’s depository institutions. Bank holding companies and banks must also be both well capitalized and well managed in order to acquire banks located outside their home state.
In order for a financial holding company to commence any new activity permitted by the BHCA or to acquire a company engaged in any new activity permitted by the BHCA, each insured depository institution subsidiary of the financial holding company must have received a rating of at least “satisfactory” in its most recent examination under the Community Reinvestment Act. See the section captioned “Community Reinvestment Act” included elsewhere in this item.
The Federal Reserve Board has the power to order any bank holding company or its subsidiaries to terminate any activity or to terminate its ownership or control of any subsidiary when the Federal Reserve Board has reasonable grounds to believe that continuation of such activity or such ownership or control constitutes a serious risk to the financial soundness, safety or stability of any bank subsidiary of the bank holding company.
Current federal law establishes a system of functional regulation under which the Federal Reserve Board is the umbrella regulator for bank holding companies, but bank holding company affiliates are principally regulated by functional regulators such as the FDIC for state nonmember bank affiliates, and state insurance regulators for insurance affiliates. Certain specific activities, including traditional bank trust and fiduciary activities, may be conducted in the bank without the bank being deemed a “broker” or a “dealer” in securities for purposes of functional regulation. Although states generally must regulate bank insurance activities in a nondiscriminatory manner, states may continue to adopt and enforce rules that specifically regulate bank insurance activities in certain identifiable areas.
Acquisitions
The BHCA, the Bank Merger Act, West Virginia banking law, and other federal and state statutes regulate acquisitions of commercial banks and their parent holding companies. The BHCA requires the prior approval of the Federal Reserve Board for the direct or indirect acquisition by a bank holding company of more than
5.0%
of the voting shares of a commercial bank or its parent holding company. Under the Bank Merger Act, the prior approval of the FDIC or other appropriate bank regulatory authority is required for a non-member bank to merge with another bank or purchase substantially all of the assets or assume any deposits of another bank. In reviewing applications seeking approval of merger and acquisition transactions, the bank regulatory authorities will consider, among other things, the competitive effect and public benefits of the transactions, the capital position of the combined organization, the risks to the stability of the U.S. banking or financial system, the applicant’s performance record under the Community Reinvestment Act (see the section captioned “Community Reinvestment Act” included elsewhere in this
12
item) and its compliance with consumer protection laws and the effectiveness of the subject organizations in combating money laundering activities.
Current federal law authorizes interstate acquisitions of banks and bank holding companies without geographic limitation. Furthermore, a bank headquartered in one state is authorized to merge with a bank headquartered in another state, subject to market share limitations and any state requirement that the target bank shall have been in existence and operating for a minimum period of time. After a bank has established branches in a state through an interstate merger transaction, the bank may establish and acquire additional branches at any location in the state where a bank headquartered in that state could have established or acquired branches under applicable federal or state law. These regulatory considerations are applicable to privately negotiated acquisition transactions.
The Federal Reserve Board has issued rules implementing section 622 of the Dodd-Frank Act, which generally prohibits a financial company from combining with another company if the ratio of the resulting company's liabilities exceeds
10%
of the aggregate consolidated liabilities of all financial companies.
Other Safety and Soundness Regulations
The Federal Reserve Board has enforcement powers over bank holding companies and their nonbanking subsidiaries. The Federal Reserve Board has authority to prohibit activities that represent unsafe or unsound practices or constitute violations of law, rule, regulation, administrative order or written agreement with a federal regulator. These powers may be exercised through the issuance of cease and desist orders, civil money penalties or other actions.
Federal and state banking regulators also have broad enforcement powers over the Bank, including the power to impose fines and other civil and criminal penalties, and to appoint a receiver in order to conserve the assets of the Bank for the benefit of depositors and other creditors. The West Virginia commissioner of banking also has the authority to take possession of a West Virginia state bank in certain circumstances, including, among other things, when it appears necessary in order to protect or preserve the assets of that bank for the benefit of depositors and other creditors.
Anti-Money Laundering and the USA PATRIOT Act
A major focus of governmental policy on financial institutions in recent years has been aimed at combating money laundering and terrorist financing. The USA PATRIOT Act of 2001, or the USA Patriot Act, substantially broadened the scope of United States anti-money laundering laws and regulations by imposing significant new compliance and due diligence obligations, creating new crimes and penalties and expanding the extra-territorial jurisdiction of the United States. The USA Patriot Act contains anti-money laundering measures affecting insured depository institutions, broker-dealers and certain other financial institutions. Financial institutions are prohibited from entering into specified financial transactions and account relationships and must use enhanced due diligence procedures in their dealings with certain types of high-risk customers and implement a written customer identification program. Financial institutions must take certain steps to assist government agencies in detecting and preventing money laundering and report certain types of suspicious transactions. The USA Patriot Act includes the International Money Laundering Abatement and Financial Anti-Terrorism Act of 2001, which grants the Secretary of the U.S. Treasury broad authority to establish regulations and to impose requirements and restrictions on financial institutions’ operations. The U.S. Treasury has issued a number of regulations to implement the USA Patriot Act under this authority requiring financial institutions to maintain appropriate policies, procedures and controls to detect, prevent and report money laundering and terrorist financing. Regulatory authorities routinely examine financial institutions for compliance with these obligations, and failure of a financial institution to maintain and implement adequate programs to combat money laundering and terrorist financing, or to comply with all of the relevant laws or regulations, could have serious legal and reputational consequences for the institution, including causing applicable bank regulatory authorities not to approve merger or acquisition transactions when regulatory approval is required or to prohibit such transactions even if approval is not required. Regulatory authorities have imposed cease and desist orders and civil money penalties against institutions found to be violating these obligations.
Office of Foreign Assets Control Regulation
The U.S. Treasury Department’s Office of Foreign Assets Control, or OFAC, administers and enforces economic and trade sanctions against targeted foreign countries and regimes, under authority of various laws, including designated foreign countries, nationals and others. OFAC publishes lists of specially designated targets and countries. We are responsible for, among other things, blocking accounts of, and transactions with, such targets and countries, prohibiting unlicensed trade and financial transactions with them and reporting blocked transactions after their occurrence. Failure to comply with these sanctions could
13
have serious legal and reputational consequences, including causing applicable bank regulatory authorities not to approve merger or acquisition transactions when regulatory approval is required or to prohibit such transactions even if approval is not required.
Incentive Compensation
The Federal Reserve Board reviews, as part of its regular, risk-focused examination process, the incentive compensation arrangements of banking organizations, such as the Company, that are not “large, complex banking organizations.” These reviews are tailored to each organization based on the scope and complexity of the organization’s activities and the prevalence of incentive compensation arrangements. The findings of this supervisory initiative will be included in reports of examination. Deficiencies will be incorporated into the organization’s supervisory ratings, which can affect the organization’s ability to make acquisitions and take other actions. Enforcement actions may be taken against a banking organization if its incentive compensation arrangements, or related risk-management control or governance processes, pose a risk to the organization’s safety and soundness and the organization is not taking prompt and effective measures to correct the deficiencies.
In
June 2010
, the Federal Reserve Board, Office of the Comptroller of the Currency (“OCC”), and FDIC issued comprehensive final guidance on incentive compensation policies intended to ensure that the incentive compensation policies of banking organizations do not undermine the safety and soundness of such organizations by encouraging excessive risk-taking. The guidance, which covers all employees that have the ability to materially affect the risk profile of an organization, either individually or as part of a group, is based upon the key principles that a banking organization’s incentive compensation arrangements should (i) provide incentives that do not encourage risk-taking beyond the organization’s ability to effectively identify and manage risks, (ii) be compatible with effective internal controls and risk management, and (iii) be supported by strong corporate governance, including active and effective oversight by the organization’s board of directors.
In
June 2016
, the Federal Reserve Board, other federal banking agencies, and the SEC jointly published a proposed rulemaking designed to strengthen the incentive-based compensation practices at covered institutions by better aligning the financial rewards for covered persons with an institution's long-term safety and soundness. The proposed rule uses a tiered approach that applies provisions to covered financial institutions according to three categories of average total consolidated assets: Level 1 ($250 billion or more), Level 2 ($50 billion to $250 billion), and Level 3 ($1 billion to $50 billion). For all covered institutions, the proposed rule would (i) prohibit types and features of incentive-based compensation arrangements that encourage inappropriate risks because they are "excessive" or "could lead to material financial loss" at a covered institution, (ii) require incentive-based compensation arrangements to adhere to three basic principles: (1) a balance between risk and reward; (2) effective risk management and controls; and (3) effective governance, and (iii) require appropriate board or directors (or committee) oversight and record keeping and disclosures to the appropriate agency. For Level 1 and Level 2 institutions, the proposed rule would (i) require the following: the deferral of awards for senior executive officers and significant risk takers; the subjecting of unpaid and unvested incentive compensation to the risk of downward adjustments or forfeiture; the subjecting of paid incentive compensation to the risk of "clawback;" establishing a board compensation committee; expanded risk-management and control standards; additional record keeping requirements for senior executive officers and significant risk takers; and detailed policies and procedures to ensure rule compliance and (ii) prohibit certain inappropriate practices, including: the purchase of hedging instruments that offset decreases in the value of incentive compensation; allowing a range of payouts that might encourage risk taking; and basing compensation solely on comparison to peer and volume-driven incentives without regard to transaction quality or compliance with sound risk management. The comment period ended in
July 2016
.
If these or other regulations are adopted in a form similar to that initially proposed, they will impose limitations on the manner in which we may structure compensation for our executives.
The scope and content of the U.S. banking regulators’ policies on incentive compensation are continuing to develop. It cannot be determined at this time whether or when a final rule will be adopted and whether compliance with such a final rule will adversely affect the ability of the Company and its subsidiary to hire, retain and motivate their key employees.
The Volcker Rule
The Volcker Rule implements section 619 of the Dodd-Frank Act and prohibits insured depository institutions and affiliated companies (together, “banking entities”) from engaging in short-term proprietary trading of certain securities, derivatives, and commodity futures, and options on these instruments, for their own account. The final rules adopted by federal financial regulatory agencies to implement section 619 also impose limits on banking entities’ investments in, and other relationships with, hedge funds or private equity funds. Like the Dodd-Frank Act, the rules provide exemptions for certain activities, including market making, underwriting, hedging, trading in government obligations, insurance company activities, and organizing and
14
offering hedge funds or private equity funds. The rules also clarify that certain activities are not prohibited, including acting as agent, broker or custodian.
The compliance requirements under the rules vary based on the size of the banking entity and the scope of activities conducted. Banking entities with significant trading operations will be required to establish a detailed compliance program, and their Chief Executive Officers will be required to attest that the program is reasonably designed to achieve compliance with the final rules. Independent testing and analysis of an institution's compliance program also will be required. The final rules reduce the burden on smaller, less-complex institutions by limiting their compliance and reporting requirements. Additionally, a banking entity that does not engage in covered trading activities will not need to establish a compliance program.
Banking entities must conform their proprietary trading activities to the final rule by
July 21, 2015
. The Federal Reserve Board has extended the compliance deadline to
July 21, 2017
for purposes of conforming investments in and relationships with covered funds and foreign funds that were in place prior to
December 31, 2013
. These requirements are not expected to have a material impact on the Company’s consolidated financial position, results of operations or cash flows. The Volcker Rule does not significantly impact the operations of the Company and its subsidiary, as we do not have any significant engagement in the businesses prohibited by the Volcker Rule.
Limit on Dividends
The Company is a legal entity separate and distinct from the Bank and the Bank's wholly-owned subsidiaries. The Company’s ability to obtain funds for the payment of dividends and for other cash requirements largely depends on the amount of dividends the Bank declares. However, the Federal Reserve Board expects the Company to serve as a source of financial and managerial strength to the Bank to reduce potential loss exposure to the Bank’s depositors and to the FDIC insurance fund in the event the Bank becomes is insolvent or is in danger of becoming insolvent. Under this requirement, the Company is expected to commit resources to support the Bank, including at times when the Company may not be in a financial position to provide such resources. Any capital loans by the Company to the Bank would be subordinate in right of payment to depositors and to certain other indebtedness of the Bank. In the event of the Company’s bankruptcy, any commitment by the Company to a federal bank regulatory agency to maintain the capital of the Bank will be assumed by the bankruptcy trustee and entitled to priority of payment.
Accordingly, the Federal Reserve Board may require the Company to retain capital for further investment in the Bank, rather than pay dividends to its shareholders. The Bank may not pay dividends to the Company if, after paying those dividends, the Bank would fail to meet the required minimum levels under the risk-based capital guidelines and the minimum leverage ratio requirements. The Bank must have the approval from the West Virginia Division of Financial Institutions if a dividend in any year would cause the total dividends for that year to exceed the sum of the current year’s net earnings as defined and the retained earnings for the preceding two years as defined, less required transfers to surplus. These provisions could limit the Company’s ability to pay dividends on its outstanding common shares.
In addition, the Company and the Bank are subject to other regulatory policies and requirements relating to the payment of dividends, including requirements to maintain adequate capital above regulatory minimums (See “Capital Requirements”, below). The appropriate federal regulatory authority is authorized to determine under certain circumstances relating to the financial condition of a bank holding company or a bank that the payment of dividends would be an unsafe or unsound practice and to prohibit payment thereof. The appropriate federal regulatory authorities have stated that paying dividends that deplete a bank’s capital base to an inadequate level would be an unsafe and unsound banking practice and that banking organizations should generally pay dividends only out of current operating earnings. In addition, in the current financial and economic environment, the Federal Reserve Board has indicated that bank holding companies should carefully review their dividend policy and has discouraged payment ratios that are at maximum allowable levels unless both asset quality and capital are very strong.
Transactions with Affiliates
Transactions between the Bank and its subsidiaries, on the one hand, and the Company or any other subsidiary, on the other hand, are regulated under federal banking law. The Federal Reserve Act, made applicable by section 8(j) of the FDIA, imposes quantitative and qualitative requirements and collateral requirements on covered transactions by the Bank with, or for the benefit of, its affiliates, and generally requires those transactions to be on terms at least as favorable to the Bank as if the transaction were conducted with an unaffiliated third party. Covered transactions are defined by statute to include a loan or extension of credit, as well as a purchase of securities issued by an affiliate, a purchase of assets (unless otherwise exempted by the Federal Reserve Board) from the affiliate, certain derivative transactions that create a credit exposure to an affiliate, the acceptance of securities issued by the affiliate as collateral for a loan, and the issuance of a guarantee, acceptance or letter of credit on behalf of an
15
affiliate. In general, any such transaction by the Bank or its subsidiaries must be limited to certain thresholds on an individual and aggregate basis and, for credit transactions with any affiliate, must be secured by designated amounts of specified collateral.
Federal law also limits a bank’s authority to extend credit to its directors, executive officers and
10%
stockholders, as well as to entities controlled by such persons. Among other things, extensions of credit to insiders are required to be made on terms that are substantially the same as, and follow credit underwriting procedures that are not less stringent than, those prevailing for comparable transactions with unaffiliated persons. Also, the terms of such extensions of credit may not involve more than the normal risk of non-repayment or present other unfavorable features and may not exceed certain limitations on the amount of credit extended to such persons individually and in the aggregate.
Capital Requirements
The Company and the Bank are each required to comply with applicable capital adequacy standards established by the Federal Reserve Board and the FDIC, respectively (“Capital Rules”). State chartered banks, such as the Bank, are subject to similar capital requirements adopted by the West Virginia Division of Financial Institutions.
The Capital Rules, among other things, (i) include a “Common Equity Tier 1” (“CET1”) measure, (ii) specify that Tier 1 capital consists of CET1 and “Additional Tier 1 capital” instruments meeting certain revised requirements, (iii) define CET1 narrowly by requiring that most deductions/adjustments to regulatory capital measures be made to CET1 and not to the other components of capital, and (iv) expand the scope of the deductions/adjustments to capital as compared to existing regulations.
Under the Capital Rules, the minimum capital ratios effective as of
January 1, 2015
are:
•
4.5%
CET1 to risk-weighted assets;
•
6.0%
Tier 1 capital (that is, CET1 plus Additional Tier 1 capital) to risk-weighted assets;
•
8.0%
Total capital (that is, Tier 1 capital plus Tier 2 capital) to risk-weighted assets; and
•
4.0%
Tier 1 capital to average consolidated assets as reported on consolidated financial statements (known as the
leverage ratio”).
The Capital Rules also include a new “capital conservation buffer”, composed entirely of CET1, on top of these minimum risk-weighted asset ratios. The implementation of the capital conservation buffer began on
January 1, 2016
at the
0.625%
level and will increase by
0.625%
on each subsequent
January 1
, until it reaches
2.5%
on
January 1, 2019
. The Capital Rules also provide for a “countercyclical capital buffer” that is only applicable to certain covered institutions and does not have any current applicability to the Company or the Bank. The capital conservation buffer is designed to absorb losses during periods of economic stress and effectively increases the minimum required risk-weighted capital ratios. Banking institutions with a ratio of CET1 to risk-weighted assets below the effective minimum (
4.5%
plus the capital conservation buffer and, if applicable, the countercyclical capital buffer) will face constraints on dividends, equity repurchases and compensation based on the amount of the shortfall.
When fully phased in on
January 1, 2019
, the Capital Rules will require the Company and the Bank to maintain an additional capital conservation buffer of
2.5%
of CET1, effectively resulting in minimum ratios of (i) CET1 to risk-weighted assets of at least
7%
, (ii) Tier 1 capital to risk-weighted assets of at least
8.5%
, (iii) a minimum ratio of Total capital to risk-weighted assets of at least
10.5%
; and (iv) a minimum leverage ratio of
4%
. The Capital Rules also provide for a number of deductions from and adjustments to CET1.
The Capital Rules prescribe a standardized approach for risk weightings that expanded the risk-weighting categories from the general risk-based capital rules to a much larger and more risk-sensitive number of categories, depending on the nature of the assets, generally ranging from
0%
for U.S. government and agency securities, to
600%
for certain equity exposures, and resulting in higher risk weights for a variety of asset categories.
With respect to the Bank, the Capital Rules also revise the “prompt corrective action” regulations pursuant to Section 38 of the Federal Deposit Insurance Act, as discussed below under “Prompt Corrective Action.”
Prompt Corrective Action
The FDIA requires among other things, the federal banking agencies to take “prompt corrective action” in respect of depository institutions that do not meet minimum capital requirements. The FDIA includes the following five capital tiers: “well capitalized,” “adequately capitalized,” “undercapitalized,” “significantly undercapitalized” and “critically undercapitalized.” A depository
16
institution’s capital tier will depend upon how its capital levels compare with various relevant capital measures and certain other factors, as established by regulation. The relevant capital measures, which reflect changes under the Capital Rules that became effective on
January 1, 2015
, are the total capital ratio, the CET1 capital ratio, the Tier 1 capital ratio and the leverage ratio.
A bank will be (i) “well capitalized” if the institution has a total risk-based capital ratio of
10.0%
or greater, a CET1 capital ratio of
6.5%
or greater, a Tier 1 risk-based capital ratio of
8.0%
or greater, and a leverage ratio of
5.0%
or greater, and is not subject to any order or written directive by any such regulatory authority to meet and maintain a specific capital level for any capital measure; (ii) “adequately capitalized” if the institution has a total risk-based capital ratio of
8.0%
or greater, a CET1 capital ratio of
4.5%
or greater, a Tier 1 risk-based capital ratio of
6.0%
or greater, and a leverage ratio of
4.0%
or greater and is not “well capitalized”; (iii) “undercapitalized” if the institution has a total risk-based capital ratio that is less than
8.0%
, a CET1 capital ratio less than
4.5%
, a Tier 1 risk-based capital ratio of less than
6.0%
or a leverage ratio of less than
4.0%
; (iv) “significantly undercapitalized” if the institution has a total risk-based capital ratio of less than
6.0%
, a CET1 capital ratio less than
3.0%
, a Tier 1 risk-based capital ratio of less than
4.0%
or a leverage ratio of less than
3.0%
; and (v) “critically undercapitalized” if the institution’s tangible equity is equal to or less than
2.0%
of average quarterly tangible assets. An institution may be downgraded to, or deemed to be in, a capital category that is lower than indicated by its capital ratios if it is determined to be in an unsafe or unsound condition or if it receives an unsatisfactory examination rating with respect to certain matters. A bank’s capital category is determined solely for the purpose of applying prompt corrective action regulations, and the capital category may not constitute an accurate representation of the bank’s overall financial condition or prospects for other purposes.
The FDIA generally prohibits a depository institution from making any capital distributions (including payment of a dividend) or paying any management fee to its parent holding company if the depository institution would thereafter be “undercapitalized.” “Undercapitalized” institutions are subject to growth limitations and are required to submit a capital restoration plan. The agencies may not accept such a plan without determining, among other things, that the plan is based on realistic assumptions and is likely to succeed in restoring the depository institution’s capital. In addition, for a capital restoration plan to be acceptable, the depository institution’s parent holding company must guarantee that the institution will comply with such capital restoration plan. The bank holding company must also provide appropriate assurances of performance. The aggregate liability of the parent holding company is limited to the lesser of (i) an amount equal to
5.0%
of the depository institution’s total assets at the time it became undercapitalized and (ii) the amount which is necessary (or would have been necessary) to bring the institution into compliance with all capital standards applicable with respect to such institution as of the time it fails to comply with the plan. If a depository institution fails to submit an acceptable plan, it is treated as if it is “significantly undercapitalized.”
“Significantly undercapitalized” depository institutions may be subject to a number of requirements and restrictions, including orders to sell sufficient voting stock to become “adequately capitalized,” requirements to reduce total assets, and cessation of receipt of deposits from correspondent banks. “Critically undercapitalized” institutions are subject to the appointment of a receiver or conservator.
The appropriate federal banking agency may, under certain circumstances, reclassify a well capitalized insured depository institution as adequately capitalized. The FDIA provides that an institution may be reclassified if the appropriate federal banking agency determines (after notice and opportunity for hearing) that the institution is in an unsafe or unsound condition or deems the institution to be engaging in an unsafe or unsound practice. The appropriate agency is also permitted to require an adequately capitalized or undercapitalized institution to comply with the supervisory provisions as if the institution were in the next lower category (but not treat a significantly undercapitalized institution as critically undercapitalized) based on supervisory information other than the capital levels of the institution.
In addition to the “prompt corrective action” directives, failure to meet capital guidelines may subject a banking organization to a variety of other enforcement remedies, including additional substantial restrictions on its operations and
activities, termination of deposit insurance by the FDIC and, under certain conditions, the appointment of a conservator or receiver.
For further information regarding the capital ratios and leverage ratio of the Company and the Bank see the discussion under the section captioned “Capital/Stockholders’ Equity” included in Item 7, Management’s Discussion and Analysis of Financial Condition and Results of Operations and Note 14, “Regulatory Capital Requirements” of the Notes to the Consolidated Financial Statements included in Item 8, Financial Statements and Supplementary Data, of this Annual Report on Form 10-K.
Safety and Soundness Standards
The FDIA requires the federal bank regulatory agencies to prescribe standards, by regulations or guidelines, relating to internal controls, information systems and internal audit systems, loan documentation, credit underwriting, interest rate risk exposure,
17
asset growth, asset quality, earnings, stock valuation and compensation, fees and benefits, and such other operational and managerial standards as the agencies deem appropriate. Guidelines adopted by the federal bank regulatory agencies establish general standards relating to internal controls and information systems, internal audit systems, loan documentation, credit underwriting, interest rate exposure, asset growth and compensation, fees and benefits. In general, the guidelines require, among other things, appropriate systems and practices to identify and manage the risk and exposures specified in the guidelines. The guidelines prohibit excessive compensation as an unsafe and unsound practice and describe compensation as excessive when the amounts paid are unreasonable or disproportionate to the services performed by an executive officer, employee, director or principal stockholder. In addition, the agencies adopted regulations that authorize, but do not require, an agency to order an institution that has been given notice by an agency that it is not satisfying any of such safety and soundness standards to submit a compliance plan. If, after being so notified, an institution fails to submit an acceptable compliance plan or fails in any material respect to implement an acceptable compliance plan, the agency must issue an order directing action to correct the deficiency and may issue an order directing other actions of the types to which an undercapitalized institution is subject under the “prompt corrective action” provisions of the FDIA. See “Prompt Corrective Action” above. If an institution fails to comply with such an order, the agency may seek to enforce such order in judicial proceedings and to impose civil money penalties.
Deposit Insurance
The Bank’s deposits are insured by the FDIC up to the limits set forth under applicable law. The FDIC imposes a risk-based deposit premium assessment system that determines assessment rates for an insured depository institution based on an assessment rate calculator, which is based on a number of elements to measure the risk each insured depository institution poses to the FDIC insurance fund. The assessment rate is applied to total average assets less tangible equity, as defined under the Dodd-Frank Act. The assessment rate schedule can change from time to time at the discretion of the FDIC, subject to certain limits. Under the current system, premiums are assessed quarterly.
Under the FDIA, the FDIC may terminate deposit insurance upon a finding that the institution has engaged in unsafe and unsound practices, is in an unsafe or unsound condition to continue operations, or has violated any applicable law, regulation, rule, order or condition imposed by the FDIC.
Depositor Preference
The FDIA provides that, in the event of the “liquidation or other resolution” of an insured depository institution, the claims of depositors of the institution, including the claims of the FDIC as subrogee of insured depositors, and certain claims for administrative expenses of the FDIC as a receiver, will have priority over other general unsecured claims against the institution. If an insured depository institution fails, insured and uninsured depositors, along with the FDIC, will have priority in payment ahead of unsecured, non-deposit creditors, including depositors whose deposits are payable only outside of the United States and the parent bank holding company, with respect to any extensions of credit they have made to such insured depository institution.
Federal Home Loan Bank (“FHLB”) membership
The FHLB provides credit to its members in the form of advances. As a member of the FHLB of Pittsburgh, the Bank must maintain an investment in the capital stock of that FHLB in an amount equal to
0.10%
of the calculated Member Asset Value (“MAV”) plus
4.00%
of outstanding advances and
0.75%
of outstanding letters of credit. The MAV is determined by taking line item values for various investment and loan classes and applying an FHLB haircut to each item. At
December 31, 2016
, the Bank held capital stock of FHLB in the amount of
$5.8 million
.
Federal and State Consumer Laws
The Company and the Bank are subject to a number of federal and state consumer protection laws that extensively govern our relationship with our customers. These laws include the Equal Credit Opportunity Act, the Fair Credit Reporting Act, the Truth in Lending Act, the Truth in Savings Act, the Electronic Fund Transfer Act, the Expedited Funds Availability Act, the Home Mortgage Disclosure Act, the Fair Housing Act, the Real Estate Settlement Procedures Act, the Fair Debt Collection Practices Act, the Service Members Civil Relief Act and these laws’ respective state-law counterparts, as well as state usury laws and laws regarding unfair and deceptive acts and practices. These and other federal laws, among other things, require disclosures of the cost of credit and terms of deposit accounts, provide substantive consumer rights, prohibit discrimination in credit transactions, regulate the use of credit report information, provide financial privacy protections, prohibit unfair, deceptive and abusive practices, restrict our ability to raise interest rates and subject us to substantial regulatory oversight. Violations of applicable consumer protection laws can result in significant potential liability from litigation brought by customers, including actual damages, restitution and attorneys’ fees. Federal bank regulators, state attorneys general, and state and local consumer protection
18
agencies may also seek to enforce consumer protection requirements and obtain these and other remedies, including regulatory sanctions, customer rescission rights, action by the state and local attorneys general in each jurisdiction in which we operate and civil money penalties. Failure to comply with consumer protection requirements may also result in our failure to obtain any required bank regulatory approval for merger or acquisition transactions we may wish to pursue or our prohibition from engaging in such transactions even if approval is not required.
CFPB
The CFPB is a federal agency responsible for implementing, examining and enforcing compliance with federal consumer protection laws. The CFPB focuses on:
|
•
|
Risks to consumers and compliance with the federal consumer financial laws, when it evaluates the policies and practices of a financial institution.
|
|
•
|
The markets in which firms operate and risks to consumers posed by activities in those markets.
|
|
•
|
Depository institutions that offer a wide variety of consumer financial products and services.
|
|
•
|
Depository institutions with a more specialized focus.
|
|
•
|
Non-depository companies that offer one or more consumer financial products or services.
|
The CFPB has broad rulemaking authority for a wide range of consumer financial laws that apply to all banks, including the Bank, addressing, among other things, the authority to prohibit “unfair, deceptive or abusive” acts and practices. Abusive acts or practices are defined as those that materially interfere with a consumer’s ability to understand a term or condition of a consumer financial product or service or take unreasonable advantage of a consumer’s (i) lack of financial savvy, (ii) inability to protect himself in the selection or use of consumer financial products or services, or (iii) reasonable reliance on a covered entity to act in the consumer’s interests. The CFPB can issue cease-and-desist orders against banks and other entities that violate consumer financial laws. The CFPB may also institute a civil action against an entity in violation of federal consumer financial law in order to impose a civil penalty or injunction. The CFPB has examination and enforcement authority over all banks with more than $10 billion in assets, as well as their affiliates, which authority would not apply to the Company or the Bank.
The Dodd-Frank Act permits states to adopt consumer protection laws and standards that are more stringent than those adopted at the federal level and, in certain circumstances, permits state attorneys general to enforce compliance with both the state and federal laws and regulations.
The CFPB has concentrated much of its rulemaking efforts on a variety of mortgage-related topics required under the Dodd-Frank Act, including mortgage origination disclosures, minimum underwriting standards and ability to repay, high-cost mortgage lending, and servicing practices. The rules related to ability to repay, qualified mortgage standards and mortgage servicing became effective in
January 2014
. The escrow and loan originator compensation rules became effective during
2013
. A final rule integrating disclosure required by the Truth in Lending Act and the Real Estate Settlement and Procedures Act became effective
August 1, 2015
.
Financial Privacy
Federal law currently contains extensive customer privacy protection provisions, including substantial customer privacy protections provided under the Financial Services Modernization Act of 1999 (commonly known as the Gramm-Leach-Bliley Act). Under these provisions, a financial institution must provide to its customers, at the inception of the customer relationship and annually thereafter, the institution’s policies and procedures regarding the handling of customers’ nonpublic personal financial information. These provisions also provide that, except for certain limited exceptions, an institution may not provide such personal information to unaffiliated third parties unless the institution discloses to the customer that such information may be so provided and the customer is given the opportunity to opt out of such disclosure. Federal law makes it a criminal offense, except in limited circumstances, to obtain or attempt to obtain customer information of a financial nature by fraudulent or deceptive means.
Automated Overdraft Payment Regulation
The Federal Reserve Board and FDIC have adopted consumer protection regulations and guidance related to automated overdraft payment programs offered by financial institutions. Regulation E prohibits financial institutions from charging consumers fees for paying overdrafts on automated teller machine and one-time debit card transactions, unless a consumer consents, or opts in, to the overdraft service for those types of transactions. Financial institutions must also provide consumers with a notice that explains the financial institution’s overdraft services, including the fees associated with the service and the consumer’s choices. In addition,
19
FDIC-supervised institutions must monitor overdraft payment programs for “excessive or chronic” customer use and undertake “meaningful and effective” follow-up action with customers that overdraw their accounts more than six times during a rolling 12-month period. Financial institutions must also impose daily limits on overdraft charges, review and modify check-clearing procedures, prominently distinguish account balances from available overdraft coverage amounts and ensure board and management oversight regarding overdraft payment programs.
Community Reinvestment Act
The Community Reinvestment Act of 1977 (“CRA”) requires depository institutions to assist in meeting the credit needs of their market areas consistent with safe and sound banking practice. Under the CRA, each depository institution is required to help meet the credit needs of its market areas by, among other things, providing credit to low- and moderate-income individuals and communities. The CRA requires the Bank’s primary federal bank regulatory agency, the FDIC, to assess the bank’s record in meeting the credit needs of the communities served by the bank, including low- and moderate-income neighborhoods and persons. Institutions are assigned one of four ratings: “Outstanding,” “Satisfactory,” “Needs to Improve” or “Substantial Noncompliance.”
In order for a financial holding company to commence any new activity permitted by the BHCA, or to acquire any company engaged in any new activity permitted by the BHCA, each insured depository institution subsidiary of the financial holding company must have received a rating of at least “satisfactory” in its most recent examination under the CRA. Furthermore, banking regulators take into account CRA ratings when considering a request for an approval of a proposed transaction to consolidate with or acquire the assets or assume the liabilities of an insured depository institution, or to open or relocate a branch office.
Cybersecurity
In
March 2015
, federal regulators issued two related statements regarding cybersecurity. One statement indicates that financial institutions should design multiple layers of security controls to establish lines of defense and to ensure that their risk management processes also address the risk posed by compromised customer credentials, including security measures to reliably authenticate customers accessing internet-based services of the financial institution. The other statement indicates that a financial institution’s management is expected to maintain sufficient business continuity planning processes to ensure the rapid recovery, resumption and maintenance of the institution’s operations after a cyber-attack involving destructive malware. A financial institution is also expected to develop appropriate processes to enable recovery of data and business operations and address rebuilding network capabilities and restoring data if the institution or its critical service providers fall victim to this type of cyber-attack. If we fail to observe the regulatory guidance, we could be subject to various regulatory sanctions, including financial penalties.
In the ordinary course of business, we rely on electronic communications and information systems to conduct our operations and to store sensitive data. We employ a variety of preventative and detective tools to monitor, block, and provide alerts regarding suspicious activity, as well as to report on any suspected advanced persistent threats. Notwithstanding our defensive measures, the threat from cyber-attacks is severe, attacks are sophisticated and increasing in volume, and attackers respond rapidly to changes in defensive measures. While to date, we are not aware that we have experienced a significant compromise, significant data loss or any material financial losses related to cybersecurity attacks, our systems and those of our customers and third-party service providers are under constant threat and it is possible that we could experience a significant event in the future. Risks and exposures related to cybersecurity attacks are expected to remain high for the foreseeable future due to the rapidly evolving nature and sophistication of these threats, as well as due to the expanding use of Internet banking, mobile banking and other technology-based products and services by us and our customers. [For further discussion of risks related to cybersecurity, see Item 1A, Risk Factors, of this Annual Report on Form 10-K.]
Monetary Policy and Economic Conditions
The business of financial institutions is affected not only by general economic conditions, but also by the policies of various governmental regulatory agencies, including the Federal Reserve Board. The Federal Reserve Board regulates money and credit conditions and interest rates to influence general economic conditions primarily through open market operations in U.S. government securities, changes in the discount rate on bank borrowings and changes in the reserve requirements against depository institutions’ deposits. These policies and regulations significantly affect the overall growth and distribution of loans, investments and deposits, and the interest rates charged on loans, as well as the interest rates paid on deposit accounts.
20
The monetary policies of the Federal Reserve Board have had a significant effect on the operating results of financial institutions in the past and are expected to continue to have significant effects in the future. In view of the changing conditions in the economy and the money markets and the activities of monetary and fiscal authorities, the Company cannot predict future changes in interest rates, credit availability or deposit levels.
Effect of Environmental Regulation
The Company’s primary exposure to environmental risk is through its lending activities. In cases when management believes environmental risk potentially exists, the Company mitigates its environmental risk exposures by requiring environmental site assessments at the time of loan origination to confirm collateral quality as to commercial real estate parcels posing higher than normal potential for environmental impact, as determined by reference to present and past uses of the subject property and adjacent sites. Environmental assessments are typically required prior to any foreclosure activity involving non-residential real estate collateral.
With regard to residential real estate lending, management reviews those loans with inherent environmental risk on an individual basis and makes decisions based on the dollar amount of the loan and the materiality of the specific credit.
The Company anticipates no material effect on anticipated capital expenditures, earnings or competitive position as a result of compliance with federal, state or local environmental protection laws or regulations.
Other Regulatory Matters
The Company is subject to examinations and investigations by federal and state banking regulators, as well as the SEC, various taxing authorities and various state regulators. The Company periodically receives requests for information from regulatory authorities in various states, including state insurance commissions and state attorneys general, securities regulators and other regulatory authorities, concerning the Company’s business and accounting practices. Such requests are considered incidental to the normal conduct of business.
Future Legislation and Regulation
Congress may enact legislation from time to time that affects the regulation of the financial services industry, and state legislatures may enact legislation from time to time affecting the regulation of financial institutions chartered by or operating in those states. Federal and state regulatory agencies also periodically propose and adopt changes to their regulations or change the manner in which existing regulations are applied. The substance or impact of pending or future legislation or regulation, or the application thereof, cannot be predicted, although enactment of the proposed legislation could impact the regulatory structure under which we operate and may significantly increase costs, impede the efficiency of internal business processes, require an increase in regulatory capital, require modifications to our business strategy, and limit our ability to pursue business opportunities in an efficient manner. A change in statutes, regulations or regulatory policies applicable to the Company or any of its subsidiaries could have a material, adverse effect on our business, financial condition and results of operations.
Corporate and available information
We file reports with the SEC, including Annual Reports on Form 10-K, Quarterly Reports on Form 10-Q, Current Reports on Form 8-K and any other filings required by the SEC. We make available on our Investor Relations website, free of charge, our Annual Reports on Form 10-K, Quarterly Reports on Form 10-Q, Current Reports on Form 8-K, and all amendments to those reports, as soon as reasonably practicable after we electronically file such material with, or furnish it to, the SEC. The information on our website is not incorporated by reference into this Annual Report on Form 10-K or in any other report or document we file with the SEC.
The public may read and copy any materials we file with the SEC at the SEC's Public Reference Room at 100 F Street, NE, Washington, DC 20549. The public may obtain information on the operation of the Public Reference Room by calling the SEC at 1-800-SEC-0330. The SEC maintains an Internet site (http://www.sec.gov) that contains reports, proxy and information statements, and other information regarding issuers that file electronically with the SEC.
An investment in our common stock is subject to risks inherent to our business. The material risks and uncertainties that management believes affect us are described below. Before making an investment decision, you should carefully consider the
21
risks and uncertainties described below together with all of the other information included or incorporated by reference in this Annual Report on Form 10-K. The risks and uncertainties described below are not the only ones facing us. Additional risks and uncertainties that management is not aware of or focused on or that management currently deems immaterial may also impair our business operations. This Annual Report on Form 10-K is qualified in its entirety by these risk factors.
If any of the following risks actually occur, our business, financial condition and results of operations could be materially and adversely affected. If this were to happen, the market price of our common stock could decline significantly, and you could lose all or part of your investment.
References to “we,” “us,” and “our” in this “Risk Factors” section refer to the Company and its subsidiary, including the Bank, unless otherwise specified or unless the context otherwise requires.
Risks Related To Our Business
Our business depends upon the general economic conditions of the State of West Virginia and the Commonwealth of Virginia, and may be adversely affected by downturns in these and the other local economies in which we operate.
In recent years, economic growth and business activity across a wide range of industries and regions in the U.S. has been slow and uneven. Furthermore, there are continuing concerns related to the level of U.S. government debt and fiscal actions that may be taken to address that debt. There can be no assurance that economic conditions will continue to improve, and these conditions could worsen. In addition, oil price volatility, the level of U.S. debt and global economic conditions have had a destabilizing effect on financial markets.
Our financial performance generally, and in particular the ability of borrowers to pay interest on and repay principal of outstanding loans and the value of collateral securing those loans, as well as demand for loans and other products and services we offer, is highly dependent upon the business environment in the markets where we operate, including the State of West Virginia and the Commonwealth of Virginia and the United States as a whole. A favorable business environment is generally characterized by, among other factors, economic growth, efficient capital markets, low inflation, low unemployment, high business and investor confidence, and strong business earnings. Unfavorable or uncertain economic and market conditions can be caused by declines in economic growth, business activity or investor or business confidence; limitations on the availability or increases in the cost of credit and capital; increases in inflation or interest rates; high unemployment, natural disasters; or a combination of these or other factors.
Overall, during recent years, the business environment has been adverse for many households and businesses in the United States and worldwide. While economic conditions in the State of West Virginia and the Commonwealth of Virginia, the United States and worldwide have shown signs of improvement, there can be no assurance that this improvement will continue. Economic pressure on consumers and uncertainty regarding continuing economic improvement may result in changes in consumer and business spending, borrowing and savings habits. Such conditions, combined with continued oil price volatility, could have a material adverse effect on the credit quality of our loans and our business, financial condition and results of operations.
A significant portion of our loans are secured by real estate concentrated in the State of West Virginia and the Commonwealth of Virginia, which may adversely affect our earnings and capital if real estate values decline.
Nearly
77.8%
of our total loans are real estate interests (residential, nonresidential including both owner-occupied and investment real estate, and construction and land development) mainly concentrated in the State of West Virginia and the Commonwealth of Virginia, a relatively small geographic area. As a result, declining real estate values in these markets could negatively impact the value of the real estate collateral securing such loans. If we are required to liquidate a significant amount of collateral during a period of reduced real estate values in satisfaction of any non-performing or defaulted loans, our earnings and capital could be adversely affected.
Our nonresidential real estate loans expose us to greater risks of nonpayment and loss than residential mortgage loans, which may cause us to increase our allowance for loan losses which would reduce our net income.
At
December 31, 2016
,
$772.0 million
, or
73.3%
, of our loan portfolio consisted of nonresidential real estate loans. Nonresidential real estate loans generally expose a lender to greater risk of non-payment and loss than residential mortgage loans because repayment of the loans often depends on the successful operation of the property and the income stream of the borrowers. Such loans expose us to additional risks because they typically are made on the basis of the borrower’s ability to make repayments from the cash flow of the borrower’s business and are secured by collateral that may depreciate over time. These
22
loans typically involve larger loan balances to single borrowers or groups of related borrowers compared to residential mortgage loans. Because such loans generally entail greater risk than residential mortgage loans, we may need to increase our allowance for loan losses in the future to account for the likely increase in probable incurred credit losses associated with the growth of such loans, which would reduce our net income. Also, many of our nonresidential real estate borrowers have more than one loan outstanding with us. Consequently, an adverse development with respect to one loan or one credit relationship can expose us to a significantly greater risk of loss compared to an adverse development with respect to a residential mortgage loan.
Our allowance for loan losses could become inadequate and reduce earnings and capital.
The Bank maintains an allowance for loan losses that it believes is adequate for absorbing the estimated future losses inherent in its loan portfolio. Management conducts a periodic review and consideration of the loan portfolio to determine the amount of the allowance for loan losses based upon general market conditions, credit quality of the loan portfolio and performance of the Bank’s clients relative to their financial obligations with it. The amount of future losses, however, is susceptible to changes in economic and other market conditions, including changes in interest rates and collateral values, which are beyond the Bank’s control, and these future losses may exceed its current estimates. Management performs stress tests on the loan portfolios to estimate future loan losses, but there can be no absolute assurance that additional provisions for loan losses will not be required in the future, including as a result of changes in the economic assumptions underlying management’s estimates and judgments, adverse developments in the economy on a national basis or in the Bank’s market area, or changes in the circumstances of particular borrowers. Although management believes the allowance for loan losses is adequate to absorb probable losses in its loan portfolio, we cannot predict with absolute certainty the amount of such losses or guarantee that the allowance will be adequate in the future. Excessive loan losses could have a material adverse effect on the Company’s financial condition and results of operations.
The profitability of MVB Mortgage will be significantly reduced if we are not able to sell mortgages.
Currently, we generally sell all of the mortgage loans originated by MVB Mortgage. We only underwrite mortgages that we reasonably expect will have more than one potential purchaser. The profitability of our Mortgage Subsidiary depends in large part upon our ability to originate a high volume of loans and to sell them in the secondary market. Thus, we are dependent upon (i) the existence of an active secondary market and (ii) our ability to sell loans into that market.
MVB Mortgage’s ability to sell mortgage loans readily is dependent upon the availability of an active secondary market for single-family mortgage loans, which in turn depends in part upon the continuation of programs currently offered by Fannie Mae and Freddie Mac and other institutional and non-institutional investors. These entities account for a substantial portion of the secondary market in residential mortgage loans. Some of the largest participants in the secondary market, including Fannie Mae and Freddie Mac, are government-sponsored enterprises with substantial market influence whose activities are governed by federal law. Any future changes in laws that significantly affect the activity of these government-sponsored enterprises and other institutional and non-institutional investors or any impairment of our ability to participate in such programs could, in turn, adversely affect our operations.
Our largest source of revenue (net interest income) is subject to interest rate risk.
The Bank’s financial condition and results of operations are significantly affected by changes in interest rates. The Bank’s earnings depend primarily upon its net interest income, which is the difference between its interest income earned on its interest-earning assets, such as loans and investment securities, and its interest expense paid on its interest-bearing liabilities, consisting of deposits and borrowings. Moreover, the loans included in our interest-earning assets are primarily comprised of variable and adjustable rate loans. Net interest income is subject to interest rate risk in the following ways:
|
•
|
In general, for a given change in interest rates, the amount of change in value (positive or negative) is larger for assets and liabilities with longer remaining maturities. The shape of the yield curve may affect new loan yields, funding costs and investment income differently.
|
|
•
|
The remaining maturity of various assets or liabilities may shorten or lengthen as payment behavior changes in response to changes in interest rates. For example, if interest rates decline sharply, loans may pre-pay, or pay down, faster than anticipated, thus reducing future cash flows and interest income. Conversely, if interest rates increase, depositors may cash in their certificates of deposit prior to maturity (notwithstanding any applicable early withdrawal penalties) or otherwise reduce their deposits to pursue higher yielding investment alternatives.
|
|
•
|
Re-pricing frequencies and maturity profiles for assets and liabilities may occur at different times. For example, in a falling rate environment, if assets re-price faster than liabilities, there will be an initial decline in earnings. Moreover, if
|
23
assets and liabilities re-price at the same time, they may not be by the same increment. For instance, if the Federal Funds Rate increased
50
basis points, rates on demand deposits may rise by
10
basis points; whereas rates on prime-based loans will instantly rise
50
basis points.
Financial instruments do not respond in a parallel fashion to rising or falling interest rates. This causes asymmetry in the magnitude of changes to net interest income, net economic value and investment income resulting from the hypothetical increases and decreases in interest rates. Therefore, the Company’s management monitors interest rate risk and adjusts the Company’s funding strategies to mitigate adverse effects of interest rate shifts on the Company’s balance sheet. Interest rate risk is more fully described under the section captioned "Interest Rate Risk" in Item 1, Business, and under the section captioned "Asset/Liability Management and Market Risk" in Item 7A, Quantitative and Qualitative Disclosures About Market Risk, of this Annual Report on Form 10-K.
Our accounting policies and estimates are critical to how we report our financial condition and results cf operations, and any changes to such accounting policies and estimates could materially affect how we report our financial condition and results cf operations.
Accounting policies and estimates are fundamental to how we record and report our financial condition and results of operations. Our management makes judgments and assumptions in selecting and adopting various accounting policies and in applying estimates so that such policies and estimates comply with U.S. generally accepted accounting principles (“GAAP”).
Management has identified certain accounting policies as being critical because they require management’s judgment to ascertain the valuations of assets, liabilities, commitments and contingencies. A variety of factors could affect the ultimate value that is obtained either when earning income, recognizing an expense, recovering an asset, valuing an asset or liability or reducing a liability. We have established detailed policies and control procedures that are intended to ensure that these critical accounting estimates and judgments are well controlled and applied consistently. In addition, these policies and procedures are intended to ensure that the process for changing methodologies occurs in an appropriate manner. Because of the uncertainty surrounding our judgments and the estimates pertaining to these matters, actual outcomes may be materially different from amounts previously estimated. For example, because of the inherent uncertainty of estimates, management cannot provide any assurance that the Bank will not significantly increase its allowance for loan losses if actual losses are more than the amount reserved. Any increase in its allowance for loan losses or loan charge-offs could have a material adverse effect on our financial condition and results of operations. In addition, we cannot guarantee that we will not be required to adjust accounting policies or restate prior financial statements. See the section captioned “Allowance for Loan Losses” in Item 7, Management’s Discussion and Analysis of Financial Condition and Results of Operations, located elsewhere in this Annual Report on Form 10-K for further discussion related to our process for determining the appropriate level of the allowance for loan losses.
Further, from time to time, the Financial Accounting Standards Board and SEC change the financial accounting and reporting standards that govern the preparation of our financial statements. The ongoing economic recession has resulted in increased scrutiny of accounting standards by legislators and our regulators, particularly as they relate to fair value accounting principles. In addition, ongoing efforts to achieve convergence between GAAP and International Financial Reporting Standards may result in changes to GAAP. These changes can be hard to predict and can materially impact how we record and report our financial condition and results of operations. In some cases, we could be required to apply a new or revised standard retroactively, resulting in our restating prior period financial statements or otherwise adversely affecting our financial condition or results of operations.
Our profitability depends significantly on economic conditions in the State of West Virginia and the Commonwealth of Virginia.
Our success depends primarily on the general economic conditions of the State of West Virginia and the Commonwealth of Virginia and the specific local markets in which we operate. Unlike larger national or other regional banks that are more geographically diversified, we provide banking and financial services primarily to customers across West Virginia and Virginia. The local economic conditions in these areas have a significant impact on the demand for our products and services as well as the ability of our customers to repay loans, the value of the collateral securing loans and the stability of our deposit funding sources. Moreover, approximately
19.5%
of the securities in our municipal securities portfolio were issued by political subdivisions or agencies within the State of West Virginia and the Commonwealth of Virginia. A significant decline in general economic conditions in State of West Virginia and the Commonwealth of Virginia, whether caused by recession, inflation, unemployment, changes in oil prices, changes in securities markets, acts of terrorism, outbreak of hostilities or other international or domestic occurrences or other factors could impact these local economic conditions and, in turn, have a material adverse effect on our business, financial condition and results of operations.
24
We may be adversely affected by the soundness of other financial institutions.
Financial services institutions are interrelated as a result of trading, clearing, counterparty, or other relationships. We have exposure to many different industries and counterparties, and routinely execute transactions with counterparties in the financial services industry, including commercial banks, brokers and dealers, investment banks, and other institutional clients. Many of these transactions expose us to credit risk in the event of a default by a counterparty or client. In addition, our credit risk may be exacerbated when the collateral held by us cannot be realized upon or is liquidated at prices not sufficient to recover the full amount of the credit or derivative exposure due to us. Any such losses could have a material adverse effect on our business, financial condition and results of operations.
We may be adversely affected by changes in U.S. tax and other laws and regulations.
The U.S. Congress and the Administration have indicated an interest in reforming the U.S. corporate income tax code. Possible approaches include lowering the 35 percent corporate tax rate, limiting or eliminating various other deductions, tax credits and/or other tax preferences. It is not possible at this time to quantify either the one-time impacts from the re-measurement of deferred tax assets and liabilities that might result upon tax reform enactment or the ongoing impacts reform proposals might have on income tax expense.
We operate in a highly competitive industry and market area.
We face substantial competition in all areas of our operations from a variety of different competitors, many of which are larger and may have more financial resources. Such competitors primarily include national, regional, and community banks within the various markets where we operate. We also face competition from many other types of financial institutions, including, without limitation, savings and loans, credit unions, finance companies, brokerage firms, insurance companies and other financial intermediaries. The financial services industry could become even more competitive as a result of legislative, regulatory and technological changes and continued consolidation. Also, technology and other changes have lowered barriers to entry and made it possible for non-banks to offer products and services traditionally provided by banks. For example, consumers can maintain funds that would have historically been held as bank deposits in brokerage accounts or mutual funds. Consumers can also complete transactions such as paying bills and/or transferring funds directly without the assistance of banks. The process of eliminating banks as intermediaries, known as “disintermediation,” could result in the loss of fee income, as well as the loss of customer deposits and the related income generated from those deposits. Further, many of our competitors have fewer regulatory constraints and may have lower cost structures. Additionally, due to their size, many competitors may be able to achieve economies of scale and, as a result, may offer a broader range of products and services as well as better pricing for those products and services than we can.
Our ability to compete successfully depends on a number of factors, including, among other things:
|
•
|
The ability to develop, maintain and build long-term customer relationships based on top quality service, high ethical standards and safe, sound assets.
|
|
•
|
The ability to expand our market position.
|
|
•
|
The scope, relevance and pricing of products and services offered to meet customer needs and demands.
|
|
•
|
The rate at which we introduce new products and services relative to our competitors.
|
|
•
|
Customer satisfaction with our level of service.
|
|
•
|
Industry and general economic trends.
|
Failure to perform in any of these areas could significantly weaken our competitive position, which could adversely affect our growth and profitability, which, in turn, could have a material adverse effect on our business, financial condition and results of operations.
We are subject to extensive government regulation and supervision and possible enforcement and other legal actions.
We, primarily through the Bank and certain non-bank subsidiaries, are subject to extensive federal and state regulation and
25
supervision, which vests a significant amount of discretion in the various regulatory authorities. Banking regulations are primarily intended to protect depositors’ funds, federal deposit insurance funds and the banking system as a whole, not security holders. These regulations and supervisory guidance affect our lending practices, capital structure, investment practices, dividend policy and growth, among other things. Congress and federal regulatory agencies continually review banking laws, regulations and policies for possible changes. The Dodd-Frank Act, enacted in
July 2010
, instituted major changes to the banking and financial institutions regulatory regimes. Other changes to statutes, regulations or regulatory policies or supervisory guidance, including changes in interpretation or implementation of statutes, regulations, policies or supervisory guidance, could affect us in substantial and unpredictable ways. Such changes could subject us to additional costs, limit the types of financial services and products we may offer and/or increase the ability of non-banks to offer competing financial services and products, among other things. Failure to comply with laws, regulations, policies or supervisory guidance could result in enforcement and other legal actions by Federal or state authorities, including criminal and civil penalties, the loss of FDIC insurance, the revocation of a banking charter, other sanctions by regulatory agencies, civil money penalties and/or reputational damage. In this regard, government authorities, including the bank regulatory agencies, are pursuing aggressive enforcement actions with respect to compliance and other legal matters involving financial activities, which heightens the risks associated with actual and perceived compliance failures. Any of the foregoing could have a material adverse effect on our business, financial condition and results of operations.
For further detail, see the sections captioned “Supervision and Regulation” included in Item 1, Business, and Note 14, “Regulatory Capital Requirements” of the Notes to Consolidated Financial Statements included in Item 8, Financial Statements and Supplementary Data, of this Annual Report on Form 10-K.
Failure to meet any of the various capital adequacy guidelines which we are subject to could adversely affect our operations and could compromise the status of the Company as a financial holding company.
The Company and the Bank are required to meet certain regulatory capital adequacy guidelines and other regulatory requirements imposed by the Federal Reserve Board, the FDIC and the U.S. Department of Treasury. If the Company or the Bank fails to meet these minimum capital guidelines and other regulatory requirements, our financial condition and results of operations would be materially and adversely affected and could compromise the status of the Company as a banking holding company. See the sections captioned “Supervision and Regulation—Capital Requirements” in Item 1, Business, and Note 14, “Regulatory Capital Requirements” of the Notes to the Consolidated Financial Statements included in Item 8, Financial Statements and Supplementary Data, of this Annual Report on Form 10-K, for detailed capital guidelines for bank holding companies and banks.
Our accounting estimates and risk management processes rely on analytical and forecasting models which may prove to be inadequate or inaccurate.
The processes we use to estimate our inherent loan losses and to measure the fair value of financial instruments, as well as the processes used to estimate the effects of changing interest rates and other market measures on our financial condition and results of operations, depends upon the use of analytical and forecasting models. These models reflect assumptions that may not be accurate, particularly in times of market stress or other unforeseen circumstances. Even if these assumptions are adequate, the models may prove to be inadequate or inaccurate because of other flaws in their design or their implementation. If the models we use for interest rate risk and asset-liability management are inadequate, we may incur increased or unexpected losses upon changes in market interest rates or other market measures. If the models we use for determining our probable loan losses are inadequate, the allowance for loan losses may not be sufficient to support future charge-offs. If the models we use to measure the fair value of financial instruments are inadequate, the fair value of such financial instruments may fluctuate unexpectedly or may not accurately reflect what we could realize upon sale or settlement of such financial instruments. Any such failure in our analytical or forecasting models could have a material adverse effect on our business, financial condition and results of operations.
The repeal of federal prohibitions on payment of interest on demand deposits could increase our interest expense.
All federal prohibitions on the ability of financial institutions to pay interest on demand deposit accounts were repealed as part of the Dodd-Frank Act beginning on
July 21, 2011
. As a result, some financial institutions have commenced offering interest on demand deposits to compete for customers. We do not yet know what interest rates other institutions may offer as market interest rates begin to increase. Our interest expense will increase and our net interest margin will decrease if we begin offering interest on demand deposits to attract additional customers or maintain current customers, which could have a material adverse effect on our business, financial condition and results of operations
26
The value of the securities in our investment securities portfolio may be negatively affected by disruptions in securities markets.
Due to credit and liquidity risks and economic volatility, making the determination of the value of a securities portfolio is less certain. There can be no assurance that decline in market value associated with these disruptions will not result in other-than-temporary or permanent impairments of these assets, which would lead to accounting charges which could have a material negative effect on our financial condition and results of operations.
The value of our goodwill and other intangible assets may decline in the future.
As of
December 31, 2016
, we had
$18.5 million
of goodwill and other intangible assets. A significant decline in our expected future cash flows, a significant adverse change in the business climate, slower growth rates or a significant and sustained decline in the price of our common stock may necessitate taking charges in the future related to the impairment of our goodwill and other intangible assets. If we were to conclude that a future write-down of goodwill and other intangible assets is necessary, we would record the appropriate charge, which could have a material adverse effect on our business, financial condition and results of operations.
New lines of business or new products and services may subject us to additional risks.
From time to time, we may implement new lines of business or offer new products and services within existing lines of business. There are substantial risks and uncertainties associated with these efforts, particularly in instances where the markets are not fully developed. In developing and marketing new lines of business and/or new products and services we may invest significant time and resources. Initial timetables for the introduction and development of new lines of business and/or new products or services may not be achieved and price and profitability targets may not prove feasible. External factors, such as compliance with regulations, competitive alternatives, and shifting market preferences, may also impact the successful implementation of a new line of business or a new product or service. Furthermore, any new line of business and/or new product or service could have a significant impact on the effectiveness of our system of internal controls. Failure to successfully manage these risks in the development and implementation of new lines of business or new products or services could have a material adverse effect on our business, financial condition and results of operations.
The Company is a financial holding company, and its sources of funds are limited.
The Company is a financial holding company and its operations are primarily conducted by the Bank, which is subject to significant federal and state regulation. Cash available to pay dividends to shareholders of the Company is derived primarily from dividends paid by the Bank. As a result, the Company’s ability to receive dividends or loans from its subsidiary is restricted. Under federal law, the payment of dividends by the Bank is subject to capital adequacy requirements. The Federal Reserve Board and/or the FDIC prohibit a dividend payment by the Company or the Bank that would constitute an unsafe or unsound practice. See the sections captioned “Supervision and Regulation – Limit on Dividends” in Item 1, Business, and Note 14, “Regulatory Capital Requirements” of the Notes to Consolidated Financial Statements included in Item 8, Financial Statements and Supplementary Data, of this Annual Report on Form 10-K.
The inability of the Bank to generate profits and pay such dividends to the Company, or regulator restrictions on the payment of such dividends to the Company even if earned, would have an adverse effect on the financial condition and results of operations of the Company and the Company’s ability to pay dividends to its shareholders.
In addition, since the Company is a legal entity separate and distinct from the Bank, its right to participate in the distribution of assets of the Bank upon the Bank’s liquidation, reorganization or otherwise will be subject to the prior claims of the Bank’s creditors, which will generally take priority over the Bank’s shareholders.
Potential acquisitions may disrupt our business and dilute stockholder value.
We generally seek merger or acquisition partners that are culturally similar and have experienced management and possess either significant market presence or have potential for improved profitability through financial management, economies of scale or expanded services. Acquiring other banks, businesses, or branches involves various risks commonly associated with acquisitions, including, among other things:
|
•
|
Potential exposure to unknown or contingent liabilities of the target company.
|
|
•
|
Exposure to potential asset quality issues of the target company.
|
27
|
•
|
Potential disruption to our business.
|
|
•
|
Potential diversion of our management’s time and attention.
|
|
•
|
The possible loss of key employees and customers of the target company.
|
|
•
|
Difficulty in estimating the value of the target company.
|
|
•
|
Potential changes in banking or tax laws or regulations that may affect the target company.
|
Acquisitions typically involve the payment of a premium over book and market values, and, therefore, some dilution of our tangible book value and net income per common share may occur in connection with any future transaction. Furthermore, failure to realize the expected revenue increases, cost savings, increases in geographic or product presence, and/or other projected benefits from an acquisition could have a material adverse effect on our business, financial condition and results of operations.
The Company is subject to liquidity risk, which could disrupt our ability to meet our financial obligations.
Liquidity refers to the ability of the Company to ensure sufficient levels of cash to fund operations, such as meeting deposit withdrawals, funding loan commitments, paying expenses and meeting quarterly payment obligations under certain subordinated debentures issued by the Company in connection with the issuance of floating rate redeemable trust preferred securities. The source of the funds for the Company’s debt obligations is dependent on the Bank. If needed, the Bank has the ability to borrow term and overnight funds from the FHLB or other financial intermediaries.
While management is satisfied that the Company’s liquidity is sufficient at
December 31, 2016
to meet known and potential obligations, any significant restriction or disruption of the Company’s ability to obtain funding from these or other sources could have a negative effect on the Company’s ability to satisfy its current and future financial obligations, which could materially affect the Company’s financial condition.
Limited availability of borrowings and liquidity from the Federal Home Loan Bank system and other sources could negatively impact earnings.
The Bank is currently a member bank of the FHLB of Pittsburgh. Membership in this system of quasi-governmental, regional home-loan oriented agency banks allows us to participate in various programs offered by the FHLB. We borrow funds from the FHLB, which are secured by a blanket lien on certain residential and commercial mortgage loans, and if applicable, investment securities with collateral values in excess of the outstanding balances. Current and future earnings shortfalls and minimum capital requirements of the FHLB may impact the collateral necessary to secure borrowings and limit the borrowings extended to their member banks, as well as require additional capital contributions by member banks. Should this occur, our short-term liquidity needs could be negatively impacted. If we were restricted from using FHLB advances due to weakness in the system or with the FHLB of Pittsburgh, we may be forced to find alternative funding sources. If we are required to rely more heavily on higher cost funding sources, revenues may not increase proportionately to cover these costs, which would adversely affect results of operations and financial position.
We may not be able to attract and retain skilled people.
Our success depends, in large part, on our ability to attract and retain key people. Competition for the best people in most activities engaged in by us can be intense and we may not be able to hire people or to retain them. Many of our branches are located in rural areas and small towns where the competition for labor can be fierce, and where the pool of qualified employees may be small. The unexpected loss of services of key personnel could have a material adverse impact on our business, financial condition and results of operations because of their skills, knowledge of our market, years of industry experience and the difficulty of promptly finding qualified replacement personnel.
Interruption to our information systems or breaches in security could adversely affect the Company’s operations.
The Company relies on information systems and communications for operating and monitoring all major aspects of business, as well as internal management functions. Any failure, interruption, intrusion or breach in security of these systems could result in failures or disruptions in the customer relationship, management, general ledger, deposit, loan and other systems. While the Company has policies, procedures and technical safeguards designed to prevent or limit the effect of any failure, interruption,
28
intrusion or security breach of its information systems, there can be no assurance that the above-noted issues will not occur or, if they do occur, that they will be adequately addressed.
There have been several cyber-attacks on websites of large financial services companies. Even if not directed at the Company specifically, attacks on other entities with whom we do business or on whom we otherwise rely or attacks on financial or other institutions important to the overall functioning of the financial system could adversely affect, directly or indirectly, aspects of our business.
Cyber-attacks on third party retailers or other business establishments that widely accept debit card or check payments could compromise sensitive Bank customer information, such as debit card and account numbers. Such an attack could result in significant costs to the Bank, such as costs to reimburse customers, reissue debit cards and open new customer accounts.
In addition, there have been efforts on the part of third parties to breach data security at financial institutions, including through the use of social engineering schemes such as “phishing.” The ability of our customers to bank remotely, including online and through mobile devices, requires secure transmission of confidential information and increases the risk of data security breaches. Because the techniques used to attack financial services company communications and information systems change frequently (and generally increase in sophistication), often attacks are not recognized until launched against a target, may be supported by foreign governments or other well-financed entities, and may originate from less regulated and remote areas around the world, we may be unable to address these techniques in advance of attacks, including by implementing adequate preventative measures.
The occurrence of any such failure, disruption or security breach of our information systems, particularly if widespread or resulting in financial losses to our customers, could damage our reputation, result in a loss of customer business, subject us to additional regulatory scrutiny, and expose us to civil litigation and possible financial liability. These risks could have a material effect on our business, results of operations and financial condition.
We continually encounter technological change.
The financial services industry is continually undergoing rapid technological change with frequent introductions of new technology-driven products and services. The effective use of technology increases efficiency and enables financial institutions to better serve customers and to reduce costs. Our future success depends, in part, upon our ability to address the needs of our customers by using technology to provide products and services that will satisfy customer demands, as well as to create additional efficiencies in our operations. Many of our competitors have substantially greater resources to invest in technological improvements. We may not be able to effectively implement new technology-driven products and services or be successful in marketing these products and services to our customers. Failure to successfully keep pace with technological change affecting the financial services industry could have a material adverse effect on our business, financial condition and results of operations.
Our operations rely on certain external vendors who may not perform in a satisfactory manner.
We are reliant upon certain external vendors to provide products and services necessary to maintain our day-to-day operations. Accordingly, our operations are exposed to risk that these vendors will not perform in accordance with applicable contractual arrangements or service level agreements. We maintain a system of policies and procedures designed to monitor vendor risks including, among other things, (i) changes in the vendor’s organizational structure, (ii) changes in the vendor’s financial condition and (iii) changes in the vendor’s support for existing products and services. While we believe these policies and procedures help to mitigate risk, and our vendors are not the sole source of service, the failure of an external vendor to perform in accordance with applicable contractual arrangements or the service level agreements could be disruptive to our operations, which could have a material adverse impact on the our business and its financial condition and results of operations.
We are subject to environmental liability risk associated with lending activities.
A significant portion of our loan portfolio is secured by real property. During the ordinary course of business, we may foreclose on and take title to properties securing certain loans. In doing so, there is a risk that hazardous or toxic substances could be found on these properties. If hazardous or toxic substances are found, we may be liable for remediation costs, as well as for personal injury and property damage. Environmental laws may require us to incur substantial expenses and may materially reduce the affected property’s value or limit our ability to use or sell the affected property. In addition, future laws or more stringent interpretations or enforcement policies with respect to existing laws may increase our exposure to environmental liability. Environmental reviews of real property before initiating foreclosure actions may not be sufficient to detect all potential environmental hazards. The remediation costs and any other financial liabilities associated with an environmental hazard could have a material adverse effect on our business, financial condition and results of operations.
29
Severe weather, natural disasters, acts of war or terrorism and other external events could significantly impact our business.
Severe weather, natural disasters, acts of war or terrorism and other adverse external events could have a significant impact on our ability to conduct business. In addition, such events could affect the stability of our deposit base, impair the ability of borrowers to repay outstanding loans, impair the value of collateral securing loans, cause significant property damage, result in loss of revenue and/or cause us to incur additional expenses. The occurrence of any such event in the future could have a material adverse effect on our business, which, in turn, could have a material adverse effect on our business, financial condition and results of operations.
Financial services companies depend on the accuracy and completeness of information about customers and counterparties.
In deciding whether to extend credit or enter into other transactions, we may rely on information furnished by or on behalf of customers and counterparties, including financial statements, credit reports and other financial information. We may also rely on representations of those customers, counterparties or other third parties, such as independent auditors, as to the accuracy and completeness of that information. Reliance on inaccurate or misleading financial statements, credit reports or other financial information could have a material adverse impact on our business, financial condition and results of operations.
Risks Associated With Our Common Stock
The trading volume in our common stock is less than that of other larger financial services companies.
Although our common stock is traded on the Over-the-Counter Bulletin Board, the trading volume in our common stock is less than that of other larger financial services companies. Moreover, the over-the-counter market is not a stock exchange, and trading of securities on the over-the-counter market is often more sporadic than the trading of securities listed on a quotation system like NASDAQ or a stock exchange like the New York Stock Exchange. A public trading market having the desired characteristics of depth, liquidity and orderliness depends on the presence in the marketplace of willing buyers and sellers of our common stock at any given time. This presence depends on the individual decisions of investors and general economic and market conditions over which we have no control. Given the lower trading volume of our common stock, significant sales of our common stock, or the expectation of these sales, could cause our stock price to fall more than would otherwise be expected. Conversely, significant purchases of our common stock, or the absence of willing sellers, could cause our stock price to be greater than would otherwise be expected in a liquid trading market. Such pricing may make it more difficult for us to sell equity or equity-related securities in the future at a time and price that we deem appropriate.
Our stock price can be volatile.
Stock price volatility may make it more difficult for you to resell your common stock when you want and at prices you find attractive. Our stock price can fluctuate significantly in response to a variety of factors including, among other things:
|
•
|
Actual or anticipated variations in quarterly results of operations.
|
|
•
|
Recommendations by securities analysts.
|
|
•
|
Operating and stock price performance of other companies that investors deem comparable to us.
|
|
•
|
News reports relating to trends, concerns and other issues in the financial services industry.
|
|
•
|
Perceptions in the marketplace regarding us and/or our competitors.
|
|
•
|
New technology used, or services offered, by competitors.
|
|
•
|
Significant acquisitions or business combinations, strategic partnerships, joint ventures or capital commitments by or involving us or our competitors.
|
|
•
|
Failure to integrate acquisitions or realize anticipated benefits from acquisitions.
|
|
•
|
Changes in government regulations.
|
|
•
|
Geopolitical conditions such as acts or threats of terrorism or military conflicts.
|
30
General market fluctuations, including real or anticipated changes in the strength of the economies we serve; industry factors and general economic and political conditions and events, such as economic slowdowns or recessions; interest rate changes, oil price volatility or credit loss trends could also cause our stock price to decrease regardless of operating results.
Our ability to pay dividends is limited and we may be unable to pay future dividends. As a result, capital appreciation, if any, of our common stock may be your sole opportunity for gains on your investment for the foreseeable future.
We make no assurances that we will pay any dividends in the future. Any future determination relating to dividend policy will be made at the discretion of our Board of Directors and will depend on a number of factors, including our future earnings, capital requirements, financial condition, future prospects, regulatory restrictions and other factors that our Board of Directors may deem relevant. The holders of our common stock are entitled to receive dividends when, and if declared by our Board of Directors out of funds legally available for that purpose. As part of our consideration of whether to pay cash dividends, we intend to retain adequate funds from future earnings to support the development and growth of our business. In addition, our ability to pay dividends is restricted by federal policies and regulations and by the terms of our existing indebtedness. It is the policy of the Federal Reserve Board that bank holding companies should pay cash dividends on common stock only out of net income available over the past year and only if prospective earnings retention is consistent with the organization’s expected future needs and financial condition. For further information, see the section captioned "Supervision and Regulation – Limit on Dividends" in Item 1, Business, of this Annual Report on Form 10-K.
We are exposed to risks relating to evaluations of controls required by Section 404 of the Sarbanes-Oxley Act of 2002.
We are required to comply with Section 404 of the Sarbanes-Oxley Act of 2002. While we have concluded that at
December 31, 2016
that we have no material weaknesses in our internal controls over financial reporting we cannot assure you that we will not have a material weakness in the future. A “material weakness” is a control deficiency, or combination of significant deficiencies that results in more than a remote likelihood that a material misstatement of the annual or interim financial statements will not be prevented or detected. If we fail to maintain a system of internal controls over financial reporting that meets the requirements of Section 404, we might be subject to sanctions or investigation by regulatory authorities. Additionally, failure to comply with Section 404 or the report by us of a material weakness may cause investors to lose confidence in our financial statements and our stock price may be adversely affected. If we fail to remedy any material weakness, our financial statements may be inaccurate, we may not have access to the capital markets, and our stock price may be adversely affected.
We may issue additional shares of our common stock that could result in dilution of an investor’s investment.
Our Board of Directors may determine from time to time that there is a need to obtain additional capital through the issuance of additional shares of common stock. These issuances would likely dilute the ownership interests of our investors and may dilute the per share book value of our common stock. In addition, the issuance of additional shares of common stock under our stock option and equity incentive plans will further dilute each investor’s ownership of our common stock.
An investment in our common stock is not an insured deposit.
Our common stock is not a bank deposit and, therefore, is not insured against loss by the FDIC, any other deposit insurance fund or by any other public or private entity. Investment in our common stock is inherently risky for the reasons described in this “Risk Factors” section and elsewhere in this Annual Report on Form 10-K and is subject to the same market forces that affect the price of common stock in any company. As a result, if you acquire our common stock, you could lose some or all of your investment.
Certain banking laws may have an anti-takeover effect.
Provisions of federal banking laws, including regulatory approval requirements, could make it more difficult for a third party to acquire us, even if doing so would be perceived to be beneficial to our shareholders. These provisions effectively inhibit a non-negotiated merger or other business combination, which, in turn, could adversely affect the market price of our common stock.
None.
31
The Company, through its Bank subsidiary, owns its main office located at 301 Virginia Avenue in Fairmont, West Virginia. The Company’s subsidiary owns or leases various other offices in the counties and cities in which they operate. As of
December 31, 2016
, the Company operated
thirteen
full-service banking branches,
eleven
mortgage only offices, with locations as further described in Item 1, Business, of this Annual Report on Form 10-K.
Nine
of the
thirteen
full-service banking branches are owned and the remaining
four
are leased. All mortgage locations are leased.
No one facility is material to the Company. Management believes that the facilities are generally in good condition and suitable for the operations for which they are used. However, management continually looks for opportunities to upgrade its facilities and locations and may do so in the future.
Additional information concerning the property and equipment owned or leased by the Company and its subsidiary is incorporated herein by reference from Note 4, "Premises and Equipment” and Note 16, "Leases” of the Notes to the Consolidated Financial Statements included in Item 8, Financial Statements and Supplementary Data, of this Annual Report on Form 10-K.
From time to time in the ordinary course of business, the Company and its subsidiary are subject to claims, asserted or unasserted, or named as a party to lawsuits or investigations. Litigation, in general, and intellectual property and securities litigation in particular, can be expensive and disruptive to normal business operations. Moreover, the results of legal proceedings cannot be predicted with any certainty and in the case of more complex legal proceedings, the results are difficult to predict at all. The Company is not aware of any asserted or unasserted legal proceedings or claims that the Company believes would have a material adverse effect on the Company’s financial condition or results of the Company’s operations.
Not applicable.
32
The Company's common stock is not traded on any national exchange. Our common stock is quoted on The OTC Bulletin Board under the symbol “MVBF.”
The table presented below provides the quarterly high and low sales prices, closing sales price and dividends declared for the last two years. The information set forth in the table is based on knowledge of certain arms-length transactions in the stock. In addition, dividends are subject to the restrictions described in Note 15, "Regulatory Restriction on Dividend" of the Notes to the Consolidated Financial Statements included in Item 8, Financial Statements and Supplementary Data, of this Annual Report on Form 10-K.
|
Quarterly Market and Dividend Information:
|
||||||||||||||||
|
High
|
Low
|
Last
|
Dividend
|
|||||||||||||
|
2016
|
||||||||||||||||
|
Fourth Quarter
|
$
|
13.05
|
|
$
|
11.50
|
|
$
|
12.80
|
|
$
|
0.02
|
|
||||
|
Third Quarter
|
13.50
|
|
11.95
|
|
12.31
|
|
0.02
|
|
||||||||
|
Second Quarter
|
14.00
|
|
12.06
|
|
12.95
|
|
0.02
|
|
||||||||
|
First Quarter
|
13.99
|
|
9.50
|
|
13.40
|
|
0.02
|
|
||||||||
|
2015
|
||||||||||||||||
|
Fourth Quarter
|
$
|
15.25
|
|
$
|
13.05
|
|
$
|
13.10
|
|
$
|
0.02
|
|
||||
|
Third Quarter
|
15.64
|
|
14.35
|
|
15.10
|
|
0.02
|
|
||||||||
|
Second Quarter
|
14.99
|
|
12.75
|
|
14.85
|
|
0.04
|
|
||||||||
|
First Quarter
|
15.80
|
|
12.77
|
|
13.00
|
|
—
|
|
||||||||
MVB Financial Corp. had
1,146
stockholders of record at
December 31, 2016
. The Company began paying an annual dividend of $.05 per share beginning in
December 2008
through
December 2011
. Beginning in
2012
, the Company began paying a semi-annual dividend of $.035 per share in
June
and
December
. During the
third quarter of 2015
, the Company began paying a quarterly dividend. In
2013
and
2014
, the Company paid a semi-annual dividend of $.04 per share in
June
and $.04 per share in
December
. In
2015
, the Company paid a semi-annual dividend of $.04 per share in
June
and a quarterly dividend of $.02 per share in
September
and
December
. In
2016
, the Company paid a quarterly dividend of $.02 per share in
March
,
June
,
September
, and
December
. No dividends were paid prior to
2008
.
Equity Compensation Plan Information as of
December 31, 2016
:
|
Plan Category
|
Number of securities to be issued upon exercise of outstanding options (a)
|
Weighted-average exercise price of outstanding options (b)
|
Number of securities remaining available for future issuance under equity compensation plans (excluding securities reflected in column (a)) (c)
|
|||||||
|
Equity compensation plans approved by security holders
|
768,598
|
|
$
|
12.75
|
|
400,825
|
|
|||
|
Equity compensation plans not approved by security holders
|
n/a
|
|
n/a
|
|
n/a
|
|
||||
|
Total
|
768,598
|
|
$
|
12.75
|
|
400,825
|
|
|||
During
2016
,
55,000
stock options under the Company’s equity compensation plan were exercised.
33
The following five-year performance graph compares the cumulative total shareholder return (assuming reinvestment of dividends) on the Company’s common stock to the KBW Bank Index and the Russell 2000 Index. The stock performance graph assumes
$100
was invested on
December 31, 2010
, and the cumulative return is measured as of each subsequent fiscal year end.
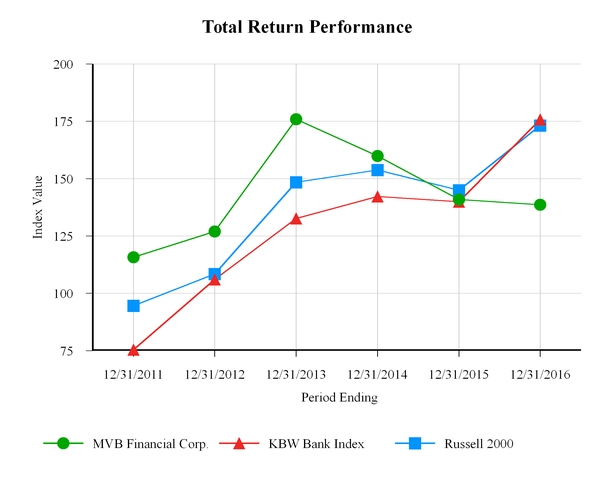
|
Index
|
12/31/2011
|
12/31/2012
|
12/31/2013
|
12/31/2014
|
12/31/2015
|
12/31/2016
|
||||||||||||||||||
|
MVB Financial Corp.
|
$
|
115.76
|
|
$
|
126.97
|
|
$
|
175.95
|
|
$
|
159.92
|
|
$
|
140.96
|
|
$
|
138.65
|
|
||||||
|
KBW Bank Index
|
75.43
|
|
106.07
|
|
132.66
|
|
142.23
|
|
139.97
|
|
175.81
|
|
||||||||||||
|
Russell 2000
|
94.55
|
|
108.38
|
|
148.49
|
|
153.73
|
|
144.95
|
|
173.18
|
|
||||||||||||
Recent Sales of Unregistered Securities
On December 5, 2016, the Company entered into Securities Purchase Agreements with certain accredited investors. Pursuant to the Purchase Agreements, the Investors agreed to purchase an aggregate of 1,913,044 shares of the Company’s common stock, par value $1.00 per share, at a price of $11.50 per share, as part of a private placement (the “Private Placement”). The Private Placement closed on December 6, 2016. The gross proceeds to the Company from the Private Placement were approximately $22 million. The proceeds from the Private Placement were used by the Company to pay related transaction fees and expenses and for general corporate purposes. A portion of the proceeds were used for the redemption of the preferred stock issued to the United States Department of Treasury in connection with the Company’s participation in the Small Business Lending Fund, which was completed in early January 2017.
The issuance of shares of Common Stock pursuant to the Private Placement is a private placement to “accredited investors” (as that term is defined under Rule 501 of Regulation D), and is exempt from registration under the Securities Act of 1933 (“Securities Act”), in reliance upon Section 4(a)(2) of the Securities Act and Regulation D Rule 506, as a transaction by an issuer not involving a public offering.
34
Purchases of Equity Securities by Issuer and Affiliated Purchasers
None.
35
|
The following consolidated summary sets forth the Company’s selected financial data that has been derived from the Company’s audited consolidated financial statements for each of the periods and at the dates indicated
|
||||||||||||||||||||
|
Years Ended December 31,
|
||||||||||||||||||||
|
(Dollars in thousands except per share data)
|
2016
|
2015
|
2014
|
2013
|
2012
|
|||||||||||||||
|
Balance Sheet Data:
|
||||||||||||||||||||
|
Assets
|
$
|
1,418,804
|
|
$
|
1,384,476
|
|
$
|
1,110,459
|
|
$
|
987,060
|
|
$
|
726,769
|
|
|||||
|
Investment securities
|
162,368
|
|
123,115
|
|
122,751
|
|
163,081
|
|
114,748
|
|
||||||||||
|
Loans, net
|
1,043,764
|
|
1,024,164
|
|
792,074
|
|
617,370
|
|
442,367
|
|
||||||||||
|
Loans held for sale
|
90,174
|
|
102,623
|
|
69,527
|
|
89,186
|
|
85,529
|
|
||||||||||
|
Deposits
|
1,107,017
|
|
1,012,314
|
|
823,227
|
|
695,811
|
|
486,519
|
|
||||||||||
|
Stockholders' equity
|
145,625
|
|
114,712
|
|
109,438
|
|
94,022
|
|
67,549
|
|
||||||||||
|
Weighted average shares outstanding - basic
|
8,212,021
|
|
8,014,316
|
|
7,905,468
|
|
6,657,093
|
|
4,388,650
|
|
||||||||||
|
Weighted average shares outstanding - diluted
|
10,068,733
|
|
8,140,116
|
|
8,102,117
|
|
6,939,028
|
|
4,509,234
|
|
||||||||||
|
Income Statement Data:
|
||||||||||||||||||||
|
Interest income
|
$
|
54,123
|
|
$
|
44,100
|
|
$
|
36,168
|
|
$
|
27,515
|
|
$
|
22,254
|
|
|||||
|
Interest expense
|
11,132
|
|
9,225
|
|
7,511
|
|
5,187
|
|
4,930
|
|
||||||||||
|
Net interest income
|
42,991
|
|
34,875
|
|
28,657
|
|
22,328
|
|
17,324
|
|
||||||||||
|
Provision for loan loss
|
3,632
|
|
2,493
|
|
2,582
|
|
2,260
|
|
2,800
|
|
||||||||||
|
Net interest income after provision for loan loss
|
39,359
|
|
32,382
|
|
26,075
|
|
20,068
|
|
14,524
|
|
||||||||||
|
Noninterest income
|
43,205
|
|
34,955
|
|
22,022
|
|
25,844
|
|
7,749
|
|
||||||||||
|
Gain on sale of securities
|
1,082
|
|
130
|
|
413
|
|
145
|
|
638
|
|
||||||||||
|
Noninterest expense
|
69,209
|
|
57,848
|
|
45,194
|
|
40,388
|
|
16,439
|
|
||||||||||
|
Income from continuing operations, before income taxes
|
13,355
|
|
9,489
|
|
2,903
|
|
5,524
|
|
5,834
|
|
||||||||||
|
Income tax expense - continuing operations
|
4,378
|
|
2,886
|
|
248
|
|
1,245
|
|
1,666
|
|
||||||||||
|
Net Income from continuing operations
|
8,977
|
|
6,603
|
|
2,655
|
|
4,279
|
|
4,168
|
|
||||||||||
|
Income from discontinued operations, before income taxes
|
6,346
|
|
353
|
|
(920
|
)
|
(522
|
)
|
—
|
|
||||||||||
|
Income tax expense (benefit) - discontinued operations
|
2,411
|
|
140
|
|
(344
|
)
|
(262
|
)
|
—
|
|
||||||||||
|
Net Income from discontinued operations
|
3,935
|
|
213
|
|
(576
|
)
|
(260
|
)
|
—
|
|
||||||||||
|
Net Income
|
12,912
|
|
6,816
|
|
2,079
|
|
4,020
|
|
4,168
|
|
||||||||||
|
Preferred dividends
|
1,128
|
|
575
|
|
332
|
|
85
|
|
136
|
|
||||||||||
|
Net Income available to common shareholders
|
11,784
|
|
6,241
|
|
1,747
|
|
3,935
|
|
4,032
|
|
||||||||||
|
Per Share Data:
|
||||||||||||||||||||
|
Earnings per share from continuing operations - basic
|
$
|
0.96
|
|
$
|
0.75
|
|
$
|
0.29
|
|
$
|
0.63
|
|
$
|
0.92
|
|
|||||
|
Earnings per share from discontinued operations - basic
|
0.48
|
|
0.03
|
|
(0.07
|
)
|
(0.04
|
)
|
—
|
|
||||||||||
|
Earnings per share per common shareholder - basic
|
1.44
|
|
0.78
|
|
0.22
|
|
0.59
|
|
0.92
|
|
||||||||||
|
Earnings per share from continuing operations - diluted
|
0.92
|
|
0.74
|
|
0.29
|
|
0.60
|
|
0.90
|
|
||||||||||
|
Earnings per share from discontinued operations - diluted
|
0.39
|
|
0.03
|
|
(0.07
|
)
|
(0.03
|
)
|
—
|
|
||||||||||
|
Earnings per share per common shareholder - diluted
|
1.31
|
|
0.77
|
|
0.22
|
|
0.57
|
|
0.90
|
|
||||||||||
|
Cash dividends
|
0.08
|
|
0.08
|
|
0.08
|
|
0.08
|
|
0.07
|
|
||||||||||
|
Book value
|
12.93
|
|
12.20
|
|
11.59
|
|
11.10
|
|
10.07
|
|
||||||||||
|
Tangible book value
|
11.01
|
|
9.81
|
|
9.44
|
|
8.85
|
|
7.19
|
|
||||||||||
|
Asset Quality Ratios:
|
||||||||||||||||||||
|
Nonperforming loans to gross loans
|
0.59
|
%
|
0.99
|
%
|
1.16
|
%
|
0.14
|
%
|
0.77
|
%
|
||||||||||
|
Nonperforming assets to total assets
|
0.47
|
|
0.76
|
|
0.89
|
|
0.12
|
|
0.50
|
|
||||||||||
|
Net charge-offs to gross loans
|
0.24
|
|
0.07
|
|
0.16
|
|
0.23
|
|
0.40
|
|
||||||||||
|
Allowance for loan losses to gross loans
|
0.86
|
|
0.78
|
|
0.78
|
|
0.79
|
|
0.91
|
|
||||||||||
|
Selected Ratios:
|
||||||||||||||||||||
|
Return on average assets - continuing operations
|
0.63
|
%
|
0.54
|
%
|
0.26
|
%
|
0.54
|
%
|
0.71
|
%
|
||||||||||
|
Return on average assets - discontinued operations
|
0.28
|
|
0.02
|
|
(0.06
|
)
|
(0.03
|
)
|
—
|
|
||||||||||
|
Return on average equity - continuing operations
|
7.30
|
|
5.89
|
|
2.57
|
|
5.44
|
|
8.33
|
|
||||||||||
|
Return on average equity - discontinued operations
|
3.20
|
|
0.19
|
|
(0.56
|
)
|
(0.33
|
)
|
—
|
|
||||||||||
|
Dividend payout
|
5.00
|
|
9.40
|
|
30.59
|
|
13.36
|
|
7.37
|
|
||||||||||
|
Efficiency ratio
|
80.29
|
|
82.84
|
|
89.18
|
|
85.44
|
|
65.56
|
|
||||||||||
|
Equity to assets
|
10.26
|
|
8.29
|
|
9.86
|
|
9.53
|
|
9.29
|
|
||||||||||
|
Common equity tier 1 capital ratio
|
10.11
|
|
7.59
|
|
n/a
|
|
n/a
|
|
n/a
|
|
||||||||||
|
Tier 1 risk-based capital ratio
|
11.92
|
|
9.47
|
|
12.03
|
|
13.03
|
|
11.40
|
|
||||||||||
|
Total risk-based capital ratio
|
15.36
|
|
12.91
|
|
16.40
|
|
13.80
|
|
12.30
|
|
||||||||||
|
Leverage ratio
|
9.54
|
|
7.77
|
|
8.98
|
|
9.28
|
|
8.40
|
|
||||||||||
36
Forward-looking Statements:
Statements in this Annual Report on Form 10-K that are based on other than historical data are forward-looking within the meaning of the Private Securities Litigation Reform Act of 1995. Forward-looking statements provide current expectations or forecasts of future events and include, among others:
|
•
|
statements with respect to the beliefs, plans, objectives, goals, guidelines, expectations, anticipations, and future financial condition, results of operations and performance of the Company and its subsidiary (collectively “we,” “our,” or “us), including the Bank;
|
|
•
|
statements preceded by, followed by or that include the words “may,” “could,” “should,” “would,” “believe,” “anticipate,” “estimate,” “expect,” “intend,” “plan,” “projects,” or similar expressions.
|
These forward-looking statements are not guarantees of future performance, nor should they be relied upon as representing the Company’s or the Bank management’s views as of any subsequent date. Forward-looking statements involve significant risks and uncertainties and actual results may differ materially from those presented, either expressed or implied, including, but not limited to, those presented in this Management’s Discussion and Analysis section. Factors that might cause such differences include, but are not limited to:
|
•
|
the ability of the Company, the Bank, and MVB Mortgage to successfully execute business plans, manage risks, and achieve objectives;
|
|
•
|
changes in local, national and international political and economic conditions, including without limitation the political and economic effects of the recent economic crisis, delay of recovery from that crisis, economic conditions and fiscal imbalances in the United States and other countries, potential or actual downgrades in rating of sovereign debt issued by the United States and other countries, and other major developments, including wars, military actions, and terrorist attacks;
|
|
•
|
changes in financial market conditions, either internationally, nationally or locally in areas in which the Company, the Bank, and MVB Mortgage conduct operations, including without limitation, reduced rates of business formation and growth, commercial and residential real estate development and real estate prices;
|
|
•
|
fluctuations in markets for equity, fixed-income, commercial paper and other securities, including availability, market liquidity levels, and pricing; changes in interest rates, the quality and composition of the loan and securities portfolios, demand for loan products, deposit flows and competition;
|
|
•
|
the ability of the Company, the Bank, and MVB Mortgage to successfully conduct acquisitions and integrate acquired businesses;
|
|
•
|
potential difficulties in expanding the businesses of the Company, the Bank, and MVB Mortgage in existing and new markets;
|
|
•
|
increases in the levels of losses, customer bankruptcies, bank failures, claims, and assessments;
|
|
•
|
changes in fiscal, monetary, regulatory, trade and tax policies and laws, and regulatory assessments and fees, including policies of the U.S. Department of Treasury, the (Federal Reserve, and the FDIC);
|
|
•
|
the impact of executive compensation rules under the Dodd-Frank Act and banking regulations which may impact the ability of the Company and its subsidiaries, and other American financial institutions to retain and recruit executives and other personnel necessary for their businesses and competitiveness;
|
|
•
|
the impact of the Dodd-Frank Act and of new international standards known as Basel III, and rules and regulations thereunder, many of which have not yet been promulgated, on our required regulatory capital and liquidity levels, governmental assessments on us, the scope of business activities in which we may engage, the manner in which the
|
37
Company, the Bank, and MVB Mortgage engage in such activities, the fees that the Company’s subsidiaries may charge for certain products and services, and other matters affected by the Dodd-Frank Act and these international standards;
|
•
|
continuing consolidation in the financial services industry; new legal claims against the Company, the Bank, and MVB Mortgage, including litigation, arbitration and proceedings brought by governmental or self-regulatory agencies, or changes in existing legal matters;
|
|
•
|
success in gaining regulatory approvals, when required, including for proposed mergers or acquisitions;
|
|
•
|
changes in consumer spending and savings habits;
|
|
•
|
increased competitive challenges and expanding product and pricing pressures among financial institutions;
|
|
•
|
inflation and deflation;
|
|
•
|
technological changes and the implementation of new technologies by the Company and its subsidiaries;
|
|
•
|
the ability of the Company, the Bank, and MVB Mortgage to develop and maintain secure and reliable information technology systems;
|
|
•
|
legislation or regulatory changes which adversely affect the operations or business of the Company, the Bank, and MVB Mortgage;
|
|
•
|
the ability of the Company, the Bank, and MVB Mortgage to comply with applicable laws and regulations; changes in accounting policies or procedures as may be required by the Financial Accounting Standards Board or regulatory agencies; and,
|
|
•
|
costs of deposit insurance and changes with respect to FDIC insurance coverage levels.
|
Except to the extent required by law, the Company specifically disclaims any obligation to update any factors or to publicly announce the result of revisions to any of the forward-looking statements included herein to reflect future events or developments.
In Management’s Discussion and Analysis, we review and explain the general financial condition and the results of operations for MVB Financial Corp. and its subsidiaries. We have designed this discussion to assist you in understanding the significant changes in the Company’s financial condition and results of operations. We have used accounting principles generally accepted in the United States to prepare the accompanying consolidated financial statements. We engaged Dixon Hughes Goodman, LLP. to audit the consolidated financial statements and their independent audit report is included herein.
Introduction
The following discussion and analysis of the Consolidated Financial Statements is presented to provide insight into management’s assessment of the financial results and operations of the Company. You should read this discussion and analysis in conjunction with the audited Consolidated Financial Statements and footnotes and the ratios and statistics contained elsewhere in this Annual Report on Form 10-K.
38
Application of Critical Accounting Policies
The Company’s consolidated financial statements are prepared in accordance with U. S. generally accepted accounting principles and follow general practices within the banking industry. Application of these principles requires management to make estimates, assumptions, and judgments that affect the amounts reported in the consolidated financial statements; accordingly, as this information changes, the consolidated financial statements could reflect different estimates, assumptions, and judgments. Certain policies inherently have a greater reliance on the use of estimates, assumptions and judgments and as such have a greater possibility of producing results that could be materially different than originally reported. Estimates, assumptions, and judgments are necessary when assets and liabilities are required to be recorded at fair value, when a decline in the value of an asset not carried on the consolidated financial statements at fair value warrants an impairment write-down or valuation reserve to be established, or when an asset or liability needs to be recorded contingent upon a future event. Carrying assets and liabilities at fair value inherently results in more financial statement volatility. The fair values and the information used to record valuation adjustments for certain assets and liabilities are based either on quoted market prices or are provided by other third-party sources, when available. When third-party information is not available, valuation adjustments are estimated in good faith by management primarily through the use of internal forecasting techniques.
The most significant accounting policies followed by the Company are presented in Note 1, "Summary of Significant Accounting Policies" of the Notes to the Consolidated Financial Statements included in Item 8, Financial Statements and Supplementary Data, of this Annual Report on Form 10-K. These policies, along with the disclosures presented in the other financial statement notes and in management’s discussion and analysis of operations, provide information on how significant assets and liabilities are valued in the consolidated financial statements and how those values are determined. Based on the valuation techniques used and the sensitivity of financial statement amounts to the methods, assumptions, and estimates underlying those amounts, management has identified the determination of the allowance for loan losses to be the accounting area that requires the most subjective or complex judgments, and as such could be most subject to revision as new information becomes available.
Allowance for Loan Losses
The Allowance for Loan Losses ("ALL") represents management’s estimate of probable credit losses inherent in the loan portfolio. Determining the amount of the allowance for loan losses is considered a critical accounting estimate because it requires significant judgment and the use of estimates related to the amount and timing of losses inherent in classifications of homogeneous loans based on the Bank’s historical loss experience and consideration of current economic trends and conditions, all of which may be susceptible to significant change. Non-homogeneous loans are specifically evaluated due to the increased risks inherent in those loans. The loan portfolio also represents the largest asset type in the consolidated balance sheet. Note 1, "Summary of Significant Accounting Policies" of the Notes to the Consolidated Financial Statements included in Item 8, Financial Statements and Supplementary Data, of this Annual Report on Form 10-K, describes the methodology used to determine the allowance for loan losses and a discussion of the factors driving changes in the amount of the allowance for loan losses.
Investment Securities
Investment securities at the time of purchase are classified as one of the following:
Held-to-Maturity Securities
- Includes securities that the Company has the positive intent and ability to hold to maturity. These securities are reported at amortized cost.
Available-for-Sale Securities
- Includes debt and equity securities not classified as held-to-maturity that will be held for indefinite periods of time. These securities may be sold in response to changes in market interest or prepayment rates, needs for liquidity and changes in the availability of and yield of alternative investments. Such securities are reported at fair value, with unrealized holding gains and losses excluded from earnings and reported as a separate component of stockholders’ equity, net of estimated income tax effect.
The amortized cost of investment in debt securities is adjusted for amortization of premiums and accretion of discounts, computed by a method that results in a level yield. Gains and losses on the sale of investment securities are computed on the basis of specific identification of the adjusted cost of each security.
Securities are periodically reviewed for other-than-temporary impairment. For debt securities, management considers whether the present value of future cash flows expected to be collected are less than the security’s amortized cost basis (the difference defined as the credit loss), the magnitude and duration of the decline, the reasons underlying the decline and the Company’s intent to sell the security or whether it is more likely than not that the Company would be required to sell the security before its anticipated
39
recovery in market value, to determine whether the loss in value is other than temporary. Once a decline in value is determined to be other than temporary, if the Company does not intend to sell the security, and it is more-likely-than-not that it will not be required to sell the security, before recovery of the security’s amortized cost basis, the charge to earnings is limited to the amount of credit loss. Any remaining difference between fair value and amortized cost (the difference defined as the non-credit portion) is recognized in other comprehensive income, net of applicable taxes. For equity securities where the fair value has been significantly below cost for one year, the Company’s policy is to recognize an impairment loss unless sufficient evidence is available that the decline is not other than temporary and a recovery period can be predicted. A decline in value that is considered to be other-than-temporary is recorded as a loss within noninterest income in the consolidated statement of income.
Common stock of the Federal Home Loan Bank represents ownership in an institution which is wholly owned by other financial institutions. These equity securities are accounted for at cost and are classified as other assets.
See Note 2, "Investment Securities" of the Notes to the Consolidated Financial Statements included in Item 8, Financial Statements and Supplementary Data, of this Annual Report on Form 10-K for the Company’s policy regarding the other than temporary impairment of investment securities.
Goodwill and Other Intangible Assets
As discussed in Note 1, "Summary of Significant Accounting Policies" of the Notes to the Consolidated Financial Statements included in Item 8, Financial Statements and Supplementary Data, of this Annual Report on Form 10-K, the Company must assess goodwill and other intangible assets each year for impairment. This assessment involves estimating the fair value of the Company’s reporting units. If the fair value of the reporting unit is less than its carrying value including goodwill, we would be required to take a charge against earnings to write down the assets to the lower value.
Deferred Tax Assets
We use an estimate of future earnings to support our position that the benefit of our deferred tax assets will be realized. If future income should prove non-existent or less than the amount of the deferred tax assets within the tax years to which they may be applied, the asset may not be realized and our net income will be reduced. Management also evaluates deferred tax assets to determine if it is more likely than not that the deferred tax benefit will be utilized in future periods. If not, a valuation allowance is recorded. Our deferred tax assets are described further in Note 8, "Income Taxes" of the Notes to the Consolidated Financial Statements included in Item 8, Financial Statements and Supplementary Data, of this Annual Report on Form 10-K.
Recent Accounting Pronouncements and Developments
In December 2016, the Financial Accounting Standards Board ("FASB") issued Accounting Standards Update ("ASU") 2016-20,
Technical Corrections and Improvements to Topic 606, Revenue from Contracts with Customers
. The amendments in this ASU cover a variety of Topics in the Codification related to the new revenue recognition standard (ASU 2014-09) and represent changes to make minor corrections or minor improvements to the Codification that are not expected to have a significant impact on current accounting practice or create a significant administrative cost to most entities. For public companies, this update will be effective for fiscal years beginning after December 15, 2017, including all interim periods within those fiscal years. The adoption of this guidance is not expected to be material to the consolidated financial statements.
In December 2016, the FASB issued ASU 2016-19,
Technical Corrections and Improvements.
The amendments in this ASU cover a wide range of Topics in the Codification and represent changes to make corrections or improvements to the Codification that are not expected to have a significant effect on current accounting practice or create a significant administrative cost to most entities. For public companies, this update will be effective for fiscal years beginning after December 15, 2016, including all interim periods within those fiscal years. Early application is permitted. The adoption of this guidance will not have a material impact on the Company's consolidated financial statements.
In November 2016, the FASB issued ASU 2016-18,
Statement of Cash Flows (Topic 230): Restricted Cash (a consensus of the FASB Emerging Issues Task Force).
The new guidance clarifies the classification within the statement of cash flows for certain transactions, including debt extinguishment costs, zero-coupon debt, contingent consideration related to business combinations, insurance proceeds, equity method distributions and beneficial interests in securitizations. The guidance also clarifies that cash flows with aspects of multiple classes of cash flows or that cannot be separated by source or use should be classified based on the activity that is likely to be the predominant source or use of cash flows for the item. This guidance is effective for fiscal years beginning after December 15, 2017 and interim periods within those fiscal years. The adoption of this guidance will not have a material impact on the Company's consolidated financial statements.
40
In October 2016, the FASB issued ASU 2016-17,
Consolidation (Topic 810): Interests Held through Related Parties That Are under Common Control.
The new guidance changes the accounting for the consolidation of VIEs in certain situations involving entities under common control. Specifically, the amendments change how the indirect interests held through related parties that are under common control should be included in a reporting entity’s evaluation of whether it is a primary beneficiary of a VIE. Under the amended guidance, the reporting entity is only required to include the indirect interests held through related parties that are under common control in a VIE on a proportionate basis. Currently, the indirect interests held by the related parties that are under common control are considered to be the equivalent of direct interests in their entirety. This guidance is effective for fiscal years beginning after December 15, 2016 and interim periods within those fiscal years. The adoption of this guidance will not have a material impact on the Company's consolidated financial statements.
In October 2016, the FASB issued ASU 2016-16,
Income Taxes (Topic 740): Intra-Entity Transfers of Assets Other Than Inventory.
This new guidance requires an entity to recognize the income tax consequences of an intra-entity transfer of an asset other than inventory when the transfer occurs. Current U.S. GAAP prohibits the recognition of current and deferred income taxes for an intra-entity asset transfer until the asset has been sold to an outside party. This guidance is effective for fiscal years beginning after December 15, 2017 and interim periods within those fiscal years. The adoption of this guidance will not have a material impact on the Company's consolidated financial statements.
In August 2016, the FASB issued ASU 2016-15,
Statement of Cash Flows (Topic 230): Classification of Certain Cash Receipts and Cash Payments
. This new guidance clarifies the guidance for classification of certain cash receipts and payments within an entity’s statements of cash flows. These items include debt prepayment or extinguishment costs, settlement of zero-coupon debt instruments, contingent consideration payments made after a business combination, proceeds from the settlement of insurance claims, proceeds from the settlement of BOLI policies, distributions received from equity method investees, and beneficial interests in securitization transactions. The amended guidance also specifies how to address classification of cash receipts and payments that have aspects of more than one class of cash flows. This guidances is effective for fiscal years beginning after December 15, 2017 and interim periods within those fiscal years. The adoption of this guidance will not have a material impact on the Company's consolidated financial statements.
In June 2016, the FASB issued ASU 2016-13,
Financial Instruments-Credit Losses (Topic 326): Measurement of Credit Losses on Financial Instruments
. The new guidance replaces the incurred loss impairment methodology in current GAAP with an expected credit loss methodology and requires consideration of a broader range of information to determine credit loss estimates. Financial assets measured at amortized cost will be presented at the net amount expected to be collected by using an allowance for credit losses. Purchased credit impaired loans will receive an allowance account at the acquisition date that represents a component of the purchase price allocation. Credit losses relating to available-for-sale debt securities will be recorded through an allowance for credit losses, with such allowance limited to the amount by which fair value is below amortized cost. The guidance is effective for fiscal years beginning after December 15, 2019 and interim periods within those fiscal years. The Company's project management team and MLC are in the process of developing an understanding of this pronouncement, evaluating the impact of this pronouncement and researching additional software resources that could assist with the implementation.
In March 2016, the FASB issued ASU 2016-09,
Compensation – Stock Compensation (Topic 718): Improvements to Employee Share-Based Payment Accounting.
The new guidance eliminates the concept of APIC pools for stock-based awards and requires that the related excess tax benefits and tax deficiencies be classified as an operating activity in the statement of cash flows. The new guidance also allows entities to make a one-time policy election to account for forfeitures when they occur, instead of accruing compensation cost based on the number of awards expected to vest. Additionally, the new guidance changes the requirement for an award to qualify for equity classification by permitting tax withholding up to the maximum statutory tax rate instead of the minimum statutory tax rate. The new guidance is effective for annual periods beginning after December 15, 2016 and interim periods within those annual periods. The adoption of this guidance did not have a material impact on the Company's consolidated financial statements.
In February 2016, the FASB issued ASU 2016-02,
Leases (Topic 842)
. Among other things, in the amendments in ASU 2016-02, lessees will be required to recognize the following for all leases (with the exception of short-term leases) at the commencement date: (1) A lease liability, which is a lessee‘s obligation to make lease payments arising from a lease, measured on a discounted basis; and (2) A right-of-use asset, which is an asset that represents the lessee’s right to use, or control the use of, a specified asset for the lease term. Under the new guidance, lessor accounting is largely unchanged. Certain targeted improvements were made to align, where necessary, lessor accounting with the lessee accounting model and Topic 606, Revenue from Contracts with Customers. The amendments in this ASU are effective for fiscal years beginning after December 15, 2018, including interim periods within those fiscal years. Early application is permitted upon issuance. Lessees (for capital and operating leases) and lessors (for sales-type, direct financing and operating leases) must apply a modified retrospective transition approach for leases
41
existing at, or entered into after, the beginning of the earliest comparative period presented in the financial statements. The modified retrospective approach would not require any transition accounting for leases that expired before the earliest comparative period presented. Lessees and lessors may not apply a full retrospective transition approach. While we are currently evaluating the impact of the new standard, we expect an increase to the Consolidated Balance Sheets for right-of-use assets and associated lease liabilities, as well as resulting depreciation expense of the right-of-use assets and interest expense of the lease liabilities in the Consolidated Statements of Income, for arrangements previously accounted for as operating leases.
In January 2016, the FASB issued ASU 2016-01, Accounting for Financial Instruments - Overall: Classification and Measurement (Subtopic 825-10). Amendments within ASU 2016-01 that relate to non-public entities have been excluded from this presentation. The amendments in this ASU 2016-01 address the following: 1) require equity investments to be measured at fair value with changes in fair value recognized in net income; 2) simplify the impairment assessment of equity investments without readily-determinable fair values by requiring a qualitative assessment to identify impairment; 3) eliminate the requirement to disclose the method(s) and significant assumptions used to estimate the fair value that is required to be disclosed for financial instruments measured at amortized cost on the balance sheet; 4) require entities to use the exit price notion when measuring the fair value of financial instruments for disclosure purposes; 5) require separate presentation in other comprehensive income for the portion of the total change in the fair value of a liability resulting from a change in the instrument-specific credit risk when the entity has elected to measure the liability at fair value in accordance with the fair value option for financial instruments; 6) require separate presentation of financial assets and financial liabilities by measurement category and form of financial asset (that is, securities or loans and receivables) on the balance sheet or the accompanying notes to the financial statements; and 7) clarify that an entity should evaluate the need for a valuation allowance on a deferred tax asset related to available-for-sale securities in combination with the entity's other deferred tax assets. The amendments are effective for public business entities for fiscal years beginning after December 15, 2017, and interim periods within those fiscal years. The Company is currently evaluating the provisions of this amendment to determine the potential impact the new standard will have on the Company's consolidated financial statements as it relates to accounting for financial instruments. The Company is currently evaluating the provisions of this amendment to determine the potential impact the new standard will have on the Company's consolidated financial statements as it relates to accounting for financial instruments.
In September 2015, the FASB issued ASU 2015-16,
Business Combinations (Topic 805): Simplifying the Accounting for Measurement-Period Adjustments
. The new guidance requires that adjustments to provisional amounts identified during the measurement period of a business combination be recognized in the reporting period in which the adjustment amounts are determined. Furthermore, the income statement effects of such adjustments, if any, must be calculated as if the accounting had been completed at the acquisition date reflecting the portion of the amount recorded in current-period earnings that would have been recorded in previous reporting periods if the adjustment to the provisional amounts had been recognized as of the acquisition date. Under previous guidance, adjustments to provisional amounts identified during the measurement period are to be recognized retrospectively. ASU 2015-16 was effective for us on January 1, 2016 and did not have a significant impact on our consolidated financial statements.
In February 2015, the FASB issued ASU 2015-02,
Consolidation (Topic 810): Amendments to the Consolidation Analysis
. The amendments modify the evaluation reporting organizations must perform to determine if certain legal entities should be consolidated as VIEs. Specifically, the amendments: (1) Modify the evaluation of whether limited partnerships and similar legal entities are variable interest entities (“VIEs”) or voting interest entities; (2) Eliminate the presumption that a general partner should consolidate a limited partnership; (3) Affect the consolidation analysis of reporting entities that are involved with VIEs, particularly those that have fee arrangements and related party relationships; and (4) Provide a scope exception from consolidation guidance for reporting entities with interests in legal entities that are required to comply with or operate in accordance with requirements that are similar to those in Rule 2a-7 of the Investment Company Act of 1940 for registered money market funds. ASU 2015-02 was effective for us on January 1, 2016 and did not have a significant impact on the Company's consolidated financial statements.
Summary Financial Results
Excluding discontinued operations, the Company earned
$9.0 million
in
2016
compared to
$6.6 million
in
2015
, an increase of
$2.4 million
. The
2016
earnings equated to a return on average assets of
0.63%
and a return on average equity of
7.30%
, compared to
2015
results of
0.54%
and
5.89%
, respectively. Basic earnings per share were
$0.96
in
2016
compared to
$0.75
in
2015
. Diluted earnings per share were
$0.92
in
2016
compared to
$0.74
in
2015
.
Excluding discontinued operations, the Company earned
$6.6 million
in
2015
compared to
$2.7 million
in
2014
, an increase of
$3.9 million
. The
2015
earnings equated to a return on average assets of
0.54%
and a return on average equity of
5.89%
, compared to
2014
results of
0.26%
and
2.57%
, respectively. Basic earnings per share were
$0.75
in
2015
compared to
$0.29
in
2014
. Diluted earnings per share were
$0.74
in
2015
compared to
$0.29
in
2014
.
42
Net interest income increased
$8.1 million
, noninterest income increased
$8.3 million
and noninterest expenses increased by
$11.4 million
during
2016
compared to
2015
. The Company’s yield on earning assets in
2016
was
4.05%
compared to
3.88%
in
2015
. Total loans increased by
$20.7 million
to
$1.1 billion
at
December 31, 2016
. The Bank’s ability to originate quality loans is supported by a minimal delinquency rate.
Net interest income increased
$6.2 million
, noninterest income increased
$12.9 million
and noninterest expenses increased by
$12.7 million
during
2015
compared to
2014
. The Company’s yield on earning assets in
2015
was
3.88%
compared to
3.80%
in
2014
. Total loans increased to
$1.0 billion
at
December 31, 2015
, from
$798.3 million
at
December 31, 2014
.
Deposits increased
$94.7 million
to
$1.1 billion
at
December 31, 2016
, from
$1.0 billion
at
December 31, 2015
. The Bank offers an uncomplicated product design accompanied by a simple fee structure that is attractive to customers. The overall cost of funds for the Company was
0.93%
in
2016
compared to
0.90%
in
2015
. This cost of funds, combined with the earning asset yield, resulted in a net interest margin of
3.22%
in
2016
compared to
3.07%
in
2015
.
Deposits increased
$189.1 million
to
$1.0 billion
at
December 31, 2015
, from
$823.2 million
at
December 31, 2014
. The overall cost of funds for the Company was
0.90%
in
2015
compared to
0.87%
in
2014
. This cost of funds, combined with the earning asset yield, resulted in a net interest margin of
3.07%
in
2015
compared to
3.01%
in
2014
.
Interest Income and Expense
Net interest income is the amount by which interest income on earning assets exceeds interest expense incurred on interest-bearing liabilities. Interest-earning assets include loans, investment securities and certificates of deposit in other banks. Interest-bearing liabilities include interest-bearing deposits and borrowed funds such as sweep accounts and repurchase agreements. Net interest income remains the primary source of revenue for the Bank. Net interest income is also impacted by changes in market interest rates, as well as the mix of interest-earning assets and interest-bearing liabilities. Net interest income is also impacted favorably by increases in noninterest bearing demand deposits and equity.
Net interest margin is calculated by dividing net interest income by average interest-earning assets and serves as a measurement of the net revenue stream generated by the Bank’s balance sheet. As noted above, the net interest margin was
3.22%
in
2016
compared to
3.07%
and
3.01%
in
2015
and
2014
, respectively. The net interest margin continues to face considerable pressure due to competitive pricing of loans and deposits in the Bank’s markets. During
2016
, the Federal Reserve raised its key interest rate from a range of
0.25%
to
0.50%
to a range of
0.50%
to
0.75%
. Management’s estimate of the impact of future changes in market interest rates is shown in the section captioned “Interest Rate Risk.”
Company management continues to analyze methods to deploy assets into an earning asset mix which will result in a stronger net interest margin. Loan growth continues to be strong and management anticipates that loan activity will remain strong in the near term future.
During
2016
, net interest income increased by
$8.1 million
or
23.3%
to
$43.0 million
from
$34.9 million
in
2015
. This increase is largely due to the growth in average earning assets, primarily
$179.0 million
in average total loans and loans held for sale. Average total earning assets were
$1.3 billion
in
2016
compared to
$1.1 billion
in
2015
. Average total loans and loans held for sale grew to
$1.2 billion
in
2016
from
$987.7 million
in
2015
. Primarily as a result of this growth, total interest income increased by
$10.0 million
, or
22.7%
, to
$54.1 million
in
2016
from
$44.1 million
in
2015
. Average investment securities increased
$21.1 million
, the result of a
$10.7 million
average increase in tax-exempt investments and a
$10.4 million
increase in taxable investments. Yield on tax-exempt securities remained flat, increasing only
1
basis point, while taxable securities increased
34
basis points. Average interest-bearing liabilities, mainly deposits and borrowings, likewise increased in
2016
by
$165.8 million
. Average interest-bearing deposits grew to
$992.7 million
in
2016
from
$842.3 million
in
2015
. Total interest expense increased by
$1.9 million
, caused primarily by a
$1.5 million
increase in deposit interest and a
$394 thousand
increase in interest on FHLB and other borrowings. The result was a
3
basis point increase in interest cost from
2015
to
2016
.
During
2015
, net interest income increased by
$6.2 million
or
21.7%
to
$34.9 million
from
$28.7 million
in
2014
. This increase is largely due to the growth in average earning assets, primarily
$207.8 million
in loans and loans held for sale. Average total earning assets were
$1.1 billion
in
2015
compared to
$952.6 million
in
2014
. Average total loans and loans held for sale grew to
$987.7 million
in
2015
from
$779.8 million
in
2014
. Primarily as a result of this growth, total interest income increased by
$7.9 million
, or
21.9%
, to
$44.1 million
in
2015
from
$36.2 million
in
2014
. Average investment securities decreased
$23.4 million
, mainly the result of a
$2.6 million
average decrease in tax-exempt investments and a
$20.8 million
decrease in taxable investments. Average interest-bearing liabilities, mainly deposits, likewise increased in
2015
by
$161.2 million
. Average interest-
43
bearing deposits grew to
$842.3 million
in
2015
from
$710.4 million
in
2014
. Total interest expense increased by
$1.7 million
, caused primarily by a
$683 thousand
increase in deposit interest and a
$1.1 million
increase in subordinated debt interest. The result was a
3
basis point increase in interest cost from
2014
to
2015
.
The Company’s earning assets increased
$199.9 million
and net interest income increased by
$8.1 million
during
2016
. The net interest margin continues to be pressured by increased competition for high quality loan growth and the deposit volume required to fund the growth.
The Bank’s yield on earning assets changed during
2016
as follows: The loan portfolio yield decreased by
16
basis points and the investment portfolio yield increased by
20
basis points while funding costs increased by
3
basis points.
The cost of interest-bearing liabilities increased to
0.93%
in
2016
from
0.90%
in
2015
. This increase is primarily the result of a
25
basis point increase in the cost of borrowings and a
23
basis point increase on deposits. Further discussion on borrowings is included in Note 6, "Borrowed Funds" of the Notes to the Consolidated Financial Statements included in Item 8, Financial Statements and Supplementary Data, of this Annual Report on Form 10-K.
44
Statistical Financial Information Regarding MVB Financial Corp.
The following tables provide further information about interest income and expense:
Average Balances and Analysis of Net Interest Income:
|
2016
|
2015
|
2014
|
|||||||||||||||||||||||||||||||
|
(Dollars in thousands)
|
Average Balance
|
Interest Income/Expense
|
Yield/Cost
|
Average Balance
|
Interest Income/Expense
|
Yield/Cost
|
Average Balance
|
Interest Income/Expense
|
Yield/Cost
|
||||||||||||||||||||||||
|
Assets
|
|||||||||||||||||||||||||||||||||
|
Interest-bearing deposits in banks
|
$
|
16,347
|
|
$
|
94
|
|
0.58
|
%
|
$
|
16,040
|
|
$
|
43
|
|
0.27
|
%
|
$
|
20,123
|
|
$
|
45
|
|
0.22
|
%
|
|||||||||
|
CDs with other banks
|
11,694
|
|
228
|
|
1.95
|
|
12,267
|
|
231
|
|
1.88
|
|
9,826
|
|
178
|
|
1.81
|
|
|||||||||||||||
|
Investment securities:
|
|||||||||||||||||||||||||||||||||
|
Taxable
|
76,525
|
|
1,366
|
|
1.79
|
|
66,110
|
|
958
|
|
1.45
|
|
86,868
|
|
1,272
|
|
1.46
|
|
|||||||||||||||
|
Tax-exempt
|
64,108
|
|
1,853
|
|
2.89
|
|
53,376
|
|
1,537
|
|
2.88
|
|
55,972
|
|
1,646
|
|
2.94
|
|
|||||||||||||||
|
Loans and loans held for sale: (1)
|
|||||||||||||||||||||||||||||||||
|
Commercial
|
734,829
|
|
32,620
|
|
4.44
|
|
616,057
|
|
26,264
|
|
4.26
|
|
489,382
|
|
21,344
|
|
4.36
|
|
|||||||||||||||
|
Tax exempt
|
16,326
|
|
564
|
|
3.45
|
|
19,678
|
|
689
|
|
3.50
|
|
29,682
|
|
1,078
|
|
3.63
|
|
|||||||||||||||
|
Real estate
|
398,766
|
|
16,594
|
|
4.16
|
|
334,538
|
|
13,586
|
|
4.06
|
|
242,526
|
|
9,832
|
|
4.05
|
|
|||||||||||||||
|
Consumer
|
16,762
|
|
804
|
|
4.80
|
|
17,383
|
|
792
|
|
4.56
|
|
18,228
|
|
773
|
|
4.24
|
|
|||||||||||||||
|
Total loans
|
1,166,683
|
|
50,582
|
|
4.34
|
|
987,656
|
|
41,331
|
|
4.18
|
|
779,818
|
|
33,027
|
|
4.24
|
|
|||||||||||||||
|
Total earning assets
|
1,335,357
|
|
54,123
|
|
4.05
|
|
1,135,449
|
|
44,100
|
|
3.88
|
|
952,607
|
|
36,168
|
|
3.80
|
|
|||||||||||||||
|
Less: Allowance for loan losses
|
(8,939
|
)
|
(7,016
|
)
|
(6,135
|
)
|
|||||||||||||||||||||||||||
|
Cash and due from banks
|
13,765
|
|
14,465
|
|
15,173
|
|
|||||||||||||||||||||||||||
|
Other assets
|
87,815
|
|
83,520
|
|
75,309
|
|
|||||||||||||||||||||||||||
|
Total assets
|
$
|
1,427,998
|
|
$
|
1,226,418
|
|
$
|
1,036,954
|
|
||||||||||||||||||||||||
|
Liabilities
|
|||||||||||||||||||||||||||||||||
|
Deposits:
|
|||||||||||||||||||||||||||||||||
|
NOW
|
$
|
454,320
|
|
$
|
2,413
|
|
0.53
|
|
$
|
446,704
|
|
$
|
2,713
|
|
0.61
|
|
$
|
402,273
|
|
$
|
3,157
|
|
0.78
|
|
|||||||||
|
Money market checking
|
163,630
|
|
1,282
|
|
0.78
|
|
65,306
|
|
396
|
|
0.61
|
|
38,332
|
|
191
|
|
0.50
|
|
|||||||||||||||
|
Savings
|
43,870
|
|
88
|
|
0.20
|
|
39,766
|
|
111
|
|
0.28
|
|
37,576
|
|
126
|
|
0.34
|
|
|||||||||||||||
|
IRAs
|
16,319
|
|
208
|
|
1.27
|
|
12,038
|
|
146
|
|
1.21
|
|
9,627
|
|
113
|
|
1.17
|
|
|||||||||||||||
|
CDs
|
314,542
|
|
3,757
|
|
1.19
|
|
278,499
|
|
2,880
|
|
1.03
|
|
222,609
|
|
1,976
|
|
0.89
|
|
|||||||||||||||
|
Repurchase agreements and federal funds sold
|
27,066
|
|
72
|
|
0.27
|
|
26,884
|
|
83
|
|
0.31
|
|
55,731
|
|
291
|
|
0.52
|
|
|||||||||||||||
|
FHLB and other borrowings
|
139,736
|
|
1,086
|
|
0.78
|
|
124,475
|
|
692
|
|
0.56
|
|
80,855
|
|
515
|
|
0.64
|
|
|||||||||||||||
|
Subordinated debt
|
33,524
|
|
2,226
|
|
6.64
|
|
33,524
|
|
2,204
|
|
6.57
|
|
19,011
|
|
1,142
|
|
6.01
|
|
|||||||||||||||
|
Total interest-bearing liabilities
|
1,193,007
|
|
11,132
|
|
0.93
|
|
1,027,196
|
|
9,225
|
|
0.90
|
|
866,014
|
|
7,511
|
|
0.87
|
|
|||||||||||||||
|
Noninterest bearing demand deposits
|
99,826
|
|
79,611
|
|
60,587
|
|
|||||||||||||||||||||||||||
|
Other liabilities
|
12,220
|
|
7,486
|
|
6,699
|
|
|||||||||||||||||||||||||||
|
Total liabilities
|
1,305,053
|
|
1,114,293
|
|
933,300
|
|
|||||||||||||||||||||||||||
|
Stockholders’ equity
|
|||||||||||||||||||||||||||||||||
|
Preferred stock
|
16,334
|
|
16,334
|
|
12,471
|
|
|||||||||||||||||||||||||||
|
Common stock
|
8,263
|
|
8,065
|
|
7,958
|
|
|||||||||||||||||||||||||||
|
Paid-in capital
|
75,799
|
|
74,331
|
|
72,308
|
|
|||||||||||||||||||||||||||
|
Treasury stock
|
(1,084
|
)
|
(1,084
|
)
|
(1,084
|
)
|
|||||||||||||||||||||||||||
|
Retained earnings
|
25,943
|
|
16,941
|
|
14,554
|
|
|||||||||||||||||||||||||||
|
Accumulated other comprehensive income
|
(2,310
|
)
|
(2,462
|
)
|
(2,553
|
)
|
|||||||||||||||||||||||||||
|
Total stockholders’ equity
|
122,945
|
|
112,125
|
|
103,654
|
|
|||||||||||||||||||||||||||
|
Total liabilities and stockholders’ equity
|
$
|
1,427,998
|
|
$
|
1,226,418
|
|
$
|
1,036,954
|
|
||||||||||||||||||||||||
|
Net interest spread
|
3.12
|
|
2.98
|
|
2.93
|
|
|||||||||||||||||||||||||||
|
Net interest income-margin
|
$
|
42,991
|
|
3.22
|
%
|
|
|
$
|
34,875
|
|
3.07
|
%
|
$
|
28,657
|
|
3.01
|
%
|
||||||||||||||||
|
(1) Non-accrual loans are included in total loan balances, lowering the effective yield for the portfolio in the aggregate.
|
|||||||||||||||||||||||||||||||||
45
Rate Volume Calculation
2016
vs.
2015
|
(Dollars in thousands)
|
Change in Volume
|
Change in Rate
|
Change in both Rate & Volume
|
Total Change
|
||||||||
|
Earning Assets
|
||||||||||||
|
Loans
|
||||||||||||
|
Commercial
|
5,064
|
|
1,083
|
|
209
|
|
6,356
|
|
||||
|
Tax exempt
|
(117
|
)
|
(10
|
)
|
2
|
|
(125
|
)
|
||||
|
Real estate
|
2,608
|
|
336
|
|
64
|
|
3,008
|
|
||||
|
Consumer
|
(28
|
)
|
41
|
|
(1
|
)
|
12
|
|
||||
|
Investment securities:
|
||||||||||||
|
Taxable
|
151
|
|
222
|
|
35
|
|
408
|
|
||||
|
Tax-exempt
|
309
|
|
6
|
|
1
|
|
316
|
|
||||
|
Interest-bearing deposits in banks
|
1
|
|
49
|
|
1
|
|
51
|
|
||||
|
CDs with other banks
|
(11
|
)
|
8
|
|
—
|
|
(3
|
)
|
||||
|
Total earning assets
|
7,977
|
|
1,735
|
|
311
|
|
10,023
|
|
||||
|
Interest bearing liabilities
|
||||||||||||
|
NOW
|
46
|
|
(340
|
)
|
(6
|
)
|
(300
|
)
|
||||
|
Money market checking
|
596
|
|
116
|
|
174
|
|
886
|
|
||||
|
Savings
|
11
|
|
(31
|
)
|
(3
|
)
|
(23
|
)
|
||||
|
IRAs
|
52
|
|
7
|
|
3
|
|
62
|
|
||||
|
CDs
|
373
|
|
446
|
|
58
|
|
877
|
|
||||
|
Repurchase agreements and federal funds sold
|
1
|
|
(12
|
)
|
—
|
|
(11
|
)
|
||||
|
FHLB and other borrowings
|
85
|
|
275
|
|
34
|
|
394
|
|
||||
|
Subordinated debt
|
—
|
|
22
|
|
—
|
|
22
|
|
||||
|
Total interest bearing liabilities
|
1,164
|
|
483
|
|
260
|
|
1,907
|
|
||||
|
Total
|
6,813
|
|
1,252
|
|
51
|
|
8,116
|
|
||||
46
Rate Volume Calculation
2015
vs.
2014
|
(Dollars in thousands)
|
Change in Volume
|
Change in Rate
|
Change in both Rate & Volume
|
Total Change
|
||||||||
|
Earning Assets
|
||||||||||||
|
Loans
|
||||||||||||
|
Commercial
|
5,524
|
|
(480
|
)
|
(124
|
)
|
4,920
|
|
||||
|
Tax exempt
|
(363
|
)
|
(39
|
)
|
13
|
|
(389
|
)
|
||||
|
Real estate
|
3,730
|
|
17
|
|
7
|
|
3,754
|
|
||||
|
Consumer
|
(36
|
)
|
58
|
|
(3
|
)
|
19
|
|
||||
|
Investment securities:
|
||||||||||||
|
Taxable
|
(304
|
)
|
(13
|
)
|
3
|
|
(314
|
)
|
||||
|
Tax-exempt
|
(77
|
)
|
(34
|
)
|
2
|
|
(109
|
)
|
||||
|
Interest-bearing deposits in banks
|
(9
|
)
|
9
|
|
(2
|
)
|
(2
|
)
|
||||
|
CDs with other banks
|
44
|
|
7
|
|
2
|
|
53
|
|
||||
|
Total earning assets
|
8,509
|
|
(475
|
)
|
(102
|
)
|
7,932
|
|
||||
|
Interest bearing liabilities
|
||||||||||||
|
NOW
|
349
|
|
(714
|
)
|
(79
|
)
|
(444
|
)
|
||||
|
Money market checking
|
135
|
|
41
|
|
29
|
|
205
|
|
||||
|
Savings
|
7
|
|
(21
|
)
|
(1
|
)
|
(15
|
)
|
||||
|
IRAs
|
28
|
|
4
|
|
1
|
|
33
|
|
||||
|
CDs
|
496
|
|
326
|
|
82
|
|
904
|
|
||||
|
Repurchase agreements and federal funds sold
|
(151
|
)
|
(119
|
)
|
62
|
|
(208
|
)
|
||||
|
FHLB and other borrowings
|
277
|
|
(65
|
)
|
(35
|
)
|
177
|
|
||||
|
Subordinated debt
|
872
|
|
108
|
|
82
|
|
1,062
|
|
||||
|
Total interest bearing liabilities
|
2,013
|
|
(440
|
)
|
141
|
|
1,714
|
|
||||
|
Total
|
6,496
|
|
(35
|
)
|
(243
|
)
|
6,218
|
|
||||
Provision for Loan Losses
The Company’s provision for loan losses for
2016
,
2015
and
2014
was
$3.6 million
,
$2.5 million
and
$2.6 million
, respectively.
Determining the appropriate level of the allowance for loan losses requires considerable management judgment. In exercising this judgment, management considers numerous internal and external factors including, but not limited to, portfolio growth, national and local economic conditions, trends in the markets served and guidance from the Bank’s primary regulators. Management seeks to maintain an allowance for loan losses that is appropriate in the circumstances and that complies with applicable accounting and regulatory standards. Further discussion can be found later in this discussion under "Allowance for Loan Losses."
Noninterest
Income
Mortgage fee income, interchange income, and portfolio loan sales generate the core of the Company’s noninterest income. Also, service charges on deposit accounts continue to be part of the core of the Company’s noninterest income and include mainly non-sufficient funds and returned check fees, allowable overdraft fees and service charges on commercial accounts. The total of noninterest income for
2016
,
2015
and
2014
were
$43.2 million
,
$35.0 million
and
$22.0 million
, respectively.
In
2016
and
2015
, mortgage fee income increased
$6.2 million
and
$11.9 million
, respectively. Production volume increased by
$344.7 million
or
26.5%
in
2016
and
$478.8 million
or
58.3%
in
2015
. The greatest increase in
2016
was due to the increase in refinance and purchase volume. The greatest increase in
2015
was due to the increase in refinance and construction volume. Both years increase in production volume was related to expansion into new market areas.
During the ordinary course of business in
2016
,
2015
and
2014
the Company sold several investment securities at a gain of
$1.1 million
,
$130 thousand
and
$413 thousand
, respectively. All investments that were sold were classified as available-for-sale with
47
the exception of one held-to-maturity investment that was sold during
2015
due to a credit downgrade. The Company is always looking at ways to improve yield while maintaining a high quality short-term investment portfolio.
Interchange income increased
$198 thousand
from
$987 thousand
in
2015
to
$1.2 million
in
2016
and increased
$209 thousand
from
$778 thousand
in
2014
to
$987 thousand
in
2015
. This increase is primarily the result of increases in the number of credit and debit card customers and the increased activity related to the increase.
Gain on sale of portfolio loans decreased
$371 thousand
from
$1.4 million
in
2015
to
$1.0 million
in
2016
and decreased
$137 thousand
from
$1.6 million
in
2014
to
$1.4 million
in
2015
. The total volume of portfolio loans sold in
2016
,
2015
and
2014
was
$57.2 million
,
$75.0 million
, and
$86.2 million
, respectively.
The Company is continually searching for ways to increase noninterest income.
Noninterest Expense
Noninterest expense was
$69.2 million
,
$57.8 million
and
$45.2 million
in
2016
,
2015
and
2014
, respectively. Approximately
65%
,
62%
and
61%
of noninterest expense for
2016
,
2015
and
2014
, respectively, related to personnel costs. Personnel are the lifeblood of every service organization, which is why personnel costs are such a significant part of the expenditure mix. Salaries and benefits increased by
$9.2 million
in
2016
and
$8.3 million
in
2015
. The
2016
increase related to the following: additional staffing related to organic growth, increased commissions due to a
26.4%
increase in mortgage loan origination volume, a
$1.8 million
increase in the earn out paid to management of the mortgage company related to the 2012 acquisition and increases for existing staff. The
2015
increase related to the following: the addition of new bank and mortgage offices, additional staffing related to organic growth, increased commissions due to a
47.5%
increase in origination volume and increases for existing staff.
Equipment and occupancy expense increased by
$735 thousand
in
2016
and
$1.2 million
in
2015
. The
2016
increase was mainly the result of a full year's worth of expense related to the branch acquisitions during late August 2015, three new full-service branches opened in 2015 and increased equipment expense related to depreciation and continued maintenance of property and software. The
2015
increase was mainly the result of opening of multiple new bank and mortgage office locations, including two branches via an acquisition.
Professional fees decreased by
$512 thousand
in
2016
and increased by
$995 thousand
in
2015
. The
2016
decrease was related to not having merger and acquisition related activity and $150 thousand related to a commercial lending relationship. The
2015
increase was related mainly to merger and acquisition activity that took place throughout most of
2015
, continued legal matters and the need for additional outside service providers as the Company continues to grow.
Data processing increased by
$1.0 million
in
2016
and
$1.2 million
in
2015
. Both increases were largely driven by overall growth in terms of personnel and office space company-wide and the usage of additional products, services and providers to better serve the client base. Further, the 2016 increase included a $300 thousand core vendor termination fee that was accrued for in September 2016.
Income Taxes
The Company incurred income tax expense of
$6.8 million
and
$3.0 million
in
2016
and
2015
, respectively, and an income tax benefit of
$96 thousand
in
2014
.
The Company’s effective tax rate was
34%
,
31%
and
negative 5%
in
2016
,
2015
and
2014
, respectively. This increase was largely driven by the fluctuation in pre-tax earnings. The Company's effective tax rate is affected by certain permanent tax differences caused by statutory requirements in the tax code. The largest permanent difference relates to tax-exempt interest income related to municipal investments and loans held by the Company. Other, smaller permanent differences arise from income derived from life insurance purchased on certain key employees and directors and meals and entertainment expenses.
Return on Assets
Excluding discontinued operations, the Company’s return on average assets from continuing operations was
0.63%
in
2016
, compared to
0.54%
in
2015
and
0.26%
in
2014
. The increased return in
2016
is a direct result of a
$2.4 million
increase in earnings from continuing operations, while average total assets increased by
$201.6 million
, mainly the result of a
$179.0 million
increase in average total loans. The increased return in
2015
is a direct result of a
$3.9 million
increase in earnings from
48
continuing operations, while average total assets increased by
$189.5 million
, mainly the result of a
$207.8 million
increase in average total loans.
Return on Equity
Excluding discontinued operations, the Company’s return on average stockholders’ equity from continuing operations was
7.30%
in
2016
, compared to
5.89%
in
2015
and
2.57%
in
2014
. The increased return in
2016
is a direct result of a
$2.4 million
increase in earnings, while average equity increased by
$10.8 million
. The increased return in
2015
is a direct result of a
$3.9 million
increase in earnings, while average equity increased by
$8.5 million
.
Overview of the Statement of Condition
The balance sheet did not change significantly from
2015
to
2016
. Loans increased by
$20.7 million
to
$1.1 billion
at
December 31, 2016
. Investment securities increased by
$39.3 million
, deposits increased by
$94.7 million
, which allowed a reduction in borrowings of
$92.3 million
and stockholders’ equity increased by
$30.9 million
.
Cash and Cash Equivalents
Cash and cash equivalents totaled
$17.3 million
at
December 31, 2016
, compared to
$29.1 million
at
December 31, 2015
. During 2016, a deposit reclassification program was implemented and allowed the Company to reduce its requirement of reserve balances on hand in accordance with the Federal Reserve Board the daily Federal Reserve Requirement.
Management believes the current balance of cash and cash equivalents adequately serves the Company’s liquidity and performance needs. Total cash and cash equivalents fluctuate on a daily basis due to transactions in process and other liquidity demands. Management believes liquidity needs are satisfied by the current balance of cash and cash equivalents, readily available access to traditional and non-traditional funding sources, and the portions of the investment and loan portfolios that mature within one year. These sources of funds should enable the Company to meet cash obligations as they come due.
Investment Securities
Prior to the final determination of Basel III, investments were recorded as held-to-maturity due to the uncertainty of the capital treatment of available-for-sale investments. Upon the issuance of the final ruling, the Company opted out of the Other Comprehensive Income treatment of available-for-sale investments permitted under Basel III. Due to the change in capital treatment under the final ruling of Basel III, the Company’s purpose of recording investments as held-to-maturity changed; therefore, during the period ended
March 31, 2016
, the Company reclassified
$52.4 million
of the remaining held-to-maturity investments into available-for-sale investments.
Investment securities totaled
$162.4 million
at
December 31, 2016
, compared to
$123.1 million
at
December 31, 2015
.
|
The following table sets forth a summary of the investment securities portfolio as of the dates indicated. Available for sale securities are reported at estimated fair value:
|
||||||||||||
|
December 31, (Dollars in thousands)
|
2016
|
2015
|
2014
|
|||||||||
|
Available-for-sale securities:
|
||||||||||||
|
U. S. Agency securities
|
$
|
28,816
|
|
$
|
29,351
|
|
$
|
37,534
|
|
|||
|
U.S. Sponsored Mortgage-backed securities
|
54,732
|
|
33,714
|
|
29,932
|
|
||||||
|
Municipal securities
|
70,796
|
|
1,798
|
|
—
|
|
||||||
|
Equity and other securities
|
8,024
|
|
5,393
|
|
747
|
|
||||||
|
Total investment securities available-for-sale
|
$
|
162,368
|
|
$
|
70,256
|
|
$
|
68,213
|
|
|||
|
Held-to-maturity securities:
|
||||||||||||
|
Municipal securities
|
$
|
—
|
|
$
|
52,859
|
|
$
|
54,538
|
|
|||
49
At
December 31, 2016
, investment securities are all available-for-sale. Management believes the available-for-sale classification provides flexibility in terms of managing the portfolio for liquidity, yield enhancement and interest rate risk management opportunities. At
December 31, 2016
, the amortized cost of investment securities totaled
$165.0 million
, resulting in unrealized loss in the investment portfolio of
$2.6 million
. Although these investments show an unrealized loss, management has the intent and ability to hold the investments to maturity and they are all high quality investments with no other than temporary impairment. The municipal securities continue to give the company the ability to pledge and to better the effective tax rate.
The following table shows the maturities for the investment securities portfolio at
December 31, 2016
:
|
Within one year
|
After one year, but within five
|
After five years, but within ten
|
After ten years
|
Total investment securities
|
||||||||||||||||||||||||||||||||
|
(Dollars in thousands)
|
Amortized Cost
|
Weighted Avg. Yield
|
Amortized Cost
|
Weighted Avg. Yield
|
Amortized Cost
|
Weighted Avg. Yield
|
Amortized Cost
|
Weighted Avg. Yield
|
Amortized Cost
|
Fair Value
|
||||||||||||||||||||||||||
|
U. S. Agency securities
|
$
|
—
|
|
—
|
%
|
$
|
8,253
|
|
1.52
|
%
|
$
|
6,530
|
|
1.73
|
%
|
$
|
14,451
|
|
1.70
|
%
|
$
|
29,234
|
|
$
|
28,816
|
|
||||||||||
|
U.S. Sponsored Mortgage-backed securities
|
—
|
|
—
|
|
—
|
|
—
|
|
2,186
|
|
2.12
|
|
53,894
|
|
1.68
|
|
56,080
|
|
54,732
|
|
||||||||||||||||
|
Equity and other securities
|
669
|
|
6.00
|
|
—
|
|
—
|
|
5,500
|
|
6.38
|
|
1,474
|
|
—
|
|
7,643
|
|
8,024
|
|
||||||||||||||||
|
Municipal securities
|
1,077
|
|
1.20
|
|
2,019
|
|
3.70
|
|
6,275
|
|
3.24
|
|
62,704
|
|
2.95
|
|
72,075
|
|
70,796
|
|
||||||||||||||||
|
$
|
1,746
|
|
3.04
|
%
|
$
|
10,272
|
|
1.95
|
%
|
$
|
20,491
|
|
3.48
|
%
|
$
|
132,523
|
|
2.26
|
%
|
$
|
165,032
|
|
$
|
162,368
|
|
|||||||||||
Management monitors the earnings performance and liquidity of the investment portfolio on a regular basis through Asset and Liability Committee (“ALCO”) meetings. The ALCO also monitors net interest income and assists in the management of interest rate risk for the Company. Through active balance sheet management and analysis of the investment securities portfolio, sufficient liquidity is maintained to satisfy depositor requirements and the various credit needs of its customers. Management believes the risk characteristics inherent in the investment portfolio are acceptable based on these parameters.
Loans
The Company’s primary market areas are the Marion, Harrison, Jefferson, Berkeley, Monongalia, and Kanawha counties of West Virginia and Fairfax county of Virginia, with a secondary focus on the adjacent counties. The portfolio consists principally of commercial lending, retail lending, which includes single-family residential mortgages and consumer lending. Loans totaled
$1.1 billion
as of
December 31, 2016
, compared to
$1.0 billion
at
December 31, 2015
.
During
2016
, the Bank experienced loan growth of
$20.7 million
. The growth came in the commercial and non-residential real estate area, which grew approximately
$28.2 million
.
|
Major classification of loans held for investment at December 31, are as follows:
|
||||||||||||||||||||
|
(Dollars in thousands)
|
2016
|
2015
|
2014
|
2013
|
2012
|
|||||||||||||||
|
Commercial and non-residential real estate
|
$
|
757,516
|
|
$
|
729,319
|
|
$
|
560,752
|
|
$
|
457,388
|
|
$
|
299,639
|
|
|||||
|
Residential real estate and home equity
|
280,838
|
|
285,490
|
|
220,442
|
|
146,001
|
|
130,012
|
|
||||||||||
|
Consumer and other
|
14,511
|
|
17,361
|
|
17,103
|
|
18,916
|
|
16,792
|
|
||||||||||
|
Total
|
$
|
1,052,865
|
|
$
|
1,032,170
|
|
$
|
798,297
|
|
$
|
622,305
|
|
$
|
446,443
|
|
|||||
At
December 31, 2016
, commercial loans represented the largest portion of the portfolio approximating
71.9%
of the total loan portfolio. Commercial loans totaled
$757.5 million
at
December 31, 2016
, compared to
$729.3 million
at
December 31, 2015
. Management will continue to focus on the enhancement and growth of the commercial loan portfolio while maintaining appropriate underwriting standards and risk/price balance.
Residential real estate loans to retail customers (including home equity lines of credit) account for the second largest portion of the loan portfolio, comprising
26.7%
of the total loan portfolio. Residential real estate and home equity loans totaled
$280.8
50
million
at
December 31, 2016
, compared to
$285.5 million
at
December 31, 2015
. Included in residential real estate loans are home equity credit lines totaling
$65.4 million
at
December 31, 2016
, compared to
$68.1 million
at
December 31, 2015
. Management believes the home equity loans are competitive products with an acceptable return on investment after risk considerations. Residential real estate lending continues to represent a primary focus due to the lower risk factors associated with this type of loan and the opportunity to provide service to those in the Marion, Harrison, Berkeley, Jefferson, Kanawha and Monongalia County markets, as well as Northern Virginia.
At
December 31, 2016
, consumer loan balances totaled
$14.5 million
compared to
$17.4 million
at
December 31, 2015
. The majority of consumer loans are in the direct lending area. Management is pleased with the performance and quality of the consumer loan portfolio, which can be attributed to the many years of experience of its consumer lenders. This is another important product necessary to serve our market areas.
At
December 31, 2016
, loans identified by management as potential problem loans amounted to
$1.7 million
, which includes two commercial relationships comprised of eight loans in total. These are loans where known information about the borrowers' possible credit problems causes management to have doubts as to the borrowers' ability to comply with the loan repayment terms. However, these loans are sufficiently collateralized and are not believed to present significant risk of loss.
The following table provides additional information about loans:
Loan maturities at
December 31, 2016
:
|
(Dollars in thousands)
|
One Year or Less
|
One Through Five Years
|
Due After Five Years
|
Total
|
||||||||||||
|
Commercial and non-residential real estate
|
$
|
232,796
|
|
$
|
301,027
|
|
$
|
223,693
|
|
$
|
757,516
|
|
||||
|
Residential real estate and home equity
|
119,644
|
|
5,088
|
|
156,106
|
|
280,838
|
|
||||||||
|
Consumer and other
|
2,684
|
|
6,244
|
|
5,583
|
|
14,511
|
|
||||||||
|
Total
|
$
|
355,124
|
|
$
|
312,359
|
|
$
|
385,382
|
|
$
|
1,052,865
|
|
||||
The preceding data has been compiled based upon the earlier of either contractual maturity or next repricing date.
The following table reflects the sensitivity of loans to changes in interest rates as of
December 31, 2016
that mature after one year:
|
(Dollars in thousands)
|
Commercial and Non-Residential Real Estate
|
Residential Real Estate and Home Equity
|
Consumer and Other
|
Total
|
||||||||||||
|
Predetermined fixed interest rate
|
$
|
165,400
|
|
$
|
103,301
|
|
$
|
5,349
|
|
$
|
274,050
|
|
||||
|
Floating or adjustable interest rate
|
359,320
|
|
57,893
|
|
6,478
|
|
423,691
|
|
||||||||
|
Total as of December 31, 2016
|
$
|
524,720
|
|
$
|
161,194
|
|
$
|
11,827
|
|
$
|
697,741
|
|
||||
Loan Concentration
At
December 31, 2016
, commercial loans comprised the largest component of the loan portfolio. A large portion of commercial loans are real estate secured however, they are geographically and industry diverse. Loans that are non-real estate secured are typically secured by accounts receivable, mortgages or equipment. While the loan concentration is in commercial loans, the commercial portfolio is comprised of loans to many different borrowers, in numerous different industries but primarily located in our market areas.
Allowance for Loan Losses
Management continually monitors the risk in the loan portfolio through review of the monthly delinquency reports and the Loan Review Committee. The Loan Review Committee is responsible for the determination of the adequacy of the allowance for loan losses. This analysis involves both experience of the portfolio to date and the makeup of the overall portfolio. Specific loss estimates are derived for individual loans based on specific criteria such as current delinquent status, related deposit account activity, where applicable, and changes in the local and national economy. When appropriate, Management also considers public knowledge and/or verifiable information from the local market to assess risks to specific loans and the loan portfolios as a whole.
51
The result of the evaluation of the adequacy at each period presented herein indicated that the allowance for loan losses was considered adequate to absorb losses inherent in the loan portfolio.
At
December 31, 2016
and
2015
, impaired loans totaled
$12.2 million
and
$15.4 million
respectively. A portion of the allowance for loan losses of
$543 thousand
and
$1.0 million
was allocated to cover any loss in these loans at
December 31, 2016
and
2015
, respectively. Loans past due more than
30 days
were
$7.7 million
and
$18.9 million
, respectively, at
December 31, 2016
and
2015
.
|
December 31,
|
|||||||||
|
2016
|
2015
|
2014
|
|||||||
|
Loans past due more than 30 days to gross loans
|
0.73
|
%
|
1.83
|
%
|
3.33
|
%
|
|||
|
Loans past due more than 90 days to gross loans
|
0.39
|
%
|
0.97
|
%
|
1.14
|
%
|
|||
Net charge-offs of
$2.5 million
in
2016
,
$710 thousand
in
2015
, and
$1.3 million
in
2014
were incurred. The provision for loan losses was
$3.6 million
in
2016
,
$2.5 million
in
2015
, and
$2.6 million
in
2014
. Net charge-offs represented
0.24%
,
0.07%
,
0.16%
,
0.23%
and
0.40%
in
2016
,
2015
,
2014
,
2013
and
2012
, respectively, compared to gross loans for the indicated period.
The following tables reflect the allocation of the allowance for loan losses as of
December 31, 2016
,
2015
,
2014
,
2013
and
2012
:
|
(Dollars in thousands)
|
Commercial and Non-Residential Real Estate
|
Residential Real Estate and Home Equity
|
Consumer and Other
|
Total
|
||||||||||||
|
ALL balance at December 31, 2015
|
$
|
6,066
|
|
$
|
1,810
|
|
$
|
130
|
|
$
|
8,006
|
|
||||
|
Charge-offs
|
(1,995
|
)
|
(224
|
)
|
(338
|
)
|
(2,557
|
)
|
||||||||
|
Recoveries
|
9
|
|
11
|
|
1
|
|
21
|
|
||||||||
|
Provision
|
3,101
|
|
121
|
|
409
|
|
3,631
|
|
||||||||
|
ALL balance at December 31, 2016
|
$
|
7,181
|
|
$
|
1,718
|
|
$
|
202
|
|
$
|
9,101
|
|
||||
|
(Dollars in thousands)
|
Commercial and Non-Residential Real Estate
|
Residential Real Estate and Home Equity
|
Consumer and Other
|
Total
|
||||||||||||
|
ALL balance at December 31, 2014
|
$
|
4,363
|
|
$
|
1,653
|
|
$
|
207
|
|
$
|
6,223
|
|
||||
|
Charge-offs
|
(708
|
)
|
(33
|
)
|
(6
|
)
|
(747
|
)
|
||||||||
|
Recoveries
|
20
|
|
6
|
|
11
|
|
37
|
|
||||||||
|
Provision
|
2,391
|
|
184
|
|
(82
|
)
|
2,493
|
|
||||||||
|
ALL balance at December 31, 2015
|
$
|
6,066
|
|
$
|
1,810
|
|
$
|
130
|
|
$
|
8,006
|
|
||||
|
(Dollars in thousands)
|
Commercial and Non-Residential Real Estate
|
Residential Real Estate and Home Equity
|
Consumer and Other
|
Total
|
||||||||||||
|
ALL balance at December 31, 2013
|
$
|
3,609
|
|
$
|
1,073
|
|
$
|
253
|
|
$
|
4,935
|
|
||||
|
Charge-offs
|
(1,110
|
)
|
(130
|
)
|
(68
|
)
|
(1,308
|
)
|
||||||||
|
Recoveries
|
7
|
|
3
|
|
4
|
|
14
|
|
||||||||
|
Provision
|
1,857
|
|
707
|
|
18
|
|
2,582
|
|
||||||||
|
ALL balance at December 31, 2014
|
$
|
4,363
|
|
$
|
1,653
|
|
$
|
207
|
|
$
|
6,223
|
|
||||
52
|
(Dollars in thousands)
|
Commercial and Non-Residential Real Estate
|
Residential Real Estate and Home Equity
|
Consumer and Other
|
Total
|
||||||||||||
|
ALL balance at December 31, 2012
|
$
|
3,107
|
|
$
|
756
|
|
$
|
213
|
|
$
|
4,076
|
|
||||
|
Charge-offs
|
(1,458
|
)
|
(38
|
)
|
(33
|
)
|
(1,529
|
)
|
||||||||
|
Recoveries
|
57
|
|
70
|
|
1
|
|
128
|
|
||||||||
|
Provision
|
1,903
|
|
285
|
|
72
|
|
2,260
|
|
||||||||
|
ALL balance at December 31, 2013
|
$
|
3,609
|
|
$
|
1,073
|
|
$
|
253
|
|
$
|
4,935
|
|
||||
|
(Dollars in thousands)
|
Commercial and Non-Residential Real Estate
|
Residential Real Estate and Home Equity
|
Consumer and Other
|
Total
|
||||||||||||
|
ALL balance at December 31, 2011
|
$
|
2,164
|
|
$
|
615
|
|
$
|
266
|
|
$
|
3,045
|
|
||||
|
Charge-offs
|
(1,731
|
)
|
(9
|
)
|
(51
|
)
|
(1,791
|
)
|
||||||||
|
Recoveries
|
5
|
|
5
|
|
12
|
|
22
|
|
||||||||
|
Provision
|
2,669
|
|
145
|
|
(14
|
)
|
2,800
|
|
||||||||
|
ALL balance at December 31, 2012
|
$
|
3,107
|
|
$
|
756
|
|
$
|
213
|
|
$
|
4,076
|
|
||||
|
(Dollars in thousands)
|
2016
|
2015
|
2014
|
2013
|
2012
|
||||||||||||||||||||||||||||||
|
December 31,
|
Amount
|
% of loans in each category to total loans
|
Amount
|
% of loans in each category to total loans
|
Amount
|
% of loans in each category to total loans
|
Amount
|
% of loans in each category to total loans
|
Amount
|
% of loans in each category to total loans
|
|||||||||||||||||||||||||
|
Commercial and non-residential real estate
|
$
|
7,181
|
|
72
|
%
|
$
|
6,066
|
|
70
|
%
|
$
|
4,363
|
|
70
|
%
|
$
|
3,609
|
|
74
|
%
|
$
|
3,107
|
|
67
|
%
|
||||||||||
|
Residential real estate and home equity
|
1,718
|
|
27
|
|
1,810
|
|
28
|
|
1,653
|
|
28
|
|
1,073
|
|
23
|
|
756
|
|
29
|
|
|||||||||||||||
|
Consumer and other
|
202
|
|
1
|
|
130
|
|
2
|
|
207
|
|
2
|
|
253
|
|
3
|
|
213
|
|
4
|
|
|||||||||||||||
|
Total
|
$
|
9,101
|
|
100
|
%
|
$
|
8,006
|
|
100
|
%
|
$
|
6,223
|
|
100
|
%
|
$
|
4,935
|
|
100
|
%
|
$
|
4,076
|
|
100
|
%
|
||||||||||
Non-performing assets consist of loans that are no longer accruing interest, loans that have been renegotiated to below market rates based upon financial difficulties of the borrower, and real estate acquired through foreclosure. When interest accruals are suspended, accrued interest income is reversed with current year accruals charged to earnings and prior year amounts generally charged off as a credit loss. When, in management’s judgment, the borrower’s ability to make periodic interest and principal payments resumes and collectability is no longer in doubt, which is evident by the receipt of six consecutive months of regular, on-time payments, the loan is eligible to be returned to accrual status. Interest income on loans would have increased by approximately
$396 thousand
if loans had performed in accordance with their terms.
53
|
Non-performing assets and past due loans:
|
||||||||||||||||||||
|
(Dollars in thousands)
|
2016
|
2015
|
2014
|
2013
|
2012
|
|||||||||||||||
|
Non-accrual loans
|
|
|
|
|
|
|
|
|
|
|
||||||||||
|
Commercial
|
$
|
4,975
|
|
$
|
8,195
|
|
$
|
3,462
|
|
$
|
284
|
|
$
|
3,081
|
|
|||||
|
Real estate and home equity
|
1,176
|
|
839
|
|
487
|
|
29
|
|
43
|
|
||||||||||
|
Consumer and other
|
78
|
|
371
|
|
—
|
|
76
|
|
1
|
|
||||||||||
|
Total non-accrual loans
|
6,229
|
|
9,405
|
|
3,949
|
|
389
|
|
3,125
|
|
||||||||||
|
Accruing loan past due 90 days or more
|
—
|
|
848
|
|
5,306
|
|
460
|
|
329
|
|
||||||||||
|
Total non-performing loans
|
6,229
|
|
10,253
|
|
9,255
|
|
849
|
|
3,454
|
|
||||||||||
|
Other real estate, net
|
414
|
|
239
|
|
575
|
|
375
|
|
207
|
|
||||||||||
|
Total non-performing assets
|
$
|
6,643
|
|
$
|
10,492
|
|
$
|
9,830
|
|
$
|
1,224
|
|
$
|
3,661
|
|
|||||
|
Allowance for loan losses
|
$
|
9,101
|
|
$
|
8,006
|
|
$
|
6,223
|
|
$
|
4,935
|
|
$
|
4,076
|
|
|||||
|
Non-performing loans to gross loans
|
0.59
|
%
|
0.99
|
%
|
1.16
|
%
|
0.14
|
%
|
0.77
|
%
|
||||||||||
|
Allowance for loan losses to non-performing loans
|
146.11
|
%
|
78.08
|
%
|
67.24
|
%
|
581.27
|
%
|
118.01
|
%
|
||||||||||
|
Non-performing assets to total assets
|
0.47
|
%
|
0.76
|
%
|
0.89
|
%
|
0.12
|
%
|
0.50
|
%
|
||||||||||
Impaired loans have decreased by
$3.2 million
, or
21%
, during
2016
, primarily the result of the net impact of
seven
commercial loan relationships. A
$5.0 million
loan to finance commercial real estate property in the Northern Virginia market, which had as primary tenants, government contractors that have vacated the premises as a result of losing significant contracts with the United States government, was purchased from another financial institution in late
2013
. In
2016
, this
$5.0 million
loan was repurchased by the selling financial institution thereby decreasing total impaired loans by
$5.0 million
.
In contrast,
five
of the
seven
relationships generated increases to the impaired loan total since
2015
, the largest of which was a
$950 thousand
commercial real estate loan (net of a
$361 thousand
participation) that was identified as impaired in
2016
as a result of an extended stabilization and interest only period, as well as a lack of project specific cash flows. Charge-offs of
$701 thousand
were incurred on this loan in
2016
. The remaining
four
relationships that generated increases to the impaired loan total included
thirteen
commercial real estate and/or acquisition and development loans that totaled
$3.9 million
as of
December 31, 2016
, a net increase of
$1.2 million
specific to these relationships since
2015
.
The last of the
seven
commercial relationships that contributed to the net decrease in impaired loans since
2015
included two loans that were identified as impaired in
2016
as a result of a decline in the coal industry. In
2016
, these
two
loans, along with a third related loan that was previously impaired, required orderly liquidation of the related collateral, resulting in
$796 thousand
in principal curtailment and a total of partial charge-offs in the amount of
$759 thousand
. The net effect of these seven significant impairment items on the total of impaired loans was
$3.4 million
.
The remaining
$200 thousand
of the net decrease in impaired loans since
December 31, 2015
was the net effect of multiple other factors, including the identification of additional impaired loans, foreclosures, loan sales, payoffs, principal curtailments, partial charge-offs, and normal loan amortization.
Funding Sources
The Bank considers a number of alternatives, including but not limited to deposits, short-term borrowings, and long-term borrowings when evaluating funding sources. Traditional deposits continue to be the most significant source of funds, totaling
$1.1 billion
, or
88.1%
of funding sources at
December 31, 2016
. This same information at
December 31, 2015
reflected
$1.0 billion
in deposits representing
80.6%
of such funding sources. Repurchase agreements, which are available to large corporate customers, represented
2.0%
and
2.2%
of funding sources at
December 31, 2016
and
2015
, respectively. Borrowings represented the remainder of such funding sources.
54
Management continues to emphasize the development of additional noninterest-bearing deposits as a core funding source for MVB. At
December 31, 2016
, noninterest-bearing balances totaled
$115.7 million
compared to
$80.4 million
at
December 31, 2015
or
10.5%
and
7.9%
of total deposits respectively. Interest-bearing deposits totaled
$991.3 million
at
December 31, 2016
, compared to
$931.9 million
at
December 31, 2015
or
89.5%
and
92.1%
of total deposits respectively.
|
(Dollars in thousands)
|
2016
|
2015
|
2014
|
|||||||||
|
Demand deposits of individuals, partnerships, and corporations
|
|
|
|
|
|
|
||||||
|
Noninterest bearing demand
|
$
|
115,692
|
|
$
|
80,423
|
|
$
|
67,066
|
|
|||
|
Interest bearing demand
|
414,031
|
|
473,459
|
|
431,896
|
|
||||||
|
Savings and money markets
|
280,533
|
|
128,622
|
|
87,715
|
|
||||||
|
Time deposits including CDs and IRAs
|
296,761
|
|
329,810
|
|
236,550
|
|
||||||
|
Total deposits
|
$
|
1,107,017
|
|
$
|
1,012,314
|
|
$
|
823,227
|
|
|||
|
Time deposits that meet or exceed the FDIC insurance limit
|
$
|
18,727
|
|
$
|
21,690
|
|
$
|
23,257
|
|
|||
The following table sets forth the average balance and average rate paid on each of the deposit categories for the years ended
December 31, 2016
,
2015
and
2014
:
|
2016
|
2015
|
2014
|
|||||||||||||||||||
|
(Dollars in thousands)
|
Average Balance
|
Average Rate
|
Average Balance
|
Average Rate
|
Average Balance
|
Average Rate
|
|||||||||||||||
|
Noninterest bearing demand deposits
|
$
|
99,826
|
|
|
|
$
|
79,611
|
|
|
|
$
|
60,587
|
|
||||||||
|
Interest-bearing demand deposits:
|
|||||||||||||||||||||
|
NOW
|
454,320
|
|
0.53
|
%
|
446,704
|
|
0.61
|
%
|
402,273
|
|
0.78
|
%
|
|||||||||
|
Money market checking
|
163,630
|
|
0.78
|
%
|
65,306
|
|
0.61
|
%
|
38,332
|
|
0.50
|
%
|
|||||||||
|
Savings
|
43,870
|
|
0.20
|
%
|
39,766
|
|
0.28
|
%
|
37,576
|
|
0.34
|
%
|
|||||||||
|
IRAs
|
16,319
|
|
1.27
|
%
|
12,038
|
|
1.21
|
%
|
9,627
|
|
1.17
|
%
|
|||||||||
|
CDs
|
314,542
|
|
1.19
|
%
|
278,499
|
|
1.03
|
%
|
222,609
|
|
0.89
|
%
|
|||||||||
|
Total interest-bearing deposits
|
992,681
|
|
0.78
|
%
|
842,313
|
|
0.74
|
%
|
710,417
|
|
0.78
|
%
|
|||||||||
|
Total demand deposits
|
$
|
1,092,507
|
|
$
|
921,924
|
|
$
|
771,004
|
|
||||||||||||
Average interest-bearing deposits totaled
$992.7 million
during
2016
compared to
$842.3 million
during
2015
. Average noninterest bearing deposits totaled
$99.8 million
during
2016
compared to
$79.6 million
during
2015
. Management will continue to emphasize deposit gathering in
2017
by offering outstanding customer service and competitively priced products.
|
Maturities of time deposits that meet or exceed the FDIC insurance limit:
|
||||
|
(Dollars in thousands)
|
2016
|
|||
|
Under 3 months
|
$
|
256
|
|
|
|
Over 3-12 months
|
6,902
|
|
||
|
Over 1 to 3 years
|
7,178
|
|
||
|
Over 3 years
|
4,391
|
|
||
|
Total
|
$
|
18,727
|
|
|
Along with traditional deposits, the Bank has access to both short-term borrowings from FHLB and overnight repurchase agreements to fund its operations and investments.
55
|
Short-term borrowings:
|
||||||||||||
|
(Dollars in thousands)
|
2016
|
2015
|
2014
|
|||||||||
|
Balance at end of year
|
$
|
87,733
|
|
$
|
179,917
|
|
$
|
95,829
|
|
|||
|
Average balance during the year
|
137,822
|
|
121,425
|
|
76,185
|
|
||||||
|
Maximum month-end balance
|
210,600
|
|
179,917
|
|
120,229
|
|
||||||
|
Weighted-average rate during the year
|
0.51
|
%
|
0.34
|
%
|
0.27
|
%
|
||||||
|
Weighted-average rate at December 31
|
0.74
|
%
|
0.44
|
%
|
0.32
|
%
|
||||||
|
Repurchase agreements:
|
||||||||||||
|
(Dollars in thousands)
|
2016
|
2015
|
2014
|
|||||||||
|
Balance at end of year
|
$
|
25,160
|
|
$
|
27,437
|
|
$
|
32,673
|
|
|||
|
Average balance during the year
|
27,066
|
|
26,884
|
|
55,731
|
|
||||||
|
Maximum month-end balance
|
29,561
|
|
32,470
|
|
83,781
|
|
||||||
|
Weighted-average rate during the year
|
0.27
|
%
|
0.31
|
%
|
0.52
|
%
|
||||||
|
Weighted-average rate at December 31
|
0.28
|
%
|
0.30
|
%
|
0.35
|
%
|
||||||
|
In addition, the Company holds subordinated debt as follows:
|
||||||||||||
|
(Dollars in thousands)
|
2016
|
2015
|
2014
|
|||||||||
|
Balance at end of year
|
$
|
33,524
|
|
$
|
33,524
|
|
$
|
33,524
|
|
|||
|
Average balance during the year
|
33,524
|
|
33,524
|
|
19,361
|
|
||||||
|
Maximum month-end balance
|
33,524
|
|
33,524
|
|
33,524
|
|
||||||
|
Weighted-average rate during the year
|
6.64
|
%
|
6.57
|
%
|
6.01
|
%
|
||||||
|
Weighted-average rate at December 31
|
6.63
|
%
|
6.57
|
%
|
6.53
|
%
|
||||||
Capital/Stockholders’ Equity
During the year ended
December 31, 2016
, stockholders’ equity increased approximately
$30.9 million
to
$145.6 million
. This increase consists of net income for the year of
$12.9 million
along with dividends paid totaling
$1.8 million
and net proceeds from a common stock issuance totaling
$20.5 million
. Although stockholders’ equity increased as noted above, the equity to assets ratio only increased
1.97%
to
10.26%
due to the increase in total assets during
2016
. The Company paid dividends to common shareholders of
$646 thousand
in
2016
and
$641 thousand
in
2015
and earned
$12.9 million
in
2016
versus
$6.8 million
in
2015
, resulting in the dividend payout ratio decreasing from
9.40%
in
2015
to
5.00%
in
2016
.
At
December 31, 2016
, accumulated other comprehensive loss totaled
$4.3 million
, an increase in the loss of
$1.3 million
from
December 31, 2015
. This change is primarily the result in the rise of the change in the value of the unrealized loss on available for sale securities in large part due to the reclassification of all held-to-maturity investments into available-for-sale investments.
The Company and the Bank are also subject to various regulatory capital requirements administered by the federal banking agencies. Failure to meet minimum capital requirements can initiate certain mandatory, and possibly additional discretionary, actions by regulators that, if undertaken, could have a direct material effect on the Company’s consolidated financial statements. Under capital adequacy guidelines the Company must meet specific capital guidelines that involve quantitative measures of the Company’s assets, liabilities, and certain off-balance sheet items as calculated under regulatory accounting practices. The Company’s capital amounts and classifications are also subject to qualitative judgments by the regulators about components, risk weightings, and other factors. Bank regulators have established “risk-based” capital requirements designed to measure capital adequacy. Risk-based capital ratios reflect the relative risks of various assets companies hold in their portfolios. A weight category of
0%
(lowest risk assets),
20%
,
50%
,
100%
or
150%
(highest risk assets) is assigned to each asset on the balance sheet. Detailed information concerning the Company’s risk-based capital ratios can be found in Note 14, "Regulatory Capital Requirements" of
56
the Notes to the Consolidated Financial Statements included in Item 8, Financial Statements and Supplementary Data, of this Annual Report on Form 10-K; and see also "Supervision and Regulation" in Item 1, Business, of this Annual Report on Form 10-K.
Quantitative measures established by regulation to ensure capital adequacy require the Company to maintain minimum amounts and ratios of Total capital, Tier 1 capital and Tier 1 common equity to risk-weighted assets, and of Tier 1 capital to average assets, as defined. As of
December 31, 2016
and
2015
, the Company meets all capital adequacy requirements to which it is subject.
At
December 31, 2016
, the Company’s consolidated risk-based capital ratios were above the minimum standards for a well capitalized institution. The total risk-based capital ratio of
15.4%
at
December 31, 2016
, is above the well capitalized standard of
10%
. The Tier 1 risk-based capital ratio of
11.9%
also exceeded the well capitalized minimum of
8%
. The common equity tier 1 capital ratio of
10.1%
is above the well capitalized standard of
6.5%
. The leverage ratio at
December 31, 2016
, was
9.5%
and was also above the well capitalized standard of
5%
. Management believes that capital continues to provide a strong base for profitable growth.
Liquidity and Interest Rate Sensitivity
The objective of the asset/liability management function is to structure the balance sheet in ways that maintain consistent growth in net interest income and minimize exposure to market risks within its policy guidelines. This objective is accomplished through management of balance sheet liquidity and interest rate risk exposure based on changes in economic conditions, interest rate levels, and customer preferences. The Company manages balance sheet liquidity through the investment portfolio, sales of commercial and residential real estate loans, and through the utilization of diversified funding sources, including retail deposits, a variety of wholesale funding sources and borrowings through the FHLB. Interest rate risk is managed through the use of interest rate caps, commercial loan swap transactions and interest rate lock commitments on mortgage loans held for sale, as well as the structuring of loan terms that provide cash flows to be consistently re-invested along the rate cycle.
Interest Rate Risk
Our primary market risk is interest rate fluctuation. Interest rate risk results primarily from the traditional banking activities in which the Bank engages, such as gathering deposits and extending loans. Many factors, including economic and financial conditions, movements in interest rates and consumer preferences affect the difference between the interest earned on our assets and the interest paid on liabilities. Our interest rate risk represents the level of exposure we have to fluctuations in interest rates and is primarily measured as the change in earnings and the theoretical market value of equity that results from changes in interest rates. The Asset/Liability Committee (ALCO) oversees our management of interest rate risk. The objective of the management of interest rate risk is to maximize stockholder value, enhance profitability and increase capital, serve customer and community needs, and protect us from any material financial consequences associated with changes in interest rate risk.
Interest rate risk is that risk to earnings or capital arising from movement of interest rates. It arises from differences between the timing of rate changes and the timing of cash flows (repricing risk); from changing rate relationships across yield curves that affect bank activities (basis risk); from changing rate relationships across the spectrum of maturities (yield curve risk); and from interest rate related options embedded in certain bank products (option risk). Changes in interest rates may also affect a bank’s underlying economic value. The value of a bank’s assets, liabilities, and interest-rate related, off-balance sheet contracts is affected by a change in rates because the present value of future cash flows, and in some cases the cash flows themselves, is changed.
We believe that accepting some level of interest rate risk is necessary in order to achieve realistic profit goals. Management and the Board have chosen an interest rate risk profile that is consistent with our strategic business plan.
The Company’s Board of Directors has established a comprehensive interest rate risk management policy, which is administered by our ALCO. The policy establishes limits on risk, which are quantitative measures of the percentage change in net interest income (a measure of net interest income at risk) and the fair value of equity capital (a measure of economic value of equity or “EVE” at risk) resulting from a hypothetical change in interest rates. We measure the potential adverse impacts that changing interest rates may have on our short-term earnings, long-term value, and liquidity by employing simulation analysis through the use of computer modeling. The simulation model captures optionality factors such as call features and interest rate caps and floors embedded in investment and loan portfolio contracts. As with any method of gauging interest rate risk, there are certain shortcomings inherent in the interest rate modeling methodology we employ. When interest rates change, actual movements in different categories of interest-earning assets and interest-bearing liabilities, loan prepayments, and withdrawals of time and other deposits, may deviate significantly from assumptions used in the model. Finally, the methodology does not measure or reflect the impact that higher rates may have on adjustable-rate loan customers’ ability to service their debts, or the impact of rate changes on demand for loan and deposit products.
57
We prepare a base case forecast using Global Insight’s Most Likely rate forecast and alternative simulations reflecting more and less extreme behavior in rates each quarter. The analysis gets presented to the ALCO and the Board of Directors. In addition, more frequent forecasts are produced when interest rates are particularly uncertain, when other business conditions so dictate, or when necessary to model potential balance sheet changes.
The balance sheet is subject to quarterly testing for interest rate shock possibilities to indicate the inherent interest rate risk. Average interest rates are shocked by +/ - 100, 200, 300, and 400 basis points (“bp”). It is our goal to structure the balance sheet so that net interest-earnings at risk over a twelve-month period and the economic value of equity at risk do not exceed policy guidelines at the various interest rate shock levels.
At
December 31, 2016
, we were in an asset sensitive position. Management continuously strives to reduce higher costing fixed rate funding instruments, while increasing assets that are more fluid in their repricing. An asset sensitive position, theoretically, is favorable in a rising rate environment since more assets than liabilities will reprice in a given time frame as interest rates rise. Similarly, a liability sensitive position, theoretically, is favorable in a declining interest rate environment since more liabilities than assets will reprice in a given time frame as interest rates decline. Management works to maintain a consistent spread between yields on assets and costs of deposits and borrowings, regardless of the direction of interest rates.
|
Estimated Changes in Net Interest Income
|
||||||||||||||||||||||||
|
Change in interest rates
|
+400 bp
|
+300 bp
|
+200 bp
|
+100 bp
|
-100 bp
|
-200 bp
|
-300 bp
|
-400 bp
|
||||||||||||||||
|
Policy Limit
|
25.0
|
%
|
20.0
|
%
|
15.0
|
%
|
10.0
|
%
|
10.0
|
%
|
15.0
|
%
|
20.0
|
%
|
25.0
|
%
|
||||||||
|
December 31, 2016
|
16.0
|
%
|
11.2
|
%
|
6.5
|
%
|
3.8
|
%
|
(5.8
|
)%
|
(12.8
|
)%
|
(15.4
|
)%
|
(15.9
|
)%
|
||||||||
|
December 31, 2015
|
(2.7
|
)%
|
2.3
|
%
|
3.8
|
%
|
1.5
|
%
|
(2.0
|
)%
|
(7.1
|
)%
|
(13.9
|
)%
|
n/a
|
|
||||||||
As shown above, measures of net interest income at risk in a rising rate environment were more favorable at
December 31, 2016
than at
December 31, 2015
at all interest rate shock levels and less favorable in a falling rate environment for the same time periods. All measures remained well within prescribed policy limits.
The measures of equity value at risk indicate the ongoing economic value of the Company by considering the effects of changes in interest rates on all of the Company’s cash flows, and by discounting the cash flows to estimate the present value of assets and liabilities. The difference between these discounted values of the assets and liabilities is the economic value of equity, which, in theory, approximates the fair value of the Company’s net assets.
|
Estimated Changes in Economic Value of Equity (EVE)
|
||||||||||||||||||||||||
|
Change in interest rates
|
+400 bp
|
+300 bp
|
+200 bp
|
+100 bp
|
-100 bp
|
-200 bp
|
-300 bp
|
-400 bp
|
||||||||||||||||
|
Policy Limit
|
35.0
|
%
|
25.0
|
%
|
17.0
|
%
|
12.0
|
%
|
12.0
|
%
|
17.0
|
%
|
25.0
|
%
|
35.0
|
%
|
||||||||
|
December 31, 2016
|
6.3
|
%
|
5.7
|
%
|
4.7
|
%
|
3.2
|
%
|
(10.4
|
)%
|
(24.9
|
)%
|
(36.4
|
)%
|
(30.5
|
)%
|
||||||||
|
December 31, 2015
|
(5.2
|
)%
|
1.8
|
%
|
5.7
|
%
|
2.8
|
%
|
(4.6
|
)%
|
(10.2
|
)%
|
(4.3
|
)%
|
n/a
|
|
||||||||
The EVE at risk in down rate scenarios, and most rising rate scenarios, increased at
December 31, 2016
, when compared to
December 31, 2015
. This is due to managing the balance sheet for a rising rate environment, given the unlikely nature of a 100 basis point decline in market rates.
Impact of Inflation and Changing Prices
The consolidated financial statements and related notes have been prepared in accordance with GAAP, which generally requires the measurement of financial position and operating results in terms of historical dollars without consideration for changes in the relative purchasing power of money over time due to inflation. The impact of inflation is reflected in the increased cost of our operations. Unlike industrial companies, our assets and liabilities are primarily monetary in nature. As a result, changes in market interest rates have a greater impact on performance than the effects of inflation.
58
Liquidity
Maintenance of a sufficient level of liquidity is a primary objective of the ALCO. Liquidity, as defined by the ALCO, is the ability to meet anticipated operating cash needs, loan demand, and deposit withdrawals, without incurring a sustained negative impact on net interest income. It is MVB’s policy to manage liquidity so that there is no need to make unplanned sales of assets or to borrow funds under emergency conditions.
The main source of liquidity for the Bank comes through deposit growth. Liquidity is also provided from cash generated from investment maturities, principal payments from loans, and income from loans and investment securities. During the year ended
December 31, 2016
, cash provided by financing activities totaled
$18.9 million
, while outflows from investing activity totaled
$56.0 million
. When appropriate, the Bank has the ability to take advantage of external sources of funds such as advances from the Federal Home Loan Bank (FHLB), national market certificate of deposit issuance programs, the Federal Reserve discount window, brokered deposits and CDARS. These external sources often provide attractive interest rates and flexible maturity dates that enable the Bank to match funding with contractual maturity dates of assets. Securities in the investment portfolio are classified as available-for-sale and can be utilized as an additional source of liquidity.
The Company has an effective shelf registration covering
$75 million
of debt and equity securities, all of which remains available, subject to Board authorization and market conditions, to issue equity or debt securities at our discretion. While we seek to preserve flexibility with respect to cash requirements, there can be no assurance that market conditions would permit us to sell securities on acceptable terms at any given time or at all.
Contractual Obligations
The following table reflects the contractual maturities of our term liabilities as of
December 31, 2016
. The amounts shown do not reflect contractual interest, early withdrawal or prepayment assumptions.
|
(Dollars in thousands)
|
Less than one year
|
One to three years
|
Three to five years
|
More than five years
|
Total
|
|||||||||||||||
|
Certificates of deposit and individual retirement accounts
1
|
$
|
145,152
|
|
$
|
102,829
|
|
$
|
48,780
|
|
$
|
—
|
|
$
|
296,761
|
|
|||||
|
Securities sold under agreement to repurchase
|
25,160
|
|
—
|
|
—
|
|
—
|
|
25,160
|
|
||||||||||
|
Operating leases
|
1,898
|
|
3,368
|
|
869
|
|
5,001
|
|
11,136
|
|
||||||||||
|
FHLB short-term advances
|
87,733
|
|
—
|
|
—
|
|
—
|
|
87,733
|
|
||||||||||
|
FHLB long-term advances
|
615
|
|
166
|
|
90
|
|
2,317
|
|
3,188
|
|
||||||||||
|
Total
|
$
|
260,558
|
|
$
|
106,363
|
|
$
|
49,739
|
|
$
|
7,318
|
|
$
|
423,978
|
|
|||||
1
Certificates of deposit give customers rights to early withdrawal. Early withdrawals may be subject to penalties. The penalty amount depends on the remaining time to maturity at the time of early withdrawal.
Off-Balance Sheet Commitments
The Bank has entered into certain agreements that represent off-balance sheet arrangements that could have a significant impact on the consolidated financial statements and could have a significant impact in future periods. Specifically, the Bank has entered into agreements to extend credit or provide conditional payments pursuant to standby and commercial letters of credit. In addition, the Bank utilizes letters of credit issued by the FHLB to collateralize certain public funds deposits. Further discussion of these agreements, including the amounts outstanding at
December 31, 2016
, is included in Note 7, "Commitments and Contingent Liabilities" of the Notes to the Consolidated Financial Statements included in Item 8, Financial Statements and Supplementary Data, of this Annual Report on Form 10-K.
Commitments to extend credit, including loan commitments, standby letters of credit, and commercial letters of credit do not necessarily represent future cash requirements, in that these commitments often expire without being drawn upon.
Fourth Quarter
Fourth quarter
2016
net income was
$2.3 million
compared to
$1.4 million
in the fourth quarter of
2015
. This equated to basic earnings per share, on a quarterly basis, of
$0.23
in
2016
and
$0.16
in
2015
. Diluted earnings per share for the fourth quarter of
2016
and
2015
were
$0.22
and
$0.15
, respectively. Net interest income increased during the fourth quarter and was
$10.8 million
59
in the fourth quarter of
2016
compared to
$9.9 million
in
2015
. Noninterest income was
$10.1 million
in the fourth quarter of
2016
compared to
$7.1 million
in
2015
. Noninterest expense increased to
$16.8 million
for the fourth quarter of
2016
from
$14.7 million
in
2015
. Loan loss provision was
$657 thousand
for the fourth quarter of
2016
, an increase of
$20 thousand
over the fourth quarter of
2015
.
The commercial and retail banking segment of the Company showed an increase in earnings in the fourth quarter of
2016
by
$727 thousand
from the same period one year prior due mainly to the following items. Net interest margin increased
$1.1 million
due to the Company’s strong balance sheet growth, namely loan growth of
$20.7 million
and deposit growth of
$94.7 million
. Other noninterest expenses increased by
$187 thousand
, mostly the result of: a
$231 thousand
increase in insurance, tax, and assessment expense, a
$225 thousand
increase in salaries and employee benefits, a
$74 thousand
increase in travel, entertainment, dues, and subscriptions, and a
$71 thousand
increase in data processing and communications expense.
Additionally, fourth quarter
2016
income tax expense increased by
$460 thousand
to
$1.3 million
versus the fourth quarter
2015
.
The mortgage segment of the Company showed an increase in fourth quarter earnings of
$122 thousand
as a result of the following items. Mortgage fee income increased by
$3.2 million
as a result of greater fourth quarter volume in
2016
and gain on derivative decreased by
$748 thousand
. Salaries and benefits increased
$2.0 million
as a result of increased commission expense due to greater production volume and the addition of lenders in key markets. In addition, there was an income tax expense increased of
$85 thousand
due to the larger fourth quarter
2016
earnings versus the prior year.
The insurance segment of the Company showed an earnings decrease of
$15 thousand
in the fourth quarter of
2016
compared to the same period in
2015
. Earnings for the fourth quarter of
2016
were
$0
as a result of the sale of the insurance company during the
second quarter of 2016
and the subsequent reorganization as a subsidiary of the Bank.
The financial holding company segment of the company showed an earnings increase of
$71 thousand
in the fourth quarter of
2016
compared to the same period in
2015
. The earnings increase was primarily related to a
$178 thousand
decrease in professional fees and a
$99 thousand
decrease in salaries and employee benefits. Additionally, the fourth quarter income tax benefit decreased
$71 thousand
due to the increase in earnings.
Future Outlook
The Company’s net income from continuing operations increased in
2016
, primarily due to a focus on growing the potential of each segment of the business, with the exception of the insurance segment, which was sold in the second quarter of 2016. The Company has invested in the infrastructure to support envisioned future growth in each key area, including personnel, technology and processes to meet the growing compliance requirements in the industry. Commercial and retail loan production remains strong and mortgage and insurance have added staff and locations to increase production and improve profitability. The Company believes it is well positioned in some of the finest markets in the State of West Virginia and the Commonwealth of Virginia and will focus on doing the things that have made it successful thus far through the following: margin improvement; leveraging capital; organic portfolio loan growth; and operating efficiency. The key challenge for the Company in the future is to attract core deposits to fund growth in the new markets through continued delivery of the most outstanding customer service with the highest quality products and technology.
60
The Company’s market risk is composed primarily of interest rate risk. The Asset and Liability Committee (“ALCO”) is responsible for reviewing the interest rate sensitivity position and establishes policies to monitor and coordinate the Company’s sources, uses, and pricing of funds.
Interest Rate Sensitivity Management
The Company uses a simulation model to analyze, manage and formulate operating strategies that address net interest income sensitivity to movements in interest rates. The simulation model projects net interest income based on various interest rate scenarios over a twenty-four month period. The model is based on the actual maturity and re-pricing characteristics of rate sensitive assets and liabilities. The model incorporates certain assumptions which management believes to be reasonable regarding the impact of changing interest rates and the prepayment assumption of certain assets and liabilities as of
December 31, 2016
. The model assumes changes in interest rates without any management intervention to change the composition of the balance sheet. According to the model run for the period ended
December 31, 2016
, over a twelve-month period, an immediate
100
basis point increase in interest rates would result in an increase in net interest income by
3.8%
. An immediate
200
basis point increase in interest rates would result in an increase in net interest income by
6.5%
. A
100
basis point decrease in interest rates would result in a decrease in net interest income of
5.8%
. While management carefully monitors the exposure to changes in interest rates and takes actions as warranted to decrease any adverse impact, there can be no assurance about the actual effect of interest rate changes on net interest income.
The Company’s net interest income and the fair value of its financial instruments are influenced by changes in the level of interest rates. The Company manages its exposure to fluctuations in interest rates through policies established by its ALCO. The ALCO meets quarterly and has responsibility for formulating and implementing strategies to improve balance sheet positioning and reviewing interest rate sensitivity.
We have counter-party risk which may arise from the possible inability of the Company’s third-party investors to meet the terms of their forward sales contracts. The Company works with third-party investors that are generally well capitalized, are investment grade and exhibit strong financial performance to mitigate this risk. We do not expect any third-party investor to fail to meet its obligation. We monitor the financial condition of these third parties on an annual basis. We do not expect these third parties to fail to meet their obligations.
61
MVB Financial Corp. and Subsidiary
Consolidated Balance Sheets
(Dollars in thousands except per share data)
December 31, 2016
and
2015
|
2016
|
2015
|
||||||
|
ASSETS
|
|||||||
|
Cash and cash equivalents:
|
|||||||
|
Cash and due from banks
|
$
|
14,846
|
|
$
|
14,302
|
|
|
|
Interest bearing balances with banks
|
2,494
|
|
14,831
|
|
|||
|
Total cash and cash equivalents
|
17,340
|
|
29,133
|
|
|||
|
Certificates of deposit with other banks
|
14,527
|
|
13,150
|
|
|||
|
Investment Securities:
|
|||||||
|
Securities available-for-sale
|
162,368
|
|
70,256
|
|
|||
|
Securities held-to-maturity (fair value of $0 for 2016 and $54,470 for 2015)
|
—
|
|
52,859
|
|
|||
|
Loans held for sale
|
90,174
|
|
102,623
|
|
|||
|
Loans:
|
1,052,865
|
|
1,032,170
|
|
|||
|
Less: Allowance for loan losses
|
(9,101
|
)
|
(8,006
|
)
|
|||
|
Net Loans
|
1,043,764
|
|
1,024,164
|
|
|||
|
Premises and equipment
|
25,081
|
|
26,275
|
|
|||
|
Bank owned life insurance
|
22,970
|
|
22,332
|
|
|||
|
Accrued interest receivable and other assets
|
24,100
|
|
25,204
|
|
|||
|
Goodwill
|
18,480
|
|
18,480
|
|
|||
|
TOTAL ASSETS
|
$
|
1,418,804
|
|
$
|
1,384,476
|
|
|
|
LIABILITIES AND STOCKHOLDERS’ EQUITY
|
|||||||
|
Deposits:
|
|||||||
|
Noninterest bearing
|
$
|
115,692
|
|
$
|
80,423
|
|
|
|
Interest bearing
|
991,325
|
|
931,891
|
|
|||
|
Total deposits
|
1,107,017
|
|
1,012,314
|
|
|||
|
Accrued interest payable and other liabilities
|
16,557
|
|
13,291
|
|
|||
|
Repurchase agreements
|
25,160
|
|
27,437
|
|
|||
|
FHLB and other borrowings
|
90,921
|
|
183,198
|
|
|||
|
Subordinated debt
|
33,524
|
|
33,524
|
|
|||
|
Total liabilities
|
1,273,179
|
|
1,269,764
|
|
|||
|
STOCKHOLDERS’ EQUITY
|
|||||||
|
Preferred stock, par value $1,000; 20,000 authorized and 9,283 issued in 2016 and 2015, respectively (See Footnote 12)
|
16,334
|
|
16,334
|
|
|||
|
Common stock, par value $1; 20,000,000 shares authorized; 10,047,621 and 8,112,998 issued; and 9,996,544 and 8,061,921 outstanding in 2016 and 2015, respectively
|
10,048
|
|
8,113
|
|
|||
|
Additional paid-in capital
|
93,412
|
|
74,228
|
|
|||
|
Retained earnings
|
31,192
|
|
20,054
|
|
|||
|
Accumulated other comprehensive loss
|
(4,277
|
)
|
(2,933
|
)
|
|||
|
Treasury Stock, 51,077 shares, at cost
|
(1,084
|
)
|
(1,084
|
)
|
|||
|
Total stockholders’ equity
|
145,625
|
|
114,712
|
|
|||
|
TOTAL LIABILITIES AND STOCKHOLDERS’ EQUITY
|
$
|
1,418,804
|
|
$
|
1,384,476
|
|
|
See Notes to Consolidated Financial Statements
62
MVB Financial Corp. and Subsidiary
Consolidated Statements of Income
(Dollars in thousands except per share data)
Years ended
December 31, 2016
,
2015
and
2014
|
2016
|
2015
|
2014
|
|||||||||
|
INTEREST INCOME
|
|||||||||||
|
Interest and fees on loans
|
$
|
50,018
|
|
$
|
40,642
|
|
$
|
31,949
|
|
||
|
Interest on deposits with other banks
|
322
|
|
274
|
|
223
|
|
|||||
|
Interest on investment securities - taxable
|
1,366
|
|
958
|
|
1,272
|
|
|||||
|
Interest on tax exempt loans and securities
|
2,417
|
|
2,226
|
|
2,724
|
|
|||||
|
Total interest income
|
54,123
|
|
44,100
|
|
36,168
|
|
|||||
|
INTEREST EXPENSE
|
|||||||||||
|
Interest on deposits
|
7,748
|
|
6,246
|
|
5,563
|
|
|||||
|
Interest on repurchase agreements
|
72
|
|
83
|
|
291
|
|
|||||
|
Interest on FHLB and other borrowings
|
1,086
|
|
692
|
|
515
|
|
|||||
|
Interest on subordinated debt
|
2,226
|
|
2,204
|
|
1,142
|
|
|||||
|
Total interest expense
|
11,132
|
|
9,225
|
|
7,511
|
|
|||||
|
NET INTEREST INCOME
|
42,991
|
|
34,875
|
|
28,657
|
|
|||||
|
Provision for loan losses
|
3,632
|
|
2,493
|
|
2,582
|
|
|||||
|
Net interest income after provision for loan losses
|
39,359
|
|
32,382
|
|
26,075
|
|
|||||
|
NONINTEREST INCOME
|
|||||||||||
|
Service charges on deposit accounts
|
764
|
|
646
|
|
677
|
|
|||||
|
Income on bank owned life insurance
|
638
|
|
653
|
|
588
|
|
|||||
|
Visa debit card and interchange income
|
1,185
|
|
987
|
|
778
|
|
|||||
|
Mortgage fee income
|
35,673
|
|
29,472
|
|
17,557
|
|
|||||
|
Gain on sale of portfolio loans
|
1,042
|
|
1,413
|
|
1,550
|
|
|||||
|
Insurance and investment services income
|
420
|
|
338
|
|
328
|
|
|||||
|
Gain on sale of securities
|
1,082
|
|
130
|
|
413
|
|
|||||
|
Gain (loss) on derivatives
|
1,467
|
|
675
|
|
(2
|
)
|
|||||
|
Other operating income
|
934
|
|
641
|
|
133
|
|
|||||
|
Total noninterest income
|
43,205
|
|
34,955
|
|
22,022
|
|
|||||
|
NONINTEREST EXPENSES
|
|||||||||||
|
Salary and employee benefits
|
45,225
|
|
36,073
|
|
27,774
|
|
|||||
|
Occupancy expense
|
3,686
|
|
3,390
|
|
2,704
|
|
|||||
|
Equipment depreciation and maintenance
|
2,452
|
|
2,013
|
|
1,479
|
|
|||||
|
Data processing and communications
|
4,964
|
|
4,010
|
|
2,768
|
|
|||||
|
Mortgage processing
|
3,355
|
|
3,158
|
|
2,514
|
|
|||||
|
Marketing, contributions and sponsorships
|
1,253
|
|
1,352
|
|
1,137
|
|
|||||
|
Professional fees
|
2,720
|
|
3,232
|
|
2,237
|
|
|||||
|
Printing, postage and supplies
|
767
|
|
762
|
|
709
|
|
|||||
|
Insurance, tax and assessment expense
|
1,528
|
|
1,394
|
|
1,478
|
|
|||||
|
Travel, entertainment, dues and subscriptions
|
1,725
|
|
1,579
|
|
1,299
|
|
|||||
|
Other operating expenses
|
1,534
|
|
885
|
|
1,095
|
|
|||||
|
Total noninterest expense
|
69,209
|
|
57,848
|
|
45,194
|
|
|||||
|
Income from continuing operations, before income taxes
|
13,355
|
|
9,489
|
|
2,903
|
|
|||||
|
Income tax expense - continuing operations
|
4,378
|
|
2,886
|
|
248
|
|
|||||
|
Net Income from continuing operations
|
8,977
|
|
6,603
|
|
2,655
|
|
|||||
|
Income (loss) from discontinued operations, before income taxes
|
6,346
|
|
353
|
|
(920
|
)
|
|||||
|
Income tax expense (benefit) - discontinued operations
|
2,411
|
|
140
|
|
(344
|
)
|
|||||
|
Net Income (loss) from discontinued operations
|
3,935
|
|
213
|
|
(576
|
)
|
|||||
|
Net Income
|
$
|
12,912
|
|
$
|
6,816
|
|
$
|
2,079
|
|
||
|
Preferred dividends
|
1,128
|
|
575
|
|
332
|
|
|||||
|
Net Income available to common shareholders
|
$
|
11,784
|
|
$
|
6,241
|
|
$
|
1,747
|
|
||
63
|
Earnings per share from continuing operations - basic
|
$
|
0.96
|
|
$
|
0.75
|
|
$
|
0.29
|
|
||
|
Earnings per share from discontinued operations - basic
|
$
|
0.48
|
|
$
|
0.03
|
|
$
|
(0.07
|
)
|
||
|
Earnings per common shareholder - basic
|
$
|
1.44
|
|
$
|
0.78
|
|
$
|
0.22
|
|
||
|
Earnings per share from continuing operations - diluted
|
$
|
0.92
|
|
$
|
0.74
|
|
$
|
0.29
|
|
||
|
Earnings per share from discontinued operations - diluted
|
$
|
0.39
|
|
$
|
0.03
|
|
$
|
(0.07
|
)
|
||
|
Earnings per common shareholder - diluted
|
$
|
1.31
|
|
$
|
0.77
|
|
$
|
0.22
|
|
||
|
Cash dividends declared
|
$
|
0.08
|
|
$
|
0.08
|
|
$
|
0.08
|
|
||
|
Weighted average shares outstanding - basic
|
8,212,021
|
|
8,014,316
|
|
7,905,468
|
|
|||||
|
Weighted average shares outstanding - diluted
|
10,068,733
|
|
8,140,116
|
|
8,102,117
|
|
|||||
See Notes to Consolidated Financial Statements
64
MVB Financial Corp. and Subsidiary
Consolidated Statements of Comprehensive Income
(Dollars in thousands)
Years ended
December 31, 2016
,
2015
and
2014
|
2016
|
2015
|
2014
|
|||||||||
|
Net Income
|
$
|
12,912
|
|
$
|
6,816
|
|
$
|
2,079
|
|
||
|
Other comprehensive income (loss):
|
|||||||||||
|
Unrealized holding gains (losses) on securities available-for-sale
|
(2,802
|
)
|
202
|
|
2,196
|
|
|||||
|
Unrealized holding gains during the year related to reclassified held-to-maturity securities
|
1,825
|
|
—
|
|
—
|
|
|||||
|
Income tax effect
|
391
|
|
(81
|
)
|
(878
|
)
|
|||||
|
Reclassification adjustment for gain recognized in income
|
(813
|
)
|
(130
|
)
|
(413
|
)
|
|||||
|
Reclassification adjustment for gain recognized in income related to reclassified held-to-maturity securities
|
(269
|
)
|
—
|
|
—
|
|
|||||
|
Income tax effect
|
433
|
|
52
|
|
165
|
|
|||||
|
Change in defined benefit pension plan
|
(181
|
)
|
(556
|
)
|
(1,252
|
)
|
|||||
|
Income tax effect
|
72
|
|
222
|
|
501
|
|
|||||
|
Total other comprehensive income (loss)
|
(1,344
|
)
|
(291
|
)
|
319
|
|
|||||
|
Comprehensive income
|
$
|
11,568
|
|
$
|
6,525
|
|
$
|
2,398
|
|
||
See Notes to Consolidated Financial Statements
65
MVB Financial Corp. and Subsidiary
Consolidated Statements of Changes in Stockholders’ Equity
(Dollars in thousands except per share data)
Years ended
December 31, 2016
,
2015
and
2014
|
|
Preferred Stock
|
Common Stock
|
Additional Paid-in Capital
|
Retained Earnings
|
Accumulated Other Comprehensive (Loss)
|
Treasury Stock
|
Total Stockholders' Equity
|
||||||||||||||||||||
|
Balance December 31, 2013
|
$
|
8,500
|
|
$
|
7,706
|
|
$
|
68,518
|
|
$
|
13,343
|
|
$
|
(2,961
|
)
|
$
|
(1,084
|
)
|
$
|
94,022
|
|
||||||
|
Net Income
|
—
|
|
—
|
|
—
|
|
2,079
|
|
—
|
|
—
|
|
2,079
|
|
|||||||||||||
|
Other comprehensive income
|
—
|
|
—
|
|
—
|
|
—
|
|
319
|
|
—
|
|
319
|
|
|||||||||||||
|
Cash dividends paid ($0.08 per share)
|
—
|
|
—
|
|
—
|
|
(636
|
)
|
—
|
|
—
|
|
(636
|
)
|
|||||||||||||
|
Dividends on preferred stock
|
—
|
|
—
|
|
—
|
|
(332
|
)
|
—
|
|
—
|
|
(332
|
)
|
|||||||||||||
|
Preferred stock issuance
|
7,834
|
|
—
|
|
—
|
|
—
|
|
—
|
|
—
|
|
7,834
|
|
|||||||||||||
|
Common stock issuance, net of issuance costs
|
—
|
|
311
|
|
5,277
|
|
—
|
|
—
|
|
—
|
|
5,588
|
|
|||||||||||||
|
Dividend reinvestment plan proceeds
|
—
|
|
11
|
|
169
|
|
—
|
|
—
|
|
—
|
|
180
|
|
|||||||||||||
|
Stock based compensation
|
—
|
|
—
|
|
321
|
|
—
|
|
—
|
|
—
|
|
321
|
|
|||||||||||||
|
Common stock options exercised
|
—
|
|
6
|
|
57
|
|
—
|
|
—
|
|
—
|
|
63
|
|
|||||||||||||
|
Balance December 31, 2014
|
16,334
|
|
8,034
|
|
74,342
|
|
14,454
|
|
(2,642
|
)
|
(1,084
|
)
|
109,438
|
|
|||||||||||||
|
|
|
||||||||||||||||||||||||||
|
Net Income
|
—
|
|
—
|
|
—
|
|
6,816
|
|
—
|
|
—
|
|
6,816
|
|
|||||||||||||
|
Other comprehensive loss
|
—
|
|
—
|
|
—
|
|
—
|
|
(291
|
)
|
—
|
|
(291
|
)
|
|||||||||||||
|
Cash dividends paid ($0.08 per share)
|
—
|
|
—
|
|
—
|
|
(641
|
)
|
—
|
|
—
|
|
(641
|
)
|
|||||||||||||
|
Dividends on preferred stock
|
—
|
|
—
|
|
—
|
|
(575
|
)
|
—
|
|
—
|
|
(575
|
)
|
|||||||||||||
|
Stock based compensation
|
—
|
|
—
|
|
413
|
|
—
|
|
—
|
|
—
|
|
413
|
|
|||||||||||||
|
Common stock options exercised
|
—
|
|
79
|
|
(527
|
)
|
—
|
|
—
|
|
—
|
|
(448
|
)
|
|||||||||||||
|
Balance December 31, 2015
|
16,334
|
|
8,113
|
|
74,228
|
|
20,054
|
|
(2,933
|
)
|
(1,084
|
)
|
114,712
|
|
|||||||||||||
|
|
|
||||||||||||||||||||||||||
|
Net Income
|
—
|
|
—
|
|
—
|
|
12,912
|
|
—
|
|
—
|
|
12,912
|
|
|||||||||||||
|
Other comprehensive loss
|
—
|
|
—
|
|
—
|
|
—
|
|
(1,344
|
)
|
—
|
|
(1,344
|
)
|
|||||||||||||
|
Cash dividends paid ($0.08 per share)
|
—
|
|
—
|
|
—
|
|
(646
|
)
|
—
|
|
—
|
|
(646
|
)
|
|||||||||||||
|
Dividends on preferred stock
|
—
|
|
—
|
|
—
|
|
(1,128
|
)
|
—
|
|
—
|
|
(1,128
|
)
|
|||||||||||||
|
Common stock issuance, net of issuance costs
|
—
|
|
1,913
|
|
18,606
|
|
—
|
|
—
|
|
—
|
|
20,519
|
|
|||||||||||||
|
Stock based compensation
|
—
|
|
—
|
|
568
|
|
—
|
|
—
|
|
—
|
|
568
|
|
|||||||||||||
|
Common stock options exercised
|
—
|
|
22
|
|
10
|
|
—
|
|
—
|
|
—
|
|
32
|
|
|||||||||||||
|
Balance December 31, 2016
|
$
|
16,334
|
|
$
|
10,048
|
|
93,412
|
|
31,192
|
|
$
|
(4,277
|
)
|
$
|
(1,084
|
)
|
$
|
145,625
|
|
||||||||
See Notes to Consolidated Financial Statements
66
MVB Financial Corp. and Subsidiary
Consolidated Statements of Cash Flows
(Dollars in thousands)
Years ended
December 31, 2016
,
2015
and
2014
|
|
2016
|
2015
|
2014
|
||||||||
|
OPERATING ACTIVITIES
|
|||||||||||
|
Net Income
|
$
|
12,912
|
|
$
|
6,816
|
|
$
|
2,079
|
|
||
|
Adjustments to reconcile net income to net cash provided by (used in) operating activities:
|
|||||||||||
|
Net amortization and accretion of investments
|
1,001
|
|
765
|
|
820
|
|
|||||
|
Net amortization of deferred loan fees
|
55
|
|
203
|
|
405
|
|
|||||
|
Provision for loan losses
|
3,632
|
|
2,493
|
|
2,582
|
|
|||||
|
Depreciation and amortization
|
3,407
|
|
2,908
|
|
1,245
|
|
|||||
|
Stock based compensation
|
568
|
|
413
|
|
321
|
|
|||||
|
Loans originated for sale
|
(1,643,450
|
)
|
(1,341,965
|
)
|
(843,233
|
)
|
|||||
|
Proceeds of loans sold
|
1,691,572
|
|
1,338,341
|
|
881,323
|
|
|||||
|
Mortgage fee income
|
(35,673
|
)
|
(29,472
|
)
|
(17,557
|
)
|
|||||
|
Gain on sale of securities
|
(1,084
|
)
|
(130
|
)
|
(553
|
)
|
|||||
|
Loss on sale of securities
|
2
|
|
—
|
|
140
|
|
|||||
|
Gain on sale of portfolio loans
|
(1,042
|
)
|
(1,413
|
)
|
(702
|
)
|
|||||
|
Gain on sale of subsidiary
|
(6,926
|
)
|
—
|
|
—
|
|
|||||
|
Income on bank owned life insurance
|
(638
|
)
|
(653
|
)
|
(588
|
)
|
|||||
|
Deferred taxes
|
707
|
|
(395
|
)
|
(1,082
|
)
|
|||||
|
Other, net
|
221
|
|
(812
|
)
|
(779
|
)
|
|||||
|
Net cash provided by (used in) operating activities
|
25,264
|
|
(22,901
|
)
|
24,421
|
|
|||||
|
INVESTING ACTIVITIES
|
|||||||||||
|
Purchases of investment securities available-for-sale
|
(114,612
|
)
|
(39,552
|
)
|
(29,573
|
)
|
|||||
|
Purchases of investment securities held-to-maturity
|
—
|
|
(700
|
)
|
(250
|
)
|
|||||
|
Maturities/paydowns of investment securities available-for-sale
|
17,790
|
|
24,412
|
|
8,230
|
|
|||||
|
Maturities/paydowns of investment securities held-to-maturity
|
400
|
|
1,580
|
|
2,000
|
|
|||||
|
Sales of investment securities available-for-sale
|
55,191
|
|
12,912
|
|
61,299
|
|
|||||
|
Sales of investment securities held-to-maturity
|
—
|
|
421
|
|
—
|
|
|||||
|
Purchases of premises and equipment
|
(1,668
|
)
|
(2,153
|
)
|
(9,798
|
)
|
|||||
|
Disposals of premises and equipment from sale of subsidiary
|
581
|
|
—
|
|
—
|
|
|||||
|
Net increase in loans
|
(22,245
|
)
|
(215,173
|
)
|
(176,989
|
)
|
|||||
|
Purchases of restricted bank stock
|
(23,933
|
)
|
(24,344
|
)
|
(13,975
|
)
|
|||||
|
Redemptions of restricted bank stock
|
26,684
|
|
20,972
|
|
15,024
|
|
|||||
|
Proceeds from sale of certificates of deposit with banks
|
6,717
|
|
248
|
|
1,234
|
|
|||||
|
Purchases of certificates of deposit with banks
|
(8,094
|
)
|
(1,491
|
)
|
(3,714
|
)
|
|||||
|
Proceeds from sale of other real estate owned
|
159
|
|
1,132
|
|
76
|
|
|||||
|
Proceeds from sale of subsidiary
|
7,047
|
|
—
|
|
—
|
|
|||||
|
Branch acquisition, net cash acquired
|
—
|
|
48,292
|
|
—
|
|
|||||
|
Purchase of bank owned life insurance
|
—
|
|
—
|
|
(5,000
|
)
|
|||||
|
Net cash used in investing activities
|
(55,983
|
)
|
(173,444
|
)
|
(151,436
|
)
|
|||||
|
FINANCING ACTIVITIES
|
|||||||||||
|
Net increase in deposits
|
94,703
|
|
120,390
|
|
127,416
|
|
|||||
|
Net decrease in repurchase agreements
|
(2,277
|
)
|
(5,236
|
)
|
(48,905
|
)
|
|||||
|
Net change in short-term FHLB borrowings
|
(92,184
|
)
|
84,088
|
|
(2,199
|
)
|
|||||
|
Principal payments on FHLB borrowings
|
(93
|
)
|
(2,177
|
)
|
(1,160
|
)
|
|||||
|
Proceeds from subordinated debt
|
—
|
|
—
|
|
29,400
|
|
|||||
|
Proceeds from stock offering, net of issuance costs
|
20,519
|
|
—
|
|
5,588
|
|
|||||
|
Preferred stock issuance
|
—
|
|
—
|
|
7,834
|
|
|||||
|
Common stock options exercised
|
32
|
|
(448
|
)
|
63
|
|
|||||
|
Dividend reinvestment plan proceeds
|
—
|
|
—
|
|
180
|
|
|||||
|
Cash dividends paid on common stock
|
(646
|
)
|
(641
|
)
|
(636
|
)
|
|||||
|
Cash dividends paid on preferred stock
|
(1,128
|
)
|
(575
|
)
|
(332
|
)
|
|||||
|
Net cash provided by financing activities
|
18,926
|
|
195,401
|
|
117,249
|
|
|||||
|
(Decrease) increase in cash and cash equivalents
|
(11,793
|
)
|
(944
|
)
|
(9,766
|
)
|
|||||
|
Cash and cash equivalents at beginning of period
|
29,133
|
|
30,077
|
|
39,843
|
|
|||||
|
Cash and cash equivalents at end of period
|
$
|
17,340
|
|
$
|
29,133
|
|
$
|
30,077
|
|
||
|
Supplemental disclosure of cash flow information:
|
|||||||||||
|
Loans transferred to other real estate owned
|
$
|
332
|
|
$
|
174
|
|
$
|
346
|
|
||
|
Cashless stock options exercised
|
$
|
16
|
|
$
|
1,180
|
|
$
|
—
|
|
||
|
Cash payments for:
|
|||||||||||
|
Interest on deposits, repurchase agreements and borrowings
|
$
|
10,890
|
|
$
|
11,124
|
|
$
|
8,953
|
|
||
|
Income taxes
|
$
|
6,922
|
|
$
|
2,400
|
|
$
|
1,729
|
|
||
See Notes to Consolidated Financial Statement
s
67
Business and Organization
MVB Financial Corp. was formed on
May 29, 2003
and became a bank holding company under the laws of West Virginia on
January 1, 2004
, and, effective
December 19, 2012
, became a financial holding company. The Company features a subsidiary and multiple affiliated businesses, each of which is described in more detail below, including MVB Bank, Inc. (the "Bank") and its wholly-owned subsidiaries, MVB Mortgage and MVB Insurance, LLC ("MVB Insurance"). On
December 31, 2013
,
three
Company subsidiaries, MVB-Central, Inc. (a second-tier level holding company), MVB-East, Inc. (a second tier holding company) and Bank Compliance Solutions, Inc. (an inactive subsidiary) were merged into the Company.
The Bank was formed on
October 30, 1997
and chartered under the laws of the State of West Virginia. The Bank commenced operations on
January 4, 1999
.
During the fourth quarter of 2012, the Bank acquired Potomac Mortgage Group, Inc. (“PMG” which, following July 15, 2013, began doing business under the registered trade name “MVB Mortgage”), a mortgage company in the northern Virginia area, and
fifty percent
(
50%
) interest in a mortgage services company, Lender Service Provider, LLC (“LSP”). In the third quarter of 2013, this
fifty percent
(
50%
) interest in LSP was reduced to a
twenty-five percent
(
25%
) interest through a sale of a partial interest. MVB Mortgage has
eleven
mortgage only offices, located in Virginia, within the Washington, DC metropolitan area as well as North Carolina and South Carolina, and, in addition, has mortgage loan originators located at select Bank locations throughout West Virginia.
MVB Insurance, LLC was originally formed in
2000
and reinstated in
2005
, as a Bank subsidiary. Effective
June 1, 2013
, MVB Insurance became a direct subsidiary of the Company. MVB Insurance offered select insurance products such as title insurance, individual insurance, commercial insurance, employee benefits insurance, and professional liability insurance. On
June 30, 2016
, the Company entered into an Asset Purchase agreement with USI Insurance Services (“USI”), in which USI purchased substantially all of the assets and assumed certain liabilities of MVB Insurance, which resulted in a pre-tax gain of
$6.9 million
, and was reported in discontinued operations, as discussed in Note 23, "Discontinued Operations" of the Notes to the Consolidated Financial Statements included in Item 8, Financial Statements and Supplementary Data, of this Annual Report on Form 10-K. MVB Insurance retained the assets related to, and continues to operate, its title insurance business. The title insurance business is immaterial in terms of revenue and the Company has reorganized MVB Insurance as a subsidiary of the Bank.
Subsequent to the sale of MVB Insurance, the Company’s primary business activities, through its subsidiary, are currently community banking, and mortgage banking. As a community-based bank, the Bank offers its customers a full range of products through various delivery channels. Such products and services include checking accounts, NOW accounts, money market and savings accounts, time certificates of deposit, commercial, installment, commercial real estate and residential real estate mortgage loans, debit cards, and safe deposit rental facilities. Services are provided through our walk-in offices, automated teller machines (“ATMs”), drive-in facilities, and internet and telephone banking. Additionally, the Bank offers non-deposit investment products through an association with a broker-dealer. Since the opening date of
January 4, 1999
, the Bank has experienced significant growth in assets, loans, and deposits due to strong community and customer support in the Marion County and Harrison County, West Virginia markets, expansion into Jefferson, Berkeley, Monongalia and Kanawha Counties, West Virginia and, most recently, into Fairfax County, Virginia. With the acquisition of PMG, mortgage banking is now a much more significant focus, which has opened increased market opportunities in the Washington, D.C. metropolitan region and added enough volume to further diversify the Company’s revenue stream.
A summary of significant accounting and reporting policies applied in the presentation of the accompanying consolidated financial statements follows:
Basis of Presentation
The financial statements are consolidated to include the accounts of the Company, its subsidiary, MVB Bank, and the Bank's wholly-owned subsidiaries, MVB Mortgage and MVB Insurance. These statements have been prepared in accordance with U.S. generally accepted accounting principles. All significant inter-company accounts and transactions have been eliminated in the consolidated financial statements.
In preparing the consolidated financial statements, management makes estimates and assumptions that affect the reported amounts of assets and liabilities and disclosure of contingent assets and liabilities at the date of the consolidated financial statements and the reported amounts of revenues and expenses for the period. Actual results could differ significantly from those estimates.
68
Material estimates that are particularly susceptible to significant change relate to determination of the allowance for loan losses, derivative instruments, goodwill and deferred tax assets and liabilities.
Operating Segments
An operating segment is defined as a component of an enterprise that engages in business activities that generates revenue and incurs expense, and the operating results of which are reviewed by the chief operating decision maker in the determination of resource allocation and performance. While the Company’s chief decision makers monitor the revenue streams of the various Company’s products and services, operations are managed and financial performance is evaluated on a Company-wide basis. The Company has identified
three
reportable segments: commercial and retail banking; mortgage banking; and financial holding company. Insurance services was previously identified as a reportable segment until entering into an Asset Purchase Agreement, as discussed below and in Note 23, "Discontinued Operations" of the Notes to the Consolidated Financial Statements included in Item 8, Financial Statements and Supplementary Data, of this Annual Report on Form 10-K.
Cash and Cash Equivalents
Cash equivalents include cash on hand, deposits in banks and interest-earning deposits. Interest-earning deposits with original maturities of
90 days
or less are considered cash equivalents. Net cash flows are reported for loans, deposits and short term borrowing transactions.
Management Estimates
The preparation of consolidated financial statements in conformity with U.S. generally accepted accounting principles requires management to make estimates and assumptions that affect the reported amounts of assets and liabilities at the date of the consolidated financial statements and the reported amounts of revenues and expenses during the reporting period. Estimates, such as the allowance for loan losses, are based upon known facts and circumstances. Estimates are revised by management in the period such facts and circumstances change. Actual results could differ from these estimates.
Loans Held for Sale
Through multiple secondary market investors, MVB Mortgage has the ability to offer customers long-term fixed rate and variable rate mortgage products without holding these instruments in the Bank’s loan portfolio. MVB Mortgage elected the fair value option and therefore values loans held for sale at fair value. Occasionally the Bank will sell portfolio loans and have them classified as loans held for sale. These loans are recorded at lower of cost or market.
The Company has a loan indemnification reserve for loans sold that may be subject to repurchase in the event of specific default by the borrower or subsequent discovery that underwriting standards were not met. The reserve amounts were
$200 thousand
and
$150 thousand
respectively as of
December 31, 2016
and
2015
.
Loans and Allowance for Loan Losses
Loans are stated at the amount of unpaid principal reduced by an allowance for loan losses. Loans are considered non-accrual when scheduled principal or interest payments are
90 days
past due. Interest income on loans is recognized on an accrual basis. The allowance for loan losses is maintained at a level deemed adequate to absorb probable losses inherent in the loan portfolio. The Company consistently applies a quarterly loan review process to continually evaluate loans for changes in credit risk. This process serves as the primary means by which the Company evaluates the adequacy of the allowance for loan losses, and is based upon periodic review of the collectability of loans in light of historical experience, the nature and volume of the loan portfolio, adverse situations that may affect the borrower’s ability to repay, estimated value of any underlying collateral and prevailing economic conditions. This evaluation is inherently subjective as it requires estimates that are susceptible to significant revision as more information becomes available.
The allowance consists of specific and general components. The specific component relates to loans that are impaired. The general component covers all loans that are not impaired, and is based upon historical loss experience adjusted for qualitative factors.
The Company allocates the allowance based on the factors described below, which conform to the Company’s loan classification policy. In reviewing risk within the Bank’s loan portfolio, management has determined there to be several different risk categories
69
within the loan portfolio. The allowance for loan losses consists of amounts applicable to: (i) residential real estate loans; (ii) commercial and commercial real estate secured loans; (iii) home equity loans; (iv) consumer and other loans. Factors considered in this process include general loan terms, collateral, and availability of historical data to support the analysis. Historical loss percentages for each loan category are calculated and used as the basis for calculating allowance allocations. Certain qualitative factors are evaluated to determine additional inherent risks in the loan portfolio, which are not necessarily reflected in the historical loss percentages. These factors are then added to the historical allocation percentages to get the adjusted factor to be applied to non-classified loans on a weighted basis, by risk grade. The following qualitative factors are analyzed:
|
•
|
Lending policies and procedures
|
|
•
|
Change in volume and severity of past due loans
|
|
•
|
Nature and volume of the portfolio
|
|
•
|
Experience and ability of management
|
|
•
|
Volume and severity of problem credits
|
|
•
|
Results of loan reviews, audits and exams
|
|
•
|
National, state, regional and local economic trends and business conditions
|
|
◦
|
General economic conditions
|
|
◦
|
Unemployment rates
|
|
◦
|
Inflation / CPI
|
|
◦
|
Changes in values of underlying collateral for collateral-dependent loans
|
|
•
|
Value of underlying collateral
|
|
•
|
Existence and effect of any credit concentrations, and changes in the level of such concentrations
|
The Company analyzes its loan portfolio each quarter to determine the appropriateness of its allowance for loan losses.
A loan that has deteriorated and requires additional collection efforts by the Bank could warrant non-accrual status. A thorough review is presented to the Chief Credit Officer and or the Management Loan Committee ("MLC"), as required with respect to any loan which is in a collection process and to make a determination as to whether the loan should be placed on non-accrual status. The placement of loans on non-accrual status is subject to applicable regulatory restrictions and guidelines. Generally, loans should be placed in non-accrual status when the loan reaches
90 days
past due, when it becomes likely the borrower cannot or will not make scheduled principal or interest payments, when full repayment of principal and interest is not expected, or when the loan displays potential loss characteristics. Normally, all accrued interest is charged off when a loan is placed in non-accrual status, unless Management believes it is likely the accrued interest will be collected. Any payments subsequently received are applied to principal. To remove a loan from non-accrual status, all principal and interest due must be paid up to date and the Bank is reasonably sure of future satisfactory payment performance. Usually, this requires a six-month recent history of payments due. Removal of a loan from non-accrual status requires the approval of the Chief Credit Officer and or MLC.
A loan is considered impaired when, based upon current information and events, it is probable that the Company will be unable to collect the scheduled payments of principal or interest when due according to the contractual terms of the loan agreement. Factors considered by management in determining impairment include payment status, collateral value, and the probability of collecting scheduled principal and interest payments when due. Loans that experience insignificant payment delays and shortages generally are not classified as impaired. Generally, the Company considers impaired loans to include loans classified as non-accrual loans, loans past due for longer than
90 days
and troubled debt restructurings.
The Company defers loan origination and commitment fees and direct loan origination costs and the net amount is amortized as an adjustment of the related loan’s yield.
Troubled Debt Restructurings (TDRs)
A restructuring of debt constitutes a TDR if the creditor for economic or legal reasons related to the debtor’s financial difficulties grants a concession to the debtor that it would not otherwise consider. The determination of whether a concession has been granted includes an evaluation of the debtor’s ability to access funds at a market rate for debt with similar risk characteristics and among other things, the significance of the modification relative to unpaid principal or collateral value of the debt, and/or the significance of a delay in the timing of payments relative to the frequency of payments, original maturity date or the expected duration of the loan. The most common concessions granted generally include one or more modifications to the terms of the debt such as a reduction in the interest rate for the remaining life of the debt, an extension of the maturity date at an interest rate lower than the current market rate for new debt with similar risk, or reduction of the unpaid principal or interest. All TDRs are considered impaired loans.
70
Derivative Instruments
Interest Rate Lock Commitments and Hedges
The Company enters into commitments to originate mortgage loans whereby the interest rate on the loan is determined prior to funding (rate lock commitments). Rate lock commitments on mortgage loans that are intended to be sold are considered to be derivatives. The period of time between issuance of a loan commitment and closing and sale of the loan generally ranges from
30 days
to
120 days
. The Company protects itself from changes in interest rates through the use of best efforts forward delivery commitments, whereby the Company commits to sell a loan at the time the borrower commits to an interest rate with the intent that the buyer has assumed interest rate risk on the loan. As a result, the Company limits the exposure of losses with these arrangements and will not realize significant gains related to its rate lock commitments due to changes in interest rates. The correlation between the rate lock commitments and hedges is very high due to their similarity. The Company also uses mortgage-backed security hedges and pair-offs to mitigate interest rate risk by entering securities and mortgage-backed securities trades with brokers.
The fair value of rate lock commitments and hedges is not readily ascertainable with precision because rate lock commitments and hedges are not actively traded in stand-alone-markets. The Company determines the fair value of rate lock commitments and hedges by measuring the change in the value of the underlying asset while taking into consideration the probability that the rate lock commitments will close. During the
fourth quarter 2014
, management refined their calculation of interest rate locks to include the cost to originate loans, which resulted in a one-time expense of
$706 thousand
. Fair value changes are recorded in noninterest income in the Company’s consolidated statement of income. At
December 31, 2016
and
2015
, the balance of interest rate lock commitments was
$1.5 million
, respectively. There were
no
forward sales commitments as of
December 31, 2016
and
2015
.
Interest Rate Cap
The Company has entered into a rate protection transaction through SMBC Capital Markets, Inc. covering the period
November 26, 2014
through
December 1, 2019
. The notional amount is
$100 million
and
3 month LIBOR
is the underlying rate and the strike price is
3%
. The
5
year coverage is broken into
20
quarterly caps. The Company’s fixed cost in the interest rate cap was
$1.5 million
. The credit support provider must maintain a long-term senior unsecured debt rating of A or better by S&P and A2 or better by Moody’s. The interest rate cap agreement is a free-standing derivative and is recorded at fair value on the Company’s consolidated balance sheet. Fair value changes are recorded in noninterest income in the Company’s consolidated net income statement. At
December 31, 2016
and
2015
, the fair value of the interest rate cap was
$268 thousand
and
$437 thousand
, respectively.
Interest Rate Swap
Beginning in
2015
, the Company entered into interest rate swap agreements to facilitate the risk management strategies of a small number of commercial banking clients. The Company mitigates this risk by entering into equal and offsetting interest rate swap agreements with highly rated third-party financial institutions. The interest rate swap agreements are free-standing derivatives and are recorded at fair value on the Company’s consolidated balance sheet. Fair value changes are recorded in noninterest income in the Company’s consolidated net income statement. At
December 31, 2016
and
2015
, the fair value of interest rate swap agreements was
$250 thousand
and
$405 thousand
, respectively.
Mortgage Servicing Rights
Mortgage servicing rights (MSRs) are recorded when the Bank sells mortgage loans and retains the servicing on those loans. On a monthly basis, MVB tracks the amount of mortgage loans that are sold with servicing retained. A valuation is done to determine the MSR’s value, which is then recorded as an asset and amortized over the period of estimated net servicing revenues. The balance of MSR’s is evaluated for impairment quarterly, and was determined not to be impaired at
December 31, 2016
or
2015
. Servicing loans for others generally consists of collecting mortgage payments from borrowers, maintaining escrow accounts, remitting payments to third party investors and when necessary, foreclosure processing. Serviced loans are not included in the Consolidated Balance Sheets. At
December 31, 2016
and
2015
, the MSR's value was
$190 thousand
and
$956 thousand
, respectively. The amortization taken on the servicing asset for the years ended
December 31, 2016
,
2015
and
2014
was
$1.0 million
,
$915 thousand
and
$574 thousand
, respectively. At
December 31, 2016
and
2015
, total loans serviced for others totaled
$296.4 million
and
$334.5 million
, respectively.
71
Premises and Equipment
Premises and equipment are carried at cost less accumulated depreciation. Depreciation expense is computed for financial reporting by the straight-line-method based on the estimated useful lives of assets, which range from
7
to
40 years
on buildings and leasehold improvements and
3
to
10 years
on furniture, fixtures and equipment.
Intangible Assets and Goodwill
Goodwill is reviewed for potential impairment at least annually at the reporting unit level. In addition to the annual impairment evaluation, the Company evaluates for impairment when events or circumstances indicate that it is more likely than not an impairment loss has occurred. The Company performs its annual impairment test during the fourth quarter. The Company first assesses qualitative factors to determine whether it is necessary to perform the two-step goodwill impairment test discussed below. The Company assesses qualitative factors to determine whether it is more likely than not that the fair value of a reporting unit is less than its carrying amount, including goodwill. Examples of qualitative factors include: economic conditions; industry and market considerations; increases in raw materials, labor, or other costs; overall financial performance such as negative or declining cash flows; relevant entity-specific events such as changes in management, key personnel, strategy, or customers; and regulatory or political developments.
If, based on its assessment of the qualitative factors, the Company determines that it is
not
more likely than not that the fair value of a reporting unit is less than its carrying amount, then the first and second steps of the goodwill impairment test are
not
necessary. If determined to be necessary, a two-step impairment test is performed to identify potential goodwill impairment and measure the amount of a goodwill impairment loss to be recognized (if any). The first step requires the estimation of the reporting unit’s fair value. If the fair value of the reporting unit exceeds the carrying value, including goodwill, no further testing is required. If the carrying value exceeds the fair value, a second step is performed to determine whether an impairment charge must be recorded, and if so, the amount of such change.
The Company’s assessment of qualitative factors determined that it is not more likely than not that the fair value of each reporting unit is less than its carrying amount and therefore, goodwill is not impaired as of
December 31, 2016
and
2015
. As of
December 31, 2016
and
2015
, the Company had goodwill of
$18.5 million
, respectively.
Intangible Assets include core deposit intangibles which are amortized over their useful life of
ten years
using the double-declining balance method. Net core deposit intangibles are included in accrued interest receivable and other assets on the consolidated balance sheet and totaled
$744 thousand
and
$845 thousand
as of
December 31, 2016
and
2015
, respectively.
Restricted Bank Stock
The Bank is a member of the FHLB of Pittsburgh and as such, is required to maintain a minimum investment in stock of the FHLB that varies with the level of advances outstanding with the FHLB. As of
December 31, 2016
and
2015
, the Bank holds
$5.8 million
and
$8.6 million
, respectively. The stock is bought from and sold to the FHLB based upon its
$100
par value. The stock does not have a readily determinable fair value and as such is classified as restricted stock, carried at cost and evaluated by management. The stock’s value is determined by the ultimate recoverability of the par value rather than by recognizing temporary declines. The determination of whether the par value will ultimately be recovered is influenced by criteria such as the following: (a) A significant decline in net assets of the FHLB as compared to the capital stock amount and the length of time this situation has persisted (b) commitments by the FHLB to make payments required by law or regulation and the level of such payments in relation to the operating performance (c) the impact of legislative and regulatory changes on the customer base of the FHLB and (d) the liquidity position of the FHLB. Management evaluated the stock and concluded that the stock was not impaired for the periods presented herein.
Management considered that the FHLB’s regulatory capital ratios have improved in the most recent quarters, liquidity appears adequate, new shares of FHLB stock continue to exchange hands at the
$100
par value and the FHLB has repurchased shares of excess capital stock from its members during
2016
and
2015
and has reinstituted the dividend.
72
Foreclosed Assets Held for Resale
Foreclosed assets held for resale acquired in satisfaction of mortgage obligations and in foreclosure proceedings are recorded at fair value less estimated selling costs at the time of foreclosure, with any valuation adjustments charged to the allowance for loan losses. Any gains or losses on sale are then recorded in other noninterest expense. At
December 31, 2016
and
2015
, the Company held other real estate of
$414 thousand
and
$239 thousand
.
Bank-Owned Life Insurance
Bank-owned life insurance (“BOLI”) represents life insurance on the lives of certain Company employees who have provided positive consent allowing the Company to be the beneficiary of such policies. These policies are recorded at their cash surrender value, or the amount that can be realized upon surrender of the policy. Income from these policies is not subject to income taxes and is recorded as noninterest income.
Income Taxes
The Company and the Bank file a consolidated federal income tax return. Deferred tax assets and liabilities are computed based on the difference between the financial statement basis and income tax basis of assets and liabilities using the enacted marginal tax rates. Deferred income tax expenses or benefits are based on the changes in the net deferred tax asset or liability from period to period.
Stock Based Compensation
Compensation cost is recognized for stock options issued to employees, based on the fair value of these awards at the date of grant. A Black-Scholes model is utilized to estimate the fair value of stock options. Compensation cost is recognized over the required service period, generally defined as the vesting period. For awards with graded vesting, compensation cost is recognized on a straight-line basis over the requisite service period for the entire award.
Earnings Per Share
The Company determines basic earnings per share by dividing net income less preferred stock dividends by the weighted average number of common shares outstanding during the period. Diluted earnings per share is determined by dividing net income less dividends on convertible preferred stock plus interest on convertible subordinated debt by the weighted average number of shares outstanding increased by both the number of shares that would be issued assuming the exercise of stock options under the Company’s 2003 and 2013 Stock Incentive Plans and the conversion of preferred stock and subordinated debt if dilutive.
Prior year dilutive earnings per share has been modified with the calculation of continuing and discontinued operations to use the denominator of shares from continuing operations for continuing, discontinuing, and total earnings per share. The subordinated debt was considered anti-dilutive for continuing operations and excluded from the calculation for year ending December 31, 2015. This changed the reported prior year earnings per share.
73
|
For the years ended
|
||||||||||||
|
December 31,
|
||||||||||||
|
(Dollars in thousands except shares and per share data)
|
2016
|
2015
|
2014
|
|||||||||
|
Numerator for basic earnings per share:
|
||||||||||||
|
Net Income from continuing operations
|
$
|
8,977
|
|
$
|
6,603
|
|
$
|
2,655
|
|
|||
|
Less: Dividends on preferred stock
|
1,128
|
|
575
|
|
332
|
|
||||||
|
Net Income from continuing operations available to common shareholders - basic
|
7,849
|
|
6,028
|
|
2,323
|
|
||||||
|
Net Income from discontinued operations available to common shareholders - basic and diluted
|
3,935
|
|
213
|
|
(576
|
)
|
||||||
|
Net Income available to common shareholders
|
$
|
11,784
|
|
$
|
6,241
|
|
$
|
1,747
|
|
|||
|
Numerator for diluted earnings per share:
|
||||||||||||
|
Net Income from continuing operations available to common shareholders - basic
|
$
|
7,849
|
|
$
|
6,028
|
|
$
|
2,323
|
|
|||
|
Add: Dividends on preferred stock
|
—
|
|
—
|
|
—
|
|
||||||
|
Add: Interest on subordinated debt (tax effected)
|
1,390
|
|
—
|
|
—
|
|
||||||
|
Net Income available to common shareholders from continuing operations - diluted
|
$
|
9,239
|
|
$
|
6,028
|
|
$
|
2,323
|
|
|||
|
Denominator:
|
||||||||||||
|
Total average shares outstanding
|
8,212,021
|
|
8,014,316
|
|
7,905,468
|
|
||||||
|
Effect of dilutive convertible preferred stock
|
—
|
|
—
|
|
—
|
|
||||||
|
Effect of dilutive convertible subordinated debt
|
1,837,500
|
|
—
|
|
—
|
|
||||||
|
Effect of dilutive stock options
|
19,212
|
|
125,800
|
|
196,649
|
|
||||||
|
Total diluted average shares outstanding
|
10,068,733
|
|
8,140,116
|
|
8,102,117
|
|
||||||
|
Earnings per share from continuing operations - basic
|
$
|
0.96
|
|
$
|
0.75
|
|
$
|
0.29
|
|
|||
|
Earnings per share from discontinued operations - basic
|
$
|
0.48
|
|
$
|
0.03
|
|
$
|
(0.07
|
)
|
|||
|
Earnings per common shareholder - basic
|
$
|
1.44
|
|
$
|
0.78
|
|
$
|
0.22
|
|
|||
|
Earnings per share from continuing operations - diluted
|
$
|
0.92
|
|
$
|
0.74
|
|
$
|
0.29
|
|
|||
|
Earnings per share from discontinued operations - diluted
|
$
|
0.39
|
|
$
|
0.03
|
|
$
|
(0.07
|
)
|
|||
|
Earnings per common shareholder - diluted
|
$
|
1.31
|
|
$
|
0.77
|
|
$
|
0.22
|
|
|||
Comprehensive Income
Accounting principles generally require that recognized revenue, expenses, gains and losses be included in net income. Although certain changes in assets and liabilities, such as unrealized gains and losses on available-for-sale securities and minimum pension liability, are reported as a separate component of the equity section of the Consolidated Balance Sheet, such items, along with net income, are components of comprehensive income.
Marketing Costs
Marketing costs are expensed as incurred. Marketing expense was
$1.3 million
,
$1.4 million
and
$1.1 million
for
2016
,
2015
and
2014
, respectively.
Transfers of Financial Assets
Transfers of financial assets are accounted for as sales when control over the assets has been surrendered. Control over transferred assets is deemed to be surrendered when (i) the assets have been isolated from the company, (ii) the transferee obtains the right (free of conditions that constrain it from taking advantage of that right) to pledge or exchange the transferred assets, and (iii) the
74
Company does not maintain effective control over the transferred assets through an agreement to repurchase them before their maturity.
Reclassifications
Certain amounts in the
2015
and
2014
consolidated financial statements have been reclassified to conform to the
2016
financial statement presentation.
Recent Accounting Pronouncements
In December 2016, the Financial Accounting Standards Board ("FASB") issued Accounting Standards Update ("ASU") 2016-20,
Technical Corrections and Improvements to Topic 606, Revenue from Contracts with Customers
. The amendments in this ASU cover a variety of Topics in the Codification related to the new revenue recognition standard (ASU 2014-09) and represent changes to make minor corrections or minor improvements to the Codification that are not expected to have a significant impact on current accounting practice or create a significant administrative cost to most entities. For public companies, this update will be effective for fiscal years beginning after December 15, 2017, including all interim periods within those fiscal years. The adoption of this guidance is not expected to be material to the consolidated financial statements.
In December 2016, the FASB issued ASU 2016-19,
Technical Corrections and Improvements.
The amendments in this ASU cover a wide range of Topics in the Codification and represent changes to make corrections or improvements to the Codification that are not expected to have a significant effect on current accounting practice or create a significant administrative cost to most entities. For public companies, this update will be effective for fiscal years beginning after December 15, 2016, including all interim periods within those fiscal years. Early application is permitted. The adoption of this guidance will not have a material impact on the Company's consolidated financial statements.
In November 2016, the FASB issued ASU 2016-18,
Statement of Cash Flows (Topic 230): Restricted Cash (a consensus of the FASB Emerging Issues Task Force).
The new guidance clarifies the classification within the statement of cash flows for certain transactions, including debt extinguishment costs, zero-coupon debt, contingent consideration related to business combinations, insurance proceeds, equity method distributions and beneficial interests in securitizations. The guidance also clarifies that cash flows with aspects of multiple classes of cash flows or that cannot be separated by source or use should be classified based on the activity that is likely to be the predominant source or use of cash flows for the item. This guidance is effective for fiscal years beginning after December 15, 2017 and interim periods within those fiscal years. The adoption of this guidance will not have a material impact on the Company's consolidated financial statements.
In October 2016, the FASB issued ASU 2016-17,
Consolidation (Topic 810): Interests Held through Related Parties That Are under Common Control.
The new guidance changes the accounting for the consolidation of VIEs in certain situations involving entities under common control. Specifically, the amendments change how the indirect interests held through related parties that are under common control should be included in a reporting entity’s evaluation of whether it is a primary beneficiary of a VIE. Under the amended guidance, the reporting entity is only required to include the indirect interests held through related parties that are under common control in a VIE on a proportionate basis. Currently, the indirect interests held by the related parties that are under common control are considered to be the equivalent of direct interests in their entirety. This guidance is effective for fiscal years beginning after December 15, 2016 and interim periods within those fiscal years. The adoption of this guidance will not have a material impact on the Company's consolidated financial statements.
In October 2016, the FASB issued ASU 2016-16,
Income Taxes (Topic 740): Intra-Entity Transfers of Assets Other Than Inventory.
This new guidance requires an entity to recognize the income tax consequences of an intra-entity transfer of an asset other than inventory when the transfer occurs. Current U.S. GAAP prohibits the recognition of current and deferred income taxes for an intra-entity asset transfer until the asset has been sold to an outside party. This guidance is effective for fiscal years beginning after December 15, 2017 and interim periods within those fiscal years. The adoption of this guidance will not have a material impact on the Company's consolidated financial statements.
In August 2016, the FASB issued ASU 2016-15,
Statement of Cash Flows (Topic 230): Classification of Certain Cash Receipts and Cash Payments
. This new guidance clarifies the guidance for classification of certain cash receipts and payments within an entity’s statements of cash flows. These items include debt prepayment or extinguishment costs, settlement of zero-coupon debt instruments, contingent consideration payments made after a business combination, proceeds from the settlement of insurance claims, proceeds from the settlement of BOLI policies, distributions received from equity method investees, and beneficial interests in securitization transactions. The amended guidance also specifies how to address classification of cash receipts and payments that have aspects of more than one class of cash flows. This guidances is effective for fiscal years beginning after
75
December 15, 2017 and interim periods within those fiscal years. The adoption of this guidance will not have a material impact on the Company's consolidated financial statements.
In June 2016, the FASB issued ASU 2016-13,
Financial Instruments-Credit Losses (Topic 326): Measurement of Credit Losses on Financial Instruments
. The new guidance replaces the incurred loss impairment methodology in current GAAP with an expected credit loss methodology and requires consideration of a broader range of information to determine credit loss estimates. Financial assets measured at amortized cost will be presented at the net amount expected to be collected by using an allowance for credit losses. Purchased credit impaired loans will receive an allowance account at the acquisition date that represents a component of the purchase price allocation. Credit losses relating to available-for-sale debt securities will be recorded through an allowance for credit losses, with such allowance limited to the amount by which fair value is below amortized cost. The guidance is effective for fiscal years beginning after December 15, 2019 and interim periods within those fiscal years. The Company's project management team and MLC are in the process of developing an understanding of this pronouncement, evaluating the impact of this pronouncement and researching additional software resources that could assist with the implementation.
In March 2016, the FASB issued ASU 2016-09,
Compensation – Stock Compensation (Topic 718): Improvements to Employee Share-Based Payment Accounting.
The new guidance eliminates the concept of APIC pools for stock-based awards and requires that the related excess tax benefits and tax deficiencies be classified as an operating activity in the statement of cash flows. The new guidance also allows entities to make a one-time policy election to account for forfeitures when they occur, instead of accruing compensation cost based on the number of awards expected to vest. Additionally, the new guidance changes the requirement for an award to qualify for equity classification by permitting tax withholding up to the maximum statutory tax rate instead of the minimum statutory tax rate. The new guidance is effective for annual periods beginning after December 15, 2016 and interim periods within those annual periods. The adoption of this guidance did not have a material impact on the Company's consolidated financial statements.
In February 2016, the FASB issued ASU 2016-02,
Leases (Topic 842)
. Among other things, in the amendments in ASU 2016-02, lessees will be required to recognize the following for all leases (with the exception of short-term leases) at the commencement date: (1) A lease liability, which is a lessee‘s obligation to make lease payments arising from a lease, measured on a discounted basis; and (2) A right-of-use asset, which is an asset that represents the lessee’s right to use, or control the use of, a specified asset for the lease term. Under the new guidance, lessor accounting is largely unchanged. Certain targeted improvements were made to align, where necessary, lessor accounting with the lessee accounting model and Topic 606, Revenue from Contracts with Customers. The amendments in this ASU are effective for fiscal years beginning after December 15, 2018, including interim periods within those fiscal years. Early application is permitted upon issuance. Lessees (for capital and operating leases) and lessors (for sales-type, direct financing and operating leases) must apply a modified retrospective transition approach for leases existing at, or entered into after, the beginning of the earliest comparative period presented in the financial statements. The modified retrospective approach would not require any transition accounting for leases that expired before the earliest comparative period presented. Lessees and lessors may not apply a full retrospective transition approach. While we are currently evaluating the impact of the new standard, we expect an increase to the Consolidated Balance Sheets for right-of-use assets and associated lease liabilities, as well as resulting depreciation expense of the right-of-use assets and interest expense of the lease liabilities in the Consolidated Statements of Income, for arrangements previously accounted for as operating leases.
In January 2016, the FASB issued ASU 2016-01, Accounting for Financial Instruments - Overall: Classification and Measurement (Subtopic 825-10). Amendments within ASU 2016-01 that relate to non-public entities have been excluded from this presentation. The amendments in this ASU 2016-01 address the following: 1) require equity investments to be measured at fair value with changes in fair value recognized in net income; 2) simplify the impairment assessment of equity investments without readily-determinable fair values by requiring a qualitative assessment to identify impairment; 3) eliminate the requirement to disclose the method(s) and significant assumptions used to estimate the fair value that is required to be disclosed for financial instruments measured at amortized cost on the balance sheet; 4) require entities to use the exit price notion when measuring the fair value of financial instruments for disclosure purposes; 5) require separate presentation in other comprehensive income for the portion of the total change in the fair value of a liability resulting from a change in the instrument-specific credit risk when the entity has elected to measure the liability at fair value in accordance with the fair value option for financial instruments; 6) require separate presentation of financial assets and financial liabilities by measurement category and form of financial asset (that is, securities or loans and receivables) on the balance sheet or the accompanying notes to the financial statements; and 7) clarify that an entity should evaluate the need for a valuation allowance on a deferred tax asset related to available-for-sale securities in combination with the entity's other deferred tax assets. The amendments are effective for public business entities for fiscal years beginning after December 15, 2017, and interim periods within those fiscal years. The Company is currently evaluating the provisions of this amendment to determine the potential impact the new standard will have on the Company's consolidated financial statements as it relates to accounting for financial instruments. The Company is currently
76
evaluating the provisions of this amendment to determine the potential impact the new standard will have on the Company's consolidated financial statements as it relates to accounting for financial instruments.
In September 2015, the FASB issued ASU 2015-16,
Business Combinations (Topic 805): Simplifying the Accounting for Measurement-Period Adjustments
. The new guidance requires that adjustments to provisional amounts identified during the measurement period of a business combination be recognized in the reporting period in which the adjustment amounts are determined. Furthermore, the income statement effects of such adjustments, if any, must be calculated as if the accounting had been completed at the acquisition date reflecting the portion of the amount recorded in current-period earnings that would have been recorded in previous reporting periods if the adjustment to the provisional amounts had been recognized as of the acquisition date. Under previous guidance, adjustments to provisional amounts identified during the measurement period are to be recognized retrospectively. ASU 2015-16 was effective for us on January 1, 2016 and did not have a significant impact on our consolidated financial statements.
In February 2015, the FASB issued ASU 2015-02,
Consolidation (Topic 810): Amendments to the Consolidation Analysis
. The amendments modify the evaluation reporting organizations must perform to determine if certain legal entities should be consolidated as VIEs. Specifically, the amendments: (1) Modify the evaluation of whether limited partnerships and similar legal entities are variable interest entities (“VIEs”) or voting interest entities; (2) Eliminate the presumption that a general partner should consolidate a limited partnership; (3) Affect the consolidation analysis of reporting entities that are involved with VIEs, particularly those that have fee arrangements and related party relationships; and (4) Provide a scope exception from consolidation guidance for reporting entities with interests in legal entities that are required to comply with or operate in accordance with requirements that are similar to those in Rule 2a-7 of the Investment Company Act of 1940 for registered money market funds. ASU 2015-02 was effective for us on January 1, 2016 and did not have a significant impact on the Company's consolidated financial statements.
Prior to the final determination of Basel III, investments were recorded as held-to-maturity due to the uncertainty of the capital treatment of available-for-sale investments. Upon the issuance of the final ruling, the Company opted out of the Other Comprehensive Income treatment of available-for-sale investments permitted under Basel III. Due to the change in capital treatment under the final ruling of Basel III, the Company’s purpose of recording investments as held-to-maturity changed; therefore, during the period ended
March 31, 2016
, the Company reclassified
$52.4 million
, with unrealized holding gains of
$1.8 million
, of the remaining held-to-maturity investments into available-for-sale investments.
There were
no
held-to-maturity securities at
December 31, 2016
.
Amortized cost and fair values of investment securities held-to-maturity at
December 31, 2015
including gross unrealized gains and losses, are summarized as follows:
|
(Dollars in thousands)
|
Amortized Cost
|
Unrealized Gain
|
Unrealized Loss
|
Fair Value
|
||||||||||||
|
Municipal securities
|
$
|
52,859
|
|
$
|
1,699
|
|
$
|
(88
|
)
|
$
|
54,470
|
|
||||
|
Total investment securities held-to-maturity
|
$
|
52,859
|
|
$
|
1,699
|
|
$
|
(88
|
)
|
$
|
54,470
|
|
||||
Amortized cost and fair values of investment securities available-for-sale at
December 31, 2016
are summarized as follows:
|
(Dollars in thousands)
|
Amortized Cost
|
Unrealized Gain
|
Unrealized Loss
|
Fair Value
|
||||||||||||
|
U. S. Agency securities
|
$
|
29,234
|
|
$
|
7
|
|
$
|
(425
|
)
|
$
|
28,816
|
|
||||
|
U.S. Sponsored Mortgage-backed securities
|
56,080
|
|
14
|
|
(1,362
|
)
|
54,732
|
|
||||||||
|
Municipal securities
|
72,075
|
|
744
|
|
(2,023
|
)
|
70,796
|
|
||||||||
|
Total debt securities
|
157,389
|
|
765
|
|
(3,810
|
)
|
154,344
|
|
||||||||
|
Equity and other securities
|
7,643
|
|
381
|
|
—
|
|
8,024
|
|
||||||||
|
Total investment securities available-for-sale
|
$
|
165,032
|
|
$
|
1,146
|
|
$
|
(3,810
|
)
|
$
|
162,368
|
|
||||
77
Amortized cost and fair values of investment securities available-for-sale at
December 31, 2015
are summarized as follows:
|
(Dollars in thousands)
|
Amortized Cost
|
Unrealized Gain
|
Unrealized Loss
|
Fair Value
|
||||||||||||
|
U. S. Agency securities
|
$
|
29,532
|
|
$
|
—
|
|
$
|
(181
|
)
|
$
|
29,351
|
|
||||
|
U.S. Sponsored Mortgage-backed securities
|
34,246
|
|
1
|
|
(533
|
)
|
33,714
|
|
||||||||
|
Municipal securities
|
1,775
|
|
23
|
|
—
|
|
1,798
|
|
||||||||
|
Total debt securities
|
65,553
|
|
24
|
|
(714
|
)
|
64,863
|
|
||||||||
|
Equity and other securities
|
5,309
|
|
95
|
|
(11
|
)
|
5,393
|
|
||||||||
|
Total investment securities available-for-sale
|
$
|
70,862
|
|
$
|
119
|
|
$
|
(725
|
)
|
$
|
70,256
|
|
||||
|
The following table summarizes amortized cost and fair values of debt securities by maturity:
|
||||||||
|
December 31, 2016
|
||||||||
|
Available for sale
|
||||||||
|
(Dollars in thousands)
|
Amortized Cost
|
Fair Value
|
||||||
|
Within one year
|
$
|
1,277
|
|
$
|
1,280
|
|
||
|
After one year, but within five
|
11,176
|
|
11,244
|
|
||||
|
After five years, but within ten
|
14,666
|
|
14,487
|
|
||||
|
After ten Years
|
130,270
|
|
127,333
|
|
||||
|
Total
|
$
|
157,389
|
|
$
|
154,344
|
|
||
Investment securities with a carrying value of
$82.7 million
and
$106.4 million
at
December 31, 2016
and
2015
, respectively, were pledged to secure public funds, repurchase agreements and potential borrowings at the Federal Reserve discount window.
The Company’s investment portfolio includes securities that are in an unrealized loss position as of
December 31, 2016
, the details of which are included in the following table. Although these securities, if sold at
December 31, 2016
would result in a pretax loss of
$3.8 million
, the Company has no intent to sell the applicable securities at such fair values, and maintains the Company has the ability to hold these securities until all principal has been recovered. It is not more likely than not the Company would sell any securities at a loss for liquidity purposes. Declines in the fair values of these securities can be traced to general market conditions which reflect the prospect for the economy as a whole. When determining other-than-temporary impairment on securities, the Company considers such factors as adverse conditions specifically related to a certain security or to specific conditions in an industry or geographic area, the time frame securities have been in an unrealized loss position, the Company’s ability to hold the security for a period of time sufficient to allow for anticipated recovery in value, whether or not the security has been downgraded by a rating agency, and whether or not the financial condition of the security issuer has severely deteriorated. As of
December 31, 2016
, the Company considers all securities with unrealized loss positions to be temporarily impaired, and consequently, does not believe the Company will sustain any material realized losses as a result of the current temporary decline in fair value.
The following table discloses investments in an unrealized loss position at
December 31, 2016
:
|
(Dollars in thousands)
|
Less than 12 months
|
12 months or more
|
||||||||||||||
|
Description and number of positions
|
Fair Value
|
Unrealized Loss
|
Fair Value
|
Unrealized Loss
|
||||||||||||
|
U.S. Agency securities (16)
|
$
|
28,814
|
|
$
|
(425
|
)
|
$
|
—
|
|
$
|
—
|
|
||||
|
U.S. Sponsored Mortgage-backed securities (29)
|
33,209
|
|
(1,040
|
)
|
13,919
|
|
(322
|
)
|
||||||||
|
Municipal securities (86)
|
42,727
|
|
(2,023
|
)
|
—
|
|
—
|
|
||||||||
|
$
|
104,750
|
|
$
|
(3,488
|
)
|
$
|
13,919
|
|
$
|
(322
|
)
|
|||||
78
The following table discloses investments in an unrealized loss position at
December 31, 2015
:
|
(Dollars in thousands)
|
Less than 12 months
|
12 months or more
|
||||||||||||||
|
Description and number of positions
|
Fair Value
|
Unrealized Loss
|
Fair Value
|
Unrealized Loss
|
||||||||||||
|
U.S. Agency securities (9)
|
$
|
28,351
|
|
$
|
(181
|
)
|
$
|
—
|
|
$
|
—
|
|
||||
|
U.S. Sponsored Mortgage-backed securities (19)
|
20,647
|
|
(233
|
)
|
11,862
|
|
(300
|
)
|
||||||||
|
Municipal securities (22)
|
3,827
|
|
(32
|
)
|
5,559
|
|
(56
|
)
|
||||||||
|
Equity and other securities (1)
|
2,489
|
|
(11
|
)
|
—
|
|
—
|
|
||||||||
|
$
|
55,314
|
|
$
|
(457
|
)
|
$
|
17,421
|
|
$
|
(356
|
)
|
|||||
The Company sold investments available-for-sale of
$55.2 million
,
$12.9 million
and
$61.3 million
in
2016
,
2015
and
2014
, respectively. These sales resulted in gross gains of
$1.1 million
,
$125 thousand
and
$553 thousand
and gross losses of
$2 thousand
,
$0
, and
$140 thousand
in
2016
,
2015
and
2014
, respectively.
During
2015
, the Company sold investments held-to-maturity
$421 thousand
, resulting in gross gains of
$5 thousand
. The held-to-maturity investments were sold due to a credit downgrade, indicating significant deterioration of the issuer’s creditworthiness. The Company sold
no
held-to-maturity investments during the years of
2016
or
2014
.
The Company routinely generates 1-4 family mortgages for sale into the secondary market. During
2016
,
2015
and
2014
, the Company recognized sales proceeds of
$1.7 billion
,
$1.3 billion
and
$881.3 million
, resulting in mortgage fee income of
$35.7 million
,
$29.5 million
and
$17.6 million
, respectively.
The components of loans in the Consolidated Balance Sheet at
December 31,
were as follows:
|
(Dollars in thousands)
|
2016
|
2015
|
||||||
|
Commercial and Non-Residential Real Estate
|
$
|
757,516
|
|
$
|
729,319
|
|
||
|
Residential Real Estate
|
215,452
|
|
217,366
|
|
||||
|
Home Equity
|
65,386
|
|
68,124
|
|
||||
|
Consumer
|
14,511
|
|
17,361
|
|
||||
|
Total Loans
|
$
|
1,052,865
|
|
$
|
1,032,170
|
|
||
All loan origination fees and direct loan origination costs are deferred and recognized over the life of the loan. As of
December 31, 2016
and
2015
, net deferred fees of
$897 thousand
and
$1.1 million
, respectively, were included in the carrying value of loans.
The following table summarizes the primary segments of the loan portfolio as of
December 31, 2016
and
2015
:
|
(Dollars in thousands)
|
Commercial
|
Residential
|
Home Equity
|
Consumer
|
Total
|
|||||||||||||||
|
December 31, 2016
|
||||||||||||||||||||
|
Individually evaluated for impairment
|
$
|
10,781
|
|
$
|
1,161
|
|
$
|
132
|
|
$
|
78
|
|
$
|
12,152
|
|
|||||
|
Collectively evaluated for impairment
|
746,735
|
|
214,291
|
|
65,254
|
|
14,433
|
|
1,040,713
|
|
||||||||||
|
Total Loans
|
$
|
757,516
|
|
$
|
215,452
|
|
$
|
65,386
|
|
$
|
14,511
|
|
$
|
1,052,865
|
|
|||||
|
December 31, 2015
|
||||||||||||||||||||
|
Individually evaluated for impairment
|
$
|
14,177
|
|
$
|
1,067
|
|
$
|
28
|
|
$
|
103
|
|
$
|
15,375
|
|
|||||
|
Collectively evaluated for impairment
|
715,142
|
|
216,299
|
|
68,096
|
|
17,258
|
|
1,016,795
|
|
||||||||||
|
Total Loans
|
$
|
729,319
|
|
$
|
217,366
|
|
$
|
68,124
|
|
$
|
17,361
|
|
$
|
1,032,170
|
|
|||||
79
Loans are considered to be impaired when, based on current information and events, it is probable that the Company will be unable to collect the scheduled payments of principal or interest when due according to the contractual terms of the loan agreement. Factors considered by management in evaluating impairment include payment status, collateral value, and the probability of collecting scheduled principal and interest payments when due. Management determines the significance of payment delays and payment shortfalls on a case-by-case basis, taking into consideration all of the circumstances surrounding the loan and the borrower, including the length of the delay, the reasons for the delay, the borrower’s prior payment record, and the amount of the shortfall in relation to the principal and interest owed. The Company also separately evaluates individual consumer loans for impairment. The Chief Credit Officer identifies these loans individually by monitoring the delinquency status of the Bank’s portfolio. Once identified, the Bank’s ongoing communications with the borrower allow Management to evaluate the significance of the payment delays and the circumstances surrounding the loan and the borrower.
Once the determination has been made that a loan is impaired, the amount of the impairment is measured using
one
of
three
valuation methods: (a) the present value of expected future cash flows discounted at the loan’s effective interest rate; (b) the loan’s observable market price; or (c) the fair value of the collateral less selling costs. The method is selected on a loan-by-loan basis, with management primarily utilizing the fair value of collateral method. The evaluation of the need and amount of a specific allocation of the allowance and whether a loan can be removed from impairment status is made on a quarterly basis.
The following table presents impaired loans by class, segregated by those for which a specific allowance was required and those for which a specific allowance was not necessary as of
December 31, 2016
and
2015
:
|
|
Impaired Loans with Specific Allowance
|
Impaired Loans with No Specific Allowance
|
Total Impaired Loans
|
|||||||||||||||||
|
(Dollars in thousands)
|
Recorded Investment
|
Related Allowance
|
Recorded Investment
|
Recorded Investment
|
Unpaid Principal Balance
|
|||||||||||||||
|
December 31, 2016
|
||||||||||||||||||||
|
Commercial
|
||||||||||||||||||||
|
Commercial Business
|
$
|
—
|
|
$
|
—
|
|
$
|
3,342
|
|
$
|
3,342
|
|
$
|
4,102
|
|
|||||
|
Commercial Real Estate
|
2,757
|
|
302
|
|
892
|
|
3,649
|
|
3,676
|
|
||||||||||
|
Acquisition & Development
|
264
|
|
74
|
|
3,526
|
|
3,790
|
|
6,059
|
|
||||||||||
|
Total Commercial
|
3,021
|
|
376
|
|
7,760
|
|
10,781
|
|
13,837
|
|
||||||||||
|
Residential
|
783
|
|
122
|
|
378
|
|
1,161
|
|
1,166
|
|
||||||||||
|
Home Equity
|
62
|
|
36
|
|
70
|
|
132
|
|
135
|
|
||||||||||
|
Consumer
|
16
|
|
9
|
|
62
|
|
78
|
|
285
|
|
||||||||||
|
Total Impaired Loans
|
$
|
3,882
|
|
$
|
543
|
|
$
|
8,270
|
|
$
|
12,152
|
|
$
|
15,423
|
|
|||||
|
December 31, 2015
|
||||||||||||||||||||
|
Commercial
|
||||||||||||||||||||
|
Commercial Business
|
$
|
574
|
|
$
|
4
|
|
$
|
3,260
|
|
$
|
3,834
|
|
$
|
3,834
|
|
|||||
|
Commercial Real Estate
|
7,587
|
|
513
|
|
—
|
|
7,587
|
|
7,587
|
|
||||||||||
|
Acquisition & Development
|
1,800
|
|
191
|
|
956
|
|
2,756
|
|
4,131
|
|
||||||||||
|
Total Commercial
|
9,961
|
|
708
|
|
4,216
|
|
14,177
|
|
15,552
|
|
||||||||||
|
Residential
|
1,045
|
|
276
|
|
22
|
|
1,067
|
|
1,067
|
|
||||||||||
|
Home Equity
|
28
|
|
28
|
|
—
|
|
28
|
|
28
|
|
||||||||||
|
Consumer
|
103
|
|
1
|
|
—
|
|
103
|
|
103
|
|
||||||||||
|
Total Impaired Loans
|
$
|
11,137
|
|
$
|
1,013
|
|
$
|
4,238
|
|
$
|
15,375
|
|
$
|
16,750
|
|
|||||
Impaired loans have decreased by
$3.2 million
, or
21%
, during
2016
, primarily the result of the net impact of
seven
commercial loan relationships. A
$5.0 million
loan to finance commercial real estate property in the Northern Virginia market, which had as primary tenants, government contractors that have vacated the premises as a result of losing significant contracts with the United States government, was purchased from another financial institution in late
2013
. In
2016
, this
$5.0 million
loan was repurchased by the selling financial institution thereby decreasing total impaired loans by
$5.0 million
.
80
In contrast,
five
of the
seven
relationships generated increases to the impaired loan total since
2015
, the largest of which was a
$950 thousand
commercial real estate loan (net of a
$361 thousand
participation) that was identified as impaired in
2016
as a result of an extended stabilization and interest only period, as well as a lack of project specific cash flows. Charge-offs of
$701 thousand
were incurred on this loan in
2016
. The remaining
four
relationships that generated increases to the impaired loan total included
thirteen
commercial real estate and/or acquisition and development loans that totaled
$3.9 million
as of
December 31, 2016
, a net increase of
$1.2 million
specific to these relationships since
2015
.
The last of the
seven
commercial relationships that contributed to the net decrease in impaired loans since
2015
included
two
loans that were identified as impaired in
2016
as a result of a decline in the coal industry. In
2016
, these
two
loans, along with a third related loan that was previously impaired, required orderly liquidation of the related collateral, resulting in
$796 thousand
in principal curtailment and a total of partial charge-offs in the amount of
$759 thousand
. The net effect of these
seven
significant impairment items on the total of impaired loans was
$3.4 million
.
The remaining
$200 thousand
of the net decrease in impaired loans since
December 31, 2015
was the net effect of multiple other factors, including the identification of additional impaired loans, foreclosures, loan sales, payoffs, principal curtailments, partial charge-offs, and normal loan amortization.
|
The following table presents the average recorded investment in impaired loans and related interest income recognized for the years ended:
|
||||||||||||||||||||||||||||||||||||
|
December 31, 2016
|
December 31, 2015
|
December 31, 2014
|
||||||||||||||||||||||||||||||||||
|
(Dollars in thousands)
|
Average Investment in Impaired Loans
|
Interest Income Recognized on Accrual Basis
|
Interest Income Recognized on Cash Basis
|
Average Investment in Impaired Loans
|
Interest Income Recognized on Accrual Basis
|
Interest Income Recognized on Cash Basis
|
Average Investment in Impaired Loans
|
Interest Income Recognized on Accrual Basis
|
Interest Income Recognized on Cash Basis
|
|||||||||||||||||||||||||||
|
Commercial
|
||||||||||||||||||||||||||||||||||||
|
Commercial Business
|
$
|
4,027
|
|
$
|
155
|
|
$
|
104
|
|
$
|
3,153
|
|
$
|
156
|
|
$
|
114
|
|
$
|
301
|
|
$
|
14
|
|
$
|
61
|
|
|||||||||
|
Commercial Real Estate
|
3,590
|
|
100
|
|
75
|
|
6,618
|
|
63
|
|
61
|
|
2,213
|
|
149
|
|
105
|
|
||||||||||||||||||
|
Acquisition & Development
|
3,983
|
|
9
|
|
112
|
|
2,408
|
|
9
|
|
10
|
|
4,456
|
|
112
|
|
94
|
|
||||||||||||||||||
|
Total Commercial
|
11,600
|
|
264
|
|
291
|
|
12,179
|
|
228
|
|
185
|
|
6,970
|
|
275
|
|
260
|
|
||||||||||||||||||
|
Residential
|
928
|
|
20
|
|
28
|
|
920
|
|
12
|
|
13
|
|
804
|
|
20
|
|
20
|
|
||||||||||||||||||
|
Home Equity
|
50
|
|
1
|
|
1
|
|
28
|
|
1
|
|
1
|
|
28
|
|
1
|
|
1
|
|
||||||||||||||||||
|
Consumer
|
245
|
|
—
|
|
—
|
|
1
|
|
—
|
|
—
|
|
20
|
|
1
|
|
1
|
|
||||||||||||||||||
|
Total
|
$
|
12,823
|
|
$
|
285
|
|
$
|
320
|
|
$
|
13,128
|
|
$
|
241
|
|
$
|
199
|
|
$
|
7,822
|
|
$
|
297
|
|
$
|
282
|
|
|||||||||
As of
December 31, 2016
, the Bank held
two
foreclosed residential real estate properties representing
$214 thousand
, or
52%
, of the total balance of other real estate owned. There are
six
additional consumer mortgage loans collateralized by residential real estate properties in the process of foreclosure. The total recorded investment in these loans was
$464 thousand
as of
December 31, 2016
. These loans are included in the table above and have a total of
$59 thousand
in specific allowance allocated to them.
Bank management uses a
nine
point internal risk rating system to monitor the credit quality of the overall loan portfolio. The first
six
categories are considered not criticized, and are aggregated as “Pass” rated. The criticized rating categories utilized by management generally follow bank regulatory definitions. The Special Mention category includes assets that are currently protected but are potentially weak, resulting in an undue and unwarranted credit risk, but not to the point of justifying a Substandard classification. Loans in the Substandard category have well-defined weaknesses that jeopardize the liquidation of the debt, and have a distinct possibility that some loss will be sustained if the weaknesses are not corrected. Any portion of a loan that has been or is expected to be charged off is placed in the Loss category.
To help ensure that risk ratings are accurate and reflect the present and future capacity of borrowers to repay a loan as agreed, the Bank has a structured loan rating process with several layers of internal and external oversight. Generally, consumer and residential mortgage loans are included in the Pass categories unless a specific action, such as past due status, bankruptcy, repossession, or death occurs to raise awareness of a possible credit event. The Bank’s Chief Credit Officer is responsible for the
81
timely and accurate risk rating of the loans in the portfolio at origination and on an ongoing basis. The Credit Department ensures that a review of all commercial relationships of
one million
dollars or greater is performed annually.
Review of the appropriate risk grade is included in both the internal and external loan review process, and on an ongoing basis. The Bank has an experienced Credit Department that continually reviews and assesses loans within the portfolio. The Bank engages an external consultant to conduct independent loan reviews on at least an annual basis. Generally, the external consultant reviews larger commercial relationships or criticized relationships. The Bank’s Credit Department compiles detailed reviews, including plans for resolution, on loans classified as Substandard on a quarterly basis. Loans in the Special Mention and Substandard categories that are collectively evaluated for impairment are given separate consideration in the determination of the allowance.
The following table represents the classes of the loan portfolio summarized by the aggregate Pass and the criticized categories of Special Mention, Substandard and Doubtful within the internal risk rating system as of
December 31, 2016
and
2015
:
|
(Dollars in thousands)
|
Pass
|
Special Mention
|
Substandard
|
Doubtful
|
Total
|
|||||||||||||||
|
December 31, 2016
|
||||||||||||||||||||
|
Commercial
|
||||||||||||||||||||
|
Commercial Business
|
$
|
377,631
|
|
$
|
2,933
|
|
$
|
6,833
|
|
$
|
69
|
|
$
|
387,466
|
|
|||||
|
Commercial Real Estate
|
240,851
|
|
26,340
|
|
3,532
|
|
737
|
|
271,460
|
|
||||||||||
|
Acquisition & Development
|
90,875
|
|
1,905
|
|
2,584
|
|
3,226
|
|
98,590
|
|
||||||||||
|
Total Commercial
|
709,357
|
|
31,178
|
|
12,949
|
|
4,032
|
|
757,516
|
|
||||||||||
|
Residential
|
212,869
|
|
1,664
|
|
787
|
|
132
|
|
215,452
|
|
||||||||||
|
Home Equity
|
64,706
|
|
582
|
|
98
|
|
—
|
|
65,386
|
|
||||||||||
|
Consumer
|
14,134
|
|
302
|
|
13
|
|
62
|
|
14,511
|
|
||||||||||
|
Total Loans
|
$
|
1,001,066
|
|
$
|
33,726
|
|
$
|
13,847
|
|
$
|
4,226
|
|
$
|
1,052,865
|
|
|||||
|
December 31, 2015
|
||||||||||||||||||||
|
Commercial
|
||||||||||||||||||||
|
Commercial Business
|
$
|
288,549
|
|
$
|
7,949
|
|
$
|
3,411
|
|
$
|
574
|
|
$
|
300,483
|
|
|||||
|
Commercial Real Estate
|
299,560
|
|
9,761
|
|
8,436
|
|
—
|
|
317,757
|
|
||||||||||
|
Acquisition & Development
|
105,585
|
|
2,739
|
|
1,223
|
|
1,532
|
|
111,079
|
|
||||||||||
|
Total Commercial
|
693,694
|
|
20,449
|
|
13,070
|
|
2,106
|
|
729,319
|
|
||||||||||
|
Residential
|
214,184
|
|
1,764
|
|
1,168
|
|
250
|
|
217,366
|
|
||||||||||
|
Home Equity
|
67,645
|
|
416
|
|
63
|
|
—
|
|
68,124
|
|
||||||||||
|
Consumer
|
16,679
|
|
311
|
|
371
|
|
—
|
|
17,361
|
|
||||||||||
|
Total Loans
|
$
|
992,202
|
|
$
|
22,940
|
|
$
|
14,672
|
|
$
|
2,356
|
|
$
|
1,032,170
|
|
|||||
Management further monitors the performance and credit quality of the loan portfolio by analyzing the age of the portfolio as determined by the length of time a recorded payment is past due.
A loan that has deteriorated and requires additional collection efforts by the Bank could warrant non-accrual status. A thorough review is presented to the Chief Credit Officer and or the Management Loan Committee ("MLC"), as required with respect to any loan which is in a collection process and to make a determination as to whether the loan should be placed on non-accrual status. The placement of loans on non-accrual status is subject to applicable regulatory restrictions and guidelines. Generally, loans should be placed in non-accrual status when the loan reaches
90 days
past due, when it becomes likely the borrower cannot or will not make scheduled principal or interest payments, when full repayment of principal and interest is not expected, or when the loan displays potential loss characteristics. Normally, all accrued interest is charged off when a loan is placed in non-accrual status, unless Management believes it is likely the accrued interest will be collected. Any payments subsequently received are applied to principal. To remove a loan from non-accrual status, all principal and interest due must be paid up to date and the Bank is reasonably sure of future satisfactory payment performance. Usually, this requires a
six
-month recent history of payments due. Removal of a loan from non-accrual status will require the approval of the Chief Credit Officer and or MLC.
82
The following table presents the classes of the loan portfolio summarized by aging categories of performing loans and nonaccrual loans as of
December 31, 2016
and
2015
:
|
(Dollars in thousands)
|
Current
|
30-59 Days Past Due
|
60-89 Days Past Due
|
90+ Days Past Due
|
Total Past Due
|
Total Loans
|
Non-Accrual
|
90+ Days Still Accruing
|
||||||||||||||||||||||||
|
December 31, 2016
|
||||||||||||||||||||||||||||||||
|
Commercial
|
||||||||||||||||||||||||||||||||
|
Commercial Business
|
$
|
387,208
|
|
$
|
15
|
|
$
|
169
|
|
$
|
74
|
|
$
|
258
|
|
$
|
387,466
|
|
$
|
74
|
|
$
|
—
|
|
||||||||
|
Commercial Real Estate
|
270,339
|
|
229
|
|
—
|
|
892
|
|
1,121
|
|
271,460
|
|
1,375
|
|
—
|
|
||||||||||||||||
|
Acquisition & Development
|
96,014
|
|
—
|
|
—
|
|
2,576
|
|
2,576
|
|
98,590
|
|
3,526
|
|
—
|
|
||||||||||||||||
|
Total Commercial
|
753,561
|
|
244
|
|
169
|
|
3,542
|
|
3,955
|
|
757,516
|
|
4,975
|
|
—
|
|
||||||||||||||||
|
Residential
|
212,502
|
|
2,067
|
|
419
|
|
464
|
|
2,950
|
|
215,452
|
|
1,072
|
|
—
|
|
||||||||||||||||
|
Home Equity
|
64,791
|
|
525
|
|
—
|
|
70
|
|
595
|
|
65,386
|
|
104
|
|
—
|
|
||||||||||||||||
|
Consumer
|
14,354
|
|
55
|
|
34
|
|
68
|
|
157
|
|
14,511
|
|
78
|
|
—
|
|
||||||||||||||||
|
Total Loans
|
$
|
1,045,208
|
|
$
|
2,891
|
|
$
|
622
|
|
$
|
4,144
|
|
$
|
7,657
|
|
$
|
1,052,865
|
|
$
|
6,229
|
|
$
|
—
|
|
||||||||
|
December 31, 2015
|
||||||||||||||||||||||||||||||||
|
Commercial
|
||||||||||||||||||||||||||||||||
|
Commercial Business
|
$
|
299,515
|
|
$
|
300
|
|
$
|
—
|
|
$
|
668
|
|
$
|
968
|
|
$
|
300,483
|
|
$
|
687
|
|
$
|
—
|
|
||||||||
|
Commercial Real Estate
|
307,029
|
|
436
|
|
4,731
|
|
5,561
|
|
10,728
|
|
317,757
|
|
5,020
|
|
541
|
|
||||||||||||||||
|
Acquisition & Development
|
107,607
|
|
678
|
|
—
|
|
2,794
|
|
3,472
|
|
111,079
|
|
2,488
|
|
307
|
|
||||||||||||||||
|
Total Commercial
|
714,151
|
|
1,414
|
|
4,731
|
|
9,023
|
|
15,168
|
|
729,319
|
|
8,195
|
|
848
|
|
||||||||||||||||
|
Residential
|
214,326
|
|
1,838
|
|
576
|
|
626
|
|
3,040
|
|
217,366
|
|
803
|
|
—
|
|
||||||||||||||||
|
Home Equity
|
67,908
|
|
23
|
|
193
|
|
—
|
|
216
|
|
68,124
|
|
36
|
|
—
|
|
||||||||||||||||
|
Consumer
|
16,921
|
|
48
|
|
21
|
|
371
|
|
440
|
|
17,361
|
|
371
|
|
—
|
|
||||||||||||||||
|
Total Loans
|
$
|
1,013,306
|
|
$
|
3,323
|
|
$
|
5,521
|
|
$
|
10,020
|
|
$
|
18,864
|
|
$
|
1,032,170
|
|
$
|
9,405
|
|
$
|
848
|
|
||||||||
An allowance for loan losses (“ALL”) is maintained to absorb losses from the loan portfolio. The ALL is based on management’s continuing evaluation of the risk characteristics and credit quality of the loan portfolio, assessment of current economic conditions, diversification and size of the portfolio, adequacy of collateral, past and anticipated loss experience, and the amount of non-performing loans.
Interest income on loans would have increased by approximately
$396 thousand
,
$639 thousand
and
$221 thousand
for
2016
,
2015
and
2014
, respectively, if loans had performed in accordance with their terms.
The Bank’s methodology for determining the ALL is based on the requirements of ASC Section 310-10-35 for loans individually evaluated for impairment (discussed above) and ASC Subtopic 450-20 for loans collectively evaluated for impairment, as well as the Interagency Policy Statements on the Allowance for Loan and Lease Losses and other bank regulatory guidance. The total of the
two
components represents the Bank’s ALL.
Loans that are collectively evaluated for impairment are analyzed with general allowances being made as appropriate. For general allowances, historical loss trends are used in the estimation of losses in the current portfolio. These historical loss amounts are modified by qualified factors.
The segments described above, which are based on the Federal call code assigned to each loan, provide the starting point for the ALL analysis. Company and bank management tracks the historical net charge-off activity at the call code level. A historical charge-off factor is calculated utilizing a defined number of consecutive historical quarters. All pools currently utilize a rolling
12
quarters.
“Pass” rated credits are segregated from “Criticized” credits for the application of qualitative factors. Loans in the criticized pools, which possess certain qualities or characteristics that may lead to collection and loss issues, are closely monitored by management and subject to additional qualitative factors.
Company and Bank management have identified a number of additional qualitative factors which it uses to supplement the historical charge-off factor because these factors are likely to cause estimated credit losses associated with the existing loan pools
83
to differ from historical loss experience. The additional factors that are evaluated quarterly and updated using information obtained from internal, regulatory, and governmental sources are: national and local economic trends and conditions; levels of and trends in delinquency rates and non-accrual loans; trends in volume and terms of loans; effects of changes in lending policies; experience, ability, and depth of lending staff; value of underlying collateral; and concentrations of credit from a loan type, industry and/or geographic standpoint. The combination of historical charge-off and qualitative factors are then weighted for each risk grade. These weightings are determined internally based upon the likelihood of loss as a loan risk grading deteriorates.
To estimate the liability for off-balance sheet credit exposures, Bank management analyzed the portfolios of letters of credit, non-revolving lines of credit, and revolving lines of credit, and based its calculation on the expectation of future advances of each loan category. Letters of credit were determined to be highly unlikely to advance since they are generally in place only to ensure various forms of performance of the borrowers. In the Bank’s history, there have been no letters of credit drawn upon. In addition, many of the letters of credit are cash secured and do not warrant an allocation. Non-revolving lines of credit were determined to be highly likely to advance as these are typically construction lines. Meanwhile, the likelihood of revolving lines of credit advancing varies with each individual borrower. Therefore, the future usage of each line was estimated based on the average line utilization of the revolving line of credit portfolio as a whole.
Once the estimated future advances were calculated, an allocation rate, which was derived from the Bank’s historical losses and qualitative environmental factors, was applied in the similar manner as those used for the allowance for loan loss calculation. The resulting estimated loss allocations were totaled to determine the liability for unfunded commitments related to these loans, which Management considers necessary to anticipate potential losses on those commitments that have a reasonable probability of funding. The liability for unfunded commitments was
$284 thousand
and
$224 thousand
respectively as of
December 31, 2016
and
2015
.
Bank management reviews the loan portfolio on a quarterly basis using a defined, consistently applied process in order to make appropriate and timely adjustments to the ALL. When information confirms all or part of specific loans to be uncollectible, these amounts are promptly charged off against the ALL.
The following tables summarize the primary segments of the ALL, segregated into the amount required for loans individually evaluated for impairment and the amount required for loans collectively evaluated for impairment as of
December 31, 2016
,
2015
, and
2014
. Activity in the allowance is presented for the periods indicated:
|
(Dollars in thousands)
|
Commercial
|
Residential
|
Home Equity
|
Consumer
|
Total
|
|||||||||||||||
|
ALL balance at December 31, 2015
|
$
|
6,066
|
|
$
|
1,095
|
|
$
|
715
|
|
$
|
130
|
|
$
|
8,006
|
|
|||||
|
Charge-offs
|
(1,995
|
)
|
(124
|
)
|
(100
|
)
|
(338
|
)
|
(2,557
|
)
|
||||||||||
|
Recoveries
|
9
|
|
2
|
|
9
|
|
1
|
|
21
|
|
||||||||||
|
Provision
|
3,101
|
|
17
|
|
104
|
|
409
|
|
3,631
|
|
||||||||||
|
ALL balance at December 31, 2016
|
$
|
7,181
|
|
$
|
990
|
|
$
|
728
|
|
$
|
202
|
|
$
|
9,101
|
|
|||||
|
Individually evaluated for impairment
|
$
|
376
|
|
$
|
122
|
|
$
|
36
|
|
$
|
9
|
|
$
|
543
|
|
|||||
|
Collectively evaluated for impairment
|
$
|
6,805
|
|
$
|
868
|
|
$
|
692
|
|
$
|
193
|
|
$
|
8,558
|
|
|||||
|
(Dollars in thousands)
|
Commercial
|
Residential
|
Home Equity
|
Consumer
|
Total
|
|||||||||||||||
|
ALL balance at December 31, 2014
|
$
|
4,363
|
|
$
|
962
|
|
$
|
691
|
|
$
|
207
|
|
$
|
6,223
|
|
|||||
|
Charge-offs
|
(708
|
)
|
(28
|
)
|
(5
|
)
|
(6
|
)
|
(747
|
)
|
||||||||||
|
Recoveries
|
20
|
|
2
|
|
4
|
|
11
|
|
37
|
|
||||||||||
|
Provision
|
2,391
|
|
159
|
|
25
|
|
(82
|
)
|
2,493
|
|
||||||||||
|
ALL balance at December 31, 2015
|
$
|
6,066
|
|
$
|
1,095
|
|
$
|
715
|
|
$
|
130
|
|
$
|
8,006
|
|
|||||
|
Individually evaluated for impairment
|
$
|
708
|
|
$
|
276
|
|
$
|
28
|
|
$
|
1
|
|
$
|
1,013
|
|
|||||
|
Collectively evaluated for impairment
|
$
|
5,358
|
|
$
|
819
|
|
$
|
687
|
|
$
|
129
|
|
$
|
6,993
|
|
|||||
84
|
(Dollars in thousands)
|
Commercial
|
Residential
|
Home Equity
|
Consumer
|
Total
|
|||||||||||||||
|
ALL balance at December 31, 2013
|
$
|
3,609
|
|
$
|
519
|
|
$
|
554
|
|
$
|
253
|
|
$
|
4,935
|
|
|||||
|
Charge-offs
|
(1,110
|
)
|
(130
|
)
|
—
|
|
(68
|
)
|
(1,308
|
)
|
||||||||||
|
Recoveries
|
7
|
|
—
|
|
3
|
|
4
|
|
14
|
|
||||||||||
|
Provision
|
1,857
|
|
573
|
|
134
|
|
18
|
|
2,582
|
|
||||||||||
|
ALL balance at December 31, 2014
|
$
|
4,363
|
|
$
|
962
|
|
$
|
691
|
|
$
|
207
|
|
$
|
6,223
|
|
|||||
|
Individually evaluated for impairment
|
$
|
362
|
|
$
|
298
|
|
$
|
28
|
|
$
|
2
|
|
$
|
690
|
|
|||||
|
Collectively evaluated for impairment
|
$
|
4,001
|
|
$
|
664
|
|
$
|
663
|
|
$
|
205
|
|
$
|
5,533
|
|
|||||
During December 2013, the Bank purchased
$74.3 million
in performing commercial real estate secured loans in the northern Virginia area. At the time of acquisition, none of these loans were considered impaired. They were acquired at a premium of roughly
1.024
or
$1.8 million
, which is being amortized in accordance with ASC 310-20. These loans are collectively evaluated for impairment under ASC 450. The loans continue to be individually monitored for payoff activity, and any necessary adjustments to the premium are made accordingly.
At
December 31, 2016
and
2015
, these balances totaled
$20.5 million
and
$46.8 million
, respectively. Of the
$53.8 million
decrease since originally purchased, MVB refinanced
$19.6 million
and sold participations totaling
$10.5 million
and sold
$9.7 million
back to the institution from which the loans were originally purchased in
December 2013
. The remainder of the decrease was the result of
$6.2 million
in loan amortization and
$7.8 million
in principal paydowns and/or loan payoffs. The weighted average yield on the remaining portfolio is
5.57%
.
The allowance for loan losses is based on estimates, and actual losses will vary from current estimates. Management believes that the granularity of the homogeneous pools and the related historical loss ratios and other qualitative factors, as well as the consistency in the application of assumptions, result in an ALL that is representative of the risk found in the components of the portfolio at any given date.
Troubled Debt Restructurings
The restructuring of a loan is considered a troubled debt restructuring (“TDR”) if both (i) the borrower is experiencing financial difficulties and (ii) the creditor has granted a concession. Concessions may include interest rate reductions or below market interest rates, principal forgiveness, restructuring amortization schedules and other actions intended to minimize potential losses. At
December 31, 2016
and
2015
, the Bank had specific reserve allocations for TDR’s of
$348 thousand
and
$672 thousand
, respectively.
Loans considered to be troubled debt restructured loans totaled
$8.8 million
and
$9.3 million
as of
December 31, 2016
and
December 31, 2015
, respectively. Of these totals,
$5.9 million
and
$6.1 million
, respectively, represent accruing troubled debt restructured loans and represent
49%
and
40%
, respectively of total impaired loans. Meanwhile,
$2.3 million
and
$2.5 million
, respectively, represent
three
loans to
two
borrowers that have defaulted under the restructured terms. All
three
loans are commercial acquisition and development loans that were considered TDR's due to extended interest only periods and/or unsatisfactory repayment structures once transitioned to principal and interest payments. These borrowers have experienced continued financial difficulty and are considered non-performing loans as of
December 31, 2016
and
December 31, 2015
.
Two
additional restructured loans, a
$214 thousand
commercial real estate loan and a
$348 thousand
mortgage loan, are considered non-performing as of
December 31, 2016
. Both of these were also considered TDR's due to interest only periods and/or unsatisfactory repayment structures.
85
The following table presents details related to loans identified as Troubled Debt Restructurings during the years ended
December 31, 2016
and
2015
.
|
New TDR's
1
|
||||||||||||||||||||||
|
December 31, 2016
|
December 31, 2015
|
|||||||||||||||||||||
|
(Dollars in thousands)
|
Number of Contracts
|
Pre-Modification Outstanding Recorded Investment
|
Post-Modification Outstanding Recorded Investment
|
Number of Contracts
|
Pre-Modification Outstanding Recorded Investment
|
Post-Modification Outstanding Recorded Investment
|
||||||||||||||||
|
Commercial
|
||||||||||||||||||||||
|
Commercial Business
|
—
|
|
$
|
—
|
|
$
|
—
|
|
—
|
|
$
|
—
|
|
$
|
—
|
|
||||||
|
Commercial Real Estate
|
—
|
|
—
|
|
—
|
|
1
|
|
1,076
|
|
1,076
|
|
||||||||||
|
Acquisition & Development
|
—
|
|
—
|
|
—
|
|
—
|
|
—
|
|
—
|
|
||||||||||
|
Total Commercial
|
—
|
|
—
|
|
—
|
|
1
|
|
1,076
|
|
1,076
|
|
||||||||||
|
Residential
|
—
|
|
—
|
|
—
|
|
1
|
|
90
|
|
90
|
|
||||||||||
|
Home Equity
|
—
|
|
—
|
|
—
|
|
—
|
|
—
|
|
—
|
|
||||||||||
|
Consumer
|
—
|
|
—
|
|
—
|
|
—
|
|
—
|
|
—
|
|
||||||||||
|
Total
|
—
|
|
$
|
—
|
|
$
|
—
|
|
2
|
|
$
|
1,166
|
|
$
|
1,166
|
|
||||||
1
The pre-modification and post-modification balances represent the balances outstanding immediately before and after modification of the loan.
Premises and equipment at
December 31,
were as follows:
|
(Dollars in thousands)
|
2016
|
2015
|
||||||
|
Land
|
$
|
3,965
|
|
$
|
3,965
|
|
||
|
Buildings and improvements
|
16,906
|
|
16,389
|
|
||||
|
Furniture, fixtures and equipment
|
12,127
|
|
10,980
|
|
||||
|
Construction in progress
|
608
|
|
1,375
|
|
||||
|
Leasehold improvements
|
1,345
|
|
1,678
|
|
||||
|
|
34,951
|
|
34,387
|
|
||||
|
Accumulated depreciation
|
(9,870
|
)
|
(8,112
|
)
|
||||
|
Net premises and equipment
|
$
|
25,081
|
|
$
|
26,275
|
|
||
During
2014
, the Bank completed construction of a new facility in Kanawha County, West Virginia and a new facility in the West Virginia High Technology Park in Fairmont, Marion County, West Virginia.
Depreciation expense amounted to
$2.0 million
,
$2.0 million
and
$1.2 million
for
2016
,
2015
and
2014
, respectively.
86
Deposits at
December 31,
were as follows:
|
(Dollars in thousands)
|
2016
|
2015
|
||||||
|
Demand deposits of individuals, partnerships, and corporations
|
|
|
|
|
||||
|
Noninterest bearing demand
|
$
|
115,692
|
|
$
|
80,423
|
|
||
|
Interest bearing demand
|
414,031
|
|
473,459
|
|
||||
|
Savings and money markets
|
280,533
|
|
128,622
|
|
||||
|
Time deposits including CDs and IRAs
|
296,761
|
|
329,810
|
|
||||
|
Total deposits
|
$
|
1,107,017
|
|
$
|
1,012,314
|
|
||
|
Time deposits that meet or exceed the FDIC insurance limit
|
$
|
18,727
|
|
$
|
21,690
|
|
||
Maturities of time deposits at
December 31, 2016
were as follows (Dollars in thousands):
|
2017
|
$
|
145,152
|
|
|
|
2018
|
74,349
|
|
||
|
2019
|
28,480
|
|
||
|
2020
|
38,513
|
|
||
|
2021
|
10,267
|
|
||
|
Total
|
$
|
296,761
|
|
|
The Bank is a member of the Federal Home Loan Bank (“FHLB”) of Pittsburgh, Pennsylvania. The remaining maximum borrowing capacity with the FHLB at
December 31, 2016
was approximately
$326.9 million
. At
December 31, 2016
and
2015
the Bank had borrowed
$90.9 million
and
$183.2 million
.
Short-term borrowings
Along with traditional deposits, the Bank has access to short-term borrowings from FHLB to fund its operations and investments. Short-term borrowings from FHLB totaled
$87.7 million
at
December 31, 2016
, compared to
$179.9 million
at year-end
2015
.
|
Information related to short-term borrowings is summarized as follows:
|
||||||||||||
|
(Dollars in thousands)
|
2016
|
2015
|
2014
|
|||||||||
|
Balance at end of year
|
$
|
87,733
|
|
$
|
179,917
|
|
$
|
95,829
|
|
|||
|
Average balance during the year
|
137,822
|
|
121,425
|
|
76,185
|
|
||||||
|
Maximum month-end balance
|
210,600
|
|
179,917
|
|
120,229
|
|
||||||
|
Weighted-average rate during the year
|
0.51
|
%
|
0.34
|
%
|
0.27
|
%
|
||||||
|
Weighted-average rate at December 31
|
0.74
|
%
|
0.44
|
%
|
0.32
|
%
|
||||||
Repurchase agreements
Along with traditional deposits, the Bank has access to securities sold under agreements to repurchase “repurchase agreements” with customers represent funds deposited by customers, on an overnight basis, that are collateralized by investment securities owned by the Company. Repurchase agreements with customers are included in borrowings section on the consolidated balance sheets. All repurchase agreements are subject to terms and conditions of repurchase/security agreements between the Company
87
and the client and are accounted for as secured borrowings. The Company's repurchase agreements reflected in liabilities consist of customer accounts and securities which are pledged on an individual security basis.
The Company monitors the fair value of the underlying securities on a monthly basis. Repurchase agreements are reflected at the amount of cash received in connection with the transaction and included in Securities sold under agreements to repurchase on the consolidated balance sheets. The primary risk with our repurchase agreements is market risk associated with the investments securing the transactions, as we may be required to provide additional collateral based on fair value changes of the underlying investments. Securities pledged as collateral under repurchase agreements are maintained with our safekeeping agents.
All of the Company’s repurchase agreements were overnight agreements at
December 31, 2016
and
December 31, 2015
. These borrowings were collateralized with investment securities with a carrying value of
$26.0 million
and
$28.3 million
at
December 31, 2016
and
December 31, 2015
, respectively, and were comprised of U.S. Government Agencies and Mortgage backed securities. Declines in the value of the collateral would require the Company to increase the amounts of securities pledged.
Repurchase agreements totaled
$25.2 million
at
December 31, 2016
, compared to
$27.4 million
in
2015
.
|
Information related to repurchase agreements is summarized as follows:
|
||||||||||||
|
(Dollars in thousands)
|
2016
|
2015
|
2014
|
|||||||||
|
Balance at end of year
|
$
|
25,160
|
|
$
|
27,437
|
|
$
|
32,673
|
|
|||
|
Average balance during the year
|
27,066
|
|
26,884
|
|
55,731
|
|
||||||
|
Maximum month-end balance
|
29,561
|
|
32,470
|
|
83,781
|
|
||||||
|
Weighted-average rate during the year
|
0.27
|
%
|
0.31
|
%
|
0.52
|
%
|
||||||
|
Weighted-average rate at December 31
|
0.28
|
%
|
0.30
|
%
|
0.35
|
%
|
||||||
Long-term notes from the FHLB as of
December 31,
were as follows:
|
(Dollars in thousands)
|
2016
|
2015
|
||||||
|
Fixed interest rate notes, originating between April 2002 and December 2007, due between July 2016 and April 2022, interest of between 4.50% and 5.90% payable monthly
|
$
|
2,390
|
|
$
|
2,461
|
|
||
|
Amortizing fixed interest rate note, originating February 2007, due February 2022, payable in monthly installments of $5 thousand, including interest of 5.22%
|
798
|
|
820
|
|
||||
|
|
$
|
3,188
|
|
$
|
3,281
|
|
||
Subordinated Debt
|
Information related to subordinated debt is summarized as follows:
|
||||||||||||
|
(Dollars in thousands)
|
2016
|
2015
|
2014
|
|||||||||
|
Balance at end of year
|
$
|
33,524
|
|
$
|
33,524
|
|
$
|
33,524
|
|
|||
|
Average balance during the year
|
33,524
|
|
33,524
|
|
19,361
|
|
||||||
|
Maximum month-end balance
|
33,524
|
|
33,524
|
|
33,524
|
|
||||||
|
Weighted-average rate during the year
|
6.64
|
%
|
6.57
|
%
|
6.01
|
%
|
||||||
|
Weighted-average rate at December 31
|
6.63
|
%
|
6.57
|
%
|
6.53
|
%
|
||||||
In
March 2007
, the Company completed the private placement of
$4 million
Floating Rate, Trust Preferred Securities through its MVB Financial Statutory Trust I subsidiary (the “Trust”). The Company established the Trust for the sole purpose of issuing the Trust Preferred Securities pursuant to an Amended and Restated Declaration of Trust. The proceeds from the sale of the Trust Preferred Securities will be loaned to the Company under subordinated Debentures (the “Debentures”) issued to the Trust pursuant to an Indenture. The Debentures are the only asset of the Trust. The Trust Preferred Securities have been issued to a
88
pooling vehicle that will use the distributions on the Trust Preferred Securities to securitize note obligations. The securities issued by the Trust are includable for regulatory purposes as a component of the Company’s Tier 1 capital.
The Trust Preferred Securities and the Debentures mature in
2037
and have been redeemable by the Company since
2012
. Interest payments are due in
March, June, September and December
and are adjusted at the interest due dates at a rate of
1.62%
over the three-month LIBOR Rate. The obligations of the Company with respect to the issuance of the trust preferred securities constitute a full and unconditional guarantee by the Company of the Trust's obligations with respect to the trust preferred securities to the extent set forth in the related guarantees.
On
June 30, 2014
, the Company issued its Convertible Subordinated Promissory Notes Due
2024
(the “Notes”) to various investors in the aggregate principal amount of
$29,400,000
. The Notes were issued in
$100,000
increments per Note subject to a minimum investment of
$1,000,000
. The Notes expire
10 years
after the initial issuance date of the Notes (the “Maturity Date”).
Interest on the Notes accrues on the unpaid principal amount of each Note (paid quarterly in arrears on
January 1, April 1, July 1 and October 1
of each year) which rate shall be dependent upon the principal invested in the Notes and the holder’s ownership of common stock in the Company. For investments of less than
$3,000,000
in Notes, an ownership of Company common stock representing at least
30%
of the principal of the Notes acquired, the interest rate on the Notes is
7%
per annum. For investments of
$3,000,000
or greater in Notes and ownership of the Company’s common stock representing at least
30%
of the principal of the Notes acquired, the interest rate on the Notes is
7.5%
per annum. For investments of
$10,000,000
or greater, the interest rate on the Notes is
7%
per annum, regardless of whether the holder owns or acquires MVB common stock. The principal on the Notes shall be paid in full at the Maturity Date. On the fifth anniversary of the issuance of the Notes, a holder may elect to continue to receive the stated fixed rate on the Notes or a floating rate determined by LIBOR plus
5%
up to a maximum rate of
9%
, adjusted quarterly.
The Notes are unsecured and subject to the terms and conditions of any senior debt and after consultation with the Board of Governors of the Federal Reserve System, the Company may, after the Notes have been outstanding for
five years
, and without premium or penalty, prepay all or a portion of the unpaid principal amount of any Note together with the unpaid interest accrued on such portion of the principal amount of such Note. All such prepayments shall be made pro rata among the holders of all outstanding Notes.
At the election of a holder, any or all of the Notes may be converted into shares of common stock during the
30
day period after the first, second, third, fourth, and fifth anniversaries of the issuance of the Notes or upon a notice to prepay by the Company. The Notes will convert into common stock based on
$16
per share of the Company’s common stock. The conversion price will be subject to anti-dilution adjustments for certain events such as stock splits, reclassifications, non-cash distributions, extraordinary cash dividends, pro rata repurchases of common stock, and business combination transactions. The Company must give
20 days
’ notice to the holders of the Company’s intent to prepay the Notes, so that holders may execute the conversion right set forth above if a holder so desires.
Repayment of the Notes is subordinated to the Company’s outstanding senior debt including (if any) without limitation, senior secured loans. No payment will be made by the Company, directly or indirectly, on the Notes, unless and until all of the senior debt then due has been paid in full. Notwithstanding the foregoing, so long as there exists no event of default under any senior debt, the Company would make, and a holder would receive and retain for the holder’s account, regularly scheduled payments of accrued interest and principal pursuant to the terms of the Notes.
The Company must obtain a consent of the holders of the Notes prior to issuing any new senior debt in excess of
$15,000,000
after the date of issuance of the Notes and prior to the Maturity Date.
An event of default will occur upon the Company’s bankruptcy or any failure to pay interest, principal, or other amounts owing on the Notes when due. Upon the occurrence and during the continuance of an event of default (but subject to the subordination provisions of the Notes) the holders of a majority of the outstanding principal amount of the Notes may declare all or any portion of the outstanding principal amount of the Notes due and payable and demand immediate payment of such amount.
The Notes are redeemable, in whole or in part, at a redemption price equal to
100%
of the principal amount of the Notes to be redeemed on any interest payment date after a date
five years
from the original issue date.
The Company reflects subordinated debt in the amount of
$33.5 million
and
$33.5 million
as of
December 31, 2016
and
December 31, 2015
and interest expense of
$2.2 million
,
$2.2 million
and
$1.1 million
for the years ended
December 31, 2016
,
2015
and
2014
.
89
|
A summary of maturities of borrowings and subordinated debt over the next five years is as follows (dollars in thousands):
|
||||
|
Year
|
Amount
|
|||
|
2017
|
88,348
|
|
||
|
2018
|
81
|
|
||
|
2019
|
85
|
|
||
|
2020
|
90
|
|
||
|
2021
|
886
|
|
||
|
Thereafter
|
34,955
|
|
||
|
|
$
|
124,445
|
|
|
Commitments
The Company is a party to financial instruments with off-balance-sheet risk in the normal course of business to meet the financing needs of its customers. These financial instruments include commitments to extend credit and standby letters of credit. These instruments involve, to varying degrees, elements of credit and interest rate risk in excess of the amounts recognized in the statements of financial condition.
The Company’s exposure to credit loss in the event of nonperformance by the other party to the financial instruments for commitments to extend credit and standby letters of credit is represented by the contractual amount of those instruments. The Company uses the same credit policies in making commitments and conditional obligations as it does for on-balance-sheet instruments.
Commitments to extend credit are agreements to lend to a customer as long as there is no violation of any condition established in the contract. Commitments generally have fixed expiration dates or other termination clauses and may require payment of a fee. Since many of the commitments are expected to expire without being drawn upon, the total commitment amounts do not necessarily represent future cash requirements. The Company evaluates each customer’s credit worthiness on a case-by-case basis. The amount and type of collateral obtained, if deemed necessary by the Company upon extension of credit, varies and is based on management’s credit evaluation of the customer.
Standby letters of credit are conditional commitments issued by the Company to guarantee the performance of a customer to a third party. Standby letters of credit generally have fixed expiration dates or other termination clauses and may require payment of a fee. The credit risk involved in issuing letters of credit is essentially the same as that involved in extending loans to customers. The Company’s policy for obtaining collateral, and the nature of such collateral, is essentially the same as that involved in making commitments to extend credit.
Specifically, the Bank has entered into agreements to extend credit or provide conditional payments pursuant to standby and commercial letters of credit. In addition, the Bank utilizes letters of credit issued by the FHLB to collateralize certain public funds deposits.
Total contractual amounts of the commitments as of
December 31,
were as follows:
|
(Dollars in thousands)
|
2016
|
2015
|
||||||
|
Available on lines of credit
|
$
|
255,469
|
|
$
|
252,543
|
|
||
|
Stand-by letters of credit
|
13,387
|
|
7,793
|
|
||||
|
Other loan commitments
|
1,819
|
|
1,568
|
|
||||
|
$
|
270,675
|
|
$
|
261,904
|
|
|||
90
Concentration of Credit Risk
The Company grants a majority of its commercial, financial, agricultural, real estate and installment loans to customers throughout the Marion, Harrison, Monongalia, Kanawha, Jefferson and Berkeley County areas of West Virginia as well as the Northern Virginia area and adjacent counties. Collateral for loans is primarily residential and commercial real estate, personal property, and business equipment. The Company evaluates the credit worthiness of each of its customers on a case-by-case basis, and the amount of collateral it obtains is based upon management’s credit evaluation.
Regulatory
The Company is required to maintain certain reserve balances on hand in accordance with the Federal Reserve Board requirements. The average balance maintained in accordance with such requirements was
$0
and
$17.0 million
on
December 31, 2016
and
2015
, respectively. During 2016, a deposit reclassification program was implemented and allowed the Company to reduce its requirement of reserve balances on hand in accordance with the Federal Reserve Board the daily Federal Reserve Requirement.
Contingent Liability
The subsidiary bank is involved in various legal actions arising in the ordinary course of business. In the opinion of management and counsel, the outcome of these matters will not have a significant adverse effect on the consolidated financial statements.
The amount reflected as income taxes represents federal and state income taxes on financial statement income. Certain items of income and expense, primarily the provision for possible loan losses, allowance for losses on foreclosed assets held for resale, depreciation, and accretion of discounts on investment securities are reported in different accounting periods for income tax purposes.
The provisions for income taxes for the years ended
December 31,
were as follows:
|
(Dollars in thousands)
|
2016
|
2015
|
2014
|
|||||||||
|
Current:
|
||||||||||||
|
Federal
|
$
|
4,885
|
|
$
|
2,830
|
|
$
|
862
|
|
|||
|
State
|
1,197
|
|
591
|
|
124
|
|
||||||
|
|
$
|
6,082
|
|
$
|
3,421
|
|
$
|
986
|
|
|||
|
Deferred expense (benefit)
|
|
|
||||||||||
|
Federal
|
$
|
665
|
|
$
|
(371
|
)
|
$
|
(1,017
|
)
|
|||
|
State
|
42
|
|
(24
|
)
|
(65
|
)
|
||||||
|
707
|
|
(395
|
)
|
(1,082
|
)
|
|||||||
|
Income tax expense (benefit)
|
$
|
6,789
|
|
$
|
3,026
|
|
$
|
(96
|
)
|
|||
Following is a reconciliation of income taxes at federal statutory rates to recorded income taxes for the year ended
December 31
:
|
2016
|
2015
|
2014
|
|||||||||||||||||||
|
(Dollars in thousands)
|
Amount
|
%
|
Amount
|
%
|
Amount
|
%
|
|||||||||||||||
|
Tax at Federal tax rate
|
$
|
6,689
|
|
34
|
%
|
$
|
3,346
|
|
34
|
%
|
$
|
674
|
|
34
|
%
|
||||||
|
Tax effect of:
|
|
|
|
|
|
|
|
|
|
|
|
|
|||||||||
|
State income tax
|
1,197
|
|
6.0
|
%
|
246
|
|
2.5
|
%
|
50
|
|
2.5
|
%
|
|||||||||
|
Tax exempt earnings
|
(1,097
|
)
|
(5.5
|
)%
|
(566
|
)
|
(5.8
|
)%
|
(820
|
)
|
(41.3
|
)%
|
|||||||||
|
|
$
|
6,789
|
|
34.5
|
%
|
$
|
3,026
|
|
30.7
|
%
|
$
|
(96
|
)
|
(4.8
|
)%
|
||||||
91
Deferred tax assets and liabilities are the result of timing differences in recognition of revenue and expense for income tax and financial statement purposes.
Deferred income tax assets and (liabilities) were comprised of the following at
December 31
:
|
(Dollars in thousands)
|
2016
|
2015
|
||||||
|
Allowance for loan losses
|
$
|
2,641
|
|
$
|
2,904
|
|
||
|
Minimum pension liability
|
1,786
|
|
1,713
|
|
||||
|
Unrealized loss on securities available-for-sale
|
1,066
|
|
242
|
|
||||
|
Gross deferred tax assets
|
5,493
|
|
4,859
|
|
||||
|
Depreciation
|
(1,352
|
)
|
(883
|
)
|
||||
|
Pension
|
(6
|
)
|
(43
|
)
|
||||
|
Goodwill
|
(465
|
)
|
(452
|
)
|
||||
|
Gross deferred tax liabilities
|
(1,823
|
)
|
(1,378
|
)
|
||||
|
Net deferred tax asset
|
$
|
3,670
|
|
$
|
3,481
|
|
||
No
deferred income tax valuation allowance is provided since it is more likely than not that realization of the deferred income tax asset will occur in future years.
The Company prescribes a recognition threshold and a measurement attribute for the financial statement recognition and measurement of a tax position taken or expected to be taken in a tax return. Benefits from tax positions should be recognized in the financial statements only when it is more likely than not that the tax position will be sustained upon examination by the appropriate taxing authority that would have full knowledge of all relevant information. A tax position that meets the more-likely-than-not recognition threshold is measured at the largest amount of benefit that is greater than
50 percent
likely of being realized upon ultimate settlement. Tax positions that previously failed to meet the more-likely-than-not recognition threshold should be recognized in the first subsequent financial reporting period in which that threshold is met. Previously recognized tax positions that no longer meet the more-likely-than-not recognition threshold should be derecognized in the first subsequent financial reporting period in which that threshold is no longer met. There is currently
no
liability for uncertain tax positions and
no
known unrecognized tax benefits. With limited exception, the Company’s federal and state income tax returns for taxable years through
2012
have been closed for purposes of examination by the federal and state taxing jurisdictions.
The Company has granted loans to officers and directors of the Company and to their associates as well as loans to related companies. These related party loans are made on substantially the same terms, including interest rates and collateral, as those prevailing at the time for comparable transactions with unrelated parties and do not involve more than normal risk of collectability. Set forth below is a summary of the related loan activity.
|
(Dollars in thousands)
|
Balance at Beginning of Year
|
Borrowings
|
Executive Officer and Director Retirements
|
Repayments
|
Balance at End of Year
|
|||||||||||||||
|
December 31, 2016
|
$
|
42,840
|
|
$
|
251,708
|
|
$
|
(7,194
|
)
|
$
|
(258,818
|
)
|
$
|
28,536
|
|
|||||
|
December 31, 2015
|
$
|
39,083
|
|
$
|
357,230
|
|
$
|
—
|
|
$
|
(353,473
|
)
|
$
|
42,840
|
|
|||||
The Company held related party deposits of
$34.7 million
and
$16.9 million
at
December 31, 2016
and
December 31, 2015
, respectively.
The Company held
no
related party repurchase agreements at
December 31, 2016
and
December 31, 2015
.
92
The Company participates in a trusteed pension plan known as the Allegheny Group Retirement Plan covering virtually all full-time employees. Benefits are based on years of service and the employee's compensation. Accruals under the Plan were frozen as of
May 31, 2014
. Freezing the plan resulted in a re-measurement of the pension obligations and plan assets as of the freeze date. The pension obligation was re-measured using the discount rate based on the Citigroup Above Median Pension Discount Curve in effect on
May 31, 2014
of
4.46%
.
Pension expense was
$273 thousand
,
$256 thousand
and
$469 thousand
in
2016
,
2015
and
2014
, respectively.
Information pertaining to the activity in the Company’s defined benefit plan, using the latest available actuarial valuations with a measurement date of
December 31, 2016
and
2015
is as follows:
|
(Dollars in thousands)
|
2016
|
2015
|
||||||
|
Change in benefit obligation
|
||||||||
|
Benefit obligation at beginning of year
|
$
|
8,662
|
|
$
|
8,173
|
|
||
|
Service cost
|
—
|
|
—
|
|
||||
|
Interest cost
|
367
|
|
315
|
|
||||
|
Actuarial loss
|
4
|
|
276
|
|
||||
|
Assumption changes
|
179
|
|
97
|
|
||||
|
Curtailment impact
|
—
|
|
—
|
|
||||
|
Benefits paid
|
(191
|
)
|
(199
|
)
|
||||
|
Benefit obligation at end of year
|
$
|
9,021
|
|
$
|
8,662
|
|
||
|
Change in plan assets:
|
||||||||
|
Fair value of plan assets at beginning of year
|
$
|
4,486
|
|
$
|
4,471
|
|
||
|
Actual return on plan assets
|
96
|
|
(124
|
)
|
||||
|
Employer contribution
|
182
|
|
338
|
|
||||
|
Benefits paid
|
(191
|
)
|
(199
|
)
|
||||
|
Fair value of plan assets at end of year
|
$
|
4,573
|
|
$
|
4,486
|
|
||
|
Funded status
|
$
|
(4,448
|
)
|
$
|
(4,176
|
)
|
||
|
Unrecognized net actuarial loss
|
4,464
|
|
4,283
|
|
||||
|
Unrecognized prior service cost
|
—
|
|
—
|
|
||||
|
Prepaid pension cost recognized
|
$
|
16
|
|
$
|
107
|
|
||
|
Accumulated benefit obligation
|
$
|
9,021
|
|
$
|
8,662
|
|
||
At
December 31, 2016
,
2015
and
2014
, the weighted average assumptions used to determine the benefit obligation are as follows:
|
2016
|
2015
|
2014
|
|||||||
|
Discount rate
|
4.05
|
%
|
4.30
|
%
|
3.90
|
%
|
|||
|
Rate of compensation increase
|
n/a
|
|
n/a
|
|
n/a
|
|
|||
93
|
The components of net periodic pension cost are as follows:
|
||||||||||||
|
(Dollars in thousands)
|
2016
|
2015
|
2014
|
|||||||||
|
Service cost
|
$
|
—
|
|
$
|
—
|
|
$
|
346
|
|
|||
|
Interest cost
|
367
|
|
315
|
|
306
|
|
||||||
|
Expected return on plan assets
|
(330
|
)
|
(316
|
)
|
(319
|
)
|
||||||
|
Amortization of prior service costs
|
—
|
|
—
|
|
—
|
|
||||||
|
Amortization of net actuarial loss
|
236
|
|
257
|
|
136
|
|
||||||
|
Net periodic pension cost
|
$
|
273
|
|
$
|
256
|
|
$
|
469
|
|
|||
For the years
December 31, 2016
,
2015
and
2014
, the weighted average assumptions used to determine net periodic pension cost are as follows:
|
2016
|
2015
|
2014
|
|||||||
|
Discount rate
|
4.30
|
%
|
3.90
|
%
|
4.86
|
%
|
|||
|
Expected long-term rate of return on plan assets
|
6.75
|
%
|
6.75
|
%
|
7.50
|
%
|
|||
|
Rate of compensation increase
|
n/a
|
|
n/a
|
|
n/a
|
|
|||
The Company’s pension plan asset allocations at
December 31, 2016
and
2015
, as well as target allocations for
2016
are as follows:
|
12/31/2016
|
12/31/2015
|
|||||
|
Plan Assets
|
||||||
|
Cash
|
16
|
%
|
10
|
%
|
||
|
Fixed income
|
28
|
%
|
20
|
%
|
||
|
Alternative investments
|
9
|
%
|
19
|
%
|
||
|
Domestic equities
|
28
|
%
|
32
|
%
|
||
|
Foreign equities
|
19
|
%
|
19
|
%
|
||
|
Total
|
100
|
%
|
100
|
%
|
||
The estimated net loss (gain) for the plan that are expected to be amortized from accumulated other comprehensive income into net periodic benefit cost over the next fiscal year is
$241 thousand
.
The following table sets forth by level, within the fair value hierarchy, as defined in Note 18, "Fair Value Measurements" of the Notes to the Consolidated Financial Statements included in Item 8, Financial Statements and Supplementary Data, of this Annual Report on Form 10-K, the Plan’s assets at fair value as of
December 31, 2016
.
|
(Dollars in thousands)
|
Level I
|
Level II
|
Level III
|
Total
|
||||||||||||
|
Assets:
|
||||||||||||||||
|
Cash
|
$
|
732
|
|
$
|
—
|
|
$
|
—
|
|
$
|
732
|
|
||||
|
Fixed income
|
1,280
|
|
—
|
|
—
|
|
1,280
|
|
||||||||
|
Alternative investments
|
—
|
|
—
|
|
412
|
|
412
|
|
||||||||
|
Domestic equities
|
1,280
|
|
—
|
|
—
|
|
1,280
|
|
||||||||
|
Foreign equities
|
869
|
|
—
|
|
—
|
|
869
|
|
||||||||
|
Total assets at fair value
|
$
|
4,161
|
|
$
|
—
|
|
$
|
412
|
|
$
|
4,573
|
|
||||
94
The following table sets forth by level, within the fair value hierarchy, as defined in Note 18, "Fair Value Measurements" of the Notes to the Consolidated Financial Statements included in Item 8, Financial Statements and Supplementary Data, of this Annual Report on Form 10-K, the Plan’s assets at fair value as of
December 31, 2015
.
|
(Dollars in thousands)
|
Level I
|
Level II
|
Level III
|
Total
|
||||||||||||
|
Assets:
|
||||||||||||||||
|
Cash
|
$
|
449
|
|
$
|
—
|
|
$
|
—
|
|
$
|
449
|
|
||||
|
Fixed income
|
897
|
|
—
|
|
—
|
|
897
|
|
||||||||
|
Alternative investments
|
—
|
|
—
|
|
852
|
|
852
|
|
||||||||
|
Domestic equities
|
1,436
|
|
—
|
|
—
|
|
1,436
|
|
||||||||
|
Foreign equities
|
852
|
|
—
|
|
—
|
|
852
|
|
||||||||
|
Total assets at fair value
|
$
|
3,634
|
|
$
|
—
|
|
$
|
852
|
|
$
|
4,486
|
|
||||
Investment in government securities and short-term investments are valued at the closing price reported on the active market on which the individual securities are traded. Alternative investments and investment in debt securities are valued at quoted prices which are available but traded less frequently, and items that are fair valued using other financial instruments, the parameters of which can be directly observed. The methods described above may produce a fair value calculation that may not be indicative of net realizable value or reflective of future fair values. Furthermore, while the Plan believes its valuation methods are appropriate and consistent with other market participants, the use of different methodologies or assumptions to determine the fair value of certain financial instruments could result in a different fair value measurement at the reporting date.
|
Below we show the best estimate of the plan contribution for next fiscal year. We also show the benefits expected to be paid in each of the next five fiscal years, and in the aggregate for the five fiscal years thereafter.
|
||||
|
(Dollars in thousands)
|
Cash Flow
|
|||
|
Contributions for the period of 01/01/17 through 12/31/17
|
$
|
319
|
|
|
|
Estimated future benefit payments reflecting expected future service
|
|
|
||
|
2017
|
$
|
252
|
|
|
|
2018
|
$
|
260
|
|
|
|
2019
|
$
|
280
|
|
|
|
2020
|
$
|
298
|
|
|
|
2021
|
$
|
307
|
|
|
|
2022 through 2026
|
$
|
2,104
|
|
|
95
|
The table below summarizes the changes in carrying amounts of goodwill and other intangibles (core deposit intangibles) for the periods presented:
|
||||||||||||||||
|
|
Core Deposit Intangible
|
|||||||||||||||
|
(Dollars in thousands)
|
Goodwill
|
Gross
|
Accumulated Depreciation
|
Net
|
||||||||||||
|
Balance at January 1, 2016
|
$
|
18,480
|
|
$
|
1,006
|
|
$
|
(161
|
)
|
$
|
845
|
|
||||
|
Amortization expense
|
—
|
|
—
|
|
(101
|
)
|
(101
|
)
|
||||||||
|
Balance at December 31, 2016
|
$
|
18,480
|
|
$
|
1,006
|
|
$
|
(262
|
)
|
$
|
744
|
|
||||
|
Balance at January 1, 2015
|
$
|
17,779
|
|
$
|
128
|
|
$
|
(127
|
)
|
$
|
1
|
|
||||
|
Goodwill and core deposit intangible resulting from branch acquisition
|
701
|
|
878
|
|
—
|
|
878
|
|
||||||||
|
Amortization expense
|
—
|
|
—
|
|
(34
|
)
|
(34
|
)
|
||||||||
|
Balance at December 31, 2015
|
$
|
18,480
|
|
$
|
1,006
|
|
$
|
(161
|
)
|
$
|
845
|
|
||||
|
Balance at January 1, 2014
|
$
|
17,779
|
|
$
|
128
|
|
$
|
(123
|
)
|
$
|
5
|
|
||||
|
Amortization expense
|
—
|
|
—
|
|
(4
|
)
|
(4
|
)
|
||||||||
|
Balance at December 31, 2014
|
$
|
17,779
|
|
$
|
128
|
|
$
|
(127
|
)
|
$
|
1
|
|
||||
Goodwill represents the excess of the purchase price over the fair value of acquired net assets under the acquisition method of accounting. The value of the acquired core deposit relationships was determined using the present value of the difference between a market participant’s cost of obtaining alternative funds and the cost to maintain the acquired deposit base. The core deposit intangibles are being amortized over a
ten
-year period using an accelerated method. Goodwill in the amount of
$701 thousand
and core deposit intangibles in the amount of
$878 thousand
resulted from the branch acquisitions as discussed in Note 22, "Mergers and Acquisitions" of the Notes to the Consolidated Financial Statements included in Item 8, Financial Statements and Supplementary Data, of this Annual Report on Form 10-K.
|
The table below presents estimated amortization expense for the Company’s other intangible assets (dollars in thousands):
|
||||
|
2017
|
$
|
98
|
|
|
|
2018
|
96
|
|
||
|
2019
|
93
|
|
||
|
2020
|
90
|
|
||
|
2021
|
87
|
|
||
|
Thereafter
|
280
|
|
||
|
$
|
744
|
|
||
The Company’s assessment of qualitative factors determined that it is not more likely than not that the fair value of each reporting unit is less than its carrying amount and therefore, goodwill is not impaired as of
December 31, 2016
and
2015
. The Company has not identified any triggering events since the impairment evaluation that would indicate potential impairment.
Core deposit intangibles are evaluated for impairment if events and circumstances indicate a potential for impairment. Such an evaluation of other intangible assets is based on undiscounted cash flow projections.
No
impairment charges were recorded for other intangible assets in any of the periods presented.
On December 5, 2016, the Company entered into Securities Purchase Agreements with certain accredited investors. Pursuant to the Purchase Agreements, the Investors agreed to purchase an aggregate of
1,913,044
shares of the Company’s common stock, par value
$1.00
per share, at a price of
$11.50
per share, as part of a private placement (the “Private Placement”). The Private
96
Placement closed on December 6, 2016. The gross proceeds to the Company from the Private Placement were approximately
$22 million
or
$20.5 million
after stock issuance costs. The proceeds from the Private Placement were used by the Company to pay related transaction fees and expenses and for general corporate purposes. A portion of the proceeds were used for the redemption of the preferred stock issued to the United States Department of Treasury in connection with the Company’s participation in the Small Business Lending Fund, as discussed in Note 25, "Subsequent Events" of the Notes to the Consolidated Financial Statements included in Item 8, Financial Statements and Supplementary Data, of this Annual Report on Form 10-K.
The Purchase Agreements contain representations and warranties and covenants of the Company and the Investors that are customary in private placement transactions. The provisions of the Purchase Agreements also include an agreement by the Company to indemnify the Investors against certain liabilities.
The Purchase Agreements required the Company to file a registration statement with the Securities and Exchange Commission (the “SEC”) to register for resale the
1,913,044
shares of common stock issued to the Investors in the Private Placement. The registration statement was declared effective by the SEC on December 27, 2016.
On
June 30, 2014
, the Company filed Certificates of Designations for its Convertible Noncumulative Perpetual Preferred Stock, Series B (“Class B Preferred”) and its Convertible Noncumulative Perpetual Preferred Stock, Series C (“Class C Preferred”). The Class B Preferred Certificate designated
400
shares of preferred stock as Class B Preferred shares. The Class B Preferred shares carry an annual dividend rate of
6%
and are convertible into shares of Company common stock within
thirty days
after the first, second, third, fourth and fifth anniversaries of the original issue date, based on a common stock price of
$16
per share, as adjusted for future corporate activities. The Class B Preferred shares are redeemable by the Company on or after the fifth anniversary of the original issue date for Liquidation Amount, as defined therein, plus declared and unpaid dividends. Redemption is subject to any necessary regulatory approvals. In the event of liquidation of the Company, shares of Class B Preferred stock shall be junior to creditors of the Company and to the shares of Senior Noncumulative Perpetual Preferred Stock, Series A. Holders of Class B Preferred shares shall have no voting rights, except for authorization of senior shares of stock, amendment to the Class B Preferred shares, share exchanges, reclassifications or changes of control, or as required by law.
The Class C Preferred Certificate designated
383.4
shares of preferred stock as Class C Preferred shares. The Class C Preferred shares carry an annual dividend rate of
6.5%
and are convertible into shares of Company common stock within
30 days
after the first, second, third, fourth and fifth anniversaries of the original issue date, based on a common stock price of
$16
per share, as adjusted for future corporate activities. The Class C Preferred shares are redeemable by the Company on or after the fifth anniversary of the original issue date for Liquidation Amount, as defined therein, plus declared and unpaid dividends. Redemption is subject to any necessary regulatory approvals. In the event of liquidation of the Company, shares of Class C Preferred stock shall be junior to creditors of the Company and to the shares of Senior Noncumulative Perpetual Preferred Stock, Series A and the Class B Preferred shares. Holders of Class C Preferred shares shall have no voting rights, except for authorization of senior shares of stock, amendment to the Class C Preferred shares, share exchanges, reclassifications or changes of control, or as required by law. The proceeds of these preferred stock offerings will be used to support continued growth of the Company and its subsidiary.
On
September 8, 2011
MVB received
$8.5 million
in Small Business Lending Fund (SBLF) capital. MVB issued
8,500
shares of
$1,000
per share preferred stock with dividends payable in arrears on
January 1, April 1, July 1 and October 1
each year. MVB's loan production qualified for the lowest dividend rate possible of
1%
. MVB may continue to utilize the SBLF capital through March 8, 2016 at the
1%
dividend rate. After that time, if the SBLF is not retired, the dividend rate increases to
9%
. On January 5, 2017, the Company redeemed all of the
8,500
shares of its Senior Non-Cumulative Perpetual Preferred Stock, Series A, liquidation amount
$1,000
per share (“Series A Preferred Stock”), that had been issued to the United States Department of the Treasury, on September 8, 2011, pursuant to the SBLF (see Note 25, "Subsequent Events" of the Notes to the Consolidated Financial Statements included in Item 8, Financial Statements and Supplementary Data, of this Annual Report on Form 10-K.)
The MVB Financial Corp. Incentive Stock Plan (the "Plan") provides for the issuance of stock options to selected employees. Under the provisions of the plan, the option price per share shall not be less than the fair market value of the common stock on the date of the grant. These options also expire
10 years
from the date of the grant. With the exception of
22,000
shares granted in 2010 that vest in
3 years
and expire
10 years
from the date of grant, all options granted vest in
5 years
and expire
10 years
from the date of the grant. As of
December 31, 2016
, the Plan had
2.2 million
shares authorized and
400,825
shares remaining available for issuance.
Total compensation expense recorded on stock options during
2016
,
2015
and
2014
was
$568 thousand
,
$413 thousand
and
$321 thousand
, respectively. Proceeds from stock options exercised were
$32 thousand
,
$(448) thousand
and
$63 thousand
during
97
2016
,
2015
and
2014
respectively. During both 2016 and 2015, certain options were exercised in cashless transactions. Shares were forfeited related to exercise price and tax withholdings and the Company paid tax authorities amounts due resulting in a net cash outflow.
The following summarizes MVB’s stock options as of and for the year ended
December 31, 2016
, and the changes for the year then ended:
|
2016
|
2015
|
|||||||||||||
|
Number of Shares
|
Weighted Average Exercise Price
|
Number of Shares
|
Weighted Average Exercise Price
|
|||||||||||
|
Outstanding at beginning of year
|
1,190,295
|
|
$
|
13.15
|
|
1,355,905
|
|
$
|
12.21
|
|
||||
|
Granted
|
432,000
|
|
12.72
|
|
45,500
|
|
14.80
|
|
||||||
|
Exercised
|
(55,000
|
)
|
9.02
|
|
(204,670
|
)
|
7.31
|
|
||||||
|
Forfeited/expired
|
(67,500
|
)
|
14.59
|
|
(6,440
|
)
|
13.33
|
|
||||||
|
Outstanding at end of year
|
1,499,795
|
|
$
|
13.11
|
|
1,190,295
|
|
$
|
13.15
|
|
||||
|
Exercisable at end of year
|
768,598
|
|
$
|
12.75
|
|
542,499
|
|
$
|
11.82
|
|
||||
|
Weighted-average fair value of options granted during 2016
|
|
|
$
|
2.98
|
|
|
|
|
|
|||||
|
Weighted-average fair value of options granted during 2015
|
|
|
$
|
2.72
|
|
|
|
|
|
|||||
|
Weighted-average fair value of options granted during 2014
|
|
$
|
3.05
|
|
|
|
|
|
||||||
The intrinsic value of options exercised during
2016
,
2015
and
2014
was
$108 thousand
,
$1.6 million
and
$37 thousand
, respectively.
The fair value for the options was estimated at the date of grant using a Black-Scholes option-pricing model with average risk-free interest rates of
1.31%
,
2.16%
and
2.65%
for
2016
,
2015
and
2014
, respectively, and a weighted average expected life of the options of
7 years
for all three years. The expected volatility of MVB’s stock price used for
2016
options was
19.07%
, while for the
2015
options it was
13.90%
and
2014
options it was
10.23%
. The expected dividend yield used was
0.43%
for
2016
and
0.51%
for both
2015
and
2014
.
The following summarizes information related to the total outstanding and exercisable options at
December 31, 2016
:
|
Options Outstanding
|
Options Exercisable
|
||||||||||||||||||||
|
Total Options
|
Weighted-Average Exercise Price
|
Intrinsic Value
|
Weighted-Average Remaining Life
|
Total Options
|
Weighted-Average Exercise Price
|
Intrinsic Value
|
Weighted-Average Remaining Life
|
||||||||||||||
|
1,499,795
|
$
|
13.11
|
|
(465,921
|
)
|
6.03
|
768,598
|
|
$
|
12.75
|
|
37,711
|
|
4.35
|
|||||||
The Company and the Bank are subject to various regulatory capital requirements administered by the federal banking agencies. Failure to meet minimum capital requirements can initiate certain mandatory, and possibly additional discretionary, actions by regulators that, if undertaken, could have a direct material effect on the Company’s consolidated financial statements. Under capital adequacy guidelines the Company must meet specific capital guidelines that involve quantitative measures of the Company’s assets, liabilities, and certain off-balance sheet items as calculated under regulatory accounting practices. The Company’s capital amounts and classifications are also subject to qualitative judgments by the regulators about components, risk weightings, and other factors.
Capital adequacy guidelines have recently changed as a result of the Dodd-Frank Act and a separate, international capital initiative known as “Basel III.” Regulators have issued rules implementing these requirements (“Revised Capital Rules”). Among other things, the Revised Capital Rules raise the minimum thresholds for required capital and revise certain aspects of the
98
definitions and elements of the capital that can be used to satisfy these required minimum thresholds. While the rules became effective on
January 1, 2014
for certain large banking organizations, most banking organizations, including MVB Financial Corp and the Bank, were required to begin complying with these new requirements on
January 1, 2015
.
Quantitative measures established by regulation to ensure capital adequacy require the Company to maintain minimum amounts and ratios of Total capital, Tier 1 capital and Tier 1 common equity to risk-weighted assets, and of Tier 1 capital to average assets, as defined. As of
December 31, 2016
and
2015
, the Company meets all capital adequacy requirements to which it is subject.
|
The most recent notification from the Federal Deposit Insurance Corporation categorized the Bank as well capitalized under the regulatory framework for prompt corrective action. To be categorized as well capitalized, the Bank must maintain minimum total risk-based, Tier 1 risk-based, Tier 1 common equity risk-based and Tier 1 leverage ratios as set forth in the table below. Both the Company’s and the Bank’s actual capital amounts and ratios are presented in the table below.
|
|||||||||||||||||||||
|
|
Actual
|
Minimum to be Well Capitalized
|
Minimum for Capital Adequacy Purposes
|
||||||||||||||||||
|
(Dollars in thousands)
|
Amount
|
Ratio
|
Amount
|
Ratio
|
Amount
|
Ratio
|
|||||||||||||||
|
As of December 31, 2016
|
|
|
|
|
|
|
|
|
|
|
|
|
|||||||||
|
Total Capital (to risk-weighted assets)
|
|||||||||||||||||||||
|
Consolidated
|
$
|
174,093
|
|
15.4
|
%
|
n/a
|
|
n/a
|
|
$
|
90,699
|
|
8.0
|
%
|
|||||||
|
Subsidiary Bank
|
$
|
163,394
|
|
14.5
|
%
|
$
|
113,027
|
|
10.0
|
%
|
$
|
90,422
|
|
8.0
|
%
|
||||||
|
Tier 1 Capital (to risk-weighted assets)
|
|||||||||||||||||||||
|
Consolidated
|
$
|
135,100
|
|
11.9
|
%
|
n/a
|
|
n/a
|
|
$
|
68,025
|
|
6.0
|
%
|
|||||||
|
Subsidiary Bank
|
$
|
153,737
|
|
13.6
|
%
|
$
|
90,422
|
|
8.0
|
%
|
$
|
67,816
|
|
6.0
|
%
|
||||||
|
Common Equity Tier 1 Capital (to risk-weighted assets)
|
|||||||||||||||||||||
|
Consolidated
|
$
|
114,642
|
|
10.1
|
%
|
n/a
|
|
n/a
|
|
$
|
51,018
|
|
4.5
|
%
|
|||||||
|
Subsidiary Bank
|
$
|
153,737
|
|
13.6
|
%
|
$
|
73,468
|
|
6.5
|
%
|
$
|
50,862
|
|
4.5
|
%
|
||||||
|
Tier 1 Capital (to average assets)
|
|||||||||||||||||||||
|
Consolidated
|
$
|
135,100
|
|
9.5
|
%
|
n/a
|
|
n/a
|
|
$
|
56,655
|
|
4.0
|
%
|
|||||||
|
Subsidiary Bank
|
$
|
153,737
|
|
10.9
|
%
|
$
|
70,651
|
|
5.0
|
%
|
$
|
56,521
|
|
4.0
|
%
|
||||||
|
As of December 31, 2015
|
|
|
|
|
|
|
|
|
|
|
|
|
|||||||||
|
Total Capital (to risk-weighted assets)
|
|||||||||||||||||||||
|
Consolidated
|
$
|
140,376
|
|
12.9
|
%
|
n/a
|
|
n/a
|
|
$
|
86,997
|
|
8.0
|
%
|
|||||||
|
Subsidiary Bank
|
$
|
132,013
|
|
12.2
|
%
|
$
|
108,318
|
|
10.0
|
%
|
$
|
86,654
|
|
8.0
|
%
|
||||||
|
Tier 1 Capital (to risk-weighted assets)
|
|||||||||||||||||||||
|
Consolidated
|
$
|
102,952
|
|
9.5
|
%
|
n/a
|
|
n/a
|
|
$
|
65,248
|
|
6.0
|
%
|
|||||||
|
Subsidiary Bank
|
$
|
123,989
|
|
11.5
|
%
|
$
|
86,654
|
|
8.0
|
%
|
$
|
64,991
|
|
6.0
|
%
|
||||||
|
Common Equity Tier 1 Capital (to risk-weighted assets)
|
|||||||||||||||||||||
|
Consolidated
|
$
|
82,494
|
|
7.6
|
%
|
n/a
|
|
n/a
|
|
$
|
48,936
|
|
4.5
|
%
|
|||||||
|
Subsidiary Bank
|
$
|
123,989
|
|
11.5
|
%
|
$
|
70,407
|
|
6.5
|
%
|
$
|
48,743
|
|
4.5
|
%
|
||||||
|
Tier 1 Capital (to average assets)
|
|||||||||||||||||||||
|
Consolidated
|
$
|
102,952
|
|
7.8
|
%
|
n/a
|
|
n/a
|
|
$
|
53,019
|
|
4.0
|
%
|
|||||||
|
Subsidiary Bank
|
$
|
123,989
|
|
9.5
|
%
|
$
|
65,238
|
|
5.0
|
%
|
$
|
52,191
|
|
4.0
|
%
|
||||||
99
The approval of the regulatory agencies is required if the total of all dividends declared by the Bank in any calendar year exceeds the Bank’s net profits, as defined, for that year combined with its retained net profits for the preceding
two
calendar years.
The Company leases land and building space for the operation of some banking offices. All such leases qualify as operating leases. Following is a schedule by year of future minimum lease payments required under operating leases that have initial or remaining non-cancelable lease terms in excess of one year as of
December 31, 2016
:
|
(Dollars in thousands)
|
||||
|
Years ended December 31:
|
|
|
||
|
2017
|
$
|
1,898
|
|
|
|
2018
|
1,561
|
|
||
|
2019
|
965
|
|
||
|
2020
|
842
|
|
||
|
2021
|
869
|
|
||
|
Thereafter
|
5,001
|
|
||
|
Total minimum payments required:
|
$
|
11,136
|
|
|
Total rent expense for the years ended
December 31, 2016
,
2015
and
2014
was
$1.7 million
,
$1.8 million
and
$1.7 million
, respectively.
The following summarizes the methods and significant assumptions used by the Company in estimating its fair value disclosures for financial instruments.
|
Level I:
|
Quoted prices are available in active markets for identical assets or liabilities as of the reported date.
|
|
Level II:
|
Pricing inputs are other than quoted prices in active markets, which are either directly or indirectly observable as of the reported date. The nature of these assets and liabilities include items for which quoted prices are available but traded less frequently, and items that are fair valued using other financial instruments, the parameters of which can be directly observed.
|
|
Level III:
|
Assets and liabilities that have little to no pricing observability as of the reported date. These items do not have two-way markets and are measured using management’s best estimate of fair value, where the inputs into the determination of fair value require significant management judgment or estimation.
|
Estimated fair values have been determined by the Company using historical data, as generally provided in the Company’s regulatory reports, and an estimation methodology suitable for each category of financial instruments. The Company’s fair value estimates, methods and assumptions are set forth below for the Company’s other financial instruments.
Cash and cash equivalents:
The carrying amounts for cash and cash equivalents approximate fair value because they have original maturities of
90 days
or less and do not present unanticipated credit concerns.
Certificates of deposits:
The fair values for certificates of deposits are computed based on scheduled future cash flows of principal and interest, discounted at interest rates currently offered for certificates of deposits with similar terms of investors. No prepayments of principal are assumed.
Securities:
Fair values of securities are based on quoted market prices, where available. If quoted market prices are not available, estimated fair values are based on quoted market prices of comparable securities.
100
Loans held for sale:
Loans held for sale are reported at fair value. These loans currently consist of one-to-four-family residential loans originated for sale in the secondary market. Fair value is based on committed market rates or the price secondary markets are currently offering for similar loans using observable market data. (Level II)
Loans:
The fair values for loans are computed based on scheduled future cash flows of principal and interest, discounted at interest rates currently offered for loans with similar terms of borrowers of similar credit quality. No prepayments of principal are assumed.
Mortgage servicing rights:
The carrying value of mortgage servicing rights approximates their fair value.
Interest rate lock commitment:
For mortgage interest rate locks, the fair value is based on either (i) the price of the underlying loans obtained from an investor for loans that will be delivered on a best efforts basis or (ii) the observable price for individual loans traded in the secondary market for loans that will be delivered on a mandatory basis less (iii) expected costs to deliver the interest rate locks, any expected “pull through rate” is multiplied by this calculation to estimate the derivative value.
Mortgage-backed security hedges:
MBS hedges are used to mitigate interest rate risk for residential mortgage loans held for sale and interest rate locks and manage expected funding percentages. These instruments are considered derivatives and are recorded at fair value based on observable market data of the individual mortgage-backed securities.
Interest rate cap:
The fair value of the interest rate cap is determined at the end of each quarter by using Bloomberg Finance which values the interest rate cap using observable inputs from forward and futures yield curves as well as standard market volatility.
Interest rate swap:
Interest rate swaps are recorded at fair value based on third party vendors who compile prices from various sources and may determine fair value of identical or similar instruments by using pricing models that consider observable market data.
Accrued interest receivable and payable and repurchase agreements:
The carrying values of accrued interest receivable and payable approximate their fair values.
Deposits:
The fair values of demand deposits (i.e., noninterest bearing checking, NOW and money market), savings accounts and other variable rate deposits approximate their carrying values. Fair values of fixed maturity deposits are estimated using a discounted cash flow methodology at rates currently offered for deposits with similar remaining maturities. Any intangible value of long-term relationships with depositors is not considered in estimating the fair values disclosed.
FHLB and other borrowings:
The fair values for loans are computed based on scheduled future cash flows of principal and interest, discounted at interest rates currently offered for loans with similar terms of borrowers of similar credit quality. No prepayments of principal are assumed.
Off-balance sheet instruments:
The fair values of commitments to extend credit and standby letters of credit are estimated using the fees currently charged to enter into similar agreements, taking into account the remaining terms of agreements and the present credit standing of the counterparties. The amounts of fees currently charged on commitments and standby letters of credit are deemed insignificant, and therefore, the estimated fair values and carrying values are not shown.
101
The carrying values and estimated fair values of the Company’s financial instruments are summarized as follows:
|
Fair Value Measurements at:
|
||||||||||||||||||||
|
(Dollars in thousands)
|
Carrying Value
|
Estimated Fair Value
|
Quoted Prices in Active Markets for Identical Assets (Level I)
|
Significant Other Observable Inputs (Level II)
|
Significant Unobservable Inputs (Level III)
|
|||||||||||||||
|
December 31, 2016
|
||||||||||||||||||||
|
Financial assets:
|
|
|
|
|
|
|
|
|
|
|
||||||||||
|
Cash and cash equivalents
|
$
|
17,340
|
|
$
|
17,340
|
|
$
|
17,340
|
|
$
|
—
|
|
$
|
—
|
|
|||||
|
Certificates of deposits with other banks
|
14,527
|
|
14,985
|
|
—
|
|
14,985
|
|
—
|
|
||||||||||
|
Securities available-for-sale
|
162,368
|
|
162,368
|
|
—
|
|
162,368
|
|
—
|
|
||||||||||
|
Loans held for sale
|
90,174
|
|
90,174
|
|
—
|
|
90,174
|
|
—
|
|
||||||||||
|
Loans, net
|
1,043,764
|
|
1,035,437
|
|
—
|
|
—
|
|
1,035,437
|
|
||||||||||
|
Mortgage servicing rights
|
190
|
|
190
|
|
—
|
|
—
|
|
190
|
|
||||||||||
|
Interest rate lock commitment
|
1,546
|
|
1,546
|
|
—
|
|
—
|
|
1,546
|
|
||||||||||
|
Mortgage-backed security hedges
|
372
|
|
372
|
|
—
|
|
372
|
|
—
|
|
||||||||||
|
Interest rate swap
|
250
|
|
250
|
|
—
|
|
250
|
|
—
|
|
||||||||||
|
Interest rate cap
|
268
|
|
268
|
|
—
|
|
268
|
|
—
|
|
||||||||||
|
Accrued interest receivable
|
3,951
|
|
3,951
|
|
—
|
|
1,002
|
|
2,949
|
|
||||||||||
|
Financial liabilities:
|
|
|
|
|
|
|
|
|
|
|
||||||||||
|
Deposits
|
$
|
1,107,017
|
|
$
|
1,116,174
|
|
$
|
—
|
|
$
|
1,116,174
|
|
$
|
—
|
|
|||||
|
Repurchase agreements
|
25,160
|
|
25,160
|
|
—
|
|
25,160
|
|
—
|
|
||||||||||
|
FHLB and other borrowings
|
90,921
|
|
90,919
|
|
—
|
|
90,919
|
|
—
|
|
||||||||||
|
Interest rate swap
|
250
|
|
250
|
|
—
|
|
250
|
|
—
|
|
||||||||||
|
Accrued interest payable
|
741
|
|
741
|
|
—
|
|
741
|
|
—
|
|
||||||||||
|
Subordinated debt
|
33,524
|
|
32,275
|
|
—
|
|
32,275
|
|
—
|
|
||||||||||
|
December 31, 2015
|
|
|
|
|
|
|||||||||||||||
|
Financial assets:
|
|
|
|
|
|
|
|
|
|
|
||||||||||
|
Cash and cash equivalents
|
$
|
29,133
|
|
$
|
29,133
|
|
$
|
29,133
|
|
$
|
—
|
|
$
|
—
|
|
|||||
|
Certificates of deposits with other banks
|
13,150
|
|
13,270
|
|
—
|
|
13,270
|
|
—
|
|
||||||||||
|
Securities available-for-sale
|
70,256
|
|
70,256
|
|
—
|
|
70,256
|
|
—
|
|
||||||||||
|
Securities held-to-maturity
|
52,859
|
|
54,470
|
|
—
|
|
54,470
|
|
—
|
|
||||||||||
|
Loans held for sale
|
102,623
|
|
102,623
|
|
—
|
|
102,623
|
|
—
|
|
||||||||||
|
Loans, net
|
1,024,164
|
|
1,034,832
|
|
—
|
|
—
|
|
1,034,832
|
|
||||||||||
|
Mortgage servicing rights
|
956
|
|
956
|
|
—
|
|
—
|
|
956
|
|
||||||||||
|
Interest rate lock commitment
|
1,537
|
|
1,537
|
|
—
|
|
—
|
|
1,537
|
|
||||||||||
|
Interest rate swap
|
405
|
|
405
|
|
—
|
|
405
|
|
—
|
|
||||||||||
|
Interest rate cap
|
437
|
|
437
|
|
—
|
|
437
|
|
—
|
|
||||||||||
|
Accrued interest receivable
|
3,356
|
|
3,356
|
|
—
|
|
723
|
|
2,633
|
|
||||||||||
|
Financial liabilities:
|
||||||||||||||||||||
|
Deposits
|
$
|
1,012,314
|
|
$
|
1,015,521
|
|
$
|
—
|
|
$
|
1,015,521
|
|
$
|
—
|
|
|||||
|
Repurchase agreements
|
27,437
|
|
27,437
|
|
—
|
|
27,437
|
|
—
|
|
||||||||||
|
FHLB and other borrowings
|
183,198
|
|
183,211
|
|
—
|
|
183,211
|
|
—
|
|
||||||||||
|
Mortgage-backed security hedges
|
19
|
|
19
|
|
—
|
|
19
|
|
—
|
|
||||||||||
|
Interest rate swap
|
405
|
|
405
|
|
—
|
|
405
|
|
—
|
|
||||||||||
|
Accrued interest payable
|
474
|
|
474
|
|
—
|
|
474
|
|
—
|
|
||||||||||
|
Subordinated debt
|
33,524
|
|
32,172
|
|
—
|
|
32,172
|
|
—
|
|
||||||||||
Fair value estimates are made at a specific point in time, based on relevant market information about the financial instrument. These estimates do not reflect any premium or discount that could result from offering for sale at one time the Company’s entire holdings of a particular financial instrument. Because no market exists for a significant portion of the Company’s financial instruments, fair value estimates are based on judgments regarding future expected loss experience, current economic conditions, risk characteristics of various financial instruments and other factors. These estimates are subjective in nature and involve uncertainties and matters of significant judgment and therefore, cannot be determined with precision. Changes in assumptions
102
could significantly affect the estimates. Fair value estimates are based on existing on-and-off balance sheet financial instruments without attempting to estimate the value of anticipated future business and the value of assets and liabilities that are not considered financial instruments.
Accounting standards require that the Company adopt fair value measurement for financial assets and financial liabilities. This enhanced guidance for using fair value to measure assets and liabilities applies whenever other standards require or permit assets or liabilities to be measured at fair value. This guidance does not expand the use of fair value in any new circumstances.
Accounting standards establish a hierarchal disclosure framework associated with the level of pricing observability utilized in measuring assets and liabilities at fair value. The three broad levels defined by these standards are as follows:
|
Level I:
|
Quoted prices are available in active markets for identical assets or liabilities as of the reported date.
|
|
Level II:
|
Pricing inputs are other than quoted prices in active markets, which are either directly or indirectly observable as of the reported date. The nature of these assets and liabilities include items for which quoted prices are available but traded less frequently, and items that are fair valued using other financial instruments, the parameters of which can be directly observed.
|
|
Level III:
|
Assets and liabilities that have little to no pricing observability as of the reported date. These items do not have two-way markets and are measured using management’s best estimate of fair value, where the inputs into the determination of fair value require significant management judgment or estimation.
|
Assets Measured on a Recurring Basis
As required by accounting standards, financial assets and liabilities are classified in their entirety based on the lowest level of input that is significant to the fair value measurement. The Company classified investments in government securities as Level II instruments and valued them using the market approach. The following measurements are made on a recurring basis.
|
•
|
Available-for-sale investment securities —
Available-for-sale investment securities are recorded at fair value on a recurring basis. Fair value measurement is based upon quoted prices, if available. If quoted prices are not available, fair values are measured using independent pricing models or other model-based valuation techniques such as the present value of future cash flows, adjusted for the security's credit rating, prepayment assumptions and other factors such as credit loss assumptions. Level I securities include those traded on an active exchange, such as the New York Stock Exchange, U.S. Treasury securities that are traded by dealers or brokers in active over-the-counter markets and money market funds. Level II securities include mortgage-backed securities issued by government sponsored entities and private label entities, municipal bonds and corporate debt securities. There have been no changes in valuation techniques for the year ended
December 31, 2016
. Valuation techniques are consistent with techniques used in prior periods.
|
|
•
|
Loans held for sale —
The fair value of mortgage loans held for sale is determined, when possible, using quoted secondary-market prices or investor commitments. If no such quoted price exists, the fair value of a loan is determined using quoted prices for a similar asset or assets, adjusted for the specific attributes of that loan, which would be used by other market participants.
|
|
•
|
Interest rate lock commitment —
The Company estimates the fair value of interest rate lock commitments based on the value of the underlying mortgage loan, quoted mortgage-backed security prices and estimates of the fair value of the mortgage servicing rights and the probability that the mortgage loan will fund within the terms of the interest rate lock commitments.
|
|
•
|
Mortgage-backed security hedges —
MBS hedges are considered derivatives and are recorded at fair value based on observable market data of the individual mortgage-backed security.
|
|
•
|
Interest rate cap —
The fair value of the interest rate cap is determined at the end of each quarter by using Bloomberg Finance which values the interest rate cap using observable inputs from forward and futures yield curves as well as standard market volatility.
|
103
|
•
|
Interest rate swap —
Interest rate swaps are recorded at fair value based on third party vendors who compile prices from various sources and may determine fair value of identical or similar instruments by using pricing models that consider observable market data.
|
The following tables present the assets reported on the consolidated statements of financial condition at their fair value on a recurring basis as of
December 31, 2016
and
2015
by level within the fair value hierarchy. Financial assets and liabilities are classified in their entirety based on the lowest level of input that is significant to the fair value measurement.
|
|
December 31, 2016
|
|||||||||||||||
|
(Dollars in thousands)
|
Level I
|
Level II
|
Level III
|
Total
|
||||||||||||
|
Assets:
|
|
|
|
|
|
|
|
|
||||||||
|
U.S. Government Agency securities
|
$
|
—
|
|
$
|
28,816
|
|
$
|
—
|
|
$
|
28,816
|
|
||||
|
U.S. Sponsored Mortgage backed securities
|
—
|
|
54,732
|
|
—
|
|
54,732
|
|
||||||||
|
Municipal securities
|
—
|
|
70,796
|
|
—
|
|
70,796
|
|
||||||||
|
Equity and other securities
|
—
|
|
8,024
|
|
—
|
|
8,024
|
|
||||||||
|
Loans held for sale
|
—
|
|
90,174
|
|
—
|
|
90,174
|
|
||||||||
|
Interest rate lock commitment
|
—
|
|
—
|
|
1,546
|
|
1,546
|
|
||||||||
|
Mortgage-backed security hedges
|
—
|
|
372
|
|
—
|
|
372
|
|
||||||||
|
Interest rate swap
|
—
|
|
250
|
|
—
|
|
250
|
|
||||||||
|
Interest rate cap
|
—
|
|
268
|
|
—
|
|
268
|
|
||||||||
|
Liabilities:
|
|
|
|
|
|
|
|
|
||||||||
|
Interest rate swap
|
—
|
|
250
|
|
—
|
|
250
|
|
||||||||
|
|
December 31, 2015
|
|||||||||||||||
|
(Dollars in thousands)
|
Level I
|
Level II
|
Level III
|
Total
|
||||||||||||
|
Assets:
|
|
|
|
|
|
|
|
|
||||||||
|
U.S. Government Agency securities
|
$
|
—
|
|
$
|
29,351
|
|
$
|
—
|
|
$
|
29,351
|
|
||||
|
U.S. Sponsored Mortgage backed securities
|
—
|
|
33,714
|
|
—
|
|
33,714
|
|
||||||||
|
Municipal securities
|
—
|
|
1,798
|
|
—
|
|
1,798
|
|
||||||||
|
Equity and other securities
|
—
|
|
5,393
|
|
—
|
|
5,393
|
|
||||||||
|
Loans held for sale
|
—
|
|
102,623
|
|
—
|
|
102,623
|
|
||||||||
|
Interest rate lock commitment
|
—
|
|
—
|
|
1,537
|
|
1,537
|
|
||||||||
|
Interest rate swap
|
—
|
|
405
|
|
—
|
|
405
|
|
||||||||
|
Interest rate cap
|
—
|
|
437
|
|
—
|
|
437
|
|
||||||||
|
Liabilities:
|
|
|
|
|
|
|
|
|
||||||||
|
Interest rate swap
|
—
|
|
405
|
|
—
|
|
405
|
|
||||||||
|
Mortgage-backed security hedges
|
—
|
|
19
|
|
—
|
|
19
|
|
||||||||
104
|
The following table represents recurring level III assets:
|
||||||||
|
Interest Rate Lock Commitments
|
December 31, 2016
|
December 31, 2015
|
||||||
|
(Dollars in thousands)
|
|
|
|
|
||||
|
Balance, beginning of period
|
$
|
1,537
|
|
$
|
1,020
|
|
||
|
Realized and unrealized gains included in earnings
|
9
|
|
517
|
|
||||
|
Balance, end of period
|
$
|
1,546
|
|
$
|
1,537
|
|
||
Assets Measured on a Nonrecurring Basis
The Company may be required, from time to time, to measure certain financial assets, financial liabilities, non-financial assets and non-financial liabilities at fair value on a nonrecurring basis in accordance with U.S. generally accepted accounting principles. These include assets that are measured at the lower of cost or market value that were recognized at fair value below cost at the end of the period. Certain non-financial assets measured at fair value on a non-recurring basis include foreclosed assets (upon initial recognition or subsequent impairment), non-financial assets and non-financial liabilities measured at fair value in the second step of a goodwill impairment test, and intangible assets and other non-financial long-lived assets measured at fair value for impairment assessment. Non-financial assets measured at fair value on a nonrecurring basis during
2016
and
2015
include certain foreclosed assets which, upon initial recognition, were remeasured and reported at fair value through a charge-off to the allowance for possible loan losses and certain foreclosed assets which, subsequent to their initial recognition, were remeasured at fair value through a write-down included in other noninterest expense.
|
•
|
Impaired Loans —
Loans for which it is probable that payment of interest and principal will not be made in accordance with the contractual terms of the loan agreement are considered impaired. Once a loan is identified as individually impaired, management measures impairment using one of several methods, including collateral value, liquidation value and discounted cash flows. Those impaired loans not requiring an allowance represent loans for which the fair value of the expected repayments or collateral exceed the recorded investments in such loans. Collateral values are estimated using Level II inputs based on observable market data or Level III inputs based on customized discounting criteria. For a majority of impaired real estate related loans, the Company obtains a current external appraisal. Other valuation techniques are used as well, including internal valuations, comparable property analysis and contractual sales information.
|
|
•
|
Other Real Estate owned —
Other real estate owned, which is obtained through the Bank’s foreclosure process is valued utilizing the appraised collateral value. Collateral values are estimated using Level II inputs based on observable market data or Level III inputs based on customized discounting criteria. At the time, the foreclosure is completed, the Company obtains a current external appraisal.
|
Assets measured at fair value on a nonrecurring basis as of
December 31, 2016
and
2015
are included in the table below:
|
(Dollars in thousands)
|
December 31, 2016
|
|||||||||||||||
|
|
Level I
|
Level II
|
Level III
|
Total
|
||||||||||||
|
Impaired loans
|
$
|
—
|
|
$
|
—
|
|
$
|
11,609
|
|
$
|
11,609
|
|
||||
|
Other real estate owned
|
—
|
|
—
|
|
414
|
|
414
|
|
||||||||
|
(Dollars in thousands)
|
December 31, 2015
|
|||||||||||||||
|
|
Level I
|
Level II
|
Level III
|
Total
|
||||||||||||
|
Impaired loans
|
$
|
—
|
|
$
|
—
|
|
$
|
14,362
|
|
$
|
14,362
|
|
||||
|
Other real estate owned
|
—
|
|
—
|
|
239
|
|
239
|
|
||||||||
105
The following tables presents quantitative information about the Level III significant unobservable inputs for assets and liabilities measured at fair value at
December 31, 2016
and
2015
.
|
|
Quantitative Information about Level III Fair Value Measurements
|
|||||||||
|
(Dollars in thousands)
|
Fair Value
|
Valuation Technique
|
Unobservable Input
|
Range
|
||||||
|
December 31, 2016
|
||||||||||
|
Nonrecurring measurements:
|
||||||||||
|
Impaired loans
|
$
|
11,609
|
|
Appraisal of collateral
1
|
Appraisal adjustments
2
|
20% - 62%
|
||||
|
|
|
|
|
Liquidation expense
2
|
5% - 10%
|
|||||
|
Other real estate owned
|
$
|
414
|
|
Appraisal of collateral
1
|
Appraisal adjustments
2
|
20% - 30%
|
||||
|
|
|
|
|
Liquidation expense
2
|
5% - 10%
|
|||||
|
Recurring measurements:
|
||||||||||
|
Interest rate lock commitments
|
$
|
1,546
|
|
Pricing model
|
Pull through rates
|
73% - 85%
|
||||
|
|
Quantitative Information about Level III Fair Value Measurements
|
|||||||||
|
(Dollars in thousands)
|
Fair Value
|
Valuation Technique
|
Unobservable Input
|
Range
|
||||||
|
December 31, 2015
|
||||||||||
|
Nonrecurring measurements:
|
||||||||||
|
Impaired loans
|
$
|
14,362
|
|
Appraisal of collateral
1
|
Appraisal adjustments
2
|
20% - 62%
|
||||
|
|
|
|
|
Liquidation expense
2
|
5% - 10%
|
|||||
|
Other real estate owned
|
$
|
239
|
|
Appraisal of collateral
1
|
Appraisal adjustments
2
|
20% - 30%
|
||||
|
|
|
|
|
Liquidation expense
2
|
5% - 10%
|
|||||
|
Recurring measurements:
|
||||||||||
|
Interest rate lock commitments
|
$
|
1,537
|
|
Pricing model
|
Pull through rates
|
76% - 85%
|
||||
1
Fair value is generally determined through independent appraisals of the underlying collateral, which generally include various level III inputs which are not identifiable.
2
Appraisals may be adjusted by management for qualitative factors such as economic conditions and estimated liquidation expenses. The range and weighted average of liquidation expenses and other appraisal adjustments are presented as a percent of the appraisal.
106
The following tables present the components of accumulated other comprehensive income (“AOCI”) for the years ended
December 31
:
|
(Dollars in thousands)
|
2016
|
2015
|
2014
|
|
||||||||||
|
Details about AOCI Components
|
Amount Reclassified from AOCI
|
Amount Reclassified from AOCI
|
Amount Reclassified from AOCI
|
Affected line item in the Statement where Net Income is presented
|
||||||||||
|
Available-for-sale securities
|
|
|
|
|
|
|
|
|||||||
|
Unrealized holding gains
|
$
|
1,082
|
|
$
|
130
|
|
$
|
413
|
|
Gain on sale of securities
|
||||
|
|
1,082
|
|
130
|
|
413
|
|
Total before tax
|
|||||||
|
|
(433
|
)
|
(52
|
)
|
(165
|
)
|
Income tax expense
|
|||||||
|
|
649
|
|
78
|
|
248
|
|
Net of tax
|
|||||||
|
Defined benefit pension plan items
|
|
|
|
|
|
|
|
|||||||
|
Amortization of net actuarial loss
|
(236
|
)
|
(257
|
)
|
(136
|
)
|
Salaries and benefits
|
|||||||
|
|
(236
|
)
|
(257
|
)
|
(136
|
)
|
Total before tax
|
|||||||
|
|
94
|
|
103
|
|
54
|
|
Income tax expense
|
|||||||
|
|
(142
|
)
|
(154
|
)
|
(82
|
)
|
Net of tax
|
|||||||
|
Total reclassifications
|
$
|
507
|
|
$
|
(76
|
)
|
$
|
166
|
|
|
||||
|
(Dollars in thousands)
|
Unrealized gains (losses) on available for-sale securities
|
Defined benefit pension plan items
|
Total
|
|||||||||
|
Balance at January 1, 2016
|
$
|
(363
|
)
|
$
|
(2,570
|
)
|
$
|
(2,933
|
)
|
|||
|
Other comprehensive loss before reclassification
|
(586
|
)
|
(251
|
)
|
(837
|
)
|
||||||
|
Amounts reclassified from AOCI
|
(649
|
)
|
142
|
|
(507
|
)
|
||||||
|
Net current period OCI
|
(1,235
|
)
|
(109
|
)
|
(1,344
|
)
|
||||||
|
Balance at December 31, 2016
|
$
|
(1,598
|
)
|
$
|
(2,679
|
)
|
$
|
(4,277
|
)
|
|||
|
Balance at January 1, 2015
|
$
|
(406
|
)
|
$
|
(2,236
|
)
|
$
|
(2,642
|
)
|
|||
|
Other comprehensive loss before reclassification
|
121
|
|
(488
|
)
|
(367
|
)
|
||||||
|
Amounts reclassified from AOCI
|
(78
|
)
|
154
|
|
76
|
|
||||||
|
Net current period OCI
|
43
|
|
(334
|
)
|
(291
|
)
|
||||||
|
Balance at December 31, 2015
|
$
|
(363
|
)
|
$
|
(2,570
|
)
|
$
|
(2,933
|
)
|
|||
107
Information relative to the parent company’s condensed balance sheets at
December 31, 2016
and
2015
, and the related condensed statements of income and cash flows for the years ended
December 31, 2016
,
2015
and
2014
are presented below:
|
|
||||||||
|
|
December 31,
|
|||||||
|
(Dollars in thousands)
|
2016
|
2015
|
||||||
|
Assets
|
|
|
|
|
||||
|
Cash
|
$
|
7,699
|
|
$
|
3,440
|
|
||
|
Investment in subsidiaries
|
168,325
|
|
142,057
|
|
||||
|
Other assets
|
4,316
|
|
3,012
|
|
||||
|
Total assets
|
$
|
180,340
|
|
$
|
148,509
|
|
||
|
Liabilities and stockholders’ equity
|
|
|
|
|
||||
|
Other liabilities
|
$
|
1,191
|
|
$
|
273
|
|
||
|
Long-term debt
|
33,524
|
|
33,524
|
|
||||
|
Total liabilities
|
34,715
|
|
33,797
|
|
||||
|
Total stockholders’ equity
|
145,625
|
|
114,712
|
|
||||
|
Total liabilities and stockholders’ equity
|
$
|
180,340
|
|
$
|
148,509
|
|
||
|
|
||||||||||||
|
|
Year ended December 31,
|
|||||||||||
|
(Dollars in thousands)
|
2016
|
2015
|
2014
|
|||||||||
|
Income - dividends from bank subsidiary
|
$
|
9,241
|
|
$
|
7,744
|
|
$
|
7,471
|
|
|||
|
Expenses - operating
|
11,307
|
|
8,988
|
|
7,331
|
|
||||||
|
Income (loss) before income taxes and undistributed earnings - continuing operations
|
(2,066
|
)
|
(1,244
|
)
|
140
|
|
||||||
|
Income tax (benefit) - continuing operations
|
(2,072
|
)
|
(1,597
|
)
|
(992
|
)
|
||||||
|
Income after tax from continuing operations
|
6
|
|
353
|
|
1,132
|
|
||||||
|
Income before income taxes and undistributed earnings - discontinued operations
|
6,926
|
|
—
|
|
—
|
|
||||||
|
Income tax - discontinued operations
|
2,629
|
|
—
|
|
—
|
|
||||||
|
Income after tax from discontinued operations
|
4,297
|
|
—
|
|
—
|
|
||||||
|
Equity in undistributed income earnings of subsidiaries
|
8,609
|
|
6,463
|
|
947
|
|
||||||
|
Net Income
|
$
|
12,912
|
|
$
|
6,816
|
|
$
|
2,079
|
|
|||
|
Preferred dividends
|
$
|
1,128
|
|
$
|
575
|
|
$
|
332
|
|
|||
|
Net Income available to common shareholders
|
$
|
11,784
|
|
$
|
6,241
|
|
$
|
1,747
|
|
|||
108
|
|
||||||||||||
|
(Dollars in thousands)
|
2016
|
2015
|
2014
|
|||||||||
|
OPERATING ACTIVITIES
|
|
|
|
|
|
|
||||||
|
Net Income
|
$
|
12,912
|
|
$
|
6,816
|
|
$
|
2,079
|
|
|||
|
Equity in undistributed earnings of subsidiaries
|
(8,609
|
)
|
(6,463
|
)
|
(947
|
)
|
||||||
|
(Decrease) in other assets
|
(612
|
)
|
(529
|
)
|
(1,778
|
)
|
||||||
|
Decrease (increase) in other liabilities
|
920
|
|
(261
|
)
|
436
|
|
||||||
|
Stock option expense
|
568
|
|
413
|
|
321
|
|
||||||
|
Net cash provided by (used in) operating activities
|
5,179
|
|
(24
|
)
|
111
|
|
||||||
|
INVESTING ACTIVITIES
|
|
|
|
|
|
|
||||||
|
Investment in subsidiary
|
(19,697
|
)
|
(400
|
)
|
(37,042
|
)
|
||||||
|
Net cash used in investing activities
|
(19,697
|
)
|
(400
|
)
|
(37,042
|
)
|
||||||
|
FINANCING ACTIVITIES
|
|
|
|
|
|
|
||||||
|
Proceeds of stock offering
|
20,519
|
|
—
|
|
5,588
|
|
||||||
|
Dividend reinvestment plan
|
—
|
|
—
|
|
180
|
|
||||||
|
Proceeds from subordinated debt
|
—
|
|
—
|
|
29,400
|
|
||||||
|
Preferred stock issuance
|
—
|
|
—
|
|
7,834
|
|
||||||
|
Common stock options exercised
|
32
|
|
(448
|
)
|
63
|
|
||||||
|
Cash dividends paid on common stock
|
(646
|
)
|
(641
|
)
|
(636
|
)
|
||||||
|
Cash dividends paid on preferred stock
|
(1,128
|
)
|
(575
|
)
|
(332
|
)
|
||||||
|
Net cash provided by (used in) financing activities
|
18,777
|
|
(1,664
|
)
|
42,097
|
|
||||||
|
Increase (decrease) in cash
|
4,259
|
|
(2,088
|
)
|
5,166
|
|
||||||
|
Cash at beginning of period
|
3,440
|
|
5,528
|
|
362
|
|
||||||
|
Cash at end of period
|
$
|
7,699
|
|
$
|
3,440
|
|
$
|
5,528
|
|
|||
The Company has identified
three
reportable segments: commercial and retail banking; mortgage banking; and financial holding company. Insurance services was previously identified as a reportable segment until entering into an Asset Purchase Agreement, as discussed below and in Note 23, "Discontinued Operations" of the Notes to the Consolidated Financial Statements included in Item 8, Financial Statements and Supplementary Data, of this Annual Report on Form 10-K. Revenue from commercial and retail banking activities consists primarily of interest earned on loans and investment securities and service charges on deposit accounts. Revenue from financial holding company activities is mainly comprised of intercompany service income and dividends.
Revenue from the mortgage banking activities is comprised of interest earned on loans and fees received as a result of the mortgage origination process. The mortgage banking services are conducted by MVB Mortgage. Revenue from insurance services is comprised mainly of commissions on the sale of insurance products.
On
June 30, 2016
, the Company entered into an Asset Purchase Agreement with USI Insurance Services (“USI”), in which USI purchased substantially all of the assets and assumed certain liabilities of MVB Insurance, which resulted in a pre-tax gain of
$6.9 million
, as discussed in Note 23, "Discontinued Operations" of the Notes to the Consolidated Financial Statements included in
109
Item 8, Financial Statements and Supplementary Data, of this Annual Report on Form 10-K. MVB Insurance retained the assets related to, and continues to operate, its title insurance business. The title insurance business is immaterial in terms of revenue and the Company has reorganized MVB Insurance as a subsidiary of the Bank.
Information about the reportable segments and reconciliation to the consolidated financial statements for the years ended
December 31,
2016
,
2015
, and
2014
are as follows:
|
2016
|
||||||||||||||||||||||||
|
(Dollars in thousands)
|
Commercial & Retail Banking
|
Mortgage Banking
|
Financial Holding Company
|
Insurance
|
Intercompany Eliminations
|
Consolidated
|
||||||||||||||||||
|
Revenues:
|
||||||||||||||||||||||||
|
Interest income
|
$
|
50,413
|
|
$
|
4,285
|
|
$
|
3
|
|
$
|
—
|
|
$
|
(578
|
)
|
$
|
54,123
|
|
||||||
|
Mortgage fee income
|
(252
|
)
|
36,960
|
|
—
|
|
—
|
|
(1,035
|
)
|
35,673
|
|
||||||||||||
|
Insurance and investment services income
|
420
|
|
—
|
|
—
|
|
—
|
|
—
|
|
420
|
|
||||||||||||
|
Other income
|
5,485
|
|
1,674
|
|
5,247
|
|
—
|
|
(5,294
|
)
|
7,112
|
|
||||||||||||
|
Total operating income
|
56,066
|
|
42,919
|
|
5,250
|
|
—
|
|
(6,907
|
)
|
97,328
|
|
||||||||||||
|
Expenses:
|
|
|
|
|
|
|
||||||||||||||||||
|
Interest expense
|
8,437
|
|
2,082
|
|
2,226
|
|
—
|
|
(1,613
|
)
|
11,132
|
|
||||||||||||
|
Salaries and employee benefits
|
11,592
|
|
27,696
|
|
5,937
|
|
—
|
|
—
|
|
45,225
|
|
||||||||||||
|
Provision for loan losses
|
3,632
|
|
—
|
|
—
|
|
—
|
|
—
|
|
3,632
|
|
||||||||||||
|
Other expense
|
18,009
|
|
8,125
|
|
3,144
|
|
—
|
|
(5,294
|
)
|
23,984
|
|
||||||||||||
|
Total operating expenses
|
41,670
|
|
37,903
|
|
11,307
|
|
—
|
|
(6,907
|
)
|
83,973
|
|
||||||||||||
|
Income (loss) from continuing operations, before income taxes
|
14,396
|
|
5,016
|
|
(6,057
|
)
|
—
|
|
—
|
|
13,355
|
|
||||||||||||
|
Income tax expense (benefit) - continuing operations
|
4,496
|
|
1,954
|
|
(2,072
|
)
|
—
|
|
—
|
|
4,378
|
|
||||||||||||
|
Net income (loss) from continuing operations
|
9,900
|
|
3,062
|
|
(3,985
|
)
|
—
|
|
—
|
|
8,977
|
|
||||||||||||
|
Income (loss) from discontinued operations
|
—
|
|
—
|
|
6,926
|
|
(580
|
)
|
—
|
|
6,346
|
|
||||||||||||
|
Income tax expense (benefit) - discontinued operations
|
$
|
—
|
|
$
|
—
|
|
$
|
2,629
|
|
$
|
(218
|
)
|
$
|
—
|
|
$
|
2,411
|
|
||||||
|
Net income (loss) from discontinued operations
|
$
|
—
|
|
$
|
—
|
|
$
|
4,297
|
|
$
|
(362
|
)
|
$
|
—
|
|
$
|
3,935
|
|
||||||
|
Net income (loss)
|
$
|
9,900
|
|
$
|
3,062
|
|
$
|
312
|
|
$
|
(362
|
)
|
$
|
—
|
|
$
|
12,912
|
|
||||||
|
Preferred stock dividends
|
—
|
|
—
|
|
1,128
|
|
—
|
|
—
|
|
1,128
|
|
||||||||||||
|
Net income (loss) available to common shareholders
|
9,900
|
|
3,062
|
|
(816
|
)
|
(362
|
)
|
—
|
|
11,784
|
|
||||||||||||
|
Capital Expenditures for the year ended December 31, 2016
|
$
|
1,145
|
|
$
|
220
|
|
$
|
303
|
|
$
|
—
|
|
$
|
—
|
|
$
|
1,668
|
|
||||||
|
Total Assets as of December 31, 2016
|
1,415,735
|
|
122,242
|
|
180,340
|
|
—
|
|
(299,513
|
)
|
1,418,804
|
|
||||||||||||
|
Goodwill as of December 31, 2016
|
1,598
|
|
16,882
|
|
—
|
|
—
|
|
—
|
|
18,480
|
|
||||||||||||
110
|
2015
|
||||||||||||||||||||||||
|
(Dollars in thousands)
|
Commercial & Retail Banking
|
Mortgage Banking
|
Financial Holding Company
|
Insurance
|
Intercompany Eliminations
|
Consolidated
|
||||||||||||||||||
|
Revenues:
|
||||||||||||||||||||||||
|
Interest income
|
$
|
40,524
|
|
$
|
3,882
|
|
$
|
2
|
|
$
|
—
|
|
$
|
(308
|
)
|
$
|
44,100
|
|
||||||
|
Mortgage fee income
|
7
|
|
30,560
|
|
—
|
|
—
|
|
(1,095
|
)
|
29,472
|
|
||||||||||||
|
Insurance and investment services income
|
338
|
|
—
|
|
—
|
|
—
|
|
—
|
|
338
|
|
||||||||||||
|
Other income
|
3,721
|
|
1,673
|
|
4,331
|
|
—
|
|
(4,580
|
)
|
5,145
|
|
||||||||||||
|
Total operating income
|
44,590
|
|
36,115
|
|
4,333
|
|
—
|
|
(5,983
|
)
|
79,055
|
|
||||||||||||
|
Expenses:
|
|
|
|
|
|
|
||||||||||||||||||
|
Interest expense
|
6,776
|
|
1,647
|
|
2,204
|
|
—
|
|
(1,402
|
)
|
9,225
|
|
||||||||||||
|
Salaries and employee benefits
|
11,049
|
|
20,774
|
|
4,250
|
|
—
|
|
—
|
|
36,073
|
|
||||||||||||
|
Provision for loan losses
|
2,493
|
|
—
|
|
—
|
|
—
|
|
—
|
|
2,493
|
|
||||||||||||
|
Other expense
|
16,132
|
|
7,471
|
|
2,534
|
|
—
|
|
(4,362
|
)
|
21,775
|
|
||||||||||||
|
Total operating expenses
|
36,450
|
|
29,892
|
|
8,988
|
|
—
|
|
(5,764
|
)
|
69,566
|
|
||||||||||||
|
Income (loss) from continuing operations, before income taxes
|
8,140
|
|
6,223
|
|
(4,655
|
)
|
—
|
|
(219
|
)
|
9,489
|
|
||||||||||||
|
Income tax expense (benefit) - continuing operations
|
2,176
|
|
2,394
|
|
(1,597
|
)
|
—
|
|
(87
|
)
|
2,886
|
|
||||||||||||
|
Net income (loss) from continuing operations
|
5,964
|
|
3,829
|
|
(3,058
|
)
|
—
|
|
(132
|
)
|
6,603
|
|
||||||||||||
|
Income (loss) from discontinued operations
|
—
|
|
—
|
|
—
|
|
134
|
|
219
|
|
353
|
|
||||||||||||
|
Income tax expense (benefit) - discontinued operations
|
$
|
—
|
|
$
|
—
|
|
$
|
—
|
|
$
|
53
|
|
$
|
87
|
|
$
|
140
|
|
||||||
|
Net income (loss) from discontinued operations
|
$
|
—
|
|
$
|
—
|
|
$
|
—
|
|
$
|
81
|
|
$
|
132
|
|
$
|
213
|
|
||||||
|
Net income (loss)
|
$
|
5,964
|
|
$
|
3,829
|
|
$
|
(3,058
|
)
|
$
|
81
|
|
$
|
—
|
|
$
|
6,816
|
|
||||||
|
Preferred stock dividends
|
—
|
|
—
|
|
575
|
|
—
|
|
—
|
|
575
|
|
||||||||||||
|
Net income (loss) available to common shareholders
|
5,964
|
|
3,829
|
|
(3,633
|
)
|
81
|
|
—
|
|
6,241
|
|
||||||||||||
|
Capital Expenditures for the year ended December 31, 2015
|
$
|
1,174
|
|
$
|
354
|
|
$
|
616
|
|
$
|
9
|
|
$
|
—
|
|
$
|
2,153
|
|
||||||
|
Total Assets as of December 31, 2015
|
1,378,988
|
|
125,227
|
|
148,509
|
|
5,017
|
|
(273,265
|
)
|
1,384,476
|
|
||||||||||||
|
Goodwill as of December 31, 2015
|
1,598
|
|
16,882
|
|
—
|
|
—
|
|
—
|
|
18,480
|
|
||||||||||||
111
|
|
2014
|
|||||||||||||||||||||||
|
(Dollars in thousands)
|
Commercial & Retail Banking
|
Mortgage Banking
|
Financial Holding Company
|
Insurance
|
Intercompany Eliminations
|
Consolidated
|
||||||||||||||||||
|
Revenues:
|
||||||||||||||||||||||||
|
Interest income
|
$
|
33,175
|
|
$
|
2,645
|
|
$
|
2
|
|
$
|
—
|
|
$
|
346
|
|
$
|
36,168
|
|
||||||
|
Mortgage fee income
|
64
|
|
18,691
|
|
—
|
|
—
|
|
(1,198
|
)
|
17,557
|
|
||||||||||||
|
Insurance and investment services income
|
328
|
|
—
|
|
—
|
|
—
|
|
—
|
|
328
|
|
||||||||||||
|
Other income
|
4,458
|
|
(2
|
)
|
4,357
|
|
—
|
|
(4,676
|
)
|
4,137
|
|
||||||||||||
|
Total operating income
|
38,025
|
|
21,334
|
|
4,359
|
|
—
|
|
(5,528
|
)
|
58,190
|
|
||||||||||||
|
Expenses:
|
|
|
|
|
|
|
||||||||||||||||||
|
Interest expense
|
5,663
|
|
1,063
|
|
1,703
|
|
—
|
|
(918
|
)
|
7,511
|
|
||||||||||||
|
Salaries and employee benefits
|
9,629
|
|
14,487
|
|
3,658
|
|
—
|
|
—
|
|
27,774
|
|
||||||||||||
|
Provision for loan losses
|
2,582
|
|
—
|
|
—
|
|
—
|
|
—
|
|
2,582
|
|
||||||||||||
|
Other expense
|
13,994
|
|
5,990
|
|
1,970
|
|
—
|
|
(4,534
|
)
|
17,420
|
|
||||||||||||
|
Total operating expenses
|
31,868
|
|
21,540
|
|
7,331
|
|
—
|
|
(5,452
|
)
|
55,287
|
|
||||||||||||
|
Income (loss) from continuing operations, before income taxes
|
6,157
|
|
(206
|
)
|
(2,972
|
)
|
—
|
|
(76
|
)
|
2,903
|
|
||||||||||||
|
Income tax expense (benefit) - continuing operations
|
1,326
|
|
(57
|
)
|
(993
|
)
|
—
|
|
(28
|
)
|
248
|
|
||||||||||||
|
Net income (loss) from continuing operations
|
4,831
|
|
(149
|
)
|
(1,979
|
)
|
—
|
|
(48
|
)
|
2,655
|
|
||||||||||||
|
Income (loss) from discontinued operations
|
—
|
|
—
|
|
—
|
|
(996
|
)
|
76
|
|
(920
|
)
|
||||||||||||
|
Income tax expense (benefit) - discontinued operations
|
$
|
—
|
|
$
|
—
|
|
$
|
—
|
|
$
|
(372
|
)
|
$
|
28
|
|
$
|
(344
|
)
|
||||||
|
Net income (loss) from discontinued operations
|
$
|
—
|
|
$
|
—
|
|
$
|
—
|
|
$
|
(624
|
)
|
$
|
48
|
|
$
|
(576
|
)
|
||||||
|
Net income (loss)
|
$
|
4,831
|
|
$
|
(149
|
)
|
$
|
(1,979
|
)
|
$
|
(624
|
)
|
$
|
—
|
|
$
|
2,079
|
|
||||||
|
Preferred stock dividends
|
—
|
|
—
|
|
332
|
|
—
|
|
—
|
|
332
|
|
||||||||||||
|
Net income (loss) available to common shareholders
|
4,831
|
|
(149
|
)
|
(2,311
|
)
|
(624
|
)
|
—
|
|
1,747
|
|
||||||||||||
|
Capital Expenditures for the year ended December 31, 2014
|
$
|
9,072
|
|
$
|
333
|
|
$
|
40
|
|
$
|
353
|
|
$
|
—
|
|
$
|
9,798
|
|
||||||
|
Total Assets as of December 31, 2014
|
1,048,101
|
|
101,791
|
|
146,137
|
|
4,031
|
|
(189,601
|
)
|
1,110,459
|
|
||||||||||||
|
Goodwill as of December 31, 2014
|
897
|
|
16,882
|
|
—
|
|
—
|
|
—
|
|
17,779
|
|
||||||||||||
Commercial & Retail Banking
For the year ended
December 31, 2016
, the Commercial & Retail Banking segment earned
$9.9 million
compared to
$6.0 million
in
2015
. Net interest income increased by
$8.2 million
, primarily the result of average loan balances increasing by
$179.0 million
. Noninterest income increased by
$1.6 million
, mainly the result of the following:
$818 thousand
improvement in performance of the interest rate cap,
$882 thousand
increase in gain on sale of securities,
$133 thousand
increase in other operating income, and
$199 thousand
increase in Visa debit card and interchange income, which was offset by
$371 thousand
decrease in gain on sale of portfolio loans and
$259 thousand
decrease in mortgage fee income. Noninterest expense increased by
$2.4 million
, primarily the result of the following:
$543 thousand
increase in salaries and employee benefits expense,
$494 thousand
increase in occupancy and equipment expense, and
$832 thousand
increase in data processing and communications expense, which was offset by
$776 thousand
decrease in professional fees. In addition, provision expense increased by
$1.1 million
.
112
Mortgage Banking
For the year ended
December 31, 2016
, the Mortgage Banking segment earned
$3.1 million
compared to
$3.8 million
in
2015
. Net interest income decreased
$32 thousand
, noninterest income increased by
$6.4 million
and noninterest expense increased by
$7.6 million
. The
$6.4 million
increase in noninterest income was all related to mortgage fee income and was offset by the
$7.6 million
increase in noninterest expense. The increase in noninterest expense was primarily the result of the following:
$6.9 million
increase in salaries and employee benefits expense, which was primarily due to a
26.4%
increase in origination volume as well as a
$1.8 million
increase in the earn out paid to management of the mortgage company related to the 2012 acquisition. Other items that impacted noninterest expense were as follows:
$197 thousand
increase in mortgage processing expense,
$98 thousand
increase in data processing and communications expense,
$117 thousand
in occupancy and equipment expense,
$133 thousand
increase in travel, entertainment, dues, and subscriptions expense, and
$134 thousand
in other operating expense, of which an increase of
$55 thousand
was related to loan expenses, which was offset by a
$115 thousand
decrease in marketing expense.
Financial Holding Company
Excluding discontinued operations, for the year ended
December 31, 2016
, the Financial Holding Company segment lost
$4.0 million
compared to a loss of
$3.1 million
in
2015
. Interest expense increased
$22 thousand
, noninterest income increased
$916 thousand
and noninterest expense increased
$2.3 million
. In addition, the income tax benefit increased
$475 thousand
. The increase in noninterest expense was primarily due to a
$1.7 million
increase in salaries and employee benefits expense, a
$220 thousand
increase in professional fees, a
$259 thousand
increase in occupancy and equipment expense, and a
$66 thousand
increase in other operating expense.
Insurance
For the year ended
December 31, 2016
, the Insurance segment lost
$362 thousand
compared to a loss of
$81 thousand
in
2015
. In
June 2016
, primarily all the assets of the Insurance segment were sold and the segment was reorganized as a subsidiary of the Bank.
On
May 1, 2015
, MVB Bank, Inc. (MVB Bank), a wholly-owned subsidiary of MVB Financial Corp. (MVB Financial or the Company), issued a joint news release with BB&T Corporation (BB&T) and Susquehanna Bancshares, Inc. (Susquehanna) announcing the signing of a definitive agreement, subject to customary closing conditions including regulatory approvals, through which MVB Bank will acquire
two
branch locations of Susquehanna Bank in Berkeley County, West Virginia and will assume approximately
$69 million
of deposits and
$17 million
of loans. The
two
Susquehanna Bank branch locations are slated for divestiture under BB&T’s agreement with the United States Department of Justice and commitments to the Board of Governors of the Federal Reserve System in connection with BB&T’s pending acquisition of Susquehanna. On
July 22, 2015
, regulatory approvals for the acquisition of the
two
Susquehanna Bank branch locations were received and the acquisition closed
August 28, 2015
.
The acquisition was accounted for under the acquisition method of accounting in accordance with ASC 805. The assets and liabilities were recorded at their estimated fair values as of the
August 28, 2015
acquisition date.
113
|
The following is a summary of net liabilities assumed:
|
|||
|
(Dollars in thousands)
|
|||
|
Net assets acquired:
|
|
||
|
Cash received in transaction
|
$
|
47,962
|
|
|
Cash on hand
|
330
|
|
|
|
Loans
|
18,200
|
|
|
|
Bank premises, furniture and equipment
|
609
|
|
|
|
Accrued interest receivable and other assets
|
62
|
|
|
|
Core deposit intangible
|
878
|
|
|
|
|
68,041
|
|
|
|
Deposits
|
68,697
|
|
|
|
Accrued interest payable and other liabilities
|
45
|
|
|
|
|
68,742
|
|
|
|
|
|
||
|
Net liabilities assumed
|
(701
|
)
|
|
|
Goodwill
|
701
|
|
|
|
|
$
|
—
|
|
A valuation of the acquired loans and core deposit intangible was performed with the assistance of a third-party valuation consultant. The unpaid principal balance and fair value of performing loans was
$18.7 million
and
$18.2 million
, respectively. The discount of
$458 thousand
will be accreted through interest income over the life of the loans in accordance with Accounting Standards Codification (ASC) topic 310-20. No nonperforming loans were acquired in this transaction. The core deposit intangible will be amortized over
10 years
using a double declining balance amortization method.
Merger costs related to the branch acquisitions were
$722 thousand
, consisting primarily of legal, consulting and data processing expenses. Goodwill was recorded in the amount of
$701 thousand
which is the difference between the total purchase price and the net liabilities assumed and is not deductible for income tax purposes.
|
The following acquisition related costs are included in the consolidated statements of income for the periods indicated:
|
||||||||||||
|
|
Year ended
|
Year ended
|
Year ended
|
|||||||||
|
(Dollars in thousands)
|
December 31, 2016
|
December 31, 2015
|
December 31, 2014
|
|||||||||
|
Professional fees
|
$
|
—
|
|
$
|
471
|
|
$
|
183
|
|
|||
|
Marketing
|
—
|
|
29
|
|
4
|
|
||||||
|
Printing, postage and supplies
|
—
|
|
71
|
|
9
|
|
||||||
|
Equipment depreciation and maintenance
|
—
|
|
—
|
|
26
|
|
||||||
|
Travel and entertainment
|
—
|
|
50
|
|
88
|
|
||||||
|
Data processing and communications
|
—
|
|
76
|
|
—
|
|
||||||
|
Other operating expense
|
—
|
|
25
|
|
—
|
|
||||||
|
Total
|
$
|
—
|
|
$
|
722
|
|
$
|
310
|
|
|||
Actual total revenues net of interest expense and net (loss) relating to the branch acquisitions were
$297 thousand
and
$(122) thousand
for the year ended
December 31, 2015
.
The following pro forma financial information combines the historical results of MVB and
two
branches acquired on
August 28, 2015
. The pro forma results exclude the impact of branch acquisition costs of
$722 thousand
.
114
If the branch acquisition had been completed on
January 1, 2014
total revenue, net of interest expense, would have been
$55.1 million
and
$76.0 million
for the years ended
December 31, 2014
and
2015
, respectively. Net income would have been
$1.7 million
and
$6.4 million
for the same periods. Basic and diluted earnings per share would have been
$0.17
and
$0.17
and
$0.73
and
$0.72
, respectively for the years ended
December 31, 2014
and
2015
.
On
June 30, 2016
, the Company entered into an Asset Purchase Agreement with USI Insurance Services ("USI"), in which USI purchased substantially all of the assets and assumed certain liabilities of MVB Insurance, which resulted in a pre-tax gain of
$6.9 million
. MVB Insurance retained the assets related to, and continues to operate, its title insurance business. The title insurance business is immaterial in terms of revenue and the Company has reorganized MVB Insurance as a subsidiary of the Bank. The Company retained approximately
$424 thousand
in liabilities and received proceeds totaling
$7.0 million
related to this transaction.
|
Assets and liabilities of discontinued operations at the dates indicated were as follows:
|
||||||||
|
(Dollars in thousands)
|
2016
|
2015
|
||||||
|
ASSETS
|
||||||||
|
Cash and cash equivalents:
|
|
|
|
|
||||
|
Cash and due from banks
|
$
|
—
|
|
$
|
2,245
|
|
||
|
Total cash and cash equivalents
|
—
|
|
2,245
|
|
||||
|
Premises and equipment
|
—
|
|
618
|
|
||||
|
Accrued interest receivable and other assets
|
—
|
|
2,154
|
|
||||
|
TOTAL ASSETS
|
$
|
—
|
|
$
|
5,017
|
|
||
|
|
||||||||
|
LIABILITIES AND STOCKHOLDERS’ EQUITY
|
||||||||
|
Accrued interest payable and other liabilities
|
—
|
|
2,834
|
|
||||
|
Total liabilities
|
—
|
|
2,834
|
|
||||
|
|
||||||||
|
STOCKHOLDERS’ EQUITY
|
||||||||
|
Retained earnings
|
—
|
|
2,183
|
|
||||
|
Total stockholders’ equity
|
—
|
|
2,183
|
|
||||
|
TOTAL LIABILITIES AND STOCKHOLDERS’ EQUITY
|
$
|
—
|
|
$
|
5,017
|
|
||
115
Net income (losses) from discontinued operations, net of tax, for the years ended
December 31, 2016
,
2015
, and
2014
, were as follows:
|
(Dollars in thousands)
|
2016
|
2015
|
2014
|
|||||||||
|
NONINTEREST INCOME
|
||||||||||||
|
Insurance and investment services income
|
$
|
1,887
|
|
$
|
4,733
|
|
$
|
3,523
|
|
|||
|
Gain on sale of subsidiary
|
6,926
|
|
—
|
|
—
|
|
||||||
|
Other operating income
|
2
|
|
6
|
|
—
|
|
||||||
|
Total noninterest income
|
8,815
|
|
4,739
|
|
3,523
|
|
||||||
|
NONINTEREST EXPENSES
|
|
|
|
|
|
|
||||||
|
Salary and employee benefits
|
1,937
|
|
3,603
|
|
3,417
|
|
||||||
|
Occupancy expense
|
124
|
|
281
|
|
245
|
|
||||||
|
Equipment depreciation and maintenance
|
29
|
|
57
|
|
56
|
|
||||||
|
Data processing and communications
|
79
|
|
105
|
|
97
|
|
||||||
|
Marketing, contributions and sponsorships
|
7
|
|
25
|
|
26
|
|
||||||
|
Professional fees
|
2
|
|
23
|
|
308
|
|
||||||
|
Printing, postage and supplies
|
12
|
|
19
|
|
41
|
|
||||||
|
Insurance, tax and assessment expense
|
58
|
|
136
|
|
96
|
|
||||||
|
Travel, entertainment, dues and subscriptions
|
67
|
|
119
|
|
132
|
|
||||||
|
Other operating expenses
|
154
|
|
18
|
|
25
|
|
||||||
|
Total noninterest expense
|
2,469
|
|
4,386
|
|
4,443
|
|
||||||
|
Income (loss) from discontinued operations, before income taxes
|
6,346
|
|
353
|
|
(920
|
)
|
||||||
|
Income tax expense (benefit) - discontinued operations
|
2,411
|
|
140
|
|
(344
|
)
|
||||||
|
Net Income (loss) from discontinued operations
|
$
|
3,935
|
|
$
|
213
|
|
$
|
(576
|
)
|
|||
|
|
|
|
Earnings Per Share
|
|||||||||||||||||||||
|
(Dollars in thousands)
|
Interest Income
|
Net Interest Income
|
Income Before Taxes
|
Net Income
|
Basic
|
Diluted
|
||||||||||||||||||
|
2016
|
|
|
|
|
|
|
|
|
|
|
|
|
||||||||||||
|
First quarter
|
$
|
13,382
|
|
$
|
10,695
|
|
$
|
2,612
|
|
$
|
1,796
|
|
$
|
0.20
|
|
$
|
0.20
|
|
||||||
|
Second quarter
|
13,580
|
|
10,742
|
|
10,228
|
|
6,499
|
|
0.77
|
|
0.63
|
|
||||||||||||
|
Third quarter
|
13,523
|
|
10,729
|
|
3,441
|
|
2,310
|
|
0.25
|
|
0.24
|
|
||||||||||||
|
Fourth quarter
|
13,638
|
|
10,825
|
|
3,420
|
|
2,307
|
|
0.23
|
|
0.22
|
|
||||||||||||
|
|
|
|
Earnings Per Share
|
|||||||||||||||||||||
|
(Dollars in thousands)
|
Interest Income
|
Net Interest Income
|
Income Before Taxes
|
Net Income
|
Basic
|
Diluted
|
||||||||||||||||||
|
2015
|
|
|
|
|
|
|
||||||||||||||||||
|
First quarter
|
$
|
9,638
|
|
$
|
7,547
|
|
$
|
3,332
|
|
$
|
2,103
|
|
$
|
0.25
|
|
$
|
0.24
|
|
||||||
|
Second quarter
|
10,694
|
|
8,426
|
|
2,688
|
|
1,905
|
|
0.22
|
|
0.23
|
|
||||||||||||
|
Third quarter
|
11,416
|
|
9,018
|
|
1,912
|
|
1,406
|
|
0.16
|
|
0.17
|
|
||||||||||||
|
Fourth quarter
|
12,352
|
|
9,884
|
|
1,910
|
|
1,402
|
|
0.16
|
|
0.15
|
|
||||||||||||
116
On January 5, 2017, the Company redeemed all of the
8,500
shares of its Senior Non-Cumulative Perpetual Preferred Stock, Series A, liquidation amount
$1,000
per share (“Series A Preferred Stock”), that had been issued to the United States Department of the Treasury, on September 8, 2011, pursuant to the Small Business Lending Fund program (“SBLF”). The aggregate redemption price of the Series A Preferred Stock was
$8,508,500
, including dividends accrued, but unpaid through, but not including the redemption date.
The Series A Preferred Stock was redeemed from the Company’s surplus capital and approved by the Company’s primary federal regulator. The redemption terminates the Company’s participation in the SBLF program. After the redemption, the Company’s capital ratios remain well in excess of those required for well capitalized status.
117

Report of Independent Registered Public Accounting Firm
To the Board of Directors and Stockholders
MVB Financial Corp.
We have audited the accompanying consolidated balance sheets of MVB Financial Corp. and Subsidiary (the Company) as of
December 31, 2016
and
2015
, and the related consolidated statements of income, comprehensive income, changes in stockholders’ equity, and cash flows for each of the years in the three-year period ended
December 31, 2016
. These consolidated financial statements are the responsibility of the Company’s management. Our responsibility is to express an opinion on these consolidated financial statements based on our audits.
We conducted our audits in accordance with the standards of the Public Company Accounting Oversight Board (United States). Those standards require that we plan and perform the audit to obtain reasonable assurance about whether the financial statements are free of material misstatement. An audit includes examining, on a test basis, evidence supporting the amounts and disclosures in the financial statements. An audit also includes assessing the accounting principles used and significant estimates made by management, as well as evaluating the overall financial statement presentation. We believe that our audits provide a reasonable basis for our opinion.
In our opinion, the consolidated financial statements referred to above present fairly, in all material respects, the financial position of MVB Financial Corp. and Subsidiary as of
December 31, 2016
and
2015
, and the results of their operations and their cash flows for each of the years in the three-year period ended
December 31, 2016
, in conformity with accounting principles generally accepted in the United States of America.
We have also audited, in accordance with the standards of the Public Company Accounting Oversight Board (United States), MVB Financial Corp. and Subsidiary's internal control over financial reporting as of
December 31, 2016
, based on criteria established in
Internal Control – Integrated Framework (2013)
issued by the Committee of Sponsoring Organizations of the Treadway Commission, and our report dated
March 10, 2017
,
expressed an unqualified opinion thereon.
/s/ Dixon Hughes Goodman LLP
Gaithersburg, Maryland
March 10, 2017
118
None.
Evaluation of Disclosure Controls and Procedures
The Company, under the supervision and with the participation of the Company’s management, including the Company’s President and Chief Executive Officer, along with the Company’s Chief Financial Officer (the Principal Financial Officer), has evaluated the effectiveness as of
December 31, 2016
, of the design and operation of the Company’s disclosure controls and procedures, as such term is defined under Rule 13a-15(e) promulgated under the Securities Exchange Act of 1934, as amended (the “Exchange Act”). Based upon that evaluation, the Company’s President and Chief Executive Officer, along with the Company’s Principal Accounting Officer concluded that the Company’s disclosure controls and procedures were effective as of
December 31, 2016
.
There have been no material changes in the Company’s internal control over financial reporting during the fourth quarter of
2016
that have materially affected, or are reasonably likely to materially affect, the Company’s internal control over financial reporting.
Management’s Annual Report on Internal Control over Financial Reporting
Management of the Company is responsible for establishing and maintaining adequate internal control over financial reporting. The Company’s internal control over financial reporting is designed to provide reasonable assurance regarding the reliability of financial reporting and the preparation of the consolidated financial statements for external purposes in accordance with generally accepted accounting principles.
Because of its inherent limitations, internal control over financial reporting may not prevent or detect misstatements. Also, projections of any evaluation of effectiveness to future periods are subject to the risk that controls may become inadequate because of changes in conditions, or that the degree of compliance with the policies or procedures may deteriorate.
A material weakness is a significant deficiency (as defined in Public Company Accounting Oversight Board Auditing Standard No. 5), or a combination of significant deficiencies, that results in there being more than a remote likelihood that a material misstatement of the annual or interim financial statements will not be prevented or detected on a timely basis by management or employees in the normal course of performing their assigned functions.
Management assessed the effectiveness of the Company’s internal control over financial reporting as of
December 31, 2016
. Management’s assessment did not identify any material weaknesses in the Company’s internal control over financial reporting.
In making this assessment, management used the criteria set forth by the Committee of Sponsoring Organizations of the Treadway Commission (COSO) in
Internal Control-Integrated Framework in 2013
. Because there were no material weaknesses discovered, management believes that, as of
December 31, 2016
, the Company’s internal control over financial reporting was effective.
119
|
Dixon Hughes Goodman LLP, an independent registered public accounting firm, has audited the consolidated financial statements included in this Annual Report and has issued a report on the effectiveness of our internal control over financial reporting, which report is included in “Item 9A – Controls and Procedures” of this Annual Report on Form 10-K.
|
|||
|
Date:
|
March 10, 2017
|
/s/ Larry F. Mazza
|
|
|
Larry F. Mazza
|
|||
|
President, CEO and Director
|
|||
|
(Principal Executive Officer)
|
|||
|
Date:
|
March 10, 2017
|
/s/ Donald T. Robinson
|
|
|
Donald T. Robinson
|
|||
|
Executive Vice President and CFO
|
|||
|
(Principal Financial and Accounting Officer)
|
|||
|
Changes in Internal Control over Financial Reporting
|
|||
|
There have been no changes in the Company’s internal control over financial reporting that materially affected, or are reasonably likely to materially affect, our internal control over financial reporting.
|
|||
120
Report of Independent Registered Public Accounting Firm
Board of Directors and Stockholders
MVB Financial Corp. and Subsidiary
We have audited MVB Financial Corp. and Subsidiary (the “Company”)’s internal control over
financial reporting as of
December 31, 2016
, based on
criteria established in
Internal Control—Integrated Framework (2013)
issued by the Committee of Sponsoring Organizations of the Treadway Commission.
The Company’s management is responsible for maintaining effective internal control over
financial reporting and for its assessment of the effectiveness of internal control over
financial reporting, included in the accompanying Management’s Annual Report on Internal Control over Financial Reporting. Our responsibility is to express an opinion on the Company's internal control over
financial reporting based on our audit.
We conducted our audit in accordance with the standards of the Public Company Accounting Oversight Board (United States). Those standards require that we plan and perform the audit to obtain reasonable assurance about whether effective internal control over financial reporting was maintained in all material respects. Our audit included obtaining an understanding of internal control over financial reporting, assessing the risk that a material weakness exists, and testing and evaluating the design and operating effectiveness of internal control based on the assessed risk. Our audit also included performing such other procedures as we considered necessary in the circumstances. We believe that our audit provides a reasonable basis for our opinion.
A company's internal control over financial reporting is a process designed to provide reasonable assurance regarding the reliability of financial reporting and the preparation of financial statements for external purposes in accordance with generally accepted accounting principles. A company's internal control over financial reporting includes those policies and procedures that (1) pertain to the maintenance of records that, in reasonable detail, accurately and fairly reflect the transactions and dispositions of the assets of the company; (2) provide reasonable assurance that transactions are recorded as necessary to permit preparation of financial statements in accordance with generally accepted accounting principles, and that receipts and expenditures of the company are being made only in accordance with authorizations of management and directors of the company; and (3) provide reasonable assurance regarding prevention or timely detection of unauthorized acquisition, use, or disposition of the company's assets that could have a material effect on the financial statements.
Because of its inherent limitations, internal control over financial reporting may not prevent or detect misstatements. Also, projections of any evaluation of effectiveness to future periods are subject to the risk that controls may become inadequate because of changes in conditions, or that the degree of compliance with the policies or procedures may deteriorate.
In our opinion, MVB Financial Corp. and Subsidiary maintained, in all material respects, effective internal control over financial reporting as of
December 31, 2016
based on
criteria established in
Internal Control—Integrated Framework (2013)
issued by the Committee of Sponsoring Organizations of the Treadway Commission.
We also have audited, in accordance with the standards of the Public Company Accounting Oversight Board (United States), the consolidated financial statements of MVB Financial Corp. and Subsidiary as of
December 31, 2016
and
2015
and for each of the years in the three-year period ended
December 31, 2016
and our report dated
March 10, 2017
, expressed an unqualified opinion on those consolidated financial statements.
/s/ Dixon Hughes Goodman LLP
Gaithersburg, Maryland
March 10, 2017
121
None.
The information required by this item is incorporated herein by reference to the Company’s definitive Proxy Statement relating to the Company’s Annual Meeting of Shareholders for
2017
(the “Proxy Statement”).
The information required by this item is incorporated herein by reference to the Proxy Statement.
The information required by this item is incorporated herein by reference to the Proxy Statement.
The Company and the Bank have, and expect to continue to have, banking and other transactions in the ordinary course of business with its directors and officers and their affiliates, including members of their families or corporations, partnerships or other organizations in which officers or directors have a controlling interest, on substantially the same terms (including documentation, price, interest rates and collateral, repayment and amortization schedules and default provisions) as those prevailing at the time for comparable transactions with unrelated parties. All of these transactions were made on substantially the same terms (including interest rates, collateral and repayment terms on loans) as comparable transactions with non-affiliated persons. The Company's management believes that these transactions did not involve more than the normal business risk of collection or include any unfavorable features.
Total loans outstanding from the Bank at
December 31, 2016
to company officers and directors as a group and members of their immediate families and companies in which they had an ownership interest of
10%
or more was
$18.8 million
or
12.9%
of total equity capital and
1.8%
of total loans. These loans do not involve more than the normal risk of collectability or present other unfavorable features.
The information required by this item is incorporated herein by reference to the Proxy Statement.
122
|
(a)(1)
|
Financial Statements
|
|
Management’s Annual Report on Internal Control over Financial Reporting
|
|
|
Report of Independent Registered Public Accounting Firm on Internal Control over Financial Reporting
|
|
|
Report of Independent Registered Public Accounting Firm - Dixon Hughes Goodman LLP
|
|
|
Consolidated Balance Sheets at December 31, 2016 and 2015
|
|
|
Consolidated Statements of Income for the years ended December 31, 2016, 2015 and 2014
|
|
|
Consolidated Statements of Comprehensive Income for the years ended December 31, 2016, 2015 and 2014
|
|
|
Consolidated Statements of Changes in Stockholders’ Equity for the years ended December 31, 2016, 2015 and 2014
|
|
|
Consolidated Statements of Cash Flows for the years ended December 31, 2016, 2015 and 2014
|
|
|
Notes to Consolidated Financial Statements
|
|
|
(b)
|
Exhibits
|
|
Exhibits filed with this Annual Report on Form 10-K are attached hereto. For a list of such exhibits, see “Exhibit Index” below. The Exhibit Index specifically identifies each management contract or compensatory plan required to be filed as an exhibit to this Form 10-K.
|
|
123
|
SIGNATURES
|
|||
|
Pursuant to the requirements of the Securities Exchange Act of 1934, the registrant has duly caused this report to be signed on its behalf by the undersigned thereunto duly authorized.
|
|||
|
MVB Financial Corp.
|
|||
|
Date:
|
March 10, 2017
|
By:
|
/s/ Larry F. Mazza
|
|
Larry F. Mazza
|
|||
|
President, CEO and Director
|
|||
|
(Principal Executive Officer)
|
|||
|
POWER OF ATTORNEY AND SIGNATURES
|
|||
|
Know all persons by the presents, that each person whose signature appears below constitutes and appoints Larry F. Mazza or Donald T. Robinson or either of them, as attorney-in-fact, with each having the power of substitution, for him or her in any and all capacities, to sign any amendment to this Form 10-K and to file the same, with exhibits thereto, and other documents in connection therewith, with the Federal Deposit Insurance Corporation hereby ratifying and confirming all that each of said attorneys-in-fact or his substitute or substitutes may do or cause to be done by virtue hereof.
|
|||
|
Pursuant to the requirements of the Securities and Exchange Act of 1934, this Form 10-K has been signed below by the following person on behalf of the registrant in the capacities and on the dates indicated.
|
|||
|
/s/ Larry F. Mazza
|
Date:
|
March 10, 2017
|
|
|
Larry F. Mazza, President, CEO and Director
|
|||
|
(Principal Executive Officer)
|
|||
|
/s/ Donald T. Robinson
|
Date:
|
March 10, 2017
|
|
|
Donald T. Robinson, Executive Vice President and CFO
|
|||
|
(Principal Financial and Accounting Officer)
|
|||
|
/s/ Stephen R. Brooks
|
Date:
|
March 10, 2017
|
|
|
Stephen R. Brooks, Chairman
|
|||
|
/s/ David B. Alvarez
|
Date:
|
March 10, 2017
|
|
|
David B. Alvarez, Vice Chairman
|
|||
|
/s/ James J. Cava, Jr.
|
Date:
|
March 10, 2017
|
|
|
James J. Cava, Jr., Director
|
|||
|
/s/ Harry E. Dean III
|
Date:
|
March 10, 2017
|
|
|
Harry E. Dean III, Director
|
|||
|
/s/ John W. Ebert
|
Date:
|
March 10, 2017
|
|
|
John W. Ebert, Director
|
|||
|
/s/ Gary A. LeDonne
|
Date:
|
March 10, 2017
|
|
|
Gary A. LeDonne, Director
|
|||
|
/s/ Kelly R. Nelson
|
Date:
|
March 10, 2017
|
|
|
Kelly R. Nelson, Director
|
|||
|
|
|||
|
/s/ J. Christopher Pallotta
|
Date:
|
March 10, 2017
|
|
|
J. Christopher Pallotta, Director
|
|||
124
|
EXHIBIT INDEX
|
||||
|
Exhibit Number
|
Description
|
Exhibit Location
|
||
|
3.1
|
Articles of Incorporation, as amended
|
|||
|
3.2
|
Amended and Restated Bylaws
|
|||
|
4.1
|
Specimen of stock certificate representing MVB Financial Corp. common stock.
|
|||
|
4.2
|
Form of Certificate for the SBLF Preferred Stock
|
|||
|
10.1
|
MVB Financial Corp. 2003 Stock Incentive Plan
|
|||
|
10.2
|
MVB Financial Corp. 2013 Stock Incentive Plan, as amended
|
|||
|
10.3
|
Lease Agreement with Essex Properties, LLC for land occupied by Bridgeport Branch
|
|||
|
10.4†
|
Employment Agreement of Larry F. Mazza
|
|||
|
10.5 †
|
Employment Agreement of Donald T. Robinson
|
|||
|
10.6 †
|
Offer Letter for Donald T. Robinson
|
|||
|
10.7
|
Asset Purchase Agreement by and among MVB Insurance, LLC, MVB Financial Corp., and USI Insurance Services LLC
|
|||
|
10.8
|
Severance Agreement and Release of Claims by and between MVB Financial Corp. and Bret S. Price
|
|||
|
10.9
|
Form of Securities Purchase Agreement
|
|||
|
11
|
Statement Regarding Computation of Earnings per Share
|
|||
|
14
|
Code of Ethics
|
|||
|
21
|
Subsidiary of Registrant
|
|||
|
23.1
|
Consent of Independent Registered Public Accounting Firm
|
|||
|
24
|
Power of Attorney
|
|||
|
31.1
|
Certificate of Principal Executive Officer pursuant to Section 302 of Sarbanes Oxley Act of 2002
|
|||
|
31.2
|
Certificate of Principal Financial Officer pursuant to Section 302 of Sarbanes Oxley Act of 2002
|
|||
|
32.1*
|
Certificate of Principal Executive Officer & Principal Financial Officer pursuant to Section 906 of Sarbanes Oxley Act of 2002
|
|||
|
101
|
Interactive data files pursuant to Rule 405 of Regulation S-T
|
Filed herewith
|
||
(*) In accordance with Item 601(b)(32)(ii) of Regulation S-K and SEC Release Nos. 33-8238 and 34-47986, Final Rule: Management's Reports on Internal Control Over Financial Reporting and Certification of Disclosure in Exchange Act Periodic Reports, the certifications furnished in Exhibits 32.1 hereto are deemed to accompany this Form 10-K and will not be deemed "filed" for purposes of Section 18 of the Exchange Act. Such certifications will not be deemed to be incorporated by reference into any filing under the Securities Act or the Exchange Act, except to the extent that the registrant specifically incorporates it by reference.
(†) Management contract or compensatory plan
125
TABLE OF CONTENTS
Part IItem 1. BusinessItem 1A. Risk FactorsItem 1B. Unresolved Staff CommentsItem 2. PropertiesItem 3. Legal ProceedingsItem 4. Mine Safety DisclosuresPart IIItem 5. Market For Registrant S Common Equity, Related Stockholder Matters and Issuer Purchases Of Equity SecuritiesItem 6. Selected Financial DataItem 7. Management S Discussion and Analysis Of Financial Condition and Results Of OperationsItem 7A. Quantitative and Qualitative Disclosures About Market RiskItem 8. Financial Statements and Supplementary DataNote 1. Summary Of Significant Accounting PoliciesNote 2. Investment SecuritiesNote 3. Loans and Allowance For Loan LossesNote 4. Premises and EquipmentNote 5. DepositsNote 6. Borrowed FundsNote 7. Commitments and Contingent LiabilitiesNote 8. Income TaxesNote 9. Related Party TransactionsNote 10. Pension PlanNote 11. Goodwill and Other Intangible AssetsNote 12. Stock OfferingNote 13. Stock OptionsNote 14. Regulatory Capital RequirementsNote 15. Regulatory Restriction on DividendNote 16. LeasesNote 17. Fair Value Of Financial InstrumentsNote 18. Fair Value MeasurementsNote 19. Comprehensive IncomeNote 20. Condensed Financial Statements Of Parent CompanyNote 21. Segment ReportingNote 22. Mergers and AcquisitionsNote 23. Discontinued OperationsNote 24. Quarterly Financial Data (unaudited)Note 25. Subsequent EventsItem 9. Changes in and Disagreements with Accountants on Accounting and Financial DisclosureItem 9A. Controls and ProceduresItem 9B. Other InformationPart IIIItem 10. Directors, Executive Officers and Corporate GovernanceItem 11. Executive CompensationItem 12. Security Ownership Of Certain Beneficial Owners and Management and Related Stockholder MattersItem 13. Certain Relationships and Related Transactions, and Director IndependenceItem 13. Certain Relationships and RelatedItem 14. Principal Accounting Fees and ServicesPart IVItem 15. Exhibits, Financial Statement Schedules