MUELLER WATER PRODUCTS, INC.
10-Ks and 10-Qs
|
|
|
|
|
|
|
|
|
|
|
|
|
|
|
|
|
|
|
|
|
|
|
|
|
|
|
|
|
|
|
|
|
|
|
|
|
|
|
|
|
|
|
|
|
|
|
|
|
|
|
|
|
UNITED STATES
SECURITIES AND EXCHANGE COMMISSION
Washington, D.C. 20549
FORM 10-K
|
x
|
ANNUAL REPORT PURSUANT TO SECTION 13 OR 15(d) OF THE SECURITIES EXCHANGE ACT OF 1934
|
For the fiscal year ended
September 30, 2018
OR
|
o
|
TRANSITION REPORT PURSUANT TO SECTION 13 OR 15(d) OF THE SECURITIES EXCHANGE ACT OF 1934
|
|
Commission file number: 001-32892
|
|
MUELLER WATER PRODUCTS, INC.
(Exact Name of Registrant as Specified in Its Charter)
|
Delaware
|
20-3547095
|
|
|
(State or Other Jurisdiction of Incorporation or Organization)
|
(I.R.S. Employer Identification Number)
|
|
1200 Abernathy Road N.E.
Suite 1200
Atlanta, GA 30328
(Address of Principal Executive Offices)
Registrant’s telephone number:
(770) 206-4200
Securities registered pursuant to Section 12(b) of the Act:
|
Title of Each Class
|
Name of Each Exchange on Which Registered
|
|
|
Common Stock, par value $0.01
|
New York Stock Exchange
|
|
Securities registered pursuant to Section 12(g) of the Act:
None
Indicate by check mark if the registrant is a well-known seasoned issuer, as defined in Rule 405 of the Securities Act.
x
Yes
o
No
Indicate by check mark if the registrant is not required to file reports pursuant to Section 13 or Section 15(d) of the Act.
o
Yes
x
No
Indicate by check mark whether the registrant (1) has filed all reports required to be filed by Section 13 or 15(d) of the Securities Exchange Act of 1934 during the preceding 12 months (or for such shorter period that the registrant was required to file such reports), and (2) has been subject to such filing requirements for the past 90 days.
x
Yes
o
No
Indicate by check mark whether the registrant has submitted electronically and posted on its corporate website, if any, every Interactive Data File required to be submitted and posted pursuant to Rule 405 of Regulations S-T (§ 232.405 of this chapter) during the preceding 12 months (or for such shorter period that the registrant was required to submit and post such files.)
x
Yes
o
No
Indicate by check mark if disclosure of delinquent filers pursuant to Item 405 of Regulation S-K (§ 229.505 of this chapter) is not contained herein, and will not be contained, to the best of registrant’s knowledge, in definitive proxy or information statements incorporated by reference in Part III of this Form 10-K or any amendment to this Form 10-K.
o
Indicate by check mark whether the registrant is a large accelerated filer, an accelerated filer, a non-accelerated filer, or a smaller reporting company. See the definitions of “large accelerated filer,” “accelerated filer” and “smaller reporting company” in Rule 12b-2 of the Exchange Act. (Check one):
x
Large accelerated filer
o
Accelerated filer
o
Non-accelerated filer
o
Smaller reporting company
Indicate by check mark whether the registrant is a shell company (as defined in Rule 12b-2 of the Act).
o
Yes
x
No
There were
157,461,336
shares of common stock of the registrant outstanding at
November 12, 2018
. At
March 31, 2018
, the aggregate market value of the voting and non-voting common stock held by non-affiliates (assuming only for purposes of this computation that directors and executive officers may be affiliates) was
$
1,702.2
million
based on the closing price per share as reported on the New York Stock Exchange.
DOCUMENTS INCORPORATED BY REFERENCE
Applicable portions of the Proxy Statement for the upcoming 2019 Annual Meeting of Stockholders of the Company are incorporated by reference into Part III of this Form 10-K.
Introductory Note
In this Annual Report on Form 10-K (“annual report”), (1) the “Company,” “we,” “us” or “our” refer to Mueller Water Products, Inc. and its subsidiaries (2) “Infrastructure” refers to our Infrastructure segment (3) “Technologies” refers to our Technologies segment (4) “Anvil” refers to our former Anvil segment, which we sold on January 6, 2017; and (5) “U.S. Pipe” refers to our former U.S. Pipe segment, which we sold on
April 1, 2012
. With regard to the Company’s segments, “we,” “us” or “our” may also refer to the segment being discussed.
Certain of the titles and logos of our products referenced in this annual report are part of our intellectual property. Each trade name, trademark or service mark of any other company appearing in this annual report is the property of its owner.
Unless the context indicates otherwise, whenever we refer in this annual report to a particular year, we mean our fiscal year ended or ending September 30 in that particular calendar year. We manage our business and report operations through
two
business segments, Infrastructure and Technologies, based largely on the products they sell and the customers they serve.
Industry and Market Data
In this annual report, we rely on and refer to information and statistics from third-party sources regarding economic conditions and trends, the demand for our water infrastructure, flow control and other products and services and the competitive conditions we face in serving our customers and end users. We believe these sources of information and statistics are reasonably accurate, but we have not independently verified them.
Most of our primary competitors are not publicly traded companies. Only limited current public information is available with respect to the size of our end markets and our relative competitive position. Our statements in this annual report about our end markets and competitive positions are based on our beliefs, studies and judgments concerning industry trends.
Forward-Looking Statements
This annual report contains certain statements that may be deemed “forward-looking statements” within the meaning of the Private Securities Litigation Reform Act of 1995. All statements that address activities, events or developments that we intend, expect, plan, project, design, believe or anticipate will or may occur in the future are forward-looking statements. Examples of forward-looking statements include, but are not limited to, statements we make regarding our business strategy, capital allocation plans and expectations for net sales and operating income margins, and the outlook for general economic conditions, spending by municipalities and the residential and non-residential construction markets and the impacts of these factors on our business and our expected financial performance.
Forward-looking statements are based on certain assumptions and assessments made by us in light of our experience and perception of historical trends, current conditions and expected future developments. Actual results and the timing of events may differ materially from those contemplated by the forward-looking statements due to a number of factors, including regional, national or global political, economic, business, competitive, market and regulatory conditions and the other factors described under the section entitled “RISK FACTORS” in Item 1A of Part I of this annual report.
Undue reliance should not be placed on any forward-looking statements. We do not have any intention or obligation to update forward-looking statements, except as required by law.
|
TABLE OF CONTENTS
|
||
|
|
Page
|
|
|
Item 1.
|
||
|
Regulatory and
Environmental Matters
|
||
|
Securities Exchange Act Reports
|
||
|
Item 1A.
|
||
|
Item 2.
|
||
|
Item 3.
|
||
|
Item 5.
|
||
|
Item 6.
|
||
|
Item 7.
|
||
|
Seasonality
|
||
|
Item 7A.
|
||
|
Item 8.
|
||
|
Item 9A.
|
||
|
Item 10*
|
||
|
Item 11*
|
||
|
Item 12*
|
||
|
Item 13*
|
||
|
Item 14*
|
||
|
Item 15
|
||
|
*
|
All or a portion of the referenced section is incorporated by reference from our definitive proxy statement that will be issued in connection with the upcoming 2019 Annual Meeting of Stockholders.
|
|
|
Item 1.
|
BUSINESS
|
Our Company
Mueller Water Products, Inc. is a Delaware corporation that was incorporated on September 22, 2005 under the name Mueller Holding Company, Inc. On June 1, 2006, we completed an initial public offering of 28,750,000 shares of our common stock, and on December 14, 2006, Walter Industries, Inc., our parent company at that time, distributed to its shareholders 85,844,920 shares of our common stock to complete a spin-off of the Company.
On September 23, 2009, we completed a public offering of 37,122,000 shares of common stock.
On April 1, 2012, we sold U.S. Pipe.
On January 6, 2017, we sold Anvil. Anvil's results of operations and the gain from its sale have been classified as discontinued operations.
We are a leading manufacturer and marketer of products and services used in the transmission, distribution and measurement of water in North America. Our products and services are used by municipalities and the residential and non-residential construction industries. Certain of our products have leading positions due to their strong brand recognition and reputation for quality, service and innovation. We believe we have one of the largest installed bases of iron gate valves and fire hydrants in the United States. Our iron gate valve or fire hydrant products are specified for use in the largest 100 metropolitan areas in the United States. Our large installed base, broad product range and well-known brands have led to long-standing relationships with the key distributors and end users of our products. Our consolidated net sales were
$916.0 million
in
2018
.
We operate our business through
two
segments, Infrastructure, formerly referred to as Mueller Co., and Technologies, formerly referred to as Mueller Technologies. Segment sales, operating results and additional financial data and commentary are provided in the Segment Analysis section in Part II, Item 7. “
MANAGEMENT’S DISCUSSION AND ANALYSIS OF FINANCIAL CONDITION AND RESULTS OF OPERATIONS
” and in
Note 16.
of the Notes to Consolidated Financial Statements in Part II, Item 8. “
FINANCIAL STATEMENTS AND SUPPLEMENTARY DATA
” of this annual report.
Infrastructure
Infrastructure manufactures valves for water and gas systems, including iron gate, butterfly, tapping, check, knife, plug, automatic control and ball valves, as well as dry-barrel and wet-barrel fire hydrants and a broad line of pipe repair products, such as clamps and couplings used to repair leaks. Infrastructure’s net sales were
$818.8 million
in
2018
. Sales of Infrastructure products are driven principally by spending on water and wastewater infrastructure upgrade, repair and replacement, and by construction of new water and wastewater infrastructure, which is typically associated with construction of new residential communities. Infrastructure sells its products primarily through waterworks distributors. We believe a majority of Infrastructure’s
2018
net sales were for infrastructure upgrade, repair and replacement.
Technologies
Technologies offers residential and commercial water metering, water leak detection and pipe condition assessment products, systems and services. Technologies’ net sales were
$97.2 million
in
2018
. Technologies is comprised of the Mueller Systems and Echologics businesses. Mueller Systems sells water metering systems, products and services directly to municipalities and to waterworks distributors. Echologics sells water leak detection and pipe condition assessment products and services primarily to municipalities.
1
Business Strategy
Our business strategy is to capitalize on the large, attractive and growing water infrastructure markets worldwide. Key elements of this strategy are as follows:
Deliver integrated, customer-focused support and alignment of our people, products and processes.
By centralizing common functions, integrating our information technology, and focusing management's attention on our customers and their needs, we expect to reduce operating costs, improve our responsiveness, and increase our net sales.
Accelerate development of new products.
We plan to continue to increase investments in our product development capabilities, including expanding our engineering staff, to develop and market new products and services. We expect to add new products to our portfolio and offer new products into different end markets. We expect this expansion to come through internal investments as well as acquisitions.
Drive continuously towards operational excellence.
We are bringing best practices focused on Lean manufacturing and Six Sigma with an investment mindset to deliver manufacturing productivity improvements. These efforts will facilitate innovation and new product development, helping us drive sales growth and strengthen product margins. Effective capital investments and efficiencies at our facilities will allow us to drive down costs, which can fund additional productivity initiatives and continued investment in product development.
Implement a go-to-market strategy that leverages all our products and services.
We plan to continue to accelerate sales growth of our existing products by enhancing our relationships with our customers and channel partners and realizing synergies among our product lines with a unified sales and marketing strategy.
Continue to seek to acquire and invest in businesses and technologies that expand our existing portfolio of businesses or allow us to enter new markets.
We will continue to evaluate the acquisition of strategic businesses, technologies and product lines that have the potential to strengthen our competitive positions, enhance or expand our existing product and service offerings, expand our technological capabilities, provide synergistic opportunities or allow us to enter new markets. As part of this strategy, we may pursue international opportunities, including acquisitions, joint ventures and partnerships, that allow us to expand product or service offerings or enter new markets.
Description of Products and Services
We offer a broad line of water infrastructure, flow control, metrology and leak detection products and services primarily in the United States and Canada. Infrastructure sells water and gas valves and fire hydrants. Technologies sells water metering products and systems and leak detection and pipe condition assessment products and services. Our products are designed, manufactured and tested in compliance with industry standards, where applicable.
Infrastructure
Infrastructure is comprised of companies that manufacture valves for water and gas systems, as well as fire hydrants and pipe repair products for water distribution.
Infrastructure’s water distribution products are manufactured to meet or exceed American Water Works Association (“AWWA”) Standards and, where applicable, certified to NSF/ANSI Standard 61 for potable water conveyance. In addition, Underwriters Laboratory (“UL”) and FM Approvals (“FM”) have approved many of these products. These products are typically specified by a water utility for use in its system.
Water and Gas Valves and Related Products.
Infrastructure manufactures valves for water and gas systems, including iron gate, butterfly, tapping, check, knife, plug, automatic control and ball valves, and sells these products under a variety of brand names, including Mueller, U.S. Pipe Valve and Hydrant, and Singer Valve. Water and gas valves and related products, generally made of iron or brass, accounted for
$569.1 million
,
$516.9 million
and
$504.8 million
of our gross sales in
2018
,
2017
and
2016
, respectively. These valve products are used to control distribution and transmission of potable water, non-potable water or gas. Water valve products typically range in size from ¾ inch to 36 inches in diameter. Infrastructure also manufactures significantly larger valves as custom order work through its Henry Pratt product line. Most of these valves are used in water transmission or distribution, water treatment facilities or industrial applications.
2
Infrastructure also produces machines and tools for tapping, drilling, extracting, installing and stopping-off, which are designed to work with its water and gas fittings and valves as an integrated system.
Fire Hydrants.
Infrastructure manufactures dry-barrel and wet-barrel fire hydrants. Sales of fire hydrants and fire hydrant parts accounted for
$204.3 million
,
$186.5 million
and
$184.9 million
of our gross sales in
2018
,
2017
and
2016
, respectively. Infrastructure sells fire hydrants for new water infrastructure development, fire protection systems and water infrastructure repair and replacement projects.
These fire hydrants consist of an upper barrel and nozzle section and a lower barrel and valve section that connects to a water main. In dry-barrel hydrants, the valve connecting the barrel of the hydrant to the water main is located below ground at or below the frost line, which keeps the upper barrel dry. Infrastructure sells dry-barrel fire hydrants under the Mueller and U.S. Pipe Valve and Hydrant brand names in the United States and the Canada Valve brand name in Canada. Infrastructure also makes wet-barrel hydrants, where the valves are located in the hydrant nozzles and the barrel contains water at all times. Wet-barrel hydrants are made for warm weather climates, such as in California and Hawaii, and are sold under the Jones brand name.
Most municipalities have approved a limited number of fire hydrant brands for installation within their systems due to their desires to use the same tools and operating instructions across their systems and to minimize inventories of spare parts. We believe Infrastructure’s large installed base of fire hydrants throughout the United States and Canada, reputation for superior quality and performance and incumbent specification positions have contributed to the leading market position of its fire hydrants. This large installed base also leads to recurring sales of replacement hydrants and hydrant parts.
Other Products and Services.
Infrastructure also sells pipe repair products, such as clamps and couplings used to repair leaks, under the Mueller and Jones brand names.
Technologies
Technologies is comprised of companies that provide innovative solutions, products and services that actively diagnose, measure and monitor the delivery of water.
Water Metering Products and Systems
. Mueller Systems manufactures and sources a variety of water technology products under the Mueller Systems and Hersey brand names that are designed to help water providers accurately measure and control water usage. Mueller Systems offers a complete line of residential, fire line and commercial metering solutions. Residential and commercial water meters are generally classified as either manually read meters or remotely read meters via radio technology. A manually read meter consists of a water meter and a register that gives a visual meter reading display. Meters equipped with radio transmitters (endpoints) use encoder registers to convert the measurement data from the meter (mechanical or static) into an encrypted digital format which is then transmitted via radio frequency to a receiver that collects and formats the data appropriately for water utility billing systems. These remotely read systems are either automatic meter reading (“AMR”) systems or fixed network advanced metering infrastructure (“AMI”) systems. With an AMR system, utility personnel with mobile equipment, including a radio receiver, computer and reading software, collect the data from utilities’ meters. With an AMI system, a network of permanent data collectors or gateway receivers that are always active or listening for the radio transmission from the utilities’ meters gather the data. AMI systems eliminate the need for utility personnel to travel through service territories to collect meter reading data. These systems provide the utilities with more frequent and diverse data at specified intervals from the utilities’ meters. Mueller Systems sells both AMR and AMI systems and related products. Mueller Systems’ remote disconnect water meter enables the water flow to be stopped and started remotely via handheld devices or from a central operating facility.
Sales of water metering products and systems accounted for
79%
,
83%
and
83%
of Technologies’ net sales in
2018
,
2017
and
2016
, respectively.
Water Leak Detection and Pipe Condition Assessment Products and Services
. Echologics develops technologies and offers products and services under the Echologics brand name that can non-invasively (without disrupting service or introducing a foreign object into the water system) detect underground leaks and assess the condition of water mains comprised of a variety of materials. Echologics leverages its proprietary acoustic technology to offer leak detection and condition assessment surveys. Echologics also offers fixed leak detection systems that allow customers to continuously monitor and detect leaks on water distribution and transmission mains. We believe Echologics’ ability to offer accurate leak detection and pipe condition assessment services non-invasively is a key competitive advantage.
3
Manufacturing
See “Item 2. PROPERTIES” for a description of our principal manufacturing facilities.
We will continue to expand the use of Lean manufacturing and Six Sigma business improvement methodologies where appropriate to safely capture higher levels of quality, service and operational efficiency in our manufacturing facilities in both segments.
Infrastructure
Infrastructure operates
twelve
manufacturing facilities located in the United States, Canada and China. These manufacturing operations include foundry, machining, fabrication, assembly, testing and painting operations. Not all facilities perform each of these operations. Infrastructure’s existing manufacturing capacity is sufficient for anticipated near-term requirements. Infrastructure is currently expanding its large valve casting capabilities at its foundry location in Chattanooga.
Infrastructure foundries use lost foam and green sand casting techniques. Infrastructure uses the lost foam technique for fire hydrant production in its Albertville, Alabama facility and for iron gate valve production in its Chattanooga, Tennessee facility. The lost foam technique has several advantages over the green sand technique for high-volume products, including a reduction in the number of manual finishing operations, lower scrap levels and the ability to reuse some of the materials.
Technologies
Mueller Systems operates
one
manufacturing facility in the United States and contracts with a manufacturing facility in Mexico. Mueller Systems designs, manufactures and assembles water metering products in Cleveland, North Carolina and designs and supports AMR and AMI systems in Middleborough, Massachusetts. Echologics designs leak detection and condition assessment products in Toronto, Ontario. As part of our continuing strategic reorganization initiative, we will be closing the Middleborough facility in 2019 and establishing a research and development center of excellence for software and electronics in Atlanta, Georgia.
Purchased Components and Raw Materials
Our products are made using various purchased components and several basic raw materials, including brass ingot, scrap steel, sand and resin. Purchased parts and raw materials represented approximately
39%
and
11%
, respectively, of cost of sales in
2018
.
Patents, Licenses and Trademarks
We have active patents relating to the design of our products and trademarks for our brands and products. We have filed and continue to file, when appropriate, patent applications used in connection with our business and products. Many of the patents for technology underlying the majority of our products have been in the public domain for many years, and we do not believe third-party patents individually or in the aggregate are material to our business. However, we consider the pool of proprietary information, consisting of expertise and trade secrets relating to the design, manufacture and operation of our products to be particularly important and valuable. We generally own the rights to the products that we manufacture and sell, and we are not dependent in any material way upon any license or franchise to operate. See “Item 1A. RISK FACTORS-Any inability to protect our intellectual property or our failure to effectively defend against intellectual property infringement claims could adversely affect our competitive position.”
4
The table below highlights selected brand names by segment.
|
Infrastructure
|
Technologies
|
|
|
Canada Valve™
|
Echologics®
|
|
|
Centurion®
|
Echoshore®
|
|
|
Hydro Gate®
|
ePulse®
|
|
|
Hydro-Guard®
|
Hersey™
|
|
|
Jones®
|
LeakFinderRT®
|
|
|
Milliken™
|
LeakFinderST™
|
|
|
Mueller®
|
LeakListener®
|
|
|
Singer™
|
LeakTuner®
|
|
|
Pratt®
|
Mi.Echo®
|
|
|
Mi.Data®
|
||
|
Mi.Hydrant™
|
||
|
Mi.Net®
|
||
|
Mueller Systems®
|
||
Seasonality
See “Item 1A. RISK FACTORS-Seasonal demand for certain of our products and services may adversely affect our financial results.” and “Item 7. MANAGEMENT’S DISCUSSION AND ANALYSIS OF FINANCIAL CONDITION AND RESULTS OF OPERATIONS-Seasonality.”
Sales, Marketing and Distribution
We sell primarily to distributors. Our distributor relationships are generally non-exclusive, but we attempt to align ourselves with key distributors in the principal markets we serve. We believe “Mueller” is the most recognized brand in the U.S. water infrastructure industry.
Infrastructure
Infrastructure sells its products primarily through waterworks distributors to a wide variety of end user customers, including municipalities, water and wastewater utilities, gas utilities, and fire protection and construction contractors. Sales of our products are heavily influenced by the specifications for the underlying projects. Approximately
9%
,
8%
and
8%
of Infrastructure’s net sales were to Canadian customers in
2018
,
2017
and
2016
, respectively.
At September 30,
2018
, Infrastructure had
87
sales representatives in the field and
104
inside marketing and sales professionals, as well as
112
independent manufacturer’s representatives. In addition to calling on distributors, these representatives call on municipalities, water companies and other end users to ensure the products specified for their projects are our products or comparable to our products.
Infrastructure’s extensive installed base, broad product range and well-known brands have led to many long-standing relationships with the key distributors in the principal markets we serve. Our distribution network covers all of the major locations for our principal products in the United States and Canada. Although we have long-standing relationships with most of our key distributors, we typically do not have long-term contracts with them, including our two largest distributors, which together accounted for approximately
35%
,
34%
and
35%
of Infrastructure’s gross sales in
2018
,
2017
and
2016
, respectively. The loss of either of these distributors would have a material adverse effect on our business. See “Item 1A. RISK FACTORS-Our business depends on a small group of key customers for a significant portion of our sales.”
Technologies
Mueller Systems sells its water metering systems, products and services directly to municipalities and to waterworks distributors. Echologics sells water leak detection and pipe condition assessment products and services primarily to municipalities or utilities. At September 30,
2018
, Technologies had
32
sales representatives in the field. Technologies’ five largest customers accounted for approximately
47%
,
48%
and
49%
of its gross sales in
2018
,
2017
and
2016
, respectively. See “Item 1A. RISK FACTORS-Our business depends on a small group of key customers for a significant portion of our sales.”
5
Backlog
We consider backlog to represent orders placed by customers for which goods or services have yet to be delivered. Backlog is a meaningful indicator for the Pratt product line of Infrastructure and the Mueller Systems business unit of Technologies. Henry Pratt Company manufactures valves and other parts for large projects that typically require design and build specifications. The delivery lead time for parts used for these projects can be as long as nine months, and we expect approximately
15%
of Henry Pratt Company's backlog at the end of
2018
will not be shipped until beyond
2019
. Mueller Systems manufactures or sources water meter systems that are sometimes ordered in large quantities with delivery dates over several years, and we expect approximately
21%
of Mueller Systems’ backlog will not be shipped until beyond
2019
. Backlog for Henry Pratt Company and Mueller Systems is presented below.
|
|
September 30,
|
||||||
|
|
2018
|
2017
|
|||||
|
|
(in millions)
|
||||||
|
Henry Pratt Company
|
$
|
71.9
|
|
$
|
73.2
|
|
|
|
Mueller Systems
|
20.6
|
|
23.2
|
|
|||
Sales cycles for metering systems can span several years and it is common for customers to place orders throughout the contract period. Although we believe we have a common understanding with our customer as to the total value of a contract when it is awarded, we do not recognize backlog until customer orders are received.
Competition
The U.S. and Canadian markets for water infrastructure and flow control products are very competitive. See “Item 1A. RISK FACTORS-Strong competition could adversely affect prices and demand for our products and services, which would adversely affect our operating results.” There are only a few competitors for most of our product and service offerings. Many of our competitors are well-established companies with products that have strong brand recognition. We consider our installed base, product quality, customer service level, brand recognition, innovation, distribution and technical support to be competitive strengths.
The competitive environment for most of Infrastructure’s valve and hydrant products is mature and many end users are slow to transition to brands other than their historically preferred brand. It is difficult to increase market share in this environment. We believe our fire hydrants and valves enjoy strong competitive positions based primarily on the extent of their installed base, product quality, specified position and brand recognition. Our principal competitors for fire hydrants and iron gate valves are McWane, Inc. and American Cast Iron Pipe Company. The primary competitors for our brass products are The Ford Meter Box Company, Inc. and A.Y. McDonald Mfg. Co. Many brass valves are interchangeable among different manufacturers.
The markets for products and services sold by Technologies are very competitive. Mueller Systems sells water metering products and systems, primarily in the United States. We believe a substantial portion of this market is in the process of transitioning from manually read meters to automatically read meters, but we also expect this transition to be relatively slow and that many end users will be reluctant to adopt brands other than their historically preferred brand. Although Mueller Systems’ market position is relatively small, we believe its automatically read meters and associated technology are well positioned to gain a greater share of these markets. Its principal competitors are Sensus, Itron, Inc., Neptune Technology Group, Inc., Badger Meter, Inc., and Master Meter. Echologics sells water leak detection and pipe condition assessment products and services in North America, the United Kingdom and select countries in Europe, Asia and the Middle East, with its primary markets being the United States and Canada. The worldwide market for leak detection and pipe condition assessment is highly fragmented with numerous competitors. Its more significant competitors are Pure Technologies Ltd., Gutermann AG and Syrinix Ltd.
Research and Development
Our primary research and development (“R&D”) facilities are located in Chattanooga, Tennessee for Infrastructure and in Middleborough, Massachusetts and Toronto, Ontario for Technologies. The primary focus of these operations is to develop new products, improve and refine existing products and obtain and assure compliance with industry approval certifications or standards (such as AWWA, UL, FM, NSF and The Public Health and Safety Company). During October 2018, we announced the creation of a research and development center of excellence for software and electronics in Atlanta, Georgia, which will allow us to consolidate our resources, including those in Middleborough, and accelerate product innovation. At September 30,
2018
, we employed
76
people dedicated to R&D activities. R&D expenses were
$11.6 million
,
$12.1 million
and
$9.9 million
during
2018
,
2017
and
2016
, respectively.
6
Regulatory and Environmental Matters
Our operations are subject to numerous federal, state and local laws and regulations, both within and outside the United States, in areas such as: competition, government contracts, international trade, labor and employment, tax, licensing, consumer protection, environmental protection, workplace health and safety, and others. These and other laws and regulations impact the manner in which we conduct our business, and changes in legislation or government policies can affect our operations, both favorably and unfavorably. For example, the Comprehensive Environmental Response, Compensation and Liability Act (“CERCLA”) and similar state laws affect our operations by, among other things, imposing investigation and cleanup requirements for threatened or actual releases of hazardous substances. Under CERCLA, joint and several liability may be imposed on operators, generators, site owners, lessees and others regardless of fault or the legality of the original activity that caused or resulted in the release of the hazardous substances. Thus, we may be subject to liability under CERCLA and similar state laws for properties that (1) we currently own, lease or operate, (2) we, our predecessors, or former subsidiaries previously owned, leased or operated, (3) sites to which we, our predecessors or former subsidiaries sent waste materials, and (4) sites at which hazardous substances from our facilities’ operations have otherwise come to be located. The purchaser of U.S. Pipe has been identified as a “potentially responsible party” (“PRP”) under CERCLA in connection with a former manufacturing facility operated by U.S. Pipe that was in the vicinity of a Superfund site located in North Birmingham, Alabama. Under the terms of the acquisition agreement relating to our sale of U.S. Pipe, we agreed to indemnify the purchaser for certain environmental liabilities, including those arising out of the former manufacturing site in North Birmingham. Accordingly, the purchaser tendered the matter to us for indemnification, which we accepted. Ultimate liability for the site will depend on many factors that have not yet been determined, including the determination of EPA’s remediation costs, the number and financial viability of the other PRPs (there are four other PRPs currently) and the determination of the final allocation of the costs among the PRPs. For more information regarding this matter as well as others that may affect our business, including our capital expenditures, earnings and competitive position, see “Item 1A. RISK FACTORS,” “Item 3. LEGAL PROCEEDINGS - Environmental,” “Item 7. MANAGEMENT’S DISCUSSION AND ANALYSIS OF FINANCIAL CONDITION AND RESULTS OF OPERATIONS - Contingencies” and
Note 17.
of the Notes to Consolidated Financial Statements.
Employees
At September 30,
2018
, we employed approximately
2,700
people, of whom
87%
work in the United States. At September 30,
2018
,
71%
of our hourly workforce was represented by collective bargaining agreements.
Our locations with employees covered by such agreements are presented below.
|
Location
|
Expiration of current agreement(s)
|
|
|
Chattanooga, TN
|
October 2019 and January 2020
|
|
|
Decatur, IL
|
June 2020
|
|
|
Albertville, AL
|
October 2020
|
|
|
Aurora, IL
|
September 2021
|
|
We believe relations with our employees, including those represented by collective bargaining agreements, are good.
Geographic Information
See Note 16.
of the Notes to Consolidated Financial Statements.
Securities Exchange Act Reports
We file annual and quarterly reports, proxy statements and other information with the U.S. Securities and Exchange Commission (“SEC”). You may read and print materials that we have filed with the SEC from its website at
www.sec.gov
. Our SEC filings may also be viewed and copied at the SEC public reference room located at 100 F Street, N.E., Washington, D.C. 20549. You may call the SEC at 1-800-SEC-0330 for further information on the public reference room.
In addition, certain of our SEC filings, including our annual reports on Form 10-K, our quarterly reports on Form 10-Q, our current reports on Form 8-K, our proxy statements and amendments to them can be viewed and printed free of charge from the investor information section of our website at
www.muellerwaterproducts.com
. Copies of our filings, specified exhibits and corporate governance materials are also available free of charge by writing us using the address on the cover of this annual report. We are not including the information on our website as a part of, or incorporating it by reference into, this annual report.
Our principal executive offices are located at 1200 Abernathy Road N.E., Suite 1200, Atlanta, Georgia 30328, and our main telephone number at that address is (770) 206-4200.
7
Our end markets are subject to risks relating to general economic cycles and conditions, which affect demand for our products and services and may adversely affect our financial results.
Our primary end markets are repair and replacement of water infrastructure, driven by municipal spending, and new water infrastructure installation driven by new residential construction. Sustained uncertainty about any of these end markets could cause our distributors and end use customers to delay purchasing, or determine not to purchase, our products or services. General economic and other factors, including interest rates, inflation, unemployment levels, energy costs, the state of the credit markets (including municipal bonds, mortgages, home equity loans and consumer credit) and other factors beyond our control, could adversely affect our sales, profitability and cash flows. In particular, interest rates are currently rising and are expected to continue to rise in the near term. Increases in interest rates can significantly increase the costs of the projects in which our products are utilized -- such as water and wastewater infrastructure upgrade, repair and replacement projects -- and lead to such projects being reduced, delayed and/or rescheduled, which could result in a decrease in our revenues and earnings and adversely affect our financial condition. In addition, higher interest rates are often accompanied by inflation. In an inflationary environment, we may be unable to raise the prices of our products sufficiently to keep up with the rate of inflation, which would reduce our profit margins. Although the rate of inflation has been low for several years, during the same period we have experienced, and we continue to experience increases in our input costs above the general inflation rate.
A significant portion of our business depends on spending for water and wastewater infrastructure construction activity.
A significant portion of our business depends on local, state and federal spending on water and wastewater infrastructure upgrade, repair and replacement. Funds for water and wastewater infrastructure repair and replacement typically come from local taxes, water fees and water rates. State and local governments and private water entities that do not adequately budget for capital expenditures when setting tax rates, water rates and water fees, as applicable, may be unable to pay for water infrastructure repair and replacement if they do not have access to other funding sources. Governments and private water entities may have limited abilities to increase taxes, water fees or water rates, as applicable. It is not unusual for water and wastewater projects to be delayed and rescheduled for a number of reasons, including changes in project priorities, increasing interest rates and inflation (as discussed above) and difficulties in complying with environmental and other governmental regulations. In addition, reductions or delays in federal spending related to water or wastewater infrastructure could adversely affect state or local projects and may adversely affect our financial results.
Some state and local governments have placed or may place significant restrictions on the use of water by their constituents. These types of water use restrictions may lead to reduced water revenues by private water entities, municipalities or other governmental agencies, which could similarly affect funding decisions for water-related projects.
Poor economic conditions may cause states, municipalities or private water entities to receive lower than anticipated revenues, which may lead to reduced or delayed funding for water infrastructure projects. Even if favorable economic conditions exist, water infrastructure owners may choose not to address deferred infrastructure needs due to a variety of political factors or competing spending priorities.
Low levels of spending for water and wastewater infrastructure construction activity could adversely affect our sales, profitability and cash flows.
Residential construction activity is important to our business and adverse conditions or sustained uncertainty regarding this market could adversely affect our financial results.
As discussed above, several conditions that affect the overall affordability of a home are currently on the rise, including mortgage interest rates and inflation and many commentators are predicting a slowdown in residential construction activity. Because a significant portion of our business depends on new water and wastewater infrastructure spending, which in turn largely depends on residential construction, our financial performance depends significantly on the stability and growth of the residential construction market. This market depends on a variety of factors beyond our control, including household formation, consumer confidence, interest rates, inflation and the availability of mortgage financing, as well as the mix between single and multifamily construction and ultimately the extent to which new construction leads to the development of raw land. Adverse conditions or sustained uncertainty regarding the residential construction market could adversely affect our sales, profitability and cash flows.
8
Our business depends on a small group of key customers for a significant portion of our sales.
Infrastructure sells products primarily to distributors and our success depends on these outside parties operating their businesses profitably and effectively. These distributors’ profitability and effectiveness can vary significantly from company to company and from region to region within the same company. Further, our largest distributors generally also carry competing products. We may fail to align our operations with successful distributors in any given market.
Distributors in our industry have experienced consolidation in recent years. If such consolidation continues, our distributors could be acquired by other distributors who have better relationships with our competitors and pricing and profit margin pressure may intensify. Pricing and profit margin pressure or the loss of any one of our key distributors in any market could adversely affect our operating results.
Technologies primarily sells directly to end users. Some of these customers represent a relatively high concentration of net sales. Over time, expected growth in sales is expected to lessen the significance of individual customers. In the short term, net sales could decline if existing significant customers do not continue to purchase our products or services and new customers are not obtained to replace them.
Strong competition could adversely affect prices and demand for our products and services, which would adversely affect our operating results.
The U.S. and Canadian markets for water infrastructure and flow control products are very competitive. While there are only a few competitors for most of our product and service offerings, many of our competitors are well-established companies with strong brand recognition. We compete on the basis of a variety of factors, including the quality, price and innovation of our products, services and service levels. Our ability to retain our customers in the face of competition depends on our ability to market our products and services to our customers and end users effectively.
The U.S. markets for water metering products and systems are highly competitive. Our primary competitors benefit from strong market positions and many end users are slow to transition to new products or new brands. Our ability to gain customers depends on our technological advancements and ability to market our products and services to our customers and end users effectively.
In addition to competition from North American companies, we face the threat of competition from outside of North America. The intensity of competition from these companies is affected by fluctuations in the value of the U.S. dollar against their local currencies, the cost to ship competitive products into North America and the availability of trade remedies, if any. Competition may also increase as a result of U.S. competitors shifting their operations to lower-cost countries or otherwise reducing their costs.
Our competitors may reduce the prices of their products or services, improve their quality, improve their functionality or enhance their marketing or sales activities. Any of these potential developments could adversely affect our prices and demand for our products and services.
The long-term success of our newer products and services, such as smart metering, leak detection and pipe condition assessment, depends on market acceptance.
Technologies' smart metering and leak detection and pipe condition assessment products and services have much less market history than many of Infrastructure's products. Our investments in smart metering have primarily focused on the market for AMI and have been based on our belief that water utilities will transition over time from traditional manually-read meters to automatically-read meters. The market for AMI is relatively new and continues to evolve, and the U.S. markets for water meter products and systems are highly competitive. Water utilities have traditionally been slow adopters of new technology and may not adopt AMI as quickly as we expect, due, in part, to the substantial investment related to installation of AMI systems. The strong market positions of our primary competitors may also slow the adoption of our products. Similarly, the adoption of our leak detection and pipe condition assessment products and services depends on the willingness of our customers to invest in new product and service offerings, and the pace of adoption may be slower than we expect. If the market for AMI develops more slowly than we expect or if our new leak detection and pipe condition assessment products and services fail to gain market acceptance, our opportunity to grow these businesses will be limited.
9
We may not be able to adequately manage the risks associated with the introduction and deployment of new products and systems, including increased warranty costs.
The success of our new products and systems will depend on our ability to manage the risks associated with their introduction, including the risk that new products and systems may have quality or other defects or deficiencies in their early stages that result in their failure to satisfy performance or reliability requirements. Our success will depend in part on our ability to manage these risks, including costs associated with manufacturing, installation, maintenance and warranties. These challenges can be costly and technologically challenging, and we cannot determine in advance the ultimate effect they may have. For example, during the quarters ended March 30, 2017 and June 30, 2018, we recorded discrete warranty expenses of $9.8 million and $14.1 million, respectively, associated with certain products that Technologies produced prior to 2017, as described more fully in
Note 17.
to the Notes to the Consolidated Financial Statements. Warranty liabilities and the related reserve estimation process is highly judgmental due to the complex nature of these exposures and the unique circumstances of each claim. Furthermore, once claims are asserted for a product defect, it can be difficult to determine the extent to which the assertion of these claims will expand geographically. Although we have obtained insurance for product defect claims, such policies may not be available or adequate to cover the liability for damages, the cost of repairs and/or the expense of litigation. Current and future claims may arise out of events or circumstances not covered by insurance and not subject to effective indemnification agreements with our subcontractors. Failure to successfully manage these challenges could result in lost revenue, significant expenses, and harm to our reputation.
We may not realize the expected benefits from our strategic reorganization plans.
During the quarter ended September 30, 2017, we announced our strategic reorganization plan designed to accelerate our product innovation and revenue growth. In particular, we reconfigured our divisional structure around products, with five business teams that have line and cross-functional responsibility for managing distinct product portfolios. We believe the new organizational structure will be better aligned with business needs and generate greater efficiencies.
Activities under the plan were initiated in the fourth quarter of 2017 and essentially completed in 2018. We incurred approximately $8.8 million in restructuring charges associated with the reorganization. We do not expect to incur additional material charges related to this reorganization.
During October 2018, we announced the move of our Middleborough, Massachusetts facility to Atlanta, which will allow us to consolidate our resources and accelerate product innovation through creation of a research and development center of excellence for software and electronics in Atlanta, Georgia. As a result of this reorganization, we expect annual cost savings of approximately $1.5 million, which takes into account the hiring and alignment of new engineering talent. We expect to incur approximately $5.0 million in charges related to this reorganization.
These measures, however, could yield unintended consequences, such as distraction of our management and employees, business disruption, inability to attract or retain key personnel, and reduced employee productivity, which could negatively affect our business, sales, financial condition and results of operations. We cannot guarantee that the activities under the restructuring and reorganization activities will result in the desired efficiencies and estimated cost savings.
Our business strategy includes developing, acquiring and investing in companies and technologies that broaden our product portfolio or complement our existing business, which could be unsuccessful or consume significant resources and adversely affect our operating results.
We will continue to evaluate the development or acquisition of strategic businesses, technologies and product lines with the potential to strengthen our industry position, enhance our existing set of product and service offerings, or enter new markets. We may be unable to identify or successfully complete suitable acquisitions in the future and completed acquisitions may not be successful.
10
Acquisitions and technology investments may involve significant cash expenditures, debt incurrence, operating losses and expenses that could have a material adverse effect on our business, financial condition, results of operations and cash flows. These types of transactions involve numerous other risks, including:
|
•
|
Diversion of management time and attention from existing operations;
|
|
•
|
Difficulties in integrating acquired businesses, technologies and personnel into our business or into our compliance and control programs, particularly those that involve international operations such as our pending acquisition of Krausz Industries, Ltd expected to close in December 2018, which is based in Tel Aviv, Israel (“Krausz Industries”);
|
|
•
|
Working with partners or other ownership structures with shared decision-making authority (our interests and other ownership interests may be inconsistent);
|
|
•
|
Difficulties in obtaining and verifying relevant information regarding a business or technology prior to the consummation of the transaction, including the identification and assessment of liabilities, claims or other circumstances, including those relating to intellectual property claims, that could result in litigation or regulatory exposure;
|
|
•
|
Assumptions of liabilities that exceed our estimated amounts;
|
|
•
|
Verifying the financial statements and other business information of an acquired business;
|
|
•
|
Inability to obtain required regulatory approvals and/or required financing on favorable terms;
|
|
•
|
Potential loss of key employees, contractual relationships or customers;
|
|
•
|
Increased operating expenses related to the acquired businesses or technologies;
|
|
•
|
The failure of new technologies, products or services to gain market acceptance with acceptable profit margins;
|
|
•
|
Entering new markets in which we have little or no experience or in which competitors may have stronger market positions;
|
|
•
|
Dilution of interests of holders of our common shares through the issuance of equity securities or equity-linked securities; and
|
|
•
|
Inability to achieve expected synergies.
|
Any acquisitions or investments may ultimately harm our business or financial condition, as they may not be successful and may ultimately result in impairment charges.
Potential international business opportunities may expose us to additional risks, including currency exchange fluctuations.
A part of our growth strategy depends on us expanding internationally. Although net sales outside of the United States and Canada account for a relatively small percentage of our total net sales, we expect to increase our level of business activity outside of the United States and Canada, as illustrated by our pending acquisition of Krausz Industries, expected to close in December 2018, which is based in Tel Aviv, Israel. Some countries that present good business opportunities also face political and economic instability and vulnerability to infrastructure and other disruptions. Seeking to expand our business internationally exposes us to additional risks, which include foreign exchange risks and currency fluctuations (as discussed more fully below), political and economic uncertainties, changes in local business conditions and national and international conflicts. A primary risk we face in connection with our export shipments relates to our ability to collect amounts due from customers. We also face the potential risks arising from staffing, monitoring and managing international operations, including the risk such activities may divert our resources and management time.
In addition, compliance with the laws and regulations of multiple international jurisdictions increases our cost of doing business. International operations are subject to anti-corruption laws and anti-competition regulations, among others. For example, the U.S. Foreign Corrupt Practices Act and similar non-U.S. anti-corruption laws generally prohibit companies and their intermediaries from making improper payments or providing anything of value to improperly influence foreign government officials and certain others for the purpose of obtaining or retaining business, or obtaining an unfair advantage. Violations of these laws and regulations could result in criminal and civil sanctions, disrupt our business and adversely affect our brands, international expansion efforts, business and operating results.
11
We earn revenues and incur expenses in foreign currencies as part of our operations outside of the United States. Accordingly, fluctuations in currency exchange rates may significantly increase the amount of U.S. dollars required for foreign currency expenses or significantly decrease the U.S. dollars we receive from foreign currency revenues. As a result, changes between the foreign exchange rates and the U.S. dollar affect the amounts we record for our foreign assets, liabilities, revenues and expenses, and could have a negative effect on our financial results. We expect that our exposure to foreign currency exchange rate fluctuations will grow as the relative contribution of our non-U.S. operations increases through both organic and inorganic growth.
If significant tariffs or other restrictions are placed on foreign imports by the United States or any related counter-measures are taken by impacted foreign countries, our revenue and results of operations may be harmed.
If significant tariffs or other restrictions are placed on foreign imports by the United States or any related counter-measures are taken by impacted foreign countries, our revenue and results of operations may be harmed. The Trump Administration has signaled that it may continue to alter trade agreements and terms between China and the United States, including limiting trade with China and/or imposing additional tariffs on imports from China. In March 2018, President Trump imposed a 25% tariff on steel imports and a 10% tariff on aluminum imports and announced additional tariffs on goods imported from China specifically, as well as certain other countries. The materials subject to these tariffs to date can impact our raw material costs. However, if further tariffs are imposed on a broader range of imports, or if further retaliatory trade measures are taken by China or other countries in response to additional tariffs, we may be required to raise our prices, which may result in the loss of customers and harm our operating performance.
Inefficient or ineffective allocation of capital could adversely affect our operating results and/or shareholder value.
Our goal is to invest capital to generate long-term value for our shareholders. This includes spending on capital projects, such as developing or acquiring strategic businesses, technologies and product lines with the potential to strengthen our industry position, enhancing our existing set of product and service offerings, or entering new markets, as well as periodically returning value to our stockholders through share repurchases and dividends. To a large degree, capital efficiency reflects how well we manage key risks. The actions taken to address specific risks may affect how well we manage the more general risk of capital efficiency. If we do not properly allocate our capital, we may fail to produce optimal financial results and we may experience a reduction in stockholder value, including increased volatility in our stock price.
Our reliance on vendors for certain products, some of which are single-source or limited source suppliers, could harm our business by adversely affecting product availability, reliability or cost.
We maintain several single-source or limited-source supplier relationships with manufacturers, including some outside of the United States. If the supply of a critical single- or limited-source product is delayed or curtailed, we may not be able to ship the related products in desired quantities or in a timely manner. Even where multiple sources of supply are available, qualification of the alternative suppliers and establishment of reliable supplies could result in delays and a possible loss of sales, which could harm our operating results.
These relationships reduce our direct control over production. Our reliance on these vendors subjects us to a greater risk of shortages, and reduced control over delivery schedules of products, as well as a greater risk of increases in product costs. In instances where we stock lower levels of product inventories, a disruption in product availability could harm our financial performance and our ability to satisfy customer needs. In addition, defective products from these manufacturers could reduce product reliability and harm our reputation.
A disruption in our supply chain or other factors impacting the distribution of our products could adversely affect our business.
A disruption within our logistics or supply chain network at any of the freight companies that deliver us components for our manufacturing operations in the United States or ship our fully-assembled products to our customers could adversely affect our business and result in lost sales or harm to our reputation. Our supply chain is dependent on third party ocean-going container ships, rail, barge and trucking systems and, therefore, disruption in these logistics services because of weather-related problems, strikes, bankruptcies or other events could adversely affect our financial performance and financial condition, negatively impacting sales, profitability and cash flows.
12
Transportation costs are relatively high for most of our products.
Transportation costs can be an important factor in a customer’s purchasing decision. Many of our products are big, bulky and heavy, which tend to increase transportation costs. We also have relatively few manufacturing sites, which tends to increase transportation distances to our customers and costs. High transportation costs could make our products less competitive compared to similar or alternative products offered by competitors.
We may experience difficulties implementing upgrades to our enterprise resource planning system.
We are engaged in a multi-year implementation of upgrades to our enterprise resource planning system (ERP) and other systems. The ERP is designed to accurately maintain the company’s books and records and provide information important to the operation of the business to the company’s management team. These upgrades will require significant investment of human and financial resources. In implementing the ERP upgrade, we may experience significant delays, increased costs and other difficulties. Any significant disruption or deficiency in the design and implementation of the ERP upgrades could adversely affect our ability to process orders, ship product, send invoices and track payments, fulfill contractual obligations or otherwise operate our business. While we have invested significant resources in planning and project management, significant implementation issues may arise.
Normal operations at our key manufacturing facilities may be interrupted.
Some of our key products, including fire hydrants and iron gate valves, are manufactured at single or few manufacturing facilities that depend on critical pieces of heavy equipment that cannot be economically moved to other locations. We are therefore limited in our ability to shift production among locations. The operations at our manufacturing facilities may be interrupted or impaired by various operating risks, including, but not limited to:
|
•
|
Catastrophic events, such as fires, floods, explosions, natural disasters, severe weather or other similar occurrences;
|
|
•
|
Interruptions in the delivery of raw materials, shortages of equipment or spare parts, or other manufacturing inputs;
|
|
•
|
Adverse government regulations;
|
|
•
|
Equipment or information systems breakdowns or failures;
|
|
•
|
Violations of our permit requirements or revocation of permits;
|
|
•
|
Releases of pollutants and hazardous substances to air, soil, surface water or ground water; and
|
|
•
|
Labor disputes.
|
The occurrence of any of these events may impair our production capabilities and adversely affect our sales, profitability and cash flows.
Any inability to protect our intellectual property or our failure to effectively defend against intellectual property infringement claims could adversely affect our competitive position.
Our business depends on our technology and expertise, which were largely developed internally and are not subject to statutory protection. We rely on a combination of patent protection, copyright and trademark laws, trade secrets protection, employee and third-party confidentiality agreements and technical measures to protect our intellectual property rights. The measures that we take to protect our intellectual property rights may not adequately deter infringement, misappropriation or independent development of our technology, and they may not prevent an unauthorized party from obtaining or using information or intellectual property that we regard as proprietary or keep others from using brand names similar to our own. The disclosure, misappropriation or infringement of our intellectual property could harm our competitive position. In addition, our actions to enforce our rights may result in substantial costs and the diversion of management time and other resources. We may also be subject to intellectual property infringement claims from time to time, which may result in additional expenses and diverting resources to respond to these claims. Finally, for those products in our portfolio that rely on patent protection, once a patent has expired the product is more subject to competition. Products under patent protection potentially generate significantly higher revenue and earnings than those not protected by patents. If we fail to successfully enforce our intellectual property rights or register new patents, our competitive position could suffer, which could adversely affect our business, financial condition, results of operations and cash flows.
13
If we do not successfully maintain our information and technology networks, including the security of those networks, our operations could be disrupted and unanticipated increases in costs and/or decreases in revenues could result.
We rely on various information technology systems, some of which are controlled by outside service providers, to manage key aspects of our operations. The proper functioning of our information technology systems is important to the successful operation of our business. If critical information technology systems fail, or are otherwise unavailable, our ability to manufacture products, process orders, track credit risk, identify business opportunities, maintain proper levels of inventories, collect accounts receivable, pay expenses and otherwise manage our business would be adversely affected.
We depend on the Internet and our information technology infrastructure for electronic communications among our locations around the world and among our personnel and suppliers and customers. Cyber and other data security breaches of this infrastructure can create system disruptions, shutdowns or unauthorized disclosure of confidential information. If we or our service providers are unable to prevent these breaches, our operations could be disrupted or we may suffer financial, reputational or other harm because of lost or misappropriated information.
We may fail to effectively manage confidential data, which could harm our reputation, result in substantial additional costs and subject us to litigation.
As we grow our Technologies businesses, we continue to accumulate increasing volumes of customer data. In addition, we store personal information in connection with our human resources operations. Our efforts to protect this information may be unsuccessful due to employee errors or malfeasance, technical malfunctions, the actions of third parties (such as cyber attack) or other factors. If our cyber defenses and other countermeasures we deploy are unable to protect personal data, it could be accessed or disclosed improperly, which could expose us to liability, harm our reputation and deter current and potential users from using our products and services. The regulatory environment related to cyber and information security, data collection and privacy is increasingly rigorous, with new and constantly changing requirements applicable to our business, and compliance with those requirements could result in additional costs.
Cyberattacks and security vulnerabilities could lead to reduced revenue, increased costs, liability claims, or harm to our reputation
Cyberthreats are constantly evolving and can take a variety of forms, increasing the difficulty of detecting and successfully defending against them. Individual and groups of hackers and sophisticated organizations, including state-sponsored organizations or nation-states, continuously undertake attacks that pose threats to our customers and our IT. These actors may use a wide variety of methods, which may include developing and deploying malicious software or exploiting vulnerabilities in hardware, software, or other infrastructure in order to attack our products and services or gain access to our networks and datacenters, using social engineering techniques to induce our employees, users, partners, or customers to disclose passwords or other sensitive information or take other actions to gain access to our data or our users’ or customers’ data, or acting in a coordinated manner to launch distributed denial of service or other coordinated attacks. Inadequate account security practices may also result in unauthorized access to confidential data.
We may have no current capability to detect certain vulnerabilities, which may allow them to persist in the environment over long periods of time. Cyberthreats can have cascading impacts that unfold with increasing speed across our internal networks and systems and those of our partners and customers. Breaches of our facilities, network, or data security could disrupt the security of our systems and business applications, impair our ability to provide services to our customers and protect the privacy of their data, result in product development delays, compromise confidential or technical business information harming our reputation, result in theft or misuse of our intellectual property or other assets, require us to allocate more resources to improved technologies, or otherwise adversely affect our business.
14
We are subject to a variety of claims, investigations and litigation that could adversely affect our results of operations and harm our reputation.
In the normal course of our business, we are subject to claims and lawsuits, including from time to time claims for damages related to product liability and warranties, investigations by governmental agencies, litigation alleging the infringement of intellectual property rights and litigation related to employee matters and commercial disputes. Defending these lawsuits and becoming involved in these investigations may divert our management’s attention, and may cause us to incur significant expenses, even if there is no evidence that our systems or components were the cause of the claim. In addition, we may be required to pay damage awards, penalties or settlements, or become subject to injunctions or other equitable remedies, that could have a material adverse effect on our business, financial condition, results of operations and cash flows. Moreover, any insurance or indemnification rights that we have may be insufficient or unavailable to protect us against potential loss exposures. See “Item 1. BUSINESS - Regulatory and Environmental Matters,” “Item 3. LEGAL PROCEEDINGS - Environmental,” “Item 7. MANAGEMENT’S DISCUSSION AND ANALYSIS OF FINANCIAL CONDITION AND RESULTS OF OPERATIONS - Contingencies” and
Note 17.
of the Notes to Consolidated Financial Statements.
We are subject to stringent environmental, health and safety laws and regulations that impose significant compliance costs. Any failure to satisfy these laws and regulations may adversely affect us.
We are subject to stringent laws and regulations relating to the protection of the environment, health and safety and incur significant capital and other expenditures to comply with these requirements. Failure to comply with any environmental, health or safety requirements could result in the assessment of damages, the imposition of penalties, suspension of production, changes to equipment or processes or a cessation of operations at our facilities, any of which could have a material adverse effect on our business. Because these laws are complex, subject to change and may be applied retroactively, we cannot predict with certainty the extent of our future liabilities with respect to environmental, health and safety matters and whether they will be material.
In addition, certain statutes such as CERCLA may impose joint and several liability for the costs of remedial investigations and actions on entities that generated waste, arranged for disposal of waste, transported to or selected the disposal sites and the past and present owners and operators of such sites. All such “potentially responsible parties” (“PRP”) (or any one of them, including us) may be required to bear all of such costs regardless of fault, the legality of the original disposal or ownership of the disposal site. As a result, we may be required to conduct investigations and perform remedial activities at current and former operating and manufacturing sites where we have been, or in the future could be, named a PRP with respect to such environmental liabilities, any of which could require us to incur material costs. The final remediation costs of these environmental sites may exceed current estimated costs, and additional sites in the future may require material remediation expenses. If actual expenditures exceed our estimates, our results of operations and financial position could be materially and adversely affected. See “Item 1. BUSINESS - Regulatory and Environmental Matters,” “Item 3. LEGAL PROCEEDINGS - Environmental,” “Item 7. MANAGEMENT’S DISCUSSION AND ANALYSIS OF FINANCIAL CONDITION AND RESULTS OF OPERATIONS - Contingencies” and
Note 17.
of the Notes to Consolidated Financial Statements.
We may have substantial additional liability for federal income tax allegedly owed by Walter Energy.
We were a member of the Walter Energy, Inc. (“Walter Energy”) federal tax consolidated group, through December 14, 2006, at which time the company was spun-off from Walter Industries. Until our spin-off from Walter Energy, we joined in the filing of the Walter Energy consolidated federal income tax return for each taxable year during which we were a member of the consolidated group. As a result, we are jointly and severally liable for the federal income tax liability, if any, of the consolidated group for each of those years. Accordingly, we could be liable in the event any such federal income tax liability is incurred, and not discharged, by any other member of the Walter Energy tax consolidated group for any period during which we were included in the Walter Energy tax consolidated group.
In July 2015, Walter Energy filed for bankruptcy protection under Chapter 11 of the U.S. Bankruptcy Code in the Northern District of Alabama (“Chapter 11 Case”). On February 2, 2017, the Chapter 11 Case was converted to a liquidation proceeding under Chapter 7 of the U.S. Bankruptcy Code, pursuant to which Walter Energy is now in the process of being wound down and liquidated.
The IRS is currently alleging that Walter Energy owes substantial amounts for prior taxable periods in which we were a member of the Walter Energy tax consolidated group (specifically, 1983-1994, 2000-2002 and 2005). On January 11, 2016, the IRS filed a proof of claim in the Chapter 11 Case, alleging that Walter Energy owes taxes, interest and penalties for the years 1983-1994, 2000-2002 and 2005 in an aggregate amount of
$554.3 million
(
$229.1 million
of which the IRS claims is entitled to priority status in the Chapter 11 Case). The IRS asserts that its claim is based on an alleged settlement of Walter Energy’s tax liability for years 1983 through 1994, which Walter Energy disputed. In the proof of claim, the IRS included an alternative
15
calculation in an aggregate amount of
$860.4 million
, which it asserts would be appropriate in the event the alleged settlement is determined to be non-binding (
$535.3 million
of which the IRS claims is entitled to priority status in the Chapter 11 Case). The IRS has indicated its intent to pursue collection of amounts included in the proofs of claim from former members of the Walter Energy tax consolidated group.
We have been working constructively with the parties involved in this matter in an effort to reach a consensual resolution with respect to the alleged tax liabilities at issue. Based on our work to date, we believe that once certain anticipated refunds (applicable primarily to 1997 and 2006 through 2015) are applied against asserted income tax liabilities owing for other years, the total net tax liabilities of Walter Energy, if any, will be substantially less than those asserted by the IRS.
We cannot estimate the amount of, or the extent to which we will be responsible for, any liabilities to which we may be subject relating to these tax claims. Such liabilities could have a material adverse effect on our business, financial condition, liquidity or results of operations. Furthermore, there can be no assurance we will be able to reach any resolution with the parties involved in this matter and, in such event, we would intend to vigorously assert any and all available defenses against any liabilities we may have as a member of the Walter Energy consolidated group.
We rely on successors to Tyco to indemnify us for certain liabilities and they may become financially unable or fail to comply with the terms of the indemnity.
Under the terms of the acquisition agreement relating to the August 1999 sale by Tyco of our businesses to a previous owner of these businesses, we are indemnified by certain Tyco entities (“Tyco Indemnitors”) for all liabilities arising in connection with the operation of these businesses prior to their sale by Tyco, including with respect to products manufactured or sold prior to the closing of that transaction, as well as certain environmental liabilities. These indemnities survive indefinitely and are not subject to any dollar limits. In the past, Tyco Indemnitors have made substantial payments and assumed defense of claims in connection with these indemnification obligations. Tyco’s indemnity does not cover liabilities to the extent caused by us or the operation of our businesses after August 1999, nor does it cover liabilities arising with respect to businesses or sites acquired after August 1999. Since 2007, Tyco has engaged in multiple corporate restructurings, split-offs and divestitures. The result of these transactions is that the assets of, and control over, Tyco Indemnitors has changed. Should any Tyco Indemnitor become financially unable or fail to comply with the terms of the indemnity, we may be responsible for such obligations or liabilities.
We depend on qualified personnel and, if we are unable to retain or hire executive officers, key employees and
skilled personnel, we may not be able to achieve our strategic objectives and our business may be adversely
affected.
Our ability to expand or maintain our business depends on our ability to hire, train and retain employees with the skills necessary to understand and adapt to the continuously developing needs of our customers. The increasing demand for qualified personnel makes it more difficult for us to attract and retain employees with requisite skill sets, particularly employees with specialized technical and trade experience. Changing demographics and labor work force trends also may result in a loss of knowledge and skills as experienced workers retire. If we fail to attract, motivate, train and retain qualified personnel, or if we experience excessive turnover, we may experience declining sales, manufacturing delays or other inefficiencies, increased recruiting, training and relocation costs and other difficulties, and our business, financial condition, results of operations and cash flows could be materially and adversely affected. Competition for qualified personnel is intense and we may not be successful in attracting or retaining qualified personnel, which could negatively impact our business.
Our expenditures for pension obligations could be materially higher than we have predicted.
We provide pension benefits to certain current and former employees. To determine our future payment obligations under the plans, certain rates of return on the plans’ assets, growth rates of certain costs and participant longevity have been estimated. The proportion of the assets held by our U.S. pension plan invested in fixed income securities, instead of equity securities, has increased over historical levels. This shift in asset allocation has resulted in a decrease in the estimated rate of return on plan assets for this plan. Assumed discount rates, expected return on plan assets and participant longevity have significant effects on the amounts reported for the pension obligations and pension expense.
The funded status of our pension plans can also be influenced by regulatory requirements, which can change unexpectedly and impose higher costs if funding levels are below certain thresholds. We may increase contributions to our pension plans to avoid or reduce these higher costs.
Significant adverse changes in credit and capital markets or changes in investments could result in discount rates or actual rates of return on plan assets being materially lower than projected and require us to increase pension contributions in future years to meet funding level requirements. Increasing life spans for plan participants may increase the estimated benefit
16
payments and increase the amounts reported for pension obligations, pension contributions and pension expense. If increased funding requirements are particularly significant and sustained, our overall liquidity could be materially reduced, which could cause us, among other things, to reduce investments and capital expenditures, or restructure or refinance our debt.
Any failure to satisfy international trade laws and regulations or to otherwise comply with changes or other trade developments may adversely affect us.
Our operations require importing and exporting goods and technology among countries on a regular basis. Thus, the sale and shipment of our products and services across international borders, as well as the purchase of components and products from international sources, subject us to extensive trade laws and regulations. Trade laws and regulations are complex, differ by country, and are enforced by a variety of government agencies. Because we are subject to extensive trade laws and regulations in the countries in which we operate, we are subject to the risk that laws and regulations could change in a way that would expose us to additional costs, penalties or liabilities, and our policies and procedures may not always protect us from actions that would violate international trade laws and regulations. For example, certain federal legislation requires the use of American iron and steel products in certain water projects receiving certain federal appropriations. We have incurred costs in connection with ensuring our ability to certify to these requirements, including those associated with enhancing our assembly operations and sourcing practices. As a result of the varying legal and regulatory requirements to which our cross-border activities are subject, we may not always be in compliance with the trade laws and regulations in all respects. Any improper actions could subject us to civil or criminal penalties, including material monetary fines, or other adverse actions, including denial of import or export privileges, and could harm our reputation and our business prospects.
Our high fixed costs may make it more difficult for us to respond to economic cycles.
A significant portion of our cost structure is fixed, including manufacturing overhead, capital equipment and research and development costs. In a prolonged economic downturn, these fixed costs may cause our gross margins to erode and earnings to decline.
The prices of our purchased components and raw materials can be volatile.
Our operations require substantial amounts of purchased components and raw materials, such as scrap steel, sand, resin, brass ingot and steel pipe. We generally purchase components and raw materials at current market prices. The cost and availability of these materials are subject to economic forces largely beyond our control, including North American and international demand, foreign currency exchange rates, freight costs, tariffs and commodity speculation.
We may not be able to pass on the entire cost of price increases for purchased components and raw materials to our customers or offset fully the effects of these higher costs through productivity improvements. In particular, when purchased component or raw material prices increase rapidly or to significantly higher than normal levels, we may not be able to pass cost increases through to our customers on a timely basis, if at all, which would reduce our profitability and cash flows. In addition, if purchased components or raw materials were not available or not available on commercially reasonable terms, our sales, profitability and cash flows would be reduced. Our competitors may secure more reliable sources of purchased components and raw materials or they may obtain these supplies on more favorable terms than we do, which could give them a cost advantage.
Seasonal demand for certain of our products and services may adversely affect our financial results.
Sales of some of our products, including iron gate valves and fire hydrants, are seasonal, with lower sales in our first and second fiscal quarters when weather conditions throughout most of North America tend to be cold resulting in lower levels of construction activity. This seasonality in demand has resulted in fluctuations in our sales and operating results. To satisfy demand during expected peak periods, we may incur costs associated with building inventory in off-peak periods, and our projections as to future needs may not be accurate. Because many of our expenses are fixed, seasonal trends can cause reductions in our profitability and profit margins and deterioration of our financial condition during periods affected by lower production or sales activity.
We may be affected by new governmental legislation and regulations relating to carbon dioxide emissions.
Many of our manufacturing plants use significant amounts of electricity generated by burning fossil fuels, which releases carbon dioxide. Several state courts and administrative agencies are considering the scope and scale of carbon dioxide emission regulation under various laws pertaining to the environment, energy use and development and greenhouse gas emissions. In addition, several states are considering various carbon dioxide registration and reduction programs. The final details and scope of these various legislative, regulatory and policy measures are unclear and their potential impact is still uncertain, so we cannot fully predict the impact on our business.
17
The potential impacts of climate change on our operations are highly uncertain. Although the financial impact of these potential changes is not reasonably estimable at this time, our operations in certain locations and those of our customers and suppliers could potentially be adversely affected, which could adversely affect our sales, profitability and cash flows.
We may not be able to efficiently integrate our acquisition of Krausz Industries or other future acquisitions.
We expect to continue making acquisitions as part of our long-term business strategy. In February 2017, we completed our acquisition of Singer Valve for $26.6 million. In November 2018, we announced an agreement to acquire Krausz Industries for $140 million. These acquisitions and other transactions and arrangements involve significant challenges and risks, including that they do not advance our business strategy, that we get an unsatisfactory return on our investment, that we have difficulty integrating and retaining new employees, business systems, and technology, or that they distract management from our other businesses. The success of these transactions and arrangements will depend in part on our ability to leverage them to enhance our existing products and services or develop compelling new ones. It may take longer than expected to realize the full benefits from these transactions and arrangements, such as increased revenue, enhanced efficiencies, or increased market share, or the benefits may ultimately be smaller than we expected. These events could adversely affect our operating results or financial condition.
|
Item 2.
|
PROPERTIES
|
Our principal properties are listed below.
|
Location
|
Activity
|
Size
(sq. ft.)
|
Owned or
leased
|
||||
|
Infrastructure:
|
|||||||
|
Albertville, AL
|
Manufacturing
|
422,000
|
|
Owned
|
|||
|
Aurora, IL
|
Manufacturing
|
147,000
|
|
Owned
|
|||
|
Aurora, IL
|
Distribution
|
84,000
|
|
Leased
|
|||
|
Barrie, Ontario
|
Distribution
|
50,000
|
|
Leased
|
|||
|
Brownsville, TX
|
Manufacturing
|
50,000
|
|
Leased
|
|||
|
Calgary, Alberta
|
Distribution
|
11,000
|
|
Leased
|
|||
|
Chattanooga, TN
|
Manufacturing
|
525,000
|
|
Owned
|
|||
|
Chattanooga, TN
|
General and administration
|
17,000
|
|
Leased
|
|||
|
Chattanooga, TN
|
Research and development
|
22,000
|
|
Leased
|
|||
|
Cleveland, TN
|
Manufacturing
|
109,500
|
|
Owned
|
|||
|
Decatur, IL
|
Manufacturing
|
467,000
|
|
Owned
|
|||
|
Hammond, IN
|
Manufacturing
|
51,000
|
|
Owned
|
|||
|
Jingmen, China
|
Manufacturing
|
154,000
|
|
Owned
|
|||
|
Ontario, CA
|
Distribution
|
73,000
|
|
Leased
|
|||
|
Surrey, British Columbia
|
Manufacturing
|
33,000
|
|
Leased
|
|||
|
Tai Cang, China
|
Manufacturing
|
19,000
|
|
Leased
|
|||
|
Woodland, WA
|
Manufacturing
|
20,000
|
|
Leased
|
|||
|
Sharjah, United Arab Emirates
|
Distribution
|
10,000
|
|
Leased
|
|||
|
Technologies:
|
|||||||
|
Cleveland, NC
|
Manufacturing
|
190,000
|
|
Owned
|
|||
|
Middleborough, MA
|
Research and development
|
26,000
|
|
Leased
|
|||
|
Toronto, Ontario
|
Research and development
|
14,000
|
|
Leased
|
|||
|
Corporate:
|
|||||||
|
Atlanta, GA
|
Corporate headquarters
|
25,000
|
|
Leased
|
|||
We consider our facilities to be well maintained and believe we have sufficient capacity to meet our anticipated needs through
2019
. Our leased properties have terms expiring at various dates through 2028.
18
|
Item 3.
|
LEGAL PROCEEDINGS
|
We are involved in various legal proceedings that have arisen in the normal course of operations, including the proceedings summarized below. The effect of the outcome of these matters on our financial statements cannot be predicted with certainty as any such effect depends on the amount and timing of the resolution of such matters. Other than the litigation described below, we do not believe that any of our outstanding litigation would have a material adverse effect on our business or prospects.
Environmental.
We are subject to a wide variety of laws and regulations concerning the protection of the environment, both with respect to the operations at many of our properties and with respect to remediating environmental conditions that may exist at our own or other properties. We accrue for environmental expenses resulting from existing conditions that relate to past operations when the costs are probable and reasonably estimable.
In the acquisition agreement pursuant to which a predecessor to Tyco sold our businesses to a previous owner in August 1999, Tyco agreed to indemnify us and our affiliates, among other things, for all “Excluded Liabilities.” Excluded Liabilities include, among other things, substantially all liabilities relating to the time prior to August 1999, including environmental liabilities. The indemnity survives indefinitely. Tyco’s indemnity does not cover liabilities to the extent caused by us or the operation of our businesses after August 1999, nor does it cover liabilities arising with respect to businesses or sites acquired after August 1999. Since 2007, Tyco has engaged in multiple corporate restructurings, split-offs and divestitures. While none of these transactions directly affects the indemnification obligations of the Tyco indemnitors under the 1999 acquisition agreement, the result of such transactions is that the assets of, and control over, such Tyco indemnitors has changed. Should any of these Tyco indemnitors become financially unable or fail to comply with the terms of the indemnity, we may be responsible for such obligations or liabilities.
On July 13, 2010, Rohcan Investments Limited, the former owner of property leased by Mueller Canada Ltd. and located in Milton, Ontario, filed suit against Mueller Canada Ltd. and its directors seeking
C$10.0 million
in damages arising from the defendants’ alleged environmental contamination of the property and breach of lease. Mueller Canada Ltd. leased the property from 1988 through 2008. We are pursuing indemnification from a former owner for certain potential liabilities that are alleged in this lawsuit, and we have accrued for other liabilities not covered by indemnification. On December 7, 2011, the Court denied the plaintiff’s motion for summary judgment.
The purchaser of U.S. Pipe has been identified as a “potentially responsible party” (“PRP”) under the Comprehensive Environmental Response, Compensation and Liability Act (“CERCLA”) in connection with a former manufacturing facility operated by U.S. Pipe that was in the vicinity of a proposed Superfund site located in North Birmingham, Alabama. Under the terms of the acquisition agreement relating to our sale of U.S. Pipe, we agreed to indemnify the purchaser for certain environmental liabilities, including those arising out of the former manufacturing site in North Birmingham. Accordingly, the purchaser tendered the matter to us for indemnification, which we accepted. Ultimate liability for the site will depend on many factors that have not yet been determined, including the determination of EPA’s remediation costs, the number and financial viability of the other PRPs (there are four other PRPs currently) and the determination of the final allocation of the costs among the PRPs. Accordingly, because the amount of such costs cannot be reasonably estimated at this time, no amounts had been accrued for this matter at
September 30, 2018
.
See “Item 1. BUSINESS - Regulatory and Environmental Matters,” “Item 1A. RISK FACTORS - We are subject to increasingly stringent environmental, health and safety laws and regulations that impose significant compliance costs. Any failure to satisfy these laws and regulations may adversely affect us,” “Item 7. MANAGEMENT’S DISCUSSION AND ANALYSIS OF FINANCIAL CONDITION AND RESULTS OF OPERATIONS - Contingencies” and
Note 17.
of the Notes to Consolidated Financial Statements.
Walter Energy
. We were a member of the Walter Energy federal tax consolidated group, through December 14, 2006, at which time the company was spun-off from Walter Industries. Until our spin-off from Walter Energy, we joined in the filing of the Walter Energy consolidated federal income tax return for each taxable year during which we were a member of the consolidated group. As a result, we are jointly and severally liable for the federal income tax liability, if any, of the consolidated group for each of those years. Accordingly, we could be liable in the event any such federal income tax liability is incurred, and not discharged, by any other member of the Walter Energy tax consolidated group for any period during which we were included in the Walter Energy tax consolidated group.
In July 2015, Walter Energy filed for bankruptcy protection under Chapter 11 of the U.S. Bankruptcy Code in the Northern District of Alabama (“Chapter 11 Case”). On February 2, 2017, the Chapter 11 Case was converted to a liquidation proceeding under Chapter 7 of the U.S. Bankruptcy Code, pursuant to which Walter Energy is now in the process of being wound down and liquidated.
19
The IRS is currently alleging that Walter Energy owes substantial amounts for prior taxable periods in which we were a member of the Walter Energy tax consolidated group (specifically, 1983-1994, 2000-2002 and 2005). On January 11, 2016, the IRS filed a proof of claim in the Chapter 11 Case, alleging that Walter Energy owes taxes,interest and penalties for the years 1983-1994, 2000-2002 and 2005 in an aggregate amount of
$554.3 million
(
$229.1 million
of which the IRS claims is entitled to priority status in the Chapter 11 Case). The IRS asserts that its claim is based on an alleged settlement of Walter Energy’s tax liability for years1983 through1994, which Walter Energy disputed. In the proof of claim, the IRS included an alternative calculation in an aggregate amount of
$860.4 million
, which it asserts would be appropriate in the event the alleged settlement is determined to be non-binding (
$535.3 million
of which the IRS claims is entitled to priority status in the Chapter 11 Case). The IRS has indicated its intent to pursue collection of amounts included in the proofs of claim from former members of the Walter Energy tax consolidated group.
According to a quarterly report on Form 10-Q filed by Walter Energy with the SEC on November 5, 2015, Walter Energy had
$33.0 million
of accruals at September 30, 2015 for unrecognized tax benefits in connection with the matters subject to the IRS claims and Walter Energy stated it believed it had sufficient accruals to address any claims, including interest and penalties, and did not believe that any potential difference between any final settlements and amounts accrued would have a material effect on Walter Energy’s financial position, but such potential difference could be material to its results of operations in a future reporting period.
We have been working constructively with the parties involved in this matter in an effort to reach a consensual resolution with respect to the alleged tax liabilities at issue. Based on our work to date, we believe that once certain anticipated refunds (applicable primarily to 1997 and 2006 through 2015) are applied against asserted income tax liabilities owing for other years, the total net tax liabilities of Walter Energy, if any, will be substantially less than those asserted by the IRS.
We cannot estimate the amount of, or the extent to which we will be responsible for, any liabilities to which we may be subject relating to these tax claims. Such liabilities could have a material adverse effect on our business, financial condition, liquidity or results of operations. Furthermore, there can be no assurance we will be able to reach any resolution with the parties involved in this matter and, in such event, we would intend to vigorously assert any and all available defenses against any liabilities we may have as a member of the Walter Energy consolidated group.
Indemnifications
. We are a party to contracts in which it is common for us to agree to indemnify third parties for certain liabilities that arise out of or relate to the subject matter of the contract. In some cases, this indemnity extends to related liabilities arising from the negligence of the indemnified parties, but usually excludes any liabilities caused by gross negligence or willful misconduct. We cannot estimate the potential amount of future payments under these indemnities until events arise that would trigger a liability under the indemnities.
Additionally, in connection with the sale of assets and the divestiture of businesses, such as the divestitures of U.S. Pipe and Anvil, we may agree to indemnify buyers and related parties for certain losses or liabilities incurred by these parties with respect to: (i) the representations and warranties made by us to these parties in connection with the sale and (ii) liabilities related to the pre-closing operations of the assets or business sold. Indemnities related to pre-closing operations generally include certain environmental and tax liabilities and other liabilities not assumed by these parties in the transaction.
Indemnities related to the pre-closing operations of sold assets or businesses normally do not represent additional liabilities to us, but simply serve to protect these parties from potential liability associated with our obligations existing at the time of the sale. As with any liability, we have accrued for those pre-closing obligations that are considered probable and reasonably estimable. Should circumstances change, increasing the likelihood of payments related to a specific indemnity, we will accrue a liability when future payment is probable and the amount is reasonably estimable.
Other Matters.
We are party to a number of other lawsuits arising in the ordinary course of business, including product liability cases for products manufactured by us or third parties. We provide for costs relating to these matters when a loss is probable and the amount is reasonably estimable. Administrative costs related to these matters are expensed as incurred. The effect of the outcome of these matters on our future financial statements cannot be predicted with certainty as any such effect depends on the amount and timing of the resolution of such matters. While the results of litigation cannot be predicted with certainty, we believe that the final outcome of such other litigation is not likely to have a materially adverse effect on our business or prospects.
20
|
Item 5.
|
MARKET FOR REGISTRANT’S COMMON EQUITY, RELATED STOCKHOLDER MATTERS AND ISSUER PURCHASES OF EQUITY SECURITIES
|
Our common stock is listed on the New York Stock Exchange under the trading symbol MWA.
Covenants contained in certain of the debt instruments described in
Note 7.
of the Notes to Consolidated Financial Statements restrict the amount we can pay in cash dividends. Future dividends will be declared at the discretion of our board of directors and will depend on our future earnings, financial condition and other factors.
At September 30,
2018
, there were
107
stockholders of record for our common stock.
Equity Compensation Plan Information
The information regarding our compensation plans under which equity securities are authorized for issuance is set forth in “Item 12. SECURITY OWNERSHIP OF CERTAIN BENEFICIAL OWNERS AND MANAGEMENT AND RELATED STOCKHOLDER MATTERS.”
Sale of Unregistered Securities
We did not issue any unregistered securities within the past three years.
Issuer Purchases of Equity Securities
We repurchased $10 million in shares of our common stock in the quarter ended September 30,
2018
.
Stock Price Performance Graph
The following graph compares the cumulative quarterly stock market performance of our common stock with the Russell 2000 Stock Index (“Russell 2000”) and the Dow Jones U.S. Building Materials & Fixtures Index (“DJ Building Materials & Fixtures”) since September 30, 2013. Total return values were calculated based on cumulative total return assuming (i) the investment of $100 in our common stock, the Russell 2000 and the DJ Building Materials & Fixtures on the dates indicated and (ii) reinvestment of all dividends.
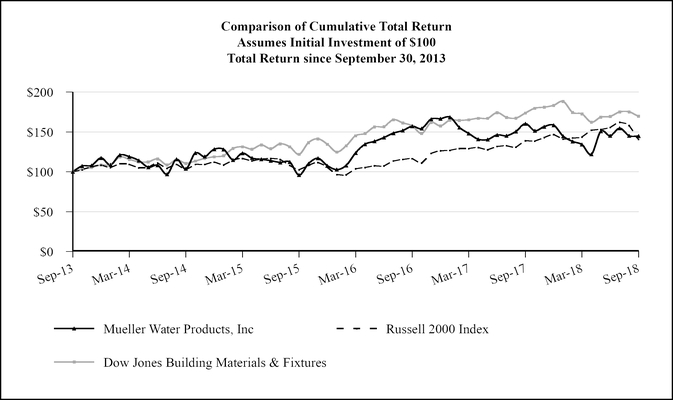
21
|
Item 6.
|
SELECTED FINANCIAL DATA
|
The selected financial and other data presented below should be read in conjunction with, and are qualified by reference to, “Item 7. MANAGEMENT’S DISCUSSION AND ANALYSIS OF FINANCIAL CONDITION AND RESULTS OF OPERATIONS” and the consolidated financial statements and notes thereto included elsewhere in this annual report.
|
2018
|
2017
|
2016
|
2015
|
2014
|
||||||||||||||||
|
|
(in millions, except per share data)
|
|||||||||||||||||||
|
Statement of operations data:
|
||||||||||||||||||||
|
Net sales
|
$
|
916.0
|
|
$
|
826.0
|
|
$
|
800.6
|
|
$
|
793.4
|
|
$
|
783.3
|
|
|||||
|
Cost of sales
|
626.1
|
|
558.1
|
|
531.7
|
|
547.5
|
|
548.2
|
|
||||||||||
|
Gross profit
|
289.9
|
|
267.9
|
|
268.9
|
|
245.9
|
|
235.1
|
|
||||||||||
|
Selling, general and administrative expenses
|
166.7
|
|
155.4
|
|
149.5
|
|
147.6
|
|
151.2
|
|
||||||||||
|
Loss on Walter receivable
|
—
|
|
—
|
|
—
|
|
11.6
|
|
—
|
|
||||||||||
|
Gain on sale of idle property
|
(9.0
|
)
|
—
|
|
—
|
|
—
|
|
—
|
|
||||||||||
|
Other charges
|
10.5
|
|
10.4
|
|
7.2
|
|
7.9
|
|
3.1
|
|
||||||||||
|
Interest expense, net
|
20.9
|
|
22.2
|
|
23.6
|
|
27.5
|
|
49.6
|
|
||||||||||
|
Loss on early extinguishment of debt
|
6.5
|
|
—
|
|
—
|
|
31.3
|
|
1.0
|
|
||||||||||
|
Pension costs other than service
|
1.0
|
|
1.4
|
|
19.3
|
|
(0.8
|
)
|
(0.2
|
)
|
||||||||||
|
Gain on settlement of interest rate swap contracts
|
(2.4
|
)
|
—
|
|
—
|
|
—
|
|
—
|
|
||||||||||
|
Income before income taxes
|
95.7
|
|
|
78.5
|
|
|
69.3
|
|
|
20.8
|
|
|
30.4
|
|
||||||
|
Income tax (benefit) expense
|
(9.9
|
)
|
24.2
|
|
24.2
|
|
8.3
|
|
1.5
|
|
||||||||||
|
Income from continuing operations
|
105.6
|
|
54.3
|
|
45.1
|
|
12.5
|
|
28.9
|
|
||||||||||
|
Discontinued operations
(1)
|
—
|
|
69.0
|
|
18.8
|
|
18.4
|
|
26.6
|
|
||||||||||
|
Net income
|
$
|
105.6
|
|
$
|
123.3
|
|
$
|
63.9
|
|
$
|
30.9
|
|
$
|
55.5
|
|
|||||
|
Earnings per basic share:
|
||||||||||||||||||||
|
Continuing operations
|
$
|
0.67
|
|
$
|
0.34
|
|
$
|
0.28
|
|
$
|
0.08
|
|
$
|
0.18
|
|
|||||
|
Discontinued operations
(1)
|
—
|
|
0.43
|
|
0.12
|
|
0.11
|
|
0.17
|
|
||||||||||
|
Net income
|
$
|
0.67
|
|
$
|
0.77
|
|
$
|
0.40
|
|
$
|
0.19
|
|
$
|
0.35
|
|
|||||
|
Earnings per diluted share:
|
||||||||||||||||||||
|
Continuing operations
|
$
|
0.66
|
|
$
|
0.34
|
|
$
|
0.28
|
|
$
|
0.08
|
|
$
|
0.18
|
|
|||||
|
Discontinued operations
(1)
|
—
|
|
0.42
|
|
0.11
|
|
0.11
|
|
0.16
|
|
||||||||||
|
Net income
|
$
|
0.66
|
|
$
|
0.76
|
|
$
|
0.39
|
|
$
|
0.19
|
|
$
|
0.34
|
|
|||||
|
Weighted average shares outstanding:
|
||||||||||||||||||||
|
Basic
|
158.2
|
|
160.1
|
|
161.3
|
|
160.5
|
|
159.2
|
|
||||||||||
|
Diluted
|
159.7
|
|
161.8
|
|
163.4
|
|
163.2
|
|
162.2
|
|
||||||||||
|
Balance sheet data (at September 30):
|
||||||||||||||||||||
|
Cash and cash equivalents
|
$
|
347.1
|
|
$
|
361.7
|
|
$
|
195.0
|
|
$
|
113.1
|
|
$
|
161.1
|
|
|||||
|
Working capital
|
518.4
|
|
528.7
|
|
426.5
|
|
381.5
|
|
363.0
|
|
||||||||||
|
Property, plant and equipment, net
|
150.9
|
|
122.3
|
|
108.4
|
|
100.0
|
|
96.2
|
|
||||||||||
|
Total assets
|
1,291.9
|
|
1,258.3
|
|
1,280.6
|
|
1,229.8
|
|
1,312.5
|
|
||||||||||
|
Total debt
|
445.0
|
|
480.6
|
|
484.4
|
|
488.3
|
|
540.3
|
|
||||||||||
|
Long-term liabilities
|
560.0
|
|
627.2
|
|
675.3
|
|
694.0
|
|
716.5
|
|
||||||||||
|
Total liabilities
|
727.1
|
|
768.8
|
|
861.1
|
|
862.0
|
|
960.9
|
|
||||||||||
|
Total equity
|
564.8
|
|
489.5
|
|
419.5
|
|
367.8
|
|
351.6
|
|
||||||||||
|
Other data (year ended September 30):
|
||||||||||||||||||||
|
Depreciation and amortization
|
43.7
|
|
41.9
|
|
39.5
|
|
43.4
|
|
42.5
|
|
||||||||||
|
Capital expenditures
|
55.7
|
|
40.6
|
|
31.5
|
|
27.2
|
|
25.3
|
|
||||||||||
|
Cash dividends declared per share
|
0.190
|
|
0.150
|
|
0.100
|
|
0.075
|
|
0.070
|
|
||||||||||
|
(1)
|
In 2017, we sold Anvil. The results of its operations and the gain on the sale of Anvil are classified as discontinued operations for 2014 through 2017, as applicable.
|
22
|
Item 7.
|
MANAGEMENT’S DISCUSSION AND ANALYSIS OF FINANCIAL CONDITION AND RESULTS OF OPERATIONS
|
The following discussion should be read in conjunction with the consolidated financial statements and notes thereto that appear elsewhere in this annual report.
Overview
Organization
On October 3, 2005, Walter Energy acquired all outstanding shares of capital stock representing the Mueller Co. and Anvil businesses and contributed them to its U.S. Pipe business to form the Company. In June 2006, we completed an initial public offering of common stock and in December 2006, Walter Energy distributed to its shareholders all of its equity interests in the Company, completing our spin-off. We subsequently sold our U.S. Pipe and Anvil businesses.
Unless the context indicates otherwise, whenever we refer to a particular year, we mean our fiscal year ended or ending September 30 in that particular calendar year.
Business
We operate our business through
two
segments, Infrastructure, formerly referred to as Mueller Co., and Technologies, formerly referred to as Mueller Technologies.
We estimate approximately 60% of the Company's 2018 net sales were for repair and replacement directly related to municipal water infrastructure spending, approximately 30% were related to residential construction activity and less than 10% were related to natural gas utilities.
We expect our primary end markets, repair and replacement of water infrastructure, driven by municipal spending, and new water infrastructure installation, driven by residential construction, to grow in 2019. We expect the residential construction market to be the faster growing.
Infrastructure
Municipal spending in 2018 was relatively strong compared with the prior year and economic forecasts predict this trend will continue. According to the U.S. Bureau of Economic Analysis, state and local tax receipts for the quarter ended
September 30, 2018
were up year-over-year and, according to the U.S. Department of Labor, the trailing twelve-month average consumer price index for water and sewerage rates at
September 30, 2018
increased 3.2%. However, water conservation efforts, particularly in areas impacted by recent drought conditions, have resulted in lower overall receipts for some U.S. water utilities.
The year-over-year percentage change in housing starts is a key indicator of demand for Infrastructure’s products sold in the residential construction market. In
September 2018
, Zelman & Associates forecasted a 6% increase in housing starts for calendar 2019 compared to the prior year. In November 2018, Blue Chip Economic Indicators forecasted a 3% increase in housing starts for calendar 2019 compared to the prior year.
Technologies
The municipal market is the key end market for Technologies. The businesses in Technologies are project-oriented and depend on customer adoption of their technology-based products and services. We entered 2019 with a backlog of
$20.6 million
at Mueller Systems, largely for AMI products.
Consolidated
Overall in 2019 for Mueller Water Products, we expect year-over-year net sales percentage growth between 4% and 6%. We expect adjusted operating income to increase between 7% and 9% and for productivity improvements to help increase operating margin.
23
Results of Operations
Year Ended
September 30, 2018
Compared to Year Ended
September 30, 2017
|
|
Year ended September 30, 2018
|
||||||||||||||
|
|
Infrastructure
|
Technologies
|
Corporate
|
Total
|
|||||||||||
|
|
(in millions)
|
||||||||||||||
|
Net sales
|
$
|
818.8
|
|
$
|
97.2
|
|
$
|
—
|
|
$
|
916.0
|
|
|||
|
Gross profit
|
$
|
284.7
|
|
$
|
5.2
|
|
$
|
—
|
|
$
|
289.9
|
|
|||
|
Operating expenses:
|
|||||||||||||||
|
Selling, general and administrative
|
104.5
|
|
29.5
|
|
32.7
|
|
166.7
|
|
|||||||
|
Gain on sale of idle property
|
—
|
|
—
|
|
(9.0
|
)
|
(9.0
|
)
|
|||||||
|
Other charges
|
0.1
|
|
0.1
|
|
10.3
|
|
10.5
|
|
|||||||
|
104.6
|
|
29.6
|
|
34.0
|
|
168.2
|
|
||||||||
|
Operating income (loss)
|
$
|
180.1
|
|
$
|
(24.4
|
)
|
$
|
(34.0
|
)
|
121.7
|
|
||||
|
Pension costs other than service
|
1.0
|
|
|||||||||||||
|
Interest expense, net
|
20.9
|
|
|||||||||||||
|
Loss on early extinguishment of debt
|
6.5
|
|
|||||||||||||
|
Gain on settlement of interest rate swap contracts
|
(2.4
|
)
|
|||||||||||||
|
Income before income taxes
|
95.7
|
|
|||||||||||||
|
Income tax benefit
|
(9.9
|
)
|
|||||||||||||
|
Income from continuing operations
|
$
|
105.6
|
|
||||||||||||
|
|
Year ended September 30, 2017
|
||||||||||||||
|
|
Infrastructure
|
Technologies
|
Corporate
|
Total
|
|||||||||||
|
|
(in millions)
|
||||||||||||||
|
Net sales
|
$
|
739.9
|
|
$
|
86.1
|
|
$
|
—
|
|
$
|
826.0
|
|
|||
|
Gross profit
|
$
|
259.9
|
|
$
|
8.0
|
|
$
|
—
|
|
$
|
267.9
|
|
|||
|
Operating expenses:
|
|||||||||||||||
|
Selling, general and administrative
|
93.4
|
|
27.6
|
|
34.4
|
|
155.4
|
|
|||||||
|
Other charges
|
2.7
|
|
0.7
|
|
7.0
|
|
10.4
|
|
|||||||
|
96.1
|
|
28.3
|
|
41.4
|
|
165.8
|
|
||||||||
|
Operating income (loss)
|
$
|
163.8
|
|
$
|
(20.3
|
)
|
$
|
(41.4
|
)
|
102.1
|
|
||||
|
Pension costs other than service
|
1.4
|
|
|||||||||||||
|
Interest expense, net
|
22.2
|
|
|||||||||||||
|
Income before income taxes
|
78.5
|
|
|||||||||||||
|
Income tax expense
|
24.2
|
|
|||||||||||||
|
Income from continuing operations
|
$
|
54.3
|
|
||||||||||||
Consolidated Analysis
Net sales for
2018
increased
10.9%
to
$916.0 million
from
$826.0 million
in the prior year due primarily to higher shipment volumes in both Infrastructure and Technologies as well as higher pricing in Infrastructure.
Gross profit was
$289.9 million
for
2018
and
$267.9 million
in the prior year. Gross margin
declined
80
basis points to
31.6%
in
2018
from
32.4%
in the prior year primarily due to higher material costs in the current year and the net effect of warranty charges at Technologies.
Selling, general and administrative expenses (“SG&A”)
increased
7.3%
to
$166.7 million
for
2018
from
$155.4 million
in the prior year, but declined 60 basis points to
18.2%
of net sales from
18.8%
of net sales in the prior year. The increase in SG&A was primarily due to personnel-related expenses and the acquisition of Singer Valve.
24
Other charges for
2018
consisted primarily of costs of our previously announced strategic reorganization and expenses related to our former U.S. Pipe and Anvil segments. In 2018, we also recorded a gain on the sale of a property in Burlington, New Jersey that we had retained in the sale of U.S. Pipe. For 2017, other charges consisted primarily of costs of our previously announced strategic reorganization and costs associated with the acquisition of Singer Valve.
Interest expense, net
declined
$1.3 million
in
2018
from the prior year as a result of interest income earned on the cash proceeds from the sale of Anvil and higher interest rates. Interest expense associated with the Term Loan decreased due to the replacement of the Term Loan with the 5.5% Senior Notes in June 2018. The components of interest expense, net are provided below.
|
2018
|
2017
|
||||||
|
|
(in millions)
|
||||||
|
Term Loan
|
$
|
14.4
|
|
$
|
19.1
|
|
|
|
5.5% Senior Notes
|
7.5
|
|
—
|
|
|||
|
Interest rate swap contracts
|
0.6
|
|
1.9
|
|
|||
|
Deferred financing costs amortization
|
1.6
|
|
1.8
|
|
|||
|
ABL Agreement
|
0.6
|
|
0.8
|
|
|||
|
Other interest expense
|
0.6
|
|
0.6
|
|
|||
|
25.3
|
|
24.2
|
|
||||
|
Interest income
|
(4.4
|
)
|
(2.0
|
)
|
|||
|
$
|
20.9
|
|
$
|
22.2
|
|
||
On December, 22, 2017, tax legislation was enacted that made significant revisions to federal income tax laws, including lowering the corporate income tax rate to 21 percent from 35 percent, overhauling the taxation of income earned outside the United States and eliminating or limiting certain deductions.
Income tax was a benefit of
$9.9 million
due to a one-time net benefit of
$35.0 million
associated with the current year adoption of the Tax Cuts and Jobs Act. Excluding this benefit, our effective income tax rate was 26.2% in 2018. This rate is lower than the prior year effective rate of
30.8%
primarily due to the reduction in the federal statutory tax rate introduced by this tax legislation. In 2018, our federal statutory rate was a blended rate of 24.5%.
Segment Analysis
Infrastructure
Net sales for
2018
increased
10.7%
to
$818.8 million
from
$739.9 million
in the prior year. Net sales
increased
primarily due to higher shipment volumes of approximately $57 million, excluding the net sales of Singer Valve which we acquired in February 2017. Unit shipments of valves, hydrants and brass products each increased between 6% and 8% in
2018
compared to
2017
. Favorable pricing of approximately $18 million and inclusion of a full year of Singer Valve net sales also contributed to the increase in net sales.
Gross profit for
2018
increased
9.5%
to
$284.7 million
from
$259.9 million
in the prior year primarily due to increased shipment volumes. We experienced higher material costs throughout the year, and although higher pricing covered these costs, it did not maintain our margins. Gross margin was down 30 basis points to
34.8%
for
2018
from
35.1%
in the prior year primarily due to this cost inflation.
SG&A in
2018
increased
11.9%
to
$104.5 million
from
$93.4 million
in the prior year primarily due to personnel-related costs and the acquisition of Singer Valve. SG&A was
12.8%
and
12.6%
of net sales for
2018
and
2017
, respectively.
Technologies
Net sales in
2018
increased
to
$97.2 million
from
$86.1 million
in the prior year primarily due to approximately $11 million of higher shipment volumes.
Gross profit in
2018
decreased
$2.8 million
to
$5.2 million
from
$8.0 million
in the prior year. Gross margin
declined
to
5.3%
in
2018
from
9.3%
in the prior year. These decreases are primarily due to the net effect of the warranty charges and higher material costs.
25
SG&A increased to
$29.5 million
in
2018
from
$27.6 million
in the prior year primarily due to increased selling costs related to increased shipment volumes. SG&A as a percentage of net sales improved to
30.3%
for
2018
from
32.1%
in the prior year.
Corporate
SG&A was
$32.7 million
in
2018
and
$34.4 million
2017.
Year Ended September 30,
2017
Compared to Year Ended September 30,
2016
|
|
Year ended September 30, 2017
|
||||||||||||||
|
|
Infrastructure
|
Technologies
|
Corporate
|
Total
|
|||||||||||
|
|
(in millions)
|
||||||||||||||
|
Net sales
|
$
|
739.9
|
|
$
|
86.1
|
|
$
|
—
|
|
$
|
826.0
|
|
|||
|
Gross profit
|
$
|
259.9
|
|
$
|
8.0
|
|
$
|
—
|
|
$
|
267.9
|
|
|||
|
Operating expenses:
|
|||||||||||||||
|
Selling, general and administrative
|
93.4
|
|
27.6
|
|
34.4
|
|
155.4
|
|
|||||||
|
Other charges
|
2.7
|
|
0.7
|
|
7.0
|
|
10.4
|
|
|||||||
|
96.1
|
|
28.3
|
|
41.4
|
|
165.8
|
|
||||||||
|
Operating income (loss)
|
$
|
163.8
|
|
$
|
(20.3
|
)
|
$
|
(41.4
|
)
|
102.1
|
|
||||
|
Pension costs other than service
|
1.4
|
|
|||||||||||||
|
Interest expense, net
|
22.2
|
|
|||||||||||||
|
Income before income taxes
|
78.5
|
|
|||||||||||||
|
Income tax expense
|
24.2
|
|
|||||||||||||
|
Income from continuing operations
|
$
|
54.3
|
|
||||||||||||
|
|
Year ended September 30, 2016
|
||||||||||||||
|
|
Infrastructure
|
Technologies
|
Corporate
|
Total
|
|||||||||||
|
|
(in millions)
|
||||||||||||||
|
Net sales
|
$
|
715.7
|
|
$
|
84.9
|
|
$
|
—
|
|
$
|
800.6
|
|
|||
|
Gross profit
|
$
|
251.7
|
|
$
|
17.2
|
|
$
|
—
|
|
$
|
268.9
|
|
|||
|
Operating expenses:
|
|
||||||||||||||
|
Selling, general and administrative
|
88.4
|
|
27.4
|
|
33.7
|
|
149.5
|
|
|||||||
|
Other charges
|
0.8
|
|
0.9
|
|
5.5
|
|
7.2
|
|
|||||||
|
89.2
|
|
|
28.3
|
|
39.2
|
|
|
156.7
|
|
||||||
|
Operating income (loss)
|
$
|
162.5
|
|
|
$
|
(11.1
|
)
|
$
|
(39.2
|
)
|
|
112.2
|
|
||
|
Pension costs other than service
|
19.3
|
|
|||||||||||||
|
Interest expense, net
|
23.6
|
|
|||||||||||||
|
Income before income taxes
|
69.3
|
|
|||||||||||||
|
Income tax expense
|
24.2
|
|
|||||||||||||
|
Income from continuing operations
|
$
|
45.1
|
|
||||||||||||
Consolidated Analysis
Net sales for
2017
increased to
$826.0 million
from
$800.6 million
in the prior year due primarily to higher shipment volumes of $15.4 million and $10.3 million in net sales related to the acquisition of Singer Valve
Gross profit for
2017
decreased to
$267.9 million
from
$268.9 million
in the prior year. Gross margin decreased 120 basis points to 32.4% in
2017
from 33.6% in the prior year due primarily due to a discrete warranty charge of $9.8 million at Technologies.
SG&A for
2017
increased to
$155.4 million
from
$149.5 million
in the prior year primarily due to the addition of Singer Valve. SG&A as a percentage of net sales increased to
18.8%
in
2017
from
18.7%
in the prior year.
26
In June 2016, our U.S. pension plan completed a pension benefit settlement program. Lump-sum distributions to fully settle existing obligations were offered to all vested participants who are no longer working for us and not yet receiving benefits. Approximately 75% of these participants accepted the offer. As a result, the plan disbursed $58.5 million and we recorded a non-cash pension settlement charge of $16.6 million.
Interest expense, net declined $1.4 million in 2017 compared to the prior year as a result of interest income earned on the cash proceeds form the sale of Anvil. Interest expense associated with the Term Loan decreased due to the repricing we completed in February 2017, which reduced the applicable interest rate spread by 75 basis points. The components of interest expense, net are provided below.
|
2017
|
2016
|
||||||
|
|
(in millions)
|
||||||
|
Term Loan
|
$
|
19.1
|
|
$
|
20.5
|
|
|
|
Interest rate swap contracts
|
1.9
|
|
—
|
|
|||
|
Deferred financing costs amortization
|
1.8
|
|
1.9
|
|
|||
|
ABL Agreement
|
0.8
|
|
1.1
|
|
|||
|
Other interest expense
|
0.6
|
|
0.5
|
|
|||
|
24.2
|
|
24.0
|
|
||||
|
Interest income
|
(2.0
|
)
|
(0.4
|
)
|
|||
|
$
|
22.2
|
|
$
|
23.6
|
|
||
Income tax expense was $24.2 million for both 2017 and 2016, but the effective income tax rate decreased to 30.8% in 2017 from 34.9% in the prior year primarily due to increased domestic manufacturing deductions and excess tax benefits related to stock compensation.
Segment Analysis
Infrastructure
Net sales for
2017
increased to
$739.9 million
from
$715.7 million
in the prior year. Net sales increased primarily due to higher shipment volumes of $14.0 million and $10.3 million in net sales of Singer Valve, which we acquired in February 2017. Domestic shipments of valves, hydrants and brass products increased 1.7% in 2017 compared to 2016.
Gross profit for
2017
increased to
$259.9 million
from
$251.7 million
in the prior year. Gross profit for 2017 increased primarily due to increased shipment volumes. Gross margin was 35.1% for
2017
compared to 35.2% in the prior year.
SG&A in
2017
was
$93.4 million
compared to
$88.4 million
in the prior year primarily due to personnel-related costs and the acquisition of Singer Valve. SG&A was 12.6% and 12.4% of net sales for
2017
and
2016
, respectively.
Technologies
Net sales in
2017
increased to
$86.1 million
from
$84.9 million
in the prior year due to $1.4 million of higher shipment volumes.
Gross profit in 2017 decreased $9.2 million to
$8.0 million
from
$17.2 million
in the prior year. Gross margin declined to
9.3%
in 2017 compared to 20.3% in the prior year. These decreases are primarily due to the
$9.8 million
warranty charge related to certain radio products produced between 2011 and 2014, which we recorded in our second quarter of 2017.
SG&A was
$27.6 million
in 2017 and
$27.4 million
in the prior year. SG&A as a percentage of net sales decreased to 32.1% of net sales for
2017
from 32.3% of net sales in the prior year.
Corporate
SG&A was
$34.4 million
in
2017
and
$33.7 million
in the prior year.
27
Financial Condition
Cash and cash equivalents were
$347.1 million
at
September 30, 2018
and
$361.7 million
at
September 30, 2017
. Cash proceeds received from the sale of Anvil in 2017 were
$305.7 million
. Cash and cash equivalents
decreased
during
2018
as a result of cash provided by operating activities of
$133.1 million
, which was offset by cash used in investing activities of
$47.9 million
, primarily capital expenditures, and cash used in financing activities of
$98.3 million
, primarily debt extinguishment, dividend payments and share repurchases. Cash and cash equivalents also decreased by
$1.5 million
during
2018
due to changes in currency exchange rates.
Receivables, net were
$164.3 million
at
September 30, 2018
and
$145.3 million
at
September 30, 2017
. Receivables at
September 30, 2018
and
September 30, 2017
represented approximately
65
and
64
days net sales, respectively.
Inventories were
$156.6 million
at
September 30, 2018
and
$138.9 million
at
September 30, 2017
. Inventories
increased
during
2018
due primarily to inflation in raw material and purchased parts costs.
Property, plant and equipment, net was
$150.9 million
at
September 30, 2018
and
$122.3 million
at
September 30, 2017
, and depreciation expense was
$20.9 million
in
2018
compared to
$19.8 million
in
2017
. Capital expenditures, including software development costs capitalized, were
$55.7 million
in
2018
.
Intangible assets were
$420.2 million
at
September 30, 2018
and
$439.3 million
at
September 30, 2017
. Finite-lived intangible assets,
$141.5 million
of net book value at
September 30, 2018
, are amortized over their estimated useful lives. This amortization expense was
$22.8 million
during
2018
and is expected to be approximately $21 million to $24 million in each of the next five years. Indefinite-lived intangible assets,
$278.7 million
at
September 30, 2018
, are not amortized, but tested at least annually for possible impairment.
Accounts payable and other current liabilities were
$166.4 million
at
September 30, 2018
and
$136.0 million
at
September 30, 2017
. Payables
increased
during
2018
due primarily to inflation in raw material and purchased parts costs.
Outstanding debt was
$445.0 million
at
September 30, 2018
and
$480.6 million
at
September 30, 2017
.
Deferred income taxes were net liabilities of
$78.0 million
at
September 30, 2018
and net liabilities of
$114.0 million
at
September 30, 2017
. The
$36.0 million
decrease
in the net liability was primarily due to the effects of the rate changes enacted in the tax legislation. Deferred tax liabilities related to intangible assets and other were
$109.4 million
and
$158.4 million
at
September 30, 2018
and
2017
, respectively.
Liquidity and Capital Resources
We had cash and cash equivalents of
$347.1 million
at
September 30, 2018
and approximately
$125 million
of additional borrowing capacity under our ABL Agreement based on
September 30, 2018
data. Undistributed earnings from our subsidiaries in Canada and China are considered to be permanently invested outside of the United States. At
September 30, 2018
, cash and cash equivalents included
$13.9 million
and
$7.1 million
in Canada and China, respectively.
On
January 6, 2017
, we sold Anvil to affiliates of One Equity Partners for cash proceeds of
$305.7 million
and the agreement by the purchaser to reimburse us for expenditures to settle certain previously existing liabilities.
In 2017, we acquired Singer Valve, a manufacturer of automatic control valves, and its affiliates that distribute Singer Valve products in the U.S. and China for an aggregate cash consideration of
$26.6 million
net of post-closing adjustments. Singer Valve is included in Infrastructure.
Cash flows from operating activities are categorized below.
|
2018
|
2017
|
||||||
|
|
(in millions)
|
||||||
|
Collections from customers
|
$
|
895.5
|
|
$
|
816.6
|
|
|
|
Disbursements, other than interest and income taxes
|
(742.8
|
)
|
(705.8
|
)
|
|||
|
Interest payments, net
|
(8.9
|
)
|
(19.5
|
)
|
|||
|
Income tax payments, net
|
(10.7
|
)
|
(31.9
|
)
|
|||
|
Cash provided by operating activities
|
$
|
133.1
|
|
$
|
59.4
|
|
|
We collected
$78.9 million
more from customers in
2018
than in
2017
, which is relatively consistent with the
$90 million
increase in net sales in
2018
compared with
2017
.
28
Capital expenditures were
$55.7 million
during
2018
and
$40.6 million
during
2017
. We estimate
2019
capital expenditures will be
$56 million
to
$60 million
. We expect our capital expenditures will be higher over the next several years as we invest more in our machinery, equipment and facilities for product introductions, enhanced productivity and maintenance.
Income tax payments were lower during
2018
compared to the prior year primarily due to the change in the federal tax rates and the timing of quarterly payments in 2017. We expect the effective tax rate in
2019
to be between 25% and 27%.
In 2015, we announced the authorization of a stock repurchase program for up to $50.0 million of our common stock. The program does not commit us to any particular timing or quantity of purchases, and we may suspend or discontinue the program at any time. In 2017, we announced an increase in the authorization of this program to $250 million. We acquired
2,573,475
and
4,581,227
shares of our common stock in 2018 and 2017, respectively. At
September 30, 2018
, we had remaining authorization of $160.0 million to repurchase shares of our common stock.
On November 5, 2018, we announced we had signed an agreement to acquire Krausz Industries, a manufacturer of pipe couplings, grips and clamps for approximately $140 million in cash, subject to post-closing adjustments. We expect to close this transaction in December.
We anticipate our existing cash, cash equivalents and borrowing capacity combined with our expected operating cash flows will be sufficient to meet our anticipated operating expenses, acquisition payments, capital expenditures and debt service obligations as they become due through September 30,
2019
. However, our ability to make these payments will depend partly upon our future operating performance, which will be affected by general economic, financial, competitive, legislative, regulatory, business and other factors beyond our control.
ABL Agreement
At
September 30, 2018
, the ABL Agreement consisted of a revolving credit facility for up to
$175 million
of revolving credit borrowings, swing line loans and letters of credit. The ABL Agreement permits us to increase the size of the credit facility by an additional
$150 million
in certain circumstances. We may borrow up to
$25 million
through swing line loans and may have up to
$60 million
of letters of credit outstanding.
Borrowings under the ABL Agreement bear interest at a floating rate equal to LIBOR plus a margin ranging from
125
to
150
basis points, or a base rate, as defined in the ABL Agreement, plus a margin ranging from
25
to
50
basis points. At
September 30, 2018
, the applicable LIBOR-based margin was
125
basis points. We pay a commitment fee for any used borrowing capacity under the ABL Agreement of
25
basis points per annum.
The ABL Agreement terminates on
July 13, 2021
.
The ABL Agreement is subject to mandatory prepayments if total outstanding borrowings under the ABL Agreement are greater than the aggregate commitments under the revolving credit facility or if we dispose of overdue accounts receivable in certain circumstances. The borrowing base under the ABL Agreement is equal to the sum of (a) 85% of the value of eligible accounts receivable and (b) the lesser of (i) 70% of the value of eligible inventory or (ii) 85% of the net orderly liquidation value of the value of eligible inventory, less certain reserves. Prepayments can be made at any time with no penalty.
Substantially all of our U.S. subsidiaries are borrowers under the ABL Agreement and are jointly and severally liable for any outstanding borrowings. Our obligations under the ABL Agreement are secured by a first-priority perfected lien on all of our U.S. inventory, accounts receivable, certain cash and other supporting obligations.
Borrowings are not subject to any financial maintenance covenants unless excess availability is less than the greater of
$17.5 million
and
10%
of the Loan Cap as defined in the ABL Agreement. The ABL Agreement contains customary negative covenants and restrictions on our ability to engage in specified activities, such as:
|
•
|
Limitations on other debt, liens, investments and guarantees;
|
|
•
|
Restrictions on dividends and redemptions of our capital stock and prepayments and redemptions of debt; and
|
|
•
|
Restrictions on mergers and acquisition, sales of assets and transactions with affiliates.
|
29
5.5% Senior Unsecured Notes
On
June 12, 2018
, we privately issued
$450.0 million
of 5.5% Senior Unsecured Notes (“Notes”), which mature in June 2026 and bear interest at
5.5%
, paid semi-annually. Substantially all of our U.S. Subsidiaries guarantee the Notes, which are subordinate to borrowings under the ABL. Based on quoted market prices, the outstanding Notes had a fair value of
$452.3 million
at
September 30, 2018
.
An indenture securing the Notes (“Indenture”) contains customary covenants and events of default, including covenants that limit our ability to incur debt, pay dividends, and make investments. We believe we were compliant with these covenants at
September 30, 2018
and expect to remain in compliance through September 30, 2019.
We may redeem some or all of the Notes at any time or from time to time prior to
June 15, 2021
at certain “make-whole” redemption prices (as set forth in the Indenture) and on or after
June 15, 2021
at specified redemption prices (as set forth in the Indenture). Additionally, we may redeem up to
40%
of the aggregate principal amount of the Notes at any time or from time to time prior to
June 15, 2021
with the net proceeds of specified equity offerings at specified redemption prices (as set forth in the Indenture). Upon a change of control (as defined in the Indenture), we will be required to make an offer to purchase the Notes at a price equal to
101%
of the outstanding principal amount of the Notes.
Term Loan
On November 25, 2014, we entered into a $500.0 million senior secured term loan (“Term Loan”), which accrued interest at a floating rate equal to LIBOR, subject to a floor of
0.75%
, plus
250
basis points. The principal amount of the Term Loan was required to be repaid in quarterly installments of
$1.225 million
with any remaining principal due on November 25, 2021. We repaid the Term Loan on June 12, 2018 with the proceeds from the issuance of the Notes and cash on hand. We wrote-off the associated deferred debt issuance costs and recorded a loss on the early extinguishment of debt of $6.2 million.
As described more fully in
Note 8.
of the Notes to Consolidated Financial Statements, we entered into interest rate swap contracts in April 2015 that hedged interest payments on $150 million of our Term Loan borrowings from September 30, 2016 through September 30, 2021. We terminated these interest rate swaps and reclassified all associated amounts from accumulated other comprehensive loss to earnings and recorded a cash gain of $2.4 million in the quarter ended June 30, 2018.
Our corporate credit rating and the credit rating for our debt are presented below.
|
|
Moody’s
|
Standard & Poor’s
|
|||||
|
September 30,
|
September 30,
|
||||||
|
2018
|
2017
|
2018
|
2017
|
||||
|
Corporate credit rating
|
Ba2
|
Ba3
|
BB
|
BB-
|
|||
|
ABL Agreement
|
Not rated
|
Not rated
|
Not rated
|
Not rated
|
|||
|
Notes
|
Ba3
|
N/A
|
BB
|
N/A
|
|||
|
Term Loan
|
N/A
|
Ba3
|
N/A
|
BB
|
|||
|
Outlook
|
Stable
|
Stable
|
Stable
|
Stable
|
|||
Off-Balance Sheet Arrangements
We do not have any relationships with unconsolidated entities or financial partnerships, such as entities often referred to as structured finance or special purpose entities, which would have been established for the purpose of facilitating off-balance sheet arrangements or other contractually narrow or limited purposes. In addition, we do not have any undisclosed borrowings or debt or any derivative contracts other than those described in “Item 7A. QUANTITATIVE AND QUALITATIVE DISCLOSURE ABOUT MARKET RISK” or synthetic leases. Therefore, we are not exposed to any financing, liquidity, market or credit risk that could have arisen had we engaged in such relationships.
We use letters of credit and surety bonds in the ordinary course of business to ensure the performance of contractual obligations. At
September 30, 2018
, we had
$17.3 million
of letters of credit and
$32.5 million
of surety bonds outstanding.
30
Contractual Obligations
Our contractual obligations at
September 30, 2018
are presented below.
|
2019
|
2020-2021
|
2022-2023
|
After 2023
|
Total
|
|||||||||||||||
|
|
(in millions)
|
||||||||||||||||||
|
Debt principal payments
|
$
|
0.7
|
|
$
|
0.9
|
|
$
|
—
|
|
$
|
450.0
|
|
$
|
451.6
|
|
||||
|
Debt interest payments
|
25.2
|
|
50.0
|
|
49.6
|
|
74.3
|
|
199.1
|
|
|||||||||
|
Operating leases
|
4.3
|
|
7.4
|
|
5.0
|
|
3.2
|
|
19.9
|
|
|||||||||
|
Unconditional purchase obligations
(1)
|
97.6
|
|
1.0
|
|
—
|
|
—
|
|
98.6
|
|
|||||||||
|
Other current liabilities
(2)
|
1.2
|
|
—
|
|
—
|
|
—
|
|
1.2
|
|
|||||||||
|
$
|
129.0
|
|
$
|
59.3
|
|
$
|
54.6
|
|
$
|
527.5
|
|
$
|
770.4
|
|
|||||
|
(1)
|
Includes contractual obligations for purchases of raw materials and capital expenditures.
|
|
(2)
|
Consists of obligations for required pension contributions. Actual payments may differ. We have not estimated required pension contributions beyond
2019
.
|
Effect of Inflation
We experience changing price levels primarily related to purchased components and raw materials. Infrastructure experienced a
16%
increase in the average cost per ton of scrap steel and a
17%
increase in the average cost of brass ingot purchased in
2018
compared to
2017
. Technologies was also impacted by the
17%
increase in the average cost of brass ingot.
Seasonality
Our water infrastructure business depends on construction activity, which is seasonal in many areas due to the impact of cold weather conditions on construction. Net sales and operating income have historically been lowest in the quarters ending December 31 and March 31 when the northern United States and all of Canada generally face weather conditions that restrict significant construction and other field crew activity. For Infrastructure, approximately
45%
of a fiscal year’s net sales occurs in the first half of the fiscal year with
55%
occurring in the second half of the fiscal year. See “Item 1A. RISK FACTORS-Seasonal demand for certain of our products and services may adversely affect our financial results.”
Critical Accounting Estimates
The preparation of financial statements in accordance with accounting principles generally accepted in the United States requires us to make estimates and judgments that affect the reported amounts of assets, liabilities, revenues, expenses and related disclosure of contingent assets and liabilities. These estimates are based upon experience and on various other assumptions we believe to be reasonable under the circumstances. Actual results may differ from these estimates. We consider an accounting estimate to be critical if changes in the estimate that are reasonably likely to occur over time or the use of reasonably different estimates could have a material impact on our financial condition or results of operations. We consider the accounting topics presented below to include our critical accounting estimates.
Revenue Recognition
We recognize revenue when delivery of a product or performance of a service has occurred and there is persuasive evidence of a sales arrangement, sales prices are fixed and determinable and collectability from the customers is reasonably assured. Sales are recorded net of estimated discounts, returns and rebates. Discounts, returns and rebates are estimated based upon current offered sales terms and historical return and allowance rates.
In May 2014, the Financial Accounting Standards Board (“FASB”) issued new guidance for the recognition of revenue and additional financial statement disclosures. We will adopt this guidance using the modified retrospective transition method beginning in the first quarter of fiscal 2019. During 2018, we completed our scoping and developed a project plan to classify our revenue streams, to evaluate revenue recognition practices for each stream against the new requirements, to consider changes to the terms of our sales contracts, and design and implement processes to quantify the effects of necessary changes. We have closely assessed the new guidance, including the interpretations by the FASB Transition Resource Group for Revenue Recognition, throughout 2018. We have completed the review of a sample of contracts with our customers that we believe are representative of our significant revenue streams. While we are substantially complete with the process of evaluating the impacts that will result from the new guidance, our assessment will be finalized during the first quarter of 2019. We expect that revenue for our primary revenue streams will be recognized at a point in time, which is similar to how revenue is recognized for
31
these services under the previous guidance. We do not anticipate recording a material adjustment for the cumulative effect of adoption of the new guidance and we do not expect the new guidance to have a significant impact on our consolidated financial position, results of operations, equity or cash flows as of the adoption date beyond the required additional disclosures. We also have identified and have implemented and are implementing changes to our accounting policies and practices, business processes, systems and controls over the impacts of the new guidance on us, including the disclosure requirements and the collection of relevant data into the reporting process.
Inventories
We record inventories at the lower of first-in, first-out method cost or estimated net realizable value. Inventory cost includes an overhead component that can be affected by levels of production and actual costs incurred. We evaluate the need to record adjustments for impairment of inventory at least quarterly. This evaluation includes such factors as anticipated usage, inventory levels and ultimate product sales value. If in our judgment persuasive evidence exists that the net realizable value of inventory is lower than its cost, the inventory value is written-down to its estimated net realizable value. Significant judgments regarding future events and market conditions must be made when estimating net realizable value.
Income Taxes
We recognize deferred tax liabilities and deferred tax assets for the expected future tax consequences of events that have been included in the financial statements or tax returns. Deferred tax liabilities and assets are determined based on the differences between the financial statements and the tax basis of assets and liabilities, using enacted tax rates in effect for the years in which the differences are expected to reverse. A valuation allowance is provided to offset any net deferred tax assets when, based upon the available evidence, it is more likely than not that some or all of the deferred tax assets will not be realized. Our tax balances are based on our expectations of future operating performance, reversal of taxable temporary differences, tax planning strategies, interpretation of the tax regulations currently enacted and rulings in numerous tax jurisdictions.
We only record tax benefits for positions that we believe are more likely than not of being sustained under audit examination based solely on the technical merits of the associated tax position. The amount of tax benefit recognized for any position that meets the more likely than not threshold is the largest amount of the tax benefit that we believe is greater than 50% likely of being realized.
Accounting for the Impairment of Long-Lived Assets Including Goodwill and Other Intangible Assets
We test indefinite-lived intangible assets and goodwill for impairment annually (or more frequently if events or circumstances indicate possible impairment). We performed this annual impairment testing at September 1, and concluded that our indefinite-lived intangible assets and goodwill were not impaired. We tested the indefinite-lived intangible assets for impairment using a “royalty savings method,” which is a variation of the discounted cash flow method. This method estimates a fair value by calculating an estimated discounted future cash flow stream from the hypothetical licensing of the indefinite-lived intangible assets. If this estimated fair value exceeds the carrying value, no impairment is indicated. This analysis is dependent on management’s best estimates of future operating results and the selection of reasonable discount rates and hypothetical royalty rates. Significantly different projected operating results could result in a different conclusion regarding impairment. Standard valuation methodologies using rates considered reasonable by management have not indicated an impairment.
Other long-lived assets, including finite-lived intangible assets, are amortized over their respective estimated useful lives and reviewed for impairment if events or circumstances indicate possible impairment.
32
Warranty Costs
We accrue for warranty expenses that can include customer costs of repair and/or replacement, including labor, materials, equipment, freight and reasonable overhead costs. We accrue for the estimated cost of product warranties at the time of sale if such costs are determined to be reasonably estimable at that time. Warranty cost estimates are revised throughout applicable warranty periods as better information regarding warranty costs becomes available. Critical factors in our analyses include warranty terms, specific claim situations, general incurred and projected failure rates, the nature of product failures, product and labor costs, and general business conditions. These estimates are inherently uncertain as they are based on historical data. If warranty claims are made in the current period for issues that have not historically been the subject of warranty claims and were not taken into consideration in establishing the accrual or if claims for issues already considered in establishing the accrual exceed expectations, warranty expense may exceed the accrual for that particular product. Additionally, a significant increase in costs of repair or replacement could require additional warranty expense. We monitor and analyze our warranty experience and costs periodically and may revise our warranty accrual as necessary. However, as we cannot predict actual future claims, the potential exists for the difference in any one reporting period to be material.
Contingencies
We are involved in litigation, investigations and claims arising out of the normal conduct of our business. We estimate and accrue liabilities resulting from such matters based on a variety of factors, including outstanding legal claims and proposed settlements; assessments by counsel of pending or threatened litigation; and assessments of potential environmental liabilities and remediation costs. We believe we have adequately accrued for these potential liabilities; however, facts and circumstances may change and could cause the actual liability to exceed the estimates, or may require adjustments to the recorded liability balances in the future. As we learn new facts concerning contingencies, we reassess our position both with respect to accrued liabilities and other potential exposures. Estimates particularly sensitive to future changes include liabilities recorded for environmental remediation, tax and legal matters. Estimated future environmental remediation costs are subject to change due to such factors as the uncertain magnitude of cleanup costs, the unknown time and extent of such remedial actions that may be required, and the determination of our liability in proportion to that of other responsible parties. Estimated future costs related to tax and legal matters are subject to change as events evolve and as additional information becomes available during the administrative and litigation processes. For more information on these and other contingencies, see
Note 17.
of the Notes to Consolidated Financial Statements. See also “Item 1. BUSINESS - Regulatory and Environmental Matters,” “Item 1A. RISK FACTORS” and “Item 3. LEGAL PROCEEDINGS”
Workers Compensation, Defined Benefit Pension Plans, Environmental and Other Long-term Liabilities
We are obligated for various liabilities that will ultimately be determined over what could be a very long future time period. We established the recorded liabilities for such items at September 30,
2018
using estimates for when such amounts will be paid and what the amounts of such payments will be. These estimates are subject to change based on numerous factors, including among others, regulatory changes, technology changes, the investment performance of related assets, longevity of participants, the discount rate used and changes to plan designs.
33
|
Item 7A.
|
QUANTITATIVE AND QUALITATIVE DISCLOSURE ABOUT MARKET RISK
|
We are exposed to various market risks, including potential losses arising from adverse changes in market prices and rates, such as various commodity prices, interest rates and foreign exchange rates. We do not enter into derivatives or other financial instruments for trading or speculative purposes.
Our primary financial instruments are cash and cash equivalents. This includes cash in banks and highly rated, liquid money market investments. We believe those instruments are not subject to material potential near-term losses in future earnings from reasonably possible near-term changes in market rates or prices.
Commodity Price Risk
Our products are made using various purchased components and several basic raw materials, including brass ingot, scrap steel, sand and resin. We expect prices for these items to fluctuate based on marketplace demand and our product margins and level of profitability may fluctuate whether or not we pass changes in purchased component and raw material costs on to our customers.
Infrastructure experienced a
16%
increase in the average cost per ton of scrap steel and a
17%
increase in the average cost of brass ingot purchased in
2018
compared to
2017
. Technologies was also impacted by the
17%
increase in the average cost of brass ingot. See “Item 1A. RISK FACTORS-The prices of our purchased components and raw materials can be volatile.”
Interest Rate Risk
Prior to the June 12, 2018 retirement of our Term Loan, we were exposed to interest rate risk that we managed to some extent using derivative instruments. We terminated these instruments in conjunction with the retirement of the Term Loan. Under our
April 2015
interest rate swap contracts, we received interest calculated using 3-month LIBOR, subject to a floor of
0.750%
, and paid fixed interest at
2.341%
, on an aggregate notional amount of
$150.0 million
. These swap contracts effectively fixed the cash interest rate on
$150.0 million
of our borrowings under the Term Loan at
4.841%
.
Currency Risk
Our principal assets, liabilities and operations outside the U.S. are in Canada and China. These assets and liabilities are translated into U.S. dollars at currency exchange rates in effect at the end of each period, with the effect of such translation reflected in other comprehensive loss. Our stockholders’ equity will fluctuate depending upon the weakening or strengthening of the U.S. dollar against these non-U.S. currencies. Net sales and expenses of these subsidiaries are translated into U.S. dollars at the average currency exchange rate during the period. At
September 30, 2018
,
$68.2 million
of our net assets were denominated in non-U.S. currencies.
|
Item 8.
|
FINANCIAL STATEMENTS AND SUPPLEMENTARY DATA
|
The Reports of Independent Registered Public Accounting Firm, Consolidated Financial Statements and the accompanying Notes to Consolidated Financial Statements that are filed as part of this annual report are listed under “Item 15. EXHIBITS AND FINANCIAL STATEMENT SCHEDULES” and are set forth beginning on page F-1.
Selected quarterly financial data for
2018
and
2017
are provided in
Note 19.
of the Notes to Consolidated Financial Statements.
34
|
Item 9A.
|
CONTROLS AND PROCEDURES
|
Evaluation of Disclosure Controls and Procedures
We maintain disclosure controls and procedures that are designed to ensure that information required to be disclosed in the reports we file or submit under the Securities Exchange Act of 1934, as amended (the “Exchange Act”) is recorded, processed, summarized and reported within the time periods specified in the rules and forms of the Securities and Exchange Commission and that such information is accumulated and communicated to our management, including the Chief Executive Officer and the Chief Financial Officer as appropriate, to allow timely decisions regarding required disclosure.
Our Chief Executive Officer and Chief Financial Officer evaluated the effectiveness of the design and operation of our disclosure controls and procedures (as defined in Rules 13a-15(e) and 15d-15(e) of the Exchange Act) as of the end of the period covered by this annual report. Based on this evaluation, those officers have concluded that, at
September 30, 2018
, our disclosure controls and procedures were effective.
Changes in Internal Control over Financial Reporting
There were no changes in internal control over financial reporting during the quarter ended
September 30, 2018
that have materially affected, or are reasonably likely to materially affect, our internal control over financial reporting.
Management’s Report on Internal Control over Financial Reporting
Management is responsible for establishing and maintaining adequate internal control over financial reporting (as defined in Rule 13a-15(f) of the Exchange Act). Internal control over financial reporting is designed to provide reasonable assurance regarding the reliability of financial reporting and the preparation of financial statements for external purposes in accordance with generally accepted accounting principles. A company’s internal control over financial reporting includes those policies and procedures that (i) pertain to the maintenance of records that, in reasonable detail, accurately and fairly reflect the transactions and dispositions of the assets of the company; (ii) provide reasonable assurance that transactions are recorded as necessary to permit preparation of financial statements in accordance with generally accepted accounting principles, and that receipts and expenditures of the company are being made only in accordance with authorizations of management and directors of the company; and (iii) provide reasonable assurance regarding prevention or timely detection of unauthorized acquisition, use, or disposition of the company’s assets that could have a material effect on the financial statements.
Because of its inherent limitations, internal control over financial reporting may not prevent or detect misstatements. Also, projections of any evaluation of effectiveness to future periods are subject to the risk that controls may become inadequate because of changes in conditions, or that the degree of compliance with the policies or procedures may deteriorate.
We assessed the effectiveness of our internal control over financial reporting at
September 30, 2018
. In making this assessment, we used the criteria set forth by the Committee of Sponsoring Organizations of the Treadway Commission in
Internal Control - Integrated Framework
(2013 framework). After doing so, management concluded that, at
September 30, 2018
, our internal control over financial reporting was effective.
The effectiveness of our internal control over financial reporting at
September 30, 2018
has been audited by Ernst & Young LLP, an independent registered public accounting firm, as stated in their report which is included in this annual report.
35
|
Item 10.
|
DIRECTORS, EXECUTIVE OFFICERS AND CORPORATE GOVERNANCE
|
The name, age at November 15, 2018 and position of each of our current executive officers and directors are presented below.
|
Name
|
Age
|
Position
|
|||
|
Scott Hall
|
54
|
|
President and Chief Executive Officer
|
||
|
Marietta Edmunds Zakas
|
59
|
|
Executive Vice President and Chief Financial Officer
|
||
|
Steven S. Heinrichs
|
50
|
|
Executive Vice President, General Counsel, Chief Compliance Officer and Corporate Secretary
|
||
|
Michael S. Nancarrow
|
44
|
|
Vice President and Chief Accounting Officer
|
||
|
Gregory S. Rogowski
|
59
|
|
Executive Vice President, Sales and Marketing
|
||
|
Hassan Ali
|
48
|
|
Senior Vice President, Engineering and Information Technology Officer
|
||
|
William A. Cofield
|
59
|
|
Senior Vice President, Operations & Supply Chain
|
||
|
M. Joseph Schrock
|
50
|
|
Vice President, Operations Controller
|
||
|
Jennifer B. O'Keefe
|
44
|
|
Vice President, Human Resources
|
||
|
Shirley C. Franklin
|
73
|
|
Director
|
||
|
Thomas J. Hansen
|
69
|
|
Director
|
||
|
Jerry W. Kolb
|
82
|
|
Director
|
||
|
Mark J. O’Brien
|
75
|
|
Director
|
||
|
Bernard G. Rethore
|
77
|
|
Director
|
||
|
Lydia W. Thomas
|
74
|
|
Director
|
||
|
Michael T. Tokarz
|
69
|
|
Director
|
||
Scott Hall
has served as our President and Chief Executive Officer since January 2017. He served as President and CEO of Textron’s Industrial segment from December 2009 until January 2017. Mr. Hall joined Textron in 2001 as president of Tempo, a multi-facility roll-up of communication test equipment. He was named president of Greenlee, a manufacturer of tools used in installing wire and cable, in 2003 when Tempo became part of Textron's Greenlee business unit. Prior to joining Textron, Mr. Hall had several leadership roles at General Cable, a leading manufacturer of wire and cable. Mr. Hall ran General Cable’s Canadian businesses before taking over responsibility for General Cable’s global Communications business. Mr. Hall received his Bachelor of Commerce degree from Memorial University of Newfoundland and his MBA from the University of Western Ontario Ivey School of Business.
Marietta Edmunds Zakas
has served as our Executive Vice President and Chief Financial Officer since January 2018. She served as Senior Vice President, Strategy, Corporate Development and Communications from November 2006 to December 2017. She was also the interim head of Human Resources from January 2016 to December 2017. Previously, Ms. Zakas held various positions at Russell Corporation, an athletic apparel, footwear and equipment company, culminating in her role as Corporate Vice President, Chief of Staff, Business Development and Treasurer. She earned a Bachelor of Arts degree with honors from Randolph-Macon Woman’s College (now known as Randolph College), a Master of Business Administration degree from the University of Virginia Darden School of Business and a Juris Doctor from the University of Virginia School of Law. Ms. Zakas is a director of Atlantic Capital Bank and Atlantic Capital Bancshares.
Steven S. Heinrichs
has served as our Executive Vice President, General Counsel, Chief Compliance Officer and Corporate Secretary since August 2018. He served as Senior Vice President, General Counsel and Secretary of Neenah, Inc. (f/k/a Neenah Paper, Inc.), which spun off from Kimberly-Clark Corporation in December 2004, from June 2004 to July 2018. Mr. Heinrichs joined Kimberly-Clark as Chief Counsel, Pulp and Paper and General Counsel for Neenah, Inc. Prior to his employment with Kimberly-Clark, Mr. Heinrichs served as Associate General Counsel and Assistant Secretary for Mariner Health Care, Inc., a nursing home and long-term acute care hospital company. Before joining Mariner Health Care in 2003, Mr. Heinrichs served as Associate General Counsel and Assistant Secretary for American Commercial Lines LLC, a leading inland barge and shipbuilding company from 1998 through 2003. Mr. Heinrichs engaged in the private practice of law with Skadden, Arps, Slate, Meagher and Flom LLP and Shuttleworth, Smith, McNabb and Williams PLLC from 1994 through 1998. Mr. Heinrichs received his MBA from the Kellogg School of Management at Northwestern University in 2008, his law degree from Tulane University in 1994, and his Bachelor of Arts degree from the University of Virginia.
36
Michael S. Nancarrow
has served as our Vice President and Chief Accounting Officer since January 2018. He served as the Company's Senior Director, Financial Reporting and Assistant Controller since December 2014 and the Company's Director of Financial Reporting since September 2006. Mr. Nancarrow earned a Bachelor of Science degree from The Ohio State University and is a certified public accountant.
Gregory S. Rogowski
has served as our Executive Vice President, Sales and Marketing since October 2017, and was President of Infrastructure from May 2009 to October 2017. Previously, Mr. Rogowski was President and/or Chief Executive Officer of Performance Fibers, Inc., a polyester industrial fibers business from 2004 to 2009. He earned a Bachelor of Science degree from Virginia Polytechnic Institute and State University, a Master of Science degree from the University of Akron and a Master of Business Administration degree from the University of Richmond.
Hassan Ali
has served as our Senior Vice President, Engineering and Information Technology Officer since October 2017 and was Vice President and General Manager of Mueller Systems, LLC from November 2009 to October 2017. Previously, Mr. Ali served as General Manager, Vice President and Director of Marketing for Landis+Gyr and Director of Quality and Business Excellence at Siemens Power Transmission & Distribution. Mr. Ali received his Bachelor of Science degree from the State University of New York at Buffalo.
William A. Cofield
has served as our Senior Vice President, Operations & Supply Chain since January 2018. Previously, Mr. Cofield served as Vice President of Operations and Supply Chain for MGA Entertainment from May 2014 to December 2018 and Vice President of Operations for Newell Brands, Inc. (formerly Newell Rubbermaid, Inc.) from January 2009 to May 2014. Mr. Cofield received his Bachelor of Science degree from the United States Military Academy. Upon graduation, he was commissioned as an officer in the United States Army where he served for 10 years. Mr. Cofield achieved the rank of Major before resigning his commission.
M. Joseph Schrock
has served as our Vice President, Operations Controller since January 2018. He served as Vice President, Operations Controller of Mueller Co. LLC from October 2017 to January 2018, Senior Director of Finance, Controller from February 2016 to September 2017, Division Controller from May 2010 to January 2016 and Plant Controller from May 2005 to April 2010. Previously, Mr. Schrock served as Division Controller of the MasterBrand Cabinets division of Fortune Brands Home & Security, Inc. from January 2004 to April 2005 and was Division Accounting Manager from November 1995 to December 2003. Mr. Schrock received his Bachelor of Science degree and his Executive MBA from Millikin University.
Jennifer B. O'Keefe
has served as our Vice President, Human Resources since December 2017, and was Senior Director, Talent & Rewards/Human Resources from January 2016 to November 2017. Previously, Ms. O'Keefe served as our Director, Talent Management & Human Resources, from February 2014 to December 2015; Senior Manager, Talent Management and Human Resources from June 2011 to January 2014; Employee Services Manager from February 2010 to June 2011; Manager, Health and Welfare Plans from February 2007 to February 2010; and Senior Benefits Analyst from October 2001 to February 2007. She earned a Bachelor of Arts degree from Furman University.
Shirley C. Franklin
has been a member of our board of directors since November 2010. Ms. Franklin serves as Executive Chair of the board of directors of Purpose Built Communities, Inc., a national non-profit organization established to transform struggling neighborhoods into sustainable communities. She also serves as Co-Chair of the Atlanta Regional Commission on Homelessness and as Chair of the board of directors of the National Center for Civil and Human Rights. From 2002 to 2010, Ms. Franklin was mayor of Atlanta, Georgia. Ms. Franklin earned a Bachelor of Science degree in sociology from Howard University and a Master’s degree in sociology from the University of Pennsylvania.
Thomas J. Hansen
has been a member of our board of directors since October 2011. Until 2012, Mr. Hansen served as Vice Chairman of Illinois Tool Works Inc. (“ITW”), a manufacturer of fasteners and components, consumable systems and a variety of specialty products and equipment. He joined ITW in 1980 as sales and marketing manager of the Shakeproof Industrial Products businesses. From 1998 until May 2006, Mr. Hansen served as Executive Vice President of ITW. Mr. Hansen earned a Bachelor of Science degree in marketing from Northern Illinois University and a Master of Business Administration degree from Governors State University.
Jerry W. Kolb
has been a member of our board of directors since April 2006. From 1986 to 1998, Mr. Kolb served as a Vice Chairman of Deloitte & Touche LLP, a registered public accounting firm. Mr. Kolb earned a Bachelor of Science degree in accountancy with highest honors from the University of Illinois and Master of Business Administration degree in finance from DePaul University. Mr. Kolb is a certified public accountant.
37
Mark J. O’Brien
has been a member of our board of directors since April 2006 and has served as our Non-Executive Chairman since January 2018. He served as Chairman of Walter Investment Management Corp. (formerly Walter Industries' Homes Business), a mortgage portfolio owner and mortgage originator and servicer, from 2009 through December 2015, and he served as its Chief Executive Officer from 2009 to October 2015. Mr. O’Brien has been President and Chief Executive Officer of Brier Patch Capital and Management, Inc., a real estate management and investment firm, since 2004. He served in various executive capacities at Pulte Homes, Inc., a home building company, for 21 years, retiring as President and Chief Executive Officer in 2003.
Mr. O’Brien earned a Bachelor of Arts degree in history from the University of Miami.
Bernard G. Rethore
has been a member of our board of directors since April 2006. Mr. Rethore has served as Chairman Emeritus
of Flowserve Corporation, a manufacturer of pumps, valves, seals and components, since 2000. From January 2000 to April 2000, he served as Flowserve’s Chairman. Mr. Rethore had previously served as its Chairman, President and Chief Executive Officer. In 2008, Mr. Rethore was honored by the Outstanding Directors Exchange as an Outstanding Director of the Year, and in 2012, he was designated a Board Leadership Fellow by the National Association of Corporate Directors. Mr. Rethore earned a Bachelor of Arts degree in Economics (Honors) from Yale University and a Master of Business Administration degree from the Wharton School of the University of Pennsylvania, where he was a Joseph P. Wharton Scholar and Fellow.
Lydia W. Thomas
has been a member of our board of directors since January 2008. Dr. Thomas served as President and Chief Executive Officer of Noblis, Inc., a public interest scientific research, technology and strategy company, from 1996 to 2007. She was previously with The MITRE Corporation, Center for Environment, Resources and Space, serving as Senior Vice President and General Manager from 1992 to 1996, Vice President from 1989 to 1992 and Technical Director from 1982 to 1989. In 2013, she was honored by the Outstanding Directors Exchange as an Outstanding Director of the Year. Dr. Thomas earned a Bachelor of Science degree in zoology from Howard University, a Master of Science degree in microbiology from American University and a Doctor of Philosophy degree in cytology from Howard University.
Michael T. Tokarz
has been a member of our board of directors since April 2006. Since 2002, Mr. Tokarz has served as a member of the Tokarz Group, LLC, an investment company. From 1996 until 2002, Mr. Tokarz served as a member of the limited liability company that serves as the general partner of Kohlberg Kravis Roberts & Co. L.P., a private equity company. In 2007, he was honored by the Outstanding Directors Exchange as an Outstanding Director of the Year. Mr. Tokarz earned a Bachelor of Arts degree in economics with high distinction and a Master of Business Administration degree in finance from the University of Illinois.
Additional Information
Additional information required by this item will be contained in our definitive proxy statement issued in connection with the
2019
Annual Meeting of Stockholders filed with the SEC within 120 days after
September 30, 2018
and is incorporated herein by reference.
Our website address is
www.muellerwaterproducts.com
. You may read and print our annual reports on Form 10-K, quarterly reports on Form 10-Q, current reports on Form 8-K, proxy statements and all amendments to those reports from the investor relations section of our website free of charge. These reports are available on our website soon after we file them with or furnish them to the SEC. These reports should also be available through the SEC’s website at
www.sec.gov
.
We have adopted a written code of conduct that applies to all directors, officers and employees, including a separate code that applies only to our principal executive officer and senior financial officers in accordance with Section 406 of the Sarbanes-Oxley Act of 2002 and the rules of the SEC promulgated thereunder. Our Code of Business Conduct and Ethics is available in the corporate governance section of our website. In the event that we make changes in, or provide waivers from, the provisions of this Code of Business Conduct and Ethics that the SEC requires us to disclose, we will disclose these events in the corporate governance section of our website.
We have adopted corporate governance guidelines. The guidelines and the charters of our board committees are available in the corporate governance section of our website. Copies of the Code of Business Conduct and Ethics, corporate governance guidelines and board committee charters are also available in print upon written request to the Corporate Secretary, Mueller Water Products, Inc., 1200 Abernathy Road N.E., Suite 1200, Atlanta, GA 30328.
|
Item 11.
|
EXECUTIVE COMPENSATION
|
The information required by this item will be contained in our definitive proxy statement issued in connection with the
2019
Annual Meeting of Stockholders and is incorporated herein by reference.
38
|
Item 12.
|
SECURITY OWNERSHIP OF CERTAIN BENEFICIAL OWNERS AND MANAGEMENT AND RELATED STOCKHOLDER MATTERS
|
Except for the information set forth below and the information set forth in “Part II, Item 5. MARKET FOR REGISTRANT’S COMMON EQUITY, RELATED STOCKHOLDER MATTERS AND ISSUER PURCHASES OF EQUITY SECURITIES,” the information required by this item will be contained in our definitive proxy statement issued in connection with the
2019
Annual Meeting of Stockholders and is incorporated herein by reference.
Securities Authorized for Issuance under Equity Compensation Plans
We have two compensation plans under which our equity securities are authorized for issuance. The Mueller Water Products, Inc. 2006 Employee Stock Purchase Plan (“ESPP”) was approved by our sole stockholder in May 2006 and amended by our stockholders in February 2016. The Mueller Water Products, Inc. 2006 Stock Incentive Plan (“2006 Plan”) was approved by our sole stockholder in May 2006 and amended by our stockholders in January 2008, January 2009 and January 2012.
The following table sets forth certain information relating to these equity compensation plans at
September 30, 2018
.
|
Number of securities
to be issued
upon exercise of
outstanding options,
warrants and rights
|
Weighted average
exercise price of
outstanding options,
warrants and rights
|
Number of securities
remaining available
for future issuance
|
||||||||||
|
Equity compensation plans approved by stockholders:
|
||||||||||||
|
2006 Plan
|
2,802,646
|
|
(1)
|
$
|
5.03
|
|
(2)
|
7,410,033
|
|
(3)
|
||
|
ESPP
|
36,202
|
|
|
—
|
|
2,750,935
|
|
(4)
|
||||
|
Total
|
2,838,848
|
|
|
10,160,968
|
|
|
||||||
|
(1)
|
Consists of the maximum number of shares that could to be earned upon exercise or vesting of outstanding stock-based awards granted under the 2006 Plan. This includes
305,176
shares associated with share-settled performance units that may not be earned, depending on Company performance, as described in
Note 11.
of the Notes to the Consolidated Financial Statements.
|
|
(2)
|
Weighted average exercise price of
1,589,026
outstanding stock options.
|
|
(3)
|
The number of securities remaining available for future issuance under the 2006 Plan is
20,500,000
shares less the cumulative number of shares granted under the plan, assuming maximum payout of all share-settled performance units for which performance goals have not yet been set, plus the cumulative number of awards canceled under the plan and, after January 25, 2012, shares surrendered upon issuance to cover employees' related tax liability.
|
|
(4)
|
The number of securities remaining available for future issuance under the ESPP Plan is
5,800,000
shares less the cumulative number of shares that have been issued under the plan.
|
|
Item 13.
|
CERTAIN RELATIONSHIPS AND RELATED TRANSACTIONS, AND DIRECTOR INDEPENDENCE
|
The information required by this item will be contained in our definitive proxy statement issued in connection with the
2019
Annual Meeting of Stockholders and is incorporated herein by reference.
|
Item 14.
|
PRINCIPAL ACCOUNTANT FEES AND SERVICES
|
The information required by this item will be contained in our definitive proxy statement issued in connection with the
2019
Annual Meeting of Stockholders and is incorporated herein by reference.
39
|
Item 15.
|
EXHIBITS AND FINANCIAL STATEMENT SCHEDULES
|
(a)
Financial Statements
|
Index to financial statements
|
Page
number
|
|
|
Reports of Independent Registered Public Accounting Firm
|
F-1
|
|
|
Consolidated Balance Sheets at September 30, 2018 and 2017
|
F-3
|
|
|
Consolidated Statements of Operations for the years ended September 30, 2018, 2017 and 2016
|
F-4
|
|
|
Consolidated Statements of Comprehensive Income for the years ended September 30, 2018, 2017 and 2016
|
F-5
|
|
|
Consolidated Statements of Stockholders’ Equity for the years ended September 30, 2018, 2017 and 2016
|
F-6
|
|
|
Consolidated Statements of Cash Flows for the years ended September 30, 2018, 2017 and 2016
|
F-7
|
|
|
Notes to Consolidated Financial Statements for the three years ended September 30, 2018
|
F-8
|
|
|
(b)
|
Financial Statement Schedules
|
Except for Schedule II, Valuation and Qualifying Accounts, the schedules for which provision is made in the applicable accounting regulations of the SEC are not required under the related instructions or are inapplicable and, therefore, have been omitted. The information required by Schedule II is included in the Notes to Consolidated Financial Statements.
|
(c)
|
Exhibits
|
|
Exhibit no.
|
|
Document
|
|
2.1
|
|
|
|
2.2
|
|
|
|
2.3
|
|
|
|
2.4
|
||
|
2.5
|
||
|
3.1
|
|
|
|
3.2
|
|
|
|
4.1
|
|
|
|
4.2
|
|
|
|
4.3
|
|
|
40
|
Exhibit no.
|
|
Document
|
|
10.2
|
|
|
|
10.3*
|
|
|
|
10.3.1*
|
||
|
10.4*
|
|
|
|
10.4.1*
|
||
|
10.4.2*
|
||
|
10.5*
|
|
|
|
10.5.1*
|
||
|
10.5.2*
|
||
|
10.6*
|
|
|
|
10.6.1*
|
||
|
10.7*
|
|
|
|
10.8*
|
|
|
|
10.9*
|
|
|
|
10.10*
|
|
|
|
10.11*
|
|
|
|
10.11.1*
|
|
|
|
10.11.2*
|
|
|
|
10.11.3*
|
|
|
|
10.11.4*
|
||
|
10.11.5*
|
|
|
|
10.12*
|
|
|
41
|
Exhibit no.
|
|
Document
|
|
10.12.1*
|
|
|
|
10.12.2*
|
||
|
10.12.3*
|
||
|
10.13*
|
|
|
|
10.14
|
||
|
10.15*
|
||
|
10.16*
|
||
|
10.17*
|
||
|
10.17.1*
|
||
|
10.19
|
||
|
10.19.1
|
||
|
10.19.2
|
||
|
10.19.3
|
||
|
10.19.4
|
||
|
10.20*
|
||
|
10.20.1*
|
||
|
10.20.2*
|
||
|
10.20.3*
|
||
|
10.20.4*
|
||
|
10.21
|
||
42
|
Exhibit no.
|
|
Document
|
|
10.22*
|
||
|
10.22.1*
|
||
|
10.22.2*
|
||
|
10.23*
|
||
|
10.23.1*
|
||
|
10.23.2*
|
||
|
10.23.3*
|
||
|
10.24*
|
||
|
10.25*
|
||
|
10.26*
|
||
|
10.27*
|
||
|
10.27.1
|
||
|
10.28*
|
||
|
10.28.1*
|
||
|
10.29*
|
||
|
10.29.1*
|
||
|
10.29.2*
|
||
|
10.29.3*
|
||
|
10.30*
|
||
|
10.30.1*
|
||
43
|
Exhibit no.
|
|
Document
|
|
10.30.2*
|
||
|
10.31**
|
||
|
10.31.1**
|
||
|
14.1*
|
||
|
21.1**
|
||
|
23.1**
|
||
|
31.1**
|
||
|
31.2**
|
||
|
32.1**
|
||
|
32.2**
|
||
|
101**
|
The following financial information from the Annual Report on Form 10-K for the year ended September 30, 2018, formatted in XBRL (Extensible Business Reporting Language),
(i) the Consolidated Balance Sheets
,
(ii) the Consolidated Statements of Operations
and
Other Comprehensive Income
,
(iii) the Consolidated Statements of Stockholders’ Equity
,
(iv) the Consolidated Statements of Cash Flows
, and
(v) the Notes to Consolidated Financial Statements
.
|
|
|
*
|
Management compensatory plan, contract or arrangement
|
|
**
|
Filed with this annual report
|
44
SIGNATURES
Pursuant to the requirements of Section 13 or 15(d) of the Securities Exchange Act of 1934, as amended, the Registrant has duly caused this report to be signed on its behalf by the undersigned, thereunto duly authorized.
Date:
November 20, 2018
|
MUELLER WATER PRODUCTS, INC.
|
|||
|
By:
|
|
/s/ Scott Hall
|
|
|
Name: Scott Hall
|
|||
|
Title:
President and Chief Executive Officer
|
|||
Pursuant to the requirements of the Securities Act of 1934, as amended, this report has been signed by the following persons on behalf of the registrant and in the capacities and on the dates indicated.
|
Signature
|
Title
|
Date
|
||
|
/s/ Scott Hall
|
President and Chief Executive Officer
|
November 20, 2018
|
||
|
Scott Hall
|
||||
|
/s/ Marietta Edmunds Zakas
|
Executive Vice President and Chief Financial Officer (principal financial officer)
|
November 20, 2018
|
||
|
Marietta Edmunds Zakas
|
||||
|
/s/ Michael S. Nancarrow
|
Vice President and Chief Accounting Officer (principal accounting officer)
|
November 20, 2018
|
||
|
Michael S. Nancarrow
|
||||
|
/s/ Shirley C. Franklin
|
Director
|
November 20, 2018
|
||
|
Shirley C. Franklin
|
||||
|
/s/ Thomas J. Hansen
|
Director
|
November 20, 2018
|
||
|
Thomas J. Hansen
|
||||
|
/s/ Jerry W. Kolb
|
Director
|
November 20, 2018
|
||
|
Jerry W. Kolb
|
||||
|
/s/ Mark J. O’Brien
|
Director
|
November 20, 2018
|
||
|
Mark J. O’Brien
|
||||
|
/s/ Bernard G. Rethore
|
Director
|
November 20, 2018
|
||
|
Bernard G. Rethore
|
||||
|
/s/ Lydia W. Thomas
|
Director
|
November 20, 2018
|
||
|
Lydia W. Thomas
|
||||
|
/s/ Michael T. Tokarz
|
Director
|
November 20, 2018
|
||
|
Michael T. Tokarz
|
||||
45
Report of Independent Registered Public Accounting Firm
To the Shareholders and the Board of Directors of Mueller Water Products, Inc.
Opinion on the Financial Statements
We have audited the accompanying consolidated balance sheets of Mueller Water Products, Inc. and subsidiaries as of September 30,
2018
and
2017
, and the related consolidated statements of operations, comprehensive income, equity, and cash flows for each of the three years in the period ended September 30,
2018
and the related notes (collectively referred to as the “consolidated financial statements”). In our opinion, the consolidated financial statements present fairly, in all material respects, the financial position of the Company at September 30,
2018
and
2017
, and the results of its operations and its cash flows for each of the three years in the period ended September 30,
2018
, in conformity with U.S. generally accepted accounting principles.
We also have audited, in accordance with the standards of the Public Company Accounting Oversight Board (United States) (PCAOB), the Company's internal control over financial reporting as of September 30,
2018
, based on criteria established in Internal Control-Integrated Framework issued by the Committee of Sponsoring Organizations of the Treadway Commission (2013 framework) and our report dated
November 20, 2018
expressed an unqualified opinion thereon.
Basis for Opinion
These financial statements are the responsibility of the Company's management. Our responsibility is to express an opinion on the Company’s financial statements based on our audits. We are a public accounting firm registered with the PCAOB and are required to be independent with respect to the Company in accordance with the U.S. federal securities laws and the applicable rules and regulations of the Securities and Exchange Commission and the PCAOB.
We conducted our audits in accordance with the standards of the PCAOB. Those standards require that we plan and perform the audit to obtain reasonable assurance about whether the financial statements are free of material misstatement, whether due to error or fraud. Our audits included performing procedures to assess the risks of material misstatement of the financial statements, whether due to error or fraud, and performing procedures that respond to those risks. Such procedures included examining, on a test basis, evidence regarding the amounts and disclosures in the financial statements. Our audits also included evaluating the accounting principles used and significant estimates made by management, as well as evaluating the overall presentation of the financial statements. We believe that our audits provide a reasonable basis for our opinion.

We have served as the Company's auditor since 2007.
Atlanta, Georgia
November 20, 2018
F- 1
Report of Independent Registered Public Accounting Firm
To the Shareholders and the Board of Directors of Mueller Water Products, Inc.
Opinion on Internal Control over Financial Reporting
We have audited Mueller Water Products, Inc. and subsidiaries’ internal control over financial reporting as of
September 30, 2018
, based on criteria established in Internal Control - Integrated Framework issued by the Committee of Sponsoring Organizations of the Treadway Commission (2013 framework) (the COSO criteria). In our opinion, Mueller Water Products, Inc. and subsidiaries (the Company) maintained, in all material respects, effective internal control over financial reporting as of
September 30, 2018
, based on the COSO criteria.
We also have audited, in accordance with the standards of the Public Company Accounting Oversight Board (United States) (PCAOB), the consolidated balance sheets of the Company as of September 30, 2018 and 2017, the related consolidated statements of operations, comprehensive income, equity and cash flows for each of the three years in the period ended September 30, 2018, and the related notes and our report dated November 20, 2018, expressed an unqualified opinion thereon.
Basis for Opinion
The Company’s management is responsible for maintaining effective internal control over financial reporting and for its assessment of the effectiveness of internal control over financial reporting included in the accompanying Management’s Report on Internal Control over Financial Reporting. Our responsibility is to express an opinion on the Company’s internal control over financial reporting based on our audit. We are a public accounting firm registered with the PCAOB and are required to be independent with respect to the Company in accordance with the U.S. federal securities laws and the applicable rules and regulations of the Securities and Exchange Commission and the PCAOB.
We conducted our audit in accordance with the standards of the PCAOB. Those standards require that we plan and perform the audit to obtain reasonable assurance about whether effective internal control over financial reporting was maintained in all material respects.
Our audit included obtaining an understanding of internal control over financial reporting, assessing the risk that a material weakness exists, testing and evaluating the design and operating effectiveness of internal control based on the assessed risk, and performing such other procedures as we considered necessary in the circumstances. We believe that our audit provides a reasonable basis for our opinion.
Definition and Limitations of Internal Control Over Financial Reporting
A company’s internal control over financial reporting is a process designed to provide reasonable assurance regarding the reliability of financial reporting and the preparation of financial statements for external purposes in accordance with generally accepted accounting principles. A company’s internal control over financial reporting includes those policies and procedures that (1) pertain to the maintenance of records that, in reasonable detail, accurately and fairly reflect the transactions and dispositions of the assets of the company; (2) provide reasonable assurance that transactions are recorded as necessary to permit preparation of financial statements in accordance with generally accepted accounting principles, and that receipts and expenditures of the company are being made only in accordance with authorizations of management and directors of the company; and (3) provide reasonable assurance regarding prevention or timely detection of unauthorized acquisition, use, or disposition of the company’s assets that could have a material effect on the financial statements.
Because of its inherent limitations, internal control over financial reporting may not prevent or detect misstatements. Also, projections of any evaluation of effectiveness to future periods are subject to the risk that controls may become inadequate because of changes in conditions, or that the degree of compliance with the policies or procedures may deteriorate.

Atlanta, Georgia
November 20, 2018
F- 2
|
MUELLER WATER PRODUCTS, INC. AND SUBSIDIARIES
CONSOLIDATED BALANCE SHEETS
|
|||||||
|
|
September 30,
|
||||||
|
|
2018
|
2017
|
|||||
|
|
(in millions, except share amounts)
|
||||||
|
Assets:
|
|||||||
|
Cash and cash equivalents
|
$
|
|
|
$
|
|
|
|
|
Receivables, net
|
|
|
|
|
|||
|
Inventories
|
|
|
|
|
|||
|
Other current assets
|
|
|
|
|
|||
|
Total current assets
|
|
|
|
|
|||
|
Property, plant and equipment, net
|
|
|
|
|
|||
|
Intangible assets
|
|
|
|
|
|||
|
Other noncurrent assets
|
|
|
|
|
|||
|
Total assets
|
$
|
|
|
$
|
|
|
|
|
Liabilities and equity:
|
|||||||
|
Current portion of long-term debt
|
$
|
|
|
$
|
|
|
|
|
Accounts payable
|
|
|
|
|
|||
|
Other current liabilities
|
|
|
|
|
|||
|
Total current liabilities
|
|
|
|
|
|||
|
Long-term debt
|
|
|
|
|
|||
|
Deferred income taxes
|
|
|
|
|
|||
|
Other noncurrent liabilities
|
|
|
|
|
|||
|
Total liabilities
|
|
|
|
|
|||
|
Commitments and contingencies (Note 17.)
|
|||||||
|
Common stock: 600,000,000 shares authorized; 157,332,121 and 158,590,383 shares outstanding at September 30, 2018 and 2017, respectively
|
|
|
|
|
|||
|
Additional paid-in capital
|
|
|
|
|
|||
|
Accumulated deficit
|
(
|
)
|
(
|
)
|
|||
|
Accumulated other comprehensive loss
|
(
|
)
|
(
|
)
|
|||
|
Total Company stockholders’ equity
|
|
|
|
|
|||
|
Noncontrolling interest
|
|
|
|
|
|||
|
Total equity
|
|
|
|
|
|
||
|
Total liabilities and equity
|
$
|
|
|
|
$
|
|
|
The accompanying notes are an integral part of the consolidated financial statements.
F- 3
|
MUELLER WATER PRODUCTS, INC. AND SUBSIDIARIES
CONSOLIDATED STATEMENTS OF OPERATIONS
|
|||||||||||
|
|
Year ended September 30,
|
||||||||||
|
|
2018
|
2017
|
2016
|
||||||||
|
|
(in millions, except per share amounts)
|
||||||||||
|
Net sales
|
$
|
|
|
$
|
|
|
$
|
|
|
||
|
Cost of sales
|
|
|
|
|
|
|
|||||
|
Gross profit
|
|
|
|
|
|
|
|||||
|
Operating expenses:
|
|||||||||||
|
Selling, general and administrative
|
|
|
|
|
|
|
|||||
|
Gain on sale of idle property
|
(
|
)
|
|
|
|
|
|||||
|
Other charges
|
|
|
|
|
|
|
|||||
|
Total operating expenses
|
|
|
|
|
|
|
|||||
|
Operating income
|
|
|
|
|
|
|
|||||
|
Pension costs other than service
|
|
|
|
|
|
|
|||||
|
Interest expense, net
|
|
|
|
|
|
|
|||||
|
Loss on early extinguishment of debt
|
|
|
|
|
|
|
|||||
|
Gain on settlement of interest rate swap contracts
|
(
|
)
|
|
|
|
|
|||||
|
Income before income taxes
|
|
|
|
|
|
|
|||||
|
Income tax (benefit) expense
|
(
|
)
|
|
|
|
|
|||||
|
Income from continuing operations
|
|
|
|
|
|
|
|||||
|
Income from discontinued operations
|
|
|
|
|
|
|
|||||
|
Net income
|
$
|
|
|
|
$
|
|
|
|
$
|
|
|
|
Earnings per basic share:
|
|||||||||||
|
Continuing operations
|
$
|
|
|
$
|
|
|
$
|
|
|
||
|
Discontinued operations
|
|
|
|
|
|
|
|||||
|
Net Income
|
$
|
|
|
$
|
|
|
$
|
|
|
||
|
Earnings per diluted share:
|
|||||||||||
|
Continuing operations
|
$
|
|
|
$
|
|
|
$
|
|
|
||
|
Discontinued operations
|
|
|
|
|
|
|
|||||
|
Net income
|
$
|
|
|
$
|
|
|
$
|
|
|
||
|
Weighted average shares outstanding:
|
|||||||||||
|
Basic
|
|
|
|
|
|
|
|||||
|
Diluted
|
|
|
|
|
|
|
|||||
|
Dividends declared per share
|
$
|
|
|
$
|
|
|
$
|
|
|
||
The accompanying notes are an integral part of the consolidated financial statements.
F- 4
|
MUELLER WATER PRODUCTS, INC. AND SUBSIDIARIES
CONSOLIDATED STATEMENTS OF COMPREHENSIVE INCOME
|
|||||||||||
|
|
Year ended September 30,
|
||||||||||
|
|
2018
|
2017
|
2016
|
||||||||
|
|
(in millions)
|
||||||||||
|
Net income
|
$
|
|
|
$
|
|
|
$
|
|
|
||
|
Other comprehensive income (loss):
|
|||||||||||
|
Pension liability
|
|
|
|
|
|
|
|||||
|
Income tax effects
|
(
|
)
|
(
|
)
|
(
|
)
|
|||||
|
Foreign currency translation
|
(
|
)
|
|
|
|
|
|||||
|
Derivative instruments
|
|
|
|
|
(
|
)
|
|||||
|
Income tax effects
|
(
|
)
|
(
|
)
|
|
|
|||||
|
|
|
|
|
(
|
)
|
||||||
|
Comprehensive income
|
$
|
|
|
$
|
|
|
$
|
|
|
||
The accompanying notes are an integral part of the consolidated financial statements.
F- 5
|
MUELLER WATER PRODUCTS, INC. AND SUBSIDIARIES
CONSOLIDATED STATEMENTS OF EQUITY
FOR THE THREE YEARS ENDED SEPTEMBER 30, 2018
|
|||||||||||||||||||||||
|
Common
stock
|
Additional
paid-in
capital
|
Accumulated
deficit
|
Accumulated
other
comprehensive
loss
|
Non-controlling interest
|
Total
|
||||||||||||||||||
|
|
(in millions)
|
||||||||||||||||||||||
|
Balance at September 30, 2015
|
$
|
|
|
$
|
|
|
$
|
(
|
)
|
$
|
(
|
)
|
$
|
|
|
$
|
|
|
|||||
|
Net income (loss)
|
|
|
|
|
|
|
|
|
(
|
)
|
|
|
|||||||||||
|
Dividends declared
|
|
|
(
|
)
|
|
|
|
|
|
|
(
|
)
|
|||||||||||
|
Stock-based compensation
|
|
|
|
|
|
|
|
|
|
|
|
|
|||||||||||
|
Shares retained for employee taxes
|
|
|
(
|
)
|
|
|
|
|
|
|
(
|
)
|
|||||||||||
|
Common stock issued
|
|
|
|
|
|
|
|
|
|
|
|
|
|||||||||||
|
Other comprehensive loss, net of tax
|
|
|
|
|
|
|
(
|
)
|
|
|
(
|
)
|
|||||||||||
|
Balance at September 30, 2016
|
|
|
|
|
(
|
)
|
(
|
)
|
|
|
|
|
|||||||||||
|
Net income (loss)
|
|
|
|
|
|
|
|
|
(
|
)
|
|
|
|||||||||||
|
Dividends declared
|
|
|
(
|
)
|
|
|
|
|
|
|
(
|
)
|
|||||||||||
|
Stock-based compensation
|
|
|
|
|
|
|
|
|
|
|
|
|
|||||||||||
|
Shares retained for employee taxes
|
|
|
(
|
)
|
|
|
|
|
|
|
(
|
)
|
|||||||||||
|
Common stock issued
|
|
|
|
|
|
|
|
|
|
|
|
|
|||||||||||
|
Stock repurchased under buyback program
|
|
|
(
|
)
|
|
|
|
|
|
|
(
|
)
|
|||||||||||
|
Other comprehensive loss, net of tax
|
|
|
|
|
|
|
|
|
|
|
|
|
|||||||||||
|
Balance at September 30, 2017
|
|
|
|
|
(
|
)
|
(
|
)
|
|
|
|
|
|||||||||||
|
Net income
|
|
|
|
|
|
|
|
|
|
|
|
|
|||||||||||
|
Dividends declared
|
|
|
(
|
)
|
|
|
|
|
|
|
(
|
)
|
|||||||||||
|
Stock-based compensation
|
|
|
|
|
|
|
|
|
|
|
|
|
|||||||||||
|
Shares retained for employee taxes
|
|
|
(
|
)
|
|
|
|
|
|
|
(
|
)
|
|||||||||||
|
Common stock issued
|
|
|
|
|
|
|
|
|
|
|
|
|
|||||||||||
|
Stock repurchased under buyback program
|
|
|
(
|
)
|
|
|
|
|
|
|
(
|
)
|
|||||||||||
|
Other comprehensive loss, net of tax
|
|
|
|
|
|
|
|
|
|
|
|
|
|||||||||||
|
Balance at September 30, 2018
|
$
|
|
|
$
|
|
|
$
|
(
|
)
|
$
|
(
|
)
|
$
|
|
|
$
|
|
|
|||||
The accompanying notes are an integral part of the consolidated financial statements.
F- 6
|
MUELLER WATER PRODUCTS, INC. AND SUBSIDIARIES
CONSOLIDATED STATEMENTS OF CASH FLOWS
|
|||||||||||
|
|
Year ended September 30,
|
||||||||||
|
|
2018
|
2017
|
2016
|
||||||||
|
|
(in millions)
|
||||||||||
|
Operating activities:
|
|||||||||||
|
Net income
|
$
|
|
|
$
|
|
|
$
|
|
|
||
|
Less income from discontinued operations
|
|
|
|
|
|
|
|||||
|
Income from continuing operations
|
|
|
|
|
|
|
|||||
|
Adjustments to reconcile net income to net cash provided by operating activities:
|
|||||||||||
|
Depreciation
|
|
|
|
|
|
|
|||||
|
Amortization
|
|
|
|
|
|
|
|||||
|
Pension plans
|
|
|
|
|
|
|
|||||
|
Deferred income taxes
|
(
|
)
|
(
|
)
|
(
|
)
|
|||||
|
Stock-based compensation
|
|
|
|
|
|
|
|||||
|
Loss on early extinguishment of debt
|
|
|
|
|
|
|
|||||
|
Gain on disposal of assets
|
(
|
)
|
|
|
|
|
|||||
|
Other, net
|
|
|
|
|
|
|
|||||
|
Changes in assets and liabilities, net of acquisitions:
|
|||||||||||
|
Receivables
|
(
|
)
|
(
|
)
|
(
|
)
|
|||||
|
Inventories
|
(
|
)
|
(
|
)
|
|
|
|||||
|
Other assets
|
(
|
)
|
(
|
)
|
(
|
)
|
|||||
|
Pension obligations, related to contributions
|
|
|
(
|
)
|
|
|
|||||
|
Other liabilities
|
|
|
|
|
|
|
|||||
|
Net cash provided by operating activities
|
|
|
|
|
|
|
|||||
|
Investing activities:
|
|||||||||||
|
Capital expenditures
|
(
|
)
|
(
|
)
|
(
|
)
|
|||||
|
Business acquisitions, net of cash acquired
|
|
|
(
|
)
|
|
|
|||||
|
Proceeds from sales of assets
|
|
|
|
|
|
|
|||||
|
Net cash used in investing activities
|
(
|
)
|
(
|
)
|
(
|
)
|
|||||
|
Financing activities:
|
|||||||||||
|
Repayment of debt
|
(
|
)
|
(
|
)
|
(
|
)
|
|||||
|
Issuance of debt
|
|
|
|
|
|
|
|||||
|
Dividends paid
|
(
|
)
|
(
|
)
|
(
|
)
|
|||||
|
Stock repurchased under buyback program
|
(
|
)
|
(
|
)
|
|
|
|||||
|
Common stock issued
|
|
|
|
|
|
|
|||||
|
Deferred financing costs paid
|
(
|
)
|
(
|
)
|
(
|
)
|
|||||
|
Employee taxes related to stock-based compensation
|
(
|
)
|
(
|
)
|
(
|
)
|
|||||
|
Other
|
(
|
)
|
|
|
(
|
)
|
|||||
|
Net cash used in financing activities
|
(
|
)
|
(
|
)
|
(
|
)
|
|||||
|
Net cash flows from discontinued operations:
|
|||||||||||
|
Operating activities
|
|
|
(
|
)
|
|
|
|||||
|
Investing activities
|
|
|
|
|
(
|
)
|
|||||
|
Financing activities
|
|
|
(
|
)
|
|
|
|||||
|
Net cash provided by discontinued operations
|
|
|
|
|
|
|
|||||
|
Effect of currency exchange rate changes on cash
|
(
|
)
|
|
|
(
|
)
|
|||||
|
Net change in cash and cash equivalents
|
(
|
)
|
|
|
|
|
|||||
|
Cash and cash equivalents at beginning of year
|
|
|
|
|
|
|
|||||
|
Cash and cash equivalents at end of year
|
$
|
|
|
$
|
|
|
$
|
|
|
||
The accompanying notes are an integral part of the consolidated financial statements.
F- 7
MUELLER WATER PRODUCTS, INC. AND SUBSIDIARIES
NOTES TO CONSOLIDATED FINANCIAL STATEMENTS
FOR THE THREE YEARS ENDED SEPTEMBER 30,
2018
|
Note 1.
|
|
Mueller Water Products, Inc., a Delaware corporation, together with its consolidated subsidiaries, operates in
two
business segments: Infrastructure and Technologies. Infrastructure (previously referred to as “Mueller Co.”) manufactures valves for water and gas systems, including butterfly, iron gate, tapping, check, knife, plug, automatic control and ball valves, as well as dry-barrel and wet-barrel fire hydrants. Technologies (previously referred to as “Mueller Technologies”) offers metering systems, leak detection, pipe condition assessment and other products and services for the water infrastructure industry. The “Company,” “we,” “us” or “our” refer to Mueller Water Products, Inc. and its subsidiaries. With regard to the Company’s segments, “we,” “us” or “our” may also refer to the segment being discussed.
In
July 2014
, Infrastructure acquired a
49
%
ownership in an industrial valve joint-venture for
$
1.7
million
. Due to substantive control features in the joint-venture agreement, all of the joint venture’s assets, liabilities and results of operations are included in our consolidated financial statements. We included an adjustment for the income attributable to noncontrolling interest in selling, general and administrative expenses. Noncontrolling interest is recorded at its carrying value, which approximates fair value.
Our consolidated financial statements are prepared in conformity with accounting principles generally accepted in the United States of America (“GAAP”), which require us to make certain estimates and assumptions that affect the reported amounts of assets, liabilities, sales and expenses and the disclosure of contingent assets and liabilities for the reporting periods. Actual results could differ from those estimates. All significant intercompany balances and transactions have been eliminated. Certain reclassifications have been made to previously reported amounts to conform to the current presentation.
|
Note 2.
|
|
F- 8
|
2018
|
2017
|
2016
|
|||||||||
|
|
(in millions)
|
||||||||||
|
Balance at beginning of year
|
$
|
|
|
$
|
|
|
$
|
|
|
||
|
Provision charged to expense
|
|
|
|
|
|
|
|||||
|
Balances written off, net of recoveries
|
(
|
)
|
(
|
)
|
|
|
|||||
|
Other
|
|
|
|
|
|
|
|||||
|
Balance at end of year
|
$
|
|
|
$
|
|
|
$
|
|
|
||
|
2018
|
2017
|
2016
|
|||||||||
|
|
(in millions)
|
||||||||||
|
Balance at beginning of year
|
$
|
|
|
$
|
|
|
$
|
|
|
||
|
Provision charged to expense
|
|
|
|
|
|
|
|||||
|
Inventory disposed
|
(
|
)
|
(
|
)
|
(
|
)
|
|||||
|
Other
|
(
|
)
|
(
|
)
|
|
|
|||||
|
Balance at end of year
|
$
|
|
|
$
|
|
|
$
|
|
|
||
Direct internal and external costs to implement computer systems and internal-use software are capitalized. Capitalized costs are depreciated over the estimated useful life of the system or software, generally
6
years, beginning when site installation or module development is complete and ready for use.
Liabilities are recognized at fair value for asset retirement obligations related to plant and landfill closures in the period in which they are reasonably estimable and the carrying amounts of the related long-lived assets are correspondingly increased. Over time, the liabilities are accreted to their estimated future values.
At September 30, 2018
and
2017
, asset retirement obligations were
$
4.1
million
and
$
3.8
million
, respectively.
F- 9
|
2018
|
2017
|
2016
|
|||||||||
|
|
(in millions)
|
||||||||||
|
Balance at beginning of year
|
$
|
|
|
$
|
|
|
$
|
|
|
||
|
Warranty accruals
|
|
|
|
|
|
|
|||||
|
Warranty costs
|
(
|
)
|
(
|
)
|
(
|
)
|
|||||
|
Balance at end of year
|
$
|
|
|
$
|
|
|
$
|
|
|
||
F- 10
We only record tax benefits for positions that management believes are more likely than not of being sustained under audit based solely on the technical merits of the associated tax position. The amount of tax benefit recognized for any position that meets the more likely than not threshold is the largest amount of the tax benefit that we believe is greater than
50
%
likely of being realized.
On December 22, 2017, HR-1, commonly referred to as the Tax Cuts and Jobs Act (“Act”), was enacted, which made significant revisions to federal income tax laws, including lowering the corporate income tax rate to 21% from 35% effective January 1, 2018, overhauling the taxation of income earned outside the United States and eliminating or limiting certain deductions. The Act subjects us to current tax on global intangible low-taxed income (“GILTI”) earned by certain of our foreign subsidiaries. The Act states that we can make an accounting policy election to either recognize deferred taxes for temporary differences expected to reverse as GILTI in future years or provide for the tax expense related to GILTI in the year the tax is incurred. We have elected to recognize the tax on GILTI as a period expense in the period the tax is incurred.
In September 2018, we adopted Accounting Standards Update 2018-02
Income Statement—Reporting Comprehensive Income (Topic 220): Reclassification of Certain Tax Effects from Accumulated Other Comprehensive Income
, which permits, but does not require, companies to reclassify from accumulated other comprehensive loss to retained earnings any “stranded tax effects” caused by the Act. We have elected to not make such a reclassification.
F- 11
|
Note 3.
|
|
On
January 6, 2017
, we sold Anvil to affiliates of One Equity Partners for cash proceeds of
$
305.7
million
and the agreement by the purchaser to reimburse us for expenditures to settle certain previously existing liabilities.
|
Gross cash proceeds
|
$
|
|
|
|
Noncash proceeds
|
|
|
|
|
Total proceeds
|
|
|
|
|
Transaction expenses
|
(
|
)
|
|
|
Net proceeds
|
|
|
|
|
Assets and liabilities disposed
|
(
|
)
|
|
|
Gain on sale, pre-tax
|
|
|
|
|
Income tax
|
(
|
)
|
|
|
Gain on sale, net of tax
|
$
|
|
|
|
|
2017
|
2016
|
|||||
|
|
(in millions)
|
||||||
|
Net sales
|
$
|
|
|
$
|
|
|
|
|
Cost of sales
|
|
|
|
|
|||
|
Gross profit
|
|
|
|
|
|||
|
Operating expenses:
|
|||||||
|
Selling, general and administrative
|
|
|
|
|
|||
|
Other charges
|
|
|
|
|
|||
|
Total operating expenses
|
|
|
|
|
|||
|
Operating income
|
|
|
|
|
|||
|
Interest expense, net
|
|
|
|
|
|||
|
Income before income taxes
|
|
|
|
|
|||
|
Income tax expense
|
|
|
|
|
|||
|
|
|
|
|
|
|||
|
Gain on sale, net of tax
|
|
|
|
|
|||
|
Income from discontinued operations
|
$
|
|
|
$
|
|
|
|
|
Note 4.
|
|
|
Assets acquired, net of cash:
|
|||
|
Receivables
|
$
|
|
|
|
Inventories
|
|
|
|
|
Other current assets
|
|
|
|
|
Property, plant and equipment
|
|
|
|
|
Intangible assets
|
|
|
|
|
Goodwill
|
|
|
|
|
Liabilities assumed:
|
|||
|
Accounts payable
|
|
|
|
|
Other current liabilities
|
|
|
|
|
Current and long term debt
|
|
|
|
|
Deferred income tax liability
|
|
|
|
|
Consideration paid
|
$
|
|
|
F- 12
|
Note 5.
|
|
Direct internal and external costs to develop software licensed by Technologies' customers are capitalized. Capitalized costs are amortized over the
6
-year estimated useful life of the software, beginning when the software is complete and ready for its intended use. At
September 30, 2018
, the remaining weighted-average amortization period for this software was
2.8
years. Amortization expense related to such software assets was
$
2.9
million
,
$
2.4
million
and
$
1.9
million
for
2018
,
2017
and
2016
, respectively. Amortization expense for each of the next five years is scheduled to be
$
3.5
million
in
2019
,
$
3.2
million
in
2020
,
$
2.5
million
in
2021
,
$
2.0
million
in
2022
and
$
1.5
million
in
2023
.
At
September 30, 2018
, the remaining weighted-average amortization period for the business combination-related finite-lived intangible assets was
6.8
years. Amortization expense related to these assets was
$
19.9
million
,
$
19.7
million
and
$
19.3
million
for
2018
,
2017
and
2016
, respectively. Amortization expense for each of the next five years is scheduled to be
$
20.7
million
in
2019
,
$
20.7
million
in
2020
,
$
20.6
million
in
2021
,
$
20.5
million
in
2022
and
$
20.5
million
in
2023
.
|
|
September 30,
|
||||||
|
|
2018
|
2017
|
|||||
|
|
(in millions)
|
||||||
|
Capitalized internal-use software:
|
|||||||
|
Cost
|
$
|
|
|
$
|
|
|
|
|
Accumulated amortization
|
(
|
)
|
(
|
)
|
|||
|
Net book value
|
|
|
|
|
|||
|
Business combination-related:
|
|||||||
|
Cost:
|
|||||||
|
Finite-lived intangible assets:
|
|||||||
|
Technology
|
|
|
|
|
|||
|
Customer relationships and other
|
|
|
|
|
|||
|
Indefinite-lived intangible assets:
|
|||||||
|
Trade names and trademarks
|
|
|
|
|
|||
|
Goodwill
|
|
|
|
|
|||
|
|
|
|
|
||||
|
Accumulated amortization:
|
|||||||
|
Technology
|
(
|
)
|
(
|
)
|
|||
|
Customer relationships and other
|
(
|
)
|
(
|
)
|
|||
|
(
|
)
|
(
|
)
|
||||
|
Net book value
|
|
|
|
|
|||
|
Total intangible assets net book value
|
$
|
|
|
$
|
|
|
|
|
Note 6.
|
|
|
2018
|
2017
|
2016
|
|||||||||
|
|
(in millions)
|
||||||||||
|
U.S.
|
$
|
|
|
$
|
|
|
$
|
|
|
||
|
Non-U.S.
|
(
|
)
|
(
|
)
|
(
|
)
|
|||||
|
Income before income taxes
|
$
|
|
|
$
|
|
|
$
|
|
|
||
On December 22, 2017, HR-1, commonly referred to as the Tax Cuts and Jobs Act (“Act”), was enacted, which made significant revisions to federal income tax laws, including lowering the corporate income tax rate to 21% from 35% effective January 1, 2018, overhauling the taxation of income earned outside the United States and eliminating or limiting certain
F- 13
deductions. Our deferred tax assets and liabilities are recorded at the enacted tax rates in effect when we expect to recognize the related tax expenses or benefits. The average of these rates varies slightly from year to year but historically has been approximately 39%. With the legislation changing rates taking place in the quarter ended December 31, 2017, we remeasured our deferred tax items at an average rate of approximately 25% and recorded an income tax benefit of
$
42.5
million
.
The Act also imposes a one-time transition tax on the undistributed, previously-untaxed, post-1986 foreign “earnings and profits” (as defined by the IRS) of certain U.S.-owned corporations. Determination of our transition tax liability requires us to calculate foreign earnings and profits going back to 1992 and then to assess our historical overall foreign loss position and the applicability of certain foreign tax credits. In March 2018, we recorded a provisional transition tax of
$
7.5
million
for the one-time deemed repatriation tax on accumulated foreign earnings of our foreign subsidiaries and will finalize the transition tax in December 2018. We have not provided income taxes for unrepatriated foreign earnings that may be subject to withholding tax or any outside basis differences inherent in our foreign subsidiaries, as these amounts continue to be indefinitely reinvested in foreign operations. The Company has a foreign tax credit carryforward of
$
4.5
million
that is not expected to be utilized prior to expiration.
|
2018
|
2017
|
2016
|
|||||||||
|
|
(in millions)
|
||||||||||
|
Current:
|
|||||||||||
|
U.S. federal
|
$
|
|
|
$
|
|
|
$
|
|
|
||
|
U.S. state and local
|
|
|
|
|
|
|
|||||
|
Non-U.S.
|
|
|
|
|
(
|
)
|
|||||
|
|
|
|
|
|
|
||||||
|
Deferred:
|
|||||||||||
|
U.S. federal
|
(
|
)
|
(
|
)
|
(
|
)
|
|||||
|
U.S. state and local
|
(
|
)
|
(
|
)
|
|
|
|||||
|
Non-U.S.
|
|
|
(
|
)
|
(
|
)
|
|||||
|
(
|
)
|
(
|
)
|
(
|
)
|
||||||
|
Income tax (benefit) expense
|
$
|
(
|
)
|
$
|
|
|
$
|
|
|
||
|
2018
|
2017
|
2016
|
|||||||||
|
(in millions)
|
|||||||||||
|
Expense at U.S. federal statutory income tax rates of 24.5%, 35% and 35%, respectively
|
$
|
|
|
$
|
|
|
$
|
|
|
||
|
Adjustments to reconcile to income tax expense:
|
|||||||||||
|
State income taxes, net of federal benefit
|
|
|
|
|
|
|
|||||
|
Domestic production activities deduction
|
(
|
)
|
(
|
)
|
(
|
)
|
|||||
|
Tax credits
|
(
|
)
|
(
|
)
|
(
|
)
|
|||||
|
Nondeductible expenses, other than compensation
|
|
|
|
|
|
|
|||||
|
Valuation allowances
|
|
|
|
|
|
|
|||||
|
Foreign income taxes
|
|
|
|
|
|
|
|||||
|
Nondeductible compensation
|
|
|
|
|
|
|
|||||
|
Excess tax benefits related to stock compensation
|
(
|
)
|
(
|
)
|
(
|
)
|
|||||
|
Federal tax rate change
|
(
|
)
|
(
|
)
|
|
|
|||||
|
Federal transition tax
|
|
|
|
|
|
|
|||||
|
Other
|
|
|
|
|
|
|
|||||
|
Income tax (benefit) expense
|
$
|
(
|
)
|
$
|
|
|
$
|
|
|
||
F- 14
|
|
September 30,
|
||||||
|
|
2018
|
2017
|
|||||
|
|
(in millions)
|
||||||
|
Deferred income tax assets:
|
|||||||
|
Inventory reserves
|
$
|
|
|
$
|
|
|
|
|
Accrued expenses
|
|
|
|
|
|||
|
Pension
|
|
|
|
|
|||
|
Stock-based compensation
|
|
|
|
|
|||
|
State net operating losses
|
|
|
|
|
|||
|
Federal credit carryovers
|
|
|
|
|
|||
|
Other
|
|
|
|
|
|||
|
|
|
|
|
||||
|
Valuation allowance
|
(
|
)
|
(
|
)
|
|||
|
Total deferred income tax assets, net of valuation allowance
|
|
|
|
|
|||
|
Deferred income tax liabilities:
|
|||||||
|
Intangible assets
|
|
|
|
|
|||
|
Pension
|
|
|
|
|
|||
|
Other
|
|
|
|
|
|||
|
Total deferred income tax liabilities
|
|
|
|
|
|||
|
Net deferred income tax liabilities
|
$
|
|
|
$
|
|
|
|
|
Balance sheet presentation:
|
|||||||
|
Deferred income taxes
|
$
|
|
|
$
|
|
|
|
|
Less deferred tax assets included in other noncurrent assets
|
|
|
|
|
|||
|
Net deferred income tax liabilities
|
$
|
|
|
$
|
|
|
|
We reevaluate the need for a valuation allowance against our deferred tax assets each quarter, considering results to date, projections of taxable income, tax planning strategies and reversing taxable temporary differences.
Our state net operating loss carryforwards, which expire between calendar years
2020
and
2033
, remain available to offset future taxable earnings.
|
2018
|
2017
|
||||||
|
|
(in millions)
|
||||||
|
Balance at beginning of year
|
$
|
|
|
$
|
|
|
|
|
Increases related to prior year positions
|
|
|
|
|
|||
|
Increases related to current year positions
|
|
|
|
|
|||
|
Decreases due to lapse in statute of limitations
|
(
|
)
|
(
|
)
|
|||
|
Balance at end of year
|
$
|
|
|
$
|
|
|
|
Substantially all unrecognized tax benefits would, if recognized, impact the effective tax rate. We recognize interest related to uncertain tax positions as interest expense and recognize any penalties incurred as a component of selling, general and administrative expenses. At
September 30, 2018
and
2017
, we had
$
0.6
million
and
$
0.7
million
, respectively, of accrued interest expense related to unrecognized tax benefits.
We expect to settle certain state income tax audits within the next 12 months and believe it is reasonably possible that these audit settlements will reduce the gross unrecognized tax benefits by
$
0.8
million
.
F- 15
The federal income tax returns for Mueller Co. and Anvil are closed for years prior to 2005 and for Mueller Water Products, Inc. for 2007 and 2008. Our 2009 through 2012 returns are closed except to the extent net operating losses from those years have been utilized on subsequent years’ returns. We also remain liable for any taxes related to periods prior to the sale of U.S. Pipe in 2012 pursuant to the terms of the sale agreement with the purchaser of the segment.
Certain tax years remain open for our predecessor company, U.S. Pipe, which was a subsidiary of Walter Energy in those years.
See Note 17.
|
Note 7.
|
|
|
|
September 30,
|
||||||
|
|
2018
|
2017
|
|||||
|
|
(in millions)
|
||||||
|
5.5% Senior Notes
|
$
|
|
|
$
|
|
|
|
|
ABL Agreement
|
|
|
|
|
|||
|
Term Loan
|
|
|
|
|
|||
|
Other
|
|
|
|
|
|||
|
|
|
|
|
||||
|
Deferred financing costs
|
(
|
)
|
(
|
)
|
|||
|
Less current portion
|
(
|
)
|
(
|
)
|
|||
|
Long-term debt
|
$
|
|
|
$
|
|
|
|
The scheduled maturities of all borrowings outstanding at
September 30, 2018
for each of the following years are.
$
0.7
million
in 2019,
$
0.6
million
in 2020,
$
0.3
million
in 2021,
$
0.0
million
in 2022 and
$
0.0
million
in 2023.
ABL Agreement
. Our asset based lending agreement (“ABL Agreement”) consists of a revolving credit facility for up to
$
175
million
of revolving credit borrowings, swing line loans and letters of credit. On July 19, 2018, we reduced our borrowing limit from
$
225
million
to
$
175
million
and wrote off a portion of the associated deferred financing costs, resulting in a loss on early extinguishment of debt of
$
0.3
million
. The ABL Agreement also permits us to increase the size of the credit facility by an additional
$
150
million
in certain circumstances. We may borrow up to
$
25
million
through swing line loans and may have up to
$
60
million
of letters of credit outstanding.
Borrowings under the ABL Agreement bear interest at a floating rate equal to LIBOR plus a margin ranging from
125
to
150
basis points, or a base rate, as defined in the ABL Agreement, plus a margin ranging from
25
to
50
basis points. At
September 30, 2018
the applicable rate was LIBOR plus
125
basis points.
The ABL Agreement terminates on
July 13, 2021
. We pay a commitment fee for any unused borrowing capacity under the ABL Agreement of
25
basis points per annum. Borrowings are not subject to financial maintenance covenants unless excess availability is less than the greater of
$
17.5
million
and
10
%
of the Loan Cap as defined in the ABL Agreement. Excess availability based on
September 30, 2018
data, as reduced by outstanding letters of credit and accrued fees and expenses of
$
18.3
million
, was approximately
$
125
million
.
5.5% Senior Unsecured Notes.
On
June 12, 2018
, we privately issued
$
450.0
million
of 5.5% Senior Unsecured Notes (“Notes”), which mature in June 2026 and bear interest at
5.5
%
. We capitalized
$
6.6
million
of financing costs, which are being amortized over the term of the Notes using the effective interest rate method. Proceeds from the Notes, along with other cash, were used to repay our Term Loan. Substantially all of our U.S. Subsidiaries guarantee the Notes, which are subordinate to borrowings under the ABL. Based on quoted market prices, the outstanding Notes had a fair value of
$
452.3
million
at
September 30, 2018
.
An indenture securing the Notes (“Indenture”) contains customary covenants and events of default, including covenants that limit our ability to incur debt, pay dividends, and make investments. We believe we were compliant with these covenants at
September 30, 2018
and expect to remain in compliance through September 30, 2019.
F- 16
We may redeem some or all of the Notes at any time or from time to time prior to
June 15, 2021
at certain “make-whole” redemption prices (as set forth in the Indenture) and on or after
June 15, 2021
at specified redemption prices (as set forth in the Indenture). Additionally, we may redeem up to
40%
of the aggregate principal amount of the Notes at any time or from time to time prior to
June 15, 2021
with the net proceeds of specified equity offerings at specified redemption prices (as set forth in the Indenture). Upon a change of control (as defined in the Indenture), we will be required to make an offer to purchase the Notes at a price equal to
101%
of the outstanding principal amount of the Notes.
|
Note 8.
|
|
Prior to the June 15, 2018 retirement of our Term Loan, we were exposed to interest rate risk that we managed to some extent using derivative instruments. We terminated these instruments in conjunction with the retirement of the Term Loan. Under our interest rate swap contracts, we received interest calculated using 3-month LIBOR, subject to a floor of
0.750
%
, and paid fixed interest at
2.341
%
, on an aggregate notional amount of
$
150.0
million
. These swap contracts effectively fixed the cash interest rate on
$
150.0
million
of our borrowings under the Term Loan at
4.841
%
through
September 30, 2021
.
We had designated our interest rate swap contracts as cash flow hedges of our future interest payments and elected to apply the “shortcut” method of assessing hedge effectiveness. As a result, the gains and losses on the swap contracts had been reported as a component of other comprehensive loss and were reclassified into interest expense as the related interest payments were made.
Upon termination of the interest rate swaps, we reclassified all associated amounts from accumulated other comprehensive loss to earnings, which resulted in a cash gain of
$
2.4
million
in June 2018.
In connection with the acquisition of Singer Valve discussed in
Note 4.
,we loaned funds to one of our Canadian subsidiaries. Although this intercompany loan has no direct effect on our consolidated financial statements, it creates exposure to currency risk for the Canadian subsidiary. To reduce this exposure, we entered into a U.S. dollar-Canadian dollar swap contract with the Canadian subsidiary and an offsetting Canadian dollar-U.S. dollar swap with a domestic bank. We have not designated these swaps as hedges and the changes in their fair value are included in earnings, where they offset the currency gains and losses associated with the intercompany loan.
|
September 30,
|
|||||||
|
2018
|
2017
|
||||||
|
(in millions)
|
|||||||
|
Interest rate swap contracts, designated as cash flow hedges:
|
|||||||
|
Other current liabilities
|
$
|
|
|
$
|
|
|
|
|
Other noncurrent liabilities
|
|
|
|
|
|||
|
$
|
|
|
$
|
|
|
||
|
Currency swap contracts, not designated as hedges:
|
|||||||
|
Other noncurrent liabilities
|
$
|
|
|
$
|
|
|
|
The fair values and the classification of the fair values between current and noncurrent portions are based on calculated cash flows using publicly available interest rate forward rate yield curve information, but amounts due at the actual settlement dates are dependent on actual rates in effect at the settlement dates and may differ significantly from amounts shown above.
F- 17
|
Note 9.
|
|
We have various pension plans (“Pension Plans”), which we fund in accordance with their requirements and, where applicable, in amounts sufficient to satisfy the minimum funding requirements of applicable laws. The Pension Plans provide benefits based on years of service and compensation or at stated amounts for each year of service. The measurement date for all Pension Plans was September 30. Our U.S. pension plan (“Plan”) comprised
98
%
of the Pension Plans’ obligations and
98
%
of the Pension Plans’ assets at
September 30, 2018
.
We did not contribute to the Plan in 2018 and do not anticipate contributing to the Plan in 2019. We plan to contribute
$
1.2
million
to Canadian pension plans in
2019
.
During 2018, with a recently negotiated labor contract, a group of our collectively bargained employees are no longer accruing benefits under a multi-employer pension plan. The affected employees are now participants in our defined contribution retirement plan with an employer match and one-time contribution vesting over the next three years of
$
0.4
million
. We expect to withdraw from this multi-employer pension plan.
During 2016, the Plan completed a pension obligation settlement program targeting vested, terminated participants not yet receiving benefits. Approximately
75%
of eligible participants accepted settlement offers. The Plan distributed assets totaling
$
58.5
million
. We incurred a non-cash pension settlement charge of
$
16.6
million
as a result of the program, which had an immaterial impact on the Plan’s funded ratio.
|
|
2018
|
2017
|
2016
|
||||||||
|
|
(in millions)
|
||||||||||
|
Service cost
|
$
|
|
|
$
|
|
|
$
|
|
|
||
|
Components of net periodic benefit cost excluded from operating income following adoption of ASU 2017-07:
|
|||||||||||
|
Interest cost
|
|
|
|
|
|
|
|||||
|
Expected return on plan assets
|
(
|
)
|
(
|
)
|
(
|
)
|
|||||
|
Amortization of actuarial net loss
|
|
|
|
|
|
|
|||||
|
Pension settlement
|
|
|
|
|
|
|
|||||
|
Other
|
|
|
|
|
|
|
|||||
|
Pension costs other than service
|
|
|
|
|
|
|
|||||
|
Net periodic benefit cost
|
$
|
|
|
$
|
|
|
$
|
|
|
||
|
|
September 30,
|
||||||
|
|
2018
|
2017
|
|||||
|
|
(in millions)
|
||||||
|
Projected benefit obligations
|
$
|
|
|
$
|
|
|
|
|
Accumulated benefit obligations
|
|
|
|
|
|||
|
Fair value of plan assets
|
|
|
|
|
|||
F- 18
Balance sheet information for Pension Plans with accumulated benefit obligations less than plan assets is presented below.
|
|
September 30,
|
||||||
|
|
2018
|
2017
|
|||||
|
|
(in millions)
|
||||||
|
Projected benefit obligations
|
$
|
|
|
$
|
|
|
|
|
Accumulated benefit obligations
|
|
|
|
|
|||
|
Fair value of plan assets
|
|
|
|
|
|||
|
Balance at beginning of year
|
$
|
|
|
|
Actuarial gain
|
(
|
)
|
|
|
Prior year actuarial loss amortization to net periodic cost
|
(
|
)
|
|
|
Balance at end of year
|
$
|
|
|
We amortize amounts in accumulated other comprehensive loss representing unrecognized prior year service cost and unrecognized loss related to the Pension Plans over the weighted average life expectancy of their inactive participants. Actuarial gains and losses are amortized using a corridor approach. The gain/loss corridor is equal to ten percent of the greater of the benefit obligation and the market-related value of assets. Gains and losses in excess of the corridor are generally amortized over the average remaining lifetime of the plan participants.
We expect to amortize
$
2.0
million
of unrecognized loss into net periodic benefit cost from accumulated other comprehensive loss in
2019
.
The discount rates for determining the present value of pension obligations were selected using a “bond settlement” approach, which constructs a hypothetical bond portfolio that could be purchased such that the coupon payments and maturity values could be used to satisfy the projected benefit payments. The discount rate is the equivalent rate that results in the present value of the projected benefit payments equaling the market value of this bond portfolio. Only high quality (AA graded or higher), non-callable corporate bonds are included in this bond portfolio. We rely on the Pension Plans’ actuaries to assist in the development of the discount rate model.
The expected returns on plan assets were determined with the assistance of the Pension Plans’ actuaries and investment consultants. Expected returns on plan assets were developed using forward looking returns over a time horizon of
10
to
15
years for major asset classes along with projected risk and historical correlations.
|
|
Pension Plans
|
|||||||
|
|
2018
|
2017
|
2016
|
|||||
|
Weighted average used to determine benefit obligations:
|
||||||||
|
Discount rate
|
|
%
|
|
%
|
|
%
|
||
|
Weighted average used to determine net periodic cost:
|
||||||||
|
Discount rate
|
|
%
|
|
%
|
|
%
|
||
|
Expected return on plan assets
|
|
%
|
|
%
|
|
%
|
||
F- 19
|
|
Pension Plans
|
||||||
|
|
2018
|
2017
|
|||||
|
|
(in millions)
|
||||||
|
Projected benefit obligations:
|
|||||||
|
Beginning of year
|
$
|
|
|
$
|
|
|
|
|
Service cost
|
|
|
|
|
|||
|
Interest cost
|
|
|
|
|
|||
|
Actuarial gain
|
(
|
)
|
(
|
)
|
|||
|
Benefits paid
|
(
|
)
|
(
|
)
|
|||
|
Currency translation
|
(
|
)
|
|
|
|||
|
Decrease in obligation due to curtailment / settlement
|
|
|
|
|
|||
|
End of year
|
$
|
|
|
$
|
|
|
|
|
Accumulated benefit obligations at end of year
|
$
|
|
|
$
|
|
|
|
|
Plan assets:
|
|||||||
|
Beginning of year
|
$
|
|
|
$
|
|
|
|
|
Actual return on plan assets
|
|
|
|
|
|||
|
Employer contributions
|
|
|
|
|
|||
|
Currency translation
|
(
|
)
|
|
|
|||
|
Benefits paid
|
(
|
)
|
(
|
)
|
|||
|
Other
|
(
|
)
|
(
|
)
|
|||
|
End of year
|
$
|
|
|
$
|
|
|
|
|
Accrued benefit cost at end of year:
|
|||||||
|
Funded (unfunded) status
|
$
|
|
|
$
|
(
|
)
|
|
|
Recognized on balance sheet:
|
|||||||
|
Other noncurrent assets
|
$
|
|
|
$
|
|
|
|
|
Other current liabilities
|
(
|
)
|
(
|
)
|
|||
|
Other noncurrent liabilities
|
|
|
(
|
)
|
|||
|
$
|
|
|
$
|
(
|
)
|
||
|
Recognized in accumulated other comprehensive loss, before tax:
|
|||||||
|
Prior year service cost
|
$
|
|
|
$
|
|
|
|
|
Net actuarial loss
|
|
|
|
|
|||
|
$
|
|
|
$
|
|
|
||
We maintain a single trust that holds the assets of the U.S. pension plan. For most of 2016, the strategic asset allocation was about
40
%
equity investments. Near the end of 2016, we directed our investment manager to adjust the asset allocation to about
30
%
equity investments. Near the end of 2017, we directed our investment manager to adjust the asset allocation to about
20
%
equity investments.
|
Strategic asset allocation
|
Actual asset allocations at
|
||||||||||||||||
|
|
September 30,
|
||||||||||||||||
|
|
Tactical range
|
2018
|
2017
|
2016
|
|||||||||||||
|
Fixed income investments
|
|
%
|
|
|
%
|
|
%
|
|
%
|
|
%
|
||||||
|
Equity investments
|
|
|
|
-
|
|
%
|
|
|
|
|
|
|
|||||
|
Cash
|
|
|
|
-
|
|
%
|
|
|
|
|
|
|
|||||
|
|
%
|
|
%
|
|
%
|
|
%
|
||||||||||
F- 20
The assets of the Pension Plans are primarily invested in investment trusts valued at net asset value, which in turn hold fixed income and equity investments. The valuation methodologies used to measure the assets of the Pension Plans at fair value are:
|
•
|
Fixed income fund investments held by the investment trusts are valued using the closing price reported in the active market in which the investment is traded or based on yields currently available on comparable securities of issuers with similar credit ratings;
|
|
•
|
Equity investments held by the investment trusts are valued using the closing price reported on the active market when reliable market quotations are readily available. When market quotations are not readily available, these assets are valued by a method the trustees believe accurately reflects fair value; and
|
|
•
|
Mutual funds are valued at the closing price reported on the active market.
|
The assets of the Pension Plans by level within the fair value hierarchy are presented below.
|
September 30, 2018
|
|||||||||||
|
Level 1
|
Level 2
|
Total
|
|||||||||
|
|
(in millions)
|
||||||||||
|
Fixed income
|
$
|
|
|
$
|
|
|
$
|
|
|
||
|
Equity:
|
|||||||||||
|
Large cap stocks:
|
|||||||||||
|
Large cap index funds
|
|
|
|
|
|
|
|||||
|
Mid cap stocks:
|
|||||||||||
|
Mid cap index funds
|
|
|
|
|
|
|
|||||
|
Small cap stocks:
|
|||||||||||
|
Small cap growth funds
|
|
|
|
|
|
|
|||||
|
International stocks:
|
|||||||||||
|
Mutual funds
|
|
|
|
|
|
|
|||||
|
International funds
|
|
|
|
|
|
|
|||||
|
Total equity
|
|
|
|
|
|
|
|||||
|
Cash and cash equivalents
|
|
|
|
|
|
|
|||||
|
$
|
|
|
|
$
|
|
|
$
|
|
|
||
F- 21
|
September 30, 2017
|
|||||||||||
|
Level 1
|
Level 2
|
Total
|
|||||||||
|
|
(in millions)
|
||||||||||
|
Fixed income
|
$
|
|
|
$
|
|
|
$
|
|
|
||
|
Equity:
|
|||||||||||
|
Large cap stocks:
|
|||||||||||
|
Large cap growth funds
|
$
|
|
|
$
|
|
|
$
|
|
|
||
|
Mid cap stocks:
|
|||||||||||
|
Mid cap index funds
|
|
|
|
|
|
|
|||||
|
Small cap stocks:
|
|||||||||||
|
Small cap growth funds
|
|
|
|
|
|
|
|||||
|
International stocks:
|
|||||||||||
|
Mutual funds
|
|
|
|
|
|
|
|||||
|
International funds
|
|
|
|
|
|
|
|||||
|
Total equity
|
|
|
|
|
|
|
|||||
|
Cash and cash equivalents
|
|
|
|
|
|
|
|||||
|
$
|
|
|
$
|
|
|
$
|
|
|
|||
|
2019
|
$
|
|
|
|
2020
|
|
|
|
|
2021
|
|
|
|
|
2022
|
|
|
|
|
2023
|
|
|
|
|
2024-2028
|
|
|
|
F- 22
|
Note 10.
|
|
|
Shares outstanding at September 30, 2015
|
|
|
|
Vesting of restricted stock units, net of shares withheld for taxes
|
|
|
|
Exercise of stock options
|
|
|
|
Exercise of employee stock purchase plan instruments
|
|
|
|
Settlement of performance-based restricted stock units, net of shares withheld for taxes
|
|
|
|
Shares outstanding at September 30, 2016
|
|
|
|
Vesting of restricted stock units, net of shares withheld for taxes
|
|
|
|
Exercise of stock options
|
|
|
|
Exercise of employee stock purchase plan instruments
|
|
|
|
Settlement of performance-based restricted stock units, net of shares withheld for taxes
|
|
|
|
Stock repurchased under buyback program
|
(
|
)
|
|
Shares outstanding at September 30, 2017
|
|
|
|
Vesting of restricted stock units, net of shares withheld for taxes
|
|
|
|
Exercise of stock options
|
|
|
|
Exercise of employee stock purchase plan instruments
|
|
|
|
Settlement of performance-based restricted stock units, net of shares withheld for taxes
|
|
|
|
Stock repurchased under buyback program
|
(
|
)
|
|
Other
|
(
|
)
|
|
Shares outstanding at September 30, 2018
|
|
|
|
Note 11.
|
|
|
2018
|
2017
|
2016
|
|||||||||
|
|
(in millions, except per share data)
|
||||||||||
|
Decrease in operating income
|
$
|
|
|
$
|
|
|
$
|
|
|
||
|
Decrease in net income
|
|
|
|
|
|
|
|||||
|
Decrease in earnings per basic share
|
|
|
|
|
|
|
|||||
|
Decrease in earnings per diluted share
|
|
|
|
|
|
|
|||||
We excluded
214,435
,
238,826
and
867,065
instruments from the calculation of diluted earnings per share for
2018
,
2017
and
2016
, respectively, because the effect of including them would have been antidilutive.
At
September 30, 2018
, there was approximately
$
5.1
million
of unrecognized compensation expense related to stock-based awards not yet vested. We expect to recognize this expense over a weighted average life of approximately
1.37
years.
The Mueller Water Products, Inc. 2006 Stock Incentive Plan (“2006 Plan”) authorizes an aggregate of
20,500,000
shares of common stock that may be granted through the issuance of stock-based awards. Any awards canceled are available for reissuance. Generally, all of our employees and members of our board of directors are eligible to participate in the 2006 Plan. At
September 30, 2018
,
7,410,033
shares of common stock were available for future grants of awards under the 2006 Plan. This total assumes that the maximum number of shares will be earned for awards for which the final number of shares to be earned has not yet been determined.
An award granted under the 2006 Plan vests at such times and in such installments as set by the Compensation and Human Resources Committee of the board of directors, but no award will be exercisable after the
10
-year anniversary of the date on which it is granted. Management expects some instruments will be forfeited prior to vesting. Grants to members of our board of the directors are expected to vest fully. Based on historical forfeitures, we expect grants to others to be forfeited at an annual rate of
2
%
.
F- 23
Restricted Stock Units.
Depending on the specific terms of each award, restricted stock units generally vest ratably over the life of the award, usually
3
years, on each anniversary date of the original grant. Compensation expense for restricted stock units is recognized between the grant date and the vesting date (or the date on which a participant becomes Retirement-eligible, if sooner) on a straight-line basis for each tranche of each award. Fair values of restricted stock units are determined using the closing price of our common stock on the respective dates of grant.
Restricted stock unit activity under the 2006 Plan is summarized below.
|
Restricted stock units
|
Weighted
average
grant date fair value per unit
|
Weighted
average
remaining
contractual
term (years)
|
Aggregate
intrinsic
value
(millions)
|
|||||||||
|
Outstanding at September 30, 2015
|
|
|
$
|
|
|
|
||||||
|
Granted
|
|
|
|
|
||||||||
|
Vested
|
(
|
)
|
|
|
$
|
|
|
|||||
|
Cancelled
|
(
|
)
|
|
|
||||||||
|
Outstanding at September 30, 2016
|
|
|
|
|
|
|||||||
|
Granted
|
|
|
|
|
||||||||
|
Vested
|
(
|
)
|
|
|
|
|
||||||
|
Cancelled
|
(
|
)
|
|
|
||||||||
|
Outstanding at September 30, 2017
|
|
|
|
|
|
|||||||
|
Granted
|
|
|
|
|
||||||||
|
Vested
|
(
|
)
|
|
|
|
|
||||||
|
Cancelled
|
(
|
)
|
|
|
||||||||
|
Outstanding at September 30, 2018
|
|
|
|
|
|
|||||||
Performance Shares.
Performance-based restricted stock units (“PRSUs”) represent a target number of units that may be paid out at the end of a multi-year award cycle consisting of annual performance periods coinciding with our fiscal years. As determined at the date of award, PRSUs may settle in cash-value equivalent of, or directly in, shares of our common stock. Settlement will range from
zero
to
two
times the number of PRSUs granted, depending on our financial performance against predetermined targets. The Compensation and Human Resources Committee of our board of directors (“Committee”) establishes performance goals within 90 days of the beginning of each performance period, with such date referred to as the “grant date”. At the end of each annual performance period, the Committee confirms performance against the applicable performance targets. PRSUs do not convey voting rights or earn dividends. PRSUs vest on the last day of an award cycle, unless vested sooner due to a “Change of Control” of the Company, or the death, disability or Retirement of a participant.
F- 24
We recognize compensation expense for stock-settled PRSUs starting on the first day of the applicable performance period and ending on the respective vesting dates. We base the recognized compensation expense upon the number of units awarded for each performance period, the closing price of our common stock on the grant date and the estimated performance factor. In 2018 and 2017,
146,061
shares and
263,410
shares, respectively, vested related to PRSUs.
Stock-settled PRSUs activity under the 2006 Plan is summarized below.
|
Award date
|
Settlement year
|
Performance period
|
Grant date per unit fair value
|
Units
awarded
|
Units forfeited
|
Net units
|
Performance factor
|
Shares
earned
|
||||||||||||||
|
December 3, 2013
|
2017
|
2014
|
$
|
|
|
|
|
(
|
)
|
|
|
|
|
|
||||||||
|
2015
|
$
|
|
|
|
|
(
|
)
|
|
|
|
|
|
||||||||||
|
2016
|
$
|
|
|
|
|
(
|
)
|
|
|
|
|
|
||||||||||
|
December 2, 2014
|
2018
|
2015
|
$
|
|
|
|
|
(
|
)
|
|
|
|
|
|
||||||||
|
2016
|
$
|
|
|
|
|
(
|
)
|
|
|
|
|
|
||||||||||
|
2017
|
$
|
|
|
|
|
(
|
)
|
|
|
|
|
|
||||||||||
|
December 1, 2015
|
2019
|
2016
|
$
|
|
|
|
|
(
|
)
|
|
|
|
|
|
||||||||
|
2017
|
$
|
|
|
|
|
(
|
)
|
|
|
|
|
|
||||||||||
|
2018
|
$
|
|
|
|
|
(
|
)
|
|
|
|
|
|
||||||||||
|
November 29, 2016
|
2020
|
2017
|
$
|
|
|
|
|
(
|
)
|
|
|
|
|
|
||||||||
|
2018
|
$
|
|
|
|
|
(
|
)
|
|
|
|
|
|
||||||||||
|
2019
|
|
|
(
|
)
|
|
|
||||||||||||||||
|
January 23, 2017
|
2020
|
2017
|
$
|
|
|
|
|
|
|
|
|
|
|
|
||||||||
|
2018
|
$
|
|
|
|
|
|
|
|
|
|
|
|
||||||||||
|
2019
|
|
|
|
|
|
|
||||||||||||||||
|
November 28, 2017
|
2021
|
2018
|
$
|
|
|
|
|
|
|
|
|
|
|
|
||||||||
|
2019
|
|
|
|
|
|
|
||||||||||||||||
|
2020
|
|
|
|
|
|
|
||||||||||||||||
Stock Options.
Stock options generally vest ratably over
3
years on each anniversary date of the original grant. Stock options granted since November 2007 also vest upon the Retirement of a participant. Compensation expense for stock options is recognized between the grant date and the vesting date (or the date on which a participant becomes Retirement-eligible, if sooner) on a straight-line basis for each tranche of each award. No stock options were granted since 2015.
|
Options
|
Weighted
average
exercise
price
per option
|
Weighted
average
remaining
contractual
term (years)
|
Aggregate
intrinsic
value
(millions)
|
|||||||||
|
Outstanding at September 30, 2015
|
|
|
$
|
|
|
|
$
|
|
|
|||
|
Exercised
|
(
|
)
|
|
|
|
|
||||||
|
Cancelled
|
(
|
)
|
|
|
||||||||
|
Outstanding at September 30, 2016
|
|
|
|
|
|
|
|
|||||
|
Exercised
|
(
|
)
|
|
|
|
|
||||||
|
Cancelled
|
(
|
)
|
|
|
||||||||
|
Outstanding at September 30, 2017
|
|
|
|
|
|
|
|
|||||
|
Exercised
|
(
|
)
|
|
|
|
|
||||||
|
Cancelled
|
|
|
|
|
||||||||
|
Outstanding at September 30, 2018
|
|
|
$
|
|
|
|
$
|
|
|
|||
|
Exercisable at September 30, 2018
|
|
|
$
|
|
|
|
$
|
|
|
|||
F- 25
Stock option exercise prices are equal to the closing price of our common stock on the relevant grant date.
|
Exercise price
|
Options
|
Weighted
average
exercise price
|
Weighted
average
remaining
contractual
term (years)
|
Exercisable options
|
Weighted
average
exercise price
|
|||||||||||||||||||
|
$
|
|
|
-
|
$
|
|
|
|
|
$
|
|
|
|
|
|
$
|
|
|
|||||||
|
$
|
|
|
-
|
$
|
|
|
|
|
|
|
|
|
|
|
|
|||||||||
|
|
|
$
|
|
|
|
|
|
$
|
|
|
||||||||||||||
Employee Stock Purchase Plan.
The Mueller Water Products, Inc. 2006 Employee Stock Purchase Plan (“ESPP”) authorizes the sale of up to
5,800,000
shares of our common stock to employees. Generally, all full-time, active employees are eligible to participate in the ESPP, subject to certain restrictions. Employee purchases are funded through payroll deductions, and any excess payroll withholdings are returned to the employee. The price for shares purchased under the ESPP is
85
%
of the lower of the closing price on the first day or the last day of the offering period. At
September 30, 2018
,
2,750,935
shares were available for issuance under the ESPP.
Phantom Plan.
Under the Mueller Water Products, Inc. Phantom Plan adopted in 2012 (“Phantom Plan”), we have awarded “phantom units” to certain non-officer employees. A phantom unit settles in cash equal to the price of one share of our common stock on the vesting date. Phantom units vest ratably over
3
years on each anniversary date of the original grant. We recognize compensation expense for phantom units on a straight-line basis for each tranche of each award based on the closing price of our common stock at each balance sheet date. The outstanding phantom units had a fair value of
$
11.51
per unit at
September 30, 2018
and our accrued liability for such units was
$
3.0
million
.
|
Phantom
Plan units
|
Weighted
average
grant date
fair value
per unit
|
Weighted
average
remaining
contractual
term (years)
|
Aggregate
intrinsic
value
(millions)
|
|||||||||
|
Outstanding at September 30, 2015
|
|
|
$
|
|
|
|
||||||
|
Granted
|
|
|
|
|
||||||||
|
Vested
|
(
|
)
|
$
|
|
|
|||||||
|
Cancelled
|
(
|
)
|
|
|
||||||||
|
Outstanding at September 30, 2016
|
|
|
|
|
|
|||||||
|
Granted
|
|
|
|
|
||||||||
|
Vested
|
(
|
)
|
|
|
||||||||
|
Cancelled
|
(
|
)
|
|
|
||||||||
|
Outstanding at September 30, 2017
|
|
|
|
|
|
|||||||
|
Granted
|
|
|
|
|
||||||||
|
Vested
|
(
|
)
|
|
|
||||||||
|
Cancelled
|
(
|
)
|
|
|
||||||||
|
Outstanding at September 30, 2018
|
|
|
|
|
|
|||||||
F- 26
|
Note 12.
|
|
|
|
September 30,
|
||||||
|
|
2018
|
2017
|
|||||
|
|
(in millions)
|
||||||
|
Inventories:
|
|||||||
|
Purchased components and raw material
|
$
|
|
|
$
|
|
|
|
|
Work in process
|
|
|
|
|
|||
|
Finished goods
|
|
|
|
|
|||
|
$
|
|
|
$
|
|
|
||
|
Other current assets:
|
|||||||
|
Maintenance and repair tooling
|
$
|
|
|
$
|
|
|
|
|
Income taxes
|
|
|
|
|
|||
|
Other
|
|
|
|
|
|||
|
$
|
|
|
$
|
|
|
||
|
Property, plant and equipment:
|
|||||||
|
Land
|
$
|
|
|
$
|
|
|
|
|
Buildings
|
|
|
|
|
|||
|
Machinery and equipment
|
|
|
|
|
|||
|
Construction in progress
|
|
|
|
|
|||
|
$
|
|
|
$
|
|
|
||
|
Accumulated depreciation
|
(
|
)
|
(
|
)
|
|||
|
$
|
|
|
$
|
|
|
||
|
Other current liabilities:
|
|||||||
|
Compensation and benefits
|
$
|
|
|
$
|
|
|
|
|
Customer rebates
|
|
|
|
|
|||
|
Taxes other than income taxes
|
|
|
|
|
|||
|
Warranty
|
|
|
|
|
|||
|
Environmental
|
|
|
|
|
|||
|
Income taxes
|
|
|
|
|
|||
|
Interest
|
|
|
|
|
|||
|
Restructuring
|
|
|
|
|
|||
|
Other
|
|
|
|
|
|||
|
$
|
|
|
$
|
|
|
||
|
Note 13.
|
|
On September 7, 2017, we announced a strategic reorganization plan designed to accelerate our product innovation and revenue growth. We have adopted a matrix management structure, where business teams have line and cross-functional responsibility for managing distinct product portfolios. Engineering, operations, sales and marketing and other functions were centralized to better align with business needs and generate greater efficiencies. We recorded
$
4.6
million
in other charges primarily for severance related to this strategic reorganization plan in 2018, of which
$
0.9
million
was accrued at September 30, 2018. This plan is substantially complete.
During the quarter ended June 30, 2016, we initiated certain demolition and related activities for our Statesboro, Georgia property, some of the costs of which are indemnified by Tyco as explained in
Note 17.
Corporate recorded a receivable from Tyco for our estimated recovery under the indemnification and a net charge of
$
4.1
million
under the caption other charges in 2016.
F- 27
|
2018
|
2017
|
2016
|
|||||||||
|
(in millions)
|
|||||||||||
|
Included in selling, general and administrative expenses:
|
|||||||||||
|
Research and development
|
$
|
|
|
$
|
|
|
$
|
|
|
||
|
Advertising
|
$
|
|
|
$
|
|
|
$
|
|
|
||
|
Interest expense, net:
|
|||||||||||
|
Term Loan
|
$
|
|
|
$
|
|
|
$
|
|
|
||
|
Deferred financing costs amortization
|
|
|
|
|
|
|
|||||
|
ABL Agreement
|
|
|
|
|
|
|
|||||
|
Interest rate swap contracts
|
|
|
|
|
|
|
|||||
|
5.5% Senior Notes
|
|
|
|
|
|
|
|||||
|
Other interest expense
|
|
|
|
|
|
|
|||||
|
|
|
|
|
|
|
||||||
|
Interest income
|
(
|
)
|
(
|
)
|
(
|
)
|
|||||
|
$
|
|
|
$
|
|
|
$
|
|
|
|||
|
Note 14.
|
|
|
Foreign currency translation
|
Pension liability, net of tax
|
Derivative instruments, net of tax
|
Total
|
||||||||||||
|
(in millions)
|
|||||||||||||||
|
Balance at September 30, 2017
|
$
|
(
|
)
|
$
|
(
|
)
|
$
|
(
|
)
|
$
|
(
|
)
|
|||
|
Other comprehensive income before reclassifications
|
(
|
)
|
|
|
|
|
|
|
|||||||
|
Amounts reclassified out of accumulated other comprehensive loss
|
|
|
|
|
|
|
|
|
|||||||
|
Other comprehensive income
|
(
|
)
|
|
|
|
|
|
|
|||||||
|
Balance at September 30, 2018
|
$
|
(
|
)
|
$
|
(
|
)
|
$
|
|
|
$
|
(
|
)
|
|||
|
Note 15.
|
|
|
September 30,
|
|||||||||||
|
2018
|
2017
|
2016
|
|||||||||
|
|
(in millions)
|
||||||||||
|
Cash paid, net:
|
|||||||||||
|
Interest
|
$
|
|
|
$
|
|
|
$
|
|
|
||
|
Income taxes
|
$
|
|
|
$
|
|
|
$
|
|
|
||
|
Note 16.
|
|
Our operations consist of
two
business segments: Infrastructure (previously referred to as “Mueller Co.”) and Technologies (previously referred to as “Mueller Technologies”). These segments are organized primarily based on products sold and customers served and are consistent with how the segments are managed, how resources are allocated and how information is used by the chief operating decision maker. Infrastructure manufactures valves for water and gas systems including butterfly, iron gate, tapping, check, knife, plug, automatic control and ball valves and dry-barrel and wet-barrel fire hydrants. Technologies offers metering, leak detection, pipe condition assessment and other products and services for the water infrastructure industry.
Segment results are not reflective of their results on a stand-alone basis. Intersegment sales and transfers are made at selling prices generally intended to cover costs. Infrastructure personnel provide certain administrative services, including management of accounts payable and accounts receivable, without any allocation of cost to Technologies. We do not believe the costs of such administrative services are material to the segments’ results. The determination of segment results excludes certain corporate expenses designated as Corporate because they are not directly attributable to segment operations. Interest expense, loss on early extinguishment of debt and income taxes are not allocated to the segments. Corporate expenses include those costs incurred by our corporate function, such as accounting, treasury, risk management, human resources, legal, tax and other administrative functions and also costs associated with assets and liabilities retained following the sales of U.S. Pipe and Anvil. Corporate assets principally consist of our cash, Anvil assets held for sale at
September 30, 2017
and certain real property previously owned by U.S. Pipe and Anvil. Business segment assets consist primarily of receivables, inventories, property, plant and equipment, intangible assets and other noncurrent assets.
|
United States
|
Canada
|
Other
|
Total
|
||||||||||||
|
|
(in millions)
|
||||||||||||||
|
Net sales:
|
|||||||||||||||
|
2018
|
$
|
|
|
$
|
|
|
$
|
|
|
$
|
|
|
|||
|
2017
|
|
|
|
|
|
|
|
|
|||||||
|
2016
|
|
|
|
|
|
|
|
|
|||||||
|
Property, plant and equipment, net:
|
|||||||||||||||
|
September 30, 2018
|
$
|
|
|
$
|
|
|
$
|
|
|
$
|
|
|
|||
|
September 30, 2017
|
|
|
|
|
|
|
|
|
|||||||
Approximately
54
%
of our
2018
gross sales were to our
10
largest customers, and approximately
34
%
of our
2018
gross sales were to our
two
largest customers, Ferguson Enterprises, Inc. (“Ferguson Enterprises”) and Core & Main LP. (“Core & Main)”). Sales to Ferguson Enterprises comprised approximately
19
%
,
18
%
and
17
%
of our total gross sales during
2018
,
2017
and
2016
, respectively. In
2018
, Ferguson Enterprises accounted for approximately
18
%
and
28
%
of gross sales for Infrastructure and Technologies, respectively. Receivables from Ferguson Enterprises totaled
$
29.7
million
and
$
20.0
million
at
September 30, 2018
and
2017
, respectively. Sales to Core & Main comprised approximately
15
%
,
16
%
and
16
%
of our total gross sales during
2018
,
2017
, and
2016
, respectively. In
2018
, Core & Main accounted for approximately
17
%
of gross sales for Infrastructure. Receivables from Core & Main totaled
$
31.7
million
and
$
27.3
million
at
September 30, 2018
and
2017
, respectively.
F- 28
|
Infrastructure
|
Technologies
|
Corporate
|
Total
|
||||||||||||
|
|
(in millions)
|
||||||||||||||
|
Net sales, excluding intercompany:
|
|||||||||||||||
|
2018
|
$
|
|
|
$
|
|
|
$
|
|
|
$
|
|
|
|||
|
2017
|
|
|
|
|
|
|
|
|
|||||||
|
2016
|
|
|
|
|
|
|
|
|
|||||||
|
Intercompany sales:
|
|||||||||||||||
|
2018
|
$
|
|
|
$
|
|
|
$
|
|
|
$
|
|
|
|||
|
2017
|
|
|
|
|
|
|
|
|
|||||||
|
2016
|
|
|
|
|
|
|
|
|
|||||||
|
Operating income (loss):
|
|||||||||||||||
|
2018
|
$
|
|
|
$
|
(
|
)
|
$
|
(
|
)
|
$
|
|
|
|||
|
2017
|
|
|
(
|
)
|
(
|
)
|
|
|
|||||||
|
2016
|
|
|
(
|
)
|
(
|
)
|
|
|
|||||||
|
Depreciation and amortization:
|
|||||||||||||||
|
2018
|
$
|
|
|
$
|
|
|
$
|
|
|
$
|
|
|
|||
|
2017
|
|
|
|
|
|
|
|
|
|||||||
|
2016
|
|
|
|
|
|
|
|
|
|||||||
|
Total pension settlement and other charges:
|
|||||||||||||||
|
2018
|
$
|
|
|
$
|
|
|
$
|
|
|
$
|
|
|
|||
|
2017
|
|
|
|
|
|
|
|
|
|||||||
|
2016
|
|
|
|
|
|
|
|
|
|||||||
|
Capital expenditures:
|
|||||||||||||||
|
2018
|
$
|
|
|
$
|
|
|
$
|
|
|
$
|
|
|
|||
|
2017
|
|
|
|
|
|
|
|
|
|||||||
|
2016
|
|
|
|
|
|
|
|
|
|||||||
|
Total assets:
|
|||||||||||||||
|
September 30, 2018
|
$
|
|
|
$
|
|
|
$
|
|
|
$
|
|
|
|||
|
September 30, 2017
|
|
|
|
|
|
|
|
|
|||||||
|
Intangible assets, net:
|
|||||||||||||||
|
September 30, 2018
|
$
|
|
|
$
|
|
|
$
|
|
|
$
|
|
|
|||
|
September 30, 2017
|
|
|
|
|
|
|
|
|
|||||||
Note 17.
Commitments and Contingencies
We are involved in various legal proceedings that have arisen in the normal course of operations, including the proceedings summarized below. The effect of the outcome of these matters on our financial statements cannot be predicted with certainty as any such effect depends on the amount and timing of the resolution of such matters. Other than the litigation described below, we do not believe that any of our outstanding litigation would have a material adverse effect on our business or prospects.
Environmental.
We are subject to a wide variety of laws and regulations concerning the protection of the environment, both with respect to the operations at many of our properties and with respect to remediating environmental conditions that may exist at our own or other properties. We accrue for environmental expenses resulting from existing conditions that relate to past operations when the costs are probable and reasonably estimable.
In the acquisition agreement pursuant to which a predecessor to Tyco sold our businesses to a previous owner in August 1999, Tyco agreed to indemnify us and our affiliates, among other things, for all “Excluded Liabilities.” Excluded Liabilities include, among other things, substantially all liabilities relating to the time prior to August 1999, including environmental liabilities. The indemnity survives indefinitely. Tyco’s indemnity does not cover liabilities to the extent caused by us or the operation of our businesses after August 1999, nor does it cover liabilities arising with respect to businesses or sites acquired after August 1999. Since 2007, Tyco has engaged in multiple corporate restructurings, split-offs and divestitures.
F- 29
While none of these transactions directly affects the indemnification obligations of the Tyco indemnitors under the 1999 acquisition agreement, the result of such transactions is that the assets of, and control over, such Tyco indemnitors has changed. Should any of these Tyco indemnitors become financially unable or fail to comply with the terms of the indemnity, we may be responsible for such obligations or liabilities.
On July 13, 2010, Rohcan Investments Limited, the former owner of property leased by Mueller Canada Ltd. and located in Milton, Ontario, filed suit against Mueller Canada Ltd. and its directors seeking
C$
10.0
million
in damages arising from the defendants’ alleged environmental contamination of the property and breach of lease. Mueller Canada Ltd. leased the property from 1988 through 2008. We are pursuing indemnification from a former owner for certain potential liabilities that are alleged in this lawsuit, and we have accrued for other liabilities not covered by indemnification. On December 7, 2011, the Court denied the plaintiff’s motion for summary judgment.
The purchaser of U.S. Pipe has been identified as a “potentially responsible party” (“PRP”) under the Comprehensive Environmental Response, Compensation and Liability Act (“CERCLA”) in connection with a former manufacturing facility operated by U.S. Pipe that was in the vicinity of a proposed Superfund site located in North Birmingham, Alabama. Under the terms of the acquisition agreement relating to our sale of U.S. Pipe, we agreed to indemnify the purchaser for certain environmental liabilities, including those arising out of the former manufacturing site in North Birmingham. Accordingly, the purchaser tendered the matter to us for indemnification, which we accepted. Ultimate liability for the site will depend on many factors that have not yet been determined, including the determination of EPA’s remediation costs, the number and financial viability of the other PRPs (there are four other PRPs currently) and the determination of the final allocation of the costs among the PRPs. Accordingly, because the amount of such costs cannot be reasonably estimated at this time, no amounts had been accrued for this matter at
September 30, 2018
.
Walter Energy
. We were a member of the Walter Energy federal tax consolidated group, through December 14, 2006, at which time the company was spun-off from Walter Industries. Until our spin-off from Walter Energy, we joined in the filing of the Walter Energy consolidated federal income tax return for each taxable year during which we were a member of the consolidated group. As a result, we are jointly and severally liable for the federal income tax liability, if any, of the consolidated group for each of those years. Accordingly, we could be liable in the event any such federal income tax liability is incurred, and not discharged, by any other member of the Walter Energy tax consolidated group for any period during which we were included in the Walter Energy tax consolidated group.
In July 2015, Walter Energy filed for bankruptcy protection under Chapter 11 of the U.S. Bankruptcy Code in the Northern District of Alabama (“Chapter 11 Case”). On February 2, 2017, the Chapter 11 Case was converted to a liquidation proceeding under Chapter 7 of the U.S. Bankruptcy Code, pursuant to which Walter Energy is now in the process of being wound down and liquidated.
The IRS is currently alleging that Walter Energy owes substantial amounts for prior taxable periods in which we were a member of the Walter Energy tax consolidated group (specifically, 1983-1994, 2000-2002 and 2005). On January 11, 2016, the IRS filed a proof of claim in the Chapter 11 Case, alleging that Walter Energy owes taxes,interest and penalties for the years 1983-1994, 2000-2002 and 2005 in an aggregate amount of
$
554.3
million
(
$
229.1
million
of which the IRS claims is entitled to priority status in the Chapter 11 Case). The IRS asserts that its claim is based on an alleged settlement of Walter Energy’s tax liability for years1983 through1994, which Walter Energy disputed. In the proof of claim, the IRS included an alternative calculation in an aggregate amount of
$
860.4
million
, which it asserts would be appropriate in the event the alleged settlement is determined to be non-binding (
$
535.3
million
of which the IRS claims is entitled to priority status in the Chapter 11 Case). The IRS has indicated its intent to pursue collection of amounts included in the proofs of claim from former members of the Walter Energy tax consolidated group.
According to a quarterly report on Form 10-Q filed by Walter Energy with the SEC on November 5, 2015, Walter Energy had
$
33.0
million
of accruals at September 30, 2015 for unrecognized tax benefits in connection with the matters subject to the IRS claims and Walter Energy stated it believed it had sufficient accruals to address any claims, including interest and penalties, and did not believe that any potential difference between any final settlements and amounts accrued would have a material effect on Walter Energy’s financial position, but such potential difference could be material to its results of operations in a future reporting period.
We have been working constructively with the parties involved in this matter in an effort to reach a consensual resolution with respect to the alleged tax liabilities at issue. Based on our work to date, we believe that once certain anticipated refunds (applicable primarily to 1997 and 2006 through 2015) are applied against asserted income tax liabilities owing for other years, the total net tax liabilities of Walter Energy, if any, will be substantially less than those asserted by the IRS.
F- 30
We cannot estimate the amount of, or the extent to which we will be responsible for, any liabilities to which we may be subject relating to these tax claims. Such liabilities could have a material adverse effect on our business, financial condition, liquidity or results of operations. Furthermore, there can be no assurance we will be able to reach any resolution with the parties involved in this matter and, in such event, we would intend to vigorously assert any and all available defenses against any liabilities we may have as a member of the Walter Energy consolidated group.
Indemnifications
. We are a party to contracts in which it is common for us to agree to indemnify third parties for certain liabilities that arise out of or relate to the subject matter of the contract. In some cases, this indemnity extends to related liabilities arising from the negligence of the indemnified parties, but usually excludes any liabilities caused by gross negligence or willful misconduct. We cannot estimate the potential amount of future payments under these indemnities until events arise that would trigger a liability under the indemnities.
Additionally, in connection with the sale of assets and the divestiture of businesses, such as the divestitures of U.S. Pipe and Anvil, we may agree to indemnify buyers and related parties for certain losses or liabilities incurred by these parties with respect to: (i) the representations and warranties made by us to these parties in connection with the sale and (ii) liabilities related to the pre-closing operations of the assets or business sold. Indemnities related to pre-closing operations generally include certain environmental and tax liabilities and other liabilities not assumed by these parties in the transaction.
Indemnities related to the pre-closing operations of sold assets or businesses normally do not represent additional liabilities to us, but simply serve to protect these parties from potential liability associated with our obligations existing at the time of the sale. As with any liability, we have accrued for those pre-closing obligations that are considered probable and reasonably estimable. Should circumstances change, increasing the likelihood of payments related to a specific indemnity, we will accrue a liability when future payment is probable and the amount is reasonably estimable.
Other Matters.
We monitor and analyze our warranty experience and costs periodically and may revise our warranty reserves as necessary. Critical factors in our reserve analyses include warranty terms, specific claim situations, general incurred and projected failure rates, the nature of product failures, product and labor costs, and general business conditions.
In 2017, our warranty analysis identified certain Technologies radio products produced prior to 2017 and installed in particularly harsh environments that had been failing at higher-than-expected rates. During the quarter ended March 31, 2017, we conducted additional testing of these products and revised our estimates of warranty expenses. As a result, we recorded an additional warranty expense of
$
9.8
million
in the second quarter of 2017.
During the quarter ended June 30, 2018, we completed a similar analysis and determined, based on this new information, that certain other Technologies products had been failing at higher-than-expected rates as well, and that the average cost to repair or replace certain products under warranty was higher than previously estimated. As a result, in the third quarter of 2018, we recorded an additional warranty expense of
$
14.1
million
associated with such products.
We are party to a number of other lawsuits arising in the ordinary course of business, including product liability cases for products manufactured by us or third parties. We provide for costs relating to these matters when a loss is probable and the amount is reasonably estimable. Administrative costs related to these matters are expensed as incurred. The effect of the outcome of these matters on our future financial statements cannot be predicted with certainty as any such effect depends on the amount and timing of the resolution of such matters. While the results of litigation cannot be predicted with certainty, we believe that the final outcome of such other litigation is not likely to have a materially adverse effect on our business or prospects.
F- 31
|
Note 18.
|
|
On
October 25, 2018
, our board of directors declared a dividend of
$
0.05
per share on our common stock, payable on or about
November 20, 2018
to stockholders of record at the close of business on
November 9, 2018
.
In October, 2018, we announced the closure our Middleborough, Massachusetts location and the creation of a center of excellence for research and development in Atlanta, Georgia. The estimated cost of this reorganization is approximately
$
5.0
million
.
|
Note 19.
|
|
|
|
Quarter
|
||||||||||||||
|
|
Fourth
|
Third
|
Second
|
First
|
|||||||||||
|
(in millions, except per share amounts)
|
|||||||||||||||
|
2018
|
|||||||||||||||
|
Net sales
|
$
|
|
|
$
|
|
|
$
|
|
|
$
|
|
|
|||
|
Gross profit
|
|
|
|
|
|
|
|
|
|||||||
|
Operating income
|
|
|
|
|
|
|
|
|
|||||||
|
Income from continuing operations
|
|
|
|
|
|
|
|
|
|||||||
|
Net income
|
|
|
|
|
|
|
|
|
|||||||
|
Earnings per basic share
(1)
|
|||||||||||||||
|
Continuing operations
|
|
|
|
|
|
|
|
|
|||||||
|
Net income
|
|
|
|
|
|
|
|
|
|||||||
|
Earnings per diluted share
(1)
|
|||||||||||||||
|
Continuing operations
|
|
|
|
|
|
|
|
|
|||||||
|
Net income
|
|
|
|
|
|
|
|
|
|||||||
|
2017
|
|||||||||||||||
|
Net sales
|
$
|
|
|
$
|
|
|
$
|
|
|
$
|
|
|
|||
|
Gross profit
|
|
|
|
|
|
|
|
|
|||||||
|
Operating income
|
|
|
|
|
|
|
|
|
|||||||
|
Income from continuing operations
|
|
|
|
|
|
|
|
|
|||||||
|
Discontinued operations
|
(
|
)
|
(
|
)
|
|
|
|
|
|||||||
|
Net income
|
|
|
|
|
|
|
|
|
|||||||
|
Earnings per basic share
(1)
|
|||||||||||||||
|
Continuing operations
|
|
|
|
|
|
|
|
|
|||||||
|
Discontinued operations
|
(
|
)
|
|
|
|
|
|
|
|||||||
|
Net income
|
|
|
|
|
|
|
|
|
|||||||
|
Earnings per diluted share
(1)
|
|||||||||||||||
|
Continuing operations
|
|
|
|
|
|
|
|
|
|||||||
|
Discontinued operations
|
(
|
)
|
|
|
|
|
|
|
|||||||
|
Net income
|
|
|
|
|
|
|
|
|
|||||||
|
(1)
|
|
F- 32
TABLE OF CONTENTS
Part IItem 1. BusinessItem 1A. Risk FactorsItem 2. PropertiesItem 3. Legal ProceedingsPart IIItem 5. Market For Registrant S Common Equity, Related Stockholder Matters and Issuer Purchases Of Equity SecuritiesItem 6. Selected Financial DataItem 7. Management S Discussion and Analysis Of Financial Condition and Results Of OperationsItem 7A. Quantitative and Qualitative Disclosure About Market RiskItem 8. Financial Statements and Supplementary DataItem 9A. Controls and ProceduresPart IIIItem 10. Directors, Executive Officers and Corporate GovernanceItem 11. Executive CompensationItem 12. Security Ownership Of Certain Beneficial Owners and Management and Related Stockholder MattersItem 13. Certain Relationships and Related Transactions, and Director IndependenceItem 14. Principal Accountant Fees and ServicesPart IVItem 15. Exhibits and Financial Statement SchedulesNote 1. OrganizationNote 2. Summary Of Significant Accounting PoliciesNote 3. DivestitureNote 4. AcquisitionNote 5. Intangible AssetsNote 6. Income TaxesNote 7. Borrowing ArrangementsNote 8. Derivative Financial InstrumentsNote 9. Retirement PlansNote 10. Capital StockNote 11. Stock-based Compensation PlansNote 12. Supplemental Balance Sheet InformationNote 13. Supplemental Statement Of Operations InformationNote 14. Accumulated Other Comprehensive LossNote 15. Supplemental Cash Flow InformationNote 16. Segment InformationNote 17. Commitments and ContingenciesNote 18. Subsequent EventsNote 19. Quarterly Consolidated Financial Information (unaudited)