MAXIM INTEGRATED PRODUCTS INC
10-Ks and 10-Qs
|
|
|
|
|
|
|
|
|
|
|
|
|
|
|
|
|
|
|
|
|
|
|
|
|
|
|
|
|
|
|
|
UNITED STATES
SECURITIES AND EXCHANGE COMMISSION
Washington, D.C. 20549
FORM 10-K
(Mark One)
|
T
|
ANNUAL REPORT PURSUANT TO SECTION 13 OR 15(d) OF THE SECURITIES EXCHANGE ACT OF 1934
|
For the Fiscal Year Ended
June 30, 2012
OR
|
£
|
TRANSITION REPORT PURSUANT TO SECTION 13 OR 15(d) OF THE SECURITIES EXCHANGE ACT OF 1934
|
Commission File Number 001-34192

MAXIM INTEGRATED PRODUCTS, INC.
(Exact name of Registrant as specified in its charter)
|
Delaware
|
|
94-2896096
|
|
(State or other jurisdiction of
incorporation or organization)
|
|
(I.R.S. Employer
Identification No.)
|
160 Rio Robles
San Jose, California 95134
(Address of Principal Executive Offices) (Zip Code)
Registrant's telephone number, including area code: (408) 601-1000
Securities registered pursuant to Section 12(b) of the Act:
|
Title of each class
Common stock, $0.001 par value
|
|
Name of each exchange on which registered
The NASDAQ Global Select Market
|
Securities registered pursuant to Section 12(g) of the Act: None
Indicate by check mark if the registrant is a well-known seasoned issuer, as defined in Rule 405 of the Securities Act. Yes
T
No
£
Indicate by check mark if the registrant is not required to file reports pursuant to Section 13 or Section 15(d) of the Act. Yes
£
No
T
Indicate by check mark whether the registrant (1) has filed all reports required to be filed by Sections 13 or 15(d) of the Securities Exchange Act of 1934 during the preceding 12 months (or for such shorter period that the registrant was required to file such reports), and (2) has been subject to such filing requirements for the past 90 days. Yes
T
No
£
Indicate by check mark whether the registrant has submitted electronically and posted on its corporate Web site, if any, every Interactive Data File required to be submitted and posted pursuant to Rule 405 of Regulation S-T (§232.405 of this chapter) during the preceding 12 months (or for such shorter period that the registrant was required to submit and post such files). Yes
T
No
£
Indicate by check mark if disclosure of delinquent filers pursuant to Item 405 of Regulation S-K is not contained herein, and will not be contained, to the best of registrant's knowledge, in definitive proxy or information statements incorporated by reference in Part III of this Form 10-K or any amendment to this Form 10-K.
T
Indicate by check mark whether the registrant is a large accelerated filer, an accelerated filer, a non-accelerated filer, or a smaller reporting company. See the definitions of "large accelerated filer," "accelerated filer" and "smaller reporting company" in Rule 12b-2 of the Exchange Act. (Check One):
|
Large Accelerated Filer
T
|
Accelerated Filer
£
|
Non-accelerated Filer
£
(Do not check if a smaller reporting company)
|
Smaller Reporting Company
£
|
|||
Indicate by check mark whether the registrant is a shell company (as defined in Rule 12b-2 of the Exchange Act). Yes
£
No
T
The aggregate market value of the voting stock held by non-affiliates of the Registrant based upon the closing price of the common stock on
December 31, 2011
as reported by The NASDAQ Global Select Market was
$4,181,299,802
. Shares of voting stock held by executive officers, directors and holders of more than 5% of the outstanding voting stock have been excluded from this calculation because such persons may be deemed to be affiliates. Exclusion of such shares should not be construed to indicate that any of such persons possesses the power, direct or indirect, to control the Registrant, or that any such person is controlled by or under common control with the Registrant.
Number of shares outstanding of the Registrant's Common Stock, $.001 par value, as of
August 7, 2012
:
291,825,784
.
Documents Incorporated By Reference:
|
(1)
|
Items 10, 11, 12, 13 and 14 of Part III incorporate information by reference from the Proxy Statement for Maxim's 2012 Annual Meeting of Stockholders, to be filed subsequently.
|
1
MAXIM INTEGRATED PRODUCTS
INDEX
|
Forward-Looking Statements
|
|||
|
Part I
|
|||
|
Business
|
|||
|
Risk Factors
|
|||
|
Unresolved Staff Comments
|
|||
|
Properties
|
|||
|
Legal Proceedings
|
|||
|
Mine Safety Disclosures
|
|||
|
Part II
|
|||
|
Market for Registrant's Common Equity, Related Stockholder Matters and Issuer Purchases of Equity Securities
|
|||
|
Selected Financial Data
|
|||
|
Management's Discussion and Analysis of Financial Condition and Results of Operations
|
|||
|
Quantitative and Qualitative Disclosures about Market Risk
|
|||
|
Financial Statements and Supplementary Data
|
|||
|
Changes in and Disagreements with Accountants on Accounting and Financial Disclosure
|
|||
|
Controls and Procedures
|
|||
|
Other Information
|
|||
|
Part III
|
|||
|
Directors, Executive Officers, and Corporate Governance
|
|||
|
Executive Compensation
|
|||
|
Security Ownership of Certain Beneficial Owners and Management and Related Stockholder Matters
|
|||
|
Certain Relationships and Related Transactions, and Director Independence
|
|||
|
Principal Accountant Fees and Services
|
|||
|
Part IV
|
|||
|
Exhibits and Financial Statement Schedules
|
|||
2
FORWARD-LOOKING STATEMENTS
This Annual Report on Form 10-K (this "Annual Report") contains forward-looking statements within the meaning of Section 27A of the Securities Act of 1933, as amended, and Section 21E of the Securities Exchange Act of 1934, as amended (the "Exchange Act"). These statements are based on our current expectations and could be affected by the uncertainties and risk factors described throughout this filing and particularly in Part I, Item 1A - Risk Factors and in Part II, Item 7 - Management's Discussion and Analysis of Financial Condition and Results of Operations. These statements relate to, among other things, sales, gross margins, operating expenses, capital expenditures and requirements, liquidity, asset dispositions, product development and R&D efforts, manufacturing plans, pending litigation, effective tax rates, and tax reserves for uncertain tax positions, and are indicated by words or phrases such as "anticipate," "expect," "outlook," "foresee," "forecast," "believe," "should," "could," "intend," "will," "plan," "seek," "project," and variations of such words and similar words or expressions. These statements involve risks and uncertainties that could cause actual results to differ materially from expectations. These forward-looking statements should not be relied upon as predictions of future events as we cannot assure you that the events or circumstances reflected in these statements will be achieved or will occur. For a discussion of some of the factors that could cause actual results to differ materially from our forward-looking statements, see the discussion on "Risk Factors" that appears in Part I, Item 1A of this Annual Report and other risks and uncertainties detailed in this and our other reports and filings with the Securities and Exchange Commission ("SEC"). We undertake no obligation to update forward-looking statements to reflect developments or information obtained after the date hereof and disclaim any obligation to do so except as required by applicable laws.
3
Overview
Maxim Integrated Products, Inc. ("Maxim" or the "Company" and also referred to as "we," "our" or "us") designs, develops, manufactures and markets a broad range of linear and mixed-signal integrated circuits, commonly referred to as analog circuits, for a large number of customers in diverse geographical locations. The analog market is fragmented and characterized by diverse applications, numerous product variations and, with respect to many circuit types, relatively long product life cycles. Our objective is to develop and market both proprietary and industry-standard analog integrated circuits that meet the increasingly stringent quality and performance standards demanded by customers.
We are a Delaware corporation originally incorporated in California in 1983. We are headquartered in San Jose, California. The mailing address for our headquarters is 160 Rio Robles, California 95134, and our telephone number is (408) 601-1000. Additional information about us is available on our website at www.maximintegrated.com.
The Company has a 52-to-53-week fiscal year that ends on the last Saturday of June. Accordingly, every fifth or sixth year will be a 53-week fiscal year. Fiscal year
2012
was a 53-week fiscal year. Fiscal years
2011
and
2010
were 52-week fiscal years.
We make available through our website, free of charge, our Annual Reports on Form 10-K, Quarterly Reports on Form 10-Q, Current Reports on Form 8-K and any amendments to those reports filed or furnished pursuant to Section 13(a) or 15(d) of the Exchange Act, as soon as reasonably practicable after they are electronically filed with or furnished to the SEC. We assume no obligation to update or revise any forward-looking statements in this Annual Report, whether as a result of new information, future events or otherwise, unless we are required to do so by applicable laws. A copy of this Annual Report is available without charge upon written request to: Investor Relations, Maxim Integrated Products, Inc., 160 Rio Robles, San Jose, California 95134.
The Mixed Signal Analog Integrated Circuit Market
All electronic signals generally fall into one of two categories, linear or digital. Linear (or analog) signals represent real world phenomena, such as temperature, pressure, sound, or speed, and are continuously variable over a wide range of values. Digital signals represent the "ones" and "zeros" of binary arithmetic and are either on or off.
Three general classes of semiconductor products arise from this distinction between linear and digital signals:
|
•
|
digital devices, such as memories and microprocessors that operate primarily in the digital domain;
|
|
•
|
linear devices, such as amplifiers, references, analog multiplexers and switches that operate primarily in the analog domain; and
|
|
•
|
mixed-signal devices such as data converter devices that combine linear and digital functions on the same integrated circuit and interface between the analog and digital domains.
|
Our strategy has been to target both the linear and mixed-signal markets, often collectively referred to as the analog market. However, some of our products are exclusively or principally digital. While our focus continues to be on the linear and mixed signal market, our capabilities in the digital domain enable development of new mixed signal and other products with highly sophisticated digital characteristics.
We operate in one reportable segment - the design, development, marketing and manufacturing of a broad range of linear and mixed signal integrated circuits.
Our linear and mixed signal products serve four major end-markets. These major end-markets and their corresponding market segments are noted in the table below:
4
|
MAJOR END-MARKET
|
MARKET SEGMENT
|
|
|
|
|
INDUSTRIAL
|
Automatic Test Equipment
|
|
|
Automotive
|
|
|
Control & Automation
|
|
|
Electronic Instrumentation
|
|
|
Medical
|
|
|
Military & Aerospace
|
|
|
Security
|
|
|
Utility & Other Meters
|
|
|
Other Industrial
|
|
|
|
|
COMMUNICATIONS
|
Basestations
|
|
|
Network & Datacom
|
|
|
Telecom
|
|
|
Other Communications
|
|
|
|
|
CONSUMER
|
Cell Phones
|
|
|
Digital Cameras
|
|
Handheld Computers
|
|
|
|
Home Entertainment & Appliances
|
|
|
Other Consumer
|
|
|
|
|
COMPUTING
|
Data Storage
|
|
|
Financial Terminals
|
|
|
Notebook Computers
|
|
|
Server & Desktop Computers
|
|
|
Peripherals & Other Computer
|
Product Quality
We employ a system addressing quality and reliability of our products from initial design through wafer fabrication, assembly, testing and final shipment. We have received ISO 9001/2, TS 16949 and ISO 14001 certifications for all wafer fabrication, assembly, final test and shipping facilities. Based on industry standard requirements, we conduct reliability stress testing on the products we manufacture and sell. Through this testing, we seek to detect and accelerate the presence of defects that may arise over the life of a product in order to ensure its reliability.
Manufacturing
We manufacture wafers in our own facilities and use third-party silicon foundries. The majority of processed wafers are subjected to parametric and functional testing at our facilities. The broad range of products demanded by the analog integrated circuit market requires multiple manufacturing process technologies. As a result, many different process technologies are currently used for wafer fabrication of our products. Historically, wafer fabrication of analog integrated circuits has not required state-of-the-art processing equipment, although newer processes do utilize and require such state-of-the-art facilities and equipment. In addition, hybrid and module products are manufactured using a complex multi-chip technology featuring thin-film, laser-trimmed resistors and other active or passive components. We rely on our own fabrication technologies and facilities to implement such manufacturing requirements. We also utilize unaffiliated manufacturing subcontractors. We are expanding our internal and external manufacturing and test capacity to meet future growth.
During fiscal years
2012
,
2011
and
2010
, a large portion of our own wafer production occurred at one of our three owned wafer fabrication facilities at the following locations:
|
Facility Location
|
Fiscal Year Acquired
|
|
Beaverton, Oregon
|
1994
|
|
San Jose, California
|
1998
|
|
San Antonio, Texas
|
2004
|
5
In fiscal year 2007, we entered into a supply agreement with Seiko Epson Corporation ("Epson"). In fiscal year 2010, we entered into a supply agreement with Powerchip Technology Corporation ("Powerchip") and Maxchip Electronics Corp. ("Maxchip") to provide 300mm and 200mm wafer capacity. Under these agreements, partner foundries (Epson, Powerchip and Maxchip) have manufactured some of our mixed-signal semiconductor products. These products are manufactured under rights and licenses using our proprietary technology at Epson's fabrication facility located in Sakata, Japan and at Powerchip and Maxchip's fabrication facilities in Hsinchu, Taiwan. In fiscal years
2012
,
2011
and
2010
, the products manufactured by our partner foundries represented
42%
,
32%
and
19%
, respectively, of our total wafer production.
At the end of fiscal year 2009, we ceased wafer fabrication in our Dallas, Texas facility and converted it into a wafer bump manufacturing facility. Our wafer bump manufacturing facility located in Dallas, Texas is used to manufacture products that utilize chip scale packaging ("CSP") or wafer level packaging ("WLP"). CSP or WLP enables integrated circuits to be attached directly to a printed circuit board without the use of a traditional plastic package. In addition, we utilize independent subcontractors to perform wafer bump manufacturing to the extent we do not have the internal capacity or capabilities to perform such services.
Once wafer manufacturing has been completed, wafers are generally sorted in order to determine which integrated circuits on each wafer are functional and which are defective. We currently perform the majority of wafer sort, final test and shipping activities at two facilities located in Cavite, the Philippines and Chonburi Province, Thailand, although we also utilize independent subcontractors for some wafer sorting. Our finished products ship directly from either Cavite, the Philippines or Chonburi Province, Thailand to customers worldwide or to other Company locations for sale to end-customers or distributors.
Integrated circuit assembly is performed by foreign assembly subcontractors, located in China, Japan, Malaysia, the Philippines, Taiwan, Thailand, Singapore and South Korea, where wafers are separated into individual integrated circuits and assembled into a variety of packages.
After assembly has been completed, the majority of the assembled product is shipped back to our facilities located in Cavite, the Philippines or Chonburi Province, Thailand where the packaged integrated circuits undergo final testing and preparation for customer shipment. In addition, we utilize independent subcontractors to perform final testing.
With the introduction of 300mm wafers into our manufacturing network, we have enabled subcontractors located in Taiwan to perform wafer bumping and testing of these wafers.
We currently perform substantially all of our module assembly operations in our facility in Batangas, the Philippines. Our Philippines facility also performs wafer singulation and tape-and-reel of bumped (CSP or WLP) wafers.
Customers, Sales and Marketing
We market our products worldwide through a direct-sales and applications organization and through our own and other unaffiliated distribution channels to a broad range of customers in diverse industries. Our products typically require a sophisticated technical sales and marketing effort. Our sales organization is divided into domestic and international regions. Distributors and direct customers generally buy on an individual purchase order basis, rather than pursuant to long-term agreements.
Certain distributors have agreements with us which allow for price protection on certain inventory if we lower the price of our products. Certain distributor agreements also generally permit distributors to exchange a portion of certain purchases on a periodic basis. As is customary in the semiconductor industry, our distributors may also market other products that compete with our products.
Sales to certain international distributors are made under agreements which permit limited stock return privileges but not sales price rebates. The agreements generally permit distributors to exchange a portion of their purchases on a periodic basis. See "Critical Accounting Policies" in Part II, Item 7 - Management's Discussion and Analysis of Financial Condition and Results of Operations and Note 2 to the Consolidated Financial Statements included in this Annual Report, which contains information regarding our revenue recognition policy.
We derived approximately
29%
of our fiscal year
2012
revenue from sales made through distributors. Our primary distributor is Avnet Electronics which accounted for
13%
,
14%
and
12%
of our revenues in fiscal years
2012
,
2011
and
2010
, respectively. Avnet, like our other distributors, is not an end customer, but rather serves as a channel of sale to many end users of the Company's products. Samsung, our largest single customer, accounted for approximately
20%
,
12%
and
12%
of net revenues in fiscal years
2012
,
2011
and
2010
, respectively. No single product accounted for more than
10%
of net revenues in fiscal years
2012
,
2011
and
2010
. Based on customers' ship-to locations, international sales accounted for approximately
88%
,
85%
and
85%
of net revenues in fiscal years
2012
,
2011
and
2010
, respectively. See Note 12, "Segment Information" in the Notes to Consolidated
6
Financial Statements in Item 15.
Seasonality
Our revenue is generally influenced on a quarter to quarter basis by customer demand patterns and new product introductions. However, an increasing number of our products are being incorporated into consumer electronic products, which are subject to significant seasonality and fluctuations in demand, and tend to have stronger sales in the middle of the calendar year as manufacturers prepare for the major holiday selling seasons.
Foreign Operations
We conduct business in numerous countries outside of the United States. Our international business is subject to numerous risks, including fluctuations in foreign currency exchange rates and controls, import and export controls, and other laws, policies and regulations of foreign governments.
Backlog
At
June 30, 2012
and
June 25, 2011
, our current quarter backlog was approximately
$393 million
and
$460 million
, respectively. We include in backlog orders with customer request dates within the next three months. As is customary in the semiconductor industry, these orders may be canceled in most cases without penalty to customers. In addition, backlog includes orders from domestic distributors for which revenues are not recognized until the products are sold by the distributors. Accordingly, we believe that our backlog is not a reliable measure of future revenues. All backlog numbers have been adjusted for estimated future U.S. distribution ship and debit pricing adjustments.
Research and Development
We believe that research and development is critical to our future success. Objectives for the research and development function include:
|
•
|
new product definition and development of proprietary products;
|
|
•
|
design of parts for performance differentiation and the ability to achieve manufacturing high yield and reliability;
|
|
•
|
development of, and access to, manufacturing processes and advanced packaging;
|
|
•
|
development of hardware and software to support the acceptance and design-in of our products in the end customer's system; and
|
|
•
|
development and design wins of high-integration products across multiple end markets.
|
Our research and development plans require engineering talent and tools for process technologies, test development, packaging development, product definition, electronic design automation ("EDA"), circuit design, software development and applications support. Research and development expenses were
$552.4 million
,
$525.3 million
and
$474.7 million
in fiscal years
2012
,
2011
and
2010
, respectively.
See "Research and Development" under Item 7, Management's Discussion and Analysis of Financial Condition and Results of Operations, for more information.
Competition
The mixed signal analog integrated circuit industry is intensely competitive, and virtually all major semiconductor companies presently compete with, or conceivably could compete with, some portion of our business.
We believe the principal elements of competition include:
|
•
|
technical innovation, service and support;
|
|
•
|
time to market;
|
|
•
|
differentiated product performance and features;
|
|
•
|
quality and reliability;
|
|
•
|
product pricing and delivery capabilities;
|
|
•
|
customized design and applications;
|
|
•
|
business relationship with customers;
|
|
•
|
experience, skill and productivity of employees and management; and
|
|
•
|
manufacturing competence and inventory management.
|
7
Our principal competitors include, but are not limited to, Analog Devices, Inc., Intersil Corporation, Linear Technology Corporation, NXP Semiconductors NV and Texas Instruments Inc. In addition, we compete with digital chipset providers, including Broadcom Corporation and Qualcomm Inc. We expect increased competition in the future from other emerging and established companies.
Patents, Licenses, and Other Intellectual Property Rights
We rely upon both know-how and patents to develop and maintain our competitive position.
It is our policy to seek patent protection for significant inventions that may be patented, though we may elect, in certain cases, not to seek patent protection even for significant inventions if other protection, such as maintaining the invention as a trade secret, is considered more advantageous. In addition, we have registered certain of our mask sets under the Semiconductor Chip Protection Act of 1984, as amended. We hold a number of patents worldwide with expiration dates ranging from 2012 to 2032. We have also registered several of our trademarks and copyrights with the U.S. Patent and Trademark Office and in foreign jurisdictions.
Employees
As of
June 30, 2012
, we employed
9,065
people of whom
4,214
were employed in the United States.
Environmental Regulations
Our compliance with foreign, federal, state and local laws and regulations that have been enacted to regulate the environment has not had a material adverse effect on our capital expenditures, earnings, or competitive or financial position.
Executive Officers
For information regarding our current executive officers, please see Part III, Item 10 of this Annual Report.
8
The following risk factors and other information included in this Annual Report should be carefully considered. The risks and uncertainties described below are not the only ones we face. Additional risks and uncertainties not presently known to us or that we presently deem less significant may also impair our business operations.
Cyclicality in the semiconductor industry may adversely affect our results of operations
Historically, the semiconductor industry has been cyclical and subject to significant and often rapid increases and decreases in demand for products and services. These changes could have adverse effects on our results of operations and on the market price of our common stock. The results of our operations may be adversely affected if demand for our products and services decreases or if we are unable to meet an increase in demand without significantly increasing the lead-time for the delivery of our products and services.
Incorrect forecasts, reductions, cancellations or delays in orders for our products could adversely affect our results of operations
As is customary in the semiconductor industry, customer orders may be canceled in most cases without penalty to the customers. Some customers place orders that require us to manufacture products and have them available for shipment, even though the customer may be unwilling to make a binding commitment to purchase all, or even any, of the products. In other cases, we manufacture products based on forecasts of customer demands. As a result, we may incur inventory and manufacturing costs in advance of anticipated sales and are subject to the risk of cancellations of orders, potentially leading to an initial inflation of backlog followed by a sharp reduction. In addition, backlog includes orders from domestic distributors for which revenues are not recognized until the ordered products are sold by the distributors. Because of the possibility of order cancellation, backlog should not be used as a measure of future revenues. Furthermore, orders or forecasts may be for products meeting the customer's unique requirements such that those canceled or unrealized orders may also result in an inventory of unsaleable products, causing potential inventory write-offs. As a result of lengthy manufacturing cycles for certain of the products, the amount of unsaleable products could be substantial. As a result, incorrect forecasts, reductions, cancellations or delays in orders for our products could adversely affect our operating results.
Our operating results may be adversely affected by unfavorable economic and market conditions
The economic environment could subject us to increased credit risk should customers be unable to pay us, or delay paying us, for previously purchased products. Accordingly, reserves for doubtful accounts and write-offs of accounts receivable may increase. In addition, weakness in the market for end users of our products could harm the cash flow of our distributors and resellers who could then delay paying their obligations to us or experience other financial difficulties. This would further increase our credit risk exposure and, potentially, cause delays in our recognition of revenue on sales to these customers.
If economic or market conditions deteriorate globally, in the United States or in other key markets, our business, operating results, and financial condition may be materially and adversely affected.
Political conditions could materially affect our revenues and results of operations
We are subject to the political and legal risks inherent in international operations. Exposure to political instabilities, different business policies and varying legal standards could impact economic activity, which in turn could lead to a contraction of customer demand or a disruption in our operations. We have been impacted by these problems in the past, but none have materially affected our results of operations. Problems in the future or not-yet-materialized consequences of past problems could affect deliveries of our products to our customers, possibly resulting in substantially delayed or lost sales and/or increased expenses that cannot be passed on to customers.
Our quarterly operating results may fluctuate, which could adversely impact our common stock price
We believe that period-to-period comparisons of our results of operations are not necessarily meaningful and should not be relied upon as indicators of future performance. Our operating results have in the past been, and will continue to be, subject to quarterly fluctuations as a result of numerous factors, some of which may contribute to more pronounced fluctuations in an uncertain global economic environment. These factors include, but are not limited to, the following:
|
•
|
Fluctuations in demand for our products and services;
|
|
•
|
Loss of a significant customer or significant customers electing to purchase from another supplier;
|
9
|
•
|
Reduced visibility into our customers' spending plans and associated revenue;
|
|
•
|
The level of price and competition in our product markets;
|
|
•
|
Our pricing practices, including our use of available information to maximize pricing potential;
|
|
•
|
The impact of the uncertain economic and credit environment on our customers, channel partners, and suppliers, including their ability to obtain financing or to fund capital expenditures;
|
|
•
|
The overall movement toward industry consolidations among our customers and competitors;
|
|
•
|
Below industry-average growth of the non-consumer segments of our business;
|
|
•
|
Announcements and introductions of new products by us or our competitors;
|
|
•
|
Deferrals of customer orders in anticipation of new products or product enhancements (introduced by us or our competitors);
|
|
•
|
Our ability to meet increases in customer orders in a timely manner;
|
|
•
|
Striking an appropriate balance between short-term execution and long-term innovation;
|
|
•
|
Our ability to develop, introduce, and market new products and enhancements and market acceptance of such new products and enhancements; and
|
|
•
|
Our levels of operating expenses.
|
Our products may fail to meet new industry standards or requirements and the efforts to meet such industry standards or requirements could be costly
Many of our products are based on industry standards that are continually evolving. Our ability to compete in the future will depend on our ability to identify and ensure compliance with these evolving industry standards. The emergence of new industry standards could render our products incompatible with products developed by major systems manufacturers. As a result, we could be required to invest significant time and effort and to incur significant expense to redesign our products to ensure compliance with relevant standards. If our products are not in compliance with prevailing industry standards or requirements, we could miss opportunities to achieve crucial design wins which in turn could have a material adverse effect on our business, operations and financial results.
Our critical information systems, necessary for the operation of our business, are subject to interruptions and failures
We maintain and rely upon certain critical information systems for the effective operation of our business. These information systems include telecommunications, the internet, our corporate intranet, various computer hardware and software applications, network communications and e-mail. These information systems may be owned by us or by our outsource providers or even third parties such as vendors and contractors and may be maintained by us or by such providers or third parties. These information systems are subject to attacks, including attacks that may result in theft of our intellectual property, failures and access denials from a number of potential sources including viruses, destructive or inadequate code, power failures and physical damage to computers, hard drives, communication lines and networking equipment. To the extent that these information systems are under our control, we have implemented security procedures, such as virus protection software and emergency recovery processes, to address the outlined risks; however, security procedures for information systems cannot be guaranteed to be failsafe and our inability to use or access these information systems at critical points in time could unfavorably impact the timely and efficient operation of our business.
We may encounter difficulties in the implementation of a new manufacturing execution system, which may adversely affect our operations and financial reporting
We are in the process of implementing a new manufacturing execution system (“MES”) in our testing facilities that is scheduled to be completed by the end of fiscal year 2013 as part of our ongoing efforts to improve the quality and productivity of our operations. In addition, we are in process of implementing a global execution system (“GES”) that is scheduled to begin implementation in fiscal year 2013 as part of our efforts to integrate inventory movement with our financial reporting system. Any difficulties in the implementation or operation of the MES could increase the cost to test our products or disrupt the testing of our products. Such developments could materially adversely affect our results of operation and financial reporting.
Our manufacturing operations may be interrupted or suffer yield problems
Given the nature of our products, it would be time consuming, difficult, and costly to arrange for new manufacturing facilities to supply such products. Any prolonged inability to utilize one of our manufacturing facilities or a third party foundry, due to damages resulting from fire, natural disaster, unavailability of electric power, labor unrest or other causes, would have a material adverse effect on our results of operations and financial condition.
10
The manufacture and design of integrated circuits is highly complex. We may experience manufacturing problems in achieving acceptable yields or experience product delivery delays in the future as a result of, among other things, capacity constraints, equipment malfunctioning, construction delays, upgrading or expanding existing facilities, changing our process technologies, or new technology qualification delays, particularly in our internal fabrication facilities, any of which could result in a loss of future revenues or increases in fixed costs. To the extent we do not achieve acceptable manufacturing yields or we experience delays in wafer fabrication, our results of operations could be adversely affected. In addition, operating expenses related to increases in production capacity may adversely affect our operating results if revenues do not increase proportionately.
Our independent distributors and sales representatives may terminate their relationship with us or fail to make payments on outstanding accounts receivable to us, which would adversely affect our financial results
A portion of our sales is realized through independent electronics distributors that are not under our direct control. These independent sales organizations generally represent product lines offered by several companies and thus could reduce their sales efforts applied to our products or terminate their representation of us. We require certain foreign distributors to provide a letter of credit to us in an amount up to the credit limit set for accounts receivable from such foreign distributors. The letter of credit provides for collection on accounts receivable from the foreign distributor should the foreign distributor default on their accounts receivable to us. Where credit limits have been established above the amount of the letter of credit, we are exposed for the difference. We do not require letters of credit from any of our domestic distributors and are not contractually protected against accounts receivable default or bankruptcy by these distributors. The inability to collect open accounts receivable could adversely affect our results of operations and financial condition. Termination of a significant distributor, whether at our or the distributor's initiative, could be disruptive to our current business.
Our operating results may be adversely affected by increased competition
We experience intense competition from a number of companies, some of which have significantly greater financial, manufacturing, and marketing resources than us, as well as greater technical resources and proprietary intellectual property rights than us. The principal elements of competition include product performance, functional value, quality and reliability, technical service and support, price, diversity of product line, sale of multiple chips for a price as part of a complete system solution and delivery capabilities. We believe we compete favorably with respect to these factors, although we may be at a disadvantage in comparison to larger companies with broader product lines and greater technical service and support capabilities. We may be unable to compete successfully in the future against existing or new competitors and our operating results may be adversely affected by increased competition.
We are dependent on a few large customers and market segments for a substantial portion of our revenues, the loss of which could materially affect our revenues and results of operations
We depend on a few large customers and market segments for a substantial portion of our net revenues. Samsung, our largest single customer, accounted for approximately 20%, 12% and 12% of net revenues in fiscal years 2012, 2011 and 2010, respectively. The loss of all or a substantial portion of our sales to any of these large customers or market segments could have a material adverse effect on our financial condition and results of operations.
Our dependence on subcontractors for assembly, test, freight, and logistic services and certain manufacturing services may cause delays beyond our control in delivering products to our customers
We rely on subcontractors located in various parts of the world for assembly and CSP packaging services, freight and logistic services, wafer fabrication and sorting and testing services. None of the subcontractors we currently use are affiliated with us. Reliability problems experienced by our subcontractors or the inability to promptly replace any subcontractor could cause serious problems in delivery and quality resulting in potential product liability to us. Such problems could impair our ability to meet our revenue plan in the fiscal year period impacted by the disruption. Failure to meet the revenue plan may materially adversely impact our results of operations.
Any disruptions in our sort, assembly, test, freight and logistic operations or in the operations of our subcontractors, including, but not limited to, the inability or unwillingness of any of our subcontractors to produce or timely deliver adequate supplies of processed wafers, integrated circuit packages or tested products conforming to our quality standards, or other required products or services could damage our reputation, relationships and goodwill with customers. Furthermore, finding alternate sources of supply or initiating internal wafer processing for these products may not be economically feasible.
11
Shortage of raw materials or supply disruption of such raw materials could harm our business
The semiconductor industry has experienced a large expansion of fabrication capacity and production worldwide over time. As a result of increasing demand from semiconductor, solar and other manufacturers, availability of certain basic materials and supplies, such as raw wafers and silicon on insulator wafers, chemicals, gases, polysilicon, silicon wafers, ultra-pure metals, lead frames and molding compounds, and of subcontract services, like epitaxial growth, ion implantation and assembly of integrated circuits into packages, has been limited from time to time over the past several years, and could come into short supply again if overall industry demand exceeds the supply of these materials and services in the future.
We purchase materials and supplies from many suppliers, some of which are sole-sourced. If the availability of these materials and supplies is interrupted, we may not be able to find suitable replacements. In addition, from time to time natural disasters can lead to a shortage of some of the above materials due to disruption of the manufacturer's production. We continually strive to maintain availability of all required materials, supplies and subcontract services. However, we do not have long-term agreements providing for all of these materials, supplies and services, and shortages could occur as a result of capacity limitations or production constraints on suppliers that could have a material adverse effect on our ability to achieve our production requirements.
Environmental liabilities could force us to expend significant capital and incur substantial costs
Various foreign and domestic federal, state, and local government agencies impose a variety of environmental regulations on the storage, handling, use, discharge and disposal of certain chemicals, gases and other substances used or produced in the semiconductor manufacturing process. Historically, compliance with these regulations has not had a material adverse effect on our capital expenditures, earnings, or competitive or financial position. There can be no assurance, however, that interpretation and enforcement of current or future environmental regulations will not impose costly requirements upon us. Any failure by us to adequately control the storage, handling, use, discharge or disposal of regulated substances could result in fines, suspension of production, alteration of wafer fabrication processes and legal liability, which may materially adversely impact our financial condition, results of operations or liquidity.
We may be unable to adequately protect our proprietary rights, which may impact our ability to compete effectively
We rely upon know-how, trade secrets, and patents to develop and maintain our competitive position. There can be no assurance that others will not develop or patent similar technology or reverse engineer our products or that the confidentiality agreements upon which we rely will be adequate to protect our interests. Moreover, the laws of some foreign countries generally do not protect proprietary rights to the same extent as the United States, and we may encounter problems in protecting our proprietary rights in those foreign countries. Other companies have obtained patents covering a variety of semiconductor designs and processes, and we could be required to obtain licenses under some of these patents or be precluded from making and selling the infringing products, if such patents are valid and other design and manufacturing solutions are not available. There can be no assurance that we would be able to obtain licenses, if required, upon commercially reasonable terms or at all.
We may suffer losses and business interruption if our products infringe the intellectual property rights of others
In the past, it has been common in the semiconductor industry for patent holders to offer licenses on reasonable terms and rates. Although the practice of offering licenses appears to be generally continuing, in some situations, typically where the patent directly relates to a specific product or family of products, patent holders have refused to grant licenses. In any of those cases, there can be no assurance that we would be able to obtain any necessary license on terms acceptable to us, if at all, or that we would be able to re-engineer our products or processes in a cost effective manner to avoid infringement. Any litigation in such a situation could involve an injunction to prevent the sales of a material portion of our products, the reduction or elimination of the value of related inventories and the assessment of a substantial monetary award for damages related to past sales, all of which could have a material adverse effect on our results of operations and financial condition.
We may experience losses related to intellectual property indemnity claims
We provide intellectual property indemnification for certain customers, distributors, suppliers and subcontractors for attorney fees and damages and costs awarded against these parties in certain circumstances in which our products are alleged to infringe third party intellectual property rights, including patents, registered trademarks and copyrights. In certain cases, there are limits on and exceptions to our potential liability for indemnification relating to intellectual property infringement claims. We cannot estimate the amount of potential future payments, if any, that we might be required to make as a result of these agreements. To date, we have not been required to pay significant amounts for intellectual property indemnification claims. However, there can be no assurance that we will not have significant financial exposure under those intellectual property indemnification obligations in the
12
future.
Business interruptions from natural disasters could harm our business
We operate our business in worldwide locations. Some of our facilities and those of our subcontractors are located in geologically unstable areas of the world and are susceptible to damage from natural disasters. In the event of a natural disaster, we may suffer a disruption in our operations that could adversely affect our results of operations.
Our financial condition, operations and liquidity may be materially adversely affected in the event of a catastrophic loss for which we are self-insured
We are primarily self-insured with respect to many of our commercial risks and exposures. Based on management's assessment and judgment, we have determined that it is generally more cost effective to self-insure these risks. The risks and exposures we self-insure include, but are not limited to, fire, property and casualty, natural disasters, product defects, political risk, general liability, theft, counterfeits, patent infringement, certain employment practice matters and medical benefits for many of our domestic (United States) employees. We also maintain insurance contracts with independent insurance companies that provide certain of our employees with health (medical and dental) benefits, worker's compensation coverage, long-term disability income coverage, life insurance coverage and fiduciary insurance coverage for employee and Company funds invested under the Employee Retirement Income and Security Act. In addition, we maintain officer and director liability coverage and certain property insurance contracts with independent insurance companies. Should there be catastrophic loss from events such as fires, explosions or earthquakes or other natural disasters, among many other risks, or adverse court or similar decisions in any area in which we are self-insured, our financial condition, results of operations and liquidity may be materially adversely affected.
Limitations in manufacturing capacity or delays in lead-time for delivery of products could adversely affect our future growth opportunities and results of operations
Limitations in manufacturing capacity and other supply constraints could impede our ability to grow revenues and meet increased customer demands for our products. Our results of operations may be adversely affected if we fail to meet such increase in demand for our products without significantly increasing the lead-time required for our delivery of such products. Any significant increase in the lead-time for delivery of products may negatively affect our customer relationships, reputation as a dependable supplier of products and ability to obtain future design wins, while potentially increasing order cancellations, aged, unsaleable or otherwise unrealized backlog, and the likelihood of our breach of supply agreement terms. Any of the foregoing factors could negatively affect our future revenue growth and results of operations.
We are subject to warranty claims and product liability
We face an inherent risk of exposure to product liability suits in connection with reliability problems or other product defects that may affect our customers. Our products are used by a variety of industries, including the transportation and medical industries. Failure of our products to perform to specifications, or other product defects, could lead to substantial damage to both the end product in which our device has been placed and to the user of such end product. Although we take measures to protect against product defects, if a product liability claim is brought against us, the cost of defending the claim could be significant and any adverse determination could have a material adverse effect on our results of operations.
We manufacture and sell products into many global jurisdictions where our efforts to contractually limit liability for certain damages, including consequential, indirect and non-proximately caused damages, may not be enforceable or may be found by a court to not apply in a particular situation. Likewise, as we continue to partner with certain customers we may be required to accept increasing exposure for liability, including product liability. We believe these relationships with key customers will continue to increase. While we attempt to structure our customer relationships to reduce such exposures, it is not always possible to limit or eliminate such liability. Should we choose to not enter into such relationships or limit the number of such relationships due to our inability to negotiate acceptable limits on liability, our revenues and financial operations could be materially adversely affected.
We may be liable for additional production costs and lost revenues to certain customers with whom we have entered into customer supply agreements if we are unable to meet certain product quantity and quality requirements
We enter into contracts with certain customers whereby we commit to supply quantities of specified parts at a predetermined scheduled delivery date. The number of such arrangements continues to increase as this practice becomes more commonplace. Should we be unable to supply the customer with the specific part at the quantity and product quality desired and on the scheduled delivery date, the customer may incur additional production costs. In addition, the customer may lose revenues due to a delay in
13
receiving the parts necessary to have the end-product ready for sale to its customers or due to product quality issues. Under certain customer supply agreements, we may be liable for direct additional production costs or lost revenues. If products are not shipped on time or are quality deficient, we may be liable for penalties and resulting damages. Such liability, should it arise, and/or our inability to meet these commitments to our customers may have a material adverse impact on our results of operations and financial condition and could damage our relationships, reputation and goodwill with the affected customers.
We may pursue acquisitions and investments that could harm our operating results and may disrupt our business
Impairment of goodwill poses a financial risk for failed acquisitions. We have made and will continue to consider making strategic business investments, alliances and acquisitions we consider necessary or desirable to gain access to key technologies that we believe will augment our existing technical capability and support our business model objectives. Acquisitions, alliances and investments involve risks and uncertainties that may negatively impact our future financial performance. If integration of our acquired businesses is not successful, we may not realize the potential benefits of an acquisition or suffer other adverse effects that we currently do not foresee. We may also need to enter new markets in which we have no or limited experience and where competitors in such markets have stronger market positions.
Any of the foregoing, and other, factors could harm our ability to achieve anticipated levels of profitability from acquired businesses or to realize other anticipated benefits of acquisitions. In addition, because acquisitions of high technology companies are inherently risky, no assurance can be given that our previous or future acquisitions will be successful and will not adversely affect our business, operating results, or financial condition.
If we fail to enter into future vendor managed inventory arrangements or fail to supply the specific product or quantity under such arrangements, the results of our operations and financial condition may be materially adversely impacted
We enter into arrangements with certain original equipment manufacturers ("OEMs") and Electronic Manufacturing Services ("EMS") partners to consign quantities of certain products within close proximity of the OEMs and EMS partners' manufacturing location. The inventory is physically segregated at these locations and we retain title and risk of loss related to this inventory until such time as the OEM or EMS partner pulls the inventory for use in its manufacturing process. Once the inventory is pulled by the OEM or EMS partner, title and risk of loss pass to the customer, at which point we relieve inventory and recognize revenue and the related cost of goods sold. The specific quantities to be consigned are based on a forecast provided by the OEM or EMS partner. Generally, the arrangements with the OEMs and EMS partners provide for transfer of title and risk of loss once product has been consigned for a certain length of time.
We believe these arrangements will continue to grow in terms of number of customers and products and will increase in proportion to consolidated net revenues. Should we be unable or unwilling to enter into such agreements as requested by OEMs or EMS partners, our results of operations may be materially adversely impacted. In addition, should we be unable to supply the specific product in the quantity needed by the OEM or EMS partner as reflected in their forecast, we may be liable for damages, including, but not limited to, lost revenues and increased production costs which could have a material adverse impact on our results of operations and financial condition. Should we supply product in excess of the OEM or EMS partners actual usage, any inventory not consumed may become excess or obsolete, which would result in an inventory write off that could materially adversely affect our results of operations.
Our stock price may be volatile
The market price of our common stock has fluctuated significantly. In the future, the market price of our common stock could be subject to significant fluctuations due to general economic and market conditions and in response to quarter-to-quarter variations including, but not limited to, the following:
|
•
|
our anticipated or actual results of operations;
|
|
•
|
announcements or introductions of new products by us or our competitors;
|
|
•
|
anticipated or actual operating results of our customers, peers or competitors;
|
|
•
|
technological innovations or setbacks by us or our competitors;
|
|
•
|
conditions in our four major markets;
|
|
•
|
the commencement or outcome of litigation or governmental investigations;
|
|
•
|
change in ratings and estimates of our performance by securities analysts;
|
|
•
|
announcements of merger, acquisition or divestiture transactions;
|
|
•
|
dividend changes;
|
|
•
|
changes in our capital structure, including any decision we make in regard to the repurchase of our common stock;
|
14
|
•
|
management changes;
|
|
•
|
supply constraints;
|
|
•
|
semiconductor industry cyclicality;
|
|
•
|
our inclusion in certain stock indices;
|
|
•
|
our ability to maintain compliance with the SEC reporting requirements; and
|
|
•
|
other events or factors beyond our control.
|
The market prices and trading volumes of many high technology companies, including semiconductor companies, are subject to volatility due to a variety of microeconomic, macroeconomic, and other factors. In some instances, these fluctuations can be unrelated or disproportionate to the operating performance of the affected companies. Any such fluctuation could harm the market price of our common stock.
Our ability to service our debt obligations, including
$300 million
of senior unsecured notes, requires sufficient cash flow from our future operations
In June 2010, the Company issued
$300 million
in senior, unsecured debt due in 2013 with an effective interest rate of
3.49%
. Interest is payable semi-annually on December 14 and June 14. The debt indenture includes covenants that limit the Company's ability to grant liens on its facilities and to enter into sale and leaseback transactions, which could limit the Company's ability to secure debt funding in the future. In circumstances involving a change of control of the Company followed by a downgrade of the rating of the Company's notes, the Company would be required to make an offer to repurchase these notes at a purchase price equal to
101%
of the aggregate principal amount, plus accrued and unpaid interest. The Company's ability to repurchase the notes in such events may be limited by the Company's then-available financial resources or by the terms of other agreements to which the Company is a party. Although the Company currently has the funds necessary to retire this debt, funds might not be available to repay the notes when they become due in the future.
If the Company fails to pay interest when due, fails to repay the notes when due or materially breaches other loan covenants, it would constitute an event of default under the indenture governing the notes which, in turn, may also constitute an event of default under other obligations of the Company. Any event of default under the indenture or other obligations of the Company and any additional obligations and restrictions imposed as a result thereof could negatively impact our financial results.
Our financial results may be adversely affected by increased tax rates and exposure to additional tax liabilities
A number of factors may increase our future effective tax rates, including, but not limited to:
|
•
|
the jurisdictions in which profits are determined to be earned and taxed;
|
|
•
|
recent changes in our global structure that involve an increased investment in technology outside of the United States to better align asset ownership and business functions with revenues and profits;
|
|
•
|
the resolution of issues arising from tax audits with various tax authorities;
|
|
•
|
changes in the valuation of our deferred tax assets and liabilities;
|
|
•
|
adjustments to estimated taxes upon finalization of various tax returns;
|
|
•
|
increases in expenses not deductible for tax purposes, including impairments of goodwill in connection with acquisitions;
|
|
•
|
changes in available tax credits;
|
|
•
|
changes in share-based compensation;
|
|
•
|
changes in tax laws or the interpretation of such tax laws, and changes in generally accepted accounting principles; and
|
|
•
|
the repatriation of non-U.S. earnings for which we have not previously provided for U.S. taxes.
|
We are subject to taxation in various countries and jurisdictions. Significant judgment is required to determine tax liabilities on a worldwide basis. Any significant increase in our future effective tax rates could reduce net income for future periods and may have a material adverse impact on our results of operations.
We may be materially adversely affected by currency fluctuations or changes in trade policies
We conduct our manufacturing and other operations in various worldwide locations. A portion of our operating costs and expenses at foreign locations are paid in local currencies. Many of the materials used in our products and much of the manufacturing process for our products are supplied by foreign companies or by our foreign operations, such as our test operations in the Philippines and Thailand. Approximately
88%
,
85%
and
85%
of our net revenues in fiscal years
2012
,
2011
and
2010
, respectively, were from
15
international sales. Accordingly, both manufacturing and sales of our products may be adversely affected by political or economic conditions abroad. In addition, various forms of protectionist trade legislation are routinely proposed in the United States and certain foreign countries. A change in current tariff structures or other trade policies could adversely affect our foreign manufacturing or marketing strategies. Currency exchange fluctuations could also decrease revenue and increase our operating costs, the cost of components manufactured abroad, and the cost of our products to foreign customers, or decrease the costs of products produced by our foreign competitors.
We are subject to a variety of domestic and international laws and regulations, including the U.S. Customs and Export Regulations
Among other laws and regulations, we are subject to U.S. Customs and Export Regulations, including U.S. International Traffic and Arms Regulations and similar laws, which collectively control import, export and sale of technologies by companies and various other aspects of the operation of our business. Failure to comply with such laws and regulations may result in civil and criminal enforcement, including monetary fines and possible injunctions against shipment of product or other activities of the Company, which could have a material adverse impact on our results of operations and financial condition.
If we fail to attract and retain qualified personnel, or fail to efficiently implement management organizational changes, our business may be harmed
Our success depends to a significant extent upon the continued service of our chief executive officer, our other executive officers, and key management and technical personnel, particularly our experienced engineers and business unit managers, and on our ability to continue to attract, retain, and motivate qualified personnel and our ability to identify and appropriately handle under- performing personnel. The loss of the services of one or several of our executive officers could have a material adverse effect on us. In addition, there could be a material adverse effect on us should the turnover rates for engineers and other key personnel increase significantly or should we be unable to continue to attract, motivate and retain qualified personnel through economic and other incentives or through other means. Should we lose one or more engineers who are key to a project's completion during the course of a particular project, the project's completion may be delayed. Such a delay could negatively affect customer relationships and goodwill and could have a material adverse effect on our results of operations. Further, we periodically implement changes to the organization of our management. Failure to implement such changes efficiently could have a material adverse effect on our results of operation.
Our certificate of incorporation contains certain anti-takeover provisions that may discourage, delay or prevent a hostile change in control of our Company
Our certificate of incorporation permits our Board of Directors to authorize the issuance of up to
2,000,000
shares of preferred stock and to determine the rights, preferences and privileges and restrictions applicable to such shares without any further vote or action by our stockholders. Any such issuance might discourage, delay or prevent a hostile change in control of our Company.
Generally Accepted Accounting Principles require us to utilize estimates which may lead to volatility in reported earnings and balances
The preparation of financial statements in conformity with accounting principles generally accepted in the United States requires management to make estimates and assumptions that affect the reported amounts of assets and liabilities, the disclosure of contingent assets and liabilities at the date of the financial statements and the reported amounts of revenues and expenses during the reporting period. Such estimates relate to the useful lives and fair value of fixed assets, valuation allowance for deferred tax assets, reserves relating to uncertain tax positions, allowances for doubtful accounts, customer returns and allowances, inventory valuation, reserves relating to litigation matters, assumptions about the fair value of reporting units, goodwill and other intangibles impairment, accrued liabilities and reserves and assumptions related to the calculation of stock-based compensation. The Company bases its estimates and judgments on its historical experience, knowledge of current conditions and its beliefs regarding what could occur in the future, given available information. Actual results may differ from those estimates, and such differences may be material to the financial statements. Additionally, new accounting pronouncements and guidance have been promulgated by the Financial Accounting Standards Board (“FASB”) that require companies to regularly attempt to determine or estimate the fair value of certain assets and liabilities and adjust those amounts to reflect the revised estimates. Recent pronouncements have broadened this trend to direct how to estimate and account for fair value measurements as well as give companies the option to apply fair value measurements more broadly to many financial assets and liabilities.
16
None.
We relocated our principal executive offices to San Jose, California in June 2012. Manufacturing and other operations are conducted in several locations worldwide. The following table provides certain information regarding our principal owned and leased offices and manufacturing facilities at
June 30, 2012
:
|
Owned Property Location
|
Use(s)
|
Approximate
Floor Space
(sq. ft.)
|
|
|
San Jose, California
|
Corporate headquarters, office space, engineering, manufacturing, administration, customer services, shipping, and other
|
435,000
|
|
|
San Jose, California
|
Wafer fabrication, office space and administration
|
80,000
|
|
|
Sunnyvale, California
|
Office space and engineering space (not being utilized currently)
|
23,000
|
|
|
N. Chelmsford, Massachusetts
|
Engineering, office space and administration
|
30,000
|
|
|
Beaverton, Oregon
|
Wafer fabrication, engineering, office space and administration
|
226,000
|
|
|
Hillsboro, Oregon
|
Engineering, manufacturing, office space and administration
|
325,000
|
|
|
Farmers Branch, Texas
|
Office space, engineering, manufacturing, administration, bump facility, customer service, warehousing, shipping, and other (240,000 sq.ft. are not being utilized currently)
|
704,000
|
|
|
Irving, Texas
|
Wafer fabrication space, office space and administration (not being utilized currently)
|
622,000
|
|
|
San Antonio, Texas
|
Wafer fabrication, office space and administration
|
381,000
|
|
|
Cavite, the Philippines
|
Manufacturing, engineering, administration, office space, customer service, shipping, and other
|
479,000
|
|
|
Batangas, the Philippines
|
Manufacturing, engineering, office space and other
|
78,000
|
|
|
Chonburi Province, Thailand
|
Manufacturing, engineering, administration, office space, customer service, shipping, and other
|
144,000
|
|
|
Bangalore, India
|
Land
|
4.6 acres
|
|
|
Chandler, Arizona
|
Office space, engineering, and test
|
65,000
|
|
In addition to the property listed in the above table, we also lease sales, engineering, administration and manufacturing offices and other premises at various locations in the United States and overseas under operating leases, none of which are material to our future cash flows. These leases expire at various dates through 2025. We anticipate no difficulty in retaining occupancy of any of our manufacturing, office or sales facilities through lease renewals prior to expiration or through month-to-month occupancy or in replacing them with equivalent facilities.
We expect these facilities to be adequate for our business purposes through at least the next 12 months.
17
Legal Proceedings
We are party or subject to various legal proceedings and claims, either asserted or unasserted, which arise in the ordinary course of business, including proceedings and claims that relate to intellectual property matters and acquisitions we have completed or to companies we have acquired or are attempting to acquire. While the outcome of these matters cannot be predicted with certainty, we do not believe that the outcome of any of these matters, individually or in the aggregate, will result in losses that are materially in excess of amounts already recognized or reserved, if any.
Indemnifications
The Company indemnifies certain customers, distributors, suppliers and subcontractors for attorney fees, damages and costs awarded against such parties in certain circumstances in which the Company's products are alleged to infringe third party intellectual property rights, including patents, registered trademarks or copyrights. The terms of the Company's indemnification obligations are generally perpetual from the effective date of the agreement. In certain cases, there are limits on and exceptions to the Company's potential liability for indemnification relating to intellectual property infringement claims.
Legal Fees Associated with Indemnification Obligations, Defense and Other Related Costs
Pursuant to the Company's charter documents and separate written indemnification agreements, the Company has certain indemnification obligations to its current officers and directors, as well as certain former officers and directors. Pursuant to such obligations, the Company has incurred expenses related to legal fees and expenses advanced to certain former officers of the Company who were subject to civil suits and civil charges by the SEC in connection with Maxim's historical stock option granting practices. The Company expenses such amounts as incurred.
Not applicable.
Our common stock is traded on the NASDAQ Global Select Market ("NASDAQ") under the symbol MXIM. At
August 7, 2012
, there were
872
stockholders of record of our common stock.
The following table sets forth the range of the high and low closing prices by quarter for fiscal years
2012
and
2011
:
|
|
High
|
Low
|
|
|
Fiscal Year ended June 30, 2012
|
|
|
|
|
First Quarter
|
$25.95
|
$21.08
|
|
|
Second Quarter
|
$27.08
|
$22.92
|
|
|
Third Quarter
|
$29.19
|
$25.95
|
|
|
Fourth Quarter
|
$29.86
|
$24.41
|
|
|
|
|
|
|
|
|
High
|
Low
|
|
|
Fiscal Year ended June 25, 2011
|
|
|
|
|
First Quarter
|
$18.54
|
$15.87
|
|
|
Second Quarter
|
$24.82
|
$17.81
|
|
|
Third Quarter
|
$28.10
|
$23.58
|
|
|
Fourth Quarter
|
$28.34
|
$23.79
|
|
18
The following table sets forth the dividends paid per share for fiscal years
2012
and
2011
:
|
|
Fiscal Years
|
||
|
|
2012
|
2011
|
|
|
|
|
|
|
|
First Quarter
|
$0.22
|
$0.21
|
|
|
Second Quarter
|
$0.22
|
$0.21
|
|
|
Third Quarter
|
$0.22
|
$0.21
|
|
|
Fourth Quarter
|
$0.22
|
$0.21
|
|
Issuer Purchases of Equity Securities
The following table summarizes the activity related to stock repurchases for the three months ended
June 30, 2012
:
|
Issuer Repurchases of Equity Securities
|
|||||||||||||
|
(in thousands, except per share amounts)
|
|||||||||||||
|
Total Number
of Shares
Purchased
|
Weighted Average Price Paid per Share
|
Total Number of Shares Purchased as Part of Publicly Announced Plans or Programs
|
Maximum Amount That May Yet Be Purchased Under the Plans or Programs
|
||||||||||
|
Apr. 1, 2012 - Apr. 28, 2012
|
535
|
|
$
|
27.74
|
|
535
|
|
$
|
592,645
|
|
|||
|
Apr. 29, 2012 - May 26, 2012
|
630
|
|
$
|
27.19
|
|
630
|
|
$
|
575,515
|
|
|||
|
May 27, 2012 - Jun. 30, 2012
|
955
|
|
$
|
25.46
|
|
955
|
|
$
|
551,204
|
|
|||
|
Total
|
2,120
|
|
$
|
26.55
|
|
2,120
|
|
$
|
551,204
|
|
|||
In August 2011, the Board of Directors authorized the Company to repurchase up to
$750 million
of the Company's common stock from time to time at the discretion of the Company's management. This stock repurchase authorization has no expiration date. All prior authorizations by the Company's Board of Directors for the repurchase of common stock were canceled and superseded by this authorization.
During fiscal year
2012
, the Company repurchased approximately
9.9 million
shares of its common stock for
$246.4 million
. As of
June 30, 2012
, the Company had remaining authorization of
$551.2 million
for future share repurchases. The number of shares to be repurchased and the timing of such repurchases will be based on several factors, including the price of the Company's common stock and liquidity and general market and business conditions.
Equity Compensation Plan Information
For important information regarding our equity compensation plans, please see Note 6, "Stock-Based Compensation," in the Notes to the Consolidated Financial Statements included in this Annual Report.
Stock Performance Graph
The line graph below compares the cumulative total stockholder return on our common stock with the cumulative total return of the NASDAQ Composite Stock Index and the Philadelphia Semiconductor index for the five years ended
June 30, 2012
. The graph and table assume that $100 was invested on June 29, 2007 (the last day of trading for the year ended
June 30, 2007
) in each of our common stock, the NASDAQ Composite Stock Index and the SPDR S&P Semiconductor Index, and that all dividends were reinvested. Cumulative total stockholder returns for our common stock, the NASDAQ Composite Stock Index and the Philadelphia Semiconductor index are based on our fiscal year.
19
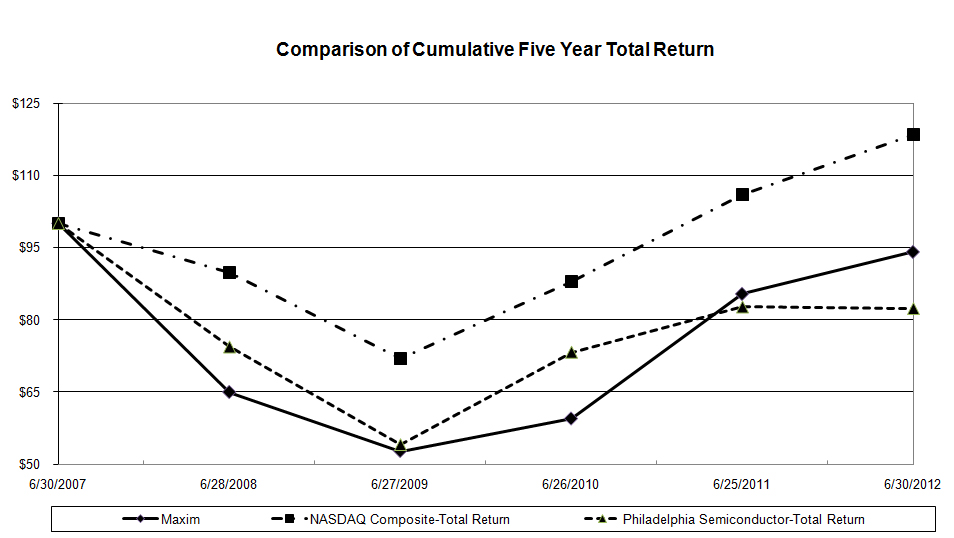
|
|
Base Year
|
Fiscal Year Ended
|
|||||||||||||||
|
|
June 30, 2007
|
June 28, 2008
|
June 27, 2009
|
June 26, 2010
|
June 25, 2011
|
June 30, 2012
|
|||||||||||
|
Maxim Integrated Products, Inc.
|
100.00
|
|
64.93
|
|
52.68
|
|
59.42
|
|
85.30
|
|
94.01
|
|
|||||
|
NASDAQ Composite-Total Return
|
100.00
|
|
89.69
|
|
71.94
|
|
87.84
|
|
105.90
|
|
118.54
|
|
|||||
|
Philadelphia Semiconductor-Total Return
|
100.00
|
|
74.33
|
|
53.98
|
|
73.22
|
|
82.65
|
|
82.31
|
|
|||||
Set forth below is a summary of certain consolidated financial information with respect to the Company as of the dates and for the periods indicated. The data set forth below as of
June 30, 2012
and
June 25, 2011
and for each of the three years in the period ended
June 30, 2012
are derived from and should be read in conjunction with, and are qualified by reference to, Item 7 - Management's Discussion and Analysis of Financial Condition and Results of Operations and Item 8 - Financial Statements and Supplementary Data, and notes thereto included elsewhere in this Annual Report. The following selected financial data as of
June 26, 2010
,
June 27, 2009
, and
June 28, 2008
and for the two years in the period ended June 27, 2009 is derived from our consolidated financial statements not included herein. The historical results are not necessarily indicative of the results to be expected in any future period.
20
|
|
Fiscal Year Ended
|
||||||||||||||||||
|
|
June 30, 2012
|
June 25, 2011
|
June 26, 2010
|
June 27, 2009
|
June 28, 2008
|
||||||||||||||
|
(Amounts in thousands, except percentages and per share data)
|
|||||||||||||||||||
|
Consolidated Statements of Income Data:
|
|
|
|
|
|
|
|
|
|
|
|||||||||
|
Net revenues
|
$
|
2,403,529
|
|
$
|
2,472,341
|
|
$
|
1,997,603
|
|
$
|
1,646,015
|
|
$
|
2,052,783
|
|
||||
|
Cost of goods sold
|
952,677
|
|
942,377
|
|
804,537
|
|
797,138
|
|
804,083
|
|
|||||||||
|
Gross margin
|
$
|
1,450,852
|
|
$
|
1,529,964
|
|
$
|
1,193,066
|
|
$
|
848,877
|
|
$
|
1,248,700
|
|
||||
|
Gross margin %
|
60.4
|
%
|
61.9
|
%
|
59.7
|
%
|
51.6
|
%
|
60.8
|
%
|
|||||||||
|
Operating income
|
$
|
534,797
|
|
$
|
673,039
|
|
$
|
292,050
|
|
$
|
17,378
|
|
$
|
426,053
|
|
||||
|
% of net revenues
|
22.3
|
%
|
27.2
|
%
|
14.6
|
%
|
1.1
|
%
|
20.8
|
%
|
|||||||||
|
Income from continuing operations
|
$
|
354,918
|
|
$
|
489,009
|
|
$
|
125,139
|
|
$
|
10,455
|
|
$
|
317,725
|
|
||||
|
Income from discontinued operations, net of tax
|
31,809
|
|
—
|
|
—
|
|
—
|
|
—
|
|
|||||||||
|
Net income
|
$
|
386,727
|
|
$
|
489,009
|
|
$
|
125,139
|
|
$
|
10,455
|
|
$
|
317,725
|
|
||||
|
Earnings per share: basic
|
|
|
|
|
|
|
|
|
|
|
|||||||||
|
From continuing operations
|
$
|
1.21
|
|
$
|
1.65
|
|
$
|
0.41
|
|
$
|
0.03
|
|
$
|
0.99
|
|
||||
|
From discontinued operations
|
0.11
|
|
—
|
|
—
|
|
—
|
|
—
|
|
|||||||||
|
Basic net income per share
|
$
|
1.32
|
|
$
|
1.65
|
|
$
|
0.41
|
|
$
|
0.03
|
|
$
|
0.99
|
|
||||
|
Earnings per share: diluted
|
|||||||||||||||||||
|
From continuing operations
|
$
|
1.18
|
|
$
|
1.61
|
|
$
|
0.40
|
|
$
|
0.03
|
|
$
|
0.98
|
|
||||
|
From discontinued operations
|
0.11
|
|
—
|
|
—
|
|
—
|
|
—
|
|
|||||||||
|
Diluted net income per share
|
$
|
1.29
|
|
$
|
1.61
|
|
$
|
0.40
|
|
$
|
0.03
|
|
$
|
0.98
|
|
||||
|
Shares used in the calculation of
|
|
|
|
|
|
|
|
|
|
|
|||||||||
|
earnings per share:
|
|
|
|
|
|
|
|
|
|
|
|||||||||
|
Basic
|
292,810
|
|
296,755
|
|
304,579
|
|
310,805
|
|
320,553
|
|
|||||||||
|
Diluted
|
300,002
|
|
303,377
|
|
310,016
|
|
311,479
|
|
325,846
|
|
|||||||||
|
|
|
|
|
|
|
|
|
|
|
|
|||||||||
|
Dividends paid per share
|
$
|
0.88
|
|
$
|
0.84
|
|
$
|
0.80
|
|
$
|
0.80
|
|
$
|
0.75
|
|
||||
|
|
As of
|
||||||||||||||||||
|
|
June 30, 2012
|
June 25, 2011
|
June 26, 2010
|
June 27, 2009
|
June 28, 2008
|
||||||||||||||
|
|
(Amounts in thousands)
|
||||||||||||||||||
|
Consolidated Balance Sheet Data:
|
|
|
|
|
|
|
|
|
|
|
|||||||||
|
Cash, cash equivalents and short-term investments
|
$
|
956,386
|
|
$
|
1,012,887
|
|
$
|
826,512
|
|
$
|
913,403
|
|
$
|
1,218,198
|
|
||||
|
Working capital
|
$
|
943,977
|
|
$
|
1,313,512
|
|
$
|
1,174,096
|
|
$
|
1,316,175
|
|
$
|
1,627,406
|
|
||||
|
Total assets
|
$
|
3,737,946
|
|
$
|
3,527,743
|
|
$
|
3,482,325
|
|
$
|
3,081,775
|
|
$
|
3,708,390
|
|
||||
|
Long-term debt
|
$
|
5,592
|
|
$
|
300,000
|
|
$
|
300,000
|
|
$
|
—
|
|
$
|
—
|
|
||||
|
Stockholders' equity
|
$
|
2,538,277
|
|
$
|
2,510,818
|
|
$
|
2,352,958
|
|
$
|
2,594,465
|
|
$
|
3,147,811
|
|
||||
21
The following discussion and analysis should be read in conjunction with our Consolidated Financial Statements and notes thereto included in Part II, Item 8, the risk factors included in Part I, Item 1A, and the "forward-looking statements" and other risks described herein and elsewhere in this Annual Report before making an investment decision regarding our common stock.
Overview
We are a global company with manufacturing facilities in the United States, the Philippines and Thailand, and sales offices and design centers throughout the world. We design, develop, manufacture and market linear and mixed-signal integrated circuits, commonly referred to as analog circuits, for a large number of customers in diverse geographical locations. The analog market is fragmented and characterized by diverse applications, a great number of product variations and, with respect to many circuit types, relatively long product life cycles. The major end-markets in which we sell our products are the industrial, communications, consumer and computing markets. We are incorporated in the State of Delaware.
Critical Accounting Policies
The methods, estimates and judgments we use in applying our most critical accounting policies have a significant impact on the results we report in our financial statements. The SEC has defined the most critical accounting policies as the ones that are most important to the portrayal of our financial condition and results of operations, and that require us to make our most difficult and subjective accounting judgments, often as a result of the need to make estimates of matters that are inherently uncertain. Based on this definition, our most critical accounting policies include revenue recognition, which impact the recording of revenues; valuation of inventories, which impacts costs of goods sold and gross margins; the assessment of recoverability of long-lived assets, which impacts write-offs of fixed assets; assessment of recoverability of intangible assets and goodwill, which impacts write-offs of goodwill and intangible assets; accounting for stock-based compensation, which impacts cost of goods sold, gross margins and operating expenses; accounting for income taxes, which impacts the income tax provision; and assessment of litigation and contingencies, which impacts charges recorded in cost of goods sold, selling, general and administrative expenses and income taxes. These policies and the estimates and judgments involved are discussed further below. We have other significant accounting policies that either do not generally require estimates and judgments that are as difficult or subjective, or it is less likely that such accounting policies would have a material impact on our reported results of operations for a given period. Our significant accounting policies are described in Note 2 to the Consolidated Financial Statements included in this Annual Report.
Revenue Recognition
The Company recognizes revenue for sales to direct customers and sales to certain distributors upon shipment, provided that persuasive evidence of a sales arrangement exists, the price is fixed or determinable, title and risk of loss has transferred, collectability of the resulting receivable is reasonably assured, there are no customer acceptance requirements and we do not have any significant post-shipment obligations. The Company estimates returns for sales to direct customers and certain distributors based on historical returns rates applied against current period gross revenues. Specific customer returns and allowances are considered within this estimate.
Sales to certain distributors are made pursuant to agreements allowing for the possibility of certain sales price rebates and for non-warranty product return privileges. The non-warranty product return privileges include allowing certain distributors to return a small portion of our products in their inventory based on their previous purchases. Given the uncertainties associated with the levels of non-warranty product returns and sales price rebates that could be issued to certain distributors, the Company defers recognition of such revenue and related cost of goods sold until receipt of notification from these distributors that product has been sold to their end-customers.
Accounts receivable from direct customers and distributors are recognized and inventory is relieved upon shipment as title to inventories generally transfers upon shipment at which point the Company has a legally enforceable right to collection under normal terms. Accounts receivable related to consigned inventory is recognized when the customer takes title to such inventory from its consigned location at which point inventory is relieved, title transfers, and the Company has a legally enforceable right to collection under the terms of our agreement with the related customers.
The Company estimates potential future returns and sales allowances related to current period product revenue. Management analyzes historical returns, changes in customer demand and acceptance of products when evaluating the adequacy of returns and sales allowances. Estimates made by us may differ from actual returns and sales allowances. These differences may materially impact reported revenue and amounts ultimately collected on accounts receivable. Historically, such differences have not been
22
material. At
June 30, 2012
and
June 25, 2011
, the Company had
$11.4 million
and
$16.0 million
accrued for returns and allowances against accounts receivable, respectively. During fiscal years
2012
and
2011
, the Company recorded
$61.0 million
and
$74.5 million
for estimated returns and allowances against revenues, respectively. These amounts were offset by
$65.6 million
and
$73.5 million
for actual returns and allowances given during fiscal years
2012
and
2011
, respectively.
Inventories
Inventories are stated at the lower of (i) standard cost, which approximates actual cost on a first-in-first-out basis, or (ii) market value. Our standard cost revision policy is to continuously monitor manufacturing variances and quarterly revise standard costs. Because of the cyclical nature of the market, inventory levels, obsolescence of technology, and product life cycles, we generally write-down inventories to net realizable value based on 12 months forecasted product demand. Actual demand and market conditions may be lower than those projected by us. This difference could have a material adverse effect on our gross margin should inventory write-downs beyond those initially recorded become necessary. Alternatively, should actual demand and market conditions be more favorable than those estimated by us, gross margin could be favorably impacted. Historically, such differences have not been material. During fiscal years
2012
,
2011
and
2010
, we had inventory write-downs of
$26.1 million
,
$13.8 million
and
$3.7 million
, respectively.
Long-Lived Assets
We evaluate the recoverability of property, plant and equipment in accordance with Accounting Standards Codification ("ASC") No. 360,
Accounting for the Property, Plant, and Equipment
("ASC 360"). We perform periodic reviews to determine whether facts and circumstances exist that would indicate that the carrying amounts of property, plant and equipment might not be fully recoverable. If facts and circumstances indicate that the carrying amount of property, plant and equipment might not be fully recoverable, we compare projected undiscounted net cash flows associated with the related asset or group of assets over their estimated remaining useful lives against their respective carrying amounts. In the event that the projected undiscounted cash flows are not sufficient to recover the carrying value of the assets, the assets are written down to their estimated fair values based on the expected discounted future cash flows attributable to the assets. Evaluation of impairment of property, plant and equipment requires estimates in the forecast of future operating results that are used in the preparation of the expected future undiscounted cash flows. Actual future operating results and the remaining economic lives of our property, plant and equipment could differ from our estimates used in assessing the recoverability of these assets. These differences could result in impairment charges, which could have a material adverse impact on our results of operations. We recorded impairment charges of
$30.1 million
,
$0.0 million
and
$8.3 million
during fiscal years
2012
,
2011
and
2010
, respectively.
Intangible Assets and Goodwill
We account for intangible assets in accordance with ASC 360. We review goodwill and purchased intangible assets with indefinite lives for impairment annually and whenever events or changes in circumstances indicate the carrying value of an asset may not be recoverable, such as when reductions in demand or significant economic slowdowns in the semiconductor industry are present.
Intangible assets reviews are performed to determine whether the carrying value is impaired, based on comparisons to undiscounted expected future cash flows. If this comparison indicates that there is impairment, the impaired asset is written down to fair value, which is typically calculated using: (i) quoted market prices or (ii) discounted expected future cash flows utilizing a discount rate consistent with the guidance provided in FASB Concepts Statement No. 7,
Using Cash Flow Information and Present Value in Accounting Measurements.
Impairment is based on the excess of the carrying amount over the fair value of those assets.
Goodwill is recorded as the difference, if any, between the aggregate consideration paid for an acquisition and the fair value of the net tangible and intangible assets acquired. In accordance with ASC No. 350,
Intangibles-Goodwill and Other (
"ASC 350"), we test goodwill for impairment at the reporting unit level (operating segment or one level below an operating segment) on an annual basis in the first quarter or more frequently if we believe indicators of impairment exist. The performance of the test involves a two-step process. The first step of the impairment test involves comparing the fair values of the applicable reporting units with their aggregate carrying values, including goodwill. We generally determine the fair value of our reporting units using the income approach methodology of valuation that includes the discounted cash flow method as well as other generally accepted valuation methodologies. If the carrying amount of a reporting unit exceeds the reporting unit's fair value, we perform the second step of the goodwill impairment test to determine the amount of impairment loss. The second step of the goodwill impairment test involves comparing the implied fair value of the affected reporting unit's goodwill with the carrying value of that goodwill. No impairment charges were recorded associated with our goodwill and intangible assets during fiscal years
2012
,
2011
, and
2010
.
23
Stock-Based Compensation
We account for stock-based compensation in accordance with ASC 718,
Compensation in Stock Compensation
("ASC 718"). ASC 718 requires the recognition of the fair value of stock-based compensation for all stock-based payment awards, including grants of stock options and other awards made to our employees and directors in exchange for services, in the income statement. It also addresses transactions in which an entity incurs liabilities in exchange for goods or services that are based on the fair value of the entity's equity instruments or that may be settled by the issuance of those equity instruments. Accordingly, stock-based compensation cost is measured at the grant date, based on the fair value of the awards ultimately expected to vest and is recognized as an expense, on a straight-line basis, over the requisite service period. We use the Black-Scholes valuation model to measure the fair value of our stock-based awards utilizing various assumptions with respect to expected holding period, risk-free interest rates, stock price volatility and dividend yield. ASC 718 also requires forfeitures to be estimated at the time of grant and revised if necessary in subsequent periods if actual forfeitures or vesting differ from those estimates. Such revisions could have a material effect on our operating results. The assumptions we use in the valuation model are based on subjective future expectations combined with management judgment. If any of the assumptions used in the Black-Scholes model changes significantly, stock-based compensation for future awards may differ materially compared to the awards granted previously.
Accounting for Income Taxes
We must make certain estimates and judgments in the calculation of income tax expense, determination of uncertain tax positions, and in the determination of whether deferred tax assets are more likely than not to be realized. The calculation of our income tax expense and income tax liabilities involves dealing with uncertainties in the application of complex tax laws and regulations.
ASC 740-10,
Income Taxes
("ASC 740-10"), prescribes a recognition threshold and measurement framework for financial statement reporting and disclosure of tax positions taken or expected to be taken on a tax return. Under ASC 740-10, a tax position is recognized in the financial statements when it is more likely than not, based on the technical merits, that the position will be sustained upon examination, including resolution of any related appeals or litigation processes. A tax position that meets the recognition threshold is then measured to determine the largest amount of the benefit that has a greater than 50% likelihood of being realized upon settlement. Although we believe that the Company's computation of tax benefits to be recognized and realized are reasonable, no assurance can be given that the final outcome will not be different from what was reflected in our income tax provisions and accruals. Such differences could have a material impact on our net income and operating results in the period in which such determination is made. See Note 16 to the Consolidated Financial Statements accompanying this Annual Report for further information related to ASC 740-10.
We evaluate our deferred tax asset balance and record a valuation allowance to reduce the net deferred tax assets to the amount that is more likely than not to be realized. In the event it is determined that the deferred tax assets to be realized in the future would be in excess of the net recorded amount, an adjustment to the deferred tax asset valuation allowance would be recorded. This adjustment would increase income, or additional paid in capital, as appropriate, in the period such determination was made. Likewise, should it be determined that all or part of the net deferred tax asset would not be realized in the future, an adjustment to increase the deferred tax asset valuation allowance would be charged to income in the period such determination is made. In assessing the need for a valuation allowance, historical levels of income, expectations and risks associated with estimates of future taxable income and ongoing prudent and practicable tax planning strategies are considered. Realization of our deferred tax asset is dependent primarily upon future U.S. taxable income. Our judgments regarding future profitability may change due to future market conditions, changes in U.S. or international tax laws and other factors. These changes, if any, may require material adjustments to the net deferred tax asset and an accompanying reduction or increase in net income in the period in which such determinations are made.
Litigation and Contingencies
From time to time, we receive notices that our products or manufacturing processes may be infringing the patent or other intellectual property rights of others, notices of stockholder litigation or other lawsuits or claims against us. We periodically assess each matter in order to determine if a contingent liability in accordance with ASC No. 450,
Accounting for Contingencies
("ASC 450"), should be recorded. In making this determination, management may, depending on the nature of the matter, consult with internal and external legal counsel and technical experts. We expense legal fees associated with consultations and defense of lawsuits as incurred. Based on the information obtained, combined with management's judgment regarding all of the facts and circumstances of each matter, we determine whether a contingent loss is probable and whether the amount of such loss can be estimated. Should a loss be probable and estimable, we record a contingent loss in accordance with ASC 450. In determining the amount of a contingent loss, we take into consideration advice received from experts in the specific matter, current status of legal proceedings, settlement negotiations which may be ongoing, prior case history and other factors. Should the judgments and estimates made by management be incorrect, we may need to record additional contingent losses that could materially adversely impact our results of operations.
24
Alternatively, if the judgments and estimates made by management are incorrect and a particular contingent loss does not occur, the contingent loss recorded would be reversed thereby favorably impacting our results of operations.
Pursuant to the Company's charter documents and separate written indemnification agreements, we have certain indemnification obligations to our current officers and directors, as well as certain former officers and directors. Pursuant to such obligations, we have incurred substantial expenses related to legal fees for certain former officers of the Company subject to civil charges by the SEC and other governmental agencies in connection with Maxim's historical stock option granting practices. During fiscal year 2010, the Company recorded a
$173.0 million
charge in connection with an agreement to settle the class action complaint regarding its historical stock option granting practices and on July 23, 2010, the Company paid such amount into an escrow fund in accordance with the terms of the settlement. Please refer to Note 13, "Commitments and Contingencies" in the Notes to Consolidated Financial Statements included elsewhere in this Annual Report for more information on the litigation and associated settlement.
Results of Operations
The following table sets forth certain Consolidated Statements of Income data expressed as a percentage of net revenues for the periods indicated:
|
|
June 30,
2012 |
June 25,
2011 |
June 26,
2010 |
|||||
|
|
|
|
|
|
|
|
||
|
Net revenues
|
100
|
%
|
100
|
%
|
100
|
%
|
||
|
Cost of goods sold
|
39.6
|
%
|
38.1
|
%
|
40.3
|
%
|
||
|
Gross margin
|
60.4
|
%
|
61.9
|
%
|
59.7
|
%
|
||
|
Operating expenses:
|
|
|
|
|
|
|
||
|
Research and development
|
23.0
|
%
|
21.2
|
%
|
23.8
|
%
|
||
|
Selling, general and administrative
|
13.4
|
%
|
11.8
|
%
|
12.1
|
%
|
||
|
Intangible asset amortization
|
0.7
|
%
|
0.8
|
%
|
0.5
|
%
|
||
|
Impairment of long-lived assets
|
1.3
|
%
|
—
|
%
|
0.4
|
%
|
||
|
Severance and restructuring expenses
|
0.3
|
%
|
0.1
|
%
|
—
|
%
|
||
|
Other operating (income) expenses, net
|
(0.5
|
)%
|
0.8
|
%
|
8.3
|
%
|
||
|
Total operating expenses
|
38.2
|
%
|
34.7
|
%
|
45.1
|
%
|
||
|
Operating income
|
22.2
|
%
|
27.2
|
%
|
14.6
|
%
|
||
|
Interest (expense) income and other, net
|
(0.1
|
)%
|
(0.5
|
)%
|
0.4
|
%
|
||
|
Income before provision for income taxes
|
22.1
|
%
|
26.7
|
%
|
15.0
|
%
|
||
|
Provision for income taxes
|
7.4
|
%
|
7.0
|
%
|
8.8
|
%
|
||
|
Income from continuing operations
|
14.7
|
%
|
19.7
|
%
|
6.2
|
%
|
||
|
Income from discontinued operations, net of tax
|
1.3
|
%
|
—
|
%
|
—
|
%
|
||
|
Net income
|
16.0
|
%
|
19.7
|
%
|
6.2
|
%
|
||
The following table shows pre-tax stock-based compensation included in the components of the Consolidated Statements of Income reported above as a percentage of net revenues for the periods indicated:
|
|
For the Year Ended
|
|||||||
|
|
June 30,
2012 |
June 25,
2011 |
June 26,
2010 |
|||||
|
|
|
|
|
|
|
|
||
|
Cost of goods sold
|
0.5
|
%
|
0.6
|
%
|
0.8
|
%
|
||
|
Research and development
|
2.0
|
%
|
2.2
|
%
|
2.7
|
%
|
||
|
Selling, general and administrative
|
1.1
|
%
|
1.0
|
%
|
1.2
|
%
|
||
|
|
3.6
|
%
|
3.8
|
%
|
4.7
|
%
|
||
Net Revenues
We reported net revenues of
$2,403.5 million
,
$2,472.3 million
and
$1,997.6 million
in fiscal years
2012
,
2011
and
2010
, respectively. Our net revenues in fiscal year
2012
decreased by
3%
compared to our net revenues in fiscal year
2011
. This decrease occurred primarily due to decreased demand for our products in three of our end markets. Revenue from communications products, computing products and industrial products were down
21%
,
19%
and
10%
, respectively. These decreases were offset by increases in consumer products revenues of
21%
, primarily from cell phones and smart phones.
25
Our net revenues in fiscal year
2011
increased by
24%
compared to our net revenues in fiscal year
2010
. This increase occurred
in three of our end markets due to increased demand for our products, resulting in increased units shipped and increased average selling prices. Revenue from industrial products were up
35%
, consumer products were up
28%
and communications products were up
26%
. Computing products were flat year over year mainly due to exiting certain notebook products with low gross margin and focusing on a better mix, which resulted in a
16%
decrease in notebook revenue that offset the growth in other market segments.
Approximately
88%
,
85%
and
85%
of the Company's net revenues in fiscal years
2012
,
2011
and
2010
, respectively, were derived from customers located outside the United States, primarily in the Pacific Rim, Europe, and Japan. While sales are primarily denominated in U.S. dollars, the Company enters into foreign currency forward contracts to mitigate its risks on firm commitments and net monetary assets denominated in foreign currencies. The impact of changes in foreign exchange rates on net revenues and the Company's results of operations for fiscal years
2012
,
2011
and
2010
were immaterial.
Gross Margin
Our gross margin as a percentage of net revenue was
60.4%
in fiscal year
2012
compared to
61.9%
in fiscal year
2011
. The year over year decrease in gross margin was primarily attributable to lower factory utilization and higher inventory reserves of
$13.1 million
.
Our gross margin as a percentage of net revenue was
61.9%
in fiscal year
2011
compared to
59.7%
in fiscal year
2010
. Year over year improvements in gross margin was primarily due to higher factory utilization, and decreased stock-based compensation as a percentage of revenue.
Research and Development
Research and development expenses were
$552.4 million
and
$525.3 million
for fiscal years
2012
and
2011
, respectively, which represented
23.0%
and
21.2%
of net revenues, respectively. The increase in research and development expenses was largely attributable to an increase in salaries and fringe expenses of
$17.9 million
, primarily related to annual salary adjustments and an extra week in fiscal year 2012.
Research and development expenses were
$525.3 million
and
$474.7 million
for fiscal years
2011
and
2010
, respectively, which represented
21.2%
and
23.8%
of net revenues, respectively. The increase in research and development expenses was largely attributable to an increase in salaries and bonuses of
$28.1 million
, primarily due to increased headcount and higher bonus levels in connection with increased profitability for fiscal year
2011
.
The level of research and development expenditures as a percentage of net revenues will vary from period to period depending, in part, on the level of net revenues and on our success in recruiting the technical personnel needed for our new product introductions and process development. We view research and development expenditures as critical to maintaining a high level of new product introductions, which in turn are critical to our plans for future growth.
Selling, General and Administrative
Selling, general and administrative expenses were
$321.3 million
and
$292.5 million
in fiscal years
2012
and
2011
, respectively, which represented
13.4%
and
11.8%
of net revenues, respectively. The increase in selling, general, and administrative expenses for fiscal year
2012
as compared to fiscal year
2011
was largely attributable to an increase in salaries and fringe expenses of
$14.2 million
, primarily due to annual salaries adjustments and an extra week in fiscal 2012. In addition, legal expense increased by $5.1 million.
Selling, general and administrative expenses were
$292.5 million
and
$242.1 million
in fiscal years
2011
and
2010
, respectively, which represented
11.8%
and
12.1%
of net revenues, respectively. The increase in selling, general, and administrative expenses for fiscal year
2011
as compared to fiscal year
2010
was largely attributable to an increase in salaries, bonuses, and benefits of
$35.5 million
, primarily due to increased headcount and higher bonus levels in connection with increased profitability for fiscal year
2011
. In addition, travel and expensed equipment increased
$6.9 million
due to our headcount and business growth requirements.
The level of selling, general and administrative expenditures as a percentage of net revenues will vary from period to period, depending on the level of net revenues and our success in recruiting sales and administrative personnel needed to support our operations.
26
Intangible Asset Amortization Expenses
Intangible asset amortization expenses were
$16.7 million
and
$18.8 million
in fiscal years
2012
and
2011
, respectively. The decrease in intangible asset amortization expenses was attributable primarily to fiscal year 2011 amortization of customer related intangibles pertaining to the acquisition of Teridian Semiconductor, Inc ("Teridian") in May 2010, which did not recur in fiscal year 2012.
Intangible asset amortization expenses were
$18.8 million
and
$10.5 million
in fiscal years
2011
and
2010
, respectively. The increase in intangible asset amortization expenses was primarily attributable to the acquisition of Teridian in the fourth quarter of fiscal year 2010 and Phyworks in the first quarter of fiscal year 2011.
Impairment of Long-lived Assets
Impairment of long lived assets was
$30.1 million
in fiscal year
2012
and
$0.0 million
in fiscal year
2011
. The increase in impairments during fiscal year
2012
was due primarily to write-downs of certain buildings classified in the period as held for sale and certain assets identified as excess, including wafer fabrication and certain end of line manufacturing equipment.
Impairment of long lived assets was
$0.0 million
in fiscal year
2011
and
$8.3 million
in fiscal year
2010
.
The decrease in impairments during fiscal year
2011
was mainly due to
$5.0 million
end of line sorting and testing equipment write-down to its estimated fair value and a
$3.3 million
write-down of Oregon fabrication facility equipment in fiscal year 2010.
Other Operating Income (Expenses), Net
Other operating expenses, net include legal and accounting fees directly attributable to the restatement of our previously filed financial statements completed in fiscal year 2009, cost reductions due to the reversal of accruals established in prior years for payroll taxes, interest and penalties related to the misdating of option grants and exercises and losses associated with our sale of the Maxim headquarters.
Other operating (income) expenses, net were
$(11.2) million
and
$19.1 million
in fiscal years
2012
and
2011
, respectively, which represented
(0.5)%
and
0.8%
of net revenues, respectively. The decrease in other operating (income) expenses, net was attributable to the gain of
$6.5 million
from sale of one of our facilities in the third quarter of fiscal year 2012, the loss of
$14.3 million
incurred in the second quarter of fiscal year 2011 on the sale of the Sunnyvale headquarters and a decrease in payroll tax and related adjustments of
$11.0 million
.
Other operating (income) expenses, net were
$19.1 million
and
$166.2 million
in fiscal years
2011
and
2010
, respectively, which represented
0.8%
and
8.3%
of net revenues, respectively. The decrease in other operating (income) expenses, net was attributable to a
$173.0 million
fiscal year 2010 charge in connection with an agreement to settle the class action complaint. See Note 13: Commitments and Contingencies. This was partially offset by a
$14.3 million
loss on the sale of our Sunnyvale headquarters in the second quarter of fiscal year 2011.
Interest income (expense) and Other, Net
Interest (expense) income and other, net were
$(2.1) million
in fiscal year
2012
and
$(11.4) million
in fiscal year
2011
, which represented
(0.1)%
and
(0.5)%
of net revenues, respectively. The lower expense was attributable to more gain on derivatives, disposal of fixed assets and foreign currency translation of
$3.5 million
,
$2.7 million
and
$1.7 million
, respectively.
Interest (expense) income and other, net were
$(11.4) million
in fiscal year
2011
and
$8.0 million
in fiscal year
2010
, which represented
(0.5)%
and
0.4%
of net revenues, respectively. The change was partially attributable to an increase of interest expense of
$10.7 million
related to our
$300 million
long-term debt issued in June 2010, a
$4.6 million
increase in foreign exchange losses in 2011 as compared to foreign exchange gains in 2010, and a reduction in interest income of
$2.9 million
resulting from lower average interest rates and reduced average cash and short term investment balances.
Provision for Income Taxes
Our annual income tax expense from continuing operations was
$177.8 million
,
$172.7 million
, and
$174.9 million
, in fiscal years
2012
,
2011
, and
2010
, respectively. The effective tax rate from continuing operations was
33.4%
,
26.1%
and
58.3%
for fiscal years
2012
,
2011
, and
2010
, respectively. The Company's federal statutory tax rate is
35%
.
The Company's fiscal year 2012 effective tax rate was lower than the statutory tax rate primarily because of earnings of foreign
27
subsidiaries taxed at lower tax rates, partially offset by stock-based compensation for which no tax benefit is expected.
The Company's fiscal year 2011 effective tax rate was lower than the statutory tax rate primarily because of a $39.4 million benefit for the realization of unrecognized tax benefits, including related interest, and earnings of foreign subsidiaries taxed at lower tax rates, partially offset by
$8.1 million
relating to fiscal year 2010 adjustments for differences between our finalized tax return and the tax provision originally recorded. The income tax provision for the fiscal year 2011 also included a $3.6 million one-time benefit for the retroactive extension of the U.S. federal research tax credit to January 1, 2010 by legislation that was signed into law on December 17, 2010.
The fiscal year 2010 effective tax rate was higher than the statutory tax rate primarily because of losses of a foreign subsidiary for which no tax benefit was available. These foreign losses represent costs of ongoing research and development efforts as well as licensing rights to preexisting intangibles.
Discontinued operations
In the third quarter of fiscal year 2012, the Company sold its clock synchronization business for a total sale price of approximately
$44.0 million
. The Company also sold certain future technologies, including die types that will result in future products, in the storage area. The total sale price for this transaction was approximately
$15.0 million
. As a result of these two transactions, the Company recognized a gain on sale of discontinued operations of
$31.8 million
, net of income taxes.
Recently Issued Accounting Pronouncements
In September 2011, the Financial Accounting Standards Board ("FASB") issued Accounting Standards Update ("ASU") No. 2011-08 relating to Intangibles-Goodwill and Other (Topic 350)-Testing Goodwill for Impairment ("ASU 2011-08"). The ASU allows an entity to first perform a qualitative assessment to determine whether it is more likely than not that the fair value of a reporting unit is less than its carrying value. If it is concluded that it is more likely than not, an entity is required to perform the currently prescribed two-step goodwill impairment test. Otherwise, the two-step goodwill impairment test is not required. ASU 2011-08 is effective for Maxim in fiscal year 2013 and earlier adoption is permitted.
In June 2011, the FASB issued ASU No. 2011-05 relating to Comprehensive Income (Topic 220)-Presentation of Comprehensive Income, which requires an entity to present the total of comprehensive income, the components of net income, and the components of other comprehensive income either in a single continuous statement of comprehensive income or in two separate but consecutive statements. The ASU is effective for Maxim in fiscal year 2013 and should be applied retrospectively.
Financial Condition, Liquidity and Capital Resources
Financial Condition
Cash flows were as follows:
|
June 30,
2012 |
June 25,
2011 |
June 26,
2010 |
|||||||||
|
(in thousands)
|
|||||||||||
|
Net cash provided by operating activities
|
$
|
756,722
|
|
$
|
861,454
|
|
$
|
490,953
|
|
||
|
Net cash used in investing activities
|
(384,765
|
)
|
(278,334
|
)
|
(241,648
|
)
|
|||||
|
Net cash used in financing activities
|
(453,438
|
)
|
(447,091
|
)
|
(132,141
|
)
|
|||||
|
Net (decrease) increase in cash and cash equivalents
|
$
|
(81,481
|
)
|
$
|
136,029
|
|
$
|
117,164
|
|
||
Operating activities
Cash provided by operating activities is net income adjusted for certain non-cash items and changes in certain assets and liabilities.
Cash from operations for the year
2012
decreased by approximately
$104.7 million
compared with fiscal year
2011
. This was due to a decrease in net income of
$102.3 million
, a decrease in deferred taxes of
$109.3 million
and a decrease in other accrued liabilities, other current assets, accounts receivables and gain from discontinued operations of $263.5 million over fiscal year
2012
. These decreases were offset by an increase in income tax payable of
$180.3 million
over fiscal year 2012 and the payment of $173.0 million in July, 2010 relating to the litigation settlement, which was accrued for in fiscal year 2010.
28
Cash from operations for fiscal year
2011
increased by approximately
$370.5 million
compared with fiscal year
2010
. This was due to an increase in net income of
$363.9 million
, a reduction in the receivables by
$167.5 million
and a reduction in other current assets by
$132.6 million
, during fiscal year
2011
, as compared to fiscal year
2010
. These increases were offset by the payment of
$173.0 million
in July, 2010 relating to the litigation settlement, which was accrued for in fiscal year 2010. (For more information on contingencies, see Note 13 to the Consolidated Financial Statements accompanying this Annual Report).
Investing activities
Investing cash flows consist primarily of capital expenditures, net investment purchases and maturities and acquisitions.
Cash used in investing activities increased by
$106.4 million
for fiscal year
2012
compared with fiscal year
2011
. The increase was due primarily to an increase in net capital expenditures relating to property, plant and equipment of
$99.8 million
and an increase of
$87.6 million
relating to increased level of acquisitions. These increases were offset by
$56.6 million
in proceeds from sale of discontinued operations and a
$24.7 million
reduction in purchases of short-term investments.
Cash used in investing activities increased by
$36.7 million
for fiscal year
2011
compared with fiscal year
2010
. The increase was due primarily to
$200.2 million
proceeds from maturity of short-term investments in the fiscal year ended 2010, that did not recur in fiscal year 2011,
$49.8 million
relating to purchase of short-term investments and an increase of
$26.5 million
in net capital expenditures relating to property, plant and equipment, including the proceeds from the sale of our Sunnyvale headquarters. The increase was offset by
$235.9 million
representing less cash used for acquisitions.
Financing activities
Financing cash flows consist primarily of repurchases of common stock, payment of dividends to stockholders and withholding tax payments associated with net share settlements of equity awards.
Net cash used in financing activities increased by approximately
$6.3 million
for fiscal year
2012
compared with fiscal year
2011
. This increase was due primarily to higher repayments of notes payable of
$19.4 million
and greater repurchases of common stock of
$15.4 million
. These increases were offset by
$25.1 million
of higher proceeds received from exercise of stock options.
Net cash used in financing activities increased by approximately
$315.0 million
for fiscal year
2011
compared with fiscal year
2010
. This increase was due primarily to cash proceeds from issuance of debt in 2010 of
$298.6 million
which did not reoccur in 2011.
Liquidity and Capital Resources
Debt Levels
On June 17, 2010, we completed a public offering of
$300 million
aggregate principal amount of the Company's
3.45%
senior unsecured and unsubordinated notes due on June 14, 2013, In addition, on July 18, 2011, we acquired certain fixed and floating rate notes in conjunction with our acquisition of SensorDynamics. (Please refer to Note 5: Financial Instruments to the Consolidated Financial Statements).
Outstanding debt increased to
$309 million
as of
June 30, 2012
as compared to
$300 million
at
June 25, 2011
, bearing weighted average interest rates of
3.45%
and
3.49%
for the year ended
June 30, 2012
and
June 25, 2011
, respectively. The increase was driven by the debt assumed in and still outstanding from the SensorDynamics acquisition.
Available borrowing resources
As of
June 30, 2012
, the Company had the capacity to issue an unspecified amount of additional debt securities, common stock, preferred stock, warrants, rights and units under the 2010 Shelf Registration Statement.
On October 13, 2011, the Company entered into a
$250 million
senior unsecured revolving credit facility with certain institutional lenders that expires on October 13, 2016. The Company has agreed to pay the lenders a facility fee at a rate per annum that varies based on the Company's index debt rating. Any advances under the credit agreement will accrue interest at a base rate plus a margin based on the Company's index debt rating. The credit agreement requires the Company to comply with certain covenants, including a requirement that the Company maintain a ratio of debt to EBITDA (earnings before interest, taxes, depreciation, and amortization)
29
of not more than
3
to
1
and a minimum interest coverage ratio (EBITDA divided by interest expense) greater than 3.5 to 1. As of
June 30, 2012
, the Company had not borrowed any amounts from this credit facility and was in compliance with all debt covenants.
As of
June 30, 2012
, our available funds consisted of
$956 million
in cash, cash equivalents and short-term investments. We anticipate that the available funds and cash generated from operations will be sufficient to meet cash and working capital requirements, including the anticipated level of capital expenditures, common stock repurchases, debt repayments and dividend payments for at least the next twelve months.
Contractual Obligations
The following table summarizes the Company's significant contractual obligations at
June 30, 2012
, and the effect such obligations are expected to have on the Company's liquidity and cash flows in future periods. This table excludes amounts already recorded on our Consolidated Balance Sheet as current liabilities at
June 30, 2012
:
|
|
Total
|
Less than
1 year
|
2-3 years
|
4-5 years
|
More than
5 years
|
||||||||||||||
|
|
(Amounts in thousands)
|
||||||||||||||||||
|
Operating lease obligations (1)
|
$
|
40,390
|
|
$
|
10,993
|
|
$
|
14,625
|
|
$
|
9,951
|
|
$
|
4,821
|
|
||||
|
Royalty obligations (2)
|
10,000
|
|
10,000
|
|
—
|
|
—
|
|
—
|
|
|||||||||
|
Long-term debt obligations (3)
|
309,088
|
|
303,496
|
|
2,028
|
|
2,599
|
|
965
|
|
|||||||||
|
Interest payments associated with long-term debt obligations (4)
|
10,806
|
|
10,554
|
|
168
|
|
79
|
|
5
|
|
|||||||||
|
Capital equipment and inventory related purchase obligations (5)
|
19,258
|
|
2,162
|
|
4,564
|
|
4,564
|
|
7,968
|
|
|||||||||
|
Total
|
$
|
389,542
|
|
$
|
337,205
|
|
$
|
21,385
|
|
$
|
17,193
|
|
$
|
13,759
|
|
||||
(1) The Company leases some facilities under non-cancelable operating lease agreements that expire at various dates through 2025.
(2) Royalty obligations represent payments for licensed patents.
(3) Long-term debt represents amounts due for the Company's $300 million notes due 2013 and other notes acquired through the SensorDynamics acquisition.
(4) Interest payments associated with the Company's $300 million notes due 2013 and other notes acquired through the SensorDynamics acquisition.
(5) Capital equipment purchase obligations represent commitments for purchase of property, plant and equipment. The Company orders some materials and supplies in advance or with minimum purchase quantities. The Company is obligated to pay for the materials and supplies when received.
Purchase orders for the purchase of the majority of our raw materials and other goods and services are not included above. Our purchase orders generally allow for cancellation without significant penalties. We do not have significant agreements for the purchase of raw materials or other goods specifying minimum quantities or set prices that exceed our expected short-term requirements.
As of
June 30, 2012
, our gross unrecognized income tax benefits were
$228.9 million
, which excludes
$10.6 million
of accrued interest and penalties. At this time, we are unable to make a reasonably reliable estimate of the timing of payments of these amounts, if any, in individual years due to uncertainties in the timing or outcomes of either actual or anticipated tax audits. As a result, these amounts are not included in the table above.
Off-Balance-Sheet Arrangements
As of
June 30, 2012
, the Company did not have any material off-balance-sheet arrangements, as defined in Item 303(a)(4)(ii) of SEC Regulation S-K.
Interest Rate Risk
The Company's exposure to market risk for changes in interest rates relates primarily to the Company's cash and cash equivalents, short term investments and notes payable. See Note 5 "Financial Instruments" to the Consolidated Financial Statements included in this Annual Report. The Company does not use derivative financial instruments to hedge the risk of interest rate volatility. At
30
June 30, 2012
, the Company maintained a significant portfolio of money market fund investments, which are included in cash and cash equivalents. These money market funds are all available on a daily basis.
Foreign Currency Risk
The Company generates revenues in various global markets based on orders obtained in non-U.S. currencies, primarily the Japanese Yen, the Euro and the British Pound. Maxim incurs expenditures denominated in non-U.S. currencies, principally the Philippine Pesos and Thai Baht associated with the Company's manufacturing activities in the Philippines and Thailand, respectively, and expenditures for sales offices and research and development activities undertaken outside of the U.S. Maxim is exposed to fluctuations in foreign currency exchange rates primarily on orders and accounts receivable from sales in these foreign currencies and cash flows for expenditures in these foreign currencies. Maxim has established risk management strategies designed to reduce the impact of volatility of future cash flows caused by changes in the exchange rate for these currencies. These strategies reduce, but do not entirely eliminate, the impact of currency exchange rates movements. Maxim does not use derivative financial instruments for speculative or trading purposes. The Company routinely hedges its exposures to certain foreign currencies with various financial institutions in an effort to minimize the impact of certain currency exchange rate fluctuations. If a financial counterparty to any of the Company's hedging arrangements experiences financial difficulties or is otherwise unable to honor the terms of the foreign currency hedge, the Company may experience financial losses.
For derivative instruments that are designated and qualify as cash flow hedges under ASC No. 815-
Derivatives and Hedging
("ASC 815"), the effective portion of the gain or loss on the derivative is reported as a component of accumulated other comprehensive loss and reclassified into earnings into the same financial statement line as the item being hedged, and in the same period or periods during which the hedged transaction affects earnings. Gains and losses on the derivative representing either hedge ineffectiveness or hedge components excluded from the assessment of effectiveness are recognized in interest and other expense, net.
For derivative instruments that are not designated as hedging instruments under ASC 815, gains and losses are recognized in interest and other expense, net. All derivatives are foreign currency forward contracts to hedge certain foreign currency denominated assets or liabilities. The gains and losses on these derivatives largely offset the changes in the fair value of the assets or liabilities being hedged.
Foreign exchange contracts
The net unrealized gain or loss, if any, is potentially subject to market and credit risk as it represents appreciation (decline) of the hedge position against the spot exchange rates. The net realized and unrealized gains or losses from hedging foreign currency denominated assets and liabilities were immaterial during the year ended
June 30, 2012
and
June 25, 2011
.
The financial statements and supplementary data required by this Item are set forth at the pages indicated in Item 15(a) of this Annual Report.
None.
Evaluation of Disclosure Controls and Procedures
Our management, with the participation of our chief executive officer ("CEO") and our chief financial officer ("CFO"), evaluated the effectiveness of our disclosure controls and procedures as defined in Rules 13a-15(e) and 15d-15(e) of the Exchange Act as of
June 30, 2012
. The purpose of these controls and procedures is to ensure that information required to be disclosed in the reports we file or submit under the Exchange Act is recorded, processed, summarized and reported within the time periods specified in the SEC rules, and that such information is accumulated and communicated to our management, including our CEO and our CFO, to allow timely decisions regarding required disclosures. Based on the evaluation, our management, including our CEO and our CFO, concluded that our disclosure controls and procedures were effective as of
June 30, 2012
.
31
Management's Annual Report on Internal Control over Financial Reporting
Our management is responsible for establishing and maintaining adequate internal control over financial reporting, as defined in Rules 13a-15(f) and 15d-15(f) under the Exchange Act. Internal control over financial reporting is a process designed by, or under the supervision of, the Company's CEO and CFO and effected by the Company's Board of Directors, management, and others to provide reasonable assurance regarding the reliability of financial reporting and the preparation of financial statements for external purposes in accordance with GAAP. Our management, with the participation of our CEO and our CFO, assessed the effectiveness of our internal control over financial reporting as of
June 30, 2012
. Management's assessment of internal control over financial reporting was conducted using the criteria in Internal Control - Integrated Framework issued by the Committee of Sponsoring Organizations of the Treadway Commission. Our management has concluded that, as of
June 30, 2012
, our internal control over financial reporting was effective, in all material respects, based on these criteria. Deloitte & Touche LLP, an Independent Registered Public Accounting Firm, audited the effectiveness of the Company's internal control over financial reporting, as stated within their report which is included herein.
Changes in Internal Control over Financial Reporting
There were no changes in our internal control over financial reporting during the quarter ended
June 30, 2012
that have materially affected or are reasonably likely to materially affect, our internal control over financial reporting.
Inherent Limitations on the Effectiveness of Internal Controls
A system of internal control over financial reporting is intended to provide reasonable assurance regarding the reliability of financial reporting and the preparation of financial statements in accordance with GAAP and no control system, no matter how well designed and operated, can provide absolute assurance. The design of any control system is based in part upon certain assumptions about the likelihood of future events, and there can be no assurance that any design will succeed in achieving its stated goals under all potential future conditions. Because of its inherent limitations, internal control over financial reporting may not prevent or detect financial statement errors and misstatements. Also, projection of any evaluation of effectiveness to future periods is subject to the risk that controls may become inadequate because of changes in conditions or that the degree of compliance with the policies or procedures may deteriorate.
32
REPORT OF INDEPENDENT REGISTERED PUBLIC ACCOUNTING FIRM
To the Board of Directors and Stockholders of
Maxim Integrated Products, Inc.
San Jose, California
We have audited the internal control over financial reporting of Maxim Integrated Products, Inc. and subsidiaries (the "Company") as of June 30, 2012, based on the criteria established in
Internal Control - Integrated Framework
issued by the Committee of Sponsoring Organizations of the Treadway Commission. The Company's management is responsible for maintaining effective internal control over financial reporting and for its assessment of the effectiveness of internal control over financial reporting, included in the accompanying Management's Annual Report on Internal Control over Financial Reporting. Our responsibility is to express an opinion on the Company's internal control over financial reporting based on our audit.
We conducted our audit in accordance with the standards of the Public Company Accounting Oversight Board (United States). Those standards require that we plan and perform the audit to obtain reasonable assurance about whether effective internal control over financial reporting was maintained in all material respects. Our audit included obtaining an understanding of internal control over financial reporting, assessing the risk that a material weakness exists, testing and evaluating the design and operating effectiveness of internal control based on the assessed risk, and performing such other procedures as we considered necessary in the circumstances. We believe that our audit provides a reasonable basis for our opinion.
A company's internal control over financial reporting is a process designed by, or under the supervision of, the company's principal executive and principal financial officers, or persons performing similar functions, and effected by the company's board of directors, management, and other personnel to provide reasonable assurance regarding the reliability of financial reporting and the preparation of financial statements for external purposes in accordance with generally accepted accounting principles. A company's internal control over financial reporting includes those policies and procedures that (1) pertain to the maintenance of records that, in reasonable detail, accurately and fairly reflect the transactions and dispositions of the assets of the company; (2) provide reasonable assurance that transactions are recorded as necessary to permit preparation of financial statements in accordance with generally accepted accounting principles, and that receipts and expenditures of the company are being made only in accordance with authorizations of management and directors of the company; and (3) provide reasonable assurance regarding prevention or timely detection of unauthorized acquisition, use, or disposition of the company's assets that could have a material effect on the financial statements.
Because of the inherent limitations of internal control over financial reporting, including the possibility of collusion or improper management override of controls, material misstatements due to error or fraud may not be prevented or detected on a timely basis. Also, projections of any evaluation of the effectiveness of the internal control over financial reporting to future periods are subject to the risk that the controls may become inadequate because of changes in conditions, or that the degree of compliance with the policies or procedures may deteriorate.
In our opinion, the Company maintained, in all material respects, effective internal control over financial reporting as of June 30, 2012, based on the criteria established in
Internal Control - Integrated Framework
issued by the Committee of Sponsoring Organizations of the Treadway Commission.
We have also audited, in accordance with the standards of the Public Company Accounting Oversight Board (United States), the consolidated financial statements and financial statement schedule as of and for the year ended June 30, 2012 of the Company and our report dated
August 17, 2012
expressed an unqualified opinion on those financial statements and financial statement schedule.
DELOITTE & TOUCHE LLP
San Jose, California
August 17, 2012
33
None.
Other than as follows, the information required by this Item is incorporated by reference from the Company's Proxy Statement for the
2012
Annual Meeting of Stockholders under the headings "Audit Committee and Audit Committee Financial Expert," "Proposal 1 - Election of Directors" and "Compliance with Section 16(a) of the Securities Exchange Act of 1934."
Executive Officers of the Registrant
The following is information regarding our executive officers, including their positions and ages as of
June 30, 2012
.
|
Name
|
Age
|
Position
|
||
|
Tunc Doluca
|
54
|
President and Chief Executive Officer
|
||
|
Bruce E. Kiddoo
|
51
|
Senior Vice President and Chief Financial Officer
|
||
|
David A. Caron
|
52
|
Vice President and Principal Accounting Officer
|
||
|
Vivek Jain
|
52
|
Senior Vice President of Manufacturing Operations
|
||
|
Chae Lee
|
47
|
Senior Vice President, Mobility Group
|
||
|
Edwin Medlin
|
55
|
Vice President, General Counsel
|
||
|
Matthew J. Murphy
|
39
|
Senior Vice President, Communications and Automotive Solutions Group
|
||
|
Christopher J. Neil
|
46
|
Senior Vice President, Industrial and Medical Solutions Group
|
||
|
Pirooz Parvarandeh
|
52
|
Chief Technology Officer
|
||
|
Walter Sangalli
|
55
|
Vice President, Worldwide Sales and Marketing
|
||
|
Steven Yamasaki
|
57
|
Vice President of Human Resources
|
||
Mr. Doluca has served as a director of Maxim as well as the President and Chief Executive Officer since January 2007. He joined Maxim in October 1984 and served as Vice President from 1994 to 2004. He was promoted to Senior Vice President in 2004 and Group President in May 2005. Prior to 1994, he served in a number of integrated circuit development positions.
Mr. Kiddoo joined Maxim in September 2007 as Vice President of Finance. On October 1, 2008, immediately following the completion of Maxim's restatement of previously filed financial statements, Mr. Kiddoo was appointed Chief Financial Officer and Principal Accounting Officer of Maxim and was appointed Senior Vice President in September 2009. Prior to joining Maxim, Mr. Kiddoo held various positions at Broadcom Corporation, a global semiconductor company, beginning in December 1999. Mr. Kiddoo served as Broadcom's Corporate Controller and Principal Accounting Officer from July 2002 and served as Vice President from January 2003. He also served as Broadcom's Acting Chief Financial Officer from September 2006 to March 2007.
Mr. Caron has served as Maxim's Corporate Controller since July 2003 and, prior to that, served as Maxim's Director of Accounting from December 1998 to July 2003. Mr. Caron was appointed Vice President and Principal Accounting Officer in August 2010. Mr. Caron is a Certified Public Accountant in the state of California and holds a Bachelor of Science in Accounting from San Jose State University.
Mr. Jain joined Maxim in April 2007 as Vice President responsible for our wafer fabrication operations. In June 2009 Mr. Jain was promoted to Senior Vice President with expanded responsibility for managing test and assembly operations in addition to wafer fabrication operations. Prior to joining Maxim, Mr. Jain was Plant Manager for several years at Intel Corporation's Technology Development and Manufacturing facility in Santa Clara, California responsible for 65nm flash manufacturing/transfer and development of 45nm flash technology. Mr. Jain has published over 30 papers and holds over 10 patents in the field of semiconductor technology.
Mr. Lee joined Maxim in 1999 and was promoted to Vice President in 2007. He was promoted to Senior Vice President in May 2012. Prior to 2007, he served in a number of business unit and engineering positions.
Mr. Medlin joined Maxim in November 1999 as Director and Associate General Counsel. He was promoted to Vice President
34
and Senior Counsel in April 2006 and appointed General Counsel in August 2010. Prior to joining Maxim, he was with the law firm of Ropers, Majeski, Kohn and Bentley from 1987 to 1994 where he held various positions, including director. From 1994 to 1997 he was with Fox Factory, Inc., a privately held manufacturing company where he held the positions of General Counsel, and later, General Manager. From 1997 to 1999 he was with RockShox, Inc., a publicly traded corporation, where he held the positions of General Counsel and then Vice President of Global Sales and Marketing.
Mr. Murphy joined Maxim in July 1994 and was promoted to Vice President of Sales in November 2006. He was promoted to Senior Vice President in September 2011. In October 2011 he assumed responsibility for the Communications and Automotive Group. Prior to 2006, he served in a number of business unit and executive management positions.
Mr. Neil joined Maxim in September 1990 and was promoted to Vice President in April 2006. He was promoted to Senior Vice President in September 2011. Prior to 2006, he held several engineering and executive management positions.
Mr. Parvarandeh joined Maxim in July 1987 and served as Vice President from 1997 to 2004. He was promoted to Senior Vice President in 2004 and Group President in May 2005.
In September 2010, Mr. Parvarandeh was also appointed Chief Technical Officer.
Prior to 1997, he served in a number of integrated circuit development positions.
Mr. Sangalli joined Maxim in 1992 as a senior field applications engineer and was promoted to Vice President of Worldwide Sales and Marketing in October 2011. Prior to his promotion to Vice President, he managed all sales and application functions in Europe since 2002.
Mr. Yamasaki
joined Maxim in April 2010 as Vice President of Human Resources. Prior to joining Maxim, he was Corporate Vice President of Human Resources of Applied Materials from 2008 to 2010, and was Executive Vice President of Human Resources of YRC Worldwide from 2004 to 2008. Before joining YRC Worldwide, Mr. Yamasaki was Vice President of Human Resources at ConAgra Foods Inc. and Honeywell International.
Code of Business Conduct and Ethics
We have a Code of Business Conduct and Ethics (the "Code of Ethics"), which applies to all directors and employees, including, but not limited to, our principal executive officer, principal financial officer and principal accounting officer. The Code of Ethics is designed to promote: (i) honest and ethical conduct, including the ethical handling of actual or apparent conflicts of interest arising from personal and professional relationships, (ii) full, fair, accurate, timely and understandable disclosure in reports and documents that we are required to file with the SEC and in other public communications, (iii) compliance with applicable governmental laws, rules and regulations, (iv) the prompt internal reporting of violations of the Code of Ethics to an appropriate person or group, and (v) accountability for adherence to the Code of Ethics. A copy of the Code of Ethics is available on our website at http://www.maxim-ic.com/company/policy. A hard copy of the Code of Ethics will be sent free of charge upon request.
The information required by this item is incorporated by reference from the Company's Proxy Statement for the
2012
Annual Meeting of Stockholders under the headings "Director Compensation," "Compensation Discussion and Analysis," "Report of Compensation Committee" and "Executive Compensation."
The information required by this item is incorporated by reference from the Company's Proxy Statement for the
2012
Annual Meeting of Stockholders under the heading "Security Ownership of Certain Beneficial Owners and Management and Related Stockholder Matters. "
The information required by this item is incorporated by reference from the Company's Proxy Statement for the
2012
Annual Meeting of Stockholders under the headings "Corporate Governance" and "Certain Relationships and Related Transactions."
The information required by this item is incorporated by reference from the Company's Proxy Statement for the
2012
Annual Meeting of Stockholders under the headings "Report of the Audit Committee" and "Principal Accountant Fees and Services."
35
(a) The following are filed as part of this Report:
|
Page
|
||||
|
(1)
|
Financial Statements.
|
|||
|
|
Consolidated Balance Sheets at June 30, 2012 and June 25, 2011
|
|||
|
|
Consolidated Statements of Income for each of the three years in the period ended June 30, 2012
|
|||
|
|
Consolidated Statements of Stockholders' Equity for each of the three years in the period ended June 30, 2012
|
|||
|
|
Consolidated Statements of Cash Flows for each of the three years in the period ended June 30, 2012
|
|||
|
|
Notes to Consolidated Financial Statements
|
|||
|
Report of Independent Registered Public Accounting Firm
|
||||
|
(2)
|
Financial Statement Schedule.
|
|||
|
The following financial statement schedule is filed as part of this Annual Report on Form 10-K and should be read in conjunction with the financial statements.
|
||||
|
Schedule II - Valuation and Qualifying Accounts
|
||||
|
All other schedules are omitted because they are not applicable, or because the required information is included in the consolidated financial statements or notes thereto.
|
||||
|
(3)
|
The Exhibits filed as a part of this Report are listed in the attached Index to Exhibits.
|
|||
(b)
Exhibits
.
See attached Index to Exhibits.
36
MAXIM INTEGRATED PRODUCTS, INC.
(In thousands, except par value)
|
|
June 30,
2012 |
June 25,
2011 |
|||||
|
|
|
|
|
|
|||
|
ASSETS
|
|||||||
|
Current assets:
|
|
|
|
|
|||
|
Cash and cash equivalents
|
$
|
881,060
|
|
$
|
962,541
|
|
|
|
Short-term investments
|
75,326
|
|
50,346
|
|
|||
|
Total cash, cash equivalents and short-term investments
|
956,386
|
|
1,012,887
|
|
|||
|
Accounts receivable, net of allowances of $12,529 in 2012 and $17,697 in 2011
|
317,461
|
|
297,632
|
|
|||
|
Inventories
|
242,162
|
|
237,928
|
|
|||
|
Deferred tax assets
|
98,180
|
|
113,427
|
|
|||
|
Other current assets
|
85,177
|
|
65,978
|
|
|||
|
Total current assets
|
1,699,366
|
|
1,727,852
|
|
|||
|
Property, plant and equipment, net
|
1,353,606
|
|
1,308,850
|
|
|||
|
Intangible assets, net
|
208,913
|
|
204,263
|
|
|||
|
Goodwill
|
423,073
|
|
265,125
|
|
|||
|
Other assets
|
52,988
|
|
21,653
|
|
|||
|
TOTAL ASSETS
|
$
|
3,737,946
|
|
$
|
3,527,743
|
|
|
|
|
|
|
|||||
|
LIABILITIES AND STOCKHOLDERS' EQUITY
|
|||||||
|
Current liabilities:
|
|
|
|||||
|
Accounts payable
|
$
|
147,086
|
|
$
|
110,153
|
|
|
|
Income taxes payable
|
22,589
|
|
3,912
|
|
|||
|
Accrued salary and related expenses
|
191,846
|
|
215,627
|
|
|||
|
Accrued expenses
|
64,092
|
|
47,767
|
|
|||
|
Current portion of long-term debt
|
303,496
|
|
—
|
|
|||
|
Deferred income on shipments to distributors
|
26,280
|
|
36,881
|
|
|||
|
Total current liabilities
|
755,389
|
|
414,340
|
|
|||
|
Long term debt
|
5,592
|
|
300,000
|
|
|||
|
Income taxes payable
|
212,389
|
|
96,099
|
|
|||
|
Deferred tax liabilities
|
198,502
|
|
183,715
|
|
|||
|
Other liabilities
|
27,797
|
|
22,771
|
|
|||
|
Total liabilities
|
1,199,669
|
|
1,016,925
|
|
|||
|
Commitments and contingencies (Note 13)
|
|
|
|
|
|||
|
|
|||||||
|
Stockholders' equity:
|
|||||||
|
Preferred stock, $0.001 par value
|
|||||||
|
Authorized: 2,000 shares, issued and outstanding: none
|
—
|
|
—
|
|
|||
|
Common stock, $0.001 par value
|
|||||||
|
Authorized: 960,000 shares
|
|||||||
|
Issued and outstanding: 292,732 in 2012 and 295,780 in 2011
|
293
|
|
296
|
|
|||
|
Additional paid-in capital
|
—
|
|
—
|
|
|||
|
Retained earnings
|
2,553,418
|
|
2,524,790
|
|
|||
|
Accumulated other comprehensive loss
|
(15,434
|
)
|
(14,268
|
)
|
|||
|
Total stockholders' equity
|
2,538,277
|
|
2,510,818
|
|
|||
|
TOTAL LIABILITIES & STOCKHOLDERS' EQUITY
|
$
|
3,737,946
|
|
$
|
3,527,743
|
|
|
See accompanying Notes to Consolidated Financial Statements.
37
MAXIM INTEGRATED PRODUCTS, INC.
(In thousands, except per share data)
|
|
For the Years Ended
|
||||||||||
|
|
June 30,
2012 |
June 25,
2011 |
June 26,
2010 |
||||||||
|
|
|||||||||||
|
Net revenues
|
$
|
2,403,529
|
|
$
|
2,472,341
|
|
$
|
1,997,603
|
|
||
|
Cost of goods sold
|
952,677
|
|
942,377
|
|
804,537
|
|
|||||
|
Gross margin
|
1,450,852
|
|
1,529,964
|
|
1,193,066
|
|
|||||
|
Operating expenses:
|
|
|
|
|
|
|
|||||
|
Research and development
|
552,379
|
|
525,308
|
|
474,652
|
|
|||||
|
Selling, general and administrative
|
321,273
|
|
292,494
|
|
242,144
|
|
|||||
|
Intangible asset amortization
|
16,737
|
|
18,752
|
|
10,477
|
|
|||||
|
Impairment of long-lived assets
|
30,095
|
|
—
|
|
8,291
|
|
|||||
|
Severance and restructuring expenses
|
6,785
|
|
1,247
|
|
(699
|
)
|
|||||
|
Other operating (income) expenses, net
|
(11,214
|
)
|
19,124
|
|
166,151
|
|
|||||
|
Total operating expenses
|
916,055
|
|
856,925
|
|
901,016
|
|
|||||
|
Operating income
|
534,797
|
|
673,039
|
|
292,050
|
|
|||||
|
Interest (expense) income and other, net
|
(2,064
|
)
|
(11,368
|
)
|
8,013
|
|
|||||
|
Income before provision for income taxes
|
532,733
|
|
661,671
|
|
300,063
|
|
|||||
|
Provision for income taxes
|
177,815
|
|
172,662
|
|
174,924
|
|
|||||
|
Income from continuing operations
|
354,918
|
|
489,009
|
|
125,139
|
|
|||||
|
Income from discontinued operations, net of tax
|
31,809
|
|
—
|
|
—
|
|
|||||
|
Net income
|
$
|
386,727
|
|
$
|
489,009
|
|
$
|
125,139
|
|
||
|
|
|
|
|
|
|
|
|||||
|
Earnings per share: basic
|
|
|
|
|
|
|
|||||
|
From continuing operations
|
$
|
1.21
|
|
$
|
1.65
|
|
$
|
0.41
|
|
||
|
From discontinued operations
|
0.11
|
|
—
|
|
—
|
|
|||||
|
Basic
|
$
|
1.32
|
|
$
|
1.65
|
|
$
|
0.41
|
|
||
|
Earnings per share: diluted
|
|||||||||||
|
From continuing operations
|
$
|
1.18
|
|
$
|
1.61
|
|
$
|
0.40
|
|
||
|
From discontinued operations
|
0.11
|
|
—
|
|
—
|
|
|||||
|
Diluted
|
$
|
1.29
|
|
$
|
1.61
|
|
$
|
0.40
|
|
||
|
Shares used in the calculation of earnings per share:
|
|
|
|
|
|
|
|||||
|
Basic
|
292,810
|
|
296,755
|
|
304,579
|
|
|||||
|
Diluted
|
300,002
|
|
303,377
|
|
310,016
|
|
|||||
|
|
|
|
|
|
|
|
|||||
|
Dividends paid per share
|
$0.88
|
$0.84
|
$0.80
|
||||||||
See accompanying Notes to Consolidated Financial Statements.
38
MAXIM INTEGRATED PRODUCTS, INC.
CONSOLIDATED STATEMENT OF STOCKHOLDERS' EQUITY
|
|
Common Stock
|
Additional
|
Accumulated Other
|
Total
|
||||||||||||||||||
|
(In thousands)
|
Shares
|
Par Value
|
Paid-In Capital
|
Retained Earnings
|
Comprehensive Loss
|
Stockholders' Equity
|
||||||||||||||||
|
Balance, June 27, 2009
|
306,019
|
|
$
|
306
|
|
$
|
21,205
|
|
$
|
2,580,610
|
|
$
|
(7,656
|
)
|
$
|
2,594,465
|
|
|||||
|
Components of comprehensive income:
|
|
|
|
|
|
|
|
|
|
|
|
|
||||||||||
|
Net income
|
|
|
|
|
|
|
125,139
|
|
125,139
|
|
||||||||||||
|
Unrealized actuarial loss on post-retirement benefits, net of tax
|
|
|
|
|
|
|
(896
|
)
|
(896
|
)
|
||||||||||||
|
Tax effect of the unrealized exchange gain on long-term intercompany receivable
|
|
|
|
|
|
|
(1,893
|
)
|
(1,893
|
)
|
||||||||||||
|
Unrealized loss on available-for-sale investments, net of tax
|
|
|
|
|
|
|
(1,346
|
)
|
(1,346
|
)
|
||||||||||||
|
Unrealized loss on forward-exchange contracts, net of tax
|
(150
|
)
|
(150
|
)
|
||||||||||||||||||
|
Total comprehensive income
|
|
|
|
|
|
|
120,854
|
|
||||||||||||||
|
Repurchase of common stock
|
(10,303
|
)
|
(10
|
)
|
(93,499
|
)
|
(97,396
|
)
|
(190,905
|
)
|
||||||||||||
|
Common stock issued under stock plans, net of shares withheld for employee taxes
|
3,295
|
|
3
|
|
(29,475
|
)
|
(29,472
|
)
|
||||||||||||||
|
Stock based compensation
|
90,440
|
|
90,440
|
|
||||||||||||||||||
|
Tax shortfall on settlement of equity instruments
|
(15,748
|
)
|
(15,748
|
)
|
||||||||||||||||||
|
Derivative settlement, net of tax
|
3,512
|
|
3,512
|
|
||||||||||||||||||
|
Modification of equity instruments to liability
|
(1,205
|
)
|
(1,205
|
)
|
||||||||||||||||||
|
Common stock issued under Employee Stock Purchase Plan
|
1,837
|
|
2
|
|
24,770
|
|
24,772
|
|
||||||||||||||
|
Dividends paid
|
(243,755
|
)
|
(243,755
|
)
|
||||||||||||||||||
|
Balance, June 26, 2010
|
300,848
|
|
$
|
301
|
|
$
|
—
|
|
$
|
2,364,598
|
|
$
|
(11,941
|
)
|
$
|
2,352,958
|
|
|||||
|
Components of comprehensive income:
|
|
|
|
|
|
|
|
|
|
|
|
|
||||||||||
|
Net income
|
489,009
|
|
489,009
|
|
||||||||||||||||||
|
Unrealized actuarial loss on post-retirement benefits, net of tax
|
(289
|
)
|
(289
|
)
|
||||||||||||||||||
|
Tax effect of the unrealized exchange gain on long-term intercompany receivable
|
(2,369
|
)
|
(2,369
|
)
|
||||||||||||||||||
|
Unrealized gain on available-for-sale investments, net of tax
|
331
|
|
331
|
|
||||||||||||||||||
|
Total comprehensive income
|
486,682
|
|
||||||||||||||||||||
|
Repurchase of common stock
|
(10,880
|
)
|
(11
|
)
|
(151,329
|
)
|
(79,672
|
)
|
(231,012
|
)
|
||||||||||||
|
Common stock issued under stock plans, net of shares withheld for employee taxes
|
2,660
|
|
3
|
|
(28,839
|
)
|
(28,836
|
)
|
||||||||||||||
|
Stock options exercised
|
1,461
|
|
1
|
|
24,829
|
|
24,830
|
|
||||||||||||||
|
Stock based compensation
|
93,623
|
|
93,623
|
|
||||||||||||||||||
|
Tax benefit on settlement of equity instruments
|
30,546
|
|
30,546
|
|
||||||||||||||||||
|
Modification of liability instruments to equity
|
2,350
|
|
2,350
|
|
||||||||||||||||||
|
Common stock issued under Employee Stock Purchase Plan
|
1,691
|
|
2
|
|
28,820
|
|
28,822
|
|
||||||||||||||
|
Dividends paid
|
(249,145
|
)
|
(249,145
|
)
|
||||||||||||||||||
|
Balance, June 25, 2011
|
295,780
|
|
$
|
296
|
|
$
|
—
|
|
$
|
2,524,790
|
|
$
|
(14,268
|
)
|
$
|
2,510,818
|
|
|||||
|
Components of comprehensive income:
|
||||||||||||||||||||||
|
Net income
|
386,727
|
|
386,727
|
|
||||||||||||||||||
|
Unrealized actuarial loss on post-retirement benefits, net of tax
|
(2,603
|
)
|
(2,603
|
)
|
||||||||||||||||||
|
Tax effect of the unrealized exchange loss on long-term intercompany receivable
|
1,612
|
|
1,612
|
|
||||||||||||||||||
|
Unrealized loss on available-for-sale investments, net of tax
|
(129
|
)
|
(129
|
)
|
||||||||||||||||||
|
Unrealized loss on foreign exchange forward contracts, net of tax
|
(46
|
)
|
(46
|
)
|
||||||||||||||||||
|
Total comprehensive income
|
385,561
|
|
||||||||||||||||||||
|
Repurchase of common stock
|
(9,920
|
)
|
(10
|
)
|
(146,034
|
)
|
(100,368
|
)
|
(246,412
|
)
|
||||||||||||
|
Net issuance of restricted stock units
|
2,357
|
|
2
|
|
(29,650
|
)
|
(29,648
|
)
|
||||||||||||||
|
Stock options exercised
|
2,843
|
|
3
|
|
49,903
|
|
49,906
|
|
||||||||||||||
|
Stock based compensation
|
88,958
|
|
88,958
|
|
||||||||||||||||||
|
Tax benefit on settlement of equity instruments
|
3,112
|
|
3,112
|
|
||||||||||||||||||
|
Common stock issued under Employee Stock Purchase Plan
|
1,672
|
|
2
|
|
33,711
|
|
33,713
|
|
||||||||||||||
|
Dividends paid
|
(257,731
|
)
|
(257,731
|
)
|
||||||||||||||||||
|
Balance, June 30, 2012
|
292,732
|
|
$
|
293
|
|
$
|
—
|
|
$
|
2,553,418
|
|
$
|
(15,434
|
)
|
$
|
2,538,277
|
|
|||||
See accompanying Notes to Consolidated Financial Statements.
39
MAXIM INTEGRATED PRODUCTS, INC.
(In thousands)
|
|
For the Years Ended
|
||||||||||
|
|
June 30,
2012 |
June 25,
2011 |
June 26,
2010 |
||||||||
|
Cash flows from operating activities:
|
|
|
|
||||||||
|
Net income
|
$
|
386,727
|
|
$
|
489,009
|
|
$
|
125,139
|
|
||
|
Adjustments to reconcile net income to net cash provided by operating activities:
|
|
|
|
|
|||||||
|
Stock-based compensation
|
89,867
|
|
94,297
|
|
93,525
|
|
|||||
|
Depreciation and amortization
|
211,096
|
|
205,062
|
|
167,523
|
|
|||||
|
Deferred taxes
|
30,759
|
|
140,084
|
|
29,090
|
|
|||||
|
In process research & development
|
1,600
|
|
—
|
|
—
|
|
|||||
|
(Gain) loss from sale of property, plant and equipment
|
(7,648
|
)
|
12,946
|
|
272
|
|
|||||
|
(Gain) loss from sale of investments in privately-held companies
|
(1,811
|
)
|
—
|
|
148
|
|
|||||
|
Tax benefit (shortfall) related to stock-based compensation
|
3,112
|
|
30,546
|
|
(15,748
|
)
|
|||||
|
Excess tax benefit related to stock-based compensation
|
(17,482
|
)
|
(12,869
|
)
|
(7,005
|
)
|
|||||
|
Impairment of long lived assets
|
30,645
|
|
—
|
|
8,291
|
|
|||||
|
Gain on sale of discontinued operations
|
(45,372
|
)
|
—
|
|
—
|
|
|||||
|
Changes in assets and liabilities:
|
|
|
|
|
|||||||
|
Accounts receivable
|
(19,262
|
)
|
43,256
|
|
(124,258
|
)
|
|||||
|
Inventories
|
(432
|
)
|
(29,435
|
)
|
22,681
|
|
|||||
|
Other current assets
|
(16,757
|
)
|
53,255
|
|
(79,319
|
)
|
|||||
|
Accounts payable
|
25,515
|
|
(4,746
|
)
|
41,191
|
|
|||||
|
Income taxes payable
|
134,967
|
|
(45,318
|
)
|
17,384
|
|
|||||
|
Deferred income on shipments to distributors
|
(10,601
|
)
|
11,102
|
|
9,020
|
|
|||||
|
Accrued liabilities - litigation settlement
|
—
|
|
(173,000
|
)
|
173,000
|
|
|||||
|
All other accrued liabilities
|
(38,201
|
)
|
47,265
|
|
30,019
|
|
|||||
|
Net cash provided by operating activities
|
756,722
|
|
861,454
|
|
490,953
|
|
|||||
|
Cash flows from investing activities:
|
|
|
|
|
|
|
|||||
|
Purchases of property, plant and equipment
|
(264,348
|
)
|
(175,253
|
)
|
(123,901
|
)
|
|||||
|
Proceeds from sale of property, plant, and equipment
|
16,883
|
|
27,624
|
|
2,802
|
|
|||||
|
Acquisitions
|
(168,544
|
)
|
(80,918
|
)
|
(316,784
|
)
|
|||||
|
Proceeds from sale of discontinued operations
|
56,607
|
|
—
|
|
—
|
|
|||||
|
Other non-current assets
|
—
|
|
—
|
|
(3,998
|
)
|
|||||
|
Purchases of available-for-sale securities
|
(25,108
|
)
|
(49,787
|
)
|
—
|
|
|||||
|
Investments in privately-held companies
|
(3,480
|
)
|
—
|
|
—
|
|
|||||
|
Proceeds from sale/maturities of available-for-sale securities
|
—
|
|
—
|
|
200,233
|
|
|||||
|
Proceeds from sale of investments in privately-held companies
|
3,225
|
|
—
|
|
—
|
|
|||||
|
Net cash used in investing activities
|
(384,765
|
)
|
(278,334
|
)
|
(241,648
|
)
|
|||||
|
Cash flows from financing activities
|
|
|
|
|
|
|
|||||
|
Excess tax benefit from stock-based compensation plans
|
17,482
|
|
12,869
|
|
7,005
|
|
|||||
|
Mortgage liability
|
—
|
|
(3,237
|
)
|
(40
|
)
|
|||||
|
Proceeds from derivative litigation settlement
|
—
|
|
—
|
|
2,460
|
|
|||||
|
Repayment of notes payable
|
(20,806
|
)
|
(1,422
|
)
|
—
|
|
|||||
|
Issuance of notes payable, net of issuance costs
|
—
|
|
—
|
|
298,578
|
|
|||||
|
Net issuance of common stock
|
54,029
|
|
24,856
|
|
(5,484
|
)
|
|||||
|
Repurchase of common stock
|
(246,412
|
)
|
(231,012
|
)
|
(190,905
|
)
|
|||||
|
Dividends paid
|
(257,731
|
)
|
(249,145
|
)
|
(243,755
|
)
|
|||||
|
Net cash used in financing activities
|
(453,438
|
)
|
(447,091
|
)
|
(132,141
|
)
|
|||||
|
Net (decrease) increase in cash and cash equivalents
|
(81,481
|
)
|
136,029
|
|
117,164
|
|
|||||
|
Cash and cash equivalents:
|
|
|
|
|
|
|
|||||
|
Beginning of year
|
962,541
|
|
826,512
|
|
709,348
|
|
|||||
|
End of year
|
$
|
881,060
|
|
$
|
962,541
|
|
$
|
826,512
|
|
||
|
|
|
|
|
|
|
|
|||||
|
Supplemental disclosures of cash flow information:
|
|
|
|
|
|
|
|||||
|
Cash paid (refunded), net during the year for income taxes
|
$
|
39,827
|
|
$
|
(15,529
|
)
|
$
|
217,140
|
|
||
|
Cash paid for interest
|
10,890
|
|
10,264
|
|
—
|
|
|||||
|
|
|
|
|
|
|||||||
|
Noncash financing and investing activities:
|
|
|
|
|
|||||||
|
Accounts payable related to property, plant and equipment purchases
|
$
|
26,079
|
|
$
|
22,841
|
|
$
|
6,894
|
|
||
See accompanying Notes to Consolidated Financial Statements.
40
MAXIM INTEGRATED PRODUCTS, INC.
NOTES TO CONSOLIDATED FINANCIAL STATEMENTS
Maxim Integrated Products, Inc. ("Maxim," the "Company," "we," "us" or "our"), incorporated in Delaware, designs, develops, manufactures, and markets a broad range of linear and mixed-signal integrated circuits, commonly referred to as analog circuits, for a large number of customers in diverse geographical locations. The Company also provides a range of high-frequency process technologies and capabilities for use in custom designs. The analog market is fragmented and characterized by diverse applications, a great number of product variations and, with respect to many circuit types, relatively long product life cycles. Maxim is a global company with manufacturing facilities in the United States, testing facilities in the Philippines and Thailand, and sales and circuit design offices throughout the world. Integrated circuit assembly is performed by foreign assembly subcontractors, located in the Philippines, Malaysia, Thailand, China, Taiwan, Singapore, Indonesia, South Korea and Japan, where wafers are separated into individual integrated circuits and assembled into a variety of packages. The major end-markets the Company's products are sold in are the communications, computing, consumer and industrial markets.
Fiscal Year
The Company has a 52-to-53-week fiscal year that ends on the last Saturday of June. Accordingly, every fifth or sixth year will be a 53-week fiscal year. Fiscal year
2012
was a 53-week fiscal year. Fiscal years
2011
and
2010
were 52-week fiscal years.
Use of Estimates
The preparation of financial statements in conformity with accounting principles generally accepted in the United States requires management to make estimates and assumptions that affect the reported amounts of assets and liabilities, the disclosure of contingent assets and liabilities at the date of the financial statements and the reported amounts of revenues and expenses during the reporting period. Such estimates relate to the useful lives and fair value of fixed assets, valuation allowance for deferred tax assets, reserves relating to uncertain tax positions, allowances for doubtful accounts, customer returns and allowances, inventory valuation, reserves relating to litigation matters, assumptions about the fair value of reporting units, accrued liabilities and reserves and assumptions related to the calculation of stock-based compensation. The Company bases its estimates and judgments on its historical experience, knowledge of current conditions and its beliefs of what could occur in the future, given available information. Actual results may differ from those estimates, and such differences may be material to the financial statements.
Basis of Presentation
The consolidated financial statements include the accounts of the Company and all of its majority-owned subsidiaries. All significant intercompany balances and transactions have been eliminated in consolidation. The condition for control of entities is the ownership of a majority voting interest and ability to otherwise exercise control over the entity.
Cash Equivalents and Short-term Investments
The Company considers all highly liquid financial instruments purchased with an original maturity of three months or less at the date of purchase to be cash equivalents. Cash and cash equivalents consist of demand accounts and money market funds. Short-term investments consist primarily of U.S. Agency debt securities with original maturities beyond three months at the date of purchase.
The Company's short-term investments are considered available-for-sale. Such securities are carried at fair market value based on market quotes and other observable inputs. Unrealized gains and losses, net of tax, on securities in this category are reported as a separate component of stockholders' equity. Realized gains and losses on sales of investment securities are determined based on the specific identification method and are included in "Interest (expense) income and other, net" in the Consolidated Statements of Income.
Derivative Instruments
The Company generates revenues in various global markets based on orders obtained in non-U.S. currencies, primarily the Japanese Yen, the British Pound and the Euro. Maxim incurs expenditures denominated in non-U.S. currencies, principally Philippine Pesos and Thai Baht associated with the Company's manufacturing activities in the Philippines and Thailand, respectively. Maxim is
41
MAXIM INTEGRATED PRODUCTS, INC.
NOTES TO CONSOLIDATED FINANCIAL STATEMENTS
exposed to fluctuations in foreign currency exchange rates primarily on orders and accounts receivable from sales in these foreign currencies and cash flows for expenditures in these foreign currencies. Maxim has established risk management strategies designed to reduce the impact of volatility of future cash flows caused by changes in the exchange rates for these currencies. These strategies reduce, but do not entirely eliminate, the impact of currency exchange rates movements.
Currency forward contracts are used to offset the currency risk of non-U.S. dollar-denominated assets and liabilities. The Company typically enters into currency forward contracts quarterly to hedge exposures associated with its expenditures denominated in Philippine Pesos and Thai Baht. The Company enters into contracts each quarter for its accounts receivable and backlog denominated in Japanese Yen, British Pound and Euro. Changes in fair value of the underlying assets and liabilities are generally offset by the changes in fair value of the related currency forward contract.
The Company uses currency forward contracts to hedge exposure to variability in anticipated non-U.S. dollar denominated cash flows. These contracts are designated as cash flow hedges and recorded on the Consolidated Balance Sheets at their fair market value. The maturities of these instruments are generally less than
6
months. For derivative instruments that are designated and qualify as cash flow hedges, the effective portion of the gain or loss on the derivative is reported as a component of accumulated other comprehensive income (loss) and reclassified into earnings in the same period or periods during which the hedged transaction affects earnings. For derivative instruments that are not designated as hedging instruments, gains and losses are recognized in "Interest income (expense) and other, net" in the Consolidated Statements of Income.
Fair Value of Financial Instruments
Maxim measures certain financial assets and liabilities at fair value based on the exchange price that would be received for an asset or paid to transfer a liability (an exit price) in the principal or most advantageous market for the asset or liability in an orderly transaction between market participants. See Note 5: "Financial Instruments" of these Notes to Consolidated Financial Statements for a further discussion on fair value of financial instruments.
Inventories
Inventories are stated at the lower of (i) standard cost, which approximates actual cost on a first-in-first-out basis, or (ii) market value. Because of the cyclical nature of the market, inventory levels, obsolescence of technology, and product life cycles, the Company generally writes down inventories to net realizable value based on
12
months forecasted product demand.
Property, Plant and Equipment
Property, plant and equipment are stated at cost. Depreciation is primarily computed on the straight-line method over the estimated useful lives of the assets, which range from
2
to
15
years for machinery and equipment and up to
40
years for buildings and building improvements. Leasehold improvements are amortized over the lesser of their useful lives or the remaining term of the related lease. When assets are retired or otherwise disposed of, the cost and accumulated depreciation or amortization is removed from the accounts and any resulting gain or loss is reflected in operating expense or Interest (expense) income and other, net in the Consolidated Statements of Income in the period recognized. The classification is based mainly on whether the asset is operating or not.
The Company evaluates the recoverability of property, plant and equipment in accordance with Accounting Standards Codification ("ASC") No. 360,
Accounting for the Property, Plant, and Equipment
. ("ASC 360"). The Company performs periodic reviews to determine whether facts and circumstances exist that would indicate that the carrying amounts of property, plant and equipment exceeds their fair values. If facts and circumstances indicate that the carrying amount of property, plant and equipment might not be fully recoverable, projected undiscounted net cash flows associated with the related asset or group of assets over their estimated remaining useful lives are compared against their respective carrying amounts. In the event that the projected undiscounted cash flows are not sufficient to recover the carrying value of the assets, the assets are written down to their estimated fair values. All long-lived assets to be disposed of are reported at the lower of carrying amount or fair market value, less expected selling costs.
Intangible Assets and Goodwill
The Company accounts for intangible assets in accordance with ASC 360. The Company reviews goodwill and purchased intangible assets with indefinite lives for impairment annually and whenever events or changes in circumstances indicate the carrying value of an asset may not be recoverable, such as when reductions in demand or significant economic slowdowns in the semiconductor industry are present.
42
MAXIM INTEGRATED PRODUCTS, INC.
NOTES TO CONSOLIDATED FINANCIAL STATEMENTS
Intangible assets reviews are performed to determine whether the carrying value is impaired, based on comparisons to undiscounted expected future cash flows. If this comparison indicates that there is impairment, the impaired asset is written down to fair value, which is typically calculated using: (i) quoted market prices or (ii) discounted expected future cash flows utilizing a discount rate consistent with the guidance provided in FASB Concepts Statement No. 7,
Using Cash Flow Information and Present Value in Accounting Measurements
. Impairment is based on the excess of the carrying amount over the fair value of those assets.
Goodwill is recorded as the difference, if any, between the aggregate consideration paid for an acquisition and the fair value of the net tangible and intangible assets acquired. In accordance with ASC No. 350,
Intangibles-Goodwill and Other,
("ASC 350"), the Company tests goodwill for impairment at the reporting unit level (operating segment or one level below an operating segment) on an annual basis in the first quarter of each fiscal year or more frequently if the Company believes indicators of impairment exist. The performance of the test involves a two-step process. The first step of the impairment test involves comparing the fair values of the applicable reporting units with their aggregate carrying values, including goodwill. The Company generally determines the fair value of the Company's reporting units using the income approach methodology of valuation that includes the discounted cash flow method as well as other generally accepted valuation methodologies. If the carrying amount of a reporting unit exceeds the reporting unit's fair value, the Company performs the second step of the goodwill impairment test to determine the amount of impairment loss. The second step of the goodwill impairment test involves comparing the implied fair value of the affected reporting unit's goodwill with the carrying value of that goodwill. No impairment charges were recorded associated with our goodwill and intangible assets during fiscal years
2012
,
2011
, and
2010
.
Product Warranty
The Company warrants its products to its customers generally for one year from the date of shipment, but in certain cases for longer periods. In certain other cases, the Company's product warranty may include significant financial responsibility beyond the cost of replacing the product. If there is a material increase in the rate of customer claims or the Company's estimates of probable losses relating to specifically identified warranty exposures are inaccurate, the Company may record a charge against future cost of sales. Warranty expense has historically been immaterial to the Company's financial statements.
Self-Insurance Accruals
The Company is self-insured with respect to defective product claims, employment practice claims, property and casualty and general liability. The Company's workers' compensation insurance has a
$1.0 million
deductible per case. Accruals are primarily based on the estimated, undiscounted cost of claims, which includes incurred-but-not-reported claims. Amounts accrued for defective product claims, employment practice claims, workers' compensation claims, property and casualty and general liability of
$4.3 million
and
$4.7 million
are included in accrued expenses as of
June 30, 2012
and
June 25, 2011
, respectively.
In addition to the above, the Company is primarily self-insured with respect to healthcare benefits for most of its domestic employees. Accruals are primarily based on estimated incurred-but-not-reported claims. Amounts accrued for employee healthcare claims of
$5.6 million
and
$5.9 million
are included in accrued salary and related expenses as of
June 30, 2012
and
June 25, 2011
, respectively.
Retirement Benefits
The Company provides medical benefits to certain former and current employees pursuant to certain retirement agreements. The Company accounts for medical benefits to individuals pursuant to a documented plan under ASC No. 715,
Compensation- Retirement Benefits
("ASC 715")
.
The Company amortizes unrecognized actuarial gains and losses and prior service cost on straight-line basis over the remaining estimated service period of participants. The measurement date for the plan is fiscal year end.
Income Taxes
The Company accounts for income taxes using an asset and liability approach as prescribed in ASC 740-10,
Income Taxes
("ASC 740-10"). The Company records the amount of taxes payable or refundable for the current and prior years and deferred tax assets and liabilities for the future tax consequences of events that have been recognized in the Company's financial statements or tax returns. A valuation allowance is recorded to reduce deferred tax assets when it is more likely than not that a tax benefit will not be realized.
ASC 740-10 prescribes a recognition threshold and measurement framework for the financial statement reporting and disclosure of an income tax position taken or expected to be taken on a tax return. Under ASC 740-10, a tax position is recognized in the
43
MAXIM INTEGRATED PRODUCTS, INC.
NOTES TO CONSOLIDATED FINANCIAL STATEMENTS
financial statements when it is more likely than not, based on the technical merits, that the position will be sustained upon examination, including resolution of any related appeals or litigation processes. A tax position that meets the recognition threshold is then measured to determine the largest amount of the benefit that has a greater than 50% likelihood of being realized upon settlement.
The calculation of tax liabilities involves significant judgment in estimating the impact of uncertainties in the application of complex tax laws across multiple tax jurisdictions. Although ASC 740-10 provides clarification on the accounting for uncertainty in income taxes recognized in the financial statements, the recognition threshold and measurement framework will continue to require significant judgment by management. Resolution of these uncertainties in a manner inconsistent with the Company's expectations could have a material impact on the Company's results of operations.
Revenue Recognition
The Company recognizes revenue for sales to direct customers and sales to certain distributors upon shipment, provided that persuasive evidence of a sales arrangement exists, the price is fixed or determinable, title and risk of loss has transferred, collectability of the resulting receivable is reasonably assured, there are no customer acceptance requirements and we do not have any significant post-shipment obligations. The Company estimates returns for sales to direct customers and certain distributors based on historical returns rates applied against current period gross revenues. Specific customer returns and allowances are considered within this estimate.
Sales to certain distributors are made pursuant to agreements allowing for the possibility of certain sales price rebates and for non-warranty product return privileges. The non-warranty product return privileges include allowing certain distributors to return a small portion of our products in their inventory based on their previous purchases. Given the uncertainties associated with the levels of non-warranty product returns and sales price rebates that could be issued to certain distributors, the Company defers recognition of such revenue and related cost of goods sold until receipt of notification from these distributors that product has been sold to their end-customers.
Accounts receivable from direct customers and distributors are recognized and inventory is relieved upon shipment as title to inventories generally transfers upon shipment, at which point the Company has a legally enforceable right to collection under normal terms. Accounts receivable related to consigned inventory is recognized when the customer takes title to such inventory from its consigned location, at which point inventory is relieved, title transfers, and the Company has a legally enforceable right to collection under the terms of our agreement with the related customers.
The Company estimates potential future returns and sales allowances related to current period product revenue. Management analyzes historical returns, changes in customer demand and acceptance of products when evaluating the adequacy of returns and sales allowances. Estimates made by the Company may differ from actual returns and sales allowances. These differences may materially impact reported revenue and amounts ultimately collected on accounts receivable. Historically, such differences have not been material. At
June 30, 2012
and
June 25, 2011
, the Company had
$11.4 million
and
$16.0 million
reserved for returns and allowances against accounts receivable, respectively. During fiscal years
2012
and
2011
, the Company recorded
$61.0 million
and
$74.5 million
for estimated returns and allowances against revenues, respectively. These amounts were offset by
$65.6 million
and
$73.5 million
actual returns and allowances given during fiscal years
2012
and
2011
, respectively.
Research and Development Costs
Research and development costs are expensed as incurred. Such costs consist primarily of expenditures for labor and benefits, masks, prototype wafers and depreciation.
Advertising
Advertising costs are expensed as incurred and included in selling, general and administrative expenses in the Consolidated Statements of Income. Advertising expenses were immaterial in fiscal years
2012
,
2011
, and
2010
.
Shipping Costs
Shipping costs billed to customers are included in net revenues and the related shipping costs are included in cost of goods sold.
44
MAXIM INTEGRATED PRODUCTS, INC.
NOTES TO CONSOLIDATED FINANCIAL STATEMENTS
Stock-Based Compensation
Stock-based compensation cost is measured at the grant date, based on the fair value of the awards ultimately expected to vest and is recognized as an expense, on a straight-line basis, over the requisite service period. The Company uses the Black-Scholes valuation model to measure the fair value of its stock-based awards utilizing various inputs with respect to expected holding period, risk-free interest rates, stock price volatility and dividend yield.
ASC 718 also requires forfeitures to be estimated at the time of grant and revised if necessary in subsequent periods if actual forfeitures or vesting differ from those estimates. Such revisions could have a material effect on the Company's operating results. The assumptions the Company uses in the valuation model are based on subjective future expectations combined with management judgment. If any of the assumptions used in the Black-Scholes model changes, stock-based compensation for future awards may differ materially compared to the awards granted previously.
Restructuring
Post-employment benefits accrued for workforce reductions related to restructuring activities in the United States are accounted for under ASC No. 712,
Compensation-Nonretirement Postemployment Benefits
("ASC 712"). A liability for post-employment benefits is recorded when payment is probable, the amount is reasonably estimable, and the obligation relates to rights that have vested or accumulated. In accordance with ASC No. 420,
Exit or Disposal Cost Obligations
, generally costs associated with restructuring activities initiated outside the United States have been recognized when they are incurred.
The Company continually evaluates the adequacy of the remaining liabilities under its restructuring initiatives. Although the Company believes that these estimates accurately reflect the costs of its restructuring plans, actual results may differ, thereby requiring the Company to record additional provisions or reverse a portion of such provisions.
Foreign Currency Translation and Remeasurement
The U.S. dollar is the functional currency for the Company's foreign operations. Using the U.S. dollar as the functional currency, monetary assets and liabilities are remeasured at the year-end exchange rates. Certain non-monetary assets and liabilities are remeasured using historical rates. Statements of Income are remeasured at the average exchange rates during the year.
Earnings Per Share
Basic earnings per share are computed using the weighted average number of common shares outstanding during the period. Diluted earnings per share incorporate the potentially dilutive incremental shares issuable upon the assumed exercise of stock options, the assumed vesting of outstanding restricted stock units, and the assumed issuance of common stock under the stock purchase plan. The number of incremental shares from the assumed issuance of stock options is calculated by applying the treasury stock method. See Note 7 "Earnings Per Share" of these Notes to Consolidated Financial Statements.
Litigation and Contingencies
From time to time, the Company receives notices that its products or manufacturing processes may be infringing the patent or other intellectual property rights of others, notices of stockholder litigation or other lawsuits or claims against the Company. The Company periodically assesses each matter in order to determine if a contingent liability in accordance with ASC 450, should be recorded. In making this determination, management may, depending on the nature of the matter, consult with internal and external legal counsel and technical experts. The Company expenses legal fees associated with consultations and defense of lawsuits as incurred. Based on the information obtained, combined with management's judgment regarding all of the facts and circumstances of each matter, the Company determines whether a contingent loss is probable and whether the amount of such loss can be estimated. Should a loss be probable and estimable, the Company records a contingent loss in accordance with ASC 450. In determining the amount of a contingent loss, the Company takes into consideration advice received from experts in the specific matter, current status of legal proceedings, settlement negotiations which may be ongoing, prior case history and other factors. Should the judgments and estimates made by management be incorrect, the Company may need to record additional contingent losses that could materially adversely impact its results of operations. Alternatively, if the judgments and estimates made by management are incorrect and a particular contingent loss does not occur, the contingent loss recorded would be reversed thereby favorably impacting the Company's results of operations.
Pursuant to the Company's charter documents and separate written indemnification agreements, the Company has certain indemnification obligations to its current officers and directors, as well as certain former officers and directors. Pursuant to such
45
MAXIM INTEGRATED PRODUCTS, INC.
NOTES TO CONSOLIDATED FINANCIAL STATEMENTS
obligations, the Company has incurred substantial expenses related to legal fees and expenses to certain former officers of the Company subject to civil charges by the SEC in connection with Maxim's historical stock option granting practices. The Company has also incurred substantial expenses related to legal fees and expenses advanced to certain current and former officers and directors who were defendants in the civil actions described above. The Company expenses such amounts as incurred.
Concentration of Credit Risk
Due to the Company's credit evaluation and collection process, bad debt expenses have not been significant. Credit risk with respect to trade receivables is limited because a large number of geographically diverse customers make up the Company's customer base, thus spreading the credit risk. The Company derived approximately
29%
of its fiscal year
2012
revenue from sales made through distributors. Our primary distributor is Avnet Electronics. Avnet, like our other distributors, is not an end customer, but rather serves as a channel of sale to many end users of the Company's products. Avnet accounted for
13%
,
14%
and
12%
of revenues in fiscal years
2012
,
2011
and
2010
, respectively, and
11%
,
11%
and
10%
of accounts receivable in fiscal years
2012
,
2011
and
2010
, respectively. Samsung, our largest single customer, accounted for approximately
20%
,
12%
and
12%
of net revenues in fiscal years
2012
,
2011
and
2010
, respectively, and
31%
,
18%
and
13%
of accounts receivable as of
June 30, 2012
,
June 25, 2011
and
June 26, 2010
, respectively.
The Company maintains cash, cash equivalents, and short-term investments with various high credit quality financial institutions, limits the amount of credit exposure to any one financial institution or instrument, and is exposed to credit risk in the event of default by these institutions to the extent of amounts recorded at the balance sheet date. To date, the Company has not incurred losses related to these investments.
Concentration of Other Risks
The semiconductor industry is characterized by rapid technological change, competitive pricing pressures, and cyclical market patterns. The Company's results of operations are affected by a wide variety of factors, including general economic conditions, both in the United States and abroad; economic conditions specific to the semiconductor industry and to the analog and mixed signal portion of that industry; demand for the Company's products; the timely introduction of new products; implementation of new manufacturing technologies; manufacturing capacity; the ability to manufacture efficiently; the availability of materials, supplies, machinery and equipment; competition; the ability to safeguard patents and other intellectual property in a rapidly evolving market; and reliance on assembly and, to a small extent, wafer fabrication subcontractors and on independent distributors and sales representatives. As a result, the Company may experience substantial period-to-period fluctuations in future operating results due to the factors mentioned above or other factors.
Recently Issued Accounting Pronouncements
In September 2011, the Financial Accounting Standards Board ("FASB") issued Accounting Standards Update ("ASU") No. 2011-08 relating to Intangibles-Goodwill and Other (Topic 350)-Testing Goodwill for Impairment ("ASU 2011-08"). ASU 2011-08 allows an entity to first perform a qualitative assessment to determine whether it is more likely than not that the fair value of a reporting unit is less than its carrying value. If it is concluded that it is more likely than not, an entity is required to perform the currently prescribed two-step goodwill impairment test. Otherwise, the two-step goodwill impairment test is not required. ASU 2011-08 is effective for Maxim in fiscal year 2013 and earlier adoption is permitted.
In June 2011, the FASB issued ASU No. 2011-05 relating to Comprehensive Income (Topic 220)-Presentation of Comprehensive Income ("ASU 2011-05"), which requires an entity to present the total of comprehensive income, the components of net income, and the components of other comprehensive income either in a single continuous statement of comprehensive income or in two separate but consecutive statements. ASU 2011-05 is effective for Maxim in fiscal year 2013 and should be applied retrospectively.
Accounts receivables, net consist of:
|
June 30, 2012
|
June 25, 2011
|
||||||
|
(in thousands)
|
|||||||
|
Accounts receivable
|
$
|
329,990
|
|
$
|
315,329
|
|
|
|
Returns and allowances
|
(12,529
|
)
|
(17,697
|
)
|
|||
|
$
|
317,461
|
|
$
|
297,632
|
|
||
46
MAXIM INTEGRATED PRODUCTS, INC.
NOTES TO CONSOLIDATED FINANCIAL STATEMENTS
The components of inventories consist of:
|
|
June 30, 2012
|
|
June 25, 2011
|
||||
|
Inventory:
|
(In thousands)
|
||||||
|
Raw materials
|
$
|
11,922
|
|
$
|
18,419
|
|
|
|
Work-in-process
|
149,603
|
|
162,245
|
|
|||
|
Finished goods
|
80,637
|
|
57,264
|
|
|||
|
|
$
|
242,162
|
|
|
$
|
237,928
|
|
Property, plant and equipment, net, consist of:
|
|
June 30, 2012
|
|
June 25, 2011
|
||||
|
Property and equipment:
|
(In thousands)
|
||||||
|
Land
|
$
|
65,007
|
|
$
|
86,257
|
|
|
|
Buildings and building improvements
|
348,727
|
|
313,642
|
|
|||
|
Machinery and equipment
|
2,105,905
|
|
1,978,827
|
|
|||
|
|
2,519,639
|
|
|
2,378,726
|
|
||
|
Less accumulated depreciation
|
(1,166,033
|
)
|
(1,069,876
|
)
|
|||
|
|
$
|
1,353,606
|
|
|
$
|
1,308,850
|
|
The Company recorded
$155.4 million
,
$156.3 million
and
$146.1 million
of depreciation expense in fiscal years
2012
,
2011
and
2010
, respectively.
The FASB established a fair value hierarchy that prioritizes the inputs to valuation techniques used to measure fair value. This hierarchy requires an entity to maximize the use of observable inputs and minimize the use of unobservable inputs when measuring fair value. Three levels of inputs that may be used to measure fair value are as follows:
Level 1
- Quoted (unadjusted) prices in active markets for identical assets or liabilities.
The Company's Level 1 assets consist of money market funds.
Level 2
- Observable inputs other than quoted prices included in Level 1, such as quoted prices for similar assets or liabilities in active markets, quoted prices for identical or similar assets or liabilities in markets that are not active, or other inputs that are observable or can be corroborated by observable market data for substantially the full term of the asset or liability.
The Company's Level 2 assets and liabilities consist of certificates of deposit, government agency securities and foreign currency forward contracts.
Level 3
- Unobservable inputs to the valuation methodology that are significant to the measurement of the fair value of the assets or liabilities.
The Company's Level 3 liabilities consist of contingent consideration related to certain acquisitions. For details on inputs used in measuring fair value, please refer to Note 9: "Acquisitions" of these Notes to Consolidated Financial Statements.
Assets and liabilities measured at fair value on a recurring basis were as follows:
47
MAXIM INTEGRATED PRODUCTS, INC.
NOTES TO CONSOLIDATED FINANCIAL STATEMENTS
|
As of June 30, 2012
|
As of June 25, 2011
|
||||||||||||||||||||||||||||||
|
Fair Value
|
Fair Value
|
||||||||||||||||||||||||||||||
|
Measurements Using
|
Total
|
Measurements Using
|
Total
|
||||||||||||||||||||||||||||
|
Level 1
|
Level 2
|
Level 3
|
Balance
|
Level 1
|
Level 2
|
Level 3
|
Balance
|
||||||||||||||||||||||||
|
(in thousands)
|
|||||||||||||||||||||||||||||||
|
Assets
|
|||||||||||||||||||||||||||||||
|
Money market funds (1)
|
$
|
602,462
|
|
$
|
—
|
|
$
|
—
|
|
$
|
602,462
|
|
$
|
603,180
|
|
$
|
—
|
|
$
|
—
|
|
$
|
603,180
|
|
|||||||
|
Certificates of deposit (1)
|
—
|
|
6,182
|
|
—
|
|
6,182
|
|
—
|
|
3,457
|
|
—
|
|
3,457
|
|
|||||||||||||||
|
Government agency securities (2)
|
—
|
|
75,326
|
|
—
|
|
75,326
|
|
—
|
|
50,346
|
|
—
|
|
50,346
|
|
|||||||||||||||
|
Foreign currency forward contracts (3)
|
—
|
|
642
|
|
—
|
|
642
|
|
—
|
|
326
|
|
—
|
|
326
|
|
|||||||||||||||
|
Total Assets
|
$
|
602,462
|
|
$
|
82,150
|
|
$
|
—
|
|
$
|
684,612
|
|
$
|
603,180
|
|
$
|
54,129
|
|
$
|
—
|
|
$
|
657,309
|
|
|||||||
|
Liabilities
|
|||||||||||||||||||||||||||||||
|
Foreign currency forward contracts (4)
|
$
|
—
|
|
$
|
507
|
|
$
|
—
|
|
$
|
507
|
|
$
|
—
|
|
$
|
309
|
|
$
|
—
|
|
$
|
309
|
|
|||||||
|
Contingent Consideration (4)
|
—
|
|
—
|
|
17,737
|
|
17,737
|
|
—
|
|
—
|
|
8,800
|
|
8,800
|
|
|||||||||||||||
|
Total Liabilities
|
$
|
—
|
|
$
|
507
|
|
$
|
17,737
|
|
$
|
18,244
|
|
$
|
—
|
|
$
|
309
|
|
$
|
8,800
|
|
$
|
9,109
|
|
|||||||
(1) Included in Cash and cash equivalents in the accompanying Consolidated Balance Sheets.
(2) Included in Short-term investments in the accompanying Consolidated Balance Sheets.
(3) Included in Other current assets in the Consolidated Balance Sheets.
(4) Included in Accrued expenses in the Consolidated Balance Sheets.
The tables below present reconciliations for liabilities measured and recorded at fair value on a recurring basis using significant unobservable inputs (Level 3) for the year ended
June 30, 2012
and for the year ended
June 25, 2011
:
|
Fair Value Measured and Recorded Using Significant Unobservable Inputs (Level 3)
|
||||||||
|
June 30,
2012 |
June 25,
2011 |
|||||||
|
Contingent Consideration
|
(in thousands)
|
|||||||
|
Beginning balance
|
$
|
8,800
|
|
$
|
—
|
|
||
|
Total gains or losses (realized and unrealized):
|
||||||||
|
Included in earnings
|
1,670
|
|
—
|
|
||||
|
Additions
|
11,354
|
|
8,800
|
|
||||
|
Payments
|
(4,087
|
)
|
—
|
|
||||
|
Ending balance
|
$
|
17,737
|
|
$
|
8,800
|
|
||
|
Changes in unrealized losses or (gains) included in earnings related to liabilities still held as of period end
|
$
|
1,670
|
|
$
|
—
|
|
||
The valuation of contingent consideration is based on a probability weighted earnouts model which relies primarily on estimates of milestone achievements and discount rates applicable for the period expected payout. The most significant unobservable input used in the determination of estimated fair value of contingent consideration is the estimates on the likelihood of milestone achievements, which directly correlates to the fair value recognized in the Consolidated Balance Sheets.
The fair value of this liability is estimated quarterly by management based on inputs received from the Company's engineering and finance personnel. The determination of the milestone achievement is performed by the Company's engineering department and reviewed by the accounting department. Potential valuation adjustments are made as the progress toward achieving milestones becomes determinable with the impact of such adjustments being recorded through Other operating expenses (income), net.
As of June 30, 2012
and
June 25, 2011
, there were no transfers in or out of level 3 from other levels in the fair value hierarchy.
48
MAXIM INTEGRATED PRODUCTS, INC.
NOTES TO CONSOLIDATED FINANCIAL STATEMENTS
Assets measured at fair value on a non-recurring basis were as follows:
As of June 30, 2012
, long-lived assets held for sale were written down to their fair value, less cost to sell of
$24.0 million
, resulting in an impairment loss of
$22.4 million
, which was included in earnings for the period. The impairment charge was measured using level 3 inputs. The Company reached its conclusion regarding the asset impairment after conducting an evaluation of assets fair values. The fair value of the buildings was determined mainly after consideration of evidence such as appraisals and offers received. Please refer to Note 10: "Impairment of long-lived assets" of these Notes to Consolidated Financial Statements.
As of June 25, 2011
, none of the Company's assets and liabilities was measured at fair value on a non-recurring basis.
Short-term investments
Fair values were as follows:
|
June 30, 2012
|
June 25, 2011
|
||||||||||||||||||||||||||||||
|
Amortized Cost
|
Gross
Unrealized
Gain
|
Gross
Unrealized
Loss
|
Estimated
Fair Value
|
Amortized Cost
|
Gross
Unrealized
Gain
|
Gross
Unrealized
Loss
|
Estimated
Fair Value
|
||||||||||||||||||||||||
|
(in thousands)
|
|||||||||||||||||||||||||||||||
|
Available-for-sale investments
|
|||||||||||||||||||||||||||||||
|
Government agency securities
|
$
|
75,007
|
|
$
|
319
|
|
$
|
—
|
|
$
|
75,326
|
|
$
|
49,826
|
|
$
|
520
|
|
$
|
—
|
|
$
|
50,346
|
|
|||||||
|
Total available-for-sale investments
|
$
|
75,007
|
|
$
|
319
|
|
$
|
—
|
|
$
|
75,326
|
|
$
|
49,826
|
|
$
|
520
|
|
$
|
—
|
|
$
|
50,346
|
|
|||||||
In the fiscal years ended
June 30, 2012
and
June 25, 2011
, Maxim did not recognize any impairment charges on short-term investments.
The government agency securities have maturity dates between February 26, 2013 and December 18, 2013.
Derivative instruments and hedging activities
Foreign Currency Risk
The Company generates revenues in various global markets based on orders obtained in non-U.S. currencies, primarily the Japanese Yen, the Euro and the British Pound. Maxim incurs expenditures denominated in non-U.S. currencies, principally the Philippine Pesos and Thai Baht associated with the Company's manufacturing activities in the Philippines and Thailand, respectively, and expenditures for sales offices and research and development activities undertaken outside of the U.S. Maxim is exposed to fluctuations in foreign currency exchange rates primarily on orders and accounts receivable from sales in these foreign currencies and cash flows for expenditures in these foreign currencies. Maxim has established risk management strategies designed to reduce the impact of volatility of future cash flows caused by changes in the exchange rate for these currencies. These strategies reduce, but do not entirely eliminate, the impact of currency exchange rates movements. Maxim does not use derivative financial instruments for speculative or trading purposes. The Company routinely hedges its exposures to certain foreign currencies with various financial institutions in an effort to minimize the impact of certain currency exchange rate fluctuations. If a financial counterparty to any of the Company's hedging arrangements experiences financial difficulties or is otherwise unable to honor the terms of the foreign currency hedge, the Company may experience financial losses.
For derivative instruments that are designated and qualify as cash flow hedges under ASC No. 815-
Derivatives and Hedging
("ASC 815"), the effective portion of the gain or loss on the derivative is reported as a component of accumulated other comprehensive loss and reclassified into earnings into the same financial statement line as the item being hedged, and in the same period or periods during which the hedged transaction affects earnings. Gains and losses on the derivative representing either hedge ineffectiveness or hedge components excluded from the assessment of effectiveness are recognized in interest and other expense, net.
For derivative instruments that are not designated as hedging instruments under ASC 815, gains and losses are recognized in interest and other expense, net. All derivatives are foreign currency forward contracts to hedge certain foreign currency denominated assets or liabilities. The gains and losses on these derivatives largely offset the changes in the fair value of the assets or liabilities
49
MAXIM INTEGRATED PRODUCTS, INC.
NOTES TO CONSOLIDATED FINANCIAL STATEMENTS
being hedged.
Fair Value of Derivative Instruments in the Consolidated Balance Sheets
Maxim estimates the fair value of derivatives primarily based on pricing models using current market rates and records all derivatives on the balance sheet at fair value. The gross notional and the recorded fair value of derivative financial instruments in the Consolidated Balance Sheets were as follows:
|
As of June 30, 2012
|
As of June 25, 2011
|
||||||||||||||||||||||
|
Gross Notional(1)
|
Other Current Assets
|
Accrued Expenses
|
Gross Notional (1)
|
Other Current Assets
|
Accrued Expenses
|
||||||||||||||||||
|
(in thousands)
|
|||||||||||||||||||||||
|
Derivatives designated as hedging instruments
|
|||||||||||||||||||||||
|
Cash flow hedges:
|
|||||||||||||||||||||||
|
Foreign exchange contracts
|
$
|
37,955
|
|
$
|
150
|
|
$
|
459
|
|
$
|
35,629
|
|
$
|
53
|
|
$
|
287
|
|
|||||
|
Derivatives not designated as hedging instruments
|
|||||||||||||||||||||||
|
Foreign exchange contracts
|
35,105
|
|
492
|
|
48
|
|
26,342
|
|
273
|
|
22
|
|
|||||||||||
|
Total derivatives
|
$
|
73,060
|
|
$
|
642
|
|
$
|
507
|
|
$
|
61,971
|
|
$
|
326
|
|
$
|
309
|
|
|||||
(1) Represents the face amounts of contracts that were outstanding as of
June 30, 2012
and
June 25, 2011
, as applicable.
Derivatives designated as hedging instruments
The following table provides the balances and changes in the accumulated other comprehensive income (loss) related to derivative instruments during the fiscal year ended
June 30, 2012
and the fiscal year ended
June 25, 2011
.
|
June 30,
2012 |
June 25,
2011 |
|||||||
|
(in thousands)
|
||||||||
|
Beginning balance
|
$
|
(234
|
)
|
$
|
(235
|
)
|
||
|
Loss reclassified to income
|
653
|
|
514
|
|
||||
|
Loss recorded in other comprehensive loss
|
(110
|
)
|
(513
|
)
|
||||
|
Ending balance
|
$
|
309
|
|
$
|
(234
|
)
|
||
Maxim expects to reclassify an estimated net accumulated other comprehensive gain of
$0.2 million
, net of taxes, to earnings in the next twelve months along with the earnings effects of the related forecasted transactions in association with cash flow hedges.
50
MAXIM INTEGRATED PRODUCTS, INC.
NOTES TO CONSOLIDATED FINANCIAL STATEMENTS
The before-tax effect of cash flow derivative instruments for the fiscal years ended
June 30, 2012
and
June 25, 2011
was as follows:
|
Gain (Loss) Reclassified from Accumulated OCI into Income (Effective portion)
|
||||||||||
|
Years Ended
|
||||||||||
|
Location
|
June 30,
2012 |
June 25,
2011 |
||||||||
|
(in thousands)
|
||||||||||
|
Cash Flow hedges:
|
||||||||||
|
Foreign exchange contracts
|
Net Revenues
|
$
|
(312
|
)
|
$
|
(1,152
|
)
|
|||
|
Foreign exchange contracts
|
Cost of goods sold
|
187
|
|
638
|
|
|||||
|
Foreign exchange contracts
|
Operating Expense
|
(528
|
)
|
—
|
|
|||||
|
Total cash flow hedges
|
$
|
(653
|
)
|
$
|
(514
|
)
|
||||
The before-tax effect of derivative instruments not designated as hedging instruments on the Consolidated Statements of Income for the fiscal years ended
June 30, 2012
and
June 25, 2011
was as follows:
|
Gain (Loss) Recognized in Income on Derivative Instrument
|
|||||||||||||
|
Years Ended
|
|||||||||||||
|
Location
|
June 30,
2012 |
June 25,
2011 |
June 26,
2010 |
||||||||||
|
(in thousands)
|
|||||||||||||
|
Foreign exchange contracts
|
Interest income (expense) and other, net
|
$
|
1,653
|
|
$
|
(1,893
|
)
|
$
|
1,444
|
|
|||
|
Total
|
$
|
1,653
|
|
$
|
(1,893
|
)
|
$
|
1,444
|
|
||||
Volume of Derivative Activity
Total net U.S. Dollar notional amounts for foreign currency forward contracts, presented by net currency purchase (sell), are as follows:
|
In United States Dollars
|
June 30, 2012
|
June 25, 2011
|
||||||
|
|
(in thousands)
|
|||||||
|
Euro
|
$
|
(10,686
|
)
|
$
|
1,542
|
|
||
|
Japanese Yen
|
(2,254
|
)
|
(5,156
|
)
|
||||
|
British Pound
|
(575
|
)
|
(10,928
|
)
|
||||
|
Philippine Peso
|
15,443
|
|
17,140
|
|
||||
|
Thai Baht
|
4,264
|
|
3,523
|
|
||||
|
Total
|
$
|
6,192
|
|
$
|
6,121
|
|
||
51
MAXIM INTEGRATED PRODUCTS, INC.
NOTES TO CONSOLIDATED FINANCIAL STATEMENTS
Long-term debt
The following table summarizes the Company's long-term debt:
|
June 30, 2012
|
June 25, 2011
|
||||||
|
(in thousands)
|
|||||||
|
3.45% fixed rate notes due June 2013
|
$
|
300,000
|
|
$
|
300,000
|
|
|
|
SensorDynamics Debt (Denominated in Euro)
|
|||||||
|
Term fixed rate notes (2.0%-2.5%) due March 2013 to September 2015
|
6,285
|
|
—
|
|
|||
|
Amortizing fixed rate notes (1.5%-2.75%) due up to June 2014
|
1,127
|
|
—
|
|
|||
|
Amortizing floating rate notes (EURIBOR plus 1.5%) due up to June 2014
|
1,676
|
|
—
|
|
|||
|
Total
|
309,088
|
|
300,000
|
|
|||
|
Less: Current portion of long-term debt
|
(303,496
|
)
|
—
|
|
|||
|
Total long-term debt
|
$
|
5,592
|
|
$
|
300,000
|
|
|
On June 17, 2010, the Company completed a public offering of
$300 million
aggregate principal amount of the Company's
3.45%
senior unsecured notes due on June 14, 2013 ("
$300 million
notes"), with an effective interest rate of
3.49%
. Interest is payable semi-annually in arrears on June 14 and December 14 of each year. The
$300 million
notes are governed by base and supplemental indentures dated June 10, 2010 and June 17, 2010, respectively, between the Company and Wells Fargo Bank, National Association, as trustee.
In conjunction with the SensorDynamics acquisition as discussed in Note 9: "Acquisitions" of these Notes to Consolidated Financial Statements, Maxim acquired certain fixed and floating rate notes as detailed in the table above.
The Company accounts for all the notes above based on their amortized cost. The discount and expenses are being amortized to Interest and other expense, net over the life of the Notes. Interest expense associated with the Notes was
$11.2 million
and
$10.4 million
during the years ended
June 30, 2012
and
June 25, 2011
, respectively. The interest expense is recorded in Interest income (expense) and other, net in the Consolidated Statements of Income.
The estimated fair value of Maxim's debt was approximately
$317 million
at
June 30, 2012
. The estimated fair value of the debt is based primarily on an income approach utilizing market observable input such as interest rate.
As of June 30, 2012
, the Company had the capacity to issue an unspecified amount of additional debt securities, common stock, preferred stock, warrants, rights and units under its 2010 Shelf Registration Statement.
Credit Facility
On October 13, 2011, the Company entered into a
$250 million
senior unsecured revolving credit facility with certain institutional lenders that expires on October 13, 2016. The Company agreed to pay the lenders a facility fee at a rate per annum that varies based on the Company's index debt rating. Any advances under the credit agreement will accrue interest at a base rate plus a margin based on the Company's debt index rating. The credit agreement requires the Company to comply with certain covenants, including a requirement that the Company maintain a ratio of debt to EBITDA (earnings before interest, taxes, depreciation, and amortization) of not more than
3
to
1
and a minimum interest coverage ratio (EBITDA divided by interest expense) greater than
3.5
to
1
.
As of June 30, 2012
, the Company had not borrowed any amounts from this credit facility and was in compliance with all debt covenants.
Other Financial Instruments
For the balance of Maxim's financial instruments, cash equivalents, accounts receivable, accounts payable and other accrued liabilities, the carrying amounts approximate fair value due to their short maturities.
At
June 30, 2012
, the Company had five stock option plans and one employee stock purchase plan, including the Company's 1996 Stock Incentive Plan (the "1996 Plan"), 1993 Officer and Director Stock Option Plan, 1987 Stock Option Plan, 1987 Supplemental Stock Option Plan, Supplemental Non-employee Stock Option Plan and 2008 Employee Stock Purchase Plan ("2008 ESPP").
52
MAXIM INTEGRATED PRODUCTS, INC.
NOTES TO CONSOLIDATED FINANCIAL STATEMENTS
The following tables present stock-based compensation expense by type of award and resulting tax effect included in the Consolidated Statements of Income for fiscal years
2012
,
2011
, and
2010
:
|
|
For the Year Ended
|
||||||||||
|
|
June 30,
2012 |
June 25,
2011 |
June 26,
2010 |
||||||||
|
|
(in thousands)
|
||||||||||
|
Stock options
|
$
|
16,294
|
|
$
|
20,070
|
|
$
|
26,545
|
|
||
|
Restricted stock units
|
64,579
|
|
65,689
|
|
59,715
|
|
|||||
|
Employee stock purchase plan
|
8,994
|
|
8,538
|
|
7,265
|
|
|||||
|
Pre-tax stock-based compensation expense
|
89,867
|
|
94,297
|
|
93,525
|
|
|||||
|
Less: Income tax effect
|
20,215
|
|
25,457
|
|
25,041
|
|
|||||
|
Net stock-based compensation expense
|
$
|
69,652
|
|
$
|
68,840
|
|
$
|
68,484
|
|
||
The following table shows pre-tax stock-based compensation expense by income statement classification:
|
For the Year Ended
|
|||||||||||
|
June 30,
2012 |
June 25,
2011 |
June 26,
2010 |
|||||||||
|
(in thousands)
|
|||||||||||
|
Cost of goods sold
|
$
|
13,139
|
|
$
|
14,001
|
|
$
|
15,220
|
|
||
|
Research and development
|
49,068
|
|
53,686
|
|
54,065
|
|
|||||
|
Selling, general and administrative
|
27,660
|
|
26,610
|
|
24,240
|
|
|||||
|
$
|
89,867
|
|
$
|
94,297
|
|
$
|
93,525
|
|
|||
Modifications and Settlements
2009 Goodwill Program
In January 2009, the Company approved a program ("Goodwill Program") wherein non-officer employees holding options that were outstanding as of November 1, 2008 and which reached or will reach their contractual
10
-year expiration term between November 2008 and December 2009 would be eligible for a payment in the form of cash or restricted stock units ("RSUs"). Payments exceeding
$5,000
would be settled in restricted stock units that vest over three quarters and are contingent upon continued employment, while amounts below
$5,000
would be settled in cash in a lump sum payment. A similar program was extended to officers in May 2009, except that payments exceeding
$5,000
to officers were settled in restricted stock units vesting over six quarters rather than three quarters.
The Company recorded a liability for the options settling in cash under the Goodwill Program. Options associated with payments being made in the form of restricted stock units under the Goodwill Program, which contain market and service conditions, are accounted for under the provisions of ASC 718. The Company recognized
$0.0 million
,
$0.2 million
and
$5.4 million
in stock based compensation expense related to this program during fiscal years
2012
,
2011
and
2010
, respectively.
Fair Value
The fair value of share-based awards granted to employees under the Company's 1996 Plan and 2008 ESPP is estimated on the date of grant using the Black-Scholes option valuation model. Expected volatilities are based on the historical volatilities from its traded common stock over a period equal to the expected term. The Company is utilizing the simplified method under ASC 718 to estimate expected holding periods. The risk-free interest rate is based on the U.S. Treasury yield. The Company determines the dividend yield by dividing the annualized dividends per share by the prior quarter's average stock price. The result is analyzed by the Company to decide whether it represents expected future dividend yield. As required by ASC 718, the Company also estimates forfeitures at the time of grant and makes revisions to forfeitures on a quarterly basis.
The fair value of each award granted in fiscal years
2012
,
2011
and
2010
has been estimated at the date of grant using the Black-Scholes option valuation model and the following weighted-average assumptions:
53
MAXIM INTEGRATED PRODUCTS, INC.
NOTES TO CONSOLIDATED FINANCIAL STATEMENTS
|
|
Stock Option Plan For the Year Ended
|
|||||||
|
|
June 30,
2012 |
June 25,
2011 |
June 26,
2010 |
|||||
|
Expected holding period (in years)
|
5.1
|
|
5.2
|
|
5.2
|
|
||
|
Risk-free interest rate
|
1.2
|
%
|
1.7
|
%
|
2.3
|
%
|
||
|
Expected stock price volatility
|
36.9
|
%
|
37.1
|
%
|
38.0
|
%
|
||
|
Dividend yield
|
3.2
|
%
|
4.2
|
%
|
4.5
|
%
|
||
|
|
|
|
|
|||||
|
|
ESP Plan For the Year Ended
|
|||||||
|
|
June 30, 2012
|
June 25, 2011
|
June 26, 2010
|
|||||
|
Expected holding period (in years)
|
0.5
|
|
0.5
|
|
0.7
|
|
||
|
Risk-free interest rate
|
0.1
|
%
|
0.1
|
%
|
0.3
|
%
|
||
|
Expected stock price volatility
|
25.0
|
%
|
24.7
|
%
|
35.0
|
%
|
||
|
Dividend yield
|
3.2
|
%
|
3.3
|
%
|
4.4
|
%
|
||
The weighted-average fair value of stock options granted was
$5.91
,
$4.02
and
$4.23
per share for fiscal years
2012
,
2011
and
2010
, respectively. The weighted-average fair value of RSUs granted was
$20.80
,
$16.61
and
$16.20
per share for fiscal years
2012
,
2011
and
2010
, respectively.
Stock Option Plans
1996 Stock Incentive Plan
The Company's 1996 Plan, which was previously approved by the Company's stockholders, permits the grant of up to
120.1 million
shares. The 1996 Plan provides for the grant of stock options, restricted stock units and restricted stock. To date, the Company has only issued stock options and restricted stock units. Under the 1996 Plan, the exercise price for all stock options will not be less than the fair market value of the Company's common stock on the date of grant. Options granted under the 1996 Plan, as well as under the Company's other stock plans described above, generally vest over a period of up to four years and expire from five to ten years from the date of the grant or such shorter term as may be provided in the agreement.
At
June 30, 2012
, the Company had
19.1 million
shares of its common stock available for issuance to employees and other option recipients under its 1996 Stock Incentive Plan, 1993 Officer and Director Stock Option Plan, 1987 Stock Option Plan, 1987 Supplemental Stock Option Plan, and Supplemental Non-employee Stock Option Plan.
The following table summarizes stock options outstanding, exercisable and vested and expected to vest as of
June 30, 2012
:
54
MAXIM INTEGRATED PRODUCTS, INC.
NOTES TO CONSOLIDATED FINANCIAL STATEMENTS
|
|
Options
|
Weighted Average
Remaining
Contractual Term
(In Years)
|
Aggregate
Intrinsic
Value (1)
|
||||||||
|
|
Number of Shares
|
Weighted Average
Exercise Price
|
|||||||||
|
Balance at June 27, 2009
|
29,599,916
|
|
$28.83
|
|
|
|
|
||||
|
Options Granted
|
3,671,459
|
|
18.08
|
|
|
|
|
||||
|
Options Exercised
|
(47,327
|
)
|
12.86
|
|
|
|
|
||||
|
Options Cancelled
|
(4,061,541
|
)
|
32.38
|
|
|
|
|
||||
|
|
|
|
|
||||||||
|
Balance at June 26, 2010
|
29,162,507
|
|
27.05
|
|
|
|
|
||||
|
Options Granted
|
3,559,132
|
|
17.61
|
|
|
|
|
||||
|
Options Exercised
|
(1,460,652
|
)
|
17.22
|
|
|
|
|
||||
|
Options Cancelled
|
(2,928,501
|
)
|
33.67
|
|
|
|
|
||||
|
Balance at June 25, 2011
|
28,332,486
|
|
25.62
|
||||||||
|
Options Granted
|
3,353,017
|
|
23.14
|
||||||||
|
Options Exercised
|
(2,843,444
|
)
|
16.55
|
||||||||
|
Options Cancelled
|
(4,607,065
|
)
|
31.62
|
||||||||
|
Balance at June 30, 2012
|
24,234,994
|
|
25.20
|
3.5
|
|
$
|
108,906,939
|
|
|||
|
|
|||||||||||
|
Exercisable at June 30, 2012
|
13,945,087
|
|
$30.02
|
2.3
|
|
$
|
40,690,170
|
|
|||
|
Vested and expected to vest, June 30, 2012
|
23,169,056
|
|
$25.43
|
3.4
|
|
$
|
103,363,007
|
|
|||
|
(1)
|
Aggregate intrinsic value represents the difference between the exercise price and the closing price per share of the Company's common stock on June 29, 2012, the last business day preceding the fiscal year end, multiplied by the number of option outstanding, exercisable or vested and expected to vest as of
June 30, 2012
.
|
The following table summarizes information about stock options that were outstanding and exercisable at
June 30, 2012
:
|
|
Outstanding Options
|
Options Exercisable
|
|||||||||||
|
Range of Exercise Prices
|
Number
Outstanding at
June 30, 2012
|
Weighted Average
Remaining
Contractual Term
(In years)
|
Weighted
Average
Exercise
Price
|
Number
Exercisable at
June 30, 2012
|
Weighted
Average
Exercise
Price
|
||||||||
|
$12.00 - $18.04
|
7,181,461
|
|
4.13
|
|
$14.29
|
2,875,727
|
|
$13.01
|
|||||
|
$18.11 - $27.22
|
7,100,505
|
|
4.67
|
|
$20.88
|
1,423,354
|
|
$21.13
|
|||||
|
$27.24 - $40.96
|
8,445,771
|
|
2.12
|
|
$34.69
|
8,138,749
|
|
$34.92
|
|||||
|
$41.92 - $51.00
|
1,507,257
|
|
2.00
|
|
$44.37
|
1,507,257
|
|
$44.37
|
|||||
|
|
24,234,994
|
|
|
|
13,945,087
|
|
|
||||||
During fiscal year
2012
, the Company granted approximately
3.4 million
stock options from its 1996 Plan with an estimated total grant date fair value of
$19.8 million
. The total intrinsic value of options exercised during fiscal years
2012
and
2011
were
$30.7 million
and
$11.8 million
, respectively, and insignificant for fiscal year
2010
. The total fair value of options vested during fiscal years
2012
and 2011 were
$14.7 million
and
$23.0 million
, respectively and insignificant for fiscal year
2010
. As of
June 30, 2012
, there was
$31.3 million
of total unrecognized compensation costs related to
10.3 million
unvested stock options expected to be recognized over a weighted average period of approximately
2.6
years.
Restricted Stock Units
Restricted stock units ("RSUs") generally vest on a quarterly basis over a service period of up to four years from the grant date. The restricted stock units represent a promise by the Company to the employees to issue shares of its common stock in the future, provided the vesting criteria are satisfied. RSUs granted reduce the total number of shares available for issuance under the 1996 Plan by a factor of two. To the extent RSUs are returned back to the 1996 Plan, for example, due to cancellations, such RSUs would increase the number of shares available to grant by a factor of two.
55
MAXIM INTEGRATED PRODUCTS, INC.
NOTES TO CONSOLIDATED FINANCIAL STATEMENTS
The following table summarizes outstanding and expected to vest RSUs as of
June 30, 2012
and their activity during fiscal years
2012
,
2011
and
2010
:
|
|
Number of
Shares
|
Weighted Average Remaining Contractual Term (In Years)
|
Aggregate
Intrinsic
Value (1)
|
||||||
|
Balance at June 27, 2009
|
11,867,329
|
|
|
|
|
|
|||
|
Restricted stock units granted
|
4,259,756
|
|
|
|
|
|
|||
|
Restricted stock units released
|
(4,813,738
|
)
|
|
|
|
|
|||
|
Restricted stock units cancelled
|
(737,930
|
)
|
|
|
|
|
|||
|
Balance at June 26, 2010
|
10,575,417
|
|
|||||||
|
Restricted stock units granted
|
4,171,372
|
|
|||||||
|
Restricted stock units released
|
(3,922,768
|
)
|
|||||||
|
Restricted stock units cancelled
|
(823,283
|
)
|
|||||||
|
Balance at June 25, 2011
|
10,000,738
|
|
|||||||
|
Restricted stock units granted
|
3,645,864
|
|
|||||||
|
Restricted stock units released
|
(3,433,989
|
)
|
|||||||
|
Restricted stock units cancelled
|
(1,289,159
|
)
|
|||||||
|
Balance at June 30, 2012
|
8,923,454
|
|
2.5
|
|
$
|
223,759,831
|
|
||
|
Expected to vest at June 30, 2012
|
7,854,496
|
|
2.5
|
|
$
|
197,619,128
|
|
||
(1) Aggregate intrinsic value for RSUs represents the closing price per share of the Company's common stock on June 29, 2012, the last business day preceding the fiscal year end, multiplied by the number of RSUs outstanding, or expected to vest as of
June 30, 2012
.
The Company withheld shares worth
$29.6 million
related to employee withholding taxes based on the value of the RSUs on their vesting date as determined by the Company's closing stock price during the fiscal year ended
June 30, 2012
. The total payments for the employees' tax obligations to the taxing authorities are reflected as financing activities within the Consolidated Statements of Cash Flows.
As of
June 30, 2012
, there was
$114.0 million
of unrecognized compensation cost related to
8.9 million
unvested RSUs, which is expected to be recognized over a weighted average period of approximately
2.5
years.
2008 Employee Stock Purchase Plan
Under the 2008 ESPP, the Company has reserved to date
10.0 million
shares of its common stock for future issuance. The 2008 ESPP permits two purchases over a twelve month offer period. Pursuant to the terms of the 2008 ESPP, eligible employees may elect withholdings of up to
25%
of eligible compensation to purchase shares of common stock at the lower of (i)
85%
of the fair market value of the shares on the offer date or (ii)
85%
of the fair market value of the shares on the purchase date. The 2008 ESPP does not permit employees to buy more than
$25,000
worth of stock annually or
1,600
shares during an offer period.
The Company issued
1.7 million
shares of its common stock for total consideration of
$33.7 million
related to the ESPP plan during the fiscal year ended
June 30, 2012
. As of
June 30, 2012
, the Company had
4.3 million
shares of its common stock reserved and available for future issuance under the 2008 ESPP.
Basic earnings per share are computed using the weighted average number of common shares outstanding during the period. For purposes of computing basic earnings per share, the weighted average number of outstanding shares of common stock excludes unvested RSUs. Diluted earnings per share incorporates the incremental dilutive shares issuable upon the assumed exercise of stock options, assumed release of unvested RSUs and assumed issuance of common stock under the employee stock purchase plans using the treasury stock method.
56
MAXIM INTEGRATED PRODUCTS, INC.
NOTES TO CONSOLIDATED FINANCIAL STATEMENTS
The following table sets forth the computation of basic and diluted earnings per share:
|
|
For the Year Ended
|
||||||||||
|
|
June 30,
2012 |
June 25,
2011 |
June 26,
2010 |
||||||||
|
|
(In thousands, except per share data)
|
||||||||||
|
Numerator for basic earnings per share and diluted earnings per share
|
|
|
|
|
|
|
|||||
|
Income from continuing operations
|
$
|
354,918
|
|
$
|
489,009
|
|
$
|
125,139
|
|
||
|
Income from discontinued operations
|
31,809
|
|
—
|
|
—
|
|
|||||
|
Net income
|
$
|
386,727
|
|
$
|
489,009
|
|
$
|
125,139
|
|
||
|
Denominator for basic earnings per share
|
292,810
|
|
296,755
|
|
304,579
|
|
|||||
|
Effect of dilutive securities:
|
|
|
|
|
|
|
|||||
|
Stock options, ESPP and RSUs
|
7,192
|
|
6,622
|
|
5,437
|
|
|||||
|
Denominator for diluted earnings per share
|
300,002
|
|
303,377
|
|
310,016
|
|
|||||
|
Earnings per share-basic:
|
|
|
|
|
|
|
|||||
|
From continuing operations
|
$
|
1.21
|
|
$
|
1.65
|
|
$
|
0.41
|
|
||
|
From discontinued operations
|
0.11
|
|
—
|
|
—
|
|
|||||
|
Basic
|
$
|
1.32
|
|
$
|
1.65
|
|
$
|
0.41
|
|
||
|
Earnings per share-diluted:
|
|||||||||||
|
From continuing operations
|
$
|
1.18
|
|
$
|
1.61
|
|
$
|
0.40
|
|
||
|
From discontinued operations
|
0.11
|
|
—
|
|
—
|
|
|||||
|
Diluted
|
$
|
1.29
|
|
$
|
1.61
|
|
$
|
0.40
|
|
||
Approximately
13.8 million
,
14.9 million
, and
21.1 million
of the Company's stock awards were excluded from the calculation of diluted earnings per share for fiscal years
2012
,
2011
, and
2010
, respectively. These options were excluded, as they were antidilutive. However, such options could be dilutive in the future.
Goodwill
The Company classifies goodwill and acquired intangible assets within other assets in the Consolidated Balance Sheets. The Company's carrying value of goodwill was
$423.1 million
and
$265.1 million
at
June 30, 2012
and
June 25, 2011
, respectively.
|
Goodwill
|
|||
|
Balance at June 25, 2011
|
$
|
265,125
|
|
|
Acquisitions
|
160,299
|
|
|
|
Divestitures
|
(9,728
|
)
|
|
|
Adjustments
|
7,377
|
|
|
|
Balance at June 30, 2012
|
$
|
423,073
|
|
In fiscal year 2012, the Company adjusted the carrying values of certain acquired assets and liabilities primarily related to fiscal year 2011 and 2012 acquisitions in process research and development (“IPR&D”), intangibles and taxes related balances.
Intangible Assets
The useful lives of the significant definite lived intangible assets are as follows:
57
MAXIM INTEGRATED PRODUCTS, INC.
NOTES TO CONSOLIDATED FINANCIAL STATEMENTS
|
Asset
|
Life
|
|
|
Intellectual Property
|
5-10 years
|
|
|
Customer Relationships
|
5-10 years
|
|
|
Tradename
|
3 years
|
|
|
Backlog
|
1 year
|
|
Intangible assets consisted of the following:
|
June 30, 2012
|
June 25, 2011
|
||||||||||||||||||||||
|
Original
Cost
|
Accumulated
Amortization
|
Net
|
Original
Cost
|
Accumulated
Amortization
|
Net
|
||||||||||||||||||
|
(in thousands)
|
|||||||||||||||||||||||
|
Intellectual property
|
$
|
227,912
|
|
$
|
102,501
|
|
$
|
125,411
|
|
$
|
195,912
|
|
$
|
64,996
|
|
$
|
130,916
|
|
|||||
|
Customer relationships
|
95,230
|
|
39,583
|
|
55,647
|
|
88,630
|
|
24,915
|
|
63,715
|
|
|||||||||||
|
Backlog
|
6,400
|
|
6,400
|
|
—
|
|
6,400
|
|
5,687
|
|
713
|
|
|||||||||||
|
Tradename
|
2,100
|
|
1,525
|
|
575
|
|
1,700
|
|
981
|
|
719
|
|
|||||||||||
|
Total amortizable purchased intangible assets
|
331,642
|
|
150,009
|
|
181,633
|
|
292,642
|
|
96,579
|
|
196,063
|
|
|||||||||||
|
IPR&D
|
27,280
|
|
—
|
|
27,280
|
|
8,200
|
|
—
|
|
8,200
|
|
|||||||||||
|
Total purchased intangible assets
|
$
|
358,922
|
|
$
|
150,009
|
|
$
|
208,913
|
|
$
|
300,842
|
|
$
|
96,579
|
|
$
|
204,263
|
|
|||||
The following table presents the amortization expense of intangible assets and its presentation in the Consolidated Statements of Income:
|
For the Year Ended
|
|||||||||||
|
June 30, 2012
|
June 25, 2011
|
June 26, 2010
|
|||||||||
|
(in thousands)
|
|||||||||||
|
Cost of goods sold
|
$
|
36,693
|
|
$
|
30,164
|
|
$
|
10,999
|
|
||
|
Intangible Asset Amortization
|
16,737
|
|
18,752
|
|
10,477
|
|
|||||
|
Total Intangible Asset Amortization Expenses
|
$
|
53,430
|
|
$
|
48,916
|
|
$
|
21,476
|
|
||
|
The following table represents the estimated future amortization expense of amortizable purchased intangible assets as of the end of fiscal year 2012:
|
||||
|
Fiscal Year
|
Amount
|
|||
|
|
(in thousands)
|
|||
|
2013
|
$
|
52,399
|
|
|
|
2014
|
41,495
|
|
||
|
2015
|
40,452
|
|
||
|
2016
|
27,661
|
|
||
|
2017
|
17,983
|
|
||
|
Thereafter
|
1,643
|
|
||
|
Total intangible assets
|
$
|
181,633
|
|
|
Acquisitions completed in fiscal year 2012
58
MAXIM INTEGRATED PRODUCTS, INC.
NOTES TO CONSOLIDATED FINANCIAL STATEMENTS
The purchase price allocation for acquisitions completed in fiscal year 2012 is set forth in the table below and reflects various preliminary fair value estimates and analysis, including preliminary work performed by third-party valuation specialists, which are subject to change within the measurement period (up to one year from the acquisition date) as valuations are finalized. The primary areas of the preliminary purchase price allocation that are not yet finalized are the determination of the deferred tax assets and liabilities and residual goodwill.
Pro forma results of operations for these acquisitions have not been presented because they are not material to Maxim's consolidated results of income, either individually or in the aggregate. Revenue and earnings per share for the acquired businesses since the date of acquisition through
June 30, 2012
were not provided as they are not material. Goodwill, which represents the excess of the purchase price over the net tangible and intangible assets acquired, is not expected to be deductible for tax purposes. Acquisition costs for fiscal year 2012 were not material.
Aggregate preliminary purchase price allocation for acquisitions made by Maxim during fiscal year 2012 is as follows:
|
SensorDynamics
|
Other acquisitions
|
Total
|
|||||||||
|
|
(in thousands)
|
||||||||||
|
Tangible assets
|
$
|
18,692
|
|
$
|
1,159
|
|
$
|
19,851
|
|
||
|
Debt assumed
|
(29,078
|
)
|
—
|
|
(29,078
|
)
|
|||||
|
Other liabilities assumed
|
(37,559
|
)
|
(4,729
|
)
|
(42,288
|
)
|
|||||
|
Net liabilities assumed
|
(47,945
|
)
|
(3,570
|
)
|
(51,515
|
)
|
|||||
|
Amortizable intangible assets
|
20,900
|
|
17,840
|
|
38,740
|
|
|||||
|
IPR&D
|
19,600
|
|
—
|
|
19,600
|
|
|||||
|
Goodwill (1)
|
130,594
|
|
38,392
|
|
168,986
|
|
|||||
|
Total purchase price (1)
|
$
|
123,149
|
|
$
|
52,662
|
|
$
|
175,811
|
|
||
(1) Includes
$11.4 million
of contingent consideration relating to the other acquisitions discussed further below.
The following table presents details of the Company's intangible assets acquired through business combinations completed during fiscal year 2012 (in thousands, except years):
|
Intellectual Property
|
Customer Relationships
|
Trademark
|
Total
|
|||||||||||||||||||||
|
Weighted Average Useful Life (in Years)
|
Amount
|
Weighted Average Useful Life (in Years)
|
Amount
|
Weighted Average Useful Life (in Years)
|
Amount
|
|||||||||||||||||||
|
SensorDynamics
|
7.0
|
|
$
|
16,400
|
|
7.0
|
|
$
|
4,100
|
|
3.0
|
|
$
|
400
|
|
$
|
20,900
|
|
||||||
|
Other acquisitions
|
9.2
|
|
15,340
|
|
3.0
|
|
2,500
|
|
—
|
|
—
|
|
17,840
|
|
||||||||||
|
Total
|
$
|
31,740
|
|
$
|
6,600
|
|
$
|
400
|
|
$
|
38,740
|
|
||||||||||||
|
Weighted Average (in Years)
|
8.1
|
|
5.5
|
|
3.0
|
|
||||||||||||||||||
SENSORDYNAMICS
On July 18, 2011, the Company acquired SensorDynamics, a semiconductor company that develops proprietary sensor and microelectromechanical solutions. SensorDynamics is based in Lebring, near Graz, Austria. The purpose of the acquisition was to allow Maxim to combine sensors with analog products. The total cash consideration associated with the acquisition was approximately
$123.1 million
. The Company expects that none of the goodwill associated with the acquisition will be deductible for tax purposes.
OTHER ACQUISITIONS
The Company acquired
three
other companies during fiscal year 2012, the biggest of which is a company that develops low power high performance analog circuits. The total cash consideration associated with the acquisition was approximately
$41.3 million
.
59
MAXIM INTEGRATED PRODUCTS, INC.
NOTES TO CONSOLIDATED FINANCIAL STATEMENTS
Maxim also recorded
$11.4 million
, representing the fair value of contingent consideration that would be payable in the future should certain specified project milestones be met. Total contingent consideration that could be paid out under the agreement amounts to
$16.0 million
. The contingent consideration was calculated based on probabilities that were developed regarding the likelihood that the product development milestones would be met and when the contingent payments would occur. Based on these factors, a probability weighted earnout amount was calculated and discounted (at the cost of debt) to present value.
Acquisitions in fiscal year 2011
Aggregate purchase price allocation for Maxim's fiscal year 2011 acquisitions:
|
|
Phyworks
|
Other acquisitions
|
Total
|
|||||||||
|
(In thousands)
|
||||||||||||
|
Tangible assets
|
$
|
5,676
|
|
$
|
662
|
|
$
|
6,338
|
|
|||
|
Liabilities assumed
|
(17,524
|
)
|
(818
|
)
|
(18,342
|
)
|
||||||
|
Net liabilities assumed
|
(11,848
|
)
|
(156
|
)
|
(12,004
|
)
|
||||||
|
Amortizable intangible assets
|
50,800
|
|
1,750
|
|
52,550
|
|
||||||
|
IPR&D
|
5,800
|
|
2,580
|
|
8,380
|
|
||||||
|
Goodwill
(1)
|
26,606
|
|
14,187
|
|
40,793
|
|
||||||
|
Total purchase price
(1)
|
$
|
71,358
|
|
$
|
18,361
|
|
$
|
89,719
|
|
|||
(1) Includes
$8.8 million
of contingent consideration relating to one of the other acquisitions discussed further below
The following table presents details of the Company's intangible assets acquired through business combinations completed during fiscal year 2011 (in thousands, except years):
|
Intellectual Property
|
Customer Relationships
|
Backlog
|
Trademark
|
Total
|
|||||||||||||||||||||||||||
|
Weighted Average Useful Life (in Years)
|
Amount
|
Weighted Average Useful Life (in Years)
|
Amount
|
Weighted Average Useful Life (in Years)
|
Amount
|
Weighted Average Useful Life (in Years)
|
Amount
|
||||||||||||||||||||||||
|
Phyworks
|
5.0
|
|
$
|
47,100
|
|
5.0
|
|
$
|
1,600
|
|
1.3
|
|
$
|
1,900
|
|
1.0
|
|
$
|
200
|
|
$
|
50,800
|
|
||||||||
|
Other acquisitions
|
3.0
|
|
1,750
|
|
—
|
|
—
|
|
—
|
|
—
|
|
—
|
|
—
|
|
1,750
|
|
|||||||||||||
|
Total
|
$
|
48,850
|
|
$
|
1,600
|
|
$
|
1,900
|
|
$
|
200
|
|
$
|
52,550
|
|
||||||||||||||||
|
Weighted Average (in Years)
|
4.9
|
|
5.0
|
|
1.3
|
|
1.0
|
|
|||||||||||||||||||||||
PHYWORKS
On September 7, 2010, the Company acquired Phyworks Limited, a developer of high-speed communications integrated circuits. The Company expects that
none
of the goodwill associated with the acquisition will be deductible for tax purposes. No supplemental pro forma information is presented for the acquisition due to the immaterial effect of the acquisition on the Company's results of operations.
OTHER ACQUISITIONS
During fiscal year 2011, the Company completed
two
other acquisitions, the biggest of which is a developer of highly integrated, analog, mixed-signal solutions, as well as design methods and flows for analog system-on-a-chip (SoCs). The total cash consideration associated with the acquisition was
$8.2 million
. The acquired assets included cash of
$0.4 million
. Maxim also recorded
$8.8 million
, representing the fair value of contingent consideration that would be payable in the future should certain specified project milestones be met. Total contingent consideration that could be paid out under the agreement amounts to
$12.5
60
MAXIM INTEGRATED PRODUCTS, INC.
NOTES TO CONSOLIDATED FINANCIAL STATEMENTS
million
. As of
June 30, 2012
, Maxim has paid
$4.1 million
relating to contingent consideration.
Fiscal year 2012 impairments:
During the fourth quarter of fiscal year 2012, the Company identified certain idle facilities that needed impairment. In connection with these circumstances, the Company recorded a charge for the write-down of buildings to its estimated fair value, less cost to sell. The total charge of
$22.4 million
was included in impairment of long-lived assets in the Company's Consolidated Statements of Income. The Company reached its conclusion regarding the asset impairment after conducting an evaluation of assets fair values. The fair value of the buildings was determined mainly after consideration of evidence such as appraisals and offers received.
During the third quarter of fiscal year 2012, the Company identified certain assets as excess primarily attributable to changes in certain manufacturing technology. These assets included fabrication used tools and certain end of line manufacturing equipment. In connection with these circumstances, the Company recorded a charge for the write down of equipment to its estimated fair value, less cost to sell. The total charge of
$7.7 million
was included in impairment of long-lived assets in the Company's Consolidated Statements of Income. The Company reached its conclusion regarding the asset impairment after conducting an evaluation of the recoverability of the related manufacturing assets in accordance with ASC 360-
Property, Plant, and Equipment
. The fair value of the equipment was determined mainly after consideration of quoted market prices of similar equipment adjusted for equipment specifications and condition in addition to the current market demand and size.
The Company has ceased depreciation and classified the above assets as held for sale based on its intentions to sell the assets and has included the lower of fair value less cost to sell and net book value in other assets in the Consolidated Balance Sheet as of
June 30, 2012
.
Fiscal year 2011 impairments:
None
Fiscal year 2010 impairments:
End-of-Line Sorting and Testing Facilities
During the first quarter of fiscal year 2010, the Company identified certain assets as excess or obsolete, primarily due to changes in certain manufacturing technology. In connection with these circumstances, the Company recorded a charge for the write-down of equipment to its estimated fair value. The total charge of
$5.0 million
was included in impairment of long-lived assets in the Company's Consolidated Statements of Income. The Company has ceased depreciation and classified these assets as held for sale based on its intentions to sell the assets and has included
$0.6 million
in other assets in the Consolidated Balance Sheet as of June 26, 2010.
Wafer Fabrication Facility, Oregon
During the first quarter of fiscal year 2010, as a result of reduced future wafer output requirements associated with equipment utilizing certain process technologies, the Company recorded a write-down of equipment to be sold to the equipment's estimated fair value. This charge of
$3.3 million
was included in impairment of long-lived assets in the Company's Consolidated Statements of Income. The Company has ceased depreciation and classified these assets as held for sale based on its intentions to sell the assets and has included
$0.5 million
in other assets in the Consolidated Balance Sheet as of June 26, 2010.
In January 2012, the Company sold its clock synchronization business for approximately
$44.0 million
. No further proceeds from the sale are expected. The clock synchronization business formed part of the Company's Comm Timing operating segment.
In February 2012, the Company also sold certain future technologies, including die types that will result in future products, in the storage area. The total sale price for this transaction was approximately
$15.0 million
. No further proceeds from the sale are expected. The technologies and die types sold formed part of the Company's Storage operating segment.
As a result of these two transactions, the Company recognized a gain on sale of discontinued operations of
$31.8 million
, net of income taxes. This gain reflects cash received, less transaction costs and the net carrying value of assets and liabilities transferred.
61
MAXIM INTEGRATED PRODUCTS, INC.
NOTES TO CONSOLIDATED FINANCIAL STATEMENTS
The Company has not disclosed and included in discontinued operations the impact of historical revenue, pre- or post- tax profit or loss related to discontinued operations for any of the prior periods presented as the impact was immaterial to the Company's consolidated financial statements.
Selected financial information related to discontinued operations follows:
|
June 30,
2012 |
||||
|
(in thousands)
|
||||
|
Gain on sale of discontinued operations
|
$
|
45,372
|
|
|
|
Income tax expense
|
(13,563
|
)
|
||
|
Gain on discontinued operations, net of tax
|
$
|
31,809
|
|
|
The Company operates and tracks its results in one reportable segment. The Company designs, develops, manufactures and markets a broad range of linear and mixed signal integrated circuits. The Chief Executive Officer has been identified as the Chief Operating Decision Maker as defined by ASC No. 280,
Disclosures about Segments Reporting
("ASC 280").
In 2012, the Company identified three operating segments which aggregate into one reportable segment. Under ASC 280, two or more operating segments may be aggregated into a single operating segment for financial reporting purposes if aggregation is consistent with the objective and basic principles of ASC 280, if the segments have similar economic characteristics, and if the segments are similar in each of the following areas:
|
•
|
the nature of products and services;
|
|
•
|
the nature of the production processes;
|
|
•
|
the type or class of customer for their products and services; and
|
|
•
|
the methods used to distribute their products or provide their services.
|
The Company meets each of the aggregation criteria for the following reasons:
|
•
|
the sale of analog and mixed signal integrated circuits is the primary source of revenue for each of the Company's three operating segments;
|
|
•
|
the integrated circuits sold by each of the Company's operating segments are manufactured using similar semiconductor manufacturing processes;
|
|
•
|
the integrated circuits marketed by each of the Company's operating segments are sold to the same types of customers; and
|
|
•
|
all of the Company's integrated circuits are sold through a centralized sales force and common wholesale distributors.
|
All of the Company's operating segments share similar economic characteristics as they have a similar long term business model. The causes for variation among the Company's operating segments are the same and include factors such as (i) life cycle and price and cost fluctuations, (ii) number of competitors, (iii) product differentiation and (iv) size of market opportunity. Additionally, each operating segment is subject to the overall cyclical nature of the semiconductor industry. The number and composition of employees and the amounts and types of tools and materials required are similar for each operating segment. Finally, even though the Company periodically reorganizes the Company's operating segments based upon changes in customers, end-markets or products, acquisitions, long-term growth strategies, and the experience and bandwidth of the senior executives in charge, the common financial goals for each operating segment remain constant.
Enterprise-wide information is provided in accordance with ASC 280. Geographical revenue information is based on customers' ship-to location. Long-lived assets consist of property, plant and equipment. Property, plant and equipment information is based on the physical location of the assets at the end of each fiscal year.
Net revenues from unaffiliated customers by geographic region were as follows:
62
MAXIM INTEGRATED PRODUCTS, INC.
NOTES TO CONSOLIDATED FINANCIAL STATEMENTS
|
|
For the Year Ended
|
||||||||||
|
|
June 30, 2012
|
June 25, 2011
|
June 26, 2010
|
||||||||
|
|
(in thousands)
|
||||||||||
|
United States
|
$
|
287,174
|
|
$
|
360,310
|
|
$
|
291,539
|
|
||
|
China
|
1,040,833
|
|
915,628
|
|
685,908
|
|
|||||
|
Japan
|
149,770
|
|
163,061
|
|
131,513
|
|
|||||
|
Korea
|
201,819
|
|
294,006
|
|
311,928
|
|
|||||
|
Rest of Asia
|
356,636
|
|
283,121
|
|
223,786
|
|
|||||
|
Europe
|
302,373
|
|
379,173
|
|
288,675
|
|
|||||
|
Rest of World
|
64,924
|
|
77,042
|
|
64,254
|
|
|||||
|
|
$
|
2,403,529
|
|
$
|
2,472,341
|
|
$
|
1,997,603
|
|
||
Net long-lived assets by geographic region were as follows:
|
|
Fiscal Year Ended
|
||||||
|
|
June 30, 2012
|
June 25, 2011
|
|||||
|
|
(in thousands)
|
||||||
|
United States
|
$
|
957,982
|
|
$
|
972,380
|
|
|
|
Philippines
|
247,681
|
|
204,581
|
|
|||
|
Thailand
|
99,308
|
|
120,838
|
|
|||
|
Rest of World
|
48,635
|
|
11,051
|
|
|||
|
|
$
|
1,353,606
|
|
$
|
1,308,850
|
|
|
Stock Option Litigation
Beginning on or about May 22, 2006, several derivative actions were filed against certain current and former executive officers and directors of the Company alleging, among other things, wrongful conduct of back-dating stock options as well as securities law violations, and named the Company as a nominal defendant against whom the plaintiffs sought no recovery.
The parties to the derivative litigation in the Delaware Court of Chancery entered into a stipulated settlement agreement, which was approved by the Delaware Court of Chancery on September 16, 2008. All derivative actions pending in the California Superior Court have since been dismissed, with prejudice. Net settlement proceeds of
$18.9 million
were received by the Company on September 10, 2009. The Company recognized an increase to additional paid in capital of
$2.5 million
related to excess gains while the remainder of the proceeds of
$16.4 million
was recorded as a reduction to other operating (income) expenses, net.
On February 6, 2008, a putative class action complaint was filed against the Company and certain former officers and employees in the U.S. District Court for the Northern District of California alleging claims under the federal securities laws based on certain alleged misrepresentations and omissions in the Company's public disclosures concerning its stock option accounting practices. On June 18, 2010, lead plaintiffs and the Company entered into a stipulation of settlement settling the action and providing for the payment of
$173.0 million
in cash by the Company. The Company made the payment in July, 2010. On September 29, 2010, the Court issued a Final Order and Judgment approving the settlement.
Legal Proceedings
We are party or subject to various other legal proceedings and claims, either asserted or unasserted, which arise in the ordinary course of business, including proceedings and claims that relate to intellectual property matters, and acquisitions we have completed or to companies we have acquired or are attempting to acquire. While the outcome of these matters cannot be predicted with certainty, we do not believe that the outcome of any of these matters, individually or in the aggregate, will result in losses that are materially in excess of amounts already recognized or reserved, if any.
Commitments
63
MAXIM INTEGRATED PRODUCTS, INC.
NOTES TO CONSOLIDATED FINANCIAL STATEMENTS
The Company leases certain of its facilities under various operating leases that expire at various dates through
June 2025
. The lease agreements generally include renewal provisions and require the Company to pay property taxes, insurance, and maintenance costs.
Future annual minimum payments for all commitments are as follows:
|
|
Total
|
Less than
1 year
|
2-3 years
|
4-5 years
|
More than
5 years
|
||||||||||||||
|
|
(Amounts in thousands)
|
||||||||||||||||||
|
Operating lease obligations (1)
|
$
|
40,390
|
|
$
|
10,993
|
|
$
|
14,625
|
|
$
|
9,951
|
|
$
|
4,821
|
|
||||
|
Royalty obligations (2)
|
10,000
|
|
10,000
|
|
—
|
|
—
|
|
—
|
|
|||||||||
|
Long-term debt obligations (3)
|
309,088
|
|
303,496
|
|
2,028
|
|
2,599
|
|
965
|
|
|||||||||
|
Interest payments associated with long-term debt obligations (4)
|
10,806
|
|
10,554
|
|
168
|
|
79
|
|
5
|
|
|||||||||
|
Capital equipment and inventory related purchase obligations (5)
|
19,258
|
|
2,162
|
|
4,564
|
|
4,564
|
|
7,968
|
|
|||||||||
|
Total
|
$
|
389,542
|
|
$
|
337,205
|
|
$
|
21,385
|
|
$
|
17,193
|
|
$
|
13,759
|
|
||||
(1) The Company leases some facilities under non-cancelable operating lease agreements that expire at various dates through 2025.
(2) Royalty obligations represent payments for licensed patents.
(3) Long-term debt represents amounts due for the Company's
$300 million
notes due 2013 and other notes acquired through the SensorDynamics acquisition.
(4) Interest payments associated with the Company's
$300 million
notes due 2013 and other notes acquired through the SensorDynamics acquisition.
(5) Capital equipment purchase obligations represent commitments for purchase of property, plant and equipment. The Company orders some materials and supplies in advance or with minimum purchase quantities. The Company is obligated to pay for the materials and supplies when received.
Purchase orders for the purchase of the majority of our raw materials and other goods and services are not included in the table. Our purchase orders generally allow for cancellation without significant penalties. We do not have significant agreements for the purchase of raw materials or other goods specifying minimum quantities or set prices that exceed our expected short-term requirements.
Rental expense amounted to approximately
$17.4 million
,
$12.7 million
, and
$8.2 million
in fiscal years
2012
,
2011
and
2010
, respectively.
Indemnifications
The Company indemnifies certain customers, distributors, suppliers and subcontractors for attorney fees and damages and costs awarded against such parties in certain circumstances in which the Company's products are alleged to infringe third party intellectual property rights, including patents, registered trademarks or copyrights. The terms of the Company's indemnification obligations are generally perpetual from the effective date of the agreement. In certain cases, there are limits on and exceptions to the Company's potential liability for indemnification relating to intellectual property infringement claims.
Legal fees associated with indemnification obligations, defense and other related costs
Pursuant to the Company's charter documents and separate written indemnification agreements, the Company has certain indemnification obligations to its current officers and directors, as well as certain former officers and directors. Pursuant to such obligations, the Company has incurred expenses related to legal fees and expenses advanced to certain former officers of the Company subject to civil charges by the SEC in connection with Maxim's historical stock option granting practices. The Company expenses such amounts as incurred.
64
MAXIM INTEGRATED PRODUCTS, INC.
NOTES TO CONSOLIDATED FINANCIAL STATEMENTS
The changes in the components of OCI, net of taxes, were as follows:
|
|
For the Year Ended
|
||||||||||
|
|
June 30,
2012 |
June 25,
2011 |
June 26,
2010 |
||||||||
|
|
(in thousands)
|
||||||||||
|
Net income, as reported
|
$
|
386,727
|
|
$
|
489,009
|
|
$
|
125,139
|
|
||
|
Unrealized gain (loss) on post-retirement benefits, net of tax benefit (expense)
of $1,788 in 2012, $(132) in 2011 and $515 in 2010
|
(2,603
|
)
|
(289
|
)
|
(896
|
)
|
|||||
|
Tax effect of the unrealized exchange gain (loss) on long-term intercompany receivables
|
1,612
|
|
(2,369
|
)
|
(1,893
|
)
|
|||||
|
Unrealized gains (losses) on investments, net of tax benefit (expense) of $74 in 2012, $(189) in 2011, and $770 in 2010
|
(129
|
)
|
331
|
|
(1,346
|
)
|
|||||
|
Unrealized gains (losses) on foreign exchange contracts,
net of tax benefit (expense) of $26 in 2012, $(1) in 2011, and $85 in 2010
|
(46
|
)
|
—
|
|
(150
|
)
|
|||||
|
Total comprehensive income
|
$
|
385,561
|
|
$
|
486,682
|
|
$
|
120,854
|
|
||
The components of Accumulated Other Comprehensive Loss, were as follows:
|
June 30,
2012 |
June 25,
2011 |
||||||
|
(in thousands)
|
|||||||
|
Tax effect of the unrealized exchange loss on long-term intercompany receivables
|
$
|
(6,469
|
)
|
$
|
(8,081
|
)
|
|
|
Unrealized loss on post-retirement benefits
|
(7,444
|
)
|
(4,841
|
)
|
|||
|
Cumulative translation adjustment
|
(1,527
|
)
|
(1,527
|
)
|
|||
|
Unrealized loss on cash flow hedges
|
(196
|
)
|
(150
|
)
|
|||
|
Unrealized gain on available-for-sale securities
|
202
|
|
331
|
|
|||
|
Accumulated Other Comprehensive Loss
|
$
|
(15,434
|
)
|
$
|
(14,268
|
)
|
|
In August 2011, the Board of Directors authorized the Company to repurchase up to
$750 million
of the Company's common stock from time to time at the discretion of the Company's management. This stock repurchase authorization has no expiration date. All prior authorizations by the Company's Board of Directors for the repurchase of common stock were canceled and superseded by this authorization.
During fiscal year
2012
and fiscal year
2011
, the Company repurchased approximately
9.9 million
, and
10.9 million
shares of its common stock for
$246.4 million
and
$231.0 million
, respectively. As of
June 30, 2012
, the Company had remaining authorization of
$551.2 million
f
or future share repurchases. The number of shares to be repurchased and the timing of such repurchases will be based on several factors, including the price of the Company's common stock and general market and business conditions.
The provision for income taxes from continuing operations consisted of the following:
65
MAXIM INTEGRATED PRODUCTS, INC.
NOTES TO CONSOLIDATED FINANCIAL STATEMENTS
|
|
For the Year Ended
|
||||||||||
|
|
June 30, 2012
|
June 25, 2011
|
June 26, 2010
|
||||||||
|
|
(in thousands)
|
||||||||||
|
Federal
|
|
|
|
|
|
|
|||||
|
Current
|
$
|
143,903
|
|
$
|
44,579
|
|
$
|
151,786
|
|
||
|
Deferred
|
16,767
|
|
118,351
|
|
12,340
|
|
|||||
|
State
|
|||||||||||
|
Current
|
2,877
|
|
781
|
|
4,092
|
|
|||||
|
Deferred
|
3,523
|
|
4,204
|
|
(1,464
|
)
|
|||||
|
Foreign
|
|||||||||||
|
Current
|
14,757
|
|
2,810
|
|
14,345
|
|
|||||
|
Deferred
|
(4,012
|
)
|
1,937
|
|
(6,175
|
)
|
|||||
|
|
$
|
177,815
|
|
$
|
172,662
|
|
$
|
174,924
|
|
||
In addition, the Company recorded income tax of
$13.6 million
related to discontinued operations that was netted against income from discontinued operations.
Pretax income (loss) from continuing operations for the Company's foreign subsidiaries was approximately
$348.3 million
,
$285.0 million
and
$(95.5) million
for fiscal years ended
June 30, 2012
,
June 25, 2011
and
June 26, 2010
, respectively.
The Company has tax holidays with respect to certain operations in Thailand that will expire at various dates between the fiscal years 2013 and 2020. The impact of the tax holidays on net income was not material for fiscal years
2012
,
2011
, and
2010
.
As of
June 30, 2012
, the Company's foreign subsidiaries have accumulated undistributed earnings of approximately
$58.5 million
that are intended to be indefinitely reinvested outside the U.S. and, accordingly, no provision for U.S. federal and state tax has been made for the distribution of these earnings. At
June 30, 2012
the amount of the unrecognized deferred tax liability on the indefinitely reinvested earnings was
$8.7 million
.
The provision for income taxes for continuing operations differs from the amount computed by applying the statutory rate as follows:
|
|
For the Year Ended
|
|||||||
|
|
June 30, 2012
|
|
June 25, 2011
|
|
June 26, 2010
|
|
||
|
|
|
|||||||
|
Federal statutory rate
|
35.0
|
%
|
35.0
|
%
|
35.0
|
%
|
||
|
State tax, net of federal benefit
|
1.1
|
|
0.7
|
|
0.4
|
|
||
|
General business credits
|
(0.5
|
)
|
(1.5
|
)
|
(1.2
|
)
|
||
|
Domestic production deduction benefit
|
—
|
|
(0.1
|
)
|
(2.1
|
)
|
||
|
Foreign earnings and losses taxed or benefitted at different rates
|
(3.9
|
)
|
(4.6
|
)
|
21.0
|
|
||
|
Stock-based compensation
|
2.3
|
|
1.3
|
|
3.0
|
|
||
|
Executive compensation
|
—
|
|
0.1
|
|
0.1
|
|
||
|
Release of unrecognized tax benefits
|
(0.4
|
)
|
(4.1
|
)
|
—
|
|
||
|
Interest accrual for unrecognized tax benefits
|
0.6
|
|
(1.6
|
)
|
0.9
|
|
||
|
Other
|
(0.8
|
)
|
0.9
|
|
1.2
|
|
||
|
Income tax rate
|
33.4
|
%
|
26.1
|
%
|
58.3
|
%
|
||
Deferred income taxes reflect the net tax effects of temporary differences between the carrying amounts of assets and liabilities for financial reporting purposes and the amounts used for income tax purposes. The components of the Company's deferred tax assets and liabilities are as follows:
66
MAXIM INTEGRATED PRODUCTS, INC.
NOTES TO CONSOLIDATED FINANCIAL STATEMENTS
|
|
For the Year Ended
|
||||||
|
|
June 30, 2012
|
June 25, 2011
|
|||||
|
|
(in thousands)
|
||||||
|
Deferred tax assets:
|
|
|
|
|
|||
|
Inventory valuation and reserves
|
$
|
8,160
|
|
$
|
11,768
|
|
|
|
Distributor related accruals and sales return and allowance accruals
|
16,426
|
|
21,334
|
|
|||
|
Deferred revenue
|
1,475
|
|
2,233
|
|
|||
|
Accrued compensation
|
44,524
|
|
56,467
|
|
|||
|
Stock-based compensation
|
59,524
|
|
73,295
|
|
|||
|
Net operating loss carryovers
|
40,750
|
|
20,827
|
|
|||
|
Tax credit carryovers
|
43,005
|
|
43,285
|
|
|||
|
Other reserves and accruals not currently deductible for tax purposes
|
17,225
|
|
10,608
|
|
|||
|
Other
|
8,102
|
|
8,940
|
|
|||
|
Total deferred tax assets
|
$
|
239,191
|
|
$
|
248,757
|
|
|
|
Deferred tax liabilities:
|
|
|
|
|
|||
|
Fixed assets cost recovery, net
|
(260,374
|
)
|
(257,647
|
)
|
|||
|
Other
|
(11,822
|
)
|
(12,168
|
)
|
|||
|
Net deferred tax assets /(liabilities) before valuation allowance
|
(33,005
|
)
|
(21,058
|
)
|
|||
|
Valuation allowance
|
(61,550
|
)
|
(44,562
|
)
|
|||
|
Net deferred tax assets/(liabilities)
|
$
|
(94,555
|
)
|
$
|
(65,620
|
)
|
|
The valuation allowance increased by
$17.0 million
in fiscal year
2012
. The increase was primarily due to a valuation allowance that was established for net operating loss carryforwards of companies acquired during the fiscal year 2012.
$37.3 million
of the valuation allowance is attributable to the tax benefits of income tax deductions generated by the exercise of stock options that, when realized, will be recorded as a credit to additional paid-in-capital.
As of
June 30, 2012
, the Company has
$28.6 million
of federal net operating loss carryforwards expiring at various dates between fiscal years 2024 and 2031,
$63.9 million
of state net operating loss carryforwards expiring at various dates through the fiscal years 2031,
$102.8 million
of foreign net operating losses with no expiration date,
$8.1 million
of state tax credit carryforwards expiring at various dates between fiscal years 2013 and 2027 and
$67.3 million
of state tax credit carryforwards with no expiration date.
The Company classifies unrecognized tax benefits as (i) a current liability to the extent that payment is anticipated within one year; (ii) a non-current liability to the extent that payment is not anticipated within one year; or (iii) as a reduction to deferred tax assets to the extent that the unrecognized tax benefit relates to deferred tax assets such as operating loss or tax credit carryforwards.
A reconciliation of the change in gross unrecognized tax benefits, excluding interest, penalties and the federal benefit for state unrecognized tax benefits, is as follows:
67
MAXIM INTEGRATED PRODUCTS, INC.
NOTES TO CONSOLIDATED FINANCIAL STATEMENTS
|
|
For the Year Ended
|
|||||||
|
|
June 30, 2012
|
June 25, 2011
|
||||||
|
|
(in thousands)
|
|||||||
|
Balance as of beginning of year
|
$
|
117,413
|
|
$
|
151,464
|
|
||
|
Tax positions related to current year:
|
||||||||
|
Addition
|
56,257
|
|
59,345
|
|
||||
|
Tax positions related to prior year:
|
||||||||
|
Addition
|
60,221
|
|
7,935
|
|
||||
|
Reduction
|
(2,979
|
)
|
(21,399
|
)
|
||||
|
Settlements
|
—
|
|
(16,636
|
)
|
||||
|
Lapses in statutes of limitations
|
(2,005
|
)
|
(63,296
|
)
|
||||
|
Balance as of end of year
|
$
|
228,907
|
|
$
|
117,413
|
|
||
The total amount of gross unrecognized tax benefits as of
June 30, 2012
that, if recognized, would affect the effective tax rate and additional paid in capital is
$218.8 million
and
$10.1 million
, respectively.
Consistent with prior years, the Company reports interest and penalties related to unrecognized tax benefits as a component of income tax expense. The gross amount of interest and penalties recognized in income tax expense during fiscal years ended
June 30, 2012
,
June 25, 2011
, and
June 26, 2010
was
$7.3 million
,
$(17.1) million
and
$4.4 million
, respectively, and the total amount of interest and penalties accrued as of
June 30, 2012
,
June 25, 2011
, and
June 26, 2010
was
$10.6 million
,
$3.3 million
, and
$20.4 million
, respectively. The fiscal year 2011 interest and penalty net benefit of
$17.1 million
was primarily due to a
$19.5 million
reversal of prior year interest and penalties due to the expiration of the statute of limitations.
In fiscal year 2012 the U.S. Internal Revenue Service commenced an audit of the Company's federal corporate income tax returns for fiscal years 2009 through 2011, which is still ongoing. Management believes that it has adequately provided for any adjustments that may result from this audit.
A summary of the fiscal tax years that remain subject to examination, as of
June 30, 2012
, for the Company's major tax jurisdictions are:
|
United States - Federal
|
2009 - forward
|
|
United States - Various States
|
2008 - forward
|
|
Japan
|
2006 - forward
|
|
Philippines
|
2009 - forward
|
|
Thailand
|
2002 - forward
|
|
United Kingdom
|
2010 - forward
|
|
Ireland
|
2010 - forward
|
68
MAXIM INTEGRATED PRODUCTS, INC.
NOTES TO CONSOLIDATED FINANCIAL STATEMENTS
Defined contribution plan:
Starting January 1, 2011, Maxim reinstated its 401(k) employer matching contribution for U.S. employees. U.S. employees are automatically enrolled in the plan when they meet eligibility requirements, unless they decline participation. Under the terms of the plan Maxim matches
100%
of the employee contributions up to
3%
of employee eligible compensation and
50%
of additional employee contributions up to
5%
of employee eligible compensation,
up to the IRS Annual Compensation Limits. Total defined contribution expense was
$6.8 million
and
$6.0 million
in fiscal years
2012
and
2011
, respectively.
Non-U.S. Pension Benefits
We provide defined-benefit pension plans in certain countries. Consistent with the requirements of local law, we deposit funds for certain plans with insurance companies, with third-party trustees, or into government-managed accounts, and/or accrue for the unfunded portion of the obligation.
Post-Employment Benefits
The Company has outstanding obligations associated with certain former Maxim employees to provide post-employment medical benefits. The total amount of this obligation was
$4.8 million
and included in other liabilities in the Consolidated Balance Sheet as of
June 25, 2011
. The Company accounted for this obligation in accordance with ASC 712
.
As a result of the Company's acquisition of Dallas Semiconductor in 2001, the Company assumed the obligation to continue medical coverage for certain former officers and directors. The total amount of this obligation was
$10.0 million
and included in other liabilities in the Consolidated Balance Sheet as of
June 25, 2011
. The Company accounted for the obligation under ASC 715
.
During the fourth quarter of fiscal year 2012, the Company formalized a post-retirement benefits plan merging the former and current Maxim employees with the Dallas Semiconductor participants under one pool. The plan gained the proper approvals and, accordingly, the Company has accounted for both plans as of June 30, 2012 under ASC 715.
69
MAXIM INTEGRATED PRODUCTS, INC.
NOTES TO CONSOLIDATED FINANCIAL STATEMENTS
Medical Expense & Funded Status Reconciliation
|
|
June 25,
2011 |
Fiscal Year 2012
Expense
|
June 30, 2012
|
Estimated
Fiscal Year 2013
Expense
|
|||||||||||
|
|
(in thousands, except percentages)
|
||||||||||||||
|
Accumulated Postretirement Benefit Obligation [APBO]:
|
|
|
|
|
|||||||||||
|
Retirees and beneficiaries
|
$
|
(9,989
|
)
|
|
$
|
(20,427
|
)
|
|
|||||||
|
Active participants
|
—
|
|
(1,780
|
)
|
|||||||||||
|
Funded status
|
$
|
(9,989
|
)
|
|
$
|
(22,207
|
)
|
|
|||||||
|
Actuarial loss
|
—
|
|
$
|
1,507
|
|
||||||||||
|
Prior service cost
|
—
|
|
3,100
|
|
|||||||||||
|
|
|
|
|
|
|||||||||||
|
Amounts Recognized in Accumulated Other Comprehensive Income:
|
|
|
|
|
|||||||||||
|
Net actuarial loss
|
$
|
7,484
|
|
|
$
|
8,603
|
|
|
|||||||
|
Prior service cost
|
—
|
|
3,100
|
|
|||||||||||
|
Total
|
$
|
7,484
|
|
|
$
|
11,703
|
|
|
|||||||
|
|
|
|
|
|
|||||||||||
|
Net Periodic Postretirement Benefit Cost/(Income):
|
|
|
|
|
|||||||||||
|
Interest cost
|
|
500
|
|
|
877
|
|
|||||||||
|
Amortization:
|
|
|
|||||||||||||
|
Prior service cost
|
—
|
|
356
|
|
|||||||||||
|
Net actuarial loss (1)
|
|
388
|
|
|
734
|
|
|||||||||
|
Total net periodic postretirement benefit cost
|
|
$
|
888
|
|
|
$
|
1,967
|
|
|||||||
|
Employer contributions
|
|
$
|
150
|
|
|
$
|
581
|
|
|||||||
|
|
|
|
|
|
|||||||||||
|
Economic Assumptions:
|
|
|
|
|
|||||||||||
|
Discount rate
|
5.1%
|
4.0%
|
|||||||||||||
|
Medical trend
|
9.5% -5%
|
9% -5%
|
|||||||||||||
(1) Unrecognized losses are amortized over average remaining service period of active participants of
8.7
years at
June 30, 2012
.
The following benefit payments are expected to be paid:
|
Non-Pension Benefits
|
|||
|
2013
|
$
|
581
|
|
|
2014
|
631
|
|
|
|
2015
|
682
|
|
|
|
2016
|
738
|
|
|
|
2017
|
799
|
|
|
|
Thereafter
|
18,776
|
|
|
|
$
|
22,207
|
|
|
Dallas Semiconductor Split-Dollar Life Insurance
As a result of the Company's acquisition of Dallas Semiconductor in 2001, the Company assumed responsibility associated with
70
MAXIM INTEGRATED PRODUCTS, INC.
NOTES TO CONSOLIDATED FINANCIAL STATEMENTS
certain split-dollar life insurance policies held by certain former Dallas Semiconductor officers and directors. The policies are owned by the individuals with the Company maintaining a limited collateral assignment on each policy.
The Company had
$3.0 million
and
$2.9 million
included in Other Assets as of
June 30, 2012
and
June 25, 2011
, respectively, associated with the limited collateral assignment to the policies. The Company had a
$4.6 million
and
$4.4 million
obligation included in Other Liabilities as of
June 30, 2012
and
June 25, 2011
, respectively, related to the anticipated continued funding associated with these policies.
|
|
Quarter Ended
|
||||||||||||||
|
Fiscal Year 2012
|
6/30/2012
|
3/31/2012
|
12/31/2011
|
9/24/2011
|
|||||||||||
|
|
(In thousands, except percentages and per share data)
|
||||||||||||||
|
Net revenues
|
$
|
604,956
|
|
$
|
571,212
|
|
$
|
591,359
|
|
$
|
636,002
|
|
|||
|
Cost of goods sold
|
232,967
|
|
235,782
|
|
243,399
|
|
240,529
|
|
|||||||
|
Gross margin
|
$
|
371,989
|
|
$
|
335,430
|
|
$
|
347,960
|
|
$
|
395,473
|
|
|||
|
Gross margin %
|
61.5
|
%
|
58.7
|
%
|
58.8
|
%
|
62.2
|
%
|
|||||||
|
Operating income
|
$
|
136,021
|
|
$
|
111,886
|
|
$
|
114,510
|
|
$
|
172,380
|
|
|||
|
% of net revenues
|
22.5
|
%
|
19.6
|
%
|
19.4
|
%
|
27.1
|
%
|
|||||||
|
Income from continuing operations
|
$
|
110,634
|
|
$
|
22,708
|
|
$
|
88,130
|
|
$
|
133,446
|
|
|||
|
Income from discontinued operations
|
—
|
|
31,809
|
|
—
|
|
—
|
|
|||||||
|
Net income
|
$
|
110,634
|
|
$
|
54,517
|
|
$
|
88,130
|
|
$
|
133,446
|
|
|||
|
Earnings per share: basic
|
|
|
|
|
|
|
|
|
|||||||
|
From continuing operations
|
$
|
0.38
|
|
$
|
0.08
|
|
$
|
0.30
|
|
$
|
0.45
|
|
|||
|
From discontinued operations
|
—
|
|
0.11
|
|
—
|
|
—
|
|
|||||||
|
Basic
|
$
|
0.38
|
|
$
|
0.19
|
|
$
|
0.30
|
|
$
|
0.45
|
|
|||
|
|
|
|
.
|
|
|
|
|
|
|||||||
|
Earnings per share: diluted
|
|||||||||||||||
|
From continuing operations
|
$
|
0.37
|
|
$
|
0.07
|
|
$
|
0.29
|
|
$
|
0.44
|
|
|||
|
From discontinued operations
|
—
|
|
0.11
|
|
—
|
|
—
|
|
|||||||
|
Diluted
|
$
|
0.37
|
|
$
|
0.18
|
|
$
|
0.29
|
|
$
|
0.44
|
|
|||
|
Shares used in the calculation of earnings per share:
|
|
|
|
|
|
|
|
|
|||||||
|
Basic
|
292,757
|
|
292,276
|
|
291,824
|
|
294,475
|
|
|||||||
|
Diluted
|
299,793
|
|
300,221
|
|
299,290
|
|
301,076
|
|
|||||||
|
|
|
|
|
|
|
|
|
|
|||||||
|
Dividends paid per share
|
$
|
0.22
|
|
$
|
0.22
|
|
$
|
0.22
|
|
$
|
0.22
|
|
|||
71
MAXIM INTEGRATED PRODUCTS, INC.
NOTES TO CONSOLIDATED FINANCIAL STATEMENTS
|
|
Quarter Ended
|
||||||||||||||
|
Fiscal Year 2011
|
6/25/2011
|
3/26/2011
|
12/25/2010
|
9/25/2010
|
|||||||||||
|
|
(In thousands, except percentages and per share data)
|
||||||||||||||
|
Net revenues
|
$
|
626,491
|
|
$
|
606,775
|
|
$
|
612,936
|
|
$
|
626,139
|
|
|||
|
Cost of goods sold
|
235,666
|
|
234,125
|
|
232,661
|
|
239,925
|
|
|||||||
|
Gross margin
|
$
|
390,825
|
|
$
|
372,650
|
|
$
|
380,275
|
|
$
|
386,214
|
|
|||
|
Gross margin %
|
62.4
|
%
|
61.4
|
%
|
62.0
|
%
|
61.7
|
%
|
|||||||
|
Operating income
|
$
|
177,922
|
|
$
|
163,995
|
|
$
|
151,999
|
|
$
|
179,123
|
|
|||
|
% of net revenues
|
28.4
|
%
|
27.0
|
%
|
24.8
|
%
|
28.6
|
%
|
|||||||
|
Net income
|
$
|
125,593
|
|
$
|
136,276
|
|
$
|
109,590
|
|
$
|
117,550
|
|
|||
|
Earnings per share:
|
|
|
|
|
|
|
|
|
|||||||
|
Basic
|
$
|
0.42
|
|
$
|
0.46
|
|
$
|
0.37
|
|
$
|
0.39
|
|
|||
|
Diluted
|
$
|
0.41
|
|
$
|
0.45
|
|
$
|
0.36
|
|
$
|
0.39
|
|
|||
|
Shares used in the calculation of earnings (loss) per share:
|
|
|
|
|
|
|
|
|
|||||||
|
Basic
|
295,751
|
|
296,511
|
|
296,550
|
|
298,216
|
|
|||||||
|
Diluted
|
303,944
|
|
304,515
|
|
303,260
|
|
301,688
|
|
|||||||
|
Dividends paid per share
|
$
|
0.21
|
|
$
|
0.21
|
|
$
|
0.21
|
|
$
|
0.21
|
|
|||
72
REPORT OF INDEPENDENT REGISTERED PUBLIC ACCOUNTING FIRM
To the Board of Directors and Stockholders of
Maxim Integrated Products, Inc.
San Jose, California
We have audited the accompanying consolidated balance sheets of Maxim Integrated Products, Inc. and subsidiaries (the "Company") as of June 30, 2012 and June 25, 2011, and the related consolidated statements of income, stockholders' equity, and cash flows for each of the three years in the period ended June 30, 2012. Our audits also included the financial statement schedule listed in the Index at Item 15. These financial statements and financial statement schedule are the responsibility of the Company's management. Our responsibility is to express an opinion on the financial statements and financial statement schedule based on our audits.
We conducted our audits in accordance with the standards of the Public Company Accounting Oversight Board (United States). Those standards require that we plan and perform the audit to obtain reasonable assurance about whether the financial statements are free of material misstatement. An audit includes examining, on a test basis, evidence supporting the amounts and disclosures in the financial statements. An audit also includes assessing the accounting principles used and significant estimates made by management, as well as evaluating the overall financial statement presentation. We believe that our audits provide a reasonable basis for our opinion.
In our opinion, such consolidated financial statements present fairly, in all material respects, the financial position of Maxim Integrated Products, Inc. and subsidiaries at June 30, 2012 and June 25, 2011, and the results of their operations and their cash flows for each of the three years in the period ended June 30, 2012, in conformity with accounting principles generally accepted in the United States of America. Also, in our opinion, such financial statement schedule, when considered in relation to the basic consolidated financial statements taken as a whole, presents fairly, in all material respects, the information set forth therein.
We have also audited, in accordance with the standards of the Public Company Accounting Oversight Board (United States), the Company's internal control over financial reporting as of June 30, 2012, based on the criteria established in
Internal Control-Integrated Framework
issued by the Committee of Sponsoring Organizations of the Treadway Commission and our report dated
August 17, 2012
expressed an unqualified opinion on the Company's internal control over financial reporting.
DELOITTE & TOUCHE LLP
San Jose, California
August 17, 2012
73
MAXIM INTEGRATED PRODUCTS, INC.
SCHEDULE II - VALUATION AND QUALIFYING ACCOUNTS
|
|
Balance at
Beginning of
Period
|
Additions (Deductions)
Charged (Credited)
to Costs and Expenses
|
Deductions (1)
|
Balance at
End of
Period
|
|||||||||||
|
|
(In thousands)
|
||||||||||||||
|
Doubtful accounts
|
|
|
|
|
|||||||||||
|
Year ended June 30, 2012
|
$
|
1,705
|
|
$
|
(504
|
)
|
$
|
46
|
|
$
|
1,155
|
|
|||
|
Year ended June 25, 2011
|
$
|
2,446
|
|
$
|
(362
|
)
|
$
|
379
|
|
$
|
1,705
|
|
|||
|
Year ended June 26, 2010
|
$
|
2,831
|
|
$
|
457
|
|
$
|
842
|
|
$
|
2,446
|
|
|||
|
|
Balance at
Beginning of
Period
|
Additions (Deductions)
Charged (Credited)
to Costs and Expenses
|
Deductions
|
Balance at
End of
Period
|
|||||||||||
|
(In thousands)
|
|||||||||||||||
|
Returns and Allowances
|
|
|
|
|
|
|
|
|
|||||||
|
Year ended June 30, 2012
|
$
|
15,992
|
|
$
|
60,989
|
|
$
|
65,607
|
|
$
|
11,374
|
|
|||
|
Year ended June 25, 2011
|
$
|
14,992
|
|
$
|
74,456
|
|
$
|
73,456
|
|
$
|
15,992
|
|
|||
|
Year ended June 26, 2010
|
$
|
10,332
|
|
$
|
67,505
|
|
$
|
62,845
|
|
$
|
14,992
|
|
|||
(1) Uncollectible accounts written off.
74
SIGNATURE
Pursuant to the requirements of Section 13 or 15(d) of the Securities Exchange Act of 1934, the Registrant has duly caused this Report to be signed on its behalf by the undersigned, thereunto duly authorized.
|
August 17, 2012
|
MAXIM INTEGRATED PRODUCTS, INC.
|
|
|
By:/s/ Bruce E. Kiddoo
|
||
|
Bruce E. Kiddoo
|
||
|
|
Senior Vice President, Chief Financial Officer
|
|
|
August 17, 2012
|
MAXIM INTEGRATED PRODUCTS, INC.
|
|
|
By:/s/ David A. Caron
|
||
|
David A. Caron
|
||
|
|
Vice President and Principal Accounting Officer
|
|
75
P
OWER OF
A
TTORNEY
KNOW ALL PERSONS BY THESE PRESENTS, that each person whose signature appears below constitutes and appoints each of Tunc Doluca and Bruce Kiddoo as his true and lawful attorneys-in-fact and agents, with full power of substitution and re-substitution, for him and in his name, place and stead, in any and all capacities, to sign any and all amendments (including post-effective amendments) to this Annual Report on Form 10-K, and to file the same, with all exhibits thereto, and other documents in connection therewith, with the Securities and Exchange Commission, granting unto said attorneys-in-fact and agents, and each of them, full power and authority to do and perform each and every act and thing requisite and necessary to be done in connection therewith and about the premises, as fully to all intents and purposes as he might or could do in person, hereby ratifying and confirming all that said attorneys-in-fact and agents, or any of them, or their or his substitute or substitutes, may lawfully do or cause to be done by virtue hereof.
Pursuant to the requirements of the Securities Exchange Act of 1934, the report has been signed below by the following persons on behalf of the registrant and in the capacities and on the dates indicated.
|
Signature
|
Title
|
Date
|
|
|
|
|
|
|
|
/s/ Tunc Doluca
|
President and Chief Executive Officer
|
August 17, 2012
|
|
|
Tunc Doluca
|
(Principal Executive Officer)
|
|
|
|
|
|
|
|
|
/s/ James R. Bergman
|
Director
|
August 17, 2012
|
|
|
James R. Bergman
|
|
|
|
|
|
|
|
|
|
/s/ Joseph R. Bronson
|
Director
|
August 17, 2012
|
|
|
Joseph R. Bronson
|
|
|
|
|
|
|
|
|
|
/s/ Robert E. Grady
|
Director
|
August 17, 2012
|
|
|
Robert E. Grady
|
|
|
|
|
|
|
|
|
|
/s/ B. Kipling Hagopian
|
Director and Chairman of the Board
|
August 17, 2012
|
|
|
B. Kipling Hagopian
|
|
||
|
|
|
|
|
|
/s/ William D. Watkins
|
Director
|
August 17, 2012
|
|
|
William D. Watkins
|
|
|
|
|
|
|
|
|
|
/s/ A.R. Wazzan
|
Director
|
August 17, 2012
|
|
|
A.R. Wazzan
|
|
|
|
76
C
ORPORATE
D
ATA AND
S
TOCKHOLDER
I
NFORMATION
Independent Registered Public Accounting Firm
Deloitte & Touche LLP
San Jose, California
Registrar/Transfer Agent
Computershare
Canton, Massachusetts
Corporate Headquarters
160 Rio Robles
San Jose, California 95134
(408) 601-1000
Stock Listing
At
August 7, 2012
, there were
872
stockholders of record of the Company's common stock as reported by Computershare. Maxim common stock is traded on the Nasdaq Global Select Market under the symbol "MXIM".
77
|
Exhibit
|
|
|
|
Number
|
Description
|
|
|
|
|
|
|
3.1 (1)
|
Restated Certificate of Incorporation of the Company
|
|
|
|
|
|
|
3.2 (2)
|
Amendments to Restated Certificate of Incorporation of the Company
|
|
|
|
|
|
|
3.3 (3)
|
Amended and Restated Bylaws of the Company, as amended
|
|
|
|
|
|
|
4.1
|
Reference is made to Exhibits 3.1, 3.2, and 3.3
|
|
|
|
|
|
|
10.1 (4)
|
The Company's Forms of Indemnity Agreement
(A)
|
|
|
|
|
|
|
10.2 (5)
|
The Company's 1987 Supplemental Stock Option Plan, as amended
(A)
|
|
|
|
|
|
|
10.3 (6)
|
The Company's 1996 Stock Incentive Plan, as amended and restated
(A)
|
|
|
|
|
|
|
10.4 (7)
|
Assumption Agreement, dated April 11, 2001, relating to Dallas Semiconductor Corporation Executives Retiree Medical Plan
(A)
|
|
|
|
|
|
|
10.5 (7)
|
Dallas Semiconductor Corporation Executives Retiree Medical Plan
(A)
|
|
|
|
|
|
|
10.6 (7)
|
Form of Indemnification Agreement between Dallas Semiconductor Corporation and its directors and officers
(A)
|
|
|
|
|
|
|
10.7 (8)
|
Form of Non-Statutory Option Agreement, as amended and restated, under the Company's 1996 Stock Incentive Plan, for U.S. Option Optionees
|
|
|
|
|
|
|
10.8 (8)
|
Form of Restricted Stock Unit Agreement under the Company's 1996 Stock Incentive Plan, for U.S. Holders
|
|
|
|
|
|
|
10.9 (9)
|
Employment Agreement between the Company and Tunc Doluca dated as of September 30, 1993
(A)
|
|
|
|
|
|
|
10.10 (9)
|
Employment Agreement between the Company and Vijay Ullal dated as of April 1, 1995
(A)
|
|
|
10.11 (9)
|
Employment Agreement between the Company and Pirooz Parvarandeh dated as of November 1, 1994
(A)
|
|
|
|
|
|
|
10.12 (10)
|
Employment Letter Agreement between the Company and Bruce Kiddoo dated as of August 6, 2007
(A)
|
|
|
|
|
|
|
10.13 (3)
|
Form of Non-Statutory Option Agreement, as amended and restated, under the Company's 1996 Stock Incentive Plan, for Non-U.S. Option Optionees
|
|
|
10.14 (3)
|
Form of Restricted Stock Unit Agreement under the Company's 1996 Stock Incentive Plan, for Non-U.S. Holders
|
|
|
10.15 (11)
|
The Company's 2008 Employee Stock Purchase Plan, as amended
(A)
|
|
|
10.16 (12)
|
Release of Claims and Vesting Agreement for Officer Goodwill Payment
(A)
|
|
|
10.17 (13)
|
Amendment to Dallas Semiconductor Corporation Executives Retiree Medical Plan
(A)
|
|
78
|
10.18 (14)
|
Agreement and Plan of Merger dated April 12, 2010, relating to the acquisition of Teridian Semiconductor Corp. by the Company
|
|
|
|
|
|
|
10.19 (15)
|
Underwriting Agreement, dated June 10, 2010, between the Company and J.P. Morgan Securities Inc. and Goldman, Sachs & Co.
|
|
|
|
|
|
|
10.20 (16)
|
Supplemental Indenture, dated as of June 17, 2010, between the Company and Wells Fargo Bank, National Association, as trustee
|
|
|
|
|
|
|
10.21 (17)
|
Change In Control Employee Severance Plan for U.S. Based Employees
|
|
|
|
|
|
|
10.22 (17)
|
Change In Control Employee Severance Plan for Non-U.S. Based Employees
|
|
|
|
|
|
|
10.23 (17)
|
Equity Award Policy Acceleration Of Vesting In The Event of A Change In Control For Employees Based Outside The U.S.
|
|
|
|
|
|
|
10.24 (18)
|
Credit Agreement, dated October 13, 2011, by and among the Company, as borrower, JPMorgan Chase Bank, N.A. as Administrative Agent, Bank of America, N.A., Wells Fargo Bank, National Association and Morgan Stanley MUFG Loan Partners, LLC, as Co-Documentation Agents, and the lenders party thereto
|
|
|
12.1
|
Statement of Ratio of Income to Fixed Charges PDF provided as a courtesy
|
|
|
14 (17)
|
Code of Business Conduct and Ethics
|
|
|
21.1
|
Subsidiaries of the Company PDF provided as a courtesy
|
|
|
23.1
|
Consent of Deloitte & Touche LLP, Independent Registered Public Accounting Firm PDF provided as a courtesy
|
|
|
|
||
|
24.1
|
Power of Attorney (see page 75)
|
|
|
31.1
|
Certification of Chief Executive Officer Pursuant to Section 302 of the Sarbanes-Oxley Act of 2002 PDF provided as a courtesy
|
|
|
31.2
|
Certification of Chief Financial Officer Pursuant to Section 302 of the Sarbanes-Oxley Act of 2002 PDF provided as a courtesy
|
|
|
32.1
|
Certification of Chief Executive Officer Pursuant to 18 U.S.C. Section 1350, as Adopted Pursuant to Section 906 of the Sarbanes-Oxley Act of 2002 PDF provided as a courtesy
|
|
|
32.2
|
Certification of Chief Financial Officer Pursuant to 18 U.S.C. Section 1350, as Adopted Pursuant to Section 906 of the Sarbanes-Oxley Act of 2002 PDF provided as a courtesy
|
|
_________________
(A) Management contract or compensatory plan or arrangement.
_________________
79
|
(1)
|
Incorporated by reference to the Company's Annual Report on Form 10-K for the year ended June 30, 1995.
|
|
(2)
|
Incorporated by reference to the Company's Annual Report on Form 10-K for the year ended June 30, 1997, to the Company's Annual Report on Form 10-K for the year ended June 30, 1998, to the Company's Quarterly Report on Form 10-Q for the quarter ended December 25, 1999, and to the Company's Quarterly Report on Form 10-Q for the quarter ended December 30, 2000.
|
|
(3)
|
Incorporated by reference to the Company's Quarterly Report on Form 10-Q for the quarter ended September 27, 2008.
|
|
(4)
|
Incorporated by reference to the Company's Registration Statement on Form S-1 No. 33-19561 and to the Company's Annual Report on Form 10-K for the year ended June 25, 2005.
|
|
(5)
|
Incorporated by reference to the Company's Annual Report on Form 10-K for the year ended June 27, 1998.
|
|
(6)
|
Incorporated by reference to the Company's Current Report on Form 8-K filed on November 24, 2009.
|
|
(7)
|
Incorporated by reference to the Company's Annual Report on Form 10-K for the year ended June 30, 2001.
|
|
(8)
|
Incorporated by reference to the Company's Quarterly Report on Form 10-Q for the quarter ended September 26, 2009.
|
|
(9)
|
Incorporated by reference to the Company's Annual Report on Form 10-K for the year ended June 24, 2006.
|
|
(10)
|
Incorporated by reference to the Company's Quarterly Report on Form 10-Q for the quarter ended September 29, 2007.
|
|
(11)
|
Incorporated by reference as Appendix A to the Company's Definitive Proxy Statement on Schedule 14A filed on October 26, 2009.
|
|
(12)
|
Incorporated by reference to the Company's Quarterly Report on Form 10-Q for the quarter ended March 28, 2009.
|
|
(13)
|
Incorporated by reference to the Company's Annual Report on Form 10-K for the year ended June 27, 2009.
|
|
(14)
|
Incorporated by reference to the Company's Current Report on Form 8-K filed on April 14, 2010.
|
|
(15)
|
Incorporated by reference to the Company's Current Report on Form 8-K filed on June 16, 2010.
|
|
(16)
|
Incorporated by reference to the Company's Current Report on Form 8-K filed on June 18, 2010.
|
|
(17)
|
Incorporated by reference to the Company's Annual Report on Form 10-K for the year ended June 26, 2010.
|
|
(18)
|
Incorporated by reference to the Company's Quarterly Report on Form 10-Q for the quarter ended September 24, 2011.
|
80
TABLE OF CONTENTS
Part IItem 1. BusinessItem 1A. Risk FactorsItem 1B. Unresolved Staff CommentsItem 2. PropertiesItem 3. Legal ProceedingsItem 4. Mine Safety DisclosuresPart IIItem 5. Market For Registrant's Common Equity, Related Stockholder Matters and Issuer Purchases Of Equity SecuritiesItem 6. Selected Financial DataItem 7. Management's Discussion and Analysis Of Financial Condition and Results Of OperationsItem 7A. Quantitative and Qualitative Disclosures About Market RiskItem 8. Financial Statements and Supplementary DataItem 9. Changes in and Disagreements with Accountants on Accounting and Financial DisclosureItem 9A. Controls and ProceduresItem 9B. Other InformationPart IIIItem 10. Directors, Executive Officers and Corporate GovernanceItem 11. Executive CompensationItem 12. Security Ownership Of Certain Beneficial Owners and Management and Related Stockholder MattersItem 13. Certain Relationships and Related Transactions, and Director IndependenceItem 14. Principal Accountant Fees and ServicesPart IVItem 15. Exhibits and Financial Statement SchedulesNote 1: Nature Of OperationsNote 2: Summary Of Significant Accounting PoliciesNote 3: Balance Sheet ComponentsNote 4: Fair Value MeasurementsNote 5: Financial InstrumentsNote 6: Stock-based CompensationNote 7: Earnings Per ShareNote 8: Goodwill and Intangible AssetsNote 9: AcquisitionsNote 10: Impairment Of Long-lived AssetsNote 11: Discontinuted OperationsNote 12: Segment InformationNote 13: Commitments and ContingenciesNote 14: Comprehensive IncomeNote 15: Common Stock RepurchasesNote 16: Income TaxesNote 17: BenefitsNote 18: Quarterly Financial Data (unaudited)