NAVISTAR INTERNATIONAL CORP
10-Ks and 10-Qs
|
|
|
|
|
|
|
|
|
|
|
|
|
|
|
|
|
|
|
|
|
|
|
|
|
|
|
|
|
|
|
|
UNITED STATES
SECURITIES AND EXCHANGE COMMISSION
Washington, D.C. 20549
___________________________________________________
Form
10-K
___________________________________________________
(Mark One)
|
|
ANNUAL REPORT PURSUANT TO SECTION 13 OR 15(d) OF THE SECURITIES EXCHANGE ACT OF 1934
|
For the fiscal year ended
October 31, 2019
OR
|
|
TRANSITION REPORT PURSUANT TO SECTION 13 or 15(d) OF THE SECURITIES EXCHANGE ACT OF 1934
|
For the transition period from _____ to _____.
Commission file number
1-9618
___________________________________________________

(Exact name of registrant as specified in its charter)
_______________________________________________
|
|
|
|
|
(State or other jurisdiction of incorporation or organization)
|
(I.R.S. Employer Identification No.)
|
|
|
|
|
|
|
|
|
|
|
(Address of principal executive offices)
|
(Zip Code)
|
|
Registrant’s telephone number, including area code: (
331
)
332-5000
Securities registered pursuant to Section 12(b) of the Act:
Securities registered pursuant to Section 12(g) of the Act: None
|
Title of each class
|
Trading Symbol(s)
|
Name of each exchange on which registered
|
|
|
|
|
|
|
|
|
Indicate by check mark if the registrant is a well-known seasoned issuer, as defined in Rule 405 of the Securities Act.
Yes
☑
No
☐
Indicate by check mark if the registrant is not required to file reports pursuant to Section 13 or Section 15(d) of the Act. Yes
☐
No
☑
Indicate by check mark whether the registrant (1) has filed all reports required to be filed by Section 13 or 15(d) of the Securities Exchange Act of 1934 during the preceding 12 months (or for such shorter period that the registrant was required to file such reports) and (2) has been subject to such filing requirements for the past 90 days.
Yes
☑
No
☐
Indicate by check mark whether the registrant has submitted electronically every Interactive Data File required to be submitted pursuant to Rule 405 of Regulation S-T (§ 232.405 of this chapter) during the preceding 12 months (or for such shorter period that the registrant was required to submit such files).
Yes
☑
No
☐
Indicate by check mark whether the registrant is a large accelerated filer, an accelerated filer, a non-accelerated filer, a smaller reporting company or an emerging growth company. See the definitions of "large accelerated filer," "accelerated filer," "smaller reporting company" and "emerging growth company" in Rule 12b-2 of the Exchange Act.
|
|
þ
|
|
Accelerated filer
|
☐
|
||
|
Non-accelerated filer
|
☐
|
|
Smaller reporting company
|
|
||
|
|
Emerging growth company
|
|
||||
If an emerging growth company, indicate by check mark if the registrant has elected not to use the extended transition period for complying with any new or revised financial accounting standards provided pursuant to Section 13(a) of the Exchange Act. ☐
Indicate by check mark whether the registrant is a shell company (as defined in Rule 12b-2 of the Act). Yes
☐
No
þ
As of April 30,
2019
, the aggregate market value of common stock held by non-affiliates of the registrant was approximately
$
1,637
million
.
As of November 30,
2019
, the number of shares outstanding of the registrant’s common stock was
99,235,946
, net of treasury shares.
Documents incorporated by reference: Portions of the Company's proxy statement for the
2020
annual meeting of stockholders scheduled to be held on
February 25, 2020
are incorporated by reference in Part III.
NAVISTAR INTERNATIONAL CORPORATION FORM 10-K
TABLE OF CONTENTS
|
|
|
Page
|
|
|
PART I
|
|||
|
Item 1.
|
|||
|
Item 1A.
|
|||
|
Item 1B.
|
|||
|
Item 2.
|
|||
|
Item 3.
|
|||
|
Item 4.
|
|||
|
PART II
|
|||
|
Item 5.
|
|||
|
Item 6.
|
|||
|
Item 7.
|
|||
|
Item 7A.
|
|||
|
Item 8.
|
|||
|
Item 9.
|
|||
|
Item 9A.
|
|||
|
Item 9B.
|
|||
|
PART III
|
|||
|
Item 10.
|
|||
|
Item 11.
|
|||
|
Item 12.
|
|||
|
Item 13.
|
|||
|
Item 14.
|
|||
|
PART IV
|
|||
|
Item 15.
|
|||
|
Item 16.
|
|||
|
EXHIBIT INDEX:
|
|||
2
Disclosure Regarding Forward-Looking Statements
Information provided and statements contained in this report that are not purely historical are forward-looking statements within the meaning of the federal securities laws. Such forward-looking statements only speak as of the date of this report and Navistar International Corporation assumes no obligation to update the information included in this report.
Such forward-looking statements include, but are not limited to, statements concerning:
|
•
|
estimates we have made in preparing our financial statements;
|
|
•
|
the implementation of, and expected benefits from, our strategic alliance with TRATON SE and certain of its subsidiaries and affiliates ("TRATON Group");
|
|
•
|
our development and launch of new products and technologies;
|
|
•
|
anticipated sales, volume, demand, markets for our products, and financial performance;
|
|
•
|
anticipated performance and benefits of our products and technologies;
|
|
•
|
our business strategies relating to, and our ability to meet, federal and state regulatory heavy-duty diesel emissions standards applicable to certain of our engines, including the timing and costs of compliance and consequences of noncompliance with such standards, as well as our ability to meet other federal, state and foreign regulatory requirements;
|
|
•
|
our business strategies and short-term and long-term goals, and activities to accomplish such strategies and goals;
|
|
•
|
our ability to implement our strategy as well as the results we expect to achieve from the implementation of our strategy;
|
|
•
|
our expectations related to new product launches;
|
|
•
|
anticipated results from acquisitions, dispositions, strategic alliances, and joint ventures we complete;
|
|
•
|
our expectations and estimates relating to restructuring activities, including restructuring charges and timing of cash payments related thereto, and operational flexibility, savings, and efficiencies from such restructurings;
|
|
•
|
our expectations relating to debt refinancing activities;
|
|
•
|
our expectations relating to the potential effects of anticipated divestitures and closures of businesses;
|
|
•
|
our expectations relating to our cost-reduction actions and actions to reduce discretionary spending;
|
|
•
|
our expectations relating to our ability to service our long-term debt;
|
|
•
|
our expectations relating to our wholesale and retail finance receivables and revenues;
|
|
•
|
liabilities resulting from environmental, health and safety laws and regulations;
|
|
•
|
our anticipated capital expenditures;
|
|
•
|
our expectations relating to payments of taxes;
|
|
•
|
our expectations relating to warranty costs;
|
|
•
|
our expectations relating to interest expense;
|
|
•
|
our expectations relating to impairment of goodwill, other intangible assets and property, plant and equipment;
|
|
•
|
costs relating to litigation and similar matters;
|
|
•
|
estimates relating to pension plan contributions and unfunded pension and postretirement benefits;
|
|
•
|
our expectations relating to commodity price risk, including the impact of tariff increases or potential new tariffs; and
|
|
•
|
anticipated trends, expectations, and outlook relating to matters affecting our financial condition or results of operations.
|
These statements often include words such as "believe," "expect," "anticipate," "intend," "plan," "estimate," or similar expressions. These statements are not guarantees of performance or results and they involve risks, uncertainties, and assumptions. Although we believe that these forward-looking statements are based on reasonable assumptions, there are many factors that could affect our results of operations and could cause actual results to differ materially from those in the forward-looking statements. Factors that could cause or contribute to differences in our future financial results include those discussed in Item 1A, Risk Factors, set forth in Part I, as well as those factors discussed elsewhere in this report. All future written and oral forward-looking statements by us or persons acting on our behalf are expressly qualified in their entirety by the cautionary statements contained herein or referred to above. Except for our ongoing obligations to disclose material information as required by the federal securities laws, we do not have any obligations or intention to release publicly any revisions to any forward-looking statements to reflect events or circumstances in the future or to reflect the occurrence of unanticipated events.
3
Available Information
We are subject to the reporting and information requirements of the Securities Exchange Act of 1934, as amended (the "Exchange Act") and as a result, are obligated to file annual, quarterly, and current reports, proxy statements, and other information with the
United States ("U.S.") Securities and Exchange Commission ("SEC")
. We make these filings available free of charge on our website (http://www.navistar.com) as soon as reasonably practicable after we electronically file them with, or furnish them to, the SEC. Information on our website does not constitute part of this Annual
Report on Form 10-K
. In addition, the SEC maintains a website (http://www.sec.gov) that contains our annual, quarterly, and current reports, proxy and information statements, and other information we electronically file with, or furnish to, the SEC.
4
|
Item 1.
|
Business
|
Navistar International Corporation ("NIC"), incorporated under the laws of the State of Delaware in 1993, is a holding company whose principal operating entities are Navistar, Inc. ("NI") and Navistar Financial Corporation ("NFC"). References herein to the "Company," "we," "our," or "us" refer to NIC and its consolidated subsidiaries, including certain variable interest entities ("VIEs") of which we are the primary beneficiary. We report our annual results for our fiscal year, which ends
October 31
. As such, all references to
2019
,
2018
, and
2017
contained within this Annual Report on Form 10-K relate to the applicable fiscal year unless otherwise indicated.
Overview
We are an international manufacturer of International
®
brand commercial trucks, proprietary diesel engines, and IC Bus
®
("IC") brand school and commercial buses, as well as a provider of service parts for trucks and diesel engines. We also provide retail, wholesale, and lease financing services for our trucks and parts.
Our Products and Services
Our principal products and services include:
|
•
|
Trucks—
We manufacture and distribute Class 4 through 8 trucks and buses in the common carrier, private carrier, government, leasing, construction, energy/petroleum, and student and commercial transportation markets under the International
®
and IC brands. We design and manufacture proprietary diesel engines for our International branded trucks and IC branded buses.
|
|
•
|
Parts—
We support our International
®
brand commercial trucks, IC brand buses, and our proprietary engines, as well as our other product lines, by distributing proprietary products together with a wide selection of other standard truck, trailer, and engine service parts.
|
|
•
|
Financial Services—
We provide and manage retail, wholesale, and lease financing of products sold by the Truck and Parts segments, as well as their dealers, within the U.S., Canada and Mexico.
|
Our Strategy
Our Business
Our Core business is the truck and parts markets for the U.S. and Canada, where we participate primarily in the Class 6 through 8 vehicle markets and this year expanded into the Class 4/5 market with our International
®
CV
™
product. With more than a million of our trucks on the road in the U.S. and Canada, one in five Class 6 through 8 vehicles is an International® truck. Nearly half of all school buses on the road today are our IC brand. We have one of the largest commercial vehicle parts distribution networks in the U.S. and a captive finance company. Further, this year we put into operation a partnership with Love’s Travel Stops expanding our service network in North America through our Dealers and Network Service Partners to over 1,000 locations, one of the largest networks in North America. Outside of our Core markets, International® is one of the leading truck brands in Mexico and much of Latin America. We are the largest independent diesel engine company in Brazil, with our wholly-owned subsidiary International Industria Automotiva da America do Sul Ltda. (“IIAA”), formerly MWM International Industria de Motores da America Do Sul Ltda. We also export trucks, buses, and engines to niche markets around the world.
We continue to take actions that we believe will improve our performance and evaluate additional opportunities to enhance value for our customers. The following is a summary of our 2019 accomplishments and our expectations going forward.
Our 2019 Accomplishments
We continue to demonstrate the growth of our business, focusing our efforts on becoming the #1 choice in our industry. In 2019, we made several notable advancements on our strategic vision.
|
I.
|
Customer-Centric:
Our focus on customer and market segmentation to better align our efforts with customer needs led to the following accomplishments in 2019:
|
|
•
|
Opened a new parts distribution center in Olive Branch, Mississippi near the FedEx World Hub in Memphis, Tennessee will provide next day parts delivery to 95% of our dealer locations
|
|
•
|
Enhanced our predictive parts stocking through digitalization
|
|
•
|
Expanded to the industry’s largest service network with over 1,000 locations through our partnership with Love’s Travel Stops
|
5
|
II.
|
Operational Excellence:
We made improvements to operations as follows:
|
|
•
|
Reduced our warranty expense as a percentage of manufacturing revenue from 1.7% in 2018 to 1.4% in 2019
|
|
•
|
Announced investments in our manufacturing footprint to expand our capabilities in Huntsville, Alabama for an integrated powertrain with TRATON Group and building a benchmark truck manufacturing facility in San Antonio, Texas
|
|
III.
|
Core Business:
We
now have the industry’s newest and most comprehensive vehicle line-up supported by our unique open architecture all-brands remote diagnostic system OnCommand Connection ("OCC"). In addition:
|
|
•
|
Our core market share improved from
17.5%
in 2018 to
18.8%
in 2019
|
|
•
|
We expanded the footprint of parts availability by adding 5 new Fleetrite retail outlets in the U.S. and Canada
|
|
V.
|
Business Transformation:
Our
strategic transformation has been and will continue to be a crucial element of how we play to win. The following are a few ways we have gained significant momentum during 2019:
|
|
•
|
Created a new aftersales function that will manage every facet of the business after the initial sale of the truck, including oversight of parts and service, warranty, and dealer development
|
|
•
|
Launched a new business unit, NEXT eMobility Solutions ("NEXT"), to deliver customized electrification solutions in the truck and school bus markets using lean, agile practices. NEXT establishes a comprehensive "four Cs" approach to developing eMobility solutions: Consulting, Constructing, Charging and Connecting
|
|
•
|
Additional actions to de-risk the balance sheet through the purchase of a Canadian pension annuity, paying off $411 million in subordinated convertible notes with cash on hand in April, expanding the revolving credit facilities of NFC, and ending the year with
$1.4 billion
in consolidated cash, cash equivalents and marketable securities
|
|
•
|
Selling off non-core business units including a 70% equity interest in our former defense business, ND Holdings, LLC (“Navistar Defense”), and our ownership interest in our former joint venture in China with Anhui Jianghuai Automobile Co., Ltd (“JAC”)
|
We believe these actions coupled with our strategic alliance with the TRATON Group and our winning culture anchored by our high performing cross-functional teams, continue to position us for success.
Our Expectations Going Forward
Moving forward, we will continue our intense focus on costs to fund our growth initiatives, grow our market share and margins, and deliver superior shareholder return. We are focused on our Navistar 4.0 playing to win strategy, which is based on three critical elements:
|
•
|
People:
Driving high performing cross-functional teams while recruiting and developing key leadership roles by:
|
|
◦
|
Expanding on our lean culture through visual management, agile approaches, and a focus on execution
|
|
◦
|
Developing our best resources and redeploying resources to focus on our growth initiatives, and
|
|
◦
|
Leveraging our strong values
|
|
•
|
Performance:
Creating a sustainable long-term performance advantage within our products and services by investing in those areas with the greatest impact on our margins and overall financial performance. These areas include the following:
|
|
◦
|
Enterprise platform strategy
: A shared platform strategy for all key vehicle systems
|
|
◦
|
Advanced modular architecture
: Optimizing parts used in our vehicles to be able to deliver a customized solution to customers with the least amount of engineering work. This creates the potential to significantly improve productivity in engineering and research & development and provide us more flexibility to invest in new products and technologies
|
|
◦
|
Integrated manufacturing
: Investments that will allow us to optimize our manufacturing network by having a strong supplier footprint, and provide mutually beneficial relationships with our suppliers
|
|
◦
|
Aftersales acceleration
: Builds on our commitment to organically grow the parts business by helping our dealers improve their parts sales through enhanced training, data analysis and market knowledge
|
|
◦
|
Integrated powertrains
: Joint effort between Navistar and TRATON Group to incorporate the requirements we need for the North American market into their next generation of products that, when combined with our investment in our Hunstville, Alabama facility for localizing the next generation big-bore diesel powertrain, will provide significant growth and margin opportunities
|
6
|
•
|
#1 Choice:
Identifying and focusing on key markets where we have a differentiated value, defining how we will operate in that market, and how to prove to our customers that we are their #1 choice by:
|
|
◦
|
Following a Listen - Understand - Deliver approach to provide our customers what they truly need to succeed
|
|
◦
|
Understanding our customers better than our competitors, ensuring that our products and services provide value to our customers, and by organizing to be aligned with our customers
|
|
◦
|
Ensuring our products and services provide leading uptime and low total cost of ownership
|
|
◦
|
Strengthening our brand and residual values to capture more of the 2
nd
and 3
rd
owner markets, and
|
|
◦
|
Strengthening our dealers and building stronger partnerships with them through our Vision 2025 strategy
|
We believe Navistar 4.0 is built upon the right vision and the right strategy. We are confident that success will result in “the best team”, an operating performance advantage, and a brand preference that will result in our leadership in key markets and continued improvement in our financial performance.
Our Operating Segments
We operate in four industry segments: Truck, Parts, Global Operations (collectively referred to as "Manufacturing operations"), and Financial Services, which consists of NFC and our foreign finance operations (collectively referred to as "Financial Services operations"). Corporate contains those items that do not fit into our four segments. Selected financial data for each segment can be found in Note 15,
Segment Reporting
, to the accompanying consolidated financial statements.
Truck Segment
Our Truck segment manufactures and distributes Class 4 through 8 trucks and buses along with production of proprietary engines, primarily in the North America markets that include the U.S., Canada, and Mexico. Our Truck segment also includes our truck export business under the International and IC brands. The proprietary engines produced in North America are primarily used in our trucks and buses. Our goal is to deliver the highest quality commercial trucks and buses. The Truck segment is our largest operating segment based on total external sales and revenues.
We compete primarily in our Core (collectively referred to as school buses, Class 6 and 7 medium trucks, Class 8 heavy trucks and Class 8 severe service trucks) markets. The Truck segment's manufacturing operations in the U.S. and Mexico consist principally of assembling components manufactured by our suppliers, as well as designing, engineering, and producing certain sheet metal components, including truck cabs, and proprietary engines.
The Truck segment's manufacturing operations also include the production of diesel engines, which are primarily used in our trucks. The operations at our engine manufacturing facility consist principally of the assembly of components manufactured by our suppliers, as well as machining operations relating to steel and grey-iron components. We market our commercial products directly to large fleets which offer a comprehensive range of services and other support functions to our end users. Our commercial trucks are distributed in virtually all key markets through our distribution and retail service network, which is comprised of
1,052
outlets in the U.S. and Canada, which includes
342
of Love’s Travel Stops locations,
89
outlets in Mexico, and our export truck operations, primarily in Latin America. In addition, our network of used truck centers and International certified used truck dealers in the U.S. and Canada provides trade-in support to our dealers and national accounts group, and markets all makes and models of reconditioned used trucks to owner-operators and fleet buyers.
The Truck business competes on many dimensions, including customer service, price, ease-of-doing-business, uptime, and parts availability. The markets in which the Truck segment competes are subject to considerable volatility and fluctuation in response to cycles in the overall business environment. These markets are particularly sensitive to the industrial sector, which generates a significant portion of the freight tonnage hauled. Government regulation has also impacted, and will continue to impact, trucking operations as well as the efficiency and specifications of trucking equipment.
The Class 4 through 8 truck and bus markets in North America are highly competitive. Major U.S.-controlled domestic competitors include PACCAR Inc. ("PACCAR"), which sells vehicles under the Kenworth and Peterbilt nameplates in North America, and Ford Motor Company ("Ford"). Competing foreign-controlled domestic manufacturers include Freightliner and Western Star (both subsidiaries of Daimler-Benz AG ("Mercedes Benz")), Volvo and Mack (both subsidiaries of Volvo Global Trucks), and Hino (a subsidiary of Toyota Motor Corporation ("Toyota")). In addition, smaller, foreign-controlled market participants such as Isuzu Motors America, Inc. ("Isuzu"), UD Trucks North America (a subsidiary of AB Volvo ("UD Trucks")), and Mitsubishi Motors North America, Inc. ("Mitsubishi") are competing in the U.S. and Canadian truck markets with primarily imported products. In Mexico, the major domestic competitors are Kenmex (a subsidiary of PACCAR) and Freightliner. In our primary truck export market of Latin America, we compete with many truck manufacturers, including PACCAR, Freightliner, and Mack.
7
Refer to Note 15,
Segment Reporting,
to the accompanying consolidated financial statements, for Truck sales to external customers.
Parts Segment
Our Parts segment provides customers with proprietary products needed to support the International commercial truck, IC Bus, proprietary engine lines, and export parts business, as well as our other product lines by providing customers with proprietary products together with a wide selection of other standard truck, trailer, and engine service parts. We distribute service parts through the dealer network that supports our trucks and engines. The Parts segment is our second largest operating segment based on total external sales and revenues and generates a significant portion of our net income.
Our extensive dealer channel provides us with an advantage in serving our customers by having our parts available when and where our customers require service. Goods are delivered to our customers either through one of our
twelve
parts distribution centers operated out of North America, or through direct shipment from our suppliers. We have a dedicated parts sales team within North America, as well as national account teams focused on large fleet customers. We also serve our global markets through our dedicated export business which supports customers globally in Latin America, the Middle East, northern Africa, South Africa, Europe, Australia, Asia and Russia. In conjunction with the Truck sales and technical service group, we provide an integrated support team that works to find solutions to support our customers.
To be competitive the Parts Segment must focus on customer service, price, ease-of-doing-business, and parts availability. We sell a substantial amount of all-make parts for light-, medium- and heavy-duty trucks ("All-Make parts"), which are common across OEM truck manufacturers. We sell remanufactured parts through our ReNEWed product line and private label products through our Fleetrite brand name. The dealers and fleets have multiple outlets to purchase All-Make parts including other OEMs (including but not limited to Freightliner, PACCAR, Mack and Volvo), independent distributors, and traditional retail outlets, including Fleetpride, TruckPro, and National Auto Parts Association ("Napa"). We sell a wide-range of proprietary parts and we are subject to varying degrees of competition for many of our proprietary parts from alternative parts-providers and independent remanufacturers.
Also included in the Parts segment is our Blue Diamond Parts, LLC ("BDP") joint venture with Ford, which manages the sourcing, merchandising and distribution of certain service parts for North America Ford diesel vehicles. Major competitors for our BDP joint venture include Alliant Power, Jasper Engine Transmissions, and Delphi Automotive. In October 2019, Ford notified the Company of its intention to dissolve the BDP joint venture effective October 2021.
Refer to Note 15,
Segment Reporting,
to the accompanying consolidated financial statements, for Parts sales to external customers.
Global Operations Segment
Our Global Operations segment includes businesses that derive revenue from outside our Truck and Parts segments and primarily consists of the operations of our wholly-owned subsidiary, International Indústria Automotiva da América do Sul Ltda. ("IIAA"). IIAA is a leader in the South American mid-range diesel engine market, manufacturing and distributing mid-range diesel engines and providing customers with additional engine offerings in the agriculture, marine, genset, and light truck markets. Additionally, we also sell our engines to global OEMs for various on-and-off-road applications. We offer contract manufacturing services under IIAA's MWM brand to OEMs for the assembly of their engines, particularly in South America. IIAA has a very significant dealer network and parts distribution center, responsible for internal and export sales of spare parts. As part of the Global Operations segment, IIAA has engine manufacturing operations in Brazil. The Global Operations segment is our third largest operating segment based on total external sales and revenues.
Our commercial products are marketed through our independent dealer network, which offers a comprehensive range of services and other support functions to our end users.
IIAA also has a commercial agreement with an Indian company, Mahindra Heavy Engines Ltd. ("Mahindra"), under which MWM engines (4.8L and 7.2L) are manufactured at a plant located in the Chakan Industrial Area in the city of Pune, India. The engines produced at that plant are exclusively sold by MWM outside of the Indian market, providing a cost competitive export platform in support of the Asian markets.
In Brazil, IIAA's engines compete with Cummins, Mercedes Benz, and Fiat Powertrain ("FPT") in the light and medium truck markets; Mercedes Benz, Cummins, Scania, MAN, Volvo, and FPT in the heavy truck market; Mercedes Benz in the bus market; New Holland (a subsidiary of CNH Industrial N.V.), Sisu Diesel (a subsidiary of AGCO Corporation), and Deere & Company in the agricultural market; and Scania and Cummins in the stationary market.
8
Financial Services Segment
Our Financial Services segment provides and manages wholesale, retail, and lease financing of products sold by the Truck and Parts segments and their dealers. We also finance wholesale and retail accounts receivable. Substantially all revenues earned by the Financial Services segment are derived from supporting the sales of our vehicles and products. The Financial Services segment continues to meet the primary goal of providing and managing financing to our customers in U.S., Canadian and Mexican markets by providing or arranging cost-effective funding sources, while working to mitigate credit losses and impaired vehicle asset values. NFC provides wholesale financing for 100% of new Truck inventory sold to our dealers and distributors in the U.S. through the customary free interest period offered by NI. At
October 31, 2019
and
2018
, NFC retained floor plan financing for approximately 72% and 74% of the dealers, respectively, after the expiration of any free interest period. The Financial Services segment also facilitates financing relationships in other countries to support our Manufacturing Operations.
The Financial Services segment manages the relationship with Navistar Capital (a program of BMO Harris Bank N.A. and Bank of Montreal (together, "BMO")). Navistar Capital is our third-party preferred source of retail and lease customer financing for equipment offered by us and our dealers in the U.S. In addition, Navistar Capital Canada (also a BMO program) provides financing to support the sale of our products in Canada.
Engineering and Product Development
Our engineering and product development programs are focused on the development of new products, enhancements of current products, quality improvements and continuous material cost reductions across our product lines, complying with future regulatory requirements, and investigating future technologies for our product lines. We have shifted our investment focus to developing driver-centric designs with world class uptime and fuel economy that incorporates industry leading connected technologies utilizing Navistar’s OCC open architecture telematics solution. In 2019, we completed the launch of the Horizon suite of vehicles for the Global markets and also launched the International CV Series in conjunction with General Motors Company ("GM") for the Class 4/5 market.
In 2020, Navistar’s product development programs will be developing advances in aerodynamics, powertrain and software systems that are increasing fuel efficiency in the International LT and RH Series on-highway vehicles. In addition, we will be introducing to our products further enhancements in our Advanced Driver Assistance Systems (“ADAS”) offerings, more fuel efficient features, and engines to comply with the 2021 greenhouse gas (“GHG”) requirements. Navistar will continue to invest in ADAS, connected technologies and electric vehicles, working with strategic suppliers and partners. We introduced our first electric medium duty vehicle at the recent North American Commercial Vehicle Show. We believe that the alliance with TRATON Group will further expand our capabilities in these areas.
We participate in very competitive markets with more stringent regulatory requirements and faster technology adoptions, and we continue to believe that our strong commitment to engineering and product development is required to drive long-term growth. Our engineering and product development costs were $
319 million
in
2019
, compared to $
297 million
in
2018
and $
251 million
in
2017
. We expect that GHG phase 2 regulations announced in 2016 will drive significant investments in product development by us and our competitors.
Backlog
We define order backlogs ("backlogs") as orders yet to be built as of the end of the period. Our backlogs do not represent guarantees of purchases by customers or dealers and are subject to cancellation.
The following table provides our worldwide backlog of unfilled truck orders as of
October 31, 2019
and
2018
:
|
Units
|
Value
|
|||||
|
As of October 31:
|
(in billions)
|
|||||
|
2019
|
41,800
|
|
$
|
2.5
|
|
|
|
2018
|
51,000
|
|
3.9
|
|
||
Production of our
October 31, 2019
backlog is expected to be substantially completed during
2020
. The backlog of unfilled orders is one of many indicators of market demand; factors such as changes in production rates, internal and supplier available capacity, new product introductions, and competitive pricing actions may affect point-in-time comparisons.
Employees
As our business requirements change, fluctuations may occur within our workforce from year to year. We carefully managed our attrition, approving the replacement of key positions that we believe are critical to sustaining the improved business performance in 2019. For more information, see Note 3,
Restructurings, Impairments and Divestitures
, to the accompanying consolidated financial statements.
9
The following tables summarize the number of employees worldwide as of the dates indicated and an additional subset of active union employees represented by the United Automobile, Aerospace and Agricultural Implement Workers of America ("UAW"), and other unions, for the periods as indicated:
|
|
As of October 31,
|
|||||||
|
2019
|
2018
|
2017
|
||||||
|
Employees worldwide:
|
|
|
|
|||||
|
Total active employees
|
12,300
|
|
13,100
|
|
11,400
|
|
||
|
Total inactive employees
|
1,000
|
|
900
|
|
900
|
|
||
|
Total employees worldwide
|
13,300
|
|
14,000
|
|
12,300
|
|
||
|
Total active union employees:
|
|
|
|
|||||
|
Total UAW
|
3,000
|
|
3,300
|
|
2,900
|
|
||
|
Total other unions
|
4,500
|
|
5,100
|
|
3,800
|
|
||
See Item 1A,
Risk Factors
, for further discussion related to the risk associated with labor and work stoppages.
Patents and Trademarks
We seek and obtain patents on our inventions and own a significant patent portfolio. Additionally, many of the components we purchase for our products are protected by patents that are owned or controlled by the component manufacturer. We license third-party patents for the manufacture of our products and also grant licenses of our patents. The monetary royalties paid or received under these licenses are not material.
Our primary trademarks are an important part of our worldwide sales and marketing efforts and provide clear identification of our products and services in the marketplace. To support these efforts, we maintain, or have pending, registrations of our primary trademarks in those countries in which we do business or expect to do business. We grant licenses under our trademarks for consumer-oriented goods, such as toy trucks and apparel, outside the product lines that we manufacture. The monetary royalties received under these licenses are not material.
Supply
We purchase raw materials, parts, and manufactured components from numerous third-party suppliers. To avoid duplicate tooling expenses and to maximize volume benefits, single-source suppliers fill a majority of our requirements for parts and manufactured components. Some parts and manufactured components are generic to the industry while others are of a proprietary design requiring unique tooling, which require additional effort to relocate. However, we believe our exposure to a disruption in production as a result of an interruption of raw materials and supplies is no greater than the industry as a whole.
Our costs for trucks and parts sold consist primarily of material costs which are influenced by commodities prices such as steel, precious metals, resins, and petroleum products. We continue to look for opportunities to mitigate the effects of market-based commodity cost increases through a combination of design changes, material substitution, alternate supplier resourcing, global sourcing efforts, and hedging activities. The objective of this strategy is to ensure cost stability and competitiveness in an often volatile global marketplace. Generally, the impact of commodity cost fluctuations in the global market will be reflected in our financial results on a delayed basis, depending on many factors including the terms of supplier contracts, special pricing arrangements, and any commodity hedging strategies employed.
Impact of Government Regulation
Truck and engine manufacturers continue to face significant governmental regulation of their products, especially in the areas of environmental and safety matters, including on-highway emissions standards which require reducing allowable particulate matter and oxides of nitrogen ("NOx"). Meeting these emissions standards resulted in a significant increase in the cost of our products.
In 2010, the initial phase-in of onboard diagnostic ("OBD") requirements commenced for the initial family of truck engines and those products were certified. The phase-in for the remaining engine families occurred in 2013. Canadian heavy-duty engine emissions regulations essentially mirror those of the U.S. Environmental Protection Agency (the "EPA"). In Mexico, we offer EPA 2004 and Euro IV engines that comply with current standards in that country. Mexico lowered NOx emission standards in 2019 and will be lowering NOx emission standards in 2021 to Euro V and VI levels, respectively. Navistar Heavy Duty Diesel ("HDD") engines meet the EURO V and VI with current controls technology.
10
Truck manufacturers are also subject to various noise standards imposed by federal, state, and local regulations. As the engine is one of a truck's primary sources of noise, we invest a great deal of effort to develop strategies to reduce engine noise. We are also subject to the National Traffic and Motor Vehicle Safety Act ("Safety Act") and Federal Motor Vehicle Safety Standards ("Safety Standards") promulgated by the National Highway Traffic Safety Administration ("NHTSA").
Government regulation related to climate change is under consideration at the U.S. federal and state levels. Because our products use fossil fuels, they may be impacted indirectly due to regulation, such as a cap and trade program, affecting the cost of fuels. The EPA and the NHTSA issued final rules for GHG emissions and fuel economy in 2011, which were fully implemented in model year 2017. We are complying with these rules through use of existing technologies and implementation of emerging technologies as they become available. The EPA and NHTSA adopted a final rule in October 2016 with a second phase of federal GHG emission and fuel economy regulations. This rule contains significantly more stringent emissions levels for engines and vehicles, which will require substantial investments of capital. The GHG emission standards in the rule will take effect in model year 2021 and be implemented in three stages culminating in model year 2027. We continue to assess the impact of the rule on us and our stakeholders as we develop our product planning for that period.
Canada adopted its version of fuel economy and GHG emission regulations in February 2013. These regulations are substantially aligned with U.S. fuel economy and GHG emission regulations. Canada has finalized heavy duty phase 2 GHG rulemaking, which is substantially similar to EPA regulations with more stringent requirements for heavy haul tractors.
In December 2014, California adopted GHG emission rules for heavy duty vehicles equivalent to EPA phase 1 rules and is in the process of adopting its phase 2 equivalent rules. In 2014 California also adopted an optional lower emission standard for NOx in California. California has stated its intention to lower NOx standards for California-certified engines and has requested that the EPA lower its standards. In June 2016, several regional air quality management districts in California and other states, as well as the environmental agencies for several states, petitioned the EPA to adopt lower NOx emission standards for on-road heavy duty trucks and engines. In addition to lower NOx, EPA and the California Air Resources Board ("CARB") may consider other actions, including extending emission warranty periods. On November 14, 2018 the EPA announced the “Cleaner Trucks Initiative” which will begin the regulatory process for a reduced NOx emissions regulation while also streamlining compliance and certification requirements. In addition to lower NOx, EPA and California may consider other actions, including extending warranty periods, mandating sales of zero emission trucks, and requiring certification of zero emission heavy duty vehicles. We will monitor and participate in this rulemaking. We expect that heavy duty vehicle and engine fuel economy and GHG emissions rules will be under consideration in other global jurisdictions in the future. These standards will require significant investments of capital, will significantly increase costs of development for engines and vehicles, and will require us to incur administrative costs arising from implementation of the standards.
The EPA also issued a final rule in October 2015 that lowered the National Ambient Air Quality Standard for ozone to 70 parts per billion. This rule could lead to future lower emission standards for substances that contribute to ozone, including NOx from vehicles, at the federal and state levels.
Our facilities may be subject to regulation related to climate change, and climate change itself may also have some impact on our operations. However, these impacts are currently uncertain and we cannot predict the nature and scope of those impacts.
Information About Our Executive Officers
The following selected information for each of our current executive officers (as defined by regulations of the SEC) was prepared as of November 30,
2019
.
|
Name
|
Age
|
Position with the Company
|
||
|
|
|
|
||
|
Troy A. Clarke
|
64
|
Chairman, President and Chief Executive Officer
|
||
|
Walter G. Borst
|
57
|
Executive Vice President and Chief Financial Officer
|
||
|
Persio V. Lisboa
|
54
|
Executive Vice President and Chief Operating Officer
|
||
|
William V. McMenamin
|
60
|
President, Financial Services and Treasurer
|
||
|
Samara A. Strycker
|
47
|
Senior Vice President and Corporate Controller
|
||
|
Curt A. Kramer
|
51
|
Senior Vice President and General Counsel
|
||
|
Richard E. Bond
|
66
|
Associate General Counsel and Corporate Secretary
|
||
11
Troy A. Clarke
has served as our President and Chief Executive Officer and as a member of our Board of Directors since April 2013 and has served as Chairman of our Board of Directors since February 2017. Mr. Clarke served as our President and Chief Operating Officer from August 2012 to April 2013. Prior to holding these positions, Mr. Clarke served at NI as President of the Truck and Engine Group from June 2012 to August 2012, as President of Asia-Pacific Operations of NI from 2011 to 2012, and as Senior Vice President of Strategic Initiatives of NI from 2010 to 2011. Prior to joining NI, Mr. Clarke held various positions at GM, including President of GM North America from 2006 to 2009 and President of GM Asia Pacific from 2003 to 2006.
Walter G. Borst
has served as our Executive Vice President and Chief Financial Officer since June 2013. Prior to joining NI, Mr. Borst served as Chairman, President and CEO of GM Asset Management and Vice President of GM since 2010. Prior to that, Mr. Borst served as Vice President and Treasurer of GM from 2009 to 2010 and as Treasurer of GM from 2003 to 2009.
Persio V. Lisboa
has served as Executive Vice President and Chief Operating Officer of NIC since March 2017. Prior to holding this position, Mr. Lisboa served as the President, Operations of NI from November 2014 to March 2017, as Senior Vice President, Chief Procurement Officer of NI from December 2012 to November 2014, as Vice President, Purchasing and Logistics and Chief Procurement Officer of NI from October 2011 to November 2012 and Vice President, Purchasing and Logistics of NI from August 2008 to October 2011. Prior to these positions, Mr. Lisboa held various management positions within the Company’s North American and South American operations.
William V. McMenamin
has served as our President, Financial Services and Treasurer since August 2015. He has also served as President of NFC since January 2013. Mr. McMenamin served as Vice President, Chief Financial Officer and Treasurer of NFC from October 2008 to January 2013. Prior to these positions, he served as Vice President of Strategy of NFC from May 2007 to October 2008, Vice President of Credit of NFC from April 2005 to May 2007, and Director of Corporate Finance of NI from 2001 to 2005. Prior to joining Navistar, Mr. McMenamin held various positions in finance and accounting with a human resources services company, a national bank and a national accounting firm.
Samara A. Strycker
has served as Senior Vice President and Corporate Controller of NIC since August 2014. Prior to joining NIC, Ms. Strycker served as Regional Controller, Americas, of General Electric Healthcare ("GE Healthcare") from July 2010 to July 2014 and prior to that position she served as Assistant Controller of GE Healthcare from September 2008 to July 2010. Prior to joining GE Healthcare, Ms. Strycker was employed at PricewaterhouseCoopers LLP from 1993 to 2008. Ms. Strycker is a Certified Public Accountant.
Curt A. Kramer
has served as our Senior Vice President and General Counsel since April 2017. Prior to holding this position, Mr. Kramer served as Associate General Counsel and Corporate Secretary of NIC and NI since December 2007. Prior to holding these positions, Mr. Kramer served as General Attorney of NI from April 2007 to December 2007, Senior Counsel of NI from 2004 to 2007, Senior Attorney of NI from 2003 to 2004, and Attorney of NI from 2002 to 2003. Prior to joining NI, Mr. Kramer was in private practice.
Richard E. Bond
has served as our Associate General Counsel and Corporate Secretary since June 2017. Mr. Bond joined NI in 2009 as Assistant General Attorney and became General Attorney and Assistant Corporate Secretary in June 2015. Prior to joining NI, he served Monaco Coach Corporation as Senior Vice President, Secretary and Chief Administrative Officer from 1999 to 2009, Vice President, Secretary and Chief Administrative Officer from 1998 to 1999 and as Vice President, General Counsel and Secretary from 1997 to 1998. Prior to 1997, Mr. Bond was the senior legal officer of another recreational vehicle manufacturer, after beginning his career in private practice.
12
Item 1A.
Risk Factors
Our financial condition, results of operations, and cash flows are subject to various risks, many of which are not exclusively within our control, which may cause actual performance to differ materially from historical or projected future performance. We have in place an Enterprise Risk Management ("ERM") process that involves systematic risk identification and mitigation covering the categories of Strategic, Financial, Operational, and Compliance risk. The goal of ERM is not to eliminate all risk, but rather to identify and assess risks; assign, mitigate and monitor risks; and report the status of our risks to the Management Risk Committee and the Board of Directors and its committees. The risks described below could materially and adversely affect our business, financial condition, results of operations, or cash flows.
We may not realize sufficient acceptance of our products in the marketplace in order to achieve our goal of revenue and market share growth.
Key elements of our operating strategy are to focus on our Core markets and grow revenue and market share. The extent to which, and the rate at which, we achieve market acceptance and penetration of our current and future products is a function of many variables including, but not limited to: price, safety, efficacy, reliability, conversion costs, competitive pressures, regulatory approvals, marketing and sales efforts, operating costs, residual values, and general economic conditions affecting purchasing patterns. Any failure to gain and retain market share could have an adverse effect on our business, liquidity, results of operations and financial condition.
We operate in the highly competitive North American truck and parts markets which are subject to considerable cyclicality and to remain competitive we must maintain profitability throughout the entire cycle.
The North American truck and parts markets in which we operate are highly competitive and cyclical. As a result, we and other manufacturers face competitive pricing and margin pressures that could adversely affect our ability to increase or maintain vehicle prices. Many of our competitors have greater financial resources, which may place us at a competitive disadvantage in responding to substantial industry changes, such as changes in governmental regulations that require major additional capital expenditures. In addition, certain of our competitors may have a lower overall cost structure.
In order to remain competitive, we must remain profitable throughout the entire cycle. Our ability to be profitable depends in part on the varying conditions in the truck, bus, mid-range diesel engine, and service parts markets, which are subject to cycles in the overall business environment and are particularly sensitive to the industrial sector, which generates a significant portion of the freight tonnage hauled. Truck and engine demand is also dependent on general economic conditions, interest rate levels and fuel costs, among other external factors.
Our business has significant liquidity requirements, and while recent operating results have improved our liquidity position, the Company’s overall credit profile and the cyclicality of the industry could have an adverse impact on our liquidity position.
We believe that in the absence of significant extraordinary cash demands, our: (i) level of cash, cash equivalents, and marketable securities, (ii) current and forecasted cash flow from our Manufacturing operations and Financial Services operations, (iii) availability under various funding facilities, (iv) current and forecasted availability from various funding alliances, and (v) access to capital in the capital markets will provide sufficient funds to meet operating requirements (including the MaxxForce Advanced EGR engine class action settlement), capital expenditures, investments, and financial obligations on both a short-term and long-term basis. Significant assumptions underlie our beliefs with respect to our liquidity position, including, among other things, assumptions relating to North American truck volumes, the continuing availability of trade credit from certain key suppliers, the ability to gain and retain market share and grow revenue and margins, the absence of material adverse developments in our competitive market position, and access to the capital markets and our capital requirements. As a result, we cannot assure you that we will continue to have sufficient liquidity to meet our operating needs. In the event that we do not have sufficient liquidity, we may be required to seek additional capital, sell assets, reduce or cut back our operating activities or otherwise alter our business strategy.
Our substantial indebtedness could adversely affect our financial condition, cash flow, and operating flexibility.
Our significant amount of outstanding indebtedness and the covenants contained in our debt agreements could have important consequences for our operations. The terms of certain of our agreements limit our ability to obtain additional debt financing to fund future working capital, acquisitions, capital expenditures, engineering and product development costs, and other general corporate requirements; however, due to the recent refinancing transactions and amendments, we have additional incremental debt financing capacity as compared to the restrictions contained in our previous debt agreements. Other consequences for our operations could include:
13
|
•
|
increasing our vulnerability to general adverse economic and industry conditions;
|
|
•
|
limiting our ability to use operating cash flow in other areas of our business because we must dedicate a portion of these funds to make significant interest payments on our indebtedness;
|
|
•
|
limiting our flexibility in planning for, or reacting to, changes in our business and the industry in which we operate;
|
|
•
|
limiting our ability to take advantage of business opportunities as a result of various restrictive covenants in our debt agreements; and
|
|
•
|
placing us at a competitive disadvantage compared to our competitors that have less debt, lower interest rates and/or less restrictive debt covenants.
|
Our ability to make required payments of principal and interest on our debt will depend on our future performance and the other cash requirements of our business. Our performance, to a certain extent, is subject to general economic, political, financial, competitive, and other factors that are beyond our control. We cannot provide any assurance that our business will generate sufficient cash flow from operations or that future borrowings will be available under certain of our debt agreements in an amount sufficient to enable us to service our indebtedness.
Our debt agreements contain certain restrictive covenants and customary events of default. These restrictive covenants limit our ability to take certain actions, such as, among other things: make restricted payments; incur additional debt and issue preferred or disqualified stock; create liens; create or permit to exist restrictions on our ability or the ability of our restricted subsidiaries to make certain payments or distributions; engage in sale-leaseback transactions; engage in mergers or consolidations or transfer all or substantially all of our assets; designate restricted and unrestricted subsidiaries; make certain dispositions and transfers of assets; limit the ability of our restricted subsidiaries to make distributions; enter into transactions with affiliates; and guarantee indebtedness. One or more of these restrictive covenants may limit our ability to execute our preferred business strategy, take advantage of business opportunities, or react to changing industry conditions. However, the refinancing transactions that closed in November 2017 (as discussed below) increase our flexibility in certain of the areas described above.
Upon an event of default, if not waived by our lenders, our lenders may declare all amounts outstanding as due and payable, which may cause cross-defaults under our other debt obligations. If our current lenders accelerate the maturity of our indebtedness, we may not have sufficient capital available at that time to pay the amounts due to our lenders on a timely basis, and there is no guarantee that we would be able to repay, refinance, or restructure the payments on such debt. Further, under our senior secured, term loan credit facility in an aggregate principal amount of
$1.6 billion
, which was refinanced in November 2017 (the "Term Loan Credit Agreement"), the $225 million Recovery Zone Facility Revenue Bonds (“Tax Exempt Bonds”) which obtained a junior lien in November 2017 on certain of the assets that underlie the Term Loan Credit Agreement and our amended and restated asset-based credit agreement in an aggregate principal amount of $125 million (the "Amended and Restated Asset-Based Credit Facility"), the lenders would have the right to foreclose on certain of our assets, which could have a material adverse effect on us.
Upon the occurrence of a "change of control" as specified in each of the principal debt agreements of our Manufacturing operations, we are required to offer to repurchase or repay such indebtedness. Under these agreements, a "change of control" is generally defined to include, among other things: (a) the acquisition by a person or group of at least 35 percent of our common stock, (b) a merger or consolidation in which holders of our common stock own less than a majority of the equity in the resulting entity, or (c) replacement of a majority of the members of our Board of Directors by persons who were not nominated by our current directors. Under our Amended and Restated Asset-Based Credit Facility and our Term Loan Credit Agreement, a change in control would result in an immediate event of default, which would allow our lenders to accelerate the debt owed to them. Under the indentures or loan agreements for our debt securities, we may be required to offer to purchase the outstanding notes under such indentures at a premium upon a change in control. In any such event, we may not have sufficient funds available to repay amounts outstanding under these agreements, which may also cause cross-defaults under our other debt obligations. Further, under our Amended and Restated Asset-Based Credit Facility and our Term Loan Credit Agreement, the lenders could have the right to foreclose on certain of our assets, which could have a material adverse effect on our financial position and results of operations.
14
Our indebtedness under our Term Loan Credit Agreement, Amended and Restated Asset-Based Credit Facility, NFC bank credit facility, Term Asset Backed Securitization, VFN and TRAC credit facilities bears interest at variable interest rates that use the London Inter-Bank Offered Rate ("LIBOR") as a benchmark rate. On July 27, 2017, the United Kingdom's Financial Conduct Authority, which regulates LIBOR, announced that it intends to stop persuading or compelling banks to submit LIBOR quotations after 2021 (the "FCA Announcement"). The FCA Announcement indicates that the continuation of LIBOR on the current basis cannot and will not be assured after 2021, and LIBOR may cease to exist or otherwise be unsuitable for use as a benchmark. Recent proposals for LIBOR reforms may result in the establishment of new methods of calculating LIBOR or the establishment of one or more alternative benchmark rates. As a result, this change may adversely impact the interest rate paid on some of our loans, credit facilities, other financial instruments and interest rate swaps, our interest expense may increase and our available cash flow and /or financial condition may be adversely affected.
Past and potential downgrades in our debt ratings may adversely affect our liquidity, competitive position and access to capital markets.
The major debt-rating agencies routinely evaluate and rate our debt according to a number of factors, among which are our perceived financial strength and our ability to gain market share. In January, March and April 2019, S&P, Fitch and Moody’s upgraded our corporate rating and certain of the ratings of our other debt securities by one level. Additionally, each rating agency also changed their rating outlook from Positive to Stable during that same period. The rating agencies have noted concerns with respect to our high levels of debt but expect continued improvement in our credit metrics and cash flow generation. However, any material deterioration in our market share, warranty expense, earnings or cash flow generation could lead to a downgrade by the rating agencies in our credit ratings. Any downgrade in our credit ratings and any resulting negative publicity could adversely affect our continued access to trade credit on customary terms as well as our ability to access capital in the future under acceptable terms and conditions.
We have significant underfunded postretirement obligations.
On a U.S. generally accepted accounting principles ("GAAP") basis, the underfunded portion of our projected benefit obligation was
$1.3 billion
and
$1.2 billion
for pension benefits at
October 31, 2019
and
2018
, respectively, and
$804 million
and
$948 million
for postretirement healthcare benefits at
October 31, 2019
and
2018
, respectively. In calculating these amounts, we have assumed certain mortality rates, interest rates and growth rates of retiree medical costs. The fair value of invested assets held in our postretirement benefit plans are measured at October 31 each year and are used to compute funded status. Future mortality assumption changes and growth rates of retiree medical costs actually experienced by the postretirement benefit plans, as well as reductions in interest rates and the investment performance of the assets, could have an adverse impact on our underfunded postretirement obligations, financial condition, results of operations and cash flows.
The continued restructuring and rationalization of our business could also accelerate our pension funding obligations under the Employee Retirement Income Security Act of 1974, as amended ("ERISA"). The volatility in the financial markets affects the valuation of our pension assets and liabilities, resulting in potentially higher pension costs and higher levels of under-funding in future periods. Even though our funding requirements over the next three years would have been higher without the pension funding relief legislation, Preservation of Access to Care for Medicare Beneficiaries and Pension Relief Act of 2010, the Moving Ahead for Progress in the 21st Century Act ("MAP-21 Act"), the Highway and Transportation Funding Act of 2014 ("HATFA") and the Bi-Partisian Budget Act of 2015, as well as possible future legislative or governmental agency relief the requirements set forth in ERISA and the Internal Revenue Code of 1986, as amended (the "IRC"), as applicable to our U.S. pension plans (including timing requirements) mandated by the Pension Protection Act of 2006 (the "PPA") to fully fund our U.S. pension plans, could have an adverse impact on our business, financial condition, results of operations and cash flows.
We may not achieve all of the expected benefits from our strategic alliances and other corporate transactions.
We cannot provide any assurances that our strategic alliances and other corporate transactions will generate all of the expected benefits, including the cost savings and strategic advantages that are anticipated from the strategic alliance with TRATON Group. In addition, we cannot assure you that disputes will not arise with our strategic alliance partners and that such disputes will not lead to litigation or otherwise have an adverse effect on the strategic alliances or our relationships with our partners. Failure to successfully manage and integrate these strategic alliances could adversely impact our financial condition, results of operations and cash flows. We continue to evaluate opportunities to further restructure our business in an effort to optimize our cost structure, which could include, among other actions, additional rationalization of our strategic alliances.
15
Our parts business may be negatively impacted by our engine strategy.
As a result of our decision to use third party engines in some of our products and a decline in operation of certain units due to lower market share in recent years, we are experiencing a decline in our engine-related parts business revenue. BDP supplies aftermarket parts to support the diesel engines supplied to Ford prior to December 2009. We have experienced declines in BDP’s engine-related parts sales and profitability, and we expect to see further declines as diesel engines transition out of service and due to the future termination of the BDP joint venture in October 2021.
Warranty claims and related costs often have high variability and can be influenced by many external factors which may affect our operating results and cash flow.
Warranty estimates are established using historical information about the nature, frequency, timing, and average cost of warranty claims. However, warranty claims inherently have high variability in timing and severity and can be influenced by many external factors. As a result, actual warranty related costs may vary from the accruals for warranty related costs. We accrue warranty related costs for the trucks and engines that we manufacture under standard warranty terms and for certain claims made outside the contractual obligation period as accommodations to our customers. In addition, with respect to our optional extended warranty contracts, we recognize losses on defined pools of extended warranty contracts when the expected costs for a given pool of contracts exceeds the related unearned revenues. Over time, we have substantially reduced our engine offerings, thereby reducing our new product warranty accruals and potentially reducing the warranty exposure associated with engine specific service contracts. Although we continue to identify opportunities to refine and improve the design, efficiency and manufacturing of our products to reduce the volume and severity of warranty claims, we may incur additional charges for recalls or field campaigns to address issues which arise during this process. These charges could have an adverse effect on our financial condition, results of operations and cash flows.
Pricing allowances and sales incentives offered to U.S. fleet customers can be influenced by many external factors which may affect our operating results and cash flow.
Pricing allowances and sales arrangements with U.S. fleet customers are often complex and non-standard, and may include other sales incentives, such as rebates, residual value guarantees, and financing incentives. Such pricing allowances and sales arrangements may have terms which could have an adverse effect on our financial condition, results of operations and cash flows.
We may discover defects or other issues in vehicles potentially resulting in delays in new model launches, recall campaigns, or increased warranty costs.
Meeting or exceeding many government-mandated safety standards is costly and often technologically challenging. Government safety standards require manufacturers to remedy defects related to motor vehicle safety through safety recall campaigns. A manufacturer is obligated to recall vehicles if it determines that they do not comply with a safety standard. In addition, we may decide to take action with respect to a product issue not related to safety. Should we or government safety regulators determine that a safety standard noncompliance, safety-related defect or other product issue exists with respect to certain types of our vehicles, there could be a delay in the launch of a new model or a significant increase in warranty claims or a recall for existing models, the costs of which could be substantial. Our partnerships with other companies in engine or vehicle development can increase this risk due to the added complexity inherent in such an effort. Additionally, if we experience failure in some of our emissions components and the emission component defect rates of our engines exceed a certain level set by CARB or the EPA, those engines may be subject to corrective actions by such agencies, which may include extending the warranties of those engines. This could increase exposure beyond the stated warranty period to the relevant regulatory useful life of the engine which could have an adverse effect on our financial condition, results of operations and cash flows. In addition, our role as secondary engine manufacturer or as emissions certification holder for engines primarily manufactured by other companies could impair our identification of defects and increase the chance of warranty costs or recalls.
16
Our Manufacturing operations are dependent upon third-party suppliers, including, in certain cases, single-source suppliers, making us vulnerable to supply shortages.
We obtain raw materials, parts and manufactured components from third-party suppliers ("Third Party Supplies"). Any delay in receiving Third Party Supplies could impair our ability to deliver products to our customers and, accordingly, could have an adverse effect on our business, financial condition, results of operations, and cash flows. The volatility in the financial markets and uncertainty in the automotive sector could result in exposure related to the financial viability of certain of our suppliers. Suppliers may also exit certain business lines, causing us to find other suppliers for materials or components and potentially delaying our ability to deliver products to customers, or our suppliers may change the terms on which they are willing to provide products to us, any of which could adversely affect our financial condition and results of operations. In addition, many of our suppliers have unionized workforces that could be subject to work stoppages as a result of labor relations issues. Some of our suppliers are the sole source for a particular supply item (e.g., the majority of engines, parts and manufactured components) and cannot be quickly or inexpensively re-sourced to another supplier due to long lead times and contractual commitments that might be required by another supplier in order to provide the component or materials. In addition to the risks described above regarding interruption of Third Party Supplies, which are exacerbated in the case of single-source suppliers, the exclusive supplier of a component potentially could exert significant bargaining power over price, quality, warranty claims or other terms relating to a component.
Our ability to execute our strategy is dependent upon our ability to attract, train and retain qualified personnel.
Our continued success depends, in large part, on our continued ability to identify, attract, develop, motivate and retain qualified employees in key functions and geographic areas, including the United States (“U.S.”), Canada, Mexico and Brazil. Although we continue to compete for top talent in large metropolitan areas outside of large automotive hubs, we have achieved a leaner and targeted workforce while reducing and controlling costs. In addition, to effectively manage our domestic and global operations, we will need to continue engaging our workforce throughout the entire employee lifecycle to create sustained high performance for our organization. Failure to do so could impair our ability to execute our business strategy and could have an adverse effect on our business prospects.
Implementation of our emissions strategy, federal regulations and fuel economy rules may increase costs.
Recent and future changes to on-highway emissions or performance standards (including fuel efficiency, noise, and safety), as well as compliance with additional environmental requirements, are expected to continue to add to the cost of our products and increase the engineering and product development programs of our business. Implementation of our emissions strategy is ongoing and we may experience increased costs or compliance or timing risks as we continue implementation of OBD systems requirements as they phase in and manage GHG emission credit balances. The EPA, the U.S. Department of Transportation and the government of Canada have issued final rules on GHG emissions and fuel economy for medium and heavy duty vehicles and engines. The emission standards establish required minimum fuel economy and GHG emissions levels for both engines and vehicles primarily through the increased use of existing technology. The rules, which apply to our engines and vehicles, initially required EPA certification for vehicles and engines to GHG emissions standards in calendar year 2014 and were fully implemented in model year 2017. EPA and NHTSA adopted a second phase of GHG emissions reductions that will apply in three emission standards beginning in model year 2021 and culminating in model year 2027. These rules reduce emission levels for engines and vehicles. In addition, California has adopted GHG emissions standards for heavy duty vehicles and engines, published its draft proposal for lowering NOx standards for California certified engines and requested EPA to lower NOx emission standards as well. In addition to lower NOx, EPA and California may consider other actions, including extending warranty periods, mandating sales of zero emission trucks, and requiring certification of zero emission heavy duty vehicles. In addition, we are responsible for emission certification for certain partner companies which can introduce complexity into the certification process.
These standards will require significant investments of capital, will significantly increase costs of development for engines and vehicles, and will require us to incur administrative costs arising from implementation of the standards. These regulatory proposals under consideration or those that are proposed in the future may set standards that are difficult to achieve or adversely affect our results of operations due to increased research, development, and warranty costs.
17
We could incur further restructuring and impairment charges as we continue to evaluate our portfolio of assets and identify opportunities to restructure our business and rationalize our Manufacturing operations in an effort to optimize our cost structure.
We continue to evaluate our portfolio of assets in order to validate their strategic and financial fit. To focus on our North American Core business, we have evaluated product lines, businesses, and engineering programs that fall outside of our Core business. We assessed the strategic fit to our Core business and identified areas that were under-performing and/or non-strategic. For those under-performing and non-strategic areas still remaining, we continually evaluate whether to fix, divest, or close those areas. In addition, we are evaluating opportunities to restructure our business and rationalize our Manufacturing operations in an effort to optimize our cost structure. These actions could result in restructuring and related charges, including but not limited to asset impairments, employee termination costs, charges for pension and other postretirement contractual benefits, potential additional pension funding obligations, and pension curtailments, any of which could be significant, and could adversely affect our financial condition and results of operations.
We have substantial amounts of long-lived assets, including goodwill, property, plant and equipment, and intangible assets, which are subject to periodic impairment analysis and review. Identifying and assessing whether impairment indicators exist, or if events or changes in circumstances have occurred, including market conditions, operating results, competition, and general economic conditions, requires significant judgment. Declines in profitability due to changes in volume, market pricing, cost, or the business environment could result in charges that could have an adverse effect on our financial condition and results of operations.
We are involved in pending litigation, and an adverse resolution of such litigation may adversely affect our business, financial condition, and results of operations and cash flows.
Litigation can be expensive, lengthy, and disruptive to normal business operations. The results of complex legal proceedings are often uncertain and difficult to predict. An unfavorable outcome of a particular matter described in our periodic filings or any future legal proceedings could have an adverse effect on our business, financial condition, and results of operations or cash flows.
We are currently involved in a number of pending litigation matters. For additional information regarding certain lawsuits in which we are involved, see Note 14,
Commitments and Contingencies
, to our consolidated financial statements.
We are exposed to political, economic, and other risks that arise from operating a multinational business.
We have significant operations in foreign countries, primarily in Canada, Mexico and Brazil. Accordingly, our business is subject to the political, economic, and other risks that are inherent in operating a multinational company. These risks include, among others:
•
trade protection measures, export limitations and import and export licensing requirements;
|
•
|
tariffs imposed on key raw materials could potentially disrupt our existing supply chains and impose additional costs on our business, including costs with respect to raw materials upon which our business depends;
|
•
difficulty in staffing and managing international operations and the application of foreign labor regulations;
•
multiple and potentially conflicting laws, regulations, and policies that are subject to change;
•
currency exchange rate risk; and
•
changes in general economic and political conditions in countries where we operate, particularly in emerging markets.
In addition, we are subject to the Foreign Corrupt Practices Act (the "FCPA") and other laws which prohibit improper payments to foreign governments and their officials by U.S. and other business entities. Certain of the countries in which we operate present heightened corruption risks, which therefore increases the risks of our exposure under the FCPA and other applicable anti-bribery and corruption laws and regulations.
18
Our operations are subject to environmental, health and safety laws and regulations that could adversely affect our financial condition.
Our operations are subject to environmental, health and safety laws and regulations, including those governing discharges to air and water; the management and disposal of hazardous substances; the cleanup of contaminated sites; and health and safety matters. We could incur material costs, including cleanup costs, civil and criminal fines, penalties and third-party claims for cost recovery, property damage or personal injury as a result of violations of or liabilities under such laws and regulations. Contamination has been identified at and in the vicinity of some of our current and former properties and at properties which received wastes from current or former Company locations for which we have established financial reserves. The ultimate cost of remediating contaminated sites is difficult to accurately predict and could exceed our current estimates. In addition, as environmental, health, and safety laws and regulations have tended to become stricter, we could incur additional costs complying with requirements that are promulgated in the future. These include climate change regulation, which could increase the cost of operations through increased energy costs.
We must comply with numerous federal security laws, procurement regulations, and procedures, as well as the rules and regulations of foreign jurisdictions, and our failure to comply could adversely affect our business.
We must observe laws and regulations relating to the formation, administration and performance of federal government contracts that affect how we do business with our clients and impose added costs on our business. For example, the Federal Acquisition Regulations, foreign government procurement regulations and related laws include provisions that:
|
•
|
allow our government clients to terminate or not renew our contracts if we come under foreign ownership, control or influence;
|
•
allow our government clients to terminate existing contracts for the convenience of the government;
•
require us to prevent unauthorized access to classified information; and
•
require us to comply with laws and regulations intended to promote various social or economic goals.
We are subject to industrial security regulations of the U.S. Departments of State and Commerce and other federal agencies that are designed to safeguard against foreigners' access to classified or restricted information. Similarly, our international operations are subject to the rules and regulations of foreign jurisdictions.
A failure to comply with applicable laws, regulations, policies or procedures, including federal regulations regarding the procurement of goods and services and protection of classified information, could result in contract termination, loss of security clearances, suspension or debarment from contracting with the federal government, civil fines and damages and criminal prosecution and penalties, any of which could adversely affect our business.
We are exposed to, and may be adversely affected by, interruptions to our computer and information technology systems and sophisticated cyber-attacks.
We rely on our information technology systems and networks in connection with many of our business activities. Some of these networks and systems are managed by third-party service providers and are not under our direct control. Our operations routinely involve receiving, storing, processing and transmitting sensitive information pertaining to our business, customers, dealers, suppliers, employees and other sensitive matters. As with most companies, we have experienced cyber-attacks, attempts to breach our systems and other similar incidents, none of which have been material. Any future cyber incidents could, however, materially disrupt operational systems; result in loss of trade secrets or other proprietary or competitively sensitive information; compromise personally identifiable information regarding customers or employees; delay our ability to deliver products to customers; and jeopardize the security of our facilities. A cyber incident could be caused by malicious outsiders or insiders using sophisticated methods to circumvent firewalls, encryption and other security defenses. Because techniques used to obtain unauthorized access or to sabotage systems change frequently and generally are not recognized until they are launched against a target, we may be unable to anticipate these techniques or to implement adequate preventative measures. Information technology security threats, including security breaches, computer malware and other cyber-attacks, are increasing in both frequency and sophistication and could create financial liability, subject us to legal or regulatory sanctions or damage our reputation with customers, dealers, suppliers and other stakeholders. Security breaches could also result in a violation of U.S. and international privacy and other laws and subject the Company to various litigations and proceedings. We continuously seek to maintain a robust program of information security and controls, but the impact of a material information technology event could have a material adverse effect on our competitive position, reputation, results of operations, financial condition and cash flows.
19
Our business may be adversely impacted by work stoppages and other labor relations matters.
We are subject to risk of work stoppages and other labor relations matters because a significant portion of our workforce is unionized. As of
October 31, 2019
, approximately
7,400
of our hourly workers and approximately
700
of our salaried workers were represented by labor unions and were covered by collective bargaining agreements. Many of these agreements include provisions that limit our ability to realize cost savings from restructuring initiatives such as plant closings and reductions in workforce. In January 2019, certain of our UAW represented employees executed a new six-year master collective bargaining agreement with a ratification date of December 17, 2018 that replaced the prior agreement which expired in October 2018.
Any strikes, threats of strikes, arbitration or other resistance in connection with the negotiation of new labor agreements, or increases in costs under a newly negotiated labor agreement, could adversely affect our business as well as impair our ability to implement further measures to reduce structural costs and improve production efficiencies. A lengthy strike that involves a significant portion of our manufacturing facilities could have an adverse effect on our financial condition, results of operations, and cash flows.
A small number of our stockholders have significant representation on and influence over our Board of Directors.
In October 2012, we entered into settlement agreements with two of our significant stockholders, Carl C. Icahn and several entities controlled by him (collectively, the "Icahn Group") and Mark H. Rachesky, MD, and several entities controlled by him (collectively, the "MHR Group") pursuant to which the Icahn Group and the MHR Group each had one representative appointed to our Board of Directors, and together the Icahn Group and the MHR Group mutually agreed upon a third representative appointed to our Board of Directors. In July 2013, we entered into amended settlement agreements with the Icahn Group and the MHR Group pursuant to which the Icahn Group and the MHR Group each had two representatives nominated for election as directors at our 2014 annual meeting, and each has continued to have two representatives nominated for election each year. On September 5, 2016, we entered into a Stockholder Agreement with TRATON Group which, among other things, provides for the appointment of two individuals designated by TRATON Group to our Board of Directors, subject to our approval, and on February 28, 2017, we appointed the two individuals designated by TRATON Group to our Board of Directors. As of October 31,
2019
, based on filings made with the SEC and other information made available to us as of that date, we believe that: (i) the Icahn Group held approximately
16.7 million
shares, or
16.9%
of our outstanding common stock, (ii) the MHR Group held approximately
16.3 million
shares, or
16.4%
of our outstanding common stock, (iii) TRATON Group held approximately
16.6 million
shares, or
16.8%
of our outstanding common stock, and (iv) the Icahn Group, the MHR Group, TRATON Group, and two other stockholders, collectively hold approximately 66% of our outstanding common stock.
As a result of the foregoing, these stockholders are able to exercise significant influence over the election of our Board of Directors as well as matters requiring stockholder approval. Further, this concentration of ownership may adversely affect the market price of our common stock.
Provisions in our charter and by-laws and Delaware law could delay and discourage takeover attempts that stockholders may consider favorable.
Certain provisions of our certificate of incorporation and by-laws, and applicable provisions of Delaware corporate law, may make it more difficult for a third party to acquire control of us or change our Board of Directors and management, or may prevent such an acquisition or change. These provisions include:
|
•
|
the ability of our Board of Directors to issue so-called "flexible" preferred stock;
|
|
•
|
a provision for any vacancies on our Board of Directors to be filled only by the remaining directors;
|
|
•
|
the inability of stockholders to act by written consent or call special meetings;
|
|
•
|
advance notice procedures for stockholder proposals to be brought before an annual meeting of our stockholders; and
|
|
•
|
Section 203 of the Delaware General Corporation Law, which generally restricts us from engaging in certain business combinations with a person who acquires 15% or more of our common stock for a period of three years from the date such person acquired such common stock, unless stockholder or Board approval is obtained prior to the acquisition
|
The foregoing provisions may adversely affect the marketability of our common stock by discouraging potential investors from acquiring our stock. In addition, these provisions could delay or frustrate the removal of incumbent directors and could make more difficult a merger, tender offer or proxy contest involving us, or impede an attempt to acquire a significant or controlling interest in us, even if such events might be beneficial to us and our stockholders.
20
Our ability to use net operating loss ("NOL") carryovers to reduce future tax payments could be negatively impacted if there is a change in our ownership or a failure to generate sufficient taxable income.
As of
October 31, 2019
, we had
$2.2 billion
of NOL carryforwards with which to offset our future taxable income for U.S. federal income tax reporting purposes. Presently, there is no annual limitation on our ability to use U.S. federal NOLs to reduce future income taxes. However, we may be subject to substantial annual limitations provided by the IRC if an "ownership change," as defined in Section 382 of the IRC, occurs with respect to our capital stock. Generally, an ownership change occurs if certain persons or groups increase their aggregate ownership by more than 50 percentage points of our total capital stock in a three-year period. If an ownership change occurs, our ability to use domestic NOLs to reduce taxable income is generally limited to an annual amount based on (i) the fair market value of our stock immediately prior to the ownership change multiplied by the long-term tax-exempt interest rate plus (ii) under certain circumstances, realized built-in gains on certain assets held prior to the ownership change for the first five years after the ownership change. Although NOLs that exceed the Section 382 limitation in any year continue to be allowed as carryforwards for the remainder of the 20-year carryforward period and can be used to offset taxable income for years within the carryover period subject to the limitation in each year, the use of the remaining NOLs for the loss year will be prohibited if the carryover period for any loss year expires. If we should fail to generate a sufficient level of taxable income prior to the expiration of the NOL carryforward periods, then we will lose the ability to apply the NOLs as offsets to future taxable income. Similar limitations also apply to certain U.S. federal tax credits.
|
Item 1B.
|
Unresolved Staff Comments
|
None.
|
Item 2.
|
Properties
|
Our Truck segment operates
four
manufacturing and assembly facilities, which contain in the aggregate approximately
five million
square-feet of floor space. Of these
four
facilities,
three
are located in the U.S. and
one
is located in Mexico.
Three
facilities are owned and
one
facility is subject to lease.
Three
plants manufacture and assemble trucks, buses, and chassis.
One
plant is used to build diesel engines.
Our Parts segment leases
seven
distribution centers in the U.S.,
two
in Canada,
one
in Mexico, and one in South Africa.
Our Global Operations segment owns and operates a manufacturing plant in Brazil, which contain a total of
1 million
square-feet of floor space for use by our South American engine subsidiaries.
Our Financial Services segment, the majority of whose activities are conducted at our headquarters in Lisle, Illinois, also leases office space in Mexico.
Our principal product development and engineering facilities are currently located in Lisle, Illinois; Melrose Park, Illinois; New Carlisle, Indiana; and Monterrey, Mexico. Additionally, we own or lease other significant properties in the U.S., Canada and Mexico including vehicle and parts distribution centers, sales offices, and our headquarters in Lisle, Illinois.
We believe that all of our facilities have been adequately maintained, are in good operating condition, and are suitable for our current needs. These facilities, together with planned capital expenditures, are expected to meet our needs in the foreseeable future. Our Lisle, Illinois and Brookfield, Wisconsin, properties are subject to liens in favor of the lenders under our Term Loan Credit Agreement. Subsequent to October 31, 2018, our Melrose Park Facility is now subject to a lien in favor of the lenders under our Term Loan Credit Agreement.
|
Item 3.
|
Legal Proceedings
|
The information required to be set forth under this heading is incorporated by reference from Note 14,
Commitments and Contingencies
, to the Consolidated Financial Statements included in Part II, Item 8.
|
Item 4.
|
Mine Safety Disclosures
|
Not applicable.
21
|
Item 5.
|
Market for Registrant's Common Equity, Related Stockholder Matters and Issuer Purchases of Equity Securities
|
Market Information
Our common stock is listed on the New York Stock Exchange ("NYSE"), under the stock symbol "NAV."
Number of Holders
As of November 30, 2019
, there were approximately
6,217
holders of record of our common stock.
Dividend Policy
Holders of our common stock are entitled to receive dividends when and as declared by the Board of Directors out of funds legally available therefore, provided that, so long as any shares of our preference stock are outstanding, no dividends (other than dividends payable in common stock) or other distributions (including purchases) may be made with respect to the common stock unless full cumulative dividends, if any, on our shares of preference stock have been paid. Under the General Corporation Law of the State of Delaware, dividends may only be paid out of surplus or out of net profits for the year in which the dividend is declared or the preceding year, and no dividend may be paid on common stock at any time during which the capital of outstanding preference stock exceeds our net assets. Certain debt instruments contain terms that include negative covenants and restrictions, including, among others, certain limitations on dividends. We have not paid dividends on our common stock since 1980.
Recent Sales of Unregistered Securities
There were no sales of unregistered securities by us or any of our affiliates during the
three months ended October 31, 2019
.
Purchases of Equity Securities
There were no purchases of equity securities by us or any of our affiliates during the
three months ended October 31, 2019
.
22
Stock Performance
The following graph compares the five-year cumulative total returns of Navistar International Corporation common stock, the S&P 500 Index, and the S&P Construction, Farm Machinery and Heavy Truck Index.
The comparison graph assumes $100 was invested on October 31, 2014 in our common stock and in each of the indices shown and assumes reinvestment of all dividends. Data is complete through
October 31, 2019
. Shareholder returns over the indicated period are based on historical data and should not be considered indicative of future shareholder returns.
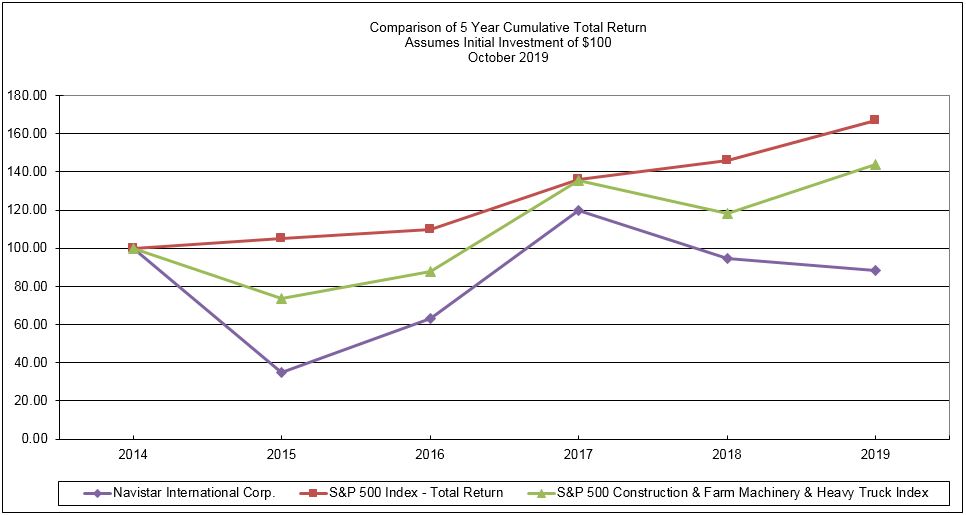
|
As of October 31,
|
|||||||||||||||||||||||
|
2014
|
2015
|
2016
|
2017
|
2018
|
2019
|
||||||||||||||||||
|
Navistar International Corporation
|
$
|
100
|
|
$
|
35
|
|
$
|
63
|
|
$
|
120
|
|
$
|
95
|
|
$
|
88
|
|
|||||
|
S&P 500 Index - Total Returns
|
100
|
|
105
|
|
110
|
|
136
|
|
146
|
|
167
|
|
|||||||||||
|
S&P Construction, Farm Machinery, and Heavy Truck Index
|
100
|
|
74
|
|
88
|
|
136
|
|
118
|
|
144
|
|
|||||||||||
The above graph uses peer group only performance (excludes us from the peer group). Peer group indices use beginning of periods' market capitalization weighting. Prepared by Zacks Investment Research, Inc. Used with permission. All rights reserved. Copyright 1980-2019. Index Data: Copyright Standard and Poor’s, Inc. Used with permission. All rights reserved.
23
|
Item 6.
|
Selected Financial Data
|
Refer to Item 7,
Management's Discussion and Analysis of Financial Condition and Results of Operations
, and the notes to the accompanying consolidated financial statements for additional information regarding the financial data presented below, including matters that might cause this data not to be indicative of our future financial condition or results of operations.
Five-Year Summary of Selected Financial and Statistical Data
|
As of and for the Years Ended October 31,
|
|||||||||||||||||||
|
(in millions, except per share data)
|
2019
|
2018
|
2017
|
2016
|
2015
|
||||||||||||||
|
RESULTS OF OPERATIONS DATA
|
|||||||||||||||||||
|
Sales and revenues, net
|
$
|
11,251
|
|
$
|
10,250
|
|
$
|
8,570
|
|
$
|
8,111
|
|
$
|
10,140
|
|
||||
|
Income (loss) from continuing operations before taxes
|
262
|
|
420
|
|
64
|
|
(32
|
)
|
(103
|
)
|
|||||||||
|
Income tax expense
|
(19
|
)
|
(52
|
)
|
(10
|
)
|
(33
|
)
|
(51
|
)
|
|||||||||
|
Income (loss) from continuing operations
|
243
|
|
368
|
|
54
|
|
(65
|
)
|
(154
|
)
|
|||||||||
|
Income from discontinued operations, net of tax
|
—
|
|
—
|
|
1
|
|
—
|
|
3
|
|
|||||||||
|
Net income (loss)
|
243
|
|
368
|
|
55
|
|
(65
|
)
|
(151
|
)
|
|||||||||
|
Less: Net income attributable to non-controlling interests
|
22
|
|
28
|
|
25
|
|
32
|
|
33
|
|
|||||||||
|
Net income (loss) attributable to Navistar International Corporation
|
$
|
221
|
|
$
|
340
|
|
$
|
30
|
|
$
|
(97
|
)
|
$
|
(184
|
)
|
||||
|
Amounts attributable to Navistar International Corporation common shareholders:
|
|||||||||||||||||||
|
Income (loss) from continuing operations net of tax
|
$
|
221
|
|
$
|
340
|
|
$
|
29
|
|
$
|
(97
|
)
|
$
|
(187
|
)
|
||||
|
Income from discontinued operations, net of tax
|
—
|
|
—
|
|
1
|
|
—
|
|
3
|
|
|||||||||
|
Net income (loss)
|
$
|
221
|
|
$
|
340
|
|
$
|
30
|
|
$
|
(97
|
)
|
$
|
(184
|
)
|
||||
|
Basic earnings (loss) per share
|
|||||||||||||||||||
|
Continuing operations
|
$
|
2.23
|
|
$
|
3.44
|
|
$
|
0.31
|
|
$
|
(1.19
|
)
|
$
|
(2.29
|
)
|
||||
|
Discontinued operations
|
—
|
|
—
|
|
0.01
|
|
—
|
|
0.04
|
|
|||||||||
|
Net income (loss)
|
$
|
2.23
|
|
$
|
3.44
|
|
$
|
0.32
|
|
$
|
(1.19
|
)
|
$
|
(2.25
|
)
|
||||
|
Diluted earnings (loss) per share
|
|||||||||||||||||||
|
Continuing operations
|
$
|
2.22
|
|
$
|
3.41
|
|
$
|
0.31
|
|
$
|
(1.19
|
)
|
$
|
(2.29
|
)
|
||||
|
Discontinued operations
|
—
|
|
—
|
|
0.01
|
|
—
|
|
0.04
|
|
|||||||||
|
Net income (loss)
|
$
|
2.22
|
|
$
|
3.41
|
|
$
|
0.32
|
|
$
|
(1.19
|
)
|
$
|
(2.25
|
)
|
||||
|
Weighted average number of shares outstanding:
|
|||||||||||||||||||
|
Basic
|
99.3
|
|
98.9
|
|
93.0
|
|
81.7
|
|
81.6
|
|
|||||||||
|
Diluted
|
99.5
|
|
99.6
|
|
93.5
|
|
81.7
|
|
81.6
|
|
|||||||||
|
BALANCE SHEET DATA
|
|||||||||||||||||||
|
Total assets
|
$
|
6,917
|
|
$
|
7,230
|
|
$
|
6,135
|
|
$
|
5,653
|
|
$
|
6,649
|
|
||||
|
Long-term debt:
(A)
|
|||||||||||||||||||
|
Manufacturing operations
|
$
|
2,900
|
|
$
|
2,965
|
|
$
|
3,121
|
|
$
|
3,025
|
|
$
|
3,059
|
|
||||
|
Financial services operations
|
1,417
|
|
1,556
|
|
768
|
|
972
|
|
1,088
|
|
|||||||||
|
Total long-term debt
|
$
|
4,317
|
|
$
|
4,521
|
|
$
|
3,889
|
|
$
|
3,997
|
|
$
|
4,147
|
|
||||
___________________________
(A) Exclusive of current portion of long-term debt.
24
|
Item 7.
|
Management's Discussion and Analysis of Financial Condition and Results of Continuing Operations
|
Management’s Discussion and Analysis of Financial Condition and Results of Operations ("MD&A") is designed to provide information that is supplemental to, and should be read together with, our consolidated financial statements and the accompanying notes. Information in MD&A is intended to assist the reader in obtaining an understanding of (i) our consolidated financial statements, (ii) the changes in certain key items within those financial statements from year-to-year, (iii) the primary factors that contributed to those changes, (iv) any changes in known trends or uncertainties that we are aware of and that may have a material effect on our future performance, and (v) how certain accounting principles affect our consolidated financial statements. In addition, MD&A provides information about our business segments and how the results of those segments impact our results of operations and financial condition as a whole.
Executive Overview
We are an international manufacturer of International® brand commercial trucks, proprietary brand diesel engines, and IC Bus® ("IC") brand school and commercial buses, as well as a provider of service parts for trucks and diesel engines. Our Core business is conducted in the North American truck and parts markets, where we principally participate in the U.S. and Canada school bus and Class 6 through 8 medium and heavy truck markets. We also provide retail, wholesale, and lease financing services for our trucks and parts.
Executive Summary
During
2019
, we continued to demonstrate the growth of our business, focusing our efforts on becoming the #1 choice in our industry. The areas of focus centered around: being customer centric, driving operational excellence, improving on our Core business and business transformation. We believe these actions coupled with our strategic alliance with the TRATON Group and our winning culture anchored by our high performing cross-functional teams continue to position us for success.
In December 2018, we completed the sale of a 70% equity interest in the defense business, Navistar Defense, to an affiliate of Cerberus Capital Management, L.P. In connection with the closing of the transaction, we entered into an exclusive long-term agreement to supply military and commercial parts and chassis to Navistar Defense. We also entered into an intellectual property agreement and a transition services agreement in connection with the sale. We recognized a gain on the sale in our Truck segment of $51 million in
Other expense, net
in our
Consolidated Statements of Operations
.
In January 2019, a new six-year master collective bargaining agreement was ratified with the UAW. This replaces the prior contract that expired in October 2018.
In January 2019, we purchased group annuity contracts which transferred approximately $268 million in obligations, and related assets, of defined benefit pension plans in Canada to certain third-party insurers. The transactions were funded by existing plan assets and required no cash contributions to our Navistar Canada pension plans. We recognized a non-cash pension settlement charge of $142 million and an income tax benefit of $38 million during the first quarter of 2019. The transactions are aligned with our strategic priority to strengthen our balance sheet by lowering risk volatility in our pension plan obligations.
In March 2019, we entered a service partnership agreement with Love’s Travel Stops, which adds more than 300 Love’s Truck Tire Care and Speedco locations to the International® service network, creating the commercial transportation industry’s largest service network and bringing the total International® service network to more than 1,000 locations in North America. Building on our commitment to Uptime leadership, this partnership will expand our customers’ access to same-day service for a wide array of light mechanical repairs and will also provide customers with faster repair service.
In April 2019, we repaid in full our 4.75% Senior Subordinated Convertible Notes issued in March 2014. The repayment of the outstanding principal of $411 million at maturity was funded with cash on hand.
In May 2019, we and certain plaintiffs in the outstanding putative United States class action lawsuits related to Model Year 2011-2014 Class 8 trucks sold in the U.S. with the Company’s 11 and 13-liter EGR only engines entered into a Stipulation and Agreement of Settlement (the "Settlement Agreement") to settle the putative class action lawsuits pending in the United States. During the second quarter, we incurred charges of $159 million to address the expected obligations under the Settlement Agreement, as well as the costs associated with current period liabilities and future potential settlements with respect to certain other MaxxForce Advanced EGR engine lawsuits that are not included in the Settlement Agreement. We expect that this preliminary step toward the settlement of these United States class action lawsuits will accelerate our efforts to address legacy engine issues.
We continue to make operational improvements. In June 2019, we stated our commitment to make capital investments of approximately $125 million in new and expanded manufacturing facilities in the State of Alabama. The investment is expected to bring 145 additional jobs to our Huntsville facility. In September 2019, we also announced we will be making a capital investment of more than $250 million to build a new manufacturing facility in Texas. The investment, which is contingent on the finalization of various incentive packages, is expected to bring approximately 600 jobs to the San Antonio area.
25
In August 2019, we opened a parts distribution center in Olive Branch, Mississippi, to help respond to the growing demand for parts and quicker maintenance turnaround times. This is our seventh parts distribution center in the U.S. and tenth in North America. Our centralized location and proximity to the FedEx World Hub in Memphis, Tennessee enables us to deliver parts the next day to over 95% of our dealers’ service locations. We are committed to uptime to enhance customer value.
2019
Financial Summary
Continuing Operations Results
Continuing Operations Results
— Consolidated net sales and revenues were
$11.3 billion
in
2019
, an increase of
10%
compared to
2018
. The increase primarily reflects higher volumes in our Core markets.
In
2019
, we earned income from continuing operations before income taxes of
$262 million
compared to
$420 million
in
2018
. Our gross margin increased by
$73 million
primarily due to the impact of higher volumes.
In
2019
, we recognized income tax expense from continuing operations of
$19 million
, compared to income tax expense of
$52 million
in the prior year. The decrease to income tax expense is primarily due to a $38 million benefit associated with a group annuity contract purchase for certain retired pension plan participants in Canada, recorded in the first quarter of 2019. Other differences for the year include the impact of earnings, geographical mix and certain discrete items.
In
2019
, after income taxes, income from continuing operations attributable to NIC was
$221 million
, or
$2.22
per diluted share, compared to income of
$340 million
, or
$3.41
per diluted share, in
2018
.
In
2019
, consolidated net income from continuing operations attributable to NIC, before manufacturing interest, taxes, depreciation and amortization expenses (“EBITDA”) was
$640 million
, compared to EBITDA of
$838 million
in
2018
. Excluding certain net adjustments of
$242 million
and
$12 million
in
2019
and
2018
, respectively, Adjusted EBITDA was
$882 million
in
2019
compared to
$826 million
in
2018
. In
2019
, adjusted consolidated net income attributable to NIC, excluding certain net impacts ("Adjusted Net Income"), was
$423 million
compared to
$327 million
in 2018. EBITDA, Adjusted EBITDA, and Adjusted Net Income are not determined in accordance with GAAP, nor are they presented as alternatives to GAAP measures. For more information regarding this non-GAAP financial information, see
Non-GAAP Financial Performance Measures
.
We ended 2019 with
$1,370 million
of consolidated cash, cash equivalents and marketable securities, compared to
$1,421 million
as of October 31, 2018. The decrease in consolidated cash, cash equivalents and marketable securities was primarily attributable to increases in finance receivables and other current assets, decreases in accounts payable and other noncurrent liabilities, capital expenditures, purchases of equipment leased to others, the repayment on our convertible notes and dividends paid with respect to non-controlling interests partially offset by net income, decreases in accounts receivable and inventories, an increase in other current liabilities, proceeds from financed lease obligations and proceeds from the sales of a majority interest in our former defense business, Navistar Defense and the sale of our joint venture in China with JAC.
Business Outlook and Key Trends
We continually look for ways to improve the efficiency and performance of our operations, and our focus is on improving our Core businesses. Certain trends have affected our results of operations for
2019
as compared to
2018
. These trends, as well as the key trends that we expect will impact our future results of operations, are as follows:
|
•
|
Engine Strategy and Emissions Standards Compliance
—We are focused on new product introductions, enhancements of current products, quality improvements and continuous material cost-reductions across our truck and bus product lines. We have shifted our investment focus to develop more driver-centric designs. We are also expanding our powertrain offerings with a mix of proprietary engines and Cummins engines. We have incurred significant research and development and tooling costs to design and produce our product lines to meet the EPA and CARB on-highway HDD emissions standards, including OBD requirements. GHG phase 2 regulations will further increase significant investments in product development by us and our competitors. CARB also continues to advocate for stricter emission standards, OBD requirements and in-use oversight. These emissions standards have and will continue to result in significant increases in the costs of our products.
|
|
•
|
TRATON Group Alliance
—We and TRATON Group have a similar vision for the role of technology, including the importance of driver-focused open architecture solutions. We expect the alliance will be a source of powertrain options and other high-value technologies, including advanced driver assistance systems, connected vehicle solutions and autonomous technologies, electric vehicles, and cab and chassis subsystems. We expect to have a fully integrated proprietary powertrain and launch an electric medium-duty truck and electric school bus based on TRATON Group's technology. In addition, our Procurement JV Framework Agreement with TRATON Group will deliver further material cost savings in the years to come.
|
26
|
•
|
Core Truck Market
—The Core market in which we compete is cyclical in nature and strongly influenced by macroeconomic factors such as industrial production, consumer spending, demand for durable goods, construction spending, business investment, and state and local government spending. During the past two years, truck customers in the U.S. and Canada have significantly replaced and expanded their fleets and truck sales have reached cyclical peaks. However, over the past year, economic momentum has softened and freight volume and rates have eased, which may continue to negatively impact Class 8 truck demand. The medium truck market is expected to ease from its currently elevated level, but solid consumer spending may continue to support medium truck demand. The school bus market is expected to be solid since school-age population increases slowly, but steadily. We anticipate that our Core market retail industry deliveries will range between 335,000 to 365,000 units for 2020.
|
|
•
|
Used Truck Inventory
—Our gross used truck inventory increased to approximately
$200 million
at
October 31, 2019
from
$154 million
at
October 31, 2018
, offset by reserves of
$37 million
and
$31 million
, respectively. During
2019
, additions to our used truck reserves were
$69 million
, compared to
$50 million
in
2018
. The increase was primarily due to higher trade-ins from strong new truck sales including an increase in other OEM used trucks related to market share gains, largely offset by used truck sales.
|
|
•
|
Parts
—The Parts business remains a significant source of revenue and profit. We are focusing on retail customer segmentation and improving dealer-lead generation. Our private label brands help provide All-Make parts to customers, attract incremental price sensitive customers, and offset the decline in late-in-lifecycle products. We are leveraging technology such as eCommerce to attract and retain new customers, to expand our existing customers’ portfolio of products, and to improve the ease of doing business. We have embraced improving uptime via parts availability, dedicated same-day deliveries and expanded hours at our parts distribution centers.
|
|
•
|
Warranty Costs
—Warranty expense continues to reflect our current product portfolio and our commitment to quality and customer uptime. Warranty expense as a percentage of manufacturing revenue declined to 1.4% from 1.7% a year ago. We recognized a charge for adjustments to pre-existing warranties of
$3 million
in
2019
, and a benefit for adjustments to pre-existing warranties of
$9 million
in
2018
. Pre-existing warranties during the period were primarily driven by proactive campaign actions on units built in prior years and was partially offset by a favorable warranty experience on trucks and engines sold prior to fiscal year 2019. For more information, see Note 1,
Summary of Significant Accounting Policies
, to the accompanying consolidated financial statements.
|
|
•
|
Income Taxes
—At
October 31, 2019
, we had
$2.2 billion
of U.S. federal net operating loss carryforwards and
$179 million
of federal tax credit carryforwards. We expect our cash payments of U.S. taxes will be minimal for as long as we are able to offset our U.S. taxable income by these U.S. net operating losses and tax credits, which have carryforward periods of up to 20 years. We also have state and foreign net operating losses that are available to reduce cash payments of state and foreign taxes in future periods.
|
We maintain valuation allowances on our U.S. and certain foreign deferred tax assets because it is more likely than not that those deferred tax assets will not be realized. It is reasonably possible within the next
twelve months
that additional valuation allowances may be required on certain foreign deferred tax assets. For more information, see Note 12,
Income Taxes
, to the accompanying consolidated financial statements.
|
•
|
Business Evaluation
—We are focused on improving our Truck and Parts businesses in our Core markets. We are working to fix, divest or close under-performing and non-strategic areas and expect to realize incremental benefits from these actions. While we are making investments in our manufacturing footprint to expand our capabilities, we continue to rationalize our manufacturing operations in an effort to optimize our cost structure. This effort is ongoing and may lead to additional divestitures of businesses or discontinuing programs that are outside of our Core operations or are not performing to our expectations.
|
As a result of these evaluations, we ceased production at our MWM Motores engine facility in Jesus Maria, Argentina in October 2019. We sold a majority interest in our former defense business, Navistar Defense, and our former joint venture in China with JAC in December 2018. We ceased engine production at our Melrose Park Facility in May 2018. We also completed the sale of our former railcar business in Cherokee, Alabama in February 2018.
|
•
|
North and Latin American Economy
—U.S. economic growth has softened over the past year. Slower global growth, rising trade tensions, and ongoing policy uncertainty will likely continue to soften economic momentum. However, with a tight labor market, the consumer sector provides a solid base for growth. In addition, the U.S. Federal Reserve Board is expected to maintain its current monetary policy to support a moderate economic expansion. With domestic fundamental weakness, the Canadian economy is expected to continue growing at a modest pace. Expansion in Latin America, including Brazil, Chile, Colombia, and Peru, is projected to slow since the growth trajectory continues to be challenged by country-specific factors and global headwinds. The Mexican economy has decelerated significantly over the past year due to the deterioration of business conditions, but economic activity is expected to slowly rebound in the next year.
|
27
During 2019, we identified a triggering event related to continued economic weakness in Brazil and the initiation of strategic cost reduction actions in the Brazilian asset group, which is included in the Global Operations segment. We test for impairment of long-lived assets whenever events or changes in circumstances indicate that the carrying value of an asset or asset group (hereinafter referred to as "asset group") may not be recoverable by comparing the sum of the estimated undiscounted future cash flows expected to result from the operation of the asset group and its eventual disposition to the carrying value. As a result of the triggering event, we estimated the recoverable amount of the asset group and determined that the sum of the undiscounted future cash flows exceeds the carrying value and the asset group was not impaired. It is reasonably possible that within the next twelve months, we could recognize impairment charges if we experience adverse changes in our business including further declines in profitability due to changes in volume, market pricing, cost, or the business environment. Significant adverse changes to our business environment and future cash flows, or our inability to realize cost savings from our restructuring activities, could cause us to record impairment charges in future periods, which could be material.
28
Results of Continuing Operations
The following information summarizes our
Consolidated Statements of Operations
and illustrates the key financial indicators used to assess our consolidated financial results. Refer to Item 7 - MD&A in Part II of our Annual Report on Form 10-K for the fiscal year ended October 31, 2018 for additional information regarding Results of Operations for the
year ended October 31, 2018
as compared to the
year ended October 31, 2017
and Segment Results of Continuing Operations for
2018
as compared to
2017
.
Results of Continuing Operations for the
year ended October 31, 2019
as compared to the
year ended October 31, 2018
.
_________________________
|
(in millions, except per share data and % change)
|
2019
|
|
2018
|
Change
|
% Change
|
|||||||||
|
Sales and revenues, net
|
$
|
11,251
|
|
$
|
10,250
|
|
$
|
1,001
|
|
10
|
%
|
|||
|
Costs of products sold
|
9,245
|
|
8,317
|
|
928
|
|
11
|
%
|
||||||
|
Restructuring charges
|
12
|
|
(1
|
)
|
13
|
|
N.M.
|
|
||||||
|
Asset impairment charges
|
7
|
|
14
|
|
(7
|
)
|
(50
|
)%
|
||||||
|
Selling, general and administrative expenses
|
934
|
|
828
|
|
106
|
|
13
|
%
|
||||||
|
Engineering and product development costs
|
319
|
|
297
|
|
22
|
|
7
|
%
|
||||||
|
Interest expense
|
312
|
|
327
|
|
(15
|
)
|
(5
|
)%
|
||||||
|
Other expense, net
|
164
|
|
48
|
|
116
|
|
242
|
%
|
||||||
|
Total costs and expenses
|
10,993
|
|
9,830
|
|
1,163
|
|
12
|
%
|
||||||
|
Equity in income of non-consolidated affiliates
|
4
|
|
—
|
|
4
|
|
N.M.
|
|
||||||
|
Income from continuing operations before income taxes
|
262
|
|
420
|
|
(158
|
)
|
(38
|
)%
|
||||||
|
Income tax expense
|
(19
|
)
|
(52
|
)
|
33
|
|
63
|
%
|
||||||
|
Income from continuing operations
|
243
|
|
368
|
|
(125
|
)
|
(34
|
)%
|
||||||
|
Less: Net income attributable to non-controlling interests
|
22
|
|
28
|
|
(6
|
)
|
(21
|
)%
|
||||||
|
Net income attributable to Navistar International Corporation
|
$
|
221
|
|
$
|
340
|
|
$
|
(119
|
)
|
(35
|
)%
|
|||
|
Diluted income per share
(A)
|
$
|
2.22
|
|
$
|
3.41
|
|
$
|
(1.19
|
)
|
(35
|
)%
|
|||
|
Diluted weighted average shares outstanding
|
99.5
|
|
99.6
|
|
(0.1
|
)
|
—
|
%
|
||||||
|
N.M.
|
Not meaningful.
|
|
(A)
|
Amounts attributable to NIC.
|
Sales and revenues, net
Our sales and revenues, net, are principally generated via sales of products and services.
Sales and revenues, net
in our
Consolidated Statements of Operations,
by reporting segment were as follows:
|
(in millions, except % change)
|
2019
|
2018
|
Change
|
% Change
|
||||||||||
|
Truck
|
$
|
8,585
|
|
$
|
7,490
|
|
$
|
1,095
|
|
15
|
%
|
|||
|
Parts
|
2,245
|
|
2,407
|
|
(162
|
)
|
(7
|
)%
|
||||||
|
Global Operations
|
343
|
|
360
|
|
(17
|
)
|
(5
|
)%
|
||||||
|
Financial Services
|
297
|
|
257
|
|
40
|
|
16
|
%
|
||||||
|
Corporate and Eliminations
|
(219
|
)
|
(264
|
)
|
45
|
|
17
|
%
|
||||||
|
Total
|
$
|
11,251
|
|
$
|
10,250
|
|
$
|
1,001
|
|
10
|
%
|
|||
In
2019
, our Truck segment net sales increased by
$1,095 million
, or
15%
, primarily due to higher volumes in our Core markets, the commencement of sales of GM-branded units manufactured for GM, partially offset by the impact of the sale of a majority interest in Navistar Defense. Chargeouts from our Core markets were up
18%
, which is reflective of an improvement in our Class 8 truck volumes and market share. The improvement represents a
24%
increase in Class 8 severe service trucks, a
20%
increase in Class 6 and 7 medium trucks, a
19%
increase in Class 8 heavy trucks and a
7%
increase in buses.
29
In
2019
, our Parts segment net sales decreased by
$162 million
, or
7%
, primarily due to the impact of the new revenue standard as certain elements of core component transactions are no longer recognized within revenue and also as we are now an agent in certain direct shipment transactions that are recorded on a net basis, and lower BDP sales, partially offset by higher sales in our North American markets.
In
2019
, our Global Operations segment net sales decreased by
$17 million
, or
5%
, primarily driven by the depreciation of the Brazilian real against the U.S. dollar as the average conversion rate weakened by
9%
compared with the prior year, partially offset by higher volumes in our South America operations.
In
2019
, our Financial Services segment net revenues increased by
$40 million
or
16%
. The increase was primarily driven by higher average finance receivable balances in the U.S. and higher operating lease balances in the U.S. and Mexico. The increase was partially offset by a reduction in finance fees charged to the Manufacturing operations.
Costs of products sold
In
2019
, Costs of products sold
increased
by
$928 million
compared to the prior year primarily driven by the impact of higher volumes in our Core markets. The increase is partially offset by the impact of the new revenue standard as we are now an agent in certain direct shipment transactions that are recorded on a net basis and also due to certain elements of core component transactions that are no longer recognized within revenue.
In
2019
, we recognized charges for adjustments to pre-existing warranties of
$3 million
compared to a benefit of
$9 million
in 2018. Pre-existing warranty expense during the period was primarily driven by proactive campaign actions on units built in prior years and was partially offset by a favorable warranty experience on both trucks and engines sold prior to fiscal year 2019.
Restructuring Charges
In 2019, Restructuring charges increased by
$13 million
compared to the prior year primarily related to the cessation of production at our MWM Motores engine facility in Jesus Maria, Argentina and structural cost reductions in Brazil. For additional information, see Note 3,
Restructurings, Impairments and Divestitures
.
Selling, general and administrative expenses
In
2019
, our SG&A expenses increased by
$106 million
compared to the prior year primarily due to a MaxxForce Advanced EGR engine class action settlement and related litigation charges of $159 million, partially offset by the release of a liability of $32 million recognized primarily in 2017 related to certain MaxxForce Advanced EGR engine product litigation, and lower profit sharing accruals related to supplemental benefits for certain retirees. For more information on our legal proceedings, see Note 14, Commitments and Contingencies, to the accompanying consolidated financial statements.
Engineering and product development costs
In
2019
, our Engineering and product development costs increased by
$22 million
compared to the prior year primarily due to our development agreements with TRATON Group involving the expense of certain engine and transmission development costs and higher research and product development costs to meet future emission standard regulatory requirements.
Interest expense
In
2019
, our Interest expense decreased by
$15 million
compared to the prior year primarily driven by lower effective interest rates related to our issuance of the 6.625% Senior Notes, partially offset by the impact of higher average finance portfolio funding levels.
Other expense, net
In 2019, our Other expenses increased by
$116 million
compared to the prior year. The increase was primarily driven by a group annuity contract purchase for certain retired pension plan participants which resulted in a plan remeasurement. As a result, we recorded pension settlement accounting charges of $142 million compared to $9 million in the prior year. The increase in expense is also impacted by a $70 million non-recurring gain from the settlement of a business economic loss claim relating to our Alabama engine manufacturing facility representing the net present value from the Deepwater Horizon Settlement Program recorded in 2018. These impacts were partially offset by a gain of $51 million related to the sale of a majority interest in Navistar Defense and a gain on sale of $5 million related to our joint venture in China with JAC. The increase was also partially offset by $46 million of non-recurring charges related to the extinguishment of unamortized debt issuance costs, discounts and tender premium payments associated with the repurchase of our previous 8.25% senior notes and refinancing of our previous Senior Secured Term Loan Credit Facility in 2018.
30
Income tax expense
In
2019
, we recognized income tax expense from continuing operations of
$19 million
, compared to
$52 million
in the prior year. The decrease to income tax expense is largely the result of a $38 million benefit associated with a group annuity contract purchase for certain retired pension plan participants, recorded in the first quarter of 2019. Other differences for the year include the impact of earnings, geographical mix and certain discrete items.
Net income attributable to non-controlling interests
Net income attributable to non-controlling interests is the result of our consolidation of subsidiaries that we do not wholly own. Substantially all of our net income attributable to non-controlling interests in 2019 and 2018 relates to Ford's non-controlling interest in BDP.
Segment Results of Continuing Operations for
2019
as Compared to
2018
We operate in four reporting segments: Truck, Parts, Global Operations, and Financial Services.
We define segment profit (loss) as net income (loss) from continuing operations attributable to NIC excluding income tax benefit (expense). The following sections analyze operating results as they relate to our four segments and do not include intersegment eliminations. For additional information concerning our segments, see Note 15,
Segment Reporting
, to the accompanying consolidated financial statements.
Truck Segment
|
(in millions, except % change)
|
2019
|
2018
|
Change
|
% Change
|
||||||||||
|
Truck segment sales, net
|
$
|
8,585
|
|
$
|
7,490
|
|
$
|
1,095
|
|
15
|
%
|
|||
|
Truck segment profit
|
269
|
|
397
|
|
(128
|
)
|
(32
|
)%
|
||||||
Segment sales
In
2019
, our Truck segment net sales increased by
$1,095 million
, or
15%
, primarily due to higher volumes in our Core markets, the commencement of sales of GM-branded units manufactured for GM, partially offset by the impact of the sale of a majority interest in Navistar Defense. Chargeouts from our Core markets were up
18%
, which is reflective of an improvement in our Class 8 truck volumes and market share. The improvement represents a
24%
increase in Class 8 severe service trucks, a
20%
increase in Class 6 and 7 medium trucks, a
19%
increase in Class 8 heavy trucks and a
7%
increase in buses.
Segment profit
In
2019
, our Truck segment profit decreased by
$128 million
, or
(32)%
. The decrease is primarily driven by charges related to a MaxxForce Advanced EGR engine class action settlement, the impact of the sale of a majority interest in Navistar Defense, an increase in used truck losses, and lower other income, partially offset by higher volumes in our Core markets, and the release of a liability recognized in a prior year related to certain MaxxForce Advanced EGR engine litigation.
In
2019
, we recorded a charge of
$3 million
in our Truck segment for adjustments to pre-existing warranties compared to a benefit of
$8 million
in the prior year. Pre-existing warranties during the period was primarily driven by proactive campaign actions on units built in prior years and was partially offset by a favorable warranty experience on trucks and engines sold prior to fiscal year 2019.
In
2019
, we recorded a gain of $51 million related to the sale of a 70% equity interest in Navistar Defense and had a reduction in finance fees charged from our Financial Services operations. In
2018
, we recorded a $70 million gain related to the settlement of a business economic loss claim which was recognized in
Other expense, net
in our
Consolidated Statements of Operations
.
31
Parts Segment
|
(in millions, except % change)
|
2019
|
2018
|
Change
|
% Change
|
||||||||||
|
Parts segment sales, net
|
$
|
2,245
|
|
$
|
2,407
|
|
$
|
(162
|
)
|
(7
|
)%
|
|||
|
Parts segment profit
|
598
|
|
569
|
|
29
|
|
5
|
%
|
||||||
Segment sales
In
2019
, our Parts segment net sales decreased by
$162 million
, or
7%
. The decrease is primarily due to the impact of the new revenue standard as certain elements of core component transactions are no longer recognized within revenue and also as we are now an agent in certain direct shipment transactions that are recorded on a net basis, and lower BDP sales, partially offset by higher sales in our North American markets.
Segment profit
In
2019
, our Parts segment profit increased by
$29 million
, or
5%
, primarily due to higher U.S. margins and lower intercompany access fees, partially offset by lower BDP volumes and higher freight-related expenses. Access fees are allocated to our Parts segment from our Truck segment, primarily for the development of new products, and consist of certain engineering and product development costs, depreciation expense, and SG&A expenses.
Global Operations Segment
|
(in millions, except % change)
|
2019
|
|
2018
|
Change
|
% Change
|
|||||||||
|
Global Operations segment sales, net
|
$
|
343
|
|
$
|
360
|
|
$
|
(17
|
)
|
(5
|
)%
|
|||
|
Global Operations segment profit
|
—
|
|
2
|
|
(2
|
)
|
(100
|
)%
|
||||||
Segment sales
In
2019
, our Global Operations segment net sales decreased by
$17 million
, or
5%
, primarily driven by the depreciation of the Brazilian real against the U.S. dollar as the average conversion rate weakened by
9%
compared with the prior year, partially offset by higher volumes in our South America operations.
Segment profit
In
2019
, our Global Operations segment profit decreased by
$2 million
, or
100%
. The decrease was primarily driven by the impact of product mix and an increase in restructuring charges related to cost reduction actions, partially offset by lower SG&A expenses and higher other income of $5 million related to the sale of our former joint venture in China with JAC.
Financial Services Segment
|
(in millions, except % change)
|
2019
|
2018
|
Change
|
% Change
|
||||||||||
|
Financial Services segment revenues, net
|
$
|
297
|
|
$
|
257
|
|
$
|
40
|
|
16
|
%
|
|||
|
Financial Services segment profit
|
123
|
|
88
|
|
35
|
|
40
|
%
|
||||||
Segment revenues
In
2019
, our Financial Services segment net revenues increased by
$40 million
, or
16%
. The increase was primarily driven by higher average finance receivable balances in the U.S. and higher operating lease balances in the U.S. and Mexico. The increase was partially offset by a reduction in finance fees charged to the Manufacturing operations.
Segment profit
In
2019
, our Financial Services segment profit increased by
$35 million
, or
40%
. The increase was primarily driven by the higher revenue and higher other income from an intercompany loan from our Financial Services operations to our Manufacturing operations. The higher profit is also the result of an improved funding strategy whereby NFC has replaced certain term debt with revolving debt. This allows NFC to utilize manufacturing cash in lieu of certain borrowings on an intra-quarter basis. The increase was partially offset by the write-off of debt issuance costs and higher depreciation expense on operating leases.
32
Supplemental Information
The following tables provide additional information on truck industry retail units, market share data, order units, backlog units, and chargeout units. These tables present key metrics and trends that provide quantitative measures of our performance.
Truck Industry Retail Deliveries
The following table summarizes approximate industry retail deliveries for our Core markets, categorized by relevant class, according to Wards Auto and IHS Markit ("Polk") and our Core retail deliveries:
|
For the Years Ended October 31,
|
2019 vs 2018
|
2018 vs 2017
|
||||||||||||||||||
|
(in units)
|
2019
|
2018
|
2017
|
Change
|
% Change
|
Change
|
% Change
|
|||||||||||||
|
Core Markets (U.S. and Canada)
|
||||||||||||||||||||
|
School buses
(A)
|
33,900
|
|
33,100
|
|
35,100
|
|
800
|
|
2
|
%
|
(2,000
|
)
|
(6
|
)%
|
||||||
|
Class 6 and 7 medium trucks
|
112,200
|
|
98,800
|
|
86,100
|
|
13,400
|
|
14
|
%
|
12,700
|
|
15
|
%
|
||||||
|
Class 8 heavy trucks
|
235,700
|
|
206,400
|
|
146,200
|
|
29,300
|
|
14
|
%
|
60,200
|
|
41
|
%
|
||||||
|
Class 8 severe service trucks
|
79,700
|
|
70,300
|
|
60,600
|
|
9,400
|
|
13
|
%
|
9,700
|
|
16
|
%
|
||||||
|
Total Core Markets
|
461,500
|
|
408,600
|
|
328,000
|
|
52,900
|
|
13
|
%
|
80,600
|
|
25
|
%
|
||||||
|
Combined class 8 trucks
|
315,400
|
|
276,700
|
|
206,800
|
|
38,700
|
|
14
|
%
|
69,900
|
|
34
|
%
|
||||||
|
Navistar Core retail deliveries
|
86,800
|
|
71,400
|
|
56,700
|
|
15,400
|
|
22
|
%
|
14,700
|
|
26
|
%
|
||||||
_________________________
|
(A)
|
The School bus retail market deliveries include buses classified as B, C, and D and are being reported on a one-month lag.
|
Truck Retail Delivery Market Share
The following table summarizes our approximate retail delivery market share percentages for our Core markets, based on market-wide information from Wards Auto and Polk:
|
For the Years Ended October 31,
|
||||||||
|
2019
|
2018
|
2017
|
||||||
|
Core Markets (U.S. and Canada)
|
||||||||
|
School buses
|
35.8
|
%
|
33.2
|
%
|
31.9
|
%
|
||
|
Class 6 and 7 medium trucks
|
27.0
|
%
|
23.3
|
%
|
24.5
|
%
|
||
|
Class 8 heavy trucks
|
13.8
|
%
|
13.7
|
%
|
11.2
|
%
|
||
|
Class 8 severe service trucks
|
14.8
|
%
|
12.9
|
%
|
13.3
|
%
|
||
|
Total Core Markets
|
18.8
|
%
|
17.5
|
%
|
17.3
|
%
|
||
|
Combined class 8 trucks
|
14.1
|
%
|
13.5
|
%
|
11.8
|
%
|
||
Truck Orders, net
We define orders as written commitments received from customers and dealers during the year to purchase trucks. Net orders represent new orders received during the year less cancellations of orders made during the same year. Orders do not represent guarantees of purchases by customers or dealers and are subject to cancellation. Orders may be either sold orders, which will be built for specific customers, or stock orders, which will generally be built for dealer inventory for eventual sale to customers. These orders may be placed at our assembly plants in the U.S. and Mexico for destinations anywhere in the world and include trucks and buses. Historically, we have had an increase in net orders for stock inventory from our dealers at the end of the year due to a combination of demand and, from time to time, incentives to the dealers. Increases in stock orders typically translate to higher future chargeouts. The following table summarizes our approximate net orders for Core units:
33
|
For the Years Ended October 31,
|
2019 vs 2018
|
2018 vs 2017
|
||||||||||||||||||
|
(in units)
|
2019
|
|
2018
|
2017
|
Change
|
% Change
|
Change
|
% Change
|
||||||||||||
|
Core Markets (U.S. and Canada)
|
||||||||||||||||||||
|
School buses
|
12,600
|
|
12,800
|
|
11,000
|
|
(200
|
)
|
(2
|
)%
|
1,800
|
|
16
|
%
|
||||||
|
Class 6 and 7 medium trucks
|
23,600
|
|
34,700
|
|
21,200
|
|
(11,100
|
)
|
(32
|
)%
|
13,500
|
|
64
|
%
|
||||||
|
Class 8 heavy trucks
|
23,300
|
|
42,400
|
|
18,900
|
|
(19,100
|
)
|
(45
|
)%
|
23,500
|
|
124
|
%
|
||||||
|
Class 8 severe service trucks
|
10,300
|
|
15,000
|
|
8,800
|
|
(4,700
|
)
|
(31
|
)%
|
6,200
|
|
70
|
%
|
||||||
|
Total Core Markets
|
69,800
|
|
104,900
|
|
59,900
|
|
(35,100
|
)
|
(33
|
)%
|
45,000
|
|
75
|
%
|
||||||
|
Combined class 8 trucks
|
33,600
|
|
57,400
|
|
27,700
|
|
(23,800
|
)
|
(41
|
)%
|
29,700
|
|
107
|
%
|
||||||
Truck Backlogs
We define order backlogs ("backlogs") as orders yet to be built as of the end of the period. Our backlogs do not represent guarantees of purchases by customers or dealers and are subject to cancellation. Although backlogs are one of many indicators of market demand, other factors such as changes in production rates, internal and supplier available capacity, new product introductions, and competitive pricing actions may affect point-in-time comparisons. Backlogs exclude units in inventory awaiting additional modifications or delivery to the end customer. The following table summarizes our approximate backlog for Core units:
|
|
For the Years Ended October 31,
|
2019 vs 2018
|
2018 vs 2017
|
|||||||||||||||||
|
(in units)
|
2019
|
2018
|
2017
|
Change
|
% Change
|
Change
|
% Change
|
|||||||||||||
|
Core Markets (U.S. and Canada)
|
||||||||||||||||||||
|
School buses
|
2,100
|
|
2,400
|
|
1,700
|
|
(300
|
)
|
(13
|
)%
|
700
|
|
41
|
%
|
||||||
|
Class 6 and 7 medium trucks
|
8,900
|
|
14,500
|
|
4,600
|
|
(5,600
|
)
|
(39
|
)%
|
9,900
|
|
215
|
%
|
||||||
|
Class 8 heavy trucks
|
11,200
|
|
20,800
|
|
6,800
|
|
(9,600
|
)
|
(46
|
)%
|
14,000
|
|
206
|
%
|
||||||
|
Class 8 severe service trucks
|
6,100
|
|
7,700
|
|
2,500
|
|
(1,600
|
)
|
(21
|
)%
|
5,200
|
|
208
|
%
|
||||||
|
Total Core Markets
|
28,300
|
|
45,400
|
|
15,600
|
|
(17,100
|
)
|
(38
|
)%
|
29,800
|
|
191
|
%
|
||||||
|
Combined class 8 trucks
|
17,300
|
|
28,500
|
|
9,300
|
|
(11,200
|
)
|
(39
|
)%
|
19,200
|
|
206
|
%
|
||||||
Truck Chargeouts
We define chargeouts as trucks that have been invoiced to customers. The units held in dealer inventory represent the principal difference between retail deliveries and chargeouts. The following table summarizes our approximate worldwide chargeouts:
|
|
For the Years Ended October 31,
|
2019 vs 2018
|
2018 vs 2017
|
|||||||||||||||||
|
(in units)
|
2019
|
|
2018
|
2017
|
Change
|
% Change
|
Change
|
% Change
|
||||||||||||
|
Core Markets (U.S. and Canada)
|
||||||||||||||||||||
|
School buses
|
13,000
|
|
12,200
|
|
11,300
|
|
800
|
|
7
|
%
|
900
|
|
8
|
%
|
||||||
|
Class 6 and 7 medium trucks
|
29,200
|
|
24,300
|
|
20,900
|
|
4,900
|
|
20
|
%
|
3,400
|
|
16
|
%
|
||||||
|
Class 8 heavy trucks
|
33,100
|
|
27,800
|
|
16,800
|
|
5,300
|
|
19
|
%
|
11,000
|
|
65
|
%
|
||||||
|
Class 8 severe service trucks
|
11,900
|
|
9,600
|
|
8,300
|
|
2,300
|
|
24
|
%
|
1,300
|
|
16
|
%
|
||||||
|
Total Core Markets
|
87,200
|
|
73,900
|
|
57,300
|
|
13,300
|
|
18
|
%
|
16,600
|
|
29
|
%
|
||||||
|
Non "Core" defense
|
100
|
|
700
|
|
800
|
|
(600
|
)
|
(86
|
)%
|
(100
|
)
|
(13
|
)%
|
||||||
|
Other markets
(A)
|
19,200
|
|
9,600
|
|
10,800
|
|
9,600
|
|
100
|
%
|
(1,200
|
)
|
(11
|
)%
|
||||||
|
Total worldwide units
|
106,500
|
|
84,200
|
|
68,900
|
|
22,300
|
|
26
|
%
|
15,300
|
|
22
|
%
|
||||||
|
Combined class 8 trucks
|
45,000
|
|
37,400
|
|
25,100
|
|
7,600
|
|
20
|
%
|
12,300
|
|
49
|
%
|
||||||
_____________________________
|
(A)
|
Other markets primarily consist of Class 4/5 vehicles, Export Truck, Mexico, and post-sale Navistar Defense. Other markets include certain Class 4/5 vehicle chargeouts of 9,000 GM-branded units sold to GM for the year ended October 31, 2019.
|
34
Liquidity and Capital Resources
Consolidated cash, cash equivalents, and marketable securities
|
As of October 31,
|
|||||||||||
|
(in millions)
|
2019
|
|
2018
|
|
2017
|
||||||
|
Consolidated cash and cash equivalents
|
$
|
1,370
|
|
$
|
1,320
|
|
$
|
706
|
|
||
|
Consolidated marketable securities
|
—
|
|
101
|
|
370
|
|
|||||
|
Consolidated cash, cash equivalents, and marketable securities
|
$
|
1,370
|
|
$
|
1,421
|
|
$
|
1,076
|
|
||
|
As of October 31,
|
|||||||||||
|
(in millions)
|
2019
|
2018
|
2017
|
||||||||
|
Manufacturing operations
|
$
|
1,328
|
|
$
|
1,362
|
|
$
|
1,036
|
|
||
|
Financial Services operations
|
42
|
|
59
|
|
40
|
|
|||||
|
Consolidated cash, cash equivalents, and marketable securities
|
$
|
1,370
|
|
$
|
1,421
|
|
$
|
1,076
|
|
||
Manufacturing cash, cash equivalents, and marketable securities
Manufacturing cash, cash equivalents, and marketable securities, and Financial Services cash, cash equivalents and marketable securities are not presented in accordance with, and should not be viewed as an alternative to, GAAP. This non-GAAP financial information should be considered supplemental to, and not as a substitute for, or superior to, financial measures calculated in accordance with GAAP. However, we believe that non-GAAP reporting provides meaningful information and therefore we use it to supplement our GAAP reporting by identifying items that may not be related to the core manufacturing business. We provide this information for an additional analysis of our ability to meet our operating requirements, capital expenditures, equity investments, and financial obligations. Manufacturing cash, cash equivalents, and marketable securities represent our consolidated cash, cash equivalents, and marketable securities, which excludes cash, cash equivalents, and marketable securities of our Financial Services operations. We include marketable securities with our cash and cash equivalents when assessing our liquidity position as our investments are highly liquid in nature. Consolidated cash, cash equivalents, and marketable securities totaled
$1.4 billion
at
October 31, 2019
.
Cash Requirements
We generate cash flows for operations from the sale of trucks, buses, diesel engines, and parts, as well as from product financing provided to our dealers and retail customers by our Financial Services operations. We fund our operations and strategic plans primarily with cash, cash generated from operations, debt and equity. It is our opinion that, in the absence of significant extraordinary cash demands, our: (i) level of cash, cash equivalents, and marketable securities, (ii) current and forecasted cash flow from our Manufacturing operations and Financial Services operations, (iii) availability under various funding facilities, (iv) current and forecasted availability from various funding alliances, and (v) access to capital in the capital markets, will provide sufficient funds to meet operating requirements (including the MaxxForce Advanced EGR engine class action settlement), capital expenditures, investments, and financial obligations on both a short-term and long-term basis. Future Manufacturing operations debt obligations are expected to be met through a combination of cash generation from operations and refinancing activities. We also believe the quality of our underlying portfolio of receivables will ensure the ongoing funding from various sources and alliance partners and will permit our Financial Services operations to meet our financing requirements and those of our dealers, and retail customers.
We have capacity under our various debt arrangements to raise additional cash by incurring incremental debt. The covenants in all of our debt agreements permit us to refinance existing debt instruments as they mature. Our 4.75% Senior Secured Convertible Notes were fully repaid upon maturity in April 2019, with cash on hand.
In May 2019, NFC increased the capacity of its revolving bank credit facility from $269 million to $748 million and extended the maturity from September 2021 to May 2024. The additional capacity was used, in part, to fully repay the senior secured NFC Term Loan balance of $398 million.
In April 2019, we increased the capacity of our retail accounts funding facility from $100 million to $150 million, and further increased the capacity to $200 million in October 2019, reverting to $150 million in November 2019. Also in April 2019, we temporarily increased the capacity of our wholesale variable funding facility from $350 million to $550 million until the issuance of $300 million of two-year investor notes in June 2019. The issuance replaced the $250 million of investor notes that matured in June 2019.
35
Our Manufacturing operations sold $10.5 billion,
$8.5 billion and $7.4 billion of wholesale notes and accounts receivable to our Financial Services operations during the
years ended October 31, 2019
, 2018 and 2017, respectively. The total outstanding balance of wholesale notes and accounts receivable purchased was $1.7 billion as of both
October 31, 2019
and 2018.
NFC paid a $20 million dividend to NI in October 2019, and total loans outstanding from our Financial Services operations to our Manufacturing operations were $281 million and $212 million as of
October 31, 2019
and 2018, respectively. Included is an unsecured loan balance with NFC of $200 million and $150 million, respectively. Also included in loans made from Financial Services operations to Manufacturing operations is an intercompany financing from NFC that is secured by a first priority lien on used truck inventory, and certain related assets (the "Intercompany Used Truck Loan"). As of
October 31, 2019
and 2018, our borrowings under the Intercompany Used Truck Loan were $25 million and zero, respectively. Our Manufacturing operations also have an intercompany revolving loan agreement (the "Intercompany Revolving Loan") with our captive insurance company under our Financial Services segment. As of
October 31, 2019
and 2018, our borrowings under the Intercompany Revolving Loan were $16 million and
$7 million
, respectively.
Our Financial Services operations in Mexico extend working capital loans to our Manufacturing operations in Mexico for orders received. As of
October 31, 2019
and
October 31, 2018
, the borrowings of our Manufacturing operations in Mexico under these loan agreements were $40 million and
$55 million
, respectively.
See Note 10,
Debt
, to the accompanying consolidated financial statements for a description of our credit facilities and long-term debt obligations.
Cash Flow Overview
|
Year Ended October 31, 2019
|
|||||||||||
|
(in millions)
|
Manufacturing
Operations (A) |
Financial Services Operations and Adjustments
(A)
|
Consolidated Statement of Cash Flows
|
||||||||
|
Net cash provided by operating activities
|
$
|
395
|
|
$
|
55
|
|
$
|
450
|
|
||
|
Net cash provided by (used in) investing activities
|
70
|
|
(138
|
)
|
(68
|
)
|
|||||
|
Net cash provided by (used in) financing activities
|
(373
|
)
|
115
|
|
(258
|
)
|
|||||
|
Effect of exchange rate changes on cash, cash equivalents and restricted cash
|
(9
|
)
|
(3
|
)
|
(12
|
)
|
|||||
|
Increase in cash, cash equivalents and restricted cash
|
83
|
|
29
|
|
112
|
|
|||||
|
Cash, cash equivalents and restricted cash at beginning of the year
|
1,295
|
|
150
|
|
1,445
|
|
|||||
|
Cash, cash equivalents and restricted cash at end of the year
|
$
|
1,378
|
|
$
|
179
|
|
$
|
1,557
|
|
||
|
|
Year Ended October 31, 2018
|
||||||||||
|
(in millions)
|
Manufacturing
Operations (A) |
|
Financial Services Operations and Adjustments
(A)
|
|
Consolidated Statement of Cash Flows
|
||||||
|
Net cash provided by (used in) operating activities
|
$
|
417
|
|
$
|
(150
|
)
|
$
|
267
|
|
||
|
Net cash provided by (used in) investing activities
|
66
|
|
(132
|
)
|
(66
|
)
|
|||||
|
Net cash provided by financing activities
|
137
|
|
277
|
|
414
|
|
|||||
|
Effect of exchange rate changes on cash, cash equivalents and restricted cash
|
(15
|
)
|
5
|
|
(10
|
)
|
|||||
|
Increase in cash, cash equivalents and restricted cash
|
605
|
|
—
|
|
605
|
|
|||||
|
Cash, cash equivalents and restricted cash at beginning of the year
|
690
|
|
150
|
|
840
|
|
|||||
|
Cash, cash equivalents and restricted cash at end of the year
|
$
|
1,295
|
|
$
|
150
|
|
$
|
1,445
|
|
||
36
|
Year Ended October 31, 2017
|
|||||||||||
|
(in millions)
|
Manufacturing
Operations (A) |
Financial Services Operations and Adjustments
(A)
|
Consolidated Statement of Cash Flows
|
||||||||
|
Net cash provided by operating activities
|
$
|
10
|
|
$
|
99
|
|
$
|
109
|
|
||
|
Net cash used in investing activities
|
(487
|
)
|
(33
|
)
|
(520
|
)
|
|||||
|
Net cash provided by (used in) financing activities
|
389
|
|
(51
|
)
|
338
|
|
|||||
|
Effect of exchange rate changes on cash, cash equivalents and restricted cash
|
(5
|
)
|
2
|
|
(3
|
)
|
|||||
|
Increase (decrease) in cash, cash equivalents and restricted cash
|
(93
|
)
|
17
|
|
(76
|
)
|
|||||
|
Cash, cash equivalents and restricted cash at beginning of the year
|
783
|
|
133
|
|
916
|
|
|||||
|
Cash, cash equivalents and restricted cash at end of the year
|
$
|
690
|
|
$
|
150
|
|
$
|
840
|
|
||
_________________________
|
(A)
|
Manufacturing operations cash flows and Financial Services operations cash flows are not presented in accordance with, and should not be viewed as an alternative to, GAAP. This non-GAAP financial information should be considered supplemental to, and not as a substitute for, or superior to, financial measures calculated in accordance with GAAP. However, we believe that non-GAAP reporting provides meaningful information and therefore we use it to supplement our GAAP reporting by identifying items that may not be related to the Core manufacturing business. Management often uses this information to assess and measure the performance and liquidity of our operating segments. Our Manufacturing operations, for this purpose, include our Truck segment, Global Operations segment, Parts segment, and Corporate items which include certain eliminations. The reconciling differences between these non-GAAP financial measures and our GAAP consolidated financial statements in Item 1,
Financial Statements and Supplementary Data
, are our Financial Services operations and adjustments required to eliminate certain intercompany transactions between Manufacturing operations and Financial Services operations. Our Financial Services operations cash flows are presented consistent with their treatment in our
Consolidated Statements of Cash Flows
and may not be consistent with how they would be treated on a stand-alone basis. We have chosen to provide this supplemental information to allow additional analysis, to illustrate the respective cash flows giving effect to the equity basis cash flow shown above, and to provide an additional measure of performance and liquidity.
|
Manufacturing Operations
Manufacturing Operations Cash Flow from Operating Activities
Cash provided by operating activities was
$395 million
,
$417 million
and
$10 million
in
2019
,
2018
and
2017
, respectively. The lower amount of cash generation from operating activities in 2019 compared to 2018 was primarily attributable to decreases in accounts payable and other noncurrent liabilities and a higher increase in other current assets partially offset by a decrease in inventories, higher collections of accounts receivable, a decrease in intercompany receivables from Financial Services and a dividend received from Financial Services. The higher amount of cash generation from operating activities in 2018 compared to 2017 was primarily attributable to higher net income, lower increases in accounts receivable, other current and noncurrent assets, and net payables with our Financial Services operations, increases in accounts payable and other current and noncurrent liabilities, partially offset by higher inventories.
Cash paid for interest, net of amounts capitalized, was
$196 million
,
$226 million
, and
$223 million
in
2019
,
2018
, and
2017
, respectively.
We paid
$203 million
,
$186 million
, and
$193 million
for
2019
,
2018
, and
2017
respectively, for costs associated with postretirement benefits including pension and postretirement health care expenses for employees and surviving spouses and dependents, the funding of trust assets, and other postretirement payments. These postretirement benefits did not include any cash payments made from trust assets to beneficiaries.
Manufacturing Operations Cash Flow from Investing Activities
Cash provided by investing activities was
$70 million
and
$66 million
in
2019
and
2018
, respectively, as compared to cash used in investing activities of
$487 million
in
2017
. The net increase in cash flow from investing activities in 2019 compared to 2018 was primarily attributable to decreases in the purchase of marketable securities and equipment leased to others, higher maturities of marketable securities and proceeds from the sale of a majority interest in Navistar Defense and the sale of our joint venture in China with JAC partially offset by an increase in capital expenditures and lower net liquidations of marketable securities. The net increase in cash flow from investing activities in 2018 compared to 2017 was primarily attributable to lower purchases and higher maturities of marketable securities partially offset by a decrease in the sale of marketable securities, an increase in capital expenditures, higher purchases of equipment leased to others, and lower proceeds from sales of property and equipment. During
2019
, sales of marketable securities totaled
zero
and maturities of marketable securities totaled
$102 million
, compared with
$460 million
of sales and
$60 million
of maturities of marketable securities and
$652 million
of sales and
$28 million
of maturities of marketable securities during
2018
and
2017
, respectively.
37
Manufacturing Operations Cash Flow from Financing Activities
Cash used in financing activities was
$373 million
, as compared to cash provided by financing activities of
$137 million
and
$389 million
in
2019
,
2018
and
2017
, respectively. The net decrease in cash flow from financing activities in 2019 compared to 2018 was primarily attributable to the maturity and repayment of our 4.75% Senior Subordinated Convertible Notes in April 2019, lower proceeds from the issuance of long-term debt, lower proceeds from loans made from Financial Services operations to Manufacturing operations and lower proceeds from finance lease obligations, partially offset by lower payments on long-term debt and a decrease in the amount of debt issuance costs. The net decrease in cash flow from financing activities in 2018 compared to 2017 was primarily attributable to higher principal repayments of long-term debt, a decrease in the amount of proceeds received from the issuance of common stock and higher debt issuance costs, partially offset by higher proceeds from the issuance of long-term debt, a decrease in the amount of stock issuance costs and funding under the Intercompany Loan.
Financial Services Operations
Financial Services Operations and Adjustments to Cash Flow from Operating Activities
Cash provided by operating activities was
$55 million
in
2019
, compared to cash used in operating activities of
$150 million
in
2018
, and compared to cash provided by operating activities of
$99 million
in
2017
. The net increase in cash provided by operating activities in 2019 was primarily due to the increase in segment profit realized from an improved funding strategy, partially offset by a reduction in intercompany finance fees. The increase in segment profit was partially offset by an increase in the balance of finance receivables funded, a dividend paid to the Manufacturing operations, and the repayment of intercompany payables to the Manufacturing operations. The net decrease in cash provided by operating activities in 2018 compared to 2017 was primarily due to the increase in the balance of finance receivables funded.
Cash paid for interest, net of amounts capitalized, was
$91 million
,
$80 million
, and
$71 million
in
2019
,
2018
, and
2017
, respectively.
Financial Services Operations and Adjustments to Cash Flow from Investing Activities
Cash used in investing activities was
$138 million
,
$132 million
and
$33 million
in
2019
,
2018
, and
2017
, respectively. In
2019
and
2018
, the increases in cash used in investing activities was primarily due to the increase in purchases of equipment leased to others, partially offset by an increase in proceeds from the sale of leased equipment in 2019.
Financial Services Operations and Adjustments to Cash Flow from Financing Activities
Cash provided by financing activities was
$115 million
and
$277 million
in
2019
and
2018
, respectively, compared to cash used in financing activities of
$51 million
in
2017
. The decrease in cash provided by financing activities in 2019 was primarily due to a lower increase in borrowing levels used to fund finance receivables and purchases of equipment leased to others, and the repayment of intercompany payables to our Manufacturing operations. The net increase in cash provided by financing activities in 2018 was primarily due to higher borrowing levels used to fund the increase in finance receivables and purchases of equipment leased to others, partially offset by repayments of debt from an increase in intercompany payables to our Manufacturing operations.
Debt
Funding of Financial Services
The Financial Services segment has traditionally relied upon secured borrowings on finance receivables, short and long-term bank borrowings, medium and long-term debt, and commercial paper in Mexico to fund dealer and retail customer financing. As of
October 31, 2019
, our funding consisted of asset-backed securitization debt of
$991 million
, bank borrowings and revolving credit facilities of
$1,059 million
, commercial paper of
$84 million
, and borrowings of
$122 million
secured by operating and finance leases.
We use a number of SPEs to securitize and sell receivables. Navistar Financial Securities Corporation ("NFSC") finances wholesale notes, International Truck Leasing Corporation ("ITLC") finances operating leases and some finance leases, and Truck Retail Accounts Corporation ("TRAC") finances retail accounts.
Our Mexican financial services operations include Navistar Financial, S.A. de C.V., Sociedad Financiera de Objeto Multiple, Entidad Regulada ("NFM"), which issues debt to provide vehicle financing to our dealers and retail customers in Mexico.
38
The following table sets forth the utilization under our bank credit and revolving funding facilities in place as of
October 31, 2019
:
|
Company
|
Instrument Type
|
Total
Amount |
Purpose of Funding
|
Amount
Utilized |
Matures or Expires
|
|||||||||
|
(in millions)
|
|
|
|
|||||||||||
|
NFSC
|
Wholesale note trust
|
$
|
950
|
|
Eligible wholesale notes
|
$
|
825
|
|
2020-2021
|
|||||
|
NFC
|
Credit agreement
(A)
|
748
|
|
Finance receivables and general corporate purposes
|
623
|
|
2024
|
|||||||
|
NFM
|
Bank lines
|
618
|
|
Finance receivables and general corporate purposes
|
437
|
|
2020-2025
|
|||||||
|
TRAC
|
Revolving retail accounts
|
200
|
|
Eligible retail accounts
|
157
|
|
2020
|
|||||||
______________________
|
(A)
|
NFM can borrow up to $100 million, if not used by NFC.
|
We are obligated under certain agreements with public and private lenders of NFC to maintain the subsidiary's income before interest expense, capital contributions from NI, and income taxes at not less than 125% of its total interest expense. Under these agreements, if NFC's consolidated income before interest expense, capital contributions from NI, and income taxes is less than 125% of its interest expense, NI must make a capital contribution to NFC to achieve the required ratio. No such payments were required for the years ended October 31, 2019, 2018, and 2017.
Derivative Instruments
We use derivative financial instruments as part of our overall interest rate, foreign currency, and commodity risk management strategies to reduce our interest rate exposure, to potentially increase the return on invested funds, to reduce exchange rate risk for transactional exposures denominated in currencies other than the functional currency, and to minimize commodity price volatility. The fair values of these derivatives are recorded as assets or liabilities on a gross basis in our
Consolidated Balance Sheets
. For more information on derivatives and related market risks, see Item 7A,
Quantitative and Qualitative Disclosures about Market Risk.
Capital Resources
We expend capital to support our operating and strategic plans. Such expenditures include investments to meet regulatory and emissions requirements, maintain capital assets, develop new products or improve existing products, and to enhance capacity or productivity. Many of the associated projects have long lead-times and require commitments in advance of actual spending.
Business units provide their estimates of costs of capital projects, expected returns, and benefits to senior management. Those projects are evaluated from the perspective of expected return and strategic importance, with a capital expenditure goal of approximately
$225 million
in 2020, exclusive of capital expenditures for equipment leased to others. See Note 10,
Debt
, to the accompanying consolidated financial statements.
Non-GAAP Financial Performance Measures
EBITDA, Adjusted EBITDA and Adjusted Net Income, which exclude certain identified items that we do not consider to be part of our ongoing business, are not in accordance with, and should not be viewed as an alternative to, GAAP. This non-GAAP financial information should be considered supplemental to, and not as a substitute for, or superior to, financial measures calculated in accordance with GAAP.
We believe these non-GAAP measures provide meaningful information about the performance of our business and therefore we use them to supplement our GAAP reporting. We believe that they improve the comparability of year-to-year results and are representative of our underlying performance. Management uses this information to assess and measure the performance of our operating segments. We have chosen to provide this supplemental information for an additional analysis of our operating results, to illustrate the results of operations giving effect to the non-GAAP adjustments shown in the below reconciliations, and to provide additional measures of performance.
39
EBITDA reconciliation:
______________________
|
For the Years Ended October 31,
|
|||||||||||
|
(in millions)
|
2019
|
|
2018
|
2017
|
|||||||
|
Income from continuing operations attributable to NIC, net of tax
|
$
|
221
|
|
|
$
|
340
|
|
$
|
29
|
|
|
|
Plus:
|
|
|
|
|
|
||||||
|
Depreciation and amortization expense
|
193
|
|
|
211
|
|
223
|
|
||||
|
Manufacturing interest expense
(A)
|
207
|
|
|
235
|
|
265
|
|
||||
|
Adjusted for:
|
|
|
|
|
|
||||||
|
Income tax expense
|
(19
|
)
|
|
(52
|
)
|
(10
|
)
|
||||
|
EBITDA
|
$
|
640
|
|
|
$
|
838
|
|
$
|
527
|
|
|
|
(A)
|
Manufacturing interest expense is the net interest expense primarily generated for borrowings that support the manufacturing and corporate operations, adjusted to eliminate intercompany interest expense with our Financial Services segment. The following table reconciles Manufacturing interest expense to the consolidated interest expense.
|
|
For the Years Ended October 31,
|
|||||||||||
|
(in millions)
|
2019
|
|
2018
|
2017
|
|||||||
|
Interest expense
|
$
|
312
|
|
|
$
|
327
|
|
$
|
351
|
|
|
|
Less: Financial Services interest expense
|
105
|
|
|
92
|
|
86
|
|
||||
|
Manufacturing interest expense
|
$
|
207
|
|
|
$
|
235
|
|
$
|
265
|
|
|
Adjusted EBITDA Reconciliation:
|
For the Years Ended October 31,
|
|||||||||||
|
(in millions)
|
2019
|
2018
|
2017
|
||||||||
|
EBITDA
(reconciled above)
|
$
|
640
|
|
|
$
|
838
|
|
$
|
527
|
|
|
|
Adjusted for significant items of:
|
|
|
|
|
|
||||||
|
Adjustments to pre-existing warranties
(A)
|
3
|
|
|
(9
|
)
|
(1
|
)
|
||||
|
Asset impairment charges
(B)
|
7
|
|
|
14
|
|
13
|
|
||||
|
Restructuring of manufacturing operations
(C)
|
14
|
|
(1
|
)
|
13
|
|
|||||
|
MaxxForce Advanced EGR engine lawsuits
(D)
|
129
|
|
1
|
|
31
|
|
|||||
|
Gain on sale
(E)
|
(56
|
)
|
—
|
|
(6
|
)
|
|||||
|
Debt refinancing charges
(F)
|
6
|
|
46
|
|
5
|
|
|||||
|
Pension settlement
(G)
|
142
|
|
9
|
|
—
|
|
|||||
|
Settlement gain
(H)
|
(3
|
)
|
(72
|
)
|
—
|
|
|||||
|
Total adjustments
|
242
|
|
|
(12
|
)
|
55
|
|
||||
|
Adjusted EBITDA
|
$
|
882
|
|
|
$
|
826
|
|
$
|
582
|
|
|
40
Adjusted Net Income attributable to NIC:
____________________
|
For the Years Ended October 31,
|
|||||||||||
|
(in millions)
|
2019
|
2018
|
2017
|
||||||||
|
Net income from continuing operations attributable to NIC
|
$
|
221
|
|
$
|
340
|
|
$
|
29
|
|
||
|
Adjusted for significant items of:
|
|||||||||||
|
Adjustments to pre-existing warranties
(A)
|
3
|
|
(9
|
)
|
(1
|
)
|
|||||
|
Asset impairment charges
(B)
|
7
|
|
14
|
|
13
|
|
|||||
|
Restructuring of manufacturing operations
(C)
|
14
|
|
(1
|
)
|
13
|
|
|||||
|
MaxxForce Advanced EGR engine lawsuits
(D)
|
129
|
|
1
|
|
31
|
|
|||||
|
Gain on sale
(E)
|
(56
|
)
|
—
|
|
(6
|
)
|
|||||
|
Debt refinancing charges
(F)
|
6
|
|
46
|
|
5
|
|
|||||
|
Pension settlement
(G)
|
142
|
|
9
|
|
—
|
|
|||||
|
Settlement gain
(H)
|
(3
|
)
|
(72
|
)
|
—
|
|
|||||
|
Total adjustments
|
242
|
|
(12
|
)
|
55
|
|
|||||
|
Tax effect
(I)
|
(40
|
)
|
(1
|
)
|
10
|
|
|||||
|
Adjusted net income attributable to NIC
|
$
|
423
|
|
$
|
327
|
|
$
|
94
|
|
||
|
(A)
|
Adjustments to pre-existing warranties reflect changes in our estimate of warranty costs for products sold in prior periods. Such adjustments typically occur when claims experience deviates from historical and expected trends. Our warranty liability is generally affected by component failure rates, repair costs, and the timing of failures. Future events and circumstances related to these factors could materially change our estimates and require adjustments to our liability. In addition, new product launches require a greater use of judgment in developing estimates until historical experience becomes available.
|
|
(B)
|
During 2019, we recorded
$7 million
of asset impairment charges relating to certain assets under operating leases in our Truck segment. During 2018, we recorded
$14 million
of impairment charges related to the exit of our railcar business in Cherokee, Alabama, certain long-lived assets and certain assets under operating leases in our Truck and Financial Services segments. During 2017, we recorded $13 million of asset impairment charges in our Truck segment relating to assets held for sale of our Conway, Arkansas fabrication business and for certain assets under operating leases.
|
|
(C)
|
During 2019, we recorded charges of $14 million primarily related to cost reduction actions recorded in
Costs of product sold
and
Restructuring charges
in our
Global Operations segment
.
During 2018, we recognized a benefit of $1 million related to adjustments for restructuring charges in our Truck, Global Operations and Corporate segments. During 2017, we recorded charges of $13 million primarily attributable to $41 million of charges related to our plan to cease production at our Melrose Park Facility, a net benefit of $36 million related to the resolution of the closing agreement and wind up charges for our Chatham, Ontario plant, and the release of $1 million in other postretirement benefit liabilities in connection with the sale of our fabrication business in Conway, Arkansas. We also recorded $6 million of restructuring charges in Brazil related to cost reduction actions consisting of personnel costs for employee separation and related benefits.
|
|
(D)
|
During 2019, we recognized a net charge of
$129 million
related to the MaxxForce Advanced EGR engine class action settlement and related litigation in our Truck segment. During 2018, we recognized a charge of $1 million for a jury verdict related to the MaxxForce Advanced EGR engine lawsuits in our Truck segment. During 2017, we recognized a charge of $31 million related to that same jury verdict in our Truck segment.
|
|
(E)
|
During 2019, we recognized a gain of $51 million related to the sale of a majority interest in the Navistar Defense business in our Truck segment, and a gain of $5 million related to the sale of our joint venture in China with JAC in our Global Operations segment. During 2017, we recognized a gain of $6 million related to the sale of a business line in our Parts segment.
|
|
(F)
|
During 2019, we recorded a charge of
$6 million
for the write-off of debt issuance costs and discounts associated with the NFC Term Loan. During 2018, we recorded a charge of $46 million for the write off of debt issuance costs and discounts associated with the repurchase of our 8.25% Senior Notes and the refinancing of our previously existing Term Loan. During 2017, we recorded a charge of $5 million related to third party fees and debt issuance costs associated with the replacement of our Term Loan with our Term Loan Credit Agreement and the refinancing of the revolving portion of the NFC bank credit facility in our Financial Services segment.
|
|
(G)
|
During 2019 and 2018, we purchased group annuity contracts for certain retired pension plan participants resulting in plan remeasurements. As a result, we recorded pension settlement charges of
$142 million
and
$9 million
, respectively, in
Other expense, net
in Corporate.
|
|
(H)
|
During 2019, we recorded interest income of
$3 million
in
Other expense, net
derived from the prior year settlement of a business economic loss claim. During 2018, we settled a business economic loss claim relating to our Alabama engine manufacturing facility from the Deepwater Horizon Settlement Program. As a result, we recorded the net present value of the settlement of $70 million and related interest income of $2 million in
Other expense, net
.
|
|
(I)
|
Tax effect is calculated by excluding the tax impact of the non-GAAP adjustments from the tax provision calculations.
|
41
Pension and Other Postretirement Benefits
Our pension plans are funded by contributions made from Company assets in accordance with applicable U.S. and Canadian government regulations. The regulatory funding requirements are computed using an actuarially determined funded status, which is determined using assumptions that often differ from assumptions used to measure the funded status for GAAP. U.S. funding targets are determined by rules promulgated under the PPA. The PPA additionally requires underfunded plans to achieve 100% funding over a period of time. From time to time, we have discussions with and receive requests for certain information from the Pension Benefit Guaranty Corporation ("PBGC"). The PBGC was created by ERISA to encourage the continuation and maintenance of private-sector defined benefit pension plans, provide timely and uninterrupted payment of pension benefits, and keep pension insurance premiums at a minimum. In July 2012, the Moving Ahead for Progress in the 21
st
Century Act was signed into law, impacting the minimum funding requirements for pension plans, but not otherwise impacting our accounting for pension benefits. In August 2014, the Highway and Transportation Funding Act of 2014, which included an extension of pension funding interest rate relief, was signed into law. The Bi-Partisan Budget Act of 2015 was signed into law in November of 2015 and provided for further extension of interest rate relief. These legislative measures will reduce our funding requirements over the next three years.
In
2019
and
2018
, we contributed
$140 million
and
$132 million
, respectively, to our U.S. and Canadian pension plans (the "Plans") to meet regulatory minimum funding requirements. In
2020
we expect to contribute approximately
$190 million
to meet the minimum required contributions for all plans. Future contributions are dependent upon a number of factors, principally the changes in values of plan assets, changes in interest rates, and the impact of any future funding relief. We currently expect that from
2021
through
2023
, we will be required to contribute approximately
$140 million
to
$175 million
per year to the Plans, depending on asset performance and discount rates.
Our contributions to other post-employment benefit ("OPEB") plans totaled
$1 million
in 2019 and 2018. Other postretirement benefit obligations, such as retiree medical, are primarily funded in accordance with a 1993 settlement agreement (the "1993 Settlement Agreement") between us, our employees, retirees, and collective bargaining organizations, which eliminated certain benefits provided prior to that date and provided for cost sharing between us and participants in the form of premiums, co-payments, and deductibles. We expect to contribute
$1 million
to our OPEB plans during 2020.
As part of the 1993 Settlement Agreement, a Base Program Trust was established in June 1993 to provide a vehicle for funding the health care liability through our contributions and retiree premiums. A separate independent Retiree Supplemental Benefit Program was also established, which included our contribution of Class B Common Stock, originally valued at $513 million, to potentially reduce retiree premiums, co-payments, and deductibles and provide additional benefits in subsequent periods. In addition to the Base Program Trust, we are contingently obligated to make profit sharing contributions to the Retiree Supplemental Benefit Trust to potentially improve upon the basic benefits provided through the Base Program Trust. These profit sharing contributions are determined by means of a calculation established through the 1993 Settlement Agreement. In 2019, we recorded $21 million of profit sharing accruals based on the operating performance of the entities that are included in the determination of qualifying profits which will be paid in the first quarter of 2020. In 2018, we recorded $30 million of profit sharing accruals based on the operating performance of the entities that are included in the determination of qualifying profits which was paid in the first quarter of 2019. There were no profit sharing contributions to the Retiree Supplemental Benefit Trust during the years ended October 31, 2018 and 2017.
The funded status of our plans is derived by subtracting the actuarially-determined present value of the projected benefit obligations from the fair value of plan assets at year end.
The underfunded status of our pension plans on a GAAP basis increased
$152 million
during 2019 primarily due to a decrease in the discount rate partially offset by cash contributions and higher than expected asset returns. Our actual return on assets during
2019
was approximately
13.0%
for the U.S. pension plans. The weighted average discount rates used to measure the postretirement benefit obligation ("PBO") were
3.1%
and
4.4%
at
October 31, 2019
and
2018
, respectively.
The underfunded status of our health and life insurance benefits decreased by
$144 million
. This was primarily driven by favorable claims experience and updated per capita cost assumptions partially offset by a decrease in the discount rate.
We continue to seek opportunities to control our pension and other postretirement benefits expenses.
For more information, see Note 11,
Postretirement Benefits
, to the accompanying consolidated financial statements.
42
Off-Balance Sheet Arrangements
We enter into various arrangements not recognized in our
Consolidated Balance Sheets
that have or could have an effect on our financial condition, results of operations, liquidity, capital expenditures, or capital resources. The principal off-balance sheet arrangements that we enter into are guarantees that could obligate us to make future payments if the primary entity fails to perform under its contractual obligations. These include residual value guarantees, for which our losses are generally capped, stand-by letters of credit and surety bonds, credit and purchase commitments and indemnifications. We have recognized liabilities for some of these guarantees in our
Consolidated Balance Sheets
as they meet recognition and measurement provisions. In addition to the liabilities that have been recognized, we are contingently liable for other potential losses under various guarantees that are not recognized in our
Consolidated Balance Sheets
. We do not believe claims that may be made under such guarantees would have a material effect on our financial condition, results of operations, or cash flows. For more information, see Note 14
, Commitments and Contingencies,
to the accompanying consolidated financial statements.
Contractual Obligations
The following table provides aggregated information on our outstanding contractual obligations as of
October 31, 2019
:
|
|
Payments Due by Year Ending October 31,
|
||||||||||||||||||
|
(in millions)
|
Total
|
2020
|
2021-2022
|
2023-2024
|
2025+
|
||||||||||||||
|
Type of contractual obligation:
|
|
|
|
|
|
||||||||||||||
|
Long-term debt obligations
(A)
|
$
|
5,158
|
|
$
|
855
|
|
$
|
764
|
|
$
|
720
|
|
$
|
2,819
|
|
||||
|
Interest on long-term debt
(B)
|
1,433
|
|
272
|
|
445
|
|
400
|
|
316
|
|
|||||||||
|
Financing arrangements
(C)
|
10
|
|
5
|
|
5
|
|
—
|
|
—
|
|
|||||||||
|
Capital lease obligations
(D)
|
2
|
|
1
|
|
1
|
|
—
|
|
—
|
|
|||||||||
|
Operating lease obligations
(E)
|
149
|
|
37
|
|
50
|
|
31
|
|
31
|
|
|||||||||
|
Purchase obligations
(F)
|
180
|
|
33
|
|
99
|
|
40
|
|
8
|
|
|||||||||
|
Total
|
$
|
6,932
|
|
$
|
1,203
|
|
$
|
1,364
|
|
$
|
1,191
|
|
$
|
3,174
|
|
||||
_____________________
|
(A)
|
Excludes offsetting discounts and issuance costs of $41 million and Financed Lease Obligations of $60 million. For more information, see Note 10,
Debt,
to the accompanying consolidated financial statements.
|
|
(B)
|
Amounts represent estimated contractual interest payments on outstanding debt. Rates in effect as of
October 31, 2019
are used for variable rate debt. For more information, see Note 10,
Debt,
to the accompanying consolidated financial statements.
|
|
(C)
|
Financing arrangements include $1 million of interest obligations.
|
|
(D)
|
We lease many of our facilities as well as other property and equipment under capital leases in the normal course of business, including
zero
of interest obligations. For more information, see Note 7,
Property and Equipment
,
Net,
to the accompanying consolidated financial statements.
|
|
(E)
|
Lease obligations for facility closures are included in operating leases. Future operating lease obligations are not recognized in our
Consolidated Balance Sheets
. For more information, see Note 7,
Property and Equipment
,
Net,
to the accompanying consolidated financial statements.
|
|
(F)
|
Purchase obligations include various commitments in the ordinary course of business that would include the purchase of goods or services which are not recognized in our
Consolidated Balance Sheets
. We also include certain contractual obligations recognized in our
Consolidated Balance Sheets
for which payments will be made beyond the next year.
|
Due to the uncertainty with respect to the timing of cash payments associated with the settlement of audits with taxing authorities and because of existing net operating loss carryforwards, the preceding table excludes uncertain tax positions of
$21 million
. We do not expect to make significant payments of these liabilities within the next year. For additional information, see Note 12,
Income Taxes
, to the accompanying consolidated financial statements.
In addition to the above contractual obligations, we are also required to fund our Plans in accordance with the requirements of the PPA. As such, we expect to contribute approximately
$190 million
in
2020
to meet the minimum required contributions for all Plans. We currently expect that from
2021
through
2023
, we will be required to contribute
$140 million
to
$175 million
per year to the Plans, depending on asset performance and discount rates in the next several years. For additional information, see Note 11,
Postretirement Benefits
, to the accompanying consolidated financial statements.
43
Other Information
Income Taxes
We file a consolidated U.S. federal income tax return for NIC and its eligible domestic subsidiaries. Our non-U.S. subsidiaries file income tax returns in their respective local jurisdictions. We account for income taxes under the asset and liability method. Deferred tax assets and liabilities are recognized for tax benefit carryforwards and the future tax consequences attributable to temporary differences between the financial statement carrying amounts of existing assets and liabilities and their respective tax bases. Deferred tax liabilities and assets at the end of each period are determined using enacted tax rates.
As of
October 31, 2019
and
2018
, we had deferred tax asset valuation allowances of
$2.0 billion
and
$2.2 billion
, respectively. A valuation allowance is required to be established or maintained when, based on currently available information, it is more likely than not that all or a portion of a deferred tax asset will not be realized. The guidance on accounting for income taxes provides that important factors in determining whether a deferred tax asset will be realized are whether there has been sufficient taxable income in recent years and whether sufficient taxable income is expected in future years in order to utilize the deferred tax asset.
We believe that our evaluation of deferred tax assets and the need for a valuation allowance against such assets involve critical accounting estimates because they are subject to, among other things, estimates of future taxable income in the U.S. and in non-U.S. tax jurisdictions. These estimates are susceptible to change and dependent upon events that may or may not occur. Our assessment of the need for a valuation allowance is material to the assets reported on our
Consolidated Balance Sheets
and changes in the valuation allowance may be material to our results of operations. We intend to continue to assess our valuation allowance in accordance with the guidance on accounting for income taxes.
We may recognize the tax benefit from an uncertain tax position only if it is more likely than not that the tax position will be sustained on examination by taxing authorities, based on the technical merits of the position. The tax benefits recognized in the financial statements from such a position are measured based on the largest benefit that has a greater than fifty percent likelihood of being realized upon ultimate settlement.
We recognize interest and penalties related to uncertain tax positions as part of
Income tax expense.
Total interest and penalties related to our uncertain tax positions resulted in income tax expense of less than
$1 million
and income tax benefits of
$1 million
and
$6 million
for the years ended
October 31, 2019
,
2018
, and
2017
respectively.
We released $14 million of uncertain tax positions based on administrative practice and precedents of relevant tax authorities in 2017.
As of
October 31, 2019
and
2018
, the amount of liability for uncertain tax positions was
$21 million
and
$27 million
, respectively. If these unrecognized tax benefits are recognized, all would impact our effective tax rate, except for positions for which we maintain a full valuation allowance against certain deferred tax assets. In this case, the effect may be in the form of an increase in the deferred tax asset related to our net operating loss carryforwards, which would be offset by a full valuation allowance. While it is probable that the liability for unrecognized tax benefits may increase or decrease during the next twelve months, we do not expect any such change would have a material effect on our financial condition, results of operations, or cash flows.
We apply the intraperiod tax allocation rules to allocate income taxes among continuing operations, discontinued operations, other comprehensive income and additional paid-in capital when we meet the criteria as prescribed in the guidance.
Environmental Matters
We have been named a potentially responsible party ("PRP"), in conjunction with other parties, in a number of cases arising under an environmental protection law, the Comprehensive Environmental Response, Compensation, and Liability Act, popularly known as the "Superfund" law. These cases involve sites that allegedly received wastes from current or former Company locations. Based on information available to us which, in most cases, consists of data related to quantities and characteristics of material generated at current or former Company locations, material allegedly shipped by us to these disposal sites, as well as cost estimates from PRPs and/or federal or state regulatory agencies for the cleanup of these sites, a reasonable estimate is calculated of our share, if any, of the probable costs and accruals and is recorded in our consolidated financial statements. These accruals are generally recognized no later than completion of the remedial feasibility study and are not discounted to their present value. We review all accruals on a regular basis and believe that, based on these calculations, our share of the potential additional costs for the cleanup of each site will not have a material effect on our financial condition, results of operations, or cash flows.
44
In addition, other sites formerly owned by us or where we are currently operating have been identified as having soil and groundwater contamination. While investigations and cleanup activities continue at these and other sites, we believe that we have appropriate accruals to cover costs to complete the cleanup of all sites.
Impact of Environmental Regulation
Government regulation related to climate change is under consideration at the U.S. federal and state levels. Because our products use fossil fuels, they may be impacted indirectly due to regulation, such as a cap and trade program, affecting the cost of fuels. The United States Environmental Protection Agency ("EPA") and National Highway Traffic Safety Administration ("NHTSA") issued final rules for greenhouse gas ("GHG") phase 1 emissions and fuel economy in 2011, which rules were fully implemented in model year 2017. We are complying with these rules through use of existing technologies and implementation of emerging technologies as they become available. The EPA and NHTSA adopted a final rule in October 2016 with the next phase of federal GHG emission and fuel economy regulations. This rule contains more stringent emissions levels for engines and vehicles and will take effect in model year 2021 and be implemented in three stages culminating in model year 2027. Canada has finalized a heavy duty phase 2 GHG rulemaking, which is substantially similar to EPA regulations with more stringent requirements for heavy haul tractors.
In December 2014, California adopted GHG emission rules for heavy duty vehicles equivalent to EPA phase 1 rules and is in the process of adopting its phase 2 equivalent rules. In 2014, California also adopted an optional lower emission standard for oxides of nitrogen ("NOx") in California. California has stated its intention to lower NOx standards for California-certified engines and has requested that the EPA lower its standards. In June 2016, several regional air quality management districts in California and other states, as well as the environmental agencies for several states, petitioned the EPA to adopt lower NOx emission standards for on-road heavy duty trucks and engines. The EPA responded to the petition in December 2016 stating that it would consider additional NOx regulations targeting model year 2024, but has not to date promulgated any further NOx regulations. The EPA and the California Air Resources Board ("CARB") may also consider other actions, including extended emission warranties. On April 18, 2019, CARB released a white paper providing an outline of measures it feels may be feasible, including lowered NOx and particular matter emission standards, changes in testing protocols, extended emission warranty periods, changes to durability demonstration periods, in-use testing and various other changes that are being considered for implementation between 2022 and 2027. However, CARB has not issued these as formal regulatory proposals. California is currently considering regulatory requirements to expand the zero emissions truck market, including the mandated sale of certain vehicles.
We expect that heavy duty vehicle and engine fuel economy and GHG emissions rules will be under consideration in other global jurisdictions in the future. The EPA also issued a final rule in October 2015 that lowered the National Ambient Air Quality Standard for ozone to 70 parts per billion. This rule could lead to future lower emission standards for substances that contribute to ozone depletion, including NOx from vehicles, at the federal and state levels. Our facilities may be subject to regulation related to climate change and climate change itself may also have some impact on our operations. However, these impacts are currently uncertain and we cannot predict the nature and scope of those impacts.
These standards will require significant investments of capital and will significantly increase costs of development for engines and vehicles and will require us to incur administrative costs arising from implementation of the standards.
Securitization Transactions
None of our securitization or trust arrangements qualify for sales accounting treatment or as an off-balance sheet arrangement. As a result, the transferred receivables and the associated secured borrowings are included in our
Consolidated Balance Sheets
and no gain or loss is recorded for these transactions.
Critical Accounting Policies and Estimates
Our consolidated financial statements are prepared in accordance with GAAP. In connection with the preparation of our consolidated financial statements, we use estimates and make judgments and assumptions about future events that affect the reported amounts of assets, liabilities, revenue, expenses, and the related disclosures. Our assumptions, estimates, and judgments are based on historical experience, current trends, and other factors we believe are relevant at the time we prepare our consolidated financial statements.
Our significant accounting policies are discussed in Note 1,
Summary of Significant Accounting Policies
, to the accompanying consolidated financial statements and should be reviewed in connection with the following discussion. We believe that the following policies are the most critical to aid in fully understanding and evaluating our reported results as they require us to make difficult, subjective, and complex judgments. In determining whether an estimate is critical, we consider if:
|
•
|
the nature of the estimate or assumption is material due to the levels of subjectivity and judgment necessary to account for highly uncertain matters or the susceptibility of such matters to change, or
|
45
|
•
|
the impact of the estimate or assumption on financial condition or operating performance is material.
|
Pension and Other Postretirement Benefits
We provide pension and other postretirement benefits to a substantial portion of our employees, former employees, and their beneficiaries. The assets, liabilities, and expenses we recognize and disclosures we make about plan actuarial and financial information are dependent on the assumptions used in calculating such amounts. The primary assumptions include factors such as discount rates, health care cost trend rates, inflation, expected return on plan assets, retirement rates, mortality rates, rate of compensation increases, and other factors including management's plans regarding plant rationalization activities. Changes to our business environment could result in changes to the assumptions, the effects of which could be material.
|
•
|
Plant rationalization activities impact the determination of whether a plan curtailment or settlement has occurred. Key considerations include, but are not limited to, expected future service credit, the remaining years of recall rights of the workforce, and the extent to which minimum service requirements (in the case of healthcare benefits) have been met.
|
|
•
|
The discount rates are obtained by matching the anticipated future benefit payments for the plans to a high quality corporate bond yield curve to establish a weighted average discount rate for each plan.
|
|
•
|
Health care cost trend rates are developed based upon historical retiree cost trend data, short term health care outlook, and industry benchmarks and surveys. The inflation assumptions used are based upon both our specific trends and nationally expected trends.
|
|
•
|
The expected return on plan assets is derived from historical plan returns, expected long-term performance of asset classes, asset allocations, input from an external pension investment advisor, and risks and other factors adjusted for our specific investment strategy. The focus is on long-term trends and provides for the consideration of recent plan performance.
|
|
•
|
Retirement rates are based upon actual and projected plan experience.
|
|
•
|
Mortality rates are developed from actual and projected plan experience for the U.S. postretirement benefit plans. Our actuaries conduct an experience study every five years as part of the process to select a best estimate of mortality. We consider both standard mortality tables and improvement factors as well as the plans’ actual experience when selecting a best estimate.
|
|
•
|
The rate of compensation increase reflects our long-term actual experience and our projected future increases.
|
The sensitivities stated below are based upon changing one assumption at a time, but often economic factors impact multiple assumptions simultaneously.
|
|
October 31, 2019
|
2020 Expense
|
|||||||||||||
|
Obligations
|
|
|
|||||||||||||
|
(in millions)
|
Pension
|
OPEB
|
Pension
|
OPEB
|
|||||||||||
|
Discount rate:
|
|
|
|
|
|||||||||||
|
Increase of 1.0%
|
$
|
(287
|
)
|
$
|
(101
|
)
|
$
|
4
|
|
$
|
4
|
|
|||
|
Decrease of 1.0%
|
339
|
|
120
|
|
(6
|
)
|
(8
|
)
|
|||||||
|
Expected return on assets:
|
|||||||||||||||
|
Increase of 1.0%
|
—
|
|
—
|
|
(20
|
)
|
(3
|
)
|
|||||||
|
Decrease of 1.0%
|
—
|
|
—
|
|
20
|
|
3
|
|
|||||||
As modeled above, net periodic postretirement benefits expense is not highly sensitive to changes in discount rates in the current interest rate environment due to the relatively short duration of the closed plans.
Income Taxes
We account for income taxes using the asset and liability method. Under this method, deferred tax assets and liabilities are recognized for the estimated future tax consequences attributable to differences between the financial statement carrying values of existing assets and liabilities and their respective tax bases. Deferred tax assets are also recorded with respect to net operating losses and other tax attribute carryforwards. Deferred tax assets and liabilities are measured using enacted tax rates in effect for the years in which temporary differences are expected to be recovered or settled. Valuation allowances are established when, based on currently available information, it is more likely than not that all or a portion of a deferred tax asset will not be realized. The effect on deferred tax assets and liabilities of a change in tax rates is recognized in the income from continuing operations in the period that includes the enactment date.
46
The ultimate recovery of deferred tax assets is dependent upon the amount and timing of future taxable income and other factors such as the taxing jurisdiction in which the asset is to be recovered. A high degree of judgment is required to determine if, and the extent to which, valuation allowances should be recorded against deferred tax assets. We have provided valuation allowances at
October 31, 2019
and
2018
aggregating
$2.0 billion
and
$2.2 billion
, respectively, against such assets based on our assessment of past operating results, estimates of future taxable income, and the feasibility of tax planning strategies. Although we believe that our approach to estimates and judgments as described herein is reasonable, actual results could differ and we may be exposed to increases or decreases in income taxes that could be material.
We recognize the tax benefit from an uncertain tax position claimed or expected to be claimed on a tax return only if it is more likely than not that the tax position will be sustained on examination by taxing authorities, based on the technical merits of the position. The tax benefits recognized in the financial statements from such a position are measured based on the largest benefit that has a greater than fifty percent likelihood of being realized upon ultimate settlement. We recognize interest and penalties related to uncertain tax positions as part of
Income tax expense.
We apply the intraperiod tax allocation rules to allocate income taxes among continuing operations, discontinued operations, other comprehensive income (loss), and additional paid-in capital when we meet the criteria as prescribed in the guidance.
Impairment of Long-Lived Assets
We test long-lived assets (other than goodwill and intangible assets with indefinite lives) or asset groups for recoverability when events and circumstances indicate that the carrying value of an asset or asset group may not be recoverable. Estimates of undiscounted future cash flows used to test the recoverability of a long-lived asset or asset group include only the future cash flows that are directly associated with and that are expected to arise as a direct result of the use and eventual disposition of the asset or asset group. If the asset or asset group is determined to not be recoverable, an impairment loss is measured as the amount by which the carrying amount of the long-lived asset or asset group exceeds its fair value.
Our impairment loss calculations require us to apply judgments in estimating future cash flows and asset fair values. This judgment includes developing cash flow projections and, at times, assessing probability weightings to certain business scenarios. Other long-lived assets could become impaired in the future or require additional charges as a result of declines in profitability due to changes in volume, market pricing, cost, manner in which an asset is used, expectation of sale or disposal of an asset, physical condition of an asset, laws and regulations, or the business environment. Significant adverse changes to our business environment and future cash flows could cause us to record additional impairment charges in future periods, which could be material.
Revenue
We account for a contract when it has approval and commitment from both parties, the rights of the parties are identified, payment terms are identified, the contract has commercial substance and collectability of consideration is probable.
Sales arrangements with U.S. fleet customers are often complex and non-standard, and may include pricing allowances and other sales incentives, such as rebates, financing incentives, and residual value guarantees, for which losses are generally capped. Sales to fleet customers are recognized in accordance with the terms of each contract. In certain arrangements, the evaluation of financing incentives and residual value guarantees may result in the transaction being recorded as a borrowing or operating lease, as we retain control in the leased property. Concurrent with our recognition of revenue, we recognize price allowances and the cost of incentive programs in the normal course of business based on programs offered to our fleet customers.
Product Warranty
We generally offer one to five-year warranty coverage for our truck, bus, and engine products, as well as our service parts. Terms and conditions vary by product, customer, and country. We accrue warranty related costs under standard warranty terms and for certain claims outside the contractual obligation period that we choose to pay as accommodations to our customers.
Our warranty estimates are established using historical information about the nature, frequency, timing, and average cost of warranty claims. Warranty claims are influenced by numerous factors, including new product introductions, technological developments, the competitive environment, the design and manufacturing process, and the complexity and related costs of component parts. We estimate our warranty accrual for our engines and trucks based on engine types and model years. Our warranty accruals take into account the projected ultimate cost-per-unit ("CPU") utilizing historical claims information. The CPU represents the total cash projected to be spent for warranty claims for a particular model year during the warranty period, divided by the number of units sold. The projection of the ultimate CPU is affected by component failure rates, repair costs, and the timing of failures in the product life cycle. Warranty claims inherently have a high amount of variability in timing and severity and can be influenced by external factors. Our warranty estimation process takes into consideration numerous variables that contribute to the precision of the estimate, but also add to the complexity of the model. Including numerous variables also
47
reduces the sensitivity of the model to any one variable. We perform periodic reviews of warranty spend data to allow for timely consideration of the effects on warranty accruals.
Initial warranty estimates for new model year products are based on the previous model year product's warranty experience until the new product progresses sufficiently through its life cycle and related claims data becomes mature. Historically, warranty claims experience for launch-year products has been higher compared to the prior model-year engines; however, over time we have been able to refine both the design and manufacturing process to reduce both the volume and the severity of warranty claims. New product launches require a greater use of judgment in developing estimates until historical experience becomes available.
We record adjustments to pre-existing warranties for changes in our estimate of warranty costs for products sold in prior fiscal years. Such adjustments typically occur when claims experience deviates from historic and expected trends. We recognized a charge for adjustments to pre-existing warranties of
$3 million
in
2019
, and a benefit for adjustments to pre-existing warranties of
$9 million
in
2018
and
$1 million
in
2017
, respectively.
When we identify cost effective opportunities to address issues in products sold or corrective actions for safety issues, we initiate product recalls or field campaigns. As a result of the uncertainty surrounding the nature and frequency of product recalls and field campaigns, the liability for such actions is generally recorded when we commit to a product recall or field campaign. In each subsequent quarter after a recall or field campaign is initiated the recorded liability balance is analyzed, reviewed, and adjusted if necessary to reflect any changes in the anticipated average cost of repair or number of repairs to be completed prospectively. Included in
2019
warranty expense was
$27 million
of charges related to new field campaign issuances as well as changes in estimates of previously issued campaigns, as compared to
$10 million
and
$21 million
in
2018
and
2017
, respectively. The charges were primarily recognized as adjustments to pre-existing warranties.
As we continue to identify opportunities to improve the design and manufacturing of our engines we may incur additional charges for product recalls and field campaigns to address identified issues.
Optional extended warranty contracts can be purchased for periods ranging from one to ten years. Warranty revenues related to extended warranty contracts are amortized to income, over the life of the contract, (a) in 2019 in proportion to the costs expected to be incurred in satisfying the obligation under the contract and (b) in 2018 and 2017 using the straight-line method. Costs under extended warranty contracts are expensed as incurred. We recognize losses on defined pools of extended warranty contracts when the expected costs for a given pool of contracts exceed related unearned revenue. In
2019
, we recognized a net benefit of
$14 million
related to extended warranty contracts on our proprietary Big-Bore engines, which includes a benefit of
$13 million
related to pre-existing warranties. In
2018
, we recognized a net benefit of
$29 million
related to extended warranty contracts on our proprietary Big-Bore engines, which includes a benefit of
$33 million
related to pre-existing warranties. In
2017
, we recognized a net charge of
$8 million
related to extended warranty contracts on our proprietary Big-Bore engines, which includes a charge of
$3 million
related to pre-existing warranties. Future warranty experience, pricing of extended warranty contracts, and external market factors may cause us to recognize additional charges as losses on extended service contracts in future periods.
When collection is reasonably assured, we also estimate the amount of warranty claim recoveries to be received from our suppliers and record them in
Other current assets
and
Other noncurrent assets
. Recoveries related to specific product recalls, in which a supplier confirms its liability under the recall, are recorded in
Trade and other receivables, net
. Warranty costs and recoveries are included in
Costs of products sold
.
Although we believe that the estimates and judgments discussed herein are reasonable, actual results could differ and we may be exposed to increases or decreases in our warranty accrual that could be material.
Recently Issued Accounting Standards
The information required to be set forth under this heading is incorporated by reference from Note 1,
Summary of Significant Accounting Policies
, to the consolidated financial statements included in Part II, Item 8.
48
Item 7A.
Quantitative and Qualitative Disclosures about Market Risk
Our primary market risks include fluctuations in interest rates and currency exchange rates. We are also exposed to changes in the prices of commodities used in our Manufacturing operations. Commodity price risk related to our current commodity financial instruments are not material. We do not hold a material portfolio of market risk sensitive instruments for trading purposes.
We have established policies and procedures to manage sensitivity to interest rate and foreign currency exchange rate market risk. These procedures include the monitoring of our level of exposure to each market risk, the funding of variable rate receivables primarily with variable rate debt, and limiting the amount of fixed rate receivables that may be funded with floating rate debt. These procedures also include the use of derivative financial instruments to mitigate the effects of interest rate fluctuations and to reduce our exposure to exchange rate risk.
Interest rate risk
Interest rate risk is the risk that we will incur economic losses due to adverse changes in interest rates. We measure our interest rate risk by estimating the net amount by which the fair value of all of our interest rate sensitive assets and liabilities would be impacted by selected hypothetical changes in market interest rates. At both
October 31, 2019
and
2018
, the net fair value of our liabilities with exposure to interest rate risk was
$5 billion
. Assuming a hypothetical instantaneous
10%
adverse change in interest rates as of
October 31, 2019
and
2018
, the fair value of these liabilities would increase by
$142 million
and
$139 million
, respectively. At both
October 31, 2019
and
2018
, the net fair value of our assets with exposure to interest rate risk was
$2 billion
. Interest rate risk is minimal as these assets are largely short-term in nature. Assuming a hypothetical instantaneous
10%
adverse change in interest rates as of
October 31, 2019
and
2018
, the fair value of these assets would decrease by
$5 million
and
$4 million
, respectively.
Commodity price risk
We are exposed to changes in the prices of commodities, particularly for aluminum, copper, precious metals, resins, diesel fuel, and steel and their impact on the acquisition cost of various parts used in our Manufacturing operations. We have been able to mitigate the effects of price increases via a combination of design changes, material substitution, global sourcing, and price performance. In certain cases, we use derivative instruments to reduce exposure to price changes. During
2019
and
2018
, we purchased approximately
$506 million
and
$403 million
, respectively, of commodities subject to market risk. Assuming a hypothetical instantaneous
10%
adverse change in commodity pricing, we would have incurred additional costs of
$51 million
and
$40 million
in
2019
and
2018
, respectively. Commodity price risk associated with our derivative position at
October 31, 2019
and
2018
is not material to our operating results or financial position.
Foreign currency risk
Foreign currency risk is the risk that we will incur economic losses due to adverse changes in foreign currency exchange rates. Our primary exposures to foreign currency exchange rate fluctuations are the Canadian dollar/U.S. dollar, Mexican peso/U.S. dollar, euro/U.S. dollar, and Brazilian real/U.S. dollar. At
October 31, 2019
and
2018
, the net fair value of our liabilities with exposure to foreign currency risk was
$159 million
and
$260 million
, respectively. Assuming that no offsetting derivative financial instruments exist, the reduction in earnings from a hypothetical instantaneous
10%
adverse change in quoted foreign currency spot rates applied to foreign currency sensitive instruments would be
$16 million
and
$26 million
at
October 31, 2019
and
2018
, respectively. At
October 31, 2019
and
2018
, the net fair value of our assets with exposure to foreign currency risk was
$108 million
and
$180 million
, respectively. Assuming that no offsetting derivative financial instruments exist, the reduction in earnings from a hypothetical instantaneous
10%
adverse change in quoted foreign currency spot rates applied to foreign currency sensitive instruments would be
$11 million
and
$18 million
at
October 31, 2019
and
2018
, respectively.
For further information regarding fair value estimates, please see Note 13,
Fair Value Measurements
to the accompanying consolidated financial statements.
49
|
Item 8.
|
Financial Statements and Supplementary Data
|
Index to Consolidated Financial Statements
|
Page
|
|
|
Notes to Consolidated Financial Statements
|
||
|
1
|
||
|
2
|
||
|
3
|
||
|
4
|
||
|
5
|
||
|
6
|
||
|
7
|
||
|
8
|
||
|
9
|
||
|
10
|
||
|
11
|
||
|
12
|
||
|
13
|
||
|
14
|
||
|
15
|
||
|
16
|
||
|
17
|
||
|
18
|
||
|
19
|
||
|
20
|
||
50
Report of Independent Registered Public Accounting Firm
To the Stockholders and Board of Directors
Navistar International Corporation:
Opinion on the Consolidated Financial Statements
We have audited the accompanying consolidated balance sheets of Navistar International Corporation and subsidiaries (the Company) as of October 31, 2019 and 2018, the related consolidated statements of operations, comprehensive income, stockholders’ deficit, and cash flows for each of the years in the three‑year period ended October 31, 2019, and the related notes (collectively, the consolidated financial statements). In our opinion, the consolidated financial statements present fairly, in all material respects, the financial position of the Company as of October 31, 2019 and 2018, and the results of its operations and its cash flows for each of the years in the three‑year period ended October 31, 2019, in conformity with U.S. generally accepted accounting principles.
We also have audited, in accordance with the standards of the Public Company Accounting Oversight Board (United States) (PCAOB), the Company’s internal control over financial reporting as of October 31, 2019, based on criteria established in Internal Control - Integrated Framework (2013) issued by the Committee of Sponsoring Organizations of the Treadway Commission, and our report dated
December 17, 2019
expressed an unqualified opinion on the effectiveness of the Company’s internal control over financial reporting.
Basis for Opinion
These consolidated financial statements are the responsibility of the Company’s management. Our responsibility is to express an opinion on these consolidated financial statements based on our audits. We are a public accounting firm registered with the PCAOB and are required to be independent with respect to the Company in accordance with the U.S. federal securities laws and the applicable rules and regulations of the Securities and Exchange Commission and the PCAOB.
We conducted our audits in accordance with the standards of the PCAOB. Those standards require that we plan and perform the audit to obtain reasonable assurance about whether the consolidated financial statements are free of material misstatement, whether due to error or fraud. Our audits included performing procedures to assess the risks of material misstatement of the consolidated financial statements, whether due to error or fraud, and performing procedures that respond to those risks. Such procedures included examining, on a test basis, evidence regarding the amounts and disclosures in the consolidated financial statements. Our audits also included evaluating the accounting principles used and significant estimates made by management, as well as evaluating the overall presentation of the consolidated financial statements. We believe that our audits provide a reasonable basis for our opinion.
Critical Audit Matters
The critical audit matters communicated below are matters arising from the current period audit of the consolidated financial statements that were communicated or required to be communicated to the audit committee and that: (1) relate to accounts or disclosures that are material to the consolidated financial statements and (2) involved our especially challenging, subjective, or complex judgments. The communication of critical audit matters does not alter in any way our opinion on the consolidated financial statements, taken as a whole, and we are not, by communicating the critical audit matters below, providing separate opinions on the critical audit matters or on the accounts or disclosures to which they relate.
Identification and Evaluation of Sales Incentives for Fleet Customers
As discussed in Note 1 to the consolidated financial statements, the Company recognizes price allowances and the cost of incentive programs to fleet customers in connection with sales arrangements. Specifically, sales arrangements with U.S. fleet customers are often complex and non-standard, and may include price allowances and other sales incentives, such as rebates, residual value guarantees, and financing incentives.
We determined the identification and evaluation of sales incentives offered to U.S. fleet customers to be a critical audit matter because ascertaining the population of sales incentives and contract terms is challenging to test due to the number, variability and combination of contracts with U.S. fleet customers. In addition, evaluating the accounting impact of certain sales incentives is complex including measurement and timing of revenue recognition.
51
The primary procedures we performed to address this critical audit matter included the following. We tested certain internal controls over the Company’s process to identify the relevant terms in sales agreements, assess the associated accounting impacts and authorize special pricing. We selected a sample of contracts to read and assessed the accounting treatment for significant fleet sales agreements entered into during the year and in the process of being negotiated. We also inspected the sample of contracts to evaluate the population and treatment of sales incentives identified by the Company, and to assess new or unusual terms that may have an accounting impact. Representations of the Company were obtained to assess the listing of existing and in-process agreements and new incentives, and to determine the contractual terms constituted the entirety of the arrangements. Further, we evaluated the Company’s representations by externally confirming the contractual terms and the population of agreements with fleet customers.
Evaluation of Product Warranty Liabilities
As discussed in Note 1 to the consolidated financial statements, the Company’s product warranty liabilities are estimated using an actuarial model which projects ultimate cost-per-unit (“CPU”) based on historical information about warranty claims which are influenced by numerous factors and are inherently variable as to frequency and severity. Total product warranty liabilities as of October 31, 2019 were
$510 million
.
We identified the evaluation of certain assumptions related to frequency and severity of claims in determining the ultimate CPU used in the Company’s models to estimate the product warranty liabilities as a critical audit matter. Evaluating the Company’s assumptions relating to the frequency and severity of future claims involved a higher degree of auditor judgment. Further, specialized actuarial skills were needed to assess the Company’s process and evaluate the assumptions regarding the determination of ultimate CPU and the impact of those assumptions on the models.
The primary procedures we performed to address this critical audit matter included the following. We tested certain internal controls over the Company’s warranty liability process, including controls related to development of the assumptions, the underlying warranty claims and the assessment of the qualifications of the actuary engaged by the Company. We identified and considered the relevance, reliability, and sufficiency of the sources of data used by the Company in developing the assumptions. We involved an actuarial professional with specialized skills and knowledge to assist with:
|
•
|
the assessment of the Company’s actuarial model for consistency with generally accepted actuarial standards,
|
|
•
|
the evaluation of certain of the assumptions used, including those related to frequency and severity of claims, in the determination of ultimate CPU, and
|
|
•
|
the development of an independent expectation of certain of the assumptions used to estimate the Company’s product warranty liabilities using the Company’s underlying historical claims data.
|
We compared the Company’s prior period assumptions to subsequent actual reported claims including an evaluation of the accounting treatment related to adjustments to pre-existing product warranty liabilities. We also considered subsequent events and transactions, including claims data and trends relative to the assumptions used to estimate the Company’s product warranty liabilities.
/s/ KPMG LLP
We have served as the Company’s auditor since 2006.
Chicago, Illinois
December 17, 2019
52
Report of Independent Registered Public Accounting Firm
To the Stockholders and Board of Directors
Navistar International Corporation:
Opinion on Internal Control Over Financial Reporting
We have audited Navistar International Corporation’s and subsidiaries’ (the Company) internal control over financial reporting as of October 31, 2019, based on criteria established in Internal Control - Integrated Framework (2013) issued by the Committee of Sponsoring Organizations of the Treadway Commission. In our opinion, the Company maintained, in all material respects, effective internal control over financial reporting as of October 31, 2019, based on criteria established in Internal Control - Integrated Framework (2013) issued by the Committee of Sponsoring Organizations of the Treadway Commission.
We also have audited, in accordance with the standards of the Public Company Accounting Oversight Board (United States) (PCAOB), the consolidated balance sheets of the Company as of October 31, 2019 and 2018, the related consolidated statements of operations, comprehensive income, stockholders’ deficit, and cash flows for each of the years in the three-year period ended October 31, 2019, and the related notes (collectively, the consolidated financial statements), and our report dated
December 17, 2019
expressed an unqualified opinion on those consolidated financial statements.
Basis for Opinion
The Company’s management is responsible for maintaining effective internal control over financial reporting and for its assessment of the effectiveness of internal control over financial reporting, included in the accompanying Management’s Report on Internal Control over Financial Reporting. Our responsibility is to express an opinion on the Company’s internal control over financial reporting based on our audit. We are a public accounting firm registered with the PCAOB and are required to be independent with respect to the Company in accordance with the U.S. federal securities laws and the applicable rules and regulations of the Securities and Exchange Commission and the PCAOB.
We conducted our audit in accordance with the standards of the PCAOB. Those standards require that we plan and perform the audit to obtain reasonable assurance about whether effective internal control over financial reporting was maintained in all material respects. Our audit of internal control over financial reporting included obtaining an understanding of internal control over financial reporting, assessing the risk that a material weakness exists, and testing and evaluating the design and operating effectiveness of internal control based on the assessed risk. Our audit also included performing such other procedures as we considered necessary in the circumstances. We believe that our audit provides a reasonable basis for our opinion.
Definition and Limitations of Internal Control Over Financial Reporting
A company’s internal control over financial reporting is a process designed to provide reasonable assurance regarding the reliability of financial reporting and the preparation of financial statements for external purposes in accordance with generally accepted accounting principles. A company’s internal control over financial reporting includes those policies and procedures that (1) pertain to the maintenance of records that, in reasonable detail, accurately and fairly reflect the transactions and dispositions of the assets of the company; (2) provide reasonable assurance that transactions are recorded as necessary to permit preparation of financial statements in accordance with generally accepted accounting principles, and that receipts and expenditures of the company are being made only in accordance with authorizations of management and directors of the company; and (3) provide reasonable assurance regarding prevention or timely detection of unauthorized acquisition, use, or disposition of the company’s assets that could have a material effect on the financial statements.
Because of its inherent limitations, internal control over financial reporting may not prevent or detect misstatements. Also, projections of any evaluation of effectiveness to future periods are subject to the risk that controls may become inadequate because of changes in conditions, or that the degree of compliance with the policies or procedures may deteriorate.
/s/ KPMG LLP
Chicago, Illinois
December 17, 2019
53
Navistar International Corporation and Subsidiaries
|
|
For the Years Ended October 31,
|
||||||||||
|
(in millions, except per share data)
|
2019
|
|
2018
|
2017
|
|||||||
|
Sales and revenues
|
|||||||||||
|
Sales of manufactured products, net
|
$
|
|
|
$
|
|
|
$
|
|
|
||
|
Finance revenues
|
|
|
|
|
|
|
|||||
|
Sales and revenues, net
|
|
|
|
|
|
|
|||||
|
Costs and expenses
|
|||||||||||
|
Costs of products sold
|
|
|
|
|
|
|
|||||
|
Restructuring charges
|
|
|
(
|
)
|
|
|
|||||
|
Asset impairment charges
|
|
|
|
|
|
|
|||||
|
Selling, general and administrative expenses
|
|
|
|
|
|
|
|||||
|
Engineering and product development costs
|
|
|
|
|
|
|
|||||
|
Interest expense
|
|
|
|
|
|
|
|||||
|
Other expense, net
|
|
|
|
|
|
|
|||||
|
Total costs and expenses
|
|
|
|
|
|
|
|||||
|
Equity in income of non-consolidated affiliates
|
|
|
|
|
|
|
|||||
|
Income from continuing operations before income tax
es
|
|
|
|
|
|
|
|||||
|
Income tax expense
|
(
|
)
|
(
|
)
|
(
|
)
|
|||||
|
Income from continuing operatio
ns
|
|
|
|
|
|
|
|||||
|
Income from discontinued operations, net of tax
|
|
|
|
|
|
|
|||||
|
Net income
|
|
|
|
|
|
|
|
||||
|
Less: Net income attributable to non-controlling interests
|
|
|
|
|
|
|
|||||
|
Net income attributable to Navistar International Corporation
|
$
|
|
|
$
|
|
|
$
|
|
|
||
|
|
|||||||||||
|
Amounts attributable to Navistar International Corporation common shareholders:
|
|
|
|||||||||
|
Income from continuing operations, net of tax
|
$
|
|
|
$
|
|
|
$
|
|
|
||
|
Income from discontinued operations, net of tax
|
|
|
|
|
|
|
|||||
|
Net income
|
$
|
|
|
$
|
|
|
$
|
|
|
||
|
Earnings per share:
|
|||||||||||
|
Basic:
|
|||||||||||
|
Continuing operations
|
$
|
|
|
$
|
|
|
$
|
|
|
||
|
Discontinued operations
|
|
|
|
|
|
|
|||||
|
$
|
|
|
$
|
|
|
$
|
|
|
|||
|
|
|
||||||||||
|
Diluted:
|
|
|
|||||||||
|
Continuing operations
|
$
|
|
|
$
|
|
|
$
|
|
|
||
|
Discontinued operations
|
|
|
|
|
|
|
|||||
|
$
|
|
|
$
|
|
|
$
|
|
|
|||
|
Weighted average shares outstanding:
|
|||||||||||
|
Basic
|
|
|
|
|
|
|
|||||
|
Diluted
|
|
|
|
|
|
|
|||||
54
Navistar International Corporation and Subsidiaries
Consolidated Statements of Comprehensive Income
|
(in millions)
|
For the Years Ended October 31,
|
||||||||||
|
2019
|
2018
|
2017
|
|||||||||
|
Net income
|
$
|
|
|
$
|
|
|
$
|
|
|
||
|
Other comprehensive income (loss):
|
|||||||||||
|
Foreign currency translation adjustment
|
(
|
)
|
(
|
)
|
(
|
)
|
|||||
|
Unrealized gain on marketable securities, net of tax
|
|
|
|
|
(
|
)
|
|||||
|
Defined benefit plans, net of tax
|
|
|
|
|
|
|
|||||
|
Total other comprehensive income
|
|
|
|
|
|
|
|||||
|
Comprehensive income
|
|
|
|
|
|
|
|||||
|
Less: Net income attributable to non-controlling interests
|
|
|
|
|
|
|
|||||
|
Total comprehensive income attributable to Navistar International Corporation
|
$
|
|
|
$
|
|
|
$
|
|
|
||
55
Navistar International Corporation and Subsidiaries
|
As of October 31,
|
|||||||
|
(in millions, except per share data)
|
2019
|
2018
|
|||||
|
ASSETS
|
|||||||
|
Current assets
|
|||||||
|
Cash and cash equivalents
|
$
|
|
|
$
|
|
|
|
|
Restricted cash and cash equivalents
|
|
|
|
|
|||
|
Marketable securities
|
|
|
|
|
|||
|
Trade and other receivables, net
|
|
|
|
|
|||
|
Finance receivables, net
|
|
|
|
|
|||
|
Inventories, net
|
|
|
|
|
|||
|
Other current assets
|
|
|
|
|
|||
|
Total current assets
|
|
|
|
|
|||
|
Restricted cash
|
|
|
|
|
|||
|
Trade and other receivables, net
|
|
|
|
|
|||
|
Finance receivables, net
|
|
|
|
|
|||
|
Investments in non-consolidated affiliates
|
|
|
|
|
|||
|
Property and equipment, net
|
|
|
|
|
|||
|
Goodwill
|
|
|
|
|
|||
|
Intangible assets, net
|
|
|
|
|
|||
|
Deferred taxes, net
|
|
|
|
|
|||
|
Other noncurrent assets
|
|
|
|
|
|||
|
Total assets
|
$
|
|
|
$
|
|
|
|
|
LIABILITIES and STOCKHOLDERS’ DEFICIT
|
|||||||
|
Liabilities
|
|||||||
|
Current liabilities
|
|||||||
|
Notes payable and current maturities of long-term debt
|
$
|
|
|
$
|
|
|
|
|
Accounts payable
|
|
|
|
|
|||
|
Other current liabilities
|
|
|
|
|
|||
|
Total current liabilities
|
|
|
|
|
|||
|
Long-term debt
|
|
|
|
|
|||
|
Postretirement benefits liabilities
|
|
|
|
|
|||
|
Other noncurrent liabilities
|
|
|
|
|
|||
|
Total liabilities
|
|
|
|
|
|||
|
Stockholders’ deficit
|
|||||||
|
Series D convertible junior preference stock
|
|
|
|
|
|||
|
Common stock, $0.10 par value per share (103.1 shares issued and 220 shares authorized at both dates)
|
|
|
|
|
|||
|
Additional paid-in capital
|
|
|
|
|
|||
|
Accumulated deficit
|
(
|
)
|
(
|
)
|
|||
|
Accumulated other comprehensive loss
|
(
|
)
|
(
|
)
|
|||
|
Common stock held in treasury, at cost (3.9 and 4.2 shares, respectively)
|
(
|
)
|
(
|
)
|
|||
|
Total stockholders’ deficit attributable to Navistar International Corporation
|
(
|
)
|
(
|
)
|
|||
|
Stockholders’ equity attributable to non-controlling interests
|
|
|
|
|
|||
|
Total stockholders’ deficit
|
(
|
)
|
(
|
)
|
|||
|
Total liabilities and stockholders’ deficit
|
$
|
|
|
$
|
|
|
|
See Notes to Consolidated Financial Statements
56
Navistar International Corporation and Subsidiaries
|
|
For the Years Ended October 31,
|
||||||||||
|
(in millions)
|
2019
|
2018
|
2017
|
||||||||
|
Cash flows from operating activities
|
|||||||||||
|
Net income
|
$
|
|
|
$
|
|
|
$
|
|
|
||
|
Adjustments to reconcile net income to net cash provided by operating activities:
|
|||||||||||
|
Depreciation and amortization
|
|
|
|
|
|
|
|||||
|
Depreciation of equipment leased to others
|
|
|
|
|
|
|
|||||
|
Deferred taxes, including change in valuation allowance
|
(
|
)
|
|
|
(
|
)
|
|||||
|
Asset impairment charges
|
|
|
|
|
|
|
|||||
|
Gain on sales of investments and businesses, net
|
(
|
)
|
|
|
(
|
)
|
|||||
|
Amortization of debt issuance costs and discount
|
|
|
|
|
|
|
|||||
|
Stock-based compensation
|
|
|
|
|
|
|
|||||
|
Provision for doubtful accounts, net of recoveries
|
|
|
|
|
|
|
|||||
|
Equity in income of non-consolidated affiliates, net of dividends
|
(
|
)
|
|
|
|
|
|||||
|
Write-off of debt issuance cost and discount
|
|
|
|
|
|
|
|||||
|
Other non-cash operating activities
|
(
|
)
|
(
|
)
|
(
|
)
|
|||||
|
Changes in other assets and liabilities, exclusive of the effects of businesses disposed:
|
|||||||||||
|
Trade and other receivables
|
|
|
(
|
)
|
(
|
)
|
|||||
|
Finance receivables
|
(
|
)
|
(
|
)
|
(
|
)
|
|||||
|
Inventories
|
|
|
(
|
)
|
|
|
|||||
|
Accounts payable
|
(
|
)
|
|
|
|
|
|||||
|
Other assets and liabilities
|
|
|
|
|
(
|
)
|
|||||
|
Net cash provided by operating activities
|
|
|
|
|
|
|
|||||
|
Cash flows from investing activities
|
|||||||||||
|
Purchases of marketable securities
|
|
|
(
|
)
|
(
|
)
|
|||||
|
Sales of marketable securities
|
|
|
|
|
|
|
|||||
|
Maturities of marketable securities
|
|
|
|
|
|
|
|||||
|
Capital expenditures
|
(
|
)
|
(
|
)
|
(
|
)
|
|||||
|
Purchases of equipment leased to others
|
(
|
)
|
(
|
)
|
(
|
)
|
|||||
|
Proceeds from sales of property and equipment
|
|
|
|
|
|
|
|||||
|
Proceeds from (payments for) sales of affiliates
|
|
|
(
|
)
|
|
|
|||||
|
Other investing activities
|
|
|
|
|
(
|
)
|
|||||
|
Net cash used in investing activities
|
(
|
)
|
(
|
)
|
(
|
)
|
|||||
|
Cash flows from financing activities
|
|||||||||||
|
Proceeds from issuance of securitized debt
|
|
|
|
|
|
|
|||||
|
Principal payments on securitized debt
|
(
|
)
|
(
|
)
|
(
|
)
|
|||||
|
Net change in secured revolving credit facilities
|
|
|
|
|
|
|
|||||
|
Proceeds from issuance of non-securitized debt
|
|
|
|
|
|
|
|||||
|
Principal payments on non-securitized debt
|
(
|
)
|
(
|
)
|
(
|
)
|
|||||
|
Net change in notes and debt outstanding under revolving credit facilities
|
|
|
(
|
)
|
(
|
)
|
|||||
|
Debt issuance costs
|
(
|
)
|
(
|
)
|
(
|
)
|
|||||
|
Proceeds from financed lease obligations
|
|
|
|
|
|
|
|||||
|
Issuance of common stock
|
|
|
|
|
|
|
|||||
|
Stock issuance costs
|
|
|
|
|
(
|
)
|
|||||
|
Proceeds from exercise of stock options
|
|
|
|
|
|
|
|||||
|
Dividends paid by subsidiaries to non-controlling interest
|
(
|
)
|
(
|
)
|
(
|
)
|
|||||
|
Other financing activities
|
(
|
)
|
(
|
)
|
(
|
)
|
|||||
|
Net cash provided by (used in) financing activities
|
(
|
)
|
|
|
|
|
|||||
|
Effect of exchange rate changes on cash, cash equivalents and restricted cash
|
(
|
)
|
(
|
)
|
(
|
)
|
|||||
|
Increase (decrease) in cash, cash equivalents and restricted cash
|
|
|
|
|
(
|
)
|
|||||
|
Cash, cash equivalents and restricted cash at beginning of the year
|
|
|
|
|
|
|
|||||
|
Cash, cash equivalents and restricted cash at end of the year
|
$
|
|
|
$
|
|
|
$
|
|
|
||
See Notes to Consolidated Financial Statements
57
Navistar International Corporation and Subsidiaries
Consolidated Statements of Stockholders’ Deficit
|
(in millions)
|
Series D
Convertible Junior Preference Stock |
Common
Stock |
Additional
Paid-in Capital |
Accumulated
Deficit |
Accumulated
Other Comprehensive Income (Loss) |
Common
Stock Held in Treasury, at cost |
Stockholders'
Equity Attributable to Non-controlling Interests |
Total
|
|||||||||||||||||||||||
|
Balance as of October 31, 2016
|
$
|
|
|
$
|
|
|
$
|
|
|
$
|
(
|
)
|
$
|
(
|
)
|
$
|
(
|
)
|
$
|
|
|
$
|
(
|
)
|
|||||||
|
Net income
|
|
|
|
|
|
|
|
|
|
|
|
|
|
|
|
|
|||||||||||||||
|
Total other comprehensive income
|
|
|
|
|
|
|
|
|
|
|
|
|
|
|
|
|
|||||||||||||||
|
Stock-based compensation
|
|
|
|
|
|
|
|
|
|
|
|
|
|
|
|
|
|||||||||||||||
|
Stock ownership programs
|
|
|
|
|
(
|
)
|
|
|
|
|
|
|
|
|
|
|
|||||||||||||||
|
Cash dividends paid to non-controlling interest
|
|
|
|
|
|
|
|
|
|
|
|
|
(
|
)
|
(
|
)
|
|||||||||||||||
|
Issuance of common stock
|
|
|
|
|
|
|
|
|
|
|
|
|
|
|
|
|
|||||||||||||||
|
Stock issuance costs
|
|
|
|
|
(
|
)
|
|
|
|
|
|
|
|
|
(
|
)
|
|||||||||||||||
|
Stock deferral and issuance - directors
|
|
|
|
|
|
|
|
|
|
|
|
|
|
|
|
|
|||||||||||||||
|
Other
|
|
|
(
|
)
|
|
|
|
|
|
|
|
|
|
|
(
|
)
|
|||||||||||||||
|
Balance as of October 31, 2017
|
$
|
|
|
$
|
|
|
$
|
|
|
$
|
(
|
)
|
$
|
(
|
)
|
$
|
(
|
)
|
$
|
|
|
$
|
(
|
)
|
|||||||
|
Net income
|
|
|
|
|
|
|
|
|
|
|
|
|
|
|
|
|
|||||||||||||||
|
Total other comprehensive income
|
|
|
|
|
|
|
|
|
|
|
|
|
|
|
|
|
|||||||||||||||
|
Stock-based compensation
|
|
|
|
|
|
|
|
|
|
|
|
|
|
|
|
|
|||||||||||||||
|
Stock ownership programs
|
|
|
|
|
(
|
)
|
|
|
|
|
|
|
|
|
|
|
|||||||||||||||
|
Cash dividends paid to non-controlling interest
|
|
|
|
|
|
|
|
|
|
|
|
|
(
|
)
|
(
|
)
|
|||||||||||||||
|
Issuance of common stock
|
|
|
|
|
|
|
|
|
|
|
|
|
|
|
|
|
|||||||||||||||
|
Stock issuance costs
|
|
|
|
|
|
|
|
|
|
|
|
|
|
|
|
|
|||||||||||||||
|
Stock deferral and issuance - directors
|
|
|
|
|
(
|
)
|
|
|
|
|
|
|
|
|
(
|
)
|
|||||||||||||||
|
Other
|
|
|
|
|
|
|
|
|
|
|
|
|
|
|
|
|
|||||||||||||||
|
Balance as of October 31, 2018
|
$
|
|
|
$
|
|
|
$
|
|
|
$
|
(
|
)
|
$
|
(
|
)
|
$
|
(
|
)
|
$
|
|
|
$
|
(
|
)
|
|||||||
|
Net income
|
|
|
|
|
|
|
|
|
|
|
|
|
|
|
|
|
|||||||||||||||
|
Total other comprehensive income
|
|
|
|
|
|
|
|
|
|
|
|
|
|
|
|
|
|||||||||||||||
|
ASC-606 modified retrospective adoption
|
|
|
|
|
|
|
(
|
)
|
|
|
|
|
|
|
(
|
)
|
|||||||||||||||
|
Stock-based compensation
|
|
|
|
|
|
|
|
|
|
|
|
|
|
|
|
|
|||||||||||||||
|
Stock ownership programs
|
|
|
|
|
(
|
)
|
|
|
|
|
|
|
|
|
|
|
|||||||||||||||
|
Cash dividends paid to non-controlling interest
|
|
|
|
|
|
|
|
|
|
|
|
|
(
|
)
|
(
|
)
|
|||||||||||||||
|
Issuance of common stock
|
|
|
|
|
|
|
|
|
|
|
|
|
|
|
|
|
|||||||||||||||
|
Stock issuance costs
|
|
|
|
|
|
|
|
|
|
|
|
|
|
|
|
|
|||||||||||||||
|
Stock deferral and issuance - directors
|
|
|
|
|
|
|
|
|
|
|
|
|
|
|
|
|
|||||||||||||||
|
Other
|
|
|
|
|
|
|
|
|
|
|
|
|
|
|
|
|
|||||||||||||||
|
Balance as of October 31, 2019
|
$
|
|
|
$
|
|
|
$
|
|
|
$
|
(
|
)
|
$
|
(
|
)
|
$
|
(
|
)
|
$
|
|
|
$
|
(
|
)
|
|||||||
See Notes to Consolidated Financial Statements
58
Navistar International Corporation and Subsidiaries
Notes to Consolidated Financial Statements
1.
Summary of Significant Accounting Policies
Organization and Description of the Business
Navistar International Corporation ("NIC"), incorporated under the laws of the State of Delaware in 1993, is a holding company whose principal operating entities are Navistar, Inc. ("NI") and Navistar Financial Corporation ("NFC"). References herein to the "Company," "we," "our," or "us" refer collectively to NIC and its consolidated subsidiaries, including certain variable interest entities ("VIEs") of which we are the primary beneficiary. We operate in
four
principal industry segments: Truck, Parts, Global Operations (collectively called "Manufacturing operations"), and Financial Services, which consists of NFC and our foreign finance operations (collectively called "Financial Services operations"). These segments are discussed in Note 15,
Segment Reporting
.
Our fiscal year ends on October 31. As such, all references to
2019
,
2018
, and
2017
contained within this Annual Report on Form
10-K
relate to the fiscal year, unless otherwise indicated.
Basis of Presentation and Consolidation
The accompanying audited consolidated financial statements include the assets, liabilities, and results of operations of our Manufacturing operations and our Financial Services operations, including VIEs of which we are the primary beneficiary. The effects of transactions among consolidated entities have been eliminated to arrive at the consolidated amounts.
Variable Interest Entities
We have an interest in several VIEs, primarily joint ventures, established to manufacture or distribute products and enhance our operational capabilities. We have determined for certain of our VIEs that we are the primary beneficiary because we have the power to direct the activities of the VIE that most significantly impact its economic performance and we have the obligation to absorb losses of, or the right to receive benefits from, the VIE that could potentially be significant to the VIE. Accordingly, we include in our consolidated financial statements the assets and liabilities and results of operations of those entities, even though we may not own a majority voting interest. The liabilities recognized as a result of consolidating these VIEs do not represent additional claims on our general assets; rather they represent claims against the specific assets of these VIEs. Assets of these entities are not readily available to satisfy claims against our general assets.
We are the primary beneficiary of our Blue Diamond Parts, LLC ("BDP") joint venture with Ford Motor Company ("Ford"). As a result, our
Consolidated Balance Sheets
include assets of
$
32
million
and
$
39
million
, respectively, and liabilities of
$
4
million
, for both periods, as of
October 31, 2019
and
2018
. Assets include
$
2
million
and
$4 million
of cash and cash equivalents as of
October 31, 2019
and
2018
, respectively, which are not readily available to satisfy claims against our general assets. The creditors of BDP do not have recourse to our general credit. In October 2019, Ford notified the Company of its intention to dissolve the BDP joint venture effective October 2021.
Our Financial Services segment consolidates several VIEs. As a result, our
Consolidated Balance Sheets
include secured assets of
$
927
million
and
$
994
million
as of
October 31, 2019
and
2018
, respectively, and liabilities of
$
838
million
and
$
852
million
as of
October 31, 2019
and
2018
, respectively, all of which are involved in securitizations that are treated as asset-backed debt. In addition, our
Consolidated Balance Sheets
include secured assets of
$
537
million
and
$
370
million
as of
October 31, 2019
and
2018
, respectively, and corresponding liabilities of
$
279
million
and
$
205
million
, at the respective dates, which are related to other secured transactions that do not qualify for sale accounting treatment, and therefore, are treated as borrowings secured by operating and finance leases. Investors that hold securitization debt have a priority claim on the cash flows generated by their respective securitized assets to the extent that the related VIEs are required to make principal and interest payments. Investors in securitizations of these entities have either no recourse, or limited recourse, to our general credit.
We also have an interest in other VIEs, which we do not consolidate because we are not the primary beneficiary. Our financial support and maximum loss exposure relating to these non-consolidated VIEs are not material to our financial condition, results of operations, or cash flows.
59
Navistar International Corporation and Subsidiaries
Notes to Consolidated Financial Statements—(Continued)
Related Party Transactions
We have a series of commercial relationships and agreements with TRATON SE and certain of its subsidiaries and affiliates ("TRATON Group"), who holds
16.8
%
of our common stock, for royalties related to use of certain engine technology, contract manufacturing operations performed by us, the sale of engines, the sale and purchase of parts, and a procurement joint venture. We have also entered into development agreements with TRATON Group involving certain engine and transmission projects. This development work is being expensed as incurred. Revenue recognized for the years ended October 31,
2019
,
2018
and
2017
was approximately
$
157
million
,
$
146
million
and
$
119
million
, respectively. Net expenses incurred for the years ended October 31,
2019
,
2018
and
2017
were
$
37
million
,
$
27
million
and
$
7
million
, respectively, included primarily in
Engineering and product development costs
in our
Consolidated Statements of Operations.
Our receivable from TRATON Group was
$
13
million
and
$
10
million
as of
October 31, 2019
and
2018
, respectively. Our payable to TRATON Group was
$
55
million
and
$
25
million
as of
October 31, 2019
and
2018
, respectively.
We have an exclusive long-term agreement to supply military and commercial parts and chassis to our former defense business, ND Holdings, LLC (“Navistar Defense”), in which we retain a
30
%
ownership interest. We also entered into an intellectual property agreement and a transition services agreement. For the year ended
October 31, 2019
, revenue recognized was approximately
$
57
million
. As of
October 31, 2019
, our receivables from Navistar Defense were
$
29
million
.
Cash and Cash Equivalents
All highly liquid financial instruments with original maturities of
90
days or less, consisting primarily of U.S. Treasury bills, federal agency securities, and commercial paper, are classified as cash equivalents.
Restricted cash
is related to our securitization facilities, senior and subordinated floating rate asset-backed notes, wholesale trust agreements, indentured trust agreements, letters of credit, Environmental Protection Agency ("EPA") requirements, and workers compensation requirements. The restricted cash and cash equivalents for our securitized facilities are restricted to pay interest expense, principal, or other amounts associated with our securitization agreements.
Marketable Securities
Marketable securities
consist of available-for-sale securities and are measured and reported at fair value. The difference between amortized cost and fair value is recorded as a component of
Accumulated other comprehensive loss ("AOCL")
in
Stockholders' Deficit,
net of taxes. Most securities with remaining maturities of less than twelve months and other investments needed for current cash requirements are classified as current in our
Consolidated Balance Sheets
. Gains and losses on the sale of marketable securities are determined using the specific identification method and are recorded in
Other expense, net
.
We evaluate our investments in marketable securities at the end of each reporting period to determine if a decline in fair value is other than temporary. When a decline in fair value is determined to be other than temporary, an impairment charge is recorded and a new cost basis in the investment is established. Our marketable securities are classified as Level 1 in the fair value hierarchy.
Derivative Instruments
We utilize derivative instruments to manage certain exposure to changes in foreign currency exchange rates, interest rates, and commodity prices. The fair values of all derivative instruments are recognized as assets or liabilities at the balance sheet date. Changes in the fair value of these derivative instruments are recognized in our operating results or included in
AOCL
, depending on whether the derivative instrument is a fair value or cash flow hedge and whether it qualifies for hedge accounting treatment. We elected to apply the normal purchase and normal sale exclusion to certain commodity contracts that are entered into to be used in production within a reasonable time during the normal course of business. For the years ended
October 31, 2019
,
2018
, and
2017
, we elected not to use hedge accounting and all changes in the fair value of our derivatives, except for those qualifying under the normal purchases and normal sales exception, were recognized in our operating results.
Gains and losses on derivative instruments are recognized in
Costs of products sold
,
Interest expense
, or
Other expense, net
depending on the underlying exposure. The exchange of cash associated with derivative transactions is classified in the
Consolidated Statements of Cash Flows
in the same category as the cash flows from the items subject to the economic hedging relationships.
60
Navistar International Corporation and Subsidiaries
Notes to Consolidated Financial Statements—(Continued)
Trade and Finance Receivables
Trade Receivables
Trade accounts receivable and trade notes receivable primarily arise from sales of goods to independently owned and operated dealers, original equipment manufacturers ("OEMs"), and commercial customers in the normal course of business.
Finance Receivables
Finance receivables consist of the following:
|
•
|
Retail notes
—Retail notes primarily consist of fixed rate loans to commercial customers to facilitate their purchase of new and used trucks, and related equipment.
|
|
•
|
Finance leases
—Finance leases consist of direct financing leases to commercial customers for acquisition of new and used trucks, and related equipment.
|
|
•
|
Wholesale notes
—Wholesale notes primarily consist of variable rate loans to our dealers for the purchase of new and used trucks, and related equipment.
|
|
•
|
Retail accounts
—Retail accounts consist of short-term accounts receivable that finance the sale of products to commercial customers.
|
|
•
|
Wholesale accounts
—Wholesale accounts consist of short-term accounts receivable primarily related to the sales of items other than trucks, and related equipment (e.g. service parts) to dealers.
|
Finance receivables are classified as held-to-maturity and are recorded at gross value less unearned income and are reported net of allowances for doubtful accounts. Unearned revenue is amortized to revenue over the life of the receivable using the effective interest method. Our Financial Services operations purchase the majority of the wholesale notes receivable and accounts receivable arising from our Manufacturing operations. The Financial Services operations retain as collateral a security interest in the equipment associated with retail notes, wholesale notes, and finance leases.
Sales of Trade and Finance Receivables
We sell finance receivables using a process commonly known as securitization, whereby asset-backed securities are sold via public offering or private placement. None of our securitizations qualify for sales accounting treatment or as an off-balance sheet arrangement. As a result, the transferred receivables and the associated secured borrowings are included in our
Consolidated Balance Sheets
and no gain or loss is recorded on the sale.
We also act as servicer of transferred receivables. The servicing duties include collecting payments on receivables and preparing monthly investor reports on the performance of the receivables that are used by the trustee to distribute monthly interest and principal payments to investors. While servicing the receivables, we apply the same servicing policies and procedures that are applied to our owned receivables.
On a limited basis, we have sold certain receivables to third party lenders, without recourse or future obligations, and generally with no gain or loss.
Allowance for Doubtful Accounts
An allowance for doubtful accounts is established through a charge to
Selling, general and administrative ("SG&A") expenses
. The allowance is an estimate of the amount required to absorb probable losses on trade and finance receivables that may become uncollectible. The receivables are charged off when amounts due are determined to be uncollectible.
We have two portfolio segments of finance receivables based on the type of financing inherent to each portfolio. The retail portfolio segment represents loans or leases to end-users for the purchase or lease of vehicles. The wholesale portfolio segment represents loans to dealers to finance their inventory. As the initial measurement attributes and the monitoring and assessment of credit risk or the performance of the receivables are consistent within each of our receivable portfolios, we determined that each portfolio consisted of one class of receivable.
61
Navistar International Corporation and Subsidiaries
Notes to Consolidated Financial Statements—(Continued)
Impaired receivables are specifically identified and segregated from the remaining portfolio. The expected loss on impaired receivables is fully reserved in a separate calculation as a specific reserve based on the unique ability of the customer to pay and the estimated value of the collateral. The historical loss experience and portfolio quality trends of the retail portfolio segment compared to the wholesale portfolio segment are inherently different. A specific reserve on impaired retail receivables is recorded if the estimated fair value of the underlying collateral, net of selling costs, is less than the principal balance of the receivable. We calculate a general reserve on the remaining loan portfolio by applying loss ratios which are determined using actual loss experience and customer payment history, in conjunction with current economic and portfolio quality trends. In addition, we analyze specific economic indicators such as tonnage, fuel prices, and gross domestic product for additional insight into the overall state of the economy and its potential impact on our portfolio.
To establish a specific reserve for impaired wholesale receivables, we consider the same factors discussed above but also consider the financial strength of the dealer and key management, the timeliness of payments, the number and location of satellite locations, the number of dealers of competitor manufacturers in the market area, the type of equipment normally financed, and the seasonality of the business.
Repossessions
Gains or losses arising from the sale of repossessed collateral supporting finance receivables and operating leases are recognized in
Other expense, net
. Repossessed assets are recorded within
Inventories
at the lower of historical cost or fair value, less estimated costs to sell.
Inventories
Inventories are valued at the lower of cost and net realizable value ("NRV"). Cost is principally determined using the first-in, first-out method. Our gross used truck inventory was
$
200
million
at
October 31, 2019
compared to
$
154
million
at
October 31, 2018
, offset by reserves of
$
37
million
and
$
31
million
, respectively.
In valuing our used truck inventory, we are required to make assumptions regarding the level of reserves required to value inventories at their NRV. Our judgments and estimates for used truck inventory are based on an analysis of current and forecasted sales prices, aging of and demand for used trucks, and the mix of sales through various market channels. The NRV is subject to change based on numerous conditions, including age, specifications, mileage, timing of sales, market mix and current and forecasted pricing. While calculations are made after taking these factors into account, significant management judgment regarding expectations for future events is involved. Future events that could significantly influence our judgment and related estimates include general economic conditions in markets where our products are sold, actions of our competitors, and the ability to sell used trucks in a timely manner.
The following table presents our used truck reserve:
|
For the Years Ended October 31,
|
|||||||||||
|
(in millions)
|
2019
|
2018
|
2017
|
||||||||
|
Balance at beginning of period
|
$
|
|
|
$
|
|
|
$
|
|
|
||
|
Additions charged to expense
(A)
|
|
|
|
|
|
|
|||||
|
Deductions/Other adjustments
(B)
|
(
|
)
|
(
|
)
|
(
|
)
|
|||||
|
Balance at end of period
|
$
|
|
|
$
|
|
|
$
|
|
|
||
_________________________
|
(A)
|
Additions charged to expense reflects the increase of the reserve for inventory on hand.
|
|
(B)
|
Deductions/Other adjustments include reductions of the reserve related to the sale of units.
|
Property and Equipment
We report land, buildings, leasehold improvements, machinery and equipment (including tooling and pattern equipment), furniture, fixtures, and equipment, and equipment leased to others at cost, net of depreciation. We initially record assets under capital lease obligations at the lower of their fair value or the present value of the aggregate future minimum lease payments. We depreciate our assets using the straight-line method over the shorter of the lease term or the estimated useful lives of the assets.
62
Navistar International Corporation and Subsidiaries
Notes to Consolidated Financial Statements—(Continued)
The ranges of estimated useful lives are as follows:
|
Years
|
|
|
Buildings
|
20 - 50
|
|
Leasehold improvements
|
3 - 20
|
|
Machinery and equipment
|
3 - 12
|
|
Furniture, fixtures, and equipment
|
3 - 15
|
|
Equipment leased to others
|
1 - 10
|
Long-lived assets are evaluated periodically to determine if an adjustment to the depreciation and amortization period or to the unamortized balance is warranted. Such evaluation is based principally on the expected utilization of the long-lived assets.
We depreciate trucks, tractors, and trailers leased to customers under operating lease agreements on a straight-line basis to the equipment's estimated residual value over the lease term. The residual values of the equipment represent estimates of the value of the assets at the end of the lease contracts and are initially recorded based on estimates of future market values. Realization of the residual values is dependent on our future ability to market the equipment. We review residual values periodically to determine that recorded amounts are appropriate and the equipment is not impaired.
Maintenance and repairs of property and equipment are expensed as incurred. We capitalize replacements and improvements that increase the estimated useful life or productive capacity of an asset and we capitalize interest on major construction and development projects while in progress.
Gains or losses on disposition of property and equipment are recognized in
Other expense, net
.
We test for impairment of long-lived assets whenever events or changes in circumstances indicate that the carrying value of an asset or asset group (hereinafter referred to as "asset group") may not be recoverable by comparing the sum of the estimated undiscounted future cash flows expected to result from the operation of the asset group and its eventual disposition to the carrying value.
During 2019, we identified a triggering event related to continued economic weakness in Brazil and the initiation of strategic cost reduction actions in the Brazilian asset group, which is included in the Global Operations segment. As a result, we estimated the recoverable amount of the asset group and determined that the sum of the undiscounted future cash flows exceeds the carrying value and the asset group was not impaired. It is reasonably possible that within the next twelve months, we could recognize impairment charges if we experience adverse changes in our business including further declines in profitability due to changes in volume, market pricing, cost, or the business environment. Significant adverse changes to our business environment and future cash flows, or our inability to realize cost savings from our restructuring activities, could cause us to record impairment charges in future periods, which could be material.
Included in equipment leased to others are trucks that we produced or acquired to lease to customers as well as equipment that is financed by Bank of Montreal ("BMO") that does not qualify for revenue recognition, as we retained control in the leased property, which are accounted for as operating leases and borrowings, respectively. In the
Consolidated Statement of Cash Flows,
the related expenditures are reflected as the
Purchases of equipment leased to others
in the investing section.
Goodwill and Other Intangible Assets
Goodwill represents the excess of the cost of an acquired business over the amounts assigned to the net assets. Goodwill is not amortized but is tested for impairment at a reporting unit level on an annual basis or more frequently, if circumstances change or an event occurs that would more likely than not reduce the fair value of a reporting unit below its carrying amount.
Qualitative factors may be assessed to determine whether it is more likely than not that the fair value of the reporting unit is less than its carrying amount. If the qualitative assessment indicates that the carrying amount is more likely than not higher than the fair value, goodwill is tested for impairment based on a two-step test. The first step compares the fair value of a reporting unit with its carrying amount, including goodwill. If the fair value of a reporting unit exceeds its carrying amount, goodwill of the reporting unit is considered not impaired, thus the second step of the impairment test is unnecessary. If the carrying amount of a reporting unit exceeds its fair value, the second step of the goodwill impairment test shall be performed to measure the amount of impairment loss, if any. The second step compares the implied fair value of reporting unit goodwill with the carrying amount of that goodwill. If the carrying amount of reporting unit goodwill exceeds the implied fair value of that goodwill, an impairment loss shall be recognized in an amount equal to that excess.
63
Navistar International Corporation and Subsidiaries
Notes to Consolidated Financial Statements—(Continued)
Significant judgment is applied when goodwill is assessed for impairment. This judgment includes developing cash flow projections, selecting appropriate discount rates, identifying relevant market comparables, incorporating general economic and market conditions, and selecting an appropriate control premium. The income approach is based on discounted cash flows which are derived from internal forecasts and economic expectations for each respective reporting unit.
An intangible asset determined to have an indefinite useful life is not amortized until its useful life is determined to no longer be indefinite. Indefinite-lived intangible assets are evaluated each reporting period to determine whether events and circumstances continue to support an indefinite useful life. Indefinite-lived intangible assets are tested for impairment annually or more frequently if events or changes in circumstances indicate that the asset might be impaired. The impairment test consists of a comparison of the fair value of the indefinite-lived intangible asset with its carrying amount. If the carrying amount of an indefinite-lived intangible asset exceeds its fair value, an impairment loss is recognized in an amount equal to that excess.
Significant judgment is applied when evaluating if an intangible asset has a finite useful life. In addition, for indefinite-lived intangible assets, significant judgment is applied in testing for impairment. This judgment includes developing cash flow projections, selecting appropriate discount rates, identifying relevant market comparables, and incorporating general economic and market conditions.
Intangible assets subject to amortization are also evaluated for impairment or when indicators of impairment are determined to exist. We test for impairment of intangible assets, subject to amortization, by comparing the sum of the estimated undiscounted future cash flows expected to result from the operation of the asset group and its eventual disposition to the carrying value. If the sum of the undiscounted future cash flows is less than the carrying value, the fair value of the asset group is determined. The amount of impairment is calculated by subtracting the fair value of the asset group from the carrying value of the asset group. Intangible assets, subject to amortization, could become impaired in the future or require additional charges as a result of declines in profitability due to changes in volume, market pricing, cost, manner in which an asset is used, physical condition of an asset, laws and regulations, or the business environment. We amortize the cost of intangible assets over their respective estimated useful lives, generally on a straight-line basis.
The ranges for the amortization periods are generally as follows:
|
Years
|
|
|
Customer base and relationships
|
3 - 15
|
|
Trademarks
|
|
|
Other
|
3 - 18
|
Equity method investments are recorded at original cost and adjusted periodically to recognize (i) our proportionate share of the investees' net income or losses after the date of investment, (ii) additional contributions made and dividends or distributions received, and (iii) impairment losses resulting from adjustments to fair value.
We assess the potential impairment of our equity method investments and determine fair value based on valuation methodologies, as appropriate, including the present value of estimated future cash flows, estimates of sales proceeds, and market multiples. If an investment is determined to be impaired and the decline in value is other than temporary, we record an appropriate write-down.
Debt Issuance Costs
We amortize debt issuance costs, discounts and premiums over the remaining life of the related debt using the effective interest method. The related income or expense is included in
Interest expense
. We record debt issuance costs, discounts and premiums associated with term debt as a direct deduction from, or addition to, the face amount of the debt. We record debt issuance costs associated with line-of-credit debt as other assets.
Pensions and Postretirement Benefits
We use actuarial methods and assumptions to account for our pension plans and other postretirement benefit plans. Pension and other postretirement benefits expense includes the actuarially computed cost of benefits earned during the current service period, the interest cost on accrued obligations, the expected return on plan assets, the straight-line amortization of net actuarial gains and losses and plan amendments, and adjustments due to settlements and curtailments.
64
Navistar International Corporation and Subsidiaries
Notes to Consolidated Financial Statements—(Continued)
Engineering and Product Development Costs
Engineering and product development costs
arise from ongoing costs associated with improving existing products and manufacturing processes and for the introduction of new truck and engine components and products, and are expensed as incurred.
Advertising Costs
Advertising costs are expensed as incurred and are included in
SG&A expenses
. These costs totaled
$
31
million
,
$
31
million
, and
$
26
million
for the years ended
October 31, 2019
,
2018
, and
2017
, respectively.
Contingency Accruals
We accrue for loss contingencies associated with outstanding litigation for which we have determined it is probable that a loss has occurred and the amount of loss can be reasonably estimated. Our asbestos, product liability, environmental, and workers compensation accruals also include estimated future legal fees associated with the loss contingencies, as we believe we can reasonably estimate those costs. In all other instances, legal fees are expensed as incurred. These expenses may be recorded in
Costs of products sold, SG&A expenses,
or
Other expense, net
. These estimates are based on our expectations of the scope, length to complete, and complexity of the claims. In the future, additional adjustments may be recorded as the scope, length, or complexity of outstanding litigation changes.
Warranty
We generally offer
one
to
five
-year warranty coverage for our truck, bus, and engine products, as well as our service parts. Terms and conditions vary by product, customer, and country. We accrue warranty related costs under standard warranty terms and for certain claims outside the contractual obligation period that we choose to pay as accommodations to our customers.
Our warranty estimates are established using historical information about the nature, frequency, timing, and average cost of warranty claims. Warranty claims are influenced by numerous factors, including new product introductions, technological developments, the competitive environment, the design and manufacturing process, and the complexity and related costs of component parts. We estimate our warranty accrual for our engines and trucks based on engine types and model years. Our warranty accruals take into account the projected ultimate cost-per-unit ("CPU") utilizing historical claims information. The CPU represents the total cash projected to be spent for warranty claims for a particular model year during the warranty period, divided by the number of units sold. The projection of the ultimate CPU is affected by component failure rates, repair costs, and the timing of failures in the product life cycle. Warranty claims inherently have a high amount of variability in timing and severity and can be influenced by external factors. Our warranty estimation process takes into consideration numerous variables that contribute to the precision of the estimate, but also add to the complexity of the model. Including numerous variables also reduces the sensitivity of the model to any one variable. We perform periodic reviews of warranty spend data to allow for timely consideration of the effects on warranty accruals.
Initial warranty estimates for new model year products are based on the previous model year product's warranty experience until the new product progresses sufficiently through its life cycle and related claims data becomes mature. Historically, warranty claims experience for launch-year products has been higher compared to the prior model-year engines; however, over time we have been able to refine both the design and manufacturing process to reduce both the volume and the severity of warranty claims. New product launches require a greater use of judgment in developing estimates until historical experience becomes available.
We record adjustments to pre-existing warranties for changes in our estimate of warranty costs for products sold in prior fiscal years. Such adjustments typically occur when claims experience deviates from historic and expected trends. Future events and circumstances could materially change these estimates and require additional adjustments to our liability.
When we identify cost effective opportunities to address issues in products sold or corrective actions for safety issues, we initiate product recalls or field campaigns. As a result of the uncertainty surrounding the nature and frequency of product recalls and field campaigns, the liability for such actions are generally recorded when we commit to a product recall or field campaign. Each subsequent quarter after a recall or campaign is initiated the recorded liability balance is analyzed, reviewed, and adjusted if necessary to reflect any changes in the anticipated average cost of repair or number of repairs to be completed prospectively. Included in
2019
warranty expense were
$
27
million
of charges related to new campaign issuances as well as changes in estimates of previously issued campaigns, as compared to
$
10
million
and
$
21
million
in
2018
and
2017
, respectively. The charges were primarily recognized as adjustments to pre-existing warranties. As we continue to identify opportunities to improve the design and manufacturing of our engines we may incur additional charges for product recalls and field campaigns to address identified issues.
65
Navistar International Corporation and Subsidiaries
Notes to Consolidated Financial Statements—(Continued)
Optional extended warranty contracts can be purchased for periods ranging from one to ten years. Warranty revenues related to extended warranty contracts are amortized to income, over the life of the contract, (a) in 2019 in proportion to the costs expected to be incurred in satisfying the obligation under the contract and (b) in 2018 and 2017 using the straight-line method. Costs under extended warranty contracts are expensed as incurred. We recognize losses on defined pools of extended warranty contracts when the expected costs for a given pool of contracts exceed related unearned revenue.
When collection is reasonably assured, we also estimate the amount of warranty claim recoveries to be received from our suppliers and record them in
Other current assets
and
Other noncurrent assets
. Recoveries related to specific product recalls, in which a supplier confirms its liability under the recall, are recorded in
Trade and other receivables, net
. Warranty costs and recoveries are included in
Costs of products sold
.
Although we believe that the estimates and judgments discussed herein are reasonable, actual results could differ and we may be exposed to increases or decreases in our warranty accrual that could be material.
Product Warranty Liability
The following table presents accrued product warranty and deferred warranty revenue activity:
________________________
|
For the Years Ended October 31,
|
|||||||||||
|
(in millions)
|
2019
|
2018
|
2017
|
||||||||
|
Balance at beginning of period
|
$
|
|
|
$
|
|
|
$
|
|
|
||
|
Costs accrued and revenues deferred
|
|
|
|
|
|
|
|||||
|
Currency translation adjustment
|
|
|
|
|
(
|
)
|
|||||
|
Adjustments to pre-existing warranties
(A)
|
|
|
(
|
)
|
(
|
)
|
|||||
|
Payments and revenues recognized
|
(
|
)
|
(
|
)
|
(
|
)
|
|||||
|
Other adjustments
(B)
|
|
|
|
|
|
|
|||||
|
Balance at end of period
|
|
|
|
|
|
|
|||||
|
Less: Current portion
|
|
|
|
|
|
|
|||||
|
Noncurrent accrued product warranty and deferred warranty revenue
|
$
|
|
|
$
|
|
|
$
|
|
|
||
|
(A)
|
Adjustments to pre-existing warranties reflect changes in our estimate of warranty costs for products sold in prior fiscal periods. Such adjustments typically occur when claims experience deviates from historic and expected trends. Our warranty liability is generally affected by component failure rates, repair costs, and the timing of failures. Future events and circumstances related to these factors could materially change our estimates and require adjustments to our liability. In addition, new product launches require a greater use of judgment in developing estimates until historical experience becomes available.
|
(B) Other adjustments include a
$
14
million
increase in revenues deferred in connection with the adoption of the new revenue standard (as defined below regarding Financial Accounting Standards Board ("FASB") Accounting Standards Codification ("ASC") 606), partially offset by a
$
2
million
reduction in liability related to the sale of a majority interest in our defense business, Navistar Defense.
In
2019
, we recognized a net benefit of
$
14
million
related to extended warranty contracts on our proprietary Big-Bore engines, which includes a benefit of
$
13
million
related to pre-existing warranties. In
2018
, we recognized a net benefit of
$
29
million
related to extended warranty contracts on our proprietary Big-Bore engines, which includes a benefit of
$
33
million
related to pre-existing warranties. In
2017
, we recognized a net charge of
$
8
million
related to extended warranty contracts on our proprietary Big-Bore engines, which includes a charge of
$
3
million
related to pre-existing warranties.
We have various plans that provide for the granting of stock-based compensation to certain employees, directors, and consultants, which is further described in Note 18,
Stock-Based Compensation Plans
. Shares are issued upon option exercise from
Common stock held in treasury
.
For transactions in which we obtain employee services in exchange for an award of equity instruments, we measure the cost of the services based on the grant date fair value of the award. We recognize the cost over the period during which an employee is required to provide services in exchange for the award, known as the requisite service period (usually the vesting period). Costs related to plans with graded vesting are generally recognized using a straight-line method.
66
Navistar International Corporation and Subsidiaries
Notes to Consolidated Financial Statements—(Continued)
Foreign Currency Translation
We translate the financial statements of foreign subsidiaries whose local currency is their functional currency to U.S. dollars using period-end exchange rates for assets and liabilities and weighted average exchange rates for each period for revenues and expenses. Differences arising from exchange rate changes are included in the
Foreign currency translation adjustment
component of
AOCL.
For foreign subsidiaries whose functional currency is the U.S. dollar, we remeasure non-monetary balance sheet accounts and the related income statement accounts at historical exchange rates. Gains and losses arising from fluctuations in currency exchange rates on transactions denominated in currencies other than the functional currency are recognized in earnings as incurred. We recognized net foreign currency transaction losses of
$
4
million
,
$
2
million
, and
$
16
million
in
2019
,
2018
, and
2017
, respectively, which were recorded in
Other expense, net
.
Income Taxes
We file a consolidated U.S. federal income tax return for NIC and its eligible domestic subsidiaries. Our non-U.S. subsidiaries file income tax returns in their respective local jurisdictions. We account for income taxes under the asset and liability method. Deferred tax assets and liabilities are recognized for the future tax consequences attributable to temporary differences between the financial statement carrying amounts of existing assets and liabilities and their respective tax bases and tax benefit carryforwards. Deferred tax assets and liabilities at the end of each period are determined using enacted tax rates. A valuation allowance is established or maintained when, based on currently available information, it is more likely than not that all or a portion of a deferred tax asset will not be realized.
We recognize the tax benefit from an uncertain tax position claimed or expected to be claimed on a tax return only if it is more likely than not that the tax position will be sustained on examination by taxing authorities, based on the technical merits of the position. The tax benefits recognized in the financial statements from such a position are measured based on the largest benefit that has a greater than fifty percent likelihood of being realized upon ultimate settlement.
We apply the intraperiod tax allocation rules to allocate income taxes among continuing operations, discontinued operations, other comprehensive income (loss), and additional paid-in capital when we meet the criteria as prescribed in the rules.
Earnings Per Share
The calculation of basic earnings per share is based on the weighted average number of our shares of common stock outstanding during the applicable period. The calculation for diluted earnings per share recognizes the effect of all potential dilutive shares of common stock that were outstanding during the respective periods, unless their impact would be anti-dilutive.
Diluted earnings per share recognizes the dilution that would occur if securities or other contracts to issue common stock were exercised or converted into shares using the treasury stock method.
Use of Estimates
The preparation of financial statements in conformity with U.S. generally accepted accounting principles ("GAAP") requires us to make estimates and assumptions that affect the reported amounts of assets and liabilities and disclosure of contingent liabilities at the date of the consolidated financial statements and the reported amounts of revenues and expenses for the periods presented. Significant estimates and assumptions are used for, but are not limited to, pension and other postretirement benefits, allowance for doubtful accounts, income tax contingency accruals and valuation allowances, product warranty accruals, used truck inventory valuations, asbestos and other product liability accruals, asset impairment charges, restructuring charges and litigation-related accruals. Actual results could differ from our estimates.
Concentration Risks
67
Navistar International Corporation and Subsidiaries
Notes to Consolidated Financial Statements—(Continued)
Recently Adopted Accounting Standards
In March 2017, the FASB issued ASU No. 2017-07, "Compensation—Retirement Benefits (Topic 715): Improving the Presentation of Net Periodic Pension Cost and Net Periodic Postretirement Benefit Cost". This ASU requires that an employer disaggregate the service cost component from the other components of net periodic benefit cost. In addition, only the service cost component will be eligible for capitalization. The amendments in this update are required to be applied retrospectively for the presentation of the service cost component and the other components of net periodic benefit cost in the Consolidated Statement of Operations and prospectively, on and after the adoption date, for the capitalization of the service cost component of net periodic benefit cost in assets. This ASU is effective for fiscal years, and interim periods within those fiscal years, beginning after December 15, 2017, with early adoption permitted. We adopted this ASU on November 1, 2018, using a retrospective approach, which resulted in a reclassification of certain net periodic benefit costs from
Selling, general and administrative ("
SG&A")
expenses
to
Other expense, net
in our
Consolidated Statements of Operations
of in the amounts of
$
94
million
and
$
127
million
for the years ended October 31, 2018 and 2017, respectively. See Note 11,
Postretirement benefits
for additional information.
In November 2016, the FASB issued ASU No. 2016-18, "Statement of Cash Flows: Restricted Cash" (Topic 230). This ASU requires that a statement of cash flows explain the change during the period in the total of cash, and cash equivalents, including amounts generally described as restricted cash or restricted cash equivalents. Therefore, amounts generally described as restricted cash and restricted cash equivalents should be included with cash and cash equivalents when reconciling the beginning-of-period and end-of-period total amounts shown on the statement of cash flows. This ASU is effective for fiscal years, and interim periods within those fiscal years, beginning after December 15, 2017. We adopted this ASU on November 1, 2018 using a retrospective transition approach.
The following table provides changes to our
Consolidated Statements of Cash Flows
for
the years ended October 31, 2018 and 2017:
|
(in millions)
|
Under Prior Standard
|
Effects of New Standard
|
As Reported
|
|||||||||
|
Year ended October 31, 2018
|
||||||||||||
|
Cash flows from investing activities
|
||||||||||||
|
Net change in restricted cash and cash equivalents
|
$
|
|
|
$
|
(
|
)
|
$
|
|
|
|||
|
Net cash used in investing activities
|
(
|
)
|
(
|
)
|
(
|
)
|
||||||
|
Increase in cash, cash equivalents and restricted cash
|
|
|
(
|
)
|
|
|
||||||
|
Cash, cash equivalents and restricted cash at beginning of the period
|
|
|
|
|
|
|
||||||
|
Cash, cash equivalents and restricted cash at end of the period
|
|
|
|
|
|
|
||||||
|
(in millions)
|
Under Prior Standard
|
Effects of New Standard
|
As Reported
|
|||||||||
|
Year ended October 31, 2017
|
||||||||||||
|
Cash flows from investing activities
|
||||||||||||
|
Net change in restricted cash and cash equivalents
|
$
|
(
|
)
|
$
|
|
|
$
|
|
|
|||
|
Net cash used in investing activities
|
(
|
)
|
|
|
(
|
)
|
||||||
|
Decrease in cash, cash equivalents and restricted cash
|
(
|
)
|
|
|
(
|
)
|
||||||
|
Cash, cash equivalents and restricted cash at beginning of the period
|
|
|
|
|
|
|
||||||
|
Cash, cash equivalents and restricted cash at end of the period
|
|
|
|
|
|
|
||||||
In May 2014, the FASB issued ASU No. 2014-09, "Revenue from Contracts with Customers" (“ASC 606”), which supersedes the revenue recognition requirements in ASC 605, "Revenue Recognition." This ASU is based on the principle that revenue is
68
Navistar International Corporation and Subsidiaries
Notes to Consolidated Financial Statements—(Continued)
recognized to depict the transfer of goods or services to customers in an amount that reflects the consideration to which the entity expects to be entitled in exchange for those goods or services. This ASU also requires additional disclosure about the nature, amount, timing and uncertainty of revenue and cash flows arising from customer contracts, including significant judgments and changes in judgments and assets recognized from costs incurred to obtain or fulfill a contract. In August 2015, the FASB issued ASU No. 2015-14, which postponed the effective date of ASU No. 2014-09 to fiscal years, and interim periods within those fiscal years, beginning after December 15, 2017, with early adoption permitted on the original effective date for fiscal years beginning after December 15, 2016. We analyzed the impact of the ASU on our portfolio of customer contracts which resulted in changes in the timing and the amount of revenue recognized and gross versus net accounting for certain revenue streams in comparison with previous guidance.
On November 1, 2018, we adopted the new accounting standard ASC 606, "Revenue from Contracts with Customers" and all the related amendments (“new revenue standard”) using the modified retrospective method to all contracts. The comparative information has not been restated and continues to be reported under the accounting standards in effect for those periods. Based on our assessment, the cumulative effect adjustment upon adoption of the new revenue standard had a $37 million impact on our
Accumulated deficit
. The primary impacts include an increase in
Accumulated deficit
due to an increase in the refund liability owed to our customers for future returns of core components. Previously our refund liability was recorded net of our future trade-in value to our suppliers. Under the new revenue standard, we record a liability for the amounts owed to our customers and a deposit asset for the amount we are currently eligible to receive from our suppliers. An additional increase relates to a change in the recognition pattern of revenue for extended warranty contracts. Revenue from these contracts was recognized on a straight-line basis over the life of the contract. Under the new revenue standard, revenue for extended warranty contracts is recorded in proportion to the costs expected to be incurred in satisfying the obligations based on historical cost patterns over the life of similar contracts.
The increase in
Accumulated deficit
is partially offset by certain contracts where revenue recognition occurred as units were delivered and accepted. Under the new revenue standard, when the contract transfers control of a good to a customer as services or production occurs, revenue is recognized over time. An additional decrease in
Accumulated deficit
relates to certain sales that were recorded as leases or borrowings as we retained control in the leased property. Under the new revenue standard, revenue is recognized upon transfer of control for these transactions, less the value of any guarantees provided to the customer. The adoption of the new revenue standard resulted in changes in the classification of
Sales and revenues, net
and
Costs of products sold
in our
Consolidated Statements of Operations
. The new revenue standard also resulted in changes in the classification of certain assets and liabilities in our
Consolidated Balance Sheets
.
We have revised our relevant policy and procedures and provided expanded revenue recognition disclosures based on the new qualitative and quantitative disclosure requirements of the standard in Note 2,
Revenue
.
The cumulative effects of the adjustments made to our November 1, 2018
Consolidated Balance Sheet
for the adoption of the new revenue standard were as follows:
69
Navistar International Corporation and Subsidiaries
Notes to Consolidated Financial Statements—(Continued)
|
(in millions)
|
Balance at October 31, 2018
|
Change Due to New Standard
|
Balance at November 1, 2018
|
|||||||||
|
ASSETS
|
||||||||||||
|
Current assets
|
||||||||||||
|
Trade and other receivables, net
(A)
|
$
|
|
|
$
|
(
|
)
|
$
|
|
|
|||
|
Inventories, net
|
|
|
(
|
)
|
|
|
||||||
|
Other current assets
|
|
|
|
|
|
|
||||||
|
Total current assets
|
|
|
(
|
)
|
|
|
||||||
|
Property and equipment, net
|
|
|
(
|
)
|
|
|
||||||
|
Deferred taxes, net
|
|
|
|
|
|
|
||||||
|
Other noncurrent assets
|
|
|
(
|
)
|
|
|
||||||
|
Total assets
|
$
|
|
|
$
|
(
|
)
|
$
|
|
|
|||
|
LIABILITIES and STOCKHOLDERS’ DEFICIT
|
||||||||||||
|
Liabilities
|
||||||||||||
|
Current liabilities
|
||||||||||||
|
Notes payable and current maturities of long-term debt
|
$
|
|
|
$
|
(
|
)
|
$
|
|
|
|||
|
Other current liabilities
|
|
|
|
|
|
|
||||||
|
Total current liabilities
|
|
|
(
|
)
|
|
|
||||||
|
Long-term debt
|
|
|
(
|
)
|
|
|
||||||
|
Other noncurrent liabilities
|
|
|
(
|
)
|
|
|
||||||
|
Total liabilities
|
|
|
(
|
)
|
|
|
||||||
|
Stockholders’ deficit
(A)
|
||||||||||||
|
Total stockholders’ deficit attributable to Navistar International Corporation
|
(
|
)
|
(
|
)
|
(
|
)
|
||||||
|
Total liabilities and stockholders’ deficit
|
$
|
|
|
$
|
(
|
)
|
$
|
|
|
|||
(A) During the fourth quarter of 2019, we identified additional transition adjustments of
$
10
million
related to the impact of certain core component transactions. As a result,
Trade and other receivables, net
was reduced by
$
10
million
and
Accumulated deficit
was increased by a corresponding amount in our November 1, 2018
Consolidated Balance Sheet.
The correction increased our cumulative effect adjustment upon adoption of the new revenue standard from
$
27
million
to
$
37
million
.
The following reconciles amounts as they would have been reported under the prior standard to current reporting:
______________________
|
Year ended October 31, 2019
(A)
|
||||||||||||
|
(in millions)
|
Under Prior Standard
|
Effects of New Standard
|
As Reported
|
|||||||||
|
Sales of manufactured products, net
|
$
|
|
|
$
|
(
|
)
|
$
|
|
|
|||
|
Costs of products sold
|
|
|
(
|
)
|
|
|
||||||
|
Interest expense
|
|
|
(
|
)
|
|
|
||||||
|
Income before income tax
|
|
|
|
|
|
|
||||||
|
Income tax expense
|
(
|
)
|
|
|
(
|
)
|
||||||
|
Net income
|
$
|
|
|
$
|
|
|
$
|
|
|
|||
(A) Our
Consolidated Statements of Operations
for the year ended October 31, 2019 includes two months of the operating activity of Navistar Defense prior to the sale of a majority interest in our former defense business. See Note 3
Restructurings, Impairments and Divestitures
for additional information.
70
Navistar International Corporation and Subsidiaries
Notes to Consolidated Financial Statements—(Continued)
|
As of October 31, 2019
(A)
|
||||||||||||
|
(in millions)
|
Under Prior Standard
|
Effects of New Standard
|
As Reported
|
|||||||||
|
ASSETS
|
||||||||||||
|
Current assets
|
||||||||||||
|
Trade and other receivables, net
|
$
|
|
|
$
|
(
|
)
|
$
|
|
|
|||
|
Inventories, net
|
|
|
(
|
)
|
|
|
||||||
|
Other current assets
|
|
|
|
|
|
|
||||||
|
Total current assets
|
|
|
(
|
)
|
|
|
||||||
|
Property and equipment, net
|
|
|
(
|
)
|
|
|
||||||
|
Deferred taxes, net
|
|
|
|
|
|
|
||||||
|
Other noncurrent assets
|
|
|
(
|
)
|
|
|
||||||
|
Total assets
|
$
|
|
|
$
|
(
|
)
|
$
|
|
|
|||
|
LIABILITIES and STOCKHOLDERS’ DEFICIT
|
||||||||||||
|
Liabilities
|
||||||||||||
|
Current liabilities
|
||||||||||||
|
Notes payable and current maturities of long-term debt
|
$
|
|
|
$
|
(
|
)
|
$
|
|
|
|||
|
Other current liabilities
|
|
|
|
|
|
|
||||||
|
Total current liabilities
|
|
|
|
|
|
|
||||||
|
Long-term debt
|
|
|
(
|
)
|
|
|
||||||
|
Other noncurrent liabilities
|
|
|
(
|
)
|
|
|
||||||
|
Total liabilities
|
|
|
(
|
)
|
|
|
||||||
|
Stockholders’ deficit
|
||||||||||||
|
Total stockholders’ deficit attributable to Navistar International Corporation
|
(
|
)
|
(
|
)
|
(
|
)
|
||||||
|
Total liabilities and stockholders’ deficit
|
$
|
|
|
$
|
(
|
)
|
$
|
|
|
|||
_________________________
|
(A)
|
Our
Consolidated Balance Sheet
as of October 31, 2019 does not include the impact of Navistar Defense due to the sale of a majority interest in our former defense business. See Note 3,
Restructurings, Impairments and Divestitures
for additional information.
|
Recently Issued Accounting Standards
In February 2018, the FASB issued ASU No. 2018-02, "Income Statement - Reporting Comprehensive Income" (Topic 220). This ASU provides guidance on a reclassification from accumulated other comprehensive income to retained earnings for the effect of the tax rate change resulting from the Tax Act. The amendments eliminate the stranded tax effects resulting from the Tax Act and will improve the usefulness of information reported to financial statement users. This ASU is effective for fiscal years, and interim periods within those fiscal years, beginning after December 15, 2018, with early adoption permitted. This ASU is effective for us in the first quarter of fiscal 2020. The adoption of this guidance will result in a decrease to
Accumulated deficit
and an increase of
Accumulated other comprehensive loss
on our
Consolidated Balance Sheet
in the amount of $189 million related to the reclassification of the stranded tax effects on November 1, 2019.
In August 2018, the FASB issued Accounting Standard Update ("ASU") No. 2018-15, "Intangibles-Goodwill and Other-Internal-Use Software (Subtopic 350-40) Customer’s Accounting for Fees Paid in a Cloud Computing Arrangement". This ASU provides guidance on evaluating the accounting for fees paid by a customer in a cloud computing arrangement (hosting arrangement) and determining when the arrangement includes a software license. This ASU is effective for fiscal years, and interim periods within those fiscal years, beginning after December 15, 2019, with early adoption permitted. This ASU is effective for us in the first quarter of fiscal 2021, and we expect to early adopt this ASU in the first quarter of 2020. We do not expect our adoption of this ASU to have a material effect on our consolidated financial statements.
71
Navistar International Corporation and Subsidiaries
Notes to Consolidated Financial Statements—(Continued)
In June 2016, the FASB issued ASU No. 2016-13, “Financial Instruments - Credit Losses: Measurement of Credit Losses on Financial Instruments” (Topic 326), and subsequently issued various ASUs to clarify the implementation guidance in ASU 2016-13. This ASU sets forth an expected credit loss model which requires the measurement of expected credit losses for financial instruments based on historical experience, current conditions and reasonable and supportable forecasts. This replaces the existing incurred loss model and is applicable to the measurement of credit losses on financial assets measured at amortized cost, and certain off-balance sheet credit exposures. This ASU is effective for fiscal years, and interim periods within those fiscal years, beginning after December 15, 2019, with early adoption permitted. Adoption will require a modified retrospective transition. This ASU is effective for us in the first quarter of fiscal 2021. The impact of this ASU on our consolidated financial statements will primarily result from our Financial Services operations and certain financial guarantees, and will largely depend on economic conditions and forecasts existing at the time of adoption.
In February 2016, the FASB issued ASU No. 2016-02, "Leases" (Topic 842), including subsequently issued ASUs to clarify the implementation guidance in ASU 2016-02 (“new lease standard”). This ASU requires lessees to recognize, on the balance sheet, assets and liabilities for the rights and obligations created by leases of greater than twelve months. The accounting by lessors will remain largely unchanged. This ASU is effective for fiscal years, and interim periods within those fiscal years, beginning after December 15, 2018, with early adoption permitted.
On November 1, 2019, we adopted the new lease standard using the optional modified retrospective basis. We elected the “package of practical expedients”, which permits us not to reassess under the new lease standard our prior conclusions about lease identification, lease classification and initial direct costs. We also elected the practical expedient related to land easements, but did not elect the use-of-hindsight. For lessor accounting, we elected to exclude taxes collected from customers, such as sales and use and value added, from the measurement of lease income and expense.
Based on our preliminary assessment, the cumulative effect adjustment upon adoption of the new lease standard will have an immaterial impact on our
Accumulated deficit
. We evaluated our lease population to assess the effect of the guidance on our consolidated financial statements and will record lease liabilities and right-of-use assets for operating leases related to certain property and equipment. We are in the process of finalizing the assessment of the impact upon adoption and we currently estimate the right-of-use assets and lease liabilities as of November 1, 2019 will range from
$
125
million
to
$
160
million
. The new lease standard will also result in changes in the classification of certain sales that were recorded as borrowings, as we retained control of the related equipment, in
Long term debt
in our
Consolidated Balance Sheets
. Under the new lease standard, these transactions will be classified as operating lease liabilities recognized as
Other noncurrent liabilities
in our
Consolidated Balance Sheets
. In addition, the new lease standard requires lessors to classify cash receipts from leases within operating activities. As a result, we will present cash receipts from operating leases which were accounted for as borrowings as an operating cash inflow rather than the current presentation as a financing cash inflow. The impact related to operating leases accounted for as borrowings on our consolidated financial statements is prospective and will largely depend on our operations at the time of adoption.
We will revise our relevant policy and procedures and provide expanded lease disclosures based on the new qualitative and quantitative disclosure requirements of the new lease standard in our Quarterly Report on Form 10-Q for the first quarter of 2020.
2.
Revenue
We account for a contract when it has approval and commitment from both parties, the rights of the parties are identified, payment terms are identified, the contract has commercial substance and collectability of consideration is probable.
72
Navistar International Corporation and Subsidiaries
Notes to Consolidated Financial Statements—(Continued)
Disaggregation of Revenue
The following tables disaggregate our external revenue by product type for the year ended
October 31, 2019
(in millions):
|
(in millions)
|
Truck
|
Parts
|
Global Operations
|
Financial
Services |
Corporate
and Eliminations |
Total
|
|||||||||||||||||
|
Year Ended October 31, 2019
|
|||||||||||||||||||||||
|
Truck products and services
(A)(B)
|
$
|
|
|
$
|
|
|
$
|
|
|
$
|
|
|
$
|
|
|
$
|
|
|
|||||
|
Truck contract manufacturing
|
|
|
|
|
|
|
|
|
|
|
|
|
|||||||||||
|
Used trucks
|
|
|
|
|
|
|
|
|
|
|
|
|
|||||||||||
|
Engines
|
|
|
|
|
|
|
|
|
|
|
|
|
|||||||||||
|
Parts
|
|
|
|
|
|
|
|
|
|
|
|
|
|||||||||||
|
Extended warranty contracts
|
|
|
|
|
|
|
|
|
|
|
|
|
|||||||||||
|
Sales of manufactured products, net
|
|
|
|
|
|
|
|
|
|
|
|
|
|||||||||||
|
Retail financing
(C)
|
|
|
|
|
|
|
|
|
(
|
)
|
|
|
|||||||||||
|
Wholesale financing
(C)
|
|
|
|
|
|
|
|
|
|
|
|
|
|||||||||||
|
Finance revenues
|
|
|
|
|
|
|
|
|
(
|
)
|
|
|
|||||||||||
|
Sales and revenues, net
|
$
|
|
|
$
|
|
|
$
|
|
|
$
|
|
|
$
|
|
|
$
|
|
|
|||||
_________________________
|
(A)
|
Includes other markets primarily consisting of Bus, Export Truck and Mexico.
|
(B) Includes military sales of
$
62
million
. In December 2018, we completed the sale of a
70
%
equity interest in Navistar Defense. See Note 3,
Restructurings, Impairments and Divestitures
for additional information.
|
(C)
|
Retail financing and Wholesale financing revenues in the Financial Services segment include interest revenue of
$
|
Trucks, Truck Contract Manufacturing, Used trucks, Engines and Parts
Revenue for our Truck products and services, certain truck contract manufacturing, Used trucks, certain Engines and Parts is recognized at a point in time when control is transferred to the customer. Our Trucks, Used trucks, Engines, and Parts have a standard warranty, the estimated cost of which is included in
Costs of products sold
. Operating lease and borrowing revenues are recognized on a straight-line basis over the life of the lease.
Prior to our sale of a
70
%
equity interest in Navistar Defense, certain truck sales to the U.S. government of non-commercial products manufactured to government specification were recognized over time as the goods were manufactured. Certain truck and other contract manufacturing arrangements, unrelated to Navistar Defense, continue to be recognized over time. We recognize revenue over time when the finished assets have no alternative use and we have a right to payment for work performed in the event of a contract cancellation or when we create or enhance an asset that the customer controls as it is being created or enhanced. We recognize revenue using a cost-based input method because it best depicts our progress in satisfying the performance obligation. The selection of the method requires judgement and is based on the nature of the products or services to be provided.
Certain terms or modifications to U.S. and foreign government contracts may have been unpriced; that is, the work to be performed was defined, but the related contract price was to be negotiated at a later date. In situations where we could reliably estimate a profit margin in excess of costs incurred, revenue and gross margin were recorded for delivered contract items. Otherwise, revenue was recognized when the price had been agreed with the applicable government and costs were deferred when it was probable that the costs would be recovered.
An allowance for parts sales returns is recorded as a reduction to revenue based upon estimates using historical information about returns. This includes when we are a reseller of certain service parts that include a core component. A core component is the basic forging or casting, such as an engine block, that can be remanufactured by a certified remanufacturing supplier. When a dealer returns a core component within the specified eligibility period, we refund the core return deposit, which is applied to the customer's account balance.
73
Navistar International Corporation and Subsidiaries
Notes to Consolidated Financial Statements—(Continued)
Extended Warranty Contracts
We sell separately-priced extended warranty contracts that can be purchased for periods ranging from one to ten years. Warranty revenue related to extended warranty contracts is recognized over the life of the contract in proportion to the costs expected to be incurred in satisfying the obligation under the contract. Costs under extended warranty contracts are expensed as incurred. We recognize losses on defined pools of extended warranty contracts when the remaining expected costs for a given pool of contracts exceed the related deferred revenue.
Retail and Wholesale Financing
Financial Services operations recognize revenue from retail notes, finance leases, wholesale notes, retail accounts, and wholesale accounts as Finance revenues over the term of the receivables utilizing the effective interest method. Certain direct origination costs and fees are deferred and recognized as adjustments to yield and are reported as part of interest income over the life of the receivable. Loans are impaired when we conclude it is probable the customer will not be able to make full payment according to contractual terms, or when a loan becomes 90 days or more past due. The accrual of interest is suspended on impaired loans. Finance revenues on these loans are recognized only to the extent cash payments are received. We resume accruing interest on these accounts when payments are current according to the terms of the loans and future payments are reasonably assured.
Operating lease revenues are recognized on a straight-line basis over the life of the lease. Recognition of revenue is suspended when management determines the collection of future revenue is not probable. Recognition of revenue is resumed if collection again becomes probable.
Performance Obligations
Generally, revenue from our sales is recognized at a point in time when control is transferred to the customer which generally occurs upon shipment from our plants and distribution centers or at the time of delivery to our customers. The standard payment term is less than 30 days, but we may extend payment terms on selected receivables. We have elected the practical expedient that allows us to not assess whether a contract has a significant financing component when the time between cash collection and transfer of control is less than one year.
We recognize price allowances, returns and the cost of incentive programs in the normal course of business based on programs offered to dealers or fleet customers. Estimates are made for sales incentives on certain vehicles in dealer stock inventory based on historical experience and announced special programs. The estimated sales incentives and returns are adjusted at the earlier of when the estimate of consideration we expect to receive changes or the consideration becomes fixed. For contracts where there is more than one performance obligation, discounts are generally allocated to all of the performance obligations in the contract based on their relative standalone selling prices.
Revenue on bill and hold arrangements is not recognized until after the customer is notified that the product (i) has been completed according to customer specifications, (ii) has passed our quality control inspections, (iii) is ready for physical transfer to the customer and (iv) the reason for the bill and hold arrangement is substantive.
We have elected to account for shipping and handling activities that occur subsequent to transfer of control as a fulfillment cost and not as a separate performance obligation. The costs are recognized as an expense in
Costs of products sold
when control of the related performance obligation has transferred to the customer. As a practical expedient, we do not disclose the transaction price related to order backlogs as they have an original expected duration of less than one year.
We exclude from revenue any sales taxes, value added taxes and other related taxes collected from customers.
The impact of changes to revenue related to performance obligations satisfied in prior periods was not material to our consolidated financial statements in 2019.
Contract Balances
Most of our contracts are for a period of less than one year. We have certain long-term contract manufacturing and extended warranty contracts that extend beyond one year. We record deferred revenue, primarily related to extended warranty contracts, when we receive consideration from a customer prior to transferring goods or services under the terms of a sales contract. This deferred revenue represents contract liabilities which are included in our
Consolidated Balance Sheets
as components of current and long-term liabilities. The amount of manufacturing contract liabilities as of October 31, 2019 is not material to our consolidated financial statements.
The amount of deferred revenue related to extended warranty programs was
$
279
million
,
$
255
million
, and
$
271
million
at
October 31, 2019
,
2018
, and
2017
, respectively. Revenue recognized under our extended warranty programs was
$
113
million
,
$
104
million
, and
$
144
million
for the years ended
October 31, 2019
,
2018
, and
2017
, respectively. We expect to recognize
74
Navistar International Corporation and Subsidiaries
Notes to Consolidated Financial Statements—(Continued)
revenue under our extended warranty programs of approximately
$
87
million
in 2020,
$
78
million
in 2021,
$
59
million
in 2022,
$
33
million
in 2023,
$
13
million
in 2024 and
$
9
million
thereafter.
Contract Costs
We recognize incremental costs to obtain contracts as an asset if they are recoverable. As a practical expedient, we recognize the costs of obtaining a contract as an expense when the related contract period is less than one year. We have no contract costs capitalized as of
October 31, 2019
.
3.
Restructurings, Impairments and Divestitures
Restructuring charges are recorded based on restructuring plans that have been committed to by management and are, in part, based upon management's best estimates of future events. Changes to the estimates may require future adjustments to the restructuring liabilities.
Manufacturing Restructuring Activities
We continue to focus on our core Truck and Parts businesses and evaluate our portfolio of assets to validate their strategic and financial fit. This allows us to close or divest non-strategic businesses, and identify opportunities to restructure our business and rationalize our Manufacturing operations in an effort to optimize our cost structure. For those areas that fall outside our strategic businesses, we are evaluating alternatives which could result in additional restructuring and other related charges in the future, including but not limited to: (i) impairments, (ii) costs for employee and contractor termination and other related benefits, and (iii) charges for pension and other postretirement contractual benefits and curtailments. These charges could be significant.
Global Operations restructuring activities
During 2017, we initiated cost-reduction actions impacting our workforce in Brazil. As a result, we recognized restructuring charges of
$
6
million
in personnel costs for employee separation and related benefits. During 2018, we recognized a benefit of
$
1
million
upon the completion of these separation actions. These impacts were recorded in our Global Operations segment within
Restructuring charges
in our
Consolidated Statements of Operations.
During 2019, we ceased production at our MWM Motores engine facility in Jesus Maria, Argentina and initiated structural cost reductions in Brazil. As a result, we recognized charges of
$
3
million
of inventory reserves and other related charges in
Costs of products sold
and
$
11
million
in
Restructuring charges
in our
Consolidated Statements of Operations
in our Global Operations segment.
Chatham restructuring activities
During 2011, we committed to close our Chatham, Ontario heavy truck plant, which had been idled since June 2009. At that time, we recognized curtailment and contractual termination charges related to postretirement plans. Based on a ruling regarding pension benefits received from the Financial Services Tribunal in Ontario, Canada, in the third quarter of 2014, we recognized additional charges of
$
14
million
related to the 2011 closure of the Chatham, Ontario plant. Unsuccessful efforts to appeal the ruling in the Ontario court system ended in December 2015. In April 2016, we filed a qualified partial wind-up report for approval by the Financial Services Commission of Ontario ("FSCO"). In January 2017, FSCO issued its approval of the partial wind-up report. In February 2017, we finalized the resolution of statutory severance pay for former employees related to the closure of our Chatham, Ontario plant, resulting in a charge of
$
6
million
in the first quarter of 2017. During the third quarter of 2017, we finalized the Chatham closure agreement. This resulted in the release of
$
66
million
in other post-employment benefit ("OPEB") liabilities. In addition, a pension settlement accounting charge of
$
23
million
was recorded as a result of lump-sum payments made to certain pension plan participants. These charges and benefits were recorded in our Truck segment within
Restructuring charges
in our
Consolidated Statements of Operations
.
Melrose Park Facility restructuring activities
During 2017, we committed to a plan to cease engine production at our plant in Melrose Park, Illinois (“Melrose Park Facility”) in 2018. As a result, we recognized charges of
$
41
million
in our Truck segment. The charges included
$
23
million
related to pension and OPEB liabilities and
$
8
million
for severance pay recorded in
Restructuring charges
in our
Consolidated Statements of Operations.
We also recorded
$
10
million
of inventory reserves and other related charges to
Costs of products sold
in our
Consolidated Statements of Operations.
During
2018, we recognized a benefit of
$
2
million
related to the finalized cessation of production agreement. This benefit was recorded in our Truck segment within
Restructuring charges
in our
Consolidated Statements of Operations.
Production at the Melrose Park Facility ceased in May 2018.
Asset Impairments
During 2019, 2018 and 2017, we concluded that we had triggering events related to certain assets under operating leases. As a result, we recorded charges of
$
6
million
,
$
5
million
, and
$
8
million
, respectively, in our Truck segment.
75
Navistar International Corporation and Subsidiaries
Notes to Consolidated Financial Statements—(Continued)
During 2019 and 2018, we concluded that we had triggering events related to certain long-lived assets. As a result, we recorded a charge of
$
1
million
in our Truck segment. In 2018, we recorded charges of
$
6
million
and
$
1
million
in our Truck segment and Financial Services segment, respectively.
During 2018, we concluded that we had triggering events related to the sale of our railcar business in Cherokee, Alabama requiring the impairment of certain long-lived assets. As a result, we recorded a charge of
$
2
million
in our Truck segment. In February 2018, we completed the sale of the business.
During 2017, we concluded that we had a triggering event in connection with the sale of our fabrication business in Conway, Arkansas requiring the impairment of certain assets. As a result, we recorded charges of
$
5
million
in our Truck segment.
These charges were recorded in
Asset impairment charges
in our
Consolidated Statements of Operations.
See Note 13,
Fair Value Measurements
, for information on the valuation of impaired operating leases and other assets.
Navistar Defense Divestiture
In December 2018, we completed the sale of a
70
%
equity interest in Navistar Defense to an affiliate of Cerberus Capital Management, L.P. The retained interest is accounted for as an equity method investment. In connection with the closing of the transaction, we entered into an exclusive long-term agreement to supply military and commercial parts and chassis to Navistar Defense
.
We also entered into an intellectual property agreement and a transition services agreement concurrent with the sale.
The Navistar Defense purchase price, adjusted for certain calendar year 2018 chargeouts, was approximately
$
140
million
, which was subject to additional adjustments for working capital, transfers of certain liabilities and commitments, and other items. The transaction also includes potential additional consideration of up to
$
17
million
, not included in the gain on the sale, based on cash proceeds from certain contracts which exceed defined thresholds.
4.
Finance Receivables
Finance receivables are receivables of our Financial Services operations. Finance receivables generally consist of wholesale notes and accounts, as well as retail notes, finance leases and accounts. Total finance receivables reported on the
Consolidated Balance Sheets
are net of an allowance for doubtful accounts. Total assets of our Financial Services operations net of intercompany balances were
$
2.8
billion
and
$
2.6
billion
as of
October 31, 2019
and
2018
, respectively. Included in total assets of our Financial Services operations are finance receivables of
$
2.2
billion
as of both
October 31, 2019
and
2018
. We have
two
portfolio segments of finance receivables that we distinguish based on the type of customer and nature of the financing inherent to each portfolio. The retail portfolio segment represents loans or leases to end-users for the purchase or lease of vehicles. The wholesale portfolio segment represents loans to dealers to finance their inventory.
O
ur
Finance receivables, net
in our
Consolidated Balance Sheets
consist of the following:
_________________________
|
As of October 31,
|
|||||||
|
(in millions)
|
2019
|
2018
|
|||||
|
Retail portfolio
|
$
|
|
|
$
|
|
|
|
|
Wholesale portfolio
|
|
|
|
|
|||
|
Total finance receivables
|
|
|
|
|
|||
|
Less: Allowance for doubtful accounts
|
|
|
|
|
|||
|
Total finance receivables, net
|
|
|
|
|
|||
|
Less: Current portion, net
(A)
|
|
|
|
|
|||
|
Noncurrent portion, net
|
$
|
|
|
$
|
|
|
|
|
(A)
|
The current portion of finance receivables is computed based on contractual maturities. Actual cash collections typically vary from the contractual cash flows because of prepayments, extensions, delinquencies, credit losses, and renewals.
|
76
Navistar International Corporation and Subsidiaries
Notes to Consolidated Financial Statements—(Continued)
As of
October 31, 2019
, contractual maturities of our finance receivables are as follows:
|
(in millions)
|
Retail Portfolio
|
Wholesale Portfolio
|
Total
|
||||||||
|
Due in:
|
|
|
|
||||||||
|
2020
|
$
|
|
|
$
|
|
|
$
|
|
|
||
|
2021
|
|
|
|
|
|
|
|||||
|
2022
|
|
|
|
|
|
|
|||||
|
2023
|
|
|
|
|
|
|
|||||
|
2024
|
|
|
|
|
|
|
|||||
|
Thereafter
|
|
|
|
|
|
|
|||||
|
Gross finance receivables
|
|
|
|
|
|
|
|||||
|
Less: Unearned finance income
|
|
|
|
|
|
|
|||||
|
Total finance receivables
|
$
|
|
|
$
|
|
|
$
|
|
|
||
Securitizations
Generally our Financial Services operations transfer wholesale notes, retail accounts receivable, finance leases, and operating leases to special purpose entities ("SPEs"), which generally are only permitted to purchase these assets, issue asset-backed securities, and make payments on the securities issued. Certain operating leases are transferred to a third party without the use of an SPE. In addition to servicing receivables, our continued involvement in these transactions may include an economic interest in the transferred receivables and, in some cases, managing exposure to interest rate changes on the securities using interest rate swaps or interest rate caps. There were
no
transfers of finance receivables that qualified for sale accounting treatment as of
October 31, 2019
and
2018
, and as a result, the transferred finance receivables are included in our
Consolidated Balance Sheets
and the related interest earned is included in
Finance revenues
.
We generally transfer eligible finance receivables into trusts in order to issue asset-backed securities. These trusts are VIEs of which we are determined to be the primary beneficiary and, therefore, the assets and liabilities of the trusts are included in our
Consolidated Balance Sheets
. The outstanding balance of finance receivables transferred into these VIEs was
$
874
million
and
$
956
million
as of
October 31, 2019
and
2018
, respectively.
Other finance receivables related to secured transactions that do not qualify for sale accounting treatment were
$
358
million
and
$
235
million
as of
October 31, 2019
and
2018
, respectively. For more information on assets and liabilities of consolidated VIEs and other securitizations accounted for as secured borrowings by our Financial Services operations, see Note 1,
Summary of Significant Accounting Policies.
Finance Revenues
The following table presents the portion of
Finance revenues
from our Financial Services operations:
|
As of October 31,
|
|||||||||||
|
(in millions)
|
2019
|
2018
|
2017
|
||||||||
|
Retail notes and finance leases revenue
|
$
|
|
|
$
|
|
|
$
|
|
|
||
|
Wholesale notes interest
|
|
|
|
|
|
|
|||||
|
Operating lease revenue
|
|
|
|
|
|
|
|||||
|
Retail and wholesale accounts interest
|
|
|
|
|
|
|
|||||
|
Gross finance revenues
|
|
|
|
|
|
|
|||||
|
Less: Intercompany revenues
|
|
|
|
|
|
|
|||||
|
Finance revenues
|
$
|
|
|
$
|
|
|
$
|
|
|
||
5.
Allowance for Doubtful Accounts
Our
two
finance receivables portfolio segments, retail and wholesale, each consist of
one
class of receivable based on: (i) initial measurement attributes of the receivables, and (ii) the assessment and monitoring of risk and performance of the receivables. For more information, see Note 4,
Finance Receivables
.
77
Navistar International Corporation and Subsidiaries
Notes to Consolidated Financial Statements—(Continued)
The following tables present the activity related to our allowance for doubtful accounts for our retail portfolio segment, wholesale portfolio segment, and trade and other receivables:
|
For the Year Ended October 31, 2019
|
|||||||||||||||
|
(in millions)
|
Retail
Portfolio |
Wholesale
Portfolio |
Trade and
Other Receivables |
Total
|
|||||||||||
|
Allowance for doubtful accounts, at beginning of period
|
$
|
|
|
$
|
|
|
$
|
|
|
$
|
|
|
|||
|
Provision for doubtful accounts
|
|
|
|
|
(
|
)
|
|
|
|||||||
|
Charge-off of accounts
|
(
|
)
|
|
|
(
|
)
|
(
|
)
|
|||||||
|
Recoveries
|
|
|
|
|
|
|
|
|
|||||||
|
Other
(A)
|
|
|
|
|
|
|
|
|
|||||||
|
Allowance for doubtful accounts, at end of period
|
$
|
|
|
$
|
|
|
$
|
|
|
$
|
|
|
|||
|
For the Year Ended October 31, 2018
|
|||||||||||||||
|
(in millions)
|
Retail
Portfolio |
Wholesale
Portfolio |
Trade and
Other Receivables |
Total
|
|||||||||||
|
Allowance for doubtful accounts, at beginning of period
|
$
|
|
|
$
|
|
|
$
|
|
|
$
|
|
|
|||
|
Provision for doubtful accounts
|
|
|
|
|
|
|
|
|
|||||||
|
Charge-off of accounts
|
(
|
)
|
|
|
(
|
)
|
(
|
)
|
|||||||
|
Recoveries
|
|
|
|
|
|
|
|
|
|||||||
|
Other
(A)
|
(
|
)
|
|
|
(
|
)
|
(
|
)
|
|||||||
|
Allowance for doubtful accounts, at end of period
|
$
|
|
|
$
|
|
|
$
|
|
|
$
|
|
|
|||
|
For the Year Ended October 31, 2017
|
|||||||||||||||
|
(in millions)
|
Retail Portfolio
|
Wholesale Portfolio
|
Trade and Other Receivables
|
Total
|
|||||||||||
|
Allowance for doubtful accounts, at beginning of period
|
$
|
|
|
$
|
|
|
$
|
|
|
$
|
|
|
|||
|
Provision for doubtful accounts
|
|
|
|
|
|
|
|
|
|||||||
|
Charge-off of accounts
|
(
|
)
|
|
|
(
|
)
|
(
|
)
|
|||||||
|
Recoveries
|
|
|
|
|
|
|
|
|
|||||||
|
Other
(A)
|
|
|
|
|
(
|
)
|
(
|
)
|
|||||||
|
Allowance for doubtful accounts, at end of period
|
$
|
|
|
$
|
|
|
$
|
|
|
$
|
|
|
|||
____________________
|
(A)
|
Amounts include impact from currency translation.
|
The accrual of interest income is discontinued on certain impaired finance receivables. Impaired finance receivables include accounts with specific loss reserves and certain accounts that are on non-accrual status. In certain cases, we continue to collect payments on our impaired finance receivables.
The following table presents information regarding impaired finance receivables:
|
|
October 31, 2019
|
October 31, 2018
|
|||||||||||||||||||||
|
(in millions)
|
Retail
Portfolio |
Wholesale
Portfolio |
Total
|
Retail
Portfolio |
Wholesale
Portfolio |
Total
|
|||||||||||||||||
|
Impaired finance receivables with specific loss reserves
|
$
|
|
|
$
|
|
|
$
|
|
|
$
|
|
|
$
|
|
|
$
|
|
|
|||||
|
Impaired finance receivables without specific loss reserves
|
|
|
|
|
|
|
|
|
|
|
|
|
|||||||||||
|
Specific loss reserves on impaired finance receivables
|
|
|
|
|
|
|
|
|
|
|
|
|
|||||||||||
|
Finance receivables on non-accrual status
|
|
|
|
|
|
|
|
|
|
|
|
|
|||||||||||
78
Navistar International Corporation and Subsidiaries
Notes to Consolidated Financial Statements—(Continued)
The average balances of the impaired finance receivables in the retail portfolio were
$
21
million
and
$
19
million
for the
years ended October 31, 2019
and
2018
, respectively. See Note 13,
Fair Value Measurements
, for information on the valuation of impaired finance receivables.
|
|
October 31, 2019
|
October 31, 2018
|
|||||||||||||||||||||
|
(in millions)
|
Retail
Portfolio |
Wholesale
Portfolio |
Total
|
Retail
Portfolio |
Wholesale
Portfolio |
Total
|
|||||||||||||||||
|
Current, and less than 30 days past due
|
$
|
|
|
$
|
|
|
$
|
|
|
$
|
|
|
$
|
|
|
$
|
|
|
|||||
|
30-90 days past due
|
|
|
|
|
|
|
|
|
|
|
|
|
|||||||||||
|
Over 90 days past due
|
|
|
|
|
|
|
|
|
|
|
|
|
|||||||||||
|
Total finance receivables
|
$
|
|
|
$
|
|
|
$
|
|
|
$
|
|
|
$
|
|
|
$
|
|
|
|||||
6.
Inventories
T
he following table presents the components of
Inventories
in our
Consolidated Balance Sheets
:
|
As of October 31,
|
|||||||
|
(in millions)
|
2019
|
2018
|
|||||
|
Finished products
|
$
|
|
|
$
|
|
|
|
|
Work in process
|
|
|
|
|
|||
|
Raw materials
|
|
|
|
|
|||
|
Total inventories, net
|
$
|
|
|
$
|
|
|
|
79
Navistar International Corporation and Subsidiaries
Notes to Consolidated Financial Statements—(Continued)
7
. Property and Equipment, Net
The following table presents the components of
Property and equipment, net
in our
Consolidated Balance Sheets
:
|
As of October 31,
|
|||||||
|
(in millions)
|
2019
|
2018
|
|||||
|
Land
|
$
|
|
|
$
|
|
|
|
|
Buildings
|
|
|
|
|
|||
|
Leasehold improvements
|
|
|
|
|
|||
|
Machinery and equipment
|
|
|
|
|
|||
|
Furniture, fixtures, and equipment
|
|
|
|
|
|||
|
Equipment leased to others
|
|
|
|
|
|||
|
Construction in progress
|
|
|
|
|
|||
|
Total property and equipment, at cost
|
|
|
|
|
|||
|
Less: Accumulated depreciation and amortization
|
|
|
|
|
|||
|
Property and equipment, net
|
$
|
|
|
$
|
|
|
|
Certain of our property and equipment serve as collateral for borrowings. See Note 10,
Debt
, for description of borrowings.
Equipment leased to others and assets under financing arrangements and capital lease obligations are as follows:
|
As of October 31,
|
|||||||
|
(in millions)
|
2019
|
2018
|
|||||
|
Equipment leased to others
|
$
|
|
|
$
|
|
|
|
|
Less: Accumulated depreciation
|
|
|
|
|
|||
|
Equipment leased to others, net
|
$
|
|
|
$
|
|
|
|
|
Buildings, machinery, and equipment under financing arrangements and capital lease obligations
|
$
|
|
|
$
|
|
|
|
|
Less: Accumulated depreciation and amortization
|
|
|
|
|
|||
|
Assets under financing arrangements and capital lease obligations, net
|
$
|
|
|
$
|
|
|
|
For the years ended
October 31, 2019
,
2018
, and
2017
, depreciation expense, amortization expense related to assets under financing arrangements and capital lease obligations, and interest capitalized on construction projects are as follows:
|
For the Years Ended October 31,
|
|||||||||||
|
(in millions)
|
2019
|
2018
|
2017
|
||||||||
|
Depreciation expense
|
$
|
|
|
$
|
|
|
$
|
|
|
||
|
Depreciation of equipment leased to others
|
|
|
|
|
|
|
|||||
|
Amortization expense
|
|
|
|
|
|
|
|||||
|
Interest capitalized
|
|
|
|
|
|
|
|||||
Certain depreciation expense on buildings used for administrative purposes is recorded in
SG&A expenses.
Capital Expenditures
At
October 31, 2019
,
2018
, and
2017
, commitments for capital expenditures were
$
37
million
,
$
36
million
, and
$
27
million
, respectively. At
October 31, 2019
,
2018
, and
2017
, liabilities related to capital expenditures that are included in accounts payable were
$
46
million
,
$
50
million
, and
$
48
million
, respectively.
80
Navistar International Corporation and Subsidiaries
Notes to Consolidated Financial Statements—(Continued)
Leases
We lease certain land, buildings, and equipment under non-cancelable operating leases and capital leases expiring at various dates through
2030
. Operating leases generally have
1
to
20
year terms, with one or more renewal options, with terms to be negotiated at the time of renewal. Various leases include provisions for rent escalation to recognize increased operating costs or require us to pay certain maintenance and utility costs. Our rent expense for the years ended
October 31, 2019
,
2018
, and
2017
was
$
23
million
,
$
40
million
, and
$
49
million
, respectively. Rental income from subleases for the years ended
October 31, 2019
,
2018
, and
2017
was
$
3
million
,
$
5
million
, and
$
11
million
, respectively.
Future minimum lease payments at
October 31, 2019
, for those leases having an initial or remaining non-cancelable lease term in excess of one year and certain leases that are treated as finance lease obligations, are as follows:
|
(in millions)
|
Capital
Lease Obligations |
Operating
Leases |
Total
|
||||||||
|
2020
|
$
|
|
|
$
|
|
|
$
|
|
|
||
|
2021
|
|
|
|
|
|
|
|||||
|
2022
|
|
|
|
|
|
|
|||||
|
2023
|
|
|
|
|
|
|
|||||
|
2024
|
|
|
|
|
|
|
|||||
|
Thereafter
|
|
|
|
|
|
|
|||||
|
|
|
|
$
|
|
|
$
|
|
|
|||
|
Less: Interest portion
|
|
|
|
|
|
|
|||||
|
Total
|
$
|
|
|
|
|
||||||
Asset Retirement Obligations
8
. Goodwill and Other Intangible Assets, Net
For our reporting units with goodwill or intangible assets not subject to amortization, we perform impairment tests on an annual basis on August 1, or more frequently if circumstances change or an event occurs that would more likely than not reduce the fair value of a reporting unit below its carrying amount. All of our goodwill is included in our Parts segment. As part of our goodwill impairment analysis for this reporting unit in the current year, we performed a qualitative assessment. Our intangible assets that are not subject to amortization includes a trademark in our Brazilian engine reporting unit within our Global Operations segment of
$
17
million
and
$
18
million
as of
October 31, 2019
and
2018
, respectively.
Information regarding our intangible assets that are subject to amortization is as follows:
|
As of October 31, 2019
|
|||||||||||
|
(in millions)
|
Customer
Base and Relationships |
Trademarks, Patents and Other
|
Total
|
||||||||
|
Gross carrying value
|
$
|
|
|
$
|
|
|
$
|
|
|
||
|
Accumulated amortization
|
(
|
)
|
(
|
)
|
(
|
)
|
|||||
|
Net of amortization
|
$
|
|
|
$
|
|
|
$
|
|
|
||
81
Navistar International Corporation and Subsidiaries
Notes to Consolidated Financial Statements—(Continued)
|
As of October 31, 2018
|
|||||||||||
|
(in millions)
|
Customer
Base and Relationships |
Trademarks, Patents and Other
|
Total
|
||||||||
|
Gross carrying value
|
$
|
|
|
$
|
|
|
$
|
|
|
||
|
Accumulated amortization
|
(
|
)
|
(
|
)
|
(
|
)
|
|||||
|
Net of amortization
|
$
|
|
|
$
|
|
|
$
|
|
|
||
We recorded amortization expense for our finite-lived intangible assets of
$
3
million
,
$
7
million
, and
$
12
million
for the years ended
October 31, 2019
,
2018
, and
2017
, respectively.
Future estimated amortization expense for our finite-lived intangible assets for the remaining years is as follows:
|
(in millions)
|
Estimated
Amortization |
||
|
2020
|
$
|
|
|
|
2021
|
|
|
|
|
2022
|
|
|
|
|
2023
|
|
|
|
|
2024
|
|
|
|
|
Thereafter
|
|
|
|
9
. Investments in Non-consolidated Affiliates
Investments in non-consolidated affiliates
is comprised of our interests in partially-owned affiliates of which our ownership percentages range from
30
%
to
50
%
. We do not control these affiliates, but have the ability to exercise significant influence over their operating and financial policies. We account for them using the equity method of accounting. We made
no
new and incremental investments in these non-consolidated affiliates for
2019
and
2018
.
The following table summarizes
100%
of the combined assets, liabilities, and equity of our equity method affiliates as of October 31:
|
(Unaudited)
|
|||||||
|
(in millions)
|
2019
|
2018
|
|||||
|
Assets:
|
|||||||
|
Current assets
|
$
|
|
|
$
|
|
|
|
|
Noncurrent assets
|
|
|
|
|
|||
|
Total assets
|
$
|
|
|
$
|
|
|
|
|
Liabilities and equity:
|
|||||||
|
Current liabilities
|
$
|
|
|
$
|
|
|
|
|
Noncurrent liabilities
|
|
|
|
|
|||
|
Total liabilities
|
|
|
|
|
|||
|
Partners' capital and stockholders' equity:
|
|||||||
|
NIC
|
|
|
|
|
|||
|
Third parties
|
|
|
|
|
|||
|
Total partners' capital and stockholders' equity
|
|
|
|
|
|||
|
Total liabilities and equity
|
$
|
|
|
$
|
|
|
|
82
Navistar International Corporation and Subsidiaries
Notes to Consolidated Financial Statements—(Continued)
The following table summarizes
100%
of the combined results of operations of our equity method affiliates for the years ended October 31:
|
(Unaudited)
|
|||||||||||
|
(in millions)
|
2019
|
2018
|
2017
|
||||||||
|
Net sales
|
$
|
|
|
$
|
|
|
$
|
|
|
||
|
Costs, expenses, and income tax expense
|
|
|
|
|
|
|
|||||
|
Net income (loss)
|
$
|
|
|
$
|
(
|
)
|
$
|
|
|
||
We recorded sales to certain of these affiliates totaling
$
61
million
,
$
4
million
, and
$
5
million
in
2019
,
2018
, and
2017
, respectively. We also purchased
$
123
million
,
$
166
million
, and
$
156
million
of products and services from certain of these affiliates in
2019
,
2018
, and
2017
, respectively.
Amounts due to and due from our affiliates arising from the sale and purchase of products and services as of
October 31
are as follows:
|
(in millions)
|
2019
|
2018
|
|||||
|
Receivables due from affiliates
|
$
|
|
|
$
|
|
|
|
|
Payables due to affiliates
|
|
|
|
|
|||
10.
Debt
The following tables present the components of
Notes payable and current maturities of long-term debt
and
Long-term debt
in our
Consolidated Balance Sheets
:
|
As of October 31,
|
|||||||
|
(in millions)
|
2019
|
|
2018
|
||||
|
Manufacturing operations
|
|||||||
|
Senior Secured Term Loan Credit Agreement, due 2025, net of unamortized discount of $6 and $7, respectively, and unamortized debt issuance costs of $10 and $11, respectively
|
$
|
|
|
$
|
|
|
|
|
6.625% Senior Notes, due 2026, net of unamortized debt issuance costs of $15 and $17, respectively
|
|
|
|
|
|||
|
4.75% Senior Subordinated Convertible Notes, due 2019, net of unamortized discount of $5 and unamortized debt issuance costs of $1
|
|
|
|
|
|||
|
Loan Agreement related to 6.75% Tax Exempt Bonds, due 2040, net of unamortized debt issuance costs of $5 at both dates
|
|
|
|
|
|||
|
Financed lease obligations
|
|
|
|
|
|||
|
Other
|
|
|
|
|
|||
|
Total Manufacturing operations debt
|
|
|
|
|
|||
|
Less: Current portion
|
|
|
|
|
|||
|
Net long-term Manufacturing operations debt
|
$
|
|
|
$
|
|
|
|
83
Navistar International Corporation and Subsidiaries
Notes to Consolidated Financial Statements—(Continued)
|
As of October 31,
|
|||||||
|
(in millions)
|
2019
|
2018
|
|||||
|
Financial Services operations
|
|||||||
|
Asset-backed debt issued by consolidated SPEs, at fixed and variable rates, due serially through 2023
, net of unamortized debt issuance costs of $4 at both dates
|
$
|
|
|
$
|
|
|
|
|
Senior secured NFC Term Loan, due 2025, net of unamortized discount of $2 and unamortized debt issuance costs of $4
|
|
|
|
|
|||
|
Bank credit facilities, at fixed and variable rates, due dates from 2020 through 2025
, net of unamortized debt issuance costs of $1 and $2, respectively
|
|
|
|
|
|||
|
Commercial paper, at variable rates, program matures in 2022
|
|
|
|
|
|||
|
Borrowings secured by operating and finance leases, at various rates, due serially through 2024
|
|
|
|
|
|||
|
Total Financial Services operations debt
|
|
|
|
|
|||
|
Less: Current portion
|
|
|
|
|
|||
|
Net long-term Financial Services operations debt
|
$
|
|
|
$
|
|
|
|
Manufacturing Operations
Senior Secured Term Loan Credit Agreement
On November 6, 2017, we signed a definitive credit agreement relating to a seven-year senior secured term loan credit facility in an aggregate principal amount of
$
1.6
billion
(“Term Loan Credit Agreement”), guaranteed by Navistar International Corporation and twelve of its subsidiaries. Under the terms of the Term Loan Credit Agreement, the interest rate on the outstanding loan is based, at our option, on an adjusted Eurodollar Rate, plus a margin of
3.50
%
, or a Base Rate, plus a margin of
2.50
%
. The Term Loan Credit Agreement requires quarterly amortization payments of
$
4
million
with the balance due at maturity on November 6, 2024. A portion of the proceeds from the Term Loan Credit Agreement was used to repay all outstanding loans under our previously existing Senior Secured Term Loan Credit Facility ("Term Loan"), to redeem a portion of the previously outstanding 8.25% senior notes ("8.25% Senior Notes") and to pay accrued and unpaid interest thereon, and pay certain transaction fees and expenses incurred in connection with the new Term Loan Credit Agreement. The remainder of the proceeds of the Term Loan Credit Agreement will be used for ongoing working capital purposes and general corporate purposes.
Upon the repayment of the Term Loan in the first quarter of 2018, we recorded approximately
$
16
million
of charges related to the extinguishment of unamortized debt issuance costs associated with the Term Loan, included in
Other expense, net
on our
Consolidated Statements of Operations.
6.625% Senior Notes
On November 6, 2017, we issued
$
1.1
billion
in aggregate principal amount of
6.625
%
senior notes, due 2026 ("
6.625
%
Senior Notes"). Interest is payable on the
6.625
%
Senior Notes on May 1 and November 1 of each year beginning on May 1, 2018 until the maturity date of November 1, 2025. The proceeds from the
6.625
%
Senior Notes offering were used to redeem a portion of our previously existing
8.25
%
Senior Notes, to pay accrued and unpaid interest thereon, and pay the associated prepayment premiums, certain transaction fees and expenses incurred in connection with the new
6.625
%
Senior Notes.
Upon the redemption of the
8.25
%
Senior Notes balance of
$
1.45
billion
in the first quarter of 2018, we recorded approximately
$
30
million
of charges related to the extinguishment of unamortized debt issuance costs and tender premiums associated with the
8.25
%
Senior Notes, included in
Other expense, net
on our
Consolidated Statements of Operations.
4.75% Senior Subordinated Convertible Notes
During the second quarter of 2014, we completed the private sale of
$
411
million
of convertible notes ("2019 Convertible Notes"), including a portion of the underwriter's over-allotment option. We received proceeds of
$
402
million
, net of
$
9
million
of issuance costs. The 2019 Convertible Notes were senior subordinated unsecured obligations of the Company. The 2019 Convertible Notes were fully repaid upon maturity in April 2019, and none were converted into our common stock.
84
Navistar International Corporation and Subsidiaries
Notes to Consolidated Financial Statements—(Continued)
Loan Agreement related to the Tax Exempt Bonds
In October 2010, we benefited from the issuance of certain tax-exempt bond financings, of which: (i) the Illinois Finance Authority issued and sold
$
135
million
aggregate principal amount of Recovery Zone Facility Revenue Bonds due October 15, 2040, and (ii) The County of Cook, Illinois issued and sold
$
90
million
aggregate principal amount of Recovery Zone Facility Revenue Bonds also due October 15, 2040 (collectively the "Tax Exempt Bonds"). The Tax Exempt Bonds were issued pursuant to separate, but substantially identical, indentures of trust dated as of October 1, 2010. The proceeds of the Tax Exempt Bonds were loaned by each issuer to the Company pursuant to separate, but substantially identical, loan agreements dated as of October 1, 2010. The proceeds from the issuance of the Tax Exempt Bonds were restricted for capital expenditures related to financing the relocation of our headquarters, the expansion of an existing warehouse facility, and the development of certain industrial and testing facilities, together with related improvements and equipment. The payment of principal and interest on the Tax Exempt Bonds is guaranteed under separate, but substantially identical, bond guarantees issued by NI. The Tax Exempt Bonds are special, limited obligations of each issuer, payable out of the revenues and income derived under the related loan agreements and related guarantees. The Tax Exempt Bonds bear interest at the fixed rate of
6.50
%
per annum, payable each April 15 and October 15, commencing April 15, 2011. Beginning on October 15, 2020, the Tax Exempt Bonds are subject to optional redemption at the direction of the Company, in whole or in part, at the redemption price equal to
100
%
of the principal amount thereof, plus accrued interest, if any, to the redemption date. In November 2010, we finalized the purchase of the property and buildings that we developed into our new world headquarters site. As of
October 31, 2019
,
none
of the
$
225
million
remains to be reimbursed under the Tax Exempt Bonds.
On November 6, 2017, we entered into the First Amendment to Loan Agreement with The County of Cook, Illinois and the First Amendment to Loan Agreement with the Illinois Finance Authority (“Tax Exempt Bond Amendments”) to adjust various covenants included in the loan agreements relating to the Tax Exempt Bonds, including to permit the Company to incur secured debt up to
$
1.7
billion
, in exchange for a coupon increase from
6.50
%
to
6.75
%
and the grant of a junior priority lien on certain collateral securing the Company’s Term Loan Credit Agreement.
Financed Lease Obligations
We have accounted for as borrowings certain third-party equipment financings by BMO (as defined in Note 14), our preferred source of retail customer financing for equipment offered by us and our dealers in the U.S. The initial transactions do not qualify for revenue recognition as we retain control in the leased property. As a result, the proceeds from the transfer are recorded as an obligation and amortized to revenue over the term of the financing. The remaining obligation will be amortized through
2024
, with interest rates ranging from
3.77
%
to
5.91
%
.
Amended and Restated Asset-Based Credit Facility
In August 2017, we amended and extended our asset-based credit facility ("Amended and Restated Asset-Based Credit Facility") which was previously due in May 2018. The 2017 amendment extended the maturity date to August 2022 and reduced the revolving facility from
$
175
million
to
$
125
million
. The borrowing base of the facility is secured by a first priority security interest in certain of NI's aftermarket parts inventory locations and contains customary covenants, representations and warranties. Our borrowing capacity under the amended facility is subject to a
$
13
million
liquidity block and is impacted by outstanding standby letters of credit issued under this facility and the amount of eligible inventory. Borrowings under the Amended and Restated Asset-Based Credit Facility accrue interest at a rate equal to a base rate or an adjusted LIBOR rate plus a spread. The spread is 175 basis points for Base Rate borrowings and 275 basis points for LIBOR borrowings
.
As of
October 31, 2019
, we had
no
borrowings but did have availability to borrow under the Amended and Restated Asset-Based Credit Facility.
Financial Services Operations
Asset-backed Debt
In May 2017, the maturity date of the variable funding notes ("VFN") facility was extended to May 2018, and the maximum capacity was reduced from
$
450
million
to
$
425
million
. In December 2017, the maturity date of our VFN facility was extended from May 2018 to December 2018, and the maximum capacity was reduced from
$
425
million
to
$
350
million
. In November 2018, the maturity of the VFN facility was extended from December 2018 to May 2020. In April 2019, the VFN facility capacity was temporarily increased from
$
350
million
to
$
550
million
until the earlier of June 28, 2019, or the completion of a qualifying wholesale asset-backed term facility. In June 2019, the capacity decreased from
$
550
million
to
$
350
million
, upon the sale of
$
300
million
of two-year investor notes by Navistar Financial Securities Corporation ("NFSC"). Proceeds were used, in part, to replace the
$
250
million
of investor notes that matured in June 2019. The VFN facility and investor notes are secured by assets of the wholesale note owner trust.
85
Navistar International Corporation and Subsidiaries
Notes to Consolidated Financial Statements—(Continued)
In June 2017, NFSC issued
$
250
million
of two-year investor notes secured by assets of the wholesale note owner trust. Proceeds were used, in part, to replace the
$
250
million
of investor notes that matured in June 2017.
In September 2018, NFSC issued
$
300
million
of two-year investor notes secured by assets of the wholesale note owner trust. Proceeds were used, in part, to replace the
$
300
million
of investor notes that matured in September 2018.
Our Mexican financial services affiliate, Navistar Financial, S.A. de C.V., Sociedad Financiera de Objeto Multiple, Entidad Regulada ("NFM"), issues secured notes, denominated in Mexican pesos, which are secured by retail finance receivables. The aggregate balance of these notes was
$
13
million
and
$
31
million
, net of issuance costs, at
October 31, 2019
, and
2018
, respectively. These notes mature at various dates through March 2023.
In January 2018, Truck Retail Accounts Corporation ("TRAC"), a special purpose, wholly-owned subsidiary of NFC, extended its one-year
$
100
million
revolving facility from April 2018 to January 2019, and in December 2018, the maturity was further extended to January 2020. In April 2019, the maximum capacity of the TRAC funding facility was increased from
$
100
million
to
$
150
million
, and further increased to
$
200
million
in October 2019. Borrowings under this facility are secured by eligible retail accounts receivable.
The majority of the above asset-backed debt is issued by consolidated SPEs and is payable out of collections on the finance receivables sold to the SPEs. This debt is the legal obligation of the SPEs and not NFC or NFM. Assets used as collateral include finance receivables, restricted cash and other assets. The carrying amount of the assets used as collateral for asset-backed debt were
$
1.3
billion
and
$
1.4
billion
at
October 31, 2019
and
2018
, respectively. See Note 4,
Finance Receivables
, for more information on finance receivables used to secure asset-backed debt.
NFC Term Loan and Bank Credit Facilities
On June 1, 2018, in accordance with the terms of the May 2016 amended and extended NFC bank credit facility, the term loan portion was paid in full and the revolving portion capacity was reduced from
$
275
million
to
$
269
million
. On June 12, 2018, certain leverage covenants and baskets under the NFC bank credit facility were amended to allow for completion of the senior secured NFC term loan ("NFC Term Loan") in July 2018. In May 2019, NFC increased the capacity of its revolving bank credit facility from
$
269
million
to
$
748
million
and extended the maturity from September 2021 to May 2024. The additional capacity was used to fully repay the NFC Term Loan balance of
$
398
million
. The early repayment of the NFC Term Loan resulted in the write off of unamortized debt issuance costs and discount of
$
6
million
. The borrowings on the revolving portion of the facility totaled
$
623
million
and
$
21
million
as of
October 31, 2019
and
2018
, respectively.
We borrow funds under various bank credit lines denominated in U.S. dollars and Mexican pesos to be used for investment in our Mexican financial services operations. As of
October 31, 2019
, borrowings outstanding under these arrangements were
$
437
million
, of which
11
%
was denominated in U.S. dollars and
89
%
in Mexican pesos. As of
October 31, 2018
, borrowings outstanding under these arrangements were
$
498
million
, of which
28
%
was denominated in U.S. dollars and
72
%
in Mexican pesos. The interest rates on the dollar-denominated debt are at a negotiated fixed rate or at a variable rate based on LIBOR, and the interest rates on peso-denominated debt are based on the Interbank Interest Equilibrium Rate.
Commercial Paper
Effective February 2017, our Mexican financial services operation entered into a five-year commercial paper program for up to P
1.8
billion
(the equivalent of approximately
$
94
million
at
October 31, 2019
). In October 2018, the commercial paper program was increased to P
3.0
billion
(the equivalent of approximately
$
157
million
at
October 31, 2019
).
Borrowings Secured by Operating and Finance Leases
International Truck Leasing Corporation ("ITLC"), a special purpose, wholly-owned subsidiary of NFC, provides NFC with another source to obtain borrowings secured by leases. The balances are classified under Financial Services operations debt as borrowings secured by leases. ITLC's assets are available to satisfy its creditors' claims prior to such assets becoming available for ITLC's use or to NFC or affiliated companies. For the years ended
October 31, 2019
and
2018
, ITLC issued new borrowings of
$
31
million
and
$
38
million
, respectively. The balance of these secured borrowings issued by ITLC totaled
$
91
million
and
$
105
million
as of
October 31, 2019
and
2018
, respectively. The carrying amount of assets used as collateral was
$
109
million
and
$
125
million
as of
October 31, 2019
and
2018
, respectively. ITLC does not have any unsecured debt.
In 2019, NFC issued new borrowings secured by leases of
$
31
million
. The balance of these secured borrowings issued by NFC totaled
$
31
million
and
zero
as of
October 31, 2019
and
2018
, respectively. The carrying amount of assets used as collateral was
$
30
million
and
zero
as of
October 31, 2019
and
2018
, respectively.
86
Navistar International Corporation and Subsidiaries
Notes to Consolidated Financial Statements—(Continued)
Future Maturities
The aggregate contractual annual maturities for debt as of
October 31, 2019
, are as follows:
|
|
Manufacturing
Operations (A) |
Financial
Services Operations |
Total
|
||||||||
|
(in millions)
|
|
|
|
||||||||
|
2020
|
$
|
|
|
$
|
|
|
$
|
|
|
||
|
2021
|
|
|
|
|
|
|
|||||
|
2022
|
|
|
|
|
|
|
|||||
|
2023
|
|
|
|
|
|
|
|||||
|
2024
|
|
|
|
|
|
|
|||||
|
Thereafter
|
|
|
|
|
|
|
|||||
|
Total debt
|
|
|
|
|
|
|
|||||
|
Less: Unamortized discount and unamortized debt issuance costs
|
|
|
|
|
|
|
|||||
|
Net debt
|
$
|
|
|
$
|
|
|
$
|
|
|
||
Debt and Lease Covenants
We have certain public and private debt agreements, including the Term Loan Credit Agreement, the 6.625% Senior Notes, the loan agreements for the Tax Exempt Bonds, and the Amended and Restated Asset-Based Credit Facility, which limit our ability to incur additional indebtedness, pay dividends, buy back our stock, and take other actions. As of
October 31, 2019
, we were in compliance with these covenants.
We are also required under certain agreements with public and private lenders of NFC to ensure that NFC and its subsidiaries maintain their income before interest expense and income taxes at not less than
125
%
of their total interest expense. Under these agreements, if NFC's consolidated income, including capital contributions made by NIC or NI, before interest expense and income taxes is less than
125
%
of its interest expense, NIC or NI must make payments to NFC to achieve the required ratio. During the years ended
October 31, 2019
,
2018
, and
2017
,
no
such payments were made.
Covenants of the NFC bank credit facility restrict or limit certain payments such as dividends paid to NI. NFC was able to pay a dividend of
$
20
million
to NI in October 2019 within the limits of these covenants. In the
years ended October 31, 2018
and 2017, NFC paid no dividends.
Our Mexican financial services operations also have debt covenants, which require the maintenance of certain financial ratios. As of
October 31, 2019
, we were in compliance with those covenants.
11.
Postretirement Benefits
Defined Benefit Plans
We provide postretirement benefits to a substantial portion of our employees and retirees. Costs associated with postretirement benefits include pension and postretirement health care expenses for employees, retirees, surviving spouses and dependents.
87
Navistar International Corporation and Subsidiaries
Notes to Consolidated Financial Statements—(Continued)
Obligations and Funded Status
A summary of the changes in benefit obligations and plan assets is as follows:
|
Pension Benefits
|
Health and Life
Insurance Benefits |
||||||||||||||
|
(in millions)
|
2019
|
2018
|
2019
|
2018
|
|||||||||||
|
Change in benefit obligations
|
|
|
|
|
|||||||||||
|
Benefit obligations at beginning of year
|
$
|
|
|
$
|
|
|
$
|
|
|
$
|
|
|
|||
|
Service cost
|
|
|
|
|
|
|
|
|
|||||||
|
Interest on obligations
|
|
|
|
|
|
|
|
|
|||||||
|
Actuarial loss (gain)
|
|
|
(
|
)
|
(
|
)
|
(
|
)
|
|||||||
|
Plan amendment
|
|
|
|
|
|
|
|
|
|||||||
|
Settlements
|
(
|
)
|
(
|
)
|
|
|
|
|
|||||||
|
Currency translation
|
(
|
)
|
(
|
)
|
|
|
|
|
|||||||
|
Plan participants' contributions
|
|
|
|
|
|
|
|
|
|||||||
|
Subsidy receipts
|
|
|
|
|
|
|
|
|
|||||||
|
Benefits paid
|
(
|
)
|
(
|
)
|
(
|
)
|
(
|
)
|
|||||||
|
Benefit obligations at end of year
|
$
|
|
|
$
|
|
|
$
|
|
|
$
|
|
|
|||
|
Change in plan assets
|
|
|
|||||||||||||
|
Fair value of plan assets at beginning of year
|
$
|
|
|
$
|
|
|
$
|
|
|
$
|
|
|
|||
|
Actual return on plan assets
|
|
|
(
|
)
|
|
|
|
|
|||||||
|
Settlements
|
(
|
)
|
(
|
)
|
|
|
|
|
|||||||
|
Currency translation
|
(
|
)
|
(
|
)
|
|
|
|
|
|||||||
|
Employer contributions
(A)
|
|
|
|
|
|
|
|
|
|||||||
|
Benefits paid
|
(
|
)
|
(
|
)
|
(
|
)
|
(
|
)
|
|||||||
|
Fair value of plan assets at end of year
|
$
|
|
|
$
|
|
|
$
|
|
|
$
|
|
|
|||
|
Funded status at year end
|
$
|
(
|
)
|
$
|
(
|
)
|
$
|
(
|
)
|
$
|
(
|
)
|
|||
_________________________
|
(A)
|
Employer contributions as of October 31, 2019 consisted of
$
|
|
Pension Benefits
|
Health and Life
Insurance Benefits |
||||||||||||||
|
(in millions)
|
2019
|
2018
|
2019
|
2018
|
|||||||||||
|
Amounts recognized in our Consolidated Balance Sheets consist of:
|
|
|
|||||||||||||
|
Noncurrent asset
|
$
|
|
|
$
|
|
|
$
|
|
|
$
|
|
|
|||
|
Current liability
|
(
|
)
|
(
|
)
|
(
|
)
|
(
|
)
|
|||||||
|
Noncurrent liability
|
(
|
)
|
(
|
)
|
(
|
)
|
(
|
)
|
|||||||
|
Net liability recognized
|
$
|
(
|
)
|
$
|
(
|
)
|
$
|
(
|
)
|
$
|
(
|
)
|
|||
|
Amounts recognized in our accumulated other comprehensive loss consist of:
|
|
|
|||||||||||||
|
Net actuarial loss (gain)
|
$
|
|
|
$
|
|
|
$
|
(
|
)
|
$
|
|
|
|||
|
Net prior service cost
|
|
|
|
|
|
|
|
|
|||||||
|
Net amount recognized
|
$
|
|
|
$
|
|
|
$
|
(
|
)
|
$
|
|
|
|||
The accumulated benefit obligation for pension benefits, a measure that excludes the effect of prospective salary and wage increases, was
$
3.3
billion
for both
October 31, 2019
and
2018
.
The cumulative postretirement benefit adjustment included in the
Consolidated Statement of Stockholders' Deficit
at
October 31, 2019
and 2018 is net of
$
464
million
and
$503 million
, respectively, of deferred taxes related to our postretirement benefit plans.
88
Navistar International Corporation and Subsidiaries
Notes to Consolidated Financial Statements—(Continued)
Information for pension plans with accumulated benefit obligations in excess of plan assets were as follows:
|
As of October 31,
|
|||||||
|
(in millions)
|
2019
|
2018
|
|||||
|
Projected benefit obligations
|
$
|
|
|
$
|
|
|
|
|
Accumulated benefit obligations
|
|
|
|
|
|||
|
Fair value of plan assets
|
|
|
|
|
|||
Generally, the pension plans are non-contributory. Our policy is to fund the pension plans in accordance with applicable U.S. and Canadian government regulations and to make additional contributions from time to time. As of
October 31, 2019
, we have met all regulatory funding requirements. In
2019
, we contributed
$
140
million
to our pension plans to meet regulatory funding requirements. We expect to contribute approximately
$
190
million
to our pension plans during
2020
.
We primarily fund OPEB obligations, such as retiree medical, in accordance with the 1993 Settlement Agreement, which requires us to fund a portion of the plans' annual service cost to a retiree benefit trust (the "Base Trust"). The 1993 Settlement Agreement resolved a class action lawsuit originally filed in 1992 regarding the restructuring of our then applicable retiree health care and life insurance benefits. In
2019
, we contributed
$
1
million
to our OPEB plans to meet legal funding requirements. We expect to contribute
$
1
million
to our OPEB plans during
2020
.
We have certain unfunded pension plans, under which we make payments directly to employees. Benefit payments of
$
17
million
and
$
16
million
for
October 31, 2019
and
2018
, respectively, are included within the amount of Benefits paid in the Change in benefit obligation section above, but are not included in the Change in plan assets section, because the payments are made directly by us and not by separate trusts that are used in the funding of our other pension plans.
We also have certain OPEB benefits that are paid from Company assets (instead of trust assets). Payments from Company assets, net of participant contributions and subsidy receipts, result in differences between benefits paid as presented under Change in benefit obligation and Change in plan assets of
$
37
million
for both
2019
and
2018
.
Components of Net Periodic Benefit Expense and Other Amounts Recognized in Other Comprehensive Loss
The components of our postretirement benefits expense included in our
Consolidated Statements of Operations
consist of the following:
|
For the Years Ended October 31,
|
|||||||||||
|
(in millions)
|
2019
|
2018
|
2017
|
||||||||
|
Pension expense
|
$
|
|
|
$
|
|
|
$
|
|
|
||
|
Health and life insurance expense
|
|
|
|
|
(
|
)
|
|||||
|
Total postretirement benefits expense
|
$
|
|
|
$
|
|
|
$
|
|
|
||
89
Navistar International Corporation and Subsidiaries
Notes to Consolidated Financial Statements—(Continued)
Components of Net Periodic Benefit Expense
Net periodic benefit expense included in our
Consolidated Statements of Operations,
and other amounts recognized in our
Consolidated Statements of Stockholders' Deficit
, for the years ended October 31 is comprised of the following:
|
For the Years Ended October 31,
|
|||||||||||||||||||||||
|
|
Pension Benefits
|
Health and Life
Insurance Benefits |
|||||||||||||||||||||
|
(in millions)
|
2019
|
2018
|
2017
|
2019
|
2018
|
2017
|
|||||||||||||||||
|
Service cost for benefits earned during the period
|
$
|
|
|
$
|
|
|
$
|
|
|
$
|
|
|
$
|
|
|
$
|
|
|
|||||
|
Interest on obligation
|
|
|
|
|
|
|
|
|
|
|
|
|
|||||||||||
|
Amortization of cumulative loss (gain)
|
|
|
|
|
|
|
(
|
)
|
|
|
|
|
|||||||||||
|
Settlements
|
|
|
|
|
|
|
|
|
|
|
|
|
|||||||||||
|
Contractual termination benefits
|
|
|
|
|
|
|
|
|
|
|
|
|
|||||||||||
|
Curtailments and other
|
|
|
|
|
|
|
|
|
|
|
(
|
)
|
|||||||||||
|
Premiums on pension insurance
|
|
|
|
|
|
|
|
|
|
|
|
|
|||||||||||
|
Expected return on assets
|
(
|
)
|
(
|
)
|
(
|
)
|
(
|
)
|
(
|
)
|
(
|
)
|
|||||||||||
|
Net periodic benefit expense
|
$
|
|
|
$
|
|
|
$
|
|
|
$
|
|
|
$
|
|
|
$
|
(
|
)
|
|||||
|
Other Changes in plan assets and benefit obligations recognized in other comprehensive loss (income)
|
|||||||||||||||||||||||
|
Actuarial net loss (gain)
|
$
|
|
|
$
|
(
|
)
|
$
|
(
|
)
|
$
|
(
|
)
|
$
|
(
|
)
|
$
|
(
|
)
|
|||||
|
Prior service cost
|
|
|
|
|
|
|
|
|
|
|
|
|
|||||||||||
|
Amortization of cumulative (loss) gain
|
(
|
)
|
(
|
)
|
(
|
)
|
|
|
(
|
)
|
(
|
)
|
|||||||||||
|
Settlements
|
(
|
)
|
(
|
)
|
(
|
)
|
|
|
|
|
|
|
|||||||||||
|
Curtailments
|
|
|
|
|
(
|
)
|
|
|
|
|
|
|
|||||||||||
|
Total recognized in other comprehensive income
|
$
|
|
|
$
|
(
|
)
|
$
|
(
|
)
|
$
|
(
|
)
|
$
|
(
|
)
|
$
|
(
|
)
|
|||||
|
Total net postretirement benefits (income) expense and other comprehensive loss (income)
|
$
|
|
|
$
|
(
|
)
|
$
|
(
|
)
|
$
|
(
|
)
|
$
|
(
|
)
|
$
|
(
|
)
|
|||||
For the year ended October 31, 2019, we adopted ASU No. 2017-07 "Compensation - Retirement Benefits (Topic 715): Improving the Presentation of Net Periodic Pension Cost and Net Periodic Postretirement Benefit Cost." This ASU requires that an employer disaggregate the service cost component from the other components of net periodic benefit cost. As a result, we have reclassified certain net periodic benefit costs from
SG&A expenses
to
Other expense, net
in our
Consolidated Statements of Operations
. The guidance, which required retrospective application, resulted in a reclassification of
$
94
million
and
$
127
million
for the years ended October 31, 2018 and 2017, respectively.
For the years ended October 31, 2019 and 2018, we purchased group annuity contracts for certain retired pension plan participants resulting in plan remeasurements. As a result, in 2019 and 2018, net actuarial losses of
$
11
million
and
$
2
million
, respectively, were recognized as components of
Accumulated other comprehensive loss
and non-cash pension settlement accounting expenses of
$
142
million
and
$
9
million
, respectively, were recognized in
Other expense, net
in our
Consolidated Statements of Operations
.
In April 2016, we filed a qualified partial wind-up report for approval by FSCO related to the 2011 closure of our Chatham, Ontario plant. FSCO provided formal approval in January 2017. As a result of an ongoing administration review ordered in conjunction with the partial wind-up, we recognized
$
1
million
of contractual termination charges in the first quarter of 2017. During the third quarter of 2017, we finalized the Chatham closure agreement. This resulted in the release of
$
66
million
in OPEB liabilities. In addition, a pension settlement accounting charge of
$
23
million
was recorded as a result of lump-sum payments made to certain pension plan participants. These charges and benefits were recorded in our Truck segment within
Restructuring charges
in our
Consolidated Statements of Operations
. See Note 3,
Restructurings, Impairments and Divestitures
for further discussion. As a result of the pension and OPEB plan remeasurements in connection with the finalization of the Chatham closure agreement, net actuarial gains of
$
21
million
were recognized as a component of Accumulated other comprehensive loss in the third quarter of 2017.
90
Navistar International Corporation and Subsidiaries
Notes to Consolidated Financial Statements—(Continued)
In the third quarter of 2017, we committed to a plan to cease engine production at our Melrose Park Facility in the third quarter of fiscal year 2018. As a result, in the third quarter of 2017, we recognized
$
9
million
of pension and
$
4
million
of OPEB contractual termination benefits charges and
$
10
million
of OPEB curtailment charges. These charges were recorded in our Truck segment within
Restructuring charges
in our
Consolidated Statements of Operations
. See Note 3,
Restructurings, Impairments and Divestitures
for further discussion. A pension curtailment gain of
$
2
million
and net actuarial gains of
$
91
million
resulting from pension and OPEB remeasurements in connection with our Melrose Park Facility announcement were recognized as a component of
Accumulated other comprehensive loss
in the third quarter of 2017.
In 2019 and 2017, in accordance with the intraperiod tax allocation rules, we recorded a net benefit of
$
5
million
and
$
28
million
, respectively, related to domestic continuing operations in Income tax expense in our
Consolidated Statements of Operations
, and an offsetting reduction in
Other comprehensive income
due to the remeasurement of certain pension and OPEB plans.
The estimated amounts for the defined benefit pension plans and the other postretirement benefit plans that will be amortized from
AOCL
into net periodic benefit expense over the next fiscal year are as follows:
|
(in millions)
|
Pension Benefits
|
Health and Life Insurance Benefits
|
|||||
|
Amortization of prior service cost (benefit)
|
$
|
|
|
$
|
|
|
|
|
Amortization of cumulative losses/(gains)
|
|
|
(
|
)
|
|||
Cumulative unrecognized actuarial gains and losses for postretirement benefit plans, where substantially all of the plan participants are inactive, are amortized over the average remaining life expectancy of the inactive plan participants. Otherwise, cumulative gains and losses are amortized over the average remaining service period of active employees.
Plan amendments unrelated to negotiated labor contracts are amortized over the average remaining service period of active employees or the remaining life expectancy of the inactive participants based upon the nature of the amendment and the participants impacted. Plan amendments arising from negotiated labor contracts are amortized over the length of the contract.
Assumptions
The weighted average rate assumptions used in determining benefit obligations for the years ended
October 31, 2019
and
2018
are:
|
|
Pension Benefits
|
Health and Life Insurance Benefits
|
|||||||||
|
|
2019
|
2018
|
2019
|
2018
|
|||||||
|
Discount rate used to determine present value of benefit obligation at end of year
|
|
%
|
|
%
|
|
%
|
|
%
|
|||
|
Expected rate of increase in future compensation levels
|
|
%
|
|
%
|
|
|
|
|
|||
The weighted average rate assumptions used in determining net postretirement benefits expense for
2019
,
2018
, and
2017
were:
|
Pension Benefits
|
Health and Life Insurance Benefits
|
||||||||||||||||
|
2019
|
2018
|
2017
|
2019
|
2018
|
2017
|
||||||||||||
|
Discount rate used to determine service cost
|
|
%
|
|
%
|
|
%
|
|
%
|
|
%
|
|
%
|
|||||
|
Discount rate used to determine interest cost
|
|
%
|
|
%
|
|
%
|
|
%
|
|
%
|
|
%
|
|||||
|
Expected long-term rate of return on plan assets
|
|
%
|
|
%
|
|
%
|
|
%
|
|
%
|
|
%
|
|||||
|
Expected rate of increase in future compensation levels
|
|
%
|
|
%
|
|
%
|
|
|
|
|
|
|
|||||
The actuarial assumptions used to compute the net postretirement benefits expense (income) are based upon information available as of the beginning of the year, specifically market interest rates, past experience, and our best estimate of future economic conditions. Changes in these assumptions may impact the measurement of future benefit costs and obligations. In computing future costs and obligations, we must make assumptions about such things as employee mortality and turnover, expected salary and wage increases, discount rates, expected returns on plan assets, and expected future cost increases. Three of these items have a significant impact on the level of expense recognized: (i) discount rates, (ii) expected rates of return on plan assets, and (iii) healthcare cost trend rates.
91
Navistar International Corporation and Subsidiaries
Notes to Consolidated Financial Statements—(Continued)
We determine the discount rate for our pension and OPEB obligations by matching anticipated future benefit payments for the plans to a high-quality corporate bond yield curve to establish a weighted average discount rate for each plan.
We determine our assumption as to expected return on plan assets by evaluating historical performance, investment community forecasts, and current market conditions. We consider the current asset mix as well as our targeted asset mix when establishing the expected return on plan assets.
Health care cost trend rates have been established through a review of actual recent cost trends and projected future trends. Our retiree medical and drug cost trend assumptions are our best estimate of expected inflationary increases to healthcare costs. Due to the number of former employees and their beneficiaries included in our retiree population (approximately
30,000
), the trend assumptions are based upon both our specific trends and nationally expected trends.
The weighted average rate of increase in the per capita cost of postretirement health care benefits provided through U.S. plans representing
90
%
of our other postretirement benefit obligation, is projected to be
10.1
%
in
2020
and was estimated as
14.4
%
for
2019
. Our projections assume that the rate will decrease to
5
%
by the year 2024 and remain at that level each year thereafter.
The effect of changing the health care cost trend rate by one-percentage point for each future year is as follows:
|
(in millions)
|
One-Percentage
Point Increase |
One-Percentage
Point Decrease |
|||||
|
Effect on total of service and interest cost components
|
$
|
|
|
$
|
(
|
)
|
|
|
Effect on postretirement benefit obligation
|
|
|
(
|
)
|
|||
Plan Assets
The accounting guidance on fair value measurements specifies a fair value hierarchy based upon the observability of inputs used in valuation techniques (Level 1, 2 and 3). See Note 13,
Fair Value Measurements
, for a discussion of the fair value hierarchy.
The following describes the methods and significant assumptions used to estimate fair value of the investments:
|
•
|
Cash and short-term investments
—Valued at cost plus earnings from investments for the period, which approximates fair market value due to the short-term duration. Cash equivalents are valued at net asset value as provided by the administrator of the fund.
|
|
•
|
U.S. Government and agency securities
—Valued at the closing price reported on the active market on which the security is traded or valued by the trustee at year-end using various pricing services of financial institutions, including Interactive Data Corporation, Standard & Poor's and SIX Telekurs.
|
|
•
|
Corporate debt securities
—Valued by the trustee at year-end using various pricing services of financial institutions, including Interactive Data Corporation, Standard & Poor's and SIX Telekurs.
|
|
•
|
Common and preferred stock
—Valued at the closing price reported on the active market on which the security is traded.
|
|
•
|
Collective trusts, Partnerships/joint venture interests, Real estate and Hedge funds
—Valued at the net asset value provided by the administrator of the fund. The net asset value is based on the value of the underlying assets owned by the fund, minus its liabilities, divided by the number of units outstanding.
|
|
•
|
Insurance Linked Securities
—Valued at the net asset value provided by the administrator of the fund. The net asset value is based on the value of the underlying assets owned by the fund, minus its liabilities, then divided by the number of units outstanding.
|
|
•
|
Derivatives
—Valued monthly for the trustee using various pricing services of financial institutions, including Interactive Data Corporation, Standard & Poor’s and SIX Telekurs. Valued monthly by the trustee using various providers of derivatives pricing, most notably Numerix, Markit and Super Derivatives.
|
92
Navistar International Corporation and Subsidiaries
Notes to Consolidated Financial Statements—(Continued)
Pension Assets
The fair value of the pension plan assets by category is summarized below:
|
As of October 31, 2019
|
As of October 31, 2018
|
||||||||||||||||||||||||||||||||||||||
|
(in millions)
|
Level 1
|
Level 2
|
Level 3
|
NAV
|
Total
|
Level 1
|
Level 2
|
Level 3
|
NAV
|
Total
|
|||||||||||||||||||||||||||||
|
Asset Category
|
|||||||||||||||||||||||||||||||||||||||
|
Cash and Cash Equivalents
|
$
|
|
|
$
|
|
|
$
|
|
|
$
|
|
|
$
|
|
|
$
|
|
|
$
|
|
|
$
|
|
|
$
|
|
|
$
|
|
|
|||||||||
|
Collective Trusts and Other
|
|||||||||||||||||||||||||||||||||||||||
|
U.S. Equity
|
|
|
|
|
|
|
|
|
|
|
|
|
|
|
|
|
|
|
|
|
|||||||||||||||||||
|
Canadian Equity
|
|
|
|
|
|
|
|
|
|
|
|
|
|
|
|
|
|
|
|
|
|||||||||||||||||||
|
International Equity
|
|
|
|
|
|
|
|
|
|
|
|
|
|
|
|
|
|
|
|
|
|||||||||||||||||||
|
Global Equity
|
|
|
|
|
|
|
|
|
|
|
|
|
|
|
|
|
|
|
|
|
|||||||||||||||||||
|
Fixed Income - Long Duration Credit
|
|
|
|
|
|
|
|
|
|
|
|
|
|
|
|
|
|
|
|
|
|||||||||||||||||||
|
Fixed Income - Long Duration Government
|
|
|
|
|
|
|
|
|
|
|
|
|
|
|
|
|
|
|
|
|
|||||||||||||||||||
|
Fixed Income - Intermediate Duration Government
|
|
|
|
|
|
|
|
|
|
|
|
|
|
|
|
|
|
|
|
|
|||||||||||||||||||
|
Fixed Income - High Yield
|
|
|
|
|
|
|
|
|
|
|
|
|
|
|
|
|
|
|
|
|
|||||||||||||||||||
|
Fixed Income - Canadian Bond
|
|
|
|
|
|
|
|
|
|
|
|
|
|
|
|
|
|
|
|
|
|||||||||||||||||||
|
Global Real Estate
|
|
|
|
|
|
|
|
|
|
|
|
|
|
|
|
|
|
|
|
|
|||||||||||||||||||
|
Global Infrastructure
|
|
|
|
|
|
|
|
|
|
|
|
|
|
|
|
|
|
|
|
|
|||||||||||||||||||
|
Insurance linked Securities
|
|
|
|
|
|
|
|
|
|
|
|
|
|
|
|
|
|
|
|
|
|||||||||||||||||||
|
Hedge Fund of Funds
|
|
|
|
|
|
|
|
|
|
|
|
|
|
|
|
|
|
|
|
|
|||||||||||||||||||
|
Private Equity
|
|
|
|
|
|
|
|
|
|
|
|
|
|
|
|
|
|
|
|
|
|||||||||||||||||||
|
Private Credit
|
|
|
|
|
|
|
|
|
|
|
|
|
|
|
|
|
|
|
|
|
|||||||||||||||||||
|
Real Estate
|
|
|
|
|
|
|
|
|
|
|
|
|
|
|
|
|
|
|
|
|
|||||||||||||||||||
|
Total
(A)
|
$
|
|
|
$
|
|
|
$
|
|
|
$
|
|
|
$
|
|
|
$
|
|
|
$
|
|
|
$
|
|
|
$
|
|
|
$
|
|
|
|||||||||
___________________
|
(A)
|
In addition, the table above includes the fair value of Canadian pension assets translated at the exchange rates as of
October 31, 2019
and
2018
, respectively, while the change in the plan asset table includes the fair value of Canadian pension assets translated at historical foreign currency rates.
|
93
Navistar International Corporation and Subsidiaries
Notes to Consolidated Financial Statements—(Continued)
Other Postretirement Benefits
The fair value of other postretirement benefit plan assets by category is summarized below:
|
As of October 31, 2019
|
As of October 31, 2018
|
||||||||||||||||||||||||||||||||||||||
|
(in millions)
|
Level 1
|
Level 2
|
Level 3
|
NAV
|
Total
|
Level 1
|
Level 2
|
Level 3
|
NAV
|
Total
|
|||||||||||||||||||||||||||||
|
Asset Category
|
|||||||||||||||||||||||||||||||||||||||
|
Cash and Cash Equivalents
|
$
|
|
|
$
|
|
|
$
|
|
|
$
|
|
|
$
|
|
|
$
|
|
|
$
|
|
|
$
|
|
|
$
|
|
|
$
|
|
|
|||||||||
|
Fixed Income
|
|||||||||||||||||||||||||||||||||||||||
|
U.S. Credit Bonds
|
|
|
|
|
|
|
|
|
|
|
|
|
|
|
|
|
|
|
|
|
|||||||||||||||||||
|
Corporate and Government Bonds
|
|
|
|
|
|
|
|
|
|
|
|
|
|
|
|
|
|
|
|
|
|||||||||||||||||||
|
Government Bonds
|
|
|
|
|
|
|
|
|
|
|
|
|
|
|
|
|
|
|
|
|
|||||||||||||||||||
|
Collective Trusts and Other
|
|||||||||||||||||||||||||||||||||||||||
|
U.S. Equity
|
|
|
|
|
|
|
|
|
|
|
|
|
|
|
|
|
|
|
|
|
|||||||||||||||||||
|
International Equity
|
|
|
|
|
|
|
|
|
|
|
|
|
|
|
|
|
|
|
|
|
|||||||||||||||||||
|
Fixed Income - Multi-Asset Credit
|
|
|
|
|
|
|
|
|
|
|
|
|
|
|
|
|
|
|
|
|
|||||||||||||||||||
|
Real Estate (REITs)
|
|
|
|
|
|
|
|
|
|
|
|
|
|
|
|
|
|
|
|
|
|||||||||||||||||||
|
Mutual Fund
|
|
|
|
|
|
|
|
|
|
|
|
|
|
|
|
|
|
|
|
|
|||||||||||||||||||
|
Insurance Linked Securities
|
|
|
|
|
|
|
|
|
|
|
|
|
|
|
|
|
|
|
|
|
|||||||||||||||||||
|
Hedge Fund of Funds
|
|
|
|
|
|
|
|
|
|
|
|
|
|
|
|
|
|
|
|
|
|||||||||||||||||||
|
Private Equity
|
|
|
|
|
|
|
|
|
|
|
|
|
|
|
|
|
|
|
|
|
|||||||||||||||||||
|
Total
|
$
|
|
|
$
|
|
|
$
|
|
|
$
|
|
|
$
|
|
|
$
|
|
|
$
|
|
|
$
|
|
|
$
|
|
|
$
|
|
|
|||||||||
The investment strategy of the postretirement pension plans (the "Plans") is based on many factors including broad economic factors, historical and prospective information regarding capital market performance, investment strategies available to an asset pool of this size, the current regulatory environment, the Plans’ liabilities and the expected interaction between assets and liabilities. The primary objective of the strategy is to manage assets in such a way that will allow the eventual satisfaction of obligations to the Plans’ participants and beneficiaries. To meet the primary objective the portfolios will be structured to provide liquidity to meet the Plans’ benefit payment obligations and administration expenses, offer a reasonable probability of achieving growth in assets that will assist in closing the Plans’ funding gap and enable the Plans to satisfy their liabilities.
Given the relationship between risk and return a moderately aggressive risk profile was implemented. Primary emphasis is to strike a balance between portfolio stability and portfolio appreciation.
In line with the Plans' return objectives and risk parameters, target asset allocations are approximately
70
%
return-seeking assets and
30
%
liability-hedging assets. The return-seeking assets include long only equities (both active and passive, domestic and international, across the capitalization range) to capture long-term growth opportunities, hedge fund of funds to diversify the equity beta, return seeking credit (including high yield debt, emerging market debt and bank loans) to provide a meaningful level of absolute return and diversify equity beta, global real estate to diversify the equity beta and private equity. The liability-hedging assets are invested in high-quality, investment grade bonds with durations that approximate the durations of the liabilities. The objective of the liability hedging assets is to dampen the Plans’ surplus volatility.
All assets are managed by external investment managers. Each investment manager is expected to prudently manage the assets in a manner consistent with the investment objectives, guidelines, and constraints outlined in their Investment Management Agreements and the Investment Policy Statement. Managers are not permitted to invest outside of the asset class mandate (i.e., equity, fixed income, alternatives) or strategy for which they are appointed.
94
Navistar International Corporation and Subsidiaries
Notes to Consolidated Financial Statements—(Continued)
Expected Future Benefit Payments
The expected future benefit payments for the years ending October 31, 2020 through 2024 and the five years ending October 31, 2029 are estimated as follows:
|
(in millions)
|
Pension Benefit Payments
|
Other Postretirement Benefit Payments
(A)
|
|||||
|
2020
|
$
|
|
|
$
|
|
|
|
|
2021
|
|
|
|
|
|||
|
2022
|
|
|
|
|
|||
|
2023
|
|
|
|
|
|||
|
2024
|
|
|
|
|
|||
|
2025 through 2029
|
|
|
|
|
|||
________________________
|
(A)
|
Payments are net of expected participant contributions and expected federal subsidy receipts.
|
Defined Contribution Plans and Other Contractual Arrangements
Our defined contribution plans cover a substantial portion of domestic salaried employees and certain domestic represented employees. The defined contribution plans contain a 401(k) feature and provide most participants with a matching contribution from the Company. Many participants covered by the plans receive annual Company contributions to their retirement accounts based on an age-weighted percentage of the participant's eligible compensation for the calendar year. Defined contribution expense pursuant to these plans was
$
35
million
in
2019
,
$
33
million
in
2018
and
$
29
million
in
2017
.
In accordance with the 1993 Settlement Agreement, an independent Retiree Supplemental Benefit Trust (the "Supplemental Trust") was established. The Supplemental Trust, and the benefits it provides to certain retirees pursuant to a certain Retiree Supplemental Benefit Program under the 1993 Settlement Agreement ("Supplemental Benefit Program"), is not part of our consolidated financial statements.
Our contingent profit sharing obligations under a certain Supplemental Benefit Trust Profit Sharing Plan ("Supplemental Benefit Trust Profit Sharing Plan") will continue until certain funding targets defined by the 1993 Settlement Agreement are met. In 2019 and 2018, we recorded
$
21
million
and
$
30
million
, respectively, in profit sharing accruals based on the operating performance of the entities that are included in the determination of qualifying profits. For more information on pending arbitration regarding the Supplemental Benefit Trust Profit Sharing Plan, see Note 14,
Commitments and Contingencies
.
12.
Income Taxes
On December 22, 2017, the Tax Act was signed into U.S. law. The Tax Act reduces the statutory corporate income tax rate from 35% to 21%, effective January 1, 2018, required companies to pay a one-time transition tax on earnings of certain foreign subsidiaries that were previously tax-deferred and created new taxes on certain foreign-sourced earnings.
The Tax Act also added many new provisions, which first applied to our taxable year beginning November 1, 2018, including changes to limits on the deductions for executive compensation and interest expense, a tax on global intangible low‐taxed income (“GILTI”), the base erosion anti‐abuse tax (“BEAT”) and a deduction for foreign derived intangible income (“FDII”). Companies can either account for taxes on GILTI as incurred or recognize deferred taxes when basis differences exist that are expected to affect the amount of the GILTI inclusion upon reversal. The Company is electing to account for taxes on GILTI as incurred.
We have completed our accounting for the income tax effects of the Tax Act. There were no significant changes from our previous estimates or “provisional” amounts as permitted by the SEC’s Staff Accounting Bulletin No. 118 (“SAB”) issued on December 22, 2017. We will continue to evaluate the Tax Act’s impact, which may change as a result of additional Treasury guidance, federal or state legislative actions, or changes in accounting standards or related interpretations.
95
Navistar International Corporation and Subsidiaries
Notes to Consolidated Financial Statements—(Continued)
The following table presents the domestic and foreign components of
Income (loss) from continuing operations before income taxes
in our
Consolidated Statements of Operations
:
|
For the Years Ended October 31,
|
|||||||||||
|
(in millions)
|
2019
|
2018
|
2017
|
||||||||
|
Domestic
|
$
|
|
|
$
|
|
|
$
|
(
|
)
|
||
|
Foreign
|
|
|
|
|
|
|
|||||
|
Income from continuing operations before income taxes
|
$
|
|
|
$
|
|
|
$
|
|
|
||
The following table presents the components of
Income tax expense
in our
Consolidated Statements of Operations
:
|
For the Years Ended October 31,
|
|||||||||||
|
(in millions)
|
2019
|
2018
|
2017
|
||||||||
|
Current:
|
|||||||||||
|
Federal
|
$
|
|
|
$
|
|
|
$
|
(
|
)
|
||
|
State and local
|
|
|
|
|
(
|
)
|
|||||
|
Foreign
|
|
|
|
|
|
|
|||||
|
Total current expense
|
$
|
|
|
$
|
|
|
$
|
|
|
||
|
Deferred:
|
|||||||||||
|
Federal
|
$
|
(
|
)
|
$
|
(
|
)
|
$
|
(
|
)
|
||
|
State and local
|
(
|
)
|
|
|
(
|
)
|
|||||
|
Foreign
|
(
|
)
|
|
|
|
|
|||||
|
Total deferred (benefit) expense
|
$
|
(
|
)
|
$
|
|
|
$
|
(
|
)
|
||
|
Total income tax expense
|
$
|
|
|
$
|
|
|
$
|
|
|
||
|
For the Years Ended October 31,
|
|||||||||||
|
(in millions)
|
2019
|
2018
|
2017
|
||||||||
|
Federal income tax expense
(A)
|
$
|
|
|
$
|
|
|
$
|
|
|
||
|
State income taxes, net of federal benefit
|
|
|
|
|
|
|
|||||
|
Credits and incentives
|
|
|
|
|
(
|
)
|
|||||
|
Adjustments to valuation allowances
|
(
|
)
|
(
|
)
|
|
|
|||||
|
Foreign operations
|
|
|
|
|
(
|
)
|
|||||
|
Adjustments to uncertain tax positions
|
|
|
|
|
(
|
)
|
|||||
|
Intraperiod tax allocation offset to equity components
|
(
|
)
|
|
|
(
|
)
|
|||||
|
Non-controlling interest adjustment
|
(
|
)
|
(
|
)
|
(
|
)
|
|||||
|
Foreign Inclusions
|
|
|
|
|
|
|
|||||
|
Tax Act Mandatory Repatriation
|
|
|
|
|
|
|
|||||
|
Tax Act US Deferred Remeasurement
|
|
|
|
|
|
|
|||||
|
Other
|
|
|
|
|
(
|
)
|
|||||
|
Recorded income tax expense
|
$
|
|
|
$
|
|
|
$
|
|
|
||
(A) Federal income tax expense was taxed at a rate of
21
%
for the year ended 2019, and
23
%
for the year ended 2018 and
35%
for the year ended 2017.
96
Navistar International Corporation and Subsidiaries
Notes to Consolidated Financial Statements—(Continued)
The tax effect of pretax income or loss from continuing operations generally should be determined by a computation that does not consider the tax effects of items that are not included in continuing operations. An exception to that incremental approach is applied when there is a loss from continuing operations and income in another category of earnings (for example, discontinued operations, other comprehensive income, additional paid in capital, etc.). In that situation, a tax provision is first allocated to the other categories of earnings. A related tax benefit is then recorded in continuing operations. This exception to the general rule applies even when a valuation allowance is in place at the beginning and end of the year. While intraperiod tax allocations do not change the overall tax provision, it may result in a gross-up of the individual components, thereby changing the amount of tax provision included in each category of income. During 2019 and 2017, we recorded
$
5
million
and
$
28
million
, respectively, for intraperiod allocation benefits in domestic continuing operations associated with certain postretirement plan remeasurement gains.
Not including the effect of the federal income tax rate change, we recognized an income tax benefit of
$
94
million
and
$
137
million
, and income tax expense of
$
57
million
, for the change in the valuation allowance for the years ended October 31, 2019, 2018 and 2017, respectively.
At
October 31, 2019
, undistributed earnings of foreign subsidiaries were
$
357
million
. Income taxes have not been provided on foreign undistributed earnings, whether previously taxed or not, because they are either considered to be permanently invested in foreign subsidiaries or are expected to be repatriated without significant incremental U.S. federal, state or foreign withholding taxes. It is impracticable to determine the exact amount of unrecognized deferred tax liabilities.
The following table presents the components of the deferred tax asset (liability):
|
As of October 31,
|
|||||||
|
(in millions)
|
2019
|
2018
|
|||||
|
Deferred tax assets attributable to:
|
|||||||
|
Employee benefits liabilities
|
$
|
|
|
$
|
|
|
|
|
Net operating loss ("NOL") carryforwards
|
|
|
|
|
|||
|
Product liability and warranty accruals
|
|
|
|
|
|||
|
Research and development
|
|
|
|
|
|||
|
Tax credit carryforwards
|
|
|
|
|
|||
|
Other
|
|
|
|
|
|||
|
Gross deferred tax assets
|
|
|
|
|
|||
|
Less: Valuation allowances
|
|
|
|
|
|||
|
Net deferred tax assets
|
$
|
|
|
$
|
|
|
|
|
Deferred tax liabilities attributable to:
|
|||||||
|
Other
|
$
|
(
|
)
|
$
|
(
|
)
|
|
|
Total deferred tax liabilities
|
$
|
(
|
)
|
$
|
(
|
)
|
|
At
October 31, 2019
, deferred tax assets attributable to NOL carryforwards include
$
465
million
attributable to U.S. federal NOL carryforwards,
$
166
million
attributable to state NOL carryforwards, and
$
151
million
attributable to foreign NOL carryforwards. If not used to reduce future taxable income, U.S. federal NOLs are scheduled to expire beginning in 2032. State NOLs can be carried forward for initial periods of
5
to
20
years, and are scheduled to expire in 2020 to 2039. Approximately one fourth of our foreign net operating losses will expire beginning in 2027, and another approximate one fourth of our foreign net operating losses will expire beginning in 2033, while the majority of the remaining balance has no expiration date. The majority of our tax credits can be carried forward for initial periods of
20
years and are scheduled to expire between 2020 and 2039.
A valuation allowance is required to be established or maintained when, based on currently available information, it is more likely than not that all or a portion of a deferred tax asset will not be realized. The guidance on accounting for income taxes provides important factors in determining whether a deferred tax asset will be realized, including whether there has been sufficient taxable income in recent years and whether sufficient income can reasonably be expected in future years in order to utilize the deferred tax asset.
97
Navistar International Corporation and Subsidiaries
Notes to Consolidated Financial Statements—(Continued)
For the year ended
October 31, 2019
, we have evaluated the need to maintain a valuation allowance for deferred tax assets based on our assessment of whether it is more likely than not that deferred tax benefits will be realized through the generation of future taxable income. Appropriate consideration is given to all available evidence, both positive and negative, in assessing the need for a valuation allowance.
We earned domestic income from continuing operations for the year ended October 31, 2019 and 2018 and incurred a domestic loss from continuing operations for the year ended October 31,
2017
. The positive evidence of domestic income from the years ended October 31, 2019 and 2018 does not outweigh the negative evidence of cumulative losses from prior years. The qualitative and quantitative analysis of current and expected domestic earnings, industry volumes, tax planning strategies, and general business risks resulted in a more likely than not conclusion of not being able to realize a significant portion of our deferred tax assets as of
October 31, 2019
.
We continue to maintain a valuation allowances on the majority of our U.S. deferred tax assets as well as certain foreign deferred tax assets that we believe, on a more-likely-than-not basis, will not be realized based on current forecasted results. For all remaining deferred tax assets, while we believe that it is more likely than not that they will be realized, we believe that it is reasonably possible that additional deferred tax asset valuation allowances could be required in the next twelve months.
The total deferred tax asset valuation allowances were
$
2.0
billion
and
$
2.2
billion
at
October 31, 2019
and
2018
, respectively. In the event we released all of our valuation allowances, almost all would impact income taxes as a benefit in our
Consolidated Statements of Operations.
We recognize the tax benefit from an uncertain tax position only if it is more likely than not that the tax position will be sustained on examination by the taxing authorities, based on the technical merits of the position. As of
October 31, 2019
, the amount of liability for uncertain tax positions was
$
21
million
. The liability at
October 31, 2019
has a recorded offsetting tax benefit associated with various issues that total
$
9
million
. If the unrecognized tax benefits are recognized, all would impact our effective tax rate, except for positions for which we maintain a full valuation allowance against certain deferred tax assets. In this case, the effect may be in the form of an increase in the deferred tax asset related to our net operating loss carryforward, which would be offset by a full valuation allowance.
Changes in the liability for uncertain tax positions are summarized as follows:
|
For the years ended October 31,
|
|||||||
|
(in millions)
|
2019
|
2018
|
|||||
|
Liability for uncertain tax positions at November 1
|
$
|
|
|
$
|
|
|
|
|
Additions as a result of positions taken in prior periods
|
|
|
|
|
|||
|
Decrease as a result of positions taken in prior periods
|
(
|
)
|
(
|
)
|
|||
|
Settlements
|
(
|
)
|
(
|
)
|
|||
|
Liability for uncertain tax positions at October 31
|
$
|
|
|
$
|
|
|
|
We recognize interest and penalties related to uncertain tax positions as part of
Income tax expense
. Total interest and penalties related to our uncertain tax positions resulted in income tax expense of less than
$
1
million
and income tax benefits of
$
1
million
and
$
6
million
for the years ended
October 31, 2019
,
2018
, and 2017, respectively. The total interest and penalties accrued were
$
4
million
and
$
3
million
for the years ended
October 31, 2019
and
2018
, respectively.
We have open tax years back to 2001 with various significant taxing jurisdictions including the U.S., Canada, Mexico, and Brazil. In connection with the examination of tax returns, contingencies may arise that generally result from differing interpretations of applicable tax laws and regulations as they relate to the amount, timing, or inclusion of revenues or expenses in taxable income, or the sustainability of tax credits to reduce income taxes payable. In connection with certain Brazil indirect federal taxes (PIS and COFINS), contingencies that would result in tax recoveries may be resolved in future periods, which could be material.
We believe we have sufficient accruals for our contingent tax liabilities. Annual tax provisions include amounts considered sufficient to pay assessments that may result from examinations of prior year tax returns, although actual results may differ. While it is probable that the liability for unrecognized tax benefits may increase or decrease during the next twelve months, we do not expect any such change would have a material effect on our financial condition, results of operations, or cash flows.
98
Navistar International Corporation and Subsidiaries
Notes to Consolidated Financial Statements—(Continued)
13.
Fair Value Measurements
For assets and liabilities measured at fair value on a recurring and nonrecurring basis, a three-level hierarchy of measurements based upon observable and unobservable inputs is used to arrive at fair value. Observable inputs are developed based on market data obtained from independent sources, while unobservable inputs reflect our assumptions about valuation based on the best information available in the circumstances. Depending on the inputs, we classify each fair value measurement as follows:
|
•
|
Level 1—based upon quoted prices for
identical
instruments in active markets,
|
|
•
|
Level 2—based upon quoted prices for
similar
instruments, prices for identical or similar instruments in markets that are not active, or model-derived valuations, all of whose significant inputs are observable, and
|
|
•
|
Level 3—based upon one or more significant unobservable inputs.
|
The following section describes key inputs and assumptions in our valuation methodologies:
Cash Equivalents and Restricted Cash Equivalents
—Cash equivalents are highly liquid investments with an original maturity of
90
days or less which may include U.S. government and federal agency securities, commercial paper, and other highly liquid investments. The carrying amounts of cash and cash equivalents and restricted cash approximate fair value because of the short-term maturity and highly liquid nature of these instruments.
Marketable Securities
—Our marketable securities portfolios are classified as available-for-sale and may include investments in U.S. government and federal agency securities, commercial paper and other investments with an original maturity greater than
90
days. We use quoted prices from active markets to determine fair value.
Derivative Assets and Liabilities
—We measure the fair value of derivatives assuming that the unit of account is an individual derivative transaction and that each derivative could be sold or transferred on a stand-alone basis. We classify within Level 2 our derivatives that are traded over-the-counter and valued using internal models based on observable market inputs.
Guarantees
—We provide certain guarantees of payments and residual values, to which losses are generally capped, to specific counterparties. The fair value of these guarantees includes a contingent component and a non-contingent component that are based upon internally developed models using unobservable inputs. We classify these liabilities within Level 3. For more information regarding guarantees, see Note 14,
Commitments and Contingencies.
Impaired Finance Receivables and Impaired Assets Under Operating Leases
—Fair values of the underlying collateral are determined by current and forecasted sales prices, aging of and demand for used trucks, and the mix of sales through various market channels. For more information regarding impaired finance receivables, see Note 5,
Allowance for Doubtful Accounts,
and for more information regarding impaired assets under operating leases, see Note 3,
Restructurings, Impairments and Divestitures.
Impaired Property, Plant and Equipment
—We measure the fair value by discounting future cash flows expected to be received from the operation of, or disposition of, the asset or asset group that has been determined to be impaired. For more information regarding the impairment of property, plant and equipment, see Note 3,
Restructurings, Impairments and Divestitures.
99
Navistar International Corporation and Subsidiaries
Notes to Consolidated Financial Statements—(Continued)
The following table presents the financial instruments measured at fair value on a recurring basis:
_________________________
|
As of October 31, 2019
|
As of October 31, 2018
|
||||||||||||||||||||||||||||||
|
(in millions)
|
Level 1
|
Level 2
|
Level 3
|
Total
|
Level 1
|
Level 2
|
Level 3
|
Total
|
|||||||||||||||||||||||
|
Assets
|
|||||||||||||||||||||||||||||||
|
Marketable securities:
|
|||||||||||||||||||||||||||||||
|
U.S. government and federal agency securities
|
$
|
|
|
$
|
|
|
$
|
|
|
$
|
|
|
$
|
|
|
$
|
|
|
$
|
|
|
$
|
|
|
|||||||
|
Derivative financial instruments:
|
|||||||||||||||||||||||||||||||
|
Commodity forward contracts
(A)
|
|
|
|
|
|
|
|
|
|
|
|
|
|
|
|
|
|||||||||||||||
|
Foreign currency contracts
(A)
|
|
|
|
|
|
|
|
|
|
|
|
|
|
|
|
|
|||||||||||||||
|
Interest rate caps
(B)
|
|
|
|
|
|
|
|
|
|
|
|
|
|
|
|
|
|||||||||||||||
|
Total assets
|
$
|
|
|
$
|
|
|
$
|
|
|
$
|
|
|
$
|
|
|
$
|
|
|
$
|
|
|
$
|
|
|
|||||||
|
Liabilities
|
|||||||||||||||||||||||||||||||
|
Derivative financial instruments:
|
|||||||||||||||||||||||||||||||
|
Commodity forward contracts
(C)
|
$
|
—
|
|
$
|
|
|
$
|
|
|
$
|
|
|
$
|
|
|
$
|
|
|
$
|
|
|
$
|
|
|
|||||||
|
Foreign currency contracts
(C)
|
|
|
|
|
|
|
|
|
|
|
|
|
|
|
|
|
|||||||||||||||
|
Guarantees
|
|
|
|
|
|
|
|
|
|
|
|
|
|
|
|
|
|||||||||||||||
|
Total liabilities
|
$
|
|
|
$
|
|
|
$
|
|
|
$
|
|
|
$
|
|
|
$
|
|
|
$
|
|
|
$
|
|
|
|||||||
|
(A)
|
The asset value of commodity forward contracts and foreign currency contracts is included in
Other current assets
in the accompanying
Consolidated Balance Sheets
.
|
|
(B)
|
The asset value of interest rate caps is included in
Other noncurrent assets
in the accompanying
Consolidated Balance Sheets.
|
|
(C)
|
The liability value of commodity forward contracts and foreign currency contracts is included in
Other current liabilities
in the accompanying
Consolidated Balance Sheets.
|
The following table presents the changes for those financial instruments classified within Level 3 of the valuation hierarchy:
|
(in millions)
|
October 31, 2019
|
October 31, 2018
|
|||||
|
Guarantees, at beginning of period
|
(
|
)
|
(
|
)
|
|||
|
Issuances
|
(
|
)
|
(
|
)
|
|||
|
Settlements
|
|
|
|
|
|||
|
Guarantees, at end of period
|
$
|
(
|
)
|
$
|
(
|
)
|
|
There were no transfers of level 3 financial instruments.
T
he following table presents the financial instruments measured at fair value on a nonrecurring basis:
_________________________
|
(in millions)
|
October 31, 2019
|
|
October 31, 2018
|
||||
|
Level 2 financial instruments
|
|||||||
|
Impaired finance receivables
(A)
|
$
|
|
|
$
|
|
|
|
|
Specific loss reserve
|
(
|
)
|
(
|
)
|
|||
|
Fair value
|
$
|
|
|
$
|
|
|
|
|
(A)
|
Certain impaired finance receivables are measured at fair value on a nonrecurring basis. An impairment charge is recorded for the amount by which the carrying value of the receivables exceeds the fair value of the underlying collateral, net of remarketing costs. Fair values of the underlying collateral are determined by reference to dealer vehicle value publications adjusted for certain market factors.
|
100
Navistar International Corporation and Subsidiaries
Notes to Consolidated Financial Statements—(Continued)
In addition to the methods and assumptions we use for the financial instruments recorded at fair value as discussed above, we use the following methods and assumptions to estimate the fair value for our other financial instruments that are not marked to market on a recurring basis. The carrying amounts of
Cash and cash equivalents
,
Restricted cash
, and
Accounts payable
approximate fair values because of the short-term maturity and highly liquid nature of these instruments.
Finance receivables
generally consist of retail and wholesale accounts and notes. The carrying amounts of
Trade and other receivables
and retail and wholesale accounts approximate fair values as a result of the short-term nature of the receivables. The carrying amounts of wholesale notes approximate fair values as a result of the short-term nature of the wholesale notes and their variable interest rate terms. Due to the nature of the aforementioned financial instruments, they have been excluded from the fair value amounts presented in the table below.
The fair values of our retail notes are estimated by discounting expected cash flows at current market rates. The fair values of our retail notes are classified as Level 3 financial instruments.
The fair values of our debt instruments classified as Level 1 were determined using quoted market prices. The 6.75% Tax Exempt Bonds, due 2040, are traded, but the trading market is illiquid, and as a result, the Loan Agreement underlying the Tax Exempt Bonds is classified as Level 2. Trading in our 6.625% Senior Notes is limited to qualified institutional buyers; therefore the notes are classified as Level 2. The fair values of our Level 3 debt instruments are generally determined using internally developed valuation techniques such as discounted cash flow modeling. Inputs such as discount rates and credit spreads reflect our estimates of assumptions that market participants would use in pricing the instrument and may be unobservable.
The following tables present the carrying values and estimated fair values of financial instruments:
|
As of October 31, 2019
|
|||||||||||||||||||
|
|
Estimated Fair Value
|
Carrying Value
|
|||||||||||||||||
|
(in millions)
|
Level 1
|
Level 2
|
Level 3
|
Total
|
|||||||||||||||
|
Assets
|
|||||||||||||||||||
|
Retail notes
|
$
|
|
|
$
|
|
|
$
|
|
|
$
|
|
|
$
|
|
|
||||
|
Liabilities
|
|||||||||||||||||||
|
Debt:
|
|||||||||||||||||||
|
Manufacturing operations
|
|||||||||||||||||||
|
Senior Secured Term Loan Credit Agreement, due 2025
|
|
|
|
|
|
|
|
|
|
|
|||||||||
|
6.625% Senior Notes, due 2026
|
|
|
|
|
|
|
|
|
|
|
|||||||||
|
Loan Agreement related to 6.75% Tax Exempt Bonds, due 2040
|
|
|
|
|
|
|
|
|
|
|
|||||||||
|
Financed lease obligations
|
|
|
|
|
|
|
|
|
|
|
|||||||||
|
Other
(A)
|
|
|
|
|
|
|
|
|
|
|
|||||||||
|
Financial Services operations
|
|||||||||||||||||||
|
Asset-backed debt issued by consolidated SPEs, due serially through 2023
|
|
|
|
|
|
|
|
|
|
|
|||||||||
|
Bank credit facilities, due dates from 2019 through 2025
|
|
|
|
|
|
|
|
|
|
|
|||||||||
|
Commercial paper, program matures in 2022
|
|
|
|
|
|
|
|
|
|
|
|||||||||
|
Borrowings secured by operating and finance leases, due serially through 2024
|
|
|
|
|
|
|
|
|
|
|
|||||||||
101
Navistar International Corporation and Subsidiaries
Notes to Consolidated Financial Statements—(Continued)
|
As of October 31, 2018
|
|||||||||||||||||||
|
|
Estimated Fair Value
|
Carrying Value
|
|||||||||||||||||
|
(in millions)
|
Level 1
|
Level 2
|
Level 3
|
Total
|
|||||||||||||||
|
Assets
|
|||||||||||||||||||
|
Retail notes
|
$
|
|
|
$
|
|
|
$
|
|
|
$
|
|
|
$
|
|
|
||||
|
Liabilities
|
|||||||||||||||||||
|
Debt:
|
|||||||||||||||||||
|
Manufacturing operations
|
|||||||||||||||||||
|
Senior Secured Term Loan Credit Agreement, due 2025
|
|
|
|
|
|
|
|
|
|
|
|||||||||
|
6.625% Senior Notes, due 2026
|
|
|
|
|
|
|
|
|
|
|
|||||||||
|
4.75% Senior Subordinated Convertible Notes, due 2019
(B)
|
|
|
|
|
|
|
|
|
|
|
|||||||||
|
Loan Agreement related to 6.75% Tax Exempt Bonds, due 2040
|
|
|
|
|
|
|
|
|
|
|
|||||||||
|
Financed lease obligations
|
|
|
|
|
|
|
|
|
|
|
|||||||||
|
Other
|
|
|
|
|
|
|
|
|
|
|
|||||||||
|
Financial Services operations
|
|||||||||||||||||||
|
Asset-backed debt issued by consolidated SPEs, due serially through 2023
|
|
|
|
|
|
|
|
|
|
|
|||||||||
|
Senior secured NFC Term Loan, due 2025
|
|
|
|
|
|
|
|
|
|
|
|||||||||
|
Bank credit facilities, due dates from 2019 through 2025
|
|
|
|
|
|
|
|
|
|
|
|||||||||
|
Commercial paper, program matures in 2022
|
|
|
|
|
|
|
|
|
|
|
|||||||||
|
Borrowings secured by operating and finance leases, due serially through 2024
|
|
|
|
|
|
|
|
|
|
|
|||||||||
|
(A)
|
Excludes capital lease obligation debt of
$
|
|
(B)
|
|
14.
Commitments and Contingencies
Guarantees
We occasionally provide guarantees that could obligate us to make future payments if the primary entity fails to perform under its contractual obligations. We have recognized liabilities for some of these guarantees in our
Consolidated Balance Sheets
as they meet the recognition and measurement provisions of GAAP. In addition to the liabilities that have been recognized, we are contingently liable for other potential losses under various guarantees. We do not believe that claims that may be made under such guarantees would have a material effect on our financial condition, results of operations, or cash flows.
Under the terms of the Navistar Capital Operating Agreement, Navistar Capital (a program of BMO Harris Bank N.A. and Bank of Montreal (together "BMO")) is our third-party preferred source of retail and lease customer financing for equipment offered by us and our dealers in the U.S. We refer to this alliance as "Navistar Capital." The Navistar Capital Operating Agreement, as amended, contains a loss sharing arrangement under which we generally reimburse BMO for excess credit losses as defined in the arrangement. Our exposure to loss is mitigated because contracts under the Navistar Capital Operating Agreement are secured by the financed equipment. There were
$
1.6
billion
and
$
1.5
billion
of outstanding loan principal and operating lease payments receivable at
October 31, 2019
and
2018
, respectively, financed through the Navistar Capital Operating Agreement and subject to the loss sharing arrangements in the U.S. The related financed values of these outstanding contracts were
$
2.7
billion
and
$
2.5
billion
at
October 31, 2019
and
2018
, respectively. We have recognized a guarantee liability for our portion of estimated Navistar Capital credit losses. Generally, we do not carry the contracts under the Navistar Capital Operating Agreement on our
Consolidated Balance Sheets
. However, for certain Navistar Capital financed contracts which we have accounted for as borrowings, we have recognized equipment leased to others of
$
51
million
and
$
104
million
and financed lease obligations of
$
60
million
and
$
122
million
, in our Consolidated Balance Sheets as of
October 31, 2019
and
2018
, respectively.
102
Navistar International Corporation and Subsidiaries
Notes to Consolidated Financial Statements—(Continued)
We also have issued a limited number of residual value guarantees, for which losses are generally capped. If control has not transferred, we account for these arrangements as operating leases and revenue is recognized on a straight-line basis over the term of the lease. If control has transferred, revenue is recognized upon sale and the amounts of the guarantees are estimated and recorded. Our guarantees are contingent upon the fair value of the leased assets at the end of the lease term. We have recognized liabilities for some of these guarantees in our
Consolidated Balance Sheets
as they meet recognition and measurement provisions. In addition to the liabilities that have been recognized, we are contingently liable for other potential losses under various guarantees that are not recognized in our
Consolidated Balance Sheets
. We do not believe claims that may be made under such guarantees would have a material effect on our financial condition, results of operations, or cash flows.
We obtain certain stand-by letters of credit and surety bonds from third-party financial institutions in the ordinary course of business when required under contracts or to satisfy insurance-related requirements. As of
October 31, 2019
, the amount of stand-by letters of credit and surety bonds issued was
$
97
million
.
In addition, as of
October 31, 2019
, we have
$
125
million
of outstanding purchase commitments and contracts with
$
28
million
of cancellation fees with expiration dates through 2025.
In the ordinary course of business, we also provide routine indemnifications and other guarantees, the terms of which range in duration and often are not explicitly defined. We do not believe these will result in claims that would have a material impact on our financial condition, results of operations, or cash flows.
Environmental Liabilities
We have been named a potentially responsible party ("PRP"), in conjunction with other parties, in a number of cases arising under an environmental protection law, the Comprehensive Environmental Response, Compensation, and Liability Act, popularly known as the "Superfund" law. These cases involve sites that allegedly received wastes from current or former Company locations. Based on information available to us which, in most cases, consists of data related to quantities and characteristics of material generated at current or former Company locations, material allegedly shipped by us to these disposal sites, as well as cost estimates from PRPs and/or federal or state regulatory agencies for the cleanup of these sites, a reasonable estimate is calculated of our share of the probable costs, if any, and accruals are recorded in our consolidated financial statements. These accruals are generally recognized no later than upon completion of the remedial feasibility study and are not discounted to their present value. We review all accruals on a regular basis and believe that, based on these calculations, our share of the potential additional costs for the cleanup of each site will not have a material effect on our financial condition, results of operations, or cash flows.
In addition, other sites formerly owned by us or where we are currently operating have been identified as having soil and groundwater contamination. While investigations and cleanup activities continue at these sites, we believe that we have appropriate accruals to cover costs to complete the cleanup of all sites.
We have accrued
$
20
million
for these and other environmental matters, which are included within
Other current liabilities
and
Other noncurrent liabilities
, as of
October 31, 2019
. The majority of these accrued liabilities are expected to be paid subsequent to
2020
.
Along with other vehicle manufacturers, we have been subject to an increased number of asbestos-related claims in recent years. In general, these claims relate to illnesses alleged to have resulted from asbestos exposure from component parts found in older vehicles, although some cases relate to the alleged presence of asbestos in our facilities. In these claims, we are generally not the sole defendant, and the claims name as defendants numerous manufacturers and suppliers of a wide variety of products allegedly containing asbestos. We have strongly disputed these claims, and it has been our policy to defend against them vigorously. Historically, the actual damages paid out to claimants have not been material in any year to our financial condition, results of operations, or cash flows. It is possible that the number of these claims will continue to grow, and that the costs for resolving asbestos related claims could become significant in the future.
Legal Proceedings
Overview
We are subject to various claims arising in the ordinary course of business and are party to various legal proceedings that constitute ordinary, routine litigation incidental to our business. The majority of these claims and proceedings relate to commercial, product liability, and warranty matters. In addition, from time to time we are subject to various claims and legal proceedings related to employee compensation, benefits, and benefits administration including, but not limited to, compliance with the Employee Retirement Income Security Act of 1974, as amended ("ERISA"), and Department of Labor requirements.
103
Navistar International Corporation and Subsidiaries
Notes to Consolidated Financial Statements—(Continued)
In our opinion, apart from the actions set forth below, the disposition of these proceedings and claims, after taking into account recorded accruals and the availability and limits of our insurance coverage, will not have a material adverse effect on our business or our financial condition, results of operations, or cash flows.
Profit Sharing Disputes
Pursuant to the 1993 Settlement Agreement, the program administrator and named fiduciary of the Supplemental Benefit Program is the Supplemental Benefit Program Committee (the "Committee"), composed of individuals not appointed by NI or NIC. In August 2013, the Committee filed a motion for leave to amend its February 2013 complaint (which sought injunctive relief for the Company to provide certain information to which the Committee was allegedly entitled under the Supplemental Benefit Trust Profit Sharing Plan) and a proposed amended complaint (the "Profit Sharing Complaint") in the U.S. District Court for the Southern District of Ohio (the "Court"). Leave to file the Profit Sharing Complaint was granted by the Court in October 2013. In its Profit Sharing Complaint, the Committee alleged the Company breached the 1993 Settlement Agreement and violated ERISA by failing to properly calculate profit sharing contributions due under the Supplemental Benefit Trust Profit Sharing Plan. The Committee seeks damages in excess of
$
50
million
, injunctive relief and reimbursement of attorneys' fees and costs. Following the resolution of a procedural dispute by the U.S. Court of Appeals for the 6th Circuit, in May 2015, the Court ordered that the claims in the Profit Sharing Complaint be arbitrated pursuant to the dispute resolution procedures in the Supplemental Benefit Trust Profit Sharing Plan. In November 2015, the Company and the Committee selected an arbitrator. The arbitration discovery process commenced and on August 1, 2016, the parties submitted briefs on issues related to the scope of the arbitration. On June 29, 2017, the arbitrator ruled, among other things, that the arbitration will include Supplemental Benefit Trust Profit Sharing Plan calculations for the years ending October 31, 2001 through October 31, 2014. On September 21, 2018, the arbitrator set a schedule to rule on all issues and determine final calculations by April 15, 2020. On April 29, 2019, the arbitrator ordered a new schedule for arbitration, and the arbitrator's final determination is expected by April 30, 2020. On September 13, 2019, the Committee filed an omnibus discovery motion with the arbitrator, alleging various discovery violations by the Company. On October 30, 2019, the Company and the Committee met with the Court regarding the motion to enforce discussed below, and the parties agreed on a plan for the Company to respond to the Committee’s information and document requests in the arbitration. On November 5, 2019, the Committee withdrew the motion without prejudice. The parties are in the process of proposing a new date to the arbitrator for the completion of the arbitration.
By letter dated February 14, 2019, the Committee indicated the Company’s Supplemental Benefit Trust Profit Sharing Plan calculation for the Plan year ending October 31, 2018 reflects numerous positions that have caused the Committee to dispute the Supplemental Benefit Trust Profit Sharing Plan calculations in the past, and on that basis the Committee disagrees with the 2018 calculation. In the February 14, 2019 letter, the Committee also requested information about the 2018 calculation. On March 12, 2019, the Committee filed in the Court a motion to enforce the 1993 Settlement Agreement for the Company’s failure to respond to the Committee’s February 14, 2019 information requests. On May 15, 2019, the Company responded to the information requests. The motion to enforce is still pending with the Court, but on October 30, 2019, the Company and the Committee met with the Court regarding the motion to enforce, and agreed on a plan for the Company to respond to the Committee’s information and document requests about the 2018 calculation.
As noted under “Retiree Health Care Litigation” below, on August 14, 2018, the Company filed a motion to schedule a status hearing, in which the Company requested an in-person hearing to discuss the possibility of a global resolution of various disputes under the 1993 Settlement Agreement, including the pending Profit Sharing Complaint. As a result, in-person hearings were held on November 2, 2018 and February 22, 2019, and an in-chambers conference with the Court was held on November 22, 2019. Telephone conferences with the Court are scheduled for January 6, 2020 and February 7, 2020, and a hearing is set for June 1, 2020. Additional hearings may be scheduled in the future.
In addition, various local bargaining units of the UAW have filed separate grievances pursuant to the profit sharing plans under various collective bargaining agreements in effect between the Company and the UAW that may have similar legal and factual issues as the Profit Sharing Complaint.
Based on our assessment of the facts underlying the claims in the above actions, we are unable to provide meaningful quantification of how the final resolution of these claims may impact our future consolidated financial condition, results of operations, or cash flows.
Retiree Health Care Litigation
On October 21, 2016,
two
lawsuits were filed in the Court relating to postretirement healthcare and life insurance obligations under the 1993 Settlement Agreement. The first lawsuit (the “Committee’s Complaint”) was filed by the Committee.
104
Navistar International Corporation and Subsidiaries
Notes to Consolidated Financial Statements—(Continued)
The Committee’s Complaint was filed against NIC, NI, NFC and a former affiliate, all of which are parties to the 1993 Settlement Agreement. Since January 1, 2012, the Navistar, Inc. Retiree Health Benefit Trust, created pursuant to the 1993 Settlement Agreement (the “Base Trust”), has received certain Medicare Part D subsidies from the federal Centers for Medicare and Medicaid Services that were made available for prescription drug benefits provided to Medicare-eligible seniors pursuant to the Medicare Prescription Drug, Improvement, and Modernization Act of 2003 and has also received certain Medicare Part D coverage-gap discounts from prescription drug manufacturers that were made available to eligible seniors pursuant to the Patient Protection and Affordable Care Act (collectively, the “Subsidies”).
The Committee alleges, among other things, that the defendants breached the 1993 Settlement Agreement since January 1, 2012 by causing the Base Trust to allocate the Subsidies in a manner that improperly decreased the defendants’ contributions to the Base Trust and increased retiree contributions. The Committee seeks damages, attorneys’ fees and costs for all alleged violations of the 1993 Settlement Agreement, including approximately
$
26
million
which the Committee alleges is the eligible retirees’ “fair share” of the Subsidies that were allegedly misappropriated by the defendants from January, 2012 through April, 2015.
The second lawsuit was filed by
two
individual members of the Committee (the “Committee Members”) who are retirees and participants in the Navistar, Inc. Health Benefit and Life Insurance Plan (the “Plan”) created pursuant to the 1993 Settlement Agreement. The Committee Members’ complaint (the “Committee Members’ Complaint”) was filed against NIC, NI, NFC and certain other former or current affiliates, all of which are parties or employers as defined in the 1993 Settlement Agreement. The Committee Members allege, among other things, that the Company violated the terms of the Plan, breached a fiduciary duty under ERISA, and engaged in ERISA-prohibited transactions by improperly using the Plan’s assets (a portion of the Subsidies) for the Company’s benefit.
The Committee Members request that the Court order the defendants to restore all losses to the Base Trust, including approximately
$
26
million
, which the Committee Members allege is the Plan participants’ “fair share” of the Subsidies that were allegedly misappropriated by the defendants from January 2012 through April 2015. The Committee Members also request that the Court enjoin the defendants from alleged future violations of the Plan and ERISA with respect to treatment of the Subsidies, order the defendants to remedy all alleged ERISA-prohibited transactions and pay the Committee Members’ attorneys’ fees and costs.
The defendants filed motions to dismiss each respective complaint on January 10, 2017. On May 10, 2017, the Court dismissed the Committee's Complaint with prejudice, stating that the Committee lacked standing to bring its claims. With respect to the Committee Members’ Complaint, the Court declined to dismiss the complaint, but ordered the parties to conduct discovery regarding whether the Committee Members’ Complaint is barred by the applicable statute of limitations and to file a motion for summary judgment thereafter on that issue of timeliness. The defendants filed their motion for summary judgment on September 21, 2017, the Committee Members’ filed their opposition on November 2, 2017, and the defendants filed their reply on November 22, 2017. On June 26, 2018, the Court conditionally overruled the defendants’ motion for summary judgment. The Court bifurcated the case and in September 2018 the Court conducted a trial on the issue of whether the Committee Members’ Complaint is barred by the applicable statute of limitations. On November 20, 2018, the Committee Members filed a motion for sanctions, alleging various discovery and trial misconduct by the defendants and requesting that the Court enter judgment in favor of the Committee Members with respect to the statute of limitations issue and award attorneys’ fees to the Committee Members. On December 11, 2018, the defendants filed their opposition to the Committee Members’ motion for sanctions. On March 26, 2019, the Court granted the Committee Members’ motion for sanctions and ordered that discovery related to the statute of limitations be re-opened through May 28, 2019, and the Court subsequently extended the statute of limitations discovery period to October 7, 2019. The Court held a hearing on October 7, 2019 and October 8, 2019 to complete the record on the statute of limitations defense. Briefing on the statute of limitations issue is scheduled for completion in January 2020. The Court also ordered the Company to pay certain of the Committee Members legal and other costs to file the motion for sanctions and to conduct additional discovery related to the statute of limitations issue.
On August 14, 2018, under the original Shy et. al. v. Navistar International Corporation, Civil Action No. 3:92-CV-333 (S.D. Ohio 1992), the Company filed a motion to schedule a status hearing to request an in-person hearing to discuss the possibility of a global resolution of various disputes under the 1993 Settlement Agreement, including but not limited to resolving the pending Profit Sharing Complaint and Committee Members’ Complaint described above. As a result, in-person hearings were held on November 2, 2018 and February 22, 2019 and an in-chambers conference with the Court was held on November 22, 2019. Telephone conferences with the Court are scheduled for January 6, 2020 and February 7, 2020, and a hearing is set for June 1, 2020. Additional hearings may be scheduled in the future.
105
Navistar International Corporation and Subsidiaries
Notes to Consolidated Financial Statements—(Continued)
Based on our assessment of the facts underlying the claims in the above actions, we are unable to provide meaningful quantification of how the final resolution of these claims may impact our future consolidated financial condition, results of operations, or cash flows.
FATMA Notice
International Indústria Automotiva da América do Sul Ltda. ("IIAA"), formerly known as Maxion International Motores S/A ("Maxion"), now a wholly owned subsidiary of the Company, received a notice (the “FATMA Notice”) in July 2010 from the State of Santa Catarina Environmental Protection Agency ("FATMA") in Brazil. The FATMA Notice alleged that Maxion sent waste to a facility owned and operated by a company known as Natureza (the “Natureza Facility”) and that soil and groundwater contamination had occurred at the Natureza Facility.
The FATMA Notice asserted liability against Maxion and assessed an initial penalty in the amount of R
$
2
million
(the equivalent of approximately less than US
$
1
million
at
October 31, 2019
), which is not due and final until all administrative appeals are exhausted. Maxion was one of numerous companies that received similar notices. IIAA filed an administrative defense in August 2010 and has not yet received a decision following that filing.
In addition to the matter described above, there is a suit pending in the federal court of Brazil in which the federal district attorney has sued (a) FATMA, for claims related to FATMA’s actions in connection with licensing and inspection procedures related to the Natureza Facility, and (b) Selamix, as the current owner of the Natureza Facility. In this federal suit, Selamix was found liable for the contamination at the Natureza Facility due to it being the successor owner of the facility. However, the federal court’s decision does not prohibit Selamix from seeking to recover its damages from third parties that contributed to the contamination at the Natureza Facility.
In connection with the FATMA Notice, IIAA presented a motion to the district attorney of the State of Santa Catarina (the “SC District Attorney”) to set forth its defenses and correct inaccuracies in the FATMA Notice in August 2017. In September 2017, the SC District Attorney informed IIAA that it intended to present a Consent Agreement to all of the companies that sent waste to Natureza to determine the allocation of the liability for generating the waste which led to the contamination of the Natureza Facility. IIAA then filed a motion requesting that the SC District Attorney consider certain facts and circumstances prior to presenting the Consent Agreement.
In January 2018, the SC District Attorney, local and state authorities, Selamix, IIAA and the 14 other companies (together, the "Companies") that are alleged to have significantly contributed to the contamination met to discuss the matter. Selamix then presented three proposals for conducting a preliminary environmental assessment in the area to determine the allocation of liability among the Companies. In March 2018, Selamix informed the SC District Attorney that it would voluntarily conduct a preliminary environmental study at the Natureza Facility in an attempt to determine and allocate the liability for the contamination pursuant to an agreement with the Companies after the study is completed. The SC District Attorney agreed to suspend further inquiry into the matter until Selamix’s study had been completed. The Companies (other than Selamix) have expressed an interest in having an independent environmental study conducted. The SC District Attorney has indicated that it may consider requiring an independent environmental study after Selamix’s environmental study is completed.
In June 2018, Selamix presented its Environmental Preliminary Assessment Report to the SC District Attorney and the Companies alleged to have contributed to the contamination and the report indicated that the entire property should be subject to further studies to confirm the type and extent of the contamination due to signs of buried residues in several areas. Selamix also presented commercial proposals from two additional companies specializing in environmental studies to perform the next steps of the technical work. The SC District Attorney then requested a third commercial proposal which was to be presented and paid for by Selamix. One of the commercial proposals included an Environmental Preliminary Assessment Report ("Phase 1 Study") and indicated that a Phase 2 assessment should be performed to include: (i) geophysical investigations to identify buried drums; (ii) investigations to verify and delimitate the volume and size of the contamination; and (iii) sample collection and analysis of soil and water. In July 2019, the SC District Attorney requested that each of the Companies (including IIAA) inform the SC District Attorney of whether they intend to contribute to the costs of the portion of the Phase 2 assessment related to geophysical investigations to identify buried drums at the Natureza Facility. The request did not include any information related to the potential range of the associated costs or indicate whether contributions for the cost of the other portions of the Phase 2 assessment would be sought from the Companies (including IIAA). IIAA responded to the request indicating that it would not contribute to the cost of the Phase 2 assessment related to geophysical investigations and requested a meeting with the SC District Attorney to discuss the next steps in the process.
IIAA continues to dispute the allegations in the FATMA Notice and intends to continue to vigorously defend itself. Currently, no demands or offers are outstanding.
106
Navistar International Corporation and Subsidiaries
Notes to Consolidated Financial Statements—(Continued)
Sao Paulo Groundwater Notice
In March 2014, IIAA, along with other nearby companies, received from the Sao Paulo District Attorney (the "District Attorney") a notice and proposed Consent Agreement relating to alleged neighborhood-wide groundwater contamination at or around its Sao Paulo manufacturing facility. The proposed Consent Agreement sought certain groundwater investigations and other technical relief and proposed sanctions in the amount of R
$
3
million
(the equivalent of approximately less than US
$
1
million
at
October 31, 2019
). In November 2014, IIAA extended a settlement offer. The parties remained in discussions and IIAA’s settlement offer was never accepted, rejected or countered by the District Attorney.
On August 31, 2016, the District Attorney filed civil actions against IIAA and other companies in the Central Forum of the capital of the State of Sao Paulo seeking soil and groundwater investigation and remediation, together with monetary payment in an unspecified amount. IIAA filed its defense to the civil action on January 26, 2017, alleging that IIAA has made all necessary investigations and has taken remedial measures to address the contamination and that Companhia Ambiental do Estado de Sao Paulo ("CETESB"), the environmental agency of Sao Paulo State, has agreed to the remedial measures taken by IIAA. On June 20, 2017, IIAA presented a petition requesting a 90-day suspension of the lawsuit. IIAA has since held and is currently engaged in discussions with the District Attorney regarding settlement of this matter. The District Attorney agreed to an initial suspension on June 30, 2017 and a subsequent suspension for an additional 90 days which ended on July 9, 2018.
A new district attorney (the “New District Attorney”) assumed responsibility for the case in February 2018. The New District Attorney would like the companies involved to try to reach a settlement agreement as to the remediation efforts to be taken after having discussions and negotiations with the New District Attorney’s technical experts. IIAA attempted to schedule a meeting with the New District Attorney’s technical experts. IIAA met with the New District Attorney on July 25, 2018. The New District Attorney has indicated that he will request information related to the status of the current remediation from CETESB. After receiving that information, the New District Attorney indicated that he will schedule a meeting with IIAA to discuss the proposed terms of a potential settlement agreement and granted a third suspension on August 14, 2018 which ended on November 14, 2018. Although the suspension was technically terminated, the New District Attorney continued to evaluate the possibility of settlement. The New District Attorney requested a suspension, which was granted by the court and technically ended on August 26, 2019. On September 6, 2019, the New District Attorney requested that (a) the case be continued due to the absence of a formal settlement agreement proposal, and (b) the judge required the Department of Water and Electric Energy (“DAEE”) and São Paulo State Sewage Company (“SABESP”) to answer inquiries related to the case. Subsequently, the New District Attorney suggested the case be suspended for another 180 days to allow for the further elaboration of the New District Attorney’s technical expert’s opinion. On September 10, 2019, the judge granted the New District Attorney's request to require answers from DAEE and SABESP on October 23, 2019. DAEE and SABESP responded to the requests and the parties are currently reviewing the information provided.
There are no current demands or offers outstanding.
MaxxForce Engine EGR Warranty Litigation
On June 24, 2014, N&C Transportation Ltd. ("N&C") filed a putative class action lawsuit against NIC, NI, Navistar Canada Inc., and Harbour International Trucks in Canada in the Supreme Court of British Columbia (the "N&C Action"). Subsequently, seven additional, similar putative class action lawsuits have been filed in Canada (together with the N&C Action, the "Canadian Actions").
From June 13-17, 2016, the court conducted a certification hearing in the N&C Action. On November 16, 2016, the court certified a Canada-wide class comprised of persons who purchased heavy-duty trucks equipped with Advanced EGR MaxxForce 11, MaxxForce 13, and MaxxForce 15 engines designed to meet 2010 EPA regulations. The court in the N&C Action denied certification to persons who operated but did not buy the trucks in question. On November 2, 2017, NIC, NI, Navistar Canada Inc. and Harbour International Trucks filed a notice of appeal. On December 8, 2017, the plaintiff filed a notice of cross-appeal. Both the appeal and cross-appeal were heard by the British Columbia Court of Appeal on February 9, 2018. On August 1, 2018, the appellate court denied our appeal and granted, in part, N&C's cross-appeal and as such certified three narrow issues on whether misrepresentations were made in Navistar's advertising materials. On September 28, 2018, Navistar sought leave to appeal the certification decision to the Supreme Court of Canada, but leave was denied on March 28, 2019. The next step will be an attendance before the case management judge regarding the details of the notice of certification to be given to the class. No date for this attendance has been set.
107
Navistar International Corporation and Subsidiaries
Notes to Consolidated Financial Statements—(Continued)
On June 5, 2017, a hearing was held in the Quebec putative class action lawsuit captioned 4037308 Canada Inc. v. Navistar Canada Inc., NI, and NIC. At that hearing, the court ruled on certain motions regarding evidence related to certification but deferred a ruling on plaintiff’s proposed amendment to narrow the proposed class to Quebec-only purchasers and lessees of model year 2010-13 vehicles containing MaxxForce 11, 13, and 15 liter engines. On November 23, 2017, we filed a motion to stay the Quebec case until the British Columbia Court of Appeal rules on the certification order in the N&C Action. The stay motion was granted on December 7, 2017. The decision of the British Columbia Court of Appeal was provided to the Quebec court. On September 6, 2018, the stay was extended until the Supreme Court of Canada decides the application for leave to appeal in the N&C Action. The stay has since been removed, but no hearing date or certification schedule has been set.
In the Manitoba putative class action lawsuit captioned Vern Brown v. Navistar International Corporation and Navistar Canada, Inc., the court held a case management conference on June 29, 2018, after the plaintiff failed to file a complete certification record by the previously court-ordered due date. The plaintiff advised that it expected to file its remaining certification affidavits by August 31, 2018, and the court suspended certification scheduling in the interim. The plaintiff filed an additional affidavit on July 5, 2018. On September 5, 2018, the court adjourned the certification application indefinitely to allow the plaintiff to obtain an expert report. On July 30, 2019, the plaintiff served an expert report. On October 7, 2019, the plaintiff served an amended motion for certification and requested a hearing to set a schedule leading to a certification hearing. On October 9, 2019, the court determined that the plaintiff did not properly file his certified materials and adjourned the plaintiffs’ scheduling request. It has not been rescheduled. There are no certification or other hearings scheduled in any of the other Canadian Actions at this time.
On July 7, 2014, Par 4 Transport, LLC filed a putative class action lawsuit against NI in the United States District Court for the Northern District of Illinois (the "Par 4 Action"). Subsequently,
seventeen
additional putative class action lawsuits were filed in various United States district courts, including the Northern District of Illinois, the Eastern District of Wisconsin, the Southern District of Florida, the Middle District of Pennsylvania, the Southern District of Texas, the Western District of Kentucky, the District of Minnesota, the Northern District of Alabama, and the District of New Jersey (together with the Par 4 Action, the "U.S. Actions"). Some of the U.S. Actions name both NIC and NI, and allege matters substantially similar to the Canadian Actions. More specifically, one or more of the Canadian Actions and the U.S. Actions (collectively, the "EGR Class Actions") seek to certify a class of persons or entities in Canada or the United States who purchased and/or leased a ProStar or other Navistar vehicle equipped with a model year 2008-2013 MaxxForce Advanced EGR engine.
In substance, the EGR Class Actions allege that the MaxxForce Advanced EGR engines are defective and that the Company and NI failed to disclose and correct the alleged defect. The EGR Class Actions assert claims based on theories of contract, breach of warranty, consumer fraud, unfair competition, misrepresentation and negligence. The EGR Class Actions seek relief in the form of monetary damages, punitive damages, declaratory relief, interest, fees, and costs.
On October 3, 2014, NIC and NI filed a motion before the United States Judicial Panel on Multidistrict Litigation (the "MDL Panel") seeking to transfer and consolidate before Judge Joan B. Gottschall of the United States District Court for the Northern District of Illinois all of the then-pending U.S. Actions, as well as certain non-class action MaxxForce Advanced EGR engine lawsuits pending in various federal district courts.
On December 17, 2014, Navistar's motion to consolidate the U.S. Actions and certain other non-class action lawsuits was granted. The MDL Panel issued an order consolidating all of the U.S. Actions that were pending on the date of Navistar’s motion before Judge Gottschall in the United States District Court for the Northern District of Illinois (the "MDL Action").
The MDL Panel also consolidated into the MDL Action certain non-class action MaxxForce Advanced EGR engine lawsuits pending in the various federal district courts. Non-class federal lawsuits presenting pre-trial issues similar to the MDL Action continue to be transferred to the MDL Action. Approximately 28 such actions are currently pending.
On March 5, 2015, Judge Gottschall entered an order in the MDL Action appointing interim lead counsel and interim liaison counsel for the plaintiffs. On May 11, 2015, lead counsel for the plaintiffs filed a First Master Consolidated Class Action Complaint ("Consolidated Complaint"). The parties to the MDL Action exchanged initial disclosures on May 29, 2015. The Company answered the Consolidated Complaint on July 13, 2015. On September 22, 2016, lead counsel for the plaintiffs filed a First Amended Consolidated Class Action Complaint (the “Amended Consolidated Complaint”). The Amended Consolidated Complaint added 25 additional named plaintiffs. NI and NIC answered the Amended Consolidated Complaint on October 20, 2016.
108
Navistar International Corporation and Subsidiaries
Notes to Consolidated Financial Statements—(Continued)
On October 13, 2017, lead counsel for the plaintiffs filed a Motion for Leave to File a Second Amended Consolidated Class Action Complaint, as well as a Motion for Voluntary Dismissal of Claims without Prejudice relating to 15 previously named plaintiffs. On January 4, 2018, Judge Gottschall granted both motions. On January 9, 2018, the plaintiffs filed a Second Amended Consolidated Class Action Complaint. The Second Amended Consolidated Class Action Complaint removed 15 named plaintiffs and substituted in 8 new named plaintiffs. Three class action cases were dismissed without prejudice because there were no longer any remaining plaintiffs in those cases. On May 30, 2019, the court granted plaintiffs leave to file a Third Amended Consolidated Class Action Complaint. The Third Amended Consolidated Class Action Complaint removed 2 named plaintiffs. NI and NIC answered the Third Amended Consolidated Class Action Complaint on June 16, 2019.
On May 28, 2019, plaintiffs submitted the Settlement Agreement to the court for preliminary approval. The Settlement Agreement class consists of entities and natural persons who owned or leased a 2011-2014 model year vehicle equipped with a MaxxForce 11 or 13 liter engine certified to meet EPA 2010 emissions standards without selective catalytic reduction technology, provided that vehicle was purchased or leased in the U.S.
Pursuant to the Settlement Agreement, among other things, (1) the parties will establish a non-reversionary common fund consisting of cash (the “Cash Fund”) and rebates (the “Rebate Fund”) with a total value of
$
135
million
(the “Settlement Fund”); (2) NIC and NI will contribute
$
85
million
to the Cash Fund, which will be used to pay all settlement fees and expenses, service awards, attorneys’ fees and costs, and cash payments to members of the settlement class; (3) NI will commit to make available rebates with a face value in the aggregate of
$
50
million
to the Rebate Fund; and (4) the settlement class will release NIC and NI and their affiliates from all claims and potential claims arising from or related to the allegations in the U. S. Actions, except for claims for personal injury or damage to third-party property. The Settlement Agreement further provides that dollars or value remaining in either the Cash Fund or the Rebate Fund after claims are processed will be used to pay approved claims from the other fund if the other fund is oversubscribed (the “Waterfall”). Any Waterfall from the Rebate Fund to the Cash Fund is capped at
$
35
million
. Finally, the Settlement Agreement states that NIC and NI deny all claims in the U.S. Actions, deny wrongdoing, liability or damage of any kind, and deny that NIC and NI acted improperly or wrongfully in any way.
The Settlement Agreement is subject to final approval by the court, including possible appeals. On June 12, 2019, the court preliminarily approved the settlement. Members of the class have been provided notice of the Settlement Agreement and an opportunity to object or opt out. Any members of the class who opt out will not receive any benefit from the Settlement Agreement or be bound by it.
Four class members filed a consolidated objection to the Settlement Agreement on October 10, 2019. NIC and NI, and also lead counsel for the class, filed responses to the objection on October 23, 2019. The objectors filed a reply on November 6, 2019. In response to a court order dated November 8, 2019, lead counsel and the objectors filed supplemental information on November 11, 2019 and November 12, 2019. The court held a fairness hearing on November 13, 2019, to consider whether the Settlement Agreement should be finally approved and whether the proposed Final Order and Judgment should be entered. At the hearing, the court heard argument on behalf of the four objectors and from one additional class member who had not formally filed an objection. The court entered an order on November 13, 2019, requiring additional information from the parties on November 20 and 27, 2019. Depending on certain oversubscription numbers, lead counsel for the class may have the option to withdraw from the Settlement Agreement.
On November 11, 2017, seven plaintiffs (the “Direct Action Plaintiffs”) in the MDL Action moved for a separate trial and discovery schedule independent of the class action schedule. On January 2, 2018, Judge Gottschall granted in part and denied in part the Direct Action Plaintiffs’ motion, allowing two of the Direct Action Plaintiffs to begin limited discovery on plaintiff-specific issues. The parties are currently engaged in discovery. One of the Direct Action Plaintiffs filed a motion for leave to file a First Amended Complaint on September 25, 2018 and that motion was granted by the court in a minute order dated December 13, 2018. The First Amended Complaint was filed on December 18, 2018 and our response was filed on January 8, 2019. On September 24, 2019, NIC, NI, and certain Direct Action Plaintiffs filed a Joint Response Regarding a Proposed Discovery Plan. The court, in turn, referred the matter to a magistrate for discovery supervision. On November 20, 2019, the magistrate set a fact discovery close of October 30, 2020, and set a status hearing for January 14, 2020.
109
Navistar International Corporation and Subsidiaries
Notes to Consolidated Financial Statements—(Continued)
There are also non-class action MaxxForce Advanced EGR engine lawsuits filed against the Company in various state courts. A number of non-class action lawsuits have been resolved in favor of the Company prior to trial or settled for immaterial amounts. Several cases have been resolved at trial with varying results. Approximately 35 state court non-class actions are pending at this time. One of the non-class action lawsuits ("Milan"), alleging violations of the Tennessee Consumer Protection Act and fraud and involving approximately 235 trucks, was tried in Tennessee state court in August 2017. On August 10, 2017, the Milan jury returned a verdict of approximately
$
31
million
against the Company, including
$
20
million
in punitive damages. On October 2, 2017, the Company filed various motions in the trial court challenging the verdict, including a Motion for Judgment Notwithstanding the Verdict or, in the Alternative, a New Trial and Motion to Disapprove of the Award of Punitive Damages.
The hearing on these motions was held on December 1, 2017 and the court denied the Company's motions, denied the Milan plaintiffs’ motion for pre-judgment interest and granted the Milan plaintiffs’
$
1
million
in fees and costs. On January 11, 2018, the Company filed a Notice of Appeal in the Tennessee Court of Appeals challenging the verdict. Briefing on the appeal was completed on March 18, 2019, and the Tennessee Court of Appeals heard oral arguments on June 19, 2019. In the third quarter of 2017, we recorded $31 million of charges in SG&A expenses in our Consolidated Statements of Operations.
On August 14, 2019, a three-judge panel of the Tennessee Court of Appeals issued a unanimous opinion reversing the
$
31
million
judgment and
$
1
million
of fees and costs for the Milan plaintiffs. In addition, the Tennessee Court of Appeals affirmed the trial court’s judgment for Navistar on the Milan plaintiffs' warranty claims. On October 11, 2019, the Milan plaintiffs filed an application for permission to appeal this ruling to the Tennessee Supreme Court. On October 28, 2019, NI filed its answer to the application for permission to appeal. The Tennessee Supreme Court will decide whether or not to exercise its discretion to hear the appeal.
Based on our assessment of the facts underlying the claims in the above actions, the Company has recorded a charge in the Company’s fiscal second quarter ended April 30, 2019 in the amount of
$
159
million
as a reserve for its expected obligations under the Settlement Agreement as well as for current period liabilities and potential future settlements with respect to certain other MaxxForce Advanced EGR engine lawsuits that are not included in the Settlement Agreement. In addition, the Company has released a liability of
$
32
million
, related to the judgment reversal in the Milan case in the third quarter ended July 31, 2019. These impacts were recorded in SG&A expenses in our Consolidated Statements of Operations. Other than the aforementioned, we are unable to provide further meaningful quantification of how the final resolution of these matters may impact our future consolidated financial condition, results of operations or cash flows.
EPA Clean Air Act Litigation
In February 2012, NI received a Notice of Violation ("NOV") from the United States Environmental Protection Agency (the "EPA") pertaining to certain heavy-duty diesel engines which, according to the EPA, were not completely assembled by NI until calendar year 2010 and, therefore, were not covered by NI's model year 2009 certificates of conformity. The NOV concluded that NI's introduction into commerce of each of these engines violated the Federal Clean Air Act.
On July 14, 2015, the Department of Justice ("DOJ"), on behalf of the EPA, filed a lawsuit against NIC and NI in the U.S. District Court for the Northern District of Illinois. Similar to the NOV, the lawsuit alleges that NIC and NI introduced into commerce approximately
7,749
heavy-duty diesel engines that were not covered by model year 2009 certificates of conformity because those engines were not completely assembled until calendar year 2010, resulting in violations of the Federal Clean Air Act. On July 16, 2015, the DOJ filed an Amended Complaint clarifying the amount of civil penalties being sought. The lawsuit requests injunctive relief and the assessment of civil penalties of up to
$
37,500
for each violation. On September 14, 2015, NIC and NI each filed an Answer and Affirmative Defenses to the Amended Complaint. We dispute the allegations in the lawsuit.
Fact discovery for the liability phase commenced on December 9, 2015. Pursuant to the court's minute order entered on July 12, 2017, the fact discovery was completed as of November 9, 2017.
On May 13, 2016, the DOJ, on behalf of the EPA, filed a motion for summary judgment on liability. On June 30, 2016, NIC and NI opposed the EPA's motion for summary judgment, and NIC cross-moved for summary judgment against the EPA. On March 1, 2017, the court entered a Memorandum Opinion and Order (i) granting the DOJ’s motion for summary judgment on the issue of liability with respect to NI, (ii) denying the DOJ’s motion for summary judgment on the issue of liability with respect to NIC, and (iii) denying NIC’s motion for summary judgment.
On April 3, 2018, the parties jointly filed a stipulation of dismissal with prejudice for NIC only. The stipulation with prejudice has no effect on the claims made against NI. With the dismissal of NIC, the matter moved to the remedy phase with respect to NI. The court entered a scheduling order on May 3, 2018, setting a fact discovery deadline of May 22, 2019, expert report and deposition deadlines through November 7, 2019, and a deadline for submission of dispositive motions of December 9, 2019. Fact discovery for the remedy phase is complete. On October 8, 2019, the court set expert report and expert deposition deadlines through March 17, 2020. A status hearing is scheduled for January 29, 2020.
110
Navistar International Corporation and Subsidiaries
Notes to Consolidated Financial Statements—(Continued)
Based on our assessment of the facts underlying the amended complaint above, potential charges to the
Consolidated Statements of Operations
and cash outlays in future periods could range from
$
2
million
to
$
291
million
related to the resolution of this matter. Other than the aforementioned, we are unable to provide further meaningful quantification of how the final resolution of this matter may impact our future consolidated financial condition, results of operations or cash flows.
Brazil Truck Dealer Disputes
In January 2014, IIAA initiated an arbitration proceeding under the International Chamber of Commerce rules seeking payment for goods sold and unpaid, in the amount of R
$
64
million
(approximately US
$
16
million
as of
October 31, 2019
), including penalties and interest, from a group of affiliated truck dealers in Brazil. The truck dealers are affiliated with each other, but not with us, and are collectively referred to as Navitrucks. In the proceeding, IIAA also seeks a declaration of fault against Navitrucks related to the termination of the truck dealer agreements between IIAA and Navitrucks. Navitrucks responded in part by submitting counterclaims against IIAA seeking the amount of R
$
128
million
(approximately US
$
32
million
as of
October 31, 2019
) for damages related to alleged unfulfilled promises and injury to Navitrucks’ reputation. In October 2014, Navitrucks amended their counterclaims by increasing the amount of damages. During a preliminary hearing before the arbitral tribunal on March 24, 2015, the parties agreed to submit all of the pending claims between the parties to the exclusive jurisdiction of the arbitral tribunal. Pursuant to the timetable issued in the arbitration proceeding, IIAA presented its complaint in July 2015, Navitrucks filed its answer and counterclaims on August 24, 2015, and IIAA filed its rebuttal and answer to Navitrucks’ counterclaims on October 22, 2015. On December 7, 2015, Navitrucks filed its rebuttal to IIAA’s answer to counterclaims. On June 13-15, 2016, the arbitral tribunal held hearings on the parties presenting witnesses and evidence.
On July 18, 2016, IIAA and Navitrucks presented additional documents and information related to the hearing held on June 13-15, 2016. On September 30, 2016, the parties presented their final allegations. On April 20, 2017, the arbitral tribunal issued a partial award (the "Initial Award") granting a portion of the relief sought by each of the parties. Specifically, the arbitral tribunal's Initial Award held that: (a) Navitrucks failed to pay certain amounts to IIAA for the purchase of vehicles under its agreements with IIAA, thereby breaching its contractual obligations; and (b) IIAA breached its contractual obligations under its agreements with Navitrucks due to its failure to fulfill its promises to invest in products, infrastructure, and a dealership network.
Furthermore, the arbitral tribunal held that, due to the mutual breach of the agreements between IIAA and Navitrucks, the agreements should be deemed terminated.
On June 3, 2017, IIAA and Navitrucks filed an application to clarify certain interpretations of the Initial Award and to correct clerical errors in the Initial Award. IIAA also requested an award to (a) set the indisputable amount of the Initial Award, and (b) order Navitrucks to promptly pay such amount. On June 8, 2017, the arbitral tribunal invited IIAA and Navitrucks to present their respective comments on each other’s applications on or before June 27, 2017. On June 3, 2017 and June 27, 2017, IIAA and Navitrucks, respectively, filed their comments. On September 29, 2017, the arbitral tribunal issued a decision on the applications filed by both parties in which it rejected all of the requests made in the applications of both parties. On October 31, 2017, the arbitral tribunal issued a decision relating to the timeline for the production of technical evidence to be used in the calculation phase in which the actual monetary amount of the damages owed by each party to the other will be definitively determined.
As determined by the arbitral tribunal, IIAA (a) designated its expert assistant and disclosed the questions to be answered by the arbitral expert (official expert designated by the arbitral tribunal); (b) presented a summary of the amount that Navitrucks owes to IIAA in accordance with the previous calculation and related award issued on April 20, 2017; and (c) presented its replies to the Navitrucks' petitions.
On May 11, 2018, the arbitral tribunal issued a decision allowing the calculation to be made by the parties’ experts and scheduled the calculation phase hearing for August 16, 2018. On July 6, 2018, each party’s experts presented their reports indicating the calculation of the total amount due from each party to the other party. On August 6, 2018, the parties jointly filed a petition informing the arbitral tribunal that they reached an agreement as to the total amount due from each party to the other party. Pursuant to the agreement, Navitrucks agreed that it owes IIAA the total amount of R
$
107
million
(approximately US
$
27
million
as of
October 31, 2019
) after deducting the agreed amount of Navitrucks' claim against IIAA.
In addition, the parties requested: (a) the cancellation of the hearing scheduled for August 16, 2018; (b) a 15 day period for the parties to present their respective costs incurred in connection with the arbitral proceeding; and (c) the closure of the calculation phase with the final ruling of merits.
On August 13, 2018, the arbitral tribunal issued a decision canceling the hearing scheduled for August 16, 2018 and directed the parties to prove their respective incurred costs in connection with the arbitral proceeding and to specify whether there were any additional productions of evidence or considerations by August 23, 2018.
111
Navistar International Corporation and Subsidiaries
Notes to Consolidated Financial Statements—(Continued)
On August 23, 2018, IIAA filed a petition indicating that its costs incurred in connection with the arbitral proceeding were R
$
6
million
(approximately US
$
1
million
as of October 31, 2019). On the same date, Navitrucks filed a petition indicating that its costs incurred in connection with the arbitral proceeding were R
$
3
million
(less than approximately US
$
1
million
as of October 31, 2019). On September 18, 2018, the arbitral tribunal issued a decision (i) declaring the end of the evidence phase, (ii) ordering the parties to present their closing arguments on or before October 31, 2018, and (iii) stating that the final decision on the merits will be issued on or before December 20, 2018. On October 31, 2018, the parties submitted their closing arguments.
On or about March 1, 2019, IIAA and Navitrucks received the award of the arbitral tribunal. The award orders the Navitrucks entities to pay IIAA a total of R
$
107
million
(approximately US
$
27
million
as of October 31, 2019), subject to inflation adjustment and default interest. In addition, the arbitral tribunal ordered the Navitrucks entities to reimburse IIAA in the amount of R
$
3
million
(approximately US
$
1
million
as of October 31, 2019) for a portion of IIAA’s costs incurred in the arbitration. The parties had 30 days from the date of receipt of the award to apply for the correction of errors and/or clarifications related to the award. On March 29, 2019, IIAA filed an application for clarifications related to certain clerical errors in the award. On April 22, 2019, the arbitral tribunal issued a decision ordering Navitrucks to submit any comments regarding the application for clarifications filed by IIAA on or before April 25, 2019 and indicated that the arbitral tribunal will issue a final award with respect to IIAA’s application for clarifications by May 25, 2019.
On June 3, 2019, the arbitral tribunal issued the final award with an addendum to address the clarifications related to certain clerical errors in the award. The final award amount was noted as R
$
131
million
(approximately US
$
33
million
as of October 31, 2019) and Navitrucks was required to pay IIAA on or before July 15, 2019. Navitrucks did not make the required payment to IIAA on or before July 15, 2019 and IIAA is now permitted to commence an enforcement proceeding in the Brazilian civil court.
We have not recorded a receivable related to this matter in our consolidated financial statements.
In addition,
two
truck fleet owners in Brazil have a separate adversarial proceeding pending against IIAA that may have similar legal and factual issues as the Navitrucks claim. This claim is not material either individually or in the aggregate.
California Air Resources Board Notice of Violation
On March 28, 2019, Navistar received a notice of violation ("NOV") from the California Air Resources Board ("CARB"). In the NOV, CARB alleges that Navistar failed to disclose a running change to 1,385 engines including certain model year 2013 to 2015 N13 engines and 2014 to 2015 N9/10 engines. CARB alleges that the running change in question made modifications to the emissions control system such that the engines no longer conformed to the configuration as certified. In August 2019, the Company and CARB reached a tentative resolution of this matter for
$
2
million
, subject to agreement on formal terms.
Based on our assessment of the facts underlying the claims in the above action, the Company has recorded a charge in the third quarter ended July 31, 2019 in the amount of
$
2
million
as a reserve for its expected obligations in Engineering and product development costs in our Consolidated Statements of Operations. Other than the aforementioned, we are unable to provide further meaningful quantification of how the final resolution of this matter may impact our future consolidated financial condition, results of operations or cash flows.
Other
Navistar Defense MRAP Litigation
In the third quarter of 2016, Navistar Defense, LLC ("NDLLC") received a subpoena from the United States Department of Defense Inspector General (the "DOD IG"). The subpoena requested documents relating to NDLLC's sale of its independent suspension systems ("ISS") for military vehicles to the government for the period from January 1, 2009 through December 31, 2010. On June 3, 2016, NDLLC met with government representatives, including representatives from the DOD IG and the Department of Justice ("DOJ") to discuss the matter.
Since then, NDLLC engaged in ongoing discussions with the DOD IG and the DOJ. NDLLC made submissions of documents responsive to the subpoena in June and August 2016 and completed its subpoena response. On May 1, 2017, NDLLC met with government representatives, including representatives from the DOD IG and the DOJ, to further discuss the matter, including assertions that NDLLC may have overcharged the United States for the ISS components. NDLLC agreed to provide additional information relating to the pricing of the ISS components. The parties met again on June 13, 2017. In August 2017, NDLLC received a letter from the DOJ claiming that NDLLC made false and misleading statements during the course of price negotiations and during the Defense Contract Audit Agency audit which resulted in NDLLC overcharging the United States for the ISS components by approximately
$
88
million
and asking for treble damages and penalties for a total demand of approximately
$
264
million
. NDLLC responded to the DOJ’s demand letter explaining its position that it has no liability in this
112
Navistar International Corporation and Subsidiaries
Notes to Consolidated Financial Statements—(Continued)
matter and outlining the bases for such position, and that NDLLC intends to vigorously defend its position. NDLLC and the DOJ communicated between October 5, 2017 and December 8, 2017 to discuss their respective positions on both liability and damages.
On December 8, 2017, NDLLC received another subpoena from the DOD IG which requested documents relating to NDLLC's pricing of the Mine Resistant Ambush Protected (“MRAP”) vehicle and its sale of parts to the government for the period from January 1, 2006 through December 31, 2013. NDLLC responded to the subpoena and made four productions of responsive documents.
On July 10, 2018, NDLLC received another subpoena from the DOD IG requesting additional custodian emails and documents related to the MRAP and ISS components. NDLLC responded to the subpoena and made four productions of responsive documents. Additionally, in September and October 2018 the DOJ conducted interviews of certain current and former employees and will likely conduct additional interviews in the future.
The parties began mediation in February 2019 but were unable to resolve the matter.
On December 3, 2019, the DOJ filed a complaint in the U.S. District Court for the District of Columbia partially intervening in what had been a sealed False Claims Act (“FCA”) case previously filed by a relator. The relator, a former NDLLC employee, filed his initial complaint in September 2013 in the U.S. District Court for the District of Columbia. The relator filed an amended complaint on November 1, 2019, alleging that NDLLC submitted false pricing support to the government in connection with three MRAP contract parts or part systems - the chassis, the engine, and 13 of the parts associated with 3,898 ISS components (“Relator’s ISS Claim”). The relator alleges single damages of
$
1.125
billion
for the chassis,
$
36.4
million
for the engine, and
$
118.7
million
for the Relator’s ISS Claim, totaling approximately
$
1.28
billion
in single damages and
$
3.84
billion
in treble damages. The DOJ’s complaint-in partial intervention alleges that NDLLC submitted false pricing support in connection with 11 of the parts associated with 3,803 ISS components used on the MRAP and seeks damages of an unspecified amount under the FCA and common law theories of mistake, unjust enrichment, and fraud.
NDLLC intends to defend itself vigorously.
At this time, we are unable to predict the outcome of these matters, including whether a settlement will be reached, or provide meaningful quantification of how the final resolution of this matter may impact our future consolidated financial condition, results of operations or cash flows.
Deepwater Horizon Settlement Program
15.
Segment Reporting
The following is a description of our
four
reporting segments:
|
•
|
Our
Truck
segment manufactures and distributes Class 4 through 8 trucks and buses under the International and IC Bus ("IC") brands, and produces engines under our proprietary brand name. This segment sells its products in the U.S., Canada, and Mexico markets, as well as through our export truck business.
|
|
•
|
Our
Parts
segment provides customers with proprietary products needed to support the International commercial truck, IC Bus, proprietary engine lines, and export parts business, as well as our other product lines. Our Parts segment also provides a wide selection of other standard truck, trailer, and engine aftermarket parts. Also included in the Parts segment are the operating results of BDP, which manages the sourcing, merchandising, and distribution of certain service parts we sell to Ford in North America.
|
|
•
|
Our
Global Operations
segment primarily consists of Brazil engine operations which produce diesel engines under contract manufacturing arrangements, as well as under the MWM brand, for sale to original equipment manufacturers (OEMs) in South America.
|
|
•
|
Our
Financial Services
segment provides retail, wholesale, and lease financing of products sold by the Truck and Parts segments and their dealers within the U.S. and Mexico, as well as financing for wholesale accounts and selected retail accounts receivable. This segment also facilitates financing relationships in other countries to support our Manufacturing Operations.
|
113
Navistar International Corporation and Subsidiaries
Notes to Consolidated Financial Statements—(Continued)
Corporate contains those items that are not included in our
four
segments.
Segment Profit (Loss)
We define segment profit (loss) as net income (loss) from continuing operations attributable to NIC, excluding income tax benefit (expense). Selected financial information from our
Consolidated Statements of Operations
and our
Consolidated Balance Sheets
is as follows:
|
•
|
The costs of profit sharing and annual incentive compensation for the Manufacturing operations are included in corporate expenses.
|
|
•
|
Interest expense and interest income for the Manufacturing operations are reported in corporate expenses.
|
|
•
|
The Financial Services segment finances certain sales to our dealers in North America, which include an interest-free period that varies in length that is subsidized by our Truck and Parts segments. Additionally, the Financial Services segment reports intersegment revenues from secured and unsecured loans to the Manufacturing operations. Certain retail sales financed by the Financial Services segment, primarily NFC, require the Manufacturing operations, primarily the Truck segment, to share a portion of any credit losses.
|
|
•
|
We allocate "access fees" to the Parts segment from the Truck segment for certain engineering and product development costs, depreciation expense, and SG&A expenses incurred by the Truck segment based on the relative percentage of certain sales, as adjusted for cyclicality.
|
|
•
|
Other than the items discussed above, the selected financial information presented below is presented in accordance with our policies described in Note 1,
Summary of Significant Accounting Policies.
|
The following tables present selected financial information for our reporting segments:
|
(in millions)
|
Truck
|
Parts
|
Global Operations
|
Financial
Services (A) |
Corporate
and Eliminations |
Total
|
|||||||||||||||||
|
Year Ended October 31, 2019
|
|||||||||||||||||||||||
|
External sales and revenues, net
|
$
|
|
|
$
|
|
|
$
|
|
|
$
|
|
|
$
|
|
|
$
|
|
|
|||||
|
Intersegment sales and revenues
|
|
|
|
|
|
|
|
|
(
|
)
|
|
|
|||||||||||
|
Total sales and revenues, net
|
$
|
|
|
$
|
|
|
$
|
|
|
$
|
|
|
$
|
(
|
)
|
$
|
|
|
|||||
|
Income (loss) from continuing operations attributable to NIC, net of tax
|
$
|
|
|
$
|
|
|
$
|
|
|
$
|
|
|
$
|
(
|
)
|
$
|
|
|
|||||
|
Income tax expense
|
|
|
|
|
|
|
|
|
(
|
)
|
(
|
)
|
|||||||||||
|
Segment profit (loss)
|
$
|
|
|
$
|
|
|
$
|
|
|
$
|
|
|
$
|
(
|
)
|
$
|
|
|
|||||
|
Depreciation and amortization
|
$
|
|
|
$
|
|
|
$
|
|
|
$
|
|
|
$
|
|
|
$
|
|
|
|||||
|
Interest expense
|
|
|
|
|
|
|
|
|
|
|
|
|
|||||||||||
|
Equity in income (loss) of non-consolidated affiliates
|
|
|
|
|
(
|
)
|
|
|
|
|
|
|
|||||||||||
|
Capital expenditures
(B)
|
|
|
|
|
|
|
|
|
|
|
|
|
|||||||||||
114
Navistar International Corporation and Subsidiaries
Notes to Consolidated Financial Statements—(Continued)
|
(in millions)
|
Truck
|
Parts
|
Global Operations
|
Financial
Services (A) |
Corporate
and Eliminations |
Total
|
|||||||||||||||||
|
Year Ended October 31, 2018
|
|||||||||||||||||||||||
|
External sales and revenues, net
|
$
|
|
|
$
|
|
|
$
|
|
|
$
|
|
|
$
|
|
|
$
|
|
|
|||||
|
Intersegment sales and revenues
|
|
|
|
|
|
|
|
|
(
|
)
|
|
|
|||||||||||
|
Total sales and revenues, net
|
$
|
|
|
$
|
|
|
$
|
|
|
$
|
|
|
$
|
(
|
)
|
$
|
|
|
|||||
|
Income (loss) from continuing operations attributable to NIC, net of tax
|
$
|
|
|
$
|
|
|
$
|
|
|
$
|
|
|
$
|
(
|
)
|
$
|
|
|
|||||
|
Income tax expense
|
|
|
|
|
|
|
|
|
(
|
)
|
(
|
)
|
|||||||||||
|
Segment profit (loss)
|
$
|
|
|
$
|
|
|
$
|
|
|
$
|
|
|
$
|
(
|
)
|
$
|
|
|
|||||
|
Depreciation and amortization
|
$
|
|
|
$
|
|
|
$
|
|
|
$
|
|
|
$
|
|
|
$
|
|
|
|||||
|
Interest expense
|
|
|
|
|
|
|
|
|
|
|
|
|
|||||||||||
|
Equity in income (loss) of non-consolidated affiliates
|
|
|
|
|
(
|
)
|
|
|
|
|
|
|
|||||||||||
|
Capital expenditures
(B)
|
|
|
|
|
|
|
|
|
|
|
|
|
|||||||||||
115
Navistar International Corporation and Subsidiaries
Notes to Consolidated Financial Statements—(Continued)
|
(in millions)
|
Truck
|
Parts
|
Global Operations
|
Financial
Services (A) |
Corporate
and Eliminations |
Total
|
|||||||||||||||||
|
Year Ended October 31, 2017
|
|||||||||||||||||||||||
|
External sales and revenues, net
|
$
|
|
|
$
|
|
|
$
|
|
|
$
|
|
|
$
|
|
|
$
|
|
|
|||||
|
Intersegment sales and revenues
|
|
|
|
|
|
|
|
|
(
|
)
|
|
|
|||||||||||
|
Total sales and revenues, net
|
$
|
|
|
$
|
|
|
$
|
|
|
$
|
|
|
$
|
(
|
)
|
$
|
|
|
|||||
|
Income (loss) from continuing operations attributable to NIC, net of tax
|
$
|
(
|
)
|
$
|
|
|
$
|
(
|
)
|
$
|
|
|
$
|
(
|
)
|
$
|
|
|
|||||
|
Income tax expense
|
|
|
|
|
|
|
|
|
(
|
)
|
(
|
)
|
|||||||||||
|
Segment profit (loss)
|
$
|
(
|
)
|
$
|
|
|
$
|
(
|
)
|
$
|
|
|
$
|
(
|
)
|
$
|
|
|
|||||
|
Depreciation and amortization
|
$
|
|
|
$
|
|
|
$
|
|
|
$
|
|
|
$
|
|
|
$
|
|
|
|||||
|
Interest expense
|
|
|
|
|
|
|
|
|
|
|
|
|
|||||||||||
|
Equity in income (loss) of non-consolidated affiliates
|
|
|
|
|
(
|
)
|
|
|
|
|
|
|
|||||||||||
|
Capital expenditures
(B)
|
|
|
|
|
|
|
|
|
|
|
|
|
|||||||||||
|
(in millions)
|
Truck
|
Parts
|
Global Operations
|
Financial
Services
|
Corporate
and
Eliminations
|
Total
|
|||||||||||||||||
|
Segment assets, as of:
|
|||||||||||||||||||||||
|
October 31, 2019
|
$
|
|
|
$
|
|
|
$
|
|
|
$
|
|
|
$
|
|
|
$
|
|
|
|||||
|
October 31, 2018
|
|
|
|
|
|
|
|
|
|
|
|
|
|||||||||||
|
(A)
|
Total sales and revenues in the Financial Services segment include interest revenues of
$
|
|
(B)
|
|
No
single customer accounted for more than
10%
of consolidated sales and revenues for the years ended
October 31, 2019
,
2018
and
2017
.
Sales and revenues to external customers classified by significant products and services were as follows:
|
For the Years Ended October 31,
|
|||||||||||
|
(in millions)
|
2019
|
2018
|
2017
|
||||||||
|
Sales and revenues:
|
|||||||||||
|
Trucks
|
$
|
|
|
$
|
|
|
$
|
|
|
||
|
Parts
|
|
|
|
|
|
|
|||||
|
Engine
|
|
|
|
|
|
|
|||||
|
Financial Services
|
|
|
|
|
|
|
|||||
116
Navistar International Corporation and Subsidiaries
Notes to Consolidated Financial Statements—(Continued)
Information concerning principal geographic areas is presented as follows:
|
For the Years Ended October 31,
|
|||||||||||
|
(in millions)
|
2019
|
2018
|
2017
|
||||||||
|
Sales and revenues:
|
|||||||||||
|
United States
|
$
|
|
|
$
|
|
|
$
|
|
|
||
|
Canada
|
|
|
|
|
|
|
|||||
|
Mexico
|
|
|
|
|
|
|
|||||
|
Brazil
|
|
|
|
|
|
|
|||||
|
Other
|
|
|
|
|
|
|
|||||
|
As of October 31,
|
|||||||
|
(in millions)
|
2019
|
2018
|
|||||
|
Long-lived assets:
(A)
|
|||||||
|
United States
|
$
|
|
|
$
|
|
|
|
|
Canada
|
|
|
|
|
|||
|
Mexico
|
|
|
|
|
|||
|
Brazil
|
|
|
|
|
|||
|
Other
|
|
|
|
|
|||
__________________________
16.
Stockholders' Deficit
Preferred and Preference Stocks
NIC has authorized
30
million
shares of preferred stock, none of which have been issued, with a par value of
$
1.00
per share. NIC has authorized
10
million
shares of preference stock with a par value of
$
1.00
per share. Currently, Series B Nonconvertible Junior Preference Stock ("Series B") and Series D Convertible Junior Preference Stock ("Series D") are outstanding.
The UAW holds the Series B and is currently entitled to elect one member of our Board of Directors. As of
October 31, 2019
and 2018, there was one share of Series B Preference stock with a par value of
$
1.00
per share authorized and outstanding.
At both
October 31, 2019
and
2018
, there were
70,182
shares of Series D issued and outstanding. These shares were issued with a par value of
$
1.00
per share, an optional redemption price, and a liquidation preference of
$
25
per share plus accrued dividends. The Series D stock may be converted into NIC common stock at the holder's option (subject to adjustment in certain circumstances); upon conversion each share of Series D stock is converted to
0.3125
shares of common stock. The Series D stock ranks senior to common stock as to dividends and liquidation and receives dividends at a rate of
120
%
of the cash dividends on common stock as declared on an as-converted basis.
117
Navistar International Corporation and Subsidiaries
Notes to Consolidated Financial Statements—(Continued)
Common Stock
Changes in shares of common stock and treasury stock were as follows:
|
(in millions)
|
Common Stock
|
Treasury Stock
|
Shares Outstanding
|
|||||
|
Balance as of October 31, 2016
|
|
|
|
|
|
|
||
|
Shares issued
|
|
|
(
|
)
|
|
|
||
|
Shares acquired
|
|
|
|
|
(
|
)
|
||
|
Balance as of October 31, 2017
|
|
|
|
|
|
|
||
|
Shares issued
|
|
|
(
|
)
|
|
|
||
|
Shares acquired
|
|
|
|
|
(
|
)
|
||
|
Balance as of October 31, 2018
|
|
|
|
|
|
|
||
|
Shares issued
|
|
|
(
|
)
|
|
|
||
|
Shares acquired
|
|
|
|
|
(
|
)
|
||
|
Balance as of October 31, 2019
|
|
|
|
|
|
|
||
On February 28, 2017, we consummated our previously announced strategic alliance with TRATON Group, which included an equity investment in the Company by TRATON Group pursuant to a Stock Purchase Agreement, License and Supply Framework Agreement and Procurement JV Framework Agreement. Pursuant to the TRATON Group Stock Purchase Agreement, on February 28, 2017 we issued and TRATON Group purchased
16.2
million
of our shares of common stock for an aggregate purchase price of
$
256
million
at
$
15.76
per share (an estimated
19.9
%
stake (
16.6
%
on a fully-diluted basis) in the Company).
Additional Paid in Capital
In accounting for the issuance of the former
4.5
%
Senior Subordinated Convertible Notes due 2018 ("2018 Convertible Notes"), a debt component and an equity component were separated resulting in the debt component being recorded at its estimated fair value without consideration given to the conversion feature. We estimated the fair value of the liability component at
$
177
million
. The resulting equity component of
$
22
million
, net of
$
1
million
of discount, was recorded in
Additional paid in capital
. Issuance costs were also allocated between the debt and equity components resulting in an immaterial amount being recorded as a reduction in
Additional paid in capital.
The 2018 Convertible Notes were fully repaid upon maturity in October 2018, and none were converted into our common stock.
In accounting for the issuance of the former 2019 Convertible Notes, the debt component and equity component were separated, resulting in the debt component being recorded at its estimated fair value without consideration given to the conversion feature. We estimated the fair value of the liability component at
$
367
million
. The resulting equity component of
$
44
million
was recorded in
Additional paid in capital
. Issuance costs were also allocated between debt and equity components with
$
1
million
being recorded as a reduction in
Additional paid in capital.
The 2019 Convertible Notes were fully repaid upon maturity in April 2019, and none were converted into our common stock.
Accumulated Other Comprehensive Loss
The following table presents changes in
Accumulated other comprehensive loss,
net of tax, included in our
Consolidated Statements of Shareholders' Deficit
:
|
(in millions)
|
Unrealized Gain on Marketable Securities
|
Foreign Currency Translation Adjustments
|
Defined Benefit Plans
|
Total
|
|||||||||||
|
Balance as of October 31, 2018
|
$
|
|
|
$
|
(
|
)
|
$
|
(
|
)
|
$
|
(
|
)
|
|||
|
Other comprehensive loss before reclassifications
|
|
|
(
|
)
|
(
|
)
|
(
|
)
|
|||||||
|
Amounts reclassified out of accumulated other comprehensive loss
|
|
|
|
|
|
|
|
|
|||||||
|
Net current-period other comprehensive income (loss)
|
|
|
(
|
)
|
|
|
|
|
|||||||
|
Balance as of October 31, 2019
|
$
|
|
|
$
|
(
|
)
|
$
|
(
|
)
|
$
|
(
|
)
|
|||
118
Navistar International Corporation and Subsidiaries
Notes to Consolidated Financial Statements—(Continued)
|
(in millions)
|
Unrealized Gain on Marketable Securities
|
Foreign Currency Translation Adjustments
|
Defined Benefit Plans
|
Total
|
|||||||||||
|
Balance as of October 31, 2017
|
$
|
|
|
$
|
(
|
)
|
$
|
(
|
)
|
$
|
(
|
)
|
|||
|
Other comprehensive income (loss) before reclassifications
|
|
|
(
|
)
|
|
|
|
|
|||||||
|
Amounts reclassified out of accumulated other comprehensive loss
|
|
|
|
|
|
|
|
|
|||||||
|
Net current-period other comprehensive income (loss)
|
|
|
(
|
)
|
|
|
|
|
|||||||
|
Balance as of October 31, 2018
|
$
|
|
|
$
|
(
|
)
|
$
|
(
|
)
|
$
|
(
|
)
|
|||
|
(in millions)
|
Unrealized Gain on Marketable Securities
|
Foreign Currency Translation Adjustments
|
Defined Benefit Plans
|
Total
|
|||||||||||
|
Balance as of October 31, 2016
|
$
|
|
|
$
|
(
|
)
|
$
|
(
|
)
|
$
|
(
|
)
|
|||
|
Other comprehensive income (loss) before reclassifications
(A)
|
(
|
)
|
(
|
)
|
|
|
|
|
|||||||
|
Amounts reclassified out of accumulated other comprehensive loss
|
|
|
|
|
|
|
|
|
|||||||
|
Net current-period other comprehensive income (loss)
|
(
|
)
|
(
|
)
|
|
|
|
|
|||||||
|
Balance as of October 31, 2017
|
$
|
|
|
$
|
(
|
)
|
$
|
(
|
)
|
$
|
(
|
)
|
|||
|
(A)
|
Other comprehensive income before reclassifications for Defined Benefit Plans includes a
$
|
The following table presents the amounts reclassified from
Accumulated other comprehensive loss
and the affected line item in our
Consolidated Statements of Operations:
|
For the Years Ended October 31,
|
||||||||||||||
|
Location in Consolidated
Statements of Operations |
2019
|
2018
|
2017
|
|||||||||||
|
Defined benefit plans
|
||||||||||||||
|
Amortization of actuarial loss
|
Other expense, net
|
$
|
|
|
$
|
|
|
$
|
|
|
||||
|
Settlements
|
Other expense, net
|
|
|
|
|
|
|
|||||||
|
Settlements
|
Restructuring
|
|
|
|
|
|
|
|||||||
|
Total before tax
|
|
|
|
|
|
|
||||||||
|
Income tax expense
|
(
|
)
|
(
|
)
|
(
|
)
|
||||||||
|
Total reclassifications for the period, net of tax
|
$
|
|
|
$
|
|
|
$
|
|
|
|||||
Dividend Restrictions
Under the General Corporation Law of the State of Delaware, dividends may only be paid out of surplus or out of net profits for the year in which the dividend is declared or the preceding year, and no dividend may be paid on common stock at any time during which the capital of outstanding preferred stock or preference stock exceeds our net assets.
Certain debt instruments, including our
6.625
%
Senior Notes indenture, our Loan Agreement with regard to the Tax Exempt Bonds and our Amended Term Loan Credit Agreement, contain terms that include various negative covenants and restrictions, including, among others, certain limitations on dividends. We have not paid dividends on our common stock since 1980.
17.
Earnings Per Share Attributable to Navistar International Corporation
The following table presents the information used in the calculation of our basic and diluted earnings per share for continuing operations, discontinued operations, and net income, all attributable to NIC in our
Consolidated Statements of Operations
:
119
Navistar International Corporation and Subsidiaries
Notes to Consolidated Financial Statements—(Continued)
|
For the Years Ended October 31,
|
||||||||||||
|
(in millions, except per share data)
|
2019
|
2018
|
2017
|
|||||||||
|
Numerator:
|
||||||||||||
|
Amounts attributable to Navistar International Corporation common stockholders:
|
||||||||||||
|
Income from continuing operations, net of tax
|
$
|
|
|
$
|
|
|
$
|
|
|
|||
|
Income from discontinued operations, net of tax
|
|
|
|
|
|
|
||||||
|
Net income
|
$
|
|
|
$
|
|
|
$
|
|
|
|||
|
Denominator:
|
||||||||||||
|
Weighted average shares outstanding:
|
||||||||||||
|
Basic
|
|
|
|
|
|
|
||||||
|
Effect of dilutive securities
|
|
|
|
|
|
|
||||||
|
Diluted
|
|
|
|
|
|
|
||||||
|
Earnings per share attributable to Navistar International Corporation:
|
||||||||||||
|
Basic:
|
||||||||||||
|
Continuing operations
|
$
|
|
|
$
|
|
|
$
|
|
|
|||
|
Discontinued operations
|
|
|
|
|
|
|
||||||
|
Net income
|
$
|
|
|
$
|
|
|
$
|
|
|
|||
|
Diluted:
|
||||||||||||
|
Continuing operations
|
$
|
|
|
$
|
|
|
$
|
|
|
|||
|
Discontinued operations
|
|
|
|
|
|
|
||||||
|
Net income
|
$
|
|
|
$
|
|
|
$
|
|
|
|||
The conversion rate on our former 2018 Convertible Notes was
17.1233
shares of common stock per
$
1,000
principal amount of 2018 Convertible Notes, equivalent to an initial conversion price of approximately
$
58.40
per share of common stock. The 2018 Convertible Notes had an anti-dilutive effect when calculating diluted earnings per share when our average stock price was less than
$
58.40
for all periods presented. The 2018 Convertible Notes were fully repaid upon maturity in October 2018, and none were converted into our common stock.
The conversion rate on our former 2019 Convertible Notes was
18.4946
shares of common stock per
$
1,000
principal amount of 2019 Convertible Notes, equivalent to an initial conversion price of approximately
$
54.07
per share of common stock. The 2019 Convertible Notes had an anti-dilutive effect when calculating diluted earnings per share when our average stock price was less than
$
54.07
for all periods presented. The 2019 Convertible Notes were fully repaid upon maturity in April 2019 and none were converted into our common stock.
In February 2017, we consummated our previously announced strategic alliance with TRATON Group, which included an equity investment in the Company by TRATON Group pursuant to a Stock Purchase Agreement (the "Stock Purchase Agreement"), a License and Supply Framework Agreement and a Procurement JV Framework Agreement.
Pursuant to the Stock Purchase Agreement, on February 28, 2017 we issued and TRATON Group purchased
16.2
million
shares of our common stock for an aggregate purchase price of
$
256
million
at
$
15.76
per share (a
19.9
%
stake at the time of purchase (
16.6
%
on a fully-diluted basis)) in the Company, excluding stock issuance costs.
The computation of diluted earnings per share also excludes outstanding options and other common stock equivalents in periods where inclusion of such potential common stock instruments would be anti-dilutive.
For the years ended October 31,
2018
and
2017
, certain securities have been excluded from the computation of earnings per share, as our average stock price was less than their respective exercise prices. The aggregate shares not included were
9.8
million
and
13.9
million
, respectively, which were primarily comprised of
7.6
million
shares related to the 2019 Convertible Notes for the years ended October 31, 2018 and October 31, 2017, as well as
3.4
million
shares related to the 2018 Convertible Notes for the year ended October 31, 2017.
120
Navistar International Corporation and Subsidiaries
Notes to Consolidated Financial Statements—(Continued)
18. Stock-based Compensation Plans
2013 Performance Incentive Plan
The 2013 Performance Incentive Plan ("2013 PIP") was approved by the Board of Directors on December 11, 2012 and subsequently approved by the stockholders on February 19, 2013. The plan was first amended on February 11, 2015 and then subsequently amended on December 9, 2019. The 2013 PIP provides for the grant of annual cash incentive awards to all employees (including the Company’s executive officers), and stock options, restricted stock or stock unit awards, stock appreciation rights and other stock-based awards to all employees (including the Company’s executive officers), any consultants of the Company and its subsidiaries, and all non-employee directors serving on the Company’s Board of Directors. The awards granted under the 2013 PIP are established by our Board of Directors or a committee thereof at the time of issuance.
The 2013 PIP replaced on a prospective basis, our 2004 Performance Incentive Plan, and will expire in February 2023. A total of
3,665,500
shares of common stock were reserved for awards under the 2013 Plan. The number of shares authorized and available for issuance under the 2013 PIP will be increased by shares of stock subject to an option or award under the 2013 PIP, the Company’s 2004 Performance Incentive Plan, or the Ownership Program as further described below, (collectively, the "Existing Plans"), that are canceled, expired, forfeited, settled in cash, or otherwise terminated after February 19, 2013 without a delivery of shares to the participant of such plan, including shares used to satisfy the exercise price of a stock option or a tax withholding obligation arising in connection with an award. As of
October 31, 2019
,
3,106,390
shares remain available for issuance under the 2013 PIP. Shares issued under the Plan may be newly issued shares or reissued Treasury shares.
Other Plans and Grants
The following plans were approved by our Board of Directors but were not approved and were not required to be approved by our stockholders: the Executive Stock Ownership Program, as amended from time to time (the "Ownership Program"), and the Non-Employee Directors Deferred Fee Plan (the "Deferred Fee Plan").
|
•
|
Ownership Program
—In June 1997, our Board of Directors approved the terms of the Ownership Program. In general, under the Ownership Program in existence through November 2013, all officers and senior managers were required to acquire, by direct purchase or through salary or annual bonus reduction, an ownership interest in the Company by acquiring a designated amount of our common stock based on organizational level. Participants were required to hold such stock for the entire period in which they are employed by the Company. The Ownership Program was amended and restated effective November 1, 2013 on a going forward basis. The new guidelines (i) increased stock ownership guideline multiples to six times salary for the President and CEO and up to three times salary for other senior executives; (ii) modified retention requirements for Company granted equity until ownership requirements are met; (iii) added a holding period for shares acquired through transactions with Company granted equity after the executives satisfy the stock ownership requirement; (iv) eliminated the granting of premium shares as an inducement to executives fulfilling stock ownership guidelines on an accelerated basis; and (v) eliminated the required time frame to fulfill stock ownership guidelines. Under the prior Ownership Program, participants were entitled to defer their cash bonus into deferred share units ("DSUs"), which vested immediately. There were
|
|
•
|
Deferred Fee Plan
—Under the Deferred Fee Plan, non-employee directors may elect to defer payment of all or a portion of their retainer fees and meeting fees in cash (with interest) or in stock units. Deferrals in the deferred stock account are valued as if each deferral was vested in NIC common stock as of the deferral date. As of
October 31, 2019
,
|
Stock Options
Stock options represent the right to purchase a specified number of shares of common stock at a specified exercise price. Generally, stock options are awarded with an exercise price equal to the fair market value of the common stock at grant date. The stock options granted prior to December 2009 generally have a
ten
-year contractual life. Stock options granted in December 2009 through November 2016 were granted with a
seven
-year contractual life. Since December 2016, stock options
121
Navistar International Corporation and Subsidiaries
Notes to Consolidated Financial Statements—(Continued)
have been granted with a ten-year contractual life. Stock options are valued using the Black-Scholes option pricing model and vest ratably over a
three
-year period.
The following table summarizes stock options activity:
|
For the Years Ended October 31,
|
||||||||||||||||||||
|
2019
|
2018
|
2017
|
||||||||||||||||||
|
Shares
|
Weighted Average Exercise Price
|
Shares
|
Weighted Average Exercise Price
|
Shares
|
Weighted Average Exercise Price
|
|||||||||||||||
|
(in thousands)
|
(in thousands)
|
(in thousands)
|
||||||||||||||||||
|
Options outstanding, at beginning of year
|
|
|
$
|
|
|
|
|
$
|
|
|
|
|
$
|
|
|
|||||
|
Granted
|
|
|
|
|
|
|
|
|
|
|
|
|
||||||||
|
Exercised
|
(
|
)
|
|
|
(
|
)
|
|
|
(
|
)
|
|
|
||||||||
|
Forfeited/expired
|
(
|
)
|
|
|
(
|
)
|
|
|
(
|
)
|
|
|
||||||||
|
Options outstanding, at end of year
|
|
|
|
|
|
|
|
|
|
|
|
|
||||||||
|
Options exercisable, at end of year
|
|
|
|
|
|
|
|
|
|
|
|
|
||||||||
The following table summarizes information about stock options outstanding:
|
Shares
|
Weighted Average Remaining Contractual Life
|
Weighted Average Exercise Price
|
Aggregate Intrinsic Value
|
||||||||||
|
Range of Exercise Prices:
|
(in thousands)
|
(in years)
|
(in millions)
|
||||||||||
|
$ 10.60 - $ 31.19
|
|
|
|
|
$
|
|
|
$
|
|
|
|||
|
$ 31.20 - $ 39.32
|
|
|
|
|
|
|
|
|
|||||
|
$ 39.33 - $ 43.86
|
|
|
|
|
|
|
|
|
|||||
|
Options Outstanding
|
|
|
|||||||||||
The following table summarizes information about stock options exercisable:
|
Shares
|
Weighted Average Remaining Contractual Life
|
Weighted Average Exercise Price
|
Aggregate Intrinsic Value
|
||||||||||
|
Range of Exercise Prices:
|
(in thousands)
|
(in years)
|
(in millions)
|
||||||||||
|
$ 10.60 - $ 31.19
|
|
|
|
|
$
|
|
|
$
|
|
|
|||
|
$ 31.20 - $ 39.32
|
|
|
|
|
|
|
|
|
|||||
|
$ 39.33 - $ 43.86
|
|
|
|
|
|
|
|
|
|||||
|
Options Exercisable
|
|
|
|||||||||||
The weighted average grant date fair value of options granted during the years ended
October 31, 2019
,
2018
, and
2017
was
$
16.15
,
$
18.90
, and
$
13.61
, respectively. The total intrinsic value of stock options exercised during the years ended
October 31, 2019
,
2018
, and
2017
was
$
2
million
,
$
3
million
, and
$
3
million
, respectively. The fair value of each option grant was estimated on the grant date using the Black-Scholes option-pricing model.
The following table summarizes the annual weighted average assumptions:
|
For the Years Ended October 31,
|
||||||||
|
|
2019
|
2018
|
2017
|
|||||
|
Risk-free interest rate
|
|
%
|
|
%
|
|
%
|
||
|
Expected volatility
|
|
%
|
|
%
|
|
%
|
||
|
Expected life (in years)
|
|
|
|
|
|
|
||
122
Navistar International Corporation and Subsidiaries
Notes to Consolidated Financial Statements—(Continued)
The use of the Black-Scholes option-pricing model requires us to make certain estimates and assumptions. The risk-free interest rate utilized is the implied yield on U.S. Treasury zero-coupon issues with a remaining term equal to the expected term assumption on the grant date, rounded to the nearest half year. A dividend yield assumption of
0
%
is used for all grants based on our history of not paying a dividend to any class of stock and future expectations. Expected volatility is based on a blend of our historical stock prices and implied volatilities from traded options in our stock. The weighted average expected life in years for all grants as a group is then calculated for each year.
Restricted Stock
Restricted stock represents common stock issued subject to forfeiture or other restrictions that will lapse upon satisfaction of specified conditions. Restricted stock is valued based on the fair value of the common stock at grant date and except for the restricted stock issued to non-employee directors, vests either ratably over a
three
-year period or cliff-vest at the end of a
three
-year period. Restricted stock issued to non-employee directors represents their first quarterly retainer fees and immediately vests at grant date.
The following table summarizes restricted stock activity:
|
For the Years Ended October 31,
|
||||||||||||||||||||
|
2019
|
2018
|
2017
|
||||||||||||||||||
|
Shares
|
Weighted Average Grant Date Fair Value
|
Shares
|
Weighted Average Grant Date Fair Value
|
Shares
|
Weighted Average Grant Date Fair Value
|
|||||||||||||||
|
(in thousands)
|
(in thousands)
|
(in thousands)
|
||||||||||||||||||
|
Nonvested, at beginning of year
|
|
|
$
|
|
|
|
|
$
|
|
|
|
|
$
|
|
|
|||||
|
Granted
|
|
|
|
|
|
|
|
|
|
|
|
|
||||||||
|
Vested
|
(
|
)
|
|
|
(
|
)
|
|
|
(
|
)
|
|
|
||||||||
|
Nonvested, at end of year
|
|
|
|
|
|
|
|
|
|
|
|
|
||||||||
The aggregate grant date fair value of restricted stock vested for the years ended
October 31, 2019
,
2018
and
2017
was
$
0.1
million
.
Restricted Stock Units
Restricted stock units ("RSUs") represent the right to receive shares of common stock ("share-settled RSUs") or the cash ("cash-settled RSUs") value of one share of common stock in the future, with the right to future delivery of the shares or cash subject to forfeiture or other restrictions that will lapse upon satisfaction of specified conditions. Share and cash-settled RSUs are valued based on the fair value of the common stock at grant date and vest either ratably over a
three
-year period or cliff-vest at the end of a
three
-year period. Cash-settled RSUs are classified as liabilities and are remeasured at each reporting date until settlement.
123
Navistar International Corporation and Subsidiaries
Notes to Consolidated Financial Statements—(Continued)
The following tables summarize RSUs activity for the years ended October 31:
|
Share-Settled RSUs
|
||||||||||||||||||||
|
2019
|
2018
|
2017
|
||||||||||||||||||
|
Shares
|
Weighted Average Grant Date Fair Value
|
Shares
|
Weighted Average Grant Date Fair Value
|
Shares
|
Weighted Average Grant Date Fair Value
|
|||||||||||||||
|
(in thousands)
|
(in thousands)
|
(in thousands)
|
||||||||||||||||||
|
Nonvested, at beginning of year
|
|
|
$
|
|
|
|
|
$
|
|
|
|
|
$
|
|
|
|||||
|
Granted
|
|
|
|
|
|
|
|
|
|
|
|
|
||||||||
|
Vested
|
(
|
)
|
|
|
(
|
)
|
|
|
(
|
)
|
|
|
||||||||
|
Forfeited
|
(
|
)
|
|
|
(
|
)
|
|
|
|
|
|
|
||||||||
|
Nonvested, at end of year
|
|
|
|
|
|
|
|
|
|
|
|
|
||||||||
|
Cash-Settled RSUs
|
||||||||||||||||||||
|
2019
|
2018
|
2017
|
||||||||||||||||||
|
Shares
|
Weighted Average Grant Date Fair Value
|
Shares
|
Weighted Average Grant Date Fair Value
|
Shares
|
Weighted Average Grant Date Fair Value
|
|||||||||||||||
|
(in thousands)
|
(in thousands)
|
(in thousands)
|
||||||||||||||||||
|
Nonvested, at beginning of year
|
|
|
$
|
|
|
|
|
$
|
|
|
|
|
$
|
|
|
|||||
|
Granted
|
|
|
|
|
|
|
|
|
|
|
|
|
||||||||
|
Vested
|
(
|
)
|
|
|
(
|
)
|
|
|
(
|
)
|
|
|
||||||||
|
Forfeited
|
(
|
)
|
|
|
(
|
)
|
|
|
(
|
)
|
|
|
||||||||
|
Nonvested, at end of year
|
|
|
|
|
|
|
|
|
|
|
|
|
||||||||
The aggregate grant date fair value of RSUs vested during the years ended
October 31, 2019
,
2018
, and
2017
was
$
8
million
,
$
7
million
, and
$
9
million
, respectively.
Performance-based Stock Options
Performance-based stock options represent the right to receive shares of common stock in the future, with the right to future delivery of the shares subject to forfeiture or other restrictions that will lapse upon satisfaction of a combination of the following conditions: service, market and performance conditions. Performance-based stock options have a
seven
-year contractual life. Performance-based stock options subject to service and performance conditions are valued using the Black-Scholes option pricing model and cliff-vest at the end of a
three
-year period if performance measures are met. Performance-based stock options subject to service and market conditions are valued using a Monte Carlo simulation and cliff-vest at the end of a
three
-year period if performance measures are met.
The following table summarizes the performance-based stock options subject to service and performance conditions activity:
|
For the Years Ended October 31,
|
||||||||||||||||||||
|
2019
|
2018
|
2017
|
||||||||||||||||||
|
Shares
|
Weighted Average Exercise Price
|
Shares
|
Weighted Average Exercise Price
|
Shares
|
Weighted Average Exercise Price
|
|||||||||||||||
|
(in thousands)
|
(in thousands)
|
(in thousands)
|
||||||||||||||||||
|
Options outstanding, at beginning of year
|
|
|
$
|
|
|
|
|
$
|
|
|
|
|
$
|
|
|
|||||
|
Exercised
|
(
|
)
|
|
|
(
|
)
|
|
|
|
|
|
|
||||||||
|
Forfeited
|
|
|
|
|
(
|
)
|
|
|
(
|
)
|
|
|
||||||||
|
Options outstanding, at end of year
|
|
|
|
|
|
|
|
|
|
|
|
|
||||||||
|
Options exercisable, at end of year
|
|
|
$
|
|
|
|
|
$
|
|
|
|
|
$
|
|
|
|||||
124
Navistar International Corporation and Subsidiaries
Notes to Consolidated Financial Statements—(Continued)
The following table summarizes the performance-based stock options subject to service and market conditions activity:
|
For the Years Ended October 31,
|
||||||||||||||||||||
|
2019
|
2018
|
2017
|
||||||||||||||||||
|
Shares
|
Weighted Average Exercise Price
|
Shares
|
Weighted Average Exercise Price
|
Shares
|
Weighted Average Exercise Price
|
|||||||||||||||
|
(in thousands)
|
(in thousands)
|
(in thousands)
|
||||||||||||||||||
|
Options outstanding, at beginning of year
|
|
|
$
|
|
|
|
|
$
|
|
|
|
|
$
|
|
|
|||||
|
Exercised
|
(
|
)
|
|
|
(
|
)
|
|
|
(
|
)
|
|
|
||||||||
|
Forfeited
|
(
|
)
|
|
|
|
|
|
|
(
|
)
|
|
|
||||||||
|
Options outstanding, at end of year
|
|
|
|
|
|
|
|
|
|
|
|
|
||||||||
|
Options exercisable, at end of year
|
|
|
|
|
|
|
|
|
|
|
|
|
||||||||
The total intrinsic value of performance-based stock options exercised was
$
1
million
during each of the years ended October 31, 2018 and October 31, 2017. There was minimal intrinsic value for performance-based options exercised during the year ended October 31, 2019.
Performance-based Stock Units
Performance-based stock units ("PUs") represent the right to receive one share of common stock ("share-settled PUs") or cash equal to the value of one share of common stock ("cash-settled PUs") in the future, with the right to future delivery of the shares or cash subject to forfeiture or other restrictions that will lapse upon satisfaction of a combination of the following conditions: service, market, and performance conditions. Share and cash-settled PUs subject to service and performance conditions are valued based on the fair value of the common stock at grant date and vest either at the end of the performance period or cliff-vest at the end of a
three
-year period if performance measures are met. Cash-settled PUs subject to service and market conditions are valued using a Monte Carlo simulation and cliff-vest at the end of a
three
-year period if performance measures are met. Cash-settled PUs are classified as liabilities and are remeasured at each reporting date until settlement. There were no nonvested share-settled PUs subject to service and performance conditions outstanding for the years ended
October 31, 2019
,
2018
, and
2017
.
The following tables summarize cash-settled PUs activity for the years ended October 31:
|
Cash-Settled PUs subject to Service and Performance Conditions
|
|||||||||||||||||||||
|
2019
|
2018
|
2017
|
|||||||||||||||||||
|
Shares
|
Weighted Average Grant Date Fair Value
|
Shares
|
Weighted Average Grant Date Fair Value
|
Shares
|
Weighted Average Grant Date Fair Value
|
||||||||||||||||
|
(in thousands)
|
(in thousands)
|
(in thousands)
|
|||||||||||||||||||
|
Nonvested, at beginning of year
|
|
|
$
|
|
|
|
|
$
|
|
|
$
|
|
|
$
|
|
|
|||||
|
Granted
|
|
|
|
|
|
|
|
|
|
|
|
|
|||||||||
|
Vested
|
|
|
|
|
(
|
)
|
|
|
|
|
|
|
|||||||||
|
Forfeited
|
|
|
|
|
(
|
)
|
|
|
(
|
)
|
|
|
|||||||||
|
Nonvested, at end of year
|
|
|
|
|
|
|
|
|
|
|
|
|
|||||||||
125
Navistar International Corporation and Subsidiaries
Notes to Consolidated Financial Statements—(Continued)
|
Cash Settled PUs subject to Service and Market Conditions
|
||||||||||||||||||||
|
2019
|
2018
|
2017
|
||||||||||||||||||
|
Shares
|
Weighted Average Grant Date Fair Value
|
Shares
|
Weighted Average Grant Date Fair Value
|
Shares
|
Weighted Average Grant Date Fair Value
|
|||||||||||||||
|
(in thousands)
|
(in thousands)
|
(in thousands)
|
||||||||||||||||||
|
Nonvested, at beginning of year
|
|
|
$
|
|
|
|
|
$
|
|
|
|
|
$
|
|
|
|||||
|
Forfeited
|
|
|
|
|
|
|
|
|
(
|
)
|
|
|
||||||||
|
Nonvested, at end of year
|
|
|
|
|
|
|
|
|
|
|
|
|
||||||||
Total Share-Based Compensation Expense
Total share-based compensation expense for the years ended
October 31, 2019
,
2018
, and
2017
was
$
17
million
,
$
17
million
and
$
25
million
, respectively. We record share-based compensation expense on a straight-line basis over the required service period which is equal to the vesting period, beginning on the grant date. Share-based compensation expense is included in
Selling, general and administrative expenses
in the
Consolidated Statements of Operations
. As of
October 31, 2019
, there was
$
12
million
of total unrecognized compensation expense related to non-vested share-based awards which is expected to be recognized over a weighted average period of approximately
one year
.
We received cash of
$
4
million
,
$
8
million
, and
$
12
million
during the years ended
October 31, 2019
,
2018
and
2017
, respectively, related to stock options exercised. We used cash of
$
8
million
,
$
13
million
, and
$
13
million
during the years ended
October 31, 2019
,
2018
, and
2017
, respectively, to settle cash-settled RSUs. We did
no
t realize any tax benefit from stock options exercised for fiscal years
2019
,
2018
and
2017
.
126
Navistar International Corporation and Subsidiaries
Notes to Consolidated Financial Statements—(Continued)
19. Supplemental Cash Flow Information
The following table provides additional information about our
Consolidated Statements of Cash Flows
:
|
For the Years Ended October 31,
|
|||||||||||
|
(in millions)
|
2019
|
2018
|
2017
|
||||||||
|
Equity in income of affiliated companies, net of dividends
|
|
|
|
||||||||
|
Equity in income of non-consolidated affiliates
|
$
|
(
|
)
|
$
|
|
|
$
|
(
|
)
|
||
|
Dividends from non-consolidated affiliates
|
|
|
|
|
|
|
|||||
|
Equity in income of non-consolidated affiliates, net of dividends
|
$
|
(
|
)
|
$
|
|
|
$
|
|
|
||
|
Other non-cash operating activities
|
|
|
|
||||||||
|
Gain on sale of property and equipment
|
$
|
(
|
)
|
$
|
|
|
$
|
(
|
)
|
||
|
Loss on sale and impairment of repossessed collateral
|
|
|
|
|
|
|
|||||
|
Income from non-cash leases
|
(
|
)
|
(
|
)
|
(
|
)
|
|||||
|
Other non-cash operating activities
|
$
|
(
|
)
|
$
|
(
|
)
|
$
|
(
|
)
|
||
|
Changes in other assets and liabilities
|
|
|
|
||||||||
|
Other current assets
|
$
|
(
|
)
|
$
|
(
|
)
|
$
|
(
|
)
|
||
|
Other noncurrent assets
|
(
|
)
|
(
|
)
|
(
|
)
|
|||||
|
Other current liabilities
|
|
|
|
|
(
|
)
|
|||||
|
Postretirement benefits liabilities, net
|
|
|
(
|
)
|
(
|
)
|
|||||
|
Other noncurrent liabilities
|
(
|
)
|
|
|
(
|
)
|
|||||
|
Other, net
|
|
|
|
|
(
|
)
|
|||||
|
Changes in other assets and liabilities
|
$
|
|
|
$
|
|
|
$
|
(
|
)
|
||
|
Cash paid during the year
|
|
|
|
||||||||
|
Interest, net of amounts capitalized
|
$
|
|
|
$
|
|
|
$
|
|
|
||
|
Income taxes, net of refunds
|
|
|
|
|
|
|
|||||
|
Non-cash investing and financing activities
|
|
|
|
||||||||
|
Transfers to inventories from property and equipment for leases to others
|
(
|
)
|
(
|
)
|
(
|
)
|
|||||
127
Navistar International Corporation and Subsidiaries
Notes to Consolidated Financial Statements—(Continued)
20
. Selected Quarterly Financial Data (Unaudited)
The following tables provide our
quarterly condensed consolidated statements of operations and financial data:
|
First Quarter Ended
January 31,
|
Second Quarter Ended
April 30,
|
||||||||||||||
|
(in millions, except for per share data and stock prices)
|
2019
|
2018
|
2019
|
2018
|
|||||||||||
|
Sales and revenues, net
|
$
|
|
|
$
|
|
|
$
|
|
|
$
|
|
|
|||
|
Manufacturing gross margin
(A)
|
|
|
|
|
|
|
|
|
|
||||||
|
Net income (loss) attributable to Navistar International Corporation
|
$
|
|
|
$
|
(
|
)
|
|
$
|
(
|
)
|
$
|
|
|
||
|
Earnings (loss) per share attributable to Navistar International Corporation:
|
|||||||||||||||
|
Basic
(B)
|
$
|
|
|
$
|
(
|
)
|
$
|
(
|
)
|
$
|
|
|
|||
|
Diluted
(B)
|
$
|
|
|
$
|
(
|
)
|
$
|
(
|
)
|
$
|
|
|
|||
|
Third Quarter Ended
July 31,
|
Fourth Quarter Ended
October 31,
|
||||||||||||||
|
(in millions, except for per share data and stock prices)
|
2019
|
2018
|
2019
|
2018
|
|||||||||||
|
Sales and revenues, net
|
$
|
|
|
$
|
|
|
$
|
|
|
$
|
|
|
|||
|
Manufacturing gross margin
(A)
|
|
|
|
|
|
|
|
|
|||||||
|
Net income attributable to Navistar International Corporation
|
$
|
|
|
$
|
|
|
$
|
|
|
$
|
|
|
|||
|
Earnings per share attributable to Navistar International Corporation:
|
|||||||||||||||
|
Basic
(B)
|
$
|
|
|
$
|
|
|
$
|
|
|
$
|
|
|
|||
|
Diluted
(B)
|
$
|
|
|
$
|
|
|
$
|
|
|
$
|
|
|
|||
(A) Manufacturing gross margin is calculated by subtracting
Costs of products sold
from
Sales of manufactured products, net
.
|
(B)
|
Earnings per share in each quarter is computed using the weighted-average number of shares outstanding during that quarter while earnings per share for the full year is computed using the weighted-average number of shares outstanding during the year. Thus, the sum of the four quarters earnings per share may not equal the full year earnings per share.
|
128
|
Item 9.
|
Changes in and Disagreements with Accountants on Accounting and Financial Disclosure
|
None.
Item 9A.
Controls and Procedures
(a) Evaluation of Disclosure Controls and Procedures
Disclosure controls and procedures (as defined in Rules 13a-15(e) and 15d-15(e) under the Exchange Act) are designed to ensure that information required to be disclosed in reports filed or submitted under the Exchange Act is recorded, processed, summarized, and reported within the time periods specified in the SEC rules and forms, and that such information is accumulated and communicated to management, including our Chief Executive Officer and Chief Financial Officer, to allow timely decisions regarding required disclosures.
In connection with the preparation of this report, management, under the supervision and with the participation of the Chief Executive Officer and Chief Financial Officer, conducted an evaluation of the effectiveness of the design and operation of our disclosure controls and procedures as of October 31, 2019. Based on that evaluation, our Chief Executive Officer and Chief Financial Officer have concluded that, as of October 31, 2019, our disclosure controls and procedures were effective.
(b) Changes in Internal Control over Financial Reporting
There were no material changes in our internal control over financial reporting identified in connection with the evaluation required by Rules 13a-15 and 15d-15 under the Exchange Act that occurred during the quarter ended October 31, 2019 that have materially affected, or are reasonably likely to materially affect, our internal control over financial reporting.
(c) Management's Report on Internal Control over Financial Reporting
Management is responsible for establishing and maintaining adequate internal control over financial reporting as defined in Rules 13a-15(f) and 15d-15(f) under the Exchange Act. Internal control over financial reporting is a process designed by, and under the supervision of, our Chief Executive Officer and Chief Financial Officer and effected by management and our Board of Directors to provide reasonable assurance regarding the reliability of financial reporting and the preparation of financial statements for external purposes in accordance with GAAP. Internal control over financial reporting includes those policies and procedures that:
|
•
|
Pertain to the maintenance of records that, in reasonable detail, accurately and fairly reflect the transactions and dispositions of assets of the Company.
|
|
•
|
Provide reasonable assurance that transactions are recorded as necessary to permit preparation of consolidated financial statements in accordance with GAAP and that receipts and expenditures of the Company are being made in accordance with authorization of our management and our Board of Directors.
|
|
•
|
Provide reasonable assurance regarding prevention or timely detection of unauthorized acquisition, use, or disposition of our assets that could have a material effect on our consolidated financial statements.
|
Because of its inherent limitations, internal control over financial reporting may not prevent or detect all misstatements. Also, projections of any evaluation of the effectiveness of our internal control over financial reporting to future periods are subject to the risk that controls may become inadequate because of changes in conditions, or that the degree of compliance with the policies or procedures may deteriorate.
Management, with the participation of our Chief Executive Officer and Chief Financial Officer, conducted an evaluation of the effectiveness of the internal control over financial reporting as of October 31, 2019 using the criteria set forth by the Internal Control Integrated Framework (2013) issued by the Committee of Sponsoring Organizations of the Treadway Commission (COSO). As a result of that evaluation, management concluded that our internal control over financial reporting was effective as of October 31, 2019.
Our independent registered public accounting firm, KPMG LLP, has audited the Company's consolidated financial statements and the effectiveness of the Company's internal control over financial reporting as of October 31, 2019. Their reports appear in this Annual Report on Form 10-K.
|
Item 9B.
|
Other Information
|
None.
129
|
Item 10.
|
Directors, Executive Officers, and Corporate Governance
|
A list of our executive officers and their respective biographical information appears in Part I, Item 1 of this report. Information about our directors may be found under the caption "
Proposal 1-Election of Directors
" in our proxy statement for the
2020
annual meeting of stockholders scheduled to be held on
February 25, 2020
(the "Proxy Statement"). Information about our Audit Committee may be found under the captions "
Board Committees
" and "
Report of the Audit Committee
" in the Proxy Statement. Information about the procedures by which security holders may recommend nominees to our Board of Directors may be found under the caption "
Shareholder Nominations
" in the Proxy Statement. That information is incorporated herein by reference.
The information in the Proxy Statement set forth under the captions "
Delinquent Section 16(a) Reports"
and "
Code of Conduct
" is incorporated herein by reference.
|
Item 11.
|
Executive Compensation
|
The information in the Proxy Statement set forth under the caption "
Executive
Compensation
" is incorporated herein by reference.
|
Item 12.
|
Security Ownership of Certain Beneficial Owners and Management and Related Stockholder Matters
|
The information in the Proxy Statement set forth under the captions "
Persons Owning More Than Five Percent of Company Common Stock
," "
Company Common Stock Owned by Executive Officers and Directors
," and "
Equity Compensation Plan Information
" is incorporated herein by reference.
|
Item 13.
|
Certain Relationships and Related Transactions, and Director Independence
|
The information set forth in the Proxy Statement under the captions "
Transactions with Related Persons
" and "
Board Independence
" is incorporated herein by reference.
|
Item 14.
|
Principal Accounting Fees and Services
|
Information concerning principal accountant fees and services appears in the Proxy Statement under the heading "
Fees of Independent Registered Public Accounting Firm
" and is incorporated herein by reference.
130
|
Item 15.
|
Exhibits and Financial Statement Schedules
|
Financial Statements
See Item 8—
Financial Statements and Supplementary Data
Financial statement schedules
are omitted because of the absence of the conditions under which they are required or because information called for is shown in the consolidated financial statements and notes thereto.
|
Exhibit:
|
Description
|
Page
|
||
|
(2.1)
|
|
N/A
|
||
|
(2.2)
|
|
N/A
|
||
|
(3)
|
E-1
|
|||
|
(4)
|
E-2
|
|||
|
(10)
|
E-3
|
|||
|
(11)
|
||||
|
(21)
|
E-10
|
|||
|
(23.1)
|
E-11
|
|||
|
(24)
|
E-12
|
|||
|
(31.1)
|
E-13
|
|||
|
(31.2)
|
E-14
|
|||
|
(32.1)
|
E-15
|
|||
|
(32.2)
|
E-16
|
|||
|
(99.1)
|
E-17
|
|||
|
(101.INS)
|
XBRL Instance Document
|
N/A
|
||
|
(101.SCH)
|
XBRL Taxonomy Extension Schema Document
|
N/A
|
||
|
(101.CAL)
|
XBRL Taxonomy Extension Calculation Linkbase Document
|
N/A
|
||
|
(101.LAB)
|
XBRL Taxonomy Extension Label Linkbase Document
|
N/A
|
||
|
(101.PRE)
|
XBRL Taxonomy Extension Presentation Linkbase Document
|
N/A
|
||
|
(101.DEF)
|
XBRL Taxonomy Extension Definition Linkbase Document
|
N/A
|
||
* Certain schedules and attachments referenced in the Recapitalization Agreement have been omitted in accordance with Item 601(b)(2) of Regulation S-K. A copy of any omitted schedule and attachment will be furnished supplementally to the U.S. Securities and Exchange Commission upon request.
All exhibits other than those indicated above are omitted because of the absence of the conditions under which they are required or because the information called for is shown in the consolidated financial statements and notes thereto in the Annual Report on Form 10-K for the period ended
October 31, 2019
.
Item 16.
Summary
None.
131
SIGNATURE
Pursuant to the requirements of the Securities Exchange Act of 1934, the Registrant has duly caused this report to be signed on its behalf by the undersigned, thereunto duly authorized.
|
NAVISTAR INTERNATIONAL CORPORATION
|
|
|
(Registrant)
|
|
|
/s/ SAMARA A. STRYCKER
|
|
|
Samara A. Strycker
|
|
|
Senior Vice President and Corporate Controller
|
|
|
(Principal Accounting Officer)
|
|
December 17, 2019
Pursuant to the requirements of the Securities Exchange Act of 1934, this report has been signed below by the following persons on behalf of the Registrant and in the capacities and on the dates indicated:
|
Signature
|
Title
|
Date
|
||
|
/s/ TROY A. CLARKE
|
Chairman, President,
Chief Executive Officer
(Principal Executive Officer)
|
December 17, 2019
|
||
|
Troy A. Clarke
|
||||
|
/s/ WALTER G. BORST
|
Executive Vice President and
Chief Financial Officer
(Principal Financial Officer)
|
December 17, 2019
|
||
|
Walter G. Borst
|
||||
|
/s/ SAMARA A. STRYCKER
|
Senior Vice President and
Corporate Controller
(Principal Accounting Officer)
|
December 17, 2019
|
||
|
Samara A. Strycker
|
||||
|
/s/ JOSÉ MARIA ALAPONT
|
Director
|
December 17, 2019
|
||
|
José Maria Alapont
|
||||
|
/s/ STEPHEN R. D'ARCY
|
Director
|
December 17, 2019
|
||
|
Stephen R. D'Arcy
|
||||
|
/s/ JEFFREY A. DOKHO
|
Director
|
December 17, 2019
|
||
|
Jeffrey A. Dokho
|
||||
|
/s/ VINCENT J. INTRIERI
|
Director
|
December 17, 2019
|
||
|
Vincent J. Intrieri
|
||||
|
/s/ RAYMOND T. MILLER
|
Director
|
December 17, 2019
|
||
|
Raymond T. Miller
|
||||
|
/s/ MARK H. RACHESKY
|
Director
|
December 17, 2019
|
||
|
Mark H. Rachesky
|
||||
|
/s/ ANDREAS H. RENSCHLER
|
Director
|
December 17, 2019
|
||
|
Andreas H. Renschler
|
||||
|
/s/ CHRISTIAN SCHULZ
|
Director
|
December 17, 2019
|
||
|
Christian Schulz
|
||||
|
/s/ KEVIN M. SHEEHAN
|
|
Director
|
|
December 17, 2019
|
|
Kevin M. Sheehan
|
||||
132
TABLE OF CONTENTS
Part IItem 1. BusinessItem 1A. Risk FactorsItem 1B. Unresolved Staff CommentsItem 2. PropertiesItem 3. Legal ProceedingsItem 4. Mine Safety DisclosuresPart IIItem 5. Market For Registrant's Common Equity, Related Stockholder Matters and Issuer Purchases Of Equity SecuritiesItem 6. Selected Financial DataItem 7. Management's Discussion and Analysis Of Financial Condition and Results Of Continuing OperationsItem 7A. Quantitative and Qualitative Disclosures About Market RiskItem 8. Financial Statements and Supplementary DataItem 9. Changes in and Disagreements with Accountants on Accounting and Financial DisclosureItem 9A. Controls and ProceduresItem 9B. Other InformationPart IIIItem 10. Directors, Executive Officers, and Corporate GovernanceItem 11. Executive CompensationItem 12. Security Ownership Of Certain Beneficial Owners and Management and Related Stockholder MattersItem 13. Certain Relationships and Related Transactions, and Director IndependenceItem 14. Principal Accounting Fees and ServicesPart IVItem 15. Exhibits and Financial Statement SchedulesItem 16. Summary