|
|
|
|
|
|
|
|
|
|
|
|
|
|
|
|
|
|
|
|
|
|
|
|
|
|
|
|
|
|
|
|
|
|
|
|
|
|
UNITED STATES
SECURITIES AND EXCHANGE COMMISSION
Washington, D.C. 20549
Form
(Mark One)
|
|
|
|
QUARTERLY REPORT PURSUANT TO SECTION 13 OR 15(d) OF THE SECURITIES EXCHANGE ACT OF 1934 |
For the quarterly period ended
or
|
|
|
|
TRANSITION REPORT PURSUANT TO SECTION 13 OR 15(d) OF THE SECURITIES EXCHANGE ACT OF 1934 |
For the transition period from to
Commission File Number:
(Exact name of registrant as specified in its charter)
|
|
|
|
(State or other jurisdiction of incorporation or organization) |
(I.R.S. Employer Identification No.) |
|
|
|
|
|
|
|
(Address of principal executive offices) |
(Zip Code) |
(Registrant’s telephone number, including area code)
(Former name, former address and former fiscal year, if changed since last report)
Indicate by check mark whether the registrant: (1) has filed all reports required to be filed by Section 13 or 15(d) of the Securities Exchange Act of 1934 during the preceding 12 months (or for such shorter period that the registrant was required to file such reports), and (2) has been subject to such filing requirements for the past 90 days.
Indicate by check mark whether the registrant has submitted electronically every Interactive Data File required to be submitted pursuant to Rule 405 of Regulation S-T
(§ 232.405 of this chapter)
during the preceding 12 months (or for such shorter period that the registrant was required to submit such files).
Indicate by check mark whether the registrant is a large accelerated filer, an accelerated filer, a non-accelerated filer, a smaller reporting company, or an emerging growth company. See the definitions of “large accelerated filer,” “accelerated filer,” “smaller reporting company” and “emerging growth company” in Rule 12b-2 of the Exchange Act.
|
|
☒ |
|
Accelerated filer |
☐ |
|
Non-accelerated filer |
☐ |
|
Smaller reporting company |
|
|
|
Emerging growth company |
|
||
If an emerging growth company, indicate by check mark if the registrant has elected not to use the extended transition period for complying with any new or revised financial accounting standards provided pursuant to Section 13(a) of the Exchange Act. ☐
Indicate by check mark whether the registrant is a shell company (as defined in Rule 12b-2 of the Exchange Act). Yes
Sec u r iti e s r e g i s te r ed p u r s u a n t to Secti o n 12(b ) o f t h e A c t.
|
Title o f each c l a s s |
|
Trading Symbol(s) |
|
N a m e o f each e x c h a ng e o n w h ich r e g i s te r ed |
|
|
|
|
|
|
|
|
|
|
|
|
As of September 30, 2022, there were

TABLE OF CONTENTS
Organization of Our Form 10-Q
The order and presentation of content in our Form 10-Q di f fers from the traditional Securities and Exchange Commission (SEC) Form 10-Q format. Our format is designed to improve readability and to better present how we organize and manage our business. See Appendix A, "Form 10-Q Cross-Reference Index" for a cross-reference index to the traditional SEC Form 10-Q format.
FORWARD-LOOKING AND CAUTIONARY STATEMENTS
This Quarterly Report on Form 10-Q contains “forward-looking” statements and other information that is based on management’s current expectations as of the date of this report. Statements that are not historical facts, including statements about our beliefs, opinions, or expectations and statements that assume or are dependent upon future events, are forward-looking statements and often contain words such as “expect,” “anticipate,” “intend,” “plan,” “believe,” “seek,” “see,” “will,” “would,” “may,” “could,” “should,” “goals,” or “target.” Such statements are based on management's expectations as of the date of this filing and involve many risks and uncertainties that could cause our actual results to differ materially from those expressed or implied in our forward-looking statements. Such risks and uncertainties are discussed more fully under the section titled “Risk Factors” and include, but are not limited to the following:
|
|
• |
the continuing impacts of the COVID-19 pandemic and related risks; |
|
|
• |
general economic conditions, including the potential impact of persistent inflation on Navient and its impact on the creditworthiness of third parties; |
|
|
• |
increased defaults on education loans held by us; |
|
|
• |
the cost and availability of funding in the capital markets; |
|
|
• |
changes in the general interest rate environment, including the availability of any relevant money-market index rate, including LIBOR, or the relationship between the relevant money-market index rate and the rate at which our assets are priced; |
|
|
• |
unanticipated repayment trends on education loans including prepayments or deferrals resulting from new interpretations of current laws, rules or regulations or future laws, executive orders or other policy initiatives which operate to encourage or require consolidation, abolish existing or create additional income-based repayment or debt forgiveness programs or establish other policies and programs which may increase the prepayment rates on education loans and accelerate repayment of the bonds in our securitization trusts; |
|
|
• |
our unhedged Floor Income is dependent on the future interest rate environment and therefore is variable; |
|
|
• |
a reduction in our credit ratings; |
|
|
• |
adverse market conditions or an inability to effectively manage our liquidity risk could negatively impact us; |
|
|
• |
the interest rate characteristics of our assets do not always match those of our funding arrangements; |
|
|
• |
our use of derivatives exposes us to credit and market risk; |
|
|
• |
our ability to continually and effectively align our cost structure with our business operations; |
|
|
• |
a failure of our operating systems, infrastructure or information technology systems; |
|
|
• |
failure by any third party providing us material services or products or a breach or violation of law by one of these third parties; |
|
|
• |
changes to applicable laws, rules, regulations and government policies and expanded regulatory and governmental oversight; |
|
|
• |
our work with government clients exposes us to additional risks inherent in the government contracting environment; |
|
|
• |
shareholder activism; |
|
|
• |
shareholders’ percentage ownership in Navient may be diluted in the future; |
|
|
• |
reputational risk and social factors; |
|
|
• |
obligations owed to parties under various transaction agreements that were executed as part of the spin-off of Navient from SLM Corporation (the Spin-Off); and |
|
|
• |
acquisitions or strategic investments that we pursue. |
Given these risks and uncertainties, readers are cautioned not to place undue reliance on such forward-looking statements. Readers are urged to carefully review and consider the various disclosures made in this Form 10-Q and in other documents we file from time to time with the SEC that disclose risks and uncertainties that may affect our business.
The preparation of our consolidated financial statements also requires management to make certain estimates and assumptions including estimates and assumptions about future events. These estimates or assumptions may prove to be incorrect and actual results could differ materially. All forward-looking statements contained in this report are qualified by these cautionary statements and are made only as of the date of this report. We do not undertake any obligation to update or revise these forward-looking statements except as required by law.
Through this discussion and analysis, we intend to provide the reader with some narrative context for how our management views our consolidated financial statements, additional context within which to assess our operating results, and information on the quality and variability of our earnings, liquidity and cash flows.
1
USE OF NON-GAAP FINANCIAL MEASURES
We prepare financial statements and present financial results in accordance with GAAP. However, we also evaluate our business segments and present our financial results on a basis that differs from GAAP. We refer to this different basis of presentation as Core Earnings, which is a non-GAAP financial measure. We provide this Core Earnings basis of presentation on a consolidated basis and for each business segment because this is what we review internally when making management decisions regarding our performance and how we allocate resources. We also include this information in our presentations with credit rating agencies, lenders and investors. Because our Core Earnings basis of presentation corresponds to our segment financial presentations, we are required by GAAP to provide Core Earnings disclosures in the notes to our consolidated financial statements for our business segments.
In addition to Core Earnings, we present the following other non-GAAP financial measures: Adjusted Core Earnings, Tangible Equity, Adjusted Tangible Equity Ratio, Pro forma Adjusted Tangible Equity Ratio, Earnings before Interest, Taxes, Depreciation and Amortization Expense (EBITDA) (for the Business Processing segment), and Allowance for Loan Losses Excluding Expected Future Recoveries on Previously Fully Charged-off Loans. See “Management’s Discussion and Analysis of Financial Condition and Results of Operations – Non-GAAP Financial Measures” for a further discussion and a complete reconciliation between GAAP net income and Core Earnings.
2
Overview and Fundamentals of Our Business
Navient (Nasdaq: NAVI) provides technology-enabled education finance and business processing solutions that simplify complex programs and help millions of people achieve success. Our customer-focused, data-driven services deliver exceptional results for clients in education, health care and government. Learn more at navient.com.
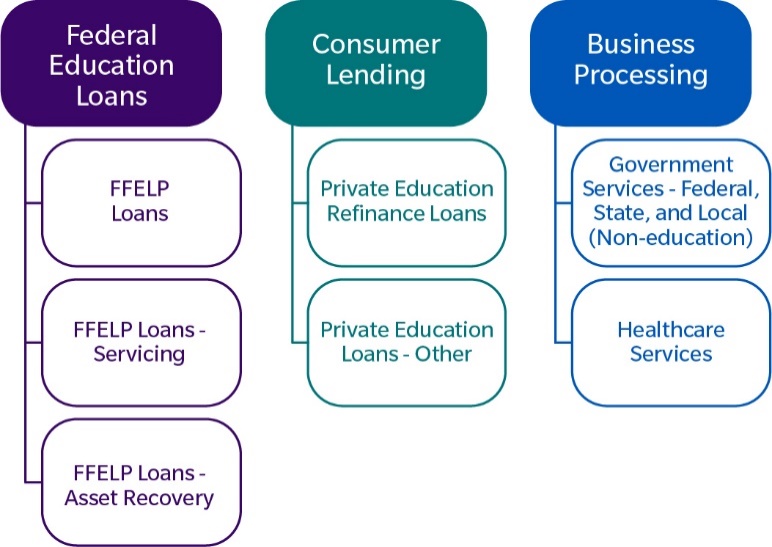
With a focus on data-driven insights, service, compliance and innovative support, Navient’s business consists of:

|
• |
Federal Education Loans |
We own a portfolio of $46.9 billion of federally guaranteed Federal Family Education Loan Program (FFELP) Loans. As a servicer on our own portfolio and for third parties, we deploy data-driven approaches to support the success of our customers. Our flexible and scalable infrastructure manages large volumes of complex transactions, simplifying the customer experience and continually improving efficiency.
|
• |
Consumer Lending |
We help students and families succeed through the paying-for-college journey with innovative planning tools, student loans and refinancing products. Our $19.2 billion Private Education Loan portfolio demonstrates high customer success rates. In the third quarter of 2022, we originated $447 million in Private Education Loans.
|
• |
Business Processing |
We provide business processing solutions for approximately 500 public sector and healthcare organizations, and their tens of millions of clients, patients, and constituents. Our suite of workflow processing, customer experience and revenue cycle solutions enables our clients to focus on their missions, optimize their cash flow and deliver essential services.
Superior Operational Performance with a Strong Customer Service and Compliance Commitment
We help our customers — both individuals and institutions — navigate the path to financial success through proactive, simplified service and innovative solutions.
|
• |
Deliver superior performance . Whether supporting student loan borrowers in successfully managing their loans, designing and implementing omnichannel contact center solutions for public sector agencies, generating additional revenue for hospitals and medical systems, or helping a state manage communication backlogs or recover revenue that funds essential services, Navient delivers value for our clients and customers. |
We leverage our experience, data-driven insights, customer service skills, technology and scale to maximize value for our clients.
|
• |
Scalable, data-driven solutions . Annually, we support tens of millions of people in conducting hundreds of millions of transactions and interactions. Our systems are built for scale and rapid implementation. We harness the power of data to build tailored programs that optimize our clients’ results. |
We leverage our omnichannel communication platform, predictive analytics, and decades of insight to stay in touch with people and address challenges that may arise.
3
|
• |
Simplify complex processes . On our clients’ behalf, we help individuals successfully navigate a broad spectrum of complex transactions. Our people and platforms simplify complex programs – including education financing, healthcare, tax, and transportation programs – to help constituents understand and meet their obligations. |
|
• |
Improve customer experience and success . We continually make enhancements to improve the customer experience, drawing from a variety of inputs including customer surveys, research panels, analysis of customer inquiries and activities, complaint data, and regulator commentary. Across our businesses, our customer-facing representatives are trained to provide empathetic, accurate support. |
|
|
o |
Repayment plan education and outreach: We help student loan borrowers understand their repayment options so they can make informed choices that align with their financial circumstances and goals. |
|
|
o |
Office of the Customer Advocate: Our Office of the Customer Advocate, established in 1997, offers escalated assistance to customers. We are committed to working with customers and appreciate customer comments, which, combined with our own customer communication channels, help us improve the ways we assist our customers. |
|
|
o |
Private loan modification program: In 2009, we pioneered the creation of a loan modification program to help Private Education Loan borrowers needing additional assistance. As of September 30, 2022, approximately $900 million of our Private Education Loans were enrolled in this interest rate reduction program, helping customers through more affordable monthly payments while making progress in repaying their principal loan balance. |
|
|
o |
Serving military customers: Navient was the first student loan servicer to launch a dedicated military benefits customer service team, website (Navient.com/military) and toll-free number. Navient’s military benefits team supports service members and their families to access the benefits designed for them, including interest rate benefits, deferment and other options. |
|
|
o |
Financial literacy: We offer free resources, including videos, articles and online tools, to help customers and the general public build knowledge on personal finance topics. Our Going Merry platform enables students to match to and apply for scholarships, institutional aid and government grants. |
|
• |
Commitment to compliance . Our rigorous compliance posture ensures adherence with laws and regulations and helps protect our clients, customers, employees and shareholders. We use a “Three Lines of Defense” compliance framework, considered best practice by the U.S. Federal Financial Institutions Examination Council (FFIEC). This framework and other compliance protocols ensure we adhere to key industry laws and regulations including: Fair and Accurate Credit Transactions Act (FACTA); Fair Credit Reporting Act (FCRA); Fair Debt Collection Practices Act (FDCPA); Electronic Funds Transfer Act (EFTA); Equal Credit Opportunity Act (ECOA); Federal Information Security Management Act (FISMA); Gramm-Leach-Bliley Act (GLBA); Health Insurance Portability and Accountability Act (HIPAA); IRS Publication 1075; Servicemembers Civil Relief Act (SCRA); Military Lending Act (MLA); Telephone Consumer Protection Act (TCPA); Truth in Lending Act (TILA); Unfair, Deceptive, or Abusive Acts and Practices (UDAAP); state laws; and state and city licensing. |
|
• |
Corporate Social Responsibility . We are committed to contributing to the social and economic wellbeing of our local communities; fostering the success of our customers; supporting a culture of integrity, inclusion and equality in our workforce; and embracing sustainable business practices. Navient has earned recognition from several organizations for our continued commitment to fostering diversity. Our employees are active in our communities, through local and national organizations, including a significant national partnership with Boys & Girls Clubs of America. |
Navient is committed to a sustainable future. Our work is largely services based; as a result, our day-to-day operations require relatively small amounts of natural resource and energy inputs. We leverage technology that minimizes energy usage in our office buildings and promote widespread adoption of “paperless” digital customer communications. Navient prioritizes adding or updating insulation and other power-saving features to our buildings to further reduce energy usage. Energy efficiency and reducing CO2 and CO2 equivalents are among the many factors considered in our growth and real estate decisions.
4
Strong Financial Performance Resulting in a Strong Capital Return
Our third-quarter 2022 results continue to build upon our previous year’s results demonstrating the strength of our business model and our ability to deliver predictable and meaningful cash flow and earnings in all types of economic environments.
Our significant earnings generate significant capital which results in a strong capital return to our investors. Navient expects to continue to return excess capital to shareholders through dividends and share repurchases in accordance with our capital allocation policy.
By optimizing capital adequacy and allocating capital to highly accretive opportunities, including organic growth and acquisitions, we remain well positioned to pay dividends and repurchase stock, while maintaining appropriate leverage that supports our credit ratings and ensures ongoing access to capital markets.
In December 2021, our Board approved a share repurchase program authorizing the purchase of up to $1 billion of the Company’s outstanding common stock. At September 30, 2022, $685 million remained in share repurchase authorization.
To inform our capital allocation decisions, we use the Adjusted Tangible Equity Ratio (1) in addition to other metrics. Our Adjusted Tangible Equity Ratio (1) was 7.8% as of September 30, 2022.
|
(Dollars and shares in millions) |
|
Q3-22 |
|
|
Q3-21 |
|
||
|
Shares repurchased |
|
|
6.3 |
|
|
|
7.0 |
|
|
Reduction in shares outstanding |
|
|
4 |
% |
|
|
4 |
% |
|
Total repurchases in dollars |
|
$ |
95 |
|
|
$ |
150 |
|
|
Dividends paid |
|
$ |
22 |
|
|
$ |
26 |
|
|
Total Capital Returned (2) |
|
$ |
117 |
|
|
$ |
176 |
|
|
Adjusted Tangible Equity Ratio (1) |
|
|
7.8 |
% |
|
|
6.4 |
% |
|
(1) |
Item is a non-GAAP financial measure. For a description and reconciliation, see “Management’s Discussion and Analysis of Financial Condition and Results of Operations – Non-GAAP Financial Measures.” |
|
(2) |
Capital Returned is defined as share repurchases and dividends paid. |
5
How We Organize Our Business
We operate our business in three primary segments: Federal Education Loans, Consumer Lending and Business Processing.
Federal Education Loans Segment
Navient owns FFELP Loans and performs servicing and asset recovery services on this portfolio. We also service and perform asset recovery services on FFELP Loans owned by other institutions. Our servicing quality, data-driven strategies and omnichannel education about federal repayment options translate into positive results for the millions of borrowers we serve. We generate revenue primarily through net interest income on our FFELP Loans.
Consumer Lending Segment
Navient helps students and families through the paying-for-college journey. Our digital tools empower people to find grants and scholarships, compare financial aid offers and complete the FAFSA. Our Private Education Loans offer easy-to-understand payment options. After graduation, we offer student loan refinancing to help people simplify their repayment and earn a better rate. We believe our 50 years of experience, product design, digital marketing strategies, and origination and servicing platform provide a unique competitive advantage. We see meaningful growth opportunities in originating Private Education Loans to financially responsible consumers, generating attractive long-term, risk-adjusted returns. We generate revenue primarily through net interest income on our Private Education Loan portfolio.
Business Processing Segment
Navient provides business processing solutions such as omnichannel contact center services, workflow processing, and revenue cycle optimization. Our support enables our clients to better serve their constituents, meet rapidly changing needs, improve technology, reduce operating expenses, manage risk and optimize revenue opportunities. Our clients include:
|
|
• |
Government : We offer our solutions to federal agencies, state governments, tolling and parking authorities, and other public sector clients. |
|
|
• |
Healthcare : Our clients include hospitals, hospital systems, medical centers, large physician groups, other healthcare providers and public health departments. |
Other Segment
This segment consists of our corporate liquidity portfolio, gains and losses incurred on the repurchase of debt, unallocated expenses of shared services (which includes regulatory expenses) and restructuring/other reorganization expenses.
6
Management’s Discussion and Analysis of Financial Condition and Results of Operations
Selected Historical Financial Information and Ratios
|
|
|
Three Months Ended September 30, |
|
|
Nine Months Ended September 30, |
|
||||||||||
|
(In millions, except per share data) |
|
2022 |
|
|
2021 |
|
|
2022 |
|
|
2021 |
|
||||
|
GAAP Basis |
|
|
|
|
|
|
|
|
|
|
|
|
|
|
|
|
|
Net income |
|
$ |
105 |
|
|
$ |
173 |
|
|
$ |
540 |
|
|
$ |
728 |
|
|
Diluted earnings per common share |
|
$ |
.75 |
|
|
$ |
1.04 |
|
|
$ |
3.67 |
|
|
$ |
4.15 |
|
|
Weighted average shares used to compute diluted earnings per share |
|
$ |
141 |
|
|
|
167 |
|
|
|
147 |
|
|
|
176 |
|
|
Return on assets |
|
|
.57 |
% |
|
|
.86 |
% |
|
|
.96 |
% |
|
|
1.19 |
% |
|
|
|
|
|
|
|
|
|
|
|
|
|
|
|
|
|
|
|
Core Earnings Basis (1) |
|
|
|
|
|
|
|
|
|
|
|
|
|
|
|
|
|
Net income (1) |
|
$ |
87 |
|
|
$ |
149 |
|
|
$ |
356 |
|
|
$ |
618 |
|
|
Diluted earnings per common share (1) |
|
$ |
.62 |
|
|
$ |
.89 |
|
|
$ |
2.42 |
|
|
$ |
3.52 |
|
|
Adjusted diluted earnings per common share (1) |
|
$ |
.75 |
|
|
$ |
.92 |
|
|
$ |
2.58 |
|
|
$ |
3.65 |
|
|
Weighted average shares used to compute diluted earnings per share |
|
|
141 |
|
|
|
167 |
|
|
|
147 |
|
|
|
176 |
|
|
Net interest margin, Federal Education Loans segment |
|
|
.94 |
% |
|
|
1.04 |
% |
|
|
1.03 |
% |
|
|
.99 |
% |
|
Net interest margin, Consumer Lending segment |
|
|
2.90 |
% |
|
|
2.98 |
% |
|
|
2.78 |
% |
|
|
2.98 |
% |
|
Return on assets |
|
|
.47 |
% |
|
|
.73 |
% |
|
|
.63 |
% |
|
|
1.01 |
% |
|
|
|
|
|
|
|
|
|
|
|
|
|
|
|
|
|
|
|
Education Loan Portfolios |
|
|
|
|
|
|
|
|
|
|
|
|
|
|
|
|
|
Ending FFELP Loans, net |
|
$ |
46,891 |
|
|
$ |
54,350 |
|
|
$ |
46,891 |
|
|
$ |
54,350 |
|
|
Ending Private Education Loans, net |
|
|
19,151 |
|
|
|
20,018 |
|
|
|
19,151 |
|
|
|
20,018 |
|
|
Ending total education loans, net |
|
$ |
66,042 |
|
|
$ |
74,368 |
|
|
$ |
66,042 |
|
|
$ |
74,368 |
|
|
Average FFELP Loans |
|
$ |
48,443 |
|
|
$ |
55,435 |
|
|
$ |
50,398 |
|
|
$ |
56,711 |
|
|
Average Private Education Loans |
|
|
20,308 |
|
|
|
20,938 |
|
|
|
20,771 |
|
|
|
21,266 |
|
|
Average total education loans |
|
$ |
68,751 |
|
|
$ |
76,373 |
|
|
$ |
71,169 |
|
|
$ |
77,977 |
|
(1) Item is a non-GAAP financial measure. For a description and reconciliation, see “Non-GAAP Financial Measures – Core Earnings.”
7
T he Quarter i n Review
We prepare financial statements and present financial results in accordance with GAAP. However, we also evaluate our business segments and present financial results on a basis that differs from GAAP. We refer to this different basis of presentation as Core Earnings. We provide this Core Earnings basis of presentation on a consolidated basis and for each business segment because this is what we review internally when making management decisions regarding our performance and how we allocate resources. We also include this information in our presentations with credit rating agencies, lenders and investors. Because our Core Earnings basis of presentation corresponds to our segment financial presentations, we are required by GAAP to provide certain Core Earnings disclosures in the notes to our consolidated financial statements for our business segments. See “Non-GAAP Financial Measures — Core Earnings” for a further discussion and a complete reconciliation between GAAP net income and Core Earnings.
Third-quarter 2022 GAAP net income was $105 million ($0.75 diluted earnings per share), compared with $173 million ($1.04 diluted Core Earnings per share) for the year-ago quarter. See “Results of Operations – Comparison of Third-Quarter 2022 Results with Third-Quarter 2021” for a discussion of the primary contributors to the change in GAAP earnings between periods.
Third-quarter 2022 Core Earnings net income was $87 million ($0.62 diluted Core Earnings per share), compared with $149 million ($0.89 diluted Core Earnings per share) for the year-ago quarter. Third-quarter 2022 and 2021 adjusted diluted Core Earnings (1) per share were $0.75 and $0.92, respectively. See “Segment Results” for a discussion of the primary contributors to the change in Core Earnings between periods.
Financial highlights of third-quarter 2022 include:
Federal Education Loans segment:
|
|
• |
Net income of $94 million. |
|
|
• |
FFELP net interest margin of 0.94%. |
|
|
• |
Includes a net reduction to pre-tax income of $10 million related to incremental FFELP Loan consolidation activity in connection with recently announced loan forgiveness plans. |
|
|
• |
$13 million of the provision for loan losses in anticipation of a deteriorating economy. |
Consumer Lending segment:
|
|
• |
Net income of $65 million. |
|
|
• |
Originated $447 million of Private Education Loans. |
|
|
• |
Private Education Loan delinquency rate of 4.4% remains below pre-pandemic levels. |
|
|
• |
$15 million of the provision for loan losses in anticipation of a deteriorating economy. |
Business Processing segment:
|
|
• |
EBITDA ( 1 ) of $13 million. |
|
|
• |
Revenue of $79 million. |
Capital, funding and liquidity:
|
|
• |
A djusted tangible equity ratio ( 1 ) of 7.8%. |
|
|
• |
Repurchased $95 million of common shares; $685 million common share repurchase authority remains outstanding. |
|
|
• |
Paid $22 million in common stock dividends. |
Expenses:
|
|
• |
Adjusted Core Earnings expenses (1) of $191 million. |
|
(1) |
Item is a non-GAAP financial measure. For a description and reconciliation, see “Non-GAAP Financial Measures.” |
8
Navient’s Response to COVID-19
Since its emergence in early 2020, the impacts of COVID-19 have been dynamic and unpredictable. In response to COVID-19, we prioritized the safety of our employees and business partners, while continually striving to support the needs of our customers and communities. During 2021 and the first nine months of 2022, the COVID-19 pandemic and long-lasting changes it has produced have continued to affect our business operations. The future direct and indirect impact of the pandemic on our businesses, results of operations and financial condition remains uncertain. Should current economic conditions deteriorate or if public health worsened due to various factors, such conditions could have an adverse effect on our businesses and results of operations and could adversely affect our financial condition. For more information on the pandemic, see “Management’s Discussion and Analysis of Financial Condition and Results of Operations – Navient’s Response to COVID-19” in our 2021 Form 10-K.
Results of Operations
GAAP Income Statements (Unaudited)
|
|
|
Three Months Ended September 30, |
|
|
Increase (Decrease) |
|
|
Nine Months Ended September 30, |
|
|
Increase (Decrease) |
|
||||||||||||||||||||
|
(In millions, except per share data) |
|
2022 |
|
|
2021 |
|
|
$ |
|
|
% |
|
|
2022 |
|
|
2021 |
|
|
$ |
|
|
% |
|
||||||||
|
Interest income |
|
|
|
|
|
|
|
|
|
|
|
|
|
|
|
|
|
|
|
|
|
|
|
|
|
|
|
|
|
|
|
|
|
FFELP Loans |
|
$ |
553 |
|
|
$ |
368 |
|
|
$ |
185 |
|
|
|
50 |
% |
|
$ |
1,312 |
|
|
$ |
1,106 |
|
|
$ |
206 |
|
|
|
19 |
% |
|
Private Education Loans |
|
|
309 |
|
|
|
291 |
|
|
|
18 |
|
|
|
6 |
|
|
|
862 |
|
|
|
905 |
|
|
|
(43 |
) |
|
|
(5 |
) |
|
Cash and investments |
|
|
19 |
|
|
|
1 |
|
|
|
18 |
|
|
|
1,800 |
|
|
|
25 |
|
|
|
2 |
|
|
|
23 |
|
|
|
1,150 |
|
|
Total interest income |
|
|
881 |
|
|
|
660 |
|
|
|
221 |
|
|
|
33 |
|
|
|
2,199 |
|
|
|
2,013 |
|
|
|
186 |
|
|
|
9 |
|
|
Total interest expense |
|
|
641 |
|
|
|
326 |
|
|
|
315 |
|
|
|
97 |
|
|
|
1,301 |
|
|
|
995 |
|
|
|
306 |
|
|
|
31 |
|
|
Net interest income |
|
|
240 |
|
|
|
334 |
|
|
|
(94 |
) |
|
|
(28 |
) |
|
|
898 |
|
|
|
1,018 |
|
|
|
(120 |
) |
|
|
(12 |
) |
|
Less: provisions for loan losses |
|
|
28 |
|
|
|
22 |
|
|
|
6 |
|
|
|
27 |
|
|
|
62 |
|
|
|
(66 |
) |
|
|
128 |
|
|
|
194 |
|
|
Net interest income after provisions for loan losses |
|
|
212 |
|
|
|
312 |
|
|
|
(100 |
) |
|
|
(32 |
) |
|
|
836 |
|
|
|
1,084 |
|
|
|
(248 |
) |
|
|
(23 |
) |
|
Other income (loss): |
|
|
|
|
|
|
|
|
|
|
|
|
|
|
|
|
|
|
|
|
|
|
|
|
|
|
|
|
|
|
|
|
|
Servicing revenue |
|
|
24 |
|
|
|
47 |
|
|
|
(23 |
) |
|
|
(49 |
) |
|
|
60 |
|
|
|
149 |
|
|
|
(89 |
) |
|
|
(60 |
) |
|
Asset recovery and business processing revenue |
|
|
80 |
|
|
|
135 |
|
|
|
(55 |
) |
|
|
(41 |
) |
|
|
264 |
|
|
|
416 |
|
|
|
(152 |
) |
|
|
(37 |
) |
|
Other income |
|
|
6 |
|
|
|
3 |
|
|
|
3 |
|
|
|
100 |
|
|
|
22 |
|
|
|
9 |
|
|
|
13 |
|
|
|
144 |
|
|
Gains on sales of loans |
|
|
— |
|
|
|
— |
|
|
|
— |
|
|
|
— |
|
|
|
— |
|
|
|
78 |
|
|
|
(78 |
) |
|
|
(100 |
) |
|
Losses on debt repurchases |
|
|
— |
|
|
|
(20 |
) |
|
|
20 |
|
|
|
(100 |
) |
|
|
— |
|
|
|
(32 |
) |
|
|
32 |
|
|
|
(100 |
) |
|
Gains (losses) on derivative and hedging activities, net |
|
|
40 |
|
|
|
(5 |
) |
|
|
45 |
|
|
|
900 |
|
|
|
161 |
|
|
|
21 |
|
|
|
140 |
|
|
|
667 |
|
|
Total other income |
|
|
150 |
|
|
|
160 |
|
|
|
(10 |
) |
|
|
(6 |
) |
|
|
507 |
|
|
|
641 |
|
|
|
(134 |
) |
|
|
(21 |
) |
|
Expenses: |
|
|
|
|
|
|
|
|
|
|
|
|
|
|
|
|
|
|
|
|
|
|
|
|
|
|
|
|
|
|
|
|
|
Operating expenses |
|
|
194 |
|
|
|
248 |
|
|
|
(54 |
) |
|
|
(22 |
) |
|
|
588 |
|
|
|
758 |
|
|
|
(170 |
) |
|
|
(22 |
) |
|
Goodwill and acquired intangible assets impairment and amortization expense |
|
|
10 |
|
|
|
4 |
|
|
|
6 |
|
|
|
150 |
|
|
|
17 |
|
|
|
14 |
|
|
|
3 |
|
|
|
21 |
|
|
Restructuring/other reorganization expenses |
|
|
21 |
|
|
|
— |
|
|
|
21 |
|
|
|
100 |
|
|
|
25 |
|
|
|
8 |
|
|
|
17 |
|
|
|
213 |
|
|
Total expenses |
|
|
225 |
|
|
|
252 |
|
|
|
(27 |
) |
|
|
(11 |
) |
|
|
630 |
|
|
|
780 |
|
|
|
(150 |
) |
|
|
(19 |
) |
|
Income before income tax expense |
|
|
137 |
|
|
|
220 |
|
|
|
(83 |
) |
|
|
(38 |
) |
|
|
713 |
|
|
|
945 |
|
|
|
(232 |
) |
|
|
(25 |
) |
|
Income tax expense |
|
|
32 |
|
|
|
47 |
|
|
|
(15 |
) |
|
|
(32 |
) |
|
|
173 |
|
|
|
217 |
|
|
|
(44 |
) |
|
|
(20 |
) |
|
Net income |
|
$ |
105 |
|
|
$ |
173 |
|
|
$ |
(68 |
) |
|
|
(39 |
)% |
|
$ |
540 |
|
|
$ |
728 |
|
|
$ |
(188 |
) |
|
|
(26 |
)% |
|
Basic earnings per common share |
|
$ |
.75 |
|
|
$ |
1.05 |
|
|
$ |
(.30 |
) |
|
|
(29 |
)% |
|
$ |
3.71 |
|
|
$ |
4.20 |
|
|
$ |
(.49 |
) |
|
|
(12 |
)% |
|
Diluted earnings per common share |
|
$ |
.75 |
|
|
$ |
1.04 |
|
|
$ |
(.29 |
) |
|
|
(28 |
)% |
|
$ |
3.67 |
|
|
$ |
4.15 |
|
|
$ |
(.48 |
) |
|
|
(12 |
)% |
|
Dividends per common share |
|
$ |
.16 |
|
|
$ |
.16 |
|
|
$ |
— |
|
|
|
— |
|
|
$ |
.48 |
|
|
$ |
.48 |
|
|
$ |
— |
|
|
|
— |
|
9
GAAP Comparison of Third-Quarter 2022 Results with Third-Quarter 2021
For the three months ended September 30, 2022, net income was $105 million, or $0.75 diluted earnings per common share, compared with net income of $173 million, or $1.04 diluted earnings per common share, for the year-ago period.
The primary contributors to the change in net income are as follows:
|
|
• |
Third-quarter 2022 results included a net reduction to pre-tax income of $10 million related to incremental FFELP Loan consolidation activity in connection with the recently announced loan forgiveness plans (i.e., Public Service Loan Forgiveness and the Student Debt Relief Plans or the “Loan Forgiveness Plans”). |
|
|
• |
Net interest income decreased by $94 million as a result of a decline in Floor Income on the FFELP portfolio due to the increase in interest rates, the continued paydown of the FFELP and non-refinance Private Education Loan portfolios, and $27 million of additional loan premium and deferred financing fee amortization as a result of the Loan Forgiveness Plans discussed above. Partially offsetting this decrease was the growth in the Private Education Refinance Loan portfolio as a result of both an increase in the portfolio size as well as an increase in the net interest margin. |
|
|
• |
Provisions for loan losses increased $6 million from $22 million to $28 million: |
|
|
○ |
The provision for FFELP Loan losses remained unchanged at $0. |
|
|
○ |
The provision for Private Education Loan losses increased $6 million from $22 million to $28 million. |
The FFELP Loan provision for loan losses was unchanged at $0, but the current period provision includes a $13 million increase related to an increase in expected losses in anticipation of a deteriorating economy, and a $13 million decrease as a result of the Loan Forgiveness Plans discussed above.
The Private Education Loan provision for loan losses of $28 million in the current period included $13 million of provision in connection with loan originations and $15 million related to an increase in expected losses in anticipation of a deteriorating economy. The provision in the year-ago quarter primarily related to loan originations.
|
|
• |
Servicing revenue decreased $23 million primarily related to the transfer of the Department of Education (ED) servicing contract to a third party in October 2021. To aid in the transition, Navient is providing limited services in 2022 to the third party through a transition services agreement. |
|
|
• |
Asset recovery and business processing revenue decreased $55 million primarily as a result of a $43 million decrease in revenue earned in our Business Processing segment, due to the expected $51 million reduction in revenue from the wind-down of pandemic-related contracts, which was partially offset by an $8 million increase in revenue from services for our traditional government and healthcare services clients. |
|
|
• |
Other income in the current period had $4 million of fee revenue as a result of the Loan Forgiveness Plans discussed above. |
|
|
• |
Losses on debt repurchases decreased $20 million. We repurchased $757 million of debt at a $20 million loss in the year-ago quarter. There were no debt repurchases in the current period. |
|
|
• |
Net gains on derivative and hedging activities increased $45 million. The primary factors affecting the change were interest rate and foreign currency fluctuations, which impact the valuations of derivative instruments including Floor Income Contracts, standard swaps (variable to fixed or fixed to variable), basis swaps and foreign currency hedges during each period. Valuations of derivative instruments fluctuate based upon many factors including changes in interest rates, credit risk, foreign currency fluctuations and other market factors. As a result, net gains and losses on derivative and hedging activities may vary significantly in future periods. |
|
|
• |
Excluding net regulatory-related expenses of $3 million and $6 million in the third quarters of 2022 and 2021, respectively, operating expenses were $191 million and $242 million in the third quarters of 2022 and 2021, respectively. This $51 million decrease was primarily related to the transfer of the ED servicing contract as well as the decline in Business Processing segment revenue. |
|
|
• |
During the three months ended September 30, 2022 and 2021, the Company incurred $21 million and $0, respectively, of restructuring/other reorganization expenses, primarily severance-related costs and facility lease terminations. |
We repurchased 6.3 million and 7.0 million shares of our common stock during the third quarters of 2022 and 2021, respectively. As a result of repurchases, our average outstanding diluted shares decreased by 26 million common shares (or 16%) from the year-ago period.
10
Comparison of Nine Months Ended September 30, 2022 Results with Nine Months Ended September 30, 2021
For the nine months ended September 30, 2022, net income was $540 million, or $3.67 diluted earnings per common share, compared with net income of $728 million, or $4.15 diluted earnings per common share, for the year-ago period.
The primary contributors to the change in net income are as follows:
|
|
• |
Net interest income decreased by $120 million as a result of the continued paydown of the FFELP and non-refinance Private Education Loan portfolios, a decline in Floor Income on the FFELP portfolio due to the increase in interest rates, and $27 million of additional loan premium and deferred financing fee amortization as a result of the Loan Forgiveness Plans previously discussed. Partially offsetting this decrease was the growth in the Private Education Refinance Loan portfolio as a result of both an increase in the portfolio size as well as an increase in the net interest margin. |
|
|
• |
Provisions for loan losses increased $128 million from $(66) million to $62 million: |
|
|
○ |
The provision for FFELP Loan losses remained unchanged at $0. |
|
|
○ |
The provision for Private Education Loan losses increased $128 million from $(66) million to $62 million. |
The FFELP Loan provision for loan losses was unchanged at $0, but the current period provision includes a $13 million increase related to an increase in expected losses in anticipation of a deteriorating economy, and a $13 million decrease as a result of the Loan Forgiveness Plans discussed above.
The Private Education Loan provision for loan losses of $62 million in the current period included $31 million of provision in connection with loan originations and $31 million related to an increase in expected losses in anticipation of a deteriorating economy. The negative provision of $(66) million in the year-ago period was primarily related to the reversal of both $107 million of allowance for loan losses in connection with the sale of approximately $1.6 billion of Private Education Loans discussed below and $8 million related to a decrease in expected losses for the overall portfolio, partially offset by $49 million of provision primarily related to loan originations.
|
|
• |
Servicing revenue decreased $89 million primarily related to the transfer of the ED servicing contract to a third party in October 2021. To aid in the transition, Navient is providing limited services in 2022 to the third party through a transition services agreement (see discussion below related to “Other income”). |
|
|
• |
Asset recovery and business processing revenue decreased $152 million primarily as a result of a $117 million decrease in revenue earned in our Business Processing segment, due to the expected $127 million reduction in revenue from the wind-down of pandemic-related contracts, which was partially offset by an $10 million increase in revenue from services for our traditional government and healthcare services clients. |
|
|
• |
Other income increased $13 million primarily related to the transition services being performed in connection with the transfer of the ED servicing contract to a third party, as discussed above. |
|
|
• |
Gains on sales of loans decreased $78 million in connection with the sale of approximately $1.6 billion of Private Education Loans in first-quarter 2021. There was a $13 million gain related to derivatives that were used to hedge this transaction that did not qualify for hedge accounting. As a result, this gain related to the derivatives was included as a part of “gains (losses) on derivative and hedging activities, net” on the income statement. There were no such sales in the current period. |
|
|
• |
Losses on debt repurchases decreased $32 million. We repurchased $1.5 billion of debt at a $32 million loss in the year-ago period. There were no debt repurchases in the current period. |
|
|
• |
Net gains on derivative and hedging activities increased $140 million. The primary factors affecting the change were interest rate and foreign currency fluctuations, which impact the valuations of derivative instruments including Floor Income Contracts, standard swaps (variable to fixed or fixed to variable), basis swaps and foreign currency hedges during each period. Valuations of derivative instruments fluctuate based upon many factors including changes in interest rates, credit risk, foreign currency fluctuations and other market factors. As a result, net gains and losses on derivative and hedging activities may vary significantly in future periods. |
|
|
• |
Excluding net regulatory-related expenses of $5 million and $22 million in the nine months ended September 30, 2022 and 2021, respectively, operating expenses were $583 million and $736 million in the nine months ended September 30, 2022 and 2021, respectively. This $153 million decrease was primarily related to the transfer of the ED servicing contract as well as the decline in Business Processing segment revenue. |
|
|
• |
During the nine months ended September 30, 2022 and 2021, the Company incurred $25 million and $8 million, respectively, of restructuring/other reorganization expenses, primarily severance-related costs and facility lease terminations. |
We repurchased 19.4 million and 26.9 million shares of our common stock during the nine months ended September 30, 2022 and 2021, respectively. As a result of repurchases, our average outstanding diluted shares decreased by 29 million common shares (or 16%) from the year-ago period.
11
Segment Results
Federal Education Loans Segment
The following table presents Core Earnings results for our Federal Education Loans segment.
|
|
|
Three Months Ended September 30, |
|
|
% Increase (Decrease) |
|
|
Nine Months Ended September 30, |
|
|
% Increase (Decrease) |
|
||||||||||||
|
(Dollars in millions) |
|
2022 |
|
|
2021 |
|
|
2022 vs. 2021 |
|
|
2022 |
|
|
2021 |
|
|
2021 vs. 2021 |
|
||||||
|
Interest income: |
|
|
|
|
|
|
|
|
|
|
|
|
|
|
|
|
|
|
|
|
|
|
|
|
|
FFELP Loans |
|
$ |
555 |
|
|
$ |
353 |
|
|
|
57 |
% |
|
$ |
1,298 |
|
|
$ |
1,062 |
|
|
|
22 |
% |
|
Cash and investments |
|
|
9 |
|
|
|
— |
|
|
|
100 |
|
|
|
12 |
|
|
|
— |
|
|
|
100 |
|
|
Total interest income |
|
|
564 |
|
|
|
353 |
|
|
|
60 |
|
|
|
1,310 |
|
|
|
1,062 |
|
|
|
23 |
|
|
Total interest expense |
|
|
444 |
|
|
|
202 |
|
|
|
120 |
|
|
|
905 |
|
|
|
627 |
|
|
|
44 |
|
|
Net interest income |
|
|
120 |
|
|
|
151 |
|
|
|
(21 |
) |
|
|
405 |
|
|
|
435 |
|
|
|
(7 |
) |
|
Less: provision for loan losses |
|
|
— |
|
|
|
— |
|
|
|
— |
|
|
|
— |
|
|
|
— |
|
|
|
— |
|
|
Net interest income after provision for loan losses |
|
|
120 |
|
|
|
151 |
|
|
|
(21 |
) |
|
|
405 |
|
|
|
435 |
|
|
|
(7 |
) |
|
Other income (loss): |
|
|
|
|
|
|
|
|
|
|
|
|
|
|
|
|
|
|
|
|
|
|
|
|
|
Servicing revenue |
|
|
21 |
|
|
|
47 |
|
|
|
(55 |
) |
|
|
51 |
|
|
|
146 |
|
|
|
(65 |
) |
|
Asset recovery and business processing revenue |
|
|
1 |
|
|
|
13 |
|
|
|
(92 |
) |
|
|
4 |
|
|
|
39 |
|
|
|
(90 |
) |
|
Other income |
|
|
6 |
|
|
|
1 |
|
|
|
500 |
|
|
|
24 |
|
|
|
3 |
|
|
|
700 |
|
|
Total other income |
|
|
28 |
|
|
|
61 |
|
|
|
(54 |
) |
|
|
79 |
|
|
|
188 |
|
|
|
(58 |
) |
|
Direct operating expenses |
|
|
25 |
|
|
|
53 |
|
|
|
(53 |
) |
|
|
79 |
|
|
|
170 |
|
|
|
(54 |
) |
|
Income before income tax expense |
|
|
123 |
|
|
|
159 |
|
|
|
(23 |
) |
|
|
405 |
|
|
|
453 |
|
|
|
(11 |
) |
|
Income tax expense |
|
|
29 |
|
|
|
37 |
|
|
|
(22 |
) |
|
|
95 |
|
|
|
107 |
|
|
|
(11 |
) |
|
Net income |
|
$ |
94 |
|
|
$ |
122 |
|
|
|
(23 |
)% |
|
$ |
310 |
|
|
$ |
346 |
|
|
|
(10 |
)% |
Comparison of Third-Quarter 2022 Results with Third-Quarter 2021
|
• |
Third-quarter 2022 results included a net reduction to pre-tax income of $10 million related to incremental FFELP Loan consolidation activity in connection with the recently announced loan forgiveness plans (i.e., Public Service Loan Forgiveness and the Student Debt Relief Plans or the “Loan Forgiveness Plans”). |
|
|
• |
Net income was $94 million compared to $122 million. |
|
• |
Net interest income decreased $31 million, primarily due to $27 million of additional loan premium and deferred financing fee amortization as a result of the Loan Forgiveness Plans discussed above, as well as the paydown of the portfolio. |
|
• |
Provision for loan losses was unchanged at $0, but the current period provision includes a $13 million increase related to an increase in expected losses in anticipation of a deteriorating economy, and a $13 million decrease as a result of the Loan Forgiveness Plans discussed above. The increases in charge-offs and delinquencies detailed below are primarily the result of loans that were experiencing repayment difficulties pre-COVID returning to repayment after pandemic relief. |
|
|
○ |
Net charge-offs were $12 million compared to $8 million. |
|
|
○ |
Delinquencies greater than 90 days were $3.8 billion compared to $1.9 billion. |
|
|
○ |
Forbearances were $7.4 billion compared to $8.0 billion. |
|
• |
Other revenue decreased $33 million which was primarily a result of the transfer of the ED servicing contract to a third party in October 2021. In the current period, there was $4 million of fee revenue as a result of the Loan Forgiveness Plans discussed above. |
• Expenses were $28 million lower primarily as a result of the decrease in other revenue discussed above.
12
Key performance metrics are as follows:
|
|
|
Three Months Ended September 30, |
|
|
Nine Months Ended September 30, |
|
||||||||||
|
(Dollars in millions) |
|
2022 |
|
|
2021 |
|
|
2022 |
|
|
2021 |
|
||||
|
Segment net interest margin |
|
|
.94 |
% |
|
|
1.04 |
% |
|
|
1.03 |
% |
|
|
.99 |
% |
|
FFELP Loans: |
|
|
|
|
|
|
|
|
|
|
|
|
|
|
|
|
|
FFELP Loan spread |
|
|
1.05 |
% |
|
|
1.10 |
% |
|
|
1.12 |
% |
|
|
1.05 |
% |
|
Provision for loan losses |
|
$ |
— |
|
|
$ |
— |
|
|
$ |
— |
|
|
$ |
— |
|
|
Net charge-offs |
|
$ |
12 |
|
|
$ |
8 |
|
|
$ |
29 |
|
|
$ |
19 |
|
|
Net charge-off rate |
|
|
.12 |
% |
|
|
.07 |
% |
|
|
.09 |
% |
|
|
.06 |
% |
|
Greater than 30-days delinquency rate |
|
|
18.6 |
% |
|
|
8.5 |
% |
|
|
18.6 |
% |
|
|
8.5 |
% |
|
Greater than 90-days delinquency rate |
|
|
10.1 |
% |
|
|
4.3 |
% |
|
|
10.1 |
% |
|
|
4.3 |
% |
|
Forbearance rate |
|
|
16.4 |
% |
|
|
15.4 |
% |
|
|
16.4 |
% |
|
|
15.4 |
% |
|
Average FFELP Loans |
|
$ |
48,443 |
|
|
$ |
55,435 |
|
|
$ |
50,398 |
|
|
$ |
56,711 |
|
|
Ending FFELP Loans, net |
|
$ |
46,891 |
|
|
$ |
54,350 |
|
|
$ |
46,891 |
|
|
$ |
54,350 |
|
|
|
|
|
|
|
|
|
|
|
|
|
|
|
|
|
|
|
|
(Dollars in billions) |
|
|
|
|
|
|
|
|
|
|
|
|
|
|
|
|
|
Total federal loans serviced (1) |
|
$ |
54 |
|
|
$ |
284 |
|
|
$ |
54 |
|
|
$ |
284 |
|
|
(1) |
Closed on the novation and transfer of our ED servicing contract to a third party in October 2021. As of September 30, 2022, we serviced $54 billion in FFELP (federally guaranteed) loans. |
Net Interest Margin
The following table details the net interest margin.
|
|
|
Three Months Ended September 30, |
|
|
Nine Months Ended September 30, |
|
||||||||||
|
|
|
2022 |
|
|
2021 |
|
|
2022 |
|
|
2021 |
|
||||
|
FFELP Loan yield |
|
|
4.16 |
% |
|
|
1.90 |
% |
|
|
3.00 |
% |
|
|
1.90 |
% |
|
Hedged Floor Income |
|
|
.34 |
|
|
|
.42 |
|
|
|
.34 |
|
|
|
.41 |
|
|
Unhedged Floor Income |
|
|
.05 |
|
|
|
.20 |
|
|
|
.10 |
|
|
|
.19 |
|
|
FFELP Loan net yield |
|
|
4.55 |
|
|
|
2.52 |
|
|
|
3.44 |
|
|
|
2.50 |
|
|
FFELP Loan cost of funds |
|
|
(3.50 |
) |
|
|
(1.42 |
) |
|
|
(2.32 |
) |
|
|
(1.45 |
) |
|
FFELP Loan spread |
|
|
1.05 |
|
|
|
1.10 |
|
|
|
1.12 |
|
|
|
1.05 |
|
|
Other interest-earning asset spread impact |
|
|
(.11 |
) |
|
|
(.06 |
) |
|
|
(.09 |
) |
|
|
(.06 |
) |
|
Net interest margin (1) |
|
|
.94 |
% |
|
|
1.04 |
% |
|
|
1.03 |
% |
|
|
.99 |
% |
|
(1) |
The average balances of the interest-earning assets for the respective periods are: |
|
|
|
Three Months Ended September 30, |
|
|
Nine Months Ended September 30, |
|
||||||||||
|
(Dollars in millions) |
|
2022 |
|
|
2021 |
|
|
2022 |
|
|
2021 |
|
||||
|
FFELP Loans |
|
$ |
48,443 |
|
|
$ |
55,435 |
|
|
$ |
50,398 |
|
|
$ |
56,711 |
|
|
Other interest-earning assets |
|
|
2,124 |
|
|
|
1,801 |
|
|
|
1,991 |
|
|
|
1,809 |
|
|
Total FFELP Loan interest-earning assets |
|
$ |
50,567 |
|
|
$ |
57,236 |
|
|
$ |
52,389 |
|
|
$ |
58,520 |
|
As of September 30, 2022, our FFELP Loan portfolio totaled $46.9 billion, comprised of $16.7 billion of FFELP Stafford Loans and $30.2 billion of FFELP Consolidation Loans. The weighted-average life of these portfolios as of September 30, 2022 was 6 years and 7 years, respectively, assuming a Constant Prepayment Rate (CPR) of 8% and 5%, respectively.
13
Floor Income
The following table analyzes on a Core Earnings basis the ability of the FFELP Loans in our portfolio to earn Floor Income after September 30, 2022 and 2021, based on interest rates as of those dates.
|
|
|
|
|
|
|
|
|
|
|
(Dollars in billions) |
|
September 30, 2022 |
|
|
September 30, 2021 |
|
||
|
Education loans eligible to earn Floor Income |
|
$ |
46.5 |
|
|
$ |
54.1 |
|
|
Less: post-March 31, 2006 disbursed loans required to rebate Floor Income |
|
|
(21.9 |
) |
|
|
(24.9 |
) |
|
Less: economically hedged Floor Income |
|
|
(12.5 |
) |
|
|
(13.3 |
) |
|
Education loans eligible to earn Floor Income after rebates and economically hedged |
|
$ |
12.1 |
|
|
$ |
15.9 |
|
|
Education loans earning Floor Income |
|
$ |
.1 |
|
|
$ |
10.6 |
|
The following table presents a projection of the average balance of FFELP Consolidation Loans for which Fixed Rate Floor Income has been economically hedged with derivatives for the period October 1, 2022 to December 31, 2026.
|
(Dollars in billions) |
|
October 1, 2022 to December 31, 2022 |
|
|
2023 |
|
|
2024 |
|
|
2025 |
|
|
2026 |
|
|||||
|
Average balance of FFELP Consolidation Loans whose Floor Income is economically hedged |
|
$ |
12.4 |
|
|
$ |
7.8 |
|
|
$ |
2.0 |
|
|
$ |
1.0 |
|
|
$ |
1.0 |
|
|
|
|
|
|
|
|
|
|
|
|
|
|
|
|
|
|
|
|
|
|
|
Servicing Revenue
Servicing revenue decreased $26 million primarily related to the transfer of the ED servicing contract to a third party in October 2021. To aid in the transition, Navient is providing limited services in 2022 to the third party through a transition services agreement (see discussion below related to “Other income”). As part of the transaction, approximately 700 Navient employees were transferred to the third party. This transaction provided a seamless transition for millions of borrowers ensuring the ongoing servicing capacity for the Department of ED through the knowledge transfer and ongoing employment of 700 employees. Additional benefits to Navient of this transaction are the simplification of our business, reducing our overall risk profile and avoiding significant severance expense.
Third-party loan servicing fees in the three months ended September 30, 2022 and 2021 included $0 and $34 million, respectively, of servicing revenue related to the ED servicing contract.
Asset Recovery and Business Processing Revenue
Asset recovery and business processing revenue decreased $12 million primarily as a result of the impact of COVID-19 on certain collection and processing activities (temporary stoppage or other restrictions on certain activities).
Other Income
Other income increased $5 million primarily related to the transition services being performed in connection with the transfer of the ED Servicing contract to a third party as discussed above.
Operating Expenses
Operating expenses for the Federal Education Loans segment primarily include costs incurred to perform servicing and asset recovery activities on our FFELP Loan portfolio and federal education loans held by other institutions. Expenses were $28 million lower primarily as a result of the decrease in servicing and asset recovery revenue discussed above.
14
Federal Loan Forgiveness
On August 24, 2022, the Biden-Harris Administration announced its Student Debt Relief (SDR) Plan that extends the repayment pause on ED held student loans through December 31, 2022 and provides up to $20,000 in one-time debt relief to income-qualified recipients with ED held student loans.
Following the initial announcement of the SDR Plan, ED provided more specific guidance on debt relief through its studentaid.gov website on September 29, 2022, which guidance was subsequently revised and published in the Federal Register on October 12, 2022. The studentaid.gov website currently provides the following guidance:
|
|
• |
All loans eligible for the student loan payment pause are also eligible for debt relief, including loans held by ED and guaranty agencies. |
|
|
• |
As of September 29, 2022, borrowers with federal student loans not held by ED cannot obtain one-time debt relief by consolidating those loans into Direct Loans. |
|
|
• |
Borrowers with FFEL Loans not held by ED who have applied to consolidate into the Direct Loan program prior to September 29, 2022, are eligible, subject to meeting the other terms and conditions. |
|
|
• |
ED is assessing whether there are alternative pathways to provide relief to borrowers with federal student loans not held by ED, including FFEL Program Loans and Perkins Loans. |
Based on this recent announcement, we estimate that borrowers holding approximately $600 million of the total $47 billion of FFELP Loans on our balance sheet as of September 30, 2022 have applied to have their loans consolidated with ED prior to the deadline established by the SDR Plan.
At this time, there is not a material impact on the Company’s accounting and related third-quarter results related to the SDR Plan as:
|
|
1. |
Privately held FFELP Loans do not qualify for debt forgiveness, and |
|
|
2. |
FFELP borrowers had to apply to consolidate their loans into the Direct Loan program prior to September 29, 2022, to qualify for their loans to be forgiven. |
As a result, we do not expect there to be incremental consolidation activity in the future related to potential loan forgiveness under the SDR Plan. The Company’s current accounting policies and related estimates appropriately consider the impact of FFELP borrowers who applied to consolidate loans into the Direct Loan program in the third quarter, but the funding of such consolidations will not occur until after September 30, 2022.
15
Consumer Lending Segment
The following table presents Core Earnings results for our Consumer Lending segment.
|
|
|
Three Months Ended September 30, |
|
|
% Increase (Decrease) |
|
|
Nine Months Ended September 30, |
|
|
% Increase (Decrease) |
|
||||||||||||
|
(Dollars in millions) |
|
2022 |
|
|
2021 |
|
|
2022 vs. 2021 |
|
|
2022 |
|
|
2021 |
|
|
2022 vs. 2021 |
|
||||||
|
Interest income: |
|
|
|
|
|
|
|
|
|
|
|
|
|
|
|
|
|
|
|
|
|
|
|
|
|
Private Education Loans |
|
$ |
309 |
|
|
$ |
291 |
|
|
|
6 |
% |
|
$ |
862 |
|
|
$ |
905 |
|
|
|
(5 |
)% |
|
Cash and investments |
|
|
3 |
|
|
|
1 |
|
|
|
200 |
|
|
|
5 |
|
|
|
1 |
|
|
|
400 |
|
|
Interest income |
|
|
312 |
|
|
|
292 |
|
|
|
7 |
|
|
|
867 |
|
|
|
906 |
|
|
|
(4 |
) |
|
Interest expense |
|
|
159 |
|
|
|
129 |
|
|
|
23 |
|
|
|
421 |
|
|
|
416 |
|
|
|
1 |
|
|
Net interest income |
|
|
153 |
|
|
|
163 |
|
|
|
(6 |
) |
|
|
446 |
|
|
|
490 |
|
|
|
(9 |
) |
|
Less: provision for loan losses |
|
|
28 |
|
|
|
22 |
|
|
|
27 |
|
|
|
62 |
|
|
|
(66 |
) |
|
|
194 |
|
|
Net interest income after provision for loan losses |
|
|
125 |
|
|
|
141 |
|
|
|
(11 |
) |
|
|
384 |
|
|
|
556 |
|
|
|
(31 |
) |
|
Other income (loss): |
|
|
|
|
|
|
|
|
|
|
|
|
|
|
|
|
|
|
|
|
|
|
|
|
|
Servicing revenue |
|
|
3 |
|
|
|
— |
|
|
|
100 |
|
|
|
9 |
|
|
|
3 |
|
|
|
200 |
|
|
Other income |
|
|
— |
|
|
|
— |
|
|
|
— |
|
|
|
1 |
|
|
|
1 |
|
|
|
— |
|
|
Gains on sales of loans |
|
|
— |
|
|
|
— |
|
|
|
— |
|
|
|
— |
|
|
|
91 |
|
|
|
(100 |
) |
|
Total other income |
|
|
3 |
|
|
|
— |
|
|
|
100 |
|
|
|
10 |
|
|
|
95 |
|
|
|
(89 |
) |
|
Direct operating expenses |
|
|
43 |
|
|
|
45 |
|
|
|
(4 |
) |
|
|
113 |
|
|
|
124 |
|
|
|
(9 |
) |
|
Income before income tax expense |
|
|
85 |
|
|
|
96 |
|
|
|
(11 |
) |
|
|
281 |
|
|
|
527 |
|
|
|
(47 |
) |
|
Income tax expense |
|
|
20 |
|
|
|
23 |
|
|
|
(13 |
) |
|
|
66 |
|
|
|
123 |
|
|
|
(46 |
) |
|
Net income |
|
$ |
65 |
|
|
$ |
73 |
|
|
|
(11 |
)% |
|
$ |
215 |
|
|
$ |
404 |
|
|
|
(47 |
)% |
Comparison of Third-Quarter 2022 Results with Third-Quarter 2021
|
• |
Originated $447 million of Private Education Loans compared to $1.6 billion. |
|
|
○ |
Refinance Loan originations were $231 million compared to $1.5 billion. |
|
|
○ |
In-school loan originations increased 41% to $216 million compared to $153 million. |
|
• |
Net income was $65 million compared to $73 million. |
|
• |
Net interest income decreased $10 million primarily due to the increase in the relative proportion of the higher quality, lower yielding Private Education Refinance Loan portfolio compared to the non-refinance loan portfolio. |
|
• |
Provision for loan losses increased $6 million. The provision for loan losses of $28 million in the current period included $13 million of provision in connection with loan originations and $15 million related to an increase in expected losses in anticipation of a deteriorating economy. The provision in the year-ago quarter primarily related to loan originations. The increases in charge-offs and delinquencies detailed below are primarily the result of loans that were experiencing repayment difficulties pre-COVID returning to repayment after pandemic relief. |
|
|
○ |
Excluding the $30 million and $16 million, respectively, related to the change in the net charge-off rate on defaulted loans, net charge-offs were $99 million compared with $39 million. |
|
|
○ |
Private Education Loan delinquencies greater than 90 days: $394 million, up $178 million from $216 million. |
|
|
○ |
Private Education Loan forbearances: $371 million, down $443 million from $814 million. |
|
• |
Expenses decreased $2 million primarily due to lower refinance loan originations as a result of the higher interest rate environment and the potential for loan forgiveness. |
16
Key performance metrics are as follows:
|
|
|
Three Months Ended September 30, |
|
|
Nine Months Ended September 30, |
|
||||||||||
|
(Dollars in millions) |
|
2022 |
|
|
2021 |
|
|
2022 |
|
|
2021 |
|
||||
|
Segment net interest margin |
|
|
2.90 |
% |
|
|
2.98 |
% |
|
|
2.78 |
% |
|
|
2.98 |
% |
|
Private Education Loans (including Refinance Loans): |
|
|
|
|
|
|
|
|
|
|
|
|
|
|
|
|
|
Private Education Loan spread |
|
|
3.03 |
% |
|
|
3.17 |
% |
|
|
2.93 |
% |
|
|
3.19 |
% |
|
Provision for loan losses |
|
$ |
28 |
|
|
$ |
22 |
|
|
$ |
62 |
|
|
$ |
(66 |
) |
|
Net charge-offs (1) |
|
$ |
99 |
|
|
$ |
39 |
|
|
$ |
238 |
|
|
$ |
109 |
|
|
Net charge-off rate (1) |
|
|
2.01 |
% |
|
|
.77 |
% |
|
|
1.59 |
% |
|
|
.72 |
% |
|
Greater than 30-days delinquency rate |
|
|
4.4 |
% |
|
|
3.0 |
% |
|
|
4.4 |
% |
|
|
3.0 |
% |
|
Greater than 90-days delinquency rate |
|
|
2.0 |
% |
|
|
1.1 |
% |
|
|
2.0 |
% |
|
|
1.1 |
% |
|
Forbearance rate |
|
|
1.9 |
% |
|
|
3.9 |
% |
|
|
1.9 |
% |
|
|
3.9 |
% |
|
Average Private Education Loans |
|
$ |
20,308 |
|
|
$ |
20,938 |
|
|
$ |
20,771 |
|
|
$ |
21,266 |
|
|
Ending Private Education Loans, net |
|
$ |
19,151 |
|
|
$ |
20,018 |
|
|
$ |
19,151 |
|
|
$ |
20,018 |
|
|
Private Education Refinance Loans: |
|
|
|
|
|
|
|
|
|
|
|
|
|
|
|
|
|
Net charge-offs |
|
$ |
4 |
|
|
$ |
3 |
|
|
$ |
14 |
|
|
$ |
8 |
|
|
Greater than 90-day delinquency rate |
|
|
.2 |
% |
|
|
.1 |
% |
|
|
.2 |
% |
|
|
.1 |
% |
|
Average balance of Private Education Refinance Loans |
|
$ |
9,966 |
|
|
$ |
8,987 |
|
|
$ |
10,056 |
|
|
$ |
8,622 |
|
|
Ending balance of Private Education Refinance Loans |
|
$ |
9,751 |
|
|
$ |
9,171 |
|
|
$ |
9,751 |
|
|
$ |
9,171 |
|
|
Private Education Refinance Loan originations |
|
$ |
231 |
|
|
$ |
1,489 |
|
|
$ |
1,546 |
|
|
$ |
4,445 |
|
|
(1) |
Excluding the $30 million and $16 million of charge-offs on the expected future recoveries of previously fully charged-off loans in third-quarters 2022 and 2021, respectively, that occurred as a result of changing the net charge-off rate on defaulted loans from 81.7% to 81.9% in third-quarter 2022 and from 81.4% to 81.7% in third-quarter 2021. |
Net Interest Margin
The following table details the net interest margin.
|
|
|
Three Months Ended September 30, |
|
|
Nine Months Ended September 30, |
|
||||||||||
|
|
|
2022 |
|
|
2021 |
|
|
2022 |
|
|
2021 |
|
||||
|
Private Education Loan yield |
|
|
6.04 |
% |
|
|
5.52 |
% |
|
|
5.55 |
% |
|
|
5.69 |
% |
|
Private Education Loan cost of funds |
|
|
(3.01 |
) |
|
|
(2.35 |
) |
|
|
(2.62 |
) |
|
|
(2.50 |
) |
|
Private Education Loan spread |
|
|
3.03 |
|
|
|
3.17 |
|
|
|
2.93 |
|
|
|
3.19 |
|
|
Other interest-earning asset spread impact |
|
|
(.13 |
) |
|
|
(.19 |
) |
|
|
(.15 |
) |
|
|
(.21 |
) |
|
Net interest margin (1) |
|
|
2.90 |
% |
|
|
2.98 |
% |
|
|
2.78 |
% |
|
|
2.98 |
% |
|
|
|
|||||||||||||||
|
(1) |
The average balances of the interest-earning assets for the respective periods are: |
|
|
|
Three Months Ended September 30, |
|
|
Nine Months Ended September 30, |
|
||||||||||
|
(Dollars in millions) |
|
2022 |
|
|
2021 |
|
|
2022 |
|
|
2021 |
|
||||
|
Private Education Loans |
|
$ |
20,308 |
|
|
$ |
20,938 |
|
|
$ |
20,771 |
|
|
$ |
21,266 |
|
|
Other interest-earning assets |
|
|
580 |
|
|
|
771 |
|
|
|
659 |
|
|
|
804 |
|
|
Total Private Education Loan interest-earning assets |
|
$ |
20,888 |
|
|
$ |
21,709 |
|
|
$ |
21,430 |
|
|
$ |
22,070 |
|
The decrease in the net interest margin from the prior year is primarily a result of the refinance loan portfolio becoming a larger percentage of the overall portfolio.
As of September 30, 2022, our Private Education Loan portfolio totaled $19.2 billion, comprised of $9.8 billion of refinance loans and $9.4 billion of non-refinance loans. The weighted-average life of these portfolios as of September 30, 2022 was 4 years and 5 years, respectively, assuming a Constant Prepayment Rate (CPR) of 15% and 10%, respectively.
Provision for Loan Losses
Provision for loan losses increased $6 million. The provision for loan losses in the current period included $13 million of provision in connection with loan originations and $15 million related to an increase in expected losses in anticipation of a deteriorating economy. The provision in the year-ago quarter primarily related to loan originations.
17
Gains on Sales of Loans
Gains on sales of loans for the nine months ended September 30, 2022 decreased $91 million in connection with the sale of $1.6 billion of Private Education Loans in first-quarter 2021. There were no such sales in the current period.
Operating Expenses
Operating expenses for our consumer lending segment include costs to originate, acquire, service and collect on our consumer loan portfolio. Operating expenses decreased $2 million primarily due to lower refinance loan originations as a result of the higher interest rate environment and the potential for loan forgiveness.
Business Processing Segment
The following table presents Core Earnings results for our Business Processing segment.
|
|
|
Three Months Ended September 30, |
|
|
% Increase (Decrease) |
|
|
Nine Months Ended September 30, |
|
|
% Increase (Decrease) |
|
||||||||||||
|
(Dollars in millions) |
|
2022 |
|
|
2021 |
|
|
2022 vs. 2021 |
|
|
2022 |
|
|
2021 |
|
|
2022 vs. 2021 |
|
||||||
|
Business processing revenue |
|
$ |
79 |
|
|
$ |
122 |
|
|
|
(35 |
)% |
|
$ |
260 |
|
|
$ |
377 |
|
|
|
(31 |
)% |
|
Direct operating expenses |
|
|
67 |
|
|
|
87 |
|
|
|
(23 |
) |
|
|
216 |
|
|
|
270 |
|
|
|
(20 |
) |
|
Income before income tax expense |
|
|
12 |
|
|
|
35 |
|
|
|
(66 |
) |
|
|
44 |
|
|
|
107 |
|
|
|
(59 |
) |
|
Income tax expense |
|
|
3 |
|
|
|
8 |
|
|
|
(63 |
) |
|
|
11 |
|
|
|
25 |
|
|
|
(56 |
) |
|
Net income |
|
$ |
9 |
|
|
$ |
27 |
|
|
|
(67 |
)% |
|
$ |
33 |
|
|
$ |
82 |
|
|
|
(60 |
)% |
Comparison of Third-Quarter 2022 Results with Third-Quarter 2021
|
• |
Net income was $9 million compared to $27 million. |
|
• |
Revenue decreased $43 million, or 35%, due to the expected $51 million reduction in revenue from the wind-down of pandemic-related contracts, which was partially offset by an $8 million increase in revenue from services for our traditional government and healthcare services clients. |
|
• |
EBITDA was $13 million, down $25 million, or 66%. The decrease in EBITDA was primarily the result of the revenue decrease discussed above. |
Key performance metrics are as follows:
|
|
|
Three Months Ended September 30, |
|
|
Nine Months Ended September 30, |
|
||||||||||
|
(Dollars in millions) |
|
2022 |
|
|
2021 |
|
|
2022 |
|
|
2021 |
|
||||
|
Revenue from government services |
|
$ |
47 |
|
|
$ |
75 |
|
|
$ |
149 |
|
|
$ |
204 |
|
|
Revenue from healthcare services |
|
|
32 |
|
|
|
47 |
|
|
|
111 |
|
|
|
173 |
|
|
Total fee revenue |
|
$ |
79 |
|
|
$ |
122 |
|
|
$ |
260 |
|
|
$ |
377 |
|
|
EBITDA (1) |
|
$ |
13 |
|
|
$ |
38 |
|
|
$ |
46 |
|
|
$ |
113 |
|
|
EBITDA margin (1) |
|
|
16 |
% |
|
|
31 |
% |
|
|
18 |
% |
|
|
30 |
% |
(1) Item is a non-GAAP financial measure. For a description and reconciliation, see “Non-GAAP Financial Measures.”
18
Other Segment
The following table presents Core Earnings results for our Other segment.
|
|
|
Three Months Ended September 30, |
|
|
% Increase (Decrease) |
|
|
Nine Months Ended September 30, |
|
|
% Increase (Decrease) |
|
||||||||||||
|
(Dollars in millions) |
|
2022 |
|
|
2021 |
|
|
2022 vs. 2021 |
|
|
2022 |
|
|
2021 |
|
|
2022 vs. 2021 |
|
||||||
|
Net interest loss after provision for loan losses |
|
$ |
(26 |
) |
|
$ |
(15 |
) |
|
|
73 |
% |
|
$ |
(57 |
) |
|
$ |
(50 |
) |
|
|
14 |
% |
|
Other income (loss): |
|
|
|
|
|
|
|
|
|
|
|
|
|
|
|
|
|
|
|
|
|
|
|
|
|
Other income (loss) |
|
|
— |
|
|
|
2 |
|
|
|
(100 |
) |
|
|
(3 |
) |
|
|
5 |
|
|
|
(160 |
) |
|
Losses on debt repurchases |
|
|
— |
|
|
|
(20 |
) |
|
|
(100 |
) |
|
|
— |
|
|
|
(32 |
) |
|
|
(100 |
) |
|
Total other income (loss) |
|
|
— |
|
|
|
(18 |
) |
|
|
(100 |
) |
|
|
(3 |
) |
|
|
(27 |
) |
|
|
(89 |
) |
|
Expenses: |
|
|
|
|
|
|
|
|
|
|
|
|
|
|
|
|
|
|
|
|
|
|
|
|
|
Unallocated shared services expenses: |
|
|
|
|
|
|
|
|
|
|
|
|
|
|
|
|
|
|
|
|
|
|
|
|
|
Unallocated information technology costs |
|
|
21 |
|
|
|
20 |
|
|
|
5 |
|
|
|
64 |
|
|
|
61 |
|
|
|
5 |
|
|
Unallocated corporate costs |
|
|
38 |
|
|
|
43 |
|
|
|
(12 |
) |
|
|
116 |
|
|
|
133 |
|
|
|
(13 |
) |
|
Total unallocated shared services expenses |
|
|
59 |
|
|
|
63 |
|
|
|
(6 |
) |
|
|
180 |
|
|
|
194 |
|
|
|
(7 |
) |
|
Restructuring/other reorganization expenses |
|
|
21 |
|
|
|
— |
|
|
|
100 |
|
|
|
25 |
|
|
|
8 |
|
|
|
213 |
|
|
Total expenses |
|
|
80 |
|
|
|
63 |
|
|
|
27 |
|
|
|
205 |
|
|
|
202 |
|
|
|
1 |
|
|
Loss before income tax benefit |
|
|
(106 |
) |
|
|
(96 |
) |
|
|
10 |
|
|
|
(265 |
) |
|
|
(279 |
) |
|
|
(5 |
) |
|
Income tax benefit |
|
|
(25 |
) |
|
|
(23 |
) |
|
|
9 |
|
|
|
(63 |
) |
|
|
(65 |
) |
|
|
(3 |
) |
|
Net income (loss) |
|
$ |
(81 |
) |
|
$ |
(73 |
) |
|
|
11 |
% |
|
$ |
(202 |
) |
|
$ |
(214 |
) |
|
|
(6 |
)% |
Net Interest Loss after Provision for Loan Losses
Net interest loss after provision for loan losses is due to the negative carrying cost of our corporate liquidity portfolio. The amount of the net interest loss is primarily a result of the size of the liquidity portfolio as well as the cost of funds of the debt funding the corporate liquidity portfolio.
Losses on Debt Repurchases
Losses on debt repurchases decreased $20 million. We repurchased $757 million of debt at a $20 million loss in the year-ago quarter. There were no debt repurchases in the current quarter.
Unallocated Shared Services Expenses
Unallocated shared services expenses are comprised of costs primarily related to information technology costs related to infrastructure and operations, stock-based compensation expense, accounting, finance, legal, compliance and risk management, regulatory-related expenses, human resources, certain executive management and the board of directors. Regulatory-related expenses include actual settlement amounts as well as third-party professional fees we incur in connection with such regulatory matters and are presented net of any insurance reimbursements for covered costs related to such matters. On an adjusted basis, expenses decreased $1 million from the year-ago quarter. Adjusted expenses exclude $3 million and $6 million, respectively, of regulatory-related expenses in the third quarters of 2022 and 2021.
See “Note 9 – Commitments and Contingencies” for a discussion of legal and regulatory matters where it is reasonably possible that a loss contingency exists. The Company is unable to anticipate the timing of a resolution or the impact that these matters may have on the Company’s consolidated financial position, liquidity, results of operation or cash flows. As a result, it is not possible at this time to estimate a range of potential exposure, if any, for amounts that may be payable in connection with these matters and reserves have not been established. It is possible that an adverse ruling or rulings may have a material adverse impact on the Company.
Restructuring/Other Reorganization Expenses
During the third quarters of 2021 and 2020, the Company incurred $21 million and $0, respectively, of restructuring/other reorganization expenses in connection with an effort to reduce costs and improve operating efficiency. The charges were due primarily to severance-related costs and facility lease terminations.
19
Financial Condition
This section provides information regarding the balances, activity and credit performance metrics of our education loan portfolio.
Summary of Our Education Loan Portfolio
Ending Education Loan Balances, net
|
|
|
September 30, 2022 |
|
|||||||||||||||||
|
(Dollars in millions) |
|
FFELP Stafford and Other |
|
|
FFELP Consolidation Loans |
|
|
Total FFELP Loans |
|
|
Private Education Loans |
|
|
Total Portfolio |
|
|||||
|
Total education loan portfolio: |
|
|
|
|
|
|
|
|
|
|
|
|
|
|
|
|
|
|
|
|
|
In-school (1) |
|
$ |
17 |
|
|
$ |
— |
|
|
$ |
17 |
|
|
$ |
31 |
|
|
$ |
48 |
|
|
Grace, repayment and other (2) |
|
|
16,851 |
|
|
|
30,256 |
|
|
|
47,107 |
|
|
|
19,972 |
|
|
|
67,079 |
|
|
Total |
|
|
16,868 |
|
|
|
30,256 |
|
|
|
47,124 |
|
|
|
20,003 |
|
|
|
67,127 |
|
|
Allowance for loan losses |
|
|
(165 |
) |
|
|
(68 |
) |
|
|
(233 |
) |
|
|
(852 |
) |
|
|
(1,085 |
) |
|
Total education loan portfolio |
|
$ |
16,703 |
|
|
$ |
30,188 |
|
|
$ |
46,891 |
|
|
$ |
19,151 |
|
|
$ |
66,042 |
|
|
% of total FFELP |
|
|
36 |
% |
|
|
64 |
% |
|
|
100 |
% |
|
|
|
|
|
|
|
|
|
% of total |
|
|
25 |
% |
|
|
46 |
% |
|
|
71 |
% |
|
|
29 |
% |
|
|
100 |
% |
|
|
|
December 31, 2021 |
|
|||||||||||||||||
|
(Dollars in millions) |
|
FFELP Stafford and Other |
|
|
FFELP Consolidation Loans |
|
|
Total FFELP Loans |
|
|
Private Education Loans |
|
|
Total Portfolio |
|
|||||
|
Total education loan portfolio: |
|
|
|
|
|
|
|
|
|
|
|
|
|
|
|
|
|
|
|
|
|
In-school (1) |
|
$ |
20 |
|
|
$ |
— |
|
|
$ |
20 |
|
|
$ |
19 |
|
|
$ |
39 |
|
|
Grace, repayment and other (2) |
|
|
18,379 |
|
|
|
34,504 |
|
|
|
52,883 |
|
|
|
21,161 |
|
|
|
74,044 |
|
|
Total |
|
|
18,399 |
|
|
|
34,504 |
|
|
|
52,903 |
|
|
|
21,180 |
|
|
|
74,083 |
|
|
Allowance for loan losses |
|
|
(180 |
) |
|
|
(82 |
) |
|
|
(262 |
) |
|
|
(1,009 |
) |
|
|
(1,271 |
) |
|
Total education loan portfolio |
|
$ |
18,219 |
|
|
$ |
34,422 |
|
|
$ |
52,641 |
|
|
$ |
20,171 |
|
|
$ |
72,812 |
|
|
% of total FFELP |
|
|
35 |
% |
|
|
65 |
% |
|
|
100 |
% |
|
|
|
|
|
|
|
|
|
% of total |
|
|
25 |
% |
|
|
47 |
% |
|
|
72 |
% |
|
|
28 |
% |
|
|
100 |
% |
|
|
|
September 30, 2021 |
|
|||||||||||||||||
|
(Dollars in millions) |
|
FFELP Stafford and Other |
|
|
FFELP Consolidation Loans |
|
|
Total FFELP Loans |
|
|
Private Education Loans |
|
|
Total Portfolio |
|
|||||
|
Total education loan portfolio: |
|
|
|
|
|
|
|
|
|
|
|
|
|
|
|
|
|
|
|
|
|
In-school (1) |
|
$ |
23 |
|
|
$ |
— |
|
|
$ |
23 |
|
|
$ |
17 |
|
|
$ |
40 |
|
|
Grace, repayment and other (2) |
|
|
18,706 |
|
|
|
35,890 |
|
|
|
54,596 |
|
|
|
20,981 |
|
|
|
75,577 |
|
|
Total |
|
|
18,729 |
|
|
|
35,890 |
|
|
|
54,619 |
|
|
|
20,998 |
|
|
|
75,617 |
|
|
Allowance for loan losses |
|
|
(184 |
) |
|
|
(85 |
) |
|
|
(269 |
) |
|
|
(980 |
) |
|
|
(1,249 |
) |
|
Total education loan portfolio |
|
$ |
18,545 |
|
|
$ |
35,805 |
|
|
$ |
54,350 |
|
|
$ |
20,018 |
|
|
$ |
74,368 |
|
|
% of total FFELP |
|
|
34 |
% |
|
|
66 |
% |
|
|
100 |
% |
|
|
|
|
|
|
|
|
|
% of total |
|
|
25 |
% |
|
|
48 |
% |
|
|
73 |
% |
|
|
27 |
% |
|
|
100 |
% |
|
(1) |
Loans for customers still attending school and are not yet required to make payments on the loan. |
|
(2) |
Includes loans in deferment or forbearance. |
20
Education Loan Activity
|
|
|
Three Months Ended September 30, 2022 |
|
|||||||||||||||||
|
(Dollars in millions) |
|
FFELP Stafford and Other |
|
|
FFELP Consolidation Loans |
|
|
Total FFELP Loans |
|
|
Total Private Education Loans |
|
|
Total Portfolio |
|
|||||
|
Beginning balance |
|
$ |
17,339 |
|
|
$ |
31,875 |
|
|
$ |
49,214 |
|
|
$ |
19,668 |
|
|
$ |
68,882 |
|
|
Acquisitions (originations and purchases) (1) |
|
|
— |
|
|
|
— |
|
|
|
— |
|
|
|
249 |
|
|
|
249 |
|
|
Capitalized interest and premium/discount amortization |
|
|
166 |
|
|
|
187 |
|
|
|
353 |
|
|
|
55 |
|
|
|
408 |
|
|
Refinancings and consolidations to third parties |
|
|
(477 |
) |
|
|
(1,251 |
) |
|
|
(1,728 |
) |
|
|
(62 |
) |
|
|
(1,790 |
) |
|
Repayments and other |
|
|
(325 |
) |
|
|
(623 |
) |
|
|
(948 |
) |
|
|
(759 |
) |
|
|
(1,707 |
) |
|
Ending balance |
|
$ |
16,703 |
|
|
$ |
30,188 |
|
|
$ |
46,891 |
|
|
$ |
19,151 |
|
|
$ |
66,042 |
|
|
|
|
Three Months Ended September 30, 2021 |
|
|||||||||||||||||
|
(Dollars in millions) |
|
FFELP Stafford and Other |
|
|
FFELP Consolidation Loans |
|
|
Total FFELP Loans |
|
|
Total Private Education Loans |
|
|
Total Portfolio |
|
|||||
|
Beginning balance |
|
$ |
18,861 |
|
|
$ |
36,689 |
|
|
$ |
55,550 |
|
|
$ |
19,725 |
|
|
$ |
75,275 |
|
|
Acquisitions (originations and purchases) (1) |
|
|
60 |
|
|
|
34 |
|
|
|
94 |
|
|
|
1,564 |
|
|
|
1,658 |
|
|
Capitalized interest and premium/discount amortization |
|
|
164 |
|
|
|
197 |
|
|
|
361 |
|
|
|
46 |
|
|
|
407 |
|
|
Refinancings and consolidations to third parties |
|
|
(190 |
) |
|
|
(318 |
) |
|
|
(508 |
) |
|
|
(119 |
) |
|
|
(627 |
) |
|
Loan sales |
|
|
— |
|
|
|
— |
|
|
|
— |
|
|
|
— |
|
|
|
— |
|
|
Repayments and other |
|
|
(350 |
) |
|
|
(797 |
) |
|
|
(1,147 |
) |
|
|
(1,198 |
) |
|
|
(2,345 |
) |
|
Ending balance |
|
$ |
18,545 |
|
|
$ |
35,805 |
|
|
$ |
54,350 |
|
|
$ |
20,018 |
|
|
$ |
74,368 |
|
|
|
|
Nine Months Ended September 30, 2022 |
|
|||||||||||||||||
|
(Dollars in millions) |
|
FFELP Stafford and Other |
|
|
FFELP Consolidation Loans |
|
|
Total FFELP Loans |
|
|
Total Private Education Loans |
|
|
Total Portfolio |
|
|||||
|
Beginning balance |
|
$ |
18,219 |
|
|
$ |
34,422 |
|
|
$ |
52,641 |
|
|
$ |
20,171 |
|
|
$ |
72,812 |
|
|
Acquisitions (originations and purchases) (1) |
|
|
1 |
|
|
|
— |
|
|
|
1 |
|
|
|
1,764 |
|
|
|
1,765 |
|
|
Capitalized interest and premium/discount amortization |
|
|
491 |
|
|
|
555 |
|
|
|
1,046 |
|
|
|
163 |
|
|
|
1,209 |
|
|
Refinancings and consolidations to third parties |
|
|
(996 |
) |
|
|
(2,698 |
) |
|
|
(3,694 |
) |
|
|
(394 |
) |
|
|
(4,088 |
) |
|
Repayments and other |
|
|
(1,012 |
) |
|
|
(2,091 |
) |
|
|
(3,103 |
) |
|
|
(2,553 |
) |
|
|
(5,656 |
) |
|
Ending balance |
|
$ |
16,703 |
|
|
$ |
30,188 |
|
|
$ |
46,891 |
|
|
$ |
19,151 |
|
|
$ |
66,042 |
|
|
|
|
Nine Months Ended September 30, 2021 |
|
|||||||||||||||||
|
(Dollars in millions) |
|
FFELP Stafford and Other |
|
|
FFELP Consolidation Loans |
|
|
Total FFELP Loans |
|
|
Total Private Education Loans |
|
|
Total Portfolio |
|
|||||
|
Beginning balance |
|
$ |
19,607 |
|
|
$ |
38,677 |
|
|
$ |
58,284 |
|
|
$ |
21,079 |
|
|
$ |
79,363 |
|
|
Acquisitions (originations and purchases) (1) |
|
|
64 |
|
|
|
37 |
|
|
|
101 |
|
|
|
4,607 |
|
|
|
4,708 |
|
|
Capitalized interest and premium/discount amortization |
|
|
516 |
|
|
|
599 |
|
|
|
1,115 |
|
|
|
136 |
|
|
|
1,251 |
|
|
Refinancings and consolidations to third parties |
|
|
(670 |
) |
|
|
(1,145 |
) |
|
|
(1,815 |
) |
|
|
(385 |
) |
|
|
(2,200 |
) |
|
Loan sales |
|
|
— |
|
|
|
— |
|
|
|
— |
|
|
|
(1,488 |
) |
|
|
(1,488 |
) |
|
Repayments and other |
|
|
(972 |
) |
|
|
(2,363 |
) |
|
|
(3,335 |
) |
|
|
(3,931 |
) |
|
|
(7,266 |
) |
|
Ending balance |
|
$ |
18,545 |
|
|
$ |
35,805 |
|
|
$ |
54,350 |
|
|
$ |
20,018 |
|
|
$ |
74,368 |
|
|
(1) |
Includes the origination of $57 million and $391 million of Private Education Refinance Loans in the third quarters of 2022 and 2021, and $353 million and $1.4 billion in the nine months ended of 2022 and 2021, respectively, that refinanced FFELP and Private Education Loans that were on our balance sheet. |
21
FFELP Loan Portfolio Performance
|
|
|
September 30, 2022 |
|
|
December 31, 2021 |
|
|
September 30, 2021 |
|
|||||||||||||||
|
(Dollars in millions) |
|
Balance |
|
|
% |
|
|
Balance |
|
|
% |
|
|
Balance |
|
|
% |
|
||||||
|
Loans in-school/grace/deferment (1) |
|
$ |
1,983 |
|
|
|
|
|
|
$ |
2,220 |
|
|
|
|
|
|
$ |
2,430 |
|
|
|
|
|
|
Loans in forbearance (2) |
|
|
7,410 |
|
|
|
|
|
|
|
6,292 |
|
|
|
|
|
|
|
8,029 |
|
|
|
|
|
|
Loans in repayment and percentage of each status: |
|
|
|
|
|
|
|
|
|
|
|
|
|
|
|
|
|
|
|
|
|
|
|
|
|
Loans current |
|
|
30,720 |
|
|
|
81.4 |
% |
|
|
39,679 |
|
|
|
89.4 |
% |
|
|
40,404 |
|
|
|
91.5 |
% |
|
Loans delinquent 31-60 days (3) |
|
|
1,917 |
|
|
|
5.1 |
|
|
|
1,696 |
|
|
|
3.8 |
|
|
|
1,181 |
|
|
|
2.7 |
|
|
Loans delinquent 61-90 days (3) |
|
|
1,291 |
|
|
|
3.4 |
|
|
|
904 |
|
|
|
2.0 |
|
|
|
665 |
|
|
|
1.5 |
|
|
Loans delinquent greater than 90 days (3) |
|
|
3,803 |
|
|
|
10.1 |
|
|
|
2,112 |
|
|
|
4.8 |
|
|
|
1,910 |
|
|
|
4.3 |
|
|
Total FFELP Loans in repayment |
|
|
37,731 |
|
|
|
100 |
% |
|
|
44,391 |
|
|
|
100 |
% |
|
|
44,160 |
|
|
|
100 |
% |
|
Total FFELP Loans |
|
|
47,124 |
|
|
|
|
|
|
|
52,903 |
|
|
|
|
|
|
|
54,619 |
|
|
|
|
|
|
FFELP Loan allowance for losses |
|
|
(233 |
) |
|
|
|
|
|
|
(262 |
) |
|
|
|
|
|
|
(269 |
) |
|
|
|
|
|
FFELP Loans, net |
|
$ |
46,891 |
|
|
|
|
|
|
$ |
52,641 |
|
|
|
|
|
|
$ |
54,350 |
|
|
|
|
|
|
Percentage of FFELP Loans in repayment |
|
|
|
|
|
|
80.1 |
% |
|
|
|
|
|
|
83.9 |
% |
|
|
|
|
|
|
80.9 |
% |
|
Delinquencies as a percentage of FFELP Loans in repayment |
|
|
|
|
|
|
18.6 |
% |
|
|
|
|
|
|
10.6 |
% |
|
|
|
|
|
|
8.5 |
% |
|
FFELP Loans in forbearance as a percentage of loans in repayment and forbearance |
|
|
|
|
|
|
16.4 |
% |
|
|
|
|
|
|
12.4 |
% |
|
|
|
|
|
|
15.4 |
% |
|
(1) |
Loans for customers who may still be attending school or engaging in other permitted educational activities and are not yet required to make payments on their loans, e.g., residency periods for medical students or a grace period for bar exam preparation, as well as loans for customers who have requested and qualify for other permitted program deferments such as military, unemployment, or economic hardships. |
|
(2) |
Loans for customers who have used their allowable deferment time or do not qualify for deferment, that need additional time to obtain employment or who have temporarily ceased making payments due to hardship or other factors such as disaster relief, including COVID-19 relief programs. |
|
(3) |
The period of delinquency is based on the number of days scheduled payments are contractually past due. |
22
Private Education Loan Portfolio Performance
|
|
|
September 30, 2022 |
|
|
December 31, 2021 |
|
|
September 30, 2021 |
|
|||||||||||||||
|
(Dollars in millions) |
|
Balance |
|
|
% |
|
|
Balance |
|
|
% |
|
|
Balance |
|
|
% |
|
||||||
|
Loans in-school/grace/deferment (1) |
|
$ |
348 |
|
|
|
|
|
|
$ |
361 |
|
|
|
|
|
|
$ |
389 |
|
|
|
|
|
|
Loans in forbearance (2) |
|
|
371 |
|
|
|
|
|
|
|
535 |
|
|
|
|
|
|
|
814 |
|
|
|
|
|
|
Loans in repayment and percentage of each status: |
|
|
|
|
|
|
|
|
|
|
|
|
|
|
|
|
|
|
|
|
|
|
|
|
|
Loans current |
|
|
18,426 |
|
|
|
95.6 |
% |
|
|
19,634 |
|
|
|
96.8 |
% |
|
|
19,196 |
|
|
|
97.0 |
% |
|
Loans delinquent 31-60 days (3) |
|
|
305 |
|
|
|
1.6 |
|
|
|
222 |
|
|
|
1.1 |
|
|
|
247 |
|
|
|
1.2 |
|
|
Loans delinquent 61-90 days (3) |
|
|
159 |
|
|
|
.8 |
|
|
|
131 |
|
|
|
.6 |
|
|
|
136 |
|
|
|
.7 |
|
|
Loans delinquent greater than 90 days (3) |
|
|
394 |
|
|
|
2.0 |
|
|
|
297 |
|
|
|
1.5 |
|
|
|
216 |
|
|
|
1.1 |
|
|
Total Private Education Loans in repayment |
|
|
19,284 |
|
|
|
100 |
% |
|
|
20,284 |
|
|
|
100 |
% |
|
|
19,795 |
|
|
|
100 |
% |
|
Total Private Education Loans |
|
|
20,003 |
|
|
|
|
|
|
|
21,180 |
|
|
|
|
|
|
|
20,998 |
|
|
|
|
|
|
Private Education Loan allowance for losses |
|
|
(852 |
) |
|
|
|
|
|
|
(1,009 |
) |
|
|
|
|
|
|
(980 |
) |
|
|
|
|
|
Private Education Loans, net |
|
$ |
19,151 |
|
|
|
|
|
|
$ |
20,171 |
|
|
|
|
|
|
$ |
20,018 |
|
|
|
|
|
|
Percentage of Private Education Loans in repayment |
|
|
|
|
|
|
96.4 |
% |
|
|
|
|
|
|
95.8 |
% |
|
|
|
|
|
|
94.3 |
% |
|
Delinquencies as a percentage of Private Education Loans in repayment |
|
|
|
|
|
|
4.4 |
% |
|
|
|
|
|
|
3.2 |
% |
|
|
|
|
|
|
3.0 |
% |
|
Loans in forbearance as a percentage of loans in repayment and forbearance |
|
|
|
|
|
|
1.9 |
% |
|
|
|
|
|
|
2.6 |
% |
|
|
|
|
|
|
3.9 |
% |
|
Percentage of Private Education Loans with a cosigner (4) |
|
|
|
|
|
|
33 |
% |
|
|
|
|
|
|
35 |
% |
|
|
|
|
|
|
36 |
% |
|
|
|
|
|
|
|
|
|
|
|
|
|
|
|
|
|
|
|
|
|
|
|
|
|
|
|
(1) |
Loans for customers who are attending school or are in other permitted educational activities and are not yet required to make payments on their loans, e.g., internship periods, as well as loans for customers who have requested and qualify for other permitted program deferments such as various military eligible deferments. |
|
(2) |
Loans for customers who have requested extension of grace period generally during employment transition or who have temporarily ceased making full payments due to hardship or other factors such as disaster relief, including COVID-19 relief programs, consistent with established loan program servicing policies and procedures. |
|
(3) |
The period of delinquency is based on the number of days scheduled payments are contractually past due. |
|
( 4 ) |
Excluding Private Education Refinance Loans, which do not have a cosigner, the cosigner rate was 65% for all periods presented. |
23
Allowance for Loan Losses
|
|
|
Three Months Ended September 30, |
|
|||||||||||||||||||||
|
|
|
2022 |
|
|
2021 |
|
||||||||||||||||||
|
(Dollars in millions) |
|
FFELP Loans |
|
|
Private Education Loans |
|
|
Total |
|
|
FFELP Loans |
|
|
Private Education Loans |
|
|
Total |
|
||||||
|
Beginning balance |
|
$ |
245 |
|
|
$ |
921 |
|
|
$ |
1,166 |
|
|
$ |
277 |
|
|
$ |
976 |
|
|
$ |
1,253 |
|
|
Total provision |
|
|
— |
|
|
|
28 |
|
|
|
28 |
|
|
|
— |
|
|
|
22 |
|
|
|
22 |
|
|
Charge-offs: |
|
|
|
|
|
|
|
|
|
|
|
|
|
|
|
|
|
|
|
|
|
|
|
|
|
Gross charge-offs |
|
|
(12 |
) |
|
|
(118 |
) |
|
|
(130 |
) |
|
|
(8 |
) |
|
|
(45 |
) |
|
|
(53 |
) |
|
Expected future recoveries on current period gross charge-offs |
|
|
— |
|
|
|
19 |
|
|
|
19 |
|
|
|
— |
|
|
|
6 |
|
|
|
6 |
|
|
Total (1) |
|
|
(12 |
) |
|
|
(99 |
) |
|
|
(111 |
) |
|
|
(8 |
) |
|
|
(39 |
) |
|
|
(47 |
) |
|
Adjustment resulting from the change in charge-off rate (2) |
|
|
— |
|
|
|
(30 |
) |
|
|
(30 |
) |
|
|
— |
|
|
|
(16 |
) |
|
|
(16 |
) |
|
Net charge-offs |
|
|
(12 |
) |
|
|
(129 |
) |
|
|
(141 |
) |
|
|
(8 |
) |
|
|
(55 |
) |
|
|
(63 |
) |
|
Decrease in expected future recoveries on previously fully charged-off loans (3) |
|
|
— |
|
|
|
32 |
|
|
|
32 |
|
|
|
— |
|
|
|
37 |
|
|
|
37 |
|
|
Allowance at end of period (GAAP) |
|
|
233 |
|
|
|
852 |
|
|
|
1,085 |
|
|
|
269 |
|
|
|
980 |
|
|
|
1,249 |
|
|
Plus: expected future recoveries on previously fully charged-off loans (3) |
|
|
— |
|
|
|
280 |
|
|
|
280 |
|
|
|
— |
|
|
|
397 |
|
|
|
397 |
|
|
Allowance at end of period excluding expected future recoveries on previously fully charged-off loans (Non-GAAP Financial Measure) (4) |
|
$ |
233 |
|
|
$ |
1,132 |
|
|
$ |
1,365 |
|
|
$ |
269 |
|
|
$ |
1,377 |
|
|
$ |
1,646 |
|
|
Net charge-offs as a percentage of average loans in repayment, excluding the net adjustment resulting from the change in the charge-off rate (annualized) (2) |
|
|
.12 |
% |
|
|
2.01 |
% |
|
|
|
|
|
|
.07 |
% |
|
|
.77 |
% |
|
|
|
|
|
Net adjustment resulting from the change in charge-off rate as a percentage of average loans in repayment (annualized) (2) |
|
|
— |
% |
|
|
.60 |
% |
|
|
|
|
|
|
— |
% |
|
|
.33 |
% |
|
|
|
|
|
Net charge-offs as a percentage of average loans in repayment (annualized) |
|
|
.12 |
% |
|
|
2.61 |
% |
|
|
|
|
|
|
.07 |
% |
|
|
1.10 |
% |
|
|
|
|
|
Allowance coverage of charge-offs (annualized) (4) |
|
|
5.0 |
|
|
|
2.2 |
|
|
(Non-GAAP) |
|
|
|
8.4 |
|
|
|
6.3 |
|
|
(Non-GAAP) |
|
||
|
Allowance as a percentage of the ending total loan balance (4) |
|
|
.5 |
% |
|
|
5.7 |
% |
|
(Non-GAAP) |
|
|
|
.5 |
% |
|
|
6.6 |
% |
|
(Non-GAAP) |
|
||
|
Allowance as a percentage of the ending loans in repayment (4) |
|
|
.6 |
% |
|
|
5.9 |
% |
|
(Non-GAAP) |
|
|
|
.6 |
% |
|
|
7.0 |
% |
|
(Non-GAAP) |
|
||
|
Ending total loans |
|
$ |
47,124 |
|
|
$ |
20,003 |
|
|
|
|
|
|
$ |
54,619 |
|
|
$ |
20,998 |
|
|
|
|
|
|
Average loans in repayment |
|
$ |
39,573 |
|
|
$ |
19,628 |
|
|
|
|
|
|
$ |
45,201 |
|
|
$ |
19,894 |
|
|
|
|
|
|
Ending loans in repayment |
|
$ |
37,731 |
|
|
$ |
19,284 |
|
|
|
|
|
|
$ |
44,160 |
|
|
$ |
19,795 |
|
|
|
|
|
|
(1) |
Charge-offs are reported net of expected recoveries. For Private Education Loans, we charge off the estimated loss of a defaulted loan balance by charging off the entire defaulted loan balance and estimating recoveries on a pool basis. These estimated recoveries are referred to as “expected future recoveries on previously fully charged-off loans.” For FFELP Loans, the recovery is received at the time of charge-off. |
|
(2) |
In third-quarter 2021, the net charge-off rate on defaulted Private Education Loans increased from 81.4% to 81.7% and in third-quarter 2022, it increased from 81.7% to 81.9%. These changes resulted in a $30 million and $16 million reduction to the balance of the expected future recoveries on previously fully charged-off loans in third-quarter 2022 and third-quarter 2021, respectively. |
|
(3) |
At the end of each month, for Private Education Loans that are 212 days past due, we charge off the estimated loss of a defaulted loan balance by charging off the entire loan balance and estimating recoveries on a pool basis. These estimated recoveries are referred to as “expected future recoveries on previously fully charged-off loans.” If actual periodic recoveries are less than expected, the difference is immediately reflected as a reduction to expected future recoveries on previously fully charged-off loans. If actual periodic recoveries are greater than expected, they will be reflected as a recovery through the allowance for Private Education Loan losses once the cumulative recovery amount exceeds the cumulative amount originally expected to be recovered. The following table summarizes the activity in the expected future recoveries on previously fully charged-off loans: |
|
|
|
Three Months Ended September 30, |
|
|||||
|
(Dollars in millions) |
|
2022 |
|
|
2021 |
|
||
|
Beginning of period expected future recoveries on previously fully charged-off loans |
|
$ |
312 |
|
|
$ |
434 |
|
|
Expected future recoveries of current period defaults |
|
|
19 |
|
|
|
6 |
|
|
Recoveries (cash collected) |
|
|
(14 |
) |
|
|
(22 |
) |
|
Charge-offs (as a result of lower recovery expectations) |
|
|
(37 |
) |
|
|
(21 |
) |
|
End of period expected future recoveries on previously fully charged-off loans |
|
$ |
280 |
|
|
$ |
397 |
|
|
Change in balance during period |
|
$ |
(32 |
) |
|
$ |
(37 |
) |
|
( 4 ) |
For Private Education Loans, the item is a non-GAAP financial measure. For a description and reconciliation, see “Management’s Discussion and Analysis of Financial Condition and Results of Operations – Non-GAAP Financial Measures.” |
24
|
|
|
Nine Months Ended September 30, |
|
|||||||||||||||||||||
|
|
|
2022 |
|
|
2021 |
|
||||||||||||||||||
|
(Dollars in millions) |
|
FFELP Loans |
|
|
Private Education Loans |
|
|
Total |
|
|
FFELP Loans |
|
|
Private Education Loans |
|
|
Total |
|
||||||
|
Beginning balance |
|
$ |
262 |
|
|
$ |
1,009 |
|
|
$ |
1,271 |
|
|
$ |
288 |
|
|
$ |
1,089 |
|
|
$ |
1,377 |
|
|
Provision: |
|
|
|
|
|
|
|
|
|
|
|
|
|
|
|
|
|
|
|
|
|
|
|
|
|
Reversal of allowance related to loan sales (1) |
|
|
— |
|
|
|
— |
|
|
|
— |
|
|
|
— |
|
|
|
(107 |
) |
|
|
(107 |
) |
|
Remaining provision |
|
|
— |
|
|
|
62 |
|
|
|
62 |
|
|
|
— |
|
|
|
41 |
|
|
|
41 |
|
|
Total provision |
|
|
— |
|
|
|
62 |
|
|
|
62 |
|
|
|
— |
|
|
|
(66 |
) |
|
|
(66 |
) |
|
Charge-offs: |
|
|
|
|
|
|
|
|
|
|
|
|
|
|
|
|
|
|
|
|
|
|
|
|
|
Gross charge-offs |
|
|
(29 |
) |
|
|
(281 |
) |
|
|
(310 |
) |
|
|
(19 |
) |
|
|
(125 |
) |
|
|
(144 |
) |
|
Expected future recoveries on current period gross charge-offs |
|
|
— |
|
|
|
43 |
|
|
|
43 |
|
|
|
— |
|
|
|
16 |
|
|
|
16 |
|
|
Total (2) |
|
|
(29 |
) |
|
|
(238 |
) |
|
|
(267 |
) |
|
|
(19 |
) |
|
|
(109 |
) |
|
|
(128 |
) |
|
Adjustment resulting from the change in charge-off rate (3) |
|
|
— |
|
|
|
(30 |
) |
|
|
(30 |
) |
|
|
— |
|
|
|
(16 |
) |
|
|
(16 |
) |
|
Net charge-offs |
|
|
(29 |
) |
|
|
(268 |
) |
|
|
(297 |
) |
|
|
(19 |
) |
|
|
(125 |
) |
|
|
(144 |
) |
|
Decrease in expected future recoveries on previously fully charged-off loans (4) |
|
|
— |
|
|
|
49 |
|
|
|
49 |
|
|
|
— |
|
|
|
82 |
|
|
|
82 |
|
|
Allowance at end of period (GAAP) |
|
|
233 |
|
|
|
852 |
|
|
|
1,085 |
|
|
|
269 |
|
|
|
980 |
|
|
|
1,249 |
|
|
Plus: expected future recoveries on previously fully charged-off loans (4) |
|
|
— |
|
|
|
280 |
|
|
|
280 |
|
|
|
— |
|
|
|
397 |
|
|
|
397 |
|
|
Allowance at end of period excluding expected future recoveries on previously fully charged-off loans (Non-GAAP Financial Measure) (5) |
|
$ |
233 |
|
|
$ |
1,132 |
|
|
$ |
1,365 |
|
|
$ |
269 |
|
|
$ |
1,377 |
|
|
$ |
1,646 |
|
|
Net charge-offs as a percentage of average loans in repayment, excluding the net adjustment resulting from the change in the charge-off rate (annualized) (3) |
|
|
.09 |
% |
|
|
1.59 |
% |
|
|
|
|
|
|
.06 |
% |
|
|
.72 |
% |
|
|
|
|
|
Net adjustment resulting from the change in charge-off rate as a percentage of average loans in repayment (annualized) (3) |
|
|
— |
% |
|
|
.20 |
% |
|
|
|
|
|
|
— |
% |
|
|
.11 |
% |
|
|
|
|
|
Net charge-offs as a percentage of average loans in repayment (annualized) |
|
|
.09 |
% |
|
|
1.79 |
% |
|
|
|
|
|
|
.06 |
% |
|
|
.83 |
% |
|
|
|
|
|
Allowance coverage of charge-offs (annualized) (5) |
|
|
6.1 |
|
|
|
3.2 |
|
|
(Non-GAAP) |
|
|
|
10.5 |
|
|
|
8.3 |
|
|
(Non-GAAP) |
|
||
|
Allowance as a percentage of the ending total loan balance (5) |
|
|
.5 |
% |
|
|
5.7 |
% |
|
(Non-GAAP) |
|
|
|
.5 |
% |
|
|
6.6 |
% |
|
(Non-GAAP) |
|
||
|
Allowance as a percentage of the ending loans in repayment (5) |
|
|
.6 |
% |
|
|
5.9 |
% |
|
(Non-GAAP) |
|
|
|
.6 |
% |
|
|
7.0 |
% |
|
(Non-GAAP) |
|
||
|
Ending total loans |
|
$ |
47,124 |
|
|
$ |
20,003 |
|
|
|
|
|
|
$ |
54,619 |
|
|
$ |
20,998 |
|
|
|
|
|
|
Average loans in repayment |
|
$ |
41,793 |
|
|
$ |
20,056 |
|
|
|
|
|
|
$ |
46,191 |
|
|
$ |
20,145 |
|
|
|
|
|
|
Ending loans in repayment |
|
$ |
37,731 |
|
|
$ |
19,284 |
|
|
|
|
|
|
$ |
44,160 |
|
|
$ |
19,795 |
|
|
|
|
|
|
(1) |
In connection with the sale of approximately $1.6 billion of Private Education Loans in 2021. |
|
(2) |
Charge-offs are reported net of expected recoveries. For Private Education Loans, we charge off the estimated loss of a defaulted loan balance by charging off the entire defaulted loan balance and estimating recoveries on a pool basis. These estimated recoveries are referred to as “expected future recoveries on previously fully charged-off loans.” For FFELP Loans, the recovery is received at the time of charge-off. |
|
( 3 ) |
In third-quarter 2021, the portion of the loan amount charged off at default on our Private Education Loans increased from 81.4% to 81.7% and in third-quarter 2022, it increased from 81.7% to 81.9%. These changes resulted in a $30 million and $16 million reduction to the balance of the expected future recoveries on previously fully charged-off loans in third-quarter 2022 and third-quarter 2021, respectively. |
|
( 4 ) |
At the end of each month, for Private Education Loans that are 212 days past due, we charge off the estimated loss of a defaulted loan balance by charging off the entire loan balance and estimating recoveries on a pool basis. These estimated recoveries are referred to as “expected future recoveries on previously fully charged-off loans.” If actual periodic recoveries are less than expected, the difference is immediately reflected as a reduction to expected future recoveries on previously fully charged-off loans. If actual periodic recoveries are greater than expected, they will be reflected as a recovery through the allowance for Private Education Loan losses once the cumulative recovery amount exceeds the cumulative amount originally expected to be recovered. The following table summarizes the activity in the expected future recoveries on previously fully charged-off loans: |
|
|
|
Nine Months Ended September 30, |
|
|||||
|
(Dollars in millions) |
|
2022 |
|
|
2021 |
|
||
|
Beginning of period expected future recoveries on previously fully charged-off loans |
|
$ |
329 |
|
|
$ |
479 |
|
|
Expected future recoveries of current period defaults |
|
|
43 |
|
|
|
16 |
|
|
Recoveries (cash collected) |
|
|
(43 |
) |
|
|
(69 |
) |
|
Charge-offs (as a result of lower recovery expectations) |
|
|
(49 |
) |
|
|
(29 |
) |
|
End of period expected future recoveries on previously fully charged-off loans |
|
$ |
280 |
|
|
$ |
397 |
|
|
Change in balance during period |
|
$ |
(49 |
) |
|
$ |
(82 |
) |
|
( 5 ) |
For Private Education Loans, the item is a non-GAAP financial measure. For a description and reconciliation, see “Management’s Discussion and Analysis of Financial Condition and Results of Operations – Non-GAAP Financial Measures.” |
25
Liquidity and Capital Resources
Funding and Liquidity Risk Management
The following “Liquidity and Capital Resources” discussion concentrates primarily on our Federal Education Loans and Consumer Lending segments. Our Business Processing and Other segments require minimal liquidity and funding. See “Navient’s Response to COVID-19” for a discussion of COVID-19’s impact on liquidity and capital resources.
We define liquidity as cash and high-quality liquid assets that we can use to meet our cash requirements. Our two primary liquidity needs are: (1) servicing our debt and (2) our ongoing ability to meet our cash needs for running the operations of our businesses (including derivative collateral requirements) throughout market cycles, including during periods of financial stress. Secondary liquidity needs, which can be adjusted as needed, include the origination of Private Education Loans, acquisitions of Private Education Loan and FFELP Loan portfolios, acquisitions of companies, the payment of common stock dividends and the repurchase of our common stock. To achieve these objectives, we analyze and monitor our liquidity needs and maintain excess liquidity and access to diverse funding sources including the issuance of unsecured debt and the issuance of secured debt primarily through asset-backed securitizations and/or other financing facilities.
We define our liquidity risk as the potential inability to meet our obligations when they become due without incurring unacceptable losses or to invest in future asset growth and business operations at reasonable market rates. Our primary liquidity risk relates to our ability to service our debt, meet our other business obligations and to continue to grow our business. The ability to access the capital markets is impacted by general market and economic conditions, our credit ratings, as well as the overall availability of funding sources in the marketplace. In addition, credit ratings may be important to customers or counterparties when we compete in certain markets and when we seek to engage in certain transactions, including over-the-counter derivatives.
Credit ratings and outlooks are opinions subject to ongoing review by the rating agencies and may change, from time to time, based on our financial performance, industry and market dynamics and other factors. Other factors that influence our credit ratings include the rating agencies’ assessment of the general operating environment, our relative positions in the markets in which we compete, reputation, liquidity position, the level and volatility of earnings, corporate governance and risk management policies, capital position and capital management practices. A negative change in our credit rating could have a negative effect on our liquidity because it might raise the cost and availability of funding and potentially require additional cash collateral or restrict cash currently held as collateral on existing borrowings or derivative collateral arrangements. It is our objective to improve our credit ratings so that we can continue to efficiently access the capital markets even in difficult economic and market conditions. We have unsecured debt totaling $7.0 billion at September 30, 2022. Three credit rating agencies currently rate our long-term unsecured debt at below investment grade.
We expect to fund our ongoing liquidity needs, including the repayment of $1.3 billion of senior unsecured notes that mature in the short term (i.e., over the next 12 months) and the remaining $5.7 billion of senior unsecured notes that mature in the long term (from 2023 to 2043 with 80% maturing by 2029), through a number of sources. These sources include our cash on hand, unencumbered FFELP Loan and Private Education Refinance Loan portfolios (see “Sources of Primary Liquidity” below), the predictable operating cash flows provided by operating activities, the repayment of principal on unencumbered education loan assets, and the distribution of overcollateralization from our securitization trusts. We may also, depending on market conditions and availability, draw down on our secured FFELP Loan and Private Education Loan facilities, issue term ABS, enter into additional Private Education Loan ABS repurchase facilities, or issue additional unsecured debt .
We originate Private Education Loans (a portion of which are done through a forward purchase agreement). We also have purchased and may purchase, in future periods, Private Education Loan and FFELP Loan portfolios from third parties. Loan originations and purchases are part of our ongoing liquidity needs. We purchased 6.3 million shares of common stock for $95 million in the third quarter of 2022 and have $685 million of unused share repurchase authority as of September 30, 2022.
26
Sources of Primary Liquidity
|
|
|
|
|
|
|
|
|
|
|
|
|
|
|
(Dollars in millions) |
|
September 30, 2022 |
|
|
December 31, 2021 |
|
|
September 30, 2021 |
|
|||
|
Ending Balances: |
|
|
|
|
|
|
|
|
|
|
|
|
|
Total unrestricted cash and liquid investments |
|
$ |
1,364 |
|
|
$ |
905 |
|
|
$ |
1,050 |
|
|
Unencumbered FFELP Loans |
|
|
151 |
|
|
|
124 |
|
|
|
106 |
|
|
Unencumbered Private Education Refinance Loans |
|
|
270 |
|
|
|
383 |
|
|
|
520 |
|
|
Total |
|
$ |
1,785 |
|
|
$ |
1,412 |
|
|
$ |
1,676 |
|
|
|
|
Three Months Ended |
|
|
Nine Months Ended |
|
||||||||||||||
|
(Dollars in millions) |
|
September 30, 2022 |
|
|
December 31, 2021 |
|
|
September 30, 2021 |
|
|
September 30, 2022 |
|
|
September 30, 2021 |
|
|||||
|
Average Balances: |
|
|
|
|
|
|
|
|
|
|
|
|
|
|
|
|
|
|
|
|
|
Total unrestricted cash and liquid investments |
|
$ |
1,363 |
|
|
$ |
1,339 |
|
|
$ |
1,047 |
|
|
$ |
1,037 |
|
|
$ |
1,166 |
|
|
Unencumbered FFELP Loans |
|
|
123 |
|
|
|
119 |
|
|
|
296 |
|
|
|
172 |
|
|
|
297 |
|
|
Unencumbered Private Education Refinance Loans |
|
|
165 |
|
|
|
565 |
|
|
|
566 |
|
|
|
213 |
|
|
|
668 |
|
|
Total |
|
$ |
1,651 |
|
|
$ |
2,023 |
|
|
$ |
1,909 |
|
|
$ |
1,422 |
|
|
$ |
2,131 |
|
Sources of Additional Liquidity
Liquidity may also be available under our secured credit facilities. Maximum borrowing capacity under the FFELP Loan and Private Education Loan asset-backed commercial paper (ABCP) facilities will vary and be subject to each agreement’s borrowing conditions, including, among others, facility size, current usage and availability of qualifying collateral from unencumbered loans. The following tables detail the additional borrowing capacity of these facilities with maturity dates ranging from October 2022 to April 2024.
|
(Dollars in millions) |
|
September 30, 2022 |
|
|
December 31, 2021 |
|
|
September 30, 2021 |
|
|||
|
Ending Balances |
|
|
|
|
|
|
|
|
|
|
|
|
|
FFELP Loan ABCP facilities |
|
$ |
200 |
|
|
$ |
546 |
|
|
$ |
184 |
|
|
Private Education Loan ABCP facilities |
|
|
2,203 |
|
|
|
2,235 |
|
|
|
2,597 |
|
|
Total |
|
$ |
2,403 |
|
|
$ |
2,781 |
|
|
$ |
2,781 |
|
|
|
|
Three Months Ended |
|
|
Nine Months Ended |
|
||||||||||||||
|
(Dollars in millions) |
|
September 30, 2022 |
|
|
December 31, 2021 |
|
|
September 30, 2021 |
|
|
September 30, 2022 |
|
|
September 30, 2021 |
|
|||||
|
Average Balances |
|
|
|
|
|
|
|
|
|
|
|
|
|
|
|
|
|
|
|
|
|
FFELP Loan ABCP facilities |
|
$ |
190 |
|
|
$ |
441 |
|
|
$ |
385 |
|
|
$ |
404 |
|
|
$ |
538 |
|
|
Private Education Loan ABCP facilities |
|
|
2,186 |
|
|
|
2,419 |
|
|
|
2,143 |
|
|
|
2,147 |
|
|
|
2,328 |
|
|
Total |
|
$ |
2,376 |
|
|
$ |
2,860 |
|
|
$ |
2,528 |
|
|
$ |
2,551 |
|
|
$ |
2,866 |
|
At September 30, 2022, we had a total of $4.3 billion of unencumbered tangible assets inclusive of those listed in the table above as sources of primary liquidity. Total unencumbered education loans comprised $2.0 billion principal of our unencumbered tangible assets of which $1.8 billion and $151 million related to Private Education Loans and FFELP Loans, respectively. In addition, as of September 30, 2022, we had $5.1 billion of encumbered net assets (i.e., overcollateralization) in our various financing facilities (consolidated variable interest entities). Our secured financing facilities include Private Education Loan ABS Repurchase Facilities, which had $0.8 billion outstanding as of September 30, 2022. These repurchase facilities are collateralized by the net assets in previously issued Private Education Loan ABS trusts and have had a cost of funds lower than that of a new unsecured debt issuance.
27
The following table reconciles encumbered and unencumbered assets and their net impact on total Tangible Equity.
|
(Dollars in billions) |
|
September 30, 2022 |
|
|
December 31, 2021 |
|
||
|
Net assets of consolidated variable interest entities (encumbered assets) — FFELP Loans |
|
$ |
3.7 |
|
|
|
3.8 |
|
|
Net assets of consolidated variable interest entities (encumbered assets) — Private Education Loans |
|
|
1.4 |
|
|
|
1.7 |
|
|
Tangible unencumbered assets (1) |
|
|
4.3 |
|
|
|
4.5 |
|
|
Senior unsecured debt |
|
|
(7.0 |
) |
|
|
(7.0 |
) |
|
Mark-to-market on unsecured hedged debt (2) |
|
|
.3 |
|
|
|
(.3 |
) |
|
Other liabilities, net |
|
|
(.5 |
) |
|
|
(.8 |
) |
|
Total Tangible Equity (1) |
|
$ |
2.2 |
|
|
$ |
1.9 |
|
|
|
(1) |
Item is a non-GAAP financial measure. For a description and reconciliation, see “Non-GAAP Financial Measures.” |
|
|
(2) |
At September 30, 2022 and December 31, 2021, there were $(305) million and $324 million, respectively, of net gains (losses) on derivatives hedging this debt in unencumbered assets, which partially offset these gains (losses). |
Borrowings
Ending Balances
|
|
|
September 30, 2022 |
|
|
December 31, 2021 |
|
||||||||||||||||||
|
(Dollars in millions) |
|
Short Term |
|
|
Long Term |
|
|
Total |
|
|
Short Term |
|
|
Long Term |
|
|
Total |
|
||||||
|
Unsecured borrowings: |
|
|
|
|
|
|
|
|
|
|
|
|
|
|
|
|
|
|
|
|
|
|
|
|
|
Senior unsecured debt |
|
$ |
1,299 |
|
|
$ |
5,709 |
|
|
$ |
7,008 |
|
|
$ |
— |
|
|
$ |
7,014 |
|
|
$ |
7,014 |
|
|
Total unsecured borrowings |
|
|
1,299 |
|
|
|
5,709 |
|
|
|
7,008 |
|
|
|
— |
|
|
|
7,014 |
|
|
|
7,014 |
|
|
Secured borrowings: |
|
|
|
|
|
|
|
|
|
|
|
|
|
|
|
|
|
|
|
|
|
|
|
|
|
FFELP Loan securitizations |
|
|
83 |
|
|
|
45,358 |
|
|
|
45,441 |
|
|
|
— |
|
|
|
51,841 |
|
|
|
51,841 |
|
|
Private Education Loan securitizations |
|
|
813 |
|
|
|
13,300 |
|
|
|
14,113 |
|
|
|
543 |
|
|
|
14,074 |
|
|
|
14,617 |
|
|
FFELP Loan ABCP facilities |
|
|
974 |
|
|
|
291 |
|
|
|
1,265 |
|
|
|
282 |
|
|
|
150 |
|
|
|
432 |
|
|
Private Education Loan ABCP facilities |
|
|
2,418 |
|
|
|
— |
|
|
|
2,418 |
|
|
|
1,363 |
|
|
|
1,152 |
|
|
|
2,515 |
|
|
Other |
|
|
105 |
|
|
|
— |
|
|
|
105 |
|
|
|
302 |
|
|
|
— |
|
|
|
302 |
|
|
Total secured borrowings |
|
|
4,393 |
|
|
|
58,949 |
|
|
|
63,342 |
|
|
|
2,490 |
|
|
|
67,217 |
|
|
|
69,707 |
|
|
Core Earnings basis borrowings (1) |
|
|
5,692 |
|
|
|
64,658 |
|
|
|
70,350 |
|
|
|
2,490 |
|
|
|
74,231 |
|
|
|
76,721 |
|
|
Adjustment for GAAP accounting treatment |
|
|
(15 |
) |
|
|
(660 |
) |
|
|
(675 |
) |
|
|
— |
|
|
|
257 |
|
|
|
257 |
|
|
GAAP basis borrowings |
|
$ |
5,677 |
|
|
$ |
63,998 |
|
|
$ |
69,675 |
|
|
$ |
2,490 |
|
|
$ |
74,488 |
|
|
$ |
76,978 |
|
Average Balances
|
|
|
Three Months Ended September 30, |
|
|
Nine Months Ended September 30, |
|
||||||||||||||||||||||||||
|
|
|
2022 |
|
|
2021 |
|
|
2022 |
|
|
2021 |
|
||||||||||||||||||||
|
(Dollars in millions) |
|
Average Balance |
|
|
Average Rate |
|
|
Average Balance |
|
|
Average Rate |
|
|
Average Balance |
|
|
Average Rate |
|
|
Average Balance |
|
|
Average Rate |
|
||||||||
|
Unsecured borrowings: |
|
|
|
|
|
|
|
|
|
|
|
|
|
|
|
|
|
|
|
|
|
|
|
|
|
|
|
|
|
|
|
|
|
Senior unsecured debt |
|
$ |
7,007 |
|
|
|
6.08 |
% |
|
$ |
7,463 |
|
|
|
4.38 |
% |
|
$ |
7,010 |
|
|
|
5.07 |
% |
|
$ |
8,106 |
|
|
|
4.49 |
% |
|
Total unsecured borrowings |
|
|
7,007 |
|
|
|
6.08 |
|
|
|
7,463 |
|
|
|
4.38 |
|
|
|
7,010 |
|
|
|
5.07 |
|
|
|
8,106 |
|
|
|
4.49 |
|
|
Secured borrowings: |
|
|
|
|
|
|
|
|
|
|
|
|
|
|
|
|
|
|
|
|
|
|
|
|
|
|
|
|
|
|
|
|
|
FFELP Loan securitizations |
|
|
46,615 |
|
|
|
3.37 |
|
|
|
53,281 |
|
|
|
1.24 |
|
|
|
48,623 |
|
|
|
2.16 |
|
|
|
54,108 |
|
|
|
1.26 |
|
|
Private Education Loan securitizations |
|
|
14,298 |
|
|
|
2.70 |
|
|
|
14,007 |
|
|
|
2.34 |
|
|
|
14,401 |
|
|
|
2.47 |
|
|
|
14,167 |
|
|
|
2.46 |
|
|
FFELP Loan ABCP facilities |
|
|
1,222 |
|
|
|
3.43 |
|
|
|
772 |
|
|
|
1.27 |
|
|
|
899 |
|
|
|
2.58 |
|
|
|
1,168 |
|
|
|
1.50 |
|
|
Private Education Loan ABCP facilities |
|
|
2,460 |
|
|
|
3.90 |
|
|
|
2,704 |
|
|
|
1.64 |
|
|
|
2,543 |
|
|
|
2.73 |
|
|
|
2,451 |
|
|
|
1.89 |
|
|
Other |
|
|
142 |
|
|
|
2.68 |
|
|
|
311 |
|
|
|
.38 |
|
|
|
189 |
|
|
|
1.29 |
|
|
|
304 |
|
|
|
.33 |
|
|
Total secured borrowings |
|
|
64,737 |
|
|
|
3.24 |
|
|
|
71,075 |
|
|
|
1.47 |
|
|
|
66,655 |
|
|
|
2.26 |
|
|
|
72,198 |
|
|
|
1.52 |
|
|
Core Earnings basis borrowings (1) |
|
|
71,744 |
|
|
|
3.52 |
|
|
|
78,538 |
|
|
|
1.75 |
|
|
|
73,665 |
|
|
|
2.52 |
|
|
|
80,304 |
|
|
|
1.82 |
|
|
Adjustment for GAAP accounting treatment |
|
|
— |
|
|
|
.02 |
|
|
|
— |
|
|
|
(.10 |
) |
|
|
— |
|
|
|
(.16 |
) |
|
|
— |
|
|
|
(.16 |
) |
|
GAAP basis borrowings |
|
$ |
71,744 |
|
|
|
3.54 |
% |
|
$ |
78,538 |
|
|
|
1.65 |
% |
|
$ |
73,665 |
|
|
|
2.36 |
% |
|
$ |
80,304 |
|
|
|
1.66 |
% |
|
(1) |
Item is a non-GAAP financial measure. For a description and reconciliation, see “Non-GAAP Financial Measures.” The differences in derivative accounting give rise to the difference above. |
28
Critical Accounting Policies and Estimates
Management’s Discussion and Analysis of Financial Condition and Results of Operations addresses our consolidated financial statements, which have been prepared in accordance with generally accepted accounting principles in the United States of America (GAAP). A discussion of our critical accounting policies, which includes the allowance for loan losses, goodwill impairment assessment, and premium and discount amortization, can be found in our 2021 Form 10-K. In the third quarter of 2022, our critical accounting estimates considered the current and potential negative impact on the economy associated with the uncertainty in connection with historically high inflation and the increase in interest rates.
Impact of the Student Debt Relief (SDR) Plan on accounting policies and estimates
On August 24, 2022, the Biden-Harris Administration announced its Student Debt Relief (SDR) Plan that extends the repayment pause on ED held student loans through December 31, 2022 and provides up to $20,000 in one-time debt relief to income-qualified recipients with ED held student loans.
Following the initial announcement of the SDR Plan, ED provided more specific guidance on debt relief through its studentaid.gov website on September 29, 2022, which guidance was subsequently revised and published in the Federal Register on October 12, 2022. The studentaid.gov website currently provides the following guidance:
|
|
• |
All loans eligible for the student loan payment pause are also eligible for debt relief, including loans held by ED and guaranty agencies. |
|
|
• |
As of September 29, 2022, borrowers with federal student loans not held by ED cannot obtain one-time debt relief by consolidating those loans into Direct Loans. |
|
|
• |
Borrowers with FFEL Loans not held by ED who have applied to consolidate into the Direct Loan program prior to September 29, 2022, are eligible, subject to meeting the other terms and conditions. |
|
|
• |
ED is assessing whether there are alternative pathways to provide relief to borrowers with federal student loans not held by ED, including FFEL Program Loans and Perkins Loans. |
Based on this recent announcement, we estimate that borrowers holding approximately $600 million of the total $47 billion of FFELP Loans on our balance sheet as of September 30, 2022 have applied to have their loans consolidated with ED prior to the deadline established by the SDR Plan.
At this time, there is not a material impact on the Company’s accounting and related third-quarter results related to the SDR Plan as:
|
|
1. |
Privately held FFELP Loans themselves do not qualify for debt forgiveness, and |
|
|
2. |
FFELP borrowers had to apply to consolidate their loans into the Direct Loan program prior to September 29, 2022, to qualify for their loans to be forgiven. |
As a result, we do not expect there to be incremental consolidation activity in the future related to potential loan forgiveness under the SDR Plan. The Company’s current accounting policies and related estimates appropriately consider the impact of FFELP borrowers who applied to consolidate loans into the Direct Loan program in the third quarter, but the funding of such consolidations will not occur until after September 30, 2022.
If the SDR Plan was changed in the future to allow FFELP Loans to be directly forgiven and/or eliminates or alters the deadline for borrowers to apply to consolidate their FFELP Loans into the Direct Loan program to receive debt forgiveness, the impact to the Company would most likely be material due to increased prepayments on our FFELP Loan portfolio. Despite the significant uncertainty regarding the ultimate impact such SDR Plan changes may have to the Company, under GAAP, the Company would be required to calculate and account for its best estimate of the potential impact and record such estimate in its results. As it relates to estimating any potential impact to the Company, the Company does not have sufficient access to:
|
|
1. |
The income levels of its borrowers, which would determine the population of borrowers eligible for SDR |
|
|
2. |
Whether its borrowers have received a Pell Grant (which would determine the amount of potential debt forgiveness)
|
29
In addition to making estimates regarding these items, the Company would also have to estimate, amongst other items, the following:
|
|
1. |
The application rate of the eligible borrowers |
|
|
2. |
How the mix of FFELP vs. ED federal loans of a borrower will impact their need/willingness to consolidate (as balances on loans held by ED are forgiven first and may result in a borrower not needing to consolidate their FFELP Loan) |
|
|
3. |
The likelihood that an injunction, stay or other legal prohibition is issued with respect to the SDR Plan or the SDR Plan is terminated or amended due to a lawsuit |
These factors would result in significant subjectivity and uncertainty in any estimate recorded related to the potential impact, and, accordingly, actual results may differ significantly.
If the SDR Plan was changed in the future as discussed above, we anticipate that the principal components of the financial items whose recognition would be accelerated through net income as a result of materially increased loan consolidations and/or debt forgiveness would be the amortization of loan premiums and debt deferred financing fees through net interest income, which would reduce net income. These impacts would be partially offset by the benefit to net income from the release of the related allowance for loan losses through provision and revenue from the assessed but previously unrecognized fees that would be recognized in other income. The table below lists those items and their respective balances related to the FFELP Loans outstanding as of September 30, 2022:
|
(Dollars in millions) |
|
As of 9/30/22 |
|
|
|
Loan premium |
|
$ |
419 |
|
|
Debt deferred financing fees |
|
|
328 |
|
|
Allowance for loan borrower benefits |
|
|
(24 |
) |
|
Allowance for loan losses |
|
|
(234 |
) |
|
Assessed but previously unrecognized fees |
|
|
(122 |
) |
|
Servicing asset – off-balance sheet trusts |
|
|
2 |
|
|
Total net asset on balance sheet |
|
$ |
369 |
|
In addition, the Company had $232 million of goodwill related to the FFELP business on its balance sheet. The goodwill could be impaired depending on unforeseen changes to the SDR Plan resulting in potential material debt forgiveness or loan consolidation activity.
30
Non-GAAP Financial Measures
In addition to financial results reported on a GAAP basis, Navient also provides certain performance measures which are non-GAAP financial measures. We present the following non-GAAP financial measures: (1) Core Earnings (as well as Adjusted Core Earnings), (2) Tangible Equity (as well the Adjusted Tangible Equity Ratio and Pro forma Adjusted Tangible Equity Ratio), (3) EBITDA for the Business Processing segment, and (4) Allowance for Loan Losses Excluding Expected Future Recoveries on Previously Fully Charged-off Loans.
1. Core Earnings
We prepare financial statements and present financial results in accordance with GAAP. However, we also evaluate our business segments and present financial results on a basis that differs from GAAP. We refer to this different basis of presentation as Core Earnings. We provide this Core Earnings basis of presentation on a consolidated basis and for each business segment because this is what we review internally when making management decisions regarding our performance and how we allocate resources. We also refer to this information in our presentations with credit rating agencies, lenders and investors. Because our Core Earnings basis of presentation corresponds to our segment financial presentations, we are required by GAAP to provide certain Core Earnings disclosures in the notes to our consolidated financial statements for our business segments.
Core Earnings are not a substitute for reported results under GAAP. We use Core Earnings to manage our business segments because Core Earnings reflect adjustments to GAAP financial results for two items, discussed below, that can create significant volatility mostly due to timing factors generally beyond the control of management. Accordingly, we believe that Core Earnings provide management with a useful basis from which to better evaluate results from ongoing operations against the business plan or against results from prior periods. Consequently, we disclose this information because we believe it provides investors with additional information regarding the operational and performance indicators that are most closely assessed by management. When compared to GAAP results, the two items we remove to result in our Core Earnings presentations are:
|
|
(1) |
Mark-to-market gains/losses resulting from our use of derivative instruments to hedge our economic risks that do not qualify for hedge accounting treatment or do qualify for hedge accounting treatment but result in ineffectiveness; and |
|
|
(2) |
The accounting for goodwill and acquired intangible assets. |
While GAAP provides a uniform, comprehensive basis of accounting, for the reasons described above, our Core Earnings basis of presentation does not. Core Earnings are subject to certain general and specific limitations that investors should carefully consider. For example, there is no comprehensive, authoritative guidance for management reporting. Our Core Earnings are not defined terms within GAAP and may not be comparable to similarly titled measures reported by other companies. Accordingly, our Core Earnings presentation does not represent a comprehensive basis of accounting. Investors, therefore, may not be able to compare our performance with that of other financial services companies based upon Core Earnings. Core Earnings results are only meant to supplement GAAP results by providing additional information regarding the operational and performance indicators that are most closely used by management, our board of directors, credit rating agencies, lenders and investors to assess performance.
31
The following tables show Core Earnings for each reportable segment and our business as a whole along with the adjustments made to the income/expense items to reconcile the amounts to our reported GAAP results as required by GAAP and reported in “Note 12 — Segment Reporting.”
|
|
|
Three Months Ended September 30, 2022 |
|
|||||||||||||||||||||||||||||||||
|
|
|
|
|
|
|
|
|
|
|
|
|
|
|
|
|
|
|
|
|
|
|
Adjustments |
|
|
|
|
|
|||||||||
|
(Dollars in millions) |
|
Federal Education Loans |
|
|
Consumer Lending |
|
|
Business Processing |
|
|
Other |
|
|
Total Core Earnings |
|
|
Reclassi- fications |
|
|
Additions/ (Subtractions) |
|
|
Total Adjustments (1) |
|
|
Total GAAP |
|
|||||||||
|
Interest income: |
|
|
|
|
|
|
|
|
|
|
|
|
|
|
|
|
|
|
|
|
|
|
|
|
|
|
|
|
|
|
|
|
|
|
|
|
|
Education loans |
|
$ |
555 |
|
|
$ |
309 |
|
|
$ |
— |
|
|
$ |
— |
|
|
$ |
864 |
|
|
$ |
— |
|
|
$ |
(2 |
) |
|
$ |
(2 |
) |
|
$ |
862 |
|
|
Cash and investments |
|
|
9 |
|
|
|
3 |
|
|
|
— |
|
|
|
7 |
|
|
|
19 |
|
|
|
— |
|
|
|
— |
|
|
|
— |
|
|
|
19 |
|
|
Total interest income |
|
|
564 |
|
|
|
312 |
|
|
|
— |
|
|
|
7 |
|
|
|
883 |
|
|
|
— |
|
|
|
(2 |
) |
|
|
(2 |
) |
|
|
881 |
|
|
Total interest expense |
|
|
444 |
|
|
|
159 |
|
|
|
— |
|
|
|
33 |
|
|
|
636 |
|
|
|
(1 |
) |
|
|
6 |
|
|
|
5 |
|
|
|
641 |
|
|
Net interest income (loss) |
|
|
120 |
|
|
|
153 |
|
|
|
— |
|
|
|
(26 |
) |
|
|
247 |
|
|
|
1 |
|
|
|
(8 |
) |
|
|
(7 |
) |
|
|
240 |
|
|
Less: provisions for loan losses |
|
|
— |
|
|
|
28 |
|
|
|
— |
|
|
|
— |
|
|
|
28 |
|
|
|
— |
|
|
|
— |
|
|
|
— |
|
|
|
28 |
|
|
Net interest income (loss) after provisions for loan losses |
|
|
120 |
|
|
|
125 |
|
|
|
— |
|
|
|
(26 |
) |
|
|
219 |
|
|
|
1 |
|
|
|
(8 |
) |
|
|
(7 |
) |
|
|
212 |
|
|
Other income (loss): |
|
|
|
|
|
|
|
|
|
|
|
|
|
|
|
|
|
|
|
|
|
|
|
|
|
|
|
|
|
|
|
|
|
|
|
|
|
Servicing revenue |
|
|
21 |
|
|
|
3 |
|
|
|
— |
|
|
|
— |
|
|
|
24 |
|
|
|
— |
|
|
|
— |
|
|
|
— |
|
|
|
24 |
|
|
Asset recovery and business processing revenue |
|
|
1 |
|
|
|
— |
|
|
|
79 |
|
|
|
— |
|
|
|
80 |
|
|
|
— |
|
|
|
— |
|
|
|
— |
|
|
|
80 |
|
|
Other income (loss) |
|
|
6 |
|
|
|
— |
|
|
|
— |
|
|
|
— |
|
|
|
6 |
|
|
|
(1 |
) |
|
|
41 |
|
|
|
40 |
|
|
|
46 |
|
|
Total other income (loss) |
|
|
28 |
|
|
|
3 |
|
|
|
79 |
|
|
|
— |
|
|
|
110 |
|
|
|
(1 |
) |
|
|
41 |
|
|
|
40 |
|
|
|
150 |
|
|
Expenses: |
|
|
|
|
|
|
|
|
|
|
|
|
|
|
|
|
|
|
|
|
|
|
|
|
|
|
|
|
|
|
|
|
|
|
|
|
|
Direct operating expenses |
|
|
25 |
|
|
|
43 |
|
|
|
67 |
|
|
|
— |
|
|
|
135 |
|
|
|
— |
|
|
|
— |
|
|
|
— |
|
|
|
135 |
|
|
Unallocated shared services expenses |
|
|
— |
|
|
|
— |
|
|
|
— |
|
|
|
59 |
|
|
|
59 |
|
|
|
— |
|
|
|
— |
|
|
|
— |
|
|
|
59 |
|
|
Operating expenses |
|
|
25 |
|
|
|
43 |
|
|
|
67 |
|
|
|
59 |
|
|
|
194 |
|
|
|
— |
|
|
|
— |
|
|
|
— |
|
|
|
194 |
|
|
Goodwill and acquired intangible asset impairment and amortization |
|
|
— |
|
|
|
— |
|
|
|
— |
|
|
|
— |
|
|
|
— |
|
|
|
— |
|
|
|
10 |
|
|
|
10 |
|
|
|
10 |
|
|
Restructuring/other reorganization expenses |
|
|
— |
|
|
|
— |
|
|
|
— |
|
|
|
21 |
|
|
|
21 |
|
|
|
— |
|
|
|
— |
|
|
|
— |
|
|
|
21 |
|
|
Total expenses |
|
|
25 |
|
|
|
43 |
|
|
|
67 |
|
|
|
80 |
|
|
|
215 |
|
|
|
— |
|
|
|
10 |
|
|
|
10 |
|
|
|
225 |
|
|
Income (loss) before income tax expense (benefit) |
|
|
123 |
|
|
|
85 |
|
|
|
12 |
|
|
|
(106 |
) |
|
|
114 |
|
|
|
— |
|
|
|
23 |
|
|
|
23 |
|
|
|
137 |
|
|
Income tax expense (benefit) (2) |
|
|
29 |
|
|
|
20 |
|
|
|
3 |
|
|
|
(25 |
) |
|
|
27 |
|
|
|
— |
|
|
|
5 |
|
|
|
5 |
|
|
|
32 |
|
|
Net income (loss) |
|
$ |
94 |
|
|
$ |
65 |
|
|
$ |
9 |
|
|
$ |
(81 |
) |
|
$ |
87 |
|
|
$ |
— |
|
|
$ |
18 |
|
|
$ |
18 |
|
|
$ |
105 |
|
|
(1) |
Core Earnings adjustments to GAAP: |
|
|
|
Three Months Ended September 30, 2022 |
|
|||||||||
|
(Dollars in millions) |
|
Net Impact of Derivative Accounting |
|
|
Net Impact of Goodwill and Acquired Intangibles |
|
|
Total |
|
|||
|
Net interest income (loss) after provisions for loan losses |
|
$ |
(7 |
) |
|
$ |
— |
|
|
$ |
(7 |
) |
|
Total other income (loss) |
|
|
40 |
|
|
|
— |
|
|
|
40 |
|
|
Goodwill and acquired intangible asset impairment and amortization |
|
|
— |
|
|
|
10 |
|
|
|
10 |
|
|
Total Core Earnings adjustments to GAAP |
|
$ |
33 |
|
|
$ |
(10 |
) |
|
|
23 |
|
|
Income tax expense (benefit) |
|
|
|
|
|
|
|
|
|
|
5 |
|
|
Net income (loss) |
|
|
|
|
|
|
|
|
|
$ |
18 |
|
|
(2) |
Income taxes are based on a percentage of net income before tax for the individual reportable segment. |
32
|
|
|
Three Months Ended September 30, 2021 |
|
|||||||||||||||||||||||||||||||||
|
|
|
|
|
|
|
|
|
|
|
|
|
|
|
|
|
|
|
|
|
|
|
Adjustments |
|
|
|
|
|
|||||||||
|
(Dollars in millions) |
|
Federal Education Loans |
|
|
Consumer Lending |
|
|
Business Processing |
|
|
Other |
|
|
Total Core Earnings |
|
|
Reclassi- fications |
|
|
Additions/ (Subtractions) |
|
|
Total Adjustments (1) |
|
|
Total GAAP |
|
|||||||||
|
Interest income: |
|
|
|
|
|
|
|
|
|
|
|
|
|
|
|
|
|
|
|
|
|
|
|
|
|
|
|
|
|
|
|
|
|
|
|
|
|
Education loans |
|
$ |
353 |
|
|
$ |
291 |
|
|
$ |
— |
|
|
$ |
— |
|
|
$ |
644 |
|
|
$ |
25 |
|
|
$ |
(10 |
) |
|
$ |
15 |
|
|
$ |
659 |
|
|
Cash and investments |
|
|
— |
|
|
|
1 |
|
|
|
— |
|
|
|
— |
|
|
|
1 |
|
|
|
— |
|
|
|
— |
|
|
|
— |
|
|
|
1 |
|
|
Total interest income |
|
|
353 |
|
|
|
292 |
|
|
|
— |
|
|
|
— |
|
|
|
645 |
|
|
|
25 |
|
|
|
(10 |
) |
|
|
15 |
|
|
|
660 |
|
|
Total interest expense |
|
|
202 |
|
|
|
129 |
|
|
|
— |
|
|
|
15 |
|
|
|
346 |
|
|
|
(3 |
) |
|
|
(17 |
) |
|
|
(20 |
) |
|
|
326 |
|
|
Net interest income (loss) |
|
|
151 |
|
|
|
163 |
|
|
|
— |
|
|
|
(15 |
) |
|
|
299 |
|
|
|
28 |
|
|
|
7 |
|
|
|
35 |
|
|
|
334 |
|
|
Less: provisions for loan losses |
|
|
— |
|
|
|
22 |
|
|
|
— |
|
|
|
— |
|
|
|
22 |
|
|
|
— |
|
|
|
— |
|
|
|
— |
|
|
|
22 |
|
|
Net interest income (loss) after provisions for loan losses |
|
|
151 |
|
|
|
141 |
|
|
|
— |
|
|
|
(15 |
) |
|
|
277 |
|
|
|
28 |
|
|
|
7 |
|
|
|
35 |
|
|
|
312 |
|
|
Other income (loss): |
|
|
|
|
|
|
|
|
|
|
|
|
|
|
|
|
|
|
|
|
|
|
|
|
|
|
|
|
|
|
|
|
|
|
|
|
|
Servicing revenue |
|
|
47 |
|
|
|
— |
|
|
|
— |
|
|
|
— |
|
|
|
47 |
|
|
|
— |
|
|
|
— |
|
|
|
— |
|
|
|
47 |
|
|
Asset recovery and business processing revenue |
|
|
13 |
|
|
|
— |
|
|
|
122 |
|
|
|
— |
|
|
|
135 |
|
|
|
— |
|
|
|
— |
|
|
|
— |
|
|
|
135 |
|
|
Other income (loss) |
|
|
1 |
|
|
|
— |
|
|
|
— |
|
|
|
2 |
|
|
|
3 |
|
|
|
(28 |
) |
|
|
23 |
|
|
|
(5 |
) |
|
|
(2 |
) |
|
Losses on debt repurchases |
|
|
— |
|
|
|
— |
|
|
|
— |
|
|
|
(20 |
) |
|
|
(20 |
) |
|
|
— |
|
|
|
— |
|
|
|
— |
|
|
|
(20 |
) |
|
Total other income (loss) |
|
|
61 |
|
|
|
— |
|
|
|
122 |
|
|
|
(18 |
) |
|
|
165 |
|
|
|
(28 |
) |
|
|
23 |
|
|
|
(5 |
) |
|
|
160 |
|
|
Expenses: |
|
|
|
|
|
|
|
|
|
|
|
|
|
|
|
|
|
|
|
|
|
|
|
|
|
|
|
|
|
|
|
|
|
|
|
|
|
Direct operating expenses |
|
|
53 |
|
|
|
45 |
|
|
|
87 |
|
|
|
— |
|
|
|
185 |
|
|
|
— |
|
|
|
— |
|
|
|
— |
|
|
|
185 |
|
|
Unallocated shared services expenses |
|
|
— |
|
|
|
— |
|
|
|
— |
|
|
|
63 |
|
|
|
63 |
|
|
|
— |
|
|
|
— |
|
|
|
— |
|
|
|
63 |
|
|
Operating expenses |
|
|
53 |
|
|
|
45 |
|
|
|
87 |
|
|
|
63 |
|
|
|
248 |
|
|
|
— |
|
|
|
— |
|
|
|
— |
|
|
|
248 |
|
|
Goodwill and acquired intangible asset impairment and amortization |
|
|
— |
|
|
|
— |
|
|
|
— |
|
|
|
— |
|
|
|
— |
|
|
|
— |
|
|
|
4 |
|
|
|
4 |
|
|
|
4 |
|
|
Restructuring/other reorganization expenses |
|
|
— |
|
|
|
— |
|
|
|
— |
|
|
|
— |
|
|
|
— |
|
|
|
— |
|
|
|
— |
|
|
|
— |
|
|
|
— |
|
|
Total expenses |
|
|
53 |
|
|
|
45 |
|
|
|
87 |
|
|
|
63 |
|
|
|
248 |
|
|
|
— |
|
|
|
4 |
|
|
|
4 |
|
|
|
252 |
|
|
Income (loss) before income tax expense (benefit) |
|
|
159 |
|
|
|
96 |
|
|
|
35 |
|
|
|
(96 |
) |
|
|
194 |
|
|
|
— |
|
|
|
26 |
|
|
|
26 |
|
|
|
220 |
|
|
Income tax expense (benefit) (2) |
|
|
37 |
|
|
|
23 |
|
|
|
8 |
|
|
|
(23 |
) |
|
|
45 |
|
|
|
— |
|
|
|
2 |
|
|
|
2 |
|
|
|
47 |
|
|
Net income (loss) |
|
$ |
122 |
|
|
$ |
73 |
|
|
$ |
27 |
|
|
$ |
(73 |
) |
|
$ |
149 |
|
|
$ |
— |
|
|
$ |
24 |
|
|
$ |
24 |
|
|
$ |
173 |
|
|
|
|
|
|
|
|
|
|
|
|
|
|
|
|
|
|
|
|
|
|
|
|
|
|
|
|
|
|
|
|
|
|
|
|
|
|
|
|
(1) |
Core Earnings adjustments to GAAP: |
|
|
|
Three Months Ended September 30, 2021 |
|
|||||||||
|
(Dollars in millions) |
|
Net Impact of Derivative Accounting |
|
|
Net Impact of Goodwill and Acquired Intangibles |
|
|
Total |
|
|||
|
Net interest income (loss) after provisions for loan losses |
|
$ |
35 |
|
|
$ |
— |
|
|
$ |
35 |
|
|
Total other income (loss) |
|
|
(5 |
) |
|
|
— |
|
|
|
(5 |
) |
|
Goodwill and acquired intangible asset impairment and amortization |
|
|
— |
|
|
|
4 |
|
|
|
4 |
|
|
Total Core Earnings adjustments to GAAP |
|
$ |
30 |
|
|
$ |
(4 |
) |
|
|
26 |
|
|
Income tax expense (benefit) |
|
|
|
|
|
|
|
|
|
|
2 |
|
|
Net income (loss) |
|
|
|
|
|
|
|
|
|
$ |
24 |
|
|
(2) |
Income taxes are based on a percentage of net income before tax for the individual reportable segment. |
33
|
|
|
Nine Months Ended September 30, 2022 |
|
|||||||||||||||||||||||||||||||||
|
|
|
|
|
|
|
|
|
|
|
|
|
|
|
|
|
|
|
|
|
|
|
Adjustments |
|
|
|
|
|
|||||||||
|
(Dollars in millions) |
|
Federal Education Loans |
|
|
Consumer Lending |
|
|
Business Processing |
|
|
Other |
|
|
Total Core Earnings |
|
|
Reclassi- fications |
|
|
Additions/ (Subtractions) |
|
|
Total Adjustments (1) |
|
|
Total GAAP |
|
|||||||||
|
Interest income: |
|
|
|
|
|
|
|
|
|
|
|
|
|
|
|
|
|
|
|
|
|
|
|
|
|
|
|
|
|
|
|
|
|
|
|
|
|
Education loans |
|
$ |
1,298 |
|
|
$ |
862 |
|
|
$ |
— |
|
|
$ |
— |
|
|
$ |
2,160 |
|
|
$ |
23 |
|
|
$ |
(9 |
) |
|
$ |
14 |
|
|
$ |
2,174 |
|
|
Cash and investments |
|
|
12 |
|
|
|
5 |
|
|
|
— |
|
|
|
8 |
|
|
|
25 |
|
|
|
— |
|
|
|
— |
|
|
|
— |
|
|
|
25 |
|
|
Total interest income |
|
|
1,310 |
|
|
|
867 |
|
|
|
— |
|
|
|
8 |
|
|
|
2,185 |
|
|
|
23 |
|
|
|
(9 |
) |
|
|
14 |
|
|
|
2,199 |
|
|
Total interest expense |
|
|
905 |
|
|
|
421 |
|
|
|
— |
|
|
|
65 |
|
|
|
1,391 |
|
|
|
3 |
|
|
|
(93 |
) |
|
|
(90 |
) |
|
|
1,301 |
|
|
Net interest income (loss) |
|
|
405 |
|
|
|
446 |
|
|
|
— |
|
|
|
(57 |
) |
|
|
794 |
|
|
|
20 |
|
|
|
84 |
|
|
|
104 |
|
|
|
898 |
|
|
Less: provisions for loan losses |
|
|
— |
|
|
|
62 |
|
|
|
— |
|
|
|
— |
|
|
|
62 |
|
|
|
— |
|
|
|
— |
|
|
|
— |
|
|
|
62 |
|
|
Net interest income (loss) after provisions for loan losses |
|
|
405 |
|
|
|
384 |
|
|
|
— |
|
|
|
(57 |
) |
|
|
732 |
|
|
|
20 |
|
|
|
84 |
|
|
|
104 |
|
|
|
836 |
|
|
Other income (loss): |
|
|
|
|
|
|
|
|
|
|
|
|
|
|
|
|
|
|
|
|
|
|
|
|
|
|
|
|
|
|
|
|
|
|
|
|
|
Servicing revenue |
|
|
51 |
|
|
|
9 |
|
|
|
— |
|
|
|
— |
|
|
|
60 |
|
|
|
— |
|
|
|
— |
|
|
|
— |
|
|
|
60 |
|
|
Asset recovery and business processing revenue |
|
|
4 |
|
|
|
— |
|
|
|
260 |
|
|
|
— |
|
|
|
264 |
|
|
|
— |
|
|
|
— |
|
|
|
— |
|
|
|
264 |
|
|
Other income (loss) |
|
|
24 |
|
|
|
1 |
|
|
|
— |
|
|
|
(3 |
) |
|
|
22 |
|
|
|
(20 |
) |
|
|
181 |
|
|
|
161 |
|
|
|
183 |
|
|
Total other income (loss) |
|
|
79 |
|
|
|
10 |
|
|
|
260 |
|
|
|
(3 |
) |
|
|
346 |
|
|
|
(20 |
) |
|
|
181 |
|
|
|
161 |
|
|
|
507 |
|
|
Expenses: |
|
|
|
|
|
|
|
|
|
|
|
|
|
|
|
|
|
|
|
|
|
|
|
|
|
|
|
|
|
|
|
|
|
|
|
|
|
Direct operating expenses |
|
|
79 |
|
|
|
113 |
|
|
|
216 |
|
|
|
— |
|
|
|
408 |
|
|
|
— |
|
|
|
— |
|
|
|
— |
|
|
|
408 |
|
|
Unallocated shared services expenses |
|
|
— |
|
|
|
— |
|
|
|
— |
|
|
|
180 |
|
|
|
180 |
|
|
|
— |
|
|
|
— |
|
|
|
— |
|
|
|
180 |
|
|
Operating expenses |
|
|
79 |
|
|
|
113 |
|
|
|
216 |
|
|
|
180 |
|
|
|
588 |
|
|
|
— |
|
|
|
— |
|
|
|
— |
|
|
|
588 |
|
|
Goodwill and acquired intangible asset impairment and amortization |
|
|
— |
|
|
|
— |
|
|
|
— |
|
|
|
— |
|
|
|
— |
|
|
|
— |
|
|
|
17 |
|
|
|
17 |
|
|
|
17 |
|
|
Restructuring/other reorganization expenses |
|
|
— |
|
|
|
— |
|
|
|
— |
|
|
|
25 |
|
|
|
25 |
|
|
|
— |
|
|
|
— |
|
|
|
— |
|
|
|
25 |
|
|
Total expenses |
|
|
79 |
|
|
|
113 |
|
|
|
216 |
|
|
|
205 |
|
|
|
613 |
|
|
|
— |
|
|
|
17 |
|
|
|
17 |
|
|
|
630 |
|
|
Income (loss) before income tax expense (benefit) |
|
|
405 |
|
|
|
281 |
|
|
|
44 |
|
|
|
(265 |
) |
|
|
465 |
|
|
|
— |
|
|
|
248 |
|
|
|
248 |
|
|
|
713 |
|
|
Income tax expense (benefit) (2) |
|
|
95 |
|
|
|
66 |
|
|
|
11 |
|
|
|
(63 |
) |
|
|
109 |
|
|
|
— |
|
|
|
64 |
|
|
|
64 |
|
|
|
173 |
|
|
Net income (loss) |
|
$ |
310 |
|
|
$ |
215 |
|
|
$ |
33 |
|
|
$ |
(202 |
) |
|
$ |
356 |
|
|
$ |
— |
|
|
$ |
184 |
|
|
$ |
184 |
|
|
$ |
540 |
|
|
(1) |
Core Earnings adjustments to GAAP: |
|
|
|
Nine Months Ended September 30, 2022 |
|
|||||||||
|
(Dollars in millions) |
|
Net Impact of Derivative Accounting |
|
|
Net Impact of Goodwill and Acquired Intangibles |
|
|
Total |
|
|||
|
Net interest income (loss) after provisions for loan losses |
|
$ |
104 |
|
|
$ |
— |
|
|
$ |
104 |
|
|
Total other income (loss) |
|
|
161 |
|
|
|
— |
|
|
|
161 |
|
|
Goodwill and acquired intangible asset impairment and amortization |
|
|
— |
|
|
|
17 |
|
|
|
17 |
|
|
Total Core Earnings adjustments to GAAP |
|
$ |
265 |
|
|
$ |
(17 |
) |
|
|
248 |
|
|
Income tax expense (benefit) |
|
|
|
|
|
|
|
|
|
|
64 |
|
|
Net income (loss) |
|
|
|
|
|
|
|
|
|
$ |
184 |
|
|
(2) |
Income taxes are based on a percentage of net income before tax for the individual reportable segment. |
34
|
|
|
Nine Months Ended September 30, 2021 |
|
|||||||||||||||||||||||||||||||||
|
|
|
|
|
|
|
|
|
|
|
|
|
|
|
|
|
|
|
|
|
|
|
Adjustments |
|
|
|
|
|
|||||||||
|
(Dollars in millions) |
|
Federal Education Loans |
|
|
Consumer Lending |
|
|
Business Processing |
|
|
Other |
|
|
Total Core Earnings |
|
|
Reclassi- fications |
|
|
Additions/ (Subtractions) |
|
|
Total Adjustments (1) |
|
|
Total GAAP |
|
|||||||||
|
Interest income: |
|
|
|
|
|
|
|
|
|
|
|
|
|
|
|
|
|
|
|
|
|
|
|
|
|
|
|
|
|
|
|
|
|
|
|
|
|
Education loans |
|
$ |
1,062 |
|
|
$ |
905 |
|
|
$ |
— |
|
|
$ |
— |
|
|
$ |
1,967 |
|
|
$ |
73 |
|
|
$ |
(29 |
) |
|
$ |
44 |
|
|
$ |
2,011 |
|
|
Cash and investments |
|
|
— |
|
|
|
1 |
|
|
|
— |
|
|
|
1 |
|
|
|
2 |
|
|
|
— |
|
|
|
— |
|
|
|
— |
|
|
|
2 |
|
|
Total interest income |
|
|
1,062 |
|
|
|
906 |
|
|
|
— |
|
|
|
1 |
|
|
|
1,969 |
|
|
|
73 |
|
|
|
(29 |
) |
|
|
44 |
|
|
|
2,013 |
|
|
Total interest expense |
|
|
627 |
|
|
|
416 |
|
|
|
— |
|
|
|
51 |
|
|
|
1,094 |
|
|
|
(6 |
) |
|
|
(93 |
) |
|
|
(99 |
) |
|
|
995 |
|
|
Net interest income (loss) |
|
|
435 |
|
|
|
490 |
|
|
|
— |
|
|
|
(50 |
) |
|
|
875 |
|
|
|
79 |
|
|
|
64 |
|
|
|
143 |
|
|
|
1,018 |
|
|
Less: provisions for loan losses |
|
|
— |
|
|
|
(66 |
) |
|
|
— |
|
|
|
— |
|
|
|
(66 |
) |
|
|
— |
|
|
|
— |
|
|
|
— |
|
|
|
(66 |
) |
|
Net interest income (loss) after provisions for loan losses |
|
|
435 |
|
|
|
556 |
|
|
|
— |
|
|
|
(50 |
) |
|
|
941 |
|
|
|
79 |
|
|
|
64 |
|
|
|
143 |
|
|
|
1,084 |
|
|
Other income (loss): |
|
|
|
|
|
|
|
|
|
|
|
|
|
|
|
|
|
|
|
|
|
|
|
|
|
|
|
|
|
|
|
|
|
|
|
|
|
Servicing revenue |
|
|
146 |
|
|
|
3 |
|
|
|
— |
|
|
|
— |
|
|
|
149 |
|
|
|
— |
|
|
|
— |
|
|
|
— |
|
|
|
149 |
|
|
Asset recovery and business processing revenue |
|
|
39 |
|
|
|
— |
|
|
|
377 |
|
|
|
— |
|
|
|
416 |
|
|
|
— |
|
|
|
— |
|
|
|
— |
|
|
|
416 |
|
|
Other income (loss) |
|
|
3 |
|
|
|
1 |
|
|
|
— |
|
|
|
5 |
|
|
|
9 |
|
|
|
(66 |
) |
|
|
87 |
|
|
|
21 |
|
|
|
30 |
|
|
Gains on sales of loans |
|
|
— |
|
|
|
91 |
|
|
|
— |
|
|
|
— |
|
|
|
91 |
|
|
|
(13 |
) |
|
|
— |
|
|
|
(13 |
) |
|
|
78 |
|
|
Losses on debt repurchases |
|
|
— |
|
|
|
— |
|
|
|
— |
|
|
|
(32 |
) |
|
|
(32 |
) |
|
|
— |
|
|
|
— |
|
|
|
— |
|
|
|
(32 |
) |
|
Total other income (loss) |
|
|
188 |
|
|
|
95 |
|
|
|
377 |
|
|
|
(27 |
) |
|
|
633 |
|
|
|
(79 |
) |
|
|
87 |
|
|
|
8 |
|
|
|
641 |
|
|
Expenses: |
|
|
|
|
|
|
|
|
|
|
|
|
|
|
|
|
|
|
|
|
|
|
|
|
|
|
|
|
|
|
|
|
|
|
|
|
|
Direct operating expenses |
|
|
170 |
|
|
|
124 |
|
|
|
270 |
|
|
|
— |
|
|
|
564 |
|
|
|
— |
|
|
|
— |
|
|
|
— |
|
|
|
564 |
|
|
Unallocated shared services expenses |
|
|
— |
|
|
|
— |
|
|
|
— |
|
|
|
194 |
|
|
|
194 |
|
|
|
— |
|
|
|
— |
|
|
|
— |
|
|
|
194 |
|
|
Operating expenses |
|
|
170 |
|
|
|
124 |
|
|
|
270 |
|
|
|
194 |
|
|
|
758 |
|
|
|
— |
|
|
|
— |
|
|
|
— |
|
|
|
758 |
|
|
Goodwill and acquired intangible asset impairment and amortization |
|
|
— |
|
|
|
— |
|
|
|
— |
|
|
|
— |
|
|
|
— |
|
|
|
— |
|
|
|
14 |
|
|
|
14 |
|
|
|
14 |
|
|
Restructuring/other reorganization expenses |
|
|
— |
|
|
|
— |
|
|
|
— |
|
|
|
8 |
|
|
|
8 |
|
|
|
— |
|
|
|
— |
|
|
|
— |
|
|
|
8 |
|
|
Total expenses |
|
|
170 |
|
|
|
124 |
|
|
|
270 |
|
|
|
202 |
|
|
|
766 |
|
|
|
— |
|
|
|
14 |
|
|
|
14 |
|
|
|
780 |
|
|
Income (loss) before income tax expense (benefit) |
|
|
453 |
|
|
|
527 |
|
|
|
107 |
|
|
|
(279 |
) |
|
|
808 |
|
|
|
— |
|
|
|
137 |
|
|
|
137 |
|
|
|
945 |
|
|
Income tax expense (benefit) (2) |
|
|
107 |
|
|
|
123 |
|
|
|
25 |
|
|
|
(65 |
) |
|
|
190 |
|
|
|
— |
|
|
|
27 |
|
|
|
27 |
|
|
|
217 |
|
|
Net income (loss) |
|
$ |
346 |
|
|
$ |
404 |
|
|
$ |
82 |
|
|
$ |
(214 |
) |
|
$ |
618 |
|
|
$ |
— |
|
|
$ |
110 |
|
|
$ |
110 |
|
|
$ |
728 |
|
|
(1) |
Core Earnings adjustments to GAAP: |
|
|
|
Nine Months Ended September 30, 2021 |
|
|||||||||
|
(Dollars in millions) |
|
Net Impact of Derivative Accounting |
|
|
Net Impact of Goodwill and Acquired Intangibles |
|
|
Total |
|
|||
|
Net interest income (loss) after provisions for loan losses |
|
$ |
143 |
|
|
$ |
— |
|
|
$ |
143 |
|
|
Total other income (loss) |
|
|
8 |
|
|
|
— |
|
|
|
8 |
|
|
Goodwill and acquired intangible asset impairment and amortization |
|
|
— |
|
|
|
14 |
|
|
|
14 |
|
|
Total Core Earnings adjustments to GAAP |
|
$ |
151 |
|
|
$ |
(14 |
) |
|
|
137 |
|
|
Income tax expense (benefit) |
|
|
|
|
|
|
|
|
|
|
27 |
|
|
Net income (loss) |
|
|
|
|
|
|
|
|
|
$ |
110 |
|
|
(2) |
Income taxes are based on a percentage of net income before tax for the individual reportable segment. |
35
The following discussion summarizes the differences between Core Earnings and GAAP net income and details each specific adjustment required to reconcile our Core Earnings segment presentation to our GAAP earnings.
|
|
|
Three Months Ended September 30, |
|
|
Nine Months Ended September 30, |
|
||||||||||
|
(Dollars in millions) |
|
2022 |
|
|
2021 |
|
|
2022 |
|
|
2021 |
|
||||
|
Core Earnings net income |
|
$ |
87 |
|
|
$ |
149 |
|
|
$ |
356 |
|
|
$ |
618 |
|
|
Core Earnings adjustments to GAAP: |
|
|
|
|
|
|
|
|
|
|
|
|
|
|
|
|
|
Net impact of derivative accounting |
|
|
33 |
|
|
|
30 |
|
|
|
265 |
|
|
|
151 |
|
|
Net impact of goodwill and acquired intangible assets |
|
|
(10 |
) |
|
|
(4 |
) |
|
|
(17 |
) |
|
|
(14 |
) |
|
Net income tax effect |
|
|
(5 |
) |
|
|
(2 |
) |
|
|
(64 |
) |
|
|
(27 |
) |
|
Total Core Earnings adjustments to GAAP |
|
|
18 |
|
|
|
24 |
|
|
|
184 |
|
|
|
110 |
|
|
GAAP net income |
|
$ |
105 |
|
|
$ |
173 |
|
|
$ |
540 |
|
|
$ |
728 |
|
|
|
|
|
|
|
|
|
|
|
|
|
|
|
|
|
|
|
(1) Derivative Accounting: Core Earnings exclude periodic gains and losses that are caused by the mark-to-market valuations on derivatives that do not qualify for hedge accounting treatment under GAAP, as well as the periodic mark-to-market gains and losses that are a result of ineffectiveness recognized related to effective hedges under GAAP. Under GAAP, for our derivatives that are held to maturity, the mark-to-market gain or loss over the life of the contract will equal $0 except for Floor Income Contracts, where the mark-to-market gain will equal the amount for which we originally sold the contract. In our Core Earnings presentation, we recognize the economic effect of these hedges, which generally results in any net settlement cash paid or received being recognized ratably as an interest expense or revenue over the hedged item’s life.
The accounting for derivatives requires that changes in the fair value of derivative instruments be recognized currently in earnings, with no fair value adjustment of the hedged item, unless specific hedge accounting criteria are met. The gains and losses recorded in “Gains (losses) on derivative and hedging activities, net” and interest expense (for qualifying fair value hedges) are primarily caused by interest rate and foreign currency exchange rate volatility and changing credit spreads during the period as well as the volume and term of derivatives not receiving hedge accounting treatment. We believe that our derivatives are effective economic hedges, and as such, are a critical element of our interest rate and foreign currency risk management strategy. However, some of our derivatives, primarily Floor Income Contracts, basis swaps and at times, certain other LIBOR swaps do not qualify for hedge accounting treatment and the stand-alone derivative is adjusted to fair value in the income statement with no consideration for the corresponding change in fair value of the hedged item.
Our Floor Income Contracts are written options that must meet more stringent requirements than other hedging relationships to achieve hedge effectiveness. Specifically, our Floor Income Contracts do not qualify for hedge accounting treatment because the pay down of principal of the education loans underlying the Floor Income embedded in those education loans does not exactly match the change in the notional amount of our written Floor Income Contracts. Additionally, the term, the interest rate index, and the interest rate index reset frequency of the Floor Income Contract can be different than that of the education loans. Under derivative accounting treatment, the upfront contractual payment is deemed a liability and changes in fair value are recorded through income throughout the life of the contract. The change in the fair value of Floor Income Contracts is primarily caused by changing interest rates that cause the amount of Floor Income paid to the counterparties to vary. This is economically offset by the change in the amount of Floor Income earned on the underlying education loans but that offsetting change in fair value is not recognized. We believe the Floor Income Contracts are economic hedges because they effectively fix the amount of Floor Income earned over the contract period, thus eliminating the timing and uncertainty that changes in interest rates can have on Floor Income for that period. Therefore, for purposes of Core Earnings, we have removed the mark-to-market gains and losses related to these contracts and added back the amortization of the net contractual premiums received on the Floor Income Contracts. The amortization of the net contractual premiums received on the Floor Income Contracts for Core Earnings is reflected in education loan interest income. Under GAAP accounting, the premiums received on the Floor Income Contracts are recorded as revenue in the “gains (losses) on derivative and hedging activities, net” line item by the end of the contracts’ lives.
36
Basis swaps are used to convert floating rate debt from one floating interest rate index to another to better match the interest rate characteristics of the assets financed by that debt. We primarily use basis swaps to hedge our education loan assets that are primarily indexed to LIBOR or Prime. The accounting for derivatives requires that when using basis swaps, the change in the cash flows of the hedge effectively offset both the change in the cash flows of the asset and the change in the cash flows of the liability. Our basis swaps hedge variable interest rate risk; however, they generally do not meet this effectiveness test because the index of the swap does not exactly match the index of the hedged assets as required for hedge accounting treatment. Additionally, some of our FFELP Loans can earn at either a variable or a fixed interest rate depending on market interest rates and therefore swaps economically hedging these FFELP Loans do not meet the criteria for hedge accounting treatment. As a result, under GAAP, these swaps are recorded at fair value with changes in fair value reflected currently in the income statement.
The table below quantifies the adjustments for derivative accounting between GAAP and Core Earnings net income.
|
|
|
Three Months Ended September 30, |
|
|
Nine Months Ended September 30, |
|
||||||||||
|
(Dollars in millions) |
|
2022 |
|
|
2021 |
|
|
2022 |
|
|
2021 |
|
||||
|
Core Earnings derivative adjustments: |
|
|
|
|
|
|
|
|
|
|
|
|
|
|
|
|
|
Gains (losses) on derivative and hedging activities, net, included in other income |
|
$ |
40 |
|
|
$ |
(5 |
) |
|
$ |
161 |
|
|
$ |
21 |
|
|
Plus: Gains (losses) on fair value hedging activity included in interest expense |
|
|
(6 |
) |
|
|
10 |
|
|
|
85 |
|
|
|
71 |
|
|
Total gains (losses) in GAAP net income |
|
|
34 |
|
|
|
5 |
|
|
|
246 |
|
|
|
92 |
|
|
Plus: Reclassification of settlement expense (income) on derivative and hedging activities, net (1) |
|
|
1 |
|
|
|
28 |
|
|
|
20 |
|
|
|
66 |
|
|
Mark-to-market gains (losses) on derivative and hedging activities, net (2) |
|
|
35 |
|
|
|
33 |
|
|
|
266 |
|
|
|
158 |
|
|
Amortization of net premiums on Floor Income Contracts in net interest income for Core Earnings |
|
|
(2 |
) |
|
|
(10 |
) |
|
|
(9 |
) |
|
|
(30 |
) |
|
Other derivative accounting adjustments (3) |
|
|
— |
|
|
|
7 |
|
|
|
8 |
|
|
|
23 |
|
|
Total net impact of derivative accounting |
|
$ |
33 |
|
|
$ |
30 |
|
|
$ |
265 |
|
|
$ |
151 |
|
|
(1) |
Derivative accounting requires net settlement income/expense on derivatives that do not qualify as hedges to be recorded in a separate income statement line item below net interest income. Under our Core Earnings presentation, these settlements are reclassified to the income statement line item of the economically hedged item. For our Core Earnings net interest income, this would primarily include (a) reclassifying the net settlement amounts related to our Floor Income Contracts to education loan interest income and (b) reclassifying the net settlement amounts related to certain of our interest rate swaps to debt interest expense. The table below summarizes these net settlements on derivative and hedging activities and the associated reclassification on a Core Earnings basis. |
|
|
|
Three Months Ended September 30, |
|
|
Nine Months Ended September 30, |
|
||||||||||
|
(Dollars in millions) |
|
2022 |
|
|
2021 |
|
|
2022 |
|
|
2021 |
|
||||
|
Reclassification of settlements on derivative and hedging activities: |
|
|
|
|
|
|
|
|
|
|
|
|
|
|
|
|
|
Net settlement expense on Floor Income Contracts reclassified to net interest income |
|
$ |
— |
|
|
$ |
(25 |
) |
|
$ |
(23 |
) |
|
$ |
(73 |
) |
|
Net settlement income (expense) on interest rate swaps reclassified to net interest income |
|
|
(1 |
) |
|
|
(3 |
) |
|
|
3 |
|
|
|
(6 |
) |
|
Net realized gains (losses) on terminated derivative contracts reclassified to other income |
|
|
— |
|
|
|
— |
|
|
|
— |
|
|
|
13 |
|
|
Total reclassifications of settlements on derivative and hedging activities |
|
$ |
(1 |
) |
|
$ |
(28 |
) |
|
$ |
(20 |
) |
|
$ |
(66 |
) |
|
|
|
|
|
|
|
|
|
|
|
|
|
|
|
|
|
|
|
(2) |
“Mark-to-market gains (losses) on derivative and hedging activities, net” is comprised of the following: |
|
|
|
Three Months Ended September 30, |
|
|
Nine Months Ended September 30, |
|
||||||||||
|
(Dollars in millions) |
|
2022 |
|
|
2021 |
|
|
2022 |
|
|
2021 |
|
||||
|
Floor Income Contracts |
|
$ |
— |
|
|
$ |
23 |
|
|
$ |
65 |
|
|
$ |
81 |
|
|
Basis swaps |
|
|
(3 |
) |
|
|
1 |
|
|
|
(6 |
) |
|
|
5 |
|
|
Foreign currency hedges |
|
|
(23 |
) |
|
|
3 |
|
|
|
34 |
|
|
|
48 |
|
|
Other |
|
|
61 |
|
|
|
6 |
|
|
|
173 |
|
|
|
24 |
|
|
Total mark-to-market gains (losses) on derivative and hedging activities, net |
|
$ |
35 |
|
|
$ |
33 |
|
|
$ |
266 |
|
|
$ |
158 |
|
|
(3) |
Other derivative accounting adjustments consist of adjustments related to: (1) foreign currency denominated debt that is adjusted to spot foreign exchange rates for GAAP where such adjustments are reversed for Core Earnings and (2) certain terminated derivatives that did not receive hedge accounting treatment under GAAP but were economic hedges under Core Earnings and, as a result, such gains or losses are amortized into Core Earnings over the life of the hedged item. |
37
Cumulative Impact of Derivative Accounting under GAAP compared to Core Earnings
As of September 30, 2022, derivative accounting has increased GAAP equity by approximately $118 million as a result of cumulative net mark-to-market losses (after tax) recognized under GAAP, but not in Core Earnings. The following table rolls forward the cumulative impact to GAAP equity due to these after-tax mark-to-market net gains and losses related to derivative accounting.
|
|
|
Three Months Ended September 30, |
|
|
Nine Months Ended September 30, |
|
||||||||||
|
(Dollars in millions) |
|
2022 |
|
|
2021 |
|
|
2022 |
|
|
2021 |
|
||||
|
Beginning impact of derivative accounting on GAAP equity |
|
$ |
39 |
|
|
$ |
(459 |
) |
|
$ |
(299 |
) |
|
$ |
(616 |
) |
|
Net impact of net mark-to-market gains (losses) under derivative accounting (1) |
|
|
79 |
|
|
|
42 |
|
|
|
417 |
|
|
|
199 |
|
|
Ending impact of derivative accounting on GAAP equity |
|
$ |
118 |
|
|
$ |
(417 |
) |
|
$ |
118 |
|
|
$ |
(417 |
) |
|
|
(1) |
Net impact of net mark-to-market gains (losses) under derivative accounting is composed of the following: |
|
|
|
Three Months Ended September 30, |
|
|
Nine Months Ended September 30, |
|
||||||||||
|
(Dollars in millions) |
|
2022 |
|
|
2021 |
|
|
2022 |
|
|
2021 |
|
||||
|
Total pre-tax net impact of derivative accounting recognized in net income (2) |
|
$ |
33 |
|
|
$ |
30 |
|
|
$ |
265 |
|
|
$ |
151 |
|
|
Tax and other impacts of derivative accounting adjustments |
|
|
(8 |
) |
|
|
(8 |
) |
|
|
(65 |
) |
|
|
(37 |
) |
|
Change in mark-to-market gains (losses) on derivatives, net of tax recognized in other comprehensive income |
|
|
54 |
|
|
|
20 |
|
|
|
217 |
|
|
|
85 |
|
|
Net impact of net mark-to-market gains (losses) under derivative accounting |
|
$ |
79 |
|
|
$ |
42 |
|
|
$ |
417 |
|
|
$ |
199 |
|
|
|
(2) |
See “Core Earnings derivative adjustments” table above. |
38
Hedging Embedded Floor Income
We use Floor Income Contracts, pay-fixed swaps and fixed rate debt to economically hedge embedded floor income in our FFELP loans. Historically, we have used these instruments on a periodic basis and depending upon market conditions and pricing, we may enter into additional hedges in the future. Under GAAP, the Floor Income Contracts do not qualify for hedge accounting and the pay-fixed swaps are accounted for as cashflow hedges. The table below shows the amount of Hedged Floor Income that will be recognized in Core Earnings in future periods based on these hedge strategies.
|
(Dollars in millions) |
|
September 30, 2022 |
|
|
September 30, 2021 |
|
||
|
Total hedged Floor Income, net of tax (1)(2) |
|
$ |
224 |
|
|
$ |
291 |
|
|
|
(1) |
$293 million and $380 million on a pre-tax basis as of September 30, 2022 and September 30, 2021, respectively. |
|
|
(2) |
Of the $224 million as of September 30, 2022, approximately $30 million, $98 million, $39 million and $21 million will be recognized as part of Core Earnings net income in the remainder of 2022, 2023, 2024 and 2025, respectively. |
(2) Goodwill and Acquired Intangible Assets: Our Core Earnings exclude goodwill and intangible asset impairment and the amortization of acquired intangible assets. The following table summarizes the goodwill and acquired intangible asset adjustments.
|
|
|
Three Months Ended September 30, |
|
|
Nine Months Ended September 30, |
|
||||||||||
|
(Dollars in millions) |
|
2022 |
|
|
2021 |
|
|
2022 |
|
|
2021 |
|
||||
|
Core Earnings goodwill and acquired intangible asset adjustments |
|
$ |
(10 |
) |
|
$ |
(4 |
) |
|
$ |
(17 |
) |
|
$ |
(14 |
) |
Adjusted Core Earnings
Adjusted Core Earnings net income and Adjusted Core Earnings operating expenses exclude restructuring and regulatory-related expenses. Management excludes these expenses as it is one of the measures we review internally when making management decisions regarding our performance and how we allocate resources, as this presentation is a useful basis for management and investors to further analyze Core Earnings. We also refer to this information in our presentations with credit rating agencies, lenders and investors.
The following table summarizes these expenses which are excluded:
|
|
|
Three Months Ended September 30, |
|
|
Nine Months Ended September 30, |
|
||||||||||
|
(Dollars in millions) |
|
2022 |
|
|
2021 |
|
|
2022 |
|
|
2021 |
|
||||
|
Restructuring/other reorganization expenses |
|
$ |
21 |
|
|
$ |
— |
|
|
$ |
25 |
|
|
$ |
8 |
|
|
Regulatory-related expenses |
|
|
3 |
|
|
|
6 |
|
|
|
5 |
|
|
|
22 |
|
|
Total |
|
$ |
24 |
|
|
$ |
6 |
|
|
$ |
30 |
|
|
$ |
30 |
|
39
2. Adjusted Tangible Equity Ratio
Adjusted Tangible Equity Ratio measures the ratio of Navient’s Tangible Equity to its tangible assets. We adjust this ratio to exclude the assets and equity associated with our FFELP portfolio because FFELP Loans are no longer originated and the FFELP portfolio bears a 3% maximum loss exposure under the terms of the federal guaranty. Management believes that excluding this portfolio from the ratio enhances its usefulness to investors. Management uses this ratio, in addition to other metrics, for analysis and decision making related to capital allocation decisions. The Adjusted Tangible Equity Ratio is calculated as:
|
(Dollars in millions) |
|
September 30, 2022 |
|
|
September 30, 2021 |
|
||
|
Navient Corporation's stockholders' equity |
|
$ |
2,973 |
|
|
$ |
2,723 |
|
|
Less: Goodwill and acquired intangible assets |
|
|
708 |
|
|
|
721 |
|
|
Tangible Equity |
|
|
2,265 |
|
|
|
2,002 |
|
|
Less: Equity held for FFELP Loans |
|
|
234 |
|
|
|
272 |
|
|
Adjusted Tangible Equity |
|
$ |
2,031 |
|
|
$ |
1,730 |
|
|
Divided by: |
|
|
|
|
|
|
|
|
|
Total assets |
|
$ |
73,625 |
|
|
$ |
81,939 |
|
|
Less: |
|
|
|
|
|
|
|
|
|
Goodwill and acquired intangible assets |
|
|
708 |
|
|
|
721 |
|
|
FFELP Loans |
|
|
46,891 |
|
|
|
54,350 |
|
|
Adjusted tangible assets |
|
$ |
26,026 |
|
|
$ |
26,868 |
|
|
Adjusted Tangible Equity Ratio (1) |
|
|
7.8 |
% |
|
|
6.4 |
% |
|
|
(1) |
The following provides the Adjusted Tangible Equity Ratio on a pro forma basis assuming the cumulative net mark-to-market losses related to derivative accounting under GAAP were excluded. These cumulative losses reverse to $0 upon the maturity of the individual derivative instruments. As these losses are temporary, we believe this pro forma presentation is a useful basis for management and investors to further analyze the Adjusted Tangible Equity Ratio. |
|
(Dollars in millions) |
|
September 30, 2022 |
|
|
September 30, 2021 |
|
||
|
Adjusted Tangible Equity (from above table) |
|
$ |
2,031 |
|
|
$ |
1,730 |
|
|
Plus: ending impact of derivative accounting on GAAP equity |
|
|
(118 |
) |
|
|
417 |
|
|
Pro forma Adjusted Tangible Equity |
|
$ |
1,913 |
|
|
$ |
2,147 |
|
|
Divided by: adjusted tangible assets (from above table) |
|
$ |
26,026 |
|
|
$ |
26,868 |
|
|
Pro forma Adjusted Tangible Equity Ratio |
|
|
7.4 |
% |
|
|
8.0 |
% |
3. Earnings before Interest, Taxes, Depreciation and Amortization Expense (EBITDA)
This measures the operating performance of the Business Processing segment and is used by management and equity investors to monitor operating performance and determine the value of those businesses. EBITDA for the Business Processing segment is calculated as:
|
|
|
Three Months Ended September 30, |
|
|
Nine Months Ended September 30, |
|
||||||||||
|
(Dollars in millions) |
|
2022 |
|
|
2021 |
|
|
2022 |
|
|
2021 |
|
||||
|
Pre-tax income |
|
$ |
12 |
|
|
$ |
35 |
|
|
$ |
44 |
|
|
$ |
107 |
|
|
Plus: |
|
|
|
|
|
|
|
|
|
|
|
|
|
|
|
|
|
Depreciation and amortization expense (1) |
|
|
1 |
|
|
|
3 |
|
|
|
2 |
|
|
|
6 |
|
|
EBITDA |
|
$ |
13 |
|
|
$ |
38 |
|
|
$ |
46 |
|
|
$ |
113 |
|
|
Divided by: |
|
|
|
|
|
|
|
|
|
|
|
|
|
|
|
|
|
Total revenue |
|
$ |
79 |
|
|
$ |
122 |
|
|
$ |
260 |
|
|
$ |
377 |
|
|
EBITDA margin |
|
|
16 |
% |
|
|
31 |
% |
|
|
18 |
% |
|
|
30 |
% |
|
|
(1) |
There is no interest expense in this segment. |
40
4. Allowance for Loan Losses Excluding Expected Future Recoveries on Previously Fully Charged-off
Loans
The allowance for loan losses on the Private Education Loan portfolio used for the three credit metrics below excludes the expected future recoveries on previously fully charged-off loans to better reflect the current expected credit losses remaining in connection with the loans on balance sheet that have not charged off. That is, as of September 30, 2022, the $1,132 million Private Education Loan allowance for loan losses excluding expected future recoveries on previously fully charged-off loans represents the current expected credit losses that remain in connection with the $20,003 million Private Education Loan portfolio. The $280 million of expected future recoveries on previously fully charged-off loans, which is collected over an average 15-year period, mechanically is a reduction to the overall allowance for loan losses. However, it is not related to the $20,003 million Private Education Loan portfolio on our balance sheet and, as a result, management excludes this impact to the allowance to better evaluate and assess our overall credit loss coverage on the Private Education Loan portfolio. We believe this provides a more meaningful and holistic view of the available credit loss coverage on our non-charged-off Private Education Loan portfolio. We believe this information is useful to our investors, lenders and rating agencies.
Allowance for Loan Losses Metrics – Private Education Loans
|
|
|
Three Months Ended September 30, |
|
|
Nine Months Ended September 30, |
|
||||||||||
|
(Dollars in millions) |
|
2022 |
|
|
2021 |
|
|
2022 |
|
|
2021 |
|
||||
|
Allowance at end of period (GAAP) |
|
$ |
852 |
|
|
$ |
980 |
|
|
$ |
852 |
|
|
$ |
980 |
|
|
Plus: expected future recoveries on previously fully charged-off loans |
|
|
280 |
|
|
|
397 |
|
|
|
280 |
|
|
|
397 |
|
|
Allowance at end of period excluding expected future recoveries on previously fully charged-off loans (Non-GAAP Financial Measure) |
|
$ |
1,132 |
|
|
$ |
1,377 |
|
|
$ |
1,132 |
|
|
$ |
1,377 |
|
|
Ending total loans |
|
$ |
20,003 |
|
|
$ |
20,998 |
|
|
$ |
20,003 |
|
|
$ |
20,998 |
|
|
Ending loans in repayment |
|
$ |
19,284 |
|
|
$ |
19,795 |
|
|
$ |
19,284 |
|
|
$ |
19,795 |
|
|
Net charge-offs |
|
$ |
129 |
|
|
$ |
55 |
|
|
$ |
268 |
|
|
$ |
125 |
|
|
|
|
|
|
|
|
|
|
|
|
|
|
|
|
|
|
|
|
Allowance coverage of charge-offs (annualized): |
|
|
|
|
|
|
|
|
|
|
|
|
|
|
|
|
|
GAAP |
|
|
1.7 |
|
|
|
4.5 |
|
|
|
2.4 |
|
|
|
5.9 |
|
|
Adjustment (1) |
|
|
.5 |
|
|
|
1.8 |
|
|
|
.8 |
|
|
|
2.4 |
|
|
Non-GAAP Financial Measure (1) |
|
|
2.2 |
|
|
|
6.3 |
|
|
|
3.2 |
|
|
|
8.3 |
|
|
|
|
|
|
|
|
|
|
|
|
|
|
|
|
|
|
|
|
Allowance as a percentage of the ending total loan balance: |
|
|
|
|
|
|
|
|
|
|
|
|
|
|
|
|
|
GAAP |
|
|
4.3 |
% |
|
|
4.7 |
% |
|
|
4.3 |
% |
|
|
4.7 |
% |
|
Adjustment (1) |
|
|
1.4 |
|
|
|
1.9 |
|
|
|
1.4 |
|
|
|
1.9 |
|
|
Non-GAAP Financial Measure (1) |
|
|
5.7 |
% |
|
|
6.6 |
% |
|
|
5.7 |
% |
|
|
6.6 |
% |
|
|
|
|
|
|
|
|
|
|
|
|
|
|
|
|
|
|
|
Allowance as a percentage of the ending loans in repayment: |
|
|
|
|
|
|
|
|
|
|
|
|
|
|
|
|
|
GAAP |
|
|
4.4 |
% |
|
|
5.0 |
% |
|
|
4.4 |
% |
|
|
5.0 |
% |
|
Adjustment (1) |
|
|
1.5 |
|
|
|
2.0 |
|
|
|
1.5 |
|
|
|
2.0 |
|
|
Non-GAAP Financial Measure (1) |
|
|
5.9 |
% |
|
|
7.0 |
% |
|
|
5.9 |
% |
|
|
7.0 |
% |
|
(1) |
The allowance used for these credit metrics excludes the expected future recoveries on previously fully charged-off loans. See discussion above. |
41
Legal Proceedings
For a discussion of legal matters as of September 30, 2022, please refer to “Note 9 – Commitments and Contingencies” to our consolidated financial statements included in this report, which is incorporated into this item by reference.
Risk Factors
The risk factors disclosed in our Annual Report on Form 10-K for the fiscal year ended December 31, 2021 (the “Form 10-K”) should be considered together with information included in this Quarterly Report on Form 10-Q. These are not the only risks to which we are exposed. The following information amends and restates in its entirety the previously disclosed risk factor in our Form 10-K and our Form 10-Q for the second quarter ended June 30, 2022 relating to higher-than-anticipated increases in prepayment rates. Except for such additional information, we believe there have been no material changes from the risk factors previously disclosed in our Form 10-K and in the second quarter Form 10-Q.
Prepayments on our loans can materially impact our profitability, results of operations, financial condition, cash flows or future business prospects. Higher or lower prepayments can result from a variety of causes including borrower activity and changes in the education loan market as a result of market conditions, interest rate movements, loan forgiveness or other government sponsored initiatives.
The rate at which borrowers prepay their loans can have a material impact on profitability, results of operations, financial condition, cash flows or future business prospects by affecting our net interest margin, the future cash flows from our loans including loans held by our securitization trusts. FFELP Loans and Private Education Loans may be voluntarily prepaid without penalty by the borrower, refinanced or consolidated with the borrower’s other loans through refinancing. Prepayment rates on education loans are subject to a variety of economic, political, competitive and other factors, including changes in our competitors’ business strategies, changes in interest rates, availability of alternative financings (including refinance and consolidations), legislative, executive and regulatory changes affecting the education loan market and the general economy. Refinance products offered by us, our competitors, and the Federal Government may increase the repayment rate on our FFELP Loans and Private Education Loans.
In particular, new interpretations of current laws, rules or regulations or future laws, executive orders or other policy initiatives which operate to encourage or require consolidation, abolish existing or create additional income-based repayment or debt forgiveness programs or establish other policies and programs also may increase or decrease the prepayment rates on education loans. For example, ED recently announced a set of policy changes and released proposed negotiated rulemaking proposals relating to the Defense to Repayment, interest capitalization rules, and Public Service Loan Forgiveness program under its Direct Loan program, which may result in an increase in consolidations of FFELP loans into Direct Loans (which results in the loan no longer being on our balance sheet). Prepayments on our loans may also decrease while programs or initiatives are discussed or rumored to be enacted in the future. On August 24, 2022, the Biden-Harris Administration announced its Student Debt Relief (SDR) Plan that extended the student loan repayment pause through December 31, 2022 and provides up to $20,000 in debt relief to certain income-qualified recipients of student loans held by ED. After several modifications, a final version of the SDR Plan was ultimately published in the Federal Register on October 12, 2022. While the SDR Plan currently provides that borrowers with federal student loans not held by ED cannot obtain one-time debt relief by consolidating those loans into Direct Loans, it also states that ED is assessing whether there are alternative pathways to provide relief to borrowers with federal student loans not held by ED, including FFEL Program Loans and is discussing this with private lenders. If a broad-based student loan forgiveness plan or any policies or programs that encourage or require borrowers to consolidate their loans into Direct Loans held by ED is implemented, it will likely result in a significant increase in prepayments of our existing education loan portfolio and could materially and adversely impact our profitability, results of operations, financial condition, cash flows or future business prospects. We cannot predict what (if any) plans or policies regarding broad-based loan forgiveness or other related policies or programs will ultimately be implemented, the timing of when such plans or policies may be implemented, and/or the outcome of such actions.
FFELP Loans may also be repaid after default by the Guarantors of FFELP Loans. Conversely, borrowers might not choose to prepay their education loans, or the terms of their education loans may be extended as a result of grace periods, deferment periods, income-driven repayment plans, or other repayment terms or monthly payment amount modifications agreed to by the servicer, for example. FFELP Loan borrowers may be eligible for various existing income-based repayment programs under which borrowers can qualify for reduced or zero monthly payment or even debt forgiveness after a certain number of years of repayment.
Prolonged introductions of significant amounts of subsidized funding at below market interest rates — whether from federal or private sources — could increase the prepayment rates of our existing Private Education Loans and have a material adverse effect on our profitability, results of operations, financial condition, cash flows or future business prospects.
42
With respect to our securitization trusts when, as a result of unanticipated prepayment levels, education loans within a securitization trust amortize faster than originally contracted, the trust’s pool balance may decline at a rate faster than the prepayment rate assumed when the trust’s bonds were originally issued. If the trust’s pool balance declines faster than originally anticipated, in most of our securitization structures, the bonds issued by that trust will also be repaid faster than originally anticipated. In such cases, our net interest income may decrease and our future cash flows from the trust may similarly decline. Conversely, when education loans within a securitization trust amortize more slowly than originally contracted, the trust’s pool balance may decline more slowly than the prepayment rate assumed when the trust’s bonds were originally issued, and the bonds may be repaid more slowly than originally anticipated. In these cases, our net interest income increases and our future cash flows from the trust may increase. It is also possible, if the prepayment rate is especially slow and certain rights of the sellers or the servicer are not exercised or are insufficient or other action is not taken to counter the slower prepayment rate, the trust’s bonds may not be repaid by their legal final maturity date(s), which could result in an event of default under the underlying securitization agreements.
43
Quantitative and Qualitative Disclosures about Market Risk
LIBOR Transition
We continue to work internally as well as with external parties to ensure an orderly transition from one-month and three-month LIBOR to an alternative benchmark rate by the June 30, 2023 transition date. We have established an internal LIBOR transition team whose purpose is to assess impacts, recommend plans and coordinate transition efforts among different business areas. Executive management and the LIBOR transition team provide quarterly reports to our Board of Directors. We have also established internal LIBOR working groups comprised of members from different business areas who meet regularly to assess specific business-level impacts and to implement operational changes necessary to effectuate a successful transition from LIBOR. In addition to our enterprise-wide efforts, we engage with market participants, industry groups and regulators, including the Alternative Reference Rates Committee (the ARRC), to develop plans and documentation to facilitate the transition to an alternative benchmark rate.
We support the ARRC’s recommendation to replace LIBOR with the Secured Overnight Financing Rate (SOFR) and continue to comply with the ARRC’s recommended best practices for completing the transition from LIBOR. All our new variable rate Private Education Loans issued since December 2021 are indexed to SOFR. Also, as of December 31, 2021, we have ceased entering into any other new contracts that are indexed to LIBOR and, where practicable, have engaged with counterparties to modify certain existing contracts to transition the existing reference rate from LIBOR to SOFR. With respect to our legacy variable rate Private Education Loans and other financial contracts that reference USD LIBOR and contain fallbacks provisions that clearly specify a method for the transition from LIBOR, we plan to transition such loans using such existing fallbacks. We have engaged with our IT vendors and impacted internal work groups to prepare and update our systems, procedures and processes to transition LIBOR-indexed contracts to SOFR. With respect to our financial instruments that do not include fallback provisions that clearly specify a method for the transition from LIBOR to an alternative benchmark rate, where practicable and commercially reasonable, we have made efforts to engage with customers, counterparties and investors to modify such instruments. Due to stringent noteholder consent requirements, it may be impracticable or impossible to modify certain financial instruments like certain of our ABS. Further, the SAP formula for our FFELP Loans, which is indexed to one-month LIBOR, cannot be modified without legislative action. Thus, in such instances, we may need to rely on the New York state LIBOR legislation or the proposed federal legislation to transition to SOFR.
On March 15, 2022, the Adjustable Interest Rate (LIBOR) Act (the “LIBOR Act”) was signed into law. The LIBOR Act provides that for contracts that contain no fallback provision or contain fallback provisions that do not identify a specific USD LIBOR benchmark replacement (including the SAP formula for FFELP Loans), a benchmark replacement recommended by the Federal Reserve Bank of New York will automatically replace the USD LIBOR benchmark in the contract after June 30, 2023. The recommended benchmark replacement will be based on the SOFR published by the Federal Reserve Bank of New York, including any recommended spread adjustment and benchmark replacement conforming changes. Following the enactment of the LIBOR Act, all of our financial instruments which are currently indexed to USD LIBOR will transition to SOFR by no later than June 30, 2023.
For a discussion of the risks related to the LIBOR transition, see “Risk Factors – Market, Funding & Liquidity Risk – The transition away from the LIBOR reference rate to an alternative reference rate may create uncertainty in the capital markets and may negatively impact the value of existing LIBOR based financial instruments. Post transition alternative reference rates may perform significantly different than LIBOR” in our Annual Report on Form 10-K for the fiscal year ended December 31, 2021.
44
Interest Rate Sensitivity Analysis
Our interest rate risk management seeks to limit the impact of short-term movements in interest rates on our results of operations and financial position. The following tables summarize the potential effect on earnings over the next 12 months and the potential effect on fair values of balance sheet assets and liabilities at September 30, 2022 and 2021, based upon a sensitivity analysis performed by management assuming a hypothetical increase and decrease in market interest rates of 100 basis points. The earnings sensitivities assume an immediate increase and decrease in market interest rates of 100 basis points and are applied only to financial assets and liabilities, including hedging instruments, that existed at the balance sheet date and do not take into account any new assets, liabilities or hedging instruments that may arise over the next 12 months.
|
|
|
As of September 30, 2022 |
|
|
As of September 30, 2021 |
|
||||||||||
|
|
|
Impact on Annual Earnings If: |
|
|
Impact on Annual Earnings If: |
|
||||||||||
|
|
|
Interest Rates |
|
|
Interest Rates |
|
||||||||||
|
(Dollars in millions, except per share amounts) |
|
Increase 100 Basis Points |
|
|
Decrease 100 Basis Points |
|
|
Increase 100 Basis Points |
|
|
Decrease 100 Basis Points |
|
||||
|
Effect on Earnings: |
|
|
|
|
|
|
|
|
|
|
|
|
|
|
|
|
|
Change in pre-tax net income before mark-to -market gains (losses) on derivative and hedging activities (1) |
|
$ |
53 |
|
|
$ |
(38 |
) |
|
$ |
(31 |
) |
|
$ |
10 |
|
|
Mark-to-market gains (losses) on derivative and hedging activities |
|
|
22 |
|
|
|
(22 |
) |
|
|
92 |
|
|
|
(120 |
) |
|
Increase (decrease) in income before taxes |
|
$ |
75 |
|
|
$ |
(60 |
) |
|
$ |
61 |
|
|
$ |
(110 |
) |
|
Increase (decrease) in net income after taxes |
|
$ |
58 |
|
|
$ |
(46 |
) |
|
$ |
47 |
|
|
$ |
(85 |
) |
|
Increase (decrease) in diluted earnings per common share |
|
$ |
.42 |
|
|
$ |
(.34 |
) |
|
$ |
.29 |
|
|
$ |
(.52 |
) |
|
(1) |
If decreasing interest rates by 100 basis points results in a negative interest rate, we assume the interest rate is 0% for this disclosure (as opposed to being a negative interest rate). |
45
|
|
|
At September 30, 2022 |
|
|||||||||||||||||
|
|
|
|
|
|
|
Interest Rates: |
|
|||||||||||||
|
|
|
|
|
|
|
Change from Increase of 100 Basis Points |
|
|
Change from Decrease of 100 Basis Points |
|
||||||||||
|
(Dollars in millions) |
|
Fair Value |
|
|
$ |
|
|
% |
|
|
$ |
|
|
% |
|
|||||
|
Effect on Fair Values: |
|
|
|
|
|
|
|
|
|
|
|
|
|
|
|
|
|
|
|
|
|
Assets |
|
|
|
|
|
|
|
|
|
|
|
|
|
|
|
|
|
|
|
|
|
Education Loans |
|
$ |
62,914 |
|
|
$ |
(81 |
) |
|
|
— |
|
|
$ |
119 |
|
|
|
— |
|
|
Other earning assets |
|
|
4,088 |
|
|
|
— |
|
|
|
— |
|
|
|
— |
|
|
|
— |
|
|
Other assets |
|
|
3,495 |
|
|
|
47 |
|
|
|
1 |
|
|
|
(42 |
) |
|
|
(1 |
) |
|
Total assets gain/(loss) |
|
$ |
70,497 |
|
|
$ |
(34 |
) |
|
|
— |
% |
|
$ |
77 |
|
|
|
— |
% |
|
Liabilities |
|
|
|
|
|
|
|
|
|
|
|
|
|
|
|
|
|
|
|
|
|
Interest-bearing liabilities |
|
$ |
66,471 |
|
|
$ |
(256 |
) |
|
|
— |
% |
|
$ |
276 |
|
|
|
— |
% |
|
Other liabilities |
|
|
977 |
|
|
|
141 |
|
|
|
14 |
|
|
|
(144 |
) |
|
|
(15 |
) |
|
Total liabilities (gain)/loss |
|
$ |
67,448 |
|
|
$ |
(115 |
) |
|
|
— |
% |
|
$ |
132 |
|
|
|
— |
% |
|
|
|
|
|
|
|
|
|
|
|
|
|
|
|
|
|
|
|
|
|
|
|
|
|
At December 31, 2021 |
|
|||||||||||||||||
|
|
|
|
|
|
|
Interest Rates: |
|
|||||||||||||
|
|
|
|
|
|
|
Change from Increase of 100 Basis Points |
|
|
Change from Decrease of 100 Basis Points |
|
||||||||||
|
(Dollars in millions) |
|
Fair Value |
|
|
$ |
|
|
% |
|
|
$ |
|
|
% |
|
|||||
|
Effect on Fair Values: |
|
|
|
|
|
|
|
|
|
|
|
|
|
|
|
|
|
|
|
|
|
Assets |
|
|
|
|
|
|
|
|
|
|
|
|
|
|
|
|
|
|
|
|
|
Education Loans |
|
$ |
74,772 |
|
|
$ |
(279 |
) |
|
|
— |
|
|
$ |
432 |
|
|
|
1 |
% |
|
Other earning assets |
|
|
3,845 |
|
|
|
— |
|
|
|
— |
|
|
|
— |
|
|
|
— |
|
|
Other assets |
|
|
3,948 |
|
|
|
(124 |
) |
|
|
(3 |
) |
|
|
263 |
|
|
|
7 |
|
|
Total assets gain/(loss) |
|
$ |
82,565 |
|
|
$ |
(403 |
) |
|
|
— |
% |
|
$ |
695 |
|
|
|
1 |
% |
|
Liabilities |
|
|
|
|
|
|
|
|
|
|
|
|
|
|
|
|
|
|
|
|
|
Interest-bearing liabilities |
|
$ |
77,040 |
|
|
$ |
(356 |
) |
|
|
— |
% |
|
$ |
386 |
|
|
|
1 |
% |
|
Other liabilities |
|
|
1,019 |
|
|
|
(40 |
) |
|
|
(4 |
) |
|
|
193 |
|
|
|
19 |
|
|
Total liabilities (gain)/loss |
|
$ |
78,059 |
|
|
$ |
(396 |
) |
|
|
(1 |
)% |
|
$ |
579 |
|
|
|
1 |
% |
A primary objective in our funding is to minimize our sensitivity to changing interest rates by generally funding our floating rate education loan portfolio with floating rate debt and our fixed rate education loan portfolio with fixed rate debt although we can have a mismatch at times. In addition, we can have a mismatch in the index (including the frequency of reset) of floating rate debt versus floating rate assets. In addition, due to the ability of some FFELP Loans to earn Floor Income, we can have a fixed versus floating mismatch in funding if the education loan earns at the fixed borrower rate and the funding remains floating. We use Floor Income Contracts, pay-fixed swaps and fixed rate debt to economically hedge embedded floor income in our FFELP loans. Historically, we have used these instruments on a periodic basis and depending upon market conditions and pricing, we may enter into additional hedges in the future. The result of these hedging transactions is to fix the relative spread between the education loan asset rate and the variable rate liability.
In the preceding tables, under the scenario where interest rates increase or decrease by 100 basis points, the change in pre-tax net income before the mark-to-market gains (losses) on derivative and hedging activities is primarily due to the impact of (i) our unhedged FFELP Loans being in a fixed-rate mode due to Floor Income, while being funded with variable rate debt in low interest rate environments; (ii) certain FFELP fixed rate loans becoming variable interest rate loans when variable interest rates rise above a certain level (Special Allowance Payment of “SAP”). When these loans are funded with fixed rate debt (as we do for a portion of the portfolio to economically hedge Floor Income) we earn additional interest income when earning the higher variable rate that is in effect; and (iii) a portion of our variable rate assets being funded with fixed rate liabilities. Item (i) will generally cause income to decrease when interest rates increase and income to increase when interest rates decrease. Item (ii) and (iii) have the opposite effect. The changes due to the interest rate scenarios in the current period are a result of items (ii) and (iii) having a more significant impact than item (i) primarily as a result of interest rates being significantly higher compared to the prior period. The changes in the prior period are a result of item (i) having a more significant impact than items (ii) and (iii) primarily as a result of interest rates being significantly lower at that time.
46
In the preceding tables, under the scenario where interest rates increase or decrease by 100 basis points, the change in mark-to-market gains (losses) on derivative and hedging activities in both periods is primarily due to (i) the notional amount and remaining term of our derivative portfolio and related hedged debt and (ii) the interest rate environment. In both periods, the mark-to-market gains (losses) are primarily related to derivatives that don’t qualify for hedge accounting that are used to economically hedge Floor Income as well as the origination of fixed rate Private Education Refinance loans. As a result of not qualifying for hedge accounting, there is not an offsetting mark- to-market of the hedged item in this analysis. The mark-to-market gains (losses) where interest rates increase and decrease 100 basis points are lower in 2022 than 2021 primarily as a result of an increased interest rate environment in 2022 and a decline in the notional amount of derivatives outstanding in connection with the decrease in the education loan portfolio over that time period.
In addition to interest rate risk addressed in the preceding tables, we are also exposed to risks related to foreign currency exchange rates. Foreign currency exchange risk is primarily the result of foreign currency denominated debt issued by us. When we issue foreign denominated corporate unsecured and securitization debt, our policy is to use cross currency interest rate swaps to swap all foreign currency denominated debt payments (fixed and floating) to USD LIBOR using a fixed exchange rate. In the tables above, there would be an immaterial impact on earnings if exchange rates were to decrease or increase, due to the terms of the hedging instrument and hedged items matching. The balance sheet interest-bearing liabilities would be affected by a change in exchange rates; however, the change would be materially offset by the cross-currency interest rate swaps in other assets or other liabilities. In certain economic environments, volatility in the spread between spot and forward foreign exchange rates has resulted in mark-to-market impacts to current period earnings which have not been factored into the above analysis. The earnings impact is noncash, and at maturity of the instruments the cumulative mark-to-market impact will be zero. Navient has not issued foreign currency denominated debt since 2008.
Asset and Liability Funding Gap
The tables below present our assets and liabilities (funding) arranged by underlying indices as of September 30, 2022. In the following GAAP presentation, the funding gap only includes derivatives that qualify as effective hedges (those derivatives which are reflected in net interest margin, as opposed to those reflected in the “gains (losses) on derivatives and hedging activities, net” line on the consolidated statements of income). The difference between the asset and the funding is the funding gap for the specified index. This represents our exposure to interest rate risk in the form of basis risk and repricing risk, which is the risk that the different indices may reset at different frequencies or may not move in the same direction or at the same magnitude.
Management analyzes interest rate risk and in doing so includes all derivatives that are economically hedging our debt whether they qualify as effective hedges or not (Core Earnings basis). Accordingly, we are also presenting the asset and liability funding gap on a Core Earnings basis in the table that follows the GAAP presentation.
GAAP Basis:
|
Index (Dollars in billions) |
|
Frequency of Variable Resets |
|
Assets |
|
|
Funding (1) |
|
|
Funding Gap |
|
|||
|
3-month Treasury bill |
|
weekly |
|
$ |
2.4 |
|
|
$ |
— |
|
|
$ |
2.4 |
|
|
3-month Treasury bill |
|
annual |
|
|
.2 |
|
|
|
— |
|
|
|
.2 |
|
|
Prime |
|
annual |
|
|
.2 |
|
|
|
— |
|
|
|
.2 |
|
|
Prime |
|
quarterly |
|
|
1.3 |
|
|
|
— |
|
|
|
1.3 |
|
|
Prime |
|
monthly |
|
|
4.6 |
|
|
|
— |
|
|
|
4.6 |
|
|
3-month LIBOR |
|
quarterly |
|
|
.3 |
|
|
|
20.1 |
|
|
|
(19.8 |
) |
|
3-month LIBOR (2) |
|
monthly |
|
|
— |
|
|
|
— |
|
|
|
— |
|
|
3-month LIBOR (2) |
|
daily |
|
|
— |
|
|
|
.1 |
|
|
|
(.1 |
) |
|
1-month LIBOR |
|
monthly |
|
|
3.0 |
|
|
|
28.0 |
|
|
|
(25.0 |
) |
|
1-month LIBOR |
|
daily |
|
|
44.2 |
|
|
|
— |
|
|
|
44.2 |
|
|
SOFR (3) |
|
various |
|
|
.1 |
|
|
|
.9 |
|
|
|
(.8 |
) |
|
Non-Discrete reset (2)(4) |
|
monthly |
|
|
— |
|
|
|
4.0 |
|
|
|
(4.0 |
) |
|
Non-Discrete reset (5) |
|
daily/weekly |
|
|
4.0 |
|
|
|
.1 |
|
|
|
3.9 |
|
|
Fixed Rate (6) |
|
|
|
|
13.3 |
|
|
|
20.4 |
|
|
|
(7.1 |
) |
|
Total |
|
|
|
$ |
73.6 |
|
|
$ |
73.6 |
|
|
$ |
— |
|
|
|
(1) |
Funding (by index) includes all derivatives that qualify as hedges. |
|
|
(2) |
Funding includes Loan Repurchase facilities. |
|
|
(3) |
Assets include $78 million of student loans indexed to the 30-day average SOFR rate. Funding includes $855 million indexed to 30-day average, 90-day average or 3-month Term CME SOFR. |
|
|
(4) |
Funding consists of auction rate ABS and ABCP facilities. |
|
|
(5) |
Assets include restricted and unrestricted cash equivalents and other overnight type instruments. Funding includes the obligation to return cash collateral held related to derivatives exposures. |
|
|
(6) |
Assets include receivables and other assets (including goodwill and acquired intangibles). Funding includes other liabilities and stockholders' equity. |
47
Core Earnings Basis:
|
Index (Dollars in billions) |
|
Frequency of Variable Resets |
|
Assets |
|
|
Funding (1) |
|
|
Funding Gap |
|
|||
|
3-month Treasury bill |
|
weekly |
|
$ |
2.4 |
|
|
$ |
— |
|
|
$ |
2.4 |
|
|
3-month Treasury bill |
|
annual |
|
|
.2 |
|
|
|
— |
|
|
|
.2 |
|
|
Prime |
|
annual |
|
|
.2 |
|
|
|
— |
|
|
|
.2 |
|
|
Prime |
|
quarterly |
|
|
1.3 |
|
|
|
— |
|
|
|
1.3 |
|
|
Prime |
|
monthly |
|
|
4.6 |
|
|
|
— |
|
|
|
4.6 |
|
|
3-month LIBOR |
|
quarterly |
|
|
.3 |
|
|
|
— |
|
|
|
.3 |
|
|
3-month LIBOR (2) |
|
monthly |
|
|
— |
|
|
|
— |
|
|
|
— |
|
|
3-month LIBOR (2) |
|
daily |
|
|
— |
|
|
|
— |
|
|
|
— |
|
|
1-month LIBOR |
|
monthly |
|
|
3.0 |
|
|
|
48.9 |
|
|
|
(45.9 |
) |
|
1-month LIBOR |
|
daily |
|
|
44.2 |
|
|
|
— |
|
|
|
44.2 |
|
|
SOFR (3) |
|
various |
|
|
.1 |
|
|
|
— |
|
|
|
.1 |
|
|
Non-Discrete reset (2)(4) |
|
monthly |
|
|
— |
|
|
|
2.8 |
|
|
|
(2.8 |
) |
|
Non-Discrete reset (5) |
|
daily/weekly |
|
|
4.0 |
|
|
|
.1 |
|
|
|
3.9 |
|
|
Fixed Rate (6) |
|
|
|
|
13.5 |
|
|
|
22.0 |
|
|
|
(8.5 |
) |
|
Total |
|
|
|
$ |
73.8 |
|
|
$ |
73.8 |
|
|
$ |
— |
|
|
|
(1) |
Funding (by index) includes all derivatives that management considers economic hedges of interest rate risk and reflects how we internally manage our interest rate exposure. |
|
|
(2) |
Funding includes Loan Repurchase facilities. |
|
|
(3) |
Assets include $78 million of student loans indexed to the 30-day average SOFR rate. Funding includes $43 million indexed to 30-day average or 90-day average SOFR. |
|
|
(4) |
Funding consists of auction rate ABS and ABCP facilities. |
|
|
(5) |
Assets include restricted and unrestricted cash equivalents and other overnight type instruments. Funding includes the obligation to return cash collateral held related to derivatives exposures. |
|
|
(6) |
Assets include receivables and other assets (including goodwill and acquired intangibles). Funding includes other liabilities and stockholders' equity. |
We use interest rate swaps and other derivatives to achieve our risk management objectives. Our asset liability management strategy is to match assets with debt (in combination with derivatives) that have the same underlying index and reset frequency or, when economical, have interest rate characteristics that we believe are highly correlated. Interest earned on our FFELP Loans is primarily indexed to daily one-month LIBOR and our cost of funds is primarily indexed to rates other than daily one-month LIBOR. A source of variability in FFELP net interest income could also be Floor Income we earn on certain FFELP Loans. Pursuant to the terms of the FFELP, certain FFELP Loans can earn interest at the stated fixed rate of interest as underlying debt interest rate expense remains variable. We refer to this additional spread income as “Floor Income.” Floor Income can be volatile since it is dependent on interest rate levels. We frequently hedge this volatility to lock in the value of the Floor Income over the term of the contract. Interest earned on our Private Education Refinance Loans is generally fixed rate with the related cost of funds generally fixed rate as well. Interest earned on the remaining Private Education Loans is generally indexed to either one-month Prime or LIBOR rates and our cost of funds is primarily indexed to one-month or three-month LIBOR. The use of funding with index types and reset frequencies that are different from our assets exposes us to interest rate risk in the form of basis and repricing risk. This could result in our cost of funds not moving in the same direction or with the same magnitude as the yield on our assets. While we believe this risk is low, as all of these indices are short-term with rate movements that are highly correlated over a long period of time, market disruptions (which have occurred in prior years) can lead to a temporary divergence between indices resulting in a negative impact to our earnings.
48
Unregistered Sales of Equity Securities and Use of Proceeds
Share Repurchases
The following table provides information relating to our purchases of shares of our common stock in the three months ended September 30, 2022.
|
(In millions, except per share data) |
|
Total Number of Shares Purchased (1) |
|
|
Average Price Paid per Share |
|
|
Total Number of Shares Purchased as Part of Publicly Announced Plans or Programs (2) |
|
|
Approximate Dollar Value of Shares That May Yet Be Purchased Under Publicly Announced Plans or Programs (2) |
|
||||
|
Period: |
|
|
|
|
|
|
|
|
|
|
|
|
|
|
|
|
|
July 1 — July 31, 2022 |
|
|
1.6 |
|
|
$ |
15.21 |
|
|
|
1.6 |
|
|
$ |
755 |
|
|
August 1 — August 31, 2022 |
|
|
2.3 |
|
|
|
16.34 |
|
|
|
2.3 |
|
|
$ |
718 |
|
|
September 1 — September 30, 2022 |
|
|
2.4 |
|
|
|
14.09 |
|
|
|
2.4 |
|
|
$ |
685 |
|
|
Total third-quarter 2022 |
|
|
6.3 |
|
|
$ |
15.19 |
|
|
|
6.3 |
|
|
|
|
|
|
|
(1) |
The total number of shares purchased includes: (i) shares purchased under the stock repurchase program discussed below and (ii) shares of our common stock tendered to us to satisfy the exercise price in connection with cashless exercise of stock options, and tax withholding obligations in connection with exercise of stock options and vesting of restricted stock and restricted stock units. |
|
|
(2) |
In December 2021, our board of directors approved a $1 billion multi-year share repurchase program. |
Controls and Procedures
Disclosure Controls and Procedures
Our management, with the participation of our Principal Executive and Principal Financial Officers, evaluated the effectiveness of our disclosure controls and procedures (as defined in Rules 13a-15(e) and 15d-15(e) under the Securities Exchange Act of 1934, as amended (the Exchange Act)) as of September 30, 2022. Based on this evaluation, our Principal Executive and Principal Financial Officers concluded that, as of September 30, 2022, our disclosure controls and procedures were effective to ensure that information required to be disclosed by us in the reports that we file or submit under the Exchange Act is (a) recorded, processed, summarized and reported within the time periods specified in the SEC’s rules and forms and (b) accumulated and communicated to our management, including our Principal Executive and Principal Financial Officers as appropriate, to allow timely decisions regarding required disclosure.
Changes in Internal Control over Financial Reporting
No change in our internal control over financial reporting (as defined in Rules 13a-15(f) and 15d-15(f) under the Exchange Act) occurred during the fiscal quarter ended September 30, 2022 that has materially affected, or is reasonably likely to materially affect, our internal control over financial reporting.
49
Exhibits
|
|
|
|
|
31.1* |
|
Certification Pursuant to Section 302 of the Sarbanes-Oxley Act of 2002 . |
|
|
|
|
|
31.2* |
|
Certification Pursuant to Section 302 of the Sarbanes-Oxley Act of 2002 . |
|
|
|
|
|
32.1** |
|
|
|
|
|
|
|
32.2** |
|
|
|
|
|
|
|
101.INS* |
|
Inline XBRL Instance Document – the instance document does not appear in the Interactive Data File because its XBRL tags are embedded within the Inline XBRL document. |
|
|
|
|
|
101.SCH* |
|
Inline XBRL Taxonomy Extension Schema Document. |
|
|
|
|
|
101.CAL* |
|
Inline XBRL Taxonomy Extension Calculation Linkbase Document. |
|
|
|
|
|
101.DEF* |
|
Inline XBRL Taxonomy Extension Definition Linkbase Document. |
|
|
|
|
|
101.LAB* |
|
Inline XBRL Taxonomy Extension Label Linkbase Document. |
|
|
|
|
|
101.PRE* |
|
Inline XBRL Taxonomy Extension Presentation Linkbase Document.
|
|
104 |
|
Cover Page Interactive Data File (formatted as Inline XBRL and contained in Exhibit 101). |
|
* |
Filed herewith |
|
** |
Furnished herewith |
50
Financial Statements
NAVIENT CORPORATION
CONSOLIDATED BALANCE SHEETS
(In millions, except per share amounts)
(Unaudited)
|
|
|
September 30, 2022 |
|
|
December 31, 2021 |
|
||
|
Assets |
|
|
|
|
|
|
|
|
|
FFELP Loans (net of allowance for losses of $
|
|
$ |
|
|
|
$ |
|
|
|
Private Education Loans (net of allowance for losses of $
respectively) |
|
|
|
|
|
|
|
|
|
Investments |
|
|
|
|
|
|
|
|
|
Held-to-maturity |
|
|
|
|
|
|
|
|
|
Other |
|
|
|
|
|
|
|
|
|
Total investments |
|
|
|
|
|
|
|
|
|
Cash and cash equivalents |
|
|
|
|
|
|
|
|
|
Restricted cash and cash equivalents |
|
|
|
|
|
|
|
|
|
Goodwill and acquired intangible assets, net |
|
|
|
|
|
|
|
|
|
Other assets |
|
|
|
|
|
|
|
|
|
Total assets |
|
$ |
|
|
|
$ |
|
|
|
Liabilities |
|
|
|
|
|
|
|
|
|
Short-term borrowings |
|
$ |
|
|
|
$ |
|
|
|
Long-term borrowings |
|
|
|
|
|
|
|
|
|
Other liabilities |
|
|
|
|
|
|
|
|
|
Total liabilities |
|
|
|
|
|
|
|
|
|
Commitments and contingencies |
|
|
|
|
|
|
|
|
|
Equity |
|
|
|
|
|
|
|
|
|
Series A Junior Participating Preferred Stock, par value $
or outstanding |
|
|
|
|
|
|
|
|
|
Common stock, par value $
|
|
|
|
|
|
|
|
|
|
Additional paid-in capital |
|
|
|
|
|
|
|
|
|
Accumulated other comprehensive income (loss) (net of tax expense (benefit)
of $
|
|
|
|
|
|
|
(
|
) |
|
Retained earnings |
|
|
|
|
|
|
|
|
|
Total Navient Corporation stockholders’ equity before treasury stock |
|
|
|
|
|
|
|
|
|
Less: Common stock held in treasury at cost:
shares, respectively |
|
|
(
|
) |
|
|
(
|
) |
|
Total Navient Corporation stockholders’ equity |
|
|
|
|
|
|
|
|
|
Noncontrolling interest |
|
|
— |
|
|
|
|
|
|
Total equity |
|
|
|
|
|
|
|
|
|
Total liabilities and equity |
|
$ |
|
|
|
$ |
|
|
Supplemental information — assets and liabilities of consolidated variable interest entities:
|
|
|
September 30, 2022 |
|
|
December 31, 2021 |
|
||
|
FFELP Loans |
|
$ |
|
|
|
$ |
|
|
|
Private Education Loans |
|
|
|
|
|
|
|
|
|
Restricted cash |
|
|
|
|
|
|
|
|
|
Other assets, net |
|
|
|
|
|
|
|
|
|
Short-term borrowings |
|
|
|
|
|
|
|
|
|
Long-term borrowings |
|
|
|
|
|
|
|
|
|
Net assets of consolidated variable interest entities |
|
$ |
|
|
|
$ |
|
|
See accompanying notes to consolidated financial statements.
51
NAVIENT CORPORATION
CONSOLIDATED STATEMENTS OF INCOME
(In millions, except per share amounts)
(Unaudited)
|
|
|
Three Months Ended September 30, |
|
|
Nine Months Ended September 30, |
|
||||||||||
|
|
|
2022 |
|
|
2021 |
|
|
2022 |
|
|
2021 |
|
||||
|
Interest income: |
|
|
|
|
|
|
|
|
|
|
|
|
|
|
|
|
|
FFELP Loans |
|
$ |
|
|
|
$ |
|
|
|
$ |
|
|
|
$ |
|
|
|
Private Education Loans |
|
|
|
|
|
|
|
|
|
|
|
|
|
|
|
|
|
Cash and investments |
|
|
|
|
|
|
|
|
|
|
|
|
|
|
|
|
|
Total interest income |
|
|
|
|
|
|
|
|
|
|
|
|
|
|
|
|
|
Total interest expense |
|
|
|
|
|
|
|
|
|
|
|
|
|
|
|
|
|
Net interest income |
|
|
|
|
|
|
|
|
|
|
|
|
|
|
|
|
|
Less: provisions for loan losses |
|
|
|
|
|
|
|
|
|
|
|
|
|
|
(
|
) |
|
Net interest income after provisions for loan losses |
|
|
|
|
|
|
|
|
|
|
|
|
|
|
|
|
|
Other income (loss): |
|
|
|
|
|
|
|
|
|
|
|
|
|
|
|
|
|
Servicing revenue |
|
|
|
|
|
|
|
|
|
|
|
|
|
|
|
|
|
Asset recovery and business processing revenue |
|
|
|
|
|
|
|
|
|
|
|
|
|
|
|
|
|
Other income |
|
|
|
|
|
|
|
|
|
|
|
|
|
|
|
|
|
Gains on sales of loans |
|
|
— |
|
|
|
— |
|
|
|
— |
|
|
|
|
|
|
Gains (losses) on debt repurchases |
|
|
— |
|
|
|
(
|
) |
|
|
— |
|
|
|
(
|
) |
|
Gains (losses) on derivative and hedging activities, net |
|
|
|
|
|
|
(
|
) |
|
|
|
|
|
|
|
|
|
Total other income |
|
|
|
|
|
|
|
|
|
|
|
|
|
|
|
|
|
Expenses: |
|
|
|
|
|
|
|
|
|
|
|
|
|
|
|
|
|
Salaries and benefits |
|
|
|
|
|
|
|
|
|
|
|
|
|
|
|
|
|
Other operating expenses |
|
|
|
|
|
|
|
|
|
|
|
|
|
|
|
|
|
Total operating expenses |
|
|
|
|
|
|
|
|
|
|
|
|
|
|
|
|
|
Goodwill and acquired intangible asset impairment and amortization expense |
|
|
|
|
|
|
|
|
|
|
|
|
|
|
|
|
|
Restructuring/other reorganization expenses |
|
|
|
|
|
|
— |
|
|
|
|
|
|
|
|
|
|
Total expenses |
|
|
|
|
|
|
|
|
|
|
|
|
|
|
|
|
|
Income before income tax expense |
|
|
|
|
|
|
|
|
|
|
|
|
|
|
|
|
|
Income tax expense |
|
|
|
|
|
|
|
|
|
|
|
|
|
|
|
|
|
Net income |
|
$ |
|
|
|
$ |
|
|
|
$ |
|
|
|
$ |
|
|
|
Basic earnings per common share |
|
$ |
|
|
|
$ |
|
|
|
$ |
|
|
|
$ |
|
|
|
Average common shares outstanding |
|
|
|
|
|
|
|
|
|
|
|
|
|
|
|
|
|
Diluted earnings per common share |
|
$ |
|
|
|
$ |
|
|
|
$ |
|
|
|
$ |
|
|
|
Average common and common equivalent shares outstanding |
|
|
|
|
|
|
|
|
|
|
|
|
|
|
|
|
|
Dividends per common share |
|
$ |
|
|
|
$ |
|
|
|
$ |
|
|
|
$ |
|
|
See accompanying notes to consolidated financial statements.
52
NAVIENT CORPORATION
CONSOLIDATED STATEMENTS OF COMPREHENSIVE INCOME
(In millions)
(Unaudited)
|
|
|
Three Months Ended September 30, |
|
|
Nine Months Ended September 30, |
|
||||||||||
|
|
|
2022 |
|
|
2021 |
|
|
2022 |
|
|
2021 |
|
||||
|
Net income |
|
$ |
|
|
|
$ |
|
|
|
$ |
|
|
|
$ |
|
|
|
Net changes in cash flow hedges, net of taxes (1) |
|
|
|
|
|
|
|
|
|
|
|
|
|
|
|
|
|
Total comprehensive income |
|
$ |
|
|
|
$ |
|
|
|
$ |
|
|
|
$ |
|
|
|
(1) |
|
See accompanying notes to consolidated financial statements.
53
NAVIENT CORPORATION
CONSOLIDATED STATEMENTS OF CHANGES IN STOCKHOLDERS’ EQUITY
(In millions, except share and per share amounts)
(Unaudited)
|
|
|
|
|
|
|
|
|
|
|
|
|
|
|
|
|
|
|
|
|
|
|
Accumulated |
|
|
|
|
|
|
|
|
|
|
|
|
|
|
|
|
|
|
|
|
|
|
|
|
|
Common Stock Shares |
|
|
|
|
|
|
Additional |
|
|
Other |
|
|
|
|
|
|
|
|
|
|
Total |
|
|
|
|
|
|
|
|
|
||||||||||||
|
|
|
|
|
|
|
|
|
|
|
|
|
|
|
Common |
|
|
Paid-In |
|
|
Comprehensive |
|
|
Retained |
|
|
Treasury |
|
|
Stockholders' |
|
|
Noncontrolling |
|
|
Total |
|
||||||||
|
|
|
Issued |
|
|
Treasury |
|
|
Outstanding |
|
|
Stock |
|
|
Capital |
|
|
Income (Loss) |
|
|
Earnings |
|
|
Stock |
|
|
Equity |
|
|
Interest |
|
|
Equity |
|
|||||||||||
|
Balance at June 30, 2021 |
|
|
|
|
|
|
(
|
) |
|
|
|
|
|
$ |
|
|
|
$ |
|
|
|
$ |
(
|
) |
|
$ |
|
|
|
$ |
(
|
) |
|
$ |
|
|
|
$ |
|
|
|
$ |
|
|
|
Comprehensive income (loss): |
|
|
|
|
|
|
|
|
|
|
|
|
|
|
|
|
|
|
|
|
|
|
|
|
|
|
|
|
|
|
|
|
|
|
|
|
|
|
|
|
|
|
|
|
|
Net income |
|
|
— |
|
|
|
— |
|
|
|
— |
|
|
|
— |
|
|
|
— |
|
|
|
— |
|
|
|
|
|
|
|
— |
|
|
|
|
|
|
|
— |
|
|
|
|
|
|
Other comprehensive income (loss), net of tax |
|
|
— |
|
|
|
— |
|
|
|
— |
|
|
|
— |
|
|
|
— |
|
|
|
|
|
|
|
— |
|
|
|
— |
|
|
|
|
|
|
|
— |
|
|
|
|
|
|
Total comprehensive income (loss) |
|
|
— |
|
|
|
— |
|
|
|
— |
|
|
|
— |
|
|
|
— |
|
|
|
— |
|
|
|
— |
|
|
|
— |
|
|
|
|
|
|
|
— |
|
|
|
|
|
|
Cash dividends: |
|
|
|
|
|
|
|
|
|
|
|
|
|
|
|
|
|
|
|
|
|
|
|
|
|
|
|
|
|
|
|
|
|
|
|
|
|
|
|
|
|
|
|
|
|
Common stock ($
|
|
|
— |
|
|
|
— |
|
|
|
— |
|
|
|
— |
|
|
|
— |
|
|
|
— |
|
|
|
(
|
) |
|
|
— |
|
|
|
(
|
) |
|
|
— |
|
|
|
(
|
) |
|
Dividend equivalent units related to employee stock-based compensation plans |
|
|
— |
|
|
|
— |
|
|
|
— |
|
|
|
— |
|
|
|
— |
|
|
|
— |
|
|
|
— |
|
|
|
— |
|
|
|
— |
|
|
|
— |
|
|
|
— |
|
|
Issuance of common shares |
|
|
|
|
|
|
— |
|
|
|
|
|
|
|
— |
|
|
|
|
|
|
|
— |
|
|
|
— |
|
|
|
— |
|
|
|
|
|
|
|
— |
|
|
|
|
|
|
Stock-based compensation expense |
|
|
— |
|
|
|
— |
|
|
|
— |
|
|
|
— |
|
|
|
|
|
|
|
— |
|
|
|
— |
|
|
|
— |
|
|
|
|
|
|
|
— |
|
|
|
|
|
|
Common stock repurchased |
|
|
— |
|
|
|
(
|
) |
|
|
(
|
) |
|
|
— |
|
|
|
— |
|
|
|
— |
|
|
|
— |
|
|
|
(
|
) |
|
|
(
|
) |
|
|
— |
|
|
|
(
|
) |
|
Shares repurchased related to employee stock-based compensation plans |
|
|
— |
|
|
|
(
|
) |
|
|
(
|
) |
|
|
— |
|
|
|
— |
|
|
|
— |
|
|
|
— |
|
|
|
(
|
) |
|
|
(
|
) |
|
|
— |
|
|
|
(
|
) |
|
Net activity in noncontrolling interest |
|
|
— |
|
|
|
— |
|
|
|
— |
|
|
|
— |
|
|
|
— |
|
|
|
— |
|
|
|
— |
|
|
|
— |
|
|
|
— |
|
|
|
— |
|
|
|
— |
|
|
Balance at September 30, 2021 |
|
|
|
|
|
|
(
|
) |
|
|
|
|
|
$ |
|
|
|
$ |
|
|
|
$ |
(
|
) |
|
$ |
|
|
|
$ |
(
|
) |
|
$ |
|
|
|
$ |
|
|
|
$ |
|
|
|
|
|
|
|
|
|
|
|
|
|
|
|
|
|
|
|
|
|
|
|
|
|
|
|
|
|
|
|
|
|
|
|
|
|
|
|
|
|
|
|
|
|
|
|
|
|
Balance at June 30, 2022 |
|
|
|
|
|
|
(
|
) |
|
|
|
|
|
$ |
|
|
|
$ |
|
|
|
$ |
|
|
|
$ |
|
|
|
$ |
(
|
) |
|
$ |
|
|
|
$ |
— |
|
|
$ |
|
|
|
Comprehensive income (loss): |
|
|
|
|
|
|
|
|
|
|
|
|
|
|
|
|
|
|
|
|
|
|
|
|
|
|
|
|
|
|
|
|
|
|
|
|
|
|
|
|
|
|
|
|
|
Net income |
|
|
— |
|
|
|
— |
|
|
|
— |
|
|
|
— |
|
|
|
— |
|
|
|
— |
|
|
|
|
|
|
|
— |
|
|
|
|
|
|
|
— |
|
|
|
|
|
|
Other comprehensive income (loss), net of tax |
|
|
— |
|
|
|
— |
|
|
|
— |
|
|
|
— |
|
|
|
— |
|
|
|
|
|
|
|
— |
|
|
|
— |
|
|
|
|
|
|
|
— |
|
|
|
|
|
|
Total comprehensive income (loss) |
|
|
— |
|
|
|
— |
|
|
|
— |
|
|
|
— |
|
|
|
— |
|
|
|
— |
|
|
|
— |
|
|
|
— |
|
|
|
|
|
|
|
— |
|
|
|
|
|
|
Cash dividends: |
|
|
— |
|
|
|
|
|
|
|
|
|
|
|
|
|
|
|
|
|
|
|
|
|
|
|
|
|
|
|
|
|
|
|
|
|
|
|
|
|
|
|
|
|
|
Common stock ($
|
|
|
— |
|
|
|
— |
|
|
|
— |
|
|
|
— |
|
|
|
— |
|
|
|
— |
|
|
|
(
|
) |
|
|
— |
|
|
|
(
|
) |
|
|
— |
|
|
|
(
|
) |
|
Dividend equivalent units related to employee stock-based compensation plans |
|
|
— |
|
|
|
— |
|
|
|
— |
|
|
|
— |
|
|
|
— |
|
|
|
— |
|
|
|
— |
|
|
|
— |
|
|
|
— |
|
|
|
— |
|
|
|
— |
|
|
Issuance of common shares |
|
|
|
|
|
|
— |
|
|
|
|
|
|
|
— |
|
|
|
— |
|
|
|
— |
|
|
|
— |
|
|
|
— |
|
|
|
— |
|
|
|
— |
|
|
|
— |
|
|
Stock-based compensation expense |
|
|
— |
|
|
|
— |
|
|
|
— |
|
|
|
— |
|
|
|
|
|
|
|
— |
|
|
|
— |
|
|
|
— |
|
|
|
|
|
|
|
— |
|
|
|
|
|
|
Common stock repurchased |
|
|
— |
|
|
|
(
|
) |
|
|
(
|
) |
|
|
— |
|
|
|
— |
|
|
|
— |
|
|
|
— |
|
|
|
(
|
) |
|
|
(
|
) |
|
|
— |
|
|
|
(
|
) |
|
Shares repurchased related to employee stock-based compensation plans |
|
|
— |
|
|
|
(
|
) |
|
|
(
|
) |
|
|
— |
|
|
|
— |
|
|
|
— |
|
|
|
— |
|
|
|
— |
|
|
|
— |
|
|
|
— |
|
|
|
— |
|
|
Net activity in noncontrolling interest |
|
|
— |
|
|
|
— |
|
|
|
— |
|
|
|
— |
|
|
|
— |
|
|
|
— |
|
|
|
— |
|
|
|
— |
|
|
|
— |
|
|
|
— |
|
|
|
— |
|
|
Balance at September 30, 2022 |
|
|
|
|
|
|
(
|
) |
|
|
|
|
|
$ |
|
|
|
$ |
|
|
|
$ |
|
|
|
$ |
|
|
|
$ |
(
|
) |
|
$ |
|
|
|
$ |
— |
|
|
$ |
|
|
See accompanying notes to consolidated financial statements.
54
NAVIENT CORPORATION
CONSOLIDATED STATEMENTS OF CHANGES IN STOCKHOLDERS’ EQUITY
(In millions, except share and per share amounts)
(Unaudited)
|
|
|
|
|
|
|
|
|
|
|
|
|
|
|
|
|
|
|
|
|
|
|
Accumulated |
|
|
|
|
|
|
|
|
|
|
|
|
|
|
|
|
|
|
|
|
|
|
|
|
|
Common Stock Shares |
|
|
|
|
|
|
Additional |
|
|
Other |
|
|
|
|
|
|
|
|
|
|
Total |
|
|
|
|
|
|
|
|
|
||||||||||||
|
|
|
|
|
|
|
|
|
|
|
|
|
|
|
Common |
|
|
Paid-In |
|
|
Comprehensive |
|
|
Retained |
|
|
Treasury |
|
|
Stockholders' |
|
|
Noncontrolling |
|
|
Total |
|
||||||||
|
|
|
Issued |
|
|
Treasury |
|
|
Outstanding |
|
|
Stock |
|
|
Capital |
|
|
Income (Loss) |
|
|
Earnings |
|
|
Stock |
|
|
Equity |
|
|
Interest |
|
|
Equity |
|
|||||||||||
|
Balance at December 31, 2020 |
|
|
|
|
|
|
(
|
) |
|
|
|
|
|
$ |
|
|
|
$ |
|
|
|
$ |
(
|
) |
|
$ |
|
|
|
$ |
(
|
) |
|
$ |
|
|
|
$ |
|
|
|
$ |
|
|
|
Comprehensive income (loss): |
|
|
|
|
|
|
|
|
|
|
|
|
|
|
|
|
|
|
|
|
|
|
|
|
|
|
|
|
|
|
|
|
|
|
|
|
|
|
|
|
|
|
|
|
|
Net income |
|
|
— |
|
|
|
— |
|
|
|
— |
|
|
|
— |
|
|
|
— |
|
|
|
— |
|
|
|
|
|
|
|
— |
|
|
|
|
|
|
|
— |
|
|
|
|
|
|
Other comprehensive income (loss), net of tax |
|
|
— |
|
|
|
— |
|
|
|
— |
|
|
|
— |
|
|
|
— |
|
|
|
|
|
|
|
— |
|
|
|
— |
|
|
|
|
|
|
|
— |
|
|
|
|
|
|
Total comprehensive income (loss) |
|
|
— |
|
|
|
— |
|
|
|
— |
|
|
|
— |
|
|
|
— |
|
|
|
— |
|
|
|
— |
|
|
|
— |
|
|
|
|
|
|
|
— |
|
|
|
|
|
|
Cash dividends: |
|
|
|
|
|
|
|
|
|
|
|
|
|
|
|
|
|
|
|
|
|
|
|
|
|
|
|
|
|
|
|
|
|
|
|
|
|
|
|
|
|
|
|
|
|
Common stock ($
|
|
|
— |
|
|
|
— |
|
|
|
— |
|
|
|
— |
|
|
|
— |
|
|
|
— |
|
|
|
(
|
) |
|
|
— |
|
|
|
(
|
) |
|
|
— |
|
|
|
(
|
) |
|
Dividend equivalent units related to employee stock-based compensation plans |
|
|
— |
|
|
|
— |
|
|
|
— |
|
|
|
— |
|
|
|
— |
|
|
|
— |
|
|
|
(
|
) |
|
|
— |
|
|
|
(
|
) |
|
|
— |
|
|
|
(
|
) |
|
Issuance of common shares |
|
|
|
|
|
|
— |
|
|
|
|
|
|
|
— |
|
|
|
|
|
|
|
— |
|
|
|
— |
|
|
|
— |
|
|
|
|
|
|
|
— |
|
|
|
|
|
|
Stock-based compensation expense |
|
|
— |
|
|
|
— |
|
|
|
— |
|
|
|
— |
|
|
|
|
|
|
|
— |
|
|
|
— |
|
|
|
— |
|
|
|
|
|
|
|
— |
|
|
|
|
|
|
Common stock repurchased |
|
|
— |
|
|
|
(
|
) |
|
|
(
|
) |
|
|
— |
|
|
|
— |
|
|
|
— |
|
|
|
— |
|
|
|
(
|
) |
|
|
(
|
) |
|
|
— |
|
|
|
(
|
) |
|
Shares repurchased related to employee stock-based compensation plans |
|
|
— |
|
|
|
(
|
) |
|
|
(
|
) |
|
|
— |
|
|
|
— |
|
|
|
— |
|
|
|
— |
|
|
|
(
|
) |
|
|
(
|
) |
|
|
— |
|
|
|
(
|
) |
|
Net activity in noncontrolling interest |
|
|
— |
|
|
|
— |
|
|
|
— |
|
|
|
— |
|
|
|
— |
|
|
|
— |
|
|
|
— |
|
|
|
— |
|
|
|
— |
|
|
|
(
|
) |
|
|
(
|
) |
|
Balance at September 30, 2021 |
|
|
|
|
|
|
(
|
) |
|
|
|
|
|
$ |
|
|
|
$ |
|
|
|
$ |
(
|
) |
|
$ |
|
|
|
$ |
(
|
) |
|
$ |
|
|
|
$ |
|
|
|
$ |
|
|
|
|
|
|
|
|
|
|
|
|
|
|
|
|
|
|
|
|
|
|
|
|
|
|
|
|
|
|
|
|
|
|
|
|
|
|
|
|
|
|
|
|
|
|
|
|
|
Balance at December 31, 2021 |
|
|
|
|
|
|
(
|
) |
|
|
|
|
|
$ |
|
|
|
$ |
|
|
|
$ |
(
|
) |
|
$ |
|
|
|
$ |
(
|
) |
|
$ |
|
|
|
$ |
|
|
|
$ |
|
|
|
Comprehensive income (loss): |
|
|
|
|
|
|
|
|
|
|
|
|
|
|
|
|
|
|
|
|
|
|
|
|
|
|
|
|
|
|
|
|
|
|
|
|
|
|
|
|
|
|
|
|
|
Net income |
|
|
— |
|
|
|
— |
|
|
|
— |
|
|
|
— |
|
|
|
— |
|
|
|
— |
|
|
|
|
|
|
|
— |
|
|
|
|
|
|
|
— |
|
|
|
|
|
|
Other comprehensive income (loss), net of tax |
|
|
— |
|
|
|
— |
|
|
|
— |
|
|
|
— |
|
|
|
— |
|
|
|
|
|
|
|
— |
|
|
|
— |
|
|
|
|
|
|
|
— |
|
|
|
|
|
|
Total comprehensive income (loss) |
|
|
— |
|
|
|
— |
|
|
|
— |
|
|
|
— |
|
|
|
— |
|
|
|
— |
|
|
|
— |
|
|
|
— |
|
|
|
|
|
|
|
— |
|
|
|
|
|
|
Cash dividends: |
|
|
— |
|
|
|
|
|
|
|
|
|
|
|
|
|
|
|
|
|
|
|
|
|
|
|
|
|
|
|
|
|
|
|
|
|
|
|
|
|
|
|
|
|
|
Common stock ($
|
|
|
— |
|
|
|
— |
|
|
|
— |
|
|
|
— |
|
|
|
— |
|
|
|
— |
|
|
|
(
|
) |
|
|
— |
|
|
|
(
|
) |
|
|
— |
|
|
|
(
|
) |
|
Dividend equivalent units related to employee stock-based compensation plans |
|
|
— |
|
|
|
— |
|
|
|
— |
|
|
|
— |
|
|
|
— |
|
|
|
— |
|
|
|
(
|
) |
|
|
— |
|
|
|
(
|
) |
|
|
— |
|
|
|
(
|
) |
|
Issuance of common shares |
|
|
|
|
|
|
— |
|
|
|
|
|
|
|
— |
|
|
|
|
|
|
|
— |
|
|
|
— |
|
|
|
— |
|
|
|
|
|
|
|
— |
|
|
|
|
|
|
Stock-based compensation expense |
|
|
— |
|
|
|
— |
|
|
|
— |
|
|
|
— |
|
|
|
|
|
|
|
— |
|
|
|
— |
|
|
|
— |
|
|
|
|
|
|
|
— |
|
|
|
|
|
|
Common stock repurchased |
|
|
— |
|
|
|
(
|
) |
|
|
(
|
) |
|
|
— |
|
|
|
— |
|
|
|
— |
|
|
|
— |
|
|
|
(
|
) |
|
|
(
|
) |
|
|
— |
|
|
|
(
|
) |
|
Shares repurchased related to employee stock-based compensation plans |
|
|
— |
|
|
|
(
|
) |
|
|
(
|
) |
|
|
— |
|
|
|
— |
|
|
|
— |
|
|
|
— |
|
|
|
(
|
) |
|
|
(
|
) |
|
|
— |
|
|
|
(
|
) |
|
Net activity in noncontrolling interest |
|
|
— |
|
|
|
— |
|
|
|
— |
|
|
|
— |
|
|
|
— |
|
|
|
— |
|
|
|
— |
|
|
|
— |
|
|
|
— |
|
|
|
(
|
) |
|
|
(
|
) |
|
Balance at September 30, 2022 |
|
|
|
|
|
|
(
|
) |
|
|
|
|
|
$ |
|
|
|
$ |
|
|
|
$ |
|
|
|
$ |
|
|
|
$ |
(
|
) |
|
$ |
|
|
|
$ |
— |
|
|
$ |
|
|
See accompanying notes to consolidated financial statements.
55
NAVIENT CORPORATION
CONSOLIDATED STATEMENTS OF CASH FLOWS
(In millions)
(Unaudited)
|
|
|
Nine Months Ended September 30, |
|
|||||
|
|
|
2022 |
|
|
2021 |
|
||
|
Cash flows from operating activities |
|
|
|
|
|
|
|
|
|
Net income |
|
$ |
|
|
|
$ |
|
|
|
Adjustments to reconcile net income to net cash provided by operating activities: |
|
|
|
|
|
|
|
|
|
(Gains) on sales of education loans |
|
|
— |
|
|
|
(
|
) |
|
Losses on debt repurchases |
|
|
— |
|
|
|
|
|
|
Goodwill and acquired intangible asset impairment and amortization expense |
|
|
|
|
|
|
|
|
|
Stock-based compensation expense |
|
|
|
|
|
|
|
|
|
Mark-to-market (gains) losses on derivative and hedging activities, net |
|
|
(
|
) |
|
|
(
|
) |
|
Provisions for loan losses |
|
|
|
|
|
|
(
|
) |
|
(Decrease) increase in accrued interest receivable |
|
|
(
|
) |
|
|
|
|
|
Increase (decrease) in accrued interest payable |
|
|
|
|
|
|
(
|
) |
|
Decrease in other assets |
|
|
|
|
|
|
|
|
|
(Decrease) increase in other liabilities |
|
|
(
|
) |
|
|
|
|
|
Total adjustments |
|
|
(
|
) |
|
|
(
|
) |
|
Net cash provided by operating activities |
|
|
|
|
|
|
|
|
|
Cash flows from investing activities |
|
|
|
|
|
|
|
|
|
Education loans originated and acquired |
|
|
(
|
) |
|
|
(
|
) |
|
Proceeds from payments on education loans |
|
|
|
|
|
|
|
|
|
Proceeds from sales of education loans |
|
|
— |
|
|
|
|
|
|
Other investing activities, net |
|
|
|
|
|
|
|
|
|
Net cash provided by investing activities |
|
|
|
|
|
|
|
|
|
Cash flows from financing activities |
|
|
|
|
|
|
|
|
|
Borrowings collateralized by loans in trust - issued |
|
|
|
|
|
|
|
|
|
Borrowings collateralized by loans in trust - repaid |
|
|
(
|
) |
|
|
(
|
) |
|
Asset-backed commercial paper conduits, net |
|
|
|
|
|
|
(
|
) |
|
Long-term unsecured notes issued |
|
|
— |
|
|
|
|
|
|
Long-term unsecured notes repaid |
|
|
(
|
) |
|
|
(
|
) |
|
Other financing activities, net |
|
|
|
|
|
|
|
|
|
Common stock repurchased |
|
|
(
|
) |
|
|
(
|
) |
|
Common dividends paid |
|
|
(
|
) |
|
|
(
|
) |
|
Net cash used in financing activities |
|
|
(
|
) |
|
|
(
|
) |
|
Net increase (decrease) in cash, cash equivalents, restricted cash and restricted cash equivalents |
|
|
|
|
|
|
(
|
) |
|
Cash, cash equivalents, restricted cash and restricted cash equivalents at beginning of period |
|
|
|
|
|
|
|
|
|
Cash, cash equivalents, restricted cash and restricted cash equivalents at end of period |
|
$ |
|
|
|
$ |
|
|
|
Supplemental disclosure of cash flow information: |
|
|
|
|
|
|
|
|
|
Cash disbursements made (refunds received) for: |
|
|
|
|
|
|
|
|
|
Interest paid |
|
$ |
|
|
|
$ |
|
|
|
Income taxes paid |
|
$ |
|
|
|
$ |
|
|
|
Income taxes refunds received |
|
$ |
(
|
) |
|
$ |
(
|
) |
|
Noncash activity: |
|
|
|
|
|
|
|
|
|
Investing activity - Held-to-maturity asset backed securities retained related to sales of education loans |
|
$ |
— |
|
|
$ |
|
|
|
Operating activity - Servicing assets recognized upon sales of education loans |
|
$ |
— |
|
|
$ |
|
|
|
|
|
|
|
|
|
|
|
|
|
Reconciliation of the Consolidated Statements of Cash Flows to the Consolidated Balance Sheets: |
|
|
|
|
|
|
|
|
|
Cash and cash equivalents |
|
$ |
|
|
|
$ |
|
|
|
Restricted cash and restricted cash equivalents |
|
|
|
|
|
|
|
|
|
Total cash, cash equivalents, restricted cash and restricted cash equivalents at end of period |
|
$ |
|
|
|
$ |
|
|
See accompanying notes to consolidated financial statements.
56
NAVIENT CORPORATION
NOTES TO CONSOLIDATED FINANCIAL STATEMENTS
(Information at September 30, 2022 and for the three and nine months ended
September 30, 2022 and 2021 is unaudited)
1. Significant Accounting Policies
Basis of Presentation
The accompanying unaudited, consolidated financial statements of Navient have been prepared in accordance with generally accepted accounting principles in the United States of America (GAAP) for interim financial information. Accordingly, they do not include all of the information and footnotes required by GAAP for complete consolidated financial statements. The consolidated financial statements include the accounts of Navient and its majority-owned and controlled subsidiaries and those Variable Interest Entities (VIEs) for which we are the primary beneficiary, after eliminating the effects of intercompany accounts and transactions. In the opinion of management, all adjustments considered necessary for a fair statement of the results for the interim periods have been included. The preparation of financial statements in conformity with GAAP requires management to make estimates and assumptions that affect the amounts reported in the consolidated financial statements and accompanying notes. Actual results could differ from those estimates. Operating results for the three and nine months ended September 30, 2022 are not necessarily indicative of the results for the year ending December 31, 2021 or for any other period. These unaudited financial statements should be read in conjunction with the audited financial statements and related notes included in our Annual Report on Form 10-K for the year ended December 31, 2021 (the 2021 Form 10-K). Definitions for certain capitalized terms used but not otherwise defined in this Quarterly Report on Form 10-Q can be found in our 2021 Form 10-K.
Recently Issued Accounting Pronouncements
In March 2022, the FASB issued ASU No. 2022-02, “Financial Instruments – Credit Losses: Troubled Debt Restructurings and Vintage Disclosures,” which eliminates the troubled debt restructurings (TDRs) recognition and measurement guidance and instead requires an entity to evaluate whether the modification represents a new loan or a continuation of an existing loan. The ASU also enhances the disclosure requirements for certain modifications of receivables made to borrowers experiencing financial difficulty. This guidance is effective on January 1, 2023. Early adoption is permissible. The Company is currently assessing the potential impact of this amendment.
57
NAVIENT CORPORATION
NOTES TO CONSOLIDATED FINANCIAL STATEMENTS
(Information at September 30, 2022 and for the three and nine months ended
September 30, 2022 and 2021 is unaudited)
2. Allowance for Loan Losses
Allowance for Loan Losses Metrics
|
|
|
Three Months Ended September 30, 2022 |
|
|||||||||
|
(Dollars in millions) |
|
FFELP Loans |
|
|
Private Education Loans |
|
|
Total |
|
|||
|
Beginning balance |
|
$ |
|
|
|
$ |
|
|
|
$ |
|
|
|
Total provision |
|
|
— |
|
|
|
|
|
|
|
|
|
|
Charge-offs: |
|
|
|
|
|
|
|
|
|
|
|
|
|
Gross charge-offs |
|
|
(
|
) |
|
|
(
|
) |
|
|
(
|
) |
|
Expected future recoveries on current period gross charge-offs |
|
|
— |
|
|
|
|
|
|
|
|
|
|
Total (1) |
|
|
(
|
) |
|
|
(
|
) |
|
|
(
|
) |
|
Adjustment resulting from the change in charge-off rate (2) |
|
|
— |
|
|
|
(
|
) |
|
|
(
|
) |
|
Net charge-offs |
|
|
(
|
) |
|
|
(
|
) |
|
|
(
|
) |
|
Decrease in expected future recoveries on previously fully charged-off loans (3) |
|
|
— |
|
|
|
|
|
|
|
|
|
|
Allowance at end of period |
|
$ |
|
|
|
$ |
|
|
|
$ |
|
|
|
Net charge-offs as a percentage of average loans in repayment, excluding the net adjustment resulting from the change in charge-off rate (annualized) (2) |
|
|
|
% |
|
|
|
% |
|
|
|
|
|
Net adjustment resulting from the change in charge-off rate as a percentage of average loans in repayment (annualized) (2) |
|
|
— |
% |
|
|
|
% |
|
|
|
|
|
Net charge-offs as a percentage of average loans in repayment (annualized) |
|
|
|
% |
|
|
|
% |
|
|
|
|
|
Ending total loans |
|
$ |
|
|
|
$ |
|
|
|
|
|
|
|
Average loans in repayment |
|
$ |
|
|
|
$ |
|
|
|
|
|
|
|
Ending loans in repayment |
|
$ |
|
|
|
$ |
|
|
|
|
|
|
|
( 1 ) |
Charge-offs are reported net of expected recoveries. For Private Education Loans we charge off the estimated loss of a defaulted loan balance by charging off the entire defaulted loan balance and estimating recoveries on a pool basis. These estimated recoveries are referred to as “expected future recoveries on previously fully charged-off loans.” For FFELP Loans, the recovery is received at the time of charge-off. |
|
( 2 ) |
In third-quarter 2022, the net charge-off rate on defaulted Private Education Loans increased from
|
|
(3) |
At the end of each month, for Private Education Loans that are 212 days past due, we charge off the estimated loss of a defaulted loan balance by charging off the entire loan balance and estimating recoveries on a pool basis. These estimated recoveries are referred to as “expected future recoveries on previously fully charged-off loans.” If actual periodic recoveries are less than expected, the difference is immediately reflected as a reduction to expected future recoveries on previously fully charged-off loans. If actual periodic recoveries are greater than expected, they will be reflected as a recovery through the allowance for Private Education Loan losses once the cumulative recovery amount exceeds the cumulative amount originally expected to be recovered. The following table summarizes the activity in the expected future recoveries on previously fully charged-off loans: |
|
|
|
Three Months Ended September 30, |
|
|
|
(Dollars in millions) |
|
2022 |
|
|
|
Beginning of period expected future recoveries on previously fully charged-off loans |
|
$ |
|
|
|
Expected future recoveries of current period defaults |
|
|
|
|
|
Recoveries (cash collected) |
|
|
(
|
) |
|
Charge-offs (as a result of lower recovery expectations) |
|
|
(
|
) |
|
End of period expected future recoveries on previously fully charged-off loans |
|
$ |
|
|
|
Change in balance during period |
|
$ |
(
|
) |
58
NAVIENT CORPORATION
NOTES TO CONSOLIDATED FINANCIAL STATEMENTS
(Information at September 30, 2022 and for the three and nine months ended
September 30, 2022 and 2021 is unaudited)
2. Allowance for Loan Losses (Continued)
|
|
|
Three Months Ended September 30, 2021 |
|
|||||||||
|
(Dollars in millions) |
|
FFELP Loans |
|
|
Private Education Loans |
|
|
Total |
|
|||
|
Beginning balance |
|
$ |
|
|
|
$ |
|
|
|
$ |
|
|
|
Total provision |
|
|
— |
|
|
|
|
|
|
|
|
|
|
Charge-offs: |
|
|
|
|
|
|
|
|
|
|
|
|
|
Gross charge-offs |
|
|
(
|
) |
|
|
(
|
) |
|
|
(
|
) |
|
Expected future recoveries on current period gross charge-offs |
|
|
— |
|
|
|
|
|
|
|
|
|
|
Total (1) |
|
|
(
|
) |
|
|
(
|
) |
|
|
(
|
) |
|
Adjustment resulting from the change in charge-off rate (2) |
|
|
— |
|
|
|
(
|
) |
|
|
(
|
) |
|
Net charge-offs |
|
|
(
|
) |
|
|
(
|
) |
|
|
(
|
) |
|
Decrease in expected future recoveries on previously fully charged-off loans (3) |
|
|
— |
|
|
|
|
|
|
|
|
|
|
Allowance at end of period |
|
$ |
|
|
|
$ |
|
|
|
$ |
|
|
|
Net charge-offs as a percentage of average loans in repayment, excluding the net adjustment resulting from the change in charge-off rate (annualized) (2) |
|
|
|
% |
|
|
|
% |
|
|
|
|
|
Net adjustment resulting from the change in charge-off rate as a percentage of average loans in repayment (annualized) (2) |
|
|
— |
% |
|
|
|
% |
|
|
|
|
|
Net charge-offs as a percentage of average loans in repayment (annualized) |
|
|
|
% |
|
|
|
% |
|
|
|
|
|
Ending total loans |
|
$ |
|
|
|
$ |
|
|
|
|
|
|
|
Average loans in repayment |
|
$ |
|
|
|
$ |
|
|
|
|
|
|
|
Ending loans in repayment |
|
$ |
|
|
|
$ |
|
|
|
|
|
|
|
( 1 ) |
Charge-offs are reported net of expected recoveries. For Private Education Loans we charge off the estimated loss of a defaulted loan balance by charging off the entire defaulted loan balance and estimating recoveries on a pool basis. These estimated recoveries are referred to as “expected future recoveries on previously fully charged-off loans.” For FFELP Loans, the recovery is received at the time of charge-off. |
|
( 2 ) |
In third-quarter 2021, the net charge-off rate on defaulted Private Education Loans increased from
|
|
( 3 ) |
At the end of each month, for Private Education Loans that are 212 days past due, we charge off the estimated loss of a defaulted loan balance by charging off the entire loan balance and estimating recoveries on a pool basis. These estimated recoveries are referred to as “expected future recoveries on previously fully charged-off loans.” If actual periodic recoveries are less than expected, the difference is immediately reflected as a reduction to expected future recoveries on previously fully charged-off loans. If actual periodic recoveries are greater than expected, they will be reflected as a recovery through the allowance for Private Education Loan losses once the cumulative recovery amount exceeds the cumulative amount originally expected to be recovered. The following table summarizes the activity in the expected future recoveries on previously fully charged-off loans: |
|
|
|
Three Months Ended September 30, |
|
|
|
(Dollars in millions) |
|
2021 |
|
|
|
Beginning of period expected future recoveries on previously fully charged-off loans |
|
$ |
|
|
|
Expected future recoveries of current period defaults |
|
|
|
|
|
Recoveries (cash collected) |
|
|
(
|
) |
|
Charge-offs (as a result of lower recovery expectations) |
|
|
(
|
) |
|
End of period expected future recoveries on previously fully charged-off loans |
|
$ |
|
|
|
Change in balance during period |
|
$ |
(
|
) |
59
NAVIENT CORPORATION
NOTES TO CONSOLIDATED FINANCIAL STATEMENTS
(Information at September 30, 2022 and for the three and nine months ended
September 30, 2022 and 2021 is unaudited)
2. Allowance for Loan Losses (Continued)
|
|
|
Nine Months Ended September 30, 2022 |
|
|||||||||
|
(Dollars in millions) |
|
FFELP Loans |
|
|
Private Education Loans |
|
|
Total |
|
|||
|
Beginning balance |
|
$ |
|
|
|
$ |
|
|
|
$ |
|
|
|
Total provision |
|
|
— |
|
|
|
|
|
|
|
|
|
|
Charge-offs: |
|
|
|
|
|
|
|
|
|
|
|
|
|
Gross charge-offs |
|
|
(
|
) |
|
|
(
|
) |
|
|
(
|
) |
|
Expected future recoveries on current period gross charge-offs |
|
|
— |
|
|
|
|
|
|
|
|
|
|
Total (1) |
|
|
(
|
) |
|
|
(
|
) |
|
|
(
|
) |
|
Adjustment resulting from the change in charge-off rate (2) |
|
|
— |
|
|
|
(
|
) |
|
|
(
|
) |
|
Net charge-offs |
|
|
(
|
) |
|
|
(
|
) |
|
|
(
|
) |
|
Decrease in expected future recoveries on previously fully charged-off loans (3) |
|
|
— |
|
|
|
|
|
|
|
|
|
|
Allowance at end of period |
|
$ |
|
|
|
$ |
|
|
|
$ |
|
|
|
Net charge-offs as a percentage of average loans in repayment, excluding the net adjustment resulting from the change in charge-off rate (annualized) (2) |
|
|
|
% |
|
|
|
% |
|
|
|
|
|
Net adjustment resulting from the change in charge-off rate as a percentage of average loans in repayment (annualized) (2) |
|
|
— |
% |
|
|
|
% |
|
|
|
|
|
Net charge-offs as a percentage of average loans in repayment (annualized) |
|
|
|
% |
|
|
|
% |
|
|
|
|
|
Ending total loans |
|
$ |
|
|
|
$ |
|
|
|
|
|
|
|
Average loans in repayment |
|
$ |
|
|
|
$ |
|
|
|
|
|
|
|
Ending loans in repayment |
|
$ |
|
|
|
$ |
|
|
|
|
|
|
|
( 1 ) |
Charge-offs are reported net of expected recoveries. For Private Education Loans we charge off the estimated loss of a defaulted loan balance by charging off the entire defaulted loan balance and estimating recoveries on a pool basis. These estimated recoveries are referred to as “expected future recoveries on previously fully charged-off loans.” For FFELP Loans, the recovery is received at the time of charge-off. |
|
( 2 ) |
In third-quarter 2022, the net charge-off rate on defaulted Private Education Loans increased from
|
|
(3) |
At the end of each month, for Private Education Loans that are 212 days past due, we charge off the estimated loss of a defaulted loan balance by charging off the entire loan balance and estimating recoveries on a pool basis. These estimated recoveries are referred to as “expected future recoveries on previously fully charged-off loans.” If actual periodic recoveries are less than expected, the difference is immediately reflected as a reduction to expected future recoveries on previously fully charged-off loans. If actual periodic recoveries are greater than expected, they will be reflected as a recovery through the allowance for Private Education Loan losses once the cumulative recovery amount exceeds the cumulative amount originally expected to be recovered. The following table summarizes the activity in the expected future recoveries on previously fully charged-off loans: |
|
|
|
Nine Months Ended September 30, |
|
|
|
(Dollars in millions) |
|
2022 |
|
|
|
Beginning of period expected future recoveries on previously fully charged-off loans |
|
$ |
|
|
|
Expected future recoveries of current period defaults |
|
|
|
|
|
Recoveries (cash collected) |
|
|
(
|
) |
|
Charge-offs (as a result of lower recovery expectations) |
|
|
(
|
) |
|
End of period expected future recoveries on previously fully charged-off loans |
|
$ |
|
|
|
Change in balance during period |
|
$ |
(
|
) |
60
NAVIENT CORPORATION
NOTES TO CONSOLIDATED FINANCIAL STATEMENTS
(Information at September 30, 2022 and for the three and nine months ended
September 30, 2022 and 2021 is unaudited)
2. Allowance for Loan Losses (Continued)
|
|
|
Nine Months Ended September 30, 2021 |
|
|||||||||
|
(Dollars in millions) |
|
FFELP Loans |
|
|
Private Education Loans |
|
|
Other Loans |
|
|||
|
Beginning balance |
|
$ |
|
|
|
$ |
|
|
|
$ |
|
|
|
Provision: |
|
|
|
|
|
|
|
|
|
|
|
|
|
Reversal of allowance related to loan sales (1) |
|
|
— |
|
|
|
(
|
) |
|
|
(
|
) |
|
Remaining provision |
|
|
— |
|
|
|
|
|
|
|
|
|
|
Total provision |
|
|
— |
|
|
|
(
|
) |
|
|
(
|
) |
|
Charge-offs: |
|
|
|
|
|
|
|
|
|
|
|
|
|
Gross charge-offs |
|
|
(
|
) |
|
|
(
|
) |
|
|
(
|
) |
|
Expected future recoveries on current period gross charge-offs |
|
|
— |
|
|
|
|
|
|
|
|
|
|
Total (2) |
|
|
(
|
) |
|
|
(
|
) |
|
|
(
|
) |
|
Adjustment resulting from the change in charge-off rate (3) |
|
|
— |
|
|
|
(
|
) |
|
|
(
|
) |
|
Net charge-offs |
|
|
(
|
) |
|
|
(
|
) |
|
|
(
|
) |
|
Decrease in expected future recoveries on previously fully charged-off loans (4) |
|
|
— |
|
|
|
|
|
|
|
|
|
|
Allowance at end of period |
|
$ |
|
|
|
$ |
|
|
|
$ |
|
|
|
Net charge-offs as a percentage of average loans in repayment, excluding the net adjustment resulting from the change in charge-off rate (annualized) (3) |
|
|
|
% |
|
|
|
% |
|
|
|
|
|
Net adjustment resulting from the change in charge-off rate as a percentage of average loans in repayment (annualized) (3) |
|
|
— |
% |
|
|
|
% |
|
|
|
|
|
Net charge-offs as a percentage of average loans in repayment (annualized) |
|
|
|
% |
|
|
|
% |
|
|
|
|
|
Ending total loans |
|
$ |
|
|
|
$ |
|
|
|
|
|
|
|
Average loans in repayment |
|
$ |
|
|
|
$ |
|
|
|
|
|
|
|
Ending loans in repayment |
|
$ |
|
|
|
$ |
|
|
|
|
|
|
|
(1) |
In connection with the sale of approximately $
|
|
(2) |
Charge-offs are reported net of expected recoveries. For Private Education Loans we charge off the estimated loss of a defaulted loan balance by charging off the entire defaulted loan balance and estimating recoveries on a pool basis. These estimated recoveries are referred to as “expected future recoveries on previously fully charged-off loans.” For FFELP Loans, the recovery is received at the time of charge-off. |
|
( 3 ) |
In third-quarter 2021, the net charge-off rate on defaulted Private Education Loans increased from
|
|
( 4 ) |
At the end of each month, for Private Education Loans that are 212 days past due, we charge off the estimated loss of a defaulted loan balance by charging off the entire loan balance and estimating recoveries on a pool basis. These estimated recoveries are referred to as “expected future recoveries on previously fully charged-off loans.” If actual periodic recoveries are less than expected, the difference is immediately reflected as a reduction to expected future recoveries on previously fully charged-off loans. If actual periodic recoveries are greater than expected, they will be reflected as a recovery through the allowance for Private Education Loan losses once the cumulative recovery amount exceeds the cumulative amount originally expected to be recovered. The following table summarizes the activity in the expected future recoveries on previously fully charged-off loans: |
|
|
|
Nine Months Ended September 30, |
|
|
|
(Dollars in millions) |
|
2021 |
|
|
|
Beginning of period expected future recoveries on previously fully charged-off loans |
|
$ |
|
|
|
Expected future recoveries of current period defaults |
|
|
|
|
|
Recoveries (cash collected) |
|
|
(
|
) |
|
Charge-offs (as a result of lower recovery expectations) |
|
|
(
|
) |
|
End of period expected future recoveries on previously fully charged-off loans |
|
$ |
|
|
|
Change in balance during period |
|
$ |
(
|
) |
61
NAVIENT CORPORATION
NOTES TO CONSOLIDATED FINANCIAL STATEMENTS
(Information at September 30, 2022 and for the three and nine months ended
September 30, 2022 and 2021 is unaudited)
2. Allowance for Loan Losses (Continued)
Troubled Debt Restructurings (“TDRs”)
We sometimes modify the terms of loans for customers experiencing financial difficulty. Certain Private Education Loans for which we have granted either a forbearance of greater than three months, an interest rate reduction or an extended repayment plan are classified as TDRs. Approximately
The following table provides the amount of loans modified in the periods presented that resulted in a TDR. Additionally, the table summarizes charge-offs occurring in the TDR portfolio, as well as TDRs for which a payment default occurred in the current period within 12 months of the loan first being designated as a TDR. We define payment default as
|
|
|
Three Months Ended September 30, |
|
|
Nine Months Ended September 30, |
|
||||||||||
|
(Dollars in millions) |
|
2022 |
|
|
2021 |
|
|
2022 |
|
|
2021 |
|
||||
|
Modified loans |
|
$ |
|
|
|
$ |
|
|
|
$ |
|
|
|
$ |
|
|
|
Charge-offs |
|
$ |
|
|
|
$ |
|
|
|
$ |
|
|
|
$ |
|
|
|
Payment default |
|
$ |
|
|
|
$ |
|
|
|
$ |
|
|
|
$ |
|
|
62
NAVIENT CORPORATION
NOTES TO CONSOLIDATED FINANCIAL STATEMENTS
(Information at September 30, 2022 and for the three and nine months ended
September 30, 2022 and 2021 is unaudited)
2. Allowance for Loan Losses (Continued)
Key Credit Quality Indicators
We assess and determine the collectability of our education loan portfolios by evaluating certain risk characteristics we refer to as key credit quality indicators. Key credit quality indicators are incorporated into the allowance for loan losses calculation.
FFELP Loans
FFELP Loans are substantially insured and guaranteed as to their principal and accrued interest in the event of default. The key credit quality indicators are loan status and loan type.
|
|
|
FFELP Loan Delinquencies |
|
|||||||||||||||||||||
|
|
|
September 30, 2022 |
|
|
December 31, 2021 |
|
|
September 30, 2021 |
|
|||||||||||||||
|
(Dollars in millions) |
|
Balance |
|
|
% |
|
|
Balance |
|
|
% |
|
|
Balance |
|
|
% |
|
||||||
|
Loans in-school/grace/deferment (1) |
|
$ |
|
|
|
|
|
|
|
$ |
|
|
|
|
|
|
|
$ |
|
|
|
|
|
|
|
Loans in forbearance (2) |
|
|
|
|
|
|
|
|
|
|
|
|
|
|
|
|
|
|
|
|
|
|
|
|
|
Loans in repayment and percentage of each status: |
|
|
|
|
|
|
|
|
|
|
|
|
|
|
|
|
|
|
|
|
|
|
|
|
|
Loans current |
|
|
|
|
|
|
|
% |
|
|
|
|
|
|
|
% |
|
|
|
|
|
|
|
% |
|
Loans delinquent 31-60 days (3) |
|
|
|
|
|
|
|
|
|
|
|
|
|
|
|
|
|
|
|
|
|
|
|
|
|
Loans delinquent 61-90 days (3) |
|
|
|
|
|
|
|
|
|
|
|
|
|
|
|
|
|
|
|
|
|
|
|
|
|
Loans delinquent greater than 90 days (3) |
|
|
|
|
|
|
|
|
|
|
|
|
|
|
|
|
|
|
|
|
|
|
|
|
|
Total FFELP Loans in repayment |
|
|
|
|
|
|
|
% |
|
|
|
|
|
|
|
% |
|
|
|
|
|
|
|
% |
|
Total FFELP Loans |
|
|
|
|
|
|
|
|
|
|
|
|
|
|
|
|
|
|
|
|
|
|
|
|
|
FFELP Loan allowance for losses |
|
|
(
|
) |
|
|
|
|
|
|
(
|
) |
|
|
|
|
|
|
(
|
) |
|
|
|
|
|
FFELP Loans, net |
|
$ |
|
|
|
|
|
|
|
$ |
|
|
|
|
|
|
|
$ |
|
|
|
|
|
|
|
Percentage of FFELP Loans in repayment |
|
|
|
|
|
|
|
% |
|
|
|
|
|
|
|
% |
|
|
|
|
|
|
|
% |
|
Delinquencies as a percentage of FFELP Loans in repayment |
|
|
|
|
|
|
|
% |
|
|
|
|
|
|
|
% |
|
|
|
|
|
|
|
% |
|
FFELP Loans in forbearance as a percentage of loans in repayment and forbearance |
|
|
|
|
|
|
|
% |
|
|
|
|
|
|
|
% |
|
|
|
|
|
|
|
% |
|
(1) |
Loans for customers who may still be attending school or engaging in other permitted educational activities and are not yet required to make payments on their loans, e.g., residency periods for medical students or a grace period for bar exam preparation, as well as loans for customers who have requested and qualify for other permitted program deferments such as military, unemployment, or economic hardships. |
|
(2) |
Loans for customers who have used their allowable deferment time or do not qualify for deferment, that need additional time to obtain employment or who have temporarily ceased making full payments due to hardship or other factors such as disaster relief, including COVID-19 relief programs, consistent with established loan program servicing policies and procedures. |
|
(3) |
The period of delinquency is based on the number of days scheduled payments are contractually past due. |
|
|
|
Loan type :
|
(Dollars in millions) |
|
September 30, 2022 |
|
|
September 30, 2021 |
|
|
Change |
|
|||
|
Stafford Loans |
|
$ |
|
|
|
$ |
|
|
|
$ |
(
|
) |
|
Consolidation Loans |
|
|
|
|
|
|
|
|
|
|
(
|
) |
|
Rehab Loans |
|
|
|
|
|
|
|
|
|
|
(
|
) |
|
Total loans, gross |
|
$ |
|
|
|
$ |
|
|
|
$ |
(
|
) |
63
NAVIENT CORPORATION
NOTES TO CONSOLIDATED FINANCIAL STATEMENTS
(Information at September 30, 2022 and for the three and nine months ended
September 30, 2022 and 2021 is unaudited)
2. Allowance for Loan Losses (Continued)
Private Education Loans
The key credit quality indicators are credit scores (FICO scores), loan status, loan seasoning, whether a loan is a TDR, the existence of a cosigner and school type. The FICO score is the higher of the borrower or co-borrower score and is updated at least every six months while school type is assessed at origination. The other Private Education Loan key quality indicators are updated quarterly.
|
|
|
Private Education Loan Credit Quality Indicators by Origination Year |
|
|||||||||||||||||||||||||||||
|
|
|
September 30, 2022 |
|
|||||||||||||||||||||||||||||
|
(Dollars in millions) |
|
September 30, 2022 |
|
|
2021 |
|
|
2020 |
|
|
2019 |
|
|
2018 |
|
|
Prior |
|
|
Total |
|
|
% of Total |
|
||||||||
|
Credit Quality Indicators |
|
|
|
|
|
|
|
|
|
|
|
|
|
|
|
|
|
|
|
|
|
|
|
|
|
|
|
|
|
|
|
|
|
FICO Scores: |
|
|
|
|
|
|
|
|
|
|
|
|
|
|
|
|
|
|
|
|
|
|
|
|
|
|
|
|
|
|
|
|
|
640 and above |
|
$ |
|
|
|
$ |
|
|
|
$ |
|
|
|
$ |
|
|
|
$ |
|
|
|
$ |
|
|
|
$ |
|
|
|
|
|
% |
|
Below 640 |
|
|
|
|
|
|
|
|
|
|
|
|
|
|
|
|
|
|
|
|
|
|
|
|
|
|
|
|
|
|
|
|
|
Total |
|
$ |
|
|
|
$ |
|
|
|
$ |
|
|
|
$ |
|
|
|
$ |
|
|
|
$ |
|
|
|
$ |
|
|
|
|
|
% |
|
Loan Status: |
|
|
|
|
|
|
|
|
|
|
|
|
|
|
|
|
|
|
|
|
|
|
|
|
|
|
|
|
|
|
|
|
|
In-school/grace/ deferment/forbearance |
|
$ |
|
|
|
$ |
|
|
|
$ |
|
|
|
$ |
|
|
|
$ |
|
|
|
$ |
|
|
|
$ |
|
|
|
|
|
% |
|
Current/90 days or less delinquent |
|
|
|
|
|
|
|
|
|
|
|
|
|
|
|
|
|
|
|
|
|
|
|
|
|
|
|
|
|
|
|
|
|
Greater than 90 days delinquent |
|
|
|
|
|
|
|
|
|
|
|
|
|
|
|
|
|
|
|
|
|
|
|
|
|
|
|
|
|
|
|
|
|
Total |
|
$ |
|
|
|
$ |
|
|
|
$ |
|
|
|
$ |
|
|
|
$ |
|
|
|
$ |
|
|
|
$ |
|
|
|
|
|
% |
|
Seasoning (1) : |
|
|
|
|
|
|
|
|
|
|
|
|
|
|
|
|
|
|
|
|
|
|
|
|
|
|
|
|
|
|
|
|
|
1-12 payments |
|
$ |
|
|
|
$ |
|
|
|
$ |
|
|
|
$ |
|
|
|
$ |
|
|
|
$ |
|
|
|
$ |
|
|
|
|
|
% |
|
13-24 payments |
|
|
— |
|
|
|
|
|
|
|
|
|
|
|
|
|
|
|
|
|
|
|
|
|
|
|
|
|
|
|
|
|
|
25-36 payments |
|
|
— |
|
|
|
— |
|
|
|
|
|
|
|
|
|
|
|
|
|
|
|
|
|
|
|
|
|
|
|
|
|
|
37-48 payments |
|
|
— |
|
|
|
— |
|
|
|
— |
|
|
|
|
|
|
|
|
|
|
|
|
|
|
|
|
|
|
|
|
|
|
More than 48 payments |
|
|
— |
|
|
|
— |
|
|
|
— |
|
|
|
— |
|
|
|
|
|
|
|
|
|
|
|
|
|
|
|
|
|
|
Loans in-school/ grace/deferment |
|
|
|
|
|
|
|
|
|
|
|
|
|
|
|
|
|
|
|
|
|
|
|
|
|
|
|
|
|
|
|
|
|
Total |
|
$ |
|
|
|
$ |
|
|
|
$ |
|
|
|
$ |
|
|
|
$ |
|
|
|
$ |
|
|
|
$ |
|
|
|
|
|
% |
|
TDR Status: |
|
|
|
|
|
|
|
|
|
|
|
|
|
|
|
|
|
|
|
|
|
|
|
|
|
|
|
|
|
|
|
|
|
TDR |
|
$ |
|
|
|
$ |
|
|
|
$ |
|
|
|
$ |
|
|
|
$ |
|
|
|
$ |
|
|
|
$ |
|
|
|
|
|
% |
|
Non-TDR |
|
|
|
|
|
|
|
|
|
|
|
|
|
|
|
|
|
|
|
|
|
|
|
|
|
|
|
|
|
|
|
|
|
Total |
|
$ |
|
|
|
$ |
|
|
|
$ |
|
|
|
$ |
|
|
|
$ |
|
|
|
$ |
|
|
|
$ |
|
|
|
|
|
% |
|
Cosigners: |
|
|
|
|
|
|
|
|
|
|
|
|
|
|
|
|
|
|
|
|
|
|
|
|
|
|
|
|
|
|
|
|
|
With cosigner (2) |
|
$ |
|
|
|
$ |
|
|
|
$ |
|
|
|
$ |
|
|
|
$ |
— |
|
|
$ |
|
|
|
$ |
|
|
|
|
|
% |
|
Without cosigner |
|
|
|
|
|
|
|
|
|
|
|
|
|
|
|
|
|
|
|
|
|
|
|
|
|
|
|
|
|
|
|
|
|
Total |
|
$ |
|
|
|
$ |
|
|
|
$ |
|
|
|
$ |
|
|
|
$ |
|
|
|
$ |
|
|
|
$ |
|
|
|
|
|
% |
|
School Type: |
|
|
|
|
|
|
|
|
|
|
|
|
|
|
|
|
|
|
|
|
|
|
|
|
|
|
|
|
|
|
|
|
|
Not-for-profit |
|
$ |
|
|
|
$ |
|
|
|
$ |
|
|
|
$ |
|
|
|
$ |
|
|
|
$ |
|
|
|
$ |
|
|
|
|
|
% |
|
For-profit |
|
|
|
|
|
|
|
|
|
|
|
|
|
|
|
|
|
|
|
|
|
|
|
|
|
|
|
|
|
|
|
|
|
Total |
|
$ |
|
|
|
$ |
|
|
|
$ |
|
|
|
$ |
|
|
|
$ |
|
|
|
$ |
|
|
|
$ |
|
|
|
|
|
% |
|
Allowance for loan losses |
|
|
|
|
|
|
|
|
|
|
|
|
|
|
|
|
|
|
|
|
|
|
|
|
|
|
(
|
) |
|
|
|
|
|
Total loans, net |
|
|
|
|
|
|
|
|
|
|
|
|
|
|
|
|
|
|
|
|
|
|
|
|
|
$ |
|
|
|
|
|
|
|
(1) |
Number of months in active repayment for which a scheduled payment was received. |
|
(2) |
Excluding Private Education Refinance Loans, which do not have a cosigner, the cosigner rate was
|
64
NAVIENT CORPORATION
NOTES TO CONSOLIDATED FINANCIAL STATEMENTS
(Information at September 30, 2022 and for the three and nine months ended
September 30, 2022 and 2021 is unaudited)
2. Allowance for Loan Losses (Continued)
|
|
|
Private Education Loan Credit Quality Indicators by Origination Year |
|
|||||||||||||||||||||||||||||
|
|
|
September 30, 2021 |
|
|||||||||||||||||||||||||||||
|
(Dollars in millions) |
|
September 30, 2021 |
|
|
2020 |
|
|
2019 |
|
|
2018 |
|
|
2017 |
|
|
Prior |
|
|
Total |
|
|
% of Total |
|
||||||||
|
Credit Quality Indicators |
|
|
|
|
|
|
|
|
|
|
|
|
|
|
|
|
|
|
|
|
|
|
|
|
|
|
|
|
|
|
|
|
|
FICO Scores: |
|
|
|
|
|
|
|
|
|
|
|
|
|
|
|
|
|
|
|
|
|
|
|
|
|
|
|
|
|
|
|
|
|
640 and above |
|
$ |
|
|
|
$ |
|
|
|
$ |
|
|
|
$ |
|
|
|
$ |
|
|
|
$ |
|
|
|
$ |
|
|
|
|
|
% |
|
Below 640 |
|
|
|
|
|
|
|
|
|
|
|
|
|
|
|
|
|
|
|
|
|
|
|
|
|
|
|
|
|
|
|
|
|
Total |
|
$ |
|
|
|
$ |
|
|
|
$ |
|
|
|
$ |
|
|
|
$ |
|
|
|
$ |
|
|
|
$ |
|
|
|
|
|
% |
|
Loan Status: |
|
|
|
|
|
|
|
|
|
|
|
|
|
|
|
|
|
|
|
|
|
|
|
|
|
|
|
|
|
|
|
|
|
In-school/grace/ deferment/forbearance |
|
$ |
|
|
|
$ |
|
|
|
$ |
|
|
|
$ |
|
|
|
$ |
|
|
|
$ |
|
|
|
$ |
|
|
|
|
|
% |
|
Current/90 days or less delinquent |
|
|
|
|
|
|
|
|
|
|
|
|
|
|
|
|
|
|
|
|
|
|
|
|
|
|
|
|
|
|
|
|
|
Greater than 90 days delinquent |
|
|
|
|
|
|
|
|
|
|
|
|
|
|
|
|
|
|
|
|
|
|
|
|
|
|
|
|
|
|
|
|
|
Total |
|
$ |
|
|
|
$ |
|
|
|
$ |
|
|
|
$ |
|
|
|
$ |
|
|
|
$ |
|
|
|
$ |
|
|
|
|
|
% |
|
Seasoning (1) : |
|
|
|
|
|
|
|
|
|
|
|
|
|
|
|
|
|
|
|
|
|
|
|
|
|
|
|
|
|
|
|
|
|
1-12 payments |
|
$ |
|
|
|
$ |
|
|
|
$ |
|
|
|
$ |
|
|
|
$ |
|
|
|
$ |
|
|
|
$ |
|
|
|
|
|
% |
|
13-24 payments |
|
|
— |
|
|
|
|
|
|
|
|
|
|
|
|
|
|
|
|
|
|
|
|
|
|
|
|
|
|
|
|
|
|
25-36 payments |
|
|
— |
|
|
|
— |
|
|
|
|
|
|
|
|
|
|
|
|
|
|
|
|
|
|
|
|
|
|
|
|
|
|
37-48 payments |
|
|
— |
|
|
|
— |
|
|
|
— |
|
|
|
|
|
|
|
|
|
|
|
|
|
|
|
|
|
|
|
|
|
|
More than 48 payments |
|
|
— |
|
|
|
— |
|
|
|
— |
|
|
|
— |
|
|
|
|
|
|
|
|
|
|
|
|
|
|
|
|
|
|
Loans in-school/ grace/deferment |
|
|
|
|
|
|
|
|
|
|
|
|
|
|
|
|
|
|
|
|
|
|
|
|
|
|
|
|
|
|
|
|
|
Total |
|
$ |
|
|
|
$ |
|
|
|
$ |
|
|
|
$ |
|
|
|
$ |
|
|
|
$ |
|
|
|
$ |
|
|
|
|
|
% |
|
TDR Status: |
|
|
|
|
|
|
|
|
|
|
|
|
|
|
|
|
|
|
|
|
|
|
|
|
|
|
|
|
|
|
|
|
|
TDR |
|
$ |
|
|
|
$ |
|
|
|
$ |
|
|
|
$ |
|
|
|
$ |
|
|
|
$ |
|
|
|
$ |
|
|
|
|
|
% |
|
Non-TDR |
|
|
|
|
|
|
|
|
|
|
|
|
|
|
|
|
|
|
|
|
|
|
|
|
|
|
|
|
|
|
|
|
|
Total |
|
$ |
|
|
|
$ |
|
|
|
$ |
|
|
|
$ |
|
|
|
$ |
|
|
|
$ |
|
|
|
$ |
|
|
|
|
|
% |
|
Cosigners: |
|
|
|
|
|
|
|
|
|
|
|
|
|
|
|
|
|
|
|
|
|
|
|
|
|
|
|
|
|
|
|
|
|
With cosigner (2) |
|
$ |
|
|
|
$ |
|
|
|
$ |
|
|
|
$ |
— |
|
|
$ |
|
|
|
$ |
|
|
|
$ |
|
|
|
|
|
% |
|
Without cosigner |
|
|
|
|
|
|
|
|
|
|
|
|
|
|
|
|
|
|
|
|
|
|
|
|
|
|
|
|
|
|
|
|
|
Total |
|
$ |
|
|
|
$ |
|
|
|
$ |
|
|
|
$ |
|
|
|
$ |
|
|
|
$ |
|
|
|
$ |
|
|
|
|
|
% |
|
School Type: |
|
|
|
|
|
|
|
|
|
|
|
|
|
|
|
|
|
|
|
|
|
|
|
|
|
|
|
|
|
|
|
|
|
Not-for-profit |
|
$ |
|
|
|
$ |
|
|
|
$ |
|
|
|
$ |
|
|
|
$ |
|
|
|
$ |
|
|
|
$ |
|
|
|
|
|
% |
|
For-profit |
|
|
|
|
|
|
|
|
|
|
|
|
|
|
|
|
|
|
|
|
|
|
|
|
|
|
|
|
|
|
|
|
|
Total |
|
$ |
|
|
|
$ |
|
|
|
$ |
|
|
|
$ |
|
|
|
$ |
|
|
|
$ |
|
|
|
$ |
|
|
|
|
|
% |
|
Allowance for loan losses |
|
|
|
|
|
|
|
|
|
|
|
|
|
|
|
|
|
|
|
|
|
|
|
|
|
|
(
|
) |
|
|
|
|
|
Total loans, net |
|
|
|
|
|
|
|
|
|
|
|
|
|
|
|
|
|
|
|
|
|
|
|
|
|
$ |
|
|
|
|
|
|
|
(1) |
Number of months in active repayment for which a scheduled payment was received. |
|
(2) |
Excluding Private Education Refinance Loans, which do not have a cosigner, the cosigner rate was
|
65
NAVIENT CORPORATION
NOTES TO CONSOLIDATED FINANCIAL STATEMENTS
(Information at September 30, 2022 and for the three and nine months ended
September 30, 2022 and 2021 is unaudited)
2. Allowance for Loan Losses (Continued)
|
|
|
Private Education Loan Delinquencies |
|
|||||||||||||||||||||
|
|
|
TDRs |
|
|||||||||||||||||||||
|
|
|
September 30, 2022 |
|
|
December 31, 2021 |
|
|
September 30, 2021 |
|
|||||||||||||||
|
(Dollars in millions) |
|
Balance |
|
|
% |
|
|
Balance |
|
|
% |
|
|
Balance |
|
|
% |
|
||||||
|
Loans in-school/grace/deferment (1) |
|
$ |
|
|
|
|
|
|
|
$ |
|
|
|
|
|
|
|
$ |
|
|
|
|
|
|
|
Loans in forbearance (2) |
|
|
|
|
|
|
|
|
|
|
|
|
|
|
|
|
|
|
|
|
|
|
|
|
|
Loans in repayment and percentage of each status: |
|
|
|
|
|
|
|
|
|
|
|
|
|
|
|
|
|
|
|
|
|
|
|
|
|
Loans current |
|
|
|
|
|
|
|
% |
|
|
|
|
|
|
|
% |
|
|
|
|
|
|
|
% |
|
Loans delinquent 31-60 days (3) |
|
|
|
|
|
|
|
|
|
|
|
|
|
|
|
|
|
|
|
|
|
|
|
|
|
Loans delinquent 61-90 days (3) |
|
|
|
|
|
|
|
|
|
|
|
|
|
|
|
|
|
|
|
|
|
|
|
|
|
Loans delinquent greater than 90 days (3) |
|
|
|
|
|
|
|
|
|
|
|
|
|
|
|
|
|
|
|
|
|
|
|
|
|
Total TDR loans in repayment |
|
|
|
|
|
|
|
% |
|
|
|
|
|
|
|
% |
|
|
|
|
|
|
|
% |
|
Total TDR loans |
|
|
|
|
|
|
|
|
|
|
|
|
|
|
|
|
|
|
|
|
|
|
|
|
|
TDR loans allowance for losses |
|
|
(
|
) |
|
|
|
|
|
|
(
|
) |
|
|
|
|
|
|
(
|
) |
|
|
|
|
|
TDR loans, net |
|
$ |
|
|
|
|
|
|
|
$ |
|
|
|
|
|
|
|
$ |
|
|
|
|
|
|
|
Percentage of TDR loans in repayment |
|
|
|
|
|
|
|
% |
|
|
|
|
|
|
|
% |
|
|
|
|
|
|
|
% |
|
Delinquencies as a percentage of TDR loans in repayment |
|
|
|
|
|
|
|
% |
|
|
|
|
|
|
|
% |
|
|
|
|
|
|
|
% |
|
Loans in forbearance as a percentage of TDR loans in repayment and forbearance |
|
|
|
|
|
|
|
% |
|
|
|
|
|
|
|
% |
|
|
|
|
|
|
|
% |
|
(1) |
Loans for customers who are attending school or are in other permitted educational activities and are not yet required to make payments on their loans, e.g., internship periods, as well as loans for customers who have requested and qualify for other permitted program deferments such as various military eligible deferments. |
|
(2) |
Loans for customers who have requested extension of grace period generally during employment transition or who have temporarily ceased making full payments due to hardship or other factors such as disaster relief, including COVID-19 relief programs, consistent with established loan program servicing policies and procedures. |
|
(3) |
The period of delinquency is based on the number of days scheduled payments are contractually past due. |
66
NAVIENT CORPORATION
NOTES TO CONSOLIDATED FINANCIAL STATEMENTS
(Information at September 30, 2022 and for the three and nine months ended
September 30, 2022 and 2021 is unaudited)
2. Allowance for Loan Losses (Continued)
|
|
|
Private Education Loan Delinquencies |
|
|||||||||||||||||||||
|
|
|
Non-TDRs |
|
|||||||||||||||||||||
|
|
|
September 30, 2022 |
|
|
December 31, 2021 |
|
|
September 30, 2021 |
|
|||||||||||||||
|
(Dollars in millions) |
|
Balance |
|
|
% |
|
|
Balance |
|
|
% |
|
|
Balance |
|
|
% |
|
||||||
|
Loans in-school/grace/deferment (1) |
|
$ |
|
|
|
|
|
|
|
$ |
|
|
|
|
|
|
|
$ |
|
|
|
|
|
|
|
Loans in forbearance (2) |
|
|
|
|
|
|
|
|
|
|
|
|
|
|
|
|
|
|
|
|
|
|
|
|
|
Loans in repayment and percentage of each status: |
|
|
|
|
|
|
|
|
|
|
|
|
|
|
|
|
|
|
|
|
|
|
|
|
|
Loans current |
|
|
|
|
|
|
|
% |
|
|
|
|
|
|
|
% |
|
|
|
|
|
|
|
% |
|
Loans delinquent 31-60 days (3) |
|
|
|
|
|
|
|
|
|
|
|
|
|
|
|
|
|
|
|
|
|
|
|
|
|
Loans delinquent 61-90 days (3) |
|
|
|
|
|
|
|
|
|
|
|
|
|
|
|
|
|
|
|
|
|
|
|
|
|
Loans delinquent greater than 90 days (3) |
|
|
|
|
|
|
|
|
|
|
|
|
|
|
|
|
|
|
|
|
|
|
|
|
|
Total non-TDR loans in repayment |
|
|
|
|
|
|
|
% |
|
|
|
|
|
|
|
% |
|
|
|
|
|
|
|
% |
|
Total non-TDR loans |
|
|
|
|
|
|
|
|
|
|
|
|
|
|
|
|
|
|
|
|
|
|
|
|
|
Non-TDR loans allowance for losses |
|
|
(
|
) |
|
|
|
|
|
|
(
|
) |
|
|
|
|
|
|
(
|
) |
|
|
|
|
|
Non-TDR loans, net |
|
$ |
|
|
|
|
|
|
|
$ |
|
|
|
|
|
|
|
$ |
|
|
|
|
|
|
|
Percentage of non-TDR loans in repayment |
|
|
|
|
|
|
|
% |
|
|
|
|
|
|
|
% |
|
|
|
|
|
|
|
% |
|
Delinquencies as a percentage of non-TDR loans in repayment |
|
|
|
|
|
|
|
% |
|
|
|
|
|
|
|
% |
|
|
|
|
|
|
|
% |
|
Loans in forbearance as a percentage of non-TDR loans in repayment and forbearance |
|
|
|
|
|
|
|
% |
|
|
|
|
|
|
|
% |
|
|
|
|
|
|
|
% |
|
(1) |
Loans for customers who are attending school or are in other permitted educational activities and are not yet required to make payments on their loans, e.g., internship periods, as well as loans for customers who have requested and qualify for other permitted program deferments such as various military eligible deferments. |
|
(2) |
Loans for customers who have requested extension of grace period generally during employment transition or who have temporarily ceased making full payments due to hardship or other factors such as disaster relief, including COVID-19 relief programs, consistent with established loan program servicing policies and procedures. |
|
(3) |
The period of delinquency is based on the number of days scheduled payments are contractually past due. |
67
NAVIENT CORPORATION
NOTES TO CONSOLIDATED FINANCIAL STATEMENTS
(Information at September 30, 2022 and for the three and nine months ended
September 30, 2022 and 2021 is unaudited)
3. Borrowings
The following table summarizes our borrowings.
|
|
|
September 30, 2022 |
|
|
December 31, 2021 |
|
||||||||||||||||||
|
(Dollars in millions) |
|
Short Term |
|
|
Long Term |
|
|
Total |
|
|
Short Term |
|
|
Long Term |
|
|
Total |
|
||||||
|
Unsecured borrowings: |
|
|
|
|
|
|
|
|
|
|
|
|
|
|
|
|
|
|
|
|
|
|
|
|
|
Senior unsecured debt (1) |
|
$ |
|
|
|
$ |
|
|
|
$ |
|
|
|
$ |
— |
|
|
$ |
|
|
|
$ |
|
|
|
Total unsecured borrowings |
|
|
|
|
|
|
|
|
|
|
|
|
|
|
— |
|
|
|
|
|
|
|
|
|
|
Secured borrowings: |
|
|
|
|
|
|
|
|
|
|
|
|
|
|
|
|
|
|
|
|
|
|
|
|
|
FFELP Loan securitizations (2)(3) |
|
|
|
|
|
|
|
|
|
|
|
|
|
|
— |
|
|
|
|
|
|
|
|
|
|
Private Education Loan securitizations (4) |
|
|
|
|
|
|
|
|
|
|
|
|
|
|
|
|
|
|
|
|
|
|
|
|
|
FFELP Loan ABCP facilities |
|
|
|
|
|
|
|
|
|
|
|
|
|
|
|
|
|
|
|
|
|
|
|
|
|
Private Education Loan ABCP facilities |
|
|
|
|
|
|
— |
|
|
|
|
|
|
|
|
|
|
|
|
|
|
|
|
|
|
Other (5) |
|
|
|
|
|
|
— |
|
|
|
|
|
|
|
|
|
|
|
— |
|
|
|
|
|
|
Total secured borrowings |
|
|
|
|
|
|
|
|
|
|
|
|
|
|
|
|
|
|
|
|
|
|
|
|
|
Total before hedge accounting adjustments |
|
|
|
|
|
|
|
|
|
|
|
|
|
|
|
|
|
|
|
|
|
|
|
|
|
Hedge accounting adjustments |
|
|
(
|
) |
|
|
(
|
) |
|
|
(
|
) |
|
|
— |
|
|
|
|
|
|
|
|
|
|
Total |
|
$ |
|
|
|
$ |
|
|
|
$ |
|
|
|
$ |
|
|
|
$ |
|
|
|
$ |
|
|
|
(1) |
Includes principal amount of $
|
|
(2) |
Includes $
|
|
( 3 ) |
Includes defaulted FFELP secured debt tranches with a remaining principal amount of $
|
|
( 4 ) |
Includes $
|
|
( 5 ) |
“Other” primarily includes the obligation to return cash collateral held related to derivative exposures. |
68
NAVIENT CORPORATION
NOTES TO CONSOLIDATED FINANCIAL STATEMENTS
(Information at September 30, 2022 and for the three and nine months ended
September 30, 2022 and 2021 is unaudited)
3. Borrowings (Continued)
Variable Interest Entities
We consolidated the following financing VIEs as of September 30, 2022 and December 31, 2021, as we are the primary beneficiary. As a result, these VIEs are accounted for as secured borrowings.
|
|
|
September 30, 2022 |
|
|||||||||||||||||||||||||
|
|
|
Debt Outstanding |
|
|
Carrying Amount of Assets Securing Debt Outstanding |
|
||||||||||||||||||||||
|
(Dollars in millions) |
|
Short Term |
|
|
Long Term |
|
|
Total |
|
|
Loans |
|
|
Cash |
|
|
Other Assets |
|
|
Total |
|
|||||||
|
Secured Borrowings — VIEs: |
|
|
|
|
|
|
|
|
|
|
|
|
|
|
|
|
|
|
|
|
|
|
|
|
|
|
|
|
|
FFELP Loan securitizations |
|
$ |
|
|
|
$ |
|
|
|
$ |
|
|
|
$ |
|
|
|
$ |
|
|
|
$ |
|
|
|
$ |
|
|
|
Private Education Loan securitizations |
|
|
|
|
|
|
|
|
|
|
|
|
|
|
|
|
|
|
|
|
|
|
|
|
|
|
|
|
|
FFELP Loan ABCP facilities |
|
|
|
|
|
|
|
|
|
|
|
|
|
|
|
|
|
|
|
|
|
|
|
|
|
|
|
|
|
Private Education Loan ABCP facilities |
|
|
|
|
|
|
— |
|
|
|
|
|
|
|
|
|
|
|
|
|
|
|
|
|
|
|
|
|
|
Total before hedge accounting adjustments |
|
|
|
|
|
|
|
|
|
|
|
|
|
|
|
|
|
|
|
|
|
|
|
|
|
|
|
|
|
Hedge accounting adjustments |
|
|
— |
|
|
|
(
|
) |
|
|
(
|
) |
|
|
— |
|
|
|
— |
|
|
|
(
|
) |
|
|
(
|
) |
|
Total |
|
$ |
|
|
|
$ |
|
|
|
$ |
|
|
|
$ |
|
|
|
$ |
|
|
|
$ |
|
|
|
$ |
|
|
|
|
|
|
|
|
|
|
|
|
|
|
|
|
|
|
|
|
|
|
|
|
|
|
|
|
|
|
|
|
|
|
|
December 31, 2021 |
|
|||||||||||||||||||||||||
|
|
|
Debt Outstanding |
|
|
Carrying Amount of Assets Securing Debt Outstanding |
|
||||||||||||||||||||||
|
(Dollars in millions) |
|
Short Term |
|
|
Long Term |
|
|
Total |
|
|
Loans |
|
|
Cash |
|
|
Other Assets |
|
|
Total |
|
|||||||
|
Secured Borrowings — VIEs: |
|
|
|
|
|
|
|
|
|
|
|
|
|
|
|
|
|
|
|
|
|
|
|
|
|
|
|
|
|
FFELP Loan securitizations |
|
$ |
— |
|
|
$ |
|
|
|
$ |
|
|
|
$ |
|
|
|
$ |
|
|
|
$ |
|
|
|
$ |
|
|
|
Private Education Loan securitizations |
|
|
|
|
|
|
|
|
|
|
|
|
|
|
|
|
|
|
|
|
|
|
|
|
|
|
|
|
|
FFELP Loan ABCP facilities |
|
|
|
|
|
|
|
|
|
|
|
|
|
|
|
|
|
|
|
|
|
|
|
|
|
|
|
|
|
Private Education Loan ABCP facilities |
|
|
|
|
|
|
|
|
|
|
|
|
|
|
|
|
|
|
|
|
|
|
|
|
|
|
|
|
|
Total before hedge accounting adjustments |
|
|
|
|
|
|
|
|
|
|
|
|
|
|
|
|
|
|
|
|
|
|
|
|
|
|
|
|
|
Hedge accounting adjustments |
|
|
— |
|
|
|
(
|
) |
|
|
(
|
) |
|
|
— |
|
|
|
— |
|
|
|
(
|
) |
|
|
(
|
) |
|
Total |
|
$ |
|
|
|
$ |
|
|
|
$ |
|
|
|
$ |
|
|
|
$ |
|
|
|
$ |
|
|
|
$ |
|
|
69
NAVIENT CORPORATION
NOTES TO CONSOLIDATED FINANCIAL STATEMENTS
(Information at September 30, 2022 and for the three and nine months ended
September 30, 2022 and 2021 is unaudited)
4. Derivative Financial Instruments
Summary of Derivative Financial Statement Impact
The following tables summarize the fair values and notional amounts of all derivative instruments and their impact on net income and other comprehensive income.
Impact of Derivatives on Balance Sheet
|
|
|
|
|
Cash Flow |
|
|
Fair Value (3) |
|
|
Trading |
|
|
Total |
|
||||||||||||||||||||
|
(Dollars in millions) |
|
Hedged Risk Exposure |
|
Sep 30, 2022 |
|
|
Dec 31, 2021 |
|
|
Sep 30, 2022 |
|
|
Dec 31, 2021 |
|
|
Sep 30, 2022 |
|
|
Dec 31, 2021 |
|
|
Sep 30, 2022 |
|
|
Dec 31, 2021 |
|
||||||||
|
Fair Values (1) |
|
|
|
|
|
|
|
|
|
|
|
|
|
|
|
|
|
|
|
|
|
|
|
|
|
|
|
|
|
|
|
|
|
|
|
Derivative Assets: |
|
|
|
|
|
|
|
|
|
|
|
|
|
|
|
|
|
|
|
|
|
|
|
|
|
|
|
|
|
|
|
|
|
|
|
Interest rate swaps |
|
Interest rate |
|
$ |
— |
|
|
$ |
— |
|
|
$ |
|
|
|
$ |
|
|
|
$ |
— |
|
|
$ |
|
|
|
$ |
|
|
|
$ |
|
|
|
Cross-currency interest rate swaps |
|
Foreign currency and interest rate |
|
|
— |
|
|
|
— |
|
|
|
— |
|
|
|
— |
|
|
|
— |
|
|
|
— |
|
|
|
— |
|
|
|
— |
|
|
Total derivative assets (2) |
|
|
|
|
— |
|
|
|
— |
|
|
|
|
|
|
|
|
|
|
|
— |
|
|
|
|
|
|
|
|
|
|
|
|
|
|
Derivative Liabilities: |
|
|
|
|
|
|
|
|
|
|
|
|
|
|
|
|
|
|
|
|
|
|
|
|
|
|
|
|
|
|
|
|
|
|
|
Interest rate swaps |
|
Interest rate |
|
|
— |
|
|
|
— |
|
|
|
(
|
) |
|
|
— |
|
|
|
(
|
) |
|
|
(
|
) |
|
|
(
|
) |
|
|
(
|
) |
|
Floor Income Contracts |
|
Interest rate |
|
|
— |
|
|
|
— |
|
|
|
— |
|
|
|
— |
|
|
|
— |
|
|
|
(
|
) |
|
|
— |
|
|
|
(
|
) |
|
Cross-currency interest rate swaps |
|
Foreign currency and interest rate |
|
|
— |
|
|
|
— |
|
|
|
(
|
) |
|
|
(
|
) |
|
|
— |
|
|
|
— |
|
|
|
(
|
) |
|
|
(
|
) |
|
Total derivative liabilities (2) |
|
|
|
|
— |
|
|
|
— |
|
|
|
(
|
) |
|
|
(
|
) |
|
|
(
|
) |
|
|
(
|
) |
|
|
(
|
) |
|
|
(
|
) |
|
Net total derivatives |
|
|
|
$ |
— |
|
|
$ |
— |
|
|
$ |
(
|
) |
|
$ |
|
|
|
$ |
(
|
) |
|
$ |
(
|
) |
|
$ |
(
|
) |
|
$ |
(
|
) |
|
(1) |
Fair values reported are exclusive of collateral held and pledged and accrued interest. Assets and liabilities are presented without consideration of master netting agreements. Derivatives are carried on the balance sheet based on net position by counterparty under master netting agreements and classified in other assets or other liabilities depending on whether in a net positive or negative position. |
|
(2) |
|
|
|
|
Other Assets |
|
|
Other Liabilities |
|
||||||||||
|
(Dollar in millions) |
|
September 30, 2022 |
|
|
December 31, 2021 |
|
|
September 30, 2022 |
|
|
December 31, 2021 |
|
||||
|
Gross position |
|
$ |
|
|
|
$ |
|
|
|
$ |
(
|
) |
|
$ |
(
|
) |
|
Impact of master netting agreements |
|
|
— |
|
|
|
(
|
) |
|
|
— |
|
|
|
|
|
|
Derivative values with impact of master netting agreements (as carried on balance sheet) |
|
|
|
|
|
|
|
|
|
|
(
|
) |
|
|
(
|
) |
|
Cash collateral (held) pledged |
|
|
(
|
) |
|
|
(
|
) |
|
|
|
|
|
|
|
|
|
Net position |
|
$ |
(
|
) |
|
$ |
(
|
) |
|
$ |
(
|
) |
|
$ |
(
|
) |
|
( 3 ) |
|
|
|
|
As of September 30, 2022 |
|
|
As of December 31, 2021 |
|
||||||||||
|
(Dollar in millions) |
|
Carrying Value |
|
|
Hedge Basis Adjustments |
|
|
Carrying Value |
|
|
Hedge Basis Adjustments |
|
||||
|
Short-term borrowings |
|
$ |
|
|
|
$ |
(
|
) |
|
$ |
— |
|
|
$ |
— |
|
|
Long-term borrowings |
|
$ |
|
|
|
$ |
(
|
) |
|
$ |
|
|
|
$ |
|
|
70
NAVIENT CORPORATION
NOTES TO CONSOLIDATED FINANCIAL STATEMENTS
(Information at September 30, 2022 and for the three and nine months ended
September 30, 2022 and 2021 is unaudited)
4. Derivative Financial Instruments (Continued)
The above fair values include adjustments when necessary for counterparty credit risk for both when we are exposed to the counterparty, net of collateral postings, and when the counterparty is exposed to us, net of collateral postings. The net adjustments decreased the asset position at September 30, 2022 and December 31, 2021 by $
|
|
|
Cash Flow |
|
|
Fair Value |
|
|
Trading |
|
|
Total |
|
||||||||||||||||||||
|
(Dollars in billions) |
|
Sep 30, 2022 |
|
|
Dec 31, 2021 |
|
|
Sep 30, 2022 |
|
|
Dec 31, 2021 |
|
|
Sep 30, 2022 |
|
|
Dec 31, 2021 |
|
|
Sep 30, 2022 |
|
|
Dec 31, 2021 |
|
||||||||
|
Notional Values: |
|
|
|
|
|
|
|
|
|
|
|
|
|
|
|
|
|
|
|
|
|
|
|
|
|
|
|
|
|
|
|
|
|
Interest rate swaps |
|
$ |
|
|
|
$ |
|
|
|
$ |
|
|
|
$ |
|
|
|
$ |
|
|
|
$ |
|
|
|
$ |
|
|
|
$ |
|
|
|
Floor Income Contracts |
|
|
— |
|
|
|
— |
|
|
|
— |
|
|
|
— |
|
|
|
|
|
|
|
|
|
|
|
|
|
|
|
|
|
|
Cross-currency interest rate swaps |
|
|
— |
|
|
|
— |
|
|
|
|
|
|
|
|
|
|
|
— |
|
|
|
— |
|
|
|
|
|
|
|
|
|
|
Total derivatives |
|
$ |
|
|
|
$ |
|
|
|
$ |
|
|
|
$ |
|
|
|
$ |
|
|
|
$ |
|
|
|
$ |
|
|
|
$ |
|
|
Mark-to-Market Impact of Derivatives on Statements of Income
|
|
|
Total Gains (Losses) |
|
|||||||||||||
|
|
|
Three Months Ended September 30, |
|
|
Nine Months Ended September 30, |
|
||||||||||
|
(Dollars in millions) |
|
2022 |
|
|
2021 |
|
|
2022 |
|
|
2021 |
|
||||
|
Fair Value Hedges: |
|
|
|
|
|
|
|
|
|
|
|
|
|
|
|
|
|
Interest Rate Swaps |
|
|
|
|
|
|
|
|
|
|
|
|
|
|
|
|
|
Gains (losses) recognized in net income on derivatives |
|
$ |
(
|
) |
|
$ |
(
|
) |
|
$ |
(
|
) |
|
$ |
(
|
) |
|
Gains (losses) recognized in net income on hedged items |
|
|
|
|
|
|
|
|
|
|
|
|
|
|
|
|
|
Net fair value hedge ineffectiveness gains (losses) |
|
|
|
|
|
|
|
|
|
|
|
|
|
|
|
|
|
Cross currency interest rate swaps |
|
|
|
|
|
|
|
|
|
|
|
|
|
|
|
|
|
Gains (losses) recognized in net income on derivatives |
|
|
(
|
) |
|
|
(
|
) |
|
|
(
|
) |
|
|
|
|
|
Gains (losses) recognized in net income on hedged items |
|
|
|
|
|
|
|
|
|
|
|
|
|
|
(
|
) |
|
Net fair value hedge ineffectiveness gains (losses) |
|
|
(
|
) |
|
|
|
|
|
|
|
|
|
|
|
|
|
Total fair value hedges (1)(2) |
|
|
(
|
) |
|
|
|
|
|
|
|
|
|
|
|
|
|
Cash Flow Hedges: |
|
|
|
|
|
|
|
|
|
|
|
|
|
|
|
|
|
Total cash flow hedges (2) |
|
|
— |
|
|
|
— |
|
|
|
— |
|
|
|
— |
|
|
Trading: |
|
|
|
|
|
|
|
|
|
|
|
|
|
|
|
|
|
Interest rate swaps |
|
|
|
|
|
|
(
|
) |
|
|
|
|
|
|
|
|
|
Floor income contracts |
|
|
— |
|
|
|
(
|
) |
|
|
|
|
|
|
|
|
|
Cross currency interest rate swaps |
|
|
— |
|
|
|
— |
|
|
|
— |
|
|
|
— |
|
|
Other |
|
|
— |
|
|
|
— |
|
|
|
— |
|
|
|
— |
|
|
Total trading derivatives (3) |
|
|
|
|
|
|
(
|
) |
|
|
|
|
|
|
|
|
|
Mark-to-market gains (losses) recognized |
|
$ |
|
|
|
$ |
|
|
|
$ |
|
|
|
$ |
|
|
|
(1) |
Recorded in interest expense in the consolidated statements of income. |
|
(2) |
The accrued interest income (expense) on fair value hedges and cash flow hedges is recorded in interest expense and is excluded from this table. |
|
(3) |
Recorded in “gains (losses) on derivative and hedging activities, net” in the consolidated statements of income. |
71
NAVIENT CORPORATION
NOTES TO CONSOLIDATED FINANCIAL STATEMENTS
(Information at September 30, 2022 and for the three and nine months ended
September 30, 2022 and 2021 is unaudited)
4. Derivative Financial Instruments (Continued)
Impact of Derivatives on Other Comprehensive Income (Equity)
|
|
|
Three Months Ended September 30, |
|
|
Nine Months Ended September 30, |
|
||||||||||
|
(Dollars in millions) |
|
2022 |
|
|
2021 |
|
|
2022 |
|
|
2021 |
|
||||
|
Total gains (losses) on cash flow hedges |
|
$ |
|
|
|
$ |
(
|
) |
|
$ |
|
|
|
$ |
|
|
|
Reclassification adjustments for derivative (gains) losses included in net income (interest expense) (1) |
|
|
|
|
|
|
|
|
|
|
|
|
|
|
|
|
|
Net changes in cash flow hedges, net of tax |
|
$ |
|
|
|
$ |
|
|
|
$ |
|
|
|
$ |
|
|
|
|
(1) |
Includes net settlement income/expense. |
Collateral
The following table details collateral held and pledged related to derivative exposure between us and our derivative counterparties:
|
(Dollars in millions) |
|
September 30, 2022 |
|
|
December 31, 2021 |
|
||
|
Collateral held: |
|
|
|
|
|
|
|
|
|
Cash (obligation to return cash collateral is recorded in short-term borrowings) |
|
$ |
|
|
|
$ |
|
|
|
Securities at fair value — corporate derivatives (not recorded in financial statements) (1) |
|
|
— |
|
|
|
— |
|
|
Securities at fair value — on-balance sheet securitization derivatives (not recorded in financial statements) (2) |
|
|
— |
|
|
|
|
|
|
Total collateral held |
|
$ |
|
|
|
$ |
|
|
|
Derivative asset at fair value including accrued interest |
|
$ |
|
|
|
$ |
|
|
|
Collateral pledged to others: |
|
|
|
|
|
|
|
|
|
Cash (right to receive return of cash collateral is recorded in investments) |
|
$ |
|
|
|
$ |
|
|
|
Total collateral pledged |
|
$ |
|
|
|
$ |
|
|
|
Derivative liability at fair value including accrued interest and premium receivable |
|
$ |
|
|
|
$ |
|
|
|
(1) |
The Company has the ability to sell or re-pledge securities it holds as collateral. |
|
(2) |
The trusts do not have the ability to sell or re-pledge securities they hold as collateral. |
72
NAVIENT CORPORATION
NOTES TO CONSOLIDATED FINANCIAL STATEMENTS
(Information at September 30, 2022 and for the three and nine months ended
September 30, 2022 and 2021 is unaudited)
4. Derivative Financial Instruments (Continued)
Our corporate derivatives contain credit contingent features. At our current unsecured credit rating, we have fully collateralized our corporate derivative liability position (including accrued interest and net of premiums receivable) of $
The table below highlights credit exposure related to our derivative counterparties at September 30, 2022.
|
(Dollars in millions) |
|
Corporate Contracts |
|
|
Securitization Trust Contracts |
|
||
|
Exposure, net of collateral |
|
$ |
|
|
|
$ |
— |
|
|
Percent of exposure to counterparties with credit ratings below S&P AA- or Moody’s Aa3 |
|
|
|
% |
|
|
— |
% |
|
Percent of exposure to counterparties with credit ratings below S&P A- or Moody’s A3 |
|
|
— |
% |
|
|
— |
% |
5. Other Assets
The following table provides the detail of our other assets.
|
(Dollars in millions) |
|
September 30, 2022 |
|
|
December 31, 2021 |
|
||
|
Accrued interest receivable |
|
$ |
|
|
|
$ |
|
|
|
Benefit and insurance-related investments |
|
|
|
|
|
|
|
|
|
Income tax asset, net |
|
|
|
|
|
|
|
|
|
Derivatives at fair value |
|
|
|
|
|
|
|
|
|
Accounts receivable |
|
|
|
|
|
|
|
|
|
Fixed assets |
|
|
|
|
|
|
|
|
|
Other |
|
|
|
|
|
|
|
|
|
Total |
|
$ |
|
|
|
$ |
|
|
73
NAVIENT CORPORATION
NOTES TO CONSOLIDATED FINANCIAL STATEMENTS
(Information at September 30, 2022 and for the three and nine months ended
September 30, 2022 and 2021 is unaudited)
6. Stockholders’ Equity
The following table summarizes common share repurchases, issuances and dividends paid.
|
|
|
Three Months Ended September 30, |
|
|
Nine Months Ended September 30, |
|
||||||||||
|
(Dollars and shares in millions, except per share amounts) |
|
2022 |
|
|
2021 |
|
|
2022 |
|
|
2021 |
|
||||
|
Common stock repurchased (1) |
|
|
|
|
|
|
|
|
|
|
|
|
|
|
|
|
|
Common stock repurchased (in dollars) (1) |
|
$ |
|
|
|
$ |
|
|
|
$ |
|
|
|
$ |
|
|
|
Average purchase price per share (1) |
|
$ |
|
|
|
$ |
|
|
|
$ |
|
|
|
$ |
|
|
|
Remaining common stock repurchase authority (1) |
|
$ |
|
|
|
$ |
|
|
|
$ |
|
|
|
$ |
|
|
|
Shares repurchased related to employee stock- based compensation plans (2) |
|
|
— |
|
|
|
|
|
|
|
|
|
|
|
|
|
|
Average purchase price per share (2) |
|
$ |
— |
|
|
$ |
|
|
|
$ |
|
|
|
$ |
|
|
|
Common shares issued (3) |
|
|
— |
|
|
|
|
|
|
|
|
|
|
|
|
|
|
Dividends paid |
|
$ |
|
|
|
$ |
|
|
|
$ |
|
|
|
$ |
|
|
|
Dividends per share |
|
$ |
|
|
|
$ |
|
|
|
$ |
|
|
|
$ |
|
|
|
(1) |
Common shares purchased under our share repurchase program. Our board of directors authorized a $
|
|
(2) |
Comprises shares withheld from stock option exercises and vesting of restricted stock for employees’ tax withholding obligations and shares tendered by employees to satisfy option exercise costs. |
|
(3) |
Common shares issued under our various compensation and benefit plans. |
The closing price of our common stock on September 30, 2022 was $
74
NAVIENT CORPORATION
NOTES TO CONSOLIDATED FINANCIAL STATEMENTS
(Information at September 30, 2022 and for the three and nine months ended
September 30, 2022 and 2021 is unaudited)
7. Earnings (Loss) per Common Share
Basic earnings (loss) per common share (EPS) are calculated using the weighted average number of shares of common stock outstanding during each period. A reconciliation of the numerators and denominators of the basic and diluted EPS calculations on a GAAP basis follows.
|
|
|
Three Months Ended September 30, |
|
|
Nine Months Ended September 30, |
|
||||||||||
|
(In millions, except per share data) |
|
2022 |
|
|
2021 |
|
|
2022 |
|
|
2021 |
|
||||
|
Numerator: |
|
|
|
|
|
|
|
|
|
|
|
|
|
|
|
|
|
Net income |
|
$ |
|
|
|
$ |
|
|
|
$ |
|
|
|
$ |
|
|
|
Denominator: |
|
|
|
|
|
|
|
|
|
|
|
|
|
|
|
|
|
Weighted average shares used to compute basic EPS |
|
|
|
|
|
|
|
|
|
|
|
|
|
|
|
|
|
Effect of dilutive securities: |
|
|
|
|
|
|
|
|
|
|
|
|
|
|
|
|
|
Dilutive effect of stock options, restricted stock, restricted stock units, performance stock units, and Employee Stock Purchase Plan (ESPP) (1) |
|
|
|
|
|
|
|
|
|
|
|
|
|
|
|
|
|
Dilutive potential common shares (2) |
|
|
|
|
|
|
|
|
|
|
|
|
|
|
|
|
|
Weighted average shares used to compute diluted EPS |
|
|
|
|
|
|
|
|
|
|
|
|
|
|
|
|
|
Basic earnings per common share |
|
$ |
|
|
|
$ |
|
|
|
$ |
|
|
|
$ |
|
|
|
Diluted earnings per common share |
|
$ |
|
|
|
$ |
|
|
|
$ |
|
|
|
$ |
|
|
|
(1) |
Includes the potential dilutive effect of additional common shares that are issuable upon exercise of outstanding stock options, restricted stock, restricted stock units, performance stock units and the outstanding commitment to issue shares under the ESPP, determined by the treasury stock method. |
|
(2) |
For the three months ended September 30, 2022 and 2021, securities covering approximately
|
8. Fair Value Measurements
We use estimates of fair value in applying various accounting standards in our financial statements. We categorize our fair value estimates based on a hierarchical framework associated with three levels of price transparency utilized in measuring financial instruments at fair value. See “Note 11 – Fair Value Measurements” in our 2021 Form 10-K for a full discussion.
During the three and nine months ended September 30, 2022, there were no significant transfers of financial instruments between levels, or changes in our methodology used to value our financial instruments.
75
NAVIENT CORPORATION
NOTES TO CONSOLIDATED FINANCIAL STATEMENTS
(Information at September 30, 2022 and for the three and nine months ended
September 30, 2022 and 2021 is unaudited)
8. Fair Value Measurements (Continued)
The following table summarizes the valuation of our financial instruments that are marked-to-market on a recurring basis. During the third quarters of 2022 and 2021, there were no significant transfers of financial instruments between levels.
|
|
|
Fair Value Measurements on a Recurring Basis |
|
|||||||||||||||||||||||||||||
|
|
|
September 30, 2022 |
|
|
December 31, 2021 |
|
||||||||||||||||||||||||||
|
(Dollars in millions) |
|
Level 1 |
|
|
Level 2 |
|
|
Level 3 |
|
|
Total |
|
|
Level 1 |
|
|
Level 2 |
|
|
Level 3 |
|
|
Total |
|
||||||||
|
Assets |
|
|
|
|
|
|
|
|
|
|
|
|
|
|
|
|
|
|
|
|
|
|
|
|
|
|
|
|
|
|
|
|
|
Derivative instruments: (1) |
|
|
|
|
|
|
|
|
|
|
|
|
|
|
|
|
|
|
|
|
|
|
|
|
|
|
|
|
|
|
|
|
|
Interest rate swaps |
|
|
— |
|
|
|
|
|
|
|
— |
|
|
|
|
|
|
|
— |
|
|
|
|
|
|
|
|
|
|
|
|
|
|
Cross-currency interest rate swaps |
|
|
— |
|
|
|
— |
|
|
|
— |
|
|
|
— |
|
|
|
— |
|
|
|
— |
|
|
|
— |
|
|
|
— |
|
|
Total derivative assets (2) |
|
|
— |
|
|
|
|
|
|
|
— |
|
|
|
|
|
|
|
— |
|
|
|
|
|
|
|
|
|
|
|
|
|
|
Total |
|
$ |
— |
|
|
$ |
|
|
|
$ |
— |
|
|
$ |
|
|
|
$ |
— |
|
|
$ |
|
|
|
$ |
|
|
|
$ |
|
|
|
Liabilities (3) |
|
|
|
|
|
|
|
|
|
|
|
|
|
|
|
|
|
|
|
|
|
|
|
|
|
|
|
|
|
|
|
|
|
Derivative instruments (1) |
|
|
|
|
|
|
|
|
|
|
|
|
|
|
|
|
|
|
|
|
|
|
|
|
|
|
|
|
|
|
|
|
|
Interest rate swaps |
|
$ |
— |
|
|
|
(
|
) |
|
$ |
(
|
) |
|
$ |
(
|
) |
|
$ |
— |
|
|
$ |
— |
|
|
$ |
(
|
) |
|
$ |
(
|
) |
|
Floor Income Contracts |
|
|
— |
|
|
|
— |
|
|
|
— |
|
|
|
— |
|
|
|
— |
|
|
|
(
|
) |
|
|
— |
|
|
|
(
|
) |
|
Cross-currency interest rate swaps |
|
|
— |
|
|
|
— |
|
|
|
(
|
) |
|
|
(
|
) |
|
|
— |
|
|
|
— |
|
|
|
(
|
) |
|
|
(
|
) |
|
Total derivative liabilities (2) |
|
|
— |
|
|
|
(
|
) |
|
|
(
|
) |
|
|
(
|
) |
|
|
— |
|
|
|
(
|
) |
|
|
(
|
) |
|
|
(
|
) |
|
Total |
|
$ |
— |
|
|
$ |
(
|
) |
|
$ |
(
|
) |
|
$ |
(
|
) |
|
$ |
— |
|
|
$ |
(
|
) |
|
$ |
(
|
) |
|
$ |
(
|
) |
|
(1) |
Fair value of derivative instruments excludes accrued interest and the value of collateral. |
|
(2) |
See "Note 4 – Derivative Financial Instruments" for a reconciliation of gross positions without the impact of master netting agreements to the balance sheet classification. |
|
(3) |
Borrowings which are the hedged item in a fair value hedge relationship and which are adjusted for changes in value due to benchmark interest rates only are not carried at full fair value and not reflected in this table. |
76
NAVIENT CORPORATION
NOTES TO CONSOLIDATED FINANCIAL STATEMENTS
(Information at September 30, 2022 and for the three and nine months ended
September 30, 2022 and 2021 is unaudited)
8. Fair Value Measurements (Continued)
The following tables summarize the change in balance sheet carrying value associated with level 3 financial instruments carried at fair value on a recurring basis.
|
|
|
Three Months Ended September 30, |
|
|||||||||||||||||||||||||||||
|
|
|
2022 |
|
|
2021 |
|
||||||||||||||||||||||||||
|
|
|
Derivative instruments |
|
|
Derivative instruments |
|
||||||||||||||||||||||||||
|
(Dollars in millions) |
|
Interest Rate Swaps |
|
|
Cross Currency Interest Rate Swaps |
|
|
Other |
|
|
Total Derivative Instruments |
|
|
Interest Rate Swaps |
|
|
Cross Currency Interest Rate Swaps |
|
|
Other |
|
|
Total Derivative Instruments |
|
||||||||
|
Balance, beginning of period |
|
$ |
(
|
) |
|
$ |
(
|
) |
|
$ |
— |
|
|
$ |
(
|
) |
|
$ |
(
|
) |
|
$ |
(
|
) |
|
$ |
— |
|
|
$ |
(
|
) |
|
Total gains/(losses): |
|
|
|
|
|
|
|
|
|
|
|
|
|
|
|
|
|
|
|
|
|
|
|
|
|
|
|
|
|
|
|
|
|
Included in earnings (1) |
|
|
|
|
|
|
(
|
) |
|
|
|
|
|
|
(
|
) |
|
|
|
|
|
|
(
|
) |
|
|
— |
|
|
|
(
|
) |
|
Included in other comprehensive income |
|
|
|
|
|
|
|
|
|
|
|
|
|
|
|
|
|
|
|
|
|
|
|
|
|
|
|
|
|
|
|
|
|
Settlements |
|
|
|
|
|
|
|
|
|
|
|
|
|
|
|
|
|
|
— |
|
|
|
|
|
|
|
— |
|
|
|
|
|
|
Transfers in and/or out of level 3 |
|
|
|
|
|
|
|
|
|
|
|
|
|
|
|
|
|
|
|
|
|
|
|
|
|
|
|
|
|
|
|
|
|
Balance, end of period |
|
$ |
(
|
) |
|
$ |
(
|
) |
|
$ |
|
|
|
$ |
(
|
) |
|
$ |
(
|
) |
|
$ |
(
|
) |
|
$ |
— |
|
|
$ |
(
|
) |
|
Change in mark-to-market gains/(losses) relating to instruments still held at the reporting date (2) |
|
$ |
|
|
|
$ |
(
|
) |
|
$ |
|
|
|
$ |
(
|
) |
|
$ |
|
|
|
$ |
(
|
) |
|
$ |
— |
|
|
$ |
(
|
) |
|
|
|
Nine Months Ended September 30, |
|
|||||||||||||||||||||||||||||
|
|
|
2022 |
|
|
2021 |
|
||||||||||||||||||||||||||
|
|
|
Derivative instruments |
|
|
Derivative instruments |
|
||||||||||||||||||||||||||
|
(Dollars in millions) |
|
Interest Rate Swaps |
|
|
Cross Currency Interest Rate Swaps |
|
|
Other |
|
|
Total Derivative Instruments |
|
|
Interest Rate Swaps |
|
|
Cross Currency Interest Rate Swaps |
|
|
Other |
|
|
Total Derivative Instruments |
|
||||||||
|
Balance, beginning of period |
|
$ |
(
|
) |
|
$ |
(
|
) |
|
$ |
— |
|
|
$ |
(
|
) |
|
$ |
(
|
) |
|
$ |
(
|
) |
|
$ |
— |
|
|
$ |
(
|
) |
|
Total gains/(losses): |
|
|
|
|
|
|
|
|
|
|
|
|
|
|
|
|
|
|
|
|
|
|
|
|
|
|
|
|
|
|
|
|
|
Included in earnings (1) |
|
|
|
|
|
|
(
|
) |
|
|
|
|
|
|
(
|
) |
|
|
|
|
|
|
|
|
|
|
— |
|
|
|
|
|
|
Included in other comprehensive income |
|
|
|
|
|
|
|
|
|
|
|
|
|
|
|
|
|
|
|
|
|
|
|
|
|
|
|
|
|
|
|
|
|
Settlements |
|
|
|
|
|
|
|
|
|
|
|
|
|
|
|
|
|
|
|
|
|
|
|
|
|
|
— |
|
|
|
|
|
|
Transfers in and/or out of level 3 |
|
|
|
|
|
|
|
|
|
|
|
|
|
|
|
|
|
|
|
|
|
|
|
|
|
|
|
|
|
|
|
|
|
Balance, end of period |
|
$ |
(
|
) |
|
$ |
(
|
) |
|
$ |
|
|
|
$ |
(
|
) |
|
$ |
(
|
) |
|
$ |
(
|
) |
|
$ |
— |
|
|
$ |
(
|
) |
|
Change in mark-to-market gains/(losses) relating to instruments still held at the reporting date (2) |
|
$ |
|
|
|
$ |
(
|
) |
|
$ |
|
|
|
$ |
(
|
) |
|
$ |
|
|
|
$ |
(
|
) |
|
$ |
— |
|
|
$ |
(
|
) |
|
( 1 ) |
“Included in earnings” is comprised of the following amounts recorded in the specified line item in the consolidated statements of income: |
|
|
|
Three Months Ended September 30, |
|
|
Nine Months Ended September 30, |
|
||||||||||
|
(Dollars in millions) |
|
2022 |
|
|
2021 |
|
|
2022 |
|
|
2021 |
|
||||
|
Gains (losses) on derivative and hedging activities, net |
|
$ |
|
|
|
$ |
|
|
|
$ |
|
|
|
$ |
|
|
|
Interest expense |
|
|
(
|
) |
|
|
(
|
) |
|
|
(
|
) |
|
|
|
|
|
Total |
|
$ |
(
|
) |
|
$ |
(
|
) |
|
$ |
(
|
) |
|
$ |
|
|
|
(2) |
Recorded in “gains (losses) on derivative and hedging activities, net” in the consolidated statements of income. |
77
NAVIENT CORPORATION
NOTES TO CONSOLIDATED FINANCIAL STATEMENTS
(Information at September 30, 2022 and for the three and nine months ended
September 30, 2022 and 2021 is unaudited)
8. Fair Value Measurements (Continued)
The following table presents the significant inputs that are unobservable or from inactive markets used in the recurring valuations of the level 3 financial instruments detailed above.
|
(Dollars in millions) |
|
Fair Value at September 30, 2022 |
|
|
Valuation Technique |
|
Input |
|
Range and Weighted Average |
|
||
|
Derivatives |
|
|
|
|
|
|
|
|
|
|
|
|
|
Prime/LIBOR basis swaps |
|
$ |
(
|
) |
|
Discounted cash flow |
|
Constant Prepayment Rate |
|
|
|
|
|
|
|
|
|
|
|
|
|
Bid/ask adjustment to discount rate |
|
|
|
|
|
Cross-currency interest rate swaps |
|
|
(
|
) |
|
Discounted cash flow |
|
Constant Prepayment Rate |
|
|
|
|
|
Other |
|
|
— |
|
|
|
|
|
|
|
|
|
|
Total |
|
$ |
(
|
) |
|
|
|
|
|
|
|
|
|
|
|
|
|
|
|
|
|
|
|
|
|
|
The following table summarizes the fair values of our financial assets and liabilities, including derivative financial instruments.
|
|
|
September 30, 2022 |
|
|
December 31, 2021 |
|
||||||||||||||||||
|
(Dollars in millions) |
|
Fair Value |
|
|
Carrying Value |
|
|
Difference |
|
|
Fair Value |
|
|
Carrying Value |
|
|
Difference |
|
||||||
|
Earning assets |
|
|
|
|
|
|
|
|
|
|
|
|
|
|
|
|
|
|
|
|
|
|
|
|
|
FFELP Loans |
|
$ |
|
|
|
$ |
|
|
|
$ |
(
|
) |
|
$ |
|
|
|
$ |
|
|
|
$ |
|
|
|
Private Education Loans |
|
|
|
|
|
|
|
|
|
|
(
|
) |
|
|
|
|
|
|
|
|
|
|
|
|
|
Cash and investments |
|
|
|
|
|
|
|
|
|
|
— |
|
|
|
|
|
|
|
|
|
|
|
— |
|
|
Total earning assets |
|
|
|
|
|
|
|
|
|
|
(
|
) |
|
|
|
|
|
|
|
|
|
|
|
|
|
Interest-bearing liabilities |
|
|
|
|
|
|
|
|
|
|
|
|
|
|
|
|
|
|
|
|
|
|
|
|
|
Short-term borrowings |
|
|
|
|
|
|
|
|
|
|
(
|
) |
|
|
|
|
|
|
|
|
|
|
(
|
) |
|
Long-term borrowings |
|
|
|
|
|
|
|
|
|
|
|
|
|
|
|
|
|
|
|
|
|
|
(
|
) |
|
Total interest-bearing liabilities |
|
|
|
|
|
|
|
|
|
|
|
|
|
|
|
|
|
|
|
|
|
|
(
|
) |
|
Derivative financial instruments |
|
|
|
|
|
|
|
|
|
|
|
|
|
|
|
|
|
|
|
|
|
|
|
|
|
Floor Income Contracts |
|
|
— |
|
|
|
— |
|
|
|
— |
|
|
|
(
|
) |
|
|
(
|
) |
|
|
— |
|
|
Interest rate swaps |
|
|
|
|
|
|
|
|
|
|
— |
|
|
|
|
|
|
|
|
|
|
|
— |
|
|
Cross-currency interest rate swaps |
|
|
(
|
) |
|
|
(
|
) |
|
|
— |
|
|
|
(
|
) |
|
|
(
|
) |
|
|
— |
|
|
Other |
|
|
— |
|
|
|
— |
|
|
|
— |
|
|
|
— |
|
|
|
— |
|
|
|
— |
|
|
Excess of net asset fair value over carrying value |
|
|
|
|
|
|
|
|
|
$ |
|
|
|
|
|
|
|
|
|
|
|
$ |
|
|
78
NAVIENT CORPORATION
NOTES TO CONSOLIDATED FINANCIAL STATEMENTS
(Information at September 30, 2022 and for the three and nine months ended
September 30, 2022 and 2021 is unaudited)
9. Commitments and Contingencies
Legal Proceedings
We and our subsidiaries and affiliates are subject to various claims, lawsuits and other actions that arise in the normal course of business. We believe that these claims, lawsuits and other actions will not, individually or in the aggregate, have a material adverse effect on our business, financial condition or results of operations, except as otherwise disclosed. Most of these matters are claims including individual and class action lawsuits against our servicing or business processing subsidiaries alleging the violation of state or federal laws in connection with servicing or collection activities on their education loans and other debts.
In the ordinary course of our business, the Company and our subsidiaries and affiliates receive information and document requests and investigative demands from various entities including State Attorneys General, U.S. Attorneys, legislative committees, individual members of Congress and administrative agencies. These requests may be informational, regulatory or enforcement in nature and may relate to our business practices, the industries in which we operate, or companies with whom we conduct business. Generally, our practice has been and continues to be to cooperate with these bodies and to be responsive to any such requests.
The number of these inquiries and the volume of related information demands continue to increase and therefore continue to increase the time, costs and resources we must dedicate to timely respond to these requests and may, depending on their outcome, result in payments of restitution, fines and penalties.
Certain Cases
During the first quarter of 2016, Navient Corporation, certain Navient officers and directors, and the underwriters of certain Navient securities offerings were sued in three putative securities class action lawsuits filed on behalf of certain investors in Navient stock or Navient unsecured debt. These
In January 2017, the Consumer Financial Protection Bureau (the CFPB) and Attorneys General for the State of Illinois and the State of Washington initiated civil actions naming Navient Corporation and several of its subsidiaries as defendants alleging violations of certain Federal and State consumer protection statutes, including the CFPA, FCRA, FDCPA and various state consumer protection laws. The Attorneys General for the States of Pennsylvania, California, Mississippi, and New Jersey also initiated actions against the Company and certain subsidiaries alleging violations of various state and federal consumer protection laws based upon similar alleged acts or failures to act. In addition to these matters, a number of lawsuits have been filed by nongovernmental parties or, in the future, may be filed by additional governmental or nongovernmental parties seeking damages or other remedies related to similar issues raised by the CFPB and the State Attorneys General. In January 2022, we entered into a series of Consent Judgment and Orders (the “Agreements”) with
79
NAVIENT CORPORATION
NOTES TO CONSOLIDATED FINANCIAL STATEMENTS
(Information at September 30, 2022 and for the three and nine months ended
September 30, 2022 and 2021 is unaudited)
9. Commitments and Cont ingencies (Continued)
As the Company has previously stated, we believe the allegations in the CFPB suit are false and that they improperly seek to impose penalties on Navient based on new, previously unannounced servicing standards applied retroactively against only one servicer. We therefore have denied these allegations and are vigorously defending against the allegations in that case. At this point in time, it is reasonably possible that a loss contingency exists; however, the Company is unable to anticipate the timing of a resolution or the impact that an adverse ruling in the CFPB case may have on the Company’s consolidated financial position, liquidity, results of operation or cash flows. As a result, it is not possible at this time to estimate a range of potential exposure, if any, for amounts that may be payable in connection with this matter and reserves have not been established. It is possible that an adverse ruling or rulings may have a material adverse impact on the Company.
The Company has been named as defendant in a number of putative class action cases alleging violations of various state and federal consumer protection laws including the Telephone Consumer Protection Act (TCPA), the Consumer Financial Protection Act of 2010 (CFPA), the Fair Credit Reporting Act (FCRA), the Fair Debt Collection Practices Act (FDCPA), in adversarial proceedings under the U.S. Bankruptcy Code, and various state consumer protection laws. At this point in time, the Company is unable to anticipate the timing of a resolution or the impact that these legal proceedings may have on the Company’s consolidated financial position, liquidity, results of operation or cash flows. As a result, it is not possible at this time to estimate a range of potential exposure, if any, for amounts that may be payable in connection with these matters and reserves have not been established. It is possible that an adverse ruling or rulings may have a material adverse impact on the Company.
Regulatory Matters
In addition, Navient and its subsidiaries are subject to examination or regulation by various federal regulatory, state licensing or other regulatory agencies as part of its ordinary course of business including the SEC, CFPB, FFIEC and ED. Items or matters similar to or different from those described above may arise during the course of those examinations. We also routinely receive inquiries or requests from various regulatory entities or bodies or government agencies concerning our business or our assets. Generally, the Company endeavors to cooperate with each such inquiry or request. The Company has received separate CIDs or subpoenas from multiple State Attorneys General, including for the District of Columbia, Kansas, Oregon, Colorado, New Jersey, New York and Indiana that are similar to the CIDs or subpoenas that preceded the lawsuits referenced above. Those CIDs and subpoenas have been resolved as part of the Company’s settlement with the State Attorneys General. Nevertheless, we have and, in the future, may receive additional CIDs or subpoenas and other inquiries from these or other Attorneys General with respect to similar or different matters.
Under the terms of the Separation and Distribution Agreement between the Company and SLM BankCo, Navient agreed to indemnify SLM BankCo for claims, actions, damages, losses or expenses that may arise from the conduct of activities of pre-Spin-Off SLM BankCo occurring prior to the Spin-Off other than those specifically excluded in that agreement. Also, as part of the Separation and Distribution Agreement, SLM BankCo agreed to indemnify Navient for certain claims, actions, damages, losses or expenses subject to the terms, conditions and limitations set forth in that agreement. As a result, subject to the terms, conditions and limitations set forth in that agreement, Navient agreed to indemnify and hold harmless Sallie Mae and its subsidiaries, including Sallie Mae Bank from liabilities arising out of the regulatory matters and CFPB and State Attorneys General lawsuits mentioned above. In addition, we asserted various claims for indemnification against Sallie Mae and Sallie Mae Bank for such specifically excluded items arising out of the CFPB and the State Attorneys General lawsuits if and to the extent any indemnified liabilities exist now or in the future. Navient has
80
NAVIENT CORPORATION
NOTES TO CONSOLIDATED FINANCIAL STATEMENTS
(Information at September 30, 2022 and for the three and nine months ended
September 30, 2022 and 2021 is unaudited)
9. Commitments and Contingencies (Continued)
OIG Audit
The Office of the Inspector General (the OIG) of ED commenced an audit regarding Special Allowance Payments (SAP) on September 10, 2007. In September 2013, we received the final audit determination of Federal Student Aid (the Final Audit Determination) on the final audit report issued by the OIG in August 2009 related to this audit. The Final Audit Determination concurred with the final audit report issued by the OIG and instructed us to make adjustment to our government billing to reflect the policy determination. In August 2016, we filed our notice of appeal to the Administrative Actions and Appeals Service Group of ED, and a hearing was held in April 2017. In March 2019, the administrative law judge hearing the appeal affirmed the audit’s findings, holding the then-existing Dear Colleague letter relied upon by the Company and other industry participants was inconsistent with the statutory framework creating the SAP rules applicable to loans funded by certain types of debt obligations at issue. We appealed the administrative law judge’s decision to the Secretary of Education given Navient’s adherence to ED-issued guidance and the potential impact on participants in any ED program student loan servicers if such guidance is deemed unreliable and may not be relied upon. In January 2021, the Acting Secretary of Education upheld the decision of the administrative law judge. In March 2021, we filed a complaint for declaratory judgment in federal court seeking to set aside the Acting Secretary’s decision. We continue to believe that our SAP billing practices were proper, considering then-existing ED guidance and lack of applicable regulations. We filed a lawsuit in federal court challenging the Acting Secretary’s decision. That case is pending. The Company first established a reserve for this matter in 2014 and increased the reserve in 2020 in response to the decision by the Acting Secretary. We do not believe, at this time, that an adverse ruling will have a material effect on the Company as a whole.
Contingencies
In the ordinary course of business, we and our subsidiaries are defendants in or parties to pending and threatened legal actions and proceedings including actions brought on behalf of various classes of claimants. These actions and proceedings may be based on alleged violations of consumer protection, securities, employment and other laws. In certain of these actions and proceedings, claims for substantial monetary damage are asserted against us and our subsidiaries. We and our subsidiaries are also subject to potential unasserted claims by third parties.
In the ordinary course of business, we and our subsidiaries are subject to regulatory examinations, information gathering requests, inquiries and investigations. In connection with formal and informal inquiries in these cases, we and our subsidiaries receive requests, subpoenas and orders for documents, testimony and information in connection with various aspects of our regulated activities.
We are required to establish reserves for litigation and regulatory matters where those matters present loss contingencies that are both probable and estimable. When loss contingencies are not both probable and estimable, we do not establish reserves.
In view of the inherent difficulty of predicting the outcome of litigation and regulatory matters, we may not be able to predict what the eventual outcome of the pending matters will be, what the timing or the ultimate resolution of these matters will be, or what the eventual loss, fines or penalties, if any, related to each pending matter may be.
Based on current knowledge, reserves have been established for certain litigation, regulatory matters, and unasserted contract claims where the loss is both probable and estimable. Based on current knowledge, management does not believe that loss contingencies, if any, arising from pending investigations, litigation or regulatory matters will have a material adverse effect on our consolidated financial position, liquidity, results of operations or cash flows, except as otherwise disclosed.
81
NAVIENT CORPORATION
NOTES TO CONSOLIDATED FINANCIAL STATEMENTS
(Information at September 30, 2022 and for the three and nine months ended
September 30, 2022 and 2021 is unaudited)
10. Revenue from Contracts with Customers Accounted for in Accordance with ASC 606
The following tables illustrate the disaggregation of revenue from contracts accounted for under ASC 606 with customers according to service type and client type by reportable operating segment.
Revenue by Service Type
|
|
|
Three Months Ended September 30, |
|
|||||||||||||||||||||
|
|
|
2022 |
|
|
2021 |
|
||||||||||||||||||
|
(Dollars in millions) |
|
Federal Education Loans |
|
|
Business Processing |
|
|
Total Revenue |
|
|
Federal Education Loans |
|
|
Business Processing |
|
|
Total Revenue |
|
||||||
|
Federal Education Loan asset recovery services |
|
$ |
— |
|
|
$ |
— |
|
|
$ |
— |
|
|
$ |
|
|
|
$ |
— |
|
|
$ |
|
|
|
Government services |
|
|
— |
|
|
|
|
|
|
|
|
|
|
|
— |
|
|
|
|
|
|
|
|
|
|
Healthcare services |
|
|
— |
|
|
|
|
|
|
|
|
|
|
|
— |
|
|
|
|
|
|
|
|
|
|
Total |
|
$ |
— |
|
|
$ |
|
|
|
$ |
|
|
|
$ |
|
|
|
$ |
|
|
|
$ |
|
|
|
|
|
|
|
|
|
|
|
|
|
|
|
|
|
|
|
|
|
|
|
|
|
|
|
|
|
|
|
Nine Months Ended September 30, |
|
|||||||||||||||||||||
|
|
|
2022 |
|
|
2021 |
|
||||||||||||||||||
|
(Dollars in millions) |
|
Federal Education Loans |
|
|
Business Processing |
|
|
Total Revenue |
|
|
Federal Education Loans |
|
|
Business Processing |
|
|
Total Revenue |
|
||||||
|
Federal Education Loan asset recovery services |
|
$ |
|
|
|
$ |
— |
|
|
$ |
|
|
|
$ |
|
|
|
$ |
— |
|
|
$ |
|
|
|
Government services |
|
|
— |
|
|
|
|
|
|
|
|
|
|
|
— |
|
|
|
|
|
|
|
|
|
|
Healthcare services |
|
|
— |
|
|
|
|
|
|
|
|
|
|
|
— |
|
|
|
|
|
|
|
|
|
|
Total |
|
$ |
|
|
|
$ |
|
|
|
$ |
|
|
|
$ |
|
|
|
$ |
|
|
|
$ |
|
|
82
NAVIENT CORPORATION
NOTES TO CONSOLIDATED FINANCIAL STATEMENTS
(Information at September 30, 2022 and for the three and nine months ended
September 30, 2022 and 2021 is unaudited)
10. Revenue from Contracts with Customers Accounted for in Accordance with ASC 606 (Continued)
Revenue by Client Type
|
|
|
Three Months Ended September 30, |
|
|||||||||||||||||||||
|
|
|
2022 |
|
|
2021 |
|
||||||||||||||||||
|
(Dollars in millions) |
|
Federal Education Loans |
|
|
Business Processing |
|
|
Total Revenue |
|
|
Federal Education Loans |
|
|
Business Processing |
|
|
Total Revenue |
|
||||||
|
Federal government |
|
$ |
— |
|
|
$ |
|
|
|
$ |
|
|
|
$ |
— |
|
|
$ |
|
|
|
$ |
|
|
|
Guarantor agencies |
|
|
— |
|
|
|
— |
|
|
|
— |
|
|
|
|
|
|
|
— |
|
|
|
|
|
|
Other institutions |
|
|
— |
|
|
|
— |
|
|
|
— |
|
|
|
— |
|
|
|
— |
|
|
|
— |
|
|
State and local government |
|
|
— |
|
|
|
|
|
|
|
|
|
|
|
— |
|
|
|
|
|
|
|
|
|
|
Tolling authorities |
|
|
— |
|
|
|
|
|
|
|
|
|
|
|
— |
|
|
|
|
|
|
|
|
|
|
Hospitals and other healthcare providers |
|
|
— |
|
|
|
|
|
|
|
|
|
|
|
— |
|
|
|
|
|
|
|
|
|
|
Total |
|
$ |
— |
|
|
$ |
|
|
|
$ |
|
|
|
$ |
|
|
|
$ |
|
|
|
$ |
|
|
|
|
|
|
|
|
|
|
|
|
|
|
|
|
|
|
|
|
|
|
|
|
|
|
|
|
|
|
|
Nine Months Ended September 30, |
|
|||||||||||||||||||||
|
|
|
2022 |
|
|
2021 |
|
||||||||||||||||||
|
(Dollars in millions) |
|
Federal Education Loans |
|
|
Business Processing |
|
|
Total Revenue |
|
|
Federal Education Loans |
|
|
Business Processing |
|
|
Total Revenue |
|
||||||
|
|
|
|
|
|
|
|
|
|
|
|
|
|
|
|
|
|
|
|
|
|
|
|
|
|
|
Federal government |
|
$ |
— |
|
|
$ |
|
|
|
$ |
|
|
|
$ |
|
|
|
$ |
|
|
|
$ |
|
|
|
Guarantor agencies |
|
|
|
|
|
|
— |
|
|
|
|
|
|
|
|
|
|
|
— |
|
|
|
|
|
|
Other institutions |
|
|
— |
|
|
|
— |
|
|
|
— |
|
|
|
— |
|
|
|
— |
|
|
|
— |
|
|
State and local government |
|
|
— |
|
|
|
|
|
|
|
|
|
|
|
— |
|
|
|
|
|
|
|
|
|
|
Tolling authorities |
|
|
— |
|
|
|
|
|
|
|
|
|
|
|
— |
|
|
|
|
|
|
|
|
|
|
Hospitals and other healthcare providers |
|
|
— |
|
|
|
|
|
|
|
|
|
|
|
— |
|
|
|
|
|
|
|
|
|
|
Total |
|
$ |
|
|
|
$ |
|
|
|
$ |
|
|
|
$ |
|
|
|
$ |
|
|
|
$ |
|
|
As of September 30, 2022 and September 30, 2021, there was $
83
NAVIENT CORPORATION
NOTES TO CONSOLIDATED FINANCIAL STATEMENTS
(Information at September 30, 2022 and for the three and nine months ended
September 30, 2022 and 2021 is unaudited)
11. Segment Reporting
We monitor and assess our ongoing operations and results based on the following
These segments meet the quantitative thresholds for reportable operating segments. Accordingly, the results of operations of these reportable operating segments are presented separately. The underlying operating segments are used by the Company’s chief operating decision maker to manage the business, review operating performance and allocate resources, and qualify to be aggregated as part of the primary reportable operating segments. As discussed further below, we measure the profitability of our operating segments based on Core Earnings net income. Accordingly, information regarding our reportable operating segments net income is provided on a Core Earnings basis.
Federal Education Loans Segment
Navient owns FFELP Loans and performs servicing and asset recovery services on this portfolio. We also service and perform asset recovery services on FFELP Loans owned by other institutions. Our servicing quality, data-driven strategies and omnichannel education about federal repayment options translate into positive results for the millions of borrowers we serve. We generate revenue primarily through net interest income on our FFELP Loans. This segment is expected to generate significant earnings and cash flow over the remaining life of the portfolio.
The following table includes asset information for our Federal Education Loans segment.
|
(Dollars in millions) |
|
September 30, 2022 |
|
|
December 31, 2021 |
|
||
|
FFELP Loans, net |
|
$ |
|
|
|
$ |
|
|
|
Cash and investments (1) |
|
|
|
|
|
|
|
|
|
Other |
|
|
|
|
|
|
|
|
|
Total assets |
|
$ |
|
|
|
$ |
|
|
|
|
(1) |
Includes restricted cash and investments. |
Consumer Lending Segment
Navient helps students and families through the paying-for-college journey. Our digital tools empower people to find grants and scholarships, compare financial aid offers and complete the FAFSA. Our Private Education Loans offer easy-to-understand payment options. After graduation, we offer student loan refinancing to help people simplify their repayment and earn a better rate. We believe our 50 years of experience, product design, digital marketing strategies, and origination and servicing platform provide a unique competitive advantage. We see meaningful growth opportunities in originating Private Education Loans to financially responsible consumers, generating attractive long-term, risk-adjusted returns. We generate revenue primarily through net interest income on our Private Education Loan portfolio.
The following table includes asset information for our Consumer Lending segment
|
(Dollars in millions) |
|
September 30, 2022 |
|
|
December 31, 2021 |
|
||
|
Private Education Loans, net |
|
$ |
|
|
|
$ |
|
|
|
Cash and investments (1) |
|
|
|
|
|
|
|
|
|
Other |
|
|
|
|
|
|
|
|
|
Total assets |
|
$ |
|
|
|
$ |
|
|
|
|
(1) |
Includes restricted cash and investments. |
84
NAVIENT CORPORATION
NOTES TO CONSOLIDATED FINANCIAL STATEMENTS
(Information at September 30, 2022 and for the three and nine months ended
September 30, 2022 and 2021 is unaudited)
11. Segment Reporting (Continued)
Business Processing Segment
Navient provides business processing solutions such as omnichannel contact center services, workflow processing, and revenue cycle optimization. Our support enables our clients to better serve their constituents, meet rapidly changing needs, improve technology, reduce operating expenses, manage risk and optimize revenue opportunities. Our clients include:
|
|
• |
Government: We offer our solutions to federal agencies, state governments, tolling and parking authorities, other public sector clients. |
|
|
• |
Healthcare: Our clients include hospitals, hospital systems, medical centers, large physician groups, other healthcare providers and public health departments. |
At September 30, 2022 and December 31, 2021, the Business Processing segment had total assets of $
Other Segment
This segment consists of our corporate liquidity portfolio, gains and losses incurred on the repurchase of debt, unallocated expenses of shared services (which includes regulatory expenses) and restructuring/other reorganization expenses.
Unallocated shared services expenses are comprised of costs primarily related to information technology costs related to infrastructure and operations, stock-based compensation expense, accounting, finance, legal, compliance and risk management, regulatory-related expenses, human resources, certain executive management and the board of directors. Regulatory-related expenses include actual settlement amounts as well as third-party professional fees we incur in connection with such regulatory matters and are presented net of any insurance reimbursements for covered costs related to such matters.
At September 30, 2022 and December 31, 2021, the Other segment had total assets of $
85
NAVIENT CORPORATION
NOTES TO CONSOLIDATED FINANCIAL STATEMENTS
(Information at September 30, 2022 and for the three and nine months ended
September 30, 2022 and 2021 is unaudited)
11. Segment Reporting (Continued)
Measure of Profitability
We prepare financial statements and present financial results in accordance with GAAP. However, we also evaluate our business segments and present financial results on a basis that differs from GAAP. We refer to this different basis of presentation as Core Earnings. We provide this Core Earnings basis of presentation on a consolidated basis and for each business segment because this is what we review internally when making management decisions regarding our performance and how we allocate resources. We also refer to this information in our presentations with credit rating agencies, lenders and investors. Because our Core Earnings basis of presentation corresponds to our segment financial presentations, we are required by GAAP to provide Core Earnings disclosure in the notes to our consolidated financial statements for our business segments.
Core Earnings are not a substitute for reported results under GAAP. We use Core Earnings to manage our business segments because Core Earnings reflect adjustments to GAAP financial results for two items, discussed below, that can create significant volatility mostly due to timing factors generally beyond the control of management. Accordingly, we believe that Core Earnings provide management with a useful basis from which to better evaluate results from ongoing operations against the business plan or against results from prior periods. Consequently, we disclose this information because we believe it provides investors with additional information regarding the operational and performance indicators that are most closely assessed by management. When compared to GAAP results, the two items we remove to result in our Core Earnings presentations are:
|
|
1. |
Mark-to-market gains/losses resulting from our use of derivative instruments to hedge our economic risks that do not qualify for hedge accounting treatment or do qualify for hedge accounting treatment but result in ineffectiveness; and |
|
|
2. |
The accounting for goodwill and acquired intangible assets. |
While GAAP provides a uniform, comprehensive basis of accounting, for the reasons described above, our Core Earnings basis of presentation does not. Core Earnings are subject to certain general and specific limitations that investors should carefully consider. For example, there is no comprehensive, authoritative guidance for management reporting. Our Core Earnings are not defined terms within GAAP and may not be comparable to similarly titled measures reported by other companies. Accordingly, our Core Earnings presentation does not represent a comprehensive basis of accounting. Investors, therefore, may not be able to compare our performance with that of other financial services companies based upon Core Earnings. Core Earnings results are only meant to supplement GAAP results by providing additional information regarding the operational and performance indicators that are most closely used by management, our board of directors, credit rating agencies, lenders and investors to assess performance.
86
NAVIENT CORPORATION
NOTES TO CONSOLIDATED FINANCIAL STATEMENTS
(Information at September 30, 2022 and for the three and nine months ended
September 30, 2022 and 2021 is unaudited)
11. Segment Reporting (Continued)
Segment Results and Reconciliations to GAAP
|
|
|
Three Months Ended September 30, 2022 |
|
|||||||||||||||||||||||||||||||||
|
|
|
|
|
|
|
|
|
|
|
|
|
|
|
|
|
|
|
|
|
|
|
Adjustments |
|
|
|
|
|
|||||||||
|
(Dollars in millions) |
|
Federal Education Loans |
|
|
Consumer Lending |
|
|
Business Processing |
|
|
Other |
|
|
Total Core Earnings |
|
|
Reclassi- fications |
|
|
Additions/ (Subtractions) |
|
|
Total Adjustments (1) |
|
|
Total GAAP |
|
|||||||||
|
Interest income: |
|
|
|
|
|
|
|
|
|
|
|
|
|
|
|
|
|
|
|
|
|
|
|
|
|
|
|
|
|
|
|
|
|
|
|
|
|
Education loans |
|
$ |
|
|
|
$ |
|
|
|
$ |
— |
|
|
$ |
— |
|
|
$ |
|
|
|
$ |
— |
|
|
$ |
(
|
) |
|
$ |
(
|
) |
|
$ |
|
|
|
Cash and investments |
|
|
|
|
|
|
|
|
|
|
— |
|
|
|
|
|
|
|
|
|
|
|
— |
|
|
|
— |
|
|
|
— |
|
|
|
|
|
|
Total interest income |
|
|
|
|
|
|
|
|
|
|
— |
|
|
|
|
|
|
|
|
|
|
|
— |
|
|
|
(
|
) |
|
|
(
|
) |
|
|
|
|
|
Total interest expense |
|
|
|
|
|
|
|
|
|
|
— |
|
|
|
|
|
|
|
|
|
|
|
(
|
) |
|
|
|
|
|
|
|
|
|
|
|
|
|
Net interest income (loss) |
|
|
|
|
|
|
|
|
|
|
— |
|
|
|
(
|
) |
|
|
|
|
|
|
|
|
|
|
(
|
) |
|
|
(
|
) |
|
|
|
|
|
Less: provisions for loan losses |
|
|
— |
|
|
|
|
|
|
|
— |
|
|
|
— |
|
|
|
|
|
|
|
— |
|
|
|
— |
|
|
|
— |
|
|
|
|
|
|
Net interest income (loss) after provisions for loan losses |
|
|
|
|
|
|
|
|
|
|
— |
|
|
|
(
|
) |
|
|
|
|
|
|
|
|
|
|
(
|
) |
|
|
(
|
) |
|
|
|
|
|
Other income (loss): |
|
|
|
|
|
|
|
|
|
|
|
|
|
|
|
|
|
|
|
|
|
|
|
|
|
|
|
|
|
|
|
|
|
|
|
|
|
Servicing revenue |
|
|
|
|
|
|
|
|
|
|
— |
|
|
|
— |
|
|
|
|
|
|
|
— |
|
|
|
— |
|
|
|
— |
|
|
|
|
|
|
Asset recovery and business processing revenue |
|
|
|
|
|
|
— |
|
|
|
|
|
|
|
— |
|
|
|
|
|
|
|
— |
|
|
|
— |
|
|
|
— |
|
|
|
|
|
|
Other income (loss) |
|
|
|
|
|
|
— |
|
|
|
— |
|
|
|
— |
|
|
|
|
|
|
|
(
|
) |
|
|
|
|
|
|
|
|
|
|
|
|
|
Total other income (loss) |
|
|
|
|
|
|
|
|
|
|
|
|
|
|
— |
|
|
|
|
|
|
|
(
|
) |
|
|
|
|
|
|
|
|
|
|
|
|
|
Expenses: |
|
|
|
|
|
|
|
|
|
|
|
|
|
|
|
|
|
|
|
|
|
|
|
|
|
|
|
|
|
|
|
|
|
|
|
|
|
Direct operating expenses |
|
|
|
|
|
|
|
|
|
|
|
|
|
|
— |
|
|
|
|
|
|
|
— |
|
|
|
— |
|
|
|
— |
|
|
|
|
|
|
Unallocated shared services expenses |
|
|
— |
|
|
|
— |
|
|
|
— |
|
|
|
|
|
|
|
|
|
|
|
— |
|
|
|
— |
|
|
|
— |
|
|
|
|
|
|
Operating expenses |
|
|
|
|
|
|
|
|
|
|
|
|
|
|
|
|
|
|
|
|
|
|
— |
|
|
|
— |
|
|
|
— |
|
|
|
|
|
|
Goodwill and acquired intangible asset impairment and amortization |
|
|
— |
|
|
|
— |
|
|
|
— |
|
|
|
— |
|
|
|
— |
|
|
|
— |
|
|
|
|
|
|
|
|
|
|
|
|
|
|
Restructuring/other reorganization expenses |
|
|
— |
|
|
|
— |
|
|
|
— |
|
|
|
|
|
|
|
|
|
|
|
— |
|
|
|
— |
|
|
|
— |
|
|
|
|
|
|
Total expenses |
|
|
|
|
|
|
|
|
|
|
|
|
|
|
|
|
|
|
|
|
|
|
— |
|
|
|
|
|
|
|
|
|
|
|
|
|
|
Income (loss) before income tax expense (benefit) |
|
|
|
|
|
|
|
|
|
|
|
|
|
|
(
|
) |
|
|
|
|
|
|
— |
|
|
|
|
|
|
|
|
|
|
|
|
|
|
Income tax expense (benefit) (2) |
|
|
|
|
|
|
|
|
|
|
|
|
|
|
(
|
) |
|
|
|
|
|
|
— |
|
|
|
|
|
|
|
|
|
|
|
|
|
|
Net income (loss) |
|
$ |
|
|
|
$ |
|
|
|
$ |
|
|
|
$ |
(
|
) |
|
$ |
|
|
|
$ |
— |
|
|
$ |
|
|
|
$ |
|
|
|
$ |
|
|
|
(1) |
Core Earnings adjustments to GAAP: |
|
|
|
Three Months Ended September 30, 2022 |
|
|||||||||
|
(Dollars in millions) |
|
Net Impact of Derivative Accounting |
|
|
Net Impact of Goodwill and Acquired Intangibles |
|
|
Total |
|
|||
|
Net interest income (loss) after provisions for loan losses |
|
$ |
(
|
) |
|
$ |
— |
|
|
$ |
(
|
) |
|
Total other income (loss) |
|
|
|
|
|
|
— |
|
|
|
|
|
|
Goodwill and acquired intangible asset impairment and amortization |
|
|
— |
|
|
|
|
|
|
|
|
|
|
Total Core Earnings adjustments to GAAP |
|
$ |
|
|
|
$ |
(
|
) |
|
|
|
|
|
Income tax expense (benefit) |
|
|
|
|
|
|
|
|
|
|
|
|
|
Net income (loss) |
|
|
|
|
|
|
|
|
|
$ |
|
|
|
(2) |
Income taxes are based on a percentage of net income before tax for the individual reportable segment. |
87
NAVIENT CORPORATION
NOTES TO CONSOLIDATED FINANCIAL STATEMENTS
(Information at September 30, 2022 and for the three and nine months ended
September 30, 2022 and 2021 is unaudited)
11. Segment Reporting (Continued)
|
|
|
Three Months Ended September 30, 2021 |
|
|||||||||||||||||||||||||||||||||
|
|
|
|
|
|
|
|
|
|
|
|
|
|
|
|
|
|
|
|
|
|
|
Adjustments |
|
|
|
|
|
|||||||||
|
(Dollars in millions) |
|
Federal Education Loans |
|
|
Consumer Lending |
|
|
Business Processing |
|
|
Other |
|
|
Total Core Earnings |
|
|
Reclassi- fications |
|
|
Additions/ (Subtractions) |
|
|
Total Adjustments (1) |
|
|
Total GAAP |
|
|||||||||
|
Interest income: |
|
|
|
|
|
|
|
|
|
|
|
|
|
|
|
|
|
|
|
|
|
|
|
|
|
|
|
|
|
|
|
|
|
|
|
|
|
Education loans |
|
$ |
|
|
|
$ |
|
|
|
$ |
— |
|
|
$ |
— |
|
|
$ |
|
|
|
$ |
|
|
|
$ |
(
|
) |
|
$ |
|
|
|
$ |
|
|
|
Cash and investments |
|
|
— |
|
|
|
|
|
|
|
— |
|
|
|
— |
|
|
|
|
|
|
|
— |
|
|
|
— |
|
|
|
— |
|
|
|
|
|
|
Total interest income |
|
|
|
|
|
|
|
|
|
|
— |
|
|
|
— |
|
|
|
|
|
|
|
|
|
|
|
(
|
) |
|
|
|
|
|
|
|
|
|
Total interest expense |
|
|
|
|
|
|
|
|
|
|
— |
|
|
|
|
|
|
|
|
|
|
|
(
|
) |
|
|
(
|
) |
|
|
(
|
) |
|
|
|
|
|
Net interest income (loss) |
|
|
|
|
|
|
|
|
|
|
— |
|
|
|
(
|
) |
|
|
|
|
|
|
|
|
|
|
|
|
|
|
|
|
|
|
|
|
|
Less: provisions for loan losses |
|
|
— |
|
|
|
|
|
|
|
— |
|
|
|
— |
|
|
|
|
|
|
|
— |
|
|
|
— |
|
|
|
— |
|
|
|
|
|
|
Net interest income (loss) after provisions for loan losses |
|
|
|
|
|
|
|
|
|
|
— |
|
|
|
(
|
) |
|
|
|
|
|
|
|
|
|
|
|
|
|
|
|
|
|
|
|
|
|
Other income (loss): |
|
|
|
|
|
|
|
|
|
|
|
|
|
|
|
|
|
|
|
|
|
|
|
|
|
|
|
|
|
|
|
|
|
|
|
|
|
Servicing revenue |
|
|
|
|
|
|
— |
|
|
|
— |
|
|
|
— |
|
|
|
|
|
|
|
— |
|
|
|
— |
|
|
|
— |
|
|
|
|
|
|
Asset recovery and business processing revenue |
|
|
|
|
|
|
— |
|
|
|
|
|
|
|
— |
|
|
|
|
|
|
|
— |
|
|
|
— |
|
|
|
— |
|
|
|
|
|
|
Other income (loss) |
|
|
|
|
|
|
— |
|
|
|
— |
|
|
|
|
|
|
|
|
|
|
|
(
|
) |
|
|
|
|
|
|
(
|
) |
|
|
(
|
) |
|
Losses on debt repurchases |
|
|
— |
|
|
|
— |
|
|
|
— |
|
|
|
(
|
) |
|
|
(
|
) |
|
|
— |
|
|
|
— |
|
|
|
— |
|
|
|
(
|
) |
|
Total other income (loss) |
|
|
|
|
|
|
— |
|
|
|
|
|
|
|
(
|
) |
|
|
|
|
|
|
(
|
) |
|
|
|
|
|
|
(
|
) |
|
|
|
|
|
Expenses: |
|
|
|
|
|
|
|
|
|
|
|
|
|
|
|
|
|
|
|
|
|
|
|
|
|
|
|
|
|
|
|
|
|
|
|
|
|
Direct operating expenses |
|
|
|
|
|
|
|
|
|
|
|
|
|
|
— |
|
|
|
|
|
|
|
— |
|
|
|
— |
|
|
|
— |
|
|
|
|
|
|
Unallocated shared services expenses |
|
|
— |
|
|
|
— |
|
|
|
— |
|
|
|
|
|
|
|
|
|
|
|
— |
|
|
|
— |
|
|
|
— |
|
|
|
|
|
|
Operating expenses |
|
|
|
|
|
|
|
|
|
|
|
|
|
|
|
|
|
|
|
|
|
|
— |
|
|
|
— |
|
|
|
— |
|
|
|
|
|
|
Goodwill and acquired intangible asset impairment and amortization |
|
|
— |
|
|
|
— |
|
|
|
— |
|
|
|
— |
|
|
|
— |
|
|
|
— |
|
|
|
|
|
|
|
|
|
|
|
|
|
|
Restructuring/other reorganization expenses |
|
|
— |
|
|
|
— |
|
|
|
— |
|
|
|
— |
|
|
|
— |
|
|
|
— |
|
|
|
— |
|
|
|
— |
|
|
|
— |
|
|
Total expenses |
|
|
|
|
|
|
|
|
|
|
|
|
|
|
|
|
|
|
|
|
|
|
— |
|
|
|
|
|
|
|
|
|
|
|
|
|
|
Income (loss) before income tax expense (benefit) |
|
|
|
|
|
|
|
|
|
|
|
|
|
|
(
|
) |
|
|
|
|
|
|
— |
|
|
|
|
|
|
|
|
|
|
|
|
|
|
Income tax expense (benefit) (2) |
|
|
|
|
|
|
|
|
|
|
|
|
|
|
(
|
) |
|
|
|
|
|
|
— |
|
|
|
|
|
|
|
|
|
|
|
|
|
|
Net income (loss) |
|
$ |
|
|
|
$ |
|
|
|
$ |
|
|
|
$ |
(
|
) |
|
$ |
|
|
|
$ |
— |
|
|
$ |
|
|
|
$ |
|
|
|
$ |
|
|
|
|
|
|
|
|
|
|
|
|
|
|
|
|
|
|
|
|
|
|
|
|
|
|
|
|
|
|
|
|
|
|
|
|
|
|
|
|
|
(1) |
Core Earnings adjustments to GAAP: |
|
|
|
Three Months Ended September 30, 2021 |
|
|||||||||
|
(Dollars in millions) |
|
Net Impact of Derivative Accounting |
|
|
Net Impact of Goodwill and Acquired Intangibles |
|
|
Total |
|
|||
|
Net interest income (loss) after provisions for loan losses |
|
$ |
|
|
|
$ |
— |
|
|
$ |
|
|
|
Total other income (loss) |
|
|
(
|
) |
|
|
— |
|
|
|
(
|
) |
|
Goodwill and acquired intangible asset impairment and amortization |
|
|
— |
|
|
|
|
|
|
|
|
|
|
Total Core Earnings adjustments to GAAP |
|
$ |
|
|
|
$ |
(
|
) |
|
|
|
|
|
Income tax expense (benefit) |
|
|
|
|
|
|
|
|
|
|
|
|
|
Net income (loss) |
|
|
|
|
|
|
|
|
|
$ |
|
|
|
(2) |
Income taxes are based on a percentage of net income before tax for the individual reportable segment. |
88
NAVIENT CORPORATION
NOTES TO CONSOLIDATED FINANCIAL STATEMENTS
(Information at September 30, 2022 and for the three and nine months ended
September 30, 2022 and 2021 is unaudited)
11. Segment Reporting (Continued)
|
|
|
Nine Months Ended September 30, 2022 |
|
|||||||||||||||||||||||||||||||||
|
|
|
|
|
|
|
|
|
|
|
|
|
|
|
|
|
|
|
|
|
|
|
Adjustments |
|
|
|
|
|
|||||||||
|
(Dollars in millions) |
|
Federal Education Loans |
|
|
Consumer Lending |
|
|
Business Processing |
|
|
Other |
|
|
Total Core Earnings |
|
|
Reclassi- fications |
|
|
Additions/ (Subtractions) |
|
|
Total Adjustments (1) |
|
|
Total GAAP |
|
|||||||||
|
Interest income: |
|
|
|
|
|
|
|
|
|
|
|
|
|
|
|
|
|
|
|
|
|
|
|
|
|
|
|
|
|
|
|
|
|
|
|
|
|
Education loans |
|
$ |
|
|
|
$ |
|
|
|
$ |
— |
|
|
$ |
— |
|
|
$ |
|
|
|
$ |
|
|
|
$ |
(
|
) |
|
$ |
|
|
|
$ |
|
|
|
Cash and investments |
|
|
|
|
|
|
|
|
|
|
— |
|
|
|
|
|
|
|
|
|
|
|
— |
|
|
|
— |
|
|
|
— |
|
|
|
|
|
|
Total interest income |
|
|
|
|
|
|
|
|
|
|
— |
|
|
|
|
|
|
|
|
|
|
|
|
|
|
|
(
|
) |
|
|
|
|
|
|
|
|
|
Total interest expense |
|
|
|
|
|
|
|
|
|
|
— |
|
|
|
|
|
|
|
|
|
|
|
|
|
|
|
(
|
) |
|
|
(
|
) |
|
|
|
|
|
Net interest income (loss) |
|
|
|
|
|
|
|
|
|
|
— |
|
|
|
(
|
) |
|
|
|
|
|
|
|
|
|
|
|
|
|
|
|
|
|
|
|
|
|
Less: provisions for loan losses |
|
|
— |
|
|
|
|
|
|
|
— |
|
|
|
— |
|
|
|
|
|
|
|
— |
|
|
|
— |
|
|
|
— |
|
|
|
|
|
|
Net interest income (loss) after provisions for loan losses |
|
|
|
|
|
|
|
|
|
|
— |
|
|
|
(
|
) |
|
|
|
|
|
|
|
|
|
|
|
|
|
|
|
|
|
|
|
|
|
Other income (loss): |
|
|
|
|
|
|
|
|
|
|
|
|
|
|
|
|
|
|
|
|
|
|
|
|
|
|
|
|
|
|
|
|
|
|
|
|
|
Servicing revenue |
|
|
|
|
|
|
|
|
|
|
— |
|
|
|
— |
|
|
|
|
|
|
|
— |
|
|
|
— |
|
|
|
— |
|
|
|
|
|
|
Asset recovery and business processing revenue |
|
|
|
|
|
|
— |
|
|
|
|
|
|
|
— |
|
|
|
|
|
|
|
— |
|
|
|
— |
|
|
|
— |
|
|
|
|
|
|
Other income (loss) |
|
|
|
|
|
|
|
|
|
|
— |
|
|
|
(
|
) |
|
|
|
|
|
|
(
|
) |
|
|
|
|
|
|
|
|
|
|
|
|
|
Total other income (loss) |
|
|
|
|
|
|
|
|
|
|
|
|
|
|
(
|
) |
|
|
|
|
|
|
(
|
) |
|
|
|
|
|
|
|
|
|
|
|
|
|
Expenses: |
|
|
|
|
|
|
|
|
|
|
|
|
|
|
|
|
|
|
|
|
|
|
|
|
|
|
|
|
|
|
|
|
|
|
|
|
|
Direct operating expenses |
|
|
|
|
|
|
|
|
|
|
|
|
|
|
— |
|
|
|
|
|
|
|
— |
|
|
|
— |
|
|
|
— |
|
|
|
|
|
|
Unallocated shared services expenses |
|
|
— |
|
|
|
— |
|
|
|
— |
|
|
|
|
|
|
|
|
|
|
|
— |
|
|
|
— |
|
|
|
— |
|
|
|
|
|
|
Operating expenses |
|
|
|
|
|
|
|
|
|
|
|
|
|
|
|
|
|
|
|
|
|
|
— |
|
|
|
— |
|
|
|
— |
|
|
|
|
|
|
Goodwill and acquired intangible asset impairment and amortization |
|
|
— |
|
|
|
— |
|
|
|
— |
|
|
|
— |
|
|
|
— |
|
|
|
— |
|
|
|
|
|
|
|
|
|
|
|
|
|
|
Restructuring/other reorganization expenses |
|
|
— |
|
|
|
— |
|
|
|
— |
|
|
|
|
|
|
|
|
|
|
|
— |
|
|
|
— |
|
|
|
— |
|
|
|
|
|
|
Total expenses |
|
|
|
|
|
|
|
|
|
|
|
|
|
|
|
|
|
|
|
|
|
|
— |
|
|
|
|
|
|
|
|
|
|
|
|
|
|
Income (loss) before income tax expense (benefit) |
|
|
|
|
|
|
|
|
|
|
|
|
|
|
(
|
) |
|
|
|
|
|
|
— |
|
|
|
|
|
|
|
|
|
|
|
|
|
|
Income tax expense (benefit) (2) |
|
|
|
|
|
|
|
|
|
|
|
|
|
|
(
|
) |
|
|
|
|
|
|
— |
|
|
|
|
|
|
|
|
|
|
|
|
|
|
Net income (loss) |
|
$ |
|
|
|
$ |
|
|
|
$ |
|
|
|
$ |
(
|
) |
|
$ |
|
|
|
$ |
— |
|
|
$ |
|
|
|
$ |
|
|
|
$ |
|
|
|
(1) |
Core Earnings adjustments to GAAP: |
|
|
|
Nine Months Ended September 30, 2022 |
|
|||||||||
|
(Dollars in millions) |
|
Net Impact of Derivative Accounting |
|
|
Net Impact of Goodwill and Acquired Intangibles |
|
|
Total |
|
|||
|
Net interest income (loss) after provisions for loan losses |
|
$ |
|
|
|
$ |
— |
|
|
$ |
|
|
|
Total other income (loss) |
|
|
|
|
|
|
— |
|
|
|
|
|
|
Goodwill and acquired intangible asset impairment and amortization |
|
|
— |
|
|
|
|
|
|
|
|
|
|
Total Core Earnings adjustments to GAAP |
|
$ |
|
|
|
$ |
(
|
) |
|
|
|
|
|
Income tax expense (benefit) |
|
|
|
|
|
|
|
|
|
|
|
|
|
Net income (loss) |
|
|
|
|
|
|
|
|
|
$ |
|
|
(2) Income taxes are based on a percentage of net income before tax for the individual reportable segment.
89
NAVIENT CORPORATION
NOTES TO CONSOLIDATED FINANCIAL STATEMENTS
(Information at September 30, 2022 and for the three and nine months ended
September 30, 2022 and 2021 is unaudited)
11. Segment Reporting (Continued)
|
|
|
Nine Months Ended September 30, 2021 |
|
|||||||||||||||||||||||||||||||||
|
|
|
|
|
|
|
|
|
|
|
|
|
|
|
|
|
|
|
|
|
|
|
Adjustments |
|
|
|
|
|
|||||||||
|
(Dollars in millions) |
|
Federal Education Loans |
|
|
Consumer Lending |
|
|
Business Processing |
|
|
Other |
|
|
Total Core Earnings |
|
|
Reclassi- fications |
|
|
Additions/ (Subtractions) |
|
|
Total Adjustments (1) |
|
|
Total GAAP |
|
|||||||||
|
Interest income: |
|
|
|
|
|
|
|
|
|
|
|
|
|
|
|
|
|
|
|
|
|
|
|
|
|
|
|
|
|
|
|
|
|
|
|
|
|
Education loans |
|
$ |
|
|
|
$ |
|
|
|
$ |
— |
|
|
$ |
— |
|
|
$ |
|
|
|
$ |
|
|
|
$ |
(
|
) |
|
$ |
|
|
|
$ |
|
|
|
Cash and investments |
|
|
— |
|
|
|
|
|
|
|
— |
|
|
|
|
|
|
|
|
|
|
|
— |
|
|
|
— |
|
|
|
— |
|
|
|
|
|
|
Total interest income |
|
|
|
|
|
|
|
|
|
|
— |
|
|
|
|
|
|
|
|
|
|
|
|
|
|
|
(
|
) |
|
|
|
|
|
|
|
|
|
Total interest expense |
|
|
|
|
|
|
|
|
|
|
— |
|
|
|
|
|
|
|
|
|
|
|
(
|
) |
|
|
(
|
) |
|
|
(
|
) |
|
|
|
|
|
Net interest income (loss) |
|
|
|
|
|
|
|
|
|
|
— |
|
|
|
(
|
) |
|
|
|
|
|
|
|
|
|
|
|
|
|
|
|
|
|
|
|
|
|
Less: provisions for loan losses |
|
|
— |
|
|
|
(
|
) |
|
|
— |
|
|
|
— |
|
|
|
(
|
) |
|
|
— |
|
|
|
— |
|
|
|
— |
|
|
|
(
|
) |
|
Net interest income (loss) after provisions for loan losses |
|
|
|
|
|
|
|
|
|
|
— |
|
|
|
(
|
) |
|
|
|
|
|
|
|
|
|
|
|
|
|
|
|
|
|
|
|
|
|
Other income (loss): |
|
|
|
|
|
|
|
|
|
|
|
|
|
|
|
|
|
|
|
|
|
|
|
|
|
|
|
|
|
|
|
|
|
|
|
|
|
Servicing revenue |
|
|
|
|
|
|
|
|
|
|
— |
|
|
|
— |
|
|
|
|
|
|
|
— |
|
|
|
— |
|
|
|
— |
|
|
|
|
|
|
Asset recovery and business processing revenue |
|
|
|
|
|
|
— |
|
|
|
|
|
|
|
— |
|
|
|
|
|
|
|
— |
|
|
|
— |
|
|
|
— |
|
|
|
|
|
|
Other income (loss) |
|
|
|
|
|
|
|
|
|
|
— |
|
|
|
|
|
|
|
|
|
|
|
(
|
) |
|
|
|
|
|
|
|
|
|
|
|
|
|
Gains on sales of loans |
|
|
— |
|
|
|
|
|
|
|
— |
|
|
|
— |
|
|
|
|
|
|
|
(
|
) |
|
|
— |
|
|
|
(
|
) |
|
|
|
|
|
Losses on debt repurchases |
|
|
— |
|
|
|
— |
|
|
|
— |
|
|
|
(
|
) |
|
|
(
|
) |
|
|
— |
|
|
|
— |
|
|
|
— |
|
|
|
(
|
) |
|
Total other income (loss) |
|
|
|
|
|
|
|
|
|
|
|
|
|
|
(
|
) |
|
|
|
|
|
|
(
|
) |
|
|
|
|
|
|
|
|
|
|
|
|
|
Expenses: |
|
|
|
|
|
|
|
|
|
|
|
|
|
|
|
|
|
|
|
|
|
|
|
|
|
|
|
|
|
|
|
|
|
|
|
|
|
Direct operating expenses |
|
|
|
|
|
|
|
|
|
|
|
|
|
|
— |
|
|
|
|
|
|
|
— |
|
|
|
— |
|
|
|
— |
|
|
|
|
|
|
Unallocated shared services expenses |
|
|
— |
|
|
|
— |
|
|
|
— |
|
|
|
|
|
|
|
|
|
|
|
— |
|
|
|
— |
|
|
|
— |
|
|
|
|
|
|
Operating expenses |
|
|
|
|
|
|
|
|
|
|
|
|
|
|
|
|
|
|
|
|
|
|
— |
|
|
|
— |
|
|
|
— |
|
|
|
|
|
|
Goodwill and acquired intangible asset impairment and amortization |
|
|
— |
|
|
|
— |
|
|
|
— |
|
|
|
— |
|
|
|
— |
|
|
|
— |
|
|
|
|
|
|
|
|
|
|
|
|
|
|
Restructuring/other reorganization expenses |
|
|
— |
|
|
|
— |
|
|
|
— |
|
|
|
|
|
|
|
|
|
|
|
— |
|
|
|
— |
|
|
|
— |
|
|
|
|
|
|
Total expenses |
|
|
|
|
|
|
|
|
|
|
|
|
|
|
|
|
|
|
|
|
|
|
— |
|
|
|
|
|
|
|
|
|
|
|
|
|
|
Income (loss) before income tax expense (benefit) |
|
|
|
|
|
|
|
|
|
|
|
|
|
|
(
|
) |
|
|
|
|
|
|
— |
|
|
|
|
|
|
|
|
|
|
|
|
|
|
Income tax expense (benefit) (2) |
|
|
|
|
|
|
|
|
|
|
|
|
|
|
(
|
) |
|
|
|
|
|
|
— |
|
|
|
|
|
|
|
|
|
|
|
|
|
|
Net income (loss) |
|
$ |
|
|
|
$ |
|
|
|
$ |
|
|
|
$ |
(
|
) |
|
$ |
|
|
|
$ |
— |
|
|
$ |
|
|
|
$ |
|
|
|
$ |
|
|
|
(1) |
Core Earnings adjustments to GAAP: |
|
|
|
Nine Months Ended September 30, 2021 |
|
|||||||||
|
(Dollars in millions) |
|
Net Impact of Derivative Accounting |
|
|
Net Impact of Goodwill and Acquired Intangibles |
|
|
Total |
|
|||
|
Net interest income (loss) after provisions for loan losses |
|
$ |
|
|
|
$ |
— |
|
|
$ |
|
|
|
Total other income (loss) |
|
|
|
|
|
|
— |
|
|
|
|
|
|
Goodwill and acquired intangible asset impairment and amortization |
|
|
— |
|
|
|
|
|
|
|
|
|
|
Total Core Earnings adjustments to GAAP |
|
$ |
|
|
|
$ |
(
|
) |
|
|
|
|
|
Income tax expense (benefit) |
|
|
|
|
|
|
|
|
|
|
|
|
|
Net income (loss) |
|
|
|
|
|
|
|
|
|
$ |
|
|
(2) Income taxes are based on a percentage of net income before tax for the individual reportable segment.
90
NAVIENT CORPORATION
NOTES TO CONSOLIDATED FINANCIAL STATEMENTS
(Information at September 30, 2022 and for the three and nine months ended
September 30, 2022 and 2021 is unaudited)
11. Segment Reporting (Continued)
Summary of Core Earnings Adjustments to GAAP
|
|
|
Three Months Ended September 30, |
|
|
Nine Months Ended September 30, |
|
||||||||||
|
(Dollars in millions) |
|
2022 |
|
|
2021 |
|
|
2022 |
|
|
2021 |
|
||||
|
Core Earnings net income |
|
$ |
|
|
|
$ |
|
|
|
$ |
|
|
|
$ |
|
|
|
Core Earnings adjustments to GAAP: |
|
|
|
|
|
|
|
|
|
|
|
|
|
|
|
|
|
Net impact of derivative accounting (1) |
|
|
|
|
|
|
|
|
|
|
|
|
|
|
|
|
|
Net impact of goodwill and acquired intangible assets (2) |
|
|
(
|
) |
|
|
(
|
) |
|
|
(
|
) |
|
|
(
|
) |
|
Net tax effect (3) |
|
|
(
|
) |
|
|
(
|
) |
|
|
(
|
) |
|
|
(
|
) |
|
Total Core Earnings adjustments to GAAP |
|
|
|
|
|
|
|
|
|
|
|
|
|
|
|
|
|
GAAP net income |
|
$ |
|
|
|
$ |
|
|
|
$ |
|
|
|
$ |
|
|
|
|
(1) |
Derivative accounting:
Core Earnings exclude periodic gains and losses that are caused by the mark-to-market valuations on derivatives that do not qualify for hedge accounting treatment under GAAP as well as the periodic mark-to-market gains and losses that are a result of ineffectiveness recognized related to effective hedges under GAAP. Under GAAP, for our derivatives that are held to maturity, the mark-to-market gain or loss over the life of the contract will equal $
|
|
|
(2) |
Goodwill and acquired intangible assets: Our Core Earnings exclude goodwill and intangible asset impairment and amortization of acquired intangible assets. |
|
|
(3) |
Net tax effect: Such tax effect is based upon our Core Earnings effective tax rate for the year. |
91
SIGNATURES
Pursuant to the requirements of the Securities Exchange Act of 1934, as amended, the Registrant has duly caused this report to be signed on its behalf by the undersigned hereunto duly authorized.
|
|
|
|
|
|
NAVIENT CORPORATION (Registrant) |
|
|
|
By: |
/s/ JOE FISHER |
|
|
|
Joe Fisher |
|
|
|
Chief Financial Officer |
|
|
|
(Principal Financial and Accounting Officer) |
Date: October 26, 2022
92
APPENDIX A
form 10-Q cross-reference index
|
|
|
Page Number |
|
Part I. Financial Information |
|||
|
|
|
|
|
|
|
|
|
|
|
Item 1. |
|||
|
|
|
|
|
|
Item 2. |
Management’s Discussion and Analysis of Financial Condition and Results of Operations |
||
|
|
|
|
|
|
Item 3. |
|||
|
|
|
|
|
|
Item 4. |
|||
|
|
|
||
|
Part II. Other Information |
|
||
|
|
|
|
|
|
Item 1. |
|||
|
|
|
|
|
|
Item 1A. |
|||
|
|
|
|
|
|
Item 2. |
|||
|
|
|
|
|
|
Item 3. |
Defaults Upon Senior Securities |
Not Applicable |
|
|
|
|
|
|
|
Item 4. |
Mine Safety Disclosures |
Not Applicable |
|
|
|
|
|
|
|
Item 5. |
Other Information |
Not Applicable |
|
|
|
|
|
|
|
Item 6. |
|||
|
|
|
|
|
|
|
|||
93