|
|
|
|
|
|
|
|
|
|
|
|
|
|
|
|
|
|
|
|
|
|
|
|
|
|
|
|
|
|
|
|
|
|
|
|
|
|
UNITED STATES
SECURITIES AND EXCHANGE COMMISSION
Washington, D.C. 20549
Form
(Mark One)
|
|
|
QUARTERLY REPORT PURSUANT TO SECTION 13 OR 15(d) OF THE SECURITIES EXCHANGE ACT OF 1934 |
For the quarterly period ended
or
|
|
|
TRANSITION REPORT PURSUANT TO SECTION 13 OR 15(d) OF THE SECURITIES EXCHANGE ACT OF 1934 |
For the transition period from to
Commission File Number:
(Exact name of registrant as specified in its charter)
|
|
|
|
(State or other jurisdiction of incorporation or organization) |
(I.R.S. Employer Identification No.) |
|
|
|
|
|
(
|
|
(Address of principal executive offices) |
(Telephone Number) |
(
(Registrant’s telephone number, including area code)
(Former name, former address and former fiscal year, if changed since last report)
Indicate by check mark whether the registrant: (1) has filed all reports required to be filed by Section 13 or 15(d) of the Securities Exchange Act of 1934 during the preceding 12 months (or for such shorter period that the registrant was required to file such reports), and (2) has been subject to such filing requirements for the past 90 days
.
Indicate by check mark whether the registrant has submitted electronically every Interactive Data File required to be submitted pursuant to Rule 405 of Regulation S-T (§ 232.405 of this chapter)
during the preceding 12 months (or for such shorter period that the registrant was required to submit such files).
Indicate by check mark whether the registrant is a large accelerated filer, an accelerated filer, a non-accelerated filer, smaller reporting company, or an emerging growth company. See the definitions of “large accelerated filer,” “accelerated filer,” “smaller reporting company,” and “emerging growth company” in Rule 12b-2 of the Exchange Act. (Check one):
|
|
|
☒ |
|
Accelerated filer |
|
☐ |
|
Non-accelerated filer |
|
☐ |
|
Smaller reporting company |
|
|
|
Emerging growth company |
|
|
||||
If an emerging growth company, indicate by check mark if the registrant has elected not to use the extended transition period for complying with any new or revised financial accounting standards provided pursuant to Section 13(a) of the Exchange Act. ☐
Indicate by check mark whether the registrant is a shell company (as defined in Rule 12b-2 of the Exchange Act). Yes
☐
No
Securities registered pursuant to Section 12(b) of the Act.
|
Title of each class |
|
Trading Symbol(s) |
|
Name of each exchange on which registered |
|
|
|
|
|
|
|
|
|
|
|
|
|
|
|
|
|
|
As of March 31, 2024
, there were

TABLE OF CONTENTS
Organization of Our Form 10-Q
The order and presentation of content in our Quarterly Report on Form 10-Q (Form 10-Q) differs from the traditional Securities and Exchange Commission (SEC) Form 10-Q format. Our format is designed to improve readability and to better present how we organize and manage our business. See Appendix A, "Form 10-Q Cross-Reference Index" for a cross-reference index to the traditional SEC Form 10-Q format.
|
|
Page Number
|
|
|
|
|
|
|
|
1 |
|
|
2 |
|
|
|
|
|
3 |
|
|
3 |
|
|
5 |
|
|
5 |
|
|
|
|
|
Management’s Discussion and Analysis of Financial Condition and Results of Operations |
7 |
|
7 |
|
|
8 |
|
|
9 |
|
|
11 |
|
|
18 |
|
|
22 |
|
|
25 |
|
|
25 |
|
|
|
|
|
33 |
|
|
33 |
|
|
35 |
|
|
|
|
|
Purchases of Equity Securities by the Issuer and Affiliated Purchasers |
38 |
|
40 |
|
|
41 |
|
|
42 |
|
|
76 |
|
|
77 |
|
FORWARD-LOOKING AND CAUTIONARY STATEMENTS
This Form 10-Q contains “forward-looking” statements and other information that is based on management’s current expectations as of the date of this report. Statements that are not historical facts, including statements about our beliefs, opinions, or expectations and statements that assume or are dependent upon future events, are forward-looking statements and often contain words such as “expect,” “anticipate,” “intend,” “plan,” “believe,” “seek,” “see,” “will,” “would,” “may,” “could,” “should,” “goals,” or “target.” Such statements are based on management's expectations as of the date of this filing and involve many risks and uncertainties that could cause our actual results to differ materially from those expressed or implied in our forward-looking statements. Such risks and uncertainties are discussed more fully under the section titled “Risk Factors” and include, but are not limited to the following:
Given these risks and uncertainties, readers are cautioned not to place undue reliance on such forward-looking statements. Readers are urged to carefully review and consider the various disclosures made in this Form 10-Q and in other documents we file from time to time with the SEC that disclose risks and uncertainties that may affect our business.
The preparation of our consolidated financial statements also requires management to make certain estimates and assumptions including estimates and assumptions about future events. These estimates or assumptions may prove to be incorrect and actual results could differ materially. All forward-looking statements contained in this report are qualified by these cautionary statements and are made only as of the date of this report. We do not undertake any obligation to update or revise these forward-looking statements except as required by law.
Through this discussion and analysis, we intend to provide the reader with some narrative context for how our management views our consolidated financial statements, additional context within which to assess our operating results, and information on the quality and variability of our earnings, liquidity and cash flows.
1
USE OF NON-GAAP FINANCIAL MEASURES
We prepare financial statements and present financial results in accordance with GAAP. However, we also evaluate our business segments and present our financial results on a basis that differs from GAAP. We refer to this different basis of presentation as Core Earnings, which is a non-GAAP financial measure. We provide this Core Earnings basis of presentation on a consolidated basis and for each business segment because this is what we review internally when making management decisions regarding our performance and how we allocate resources. We also include this information in our presentations with credit rating agencies, lenders and investors. Because our Core Earnings basis of presentation is our measure of profit or loss for our segments, we are required by GAAP to provide Core Earnings disclosures in the notes to our consolidated financial statements for our business segments.
In addition to Core Earnings, we present the following other non-GAAP financial measures: Tangible Equity, Adjusted Tangible Equity Ratio, Earnings before Interest, Taxes, Depreciation and Amortization Expense (EBITDA) (for the Business Processing segment), and Allowance for Loan Losses Excluding Expected Future Recoveries on Previously Fully Charged-off Loans. Definitions for the non-GAAP financial measures and reconciliations are provided below, except that reconciliations of forward-looking non-GAAP financial measures are not provided because the Company is unable to provide such reconciliations without unreasonable effort due to the uncertainty and inherent difficulty of predicting the occurrence and financial impact of certain items, including, but not limited to, the impact of any mark-to-market gains/losses resulting from our use of derivative instruments to hedge our economic risks. See “Management’s Discussion and Analysis of Financial Condition and Results of Operations — Non-GAAP Financial Measures” for a further discussion and a complete reconciliation between GAAP net income and Core Earnings.
2
Business
O verview and Fundamentals of Our Business
Navient (Nasdaq: NAVI) provides technology-enabled education finance and business processing solutions that simplify complex programs and help millions of people achieve success. Our customer-focused, data-driven services deliver exceptional results for clients in education, health care and government. Learn more at navient.com.
With a focus on data-driven insights, service, compliance and innovative support, Navient’s business consists of:

We own a portfolio of $35.9 billion of federally guaranteed Federal Family Education Loan Program (FFELP) Loans. As a servicer on our own portfolio and for third parties, we deploy data-driven approaches to support the success of our customers. Our flexible and scalable infrastructure manages large volumes of complex transactions, simplifying the customer experience and continually improving efficiency.
We help students and families succeed through the college journey with innovative planning tools, student loans and refinancing products. Our $16.6 billion Private Education Loan portfolio demonstrates high customer success rates. In the first quarter of 2024, we originated approximately $259 million of Private Education Loans.
We leverage our loan servicing expertise to provide business processing solutions for approximately 500 public sector and healthcare organizations, and their tens of millions of clients, patients, and constituents. Our suite of omnichannel customer experience, digital processing and revenue cycle solutions enables our clients to deliver better results for the people they serve.
Superior Operational Performance with a Strong Customer Service and Compliance Commitment
We help our customers — both individuals and institutions — navigate the path to financial success through proactive, data-driven, simplified service and innovative solutions.
We leverage our customer service expertise, data-driven insights, technology platforms, and scale to maximize value for our clients.
3
Navient is committed to a sustainable future. We leverage technologies that minimize energy use in our office buildings and promote widespread adoption of “paperless” digital customer communications. Navient prioritizes the usage of power-saving features to our buildings to reduce energy usage. Energy efficiency and reducing carbon dioxide (CO2) and CO2 equivalents are among the many factors considered in our real estate decisions.
Strong Financial Performance Resulting in a Strong Capital Return
Our first-quarter 2024 results continue to demonstrate the strength of our business model and our ability to deliver predictable and meaningful cash flow and earnings in a variety of economic environments.
Our significant earnings generate significant capital which allows for a strong capital return to our investors. Navient expects to continue to return excess capital to shareholders through dividends and share repurchases in accordance with our capital allocation policy.
By optimizing capital adequacy and allocating capital to highly accretive opportunities, including organic growth and acquisitions, we remain well positioned to pay dividends and repurchase stock, while maintaining appropriate leverage that supports our credit ratings and ensures ongoing access to capital markets.
In December 2021, our Board of Directors approved a share repurchase program authorizing the purchase of up to $1 billion of the Company’s outstanding common stock. At March 31, 2024, $247 million remained in share repurchase authorization.
To inform our capital allocation decisions, we use the Adjusted Tangible Equity Ratio (1) in addition to other metrics. Our GAAP equity-to-asset ratio was 4.7% and our Adjusted Tangible Equity Ratio (1) was 8.4% as of March 31, 2024.
|
(Dollars and shares in millions) |
|
Q1-24 |
|
|
Q1-23 |
|
||
|
Shares repurchased |
|
|
2.6 |
|
|
|
4.9 |
|
|
Reduction in shares outstanding |
|
|
1 |
% |
|
|
3 |
% |
|
Total repurchases in dollars |
|
$ |
43 |
|
|
$ |
85 |
|
|
Dividends paid |
|
$ |
18 |
|
|
$ |
21 |
|
|
Total Capital Returned (2) |
|
$ |
61 |
|
|
$ |
106 |
|
|
GAAP equity-to-asset ratio |
|
|
4.7 |
% |
|
|
4.4 |
% |
|
Adjusted Tangible Equity Ratio (1) |
|
|
8.4 |
% |
|
|
8.5 |
% |
4
Recent Business Developments
On January 30, 2024, as a result of an in-depth review of our business, Navient announced strategic actions to simplify our company, reduce our expense base, and enhance our flexibility. The three strategic actions are:
Since the announcement on January 30, 2024, we have made substantial progress on the above strategic actions. We are nearing completion of a final outsourcing agreement with MOHELA. Further, we expect to learn much more about the possible range of outcomes from the business processing segment divestment process during the second quarter. We are beginning to execute our plans for a leaner company. We continue to expect to be largely complete with these strategic actions by mid to end of 2025.
How We Organi ze Our Business
We operate our business in three primary segments: Federal Education Loans, Consumer Lending and Business Processing.
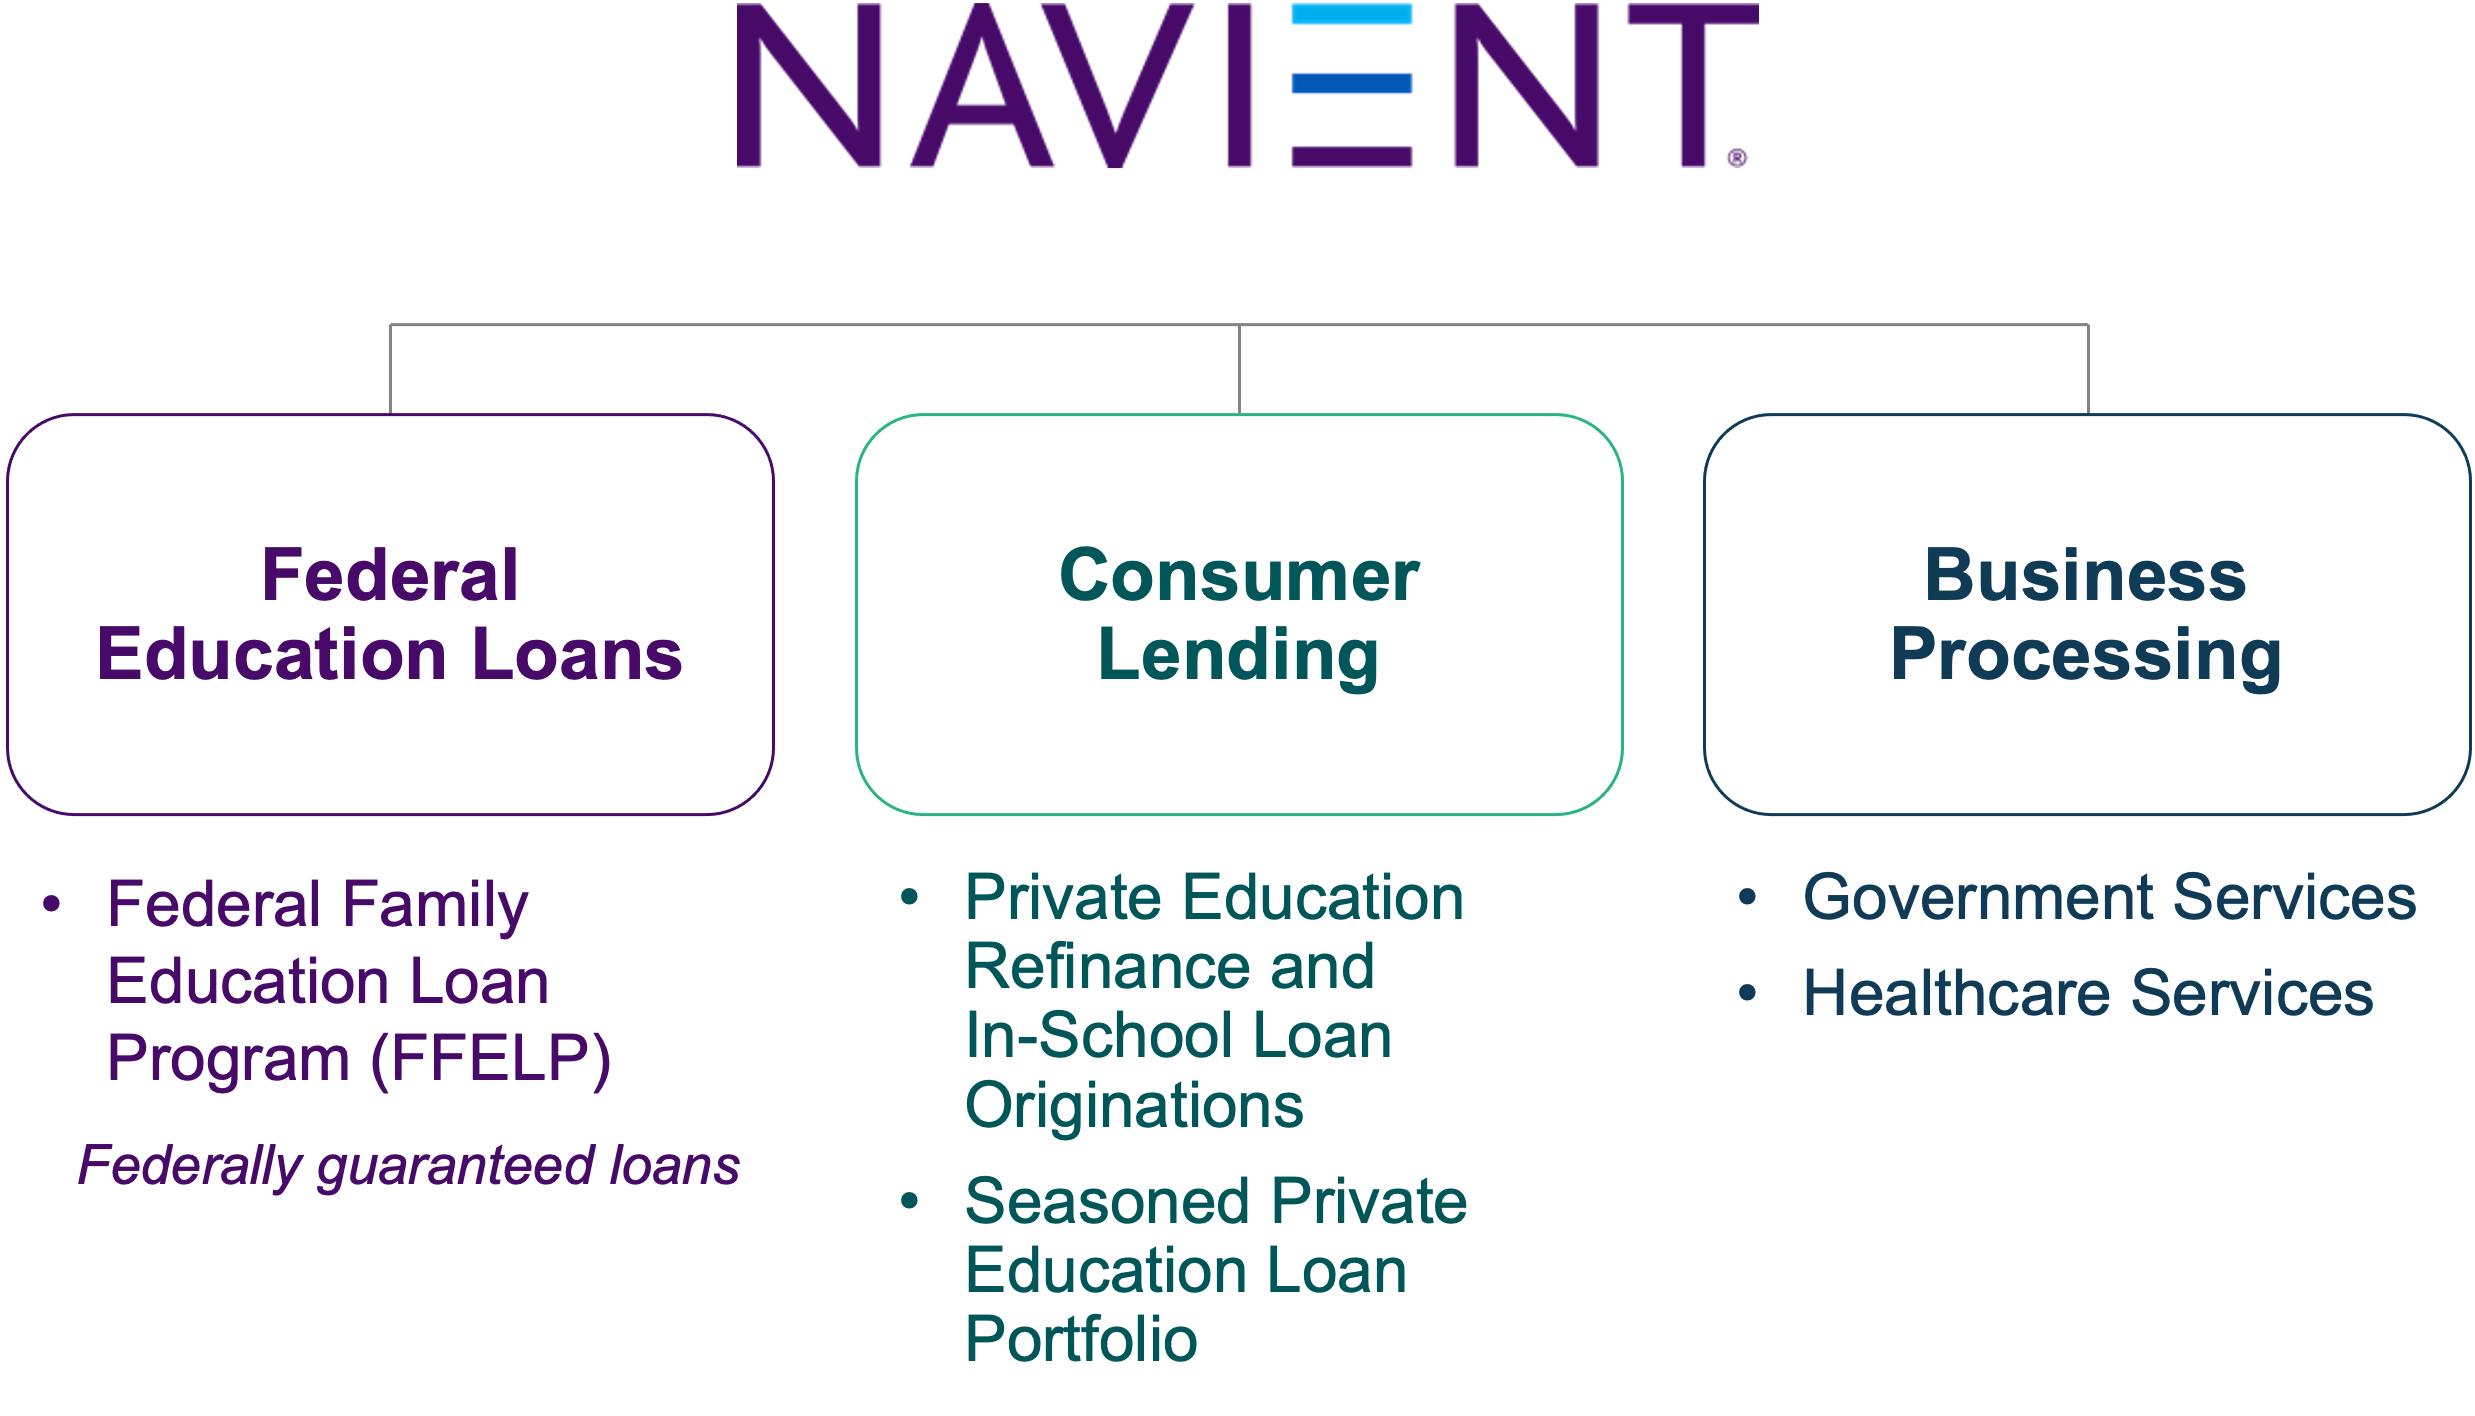
Federal Education Loans Segment
Navient owns FFELP Loans and performs servicing on this portfolio. We also service FFELP Loans owned by other institutions. Our servicing quality, data-driven strategies and omnichannel education about federal repayment options translate into positive results for the millions of borrowers we serve. We generate revenue primarily through net interest income on our FFELP Loans.
5
Consumer Lending Segment
Navient owns, originates and services refinance and in-school Private Education Loans. "Refinance" Private Education Loans are loans where a borrower has refinanced their education loans, and "In-school" Private Education Loans are loans originally made to borrowers while they are attending school. We generate revenue primarily through net interest income on our Private Education Loan portfolio.
Through our Earnest brand, we help students and families on the planning and paying for college journey. Our digital tools empower people to find scholarships and compare financial aid offers. We believe our 50 years of experience, product design, digital marketing strategies, and origination and servicing platform provide a unique competitive advantage. We see meaningful growth opportunities in originating Private Education Loans, generating attractive long-term, risk-adjusted returns.
Business Processing Segment
Navient provides business processing solutions such as omnichannel contact center services, workflow processing, and revenue cycle optimization. We leverage the same expertise and intelligent tools we use to deliver successful results for portfolios we own. Our support enables our clients to ensure better constituent outcomes, meet rapidly changing needs, improve technology, reduce operating expenses, manage risk and optimize revenue opportunities. Our clients include:
Other Segment
This segment consists of our corporate liquidity portfolio, gains and losses incurred on the repurchase of debt, unallocated expenses of shared services (which includes regulatory expenses) and restructuring/other reorganization expenses.
6
Management’s Discussion and Analysis of Financial Condition and Results of Operations
S elected Historical Financial Information and Ratios
|
|
|
Three Months Ended March 31, |
|
|||||
|
(In millions, except per share data) |
|
2024 |
|
|
2023 |
|
||
|
GAAP Basis |
|
|
|
|
|
|
||
|
Net income |
|
$ |
73 |
|
|
$ |
111 |
|
|
Diluted earnings per common share |
|
$ |
.64 |
|
|
$ |
.86 |
|
|
Weighted average shares used to compute diluted earnings per share |
|
|
114 |
|
|
|
130 |
|
|
Return on common stockholders' equity |
|
|
.51 |
% |
|
|
.68 |
% |
|
|
|
|
|
|
|
|
||
|
Core Earnings Basis (1) |
|
|
|
|
|
|
||
|
Net income (1) |
|
$ |
54 |
|
|
$ |
133 |
|
|
Diluted earnings per common share (1) |
|
$ |
.47 |
|
|
$ |
1.02 |
|
|
Weighted average shares used to compute diluted earnings per share |
|
|
114 |
|
|
|
130 |
|
|
Net interest margin, Federal Education Loans segment |
|
|
.55 |
% |
|
|
1.12 |
% |
|
Net interest margin, Consumer Lending segment |
|
|
2.99 |
% |
|
|
3.12 |
% |
|
Return on assets |
|
|
.37 |
% |
|
|
.82 |
% |
|
|
|
|
|
|
|
|
||
|
Education Loan Portfolios |
|
|
|
|
|
|
||
|
Ending FFELP Loans, net |
|
$ |
35,879 |
|
|
$ |
42,148 |
|
|
Ending Private Education Loans, net |
|
|
16,608 |
|
|
|
18,275 |
|
|
Ending total education loans, net |
|
$ |
52,487 |
|
|
$ |
60,423 |
|
|
Average FFELP Loans |
|
$ |
37,158 |
|
|
$ |
43,263 |
|
|
Average Private Education Loans |
|
|
17,385 |
|
|
|
19,289 |
|
|
Average total education loans |
|
$ |
54,543 |
|
|
$ |
62,552 |
|
7
T he Quarter i n Review
We prepare financial statements and present financial results in accordance with GAAP. However, we also evaluate our business segments and present financial results on a basis that differs from GAAP. We refer to this different basis of presentation as Core Earnings. We provide this Core Earnings basis of presentation on a consolidated basis and for each business segment because this is what we review internally when making management decisions regarding our performance and how we allocate resources. We also include this information in our presentations with credit rating agencies, lenders and investors. Because our Core Earnings basis of presentation corresponds to our segment financial presentations, we are required by GAAP to provide certain Core Earnings disclosures in the notes to our consolidated financial statements for our business segments. See “Non-GAAP Financial Measures — Core Earnings” for a further discussion and a complete reconciliation between GAAP net income and Core Earnings.
First-quarter 2024 GAAP net income was $73 million ($0.64 diluted earnings per share), compared with $111 million ($0.86 diluted earnings per share) for the year-ago quarter. See “Results of Operations – GAAP Comparison of First-Quarter 2024 Results with First-Quarter 2023" for a discussion of the primary contributors to the change in GAAP earnings between periods.
First-quarter 2024 Core Earnings net income was $54 million ($0.47 diluted Core Earnings per share), compared with $133 million ($1.02 diluted Core Earnings per share) for the year-ago quarter. See “Segment Results” for a discussion of the primary contributors to the change in Core Earnings between periods.
GAAP and Core Earnings results included a net reduction to pre-tax income of $23 million ($0.16 diluted loss per share) comprised of the following items:
Financial highlights of first-quarter 2024 include:
Federal Education Loans segment:
Consumer Lending segment:
Business Processing segment:
Capital, funding and liquidity:
Operating Expenses:
8
R esults of Operations
GAAP Income Statements (Unaudited)
|
|
|
Three Months Ended March 31, |
|
|
Increase
|
|
||||||||||
|
(In millions, except per share data) |
|
2024 |
|
|
2023 |
|
|
$ |
|
|
% |
|
||||
|
Interest income |
|
|
|
|
|
|
|
|
|
|
|
|
||||
|
FFELP Loans |
|
$ |
661 |
|
|
$ |
693 |
|
|
$ |
(32 |
) |
|
|
(5 |
)% |
|
Private Education Loans |
|
|
328 |
|
|
|
344 |
|
|
|
(16 |
) |
|
|
(5 |
) |
|
Cash and investments |
|
|
38 |
|
|
|
34 |
|
|
|
4 |
|
|
|
12 |
|
|
Total interest income |
|
|
1,027 |
|
|
|
1,071 |
|
|
|
(44 |
) |
|
|
(4 |
) |
|
Total interest expense |
|
|
875 |
|
|
|
837 |
|
|
|
38 |
|
|
|
5 |
|
|
Net interest income |
|
|
152 |
|
|
|
234 |
|
|
|
(82 |
) |
|
|
(35 |
) |
|
Less: provisions for loan losses |
|
|
12 |
|
|
|
(14 |
) |
|
|
26 |
|
|
|
186 |
|
|
Net interest income after provisions for loan
|
|
|
140 |
|
|
|
248 |
|
|
|
(108 |
) |
|
|
(44 |
) |
|
Other income (loss): |
|
|
|
|
|
|
|
|
|
|
|
|
||||
|
Servicing revenue |
|
|
17 |
|
|
|
17 |
|
|
|
— |
|
|
|
— |
|
|
Asset recovery and business processing
|
|
|
77 |
|
|
|
72 |
|
|
|
5 |
|
|
|
7 |
|
|
Other income |
|
|
9 |
|
|
|
7 |
|
|
|
2 |
|
|
|
29 |
|
|
Gains (losses) on derivative and hedging
|
|
|
32 |
|
|
|
(8 |
) |
|
|
40 |
|
|
|
500 |
|
|
Total other income |
|
|
135 |
|
|
|
88 |
|
|
|
47 |
|
|
|
53 |
|
|
Expenses: |
|
|
|
|
|
|
|
|
|
|
|
|
||||
|
Operating expenses |
|
|
183 |
|
|
|
185 |
|
|
|
(2 |
) |
|
|
(1 |
) |
|
Goodwill and acquired intangible assets
|
|
|
3 |
|
|
|
3 |
|
|
|
— |
|
|
|
— |
|
|
Restructuring/other reorganization expenses |
|
|
1 |
|
|
|
4 |
|
|
|
(3 |
) |
|
|
(75 |
) |
|
Total expenses |
|
|
187 |
|
|
|
192 |
|
|
|
(5 |
) |
|
|
(3 |
) |
|
Income before income tax expense |
|
|
88 |
|
|
|
144 |
|
|
|
(56 |
) |
|
|
(39 |
) |
|
Income tax expense |
|
|
15 |
|
|
|
33 |
|
|
|
(18 |
) |
|
|
(55 |
) |
|
Net income |
|
$ |
73 |
|
|
$ |
111 |
|
|
$ |
(38 |
) |
|
|
(34 |
)% |
|
Basic earnings per common share |
|
$ |
.65 |
|
|
$ |
.87 |
|
|
$ |
(.22 |
) |
|
|
(25 |
)% |
|
Diluted earnings per common share |
|
$ |
.64 |
|
|
$ |
.86 |
|
|
$ |
(.22 |
) |
|
|
(26 |
)% |
|
Dividends per common share |
|
$ |
.16 |
|
|
$ |
.16 |
|
|
$ |
— |
|
|
|
— |
|
9
GAAP Comparison of First-Quarter 2024 Results with First-Quarter 2023
For the three months ended March 31, 2024, net income was $73 million, or $0.64 diluted earnings per common share, compared with net income of $111 million, or $0.86 diluted earnings per common share, for the year-ago period.
The primary contributors to the change in net income are as follows:
The FFELP Loan provision for loan losses of $1 million in the current period was the result of relatively stable credit trends.
The Private Education Loan provision for loan losses of $11 million in the current period included $5 million in connection with loan originations and $6 million related to a general reserve build. The provision of $(24) million in the year-ago period included $(52) million in connection with the adoption of Accounting Standards Update (ASU) No. 2022-02, "Financial Instruments – Credit Losses: Troubled Debt Restructurings and Vintage Disclosures," $5 million in connection with loan originations and $23 million in connection with the resolution of certain private legacy loans in bankruptcy. See our Annual Report on Form 10-K for the year ended December 31, 2023 (the 2023 Form 10-K) for further discussion on the adoption of ASU No. 2022-02, as well as the resolution of certain private legacy loans in bankruptcy.
We repurchased 2.6 million and 4.9 million shares of our common stock during the first quarters of 2024 and 2023, respectively. As a result of repurchases, our average outstanding diluted shares decreased by 16 million common shares (or 12%) from the year-ago period.
10
Segment Res ults
Federal Education Loans Segment
The following table presents Core Earnings results for our Federal Education Loans segment.
|
|
|
Three Months Ended March 31, |
|
|
% Increase
|
|
||||||
|
(Dollars in millions) |
|
2024 |
|
|
2023 |
|
|
2024 vs. 2023 |
|
|||
|
Interest income: |
|
|
|
|
|
|
|
|
|
|||
|
FFELP Loans |
|
$ |
661 |
|
|
$ |
695 |
|
|
|
(5 |
)% |
|
Cash and investments |
|
|
23 |
|
|
|
20 |
|
|
|
15 |
|
|
Total interest income |
|
|
684 |
|
|
|
715 |
|
|
|
(4 |
) |
|
Total interest expense |
|
|
631 |
|
|
|
590 |
|
|
|
7 |
|
|
Net interest income |
|
|
53 |
|
|
|
125 |
|
|
|
(58 |
) |
|
Less: provision for loan losses |
|
|
1 |
|
|
|
10 |
|
|
|
(90 |
) |
|
Net interest income after provision for
|
|
|
52 |
|
|
|
115 |
|
|
|
(55 |
) |
|
Other income (loss): |
|
|
|
|
|
|
|
|
|
|||
|
Servicing revenue |
|
|
13 |
|
|
|
14 |
|
|
|
(7 |
) |
|
Other income |
|
|
4 |
|
|
|
5 |
|
|
|
(20 |
) |
|
Total other income |
|
|
17 |
|
|
|
19 |
|
|
|
(11 |
) |
|
Direct operating expenses |
|
|
17 |
|
|
|
20 |
|
|
|
(15 |
) |
|
Income before income tax expense |
|
|
52 |
|
|
|
114 |
|
|
|
(54 |
) |
|
Income tax expense |
|
|
12 |
|
|
|
27 |
|
|
|
(56 |
) |
|
Net income |
|
$ |
40 |
|
|
$ |
87 |
|
|
|
(54 |
)% |
Comparison of First-Quarter 2024 Results with First-Quarter 2023
11
Key performance metrics are as follows:
|
|
|
Three Months Ended March 31, |
|
|||||
|
(Dollars in millions) |
|
2024 |
|
|
2023 |
|
||
|
Segment net interest margin |
|
|
.55 |
% |
|
|
1.12 |
% |
|
FFELP Loans: |
|
|
|
|
|
|
||
|
FFELP Loan spread |
|
|
.66 |
% |
|
|
1.25 |
% |
|
Provision for loan losses |
|
$ |
1 |
|
|
$ |
10 |
|
|
Net charge-offs |
|
$ |
10 |
|
|
$ |
18 |
|
|
Net charge-off rate |
|
|
.13 |
% |
|
|
.22 |
% |
|
Greater than 30-days delinquency rate |
|
|
13.2 |
% |
|
|
14.4 |
% |
|
Greater than 90-days delinquency rate |
|
|
6.6 |
% |
|
|
7.9 |
% |
|
Forbearance rate |
|
|
16.0 |
% |
|
|
16.9 |
% |
|
Average FFELP Loans |
|
$ |
37,158 |
|
|
$ |
43,263 |
|
|
Ending FFELP Loans, net |
|
$ |
35,879 |
|
|
$ |
42,148 |
|
|
|
|
|
|
|
|
|
||
|
(Dollars in billions) |
|
|
|
|
|
|
||
|
Total federal loans serviced |
|
$ |
42 |
|
|
$ |
49 |
|
Net Interest Margin
The following table details the net interest margin.
|
|
|
Three Months Ended March 31, |
|
|||||
|
|
|
2024 |
|
|
2023 |
|
||
|
FFELP Loan yield |
|
|
6.91 |
% |
|
|
6.07 |
% |
|
Floor Income |
|
|
.24 |
|
|
|
.45 |
|
|
FFELP Loan net yield |
|
|
7.15 |
|
|
|
6.52 |
|
|
FFELP Loan cost of funds |
|
|
(6.49 |
) |
|
|
(5.27 |
) |
|
FFELP Loan spread |
|
|
.66 |
|
|
|
1.25 |
|
|
Other interest-earning asset spread impact |
|
|
(.11 |
) |
|
|
(.13 |
) |
|
Net interest margin (1) |
|
|
.55 |
% |
|
|
1.12 |
% |
|
|
|
Three Months Ended March 31, |
|
|||||
|
(Dollars in millions) |
|
2024 |
|
|
2023 |
|
||
|
FFELP Loans |
|
$ |
37,158 |
|
|
$ |
43,263 |
|
|
Other interest-earning assets |
|
|
1,861 |
|
|
|
1,972 |
|
|
Total FFELP Loan interest-earning assets |
|
$ |
39,019 |
|
|
$ |
45,235 |
|
The decrease in the net interest margin is primarily due to the impact of increased interest rates on the different index resets for the segment's assets and debt which resulted in a decrease of floor income and an increased cost of funds. In addition, there was an increase in prepayments which contributed to an increase in the amortization of loan premium, a non-cash reduction to interest margin.
As of March 31, 2024, our FFELP Loan portfolio totaled $35.9 billion, comprised of $12.7 billion of FFELP Stafford Loans and $23.2 billion of FFELP Consolidation Loans. The weighted-average life of these portfolios as of March 31, 2024 was 7 years and 8 years, respectively, assuming a Constant Prepayment Rate (CPR) of 7% and 5%, respectively.
Floor Income
The following table analyzes on a Core Earnings basis the ability of the FFELP Loans in our portfolio to earn Floor Income after March 31, 2024 and 2023, based on interest rates as of those dates.
|
|
|
|
|
|
|
|
||
|
(Dollars in billions) |
|
March 31, 2024 |
|
|
March 31, 2023 |
|
||
|
Education loans eligible to earn Floor Income |
|
$ |
35.6 |
|
|
$ |
41.8 |
|
|
Less: post-March 31, 2006 disbursed loans required to rebate
|
|
|
(16.9 |
) |
|
|
(19.9 |
) |
|
Less: economically hedged Floor Income |
|
|
(2.0 |
) |
|
|
(9.1 |
) |
|
Education loans eligible to earn Floor Income after rebates and
|
|
$ |
16.7 |
|
|
$ |
12.8 |
|
|
Education loans earning Floor Income |
|
$ |
1.1 |
|
|
$ |
— |
|
12
The following table presents a projection of the average balance of FFELP Consolidation Loans for which Fixed Rate Floor Income has been economically hedged with derivatives for the period April 1, 2024 to December 31, 2028.
|
(Dollars in billions) |
|
April 1, 2024
|
|
|
2025 |
|
|
2026 |
|
|
2027 |
|
|
2028 |
|
|||||
|
Average balance of FFELP Consolidation Loans
|
|
$ |
1.7 |
|
|
$ |
.9 |
|
|
$ |
.7 |
|
|
$ |
.3 |
|
|
$ |
.3 |
|
|
|
|
|
|
|
|
|
|
|
|
|
|
|
|
|
|
|||||
Operating Expenses
Operating expenses for the Federal Education Loans segment primarily include costs incurred to perform servicing on our FFELP Loan portfolio and federal education loans held by other institutions. Expenses were $3 million lower as a result of the paydown of the loan portfolio.
Various Federal Loan Forgiveness Plans
On August 24, 2022, the Biden-Harris Administration announced its Student Debt Relief (SDR) Plan. The SDR Plan would have provided up to $20,000 in one-time debt relief to income-qualified recipients with ED held student loans and a repayment pause on ED held loans. Privately held FFELP Loans, like ours, were not eligible for debt forgiveness.
A number of states and private organizations initiated legal challenges to the SDR Plan in various courts throughout the country. On June 30, 2023, the Supreme Court ruled that ED was prohibited from implementing the SDR Plan, and student loan payments on ED held loans resumed in October 2023. After the invalidation of the SDR Plan, ED announced that it had begun a new rulemaking process to consider other ways to provide debt relief to borrowers, which could include borrowers with privately held FFELP Loans. ED held several public meeting sessions with a negotiated rulemaking committee in the fourth quarter of 2023 and in the first quarter of 2024. ED is expected to publish proposed regulations for public comment in May 2024.
In addition, on July 10, 2023, ED issued final regulations on income-driven repayment plans for Direct loans, which are student loans held by ED. Eligible FFELP borrowers can access the new changes by consolidating their loans into the Direct Loan Program. The new regulations are effective July 1, 2024; however, ED has elected early implementation for some features starting July 30, 2023. The regulations provide a lower monthly loan payment on a Direct loan by decreasing discretionary income (i.e., taxable income over 225% of the federal poverty guideline), decreasing the percentage of discretionary income that must be paid toward a Direct loan to 5% (for undergraduates), and providing the option for married borrowers to exclude their spouse’s income from being factored by filing a separate tax return. Other changes provide for the elimination of accrued interest that is not covered by the monthly payment amount, provide credit towards loan forgiveness that counts certain periods of deferment and forbearance, a shorter loan forgiveness period (10-years) for borrowers with an original principal balance less than or equal to $12,000, and credit toward loan forgiveness for eligible payments on a Direct or FFELP loan that is repaid by a Direct Consolidation loan.
Several lawsuits have been filed or announced (which Navient is not party to) looking to overturn these regulations.
The proposed borrower debt relief regulations as well as the new income-driven repayment plan have increased, and may continue to increase, consolidation activity in the future as FFELP borrowers consolidate their loans into the Direct Loan Program in order to be eligible for potential debt relief and the new income-driven repayment plan. This consolidation activity could have a material impact on the Company’s results.
13
Consumer Lending Segment
The following table presents Core Earnings results for our Consumer Lending segment.
|
|
|
Three Months Ended March 31, |
|
|
% Increase
|
|
||||||
|
(Dollars in millions) |
|
2024 |
|
|
2023 |
|
|
2024 vs. 2023 |
|
|||
|
Interest income: |
|
|
|
|
|
|
|
|
|
|||
|
Private Education Loans |
|
$ |
328 |
|
|
$ |
344 |
|
|
|
(5 |
)% |
|
Cash and investments |
|
|
7 |
|
|
|
6 |
|
|
|
17 |
|
|
Interest income |
|
|
335 |
|
|
|
350 |
|
|
|
(4 |
) |
|
Interest expense |
|
|
201 |
|
|
|
197 |
|
|
|
2 |
|
|
Net interest income |
|
|
134 |
|
|
|
153 |
|
|
|
(12 |
) |
|
Less: provision for loan losses |
|
|
11 |
|
|
|
(24 |
) |
|
|
146 |
|
|
Net interest income after provision for loan losses |
|
|
123 |
|
|
|
177 |
|
|
|
(31 |
) |
|
Other income (loss): |
|
|
|
|
|
|
|
|
|
|||
|
Servicing revenue |
|
|
4 |
|
|
|
3 |
|
|
|
33 |
|
|
Other revenue |
|
|
— |
|
|
|
— |
|
|
|
— |
|
|
Total other income |
|
|
4 |
|
|
|
3 |
|
|
|
33 |
|
|
Direct operating expenses |
|
|
32 |
|
|
|
37 |
|
|
|
(14 |
) |
|
Income before income tax expense |
|
|
95 |
|
|
|
143 |
|
|
|
(34 |
) |
|
Income tax expense |
|
|
22 |
|
|
|
33 |
|
|
|
(33 |
) |
|
Net income |
|
$ |
73 |
|
|
$ |
110 |
|
|
|
(34 |
)% |
Comparison of First-Quarter 2024 Results with First-Quarter 2023
14
Key performance metrics are as follows:
|
|
|
Three Months Ended March 31, |
|
|||||
|
(Dollars in millions) |
|
2024 |
|
|
2023 |
|
||
|
Segment net interest margin |
|
|
2.99 |
% |
|
|
3.12 |
% |
|
Private Education Loans (including Refinance Loans): |
|
|
|
|
|
|
||
|
Private Education Loan spread |
|
|
3.10 |
% |
|
|
3.28 |
% |
|
Provision for loan losses |
|
$ |
11 |
|
|
$ |
(24 |
) |
|
Net charge-offs |
|
$ |
99 |
|
|
$ |
75 |
|
|
Net charge-off rate |
|
|
2.40 |
% |
|
|
1.63 |
% |
|
Greater than 30-days delinquency rate |
|
|
5.0 |
% |
|
|
4.5 |
% |
|
Greater than 90-days delinquency rate |
|
|
2.1 |
% |
|
|
2.0 |
% |
|
Forbearance rate |
|
|
1.8 |
% |
|
|
1.9 |
% |
|
Average Private Education Loans |
|
$ |
17,385 |
|
|
$ |
19,289 |
|
|
Ending Private Education Loans, net |
|
$ |
16,608 |
|
|
$ |
18,275 |
|
|
Private Education Refinance Loans: |
|
|
|
|
|
|
||
|
Net charge-offs |
|
$ |
11 |
|
|
$ |
8 |
|
|
Greater than 90-day delinquency rate |
|
|
.5 |
% |
|
|
.3 |
% |
|
Average balance of Private Education Refinance Loans |
|
$ |
8,796 |
|
|
$ |
9,521 |
|
|
Ending balance of Private Education Refinance Loans |
|
$ |
8,619 |
|
|
$ |
9,274 |
|
|
Private Education Refinance Loan originations |
|
$ |
228 |
|
|
$ |
135 |
|
Net Interest Margin
The following table details the net interest margin.
|
|
|
Three Months Ended March 31, |
|
|||||
|
|
|
2024 |
|
|
2023 |
|
||
|
Private Education Loan yield |
|
|
7.58 |
% |
|
|
7.24 |
% |
|
Private Education Loan cost of funds |
|
|
(4.48 |
) |
|
|
(3.96 |
) |
|
Private Education Loan spread |
|
|
3.10 |
|
|
|
3.28 |
|
|
Other interest-earning asset spread impact |
|
|
(.11 |
) |
|
|
(.16 |
) |
|
Net interest margin (1) |
|
|
2.99 |
% |
|
|
3.12 |
% |
|
|
|
|||||||
|
|
|
Three Months Ended March 31, |
|
|||||
|
(Dollars in millions) |
|
2024 |
|
|
2023 |
|
||
|
Private Education Loans |
|
$ |
17,385 |
|
|
$ |
19,289 |
|
|
Other interest-earning assets |
|
|
543 |
|
|
|
625 |
|
|
Total Private Education Loan interest-earning assets |
|
$ |
17,928 |
|
|
$ |
19,914 |
|
As of March 31, 2024, our Private Education Loan portfolio totaled $16.6 billion, comprised of $8.6 billion of refinance loans and $8.0 billion of non-refinance loans. The weighted-average life of these portfolios as of March 31, 2024 was 5 years and 5 years, respectively, assuming a CPR of 10% and 10%, respectively.
Provision for Loan Losses
The provision for Private Education Loan losses increased $35 million. The provision for loan losses of $11 million in the current period included $5 million in connection with loan originations and $6 million related to a general reserve build. The provision of $(24) million in the year-ago quarter included $(52) million in connection with the adoption of a new accounting standard (ASU No. 2022-02), $5 million in connection with loan originations and $23 million in connection with the resolution of certain private legacy loans in bankruptcy.
Operating Expenses
Operating expenses for our consumer lending segment include costs to originate, acquire, service and collect on our consumer loan portfolio. Operating expenses decreased $5 million primarily due to lower in-school loan marketing spend.
15
Business Processing Segment
The following table presents Core Earnings results for our Business Processing segment.
|
|
|
Three Months Ended March 31, |
|
|
% Increase
|
|
||||||
|
(Dollars in millions) |
|
2024 |
|
|
2023 |
|
|
2024 vs. 2023 |
|
|||
|
Business processing revenue |
|
$ |
77 |
|
|
$ |
72 |
|
|
|
7 |
% |
|
Direct operating expenses |
|
|
69 |
|
|
|
67 |
|
|
|
3 |
|
|
Income before income tax expense |
|
|
8 |
|
|
|
5 |
|
|
|
60 |
|
|
Income tax expense |
|
|
2 |
|
|
|
1 |
|
|
|
100 |
|
|
Net income |
|
$ |
6 |
|
|
$ |
4 |
|
|
|
50 |
% |
Comparison of First-Quarter 2024 Results with First-Quarter 2023
Key performance metrics are as follows:
|
|
|
Three Months Ended March 31, |
|
|||||
|
(Dollars in millions) |
|
2024 |
|
|
2023 |
|
||
|
Revenue from government services |
|
$ |
48 |
|
|
$ |
40 |
|
|
Revenue from healthcare services |
|
|
29 |
|
|
|
32 |
|
|
Total fee revenue |
|
$ |
77 |
|
|
$ |
72 |
|
|
EBITDA (1) |
|
$ |
9 |
|
|
$ |
5 |
|
|
EBITDA margin (1) |
|
|
11 |
% |
|
|
7 |
% |
16
Other Segment
The following table presents Core Earnings results for our Other segment.
|
|
|
Three Months Ended March 31, |
|
|
% Increase
|
|
||||||
|
(Dollars in millions) |
|
2024 |
|
|
2023 |
|
|
2024 vs. 2023 |
|
|||
|
Net interest loss after provision for loan losses |
|
$ |
(24 |
) |
|
$ |
(25 |
) |
|
|
(4 |
)% |
|
Other revenue |
|
|
5 |
|
|
|
2 |
|
|
|
150 |
|
|
Expenses: |
|
|
|
|
|
|
|
|
|
|||
|
Unallocated shared services operating expenses: |
|
|
|
|
|
|
|
|
|
|||
|
Unallocated information technology costs |
|
|
22 |
|
|
|
19 |
|
|
|
16 |
|
|
Unallocated corporate costs |
|
|
43 |
|
|
|
42 |
|
|
|
2 |
|
|
Total unallocated shared services operating expenses |
|
|
65 |
|
|
|
61 |
|
|
|
7 |
|
|
Restructuring/other reorganization expenses |
|
|
1 |
|
|
|
4 |
|
|
|
(75 |
) |
|
Total expenses |
|
|
66 |
|
|
|
65 |
|
|
|
2 |
|
|
Loss before income tax benefit |
|
|
(85 |
) |
|
|
(88 |
) |
|
|
(3 |
) |
|
Income tax benefit |
|
|
(20 |
) |
|
|
(20 |
) |
|
|
— |
|
|
Net income (loss) |
|
$ |
(65 |
) |
|
$ |
(68 |
) |
|
|
(4 |
)% |
Net Interest Loss after Provision for Loan Losses
Net interest loss after provision for loan losses is due to the negative carrying cost of our corporate liquidity portfolio. The amount of the net interest loss is primarily a result of the size of the liquidity portfolio as well as the cost of funds of the debt funding the corporate liquidity portfolio.
Unallocated Shared Services Operating Expenses
Unallocated shared services operating expenses are costs primarily related to information technology costs related to infrastructure and operations, stock-based compensation expense, accounting, finance, legal, compliance and risk management, regulatory-related expenses, human resources, certain executive management and the Board of Directors. Regulatory-related expenses include actual settlement amounts as well as third-party professional fees we incur in connection with such regulatory matters and are presented net of any insurance reimbursements for covered costs related to such matters. Expenses increased $1 million from the year-ago quarter primarily as a result of an $11 million increase in regulatory-related expenses. Regulatory-related expenses were $13 million and $2 million in first-quarter 2024 and first-quarter 2023, respectively, with first quarter 2024 including a $12 million contingency loss accrual related to recent developments in connection to CFPB matters. The remaining $10 million decrease in expenses was primarily the result of ongoing initiatives to reduce costs and improve operating efficiency.
See “Note 9 – Commitments and Contingencies” for a discussion of legal and regulatory matters where it is reasonably possible that a loss contingency exists. The Company is unable to anticipate the timing of a resolution or the impact that certain matters may have on the Company’s consolidated financial position, liquidity, results of operation or cash flows. As a result, it is not possible at this time to estimate a range of potential exposure, if any, for amounts that may be payable in connection with certain matters and reserves have not been established. It is possible that an adverse ruling or rulings may have a material adverse impact on the Company.
Restructuring/Other Reorganization Expenses
These expenses declined $3 million and primarily related to severance and facility exit costs.
17
F inancial Condition
This section provides information regarding the balances, activity and credit performance metrics of our education loan portfolio.
Summary of Our Education Loan Portfolio
Ending Education Loan Balances, net
|
|
|
March 31, 2024 |
|
|||||||||||||||||
|
(Dollars in millions) |
|
FFELP
|
|
|
FFELP
|
|
|
Total
|
|
|
Private
|
|
|
Total
|
|
|||||
|
Total education loan portfolio: |
|
|
|
|
|
|
|
|
|
|
|
|
|
|
|
|||||
|
In-school (1) |
|
$ |
13 |
|
|
$ |
— |
|
|
$ |
13 |
|
|
$ |
91 |
|
|
$ |
104 |
|
|
Grace, repayment and other (2) |
|
|
12,816 |
|
|
|
23,256 |
|
|
|
36,072 |
|
|
|
17,055 |
|
|
|
53,127 |
|
|
Total |
|
|
12,829 |
|
|
|
23,256 |
|
|
|
36,085 |
|
|
|
17,146 |
|
|
|
53,231 |
|
|
Allowance for loan losses |
|
|
(152 |
) |
|
|
(54 |
) |
|
|
(206 |
) |
|
|
(538 |
) |
|
|
(744 |
) |
|
Total education loan portfolio |
|
$ |
12,677 |
|
|
$ |
23,202 |
|
|
$ |
35,879 |
|
|
$ |
16,608 |
|
|
$ |
52,487 |
|
|
% of total FFELP |
|
|
35 |
% |
|
|
65 |
% |
|
|
100 |
% |
|
|
|
|
|
|
||
|
% of total |
|
|
24 |
% |
|
|
44 |
% |
|
|
68 |
% |
|
|
32 |
% |
|
|
100 |
% |
|
|
|
December 31, 2023 |
|
|||||||||||||||||
|
(Dollars in millions) |
|
FFELP
|
|
|
FFELP
|
|
|
Total
|
|
|
Private
|
|
|
Total
|
|
|||||
|
Total education loan portfolio: |
|
|
|
|
|
|
|
|
|
|
|
|
|
|
|
|||||
|
In-school (1) |
|
$ |
12 |
|
|
$ |
— |
|
|
$ |
12 |
|
|
$ |
70 |
|
|
$ |
82 |
|
|
Grace, repayment and other (2) |
|
|
13,708 |
|
|
|
24,420 |
|
|
|
38,128 |
|
|
|
17,449 |
|
|
|
55,577 |
|
|
Total |
|
|
13,720 |
|
|
|
24,420 |
|
|
|
38,140 |
|
|
|
17,519 |
|
|
|
55,659 |
|
|
Allowance for loan losses |
|
|
(156 |
) |
|
|
(59 |
) |
|
|
(215 |
) |
|
|
(617 |
) |
|
|
(832 |
) |
|
Total education loan portfolio |
|
$ |
13,564 |
|
|
$ |
24,361 |
|
|
$ |
37,925 |
|
|
$ |
16,902 |
|
|
$ |
54,827 |
|
|
% of total FFELP |
|
|
36 |
% |
|
|
64 |
% |
|
|
100 |
% |
|
|
|
|
|
|
||
|
% of total |
|
|
25 |
% |
|
|
44 |
% |
|
|
69 |
% |
|
|
31 |
% |
|
|
100 |
% |
|
|
|
March 31, 2023 |
|
|||||||||||||||||
|
(Dollars in millions) |
|
FFELP
|
|
|
FFELP
|
|
|
Total
|
|
|
Private
|
|
|
Total
|
|
|||||
|
Total education loan portfolio: |
|
|
|
|
|
|
|
|
|
|
|
|
|
|
|
|||||
|
In-school (1) |
|
$ |
15 |
|
|
$ |
— |
|
|
$ |
15 |
|
|
$ |
73 |
|
|
$ |
88 |
|
|
Grace, repayment and other (2) |
|
|
15,339 |
|
|
|
27,008 |
|
|
|
42,347 |
|
|
|
18,908 |
|
|
|
61,255 |
|
|
Total |
|
|
15,354 |
|
|
|
27,008 |
|
|
|
42,362 |
|
|
|
18,981 |
|
|
|
61,343 |
|
|
Allowance for loan losses |
|
|
(155 |
) |
|
|
(59 |
) |
|
|
(214 |
) |
|
|
(706 |
) |
|
|
(920 |
) |
|
Total education loan portfolio |
|
$ |
15,199 |
|
|
$ |
26,949 |
|
|
$ |
42,148 |
|
|
$ |
18,275 |
|
|
$ |
60,423 |
|
|
% of total FFELP |
|
|
36 |
% |
|
|
64 |
% |
|
|
100 |
% |
|
|
|
|
|
|
||
|
% of total |
|
|
25 |
% |
|
|
45 |
% |
|
|
70 |
% |
|
|
30 |
% |
|
|
100 |
% |
18
Education Loan Activity
|
|
|
Three Months Ended March 31, 2024 |
|
|||||||||||||||||
|
(Dollars in millions) |
|
FFELP
|
|
|
FFELP
|
|
|
Total
|
|
|
Private
|
|
|
Total
|
|
|||||
|
Beginning balance |
|
$ |
13,564 |
|
|
$ |
24,361 |
|
|
$ |
37,925 |
|
|
$ |
16,902 |
|
|
$ |
54,827 |
|
|
Acquisitions (originations and purchases) (1) |
|
|
— |
|
|
|
— |
|
|
|
— |
|
|
|
363 |
|
|
|
363 |
|
|
Capitalized interest and premium/discount
|
|
|
134 |
|
|
|
140 |
|
|
|
274 |
|
|
|
60 |
|
|
|
334 |
|
|
Refinancings and consolidations to third
|
|
|
(482 |
) |
|
|
(788 |
) |
|
|
(1,270 |
) |
|
|
(51 |
) |
|
|
(1,321 |
) |
|
Repayments and other |
|
|
(539 |
) |
|
|
(511 |
) |
|
|
(1,050 |
) |
|
|
(666 |
) |
|
|
(1,716 |
) |
|
Ending balance |
|
$ |
12,677 |
|
|
$ |
23,202 |
|
|
$ |
35,879 |
|
|
$ |
16,608 |
|
|
$ |
52,487 |
|
|
|
|
Three Months Ended March 31, 2023 |
|
|||||||||||||||||
|
(Dollars in millions) |
|
FFELP
|
|
|
FFELP
|
|
|
Total
|
|
|
Private
|
|
|
Total
|
|
|||||
|
Beginning balance |
|
$ |
15,691 |
|
|
$ |
27,834 |
|
|
$ |
43,525 |
|
|
$ |
18,725 |
|
|
$ |
62,250 |
|
|
Acquisitions (originations and purchases) (1) |
|
|
— |
|
|
|
— |
|
|
|
— |
|
|
|
274 |
|
|
|
274 |
|
|
Capitalized interest and premium/discount
|
|
|
146 |
|
|
|
163 |
|
|
|
309 |
|
|
|
49 |
|
|
|
358 |
|
|
Refinancings and consolidations to third
|
|
|
(252 |
) |
|
|
(435 |
) |
|
|
(687 |
) |
|
|
(72 |
) |
|
|
(759 |
) |
|
Repayments and other |
|
|
(386 |
) |
|
|
(613 |
) |
|
|
(999 |
) |
|
|
(701 |
) |
|
|
(1,700 |
) |
|
Ending balance |
|
$ |
15,199 |
|
|
$ |
26,949 |
|
|
$ |
42,148 |
|
|
$ |
18,275 |
|
|
$ |
60,423 |
|
19
FFELP Loan Portfolio Performance
|
|
|
March 31, 2024 |
|
|
December 31, 2023 |
|
|
March 31, 2023 |
|
|||||||||||||||
|
(Dollars in millions) |
|
Balance |
|
|
% |
|
|
Balance |
|
|
% |
|
|
Balance |
|
|
% |
|
||||||
|
Loans in-school/grace/deferment (1) |
|
$ |
1,562 |
|
|
|
|
|
$ |
1,557 |
|
|
|
|
|
$ |
1,778 |
|
|
|
|
|||
|
Loans in forbearance (2) |
|
|
5,538 |
|
|
|
|
|
|
6,147 |
|
|
|
|
|
|
6,844 |
|
|
|
|
|||
|
Loans in repayment and percentage of each status: |
|
|
|
|
|
|
|
|
|
|
|
|
|
|
|
|
|
|
||||||
|
Loans current |
|
|
25,162 |
|
|
|
86.8 |
% |
|
|
26,204 |
|
|
|
86.1 |
% |
|
|
28,886 |
|
|
|
85.6 |
% |
|
Loans delinquent 31-60 days (3) |
|
|
1,163 |
|
|
|
4.0 |
|
|
|
1,193 |
|
|
|
3.9 |
|
|
|
1,270 |
|
|
|
3.8 |
|
|
Loans delinquent 61-90 days (3) |
|
|
747 |
|
|
|
2.6 |
|
|
|
746 |
|
|
|
2.5 |
|
|
|
902 |
|
|
|
2.7 |
|
|
Loans delinquent greater than 90 days (3) |
|
|
1,913 |
|
|
|
6.6 |
|
|
|
2,293 |
|
|
|
7.5 |
|
|
|
2,682 |
|
|
|
7.9 |
|
|
Total FFELP Loans in repayment |
|
|
28,985 |
|
|
|
100 |
% |
|
|
30,436 |
|
|
|
100 |
% |
|
|
33,740 |
|
|
|
100 |
% |
|
Total FFELP Loans |
|
|
36,085 |
|
|
|
|
|
|
38,140 |
|
|
|
|
|
|
42,362 |
|
|
|
|
|||
|
FFELP Loan allowance for losses |
|
|
(206 |
) |
|
|
|
|
|
(215 |
) |
|
|
|
|
|
(214 |
) |
|
|
|
|||
|
FFELP Loans, net |
|
$ |
35,879 |
|
|
|
|
|
$ |
37,925 |
|
|
|
|
|
$ |
42,148 |
|
|
|
|
|||
|
Percentage of FFELP Loans in repayment |
|
|
|
|
|
80.3 |
% |
|
|
|
|
|
79.8 |
% |
|
|
|
|
|
79.6 |
% |
|||
|
Delinquencies as a percentage of FFELP Loans in
|
|
|
|
|
|
13.2 |
% |
|
|
|
|
|
13.9 |
% |
|
|
|
|
|
14.4 |
% |
|||
|
FFELP Loans in forbearance as a percentage of
|
|
|
|
|
|
16.0 |
% |
|
|
|
|
|
16.8 |
% |
|
|
|
|
|
16.9 |
% |
|||
Private Education Loan Portfolio Performance
|
|
|
March 31, 2024 |
|
|
December 31, 2023 |
|
|
March 31, 2023 |
|
|||||||||||||||
|
(Dollars in millions) |
|
Balance |
|
|
% |
|
|
Balance |
|
|
% |
|
|
Balance |
|
|
% |
|
||||||
|
Loans in-school/grace/deferment (1) |
|
$ |
369 |
|
|
|
|
|
$ |
360 |
|
|
|
|
|
$ |
369 |
|
|
|
|
|||
|
Loans in forbearance (2) |
|
|
297 |
|
|
|
|
|
|
363 |
|
|
|
|
|
|
354 |
|
|
|
|
|||
|
Loans in repayment and percentage of each status: |
|
|
|
|
|
|
|
|
|
|
|
|
|
|
|
|
|
|
||||||
|
Loans current |
|
|
15,661 |
|
|
|
95.0 |
% |
|
|
15,935 |
|
|
|
94.9 |
% |
|
|
17,439 |
|
|
|
95.5 |
% |
|
Loans delinquent 31-60 days (3) |
|
|
303 |
|
|
|
1.9 |
|
|
|
308 |
|
|
|
1.8 |
|
|
|
290 |
|
|
|
1.6 |
|
|
Loans delinquent 61-90 days (3) |
|
|
165 |
|
|
|
1.0 |
|
|
|
173 |
|
|
|
1.0 |
|
|
|
165 |
|
|
|
.9 |
|
|
Loans delinquent greater than 90 days (3) |
|
|
351 |
|
|
|
2.1 |
|
|
|
380 |
|
|
|
2.3 |
|
|
|
364 |
|
|
|
2.0 |
|
|
Total Private Education Loans in repayment |
|
|
16,480 |
|
|
|
100 |
% |
|
|
16,796 |
|
|
|
100 |
% |
|
|
18,258 |
|
|
|
100 |
% |
|
Total Private Education Loans |
|
|
17,146 |
|
|
|
|
|
|
17,519 |
|
|
|
|
|
|
18,981 |
|
|
|
|
|||
|
Private Education Loan allowance for losses |
|
|
(538 |
) |
|
|
|
|
|
(617 |
) |
|
|
|
|
|
(706 |
) |
|
|
|
|||
|
Private Education Loans, net |
|
$ |
16,608 |
|
|
|
|
|
$ |
16,902 |
|
|
|
|
|
$ |
18,275 |
|
|
|
|
|||
|
Percentage of Private Education Loans in
|
|
|
|
|
|
96.1 |
% |
|
|
|
|
|
95.9 |
% |
|
|
|
|
|
96.2 |
% |
|||
|
Delinquencies as a percentage of Private Education
|
|
|
|
|
|
5.0 |
% |
|
|
|
|
|
5.1 |
% |
|
|
|
|
|
4.5 |
% |
|||
|
Loans in forbearance as a percentage of loans in
|
|
|
|
|
|
1.8 |
% |
|
|
|
|
|
2.1 |
% |
|
|
|
|
|
1.9 |
% |
|||
|
Percentage of Private Education Loans with a
|
|
|
|
|
|
33 |
% |
|
|
|
|
|
33 |
% |
|
|
|
|
|
33 |
% |
|||
|
|
|
|
|
|
|
|
|
|
|
|
|
|
|
|
|
|
|
|
||||||
20
Allowance for Loan Losses
|
|
|
Three Months Ended March 31, |
|
|||||||||||||||||||||
|
|
|
2024 |
|
|
2023 |
|
||||||||||||||||||
|
(Dollars in millions) |
|
FFELP Loans |
|
|
Private Education Loans |
|
|
Total |
|
|
FFELP Loans |
|
|
Private Education Loans |
|
|
Total |
|
||||||
|
Beginning balance |
|
$ |
215 |
|
|
$ |
617 |
|
|
$ |
832 |
|
|
$ |
222 |
|
|
$ |
800 |
|
|
$ |
1,022 |
|
|
Total provision |
|
|
1 |
|
|
|
11 |
|
|
|
12 |
|
|
|
10 |
|
|
|
(24 |
) |
|
|
(14 |
) |
|
Charge-offs: |
|
|
|
|
|
|
|
|
|
|
|
|
|
|
|
|
|
|
||||||
|
Gross charge-offs |
|
|
(10 |
) |
|
|
(110 |
) |
|
|
(120 |
) |
|
|
(18 |
) |
|
|
(88 |
) |
|
|
(106 |
) |
|
Expected future recoveries on current period gross
|
|
|
— |
|
|
|
11 |
|
|
|
11 |
|
|
|
— |
|
|
|
13 |
|
|
|
13 |
|
|
Net charge-offs (1)(2) |
|
|
(10 |
) |
|
|
(99 |
) |
|
|
(109 |
) |
|
|
(18 |
) |
|
|
(75 |
) |
|
|
(93 |
) |
|
Decrease in expected future recoveries on previously
|
|
|
— |
|
|
|
9 |
|
|
|
9 |
|
|
|
— |
|
|
|
5 |
|
|
|
5 |
|
|
Allowance at end of period (GAAP) |
|
|
206 |
|
|
|
538 |
|
|
|
744 |
|
|
|
214 |
|
|
|
706 |
|
|
|
920 |
|
|
Plus: expected future recoveries on previously fully
|
|
|
— |
|
|
|
217 |
|
|
|
217 |
|
|
|
— |
|
|
|
268 |
|
|
|
268 |
|
|
Allowance at end of period excluding expected future
|
|
$ |
206 |
|
|
$ |
755 |
|
|
$ |
961 |
|
|
$ |
214 |
|
|
$ |
974 |
|
|
$ |
1,188 |
|
|
Net charge-offs as a percentage of average loans in
|
|
|
.13 |
% |
|
|
2.40 |
% |
|
|
|
|
|
.22 |
% |
|
|
1.63 |
% |
|
|
|
||
|
Allowance coverage of charge-offs (annualized) (4) |
|
|
5.3 |
|
|
|
1.8 |
|
|
(Non-GAAP) |
|
|
|
2.9 |
|
|
|
3.2 |
|
|
(Non-GAAP) |
|
||
|
Allowance as a percentage of the ending total loan
|
|
|
.6 |
% |
|
|
4.4 |
% |
|
(Non-GAAP) |
|
|
|
.5 |
% |
|
|
5.1 |
% |
|
(Non-GAAP) |
|
||
|
Allowance as a percentage of ending loans in
|
|
|
.7 |
% |
|
|
4.6 |
% |
|
(Non-GAAP) |
|
|
|
.6 |
% |
|
|
5.4 |
% |
|
(Non-GAAP) |
|
||
|
Ending total loans |
|
$ |
36,085 |
|
|
$ |
17,146 |
|
|
|
|
|
$ |
42,362 |
|
|
$ |
18,981 |
|
|
|
|
||
|
Average loans in repayment |
|
$ |
29,736 |
|
|
$ |
16,671 |
|
|
|
|
|
$ |
34,305 |
|
|
$ |
18,552 |
|
|
|
|
||
|
Ending loans in repayment |
|
$ |
28,985 |
|
|
$ |
16,480 |
|
|
|
|
|
$ |
33,740 |
|
|
$ |
18,258 |
|
|
|
|
||
|
|
|
Three Months Ended March 31, |
|
|||||
|
(Dollars in millions) |
|
2024 |
|
|
2023 |
|
||
|
Beginning of period expected future recoveries on
|
|
$ |
226 |
|
|
$ |
274 |
|
|
Expected future recoveries of current period defaults |
|
|
11 |
|
|
|
13 |
|
|
Recoveries (cash collected) |
|
|
(11 |
) |
|
|
(13 |
) |
|
Charge-offs (as a result of lower recovery expectations) |
|
|
(9 |
) |
|
|
(6 |
) |
|
End of period expected future recoveries on previously
|
|
$ |
217 |
|
|
$ |
268 |
|
|
Change in balance during period |
|
$ |
(9 |
) |
|
$ |
(5 |
) |
21
L iquidity and Capital Resources
Funding and Liquidity Risk Management
The following “Liquidity and Capital Resources” discussion concentrates primarily on our Federal Education Loans and Consumer Lending segments. Our Business Processing segment requires minimal liquidity and funding.
We define liquidity as cash and high-quality liquid assets that we can use to meet our cash requirements. Our two primary liquidity needs are: (1) servicing our debt and (2) our ongoing ability to meet our cash needs for running the operations of our businesses (including derivative collateral requirements) throughout market cycles, including during periods of financial stress. Secondary liquidity needs, which can be adjusted as needed, include the origination of Private Education Loans, acquisitions of Private Education Loan and FFELP Loan portfolios, acquisitions of companies, the payment of common stock dividends and the repurchase of our common stock. To achieve these objectives, we analyze and monitor our liquidity needs and maintain excess liquidity and access to diverse funding sources including the issuance of unsecured debt and the issuance of secured debt primarily through asset-backed securitizations and/or other financing facilities.
We define our liquidity risk as the potential inability to meet our obligations when they become due without incurring unacceptable losses or to invest in future asset growth and business operations at reasonable market rates. Our primary liquidity risk relates to our ability to service our debt, meet our other business obligations and to continue to grow our business. The ability to access the capital markets is impacted by general market and economic conditions, our credit ratings, as well as the overall availability of funding sources in the marketplace. In addition, credit ratings may be important to customers or counterparties when we compete in certain markets and when we seek to engage in certain transactions, including over-the-counter derivatives.
Credit ratings and outlooks are opinions subject to ongoing review by the rating agencies and may change, from time to time, based on our financial performance, industry and market dynamics and other factors. Other factors that influence our credit ratings include the rating agencies’ assessment of the general operating environment, our relative positions in the markets in which we compete, reputation, liquidity position, the level and volatility of earnings, corporate governance and risk management policies, capital position and capital management practices. A negative change in our credit rating could have a negative effect on our liquidity because it might raise the cost and availability of funding and potentially require additional cash collateral or restrict cash currently held as collateral on existing borrowings or derivative collateral arrangements. It is our objective to improve our credit ratings so that we can continue to efficiently access the capital markets even in difficult economic and market conditions. We have unsecured debt totaling $5.9 billion at March 31, 2024. Three credit rating agencies currently rate our long-term unsecured debt at below investment grade.
We expect to fund our ongoing liquidity needs, including the repayment of $0.6 billion of senior unsecured notes that mature in the short term (i.e., over the next 12 months) and the remaining $5.3 billion of senior unsecured notes that mature in the long term (from 2025 to 2043 with 60% maturing by 2029), through a number of sources. These sources include our cash on hand, unencumbered FFELP Loan and Private Education Refinance Loan portfolios (see “Sources of Primary Liquidity” below), the predictable operating cash flows provided by operating activities, the repayment of principal on unencumbered education loan assets, and the distribution of overcollateralization from our securitization trusts. We may also, depending on market conditions and availability, draw down on our secured FFELP Loan and Private Education Loan asset-backed commercial paper (ABCP) facilities, issue term ABS, enter into additional Private Education Loan and FFELP Loan ABS repurchase facilities, or issue additional unsecured debt.
We originate Private Education Loans (a portion of which is obtained through a forward purchase agreement). We also have purchased and may purchase, in future periods, Private Education Loan and FFELP Loan portfolios from third parties. Loan originations and purchases are part of our ongoing liquidity needs. We purchased 2.6 million shares of common stock for $43 million in the first quarter of 2024 and have $247 million of unused share repurchase authority as of March 31, 2024.
22
Sources of Primary Liquidity
|
|
|
|
|
|
|
|
|
|
|
|||
|
(Dollars in millions) |
|
March 31, 2024 |
|
|
December 31, 2023 |
|
|
March 31, 2023 |
|
|||
|
Ending Balances: |
|
|
|
|
|
|
|
|
|
|||
|
Total unrestricted cash and liquid investments |
|
$ |
823 |
|
|
$ |
839 |
|
|
$ |
570 |
|
|
Unencumbered FFELP Loans |
|
|
133 |
|
|
|
92 |
|
|
|
62 |
|
|
Unencumbered Private Education Refinance
|
|
|
88 |
|
|
|
236 |
|
|
|
37 |
|
|
Total |
|
$ |
1,044 |
|
|
$ |
1,167 |
|
|
$ |
669 |
|
|
|
|
Three Months Ended |
|
|||||||||
|
(Dollars in millions) |
|
March 31, 2024 |
|
|
December 31, 2023 |
|
|
March 31, 2023 |
|
|||
|
Average Balances: |
|
|
|
|
|
|
|
|
|
|||
|
Total unrestricted cash and liquid
|
|
$ |
767 |
|
|
$ |
1,167 |
|
|
$ |
825 |
|
|
Unencumbered FFELP Loans |
|
|
115 |
|
|
|
92 |
|
|
|
85 |
|
|
Unencumbered Private Education
|
|
|
218 |
|
|
|
137 |
|
|
|
66 |
|
|
Total |
|
$ |
1,100 |
|
|
$ |
1,396 |
|
|
$ |
976 |
|
Sources of Additional Liquidity
Liquidity may also be available under our secured credit facilities. Maximum borrowing capacity under the FFELP Loan and Private Education Loan ABCP facilities will vary and be subject to each agreement’s borrowing conditions, including, among others, facility size, current usage and availability of qualifying collateral from unencumbered loans. The following tables detail the additional borrowing capacity of these facilities with maturity dates ranging from June 2024 to April 2026.
|
(Dollars in millions) |
|
March 31, 2024 |
|
|
December 31, 2023 |
|
|
March 31, 2023 |
|
|||
|
Ending Balances: |
|
|
|
|
|
|
|
|
|
|||
|
FFELP Loan ABCP facilities |
|
$ |
409 |
|
|
$ |
408 |
|
|
$ |
57 |
|
|
Private Education Loan ABCP facilities |
|
|
1,340 |
|
|
|
1,719 |
|
|
|
1,028 |
|
|
Total |
|
$ |
1,749 |
|
|
$ |
2,127 |
|
|
$ |
1,085 |
|
|
|
|
Three Months Ended |
|
|||||||||
|
(Dollars in millions) |
|
March 31, 2024 |
|
|
December 31, 2023 |
|
|
March 31, 2023 |
|
|||
|
Average Balances: |
|
|
|
|
|
|
|
|
|
|||
|
FFELP Loan ABCP facilities |
|
$ |
408 |
|
|
$ |
203 |
|
|
$ |
107 |
|
|
Private Education Loan ABCP facilities |
|
|
1,563 |
|
|
|
1,693 |
|
|
|
1,141 |
|
|
Total |
|
$ |
1,971 |
|
|
$ |
1,896 |
|
|
$ |
1,248 |
|
At March 31, 2024, we had a total of $2.8 billion of unencumbered tangible assets inclusive of those listed in the table above as sources of primary liquidity. Total unencumbered education loans comprised $1.1 billion principal of our unencumbered tangible assets of which $957 million and $133 million related to Private Education Loans and FFELP Loans, respectively. In addition, as of March 31, 2024, we had $5.5 billion of encumbered net assets (i.e., overcollateralization) in our various financing facilities (consolidated variable interest entities). We enter into repurchase facilities at times to borrow against the encumbered net assets of these financing vehicles. As of March 31, 2024, $0.6 billion of repurchase facility borrowings were outstanding.
The following table reconciles encumbered and unencumbered assets and their net impact on total Tangible Equity.
|
(Dollars in billions) |
|
March 31, 2024 |
|
|
December 31, 2023 |
|
||
|
Net assets of consolidated variable interest
|
|
$ |
3.3 |
|
|
|
3.4 |
|
|
Net assets of consolidated variable interest entities
|
|
|
2.2 |
|
|
|
2.1 |
|
|
Tangible unencumbered assets (1) |
|
|
2.8 |
|
|
|
3.0 |
|
|
Senior unsecured debt |
|
|
(5.9 |
) |
|
|
(5.9 |
) |
|
Mark-to-market on unsecured hedged debt (2) |
|
|
.2 |
|
|
|
.2 |
|
|
Other liabilities, net |
|
|
(.5 |
) |
|
|
(.7 |
) |
|
Total Tangible Equity (3) |
|
$ |
2.1 |
|
|
$ |
2.1 |
|
23
Borrowings
Ending Balances
|
|
|
March 31, 2024 |
|
|
December 31, 2023 |
|
||||||||||||||||||
|
(Dollars in millions) |
|
Short
|
|
|
Long
|
|
|
Total |
|
|
Short
|
|
|
Long
|
|
|
Total |
|
||||||
|
Unsecured borrowings: |
|
|
|
|
|
|
|
|
|
|
|
|
|
|
|
|
|
|
||||||
|
Senior unsecured debt |
|
$ |
556 |
|
|
$ |
5,303 |
|
|
$ |
5,859 |
|
|
$ |
506 |
|
|
$ |
5,351 |
|
|
$ |
5,857 |
|
|
Total unsecured borrowings |
|
|
556 |
|
|
|
5,303 |
|
|
|
5,859 |
|
|
|
506 |
|
|
|
5,351 |
|
|
|
5,857 |
|
|
Secured borrowings: |
|
|
|
|
|
|
|
|
|
|
|
|
|
|
|
|
|
|
||||||
|
FFELP Loan securitizations |
|
|
55 |
|
|
|
33,787 |
|
|
|
33,842 |
|
|
|
59 |
|
|
|
35,626 |
|
|
|
35,685 |
|
|
Private Education Loan securitizations |
|
|
383 |
|
|
|
11,214 |
|
|
|
11,597 |
|
|
|
435 |
|
|
|
11,754 |
|
|
|
12,189 |
|
|
FFELP Loan ABCP facilities |
|
|
1,719 |
|
|
|
89 |
|
|
|
1,808 |
|
|
|
1,854 |
|
|
|
89 |
|
|
|
1,943 |
|
|
Private Education Loan ABCP facilities |
|
|
1,659 |
|
|
|
784 |
|
|
|
2,443 |
|
|
|
1,286 |
|
|
|
821 |
|
|
|
2,107 |
|
|
Other |
|
|
62 |
|
|
|
39 |
|
|
|
101 |
|
|
|
95 |
|
|
|
39 |
|
|
|
134 |
|
|
Total secured borrowings |
|
|
3,878 |
|
|
|
45,913 |
|
|
|
49,791 |
|
|
|
3,729 |
|
|
|
48,329 |
|
|
|
52,058 |
|
|
Core Earnings basis borrowings (1) |
|
|
4,434 |
|
|
|
51,216 |
|
|
|
55,650 |
|
|
|
4,235 |
|
|
|
53,680 |
|
|
|
57,915 |
|
|
Adjustment for GAAP accounting treatment |
|
|
(7 |
) |
|
|
(368 |
) |
|
|
(375 |
) |
|
|
(9 |
) |
|
|
(278 |
) |
|
|
(287 |
) |
|
GAAP basis borrowings |
|
$ |
4,427 |
|
|
$ |
50,848 |
|
|
$ |
55,275 |
|
|
$ |
4,226 |
|
|
$ |
53,402 |
|
|
$ |
57,628 |
|
Average Balances
|
|
|
Three Months Ended March 31, |
|
|||||||||||||
|
|
|
2024 |
|
|
2023 |
|
||||||||||
|
(Dollars in millions) |
|
Average
|
|
|
Average
|
|
|
Average
|
|
|
Average
|
|
||||
|
Unsecured borrowings: |
|
|
|
|
|
|
|
|
|
|
|
|
||||
|
Senior unsecured debt |
|
$ |
5,858 |
|
|
|
9.25 |
% |
|
$ |
6,279 |
|
|
|
8.14 |
% |
|
Total unsecured borrowings |
|
|
5,858 |
|
|
|
9.25 |
|
|
|
6,279 |
|
|
|
8.14 |
|
|
Secured borrowings: |
|
|
|
|
|
|
|
|
|
|
|
|
||||
|
FFELP Loan securitizations |
|
|
34,860 |
|
|
|
6.35 |
|
|
|
41,377 |
|
|
|
5.15 |
|
|
Private Education Loan securitizations |
|
|
11,907 |
|
|
|
3.56 |
|
|
|
13,172 |
|
|
|
3.25 |
|
|
FFELP Loan ABCP facilities |
|
|
1,893 |
|
|
|
6.98 |
|
|
|
1,288 |
|
|
|
5.90 |
|
|
Private Education Loan ABCP facilities |
|
|
2,242 |
|
|
|
7.27 |
|
|
|
2,828 |
|
|
|
6.25 |
|
|
Other |
|
|
111 |
|
|
|
(1.67 |
) |
|
|
108 |
|
|
|
5.03 |
|
|
Total secured borrowings |
|
|
51,013 |
|
|
|
5.75 |
|
|
|
58,773 |
|
|
|
4.79 |
|
|
Core Earnings basis borrowings (1) |
|
|
56,871 |
|
|
|
6.11 |
|
|
|
65,052 |
|
|
|
5.11 |
|
|
Adjustment for GAAP accounting treatment |
|
|
— |
|
|
|
.08 |
|
|
|
— |
|
|
|
.11 |
|
|
GAAP basis borrowings |
|
$ |
56,871 |
|
|
|
6.19 |
% |
|
$ |
65,052 |
|
|
|
5.22 |
% |
24
C ritical Accounting Policies and Estimates
Management’s Discussion and Analysis of Financial Condition and Results of Operations addresses our consolidated financial statements, which have been prepared in accordance with generally accepted accounting principles in the United States of America (GAAP). A discussion of our critical accounting policies, which includes the allowance for loan losses, goodwill impairment assessment, premium and discount amortization, and the impact of the SDR Plan on our accounting policies and estimates, can be found in our 2023 Form 10-K. See "Segment Results —Federal Education Loans Segment — Various Federal Loan Forgiveness Plans" for an update on the SDR Plan.
N on-GAAP Financial Measures
In addition to financial results reported on a GAAP basis, Navient also provides certain performance measures which are non-GAAP financial measures. We present the following non-GAAP financial measures: (1) Core Earnings, (2) Tangible Equity (as well as the Adjusted Tangible Equity Ratio), (3) EBITDA for the Business Processing segment, and (4) Allowance for Loan Losses Excluding Expected Future Recoveries on Previously Fully Charged-off Loans. Definitions for the non-GAAP financial measures and reconciliations are provided below, except that reconciliations of forward-looking non-GAAP financial measures are not provided because the Company is unable to provide such reconciliations without unreasonable effort due to the uncertainty and inherent difficulty of predicting the occurrence and financial impact of certain items, including, but not limited to, the impact of any mark-to-market gains/losses resulting from our use of derivative instruments to hedge our economic risks.
1. Core Earnings
We prepare financial statements and present financial results in accordance with GAAP. However, we also evaluate our business segments and present financial results on a basis that differs from GAAP. We refer to this different basis of presentation as Core Earnings. We provide this Core Earnings basis of presentation on a consolidated basis and for each business segment because this is what we review internally when making management decisions regarding our performance and how we allocate resources. We also refer to this information in our presentations with credit rating agencies, lenders and investors. Because our Core Earnings basis of presentation corresponds to our segment financial presentations, we are required by GAAP to provide certain Core Earnings disclosures in the notes to our consolidated financial statements for our business segments.
Core Earnings are not a substitute for reported results under GAAP. We use Core Earnings to manage our business segments because Core Earnings reflect adjustments to GAAP financial results for two items, discussed below, that can create significant volatility mostly due to timing factors generally beyond the control of management. Accordingly, we believe that Core Earnings provide management with a useful basis from which to better evaluate results from ongoing operations against the business plan or against results from prior periods. Consequently, we disclose this information because we believe it provides investors with additional information regarding the operational and performance indicators that are most closely assessed by management. When compared to GAAP results, the two items we remove to result in our Core Earnings presentations are:
While GAAP provides a uniform, comprehensive basis of accounting, for the reasons described above, our Core Earnings basis of presentation does not. Core Earnings are subject to certain general and specific limitations that investors should carefully consider. For example, there is no comprehensive, authoritative guidance for management reporting. Our Core Earnings are not defined terms within GAAP and may not be comparable to similarly titled measures reported by other companies. Accordingly, our Core Earnings presentation does not represent a comprehensive basis of accounting. Investors, therefore, may not be able to compare our performance with that of other financial services companies based upon Core Earnings. Core Earnings results are only meant to supplement GAAP results by providing additional information regarding the operational and performance indicators that are most closely used by management, our Board of Directors, credit rating agencies, lenders and investors to assess performance.
25
The following tables show our consolidated GAAP results, Core Earnings results (including for each reportable segment) along with the adjustments made to the income/expense items to reconcile the consolidated GAAP results to the Core Earnings results as required by GAAP and reported in “Note 11 — Segment Reporting.”
|
|
|
Three Months Ended March 31, 2024 |
|
|||||||||||||||||||||||||||||||||
|
|
|
|
|
|
Adjustments |
|
|
|
|
|
Reportable Segments |
|
||||||||||||||||||||||||
|
(Dollars in millions) |
|
Total
|
|
|
Reclassi-
|
|
|
Additions/
|
|
|
Total
|
|
|
Total
|
|
|
Federal Education Loans |
|
|
Consumer Lending |
|
|
Business Processing |
|
|
Other |
|
|||||||||
|
Interest income: |
|
|
|
|
|
|
|
|
|
|
|
|
|
|
|
|
|
|
|
|
|
|
|
|
|
|
|
|||||||||
|
Education loans |
|
$ |
989 |
|
|
|
|
|
|
|
|
|
|
|
|
|
|
$ |
661 |
|
|
$ |
328 |
|
|
$ |
— |
|
|
$ |
— |
|
||||
|
Cash and investments |
|
|
38 |
|
|
|
|
|
|
|
|
|
|
|
|
|
|
|
23 |
|
|
|
7 |
|
|
|
— |
|
|
|
8 |
|
||||
|
Total interest income |
|
|
1,027 |
|
|
|
|
|
|
|
|
|
|
|
|
|
|
|
684 |
|
|
|
335 |
|
|
|
— |
|
|
|
8 |
|
||||
|
Total interest expense |
|
|
875 |
|
|
|
|
|
|
|
|
|
|
|
|
|
|
|
631 |
|
|
|
201 |
|
|
|
— |
|
|
|
32 |
|
||||
|
Net interest income
|
|
|
152 |
|
|
$ |
10 |
|
|
$ |
1 |
|
|
$ |
11 |
|
|
$ |
163 |
|
|
|
53 |
|
|
|
134 |
|
|
|
— |
|
|
|
(24 |
) |
|
Less: provisions for loan
|
|
|
12 |
|
|
|
|
|
|
|
|
|
|
|
|
12 |
|
|
|
1 |
|
|
|
11 |
|
|
|
— |
|
|
|
— |
|
|||
|
Net interest income
|
|
|
140 |
|
|
|
|
|
|
|
|
|
|
|
|
|
|
|
52 |
|
|
|
123 |
|
|
|
— |
|
|
|
(24 |
) |
||||
|
Other income (loss): |
|
|
|
|
|
|
|
|
|
|
|
|
|
|
|
|
|
|
|
|
|
|
|
|
|
|
|
|||||||||
|
Servicing revenue |
|
|
17 |
|
|
|
|
|
|
|
|
|
|
|
|
|
|
|
13 |
|
|
|
4 |
|
|
|
— |
|
|
|
— |
|
||||
|
Asset recovery and
|
|
|
77 |
|
|
|
|
|
|
|
|
|
|
|
|
|
|
|
— |
|
|
|
— |
|
|
|
77 |
|
|
|
— |
|
||||
|
Other revenue |
|
|
41 |
|
|
|
|
|
|
|
|
|
|
|
|
|
|
|
4 |
|
|
|
— |
|
|
|
— |
|
|
|
5 |
|
||||
|
Total other income
|
|
|
135 |
|
|
|
(10 |
) |
|
|
(22 |
) |
|
|
(32 |
) |
|
|
103 |
|
|
|
17 |
|
|
|
4 |
|
|
|
77 |
|
|
|
5 |
|
|
Expenses: |
|
|
|
|
|
|
|
|
|
|
|
|
|
|
|
|
|
|
|
|
|
|
|
|
|
|
|
|||||||||
|
Direct operating
|
|
|
118 |
|
|
|
|
|
|
|
|
|
|
|
|
|
|
|
17 |
|
|
|
32 |
|
|
|
69 |
|
|
|
— |
|
||||
|
Unallocated shared
|
|
|
65 |
|
|
|
|
|
|
|
|
|
|
|
|
|
|
|
— |
|
|
|
— |
|
|
|
— |
|
|
|
65 |
|
||||
|
Operating expenses |
|
|
183 |
|
|
|
— |
|
|
|
— |
|
|
|
— |
|
|
|
183 |
|
|
|
17 |
|
|
|
32 |
|
|
|
69 |
|
|
|
65 |
|
|
Goodwill and acquired
|
|
|
3 |
|
|
|
— |
|
|
|
(3 |
) |
|
|
(3 |
) |
|
|
— |
|
|
|
— |
|
|
|
— |
|
|
|
— |
|
|
|
— |
|
|
Restructuring/other
|
|
|
1 |
|
|
|
— |
|
|
|
— |
|
|
|
— |
|
|
|
1 |
|
|
|
— |
|
|
|
— |
|
|
|
— |
|
|
|
1 |
|
|
Total expenses |
|
|
187 |
|
|
|
— |
|
|
|
(3 |
) |
|
|
(3 |
) |
|
|
184 |
|
|
|
17 |
|
|
|
32 |
|
|
|
69 |
|
|
|
66 |
|
|
Income (loss) before
|
|
|
88 |
|
|
|
— |
|
|
|
(18 |
) |
|
|
(18 |
) |
|
|
70 |
|
|
|
52 |
|
|
|
95 |
|
|
|
8 |
|
|
|
(85 |
) |
|
Income tax expense
|
|
|
15 |
|
|
|
— |
|
|
|
1 |
|
|
|
1 |
|
|
|
16 |
|
|
|
12 |
|
|
|
22 |
|
|
|
2 |
|
|
|
(20 |
) |
|
Net income (loss) |
|
$ |
73 |
|
|
$ |
— |
|
|
$ |
(19 |
) |
|
$ |
(19 |
) |
|
$ |
54 |
|
|
$ |
40 |
|
|
$ |
73 |
|
|
$ |
6 |
|
|
$ |
(65 |
) |
|
|
|
Three Months Ended March 31, 2024 |
|
|||||||||
|
(Dollars in millions) |
|
Net Impact of
|
|
|
Net Impact of
|
|
|
Total |
|
|||
|
Net interest income (loss) after provisions for loan losses |
|
$ |
11 |
|
|
$ |
— |
|
|
$ |
11 |
|
|
Total other income (loss) |
|
|
(32 |
) |
|
|
— |
|
|
|
(32 |
) |
|
Goodwill and acquired intangible asset impairment and amortization |
|
|
— |
|
|
|
(3 |
) |
|
|
(3 |
) |
|
Total Core Earnings adjustments to GAAP |
|
$ |
(21 |
) |
|
$ |
3 |
|
|
|
(18 |
) |
|
Income tax expense (benefit) |
|
|
|
|
|
|
|
|
1 |
|
||
|
Net income (loss) |
|
|
|
|
|
|
|
$ |
(19 |
) |
||
26
|
|
|
Three Months Ended March 31, 2023 |
|
|||||||||||||||||||||||||||||||||
|
|
|
|
|
|
Adjustments |
|
|
|
|
|
Reportable Segments |
|
||||||||||||||||||||||||
|
(Dollars in millions) |
|
Total
|
|
|
Reclassi-
|
|
|
Additions/
|
|
|
Total
|
|
|
Total
|
|
|
Federal Education Loans |
|
|
Consumer Lending |
|
|
Business Processing |
|
|
Other |
|
|||||||||
|
Interest income: |
|
|
|
|
|
|
|
|
|
|
|
|
|
|
|
|
|
|
|
|
|
|
|
|
|
|
|
|||||||||
|
Education loans |
|
$ |
1,037 |
|
|
|
|
|
|
|
|
|
|
|
|
|
|
$ |
695 |
|
|
$ |
344 |
|
|
$ |
— |
|
|
$ |
— |
|
||||
|
Cash and investments |
|
|
34 |
|
|
|
|
|
|
|
|
|
|
|
|
|
|
|
20 |
|
|
|
6 |
|
|
|
— |
|
|
|
8 |
|
||||
|
Total interest income |
|
|
1,071 |
|
|
|
|
|
|
|
|
|
|
|
|
|
|
|
715 |
|
|
|
350 |
|
|
|
— |
|
|
|
8 |
|
||||
|
Total interest expense |
|
|
837 |
|
|
|
|
|
|
|
|
|
|
|
|
|
|
|
590 |
|
|
|
197 |
|
|
|
— |
|
|
|
33 |
|
||||
|
Net interest income
|
|
|
234 |
|
|
$ |
12 |
|
|
$ |
7 |
|
|
$ |
19 |
|
|
$ |
253 |
|
|
|
125 |
|
|
|
153 |
|
|
|
— |
|
|
|
(25 |
) |
|
Less: provisions for loan
|
|
|
(14 |
) |
|
|
|
|
|
|
|
|
|
|
|
(14 |
) |
|
|
10 |
|
|
|
(24 |
) |
|
|
— |
|
|
|
— |
|
|||
|
Net interest income
|
|
|
248 |
|
|
|
|
|
|
|
|
|
|
|
|
|
|
|
115 |
|
|
|
177 |
|
|
|
— |
|
|
|
(25 |
) |
||||
|
Other income (loss): |
|
|
|
|
|
|
|
|
|
|
|
|
|
|
|
|
|
|
|
|
|
|
|
|
|
|
|
|||||||||
|
Servicing revenue |
|
|
17 |
|
|
|
|
|
|
|
|
|
|
|
|
|
|
|
14 |
|
|
|
3 |
|
|
|
— |
|
|
|
— |
|
||||
|
Asset recovery and
|
|
|
72 |
|
|
|
|
|
|
|
|
|
|
|
|
|
|
|
— |
|
|
|
— |
|
|
|
72 |
|
|
|
— |
|
||||
|
Other revenue |
|
|
(1 |
) |
|
|
|
|
|
|
|
|
|
|
|
|
|
|
5 |
|
|
|
— |
|
|
|
— |
|
|
|
2 |
|
||||
|
Total other income
|
|
|
88 |
|
|
|
(12 |
) |
|
|
20 |
|
|
|
8 |
|
|
|
96 |
|
|
|
19 |
|
|
|
3 |
|
|
|
72 |
|
|
|
2 |
|
|
Expenses: |
|
|
|
|
|
|
|
|
|
|
|
|
|
|
|
|
|
|
|
|
|
|
|
|
|
|
|
|||||||||
|
Direct operating
|
|
|
124 |
|
|
|
|
|
|
|
|
|
|
|
|
|
|
|
20 |
|
|
|
37 |
|
|
|
67 |
|
|
|
— |
|
||||
|
Unallocated shared
|
|
|
61 |
|
|
|
|
|
|
|
|
|
|
|
|
|
|
|
— |
|
|
|
— |
|
|
|
— |
|
|
|
61 |
|
||||
|
Operating expenses |
|
|
185 |
|
|
|
— |
|
|
|
— |
|
|
|
— |
|
|
|
185 |
|
|
|
20 |
|
|
|
37 |
|
|
|
67 |
|
|
|
61 |
|
|
Goodwill and acquired
|
|
|
3 |
|
|
|
— |
|
|
|
(3 |
) |
|
|
(3 |
) |
|
|
— |
|
|
|
— |
|
|
|
— |
|
|
|
— |
|
|
|
— |
|
|
Restructuring/other
|
|
|
4 |
|
|
|
— |
|
|
|
— |
|
|
|
— |
|
|
|
4 |
|
|
|
— |
|
|
|
— |
|
|
|
— |
|
|
|
4 |
|
|
Total expenses |
|
|
192 |
|
|
|
— |
|
|
|
(3 |
) |
|
|
(3 |
) |
|
|
189 |
|
|
|
20 |
|
|
|
37 |
|
|
|
67 |
|
|
|
65 |
|
|
Income (loss) before
|
|
|
144 |
|
|
|
— |
|
|
|
30 |
|
|
|
30 |
|
|
|
174 |
|
|
|
114 |
|
|
|
143 |
|
|
|
5 |
|
|
|
(88 |
) |
|
Income tax expense
|
|
|
33 |
|
|
|
— |
|
|
|
8 |
|
|
|
8 |
|
|
|
41 |
|
|
|
27 |
|
|
|
33 |
|
|
|
1 |
|
|
|
(20 |
) |
|
Net income (loss) |
|
$ |
111 |
|
|
$ |
— |
|
|
$ |
22 |
|
|
$ |
22 |
|
|
$ |
133 |
|
|
$ |
87 |
|
|
$ |
110 |
|
|
$ |
4 |
|
|
$ |
(68 |
) |
|
|
|
|
|
|
|
|
|
|
|
|
|
|
|
|
|
|
|
|
|
|
|
|
|
|
|
|
|
|||||||||
|
|
|
Three Months Ended March 31, 2023 |
|
|||||||||
|
(Dollars in millions) |
|
Net Impact of
|
|
|
Net Impact of
|
|
|
Total |
|
|||
|
Net interest income (loss) after provisions for loan losses |
|
$ |
19 |
|
|
$ |
— |
|
|
$ |
19 |
|
|
Total other income (loss) |
|
|
8 |
|
|
|
— |
|
|
|
8 |
|
|
Goodwill and acquired intangible asset impairment and amortization |
|
|
— |
|
|
|
(3 |
) |
|
|
(3 |
) |
|
Total Core Earnings adjustments to GAAP |
|
$ |
27 |
|
|
$ |
3 |
|
|
|
30 |
|
|
Income tax expense (benefit) |
|
|
|
|
|
|
|
|
8 |
|
||
|
Net income (loss) |
|
|
|
|
|
|
|
$ |
22 |
|
||
27
The following discussion summarizes the differences between GAAP and Core Earnings net income and details each specific adjustment required to reconcile our GAAP earnings to our Core Earnings segment presentation.
|
|
|
Three Months Ended March 31, |
|
|||||
|
(Dollars in millions) |
|
2024 |
|
|
2023 |
|
||
|
GAAP net income |
|
$ |
73 |
|
|
$ |
111 |
|
|
Core Earnings adjustments to GAAP: |
|
|
|
|
|
|
||
|
Net impact of derivative accounting |
|
|
(21 |
) |
|
|
27 |
|
|
Net impact of goodwill and acquired intangible assets |
|
|
3 |
|
|
|
3 |
|
|
Net income tax effect |
|
|
(1 |
) |
|
|
(8 |
) |
|
Total Core Earnings adjustments to GAAP |
|
|
(19 |
) |
|
|
22 |
|
|
Core Earnings net income |
|
$ |
54 |
|
|
$ |
133 |
|
|
|
|
|
|
|
|
|
||
(1) Derivative Accounting: Core Earnings exclude periodic gains and losses that are caused by the mark-to-market valuations on derivatives that do not qualify for hedge accounting treatment under GAAP, as well as the periodic mark-to-market gains and losses that are a result of ineffectiveness recognized related to effective hedges under GAAP. Under GAAP, for our derivatives that are held to maturity, the mark-to-market gain or loss over the life of the contract will equal $0 except for Floor Income Contracts, where the mark-to-market gain will equal the amount for which we originally sold the contract. In our Core Earnings presentation, we recognize the economic effect of these hedges, which generally results in any net settlement cash paid or received being recognized ratably as an interest expense or revenue over the hedged item’s life.
The accounting for derivatives requires that changes in the fair value of derivative instruments be recognized currently in earnings, with no fair value adjustment of the hedged item, unless specific hedge accounting criteria are met. The gains and losses recorded in “Gains (losses) on derivative and hedging activities, net” and interest expense (for qualifying fair value hedges) are primarily caused by interest rate and foreign currency exchange rate volatility and changing credit spreads during the period as well as the volume and term of derivatives not receiving hedge accounting treatment. We believe that our derivatives are effective economic hedges, and as such, are a critical element of our interest rate and foreign currency risk management strategy. However, some of our derivatives, primarily Floor Income Contracts, basis swaps and at times, certain other interest rate swaps do not qualify for hedge accounting treatment and the stand-alone derivative is adjusted to fair value in the income statement with no consideration for the corresponding change in fair value of the hedged item. See our 2023 Form 10-K for further discussion.
28
The table below quantifies the adjustments for derivative accounting between GAAP and Core Earnings net income.
|
|
|
Three Months Ended March 31, |
|
|||||
|
(Dollars in millions) |
|
2024 |
|
|
2023 |
|
||
|
Core Earnings derivative adjustments: |
|
|
|
|
|
|
||
|
(Gains) losses on derivative and hedging activities, net, included in other income |
|
$ |
(32 |
) |
|
$ |
8 |
|
|
Plus: (Gains) losses on fair value hedging activity included in interest expense |
|
|
— |
|
|
|
6 |
|
|
Total (gains) losses in GAAP net income |
|
|
(32 |
) |
|
|
14 |
|
|
Plus: Reclassification of settlement income (expense) on derivative and hedging
|
|
|
10 |
|
|
|
12 |
|
|
Mark-to-market (gains) losses on derivative and hedging activities, net (2) |
|
|
(22 |
) |
|
|
26 |
|
|
Amortization of net premiums on Floor Income Contracts in net interest income for
|
|
|
— |
|
|
|
2 |
|
|
Other derivative accounting adjustments (3) |
|
|
1 |
|
|
|
(1 |
) |
|
Total net impact of derivative accounting |
|
$ |
(21 |
) |
|
$ |
27 |
|
|
|
|
Three Months Ended March 31, |
|
|||||
|
(Dollars in millions) |
|
2024 |
|
|
2023 |
|
||
|
Reclassification of settlements on derivative and hedging activities: |
|
|
|
|
|
|
||
|
Net settlement expense on Floor Income Contracts reclassified to net
|
|
$ |
— |
|
|
$ |
— |
|
|
Net settlement income (expense) on interest rate swaps reclassified to net
|
|
|
10 |
|
|
|
12 |
|
|
Total reclassifications of settlement income (expense) on derivative and
|
|
$ |
10 |
|
|
$ |
12 |
|
|
|
|
Three Months Ended March 31, |
|
|||||
|
(Dollars in millions) |
|
2024 |
|
|
2023 |
|
||
|
Fair value hedges |
|
$ |
(3 |
) |
|
$ |
4 |
|
|
Foreign currency hedges |
|
|
3 |
|
|
|
2 |
|
|
Floor Income Contracts |
|
|
— |
|
|
|
— |
|
|
Basis swaps |
|
|
— |
|
|
|
2 |
|
|
Other |
|
|
(22 |
) |
|
|
18 |
|
|
Total mark-to-market (gains) losses on derivative and hedging activities, net |
|
$ |
(22 |
) |
|
$ |
26 |
|
29
Cumulative Impact of Derivative Accounting under GAAP compared to Core Earnings
As of March 31, 2024, derivative accounting has increased GAAP equity by approximately $11 million as a result of cumulative net mark-to-market gains (after tax) recognized under GAAP, but not in Core Earnings. The following table rolls forward the cumulative impact to GAAP equity due to these after-tax mark-to-market net gains and losses related to derivative accounting.
|
|
|
Three Months Ended March 31, |
|
|||||
|
(Dollars in millions) |
|
2024 |
|
|
2023 |
|
||
|
Beginning impact of derivative accounting on GAAP equity |
|
$ |
(1 |
) |
|
$ |
122 |
|
|
Net impact of net mark-to-market gains (losses) under derivative accounting (1) |
|
|
12 |
|
|
|
(41 |
) |
|
Ending impact of derivative accounting on GAAP equity |
|
$ |
11 |
|
|
$ |
81 |
|
|
|
|
Three Months Ended March 31, |
|
|||||
|
(Dollars in millions) |
|
2024 |
|
|
2023 |
|
||
|
Total pre-tax net impact of derivative accounting recognized in net income (2) |
|
$ |
21 |
|
|
$ |
(27 |
) |
|
Tax and other impacts of derivative accounting adjustments |
|
|
(5 |
) |
|
|
7 |
|
|
Change in mark-to-market gains (losses) on derivatives, net of tax
|
|
|
(4 |
) |
|
|
(21 |
) |
|
Net impact of net mark-to-market gains (losses) under derivative accounting |
|
$ |
12 |
|
|
$ |
(41 |
) |
Hedging Embedded Floor Income
We use Floor Income Contracts, pay-fixed swaps and fixed rate debt to economically hedge embedded Floor Income in our FFELP Loans. Historically, we have used these instruments on a periodic basis and depending upon market conditions and pricing, we may enter into additional hedges in the future. Under GAAP, the Floor Income Contracts do not qualify for hedge accounting and the pay-fixed swaps are accounted for as cash flow hedges. The table below shows the amount of hedged Floor Income that will be recognized in Core Earnings in future periods based on these hedge strategies.
|
(Dollars in millions) |
|
March 31, 2024 |
|
|
March 31, 2023 |
|
||
|
Total hedged Floor Income, net of tax (1)(2) |
|
$ |
80 |
|
|
$ |
166 |
|
(2) Goodwill and Acquired Intangible Assets: Our Core Earnings exclude goodwill and intangible asset impairment and the amortization of acquired intangible assets. The following table summarizes the goodwill and acquired intangible asset adjustments.
|
|
|
Three Months Ended March 31, |
|
|||||
|
(Dollars in millions) |
|
2024 |
|
|
2023 |
|
||
|
Core Earnings goodwill and acquired intangible
|
|
$ |
3 |
|
|
$ |
3 |
|
30
2. Tangible Equity and Adjusted Tangible Equity Ratio
Adjusted Tangible Equity Ratio measures the ratio of Navient’s Tangible Equity to its tangible assets. We adjust this ratio to exclude the assets and equity associated with our FFELP Loan portfolio because FFELP Loans are no longer originated and the FFELP Loan portfolio bears a 3% maximum loss exposure under the terms of the federal guaranty. Management believes that excluding this portfolio from the ratio enhances its usefulness to investors. Management uses this ratio, in addition to other metrics, for analysis and decision making related to capital allocation decisions. The Adjusted Tangible Equity Ratio is calculated as:
|
(Dollars in millions) |
|
March 31, 2024 |
|
|
March 31, 2023 |
|
||
|
Navient Corporation's stockholders' equity |
|
$ |
2,766 |
|
|
$ |
2,958 |
|
|
Less: Goodwill and acquired intangible assets |
|
|
692 |
|
|
|
703 |
|
|
Tangible Equity |
|
|
2,074 |
|
|
|
2,255 |
|
|
Less: Equity held for FFELP Loans |
|
|
179 |
|
|
|
211 |
|
|
Adjusted Tangible Equity |
|
$ |
1,895 |
|
|
$ |
2,044 |
|
|
Divided by: |
|
|
|
|
|
|
||
|
Total assets |
|
$ |
59,029 |
|
|
$ |
66,913 |
|
|
Less: |
|
|
|
|
|
|
||
|
Goodwill and acquired intangible assets |
|
|
692 |
|
|
|
703 |
|
|
FFELP Loans |
|
|
35,879 |
|
|
|
42,148 |
|
|
Adjusted tangible assets |
|
$ |
22,458 |
|
|
$ |
24,062 |
|
|
Adjusted Tangible Equity Ratio |
|
|
8.4 |
% |
|
|
8.5 |
% |
3. Earnings before Interest, Taxes, Depreciation and Amortization Expense (EBITDA)
This measures the operating performance of the Business Processing segment and is used by management and equity investors to monitor operating performance and determine the value of those businesses. EBITDA for the Business Processing segment is calculated as:
|
|
|
Three Months Ended March 31, |
|
|||||
|
(Dollars in millions) |
|
2024 |
|
|
2023 |
|
||
|
Pre-tax income |
|
$ |
8 |
|
|
$ |
5 |
|
|
Plus: |
|
|
|
|
|
|
||
|
Depreciation and amortization expense (1) |
|
|
1 |
|
|
|
— |
|
|
EBITDA |
|
$ |
9 |
|
|
$ |
5 |
|
|
Divided by: |
|
|
|
|
|
|
||
|
Total revenue |
|
$ |
77 |
|
|
$ |
72 |
|
|
EBITDA margin |
|
|
11 |
% |
|
|
7 |
% |
31
4. Allowance for Loan Losses Excluding Expected Future Recoveries on Previously Fully Charged-off
Loans
The allowance for loan losses on the Private Education Loan portfolio used for the three credit metrics below excludes the expected future recoveries on previously fully charged-off loans to better reflect the current expected credit losses remaining in connection with the loans on balance sheet that have not charged off. That is, as of March 31, 2024, the $755 million Private Education Loan allowance for loan losses excluding expected future recoveries on previously fully charged-off loans represents the current expected credit losses that remain in connection with the $17,146 million Private Education Loan portfolio. The $217 million of expected future recoveries on previously fully charged-off loans, which is collected over an average 15-year period, mechanically is a reduction to the overall allowance for loan losses. However, it is not related to the $17,146 million Private Education Loan portfolio on our balance sheet and, as a result, management excludes this impact to the allowance to better evaluate and assess our overall credit loss coverage on the Private Education Loan portfolio. We believe this provides a more meaningful and holistic view of the available credit loss coverage on our non-charged-off Private Education Loan portfolio. We believe this information is useful to our investors, lenders and rating agencies .
Allowance for Loan Losses Metrics – Private Education Loans
|
|
|
Three Months Ended March 31, |
|
|||||
|
(Dollars in millions) |
|
2024 |
|
|
2023 |
|
||
|
Allowance at end of period (GAAP) |
|
$ |
538 |
|
|
$ |
706 |
|
|
Plus: expected future recoveries on previously fully charged-off loans |
|
|
217 |
|
|
|
268 |
|
|
Allowance at end of period excluding expected future recoveries on
|
|
$ |
755 |
|
|
$ |
974 |
|
|
Ending total loans |
|
$ |
17,146 |
|
|
$ |
18,981 |
|
|
Ending loans in repayment |
|
$ |
16,480 |
|
|
$ |
18,258 |
|
|
Net charge-offs |
|
$ |
99 |
|
|
$ |
75 |
|
|
|
|
|
|
|
|
|
||
|
Allowance coverage of charge-offs (annualized): |
|
|
|
|
|
|
||
|
GAAP |
|
|
1.3 |
|
|
|
2.3 |
|
|
Adjustment (1) |
|
|
.5 |
|
|
|
.9 |
|
|
Non-GAAP Financial Measure (1) |
|
|
1.8 |
|
|
|
3.2 |
|
|
|
|
|
|
|
|
|
||
|
Allowance as a percentage of the ending total loan balance: |
|
|
|
|
|
|
||
|
GAAP |
|
|
3.1 |
% |
|
|
3.7 |
% |
|
Adjustment (1) |
|
|
1.3 |
|
|
|
1.4 |
|
|
Non-GAAP Financial Measure (1) |
|
|
4.4 |
% |
|
|
5.1 |
% |
|
|
|
|
|
|
|
|
||
|
Allowance as a percentage of the ending loans in repayment: |
|
|
|
|
|
|
||
|
GAAP |
|
|
3.3 |
% |
|
|
3.9 |
% |
|
Adjustment (1) |
|
|
1.3 |
|
|
|
1.5 |
|
|
Non-GAAP Financial Measure (1) |
|
|
4.6 |
% |
|
|
5.4 |
% |
32
Legal Proc eedings
For a discussion of legal matters as of March 31, 2024, please refer to “Note 9 – Commitments and Contingencies” to our consolidated financial statements included in this report, which is incorporated into this item by reference.
R isk Factors
The risk factors disclosed in our 2023 Form 10-K should be considered together with information included in this Form 10-Q. These are not the only risks to which we are exposed. The following information amends and restates in its entirety the previously disclosed risk factor in our 2023 Form 10-K relating to potential impacts of prepayments on our loans. Except for such additional information, we believe there have been no material changes from the risk factors previously disclosed in our 2023 Form 10-K.
Prepayments on our loans can materially impact our profitability, results of operations, financial condition, cash flows or future business prospects.
The rate at which borrowers prepay their loans can have a material impact on profitability, results of operations, financial condition, cash flows or future business prospects by affecting our net interest margin, the future cash flows from our loans including loans held by our securitization trusts. Higher or lower prepayments can result from a variety of causes including borrower activity and changes in the education loan market as a result of market conditions, interest rate movements, loan forgiveness or other government sponsored initiatives or programs. FFELP Loans and Private Education Loans may be voluntarily prepaid without penalty by the borrower, refinanced or consolidated with the borrower’s other loans through refinancing or repaid by the Department of Education (ED) in connection with certain government sponsored programs. Prepayment rates on education loans are subject to a variety of economic, political, competitive and other factors, including changes in our competitors’ business strategies, changes in interest rates, availability of alternative financings (including refinance and consolidations), legislative, executive, policy and regulatory changes affecting the education loan market and the general economy. Refinance products offered by us, our competitors, and the Federal Government may increase the repayment rate on our FFELP Loans and Private Education Loans.
In particular, new interpretations of current laws, rules or regulations or future laws, executive orders or other policy initiatives which operate to encourage or require consolidation, abolish existing or create additional income-based repayment or debt forgiveness programs or establish other policies and programs also may increase or decrease the prepayment rates on education loans. In addition, the timing of the implementation and execution of certain government sponsored programs, like the Borrower Defense Loan Discharge program, may also increase or decrease the prepayment rates on FFELP Loans. For example, after the invalidation of the Student Debt Relief (SDR) Plan, ED announced that it had begun a new rulemaking process to consider other ways to provide debt relief to borrowers, which could include borrowers with privately held FFELP Loans. ED held several public meeting sessions with a negotiated rulemaking committee in the fourth quarter of 2023 and in the first quarter of 2024. ED is expected to publish proposed regulations for public comment in May 2024. Further, on July 10, 2023, ED issued final regulations on income-driven repayment plans for Direct loans, which are student loans held by ED. Eligible FFELP borrowers can access the new changes by consolidating their loans into the Direct Loan Program. This new income-driven repayment plan may increase consolidation activity in the future as FFELP borrowers consolidate their loans into the Direct Loan Program in order to be eligible for the new income-driven repayment plan.
These proposed borrower debt relief regulations, the new income-driven repayment plan and the timing of the implementation and execution of certain government sponsored programs have increased, and may continue to increase, the prepayment rates of our existing education loan portfolio and could materially and adversely impact our profitability, results of operations, financial condition, cash flows or future business prospects. We cannot predict what (if any) plans or policies regarding debt relief or other related policies or programs may ultimately be implemented, the timing of when such plans or policies may be implemented, and/or the outcome of such actions.
FFELP Loans may also be repaid after default by the Guarantors of FFELP Loans. Conversely, borrowers might not choose to prepay their education loans, or the terms of their education loans may be extended as a result of grace periods, deferment periods, income-driven repayment plans, or other repayment terms or monthly payment amount modifications agreed to by the servicer, for example. FFELP Loan borrowers may be eligible for various existing income-based repayment programs under which borrowers can qualify for reduced or zero monthly payment or even debt forgiveness after a certain number of years of repayment. Prolonged introductions of significant amounts of subsidized funding at below market interest rates — whether from federal or private sources — could increase the prepayment rates of our existing Private Education Loans and have a material adverse effect on our profitability, results of operations, financial condition, cash flows or future business prospects.
33
With respect to our securitization trusts when, as a result of unanticipated prepayment levels, education loans within a securitization trust amortize faster than originally contracted, the trust’s pool balance may decline at a rate faster than the prepayment rate assumed when the trust’s bonds were originally issued. If the trust’s pool balance declines faster than originally anticipated, in most of our securitization structures, the bonds issued by that trust will also be repaid faster than originally anticipated. In such cases, our net interest income may decrease and our future cash flows from the trust may similarly decline. Conversely, when education loans within a securitization trust amortize more slowly than originally contracted, the trust’s pool balance may decline more slowly than the prepayment rate assumed when the trust’s bonds were originally issued, and the bonds may be repaid more slowly than originally anticipated. In these cases, our net interest income increases and our future cash flows from the trust may increase. It is also possible, if the prepayment rate is especially slow and certain rights of the sellers or the servicer are not exercised or are insufficient or other action is not taken to counter the slower prepayment rate, the trust’s bonds may not be repaid by their legal final maturity date(s), which could result in an event of default under the underlying securitization agreements.
34
Quantitative and Qualitat ive Disclosures about Market Risk
Interest Rate Sensitivity Analysis
Our interest rate risk management seeks to limit the impact of movements in interest rates on our results of operations and financial position. The following tables summarize the potential effect on earnings over the next 12 months and the potential effect on fair values of balance sheet assets and liabilities at March 31, 2024 and 2023, based upon a sensitivity analysis performed by management assuming a hypothetical increase and decrease in market interest rates of 100 basis points. The earnings sensitivities assume an immediate increase and decrease in market interest rates of 100 basis points and are applied only to financial assets and liabilities, including hedging instruments, that existed at the balance sheet date and do not take into account any new assets, liabilities or hedging instruments that may arise over the next 12 months.
|
|
|
As of March 31, 2024 |
|
|
As of March 31, 2023 |
|
||||||||||
|
|
|
Impact on Annual Earnings If: |
|
|
Impact on Annual Earnings If: |
|
||||||||||
|
|
|
Interest Rates |
|
|
Interest Rates |
|
||||||||||
|
(Dollars in millions, except per share amounts) |
|
Increase
|
|
|
Decrease
|
|
|
Increase
|
|
|
Decrease
|
|
||||
|
Effect on Earnings: |
|
|
|
|
|
|
|
|
|
|
|
|
||||
|
Change in pre-tax net income before mark-to
|
|
$ |
16 |
|
|
$ |
2 |
|
|
$ |
39 |
|
|
$ |
(26 |
) |
|
Mark-to-market gains (losses) on derivative and
|
|
|
58 |
|
|
|
(60 |
) |
|
|
32 |
|
|
|
(33 |
) |
|
Increase (decrease) in income before taxes |
|
$ |
74 |
|
|
$ |
(58 |
) |
|
$ |
71 |
|
|
$ |
(59 |
) |
|
Increase (decrease) in net income after taxes |
|
$ |
57 |
|
|
$ |
(45 |
) |
|
$ |
55 |
|
|
$ |
(45 |
) |
|
Increase (decrease) in diluted earnings per
|
|
$ |
.51 |
|
|
$ |
(.40 |
) |
|
$ |
.43 |
|
|
$ |
(.36 |
) |
35
|
|
|
At March 31, 2024 |
|
|||||||||||||||||
|
|
|
|
|
|
Interest Rates: |
|
||||||||||||||
|
|
|
|
|
|
Change from
|
|
|
Change from
|
|
|||||||||||
|
(Dollars in millions) |
|
Fair Value |
|
|
$ |
|
|
% |
|
|
$ |
|
|
% |
|
|||||
|
Effect on Fair Values: |
|
|
|
|
|
|
|
|
|
|
|
|
|
|
|
|||||
|
Assets |
|
|
|
|
|
|
|
|
|
|
|
|
|
|
|
|||||
|
Education Loans |
|
$ |
51,343 |
|
|
$ |
(75 |
) |
|
|
— |
% |
|
$ |
111 |
|
|
|
— |
% |
|
Other earning assets |
|
|
3,077 |
|
|
|
— |
|
|
|
— |
|
|
|
— |
|
|
|
— |
|
|
Other assets |
|
|
3,465 |
|
|
|
29 |
|
|
|
1 |
|
|
|
27 |
|
|
|
1 |
|
|
Total assets gain/(loss) |
|
$ |
57,885 |
|
|
$ |
(46 |
) |
|
|
— |
% |
|
$ |
138 |
|
|
|
— |
% |
|
Liabilities |
|
|
|
|
|
|
|
|
|
|
|
|
|
|
|
|||||
|
Interest-bearing liabilities |
|
$ |
53,882 |
|
|
$ |
(261 |
) |
|
|
— |
% |
|
$ |
277 |
|
|
|
1 |
% |
|
Other liabilities |
|
|
988 |
|
|
|
121 |
|
|
|
12 |
|
|
|
(69 |
) |
|
|
(7 |
) |
|
Total liabilities (gain)/loss |
|
$ |
54,870 |
|
|
$ |
(140 |
) |
|
|
— |
% |
|
$ |
208 |
|
|
|
— |
% |
|
|
|
|
|
|
|
|
|
|
|
|
|
|
|
|
|
|||||
|
|
|
At December 31, 2023 |
|
|||||||||||||||||
|
|
|
|
|
|
Interest Rates: |
|
||||||||||||||
|
|
|
|
|
|
Change from
|
|
|
Change from
|
|
|||||||||||
|
(Dollars in millions) |
|
Fair Value |
|
|
$ |
|
|
% |
|
|
$ |
|
|
% |
|
|||||
|
Effect on Fair Values: |
|
|
|
|
|
|
|
|
|
|
|
|
|
|
|
|||||
|
Assets |
|
|
|
|
|
|
|
|
|
|
|
|
|
|
|
|||||
|
Education Loans |
|
$ |
52,877 |
|
|
$ |
(88 |
) |
|
|
— |
% |
|
$ |
130 |
|
|
|
— |
% |
|
Other earning assets |
|
|
2,939 |
|
|
|
— |
|
|
|
— |
|
|
|
— |
|
|
|
— |
|
|
Other assets |
|
|
3,609 |
|
|
|
7 |
|
|
|
— |
|
|
|
50 |
|
|
|
1 |
|
|
Total assets gain/(loss) |
|
$ |
59,425 |
|
|
$ |
(81 |
) |
|
|
— |
% |
|
$ |
180 |
|
|
|
— |
% |
|
Liabilities |
|
|
|
|
|
|
|
|
|
|
|
|
|
|
|
|||||
|
Interest-bearing liabilities |
|
$ |
55,803 |
|
|
$ |
(274 |
) |
|
|
— |
% |
|
$ |
295 |
|
|
|
1 |
% |
|
Other liabilities |
|
|
987 |
|
|
|
113 |
|
|
|
11 |
|
|
|
(67 |
) |
|
|
(7 |
) |
|
Total liabilities (gain)/loss |
|
$ |
56,790 |
|
|
$ |
(161 |
) |
|
|
— |
% |
|
$ |
228 |
|
|
|
— |
% |
A primary objective in our funding is to minimize our sensitivity to changing interest rates by generally funding our floating rate education loan portfolio with floating rate debt and our fixed rate education loan portfolio with fixed rate debt although we can have a mismatch at times. In addition, we can have a mismatch in the index (including the frequency of reset) of floating rate debt versus floating rate assets. In addition, due to the ability of some FFELP Loans to earn Floor Income, we can have a fixed versus floating mismatch in funding if the education loan earns at the fixed borrower rate and the funding remains floating. We use Floor Income Contracts, pay-fixed swaps and fixed rate debt to economically hedge embedded Floor Income in our FFELP Loans. Historically, we have used these instruments on a periodic basis and depending upon market conditions and pricing, we may enter into additional hedges in the future. The result of these hedging transactions is to fix the relative spread between the education loan asset rate and the funding instrument rate.
In the preceding tables, under the scenario where interest rates increase or decrease by 100 basis points, the change in pre-tax net income before the mark-to-market gains (losses) on derivative and hedging activities is primarily due to the impact of (i) a portion of our unhedged FFELP Loans being in a fixed-rate mode due to Floor Income, while being funded with variable rate debt; (ii) certain FFELP fixed rate loans becoming variable interest rate loans when variable interest rates rise above a certain level (Special Allowance Payment or “SAP”). When these loans are funded with fixed rate debt (as we do for a portion of the portfolio to economically hedge Floor Income) we earn additional interest income when earning the higher variable rate that is in effect; and (iii) a portion of our variable rate assets being funded with fixed rate liabilities. Item (i) will generally cause income to decrease when interest rates increase and income to increase when interest rates decrease. Item (ii) and (iii) have the opposite effect. The change due to the interest rate scenario where interest rates increase by 100 basis points in the current period is primarily a result of item (iii) as well as item (ii) having a more significant impact than item (i) as a result of interest rates being higher compared to the prior period. The change due to the interest scenario where interest rates decrease by 100 basis points in the current period is primarily a result of item (i) having a more significant impact (including annual reset floors in connection with a portion of the Stafford FFELP loan portfolio) than item (ii) as a result of interest rates being higher compared to the prior period. The relative changes from the prior period are a result of interest rates being lower in the prior period.
36
In the preceding tables, under the scenario where interest rates increase or decrease by 100 basis points, the change in mark-to-market gains (losses) on derivative and hedging activities in both periods is primarily due to (i) the notional amount and remaining term of our derivative portfolio and related hedged debt and (ii) the interest rate environment. In both periods, the mark-to-market gains (losses) are primarily related to derivatives that don’t qualify for hedge accounting that are used to economically hedge the origination of fixed rate Private Education Refinance loans. As a result of not qualifying for hedge accounting, there is not an offsetting mark- to-market of the hedged item in this analysis.
In addition to interest rate risk addressed in the preceding tables, we are also exposed to risks related to foreign currency exchange rates. Foreign currency exchange risk is primarily the result of foreign currency denominated debt issued by us. When we issue foreign denominated corporate unsecured and securitization debt, our policy is to use cross currency interest rate swaps to swap all foreign currency denominated debt payments (fixed and floating) to USD SOFR using a fixed exchange rate. In the tables above, there would be an immaterial impact on earnings if exchange rates were to decrease or increase, due to the terms of the hedging instrument and hedged items matching. The balance sheet interest-bearing liabilities would be affected by a change in exchange rates; however, the change would be materially offset by the cross-currency interest rate swaps in other assets or other liabilities. In certain economic environments, volatility in the spread between spot and forward foreign exchange rates has resulted in mark-to-market impacts to current period earnings which have not been factored into the above analysis. The earnings impact is noncash, and at maturity of the instruments the cumulative mark-to-market impact will be zero. Navient has not issued foreign currency denominated debt since 2008.
Asset and Liability Funding Gap
The table below presents our assets and liabilities (funding) arranged by underlying indices as of March 31, 2024. Management analyzes interest rate risk and in doing so includes all derivatives that are economically hedging our debt whether they qualify as effective hedges or not (Core Earnings basis). Accordingly, we present the asset and liability funding gap on a Core Earnings basis. The difference between the asset and the funding is the funding gap for the specified index. This represents our exposure to interest rate risk in the form of basis risk and repricing risk, which is the risk that the different indices may reset at different frequencies or may not move in the same direction or at the same magnitude.
|
Index
|
|
Frequency of
|
|
Assets |
|
|
Funding |
|
|
Funding
|
|
|||
|
3 month Treasury bill |
|
weekly |
|
$ |
1.9 |
|
|
$ |
— |
|
|
$ |
1.9 |
|
|
3 month Treasury bill |
|
annual |
|
|
.1 |
|
|
|
— |
|
|
|
.1 |
|
|
Prime |
|
annual |
|
|
.1 |
|
|
|
— |
|
|
|
.1 |
|
|
Prime |
|
quarterly |
|
|
1.0 |
|
|
|
— |
|
|
|
1.0 |
|
|
Prime |
|
monthly |
|
|
3.4 |
|
|
|
— |
|
|
|
3.4 |
|
|
3 month Term SOFR |
|
quarterly |
|
|
.2 |
|
|
|
1.2 |
|
|
|
(1.0 |
) |
|
3 month Term SOFR (1) |
|
monthly |
|
|
— |
|
|
|
.4 |
|
|
|
(.4 |
) |
|
1 month Term SOFR |
|
monthly |
|
|
2.3 |
|
|
|
1.0 |
|
|
|
1.3 |
|
|
Overnight SOFR (2) |
|
daily |
|
|
33.7 |
|
|
|
34.7 |
|
|
|
(1.0 |
) |
|
Non Discrete reset (1) |
|
monthly |
|
|
— |
|
|
|
4.7 |
|
|
|
(4.7 |
) |
|
Non Discrete reset (3) |
|
daily/weekly |
|
|
3.0 |
|
|
|
— |
|
|
|
3.0 |
|
|
Fixed Rate (4) |
|
|
|
|
13.5 |
|
|
|
17.2 |
|
|
|
(3.7 |
) |
|
Total |
|
|
|
$ |
59.2 |
|
|
$ |
59.2 |
|
|
$ |
— |
|
37
We use interest rate swaps and other derivatives to achieve our risk management objectives. Our asset liability management strategy is to match assets with debt (in combination with derivatives) that have the same underlying index and reset frequency or, when economical, have interest rate characteristics that we believe are highly correlated. Interest earned on our FFELP Loans is primarily indexed to 30-day average overnight SOFR reset daily and our cost of funds is primarily indexed to overnight SOFR but resetting at different times than the asset. A source of variability in FFELP net interest income could also be Floor Income we earn on certain FFELP Loans. Pursuant to the terms of the FFELP, certain FFELP Loans can earn interest at the stated fixed rate of interest as underlying debt interest rate expense remains variable. We refer to this additional spread income as “Floor Income.” Floor Income can be volatile since it is dependent on interest rate levels. We frequently hedge this volatility to lock in the value of the Floor Income over the term of the contract. Interest earned on our Private Education Refinance Loans is generally fixed rate with the related cost of funds generally fixed rate as well. Interest earned on the remaining Private Education Loans is generally indexed to either one-month Prime or term SOFR rates and our cost of funds is primarily indexed to one-month or three-month term SOFR. The use of funding with index types and reset frequencies that are different from our assets exposes us to interest rate risk in the form of basis and repricing risk. This could result in our cost of funds not moving in the same direction or with the same magnitude as the yield on our assets. While we believe this risk is low, as all of these indices are short-term with rate movements that are highly correlated over a long period of time, market disruptions (which have occurred in prior years) can lead to a temporary divergence between indices resulting in a negative impact to our earnings.
Unregistered Sales of Equity Securities and Use of Proceeds
Issuer Purchases of Equity Securities
The following tables provide information relating to our purchases of shares of our common stock in the three months ended March 31, 2024.
|
(In millions, except per share data) |
|
Total Number
|
|
|
Average Price
|
|
|
Total Number of
|
|
|
Approximate Dollar
|
|
||||
|
Period: |
|
|
|
|
|
|
|
|
|
|
|
|
||||
|
January 1 — January 31, 2024 |
|
|
.9 |
|
|
$ |
17.69 |
|
|
|
.9 |
|
|
$ |
275 |
|
|
February 1 — February 29, 2024 |
|
|
.9 |
|
|
|
16.16 |
|
|
|
.9 |
|
|
$ |
261 |
|
|
March 1 — March 31, 2024 |
|
|
.8 |
|
|
|
16.70 |
|
|
|
.8 |
|
|
$ |
247 |
|
|
Total first-quarter 2024 |
|
|
2.6 |
|
|
$ |
16.84 |
|
|
|
2.6 |
|
|
|
|
|
38
|
Execution Date |
Total Number of Shares Purchased (1) |
|
Average Price Paid per Share |
|
Total Number of Shares Purchased as part of Publicly Announced Plans or Programs (1)(2) |
|
Approximate Dollar Value of Shares that May Yet Be Purchased Under Publicly Announced Plans or Programs (1) |
|
||||
|
1/2/2024 |
|
38,510 |
|
$ |
18.53 |
|
|
38,510 |
|
$ |
289,296,075 |
|
|
1/3/2024 |
|
39,290 |
|
$ |
18.16 |
|
|
39,290 |
|
$ |
288,582,749 |
|
|
1/4/2024 |
|
39,284 |
|
$ |
18.16 |
|
|
39,284 |
|
$ |
287,869,332 |
|
|
1/5/2024 |
|
38,975 |
|
$ |
18.30 |
|
|
38,975 |
|
$ |
287,155,945 |
|
|
1/8/2024 |
|
39,423 |
|
$ |
18.05 |
|
|
39,423 |
|
$ |
286,444,234 |
|
|
1/9/2024 |
|
39,532 |
|
$ |
17.81 |
|
|
39,532 |
|
$ |
285,740,276 |
|
|
1/10/2024 |
|
40,804 |
|
$ |
17.46 |
|
|
40,804 |
|
$ |
285,027,899 |
|
|
1/11/2024 |
|
40,895 |
|
$ |
17.39 |
|
|
40,895 |
|
$ |
284,316,792 |
|
|
1/12/2024 |
|
41,167 |
|
$ |
17.33 |
|
|
41,167 |
|
$ |
283,603,360 |
|
|
1/16/2024 |
|
41,430 |
|
$ |
17.22 |
|
|
41,430 |
|
$ |
282,889,877 |
|
|
1/17/2024 |
|
41,099 |
|
$ |
17.05 |
|
|
41,099 |
|
$ |
282,188,942 |
|
|
1/18/2024 |
|
43,250 |
|
$ |
16.73 |
|
|
43,250 |
|
$ |
281,465,288 |
|
|
1/19/2024 |
|
42,133 |
|
$ |
16.95 |
|
|
42,133 |
|
$ |
280,751,175 |
|
|
1/22/2024 |
|
41,150 |
|
$ |
17.57 |
|
|
41,150 |
|
$ |
280,027,997 |
|
|
1/23/2024 |
|
40,589 |
|
$ |
17.60 |
|
|
40,589 |
|
$ |
279,313,675 |
|
|
1/24/2024 |
|
40,508 |
|
$ |
17.68 |
|
|
40,508 |
|
$ |
278,597,299 |
|
|
1/25/2024 |
|
40,250 |
|
$ |
17.81 |
|
|
40,250 |
|
$ |
277,880,507 |
|
|
1/26/2024 |
|
39,660 |
|
$ |
18.07 |
|
|
39,660 |
|
$ |
277,163,918 |
|
|
1/29/2024 |
|
38,969 |
|
$ |
18.13 |
|
|
38,969 |
|
$ |
276,457,434 |
|
|
1/30/2024 |
|
39,692 |
|
$ |
18.22 |
|
|
39,692 |
|
$ |
275,734,321 |
|
|
1/31/2024 |
|
41,214 |
|
$ |
17.59 |
|
|
41,214 |
|
$ |
275,009,511 |
|
|
2/5/2024 |
|
48,571 |
|
$ |
16.00 |
|
|
48,571 |
|
$ |
274,232,618 |
|
|
2/6/2024 |
|
48,205 |
|
$ |
16.12 |
|
|
48,205 |
|
$ |
273,455,630 |
|
|
2/7/2024 |
|
49,158 |
|
$ |
15.81 |
|
|
49,158 |
|
$ |
272,678,639 |
|
|
2/8/2024 |
|
48,511 |
|
$ |
16.02 |
|
|
48,511 |
|
$ |
271,901,648 |
|
|
2/9/2024 |
|
48,342 |
|
$ |
16.07 |
|
|
48,342 |
|
$ |
271,124,657 |
|
|
2/12/2024 |
|
46,941 |
|
$ |
16.57 |
|
|
46,941 |
|
$ |
270,346,671 |
|
|
2/13/2024 |
|
48,496 |
|
$ |
16.04 |
|
|
48,496 |
|
$ |
269,568,688 |
|
|
2/14/2024 |
|
48,262 |
|
$ |
16.12 |
|
|
48,262 |
|
$ |
268,790,710 |
|
|
2/15/2024 |
|
47,316 |
|
$ |
16.44 |
|
|
47,316 |
|
$ |
268,012,735 |
|
|
2/16/2024 |
|
47,451 |
|
$ |
16.40 |
|
|
47,451 |
|
$ |
267,234,748 |
|
|
2/20/2024 |
|
47,467 |
|
$ |
16.39 |
|
|
47,467 |
|
$ |
266,456,754 |
|
|
2/21/2024 |
|
48,413 |
|
$ |
16.07 |
|
|
48,413 |
|
$ |
265,678,762 |
|
|
2/22/2024 |
|
48,192 |
|
$ |
16.14 |
|
|
48,192 |
|
$ |
264,900,774 |
|
|
2/23/2024 |
|
47,501 |
|
$ |
16.38 |
|
|
47,501 |
|
$ |
264,122,789 |
|
|
2/26/2024 |
|
47,971 |
|
$ |
16.22 |
|
|
47,971 |
|
$ |
263,344,800 |
|
|
2/27/2024 |
|
48,504 |
|
$ |
16.04 |
|
|
48,504 |
|
$ |
262,566,805 |
|
|
2/28/2024 |
|
48,959 |
|
$ |
15.89 |
|
|
48,959 |
|
$ |
261,788,817 |
|
|
2/29/2024 |
|
48,068 |
|
$ |
16.19 |
|
|
48,068 |
|
$ |
261,010,822 |
|
|
3/1/2024 |
|
42,779 |
|
$ |
16.36 |
|
|
42,779 |
|
$ |
260,310,834 |
|
|
3/4/2024 |
|
42,500 |
|
$ |
16.43 |
|
|
42,500 |
|
$ |
259,612,385 |
|
|
3/5/2024 |
|
42,500 |
|
$ |
16.43 |
|
|
42,500 |
|
$ |
258,914,101 |
|
|
3/6/2024 |
|
42,700 |
|
$ |
16.35 |
|
|
42,700 |
|
$ |
258,215,862 |
|
|
3/7/2024 |
|
42,500 |
|
$ |
16.43 |
|
|
42,500 |
|
$ |
257,517,728 |
|
|
3/8/2024 |
|
42,500 |
|
$ |
16.44 |
|
|
42,500 |
|
$ |
256,818,862 |
|
|
3/11/2024 |
|
42,200 |
|
$ |
16.56 |
|
|
42,200 |
|
$ |
256,120,148 |
|
|
3/12/2024 |
|
41,700 |
|
$ |
16.69 |
|
|
41,700 |
|
$ |
255,424,383 |
|
|
3/13/2024 |
|
41,500 |
|
$ |
16.87 |
|
|
41,500 |
|
$ |
254,724,486 |
|
|
3/14/2024 |
|
41,713 |
|
$ |
16.62 |
|
|
41,713 |
|
$ |
254,031,124 |
|
|
3/15/2024 |
|
43,000 |
|
$ |
16.50 |
|
|
43,000 |
|
$ |
253,321,474 |
|
|
3/18/2024 |
|
42,563 |
|
$ |
16.45 |
|
|
42,563 |
|
$ |
252,621,478 |
|
|
3/19/2024 |
|
42,489 |
|
$ |
16.47 |
|
|
42,489 |
|
$ |
251,921,489 |
|
|
3/20/2024 |
|
41,819 |
|
$ |
16.74 |
|
|
41,819 |
|
$ |
251,221,497 |
|
|
3/21/2024 |
|
37,200 |
|
$ |
16.95 |
|
|
37,200 |
|
$ |
250,590,998 |
|
|
3/22/2024 |
|
46,484 |
|
$ |
16.89 |
|
|
46,484 |
|
$ |
249,805,721 |
|
|
3/25/2024 |
|
39,600 |
|
$ |
17.11 |
|
|
39,600 |
|
$ |
249,128,311 |
|
|
3/26/2024 |
|
44,700 |
|
$ |
17.18 |
|
|
44,700 |
|
$ |
248,360,321 |
|
|
3/27/2024 |
|
42,000 |
|
$ |
17.20 |
|
|
42,000 |
|
$ |
247,637,749 |
|
|
3/28/2024 |
|
35,250 |
|
$ |
17.39 |
|
|
35,250 |
|
$ |
247,024,857 |
|
|
|
|
2,551,849 |
|
$ |
16.84 |
|
|
2,551,849 |
|
|
|
|
39
Other Information
Director and Officer Trading Arrangements
None of our
Controls and Procedures
Disclosure Controls and Procedures
Our management, with the participation of our Principal Executive and Principal Financial Officers, evaluated the effectiveness of our disclosure controls and procedures (as defined in Rules 13a-15(e) and 15d-15(e) under the Securities Exchange Act of 1934, as amended (the Exchange Act)) as of March 31, 2024. Based on this evaluation, our Principal Executive and Principal Financial Officers concluded that, as of March 31, 2024, our disclosure controls and procedures were effective to ensure that information required to be disclosed by us in the reports that we file or submit under the Exchange Act is (a) recorded, processed, summarized and reported within the time periods specified in the SEC’s rules and forms and (b) accumulated and communicated to our management, including our Principal Executive and Principal Financial Officers as appropriate, to allow timely decisions regarding required disclosure.
Changes in Internal Control over Financial Reporting
No change in our internal control over financial reporting (as defined in Rules 13a-15(f) and 15d-15(f) under the Exchange Act) occurred during the fiscal quarter ended March 31, 2024 that has materially affected, or is reasonably likely to materially affect, our internal control over financial reporting.
40
E xhibits
|
10.1* |
|
Form of Navient Corporation 2014 Omnibus Incentive Plan Performance Stock Unit Agreement. |
|
|
|
|
|
31.1* |
|
Certification Pursuant to Section 302 of the Sarbanes-Oxley Act of 2002. |
|
|
|
|
|
31.2* |
|
Certification Pursuant to Section 302 of the Sarbanes-Oxley Act of 2002. |
|
|
|
|
|
32.1** |
|
|
|
|
|
|
|
32.2** |
|
|
|
|
|
|
|
101.INS* |
|
Inline XBRL Instance Document–the instance document does not appear in the Interactive Data File as its XBRL tags are embedded within the Inline XBRL document. |
|
|
|
|
|
101.SCH* |
|
Inline XBRL Taxonomy Extension Schema With Embedded Linkbase Documents. |
|
|
|
|
|
104 |
|
Cover Page Interactive Data File (formatted as Inline XBRL and contained in Exhibit 101). |
* Filed herewith
** Furnished herewith
41
Financ ial Statements
NAVIENT CORPORATION
CONSOLIDATED BALANCE SHEETS
(In millions, except per share amounts)
(Unaudited)
|
|
|
March 31, 2024 |
|
|
December 31, 2023 |
|
||
|
Assets |
|
|
|
|
|
|
||
|
FFELP Loans (net of allowance for losses of $
|
|
$ |
|
|
|
$ |
|
|
|
Private Education Loans (net of allowance for losses of $
|
|
|
|
|
|
|
|
|
|
Investments |
|
|
|
|
|
|
|
|
|
Cash and cash equivalents |
|
|
|
|
|
|
|
|
|
Restricted cash and cash equivalents |
|
|
|
|
|
|
|
|
|
Goodwill and acquired intangible assets, net |
|
|
|
|
|
|
|
|
|
Other assets |
|
|
|
|
|
|
|
|
|
Total assets |
|
$ |
|
|
|
$ |
|
|
|
Liabilities |
|
|
|
|
|
|
||
|
Short-term borrowings |
|
$ |
|
|
|
$ |
|
|
|
Long-term borrowings |
|
|
|
|
|
|
|
|
|
Other liabilities |
|
|
|
|
|
|
|
|
|
Total liabilities |
|
|
|
|
|
|
|
|
|
|
|
|
|
|
|
|
||
|
Equity |
|
|
|
|
|
|
||
|
Series A Junior Participating Preferred Stock, par value $
|
|
|
|
|
|
|
|
|
|
Common stock, par value $
|
|
|
|
|
|
|
|
|
|
Additional paid-in capital |
|
|
|
|
|
|
|
|
|
Accumulated other comprehensive income (net of tax expense
|
|
|
|
|
|
|
|
|
|
Retained earnings |
|
|
|
|
|
|
|
|
|
Total stockholders’ equity before treasury stock |
|
|
|
|
|
|
|
|
|
Less: Common stock held in treasury at cost:
|
|
|
(
|
) |
|
|
(
|
) |
|
Total equity |
|
|
|
|
|
|
|
|
|
Total liabilities and equity |
|
$ |
|
|
|
$ |
|
|
Supplemental information — assets and liabilities of consolidated variable interest entities:
|
|
|
March 31, 2024 |
|
|
December 31, 2023 |
|
||
|
FFELP Loans |
|
$ |
|
|
|
$ |
|
|
|
Private Education Loans |
|
|
|
|
|
|
|
|
|
Restricted cash |
|
|
|
|
|
|
|
|
|
Other assets, net |
|
|
|
|
|
|
|
|
|
Short-term borrowings |
|
|
|
|
|
|
|
|
|
Long-term borrowings |
|
|
|
|
|
|
|
|
|
Net assets of consolidated variable interest entities |
|
$ |
|
|
|
$ |
|
|
See accompanying notes to consolidated financial statements.
42
NAVIENT CORPORATION
CONSOLIDATED STAT EMENTS OF INCOME
(In millions, except per share amounts)
(Unaudited)
|
|
|
Three Months Ended March 31, |
|
|||||
|
|
|
2024 |
|
|
2023 |
|
||
|
Interest income: |
|
|
|
|
|
|
||
|
FFELP Loans |
|
$ |
|
|
|
$ |
|
|
|
Private Education Loans |
|
|
|
|
|
|
|
|
|
Cash and investments |
|
|
|
|
|
|
|
|
|
Total interest income |
|
|
|
|
|
|
|
|
|
Total interest expense |
|
|
|
|
|
|
|
|
|
Net interest income |
|
|
|
|
|
|
|
|
|
Less: provisions for loan losses |
|
|
|
|
|
|
(
|
) |
|
Net interest income after provisions for loan losses |
|
|
|
|
|
|
|
|
|
Other income (loss): |
|
|
|
|
|
|
||
|
Servicing revenue |
|
|
|
|
|
|
|
|
|
Asset recovery and business processing revenue |
|
|
|
|
|
|
|
|
|
Other income |
|
|
|
|
|
|
|
|
|
Gains (losses) on derivative and hedging activities, net |
|
|
|
|
|
|
(
|
) |
|
Total other income |
|
|
|
|
|
|
|
|
|
Expenses: |
|
|
|
|
|
|
||
|
Salaries and benefits |
|
|
|
|
|
|
|
|
|
Other operating expenses |
|
|
|
|
|
|
|
|
|
Total operating expenses |
|
|
|
|
|
|
|
|
|
Goodwill and acquired intangible asset impairment and
|
|
|
|
|
|
|
|
|
|
Restructuring/other reorganization expenses |
|
|
|
|
|
|
|
|
|
Total expenses |
|
|
|
|
|
|
|
|
|
Income before income tax expense |
|
|
|
|
|
|
|
|
|
Income tax expense |
|
|
|
|
|
|
|
|
|
Net income |
|
$ |
|
|
|
$ |
|
|
|
Basic earnings per common share |
|
$ |
|
|
|
$ |
|
|
|
Average common shares outstanding |
|
|
|
|
|
|
|
|
|
Diluted earnings per common share |
|
$ |
|
|
|
$ |
|
|
|
Average common and common equivalent shares outstanding |
|
|
|
|
|
|
|
|
|
Dividends per common share |
|
$ |
|
|
|
$ |
|
|
See accompanying notes to consolidated financial statements.
43
NAVIENT CORPORATION
CONSOLIDATED STATEMENTS OF COMPREHENSIVE INCOME
(In millions)
(Unaudited)
|
|
|
Three Months Ended March 31, |
|
|||||
|
|
|
2024 |
|
|
2023 |
|
||
|
Net income |
|
$ |
|
|
|
$ |
|
|
|
Net changes in cash flow hedges, net of tax (1) |
|
|
(
|
) |
|
|
(
|
) |
|
Total comprehensive income |
|
$ |
|
|
|
$ |
|
|
See accompanying notes to consolidated financial statements.
44
NAVIENT CORPORATION
CONSOLIDATED STATEMENTS OF CHANGES IN STOCKHOLDERS’ EQUITY
(In millions, except share and per share amounts)
(Unaudited)
|
|
|
|
|
|
|
|
|
|
|
|
|
|
|
|
|
|
|
|
|
|
|
|
|
|
|
|
|
|
|
|
|
|
|
|||||||||||
|
|
|
|
|
|
|
|
|
|
|
|
|
|
|
|
|
|
Accumulated |
|
|
|
|
|
|
|
|
|
|
|
|
|
|
|
|
|||||||||||
|
|
|
Common Stock Shares |
|
|
|
|
|
Additional |
|
|
Other |
|
|
|
|
|
|
|
|
Total |
|
|
|
|
|
|
|
|||||||||||||||||
|
|
|
|
|
|
|
|
|
|
|
|
Common |
|
|
Paid-In |
|
|
Comprehensive |
|
|
Retained |
|
|
Treasury |
|
|
Stockholders' |
|
|
Noncontrolling |
|
|
Total |
|
|||||||||||
|
|
|
Issued |
|
|
Treasury |
|
|
Outstanding |
|
|
Stock |
|
|
Capital |
|
|
Income (Loss) |
|
|
Earnings |
|
|
Stock |
|
|
Equity |
|
|
Interest |
|
|
Equity |
|
|||||||||||
|
Balance at
|
|
|
|
|
|
|
(
|
) |
|
|
|
|
|
$ |
|
|
|
$ |
|
|
|
$ |
|
|
|
$ |
|
|
|
$ |
(
|
) |
|
$ |
|
|
|
$ |
— |
|
|
$ |
|
|
|
Comprehensive income (loss): |
|
|
|
|
|
|
|
|
|
|
|
|
|
|
|
|
|
|
|
|
|
|
|
|
|
|
|
|
|
|
|
|
|
|||||||||||
|
Net income |
|
|
— |
|
|
|
— |
|
|
|
— |
|
|
|
— |
|
|
|
— |
|
|
|
— |
|
|
|
|
|
|
|
— |
|
|
|
|
|
|
|
— |
|
|
|
|
|
|
Other comprehensive
|
|
|
— |
|
|
|
— |
|
|
|
— |
|
|
|
— |
|
|
|
— |
|
|
|
(
|
) |
|
|
— |
|
|
|
— |
|
|
|
(
|
) |
|
|
— |
|
|
|
(
|
) |
|
Total comprehensive income
|
|
|
— |
|
|
|
— |
|
|
|
— |
|
|
|
— |
|
|
|
— |
|
|
|
— |
|
|
|
— |
|
|
|
— |
|
|
|
|
|
|
|
— |
|
|
|
|
|
|
Cash dividends: |
|
|
|
|
|
|
|
|
|
|
|
|
|
|
|
|
|
|
|
|
|
|
|
|
|
|
|
|
|
|
|
|
|
|||||||||||
|
Common stock ($
|
|
|
— |
|
|
|
— |
|
|
|
— |
|
|
|
— |
|
|
|
— |
|
|
|
— |
|
|
|
(
|
) |
|
|
— |
|
|
|
(
|
) |
|
|
— |
|
|
|
(
|
) |
|
Dividend equivalent units
|
|
|
— |
|
|
|
— |
|
|
|
— |
|
|
|
— |
|
|
|
— |
|
|
|
— |
|
|
|
(
|
) |
|
|
— |
|
|
|
(
|
) |
|
|
— |
|
|
|
(
|
) |
|
Issuance of common shares |
|
|
|
|
|
|
— |
|
|
|
|
|
|
|
— |
|
|
|
|
|
|
|
— |
|
|
|
— |
|
|
|
— |
|
|
|
|
|
|
|
— |
|
|
|
|
|
|
Stock-based compensation
|
|
|
— |
|
|
|
— |
|
|
|
— |
|
|
|
— |
|
|
|
|
|
|
|
— |
|
|
|
— |
|
|
|
— |
|
|
|
|
|
|
|
— |
|
|
|
|
|
|
Common stock repurchased |
|
|
— |
|
|
|
(
|
) |
|
|
(
|
) |
|
|
— |
|
|
|
— |
|
|
|
— |
|
|
|
— |
|
|
|
(
|
) |
|
|
(
|
) |
|
|
— |
|
|
|
(
|
) |
|
Shares repurchased related
|
|
|
— |
|
|
|
(
|
) |
|
|
(
|
) |
|
|
— |
|
|
|
— |
|
|
|
— |
|
|
|
— |
|
|
|
(
|
) |
|
|
(
|
) |
|
|
— |
|
|
|
(
|
) |
|
Other |
|
|
— |
|
|
|
— |
|
|
|
— |
|
|
|
— |
|
|
|
— |
|
|
|
— |
|
|
|
— |
|
|
|
(
|
) |
|
|
(
|
) |
|
|
— |
|
|
|
(
|
) |
|
Balance at
|
|
|
|
|
|
|
(
|
) |
|
|
|
|
|
$ |
|
|
|
$ |
|
|
|
$ |
|
|
|
$ |
|
|
|
$ |
(
|
) |
|
$ |
|
|
|
$ |
— |
|
|
$ |
|
|
|
|
|
|
|
|
|
|
|
|
|
|
|
|
|
|
|
|
|
|
|
|
|
|
|
|
|
|
|
|
|
|
|
|
|
|||||||||||
|
Balance at
|
|
|
|
|
|
|
(
|
) |
|
|
|
|
|
$ |
|
|
|
$ |
|
|
|
$ |
|
|
|
$ |
|
|
|
$ |
(
|
) |
|
$ |
|
|
|
$ |
— |
|
|
$ |
|
|
|
Comprehensive income (loss): |
|
|
|
|
|
|
|
|
|
|
|
|
|
|
|
|
|
|
|
|
|
|
|
|
|
|
|
|
|
|
|
|
|
|||||||||||
|
Net income |
|
|
— |
|
|
|
— |
|
|
|
— |
|
|
|
— |
|
|
|
— |
|
|
|
— |
|
|
|
|
|
|
|
— |
|
|
|
|
|
|
|
— |
|
|
|
|
|
|
Other comprehensive
|
|
|
— |
|
|
|
— |
|
|
|
— |
|
|
|
— |
|
|
|
— |
|
|
|
(
|
) |
|
|
— |
|
|
|
— |
|
|
|
(
|
) |
|
|
— |
|
|
|
(
|
) |
|
Total comprehensive income
|
|
|
— |
|
|
|
— |
|
|
|
— |
|
|
|
— |
|
|
|
— |
|
|
|
— |
|
|
|
— |
|
|
|
— |
|
|
|
|
|
|
|
— |
|
|
|
|
|
|
Cash dividends: |
|
|
— |
|
|
|
|
|
|
|
|
|
|
|
|
|
|
|
|
|
|
|
|
|
|
|
|
|
|
|
|
|
|
|
||||||||||
|
Common stock ($
|
|
|
— |
|
|
|
— |
|
|
|
— |
|
|
|
— |
|
|
|
— |
|
|
|
— |
|
|
|
(
|
) |
|
|
— |
|
|
|
(
|
) |
|
|
— |
|
|
|
(
|
) |
|
Dividend equivalent units
|
|
|
— |
|
|
|
— |
|
|
|
— |
|
|
|
— |
|
|
|
— |
|
|
|
— |
|
|
|
(
|
) |
|
|
— |
|
|
|
(
|
) |
|
|
— |
|
|
|
(
|
) |
|
Issuance of common shares |
|
|
|
|
|
|
— |
|
|
|
|
|
|
|
— |
|
|
|
|
|
|
|
— |
|
|
|
— |
|
|
|
— |
|
|
|
|
|
|
|
— |
|
|
|
|
|
|
Stock-based compensation
|
|
|
— |
|
|
|
— |
|
|
|
— |
|
|
|
— |
|
|
|
|
|
|
|
— |
|
|
|
— |
|
|
|
— |
|
|
|
|
|
|
|
— |
|
|
|
|
|
|
Common stock repurchased |
|
|
— |
|
|
|
(
|
) |
|
|
(
|
) |
|
|
— |
|
|
|
— |
|
|
|
— |
|
|
|
— |
|
|
|
(
|
) |
|
|
(
|
) |
|
|
— |
|
|
|
(
|
) |
|
Shares repurchased related
|
|
|
— |
|
|
|
(
|
) |
|
|
(
|
) |
|
|
— |
|
|
|
— |
|
|
|
— |
|
|
|
— |
|
|
|
(
|
) |
|
|
(
|
) |
|
|
— |
|
|
|
(
|
) |
|
Other |
|
|
— |
|
|
|
— |
|
|
|
— |
|
|
|
— |
|
|
|
— |
|
|
|
— |
|
|
|
— |
|
|
|
— |
|
|
|
— |
|
|
|
— |
|
|
|
— |
|
|
Balance at
|
|
|
|
|
|
|
(
|
) |
|
|
|
|
|
$ |
|
|
|
$ |
|
|
|
$ |
|
|
|
$ |
|
|
|
$ |
(
|
) |
|
$ |
|
|
|
$ |
— |
|
|
$ |
|
|
See accompanying notes to consolidated financial statements.
45
NAVIENT CORPORATION
CONSOLIDATED STATEMENTS OF CASH FLOWS
(In millions)
(Unaudited)
|
|
|
Three Months Ended March 31, |
|
|||||
|
|
|
2024 |
|
|
2023 |
|
||
|
Cash flows from operating activities |
|
|
|
|
|
|
||
|
Net income |
|
$ |
|
|
|
$ |
|
|
|
Adjustments to reconcile net income to net cash provided by operating activities: |
|
|
|
|
|
|
||
|
Goodwill and acquired intangible asset impairment and amortization expense |
|
|
|
|
|
|
|
|
|
Stock-based compensation expense |
|
|
|
|
|
|
|
|
|
Mark-to-market (gains) losses on derivative and hedging activities, net |
|
|
(
|
) |
|
|
|
|
|
Provisions for loan losses |
|
|
|
|
|
|
(
|
) |
|
Decrease (increase) in accrued interest receivable |
|
|
|
|
|
|
(
|
) |
|
Decrease in accrued interest payable |
|
|
(
|
) |
|
|
(
|
) |
|
Decrease in other assets |
|
|
|
|
|
|
|
|
|
Decrease in other liabilities |
|
|
(
|
) |
|
|
(
|
) |
|
Total adjustments |
|
|
|
|
|
|
|
|
|
Net cash provided by operating activities |
|
|
|
|
|
|
|
|
|
Cash flows from investing activities |
|
|
|
|
|
|
||
|
Education loans originated and acquired |
|
|
(
|
) |
|
|
(
|
) |
|
Proceeds from payments on education loans |
|
|
|
|
|
|
|
|
|
Other investing activities, net |
|
|
|
|
|
|
|
|
|
Net cash provided by investing activities |
|
|
|
|
|
|
|
|
|
Cash flows from financing activities |
|
|
|
|
|
|
||
|
Borrowings collateralized by loans in trust - repaid |
|
|
(
|
) |
|
|
(
|
) |
|
Asset-backed commercial paper conduits, net |
|
|
|
|
|
|
|
|
|
Long-term unsecured notes repaid |
|
|
(
|
) |
|
|
(
|
) |
|
Other financing activities, net |
|
|
(
|
) |
|
|
(
|
) |
|
Common stock repurchased |
|
|
(
|
) |
|
|
(
|
) |
|
Common dividends paid |
|
|
(
|
) |
|
|
(
|
) |
|
Net cash used in financing activities |
|
|
(
|
) |
|
|
(
|
) |
|
Net increase (decrease) in cash, cash equivalents, restricted cash and restricted cash equivalents |
|
|
|
|
|
|
(
|
) |
|
Cash, cash equivalents, restricted cash and restricted cash equivalents at beginning of period |
|
|
|
|
|
|
|
|
|
Cash, cash equivalents, restricted cash and restricted cash equivalents at end of period |
|
$ |
|
|
|
$ |
|
|
|
Supplemental disclosure of cash flow information: |
|
|
|
|
|
|
||
|
Cash disbursements made (refunds received) for: |
|
|
|
|
|
|
||
|
Interest paid |
|
$ |
|
|
|
$ |
|
|
|
Income taxes paid |
|
$ |
|
|
|
$ |
|
|
|
Income taxes refunds received |
|
$ |
|
|
|
$ |
(
|
) |
|
Reconciliation of the Consolidated Statements of Cash Flows to the Consolidated
|
|
|
|
|
|
|
||
|
Cash and cash equivalents |
|
$ |
|
|
|
$ |
|
|
|
Restricted cash and restricted cash equivalents |
|
|
|
|
|
|
|
|
|
Total cash, cash equivalents, restricted cash and restricted cash equivalents at end of period |
|
$ |
|
|
|
$ |
|
|
See accompanying notes to consolidated financial statements.
46
NAVIENT CORPORATION
NOTES TO CONSOLIDATED FINANCIAL STATEMENTS
(Information at March 31, 2024 and for the three months ended
March 31, 2024 and 2023 is unaudited)
1. Significant Accounting Policies
Basis of Presentation
The accompanying unaudited, consolidated financial statements of Navient have been prepared in accordance with generally accepted accounting principles in the United States of America (GAAP) for interim financial information. Accordingly, they do not include all of the information and footnotes required by GAAP for complete consolidated financial statements. The consolidated financial statements include the accounts of Navient and its majority-owned and controlled subsidiaries and those Variable Interest Entities (VIEs) for which we are the primary beneficiary, after eliminating the effects of intercompany accounts and transactions. In the opinion of management, all adjustments considered necessary for a fair statement of the results for the interim periods have been included. The preparation of financial statements in conformity with GAAP requires management to make estimates and assumptions that affect the amounts reported in the consolidated financial statements and accompanying notes. Actual results could differ from those estimates. Operating results for the three months ended March 31, 2024 are not necessarily indicative of the results for the year ending December 31, 2024 or for any other period. These unaudited financial statements should be read in conjunction with the audited financial statements and related notes included in our 2023 Form 10-K. Definitions for certain capitalized terms used but not otherwise defined in this Form 10-Q can be found in our 2023 Form 10-K.
Recently Issued Accounting Pronouncements
Segment Reporting
In November 2023, the Financial Accounting Standards Board (FASB) issued ASU No. 2023-07, “Segment Reporting – Improvements to Reportable Segment Disclosures,” which requires expanded disclosures regarding significant segment expenses for each reportable segment. Significant segment expenses include expenses that are regularly provided to the chief operating decision maker (CODM) and included in each reported measure of segment profit or loss. The ASU also requires disclosure of the CODM’s title and position and permits companies to disclose multiple segment profit or loss measures if the CODM uses these measures to allocate resources and assess segment performance. Companies must reconcile each measure of profit or loss quarterly to the consolidated income statement. This guidance became effective beginning after January 1, 2024, for fiscal years, and beginning after January 1, 2025, for interim periods. The Company continues to assess the impact of the reportable segment disclosure requirements.
47
NAVIENT CORPORATION
NOTES TO CONSOLIDATED FINANCIAL STATEMENTS
(Information at March 31, 2024 and for the three months ended
March 31, 2024 and 2023 is unaudited)
2. Allowance for Loan Losses
Allowance for Loan Losses Roll Forward
|
|
|
Three Months Ended March 31, 2024 |
|
|||||||||
|
(Dollars in millions) |
|
FFELP
|
|
|
Private
|
|
|
Total |
|
|||
|
Beginning balance |
|
$ |
|
|
|
$ |
|
|
|
$ |
|
|
|
Total provision |
|
|
|
|
|
|
|
|
|
|
|
|
|
Charge-offs: |
|
|
|
|
|
|
|
|
|
|||
|
Gross charge-offs |
|
|
(
|
) |
|
|
(
|
) |
|
|
(
|
) |
|
Expected future recoveries on current period gross charge-offs |
|
|
|
|
|
|
|
|
|
|
|
|
|
Net charge-offs (1)(2) |
|
|
(
|
) |
|
|
(
|
) |
|
|
(
|
) |
|
Decrease in expected future recoveries on previously fully
|
|
|
|
|
|
|
|
|
|
|
|
|
|
Allowance at end of period |
|
$ |
|
|
|
$ |
|
|
|
$ |
|
|
|
Net charge-offs as a percentage of average loans in repayment
|
|
|
|
% |
|
|
|
% |
|
|
|
|
|
Ending total loans |
|
$ |
|
|
|
$ |
|
|
|
|
|
|
|
Average loans in repayment |
|
$ |
|
|
|
$ |
|
|
|
|
|
|
|
Ending loans in repayment |
|
$ |
|
|
|
$ |
|
|
|
|
|
|
|
|
|
Three Months Ended March 31, |
|
|
|
(Dollars in millions) |
|
2024 |
|
|
|
Beginning of period expected future recoveries on previously fully charged-off loans |
|
$ |
|
|
|
Expected future recoveries of current period defaults |
|
|
|
|
|
Recoveries (cash collected) |
|
|
(
|
) |
|
Charge-offs (as a result of lower recovery expectations) |
|
|
(
|
) |
|
End of period expected future recoveries on previously fully charged-off loans |
|
$ |
|
|
|
Change in balance during period |
|
$ |
(
|
) |
48
NAVIENT CORPORATION
NOTES TO CONSOLIDATED FINANCIAL STATEMENTS
(Information at March 31, 2024 and for the three months ended
March 31, 2024 and 2023 is unaudited)
2. Allowance for Loan Losses (Continued)
|
|
|
Three Months Ended March 31, 2023 |
|
|||||||||
|
(Dollars in millions) |
|
FFELP Loans |
|
|
Private Education Loans |
|
|
Total |
|
|||
|
Beginning balance |
|
$ |
|
|
|
$ |
|
|
|
$ |
|
|
|
Total provision |
|
|
|
|
|
|
(
|
) |
|
|
(
|
) |
|
Charge-offs: |
|
|
|
|
|
|
|
|
|
|||
|
Gross charge-offs |
|
|
(
|
) |
|
|
(
|
) |
|
|
(
|
) |
|
Expected future recoveries on current period gross charge-offs |
|
|
|
|
|
|
|
|
|
|
|
|
|
Net charge-offs (1) |
|
|
(
|
) |
|
|
(
|
) |
|
|
(
|
) |
|
Decrease in expected future recoveries on previously fully
|
|
|
|
|
|
|
|
|
|
|
|
|
|
Allowance at end of period |
|
$ |
|
|
|
$ |
|
|
|
$ |
|
|
|
Net charge-offs as a percentage of average loans in repayment
|
|
|
|
% |
|
|
|
% |
|
|
|
|
|
Ending total loans |
|
$ |
|
|
|
$ |
|
|
|
|
|
|
|
Average loans in repayment |
|
$ |
|
|
|
$ |
|
|
|
|
|
|
|
Ending loans in repayment |
|
$ |
|
|
|
$ |
|
|
|
|
|
|
|
|
|
Three Months Ended March 31, |
|
|
|
(Dollars in millions) |
|
2023 |
|
|
|
Beginning of period expected future recoveries on previously fully charged-off loans |
|
$ |
|
|
|
Expected future recoveries of current period defaults |
|
|
|
|
|
Recoveries (cash collected) |
|
|
(
|
) |
|
Charge-offs (as a result of lower recovery expectations) |
|
|
(
|
) |
|
End of period expected future recoveries on previously fully charged-off loans |
|
$ |
|
|
|
Change in balance during period |
|
$ |
(
|
) |
49
NAVIENT CORPORATION
NOTES TO CONSOLIDATED FINANCIAL STATEMENTS
(Information at March 31, 2024 and for the three months ended
March 31, 2024 and 2023 is unaudited)
2. Allowance for Loan Losses (Continued)
Key Credit Quality Indicators
We assess and determine the collectability of our education loan portfolios by evaluating certain risk characteristics we refer to as key credit quality indicators. Key credit quality indicators are incorporated into the allowance for loan losses calculation.
FFELP Loans
FFELP Loans are substantially insured and guaranteed as to their principal and accrued interest in the event of default. The key credit quality indicators are loan status and loan type.
|
|
|
FFELP Loan Delinquencies |
|
|||||||||||||||||||||
|
|
|
March 31, 2024 |
|
|
December 31, 2023 |
|
|
March 31, 2023 |
|
|||||||||||||||
|
(Dollars in millions) |
|
Balance |
|
|
% |
|
|
Balance |
|
|
% |
|
|
Balance |
|
|
% |
|
||||||
|
Loans in-school/grace/deferment (1) |
|
$ |
|
|
|
|
|
|
$ |
|
|
|
|
|
|
$ |
|
|
|
|
|
|||
|
Loans in forbearance (2) |
|
|
|
|
|
|
|
|
|
|
|
|
|
|
|
|
|
|
|
|
|
|||
|
Loans in repayment and percentage of each status: |
|
|
|
|
|
|
|
|
|
|
|
|
|
|
|
|
|
|
||||||
|
Loans current |
|
|
|
|
|
|
|
% |
|
|
|
|
|
|
|
% |
|
|
|
|
|
|
|
% |
|
Loans delinquent 31-60 days (3) |
|
|
|
|
|
|
|
|
|
|
|
|
|
|
|
|
|
|
|
|
|
|
|
|
|
Loans delinquent 61-90 days (3) |
|
|
|
|
|
|
|
|
|
|
|
|
|
|
|
|
|
|
|
|
|
|
|
|
|
Loans delinquent greater than 90 days (3) |
|
|
|
|
|
|
|
|
|
|
|
|
|
|
|
|
|
|
|
|
|
|
|
|
|
Total FFELP Loans in repayment |
|
|
|
|
|
|
|
% |
|
|
|
|
|
|
|
% |
|
|
|
|
|
|
|
% |
|
Total FFELP Loans |
|
|
|
|
|
|
|
|
|
|
|
|
|
|
|
|
|
|
|
|
|
|||
|
FFELP Loan allowance for losses |
|
|
(
|
) |
|
|
|
|
|
(
|
) |
|
|
|
|
|
(
|
) |
|
|
|
|||
|
FFELP Loans, net |
|
$ |
|
|
|
|
|
|
$ |
|
|
|
|
|
|
$ |
|
|
|
|
|
|||
|
Percentage of FFELP Loans in repayment |
|
|
|
|
|
|
% |
|
|
|
|
|
|
% |
|
|
|
|
|
|
% |
|||
|
Delinquencies as a percentage of FFELP Loans in
|
|
|
|
|
|
|
% |
|
|
|
|
|
|
% |
|
|
|
|
|
|
% |
|||
|
FFELP Loans in forbearance as a percentage of
|
|
|
|
|
|
|
% |
|
|
|
|
|
|
% |
|
|
|
|
|
|
% |
|||
|
(Dollars in millions) |
|
March 31, 2024 |
|
|
March 31, 2023 |
|
|
Change |
|
|||
|
Stafford Loans |
|
$ |
|
|
|
$ |
|
|
|
$ |
(
|
) |
|
Consolidation Loans |
|
|
|
|
|
|
|
|
|
|
(
|
) |
|
Rehab Loans |
|
|
|
|
|
|
|
|
|
|
(
|
) |
|
Total loans, gross |
|
$ |
|
|
|
$ |
|
|
|
$ |
(
|
) |
50
NAVIENT CORPORATION
NOTES TO CONSOLIDATED FINANCIAL STATEMENTS
(Information at March 31, 2024 and for the three months ended
March 31, 2024 and 2023 is unaudited)
2. Allowance for Loan Losses (Continued)
Private Education Loans
The key credit quality indicators are credit scores (FICO scores), loan status, loan seasoning, certain loan modifications, the existence of a cosigner and school type. The FICO score is the higher of the borrower or co-borrower score and is updated at least every six months while school type is assessed at origination. The other Private Education Loan key quality indicators are updated quarterly.
|
|
|
Private Education Loan Credit Quality Indicators by Origination Year |
|
|||||||||||||||||||||||||||||
|
|
|
March 31, 2024 |
|
|||||||||||||||||||||||||||||
|
(Dollars in millions) |
|
2024 |
|
|
2023 |
|
|
2022 |
|
|
2021 |
|
|
2020 |
|
|
Prior |
|
|
Total |
|
|
% of Total |
|
||||||||
|
Credit Quality
|
|
|
|
|
|
|
|
|
|
|
|
|
|
|
|
|
|
|
|
|
|
|
|
|
||||||||
|
FICO Scores: |
|
|
|
|
|
|
|
|
|
|
|
|
|
|
|
|
|
|
|
|
|
|
|
|
||||||||
|
640 and above |
|
$ |
|
|
|
$ |
|
|
|
$ |
|
|
|
$ |
|
|
|
$ |
|
|
|
$ |
|
|
|
$ |
|
|
|
|
|
% |
|
Below 640 |
|
|
|
|
|
|
|
|
|
|
|
|
|
|
|
|
|
|
|
|
|
|
|
|
|
|
|
|
|
|
|
|
|
Total |
|
$ |
|
|
|
$ |
|
|
|
$ |
|
|
|
$ |
|
|
|
$ |
|
|
|
$ |
|
|
|
$ |
|
|
|
|
|
% |
|
Loan Status: |
|
|
|
|
|
|
|
|
|
|
|
|
|
|
|
|
|
|
|
|
|
|
|
|
||||||||
|
In-school/grace/
|
|
$ |
|
|
|
$ |
|
|
|
$ |
|
|
|
$ |
|
|
|
$ |
|
|
|
$ |
|
|
|
$ |
|
|
|
|
|
% |
|
Current/90 days or
|
|
|
|
|
|
|
|
|
|
|
|
|
|
|
|
|
|
|
|
|
|
|
|
|
|
|
|
|
|
|
|
|
|
Greater than 90 days
|
|
|
|
|
|
|
|
|
|
|
|
|
|
|
|
|
|
|
|
|
|
|
|
|
|
|
|
|
|
|
|
|
|
Total |
|
$ |
|
|
|
$ |
|
|
|
$ |
|
|
|
$ |
|
|
|
$ |
|
|
|
$ |
|
|
|
$ |
|
|
|
|
|
% |
|
Seasoning (1) : |
|
|
|
|
|
|
|
|
|
|
|
|
|
|
|
|
|
|
|
|
|
|
|
|
||||||||
|
1-12 payments |
|
$ |
|
|
|
$ |
|
|
|
$ |
|
|
|
$ |
|
|
|
$ |
|
|
|
$ |
|
|
|
$ |
|
|
|
|
|
% |
|
13-24 payments |
|
|
|
|
|
|
|
|
|
|
|
|
|
|
|
|
|
|
|
|
|
|
|
|
|
|
|
|
|
|
|
|
|
25-36 payments |
|
|
|
|
|
|
|
|
|
|
|
|
|
|
|
|
|
|
|
|
|
|
|
|
|
|
|
|
|
|
|
|
|
37-48 payments |
|
|
|
|
|
|
|
|
|
|
|
|
|
|
|
|
|
|
|
|
|
|
|
|
|
|
|
|
|
|
|
|
|
More than 48
|
|
|
|
|
|
|
|
|
|
|
|
|
|
|
|
|
|
|
|
|
|
|
|
|
|
|
|
|
|
|
|
|
|
Loans in-school/
|
|
|
|
|
|
|
|
|
|
|
|
|
|
|
|
|
|
|
|
|
|
|
|
|
|
|
|
|
|
|
|
|
|
Total |
|
$ |
|
|
|
$ |
|
|
|
$ |
|
|
|
$ |
|
|
|
$ |
|
|
|
$ |
|
|
|
$ |
|
|
|
|
|
% |
|
Certain Loan
|
|
|
|
|
|
|
|
|
|
|
|
|
|
|
|
|
|
|
|
|
|
|
|
|
||||||||
|
Modified |
|
$ |
|
|
|
$ |
|
|
|
$ |
|
|
|
$ |
|
|
|
$ |
|
|
|
$ |
|
|
|
$ |
|
|
|
|
|
% |
|
Non-Modified |
|
|
|
|
|
|
|
|
|
|
|
|
|
|
|
|
|
|
|
|
|
|
|
|
|
|
|
|
|
|
|
|
|
Total |
|
$ |
|
|
|
$ |
|
|
|
$ |
|
|
|
$ |
|
|
|
$ |
|
|
|
$ |
|
|
|
$ |
|
|
|
|
|
% |
|
Cosigners: |
|
|
|
|
|
|
|
|
|
|
|
|
|
|
|
|
|
|
|
|
|
|
|
|
||||||||
|
With cosigner (3) |
|
$ |
|
|
|
$ |
|
|
|
$ |
|
|
|
$ |
|
|
|
$ |
|
|
|
$ |
|
|
|
$ |
|
|
|
|
|
% |
|
Without cosigner |
|
|
|
|
|
|
|
|
|
|
|
|
|
|
|
|
|
|
|
|
|
|
|
|
|
|
|
|
|
|
|
|
|
Total |
|
$ |
|
|
|
$ |
|
|
|
$ |
|
|
|
$ |
|
|
|
$ |
|
|
|
$ |
|
|
|
$ |
|
|
|
|
|
% |
|
School Type: |
|
|
|
|
|
|
|
|
|
|
|
|
|
|
|
|
|
|
|
|
|
|
|
|
||||||||
|
Not-for-profit |
|
$ |
|
|
|
$ |
|
|
|
$ |
|
|
|
$ |
|
|
|
$ |
|
|
|
$ |
|
|
|
$ |
|
|
|
|
|
% |
|
For-profit |
|
|
|
|
|
|
|
|
|
|
|
|
|
|
|
|
|
|
|
|
|
|
|
|
|
|
|
|
|
|
|
|
|
Total |
|
$ |
|
|
|
$ |
|
|
|
$ |
|
|
|
$ |
|
|
|
$ |
|
|
|
$ |
|
|
|
$ |
|
|
|
|
|
% |
|
Allowance for loan
|
|
|
|
|
|
|
|
|
|
|
|
|
|
|
|
|
|
|
|
|
(
|
) |
|
|
|
|||||||
|
Total loans, net |
|
|
|
|
|
|
|
|
|
|
|
|
|
|
|
|
|
|
|
$ |
|
|
|
|
|
|||||||
|
|
|
|
|
|
|
|
|
|
|
|
|
|
|
|
|
|
|
|
|
|
|
|
|
|
||||||||
|
Charge-Offs |
|
$ |
|
|
|
$ |
(
|
) |
|
$ |
(
|
) |
|
$ |
(
|
) |
|
$ |
(
|
) |
|
$ |
(
|
) |
|
$ |
(
|
) |
|
|
|
% |
51
NAVIENT CORPORATION
NOTES TO CONSOLIDATED FINANCIAL STATEMENTS
(Information at March 31, 2024 and for the three months ended
March 31, 2024 and 2023 is unaudited)
2. Allowance for Loan Losses (Continued)
|
|
|
Private Education Loan Credit Quality Indicators by Origination Year |
|
|||||||||||||||||||||||||||||
|
|
|
March 31, 2023 |
|
|||||||||||||||||||||||||||||
|
(Dollars in millions) |
|
2023 |
|
|
2022 |
|
|
2021 |
|
|
2020 |
|
|
2019 |
|
|
Prior |
|
|
Total |
|
|
% of Total |
|
||||||||
|
Credit Quality
|
|
|
|
|
|
|
|
|
|
|
|
|
|
|
|
|
|
|
|
|
|
|
|
|
||||||||
|
FICO Scores: |
|
|
|
|
|
|
|
|
|
|
|
|
|
|
|
|
|
|
|
|
|
|
|
|
||||||||
|
640 and above |
|
$ |
|
|
|
$ |
|
|
|
$ |
|
|
|
$ |
|
|
|
$ |
|
|
|
$ |
|
|
|
$ |
|
|
|
|
|
% |
|
Below 640 |
|
|
|
|
|
|
|
|
|
|
|
|
|
|
|
|
|
|
|
|
|
|
|
|
|
|
|
|
|
|
|
|
|
Total |
|
$ |
|
|
|
$ |
|
|
|
$ |
|
|
|
$ |
|
|
|
$ |
|
|
|
$ |
|
|
|
$ |
|
|
|
|
|
% |
|
Loan Status: |
|
|
|
|
|
|
|
|
|
|
|
|
|
|
|
|
|
|
|
|
|
|
|
|
||||||||
|
In-school/grace/
|
|
$ |
|
|
|
$ |
|
|
|
$ |
|
|
|
$ |
|
|
|
$ |
|
|
|
$ |
|
|
|
$ |
|
|
|
|
|
% |
|
Current/90 days or
|
|
|
|
|
|
|
|
|
|
|
|
|
|
|
|
|
|
|
|
|
|
|
|
|
|
|
|
|
|
|
|
|
|
Greater than 90 days
|
|
|
|
|
|
|
|
|
|
|
|
|
|
|
|
|
|
|
|
|
|
|
|
|
|
|
|
|
|
|
|
|
|
Total |
|
$ |
|
|
|
$ |
|
|
|
$ |
|
|
|
$ |
|
|
|
$ |
|
|
|
$ |
|
|
|
$ |
|
|
|
|
|
% |
|
Seasoning (1) : |
|
|
|
|
|
|
|
|
|
|
|
|
|
|
|
|
|
|
|
|
|
|
|
|
||||||||
|
1-12 payments |
|
$ |
|
|
|
$ |
|
|
|
$ |
|
|
|
$ |
|
|
|
$ |
|
|
|
$ |
|
|
|
$ |
|
|
|
|
|
% |
|
13-24 payments |
|
|
|
|
|
|
|
|
|
|
|
|
|
|
|
|
|
|
|
|
|
|
|
|
|
|
|
|
|
|
|
|
|
25-36 payments |
|
|
|
|
|
|
|
|
|
|
|
|
|
|
|
|
|
|
|
|
|
|
|
|
|
|
|
|
|
|
|
|
|
37-48 payments |
|
|
|
|
|
|
|
|
|
|
|
|
|
|
|
|
|
|
|
|
|
|
|
|
|
|
|
|
|
|
|
|
|
More than 48
|
|
|
|
|
|
|
|
|
|
|
|
|
|
|
|
|
|
|
|
|
|
|
|
|
|
|
|
|
|
|
|
|
|
Loans in-school/
|
|
|
|
|
|
|
|
|
|
|
|
|
|
|
|
|
|
|
|
|
|
|
|
|
|
|
|
|
|
|
|
|
|
Total |
|
$ |
|
|
|
$ |
|
|
|
$ |
|
|
|
$ |
|
|
|
$ |
|
|
|
$ |
|
|
|
$ |
|
|
|
|
|
% |
|
Certain Loan
|
|
|
|
|
|
|
|
|
|
|
|
|
|
|
|
|
|
|
|
|
|
|
|
|
||||||||
|
Modified |
|
$ |
|
|
|
$ |
|
|
|
$ |
|
|
|
$ |
|
|
|
$ |
|
|
|
$ |
|
|
|
$ |
|
|
|
|
|
% |
|
Non-Modified |
|
|
|
|
|
|
|
|
|
|
|
|
|
|
|
|
|
|
|
|
|
|
|
|
|
|
|
|
|
|
|
|
|
Total |
|
$ |
|
|
|
$ |
|
|
|
$ |
|
|
|
$ |
|
|
|
$ |
|
|
|
$ |
|
|
|
$ |
|
|
|
|
|
% |
|
Cosigners: |
|
|
|
|
|
|
|
|
|
|
|
|
|
|
|
|
|
|
|
|
|
|
|
|
||||||||
|
With cosigner (3) |
|
$ |
|
|
|
$ |
|
|
|
$ |
|
|
|
$ |
|
|
|
$ |
|
|
|
$ |
|
|
|
$ |
|
|
|
|
|
% |
|
Without cosigner |
|
|
|
|
|
|
|
|
|
|
|
|
|
|
|
|
|
|
|
|
|
|
|
|
|
|
|
|
|
|
|
|
|
Total |
|
$ |
|
|
|
$ |
|
|
|
$ |
|
|
|
$ |
|
|
|
$ |
|
|
|
$ |
|
|
|
$ |
|
|
|
|
|
% |
|
School Type: |
|
|
|
|
|
|
|
|
|
|
|
|
|
|
|
|
|
|
|
|
|
|
|
|
||||||||
|
Not-for-profit |
|
$ |
|
|
|
$ |
|
|
|
$ |
|
|
|
$ |
|
|
|
$ |
|
|
|
$ |
|
|
|
$ |
|
|
|
|
|
% |
|
For-profit |
|
|
|
|
|
|
|
|
|
|
|
|
|
|
|
|
|
|
|
|
|
|
|
|
|
|
|
|
|
|
|
|
|
Total |
|
$ |
|
|
|
$ |
|
|
|
$ |
|
|
|
$ |
|
|
|
$ |
|
|
|
$ |
|
|
|
$ |
|
|
|
|
|
% |
|
Allowance for loan
|
|
|
|
|
|
|
|
|
|
|
|
|
|
|
|
|
|
|
|
|
(
|
) |
|
|
|
|||||||
|
Total loans, net |
|
|
|
|
|
|
|
|
|
|
|
|
|
|
|
|
|
|
|
$ |
|
|
|
|
|
|||||||
|
|
|
|
|
|
|
|
|
|
|
|
|
|
|
|
|
|
|
|
|
|
|
|
|
|
||||||||
|
Charge-Offs |
|
$ |
|
|
|
$ |
(
|
) |
|
$ |
(
|
) |
|
$ |
(
|
) |
|
$ |
(
|
) |
|
$ |
(
|
) |
|
$ |
(
|
) |
|
|
|
% |
52
NAVIENT CORPORATION
NOTES TO CONSOLIDATED FINANCIAL STATEMENTS
(Information at March 31, 2024 and for the three months ended
March 31, 2024 and 2023 is unaudited)
2. Allowance for Loan Losses (Continued)
|
|
|
Private Education Loan Delinquencies |
|
|||||||||||||||||||||
|
|
|
March 31, 2024 |
|
|
December 31, 2023 |
|
|
March 31, 2023 |
|
|||||||||||||||
|
(Dollars in millions) |
|
Balance |
|
|
% |
|
|
Balance |
|
|
% |
|
|
Balance |
|
|
% |
|
||||||
|
Loans in-school/grace/deferment (1) |
|
$ |
|
|
|
|
|
|
$ |
|
|
|
|
|
|
$ |
|
|
|
|
|
|||
|
Loans in forbearance (2) |
|
|
|
|
|
|
|
|
|
|
|
|
|
|
|
|
|
|
|
|
|
|||
|
Loans in repayment and percentage of each status: |
|
|
|
|
|
|
|
|
|
|
|
|
|
|
|
|
|
|
||||||
|
Loans current |
|
|
|
|
|
|
|
% |
|
|
|
|
|
|
|
% |
|
|
|
|
|
|
|
% |
|
Loans delinquent 31-60 days (3) |
|
|
|
|
|
|
|
|
|
|
|
|
|
|
|
|
|
|
|
|
|
|
|
|
|
Loans delinquent 61-90 days (3) |
|
|
|
|
|
|
|
|
|
|
|
|
|
|
|
|
|
|
|
|
|
|
|
|
|
Loans delinquent greater than 90 days (3) |
|
|
|
|
|
|
|
|
|
|
|
|
|
|
|
|
|
|
|
|
|
|
|
|
|
Total loans in repayment |
|
|
|
|
|
|
|
% |
|
|
|
|
|
|
|
% |
|
|
|
|
|
|
|
% |
|
Total loans |
|
|
|
|
|
|
|
|
|
|
|
|
|
|
|
|
|
|
|
|
|
|||
|
Allowance for losses |
|
|
(
|
) |
|
|
|
|
|
(
|
) |
|
|
|
|
|
(
|
) |
|
|
|
|||
|
Loans, net |
|
$ |
|
|
|
|
|
|
$ |
|
|
|
|
|
|
$ |
|
|
|
|
|
|||
|
Percentage of loans in repayment |
|
|
|
|
|
|
% |
|
|
|
|
|
|
% |
|
|
|
|
|
|
% |
|||
|
Delinquencies as a percentage of loans in
|
|
|
|
|
|
|
% |
|
|
|
|
|
|
% |
|
|
|
|
|
|
% |
|||
|
Loans in forbearance as a percentage of
|
|
|
|
|
|
|
% |
|
|
|
|
|
|
% |
|
|
|
|
|
|
% |
|||
53
NAVIENT CORPORATION
NOTES TO CONSOLIDATED FINANCIAL STATEMENTS
(Information at March 31, 2024 and for the three months ended
March 31, 2024 and 2023 is unaudited)
2. Allowance for Loan Losses (Continued)
Loan Modifications to Borrowers Experiencing Financial Difficulty
We adjust the terms of Private Education Loans for certain borrowers when we believe such changes will help our customers better manage their student loan obligations, achieve better outcomes and increase the collectability of the loans. These changes generally take the form of a temporary interest rate reduction, a temporary forbearance of payments, a temporary interest only payment, and a temporary interest rate reduction with a permanent extension of the loan term. The effect of modifications of loans made to borrowers who are experiencing financial difficulty is already included in the allowance for credit losses because of the measurement methodologies used to estimate the allowance. The model design predicts borrowers that will have financial difficulty in the future and require loan modification and increased life of loan default risk.
Under our current forbearance practices, temporary hardship forbearance of payments generally cannot exceed
FFELP Loans are at least
The following tables show the amortized cost basis as of March 31, 2024 and 2023 of the loans to borrowers experiencing financial difficulty that were modified during the respective period.
|
|
|
Three Months Ended March 31, 2024 |
|
|||||||||||||||||||||
|
|
|
Loan Modifications Made to Borrowers Experiencing Financial Difficulty |
|
|||||||||||||||||||||
|
(Dollars in millions) |
|
Interest Rate Reductions (1) |
|
|
More Than an Insignificant Payment Delay (2) |
|
|
Combination Rate Reduction and Term Extension |
|
|||||||||||||||
|
Loan Type |
|
Amortized Cost |
|
|
% of Loan Type |
|
|
Amortized Cost |
|
|
% of Loan Type |
|
|
Amortized Cost |
|
|
% of Loan Type |
|
||||||
|
Private Education
|
|
$ |
|
|
|
|
|
% |
|
$ |
|
|
|
|
|
% |
|
$ |
|
|
|
|
|
% |
|
|
|
|
|
|
|
|
|
|
|
|
|
|
|
|
|
|
|
|
||||||
|
|
|
Three Months Ended March 31, 2023 |
|
|||||||||||||||||||||
|
|
|
Loan Modifications Made to Borrowers Experiencing Financial Difficulty |
|
|||||||||||||||||||||
|
(Dollars in millions) |
|
Interest Rate Reductions (1) |
|
|
More Than an Insignificant Payment Delay (2) |
|
|
Combination Rate Reduction and Term Extension |
|
|||||||||||||||
|
Loan Type |
|
Amortized Cost |
|
|
% of Loan Type |
|
|
Amortized Cost |
|
|
% of Loan Type |
|
|
Amortized Cost |
|
|
% of Loan Type |
|
||||||
|
Private Education
|
|
$ |
|
|
|
|
|
% |
|
$ |
|
|
|
|
|
% |
|
$ |
|
|
|
|
|
% |
54
NAVIENT CORPORATION
NOTES TO CONSOLIDATED FINANCIAL STATEMENTS
(Information at March 31, 2024 and for the three months ended
March 31, 2024 and 2023 is unaudited)
2. Allowance for Loan Losses (Continued)
For those loans modified in the three months ended March 31, 2024 and 2023, the following tables show the impact of such modification.
|
Three Months Ended March 31, 2024 |
|||
|
Loan Type |
Interest Rate Reductions |
More Than an Insignificant Payment Delay |
Combination Rate Reduction and Term Extension |
|
Private Education Loans |
Reduced the weighted average contractual rate from
|
Added an average
|
Added an average
|
|
|
|
|
|
|
Three Months Ended March 31, 2023 |
|||
|
Loan Type |
Interest Rate Reductions |
More Than an Insignificant Payment Delay |
Combination Rate Reduction and Term Extension |
|
Private Education Loans |
Reduced the weighted average contractual rate from
|
Added an average
|
Added an average
|
|
|
|
Three Months Ended March 31, |
|
|||||
|
(Dollars in millions) |
|
2024 |
|
|
2023 |
|
||
|
Modified loans (amortized cost) (1) |
|
$ |
|
|
|
$ |
|
|
|
Payment default (par) |
|
$ |
|
|
|
$ |
|
|
|
Charge-offs (par) |
|
$ |
|
|
|
$ |
|
|
The following table provides the performance and related loan status of Private Education Loans that have been modified during the respective reporting periods.
|
(Dollars in millions) |
|
Payment Status (Amortized Cost) |
|
|||||||||
|
Loan Status |
|
March 31, 2024 |
|
|
December 31, 2023 |
|
|
March 31, 2023 |
|
|||
|
Loans in school/deferment |
|
$ |
|
|
|
$ |
|
|
|
$ |
|
|
|
Loans in forbearance |
|
|
|
|
|
|
|
|
|
|
|
|
|
Loans current |
|
|
|
|
|
|
|
|
|
|
|
|
|
Loans delinquent 31 - 60 days |
|
|
|
|
|
|
|
|
|
|
|
|
|
Loans delinquent 61 - 90 days |
|
|
|
|
|
|
|
|
|
|
|
|
|
Loans delinquent greater than 90 days |
|
|
|
|
|
|
|
|
|
|
|
|
|
Total modified loans |
|
$ |
|
|
|
$ |
|
|
|
$ |
|
|
|
|
|
|
|
|
|
|
|
|
|
|||
55
NAVIENT CORPORATION
NOTES TO CONSOLIDATED FINANCIAL STATEMENTS
(Information at March 31, 2024 and for the three months ended
March 31, 2024 and 2023 is unaudited)
3. Borrowings
The following table summarizes our borrowings.
|
|
|
March 31, 2024 |
|
|
December 31, 2023 |
|
||||||||||||||||||
|
(Dollars in millions) |
|
Short
|
|
|
Long
|
|
|
Total |
|
|
Short
|
|
|
Long
|
|
|
Total |
|
||||||
|
Unsecured borrowings: |
|
|
|
|
|
|
|
|
|
|
|
|
|
|
|
|
|
|
||||||
|
Senior unsecured debt (1) |
|
$ |
|
|
|
$ |
|
|
|
$ |
|
|
|
$ |
|
|
|
$ |
|
|
|
$ |
|
|
|
Total unsecured borrowings |
|
|
|
|
|
|
|
|
|
|
|
|
|
|
|
|
|
|
|
|
|
|
|
|
|
Secured borrowings: |
|
|
|
|
|
|
|
|
|
|
|
|
|
|
|
|
|
|
||||||
|
FFELP Loan securitizations (2)(3) |
|
|
|
|
|
|
|
|
|
|
|
|
|
|
|
|
|
|
|
|
|
|
|
|
|
Private Education Loan securitizations (4) |
|
|
|
|
|
|
|
|
|
|
|
|
|
|
|
|
|
|
|
|
|
|
|
|
|
FFELP Loan ABCP facilities |
|
|
|
|
|
|
|
|
|
|
|
|
|
|
|
|
|
|
|
|
|
|
|
|
|
Private Education Loan ABCP facilities |
|
|
|
|
|
|
|
|
|
|
|
|
|
|
|
|
|
|
|
|
|
|
|
|
|
Other (5) |
|
|
|
|
|
|
|
|
|
|
|
|
|
|
|
|
|
|
|
|
|
|
|
|
|
Total secured borrowings |
|
|
|
|
|
|
|
|
|
|
|
|
|
|
|
|
|
|
|
|
|
|
|
|
|
Total before hedge accounting adjustments |
|
|
|
|
|
|
|
|
|
|
|
|
|
|
|
|
|
|
|
|
|
|
|
|
|
Hedge accounting adjustments |
|
|
(
|
) |
|
|
(
|
) |
|
|
(
|
) |
|
|
(
|
) |
|
|
(
|
) |
|
|
(
|
) |
|
Total |
|
$ |
|
|
|
$ |
|
|
|
$ |
|
|
|
$ |
|
|
|
$ |
|
|
|
$ |
|
|
56
NAVIENT CORPORATION
NOTES TO CONSOLIDATED FINANCIAL STATEMENTS
(Information at March 31, 2024 and for the three months ended
March 31, 2024 and 2023 is unaudited)
3. Borrowings (Continued)
Variable Interest Entities
We consolidated the following financing VIEs as of March 31, 2024 and December 31, 2023, as we are the primary beneficiary. As a result, these VIEs are accounted for as secured borrowings.
|
|
|
March 31, 2024 |
|
|||||||||||||||||||||||||
|
|
|
Debt Outstanding |
|
|
Carrying Amount of Assets Securing
|
|
||||||||||||||||||||||
|
(Dollars in millions) |
|
Short
|
|
|
Long
|
|
|
Total |
|
|
Loans |
|
|
Cash |
|
|
Other
|
|
|
Total |
|
|||||||
|
Secured Borrowings — VIEs: |
|
|
|
|
|
|
|
|
|
|
|
|
|
|
|
|
|
|
|
|
|
|||||||
|
FFELP Loan securitizations |
|
$ |
|
|
|
$ |
|
|
|
$ |
|
|
|
$ |
|
|
|
$ |
|
|
|
$ |
|
|
|
$ |
|
|
|
Private Education Loan securitizations |
|
|
|
|
|
|
|
|
|
|
|
|
|
|
|
|
|
|
|
|
|
|
|
|
|
|
|
|
|
FFELP Loan ABCP facilities |
|
|
|
|
|
|
|
|
|
|
|
|
|
|
|
|
|
|
|
|
|
|
|
|
|
|
|
|
|
Private Education Loan ABCP facilities |
|
|
|
|
|
|
|
|
|
|
|
|
|
|
|
|
|
|
|
|
|
|
|
|
|
|
|
|
|
Total before hedge accounting
|
|
|
|
|
|
|
|
|
|
|
|
|
|
|
|
|
|
|
|
|
|
|
|
|
|
|
|
|
|
Hedge accounting adjustments |
|
|
|
|
|
|
(
|
) |
|
|
(
|
) |
|
|
|
|
|
|
|
|
|
|
(
|
) |
|
|
(
|
) |
|
Total |
|
$ |
|
|
|
$ |
|
|
|
$ |
|
|
|
$ |
|
|
|
$ |
|
|
|
$ |
|
|
|
$ |
|
|
|
|
|
|
|
|
|
|
|
|
|
|
|
|
|
|
|
|
|
|
|
|
|
|||||||
|
|
|
December 31, 2023 |
|
|||||||||||||||||||||||||
|
|
|
Debt Outstanding |
|
|
Carrying Amount of Assets Securing
|
|
||||||||||||||||||||||
|
(Dollars in millions) |
|
Short
|
|
|
Long
|
|
|
Total |
|
|
Loans |
|
|
Cash |
|
|
Other
|
|
|
Total |
|
|||||||
|
Secured Borrowings — VIEs: |
|
|
|
|
|
|
|
|
|
|
|
|
|
|
|
|
|
|
|
|
|
|||||||
|
FFELP Loan securitizations |
|
$ |
|
|
|
$ |
|
|
|
$ |
|
|
|
$ |
|
|
|
$ |
|
|
|
$ |
|
|
|
$ |
|
|
|
Private Education Loan securitizations |
|
|
|
|
|
|
|
|
|
|
|
|
|
|
|
|
|
|
|
|
|
|
|
|
|
|
|
|
|
FFELP Loan ABCP facilities |
|
|
|
|
|
|
|
|
|
|
|
|
|
|
|
|
|
|
|
|
|
|
|
|
|
|
|
|
|
Private Education Loan ABCP facilities |
|
|
|
|
|
|
|
|
|
|
|
|
|
|
|
|
|
|
|
|
|
|
|
|
|
|
|
|
|
Total before hedge accounting
|
|
|
|
|
|
|
|
|
|
|
|
|
|
|
|
|
|
|
|
|
|
|
|
|
|
|
|
|
|
Hedge accounting adjustments |
|
|
|
|
|
|
(
|
) |
|
|
(
|
) |
|
|
|
|
|
|
|
|
|
|
(
|
) |
|
|
(
|
) |
|
Total |
|
$ |
|
|
|
$ |
|
|
|
$ |
|
|
|
$ |
|
|
|
$ |
|
|
|
$ |
|
|
|
$ |
|
|
57
NAVIENT CORPORATION
NOTES TO CONSOLIDATED FINANCIAL STATEMENTS
(Information at March 31, 2024 and for the three months ended
March 31, 2024 and 2023 is unaudited)
4. Derivative Financial Instruments
Summary of Derivative Financial Statement Impact
The following tables summarize the fair values and notional amounts of all derivative instruments and their impact on net income and other comprehensive income.
Impact of Derivatives on Balance Sheet
|
|
|
|
|
Cash Flow |
|
|
Fair Value (3) |
|
|
Trading |
|
|
Total |
|
||||||||||||||||||||
|
(Dollars in millions) |
|
Hedged Risk
|
|
Mar 31, 2024 |
|
|
Dec 31, 2023 |
|
|
Mar 31, 2024 |
|
|
Dec 31, 2023 |
|
|
Mar 31, 2024 |
|
|
Dec 31, 2023 |
|
|
Mar 31, 2024 |
|
|
Dec 31, 2023 |
|
||||||||
|
Fair Values (1) |
|
|
|
|
|
|
|
|
|
|
|
|
|
|
|
|
|
|
|
|
|
|
|
|
|
|
||||||||
|
Derivative Assets: |
|
|
|
|
|
|
|
|
|
|
|
|
|
|
|
|
|
|
|
|
|
|
|
|
|
|
||||||||
|
Interest rate swaps |
|
Interest rate |
|
$ |
|
|
|
$ |
|
|
|
$ |
|
|
|
$ |
|
|
|
$ |
|
|
|
$ |
|
|
|
$ |
|
|
|
$ |
|
|
|
Cross-currency interest rate
|
|
Foreign currency and
|
|
|
|
|
|
|
|
|
|
|
|
|
|
|
|
|
|
|
|
|
|
|
|
|
|
|
|
|
|
|
|
|
|
Total derivative assets (2) |
|
|
|
|
|
|
|
|
|
|
|
|
|
|
|
|
|
|
|
|
|
|
|
|
|
|
|
|
|
|
|
|
|
|
|
Derivative Liabilities: |
|
|
|
|
|
|
|
|
|
|
|
|
|
|
|
|
|
|
|
|
|
|
|
|
|
|
||||||||
|
Interest rate swaps |
|
Interest rate |
|
|
|
|
|
|
|
|
|
|
|
|
|
|
|
|
|
|
(
|
) |
|
|
(
|
) |
|
|
(
|
) |
|
|
(
|
) |
|
Floor Income Contracts |
|
Interest rate |
|
|
|
|
|
|
|
|
|
|
|
|
|
|
|
|
|
|
|
|
|
|
|
|
|
|
|
|
|
|
|
|
|
Cross-currency interest rate
|
|
Foreign currency and
|
|
|
|
|
|
|
|
|
|
|
(
|
) |
|
|
(
|
) |
|
|
|
|
|
|
|
|
|
|
(
|
) |
|
|
(
|
) |
|
Total derivative liabilities (2) |
|
|
|
|
|
|
|
|
|
|
|
|
(
|
) |
|
|
(
|
) |
|
|
(
|
) |
|
|
(
|
) |
|
|
(
|
) |
|
|
(
|
) |
|
Net total derivatives |
|
|
|
$ |
|
|
|
$ |
|
|
|
$ |
(
|
) |
|
$ |
(
|
) |
|
$ |
(
|
) |
|
$ |
(
|
) |
|
$ |
(
|
) |
|
$ |
(
|
) |
|
|
|
Other Assets |
|
|
Other Liabilities |
|
||||||||||
|
(Dollar in millions) |
|
March 31, 2024 |
|
|
December 31, 2023 |
|
|
March 31, 2024 |
|
|
December 31, 2023 |
|
||||
|
Gross position |
|
$ |
|
|
|
$ |
|
|
|
$ |
(
|
) |
|
$ |
(
|
) |
|
Impact of master netting agreements |
|
|
|
|
|
|
|
|
|
|
|
|
|
|
|
|
|
with impact of master netting
|
|
|
|
|
|
|
|
|
|
|
(
|
) |
|
|
(
|
) |
|
Cash collateral (held) pledged |
|
|
(
|
) |
|
|
(
|
) |
|
|
|
|
|
|
|
|
|
Net position |
|
$ |
|
|
|
$ |
(
|
) |
|
$ |
(
|
) |
|
$ |
(
|
) |
|
|
|
As of March 31, 2024 |
|
|
As of December 31, 2023 |
|
||||||||||
|
(Dollar in millions) |
|
Carrying
|
|
|
Hedge Basis Adjustments |
|
|
Carrying
|
|
|
Hedge Basis Adjustments |
|
||||
|
Short-term borrowings |
|
$ |
|
|
|
$ |
(
|
) |
|
$ |
|
|
|
$ |
(
|
) |
|
Long-term borrowings |
|
$ |
|
|
|
$ |
(
|
) |
|
$ |
|
|
|
$ |
(
|
) |
58
NAVIENT CORPORATION
NOTES TO CONSOLIDATED FINANCIAL STATEMENTS
(Information at March 31, 2024 and for the three months ended
March 31, 2024 and 2023 is unaudited)
4. Derivative Financial Instruments (Continued)
The above fair values include adjustments when necessary for counterparty credit risk for both when we are exposed to the counterparty, net of collateral postings, and when the counterparty is exposed to us, net of collateral postings. The net adjustments decreased the asset position at March 31, 2024
and December 31, 2023 by $
|
|
|
Cash Flow |
|
|
Fair Value |
|
|
Trading |
|
|
Total |
|
||||||||||||||||||||
|
(Dollars in billions) |
|
Mar 31, 2024 |
|
|
Dec 31, 2023 |
|
|
Mar 31, 2024 |
|
|
Dec 31, 2023 |
|
|
Mar 31, 2024 |
|
|
Dec 31, 2023 |
|
|
Mar 31, 2024 |
|
|
Dec 31, 2023 |
|
||||||||
|
Notional Values: |
|
|
|
|
|
|
|
|
|
|
|
|
|
|
|
|
|
|
|
|
|
|
|
|
||||||||
|
Interest rate swaps |
|
$ |
|
|
|
$ |
|
|
|
$ |
|
|
|
$ |
|
|
|
$ |
|
|
|
$ |
|
|
|
$ |
|
|
|
$ |
|
|
|
Floor Income Contracts |
|
|
|
|
|
|
|
|
|
|
|
|
|
|
|
|
|
|
|
|
|
|
|
|
|
|
|
|
|
|
|
|
|
Cross-currency interest rate swaps |
|
|
|
|
|
|
|
|
|
|
|
|
|
|
|
|
|
|
|
|
|
|
|
|
|
|
|
|
|
|
|
|
|
Total derivatives |
|
$ |
|
|
|
$ |
|
|
|
$ |
|
|
|
$ |
|
|
|
$ |
|
|
|
$ |
|
|
|
$ |
|
|
|
$ |
|
|
Mark-to-Market Impact of Derivatives on Statements of Income
|
|
|
Total Gains (Losses) |
|
|||||
|
|
|
Three Months Ended March 31, |
|
|||||
|
(Dollars in millions) |
|
2024 |
|
|
2023 |
|
||
|
Fair Value Hedges: |
|
|
|
|
|
|
||
|
Interest Rate Swaps |
|
|
|
|
|
|
||
|
Gains (losses) recognized in net income on derivatives |
|
$ |
(
|
) |
|
$ |
|
|
|
Gains (losses) recognized in net income on hedged items |
|
|
|
|
|
|
(
|
) |
|
Net fair value hedge ineffectiveness gains (losses) |
|
|
|
|
|
|
(
|
) |
|
Cross currency interest rate swaps |
|
|
|
|
|
|
||
|
Gains (losses) recognized in net income on derivatives |
|
|
(
|
) |
|
|
|
|
|
Gains (losses) recognized in net income on hedged items |
|
|
|
|
|
|
(
|
) |
|
Net fair value hedge ineffectiveness gains (losses) |
|
|
(
|
) |
|
|
(
|
) |
|
Total fair value hedges (1)(2) |
|
|
|
|
|
|
(
|
) |
|
Cash Flow Hedges: |
|
|
|
|
|
|
||
|
Total cash flow hedges (2) |
|
|
|
|
|
|
|
|
|
Trading: |
|
|
|
|
|
|
||
|
Interest rate swaps |
|
|
|
|
|
|
(
|
) |
|
Floor income contracts |
|
|
|
|
|
|
|
|
|
Cross currency interest rate swaps |
|
|
|
|
|
|
|
|
|
Other |
|
|
|
|
|
|
|
|
|
Total trading derivatives (3) |
|
|
|
|
|
|
(
|
) |
|
Mark-to-market gains (losses) recognized |
|
$ |
|
|
|
$ |
(
|
) |
59
NAVIENT CORPORATION
NOTES TO CONSOLIDATED FINANCIAL STATEMENTS
(Information at March 31, 2024 and for the three months ended
March 31, 2024 and 2023 is unaudited)
4. Derivative Financial Instruments (Continued)
Impact of Derivatives on Other Comprehensive Income (Equity)
|
|
|
Three Months Ended March 31, |
|
|||||
|
(Dollars in millions) |
|
2024 |
|
|
2023 |
|
||
|
Total gains (losses) on cash flow hedges |
|
$ |
|
|
|
$ |
(
|
) |
|
Reclassification adjustments for derivative (gains) losses
|
|
|
(
|
) |
|
|
(
|
) |
|
Net changes in cash flow hedges, net of tax |
|
$ |
(
|
) |
|
$ |
(
|
) |
Collateral
The following table details collateral held and pledged related to derivative exposure between us and our derivative counterparties:
|
(Dollars in millions) |
|
March 31, 2024 |
|
|
December 31, 2023 |
|
||
|
Collateral held: |
|
|
|
|
|
|
||
|
Cash (obligation to return cash collateral is recorded in short-term borrowings) |
|
$ |
|
|
|
$ |
|
|
|
Securities at fair value — corporate derivatives (not recorded in financial
|
|
|
|
|
|
|
|
|
|
Securities at fair value — on-balance sheet securitization derivatives (not
|
|
|
|
|
|
|
|
|
|
Total collateral held |
|
$ |
|
|
|
$ |
|
|
|
Derivative asset at fair value including accrued interest |
|
$ |
|
|
|
$ |
|
|
|
Collateral pledged to others: |
|
|
|
|
|
|
||
|
Cash (right to receive return of cash collateral is recorded in investments) |
|
$ |
|
|
|
$ |
|
|
|
Total collateral pledged |
|
$ |
|
|
|
$ |
|
|
|
Derivative liability at fair value including accrued interest and premium
|
|
$ |
|
|
|
$ |
|
|
Our corporate derivatives contain credit contingent features. At our current unsecured credit rating, we have fully collateralized our corporate derivative liability position (including accrued interest and net of premiums receivable) of $
60
NAVIENT CORPORATION
NOTES TO CONSOLIDATED FINANCIAL STATEMENTS
(Information at March 31, 2024 and for the three months ended
March 31, 2024 and 2023 is unaudited)
5. Other Assets
The following table provides the detail of our other assets.
|
(Dollars in millions) |
|
March 31, 2024 |
|
|
December 31, 2023 |
|
||
|
Accrued interest receivable |
|
$ |
|
|
|
$ |
|
|
|
Benefit and insurance-related investments |
|
|
|
|
|
|
|
|
|
Income tax asset, net |
|
|
|
|
|
|
|
|
|
Derivatives at fair value |
|
|
|
|
|
|
|
|
|
Accounts receivable |
|
|
|
|
|
|
|
|
|
Fixed assets |
|
|
|
|
|
|
|
|
|
Other |
|
|
|
|
|
|
|
|
|
Total |
|
$ |
|
|
|
$ |
|
|
61
NAVIENT CORPORATION
NOTES TO CONSOLIDATED FINANCIAL STATEMENTS
(Information at March 31, 2024 and for the three months ended
March 31, 2024 and 2023 is unaudited)
6. Stockholders’ Equity
The following table summarizes common share repurchases, issuances and dividends paid.
|
|
|
Three Months Ended March 31, |
|
|||||
|
(Dollars and shares in millions, except per share amounts) |
|
2024 |
|
|
2023 |
|
||
|
Common stock repurchased (1) |
|
|
|
|
|
|
|
|
|
Common stock repurchased (in dollars) (1) |
|
$ |
|
|
|
$ |
|
|
|
Average purchase price per share (1) |
|
$ |
|
|
|
$ |
|
|
|
Remaining common stock repurchase authority (1) |
|
$ |
|
|
|
$ |
|
|
|
Shares repurchased related to employee stock-based compensation plans (2) |
|
|
|
|
|
|
|
|
|
Average purchase price per share (2) |
|
$ |
|
|
|
$ |
|
|
|
Common shares issued (3) |
|
|
|
|
|
|
|
|
|
Dividends paid |
|
$ |
|
|
|
$ |
|
|
|
Dividends per share |
|
$ |
|
|
|
$ |
|
|
The closing price of our common stock on March 28, 2024
was $
7. Earnings (Loss) per Common Share
Basic earnings (loss) per common share (EPS) are calculated using the weighted average number of shares of common stock outstanding during each period. A reconciliation of the numerators and denominators of the basic and diluted EPS calculations on a GAAP basis follows.
|
|
|
Three Months Ended March 31, |
|
|||||
|
(In millions, except per share data) |
|
2024 |
|
|
2023 |
|
||
|
Numerator: |
|
|
|
|
|
|
||
|
Net income |
|
$ |
|
|
|
$ |
|
|
|
Denominator: |
|
|
|
|
|
|
||
|
Weighted average shares used to compute basic EPS |
|
|
|
|
|
|
|
|
|
Effect of dilutive securities: |
|
|
|
|
|
|
||
|
Dilutive effect of stock options, restricted stock, restricted stock
|
|
|
|
|
|
|
|
|
|
Dilutive potential common shares (2) |
|
|
|
|
|
|
|
|
|
Weighted average shares used to compute diluted EPS |
|
|
|
|
|
|
|
|
|
Basic earnings per common share |
|
$ |
|
|
|
$ |
|
|
|
Diluted earnings per common share |
|
$ |
|
|
|
$ |
|
|
62
NAVIENT CORPORATION
NOTES TO CONSOLIDATED FINANCIAL STATEMENTS
(Information at March 31, 2024 and for the three months ended
March 31, 2024 and 2023 is unaudited)
8. Fair Value Measurements
We use estimates of fair value in applying various accounting standards in our financial statements. We categorize our fair value estimates based on a hierarchical framework associated with three levels of price transparency utilized in measuring financial instruments at fair value. The fair value of the items discussed below are separately disclosed in this footnote.
During the three months ended March 31, 2024, there were no significant transfers of financial instruments between levels, or changes in our methodology used to value our financial instruments.
The following table summarizes the valuation of our financial instruments that are marked-to-market on a recurring basis. During the first-quarters of 2024 and 2023, there were no significant transfers of financial instruments between levels.
|
|
|
Fair Value Measurements on a Recurring Basis |
|
|||||||||||||||||||||||||||||
|
|
|
March 31, 2024 |
|
|
December 31, 2023 |
|
||||||||||||||||||||||||||
|
(Dollars in millions) |
|
Level 1 |
|
|
Level 2 |
|
|
Level 3 |
|
|
Total |
|
|
Level 1 |
|
|
Level 2 |
|
|
Level 3 |
|
|
Total |
|
||||||||
|
Assets |
|
|
|
|
|
|
|
|
|
|
|
|
|
|
|
|
|
|
|
|
|
|
|
|
||||||||
|
Derivative instruments: (1) |
|
|
|
|
|
|
|
|
|
|
|
|
|
|
|
|
|
|
|
|
|
|
|
|
||||||||
|
Interest rate swaps |
|
$ |
|
|
|
$ |
|
|
|
$ |
|
|
|
$ |
|
|
|
$ |
|
|
|
$ |
|
|
|
$ |
|
|
|
$ |
|
|
|
Cross-currency interest rate swaps |
|
|
|
|
|
|
|
|
|
|
|
|
|
|
|
|
|
|
|
|
|
|
|
|
|
|
|
|
|
|
|
|
|
Total derivative assets (2) |
|
|
|
|
|
|
|
|
|
|
|
|
|
|
|
|
|
|
|
|
|
|
|
|
|
|
|
|
|
|
|
|
|
Total |
|
$ |
|
|
|
$ |
|
|
|
$ |
|
|
|
$ |
|
|
|
$ |
|
|
|
$ |
|
|
|
$ |
|
|
|
$ |
|
|
|
Liabilities (3) |
|
|
|
|
|
|
|
|
|
|
|
|
|
|
|
|
|
|
|
|
|
|
|
|
||||||||
|
Derivative instruments (1) |
|
|
|
|
|
|
|
|
|
|
|
|
|
|
|
|
|
|
|
|
|
|
|
|
||||||||
|
Interest rate swaps |
|
$ |
|
|
|
$ |
|
|
|
$ |
(
|
) |
|
$ |
(
|
) |
|
$ |
|
|
|
$ |
|
|
|
$ |
(
|
) |
|
$ |
(
|
) |
|
Floor Income Contracts |
|
|
|
|
|
|
|
|
|
|
|
|
|
|
|
|
|
|
|
|
|
|
|
|
|
|
|
|
|
|
|
|
|
Cross-currency interest rate swaps |
|
|
|
|
|
|
|
|
|
|
(
|
) |
|
|
(
|
) |
|
|
|
|
|
|
|
|
|
|
(
|
) |
|
|
(
|
) |
|
Total derivative liabilities (2) |
|
|
|
|
|
|
|
|
|
|
(
|
) |
|
|
(
|
) |
|
|
|
|
|
|
|
|
|
|
(
|
) |
|
|
(
|
) |
|
Total |
|
$ |
|
|
|
$ |
|
|
|
$ |
(
|
) |
|
$ |
(
|
) |
|
$ |
|
|
|
$ |
|
|
|
$ |
(
|
) |
|
$ |
(
|
) |
63
NAVIENT CORPORATION
NOTES TO CONSOLIDATED FINANCIAL STATEMENTS
(Information at March 31, 2024 and for the three months ended
March 31, 2024 and 2023 is unaudited)
8. Fair Value Measurements (Continued)
The following tables summarize the change in balance sheet carrying value associated with level 3 financial instruments carried at fair value on a recurring basis.
|
|
|
Three Months Ended March 31, |
|
|||||||||||||||||||||||||||||
|
|
|
2024 |
|
|
2023 |
|
||||||||||||||||||||||||||
|
|
|
Derivative instruments |
|
|
Derivative instruments |
|
||||||||||||||||||||||||||
|
(Dollars in millions) |
|
Interest
|
|
|
Cross
|
|
|
Other |
|
|
Total
|
|
|
Interest
|
|
|
Cross
|
|
|
Other |
|
|
Total
|
|
||||||||
|
Balance, beginning of
|
|
$ |
(
|
) |
|
$ |
(
|
) |
|
$ |
|
|
|
$ |
(
|
) |
|
$ |
(
|
) |
|
$ |
(
|
) |
|
$ |
|
|
|
$ |
(
|
) |
|
Total gains/(losses): |
|
|
|
|
|
|
|
|
|
|
|
|
|
|
|
|
|
|
|
|
|
|
|
|
||||||||
|
(1) |
|
|
|
|
|
|
(
|
) |
|
|
|
|
|
|
(
|
) |
|
|
|
|
|
|
|
|
|
|
|
|
|
|
|
|
|
Included in other comprehensive income |
|
|
|
|
|
|
|
|
|
|
|
|
|
|
|
|
|
|
|
|
|
|
|
|
|
|
|
|
|
|
|
|
|
Settlements |
|
|
|
|
|
|
|
|
|
|
|
|
|
|
|
|
|
|
|
|
|
|
|
|
|
|
|
|
|
|
|
|
|
Transfers in and/or out
|
|
|
|
|
|
|
|
|
|
|
|
|
|
|
|
|
|
|
|
|
|
|
|
|
|
|
|
|
|
|
|
|
|
Balance, end of period |
|
$ |
(
|
) |
|
$ |
(
|
) |
|
$ |
|
|
|
$ |
(
|
) |
|
$ |
(
|
) |
|
$ |
(
|
) |
|
$ |
|
|
|
$ |
(
|
) |
|
Change in mark-to-
|
|
$ |
|
|
|
$ |
(
|
) |
|
$ |
|
|
|
$ |
(
|
) |
|
$ |
|
|
|
$ |
|
|
|
$ |
|
|
|
$ |
|
|
|
|
|
Three Months Ended March 31, |
|
|||||
|
(Dollars in millions) |
|
2024 |
|
|
2023 |
|
||
|
|
|
$ |
|
|
|
$ |
|
|
|
|
|
|
(
|
) |
|
|
|
|
|
|
|
$ |
(
|
) |
|
$ |
|
|
64
NAVIENT CORPORATION
NOTES TO CONSOLIDATED FINANCIAL STATEMENTS
(Information at March 31, 2024 and for the three months ended
March 31, 2024 and 2023 is unaudited)
8. Fair Value Measurements (Continued)
The following table presents the significant inputs that are unobservable or from inactive markets used in the recurring valuations of the level 3 financial instruments detailed above.
|
(Dollars in millions) |
|
Fair Value at March 31, 2024 |
|
|
Valuation
|
|
Input |
|
Range and
|
|
|
Derivatives |
|
|
|
|
|
|
|
|
|
|
|
Prime basis swaps |
|
$ |
(
|
) |
|
|
|
Constant Prepayment Rate |
|
|
|
|
|
|
|
|
|
|
Bid/ask adjustment to
|
|
|
|
|
Cross-currency interest rate swaps |
|
|
(
|
) |
|
|
|
|
|
|
|
Other |
|
|
|
|
|
|
|
|
|
|
|
Total |
|
$ |
(
|
) |
|
|
|
|
|
|
|
|
|
|
|
|
|
|
|
|
|
|
The following table summarizes the fair values of our financial assets and liabilities, including derivative financial instruments.
|
|
|
March 31, 2024 |
|
|
December 31, 2023 |
|
||||||||||||||||||
|
(Dollars in millions) |
|
Fair
|
|
|
Carrying
|
|
|
Difference |
|
|
Fair
|
|
|
Carrying
|
|
|
Difference |
|
||||||
|
Earning assets |
|
|
|
|
|
|
|
|
|
|
|
|
|
|
|
|
|
|
||||||
|
FFELP Loans |
|
$ |
|
|
|
$ |
|
|
|
$ |
(
|
) |
|
$ |
|
|
|
$ |
|
|
|
$ |
(
|
) |
|
Private Education Loans |
|
|
|
|
|
|
|
|
|
|
(
|
) |
|
|
|
|
|
|
|
|
|
|
(
|
) |
|
Cash and investments |
|
|
|
|
|
|
|
|
|
|
|
|
|
|
|
|
|
|
|
|
|
|
|
|
|
Total earning assets |
|
|
|
|
|
|
|
|
|
|
(
|
) |
|
|
|
|
|
|
|
|
|
|
(
|
) |
|
Interest-bearing liabilities |
|
|
|
|
|
|
|
|
|
|
|
|
|
|
|
|
|
|
||||||
|
Short-term borrowings |
|
|
|
|
|
|
|
|
|
|
(
|
) |
|
|
|
|
|
|
|
|
|
|
(
|
) |
|
Long-term borrowings |
|
|
|
|
|
|
|
|
|
|
|
|
|
|
|
|
|
|
|
|
|
|
|
|
|
Total interest-bearing liabilities |
|
|
|
|
|
|
|
|
|
|
|
|
|
|
|
|
|
|
|
|
|
|
|
|
|
Derivative financial instruments |
|
|
|
|
|
|
|
|
|
|
|
|
|
|
|
|
|
|
||||||
|
Floor Income Contracts |
|
|
|
|
|
|
|
|
|
|
|
|
|
|
|
|
|
|
|
|
|
|
|
|
|
Interest rate swaps |
|
|
|
|
|
|
|
|
|
|
|
|
|
|
|
|
|
|
|
|
|
|
|
|
|
Cross-currency interest rate swaps |
|
|
(
|
) |
|
|
(
|
) |
|
|
|
|
|
|
(
|
) |
|
|
(
|
) |
|
|
|
|
|
Other |
|
|
|
|
|
|
|
|
|
|
|
|
|
|
|
|
|
|
|
|
|
|
|
|
|
Excess of net asset fair value over carrying value |
|
|
|
|
|
|
|
$ |
|
|
|
|
|
|
|
|
|
$ |
(
|
) |
||||
65
NAVIENT CORPORATION
NOTES TO CONSOLIDATED FINANCIAL STATEMENTS
(Information at March 31, 2024 and for the three months ended
March 31, 2024 and 2023 is unaudited)
9. Commitments, Contingencies and Guarantees
L egal Proceedings
We and our subsidiaries and affiliates are subject to various claims, lawsuits and other actions that arise in the normal course of business. We believe that these claims, lawsuits and other actions will not, individually or in the aggregate, have a material adverse effect on our business, financial condition or results of operations, except as otherwise disclosed. Most of these matters are claims including individual and class action lawsuits against our servicing or business processing subsidiaries alleging the violation of state or federal laws in connection with servicing or collection activities on education loans and other debts.
In the ordinary course of our business, the Company and our subsidiaries and affiliates receive information and document requests and investigative demands from various entities including State Attorneys General, U.S. Attorneys, legislative committees, individual members of Congress and administrative agencies. These requests may be informational, regulatory or enforcement in nature and may relate to our business practices, the industries in which we operate, or companies with whom we conduct business. Generally, our practice has been and continues to be to cooperate with these bodies and to be responsive to any such requests.
The number of these inquiries and the volume of related information demands have normalized at elevated levels and therefore the Company must continue to expend time and resources to timely respond to these requests which may, depending on their outcome, result in payments of restitution, fines and penalties.
Contingencies
In the ordinary course of business, we and our subsidiaries are defendants in or parties to pending and threatened legal actions and proceedings including actions brought on behalf of various classes of claimants. These actions and proceedings may be based on alleged violations of consumer protection, securities, employment and other laws. In certain of these actions and proceedings, claims for substantial monetary damage are asserted against us and our subsidiaries. We and our subsidiaries are also subject to potential unasserted claims by third parties.
In the ordinary course of business, we and our subsidiaries are subject to regulatory examinations, information gathering requests, inquiries and investigations. In connection with formal and informal inquiries in these cases, we and our subsidiaries receive requests, subpoenas and orders for documents, testimony and information in connection with various aspects of our regulated activities.
In view of the inherent difficulty of predicting the outcome of litigation and regulatory matters, we may not be able to predict what the eventual outcome of the pending matters will be, what the timing or the ultimate resolution of these matters will be, or what the eventual loss, fines or penalties, if any, related to each pending matter may be.
The Company accrues a liability for litigation, regulatory matters, and unasserted contract claims when those matters present loss contingencies that are both probable and reasonably estimable. When loss contingencies are not both probable and reasonably estimable, we do not accrue a liability. Based on current knowledge, management does not believe that loss contingencies, if any, arising from pending investigations, litigation or regulatory matters will have a material adverse effect on our consolidated financial position, liquidity, results of operations or cash flows, except as otherwise disclosed.
The Company evaluates its outstanding legal and regulatory matters each reporting period, and makes adjustments to the accrued liabilities for such matters, upward or downward, as appropriate, based on the relevant facts and circumstances. The Company's accrued liabilities and estimated range of possible losses pertaining to certain matters can involve significant judgment given factors such as: the varying stages of the proceedings; the existence of numerous yet to be resolved issues; the breadth of the claims (often spanning multiple years and wide ranges of business activities); unspecified damages, civil money penalties or fines and/or the novelty of the legal issues presented; and the attendant uncertainty of the various potential outcomes of such proceedings, including where the Company has made assumptions concerning future rulings by the court or other adjudicator, or about the behavior or incentives of adverse parties or regulatory authorities. Various aspects of the legal proceedings underlying these estimates will change from time to time. Actual losses therefore may vary significantly from any estimates.
Due to developments in the second half of 2023 and the first quarter of 2024 in connection with the Company's CFPB matter, the Company concluded a loss was probable and reasonably estimable. As of December 31, 2023 and March 31, 2024, the contingency loss liability was $
66
NAVIENT CORPORATION
NOTES TO CONSOLIDATED FINANCIAL STATEMENTS
(Information at March 31, 2024 and for the three months ended
March 31, 2024 and 2023 is unaudited)
9. Commitments, Contingencies and Guarantees (Continued)
The Company believes the estimate of the aggregate range of reasonably possible losses (meaning the likelihood of losses is more than remote but less than likely) in connection with this matter, is from $
Set forth below are descriptions of the Company’s material legal proceedings.
Certain Cases
In January 2017, the Consumer Financial Protection Bureau (the CFPB) and Attorneys General for the State of Illinois and the State of Washington initiated civil actions naming Navient Corporation and several of its subsidiaries as defendants alleging violations of certain Federal and State consumer protection statutes, including the CFPA, FCRA, FDCPA and various state consumer protection laws. The Attorneys General for the States of Pennsylvania, California, Mississippi, and New Jersey also initiated actions against the Company and certain subsidiaries alleging violations of various state and federal consumer protection laws based upon similar alleged acts or failures to act. In addition to these matters, a number of lawsuits have been filed by nongovernmental parties or, in the future, may be filed by additional governmental or nongovernmental parties seeking damages or other remedies related to similar issues raised by the CFPB and the State Attorneys General. In January 2022, we entered into a series of Consent Judgment and Orders (the “Agreements”) with
As the Company has previously stated, we believe the allegations in the CFPB suit are false and that they improperly seek to impose penalties on Navient based on new, previously unannounced servicing standards applied retroactively against only one servicer. We therefore have denied these allegations and are vigorously defending against the allegations in that case.
On April 12, 2023, the Company reached an agreement in principle (“Settlement”) with certain plaintiffs for a nationwide settlement of claims raised in the following bankruptcy adversary actions: Coyle v. Navient Solutions, LLC, No. 22-80018 (Bankr. W.D. Mich.); Homaidan v. SLM Corp., No. 1:17-ap-01085 (Bankr. E.D.N.Y.); Mazloom v. Navient Solutions, LLC, No. 20-80033-6 (Bankr. N.D.N.Y.); and Woodard v. Navient Solutions, LLC, No. 08-81442 (Bankr. D. Neb.) collectively referred to as the “Bankruptcy Cases.” The Settlement has received final court approval. Under the Settlement, Navient will forego the collection of defined balances for borrowers or co-borrowers of certain private loans — all of which were originated prior to our company separation — who have received a discharge in bankruptcy during the periods covered by the agreements. As a result, we recorded a $
67
NAVIENT CORPORATION
NOTES TO CONSOLIDATED FINANCIAL STATEMENTS
(Information at March 31, 2024 and for the three months ended
March 31, 2024 and 2023 is unaudited)
9. Commitments, Contingencies and Guarantees (Continued)
Regulatory Matters
The Company has been named as defendant in a number of putative class action and other cases alleging violations of various state and federal consumer protection laws including the Telephone Consumer Protection Act (TCPA), the Consumer Financial Protection Act of 2010 (CFPA), the Fair Credit Reporting Act (FCRA), the Fair Debt Collection Practices Act (FDCPA), in adversarial proceedings under the U.S. Bankruptcy Code, and various state consumer protection laws. At this point in time, the Company is unable to anticipate the timing of a resolution or the impact that these legal proceedings may have on the Company’s consolidated financial position, liquidity, results of operation or cash flows. As a result, it is not possible at this time to estimate a range of potential exposure, if any, for amounts that may be payable in connection with these matters and loss contingency accruals have not been established. It is possible that an adverse ruling or rulings may have a material adverse impact on the Company.
In addition, Navient and its subsidiaries are subject to examination or regulation by various federal regulatory, state licensing or other regulatory agencies as part of its ordinary course of business including the SEC, CFPB, FFIEC and ED. Items or matters similar to or different from those described above may arise during the course of those examinations. We also routinely receive inquiries or requests from various regulatory entities or bodies or government agencies concerning our business or our assets. Generally, the Company endeavors to cooperate with each such inquiry or request. The Company has received separate CIDs or subpoenas from multiple State Attorneys General that are similar to the CIDs or subpoenas that preceded the lawsuits referenced above. Those CIDs and subpoenas have been resolved as part of the Company’s settlement with the State Attorneys General. Nevertheless, we have received and, in the future may receive, additional CIDs or subpoenas and other inquiries from these or other Attorneys General with respect to similar or different matters.
Under the terms of the Separation and Distribution Agreement between the Company and SLM BankCo, Navient agreed to indemnify SLM BankCo for claims, actions, damages, losses or expenses that may arise from the conduct of activities of pre-Spin-Off SLM BankCo occurring prior to the Spin-Off other than those specifically excluded in that agreement. Also, as part of the Separation and Distribution Agreement, SLM BankCo agreed to indemnify Navient for certain claims, actions, damages, losses or expenses subject to the terms, conditions and limitations set forth in that agreement. As a result, subject to the terms, conditions and limitations set forth in that agreement, Navient agreed to indemnify and hold harmless Sallie Mae and its subsidiaries, including Sallie Mae Bank from liabilities arising out of the regulatory matters and CFPB and State Attorneys General lawsuits mentioned above. In addition, we asserted various claims for indemnification against Sallie Mae and Sallie Mae Bank for such specifically excluded items arising out of the CFPB and the State Attorneys General lawsuits if and to the extent any indemnified liabilities exist now or in the future. Navient has
68
NAVIENT CORPORATION
NOTES TO CONSOLIDATED FINANCIAL STATEMENTS
(Information at March 31, 2024 and for the three months ended
March 31, 2024 and 2023 is unaudited)
10. Revenue from Contracts with Customers Accounted for in Accordance with ASC 606
The following tables illustrate the disaggregation of revenue from contracts accounted for under ASC 606 with customers according to service type and client type by reportable operating segment.
Revenue by Service Type
|
|
|
Three Months Ended March 31, |
|
|||||||||||||||||||||
|
|
|
2024 |
|
|
2023 |
|
||||||||||||||||||
|
(Dollars in millions) |
|
Federal Education Loans |
|
|
Business Processing |
|
|
Total Revenue |
|
|
Federal Education Loans |
|
|
Business Processing |
|
|
Total Revenue |
|
||||||
|
Federal Education Loan
|
|
$ |
|
|
|
$ |
|
|
|
$ |
|
|
|
$ |
|
|
|
$ |
|
|
|
$ |
|
|
|
Government services |
|
|
|
|
|
|
|
|
|
|
|
|
|
|
|
|
|
|
|
|
|
|
|
|
|
Healthcare services |
|
|
|
|
|
|
|
|
|
|
|
|
|
|
|
|
|
|
|
|
|
|
|
|
|
Total |
|
$ |
|
|
|
$ |
|
|
|
$ |
|
|
|
$ |
|
|
|
$ |
|
|
|
$ |
|
|
Revenue by Client Type
|
|
|
Three Months Ended March 31, |
|
|||||||||||||||||||||
|
|
|
2024 |
|
|
2023 |
|
||||||||||||||||||
|
(Dollars in millions) |
|
Federal Education Loans |
|
|
Business Processing |
|
|
Total Revenue |
|
|
Federal Education Loans |
|
|
Business Processing |
|
|
Total Revenue |
|
||||||
|
Federal government |
|
$ |
|
|
|
$ |
|
|
|
$ |
|
|
|
$ |
|
|
|
$ |
|
|
|
$ |
|
|
|
Guarantor agencies |
|
|
|
|
|
|
|
|
|
|
|
|
|
|
|
|
|
|
|
|
|
|
|
|
|
State and local government |
|
|
|
|
|
|
|
|
|
|
|
|
|
|
|
|
|
|
|
|
|
|
|
|
|
Tolling authorities |
|
|
|
|
|
|
|
|
|
|
|
|
|
|
|
|
|
|
|
|
|
|
|
|
|
Hospitals and other
|
|
|
|
|
|
|
|
|
|
|
|
|
|
|
|
|
|
|
|
|
|
|
|
|
|
Total |
|
$ |
|
|
|
$ |
|
|
|
$ |
|
|
|
$ |
|
|
|
$ |
|
|
|
$ |
|
|
As of March 31, 2024 and March 31, 2023
, there was $
69
NAVIENT CORPORATION
NOTES TO CONSOLIDATED FINANCIAL STATEMENTS
(Information at March 31, 2024 and for the three months ended
March 31, 2024 and 2023 is unaudited)
11. Segment Reporting
We monitor and assess our ongoing operations and results based on the following
These segments meet the quantitative thresholds for reportable operating segments. Accordingly, the results of operations of these reportable operating segments are presented separately. The underlying operating segments are used by the Company’s chief operating decision maker to manage the business, review operating performance and allocate resources, and qualify to be aggregated as part of the primary reportable operating segments. As discussed further below, we measure the profitability of our operating segments based on Core Earnings net income. Accordingly, information regarding our reportable operating segments net income is provided on a Core Earnings basis.
Federal Education Loans Segment
Navient owns FFELP Loans and performs servicing on this portfolio. We also service FFELP Loans owned by other institutions. We generate revenue primarily through net interest income on our FFELP Loans.
The following table includes asset information for our Federal Education Loans segment.
|
(Dollars in millions) |
|
March 31, 2024 |
|
|
December 31, 2023 |
|
||
|
FFELP Loans, net |
|
$ |
|
|
|
$ |
|
|
|
Cash and investments (1) |
|
|
|
|
|
|
|
|
|
Other |
|
|
|
|
|
|
|
|
|
Total assets |
|
$ |
|
|
|
$ |
|
|
Consumer Lending Segment
Navient owns, originates and services refinance and in-school Private Education Loans. "Refinance" Private Education Loans are loans where a borrower has refinanced their education loans, and "In-school" Private Education Loans are loans originally made to borrowers while they are attending school. We generate revenue primarily through net interest income on our Private Education Loan portfolio.
The following table includes asset information for our Consumer Lending segment.
|
(Dollars in millions) |
|
March 31, 2024 |
|
|
December 31, 2023 |
|
||
|
Private Education Loans, net |
|
$ |
|
|
|
$ |
|
|
|
Cash and investments (1) |
|
|
|
|
|
|
|
|
|
Other |
|
|
|
|
|
|
|
|
|
Total assets |
|
$ |
|
|
|
$ |
|
|
70
NAVIENT CORPORATION
NOTES TO CONSOLIDATED FINANCIAL STATEMENTS
(Information at March 31, 2024 and for the three months ended
March 31, 2024 and 2023 is unaudited)
11. Segment Reporting (Continued)
Business Processing Segment
Navient provides business processing solutions such as omnichannel contact center services, workflow processing, and revenue cycle optimization. Our clients include:
At March 31, 2024 and December 31, 2023
, the Business Processing segment had total assets of $
Other Segment
This segment consists of our corporate liquidity portfolio, gains and losses incurred on the repurchase of debt, unallocated expenses of shared services (which includes regulatory expenses) and restructuring/other reorganization expenses.
Unallocated shared services expenses are comprised of costs primarily related to information technology costs related to infrastructure and operations, stock-based compensation expense, accounting, finance, legal, compliance and risk management, regulatory-related expenses, human resources, certain executive management and the Board of Directors. Regulatory-related expenses include actual settlement amounts as well as third-party professional fees we incur in connection with such regulatory matters and are presented net of any insurance reimbursements for covered costs related to such matters.
At March 31, 2024 and December 31, 2023
, the Other segment had total assets of $
71
NAVIENT CORPORATION
NOTES TO CONSOLIDATED FINANCIAL STATEMENTS
(Information at March 31, 2024 and for the three months ended
March 31, 2024 and 2023 is unaudited)
11. Segment Reporting (Continued)
Measure of Profitability
We prepare financial statements and present financial results in accordance with GAAP. However, we also evaluate our business segments and present financial results on a basis that differs from GAAP. We refer to this different basis of presentation as Core Earnings. We provide this Core Earnings basis of presentation on a consolidated basis and for each business segment because this is what we review internally when making management decisions regarding our performance and how we allocate resources. We also refer to this information in our presentations with credit rating agencies, lenders and investors. Because our Core Earnings basis of presentation corresponds to our segment financial presentations, we are required by GAAP to provide Core Earnings disclosure in the notes to our consolidated financial statements for our business segments.
Core Earnings are not a substitute for reported results under GAAP. We use Core Earnings to manage our business segments because Core Earnings reflect adjustments to GAAP financial results for two items, discussed below, that can create significant volatility mostly due to timing factors generally beyond the control of management. Accordingly, we believe that Core Earnings provide management with a useful basis from which to better evaluate results from ongoing operations against the business plan or against results from prior periods. Consequently, we disclose this information because we believe it provides investors with additional information regarding the operational and performance indicators that are most closely assessed by management. When compared to GAAP results, the two items we remove to result in our Core Earnings presentations are:
While GAAP provides a uniform, comprehensive basis of accounting, for the reasons described above, our Core Earnings basis of presentation does not. Core Earnings are subject to certain general and specific limitations that investors should carefully consider. For example, there is no comprehensive, authoritative guidance for management reporting. Our Core Earnings are not defined terms within GAAP and may not be comparable to similarly titled measures reported by other companies. Accordingly, our Core Earnings presentation does not represent a comprehensive basis of accounting. Investors, therefore, may not be able to compare our performance with that of other financial services companies based upon Core Earnings. Core Earnings results are only meant to supplement GAAP results by providing additional information regarding the operational and performance indicators that are most closely used by management, our Board of Directors, credit rating agencies, lenders and investors to assess performance.
72
NAVIENT CORPORATION
NOTES TO CONSOLIDATED FINANCIAL STATEMENTS
(Information at March 31, 2024 and for the three months ended
March 31, 2024 and 2023 is unaudited)
11. Segment Reporting (Continued)
Segment Results and Reconciliations to GAAP
|
|
|
Three Months Ended March 31, 2024 |
|
|||||||||||||||||||||||||||||||||
|
|
|
|
|
|
Adjustments |
|
|
|
|
|
Reportable Segments |
|
||||||||||||||||||||||||
|
(Dollars in millions) |
|
Total
|
|
|
Reclassi-
|
|
|
Additions/
|
|
|
Total
|
|
|
Total
|
|
|
Federal Education Loans |
|
|
Consumer Lending |
|
|
Business Processing |
|
|
Other |
|
|||||||||
|
Interest income: |
|
|
|
|
|
|
|
|
|
|
|
|
|
|
|
|
|
|
|
|
|
|
|
|
|
|
|
|||||||||
|
Education loans |
|
$ |
|
|
|
|
|
|
|
|
|
|
|
|
|
|
|
$ |
|
|
|
$ |
|
|
|
$ |
|
|
|
$ |
|
|
||||
|
Cash and investments |
|
|
|
|
|
|
|
|
|
|
|
|
|
|
|
|
|
|
|
|
|
|
|
|
|
|
|
|
|
|
|
|
||||
|
Total interest income |
|
|
|
|
|
|
|
|
|
|
|
|
|
|
|
|
|
|
|
|
|
|
|
|
|
|
|
|
|
|
|
|
||||
|
Total interest expense |
|
|
|
|
|
|
|
|
|
|
|
|
|
|
|
|
|
|
|
|
|
|
|
|
|
|
|
|
|
|
|
|
||||
|
Net interest income
|
|
|
|
|
|
$ |
|
|
|
$ |
|
|
|
$ |
|
|
|
$ |
|
|
|
|
|
|
|
|
|
|
|
|
|
|
|
|
(
|
) |
|
Less: provisions for loan
|
|
|
|
|
|
|
|
|
|
|
|
|
|
|
|
|
|
|
|
|
|
|
|
|
|
|
|
|
|
|
|
|
|
|||
|
Net interest income
|
|
|
|
|
|
|
|
|
|
|
|
|
|
|
|
|
|
|
|
|
|
|
|
|
|
|
|
|
|
|
(
|
) |
||||
|
Other income (loss): |
|
|
|
|
|
|
|
|
|
|
|
|
|
|
|
|
|
|
|
|
|
|
|
|
|
|
|
|||||||||
|
Servicing revenue |
|
|
|
|
|
|
|
|
|
|
|
|
|
|
|
|
|
|
|
|
|
|
|
|
|
|
|
|
|
|
|
|
||||
|
Asset recovery and
|
|
|
|
|
|
|
|
|
|
|
|
|
|
|
|
|
|
|
|
|
|
|
|
|
|
|
|
|
|
|
|
|
||||
|
Other revenue |
|
|
|
|
|
|
|
|
|
|
|
|
|
|
|
|
|
|
|
|
|
|
|
|
|
|
|
|
|
|
|
|
||||
|
Total other income
|
|
|
|
|
|
|
(
|
) |
|
|
(
|
) |
|
|
(
|
) |
|
|
|
|
|
|
|
|
|
|
|
|
|
|
|
|
|
|
|
|
|
Expenses: |
|
|
|
|
|
|
|
|
|
|
|
|
|
|
|
|
|
|
|
|
|
|
|
|
|
|
|
|||||||||
|
Direct operating
|
|
|
|
|
|
|
|
|
|
|
|
|
|
|
|
|
|
|
|
|
|
|
|
|
|
|
|
|
|
|
|
|
||||
|
Unallocated shared
|
|
|
|
|
|
|
|
|
|
|
|
|
|
|
|
|
|
|
|
|
|
|
|
|
|
|
|
|
|
|
|
|
||||
|
Operating expenses |
|
|
|
|
|
|
|
|
|
|
|
|
|
|
|
|
|
|
|
|
|
|
|
|
|
|
|
|
|
|
|
|
|
|
|
|
|
Goodwill and acquired
|
|
|
|
|
|
|
|
|
|
|
(
|
) |
|
|
(
|
) |
|
|
|
|
|
|
|
|
|
|
|
|
|
|
|
|
|
|
|
|
|
Restructuring/other
|
|
|
|
|
|
|
|
|
|
|
|
|
|
|
|
|
|
|
|
|
|
|
|
|
|
|
|
|
|
|
|
|
|
|
|
|
|
Total expenses |
|
|
|
|
|
|
|
|
|
|
(
|
) |
|
|
(
|
) |
|
|
|
|
|
|
|
|
|
|
|
|
|
|
|
|
|
|
|
|
|
Income (loss) before
|
|
|
|
|
|
|
|
|
|
|
(
|
) |
|
|
(
|
) |
|
|
|
|
|
|
|
|
|
|
|
|
|
|
|
|
|
|
(
|
) |
|
Income tax expense
|
|
|
|
|
|
|
|
|
|
|
|
|
|
|
|
|
|
|
|
|
|
|
|
|
|
|
|
|
|
|
|
|
|
|
(
|
) |
|
Net income (loss) |
|
$ |
|
|
|
$ |
|
|
|
$ |
(
|
) |
|
$ |
(
|
) |
|
$ |
|
|
|
$ |
|
|
|
$ |
|
|
|
$ |
|
|
|
$ |
(
|
) |
|
|
|
Three Months Ended March 31, 2024 |
|
|||||||||
|
(Dollars in millions) |
|
Net Impact of
|
|
|
Net Impact of
|
|
|
Total |
|
|||
|
Net interest income (loss) after provisions for loan losses |
|
$ |
|
|
|
$ |
|
|
|
$ |
|
|
|
Total other income (loss) |
|
|
(
|
) |
|
|
|
|
|
|
(
|
) |
|
Goodwill and acquired intangible asset impairment and amortization |
|
|
|
|
|
|
(
|
) |
|
|
(
|
) |
|
Total Core Earnings adjustments to GAAP |
|
$ |
(
|
) |
|
$ |
|
|
|
|
(
|
) |
|
Income tax expense (benefit) |
|
|
|
|
|
|
|
|
|
|
||
|
Net income (loss) |
|
|
|
|
|
|
|
$ |
(
|
) |
||
73
NAVIENT CORPORATION
NOTES TO CONSOLIDATED FINANCIAL STATEMENTS
(Information at March 31, 2024 and for the three months ended
March 31, 2024 and 2023 is unaudited)
11. Segment Reporting (Continued)
|
|
|
Three Months Ended March 31, 2023 |
|
|||||||||||||||||||||||||||||||||
|
|
|
|
|
|
Adjustments |
|
|
|
|
|
Reportable Segments |
|
||||||||||||||||||||||||
|
(Dollars in millions) |
|
Total
|
|
|
Reclassi-
|
|
|
Additions/
|
|
|
Total
|
|
|
Total
|
|
|
Federal Education Loans |
|
|
Consumer Lending |
|
|
Business Processing |
|
|
Other |
|
|||||||||
|
Interest income: |
|
|
|
|
|
|
|
|
|
|
|
|
|
|
|
|
|
|
|
|
|
|
|
|
|
|
|
|||||||||
|
Education loans |
|
$ |
|
|
|
|
|
|
|
|
|
|
|
|
|
|
|
$ |
|
|
|
$ |
|
|
|
$ |
|
|
|
$ |
|
|
||||
|
Cash and investments |
|
|
|
|
|
|
|
|
|
|
|
|
|
|
|
|
|
|
|
|
|
|
|
|
|
|
|
|
|
|
|
|
||||
|
Total interest income |
|
|
|
|
|
|
|
|
|
|
|
|
|
|
|
|
|
|
|
|
|
|
|
|
|
|
|
|
|
|
|
|
||||
|
Total interest expense |
|
|
|
|
|
|
|
|
|
|
|
|
|
|
|
|
|
|
|
|
|
|
|
|
|
|
|
|
|
|
|
|
||||
|
Net interest income
|
|
|
|
|
|
$ |
|
|
|
$ |
|
|
|
$ |
|
|
|
$ |
|
|
|
|
|
|
|
|
|
|
|
|
|
|
|
|
(
|
) |
|
Less: provisions for loan
|
|
|
(
|
) |
|
|
|
|
|
|
|
|
|
|
|
(
|
) |
|
|
|
|
|
|
(
|
) |
|
|
|
|
|
|
|
|
|||
|
Net interest income
|
|
|
|
|
|
|
|
|
|
|
|
|
|
|
|
|
|
|
|
|
|
|
|
|
|
|
|
|
|
|
(
|
) |
||||
|
Other income (loss): |
|
|
|
|
|
|
|
|
|
|
|
|
|
|
|
|
|
|
|
|
|
|
|
|
|
|
|
|||||||||
|
Servicing revenue |
|
|
|
|
|
|
|
|
|
|
|
|
|
|
|
|
|
|
|
|
|
|
|
|
|
|
|
|
|
|
|
|
||||
|
Asset recovery and
|
|
|
|
|
|
|
|
|
|
|
|
|
|
|
|
|
|
|
|
|
|
|
|
|
|
|
|
|
|
|
|
|
||||
|
Other revenue |
|
|
(
|
) |
|
|
|
|
|
|
|
|
|
|
|
|
|
|
|
|
|
|
|
|
|
|
|
|
|
|
|
|
||||
|
Total other income
|
|
|
|
|
|
|
(
|
) |
|
|
|
|
|
|
|
|
|
|
|
|
|
|
|
|
|
|
|
|
|
|
|
|
|
|
|
|
|
Expenses: |
|
|
|
|
|
|
|
|
|
|
|
|
|
|
|
|
|
|
|
|
|
|
|
|
|
|
|
|||||||||
|
Direct operating
|
|
|
|
|
|
|
|
|
|
|
|
|
|
|
|
|
|
|
|
|
|
|
|
|
|
|
|
|
|
|
|
|
||||
|
Unallocated shared
|
|
|
|
|
|
|
|
|
|
|
|
|
|
|
|
|
|
|
|
|
|
|
|
|
|
|
|
|
|
|
|
|
||||
|
Operating expenses |
|
|
|
|
|
|
|
|
|
|
|
|
|
|
|
|
|
|
|
|
|
|
|
|
|
|
|
|
|
|
|
|
|
|
|
|
|
Goodwill and acquired
|
|
|
|
|
|
|
|
|
|
|
(
|
) |
|
|
(
|
) |
|
|
|
|
|
|
|
|
|
|
|
|
|
|
|
|
|
|
|
|
|
Restructuring/other
|
|
|
|
|
|
|
|
|
|
|
|
|
|
|
|
|
|
|
|
|
|
|
|
|
|
|
|
|
|
|
|
|
|
|
|
|
|
Total expenses |
|
|
|
|
|
|
|
|
|
|
(
|
) |
|
|
(
|
) |
|
|
|
|
|
|
|
|
|
|
|
|
|
|
|
|
|
|
|
|
|
Income (loss) before
|
|
|
|
|
|
|
|
|
|
|
|
|
|
|
|
|
|
|
|
|
|
|
|
|
|
|
|
|
|
|
|
|
|
|
(
|
) |
|
Income tax expense
|
|
|
|
|
|
|
|
|
|
|
|
|
|
|
|
|
|
|
|
|
|
|
|
|
|
|
|
|
|
|
|
|
|
|
(
|
) |
|
Net income (loss) |
|
$ |
|
|
|
$ |
|
|
|
$ |
|
|
|
$ |
|
|
|
$ |
|
|
|
$ |
|
|
|
$ |
|
|
|
$ |
|
|
|
$ |
(
|
) |
|
|
|
|
|
|
|
|
|
|
|
|
|
|
|
|
|
|
|
|
|
|
|
|
|
|
|
|
|
|||||||||
|
|
|
Three Months Ended March 31, 2023 |
|
|||||||||
|
(Dollars in millions) |
|
Net Impact of
|
|
|
Net Impact of
|
|
|
Total |
|
|||
|
Net interest income (loss) after provisions for loan losses |
|
$ |
|
|
|
$ |
|
|
|
$ |
|
|
|
Total other income (loss) |
|
|
|
|
|
|
|
|
|
|
|
|
|
Goodwill and acquired intangible asset impairment and amortization |
|
|
|
|
|
|
(
|
) |
|
|
(
|
) |
|
Total Core Earnings adjustments to GAAP |
|
$ |
|
|
|
$ |
|
|
|
|
|
|
|
Income tax expense (benefit) |
|
|
|
|
|
|
|
|
|
|
||
|
Net income (loss) |
|
|
|
|
|
|
|
$ |
|
|
||
74
NAVIENT CORPORATION
NOTES TO CONSOLIDATED FINANCIAL STATEMENTS
(Information at March 31, 2024 and for the three months ended
March 31, 2024 and 2023 is unaudited)
11. Segment Reporting (Continued)
Su mmary of Core Earnings Adjustments to GAAP
|
|
|
Three Months Ended March 31, |
|
|||||
|
(Dollars in millions) |
|
2024 |
|
|
2023 |
|
||
|
GAAP net income |
|
$ |
|
|
|
$ |
|
|
|
Core Earnings adjustments to GAAP: |
|
|
|
|
|
|
||
|
Net impact of derivative accounting (1) |
|
|
(
|
) |
|
|
|
|
|
Net impact of goodwill and acquired intangible assets (2) |
|
|
|
|
|
|
|
|
|
Net income tax effect (3) |
|
|
(
|
) |
|
|
(
|
) |
|
Total Core Earnings adjustments to GAAP |
|
|
(
|
) |
|
|
|
|
|
Core Earnings net income |
|
$ |
|
|
|
$ |
|
|
75
S IGNATURES
Pursuant to the requirements of the Securities Exchange Act of 1934, as amended, the Registrant has duly caused this report to be signed on its behalf by the undersigned hereunto duly authorized.
|
|
|
|
|
|
NAVIENT CORPORATION (Registrant) |
|
|
|
By: |
/s/ JOE FISHER |
|
|
|
Joe Fisher |
|
|
|
Chief Financial Officer |
|
|
|
(Principal Financial and Accounting Officer) |
Date: April 24, 2024
76
APPEN DIX A
form 10-Q cross-reference index
|
|
|
Page Number |
|
Part I. Financial Information |
||
|
|
|
|
|
|
|
|
|
Item 1. |
42 - 75 |
|
|
|
|
|
|
Item 2. |
Management’s Discussion and Analysis of Financial Condition and Results of Operations |
7 - 32 |
|
|
|
|
|
Item 3. |
35 - 38 |
|
|
|
|
|
|
Item 4. |
40 |
|
|
|
|
|
|
Part II. Other Information |
|
|
|
|
|
|
|
Item 1. |
33 , 66 |
|
|
|
|
|
|
Item 1A. |
33 |
|
|
|
|
|
|
Item 2. |
Purchases of Equity Securities by the Issuer and Affiliated Purchasers |
38 |
|
|
|
|
|
Item 3. |
Defaults Upon Senior Securities |
Not Applicable |
|
|
|
|
|
Item 4. |
Mine Safety Disclosures |
Not Applicable |
|
|
|
|
|
Item 5. |
40 |
|
|
|
|
|
|
Item 6. |
41 |
|
|
|
|
|
|
|
76 |
|
77