NACCO INDUSTRIES INC
10-Ks and 10-Qs
|
|
|
|
|
|
|
|
|
|
|
|
|
|
|
|
|
|
|
|
|
|
|
|
|
|
|
|
|
|
|
|
|
|
|
|
|
|
|
|
|
|
|
|
|
|
|
|
|
|
|
|
|
|
|
|
|
|
|
UNITED STATES
SECURITIES AND EXCHANGE COMMISSION
WASHINGTON, DC 20549
FORM 10-K
|
(Mark One)
|
||
|
R
|
ANNUAL REPORT PURSUANT TO SECTION 13 OR 15(d) OF THE SECURITIES EXCHANGE ACT OF 1934
|
|
|
For the fiscal year ended December 31, 2011
|
||
or
|
£
|
TRANSITION REPORT PURSUANT TO SECTION 13 OR 15(d) OF THE SECURITIES EXCHANGE ACT OF 1934
|
|
Commission File No. 1-9172
NACCO INDUSTRIES, INC.
(Exact name of registrant as specified in its charter)
|
Delaware
(State or other jurisdiction of incorporation or organization)
|
|
34-1505819
(I.R.S. Employer Identification No.)
|
|
|
|
|
|
5875 Landerbrook Drive, Cleveland, Ohio
(Address of principal executive offices)
|
|
44124-4069
(Zip Code)
|
Registrant's telephone number, including area code:
(440) 449-9600
Securities registered pursuant to Section 12(b) of the Act:
|
Title of each class
|
|
Name of each exchange on which registered
|
|
Class A Common Stock, Par Value $1.00 Per Share
|
|
New York Stock Exchange
|
Securities registered pursuant to Section 12(g) of the Act:
Class B Common Stock, Par Value $1.00 Per Share
(Title of class)
Indicate by check mark if the registrant is a well-known seasoned issuer, as defined in Rule 405 of the Securities Act.
YES
£
NO
R
Indicate by check mark if the registrant is not required to file reports pursuant to Section 13 or Section 15(d) of the Act.
YES
£
NO
R
Indicate by check mark whether the registrant (1) has filed all reports required to be filed by Section 13 or 15(d) of the Securities Exchange Act of 1934 during the preceding 12 months (or for such shorter period that the registrant was required to file such reports), and (2) has been subject to such filing requirements for the past 90 days.
YES
R
NO
£
Indicate by check mark whether the registrant has submitted electronically and posted on its corporate Web site, if any, every Interactive Data File required to be submitted and posted pursuant to Rule 405 of Regulation S-T (§ 232.405 of this chapter) during the preceding 12 months (or for such shorter period that the registrant was required to submit and post such files).
YES
R
NO
£
Indicate by check mark if disclosure of delinquent filers pursuant to Item 405 of Regulation S-K (§ 229.405) is not contained herein, and will not be contained, to the best of registrant's knowledge, in definitive proxy or information statements incorporated by reference in Part III of this Form 10-K or any amendment to this Form 10-K.
£
Indicate by check mark whether the registrant is a large accelerated filer, an accelerated filer, a non-accelerated filer, or a smaller reporting company. See definitions of “large accelerated filer,” “accelerated filer,” and “smaller reporting company” in Rule 12b-2 of the Exchange Act.
|
Large accelerated filer
£
|
Accelerated filer
R
|
Non-accelerated filer
£
(Do not check if a smaller reporting company)
|
Smaller reporting company
£
|
Indicate by check mark whether the registrant is a shell company (as defined in Rule 12b-2 of the Exchange Act)
YES
£
NO
R
Aggregate market value of Class A Common Stock and Class B Common Stock held by non-affiliates as of June 30, 2011 (the last business day of the registrant's most recently completed second fiscal quarter): $568,596,169
Number of shares of Class A Common Stock outstanding at February 24, 2012:
6,793,716
Number of shares of Class B Common Stock outstanding at February 24, 2012:
1,592,571
DOCUMENTS INCORPORATED BY REFERENCE
Portions of the Company's Proxy Statement for its 2012 annual meeting of stockholders are incorporated herein by reference in Part III of this Form 10-K.
NACCO INDUSTRIES, INC.
TABLE OF CONTENTS
|
|
|
PAGE
|
|
|
|
|
||
|
|
|
||
|
|
|
||
|
|
|
||
General
NACCO Industries, Inc. (“NACCO” or the “Company”) is a holding company with the following principal businesses: lift trucks, small appliances, specialty retail and mining.
(a)
NACCO Materials Handling Group.
NACCO Materials Handling Group consists of the Company’s wholly owned subsidiary, NMHG Holding Co. (“NMHG”). NMHG designs, engineers, manufactures, sells and services a comprehensive line of lift trucks and aftermarket parts marketed globally primarily under the Hyster
®
and Yale
®
brand names, mainly to independent Hyster
®
and Yale
®
retail dealerships.
(b)
Hamilton Beach Brands.
The Company’s wholly owned subsidiary, Hamilton Beach Brands, Inc. (“HBB”), is a leading designer, marketer and distributor of small electric household appliances, as well as commercial products for restaurants, bars and hotels.
(c)
Kitchen Collection.
The Company’s wholly owned subsidiary, The Kitchen Collection, LLC (“KC”), is a national specialty retailer of kitchenware and gourmet foods operating under the Kitchen Collection
®
and Le Gourmet Chef
®
store names in outlet and traditional malls throughout the United States.
(d)
North American Coal.
The Company’s wholly owned subsidiary, The North American Coal Corporation and its affiliated coal companies (collectively, “NACoal”), mine and market coal primarily as fuel for power generation and provide selected value-added mining services for other natural resources companies.
Additional information relating to financial and operating data on a segment basis (including NACCO and Other) and by geographic region is set forth under the heading “Management’s Discussion and Analysis of Financial Condition and Results of Operations” contained in Part II of this Form 10-K and in Note 19 to the Consolidated Financial Statements contained in this Form 10-K.
NACCO was incorporated as a Delaware corporation in 1986 in connection with the formation of a holding company structure for a predecessor corporation organized in 1913. As of
January 31, 2012
, the Company and its subsidiaries had approximately 8,900 employees, including approximately 1,100 employees at the Company’s unconsolidated mines.
The Company makes its annual reports on Form 10-K, quarterly reports on Form 10-Q, current reports on Form 8-K, and any amendments to those reports available, free of charge, through its website, www.nacco.com, as soon as reasonably practicable after such material is electronically filed with, or furnished to, the Securities and Exchange Commission (“SEC”).
Significant Events
In 2011, the Company announced that the Company's Board of Directors approved the repurchase of up to $50 million of the Company's outstanding Class A common stock. The authorization for the repurchase program expires on December 31, 2012.
In 2006, the Company initiated litigation in the Delaware Chancery Court against Applica Incorporated ("Applica") and individuals and entities affiliated with Applica's shareholder, Harbinger Capital Partners Master Fund, Ltd. The litigation alleged a number of contract and tort claims against the defendants related to the failed transaction with Applica, which had been previously announced. On February 14, 2011, the parties to this litigation entered into a settlement agreement. The settlement agreement provided for, among other things, the payment of $60 million to the Company and dismissal of the lawsuit with prejudice. The payment was received in February 2011.
Litigation costs related to the failed transaction with Applica were $2.8 million, $18.8 million and $1.1 million in 2011, 2010 and 2009, respectively.
During 2010 and 2011, NACoal entered into agreements to sell $31.4 million of assets, which consist primarily of two draglines. The sales of the assets are expected to occur in 2012.
1
BUSINESS SEGMENT INFORMATION
A. NACCO Materials Handling Group
General
NMHG designs, engineers, manufactures, sells and services a comprehensive line of lift trucks and aftermarket parts marketed globally primarily under the Hyster
®
and Yale
®
brand names.
Manufacturing and Assembly
NMHG manufactures components, such as frames, masts and transmissions, and assembles products in the market of sale whenever practical to minimize freight cost and balance currency mix. In some instances, however, it utilizes one worldwide location to manufacture specific components or assemble specific products. Additionally, components and assembled lift trucks are exported to locations when it is advantageous to meet demand in certain markets. NMHG operates twelve manufacturing and assembly facilities worldwide with five plants in the Americas, three in Europe and four in Asia-Pacific, including joint venture operations.
Sales of lift trucks represented approximately 83% of NMHG’s annual revenues in
2011
, 77% in
2010
and 71% in
2009
. Service, rental and other revenues were approximately 4% in
2011
, 6% in
2010
and 11% in
2009
.
Aftermarket Parts
NMHG offers a line of aftermarket parts to service its large installed base of lift trucks currently in use in the industry. NMHG offers online technical reference databases specifying the required aftermarket parts to service lift trucks and an aftermarket parts ordering system. Aftermarket parts sales represented approximately 13% of NMHG’s annual revenues in
2011
, 17% in
2010
and 18% in
2009
.
NMHG sells Hyster
®
- and Yale
®
-branded aftermarket parts to dealers for Hyster
®
and Yale
®
lift trucks. NMHG also sells aftermarket parts under the UNISOURCE™, MULTIQUIP™ and PREMIER™ brands to Hyster
®
and Yale
®
dealers for the service of competitor lift trucks. NMHG has a contractual relationship with a third-party, multi-brand, aftermarket parts wholesaler in the Americas and Europe whereby orders from NMHG dealers for parts for lift trucks are fulfilled by the third party who then pays NMHG a commission.
Marketing
NMHG’s marketing organization is structured in three regional divisions: the Americas; Europe, which includes the Middle East and Africa; and Asia-Pacific. In each region, certain marketing support functions for the Hyster
®
and Yale
®
brands are combined into a single shared services organization. These activities include sales and service training, information systems support, product launch coordination, specialized sales material development, help desks, order entry, marketing strategy and field service support.
Patents, Trademarks and Licenses
NMHG relies on a combination of trade secret protection, trademarks, copyrights, and patents to establish and protect its proprietary rights. These intellectual property rights may not have commercial value or may not be sufficiently broad to protect the aspect of NMHG’s technology to which they relate or competitors may design around the patents. NMHG is not materially dependent upon patents or patent protection; however, as materials handling equipment has become more technologically advanced, NMHG and its competitors have increasingly sought patent protection for inventions incorporated into their products. NMHG is the owner of the Hyster
®
and Yale
®
trademarks and believes these trademarks are material to its business.
Distribution Network
NMHG distributes lift trucks and aftermarket parts primarily through two channels: independent dealers and a National Accounts program. NMHG’s end-user base is diverse and fragmented, including, among others, light and heavy manufacturers, trucking and automotive companies, rental companies, building materials and paper suppliers, lumber, metal products, warehouses, retailers, food distributors, container handling companies and domestic and foreign governmental agencies.
Independent Dealers
The majority of NMHG’s dealers are independently owned and operated. In the Americas, Hyster
®
had 43 independent dealers and Yale
®
had 66 independent dealers as of
December 31, 2011
. In Europe, Hyster
®
had 55 independent dealers and Yale
®
had 98 independent dealers as of
December 31, 2011
. In Asia-Pacific, Hyster
®
had 12 independent dealers and Yale
®
had 14
2
independent dealers as of
December 31, 2011
. As of
December 31, 2011
, NMHG had 15 dual-branded dealers in the Americas.
National Accounts
NMHG operates a National Accounts program for both Hyster
®
and Yale
®
. The National Accounts program focuses on large customers with centralized purchasing and geographically dispersed operations in multiple dealer territories. The National Accounts program accounted for 15%, 14% and 18% of new lift truck unit volume in
2011
,
2010
and
2009
, respectively. The independent dealers support the National Accounts program by providing aftermarket parts and service on a local basis. Dealers receive a commission for the support they provide in connection with National Accounts sales and for the preparation and delivery of lift trucks to customer locations. In addition to selling new lift trucks, the National Accounts program markets services, including full maintenance leases and total fleet management.
Financing of Sales
NMHG is engaged in a joint venture with General Electric Capital Corporation (“GECC”) to provide dealer and customer financing of new lift trucks in the United States. NMHG owns 20% of the joint venture entity, NMHG Financial Services, Inc. (“NFS”), and receives fees and remarketing profits under a joint venture agreement. This agreement expires on December 31, 2013. NMHG accounts for its ownership of NFS using the equity method of accounting.
In addition, NMHG has entered into an operating agreement with GECC under which GECC provides leasing and financing services to Hyster
®
and Yale
®
dealers and their customers outside of the United States. GECC pays NMHG a referral fee once certain financial thresholds are met. This agreement expires on December 31, 2013.
Under the joint venture agreement with NFS and the operating agreement with GECC, NMHG’s dealers and certain customers are extended credit for the purchase of lift trucks to be placed in the dealer’s floor plan inventory or the financing of lift trucks that are sold or leased to customers. For some of these arrangements, NMHG provides recourse or repurchase obligations to NFS or to GECC. In substantially all of these transactions, a perfected security interest is maintained in the lift trucks financed, so that in the event of a default, NMHG has the ability to foreclose on the leased property and sell it through the Hyster
®
or Yale
®
dealer network. Furthermore, NMHG has established reserves for exposures under these agreements when required. In addition, NMHG has an agreement with GECC to limit its exposure to losses at certain eligible dealers. Under this agreement, losses related to guarantees for these certain eligible dealers are limited to 7.5% of their original loan balance. See Notes 14 and 22 to the Consolidated Financial Statements in this Form 10-K for further discussion.
Backlog
As of
December 31, 2011
, NMHG’s backlog of unfilled orders placed with its manufacturing and assembly operations for new lift trucks was approximately 24,700 units, or approximately $629 million, of which substantially all is expected to be filled during fiscal
2012
. This compares with the backlog as of
December 31, 2010
of approximately 23,000 units, or approximately $512 million. Backlog represents unfilled lift truck orders placed with NMHG’s manufacturing and assembly facilities from dealers, National Accounts customers and contracts with the U.S. government.
Key Suppliers and Raw Materials
At times, NMHG has experienced significant increases in its material costs, primarily as a result of global increases in industrial metals including steel, lead and copper and other commodity products, including rubber, due to increased demand and limited supply. While NMHG attempts to pass these increased costs along to its customers in the form of higher prices for its products, it may not be able to fully offset the increased costs of industrial metals and other commodities, due to overall market conditions and the lag time involved in implementing price increases for its products. NMHG depends on a limited number of suppliers for some of its critical components, including diesel and gasoline engines and cast-iron counterweights used to counterbalance some lift trucks. Some of these critical components are imported and subject to regulation, such as inspection by the U.S. Department of Commerce. NMHG believes comparable alternatives are available for all suppliers.
Competition
NMHG is one of the leaders in the lift truck industry with respect to market share in the Americas and worldwide. Competition in the lift truck industry is intense and is based primarily on strength and quality of dealers, brand loyalty, customer service, new lift truck sales prices, availability of products and aftermarket parts, comprehensive product line offerings, product performance, product quality and features and the cost of ownership over the life of the lift truck. NMHG competes with several global manufacturers that operate in all major markets.
The lift truck industry also competes with alternative methods of materials handling, including conveyor systems and automated guided vehicle systems.
3
NMHG’s aftermarket parts offerings compete with parts manufactured by other lift truck manufacturers as well as companies that focus solely on the sale of generic parts.
Cyclical Nature of Lift Truck Business
NMHG’s lift truck business historically has been cyclical. Fluctuations in the rate of orders for lift trucks reflect the capital investment decisions of NMHG’s customers, which depend to a certain extent on the general level of economic activity in the various industries the lift truck customers serve. During economic downturns, customers tend to delay new lift truck and parts purchases. Consequently, NMHG has experienced, and in the future may continue to experience, significant fluctuations in its revenues and net income.
Research and Development
NMHG’s research and development capability is organized around four major engineering centers, all coordinated on a global basis by NMHG’s global executive administrative center. Products are designed for each brand concurrently and generally each center is focused on the global requirements for a single product line. NMHG’s counterbalanced development center, which has global design responsibility for several classes of lift trucks for a highly diverse customer base, is located in Fairview, Oregon. NMHG’s big truck development center is located in Nijmegen, The Netherlands, adjacent to a dedicated global big truck assembly facility. Big trucks are primarily used in handling shipping containers and in specialized heavy lifting applications. Warehouse trucks, which are primarily used in distribution applications, are designed based on regional differences in stacking and storage practices. NMHG designs warehouse equipment for sale in the Americas market in Greenville, North Carolina, adjacent to the Americas assembly facility. NMHG designs warehouse equipment for the European market in Masate, Italy adjacent to its assembly facilities for warehouse equipment. NMHG also has an engineering Concept Center in the United Kingdom to support advanced design activities. In addition, NMHG has an engineering office in India to support its global drafting and design activities for its four major engineering centers.
NMHG’s engineering centers utilize a three-dimensional CAD/CAM system and are connected with one another, with all of NMHG’s manufacturing and assembly facilities and with some suppliers. This allows for collaboration in technical engineering designs and collaboration with suppliers. Additionally, NMHG solicits customer feedback throughout the design phase to improve product development efforts. NMHG invested $61.3 million, $48.6 million and $43.6 million on product design and development activities in
2011
,
2010
and
2009
, respectively.
Sumitomo-NACCO Joint Venture
NMHG has a 50% ownership interest in Sumitomo-NACCO Materials Handling Group, Ltd. (“SN”), a limited liability company that was formed in 1970 primarily to manufacture and distribute Sumitomo-Yale branded lift trucks in Japan and export Hyster
®
- and Yale
®
-branded lift trucks and related components and service parts outside of Japan. Sumitomo Heavy Industries, Ltd. owns the remaining 50% interest in SN. Each shareholder of SN is entitled to appoint directors representing 50% of the vote of SN’s board of directors. All matters related to policies and programs of operation, manufacturing and sales activities require mutual agreement between NMHG and Sumitomo Heavy Industries, Ltd. prior to a vote of SN’s board of directors. As a result, NMHG accounts for its ownership in SN using the equity method of accounting. NMHG purchases Hyster
®
- and Yale
®
-branded lift trucks and related component and aftermarket parts from SN under normal trade terms for sale outside of Japan. NMHG also contracts with SN for engineering design services on a cost plus basis and charges SN for technology used by SN but developed by NMHG.
Employees
As of
January 31, 2012
, NMHG had approximately 5,300 employees. Certain employees in the Danville, Illinois parts depot operations (approximately 90 employees) are unionized. NMHG’s contract with the Danville union expires in June 2012. Employees at the facilities in Berea, Kentucky; Sulligent, Alabama; and Greenville, North Carolina are not represented by unions. In Brazil, all employees are unionized. NMHG’s contract with the Brazilian union expires annually in October, at which time salaries are negotiated for the following year. In Mexico, shop employees are unionized.
In Europe, some employees in the Craigavon, Northern Ireland and Masate, Italy facilities are unionized. All of the European employees are part of works councils that perform a consultative role on business and employment matters.
NMHG believes its current labor relations with both union and non-union employees are generally satisfactory. However, there can be no assurances that NMHG will be able to successfully renegotiate its union contracts without work stoppages or on acceptable terms. A prolonged work stoppage at a unionized facility could have a material adverse effect on NMHG’s business and results of operations.
4
Environmental Matters
NMHG’s manufacturing operations are subject to laws and regulations relating to the protection of the environment, including those governing the management and disposal of hazardous substances. NMHG’s policies stress compliance, and NMHG believes it is currently in substantial compliance with existing environmental laws. If NMHG fails to comply with these laws or its environmental permits, then it could incur significant costs, including cleanup costs, fines and civil and criminal sanctions. In addition, future changes to environmental laws could require NMHG to incur significant additional expense or restrict operations. Based on current information, NMHG does not expect compliance with environmental requirements to have a material adverse effect on NMHG’s financial condition or results of operations.
In addition, NMHG’s products may be subject to laws and regulations relating to the protection of the environment, including those governing vehicle exhaust. Regulatory agencies in the United States and Europe have issued or proposed various regulations and directives designed to reduce emissions from spark-ignited engines and diesel engines used in off-road vehicles, such as industrial lift trucks. These regulations require NMHG and other lift truck manufacturers to incur costs to modify designs and manufacturing processes and to perform additional testing and reporting. While there can be no assurance, NMHG believes the impact of the additional expenditures to comply with these requirements will not have a material adverse effect on its business.
NMHG is investigating or remediating historical contamination at some current and former sites caused by its operations or those of businesses it acquired. NMHG has also been named as a potentially responsible party for cleanup costs under the so-called Superfund law at several third-party sites where NMHG (or its predecessors) disposed of wastes in the past. Under the Superfund law and often under similar state laws, the entire cost of cleanup can be imposed on any one of the statutorily liable parties, without regard to fault. While NMHG is not currently aware that any material outstanding claims or obligations exist with regard to these sites, the discovery of additional contamination at these or other sites could result in significant cleanup costs that could have a material adverse effect on NMHG’s financial conditions and results of operations.
In connection with any acquisition made by NMHG, NMHG could, under some circumstances, be held financially liable for or suffer other adverse effects due to environmental violations or contamination caused by prior owners of businesses NMHG has acquired. In addition, under some of the agreements through which NMHG has sold businesses or assets, NMHG has retained responsibility for certain contingent environmental liabilities arising from pre-closing operations. These liabilities may not arise, if at all, until years later and could require NMHG to incur significant additional expenses.
Government and Trade Regulations
In the past, NMHG’s business has been affected by trade disputes between the United States and Europe. In the future, to the extent NMHG is affected by trade disputes and increased tariffs are levied on its goods, its results of operations may be materially adversely affected.
B. Hamilton Beach Brands
General
HBB is a leading designer, marketer and distributor of small electric household appliances, as well as commercial products for restaurants, bars and hotels. HBB’s products are marketed primarily to retail merchants and wholesale distributors.
Sales and Marketing
HBB designs, markets and distributes a wide range of small electric household appliances, including blenders, can openers, coffeemakers, food processors, indoor electric and outdoor gas grills, irons, mixers, slow cookers, toasters and toaster ovens. HBB also markets a line of air purifiers and odor eliminators. In addition, HBB designs, markets and distributes commercial products for restaurants, bars and hotels. HBB generally markets its “better” and “best” segments under the Hamilton Beach
®
brand and uses the Proctor Silex
®
brand for the “good” segment and its opening price point products. HBB markets premium products under the Hamilton Beach
®
eclectrics
®
brand. HBB also markets air purifiers, allergen reducers and home odor elimination products under the TrueAir
®
brand.
Furthermore, HBB supplies Wal-Mart with certain GE-brand kitchen electric and garment-care appliances under Wal-Mart’s license agreement with General Electric Company. In addition, HBB supplies Kohl’s with certain Food Network-branded kitchen appliances. HBB has licensed the Melitta
®
brand from Melitta, North America, Inc. for a unique line of coffee and hot beverage appliances. HBB supplies additional private label products on a limited basis throughout North America.
HBB markets its retail products primarily in North America, but also sells products in Latin America and other selected markets. HBB commercial products are sold worldwide. Retail sales are generated predominantly by a network of inside sales employees to mass merchandisers, national department stores, variety store chains, drug store chains, specialty home retailers,
5
distributors and other retail outlets. Wal-Mart accounted for approximately 30%, 36% and 38% of HBB’s revenues in
2011
,
2010
and
2009
, respectively. HBB’s five largest customers accounted for approximately 50%, 55% and 61% of HBB’s revenues for the years ended
December 31, 2011
,
2010
and
2009
, respectively. The loss of or significant reduction in sales to any key customer could result in significant decreases in HBB’s revenue and profitability and an inability to sustain or grow its business.
Sales promotion activities are primarily focused on cooperative advertising. In addition, HBB promotes certain of its innovative products through the use of television, web and print advertising. HBB also licenses certain of its trademarks to various licensees for use with microwaves, compact refrigerators, cookware, kitchen tools and gadgets and hand and stick vacuums.
Because of the seasonal nature of the markets for small electric appliances, HBB’s management believes backlog is not a meaningful indicator of performance and is not a significant indicator of annual sales. Backlog represents customer orders, which may be cancelled at any time prior to shipment. Backlog for HBB was approximately $13.1 million and $11.7 million at
December 31, 2011
and
2010
, respectively.
HBB’s warranty program to the consumer consists generally of a limited warranty lasting for varying periods of up to five years for electric appliances, with the majority of products having a warranty of one year. Under its warranty program, HBB may repair or replace, at its option, those products found to contain manufacturing defects.
The market for small electric household appliances is highly seasonal in nature. Revenues and operating profit for HBB are traditionally greater in the second half of the year as sales of small electric appliances to retailers and consumers increase significantly with the fall holiday-selling season. Because of the seasonality of purchases of its products, HBB generally uses a substantial amount of cash or short-term debt to finance inventories and accounts receivable in anticipation of the fall holiday-selling season.
Patents, Trademarks, Copyrights and Licenses
HBB holds patents and trademarks registered in the United States and foreign countries for various products. HBB believes its business is not dependent upon any individual patent, copyright or license, but that the Hamilton Beach
®
and Proctor Silex
®
trademarks are material to its business.
Product Design and Development
HBB spent $7.4 million in
2011
, $7.6 million in
2010
and $6.8 million in
2009
on product design and development activities.
Key Suppliers and Raw Material
The majority of HBB’s products are supplied to its specifications by third-party suppliers located in China. HBB does not maintain long-term purchase contracts with suppliers and operates mainly on a purchase order basis. HBB generally negotiates purchase orders with its foreign suppliers in U.S. dollars. The weakening of the U.S. dollar against local currencies could result in certain manufacturers increasing the U.S. dollar prices for future product purchases.
During
2011
, HBB purchased approximately 98% of its finished products from suppliers in China. HBB does not currently depend on any single supplier. HBB believes the loss of any one supplier would not have a long-term material adverse effect on its business as there are adequate third-party supplier choices available that can meet HBB’s production and quality requirements. However, the loss of a supplier could, in the short term, adversely affect HBB’s business until alternative supply arrangements are secured.
The principal raw materials used by HBB’s third-party suppliers to manufacture its products are plastic, glass, steel, copper, aluminum and packaging materials. HBB believes adequate quantities of raw materials are available from various suppliers.
Competition
The small electric household appliance industry does not have onerous entry barriers. As a result, HBB competes with many small manufacturers and distributors of housewares products. Based on publicly available information about the industry, HBB believes it is one of the largest full-line distributors and marketers of small electric household appliances in North America based on key product categories.
As retailers generally purchase a limited selection of small electric appliances, HBB competes with other suppliers for retail shelf space. HBB conducts consumer advertising for the Hamilton Beach
®
and Proctor Silex
®
brands. HBB believes the principal areas of competition with respect to its products are product design and innovation, quality, price, product features, merchandising, promotion and warranty.
6
Government Regulation
HBB is subject to numerous federal and state health, safety and environmental regulations. HBB’s management believes the impact of expenditures to comply with such laws will not have a material adverse effect on HBB.
As a marketer and distributor of consumer products, HBB is subject to the Consumer Products Safety Act and the Federal Hazardous Substances Act, which empower the U.S. Consumer Product Safety Commission (“CPSC”) to seek to exclude products that are found to be unsafe or hazardous from the market. Under certain circumstances, the CPSC could require HBB to repair, replace or refund the purchase price of one or more of HBB’s products, or HBB may voluntarily do so.
Throughout the world, electrical appliances are subject to various mandatory and voluntary standards, including requirements in some jurisdictions that products be listed by Underwriters’ Laboratories, Inc. (“UL”) or other similar recognized laboratories. HBB also uses the Intertek Testing Services for certification and testing of compliance with UL standards, as well as other nation- and industry-specific standards. HBB endeavors to have its products designed to meet the certification requirements of, and to be certified in, each of the jurisdictions in which they are sold.
Employees
As of
January 31, 2012
, HBB’s work force consisted of approximately 500 employees, most of whom are not represented by unions. In Canada, as of January 31, 2012, 16 hourly employees at HBB’s Picton, Ontario distribution facility were unionized. These employees are represented by an employee association which performs a consultative role on employment matters. None of HBB’s U.S. employees are unionized. HBB believes its current labor relations with both union and non-union employees are satisfactory.
C. Kitchen Collection
General
KC is a national specialty retailer of kitchenware and gourmet foods operating under the Kitchen Collection
®
and Le Gourmet Chef
®
store names in outlet and traditional malls throughout the United States.
Sales and Marketing
KC operated 337 retail stores as of
December 31, 2011
. Kitchen Collection
®
stores are located primarily in factory outlet and traditional malls and feature merchandise of highly recognizable name-brand manufacturers, including Hamilton Beach
®
and Proctor Silex
®
. Le Gourmet Chef
®
stores are located primarily in factory outlet and traditional malls throughout the United States and feature gourmet foods and home entertainment products, as well as brand name electric and non-electric kitchen items, including Hamilton Beach
®
.
Seasonality
Revenues and operating profit for KC are traditionally greater in the second half of the year as sales to consumers increase significantly with the fall holiday-selling season. Because of the seasonality of purchases of its products, KC incurs substantial short-term debt to finance inventories in anticipation of the fall holiday-selling season.
Product Design and Development
KC, a retailer, has no expenditures for product design and development activities.
Product Sourcing and Distribution
KC purchases all inventory centrally, which allows KC to take advantage of volume purchase discounts and monitor controls over inventory and product mix. KC purchases its inventory from approximately 250 suppliers, none of which represented over 10% of purchases during the year ended
December 31, 2011
. KC does not currently depend on any single supplier. KC believes that the loss of any one supplier would not have a long-term material adverse effect on its business as there are adequate third-party supplier choices available that can meet KC’s requirements. However, the loss of a supplier could, in the short term, adversely affect KC’s business until alternative supply arrangements are secured.
KC currently maintains its inventory for distribution to its stores at a distribution center located near its corporate headquarters in Chillicothe, Ohio.
Because KC's coverage of the outlet mall channel of the retail industry is high, KC continues to explore alternate areas of growth and diversification. For the past several years, KC has been testing alternative store formats both within the outlet mall industry and in the more traditional retail environments, including the traditional mall store format. Because not all of these formats have met KC’s rigorous financial performance standards, KC continues to explore alternate channels of distribution,
7
including increased distribution through the internet. In addition, KC is exploring alternatives for Le Gourmet Chef
®
stores in outlet malls, traditional malls and distribution through the internet.
Competition
KC competes against a diverse group of retailers, including specialty stores, department stores, discount stores and catalog retailers. The retail environment continues to be extremely competitive. Widespread Chinese sourcing of products allows many retailers to offer value-priced kitchen products.
KC believes there is growth potential in kitchenware retailing, but only through offering unique, high quality products at prices affordable to most consumers. While a number of very low-end and very high-end kitchenware retailers participate in the marketplace, KC believes there is still an opportunity for stores offering mid-priced, high-quality kitchenware.
Patents, Trademarks, Copyrights and Licenses
KC holds trademarks registered in the United States for the Kitchen Collection
®
and Le Gourmet Chef
®
store names. KC believes that the Kitchen Collection
®
and Le Gourmet Chef
®
store name trademarks are material to its business.
Employees
As of
January 31, 2012
, KC’s work force consisted of approximately 1,700 employees. None of KC’s employees are unionized. KC believes its current labor relations with employees are satisfactory.
D. North American Coal
General
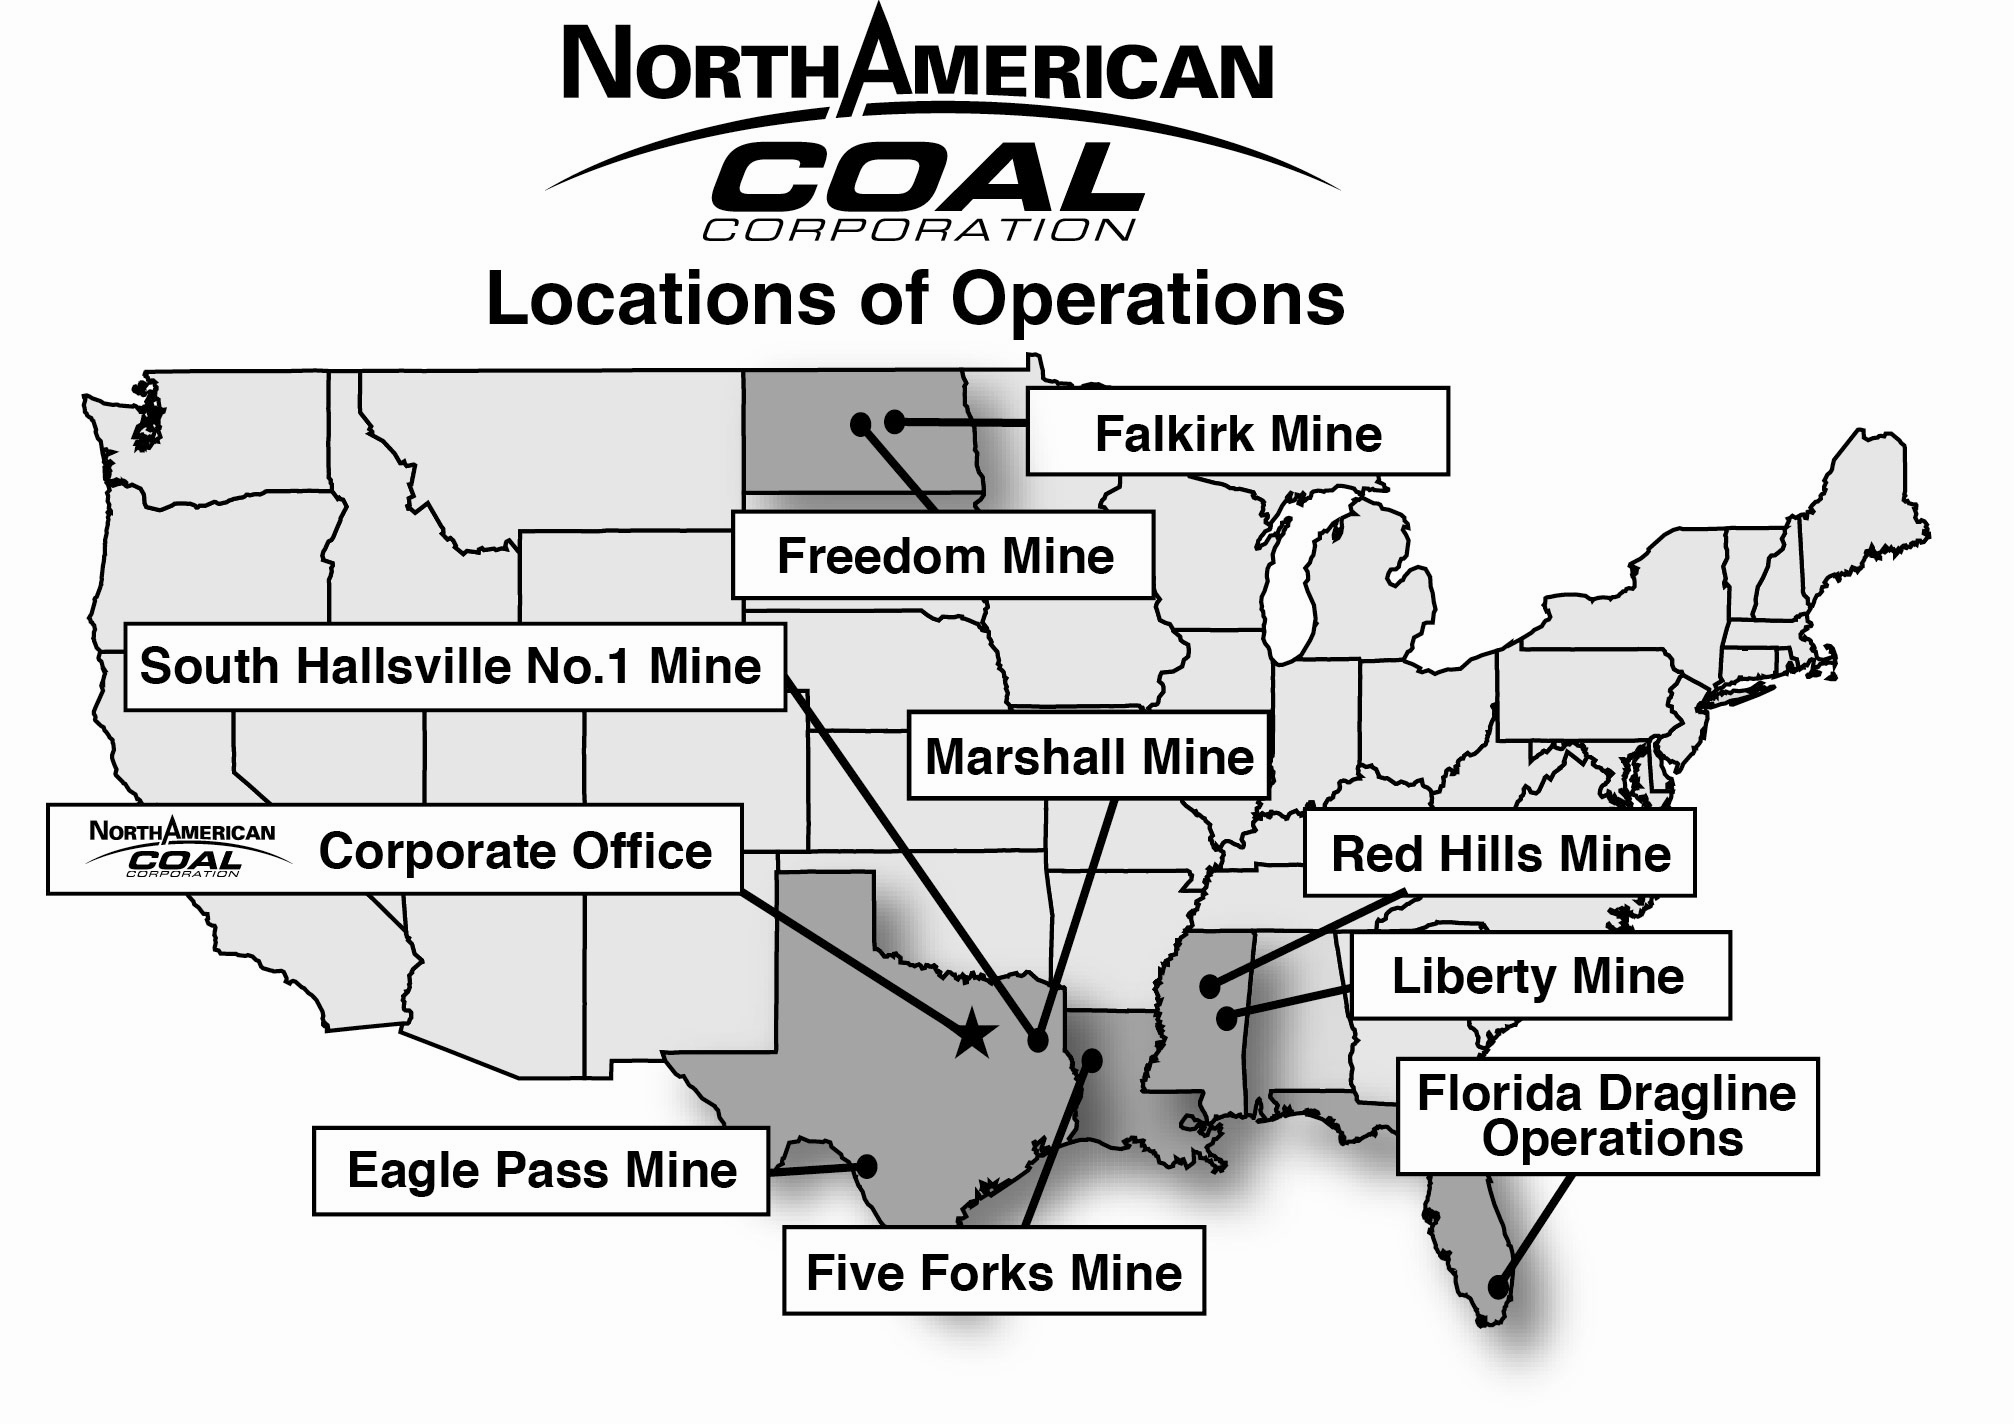
NACoal mines and markets coal primarily as fuel for power generation and provides selected value-added mining services for other natural resources companies. Coal is or will be surface mined in Louisiana, Mississippi, North Dakota and Texas. NACoal has one consolidated mining operation: Mississippi Lignite Mining Company (“MLMC”). NACoal has nine unconsolidated operations: The Coteau Properties Company (“Coteau”), The Falkirk Mining Company (“Falkirk”), The Sabine Mining Company (“Sabine”), Demery Resources Company, LLC (“Demery”), Caddo Creek Resources Company, LLC (“Caddo Creek”), Camino Real Fuels, LLC (“Camino Real”), Liberty Fuels Company, LLC (“Liberty”), NoDak Energy Services, LLC (“NoDak”) and North American Coal Corporation India Private Limited (“NACC India”). Demery, Caddo Creek, Camino Real and Liberty are in the development stage and do not currently mine or deliver coal. NoDak was formed to operate and maintain a coal processing facility. NACC India was formed to provide technical advisory services to the third-party owners of a mine in India. NACoal also provides dragline mining services for independently owned limerock quarries in Florida. At the end of 2010, NACoal's contract at the San Miguel Lignite Mine (“San Miguel”) expired and its mining operations were transitioned to another company. During 2009, NACoal completed the sale of certain assets of the Red River Mining Company (“Red River”).
The contracts with the unconsolidated operations' customers provide for reimbursement at a price based on actual costs plus an agreed pre-tax profit per ton of coal sold or actual costs plus a management fee.
At
December 31, 2011
, NACoal’s operating mines consisted both of mines where the reserves were acquired and developed by NACoal, as well as mines where reserves were owned by the customers of the mines. It is currently contemplated that the reported reserves will be mined within the term of the leases for each of the mines NACoal operates and controls the reserves. In the future, if any of the leases are projected to expire before mining operations can commence, it is currently expected that each such lease would be amended to extend the term or new leases would be negotiated. Under these terms, NACoal expects coal mined pursuant to these leases will be available to meet its production requirements.
The majority of NACoal's revenues is generated from its consolidated mining operations and dragline mining services. MLMC's customer, Choctaw Generation Limited Partnership, accounted for approximately 77%, 49% and 58% of NACoal's revenues for the years ended
December 31, 2011
,
2010
and
2009
, respectively. San Miguel's customer, San Miguel Electric Cooperative, accounted for approximately 29% and 31% of NACoal's revenues for the years ended
December 31, 2010
and
2009
, respectively.
8
Sales, Marketing and Operations
The principal coal customers of NACoal are electric utilities, an independent power provider and a synfuels plant. The distribution of coal sales, including sales of the unconsolidated mines, in the last five years has been as follows:
|
|
Distribution
|
||||
|
|
Electric Utilities/Independent Power Provider
|
Synfuels Plant
|
|||
|
2011
|
78
|
%
|
22
|
%
|
|
|
2010
|
82
|
%
|
18
|
%
|
|
|
2009
|
82
|
%
|
18
|
%
|
|
|
2008
|
82
|
%
|
18
|
%
|
|
|
2007
|
82
|
%
|
18
|
%
|
|
The total coal production by mine (in millions of tons) for the three years ended December 31 and the weighted average prices per ton delivered for the three years ended December 31 are as follows:
|
|
2011
|
2010
|
2009
|
||||||||
|
Unconsolidated Mines
|
|
|
|
||||||||
|
Freedom
|
13.6
|
|
14.6
|
|
15.0
|
|
|||||
|
Falkirk
|
7.5
|
|
7.6
|
|
8.1
|
|
|||||
|
South Hallsville No. 1
|
4.0
|
|
4.6
|
|
3.8
|
|
|||||
|
Consolidated Mines
|
|
|
|||||||||
|
Red Hills
|
2.8
|
|
4.0
|
|
3.4
|
|
|||||
|
San Miguel
|
—
|
|
3.3
|
|
3.2
|
|
|||||
|
Total tons produced
|
27.9
|
|
34.1
|
|
33.5
|
|
|||||
|
Oxbow (discontinued operations)
|
—
|
|
—
|
|
0.7
|
|
|||||
|
Price per ton delivered
|
$
|
20.06
|
|
$
|
17.52
|
|
$
|
16.42
|
|
||
The contracts under which certain of the unconsolidated mines were organized provide that, under certain conditions of default, the customer(s) involved may elect to acquire the assets (subject to the liabilities) or the capital stock of the subsidiary for an amount effectively equal to book value. NACoal does not know of any conditions of default that currently exist. In one case, the customer may elect to acquire the stock of the subsidiary upon a specified period of notice without reference to default, in exchange for certain payments on coal mined thereafter. NACoal does not know of any current intention of any customer to acquire the stock of a subsidiary or terminate a contract for convenience. In addition, the contracts under which certain of the unconsolidated mines were organized provide that, under certain conditions of default or termination by the customer, the subsidiaries have the right to acquire certain or all of the assets of the mines under the same terms as a third-party purchaser.
9
The location, mine type, reserve data, coal quality characteristics, customer, sales tonnage and contract expiration date for the mines operated by NACoal in
2011
were as follows:
COAL MINING OPERATIONS ON AN “AS RECEIVED” BASIS
|
|
|
2011
|
2010
|
||||||||||||||||||||||||||||
|
|
|
Proven and Probable Reserves (a)(b)
|
|
|
|
|
|
|
|||||||||||||||||||||||
|
|
|
Committed
Under
Contract
|
Uncommitted
|
Total
|
Tons
Delivered
(Millions)
|
Owned
Reserves
(%)
|
Leased
Reserves
(%)
|
Total
Committed
and
Uncommitted
(Millions of
Tons)
|
Tons
Delivered
(Millions)
|
Contract
Expires
|
|||||||||||||||||||||
|
Mine/Reserve
|
Type of Mine
|
(Millions of Tons)
|
|||||||||||||||||||||||||||||
|
Unconsolidated Mines
|
|
|
|
|
|
|
|
|
|
|
|
||||||||||||||||||||
|
Freedom Mine (c)
|
Surface Lignite
|
549.5
|
|
—
|
|
549.5
|
|
13.5
|
|
2
|
%
|
98
|
%
|
561.2
|
|
14.6
|
|
2017
|
|
(d)
|
|||||||||||
|
Falkirk Mine (c)
|
Surface Lignite
|
435.8
|
|
—
|
|
435.8
|
|
7.5
|
|
1
|
%
|
99
|
%
|
461.5
|
|
7.6
|
|
2045
|
|
|
|||||||||||
|
South Hallsville No. 1 Mine (c)
|
Surface Lignite
|
(e)
|
|
(e)
|
|
(e)
|
|
4.2
|
|
(e)
|
|
(e)
|
|
(e)
|
|
4.4
|
|
2035
|
|
|
|||||||||||
|
Five Forks Mine (c)
|
Surface Lignite
|
(e)
|
|
(e)
|
|
(e)
|
|
(g)
|
|
(e)
|
|
(e)
|
|
(e)
|
|
(g)
|
|
2030
|
|
|
|||||||||||
|
Marshall Mine (c)
|
Surface Lignite
|
(e)
|
|
(e)
|
|
(e)
|
|
(g)
|
|
(e)
|
|
(e)
|
|
(e)
|
|
(g)
|
|
2043
|
|
|
|||||||||||
|
Eagle Pass Mine (c)
|
Surface
Sub-bituminous
|
(e)
|
|
(e)
|
|
(e)
|
|
(g)
|
|
(e)
|
|
(e)
|
|
(e)
|
|
(g)
|
|
2012
|
|
(h)
|
|||||||||||
|
Liberty Mine (c)
|
Surface Lignite
|
(e)
|
|
(e)
|
|
(e)
|
|
(g)
|
|
(e)
|
|
(e)
|
|
(e)
|
|
(g)
|
|
2054
|
(i)
|
||||||||||||
|
Consolidated Mines (j)
|
|
|
|
|
|
|
|
|
|
|
|
|
|||||||||||||||||||
|
Red Hills Mine
|
Surface Lignite
|
125.6
|
|
101.3
|
|
226.9
|
|
2.7
|
|
27
|
%
|
73
|
%
|
227.8
|
|
3.6
|
|
2032
|
|
|
|||||||||||
|
Total Developed
|
|
1,110.9
|
|
101.3
|
|
1,212.2
|
|
27.9
|
|
|
|
1,250.5
|
|
30.2
|
|
|
|
||||||||||||||
|
Undeveloped Mines
|
|
|
|
|
|
|
|
|
|
|
|
||||||||||||||||||||
|
North Dakota
|
—
|
|
—
|
|
594.1
|
|
594.1
|
|
—
|
|
—
|
%
|
100
|
%
|
596.1
|
|
—
|
|
—
|
|
|
||||||||||
|
Texas
|
—
|
|
—
|
|
226.2
|
|
226.2
|
|
—
|
|
54
|
%
|
46
|
%
|
165.1
|
|
—
|
|
—
|
|
|
||||||||||
|
Eastern (f)
|
—
|
|
—
|
|
28.7
|
|
28.7
|
|
—
|
|
100
|
%
|
—
|
%
|
28.8
|
|
—
|
|
—
|
|
|
||||||||||
|
Mississippi
|
—
|
|
—
|
|
211.9
|
|
211.9
|
|
—
|
|
—
|
%
|
100
|
%
|
142.2
|
|
—
|
|
—
|
|
|
||||||||||
|
Total Undeveloped
|
|
—
|
|
1,060.9
|
|
1,060.9
|
|
|
|
|
932.2
|
|
|
|
|
||||||||||||||||
|
Total Developed/Undeveloped
|
|
1,110.9
|
|
1,162.2
|
|
2,273.1
|
|
|
|
|
2,182.7
|
|
|
|
|
||||||||||||||||
|
|
|
Average Coal Quality (As received)
|
|||||||||||||||||||||
|
Mine/Reserve
|
Type of Mine
|
Coal Formation or
Coal Seam(s)
|
Average Seam
Thickness (feet)
|
Average
Depth (feet)
|
BTUs/lb
|
Sulfur (%)
|
Ash (%)
|
Moisture (%)
|
|||||||||||||||
|
Unconsolidated Mines
|
|
|
|
|
|
|
|
|
|||||||||||||||
|
Freedom Mine (c)
|
Surface Lignite
|
Beulah-Zap Seams
|
18
|
|
130
|
|
6,700
|
|
0.9
|
%
|
9
|
%
|
36
|
%
|
|||||||||
|
Falkirk Mine (c)
|
Surface Lignite
|
Hagel A&B, Tavis
Creek Seams
|
8
|
|
60
|
|
6,200
|
|
0.6
|
%
|
11
|
%
|
38
|
%
|
|||||||||
|
South Hallsville No. 1 Mine (c)
|
Surface Lignite
|
(e)
|
(e)
|
|
(e)
|
|
(e)
|
|
(e)
|
|
(e)
|
|
(e)
|
|
|||||||||
|
Five Forks Mine (c)
|
Surface Lignite
|
(e)
|
(e)
|
|
(e)
|
|
(e)
|
|
(e)
|
|
(e)
|
|
(e)
|
|
|||||||||
|
Marshall Mine (c)
|
Surface Lignite
|
(e)
|
(e)
|
|
(e)
|
|
(e)
|
|
(e)
|
|
(e)
|
|
(e)
|
|
|||||||||
|
Eagle Pass Mine (c)
|
Surface
Sub-bituminous
|
(e)
|
(e)
|
|
(e)
|
|
(e)
|
|
(e)
|
|
(e)
|
|
(e)
|
|
|||||||||
|
Liberty Mine (c)
|
Surface Lignite
|
(e)
|
(e)
|
|
(e)
|
|
(e)
|
|
(e)
|
|
(e)
|
|
(e)
|
|
|||||||||
|
Consolidated Mines (j)
|
|
|
|
|
|
|
|
|
|||||||||||||||
|
Red Hills Mine
|
Surface Lignite
|
C, D, E, F, G, H Seams
|
3.6
|
|
150
|
|
5,200
|
|
0.6
|
%
|
14
|
%
|
43
|
%
|
|||||||||
|
Undeveloped Mines
|
|
|
|||||||||||||||||||||
|
North Dakota
|
—
|
|
Fort Union Formation
|
13
|
|
130
|
|
6,500
|
|
0.8
|
%
|
8
|
%
|
38
|
%
|
||||||||
|
Texas
|
—
|
|
Wilcox Formation
|
5
|
|
120
|
|
6,800
|
|
1.0
|
%
|
16
|
%
|
30
|
%
|
||||||||
|
Eastern (f)
|
—
|
|
Freeport & Kittanning
|
4
|
|
400
|
|
12,070
|
|
3.3
|
%
|
12
|
%
|
3
|
%
|
||||||||
|
Mississippi
|
—
|
|
Wilcox Formation
|
5
|
|
130
|
|
5,200
|
|
0.6
|
%
|
13
|
%
|
44
|
%
|
||||||||
10
|
(a)
|
Committed and uncommitted tons represent in-place estimates. The projected extraction loss is approximately 10% of the proven and probable reserves, except with respect to the Eastern Undeveloped Mining Operations, in which case the extraction loss is approximately 30% of the proven and probable reserves.
|
|
(b)
|
NACoal’s reserve estimates are generally based on the entire drill hole database, which was used to develop a geologic computer model using a 200 foot grid and inverse distance to the second power as an interpolator. None of NACoal’s coal reserves have been reviewed by independent experts. As such, all reserves are considered proven (measured) within NACoal’s reserve estimate.
|
|
(c)
|
The contracts for these mines require the customer to cover the cost of the ongoing replacement and upkeep of the plant and equipment of the mine.
|
|
(d)
|
Although the term of the existing coal sales agreement terminates in 2017, the term may be extended for four additional periods of five years, or until 2037, at the option of Coteau.
|
|
(e)
|
The reserves are owned and controlled by the customer and, therefore, have not been listed in the table.
|
|
(f)
|
The proven and probable reserves included in the table do not include coal that is leased to others. NACoal had 79.5 million tons and 80.1 million tons in
2011
and
2010
, respectively, of Eastern Undeveloped Mining Operations with leased coal committed under contract.
|
|
(g)
|
These mines are in the development stage and no coal was delivered during
2011
or
2010
.
|
|
(h)
|
Although the term of the existing contract mining agreement expires in 2012, it extends automatically if NACoal’s customer’s third-party coal supply agreement is extended, and can be terminated in certain circumstances by either party.
|
|
(i)
|
The contract term is for 40 years commencing the year commercial deliveries begin, which is anticipated to be 2014.
|
|
(j)
|
The San Miguel Lignite Mine was operated by NACoal during 2010, but is not included in the table above or in the disclosures that follow because at the end of 2010, NACoal's contract at the San Miguel Lignite Mine expired and its mining operations were transitioned to another company.
|
11
Unconsolidated Mines
Freedom Mine — The Coteau Properties Company
The Freedom Mine, operated by Coteau, is located approximately 90 miles northwest of Bismarck, North Dakota. The main entrance to the Freedom Mine is accessed by means of a paved road and is located on County Road 15. Coteau holds 290 leases granting the right to mine approximately 36,831 acres of coal interests and the right to utilize approximately 25,168 acres of surface interests. In addition, Coteau owns in fee 30,547 acres of surface interests and 4,345 acres of coal interests. Substantially all of the leases held by Coteau were acquired in the early 1970s and have been replaced with new leases or have lease terms for a period sufficient to meet Coteau’s contractual production requirements.
The Freedom Mine generally produces between 13 million and 15 million tons of lignite coal annually. The mine started delivering coal in 1983. All production from the mine is sold to Dakota Coal Company, a wholly owned subsidiary of Basin Electric Power Cooperative. Dakota Coal Company then sells the coal to Great Plains Synfuels Plant, Antelope Valley Station and Leland Olds Station, all of which are affiliates of Basin Electric Power Cooperative.
The reserves are located in Mercer County, North Dakota, starting approximately two miles north of Beulah, North Dakota. The center of the basin is located near the city of Williston, North Dakota, approximately 100 miles northwest of the Freedom Mine. The economically mineable coal in the reserve occurs in the Sentinel Butte Formation, and is overlain by the Coleharbor Formation. The Coleharbor Formation unconformably overlies the Sentinel Butte Formation. It includes all of the unconsolidated sediments resulting from deposition during glacial and interglacial periods. Lithologic types include gravel, sand, silt, clay and till. The modified glacial channels are in-filled with gravels, sands, silts and clays overlain by till. The coarser gravel and sand beds are generally limited to near the bottom of the channel fill. The general stratigraphic sequence in the upland portions of the reserve area consists of till, silty sands and clayey silts.
Falkirk Mine — The Falkirk Mining Company
The Falkirk Mine, operated by Falkirk, is located approximately 50 miles north of Bismarck, North Dakota on a paved access road off U.S. Highway 83. Falkirk holds 314 leases granting the right to mine approximately 50,721 acres of coal interests and the right to utilize approximately 29,573 acres of surface interests. In addition, Falkirk owns in fee 36,937 acres of surface interests and 1,270 acres of coal interests. Substantially all of the leases held by Falkirk were acquired in the early 1970s with initial terms that have been further extended by the continuation of mining operations.
The Falkirk Mine generally produces between 7 million and 9 million tons of lignite coal annually for the Coal Creek Station, an electric power generating station owned by Great River Energy. All production from the mine is used by Coal Creek Station. The mine started delivering coal in 1978.
The reserves are located in McLean County, North Dakota, from approximately nine miles northwest of the town of Washburn, North Dakota to four miles north of the town of Underwood, North Dakota. Structurally, the area is located on an intercratonic basin containing a thick sequence of sedimentary rocks. The economically mineable coals in the reserve occur in the Sentinel Butte Formation and the Bullion Creek Formation and are unconformably overlain by the Coleharbor Formation. The Sentinel Butte Formation conformably overlies the Bullion Creek Formation. The general stratigraphic sequence in the upland portions of the reserve area (Sentinel Butte Formation) consists of till, silty sands and clayey silts, main hagel lignite bed, silty clay, lower lignite of the hagel lignite interval and silty clays. Beneath the Tavis Creek, there is a repeating sequence of silty to sand clays with generally thin lignite beds.
South Hallsville No. 1 Mine — The Sabine Mining Company
The South Hallsville No. 1 Mine, operated by Sabine, is located approximately 150 miles east of Dallas, Texas on FM 968. The entrance to the mine is by means of a paved road. Sabine has no title, claim, lease or option to acquire any of the reserves at the South Hallsville No. 1 Mine. Southwestern Electric Power Company controls all of the reserves within the South Hallsville No. 1 Mine.
The South Hallsville No. 1 Mine has two active pits generally producing between 3 million and 5 million tons of lignite coal annually based upon Southwestern Electric Power Company’s demand for its Henry W. Pirkey Plant and other contractual requirements. The mine started delivering coal in 1985.
Five Forks Mine — Demery Resources Company, LLC
The Five Forks Mine, to be operated by Demery, is in the development stage and is located approximately three miles north of Creston, Louisiana on State Highway 153. Access to the Five Forks Mine will be by means of a gravel road. Demery will have no title, claim, lease or option to acquire any of the reserves at the Five Forks Mine. Five Forks Mining, LLC will control all of the reserves within the Five Forks Mine.
12
Marshall Mine — Caddo Creek Resources Company, LLC
The Marshall Mine, to be operated by Caddo Creek, is in the development stage and is located approximately ten miles south of Marshall, Texas on FM-1186. Access to the Marshall Mine will be by means of a paved road. Caddo Creek will have no title, claim, lease or option to acquire any of the reserves at the Marshall Mine. Marshall Mine, LLC will control all of the reserves within the Marshall Mine.
Eagle Pass Mine — Camino Real Fuels, LLC
The Eagle Pass Mine, to be operated by Camino Real, is in the development stage and is located approximately six miles north of Eagle Pass, Texas on State Highway 1588. Access to the Eagle Pass Mine has not been determined. Camino Real will have no title, claim, lease or option to acquire any of the reserves at the Eagle Pass Mine. Dos Republicas Coal Partnership will control all of the reserves within the Eagle Pass Mine.
Liberty Mine — Liberty Fuels Company, LLC
The Liberty Mine, to be operated by Liberty, is in the development stage and is located approximately 20 miles north of Meridian, Mississippi off State Highway 493. Liberty will have no title, claim, lease or option to acquire any of the reserves at the Liberty Mine. Mississippi Power Company will control all of the reserves within the Liberty Mine.
Consolidated Mines
Red Hills Mine — Mississippi Lignite Mining Company
The Red Hills Mine, operated by MLMC, is located approximately 120 miles northeast of Jackson, Mississippi. The entrance to the mine is by means of a paved road located approximately one mile west of Highway 9. MLMC holds 129 leases granting the right to mine approximately 7,710 acres of coal interests and the right to utilize approximately 7,379 acres of surface interests. In addition, MLMC owns in fee 2,643 acres of surface interests and 1,944 acres of coal interests. Substantially all of the leases held by MLMC were acquired during the mid-1970s to the early 1980s with terms totaling 50 years, many of which can be further extended by the continuation of mining operations.
The Red Hills Mine generally produces between 2 million and 4 million tons of lignite coal annually for the Red Hills Power Plant. The mine started delivering coal in 2000.
The lignite deposits of the Gulf Coast are found primarily in a narrow band of strata that outcrops/subcrops along the margin of the Mississippi embayment. The potentially exploitable tertiary lignites in Mississippi are found in the Wilcox Group. The outcropping Wilcox is composed predominately of non-marine sediments deposited on a broad flat plain.
Florida Dragline Operations — The North American Coal Corporation
NACoal’s Florida Dragline Operations operate draglines to mine limerock at the following quarries in Florida pursuant to mining services agreements with the quarry owners:
|
Quarry Name
|
|
Location
|
|
Quarry Owner
|
|
Year NACoal Started Dragline Operations
|
|
White Rock Quarry — North
|
|
Miami
|
|
WRQ
|
|
1995
|
|
White Rock Quarry — South
|
|
Miami
|
|
WRQ
|
|
2005
|
|
Krome Quarry
|
|
Miami
|
|
Cemex
|
|
2003
|
|
Alico Quarry
|
|
Ft. Myers
|
|
Cemex
|
|
2004
|
|
FEC Quarry
|
|
Miami
|
|
Cemex
|
|
2005
|
|
Pennsuco Quarry
|
|
Miami
|
|
Tarmac
|
|
2005
|
|
SCL Quarry
|
|
Miami
|
|
Cemex
|
|
2006
|
|
Card Sound Quarry
|
|
Miami
|
|
Cemex
|
|
2009
|
Vecellio & Grogan, Inc., d/b/a White Rock Quarries (“WRQ”), Cemex S.A.B. de C.V. (“Cemex”) and Tarmac America LLC (“Tarmac”) control all of the limerock reserves within their respective quarries. WRQ and Cemex perform drilling programs occasionally for the purpose of redefining the bottom of the limerock bed.
Access to the White Rock Quarry is by means of a paved road from 122nd Avenue, access to the Krome Quarry is by means of
13
a paved road from Krome Avenue and access to Pennsuco Quarry is by means of a paved road from NW 121st Way. Access to the FEC Quarry is by means of a paved road from NW 118th Avenue and access to the Alico Quarry is by means of a paved road from Alico Road. Access to the SCL Quarry is by means of a paved road from NW 137th Avenue and access to the Card Sound Quarry is by means of a paved road from SW 408th Street. Florida Dragline Operations have no title, claim, lease or option to acquire any of the reserves at the White Rock Quarry (North and South), the FEC Quarry, the Krome Quarry, the Pennsuco Quarry, the SCL Quarry, the Alico Quarry or the Card Sound Quarry.
North American Coal Royalty Company
No operating mines currently exist on the undeveloped reserves in North Dakota, Texas and Mississippi. NACoal Royalty Company does receive certain royalty payments from unrelated third parties for production or advance royalty payments for oil and gas, as well as for coal reserves located in Ohio, Pennsylvania, North Dakota, Louisiana and Texas.
During 2009, NACoal received bonus payments for the lease of certain oil and gas mineral rights to a third party. The Company recorded a gain of $7.1 million in 2009 related to these payments.
General Information about the Mines
Leases
. The leases held by Coteau, Falkirk and MLMC have a variety of continuation provisions, but generally they permit the leases to be continued beyond their fixed terms. Under the terms of the leases held by these companies, each respective company expects that coal mined pursuant to its leases will be available to meet its production requirements.
No Previous Operators
. There were no previous operators of the Freedom Mine, Falkirk Mine, South Hallsville No. 1 Mine or Red Hills Mine.
Exploration and Development
. The Freedom Mine, Falkirk Mine, South Hallsville No. 1 Mine and Red Hills Mine are well past the exploration stage and are in production. Additional pit development is underway at each mine. Drilling programs are routinely conducted for the purpose of refining guidance related to ongoing operations. For example, at the Red Hills Mine, the lignite coal reserve has been defined by a drilling program that is designed to provide 500-foot spaced drill holes for areas anticipated to be mined within six years of the current pit. Drilling beyond the six-year horizon ranges from 1,000 to 2,000-foot centers. Drilling is conducted every other year to stay current with the advance of mining operations. Demery, Caddo Creek, Camino Real and Liberty are in the mine planning and design phase. Caddo Creek is involved in initial mine permitting. Camino Real is involved in substantial revisions to an existing mine permit. Geological evaluation is in process at all four locations.
Facilities and Equipment
. The facilities and equipment for each of the mines are maintained to allow for safe and efficient operation. The equipment is well maintained, in good physical condition and is either updated or replaced periodically with the latest models or upgrades available to keep up with modern technology. As equipment wears out, the mines evaluate what
replacement option will be the most cost efficient, including the evaluation of both new and used equipment, and proceed with that replacement. The majority of electrical power for the draglines, shovels, coal crushers, coal conveyors and facilities generally is provided by the utility customer for the applicable mine. Electrical power for the Sabine facilities is provided by Upshur Rural Electric Co-op. Electrical power for the Sabine draglines is provided by the Pirkey Power Plant. The remainder of the equipment generally is powered by diesel or gasoline.
14
The total cost of the property, plant and equipment, net of applicable accumulated amortization and depreciation as of
December 31, 2011
, for each of the mines is set forth in the chart below.
|
Mine
|
Total Historical Cost of Mine
Property, Plant and Equipment
(excluding Coal Lands, Real Estate
and Construction in Progress), Net of
Applicable Accumulated
Amortization and Depreciation
|
|||
|
|
(
in millions)
|
|||
|
Unconsolidated Mining Operations
|
|
|||
|
Freedom Mine — The Coteau Properties Company
|
$
|
114.7
|
|
|
|
Falkirk Mine — The Falkirk Mining Company
|
$
|
111.6
|
|
|
|
South Hallsville No. 1 Mine — The Sabine Mining Company
|
$
|
162.1
|
|
|
|
Five Forks Mine — Demery Resources Company, LLC
|
$
|
—
|
|
|
|
Marshall Mine — Caddo Creek Resources Company, LLC
|
$
|
—
|
|
|
|
Eagle Pass Mine — Camino Real Fuels, LLC
|
$
|
—
|
|
|
|
Liberty Mine — Liberty Fuels, LLC
|
$
|
—
|
|
|
|
Consolidated Mining Operations
|
||||
|
Red Hills Mine — Mississippi Lignite Mining Company
|
$
|
34.7
|
|
|
|
Florida Dragline Operations — The North American Coal Corporation
|
$
|
3.1
|
|
|
Predominantly all of Demery, Caddo Creek, Camino Real and Liberty’s machinery and equipment is owned by NACoal’s customers. A substantial portion of MLMC’s machinery, trucks and equipment is rented under operating leases. All other draglines were purchased used and have been or will be updated with the latest technology.
Government Regulation
NACoal’s coal mining operations and dragline mining services are subject to various federal, state and local laws and regulations on matters such as employee health and safety, and certain environmental laws relating to, among others, the reclamation and restoration of properties after mining operations, air pollution, water pollution, the disposal of wastes and the effects on groundwater. In addition, the electric utility industry is subject to extensive regulation regarding the environmental impact of its power generation activities that could affect demand for coal from NACoal’s coal mining operations.
Numerous governmental permits and approvals are required for coal mining operations. NACoal or one of its subsidiaries holds or will hold the necessary permits at all of NACoal’s coal mining operations except Demery and Camino Real, where NACoal’s customers hold or will hold the permits. The Company believes, based upon present information provided to it by NACoal’s customers, that NACoal’s customers have or will have all environmental permits necessary for NACoal to operate Demery and Camino Real; however, the Company cannot be certain that NACoal’s customers will be able to obtain and/or maintain all such permits in the future.
At the coal mining operations where NACoal holds the permits, NACoal is required to prepare and present to federal, state or local governmental authorities data pertaining to the effect or impact that any proposed exploration for or production of coal may have upon the environment and public and employee health and safety.
The limerock quarries where NACoal provides dragline mining services are owned and operated by NACoal’s customers. All environmental permits for the limerock quarries are held by NACoal’s customers. During 2007, the U.S. District Court for the Southern District of Florida (“District Court”) issued an unfavorable decision that affected NACoal’s customers’ limerock mining permits in South Florida. The decision was appealed and upon appeal, the litigation was remanded back to the District Court.
On January 30, 2009, the District Court issued an order that set aside certain existing mining permits in the South Florida lake belt region where NACoal provides limerock mining services. By setting aside the existing mining permits previously issued by the U.S. Army Corps of Engineers, this order essentially prohibited mining in the lake belt region. An appeal of the District Court’s ruling was filed by the limerock producers, some of whom are NACoal’s customers. The appeal was unsuccessful.
In response to the District Court’s ruling, the U.S. Army Corps of Engineers issued a Final Supplemental Environmental Impact Statement (“FSEIS”) in May 2009. The requisite Department of Army Record of Decision (“ROD”) and statement of findings on the May 2009 FSEIS was released on February 1, 2010. New mining permits were issued for NACoal's customers at all of the limerock dragline mining operations during 2010.
15
Some laws, as discussed below, place many requirements on NACoal’s coal mining operations and the limerock quarries where NACoal provides dragline mining services. Federal and state regulations require regular monitoring of NACoal’s operations to ensure compliance.
Mine Health and Safety Laws
The Federal Mine Safety and Health Act of 1977 imposes safety and health standards on all coal mining operations. Regulations are comprehensive and affect numerous aspects of mining operations, including training of mine personnel, mining procedures, blasting, the equipment used in mining operations and other matters. The Federal Mine Safety and Health Administration enforces compliance with these federal laws and regulations.
Environmental Laws
NACoal’s coal mining operations are subject to various federal environmental laws, including:
|
•
|
the Surface Mining Control and Reclamation Act of 1977 (“SMCRA”);
|
|
•
|
the Clean Air Act, including amendments to that act in 1990 (“CAA”);
|
|
•
|
the Clean Water Act of 1972 (the “Clean Water Act”);
|
|
•
|
the Resource Conservation and Recovery Act; and
|
|
•
|
the Comprehensive Environmental Response, Compensation and Liability Act.
|
In addition to these federal environmental laws, various states have enacted environmental laws that provide for higher levels of environmental compliance than similar federal laws. These environmental laws require reporting, permitting and/or approval of many aspects of coal mining operations. Both federal and state inspectors regularly visit mines to enforce compliance. NACoal has ongoing training, compliance and permitting programs to ensure compliance with such environmental laws.
Surface Mining Control and Reclamation Act
SMCRA establishes mining, environmental protection and reclamation standards for all aspects of surface coal mining operations. Where state regulatory agencies have adopted federal mining programs under the SMCRA, the state becomes the primary regulatory authority. All of the states where NACoal has active coal mining operations have achieved primary control of enforcement through federal authorization.
Coal mine operators must obtain SMCRA permits and permit renewals for coal mining operations from the regulatory agency. These SMCRA permit provisions include requirements for coal prospecting, mine plan development, topsoil removal, storage and replacement, selective handling of overburden materials, mine pit backfilling and grading, protection of the hydrologic balance, surface drainage control, mine drainage and mine discharge control and treatment, and revegetation.
Although NACoal’s permits have stated expiration dates, SMCRA provides for a right of successive renewal. The cost of obtaining surface mining permits can vary widely depending on the quantity and type of information that must be provided to obtain the permits; however, the cost of obtaining a permit is usually between $1,000,000 and $5,000,000, and the cost of obtaining a permit renewal is usually between $15,000 and $100,000.
The Abandoned Mine Land Fund, which is part of SMCRA, imposes a fee on all current lignite coal mining operations. The proceeds are used principally to reclaim mine lands closed prior to 1977. In addition, the Abandoned Mine Land Fund also makes transfers annually to the United Mine Workers of America Combined Benefit Fund (the “Fund”), which provides health care benefits to retired coal miners who are beneficiaries of the Fund. The fee is currently $0.09 per ton on lignite coal produced.
SMCRA establishes operational, reclamation and closure standards for surface coal mines. The Company accrues for the costs of current mine disturbance and final mine closure, including the cost of treating mine water discharges, where necessary. These obligations are unfunded.
SMCRA stipulates compliance with many other major environmental programs. These programs include the CAA, Clean Water Act, Resource Conservation and Recovery Act, Comprehensive Environmental Response, Compensation and Liability Act, and Emergency Planning and Community Right-To-Know Act. The U.S. Army Corps of Engineers regulates activities affecting navigable waters, and the U.S. Bureau of Alcohol, Tobacco and Firearms regulates the use of explosives for blasting. In addition, the U.S. Environmental Protection Agency (the “EPA”), the U.S. Army Corps of Engineers and the Federal Office of Surface Mining are engaged in a series of rulemakings and other administrative actions under the Clean Water Act and other statutes that are directed at reducing the impact of coal mining operations on water bodies. Currently, these initiatives are primarily with respect to mining operations in the Appalachian region, especially on mountaintops. However, these initiatives
16
may extend beyond this region to areas where NACoal has mining operations.
The Company does not believe there are any significant issues that cause a risk to NACoal’s ability to maintain its existing mining permits or hinder its ability to acquire future mining permits.
Clean Air Act
The process of burning coal can cause many compounds and impurities in the coal to be released into the air; including sulfur dioxide, nitrogen oxides, mercury, particulate matter and others. The CAA and the corresponding state laws that extensively regulate the emissions of materials into the air affect coal mining operations both directly and indirectly. Direct impacts on coal mining operations occur through CAA permitting requirements and/or emission control requirements relating to air
contaminants, especially particulate matter. Indirect impacts on coal mining operations occur through regulation of the air emissions of sulfur dioxide, nitrogen oxides, mercury, particulate matter and other compounds emitted by coal-fired power plants. The EPA has promulgated or proposed regulations that impose tighter emission restrictions in a number of areas, some of which are currently subject to litigation. The general effect of tighter restrictions could be to reduce demand for coal. Any reduction in coal’s share of the capacity for power generation could have a material adverse effect on the Company’s business, financial condition and results of operations.
States are required to submit to the EPA revisions to their state implementation plans ("SIPs") that demonstrate the manner in which the states will attain national ambient air quality standards ("NAAQS") every time a NAAQS is issued or revised by the EPA. The EPA has adopted NAAQS for several pollutants, which it continues to periodically review for revisions. When the EPA adopts new, more stringent NAAQS for a pollutant, some states have to change their existing SIPs. If a state fails to revise its SIP and obtain EPA approval, the EPA may adopt regulations to effect the revision. Coal mining operations and coal-fired power plants that emit particulate matter or other specified material are, therefore, affected by changes in the SIPs. Through this process over the last few years, the EPA has reduced the NAAQS for particulate matter, ozone, and nitrogen oxides. NACoal’s coal mining operations and utility customers may be directly affected when the revisions to the SIPs are made and incorporate new NAAQS for sulfur dioxide, nitrogen oxides, ozone and particulate matter. In response to a court remand of earlier rules to control the regional transport of sulfur dioxide and nitrogen oxides from coal-fired power plants and their impacts of downwind NAAQS areas, in mid-2011, the EPA finalized the Cross-State Air Pollution Rule ("CSAPR") to address interstate transport of pollutants. This affects states in the eastern half of the United States, including Texas. This rule imposes additional emission restrictions on coal-fired power plants to attain ozone and fine particulate NAAQS.
The CAA Acid Rain Control Provisions were promulgated as part of the CAA Amendments of 1990 in Title IV of the CAA (“Acid Rain Program”). The Acid Rain Program required reductions of sulfur dioxide emissions from coal-fired power plants. The Acid Rain Program is now a mature program and the Company believes that any market impacts of the required controls have likely been factored into the coal market.
The EPA promulgated a regional haze program designed to protect and to improve visibility at and around Class I Areas, which are generally National Parks, National Wilderness Areas and International Parks. This program may restrict the construction of new coal-fired power plants whose operation may impair visibility at and around the Class I Areas. Additionally, the program requires certain existing coal-fired power plants to install additional control measures designed to limit haze-causing emissions, such as sulfur dioxide, nitrogen oxide and particulate matter. States were required to submit Regional Haze SIPs to the EPA by December 2007; however, many states did not meet that deadline.
Under the CAA, new and modified sources of air pollution must meet certain new source standards (the “New Source Review Program”). In the late 1990s, the EPA filed lawsuits against many coal-fired power plants in the eastern United States alleging that the owners performed non-routine maintenance, causing increased emissions that should have triggered the application of these new source standards. Some of these lawsuits have been settled with the owners agreeing to install additional emission control devices in their coal-fired power plants. The remaining litigation and the uncertainty around the New Source Review Program rules could adversely impact demand for coal. Regardless of the outcome of litigation on either rule, stricter controls on emissions of sulfur dioxide, nitrogen oxide and mercury are likely. Any such controls may have an adverse impact on the demand for coal, which may have an adverse effect on NACoal’s business, financial condition or results of operations.
Under the CAA, the EPA also adopts national emission standards for hazardous air pollutants. In December 2011, the EPA adopted a final rule called the Mercury and Air Toxics Standard ("MATS"), which applies to new and existing coal-fired and oil-fired units. This requires mercury emission reductions, but also requires reductions in emissions of acid gases during fuel combustion, and additional reductions in fine particulates, which is being regulated as a surrogate for certain metals.
NACoal’s utility customers must incur substantial costs to control emissions to meet all of the CAA requirements, including the new requirements under CSAPR and the EPA's regional haze program. These costs could raise the price of coal-generated electricity, making coal-fired power less competitive with other sources of electricity, thereby reducing demand for coal. In addition, NACoal's utility customers may choose to close coal-fired generation units or to postpone or cancel plans to add new
17
capacity, in light of not only these costs, but also of the adequacy of the time mandated for compliance with the new requirements and the prospects of the imposition of additional future requirements on emissions from coal-fired units. If NACoal cannot offset the cost to control mercury, acid gas and fine particulate emissions by lowering the costs of delivery of its coal on an energy equivalent basis or if NACoal's customers elect to close coal-fired units, the Company’s business, financial condition and results of operations could be materially adversely affected.
Global climate change continues to attract considerable public and scientific attention and a considerable amount of legislative and regulatory attention in the United States. Congress is considering climate change legislation that would reduce greenhouse gas (“GHG”) emissions, particularly from coal combustion by power plants. The EPA is also developing regulations to control GHG under the CAA without new legislation. Enactment of laws and passage of regulations regarding GHG emissions by the United States or some of its states, or other actions to limit carbon dioxide emissions, such as opposition by environmental
groups to expansion or modification of coal-fired power plants, could result in electric generators switching from coal to other fuel sources.
Congress continues to consider a variety of proposals to reduce GHG emissions from the combustion of coal and other fuels. These proposals include emission taxes, emission reductions, including “cap-and-trade” programs, and mandates or incentives to generate electricity by using renewable resources, such as wind or solar power. Some states have established programs to reduce GHG emissions.
The EPA has begun to establish a GHG regulation program under the CAA by issuing a finding that the emission of six GHG, including carbon dioxide and methane, may reasonably be anticipated to endanger public health and welfare. This finding is currently being litigated. Based on this finding, the EPA plans to publish a New Source Performance Standard for greenhouse gases, emitted from future new power plants, in early 2012. This could impact coal-fired power plants and reduce the demand for coal.
The United States has not implemented the 1992 Framework Convention on Global Climate Change (“Kyoto Protocol”), which became effective for many countries on February 16, 2005. The Kyoto Protocol was intended to limit or reduce emissions of GHG, such as carbon dioxide. The United States has not ratified the emission targets of the Kyoto Protocol or any other GHG agreement. Because the Kyoto Protocol will expire in 2012, there have been efforts to reach an international agreement, including a meeting in Copenhagen, Denmark in December 2009, and Durban, South Africa in 2011, to construct a successor to the Kyoto Protocol. Even though the United States has not accepted these international GHG limiting treaties nor has it enacted domestic legislation to control GHG, numerous lawsuits and regulatory actions have been undertaken by states and environmental groups to try to force controls on the emission of carbon dioxide; or to prevent the construction of new coal-fired power plants. The implementation by the United States of an international agreement, the regulations promulgated to date by the EPA with respect to GHG emissions or the adoption of legislation to control GHG emissions, could have a materially adverse effect on the Company’s business, financial condition and results of operations.
NACoal has obtained all necessary permits under the CAA at all of its coal mining operations where it is responsible for permitting.
Clean Water Act
The Clean Water Act affects coal mining operations by establishing in-stream water quality standards and treatment standards for waste water discharge. Permits requiring regular monitoring, reporting and performance standards govern the discharge of pollutants into water.
Federal and state regulations establish standards for water quality. These regulations prohibit the diminution of water quality. Waters discharged from coal mines will be required to meet these standards. These federal and state requirements could require more costly water treatment and could materially adversely affect the Company’s business, financial condition and results of operations.
The Company believes NACoal has obtained all permits required under the Clean Water Act and corresponding state laws and is in compliance with such permits.
Bellaire Corporation, a wholly owned non-operating subsidiary of the Company (“Bellaire”), is treating mine water drainage from coal refuse piles associated with two former underground coal mines in Ohio and one former underground coal mine in Pennsylvania, and is treating mine water from a former underground coal mine in Pennsylvania. Bellaire anticipates that it will need to continue these activities indefinitely and has accrued a liability of $13.6 million as of
December 31, 2011
related to these matters.
In connection with Bellaire's normal permit renewal with the Pennsylvania Department of Environmental Protection ("DEP"), it was notified during 2004 that in order to obtain renewal of the permit it would be required to establish a mine water treatment trust (the "Trust"). On October 1, 2010, Bellaire executed a Post-Mining Treatment Trust Consent Order and Agreement
18
(“Consent”) with the DEP which established the Trust to provide a financial assurance mechanism in order to assure the long-term treatment of post-mining discharges.
Bellaire has agreed to initially fund the Trust with approximately $5.0 million. Bellaire funded $2.5 million upon execution of the Consent and the remaining amount was funded in 2011.
Resource Conservation and Recovery Act
The Resource Conservation and Recovery Act ("RCRA") affects coal mining operations by establishing requirements for the treatment, storage and disposal of wastes, including hazardous wastes. Coal mine wastes, such as overburden and coal cleaning wastes, currently are exempted from hazardous waste management. EPA has proposed a rule that may designate coal combustion residuals or coal ash ("CCRs") as hazardous waste. However, the EPA proposed rule exempts CCRs disposed of at mine sites in favor of deferring any regulation to the Federal Office of Surface Mining (“OSM”) for these materials. Currently the Office of Surface Mining is developing rules to address the use of CCRs on coal mine sites. The outcome of these rulemakings, and any subsequent actions by EPA and OSM, could impact those NACoal operations which use CCRs for haul roads and other fill. If NACoal were unable to use CCRs for this purpose, its revenues for disposing of CCRs from its customers may decrease and its costs may increase due to the purchase of alternative materials for haul roads.
Comprehensive Environmental Response, Compensation and Liability Act
The Comprehensive Environmental Response, Compensation and Liability Act and similar state laws create liabilities for the investigation and remediation of releases of hazardous substances into the environment and for damages to natural resources. The Company must also comply with reporting requirements under the Emergency Planning and Community Right-to-Know Act and the Toxic Substances Control Act.
From time to time, the Company has been the subject of administrative proceedings, litigation and investigations relating to environmental matters.
The Company’s subsidiary, Sabine, has been named as a potentially responsible party for cleanup costs under the so-called Superfund law at a third-party site where Sabine disposed of waste oil in the past. The Company believes Sabine’s liability will be de minimis.
The extent of the liability and the cost of complying with environmental laws cannot be predicted with certainty due to the lack of specific information available with respect to many sites, the potential for new or changed laws and regulations and for the development of new remediation technologies and the uncertainty regarding the timing of work with respect to particular sites. As a result, the Company may incur material liabilities or costs related to environmental matters in the future, and such environmental liabilities or costs could adversely affect the Company’s results of operations and financial condition. In addition, there can be no assurance that changes in laws or regulations would not affect the manner in which NACoal is required to conduct its operations.
Competition
The coal industry competes with other sources of energy, particularly oil, gas, hydro-electric power and nuclear power. In addition, it competes with subsidized green energy projects, such as biofuels, wind and solar projects. Among the factors that affect competition are the price and availability of oil and natural gas, environmental considerations, the time and expenditures required to develop new energy sources, the cost of transportation, the cost of compliance with governmental regulation of operations, the impact of federal and state energy policies and the current trend toward deregulation of energy markets. The ability of NACoal to market and develop its reserves will depend upon the interaction of these factors.
Based on industry information, NACoal believes it was one of the ten largest coal producers in the United States in
2011
based on total coal tons produced.
Employees
As of
January 31, 2012
, NACoal had approximately 1,400 employees, including approximately 1,100 employees at the unconsolidated mines. None of NACoal’s employees are unionized. NACoal believes its current labor relations with employees are satisfactory.
19
NMHG
NMHG's lift truck business is cyclical. Any downturn in the general economy could result in significant decreases in the Company's revenue and profitability and an inability to sustain or grow the business.
NMHG's lift truck business historically has been cyclical. Fluctuations in the rate of orders for lift trucks reflect the capital investment decisions of NMHG's customers, which depend to a certain extent on the general level of economic activity in the various industries the lift truck customers serve. During economic downturns, customers tend to delay new lift truck and parts purchases. Consequently, NMHG has experienced, and in the future may continue to experience, significant fluctuations in its revenues and net income. If there is a downturn in the general economy, or in the industries served by NMHG's lift truck customers, the Company's revenue and profitability could decrease significantly and the Company may not be able to sustain or grow the business.
If the capital goods market declines, the cost saving efforts implemented by NMHG may not be sufficient to achieve the benefits NMHG expects.
If the economy or the capital goods market declines, NMHG's revenues could decline. If revenues are lower than expected, the programs implemented at NMHG may not achieve the benefits NMHG expects. Furthermore, NMHG may be forced to take additional cost saving steps that could result in additional charges that materially adversely affect its ability to compete or implement its current business strategies.
The pricing and costs of NMHG's products have been and may continue to be impacted by foreign currency fluctuations, which could materially increase the Company's costs, result in material exchange losses and materially reduce operating margins.
Because NMHG conducts transactions in various foreign currencies, including the euro, British pound, Australian dollar, Brazilian Real and the Japanese yen, its lift truck pricing is subject to the effects of fluctuations in the value of these foreign currencies and fluctuations in the related currency exchange rates. As a result, NMHG's sales have historically been affected by, and may continue to be affected by, these fluctuations. In addition, exchange rate movements between currencies in which NMHG purchases materials and components and manufactures certain of its products and the currencies in which NMHG sells those products have been affected by and may continue to result in exchange losses that could materially reduce operating margins. Furthermore, NMHG's hedging contracts may not offset risks from changes in currency exchange rates.
The cost of raw materials used by NMHG's products has and may continue to fluctuate, which could materially reduce the Company's profitability.
At times, NMHG has experienced significant increases in its materials costs, primarily as a result of global increases in industrial metals including steel, lead and copper and other commodity prices, including rubber, as a result of increased demand and limited supply. NMHG manufactures products that include raw materials that consist of steel, rubber, copper, lead, castings and counterweights. NMHG also purchases parts provided by suppliers that are manufactured from castings and steel or contain lead. The cost of these parts is impacted by the same economic conditions that impact the cost of the parts that NMHG manufactures. The cost to manufacture lift trucks and related service parts has been and will continue to be affected by fluctuations in prices for these raw materials. If costs of these raw materials increase, the Company's profitability could be reduced.
NMHG depends on a limited number of suppliers for specific critical components.
NMHG depends on a limited number of suppliers for some of its critical components, including diesel and gasoline engines and cast-iron counterweights used to counterbalance some lift trucks. Some of these critical components are imported and subject to regulation, such as inspection by the U.S. Department of Commerce. The Company's results of operations could be adversely affected if NMHG is unable to obtain these critical components, or if the costs of these critical components were to increase significantly, due to regulatory compliance or otherwise, and NMHG was unable to pass the cost increases on to its customers.
If NMHG's current cost reduction and efficiency programs, including the introduction of new products, does not prove effective, the Company's revenues, profitability and market share could be significantly reduced.
Changes in the timing of implementation of its current cost reduction, efficiency and new product programs may result in a delay in the expected recognition of future costs and realization of future benefits. In addition, if future industry demand levels are lower than expected, the actual annual cost savings could be lower than expected. If NMHG is unable to successfully implement these programs, the Company's revenues, profitability and market share could be significantly reduced.
20
The failure of NMHG to compete effectively within its industry could result in a significant decrease in the Company's revenues and profitability.
NMHG experiences intense competition in the sale of lift trucks and aftermarket parts. Competition in the lift truck industry is based primarily on strength and quality of dealers, brand loyalty, customer service, new lift truck sales prices, availability of products and aftermarket parts, comprehensive product line offerings, product performance, product quality and features and the cost of ownership over the life of the lift truck. NMHG competes with several global full-line manufacturers that operate in all major markets. These manufacturers may have greater financial resources and less debt than NMHG, which may enable them to commit larger amounts of capital in response to changing market conditions, and lower costs of manufacturing. If NMHG fails to compete effectively, the Company's revenues and profitability could be significantly reduced.
NMHG relies primarily on its network of independent dealers to sell its lift trucks and aftermarket parts and has no direct control over sales by those dealers to customers. Ineffective or poor performance by these independent dealers could result in a significant decrease in the Company's revenues and profitability and an inability by NMHG to sustain or grow the business.
NMHG relies primarily on independent dealers for sales of its lift trucks and aftermarket parts. Sales of NMHG's products are therefore subject to the quality and effectiveness of the dealers, who are generally not subject to NMHG's direct control. As a result, ineffective or poorly performing dealers could result in a significant decrease in the Company's revenues and profitability and NMHG may not be able to sustain or grow its business.
NMHG's actual liabilities relating to pending lawsuits may exceed its expectations.
NMHG is a defendant in pending lawsuits involving, among other things, product liability claims. NMHG cannot be sure that it will succeed in defending these claims, that judgments will not be rendered against NMHG with respect to any or all of these proceedings or that reserves set aside or insurance policies will be adequate to cover any such judgments. The Company could incur a charge to earnings if reserves prove to be inadequate or the average cost per claim or the number of claims exceed estimates, which could have a material adverse effect on the Company's results of operations and liquidity for the period in which the charge is taken and any judgment or settlement amount is paid.
NMHG is subject to recourse or repurchase obligations with respect to financing arrangements of some of its customers.
Through arrangements with GECC and others, dealers and other customers are provided financing for new lift trucks in the United States and in major countries of the world outside of the United States. Through these arrangements, NMHG's dealers and certain customers are extended credit for the purchase of lift trucks to be placed in the dealer's floor plan inventory or the financing of lift trucks that are sold or leased to customers. For some of these arrangements, NMHG provides recourse or repurchase obligations such that it would become obligated in the event of default by the dealer or customer. Total amounts subject to these types of obligations at
December 31, 2011
were $179.1 million. Generally, NMHG maintains a perfected security interest in the assets financed such that, in the event that it becomes obligated under the terms of the recourse or repurchase obligations, it may take title to the assets financed. NMHG cannot be certain, however, that the security interest will equal or exceed the amount of the recourse or repurchase obligations. In addition, NMHG cannot be certain that losses under the terms of the recourse or repurchase obligations will not exceed the reserves that it has set aside in its consolidated financial statements. The Company could incur a charge to earnings if its reserves prove to be inadequate, which could have a material adverse effect on the Company's results of operations and liquidity for the period in which the charge is taken.
NMHG is subject to risks relating to its foreign operations.
Foreign operations represent a significant portion of NMHG's business. NMHG expects revenue from foreign markets to continue to represent a significant portion of NMHG's total revenue. NMHG owns or leases manufacturing facilities in Brazil, Italy, Mexico, The Netherlands and Northern Ireland, and owns interests in joint ventures with facilities in China, Japan, the Philippines and Vietnam. It also sells domestically produced products to foreign customers and sells foreign produced products to domestic customers. NMHG's foreign operations are subject to additional risks, which include:
|
•
|
potential political, economic and social instability in the foreign countries in which NMHG operates;
|
|
•
|
currency risks, see the risk factor titled “The pricing and costs of NMHG's products have been and may continue to be impacted by foreign currency fluctuations, which could materially increase the Company's costs, result in material exchange losses and materially reduce operating margins;”
|
|
•
|
imposition of or increases in currency exchange controls;
|
|
•
|
potential inflation in the applicable foreign economies;
|
21
|
•
|
imposition of or increases in import duties and other tariffs on NMHG's products;
|
|
•
|
imposition of or increases in foreign taxation of earnings and withholding on payments received by NMHG from its subsidiaries;
|
|
•
|
regulatory changes affecting international operations; and
|
|
•
|
stringent labor regulations.
|
Part of the strategy to expand NMHG's worldwide market share and decrease costs is strengthening its international distribution network and sourcing basic components in lower-cost countries. Implementation of this strategy may increase the impact of the risks described above and there can be no assurance that such risks will not have an adverse effect on the Company's revenues, profitability or market share.
NMHG's actual liabilities relating to environmental matters may exceed its expectations
.
NMHG's manufacturing operations are subject to laws and regulations relating to the protection of the environment, including those governing the management and disposal of hazardous substances. If NMHG fails to comply with these laws or its environmental permits, then it could incur substantial costs, including cleanup costs, fines and civil and criminal sanctions. In addition, future changes to environmental laws could require NMHG to incur significant additional expense or restrict operations.
In addition, NMHG's products may be subject to laws and regulations relating to the protection of the environment, including those governing vehicle exhausts. Regulatory agencies in the United States and Europe have issued or proposed various regulations and directives designed to reduce emissions from spark ignited engines and diesel engines used in off-road vehicles, such as industrial lift trucks. These regulations require NMHG and other lift truck manufacturers to incur costs to modify designs and manufacturing processes and to perform additional testing and reporting.
NMHG is investigating or remediating historical contamination at some current and former sites caused by its operations or those of businesses it acquired. NMHG has also been named as a potentially responsible party for cleanup costs under the so-called Superfund law at several third-party sites where NMHG (or its predecessors) disposed of wastes in the past. Under the Superfund law and often under similar state laws, the entire cost of cleanup can be imposed on any one of the statutorily liable parties, without regard to fault. While NMHG is not currently aware that any material outstanding claims or obligations exist with regard to these sites, the discovery of additional contamination at these or other sites could result in significant cleanup costs that could have a material adverse effect on NMHG's financial conditions and results of operations.
In connection with any acquisition made by NMHG, NMHG could, under some circumstances, be held financially liable for or suffer other adverse effects due to environmental violations or contamination caused by prior owners of businesses NMHG has acquired. In addition, under some of the agreements through which NMHG has sold businesses or assets, NMHG has retained responsibility for certain contingent environmental liabilities arising from pre-closing operations. These liabilities may not arise, if at all, until years later and could require NMHG to incur significant additional expenses, which could materially adversely affect the Company's results of operations and financial condition.
Hamilton Beach Brands
HBB's business is sensitive to the strength of the U.S. retail market and weakness in this market could adversely affect its business.
The strength of the retail economy in the United States has a significant impact on HBB's performance. Weakness in consumer confidence and poor financial performance by mass merchandisers, warehouse clubs, department stores or any of HBB's other customers would result in lost revenues. A general slowdown in the retail sector would result in additional pricing and marketing support pressures on HBB.
The market for HBB's products is highly seasonal and dependent on consumer spending, which could result in significant variations in the Company's revenues and profitability.
Sales of HBB's products are related to consumer spending. Any downturn in the general economy or a shift in consumer
spending away from small electric household appliances would adversely affect its business. In addition, the market for small electric household appliances is highly seasonal in nature. HBB often recognizes a substantial portion of its sales in the last half of the year as sales of small electric appliances to retailers and consumers increase significantly with the fall holiday-selling season. Accordingly, quarter-to-quarter comparisons of past operating results of HBB are meaningful only when comparing equivalent time periods, if at all. Any economic downturn, decrease in consumer spending or a shift in consumer spending
22
away from small electric household appliances may significantly reduce revenues and profitability.
HBB is dependent on key customers and the loss of, or significant decline in business from, one or more of its key customers could materially reduce its revenues and profitability and its ability to sustain or grow its business.
HBB relies on several key customers. Its five largest customers accounted for approximately 50%, 55% and 61% of revenues for the years ended
December 31, 2011
,
2010
and
2009
, respectively. Wal-Mart accounted for approximately 30%, 36% and 38% of HBB's revenues in
2011
,
2010
and
2009
, respectively. Although HBB has long-established relationships with many customers, it does not have any long-term supply contracts with these customers, and purchases are generally made using individual purchase orders. A loss of any key customer could result in significant decreases in HBB's revenues and profitability and an inability to sustain or grow its business.
HBB must receive a continuous flow of new orders from its large, high-volume retail customers; however, it may be unable to continually meet the needs of those customers. In addition, failure to obtain anticipated orders or delays or cancellations of orders or significant pressure to reduce prices from key customers could impair its ability to sustain or grow its business.
As a result of dependence on its key customers, HBB could experience a material adverse effect on its revenues and profitability if any of the following were to occur:
•
the insolvency or bankruptcy of any key customer;
•
a declining market in which customers materially reduce orders or demand lower prices; or
•
a strike or work stoppage at a key customer facility, which could affect both its suppliers and customers.
If HBB were to lose, or experience a significant decline in business from, any major retail customer or if any major retail customers were to go bankrupt, HBB might be unable to find alternate distribution sources.
HBB depends on third-party suppliers for the manufacturing of all of its products, which subjects the Company to risks, including unanticipated increases in expenses, decreases in revenues and disruptions in the supply chain.
HBB is dependent on third-party suppliers for the manufacturing of all of its products. HBB's ability to select reliable suppliers who provide timely deliveries of quality products will impact its success in meeting customer demand. Any inability of HBB's suppliers to timely deliver products or any unanticipated changes in suppliers could be disruptive and costly to the Company. Any significant failure by HBB to obtain products on a timely basis at an affordable cost or any significant delays or interruptions of supply would have a material adverse effect on the Company's profitability.
Because HBB's suppliers are primarily based in China, international operations subject the Company to additional risks including, among others:
•
currency fluctuations;
•
labor unrest;
•
potential political, economic and social instability;
•
lack of developed infrastructure;
•
restrictions on transfers of funds;
•
import and export duties and quotas;
•
changes in domestic and international customs and tariffs;
•
uncertainties involving the costs to transport products;
•
long distance shipping routes dependent upon a small group of shipping and rail carriers;
•
unexpected changes in regulatory environments;
•
regulatory issues involved in dealing with foreign suppliers and in exporting and importing products;
•
difficulty in complying with a variety of foreign laws;
•
difficulty in obtaining distribution and support; and
23
•
potentially adverse tax consequences.
The foregoing factors could have a material adverse effect on HBB's ability to maintain or increase the supply of products, which may result in material increases in expenses and decreases in revenues.
Increases in costs of products may materially reduce the Company's profitability.
Factors that are largely beyond the Company's control, such as movements in commodity prices for the raw materials needed by suppliers of HBB's products, may affect the cost of products, and HBB may not be able to pass those costs on to its customers. As an example, HBB's products require a substantial amount of plastic. Because the primary resource used in plastic is petroleum, the cost and availability of plastic varies to a great extent with the price of petroleum. In recent years, the prices of petroleum, as well as steel, aluminum and copper, have increased significantly. These price increases may materially reduce the Company's profitability.
The increasing concentration of HBB's small electric household appliance sales among a few retailers and the trend toward private label brands could materially reduce revenues and profitability.
With the growing trend towards the concentration of HBB's small electric household appliance sales among a few retailers, HBB is increasingly dependent upon fewer customers whose bargaining strength is growing as a result of this concentration. HBB sells a substantial quantity of products to mass merchandisers, national department stores, variety store chains, drug store chains, specialty home retailers and other retail outlets. These retailers generally purchase a limited selection of small electric household appliances. As a result, HBB competes for retail shelf space with its competitors. In addition, certain of HBB's larger customers use their own private label brands on household appliances that compete directly with some of HBB's products. As the retailers in the small electric household appliance industry become more concentrated, competition for sales to these retailers may increase, which could materially reduce the Company's revenues and profitability.
The small electric household and commercial appliance industry is consolidating, which could reduce HBB's ability to successfully secure product placements at key customers and limit its ability to sustain a cost competitive position in the industry.
Over the past several years, the small electric household and commercial appliance industry has undergone substantial consolidation, and further consolidation is likely. As a result of this consolidation, the small electric household and commercial appliance industry primarily consists of a limited number of large distributors. To the extent that HBB does not continue to be a major participant in the small electric household and commercial appliance industry, its ability to compete effectively with these larger distributors could be negatively impacted. As a result, this condition could reduce HBB's ability to successfully secure product placements at key customers and limit the ability to sustain a cost competitive position in the industry.
HBB's inability to compete effectively with competitors in its industry, including large established companies with greater resources, could result in lost market share and decreased revenues.
The small electric household and commercial appliance industry does not have onerous entry barriers. As a result, HBB competes with many small manufacturers and distributors of housewares products. Additional competitors may also enter this market and cause competition to intensify. For example, some of HBB's customers have expressed interest in sourcing, or expanding the extent of sourcing, small electric household and commercial appliances directly from manufacturers in Asia. The Company believes competition is based upon several factors, including product design and innovation, quality, price, product features, merchandising, promotion and warranty. If HBB fails to compete effectively with these manufacturers and distributors, it could lose market share and experience a decrease in revenues, which would adversely affect the Company's results of operations.
HBB also competes with established companies, a number of which have substantially greater facilities, personnel, financial and other resources. In addition, HBB competes with retail customers, who use their own private label brands, and importers and foreign manufacturers of unbranded products. Some competitors may be willing to reduce prices and accept lower profit margins to compete with HBB. As a result of this competition, HBB could lose market share and revenues.
24
Kitchen Collection
The market for KC's products is highly seasonal and dependent on consumer spending, which could result in significant variations in the Company's revenues and profitability.
Sales of products sold at KC stores are subject to a number of factors related to consumer spending, including general economic conditions affecting disposable consumer income such as unemployment rates, business conditions, interest rates, levels of consumer confidence, energy prices, mortgage rates, the level of consumer debt and taxation. A weak economic environment, a worsening of the general economy or a shift in consumer spending will adversely affect KC's business. In addition, KC often recognizes a substantial portion of its revenues and operating profit in the last half of the year as sales to consumers increase significantly with the fall holiday-selling season. Accordingly, any economic downturn, decrease in consumer spending or a shift in consumer spending away from KC's products could significantly reduce, or cause significant variations in, KC's revenues and profitability.
KC faces an extremely competitive specialty retail market, and such competition could result in a reduction of KC's prices and loss of market share.
The retail market is highly competitive. KC competes against a diverse group of retailers, including specialty stores, department stores, discount stores and catalog retailers. Widespread Chinese sourcing of products allows many retailers to offer value-priced kitchen products. Many of KC's competitors are larger and have significantly greater financial, marketing and other resources. This competition could result in the reduction of KC product prices and a loss of market share.
KC may not be able to forecast customer preferences accurately in its merchandise selections.
KC's success depends in part on its ability to anticipate the tastes of its customers and to provide merchandise that appeals to their preferences. KC's strategy requires merchandising staff to introduce products that meet current customer preferences and that are affordable and distinctive in quality and design. KC's failure to anticipate, identify or react appropriately to changes in consumer trends could cause excess inventories and higher mark-downs or a shortage of products and could harm KC's business and operating results.
KC depends on third-party suppliers for all of its products, which subjects KC to risks, including unanticipated increases in expenses, decreases in revenues and disruptions in the supply chain.
KC is dependent on third-party suppliers for all of its products. KC's ability to select reliable suppliers who provide timely deliveries of quality products will impact its success in meeting customer demand. Any inability of KC's suppliers to timely deliver products or any unanticipated changes in suppliers could be disruptive and costly to KC. The loss of a supplier could, in the short term, adversely affect KC’s business until alternative supply arrangements are secured. In addition, KC may not be able to acquire desired merchandise in sufficient quantities on acceptable terms in the future. KC's business would also be adversely affected by any delays in product shipments due to freight difficulties, strikes or other difficulties at its principal transport providers. Any significant failure by KC to obtain products on a timely basis at an affordable cost or any significant delays or interruptions of supply would have a material adverse effect on KC's profitability.
North American Coal
Termination of or default under long-term mining contracts could materially reduce the Company's profitability.
Substantially all of NACoal's profits are derived from long-term mining contracts. The contracts for certain of NACoal's unconsolidated mines permit the customer under some conditions of default to acquire the assets or stock of the subsidiary for an amount roughly equal to book value. In one case, the customer may elect to acquire the stock of the subsidiary upon a specified period of prior notice, for any reason, in exchange for payments to NACoal on coal mined at that facility in the future. If any of NACoal's long-term mining contracts were terminated or if any of its customers were to default under the contracts, profitability could be materially reduced to the extent that NACoal is unable to find alternative customers at the same level of profitability.
NACoal's unconsolidated mines are subject to risks created by changes in customer demand, inflationary adjustments and tax rates.
The contracts with the unconsolidated mines’ customers allow each mine to sell coal at a price based on actual cost plus an agreed pre-tax profit per ton or cost plus a management fee per ton during the production stage. During the development stage, the contracts with the unconsolidated mines' customers provide for reimbursement of actual costs incurred plus a monthly management fee. During the production stage, the unconsolidated mines' customers pay on a cost-plus basis only for the coal they consume and use. As a result, reduced coal usage by customers for any reason, including but not limited to fluctuations in
25
demand due to unanticipated weather conditions, scheduled and unscheduled power plant outages, economic conditions or governmental regulations, could have an adverse impact on the Company's results of operations. Because of the contractual price formulas for the sale of coal and mining services by these unconsolidated mines, the profitability of these operations is also subject to fluctuations in inflationary adjustments (or lack thereof) that can impact the per ton profit or management fee paid for the coal and taxes applicable to NACoal's income on that coal. In addition, any changes in tax laws that eliminate benefits for percentage depletion would have a material adverse effect on the Company. These factors could materially reduce NACoal's profitability.
NACoal’s consolidated mining operations are subject to risks created by its capital investment in the mines, the costs of mining the coal and the dragline mining equipment, in addition to risks created by changes in customer demand, inflationary adjustments and tax rates.
The consolidated mining operations are comprised of MLMC, dragline mining services, royalties from mineral leases to other mining companies and other activities. The profitability of these consolidated mining operations is subject to the risk of loss of its investment in these mining operations, changes in demand from customers, as well as increases in the cost of mining the coal. At MLMC, the costs of mining operations are not passed on to its customer. As such, increased costs at MLMC could materially reduce NACoal's profitability. NACoal's operations are subject to changes in customer demand for any reason, including but not limited to fluctuations in demand due to unanticipated weather conditions, the emergence of unidentified adverse mining conditions, planned and unplanned power plant outages, economic conditions, governmental regulations, inflationary adjustments and tax risks. In addition, any changes in tax laws that eliminate benefits for percentage depletion or eliminate the expensing of exploration and development costs would have a material adverse effect on the Company. These factors could materially reduce NACoal's profitability.
Mining operations are vulnerable to weather and other conditions that are beyond NACoal's control.
Many conditions beyond NACoal's control can decrease the delivery, and therefore the use, of coal to NACoal's customers. These conditions include weather, the emergence of unidentified adverse mining conditions, unexpected maintenance problems and increased costs of replacement parts, which could significantly reduce the Company's profitability.
Government regulations could impose costly requirements on NACoal.
The coal mining industry is subject to regulation by federal, state and local authorities on matters concerning the health and safety of employees, land use, permit and licensing requirements, air and water quality standards, plant and wildlife protection, reclamation and restoration of mining properties after mining, the discharge of materials into the environment, surface subsidence from underground mining and the effects that mining has on groundwater quality and availability. Legislation mandating certain benefits for current and retired coal miners also affects the industry. Mining operations require numerous governmental permits and approvals. NACoal is required to prepare and present to federal, state or local authorities data pertaining to the impact the production of coal may have upon the environment. The public, including non-governmental organizations, opposition groups and individuals, have statutory rights to comment upon and submit objections to requested permits and approvals. Compliance with these requirements may be costly and time-consuming and may delay commencement or continuation of development or production.
New legislation and/or regulations and orders may materially adversely affect NACoal's mining operations or its cost structure. New legislation, including proposals related to environmental protection that would further regulate and tax the coal industry, may also require NACoal or its customers to change operations significantly or incur increased costs. Possible limitations on carbon emissions and requirements for a specific mix of fuel sources for energy generation methods may reduce potential coal demand. All of these factors could significantly reduce the Company's profitability.
NACoal is subject to federal and state mining regulations, which place a burden on it.
Federal and state statutes require NACoal to restore mine property in accordance with specified standards and an approved reclamation plan, and require that NACoal obtain and periodically renew permits for mining operations. Regulations require NACoal to incur the cost of reclaiming current mine disturbance. Although the Company believes that appropriate accruals have been recorded for all expected reclamation and other costs associated with closed mines, future profitability would be adversely affected if accruals for these costs are later determined to be insufficient or if changed conditions, including adverse judicial proceedings or revised assumptions, require a change in these reserves.
NACoal's operations are impacted by the Clean Air Act requirements affecting coal consumption.
The process of burning coal can cause many compounds and impurities in the coal to be released into the air; including sulfur dioxide, nitrogen oxides, mercury, particulate matter and others. The CAA and the corresponding state laws that extensively
26
regulate the emissions of materials into the air affect coal mining operations both directly and indirectly. Direct impacts on coal mining operations occur through CAA permitting requirements and/or emission control requirements relating to air
contaminants, especially particulate matter. Indirect impacts on coal mining operations occur through regulation of the air emissions of sulfur dioxide, nitrogen oxides, mercury, particulate matter and other compounds emitted by coal-fired power plants. The EPA has promulgated or proposed regulations that impose tighter emission restrictions in a number of areas, some of which are currently subject to litigation. The general effect of tighter restrictions could be to reduce demand for coal. Any reduction in coal’s share of the capacity for power generation could have a material adverse effect on the Company’s business, financial condition and results of operations.
States are required to submit to the EPA revisions to their SIPs that demonstrate the manner in which the states will attain NAAQS every time a NAAQS is issued or revised by the EPA. The EPA has adopted NAAQS for several pollutants, which it continues to periodically review for revisions. When the EPA adopts new, more stringent NAAQS for a pollutant, some states have to change their existing SIPs. If a state fails to revise its SIP and obtain EPA approval, the EPA may adopt regulations to effect the revision. Coal mining operations and coal-fired power plants that emit particulate matter or other specified material are, therefore, affected by changes in the SIPs. Through this process over the last few years, the EPA has reduced the NAAQS for particulate matter, ozone, and nitrogen oxides. NACoal’s coal mining operations and utility customers may be directly affected when the revisions to the SIPs are made and incorporate new NAAQS for sulfur dioxide, nitrogen oxides, ozone and particulate matter. In response to a court remand of earlier rules to control the regional transport of sulfur dioxide and nitrogen oxides from coal-fired power plants and their impacts of downwind NAAQS areas, in mid-2011, the EPA finalized CSAPR to address interstate transport of pollutants. This affects states in the eastern half of the United States, including Texas. This rule imposes additional emission restrictions on coal-fired power plants to attain ozone and fine particulate NAAQS.
The CAA Acid Rain Control Provisions were promulgated as part of the CAA Amendments of 1990 in Title IV of the CAA. The Acid Rain Program required reductions of sulfur dioxide emissions from coal-fired power plants. The Acid Rain Program is now a mature program and the Company believes that any market impacts of the required controls have likely been factored into the coal market.
The EPA promulgated a regional haze program designed to protect and to improve visibility at and around Class I Areas, which are generally National Parks, National Wilderness Areas and International Parks. This program may restrict the construction of new coal-fired power plants whose operation may impair visibility at and around the Class I Areas. Additionally, the program requires certain existing coal-fired power plants to install additional control measures designed to limit haze-causing emissions, such as sulfur dioxide, nitrogen oxide and particulate matter. States were required to submit Regional Haze SIPs to the EPA by December 2007; however, many states did not meet that deadline.
Under the CAA, new and modified sources of air pollution must meet certain new source standards. In the late 1990s, the EPA filed lawsuits against many coal-fired power plants in the eastern United States alleging that the owners performed non-routine maintenance, causing increased emissions that should have triggered the application of these new source standards. Some of these lawsuits have been settled with the owners agreeing to install additional emission control devices in their coal-fired power plants. The remaining litigation and the uncertainty around the New Source Review Program rules could adversely impact demand for coal. Regardless of the outcome of litigation on either rule, stricter controls on emissions of sulfur dioxide, nitrogen oxide and mercury are likely. Any such controls may have an adverse impact on the demand for coal, which may have an adverse effect on NACoal’s business, financial condition or results of operations.
Under the CAA, the EPA also adopts national emission standards for hazardous air pollutants. In December 2011, the EPA adopted a final rule called MATS, which applies to new and existing coal-fired and oil-fired units. This requires mercury emission reductions, but also requires reductions in emissions of acid gases during fuel combustion, and additional reductions in fine particulates, which is being regulated as a surrogate for certain metals.
NACoal’s utility customers must incur substantial costs to control emissions to meet all of the CAA requirements, including the new requirements under CSAPR and the EPA's regional haze program. These costs could raise the price of coal-generated electricity, making coal-fired power less competitive with other sources of electricity, thereby reducing demand for coal. In addition, NACoal's utility customers may choose to close coal-fired generation units or to postpone or cancel plans to add new capacity, in light of not only these costs, but also of the adequacy of the time mandated for compliance with the new requirements and the prospects of the imposition of additional future requirements on emissions from coal-fired units. If NACoal cannot offset the cost to control mercury, acid gas and fine particulate emissions by lowering the costs of delivery of its coal on an energy equivalent basis or if NACoal's customers elect to close coal-fired units, the Company’s business, financial condition and results of operations could be materially adversely affected.
Global climate change continues to attract considerable public and scientific attention and a considerable amount of legislative and regulatory attention in the United States. Congress is considering climate change legislation that would reduce GHG emissions, particularly from coal combustion by power plants. The EPA is also developing regulations to control GHG under
27
the CAA without new legislation. Enactment of laws and passage of regulations regarding GHG emissions by the United States or some of its states, or other actions to limit carbon dioxide emissions, such as opposition by environmental groups to expansion or modification of coal-fired power plants, could result in electric generators switching from coal to other fuel sources.
Congress continues to consider a variety of proposals to reduce GHG emissions from the combustion of coal and other fuels. These proposals include emission taxes, emission reductions, including “cap-and-trade” programs, and mandates or incentives to generate electricity by using renewable resources, such as wind or solar power. Some states have established programs to reduce GHG emissions.
The EPA has begun to establish a GHG regulation program under the CAA by issuing a finding that the emission of six GHG, including carbon dioxide and methane, may reasonably be anticipated to endanger public health and welfare. This finding is currently being litigated. Based on this finding, the EPA plans to publish a New Source Performance Standard for greenhouse gases, emitted from future new power plants, in early 2012. This could impact coal-fired power plants and reduce the demand for coal.
The United States has not implemented the Kyoto Protocol, which became effective for many countries on February 16, 2005. The Kyoto Protocol was intended to limit or reduce emissions of GHG, such as carbon dioxide. The United States has not ratified the emission targets of the Kyoto Protocol or any other GHG agreement. Because the Kyoto Protocol will expire in 2012, there have been efforts to reach an international agreement, including a meeting in Copenhagen, Denmark in December 2009, and Durban, South Africa in 2011, to construct a successor to the Kyoto Protocol. Even though the United States has not accepted these international GHG limiting treaties nor has it enacted domestic legislation to control GHG, numerous lawsuits and regulatory actions have been undertaken by states and environmental groups to try to force controls on the emission of carbon dioxide; or to prevent the construction of new coal-fired power plants. The implementation by the United States of an international agreement, the regulations promulgated to date by the EPA with respect to GHG emissions or the adoption of legislation to control GHG emissions, could have a materially adverse effect on the Company’s business, financial condition and results of operations.
NACoal is subject to the high costs and risks involved in the development of new coal and dragline mining projects.
From time to time, NACoal seeks to develop new coal and dragline mining projects. The costs and risks associated with such projects can be substantial. In addition, any changes in tax laws that eliminate the expensing of exploration and development costs will increase the cost of building a mine and make the cost of coal less competitive with other power generation fuels.
General
The Company may become subject to claims under foreign laws and regulations, which may be expensive, time consuming and distracting.
Because the Company has employees, property and business operations outside of the United States, the Company is subject to the laws and the court systems of many jurisdictions. The Company may become subject to claims outside the United States based in foreign jurisdictions for violations of their laws with respect to the foreign operations of NMHG, NACoal and HBB. In addition, these laws may be changed or new laws may be enacted in the future. International litigation is often expensive, time consuming and distracting. As a result, any of these risks could significantly reduce the Company's profitability and its ability to operate its businesses effectively.
The Company is dependent on key personnel and the loss of these key personnel could significantly reduce its profitability.
The Company is highly dependent on the skills, experience and services of its respective key personnel and the loss of key personnel could have a material adverse effect on its business, operating results and financial condition. Employment and retention of qualified personnel is important to the successful conduct of the Company's business. Therefore, the Company's success also depends upon its ability to recruit, hire, train and retain additional skilled and experienced management personnel. The Company's inability to hire and retain personnel with the requisite skills could impair its ability to manage and operate its business effectively and could significantly reduce its profitability.
The amount and frequency of dividend payments made on NACCO's common stock could change.
The Board of Directors has the power to determine the amount and frequency of the payment of dividends. Decisions regarding whether or not to pay dividends and the amount of any dividends are based on earnings, capital and future expense requirements, financial conditions, contractual limitations and other factors the Board of Directors may consider. Accordingly, holders of NACCO's common stock should not rely on past payments of dividends in a particular amount as an indication of the amount of dividends that will be paid in the future.
28
None.
A. NACCO
NACCO leases office space in Mayfield Heights, Ohio, a suburb of Cleveland, Ohio, that serves as its and NMHG’s corporate headquarters.
B. NMHG
The following table presents the principal assembly, manufacturing, distribution and office facilities that NMHG owns or leases in addition to its corporate headquarters described above:
|
Region
|
Facility Location
|
Owned/Leased
|
Function(s)
|
|
Americas
|
Berea, Kentucky
|
Owned
|
Assembly of lift trucks and manufacture of component parts
|
|
|
Danville, Illinois
|
Owned
|
Americas parts distribution center
|
|
|
Greenville,
North Carolina
|
Owned
|
Divisional headquarters and marketing and sales operations for Hyster
®
and Yale
®
in Americas; Americas warehouse development center; assembly of lift trucks and manufacture of component parts
|
|
|
Fairview, Oregon
|
Owned
|
Global executive administrative center; counterbalanced development center for design and testing of lift trucks, prototype equipment and component parts
|
|
|
Ramos Arizpe,
Mexico
|
Owned
|
Manufacture of component parts for lift trucks
|
|
|
Sao Paulo, Brazil
|
Owned
|
Assembly of lift trucks and marketing operations for Brazil
|
|
|
Sulligent, Alabama
|
Owned
|
Manufacture of component parts for lift trucks
|
|
Europe
|
Craigavon,
Northern Ireland
|
Owned
|
Manufacture of lift trucks; cylinder and transmission assembly; mast fabrication and assembly for Europe
|
|
|
Fleet, England
|
Leased
|
European executive center; marketing and sales operations for Hyster
®
and Yale
®
in Europe
|
|
|
Irvine, Scotland
|
Leased
|
European administrative center
|
|
|
Masate, Italy
|
Leased
|
Assembly of lift trucks; European warehouse development center
|
|
|
Nijmegen,
The Netherlands
|
Owned
|
Big trucks development center; manufacture and assembly of big trucks and component parts; European parts distribution center
|
|
Asia-Pacific
|
Shanghai, China
|
Owned (1)
|
Assembly of lift trucks by Shanghai Hyster joint venture and marketing operations of China
|
|
|
Sydney, Australia
|
Leased
|
Divisional headquarters and sales and marketing for Asia-Pacific; Asia-Pacific parts distribution center
|
|
India
|
Pune, India
|
Leased
|
Engineering design services
|
|
(1)
|
This facility is owned by Shanghai Hyster Forklift Ltd., NMHG’s Chinese joint venture company.
|
SN’s operations are supported by four facilities. SN’s headquarters are located in Obu, Japan at a facility owned by SN. The Obu facility also has assembly and distribution capabilities. In Cavite, the Philippines and Hanoi, Vietnam, SN owns facilities for the manufacture of components for SN products. SN also has one wholly-owned and six partially-owned dealerships in Japan.
NMHG leases the facility for its one retail dealership in Singapore.
29
C. Hamilton Beach Brands
The following table presents the principal distribution and office facilities owned or leased by HBB:
|
|
Owned/
|
|
||
|
Facility Location
|
Leased
|
Function(s)
|
||
|
Glen Allen, Virginia
|
Leased
|
Corporate headquarters
|
||
|
Geel, Belgium
|
(1)
|
Distribution center
|
||
|
Hong Kong, People's Republic of China
|
(1)
|
Distribution center
|
||
|
Mexico City, Mexico
|
Leased
|
Mexico sales and administrative headquarters
|
||
|
Mexico City, Mexico
|
(1)
|
Distribution center
|
||
|
Olive Branch, Mississippi
|
Leased
|
Distribution center
|
||
|
Picton, Ontario, Canada
|
Leased
|
Distribution center
|
||
|
Southern Pines, North Carolina
|
Owned
|
Service center for customer returns; catalog distribution center; parts distribution center
|
||
|
Shenzhen, China
|
Leased
|
Administrative office
|
||
|
Markham, Ontario, Canada
|
Leased
|
Canada sales and administration headquarters
|
||
|
(1)
|
This facility is not owned or leased by HBB. This facility is managed by a third-party distribution provider.
|
Sales offices are also leased in several cities in the United States, Canada and Mexico.
D. The Kitchen Collection
KC leases its corporate headquarters building and the KC warehouse/distribution facility in Chillicothe, Ohio. KC leases its retail stores. A typical Kitchen Collection
®
store is approximately 3,000 square feet and a typical Le Gourmet Chef
®
store is approximately 4,300 square feet
.
E. NACoal
NACoal leases its corporate headquarters office space in Plano, Texas. NACoal’s proven and probable coal reserves and deposits (owned in fee or held under leases, which generally remain in effect until exhaustion of the reserves if mining is in progress) are estimated at approximately 2.3 billion tons (including the unconsolidated mining operations), all of which are lignite coal deposits, except for approximately 28.7 million tons of bituminous coal. Reserves are estimates of quantities of coal, made by NACoal’s geological and engineering staff, which are considered mineable in the future using existing operating methods. Developed reserves are those which have been allocated to mines which are in operation; all other reserves are classified as undeveloped. Information concerning mine type, reserve data and coal quality characteristics for NACoal’s properties are set forth on the table on pages 10 and 11 under “Item 1. Business — C. North American Coal — Sales, Marketing and Operations.”
Neither the Company nor any of its subsidiaries is a party to any material legal proceeding other than ordinary routine litigation incidental to its respective business.
Information concerning mine safety violations or other regulatory matters required by Section 1503(a) of the Dodd-Frank Wall Street Reform and Consumer Protection Act and Item 104 of Regulation S-K is included in Exhibit 95 filed to this Form 10-K.
30
The information under this Item is furnished pursuant to Instruction 3 to Item 401(b) of Regulation S-K.
There exists no arrangement or understanding between any executive officer and any other person pursuant to which such executive officer was elected. Each executive officer serves until his or her successor is elected and qualified.
The following tables set forth the name, age, current position and principal occupation and employment during the past five years of the Company’s executive officers. Certain executive officers of the Company listed below are also executive officers for certain of NACCO's subsidiaries.
EXECUTIVE OFFICERS OF THE COMPANY
|
Name
|
Age
|
Current Position
|
Other Positions
|
|||
|
Alfred M. Rankin, Jr.
|
70
|
Chairman, President and Chief Executive Officer of NACCO (from prior to 2007), Chairman of NMHG (from October 2008), Chairman of HBB (from January 2010), Chairman of KC (from January 2010), Chairman of NACoal (from February 2010)
|
|
|||
|
Charles A. Bittenbender
|
62
|
Vice President, General Counsel and Secretary of NACCO (from prior to 2007), Vice President, General Counsel and Secretary of NMHG (from October 2008)
|
|
|||
|
J.C. Butler, Jr.
|
51
|
Vice President — Corporate Development and Treasurer of NACCO (from prior to 2007), Senior Vice President — Project Development and Administration of NACoal (from January 2010), Treasurer of NMHG (from September 2011)
|
From May 2008 to January 2010, Senior Vice President — Project Development of NACoal.
|
|||
|
Mary D. Maloney
|
49
|
Assistant General Counsel (from prior to 2007) and Assistant Secretary of NACCO (from May 2007), Assistant Secretary of NMHG (from August 2011)
|
||||
|
Lauren E. Miller
|
57
|
Vice President — Consulting Services of NACCO (from prior to 2007), Senior Vice President, Marketing and Consulting of NMHG (from October 2008)
|
|
|||
|
Kenneth C. Schilling
|
52
|
Vice President and Controller of NACCO (from prior to 2007), Vice President and Chief Financial Officer of NMHG (from October 2008)
|
|
|||
|
Suzanne S. Taylor
|
49
|
Associate General Counsel and Assistant Secretary of NACCO (from December 2008), Assistant Secretary of NMHG (from August 2011)
|
From April 2007 to December 2008, Vice President, General Counsel and Chief Compliance Officer, Keithley Instruments, Inc. (developer, manufacturer and marketer of electronic instruments). From prior to 2007 to April 2007, Assistant General Counsel, Platinum Equity, LLC (a private equity firm).
|
|||
31
PRINCIPAL OFFICERS OF THE COMPANY’S SUBSIDIARIES
A. NMHG
|
Name
|
Age
|
Current Position
|
Other Positions
|
|||
|
Michael P. Brogan
|
61
|
President and Chief Executive Officer of NMHG (from prior to 2007)
|
||||
|
Jennifer M. Langer
|
38
|
Controller of NMHG (from January 2012), Director of Financial Reporting, Planning and Analysis of NACCO (from March 2011)
|
From January 2008 to March 2011, Director of Financial Reporting of NACCO. From prior to 2007 to January 2008, Manager of Financial Reporting of NACCO.
|
|||
|
Ralf A. Mock
|
56
|
Managing Director, Europe, Africa and Middle East of NMHG (from prior to 2007)
|
||||
|
Rajiv K. Prasad
|
48
|
Vice President, Global Product Development and Manufacturing of NMHG (from January 2012)
|
From July 2007 to January 2012, Vice President, Global Product Development of NMHG. From prior to 2007 to July 2007, Vice President, Global Product Development, International Truck and Engine Corporation (an industrial company).
|
|||
|
Victoria L. Rickey
|
59
|
Vice President, Asia-Pacific of NMHG (from October 2008)
|
From prior to 2007 to October 2008, Vice President, Chief Marketing Officer of NMHG.
|
|||
|
Michael E. Rosberg
|
62
|
Vice President, Global Supply Chain of NMHG (from prior to 2007)
|
||||
|
Colin Wilson
|
57
|
Vice President and Chief Operating Officer of NMHG (from prior to 2007), President, Americas of NMHG (from October 2008)
|
||||
32
PRINCIPAL OFFICERS OF THE COMPANY’S SUBSIDIARIES
B. HBB
|
Name
|
Age
|
Current Position
|
Other Positions
|
|||
|
Gregory H. Trepp
|
50
|
President and Chief Executive Officer of HBB (from January 2010), Chief Executive Officer of KC (from January 2010)
|
From June 2008 to January 2010, Vice President, Global Marketing of HBB. From prior to 2007 to June 2008, Vice President, Marketing of HBB. From April 2009 to January 2010, Interim President and Chief Executive Officer of KC.
|
|||
|
Keith B. Burns
|
55
|
Vice President — Engineering and Information Technology of HBB (from June 2008)
|
From prior to 2007 to June 2008, Vice President — Engineering and New Product Development of HBB.
|
|||
|
Kathleen L. Diller
|
60
|
Vice President, General Counsel and Secretary of HBB (from May 2007)
|
From prior to 2007 to May 2007, Vice President, General Counsel and Human Resources, and Secretary of HBB.
|
|||
|
Richard E. Moss
|
48
|
Senior Director of Finance and Treasurer of HBB (from January 2011)
|
From March 2009 to December 2010, Senior Director Finance and Credit of HBB. From prior to 2007 to February 2009, Director Financial Planning and Analysis of HBB.
|
|||
|
Gregory E. Salyers
|
51
|
Senior Vice President, Global Operations of HBB (from January 2010)
|
From May 2007 to January 2010, Vice President, Global Operations of HBB. From prior to 2007 to May 2007, Vice President — Operations and Information Systems of HBB.
|
|||
|
James H. Taylor
|
54
|
Vice President and Chief Financial Officer of HBB (from January 2011)
|
From January 2007 to January 2011, Vice President, Chief Financial Officer and Treasurer of HBB. From prior to 2007 to January 2007, Vice President — Finance and Treasurer of HBB.
|
|||
|
R. Scott Tidey
|
47
|
Senior Vice President, North American Sales and Marketing of HBB (from January 2010)
|
From July 2008 to January 2010, Vice President, North America Sales of HBB. From March 2007 to July 2008, Vice President, U.S. Consumer Sales of HBB. From prior to 2007 to March 2007, Vice President, International and National Account Sales of HBB.
|
|||
C. KC
|
Name
|
Age
|
Current Position
|
Other Positions
|
|||
|
Richard R. Chene, Jr.
|
49
|
President of KC (from February 2011)
|
From July 2008 to January 2011, Vice President, General Merchandising Manager - Dog, PETCO Animal Supplies, Inc. (a pet supply company). From prior to 2007 to April 2008, Divisional Merchandising Manager - Bed, Bath, Window, Rug and Storage, Sears Holdings Corporation (a national retailer).
|
|||
33
PRINCIPAL OFFICERS OF THE COMPANY’S SUBSIDIARIES
D. NACOAL
|
Name
|
Age
|
Current Position
|
Other Positions
|
|||
|
Robert L. Benson
|
64
|
President and Chief Executive Officer of NACoal (from prior to 2007)
|
||||
|
Bob D. Carlton
|
54
|
Vice President and Chief Financial Officer of NACoal (from May 2008)
|
From prior to 2007 to May 2008, Vice President - Financial Services of NACoal.
|
|||
|
Michael J. Gregory
|
64
|
Vice President, International Operations and Special Projects of NACoal (from August 2010)
|
From May 2008 to August 2010, Vice President - Engineering, Human Resources and International Operations of NACoal. From prior to 2007 to May 2008, Vice President — Southern Operations and Human Resources of NACoal.
|
|||
|
K. Donald Grischow
|
64
|
Treasurer of NACoal (from prior to 2007)
|
|
|||
|
Thomas A. Koza
|
65
|
Vice President, Senior Counsel and Assistant Secretary of NACoal (from January 2011)
|
From prior to 2007 to December 2010, Vice President - Law and Administration, and Secretary of NACoal.
|
|||
|
John D. Neumann
|
36
|
Vice President, General Counsel and Secretary of NACoal (from January 2011)
|
From March 2009 to December 2010, Assistant General Counsel and Assistant Secretary of NACoal. From prior to 2007 to February 2009, associate, Jones Day (law firm).
|
|||
|
John R. Pokorny
|
56
|
Controller of NACoal (from October 2009)
|
From prior to 2007 to October 2009, Director of Accounting and Financial Planning of NACoal.
|
|||
|
Harry B. Tipton III
|
54
|
Vice President - Engineering, and Louisiana and Mississippi Operations of NACoal (from September 2010), Vice President of Liberty Fuels LLC (from March 2011)
|
From prior to 2007 to September 2010, General Manager of Mississippi Lignite Mine. From July 2010 to March 2011, President of Liberty Fuels, LLC.
|
|||
34
NACCO's Class A common stock is traded on the New York Stock Exchange under the ticker symbol “NC.” Because of transfer restrictions, no trading market has developed, or is expected to develop, for the Company's Class B common stock. The Class B common stock is convertible into Class A common stock on a one-for-one basis. The high and low market prices for the Class A common stock and dividends per share for both classes of common stock for each quarter during the past two years are presented in the table below:
|
|
2011
|
||||||||
|
|
Sales Price
|
||||||||
|
|
High
|
Low
|
Cash Dividend
|
||||||
|
First quarter
|
$
|
132.69
|
|
$
|
91.11
|
|
52.25¢
|
||
|
Second quarter
|
$
|
111.95
|
|
$
|
86.55
|
|
53.25¢
|
||
|
Third quarter
|
$
|
103.70
|
|
$
|
60.01
|
|
53.25¢
|
||
|
Fourth quarter
|
$
|
92.98
|
|
$
|
56.53
|
|
53.25¢
|
||
|
|
2010
|
||||||||
|
|
Sales Price
|
||||||||
|
|
High
|
Low
|
Cash Dividend
|
||||||
|
First quarter
|
$
|
86.15
|
|
$
|
44.87
|
|
51.75¢
|
||
|
Second quarter
|
$
|
114.69
|
|
$
|
68.01
|
|
52.25¢
|
||
|
Third quarter
|
$
|
112.45
|
|
$
|
75.21
|
|
52.25¢
|
||
|
Fourth quarter
|
$
|
121.73
|
|
$
|
85.93
|
|
52.25¢
|
||
At
December 31, 2011
, there were approximately 840 Class A common stockholders of record and approximately 200 Class B common stockholders of record. See Note 21 to Consolidated Financial Statements contained elsewhere in this Form 10-K for a discussion of the amount of NACCO's investment in subsidiaries that was restricted at
December 31, 2011
.
Sales of Unregistered Company Stock
Pursuant to the Non-Employee Directors’ Equity Compensation Plan, the Company issued an aggregate of 4,016 shares of its Class A common stock on January 1, 2011, April 1, 2011, July 1, 2011 and October 1, 2011 for payment of a portion of the directors’ annual retainer fee. In addition, pursuant to the terms of such plan, directors may elect to receive shares of Class A common stock in lieu of cash for up to 100% of the balance of their annual retainer, meeting attendance fees and any committee chairman's fees. An aggregate of 1,109 shares of Class A common stock were issued under voluntary elections on January 1, 2011, April 1, 2011, July 1, 2011 and October 1, 2011. The issuance of these unregistered shares qualifies as an exempt transaction pursuant to Section 4(2) of the Securities Act of 1933.
Pursuant to the Non-Employee Directors’ Equity Compensation Plan, the Company issued an aggregate of 3,516 shares of its Class A common stock on January 1, 2010, April 1, 2010, July 1, 2010 and October 1, 2010 for payment of a portion of the directors’ annual retainer fee. In addition, pursuant to the terms of such plan, directors may elect to receive shares of Class A common stock in lieu of cash for up to 100% of the balance of their annual retainer, meeting attendance fees and any committee chairman's fees. An aggregate of 1,062 shares of Class A common stock were issued under voluntary elections on January 1, 2010, April 1, 2010, July 1, 2010 and October 1, 2010. The issuance of these unregistered shares qualifies as an exempt transaction pursuant to Section 4(2) of the Securities Act of 1933.
Pursuant to the Non-Employee Directors’ Equity Compensation Plan, the Company issued an aggregate of 6,399 shares of its Class A common stock on January 1, 2009, April 1, 2009, July 1, 2009 and October 1, 2009 for payment of a portion of the directors’ annual retainer fee. In addition, pursuant to the terms of such plan, directors may elect to receive shares of Class A common stock in lieu of cash for up to 100% of the balance of their annual retainer, meeting attendance fees and any committee chairman's fees. An aggregate of 1,891 shares of Class A common stock were issued under voluntary elections on January 1, 2009, April 1, 2009, July 1, 2009 and October 1, 2009. The issuance of these unregistered shares qualifies as an exempt transaction pursuant to Section 4(2) of the Securities Act of 1933.
35
Purchases of Equity Securities by the Issuer and Affiliated Purchasers
|
Issuer Purchases of Equity Securities
|
||||
|
Period
|
(a)
Total Number of Shares Purchased
|
(b)
Average Price Paid per Share
|
(c)
Total Number of Shares Purchased as Part of the Publicly Announced Program
|
(d)
Maximum Number of Shares (or Approximate Dollar Value) that May Yet Be Purchased Under the Program (1)
|
|
Month #1
(October 1 to 31, 2011)
|
—
|
—
|
—
|
—
|
|
Month #2
(November 1 to 30, 2011)
|
—
|
—
|
—
|
$50,000,000
|
|
Month #3
(December 1 to 31, 2011)
|
24,406
|
$84.53
|
24,406
|
$47,937,034
|
|
Total
|
24,406
|
$84.53
|
24,406
|
$47,937,034
|
|
(1)
|
On November 8, 2011, the Company announced that the Company's Board of Directors approved the repurchase of up to $50 million of the Company's outstanding Class A common stock. The timing and amount of any repurchases will be determined at the discretion of the Company's management based on a number of factors, including the availability of capital, other capital allocation alternatives and market conditions for the Company's Class A common stock. The authorization for the repurchase program expires on December 31, 2012. The share repurchase program does not require the Company to acquire any specific number of shares. It may be modified, suspended, extended or terminated by the Company at any time without prior notice and may be executed through open market purchases, privately negotiated transactions or otherwise. All or part of the repurchases may be implemented under a Rule 10b5-1 trading plan, which would allow repurchases under pre-set terms at times when the Company might otherwise be prevented from doing so. As of December 31, 2011, the Company had repurchased $2.1 million of Class A common stock under this program.
|
36
|
|
Year Ended December 31
|
||||||||||||||||||
|
|
2011
(2)
|
2010
(2)
|
2009
(2)
|
2008
(1)(2)
|
2007
|
||||||||||||||
|
|
(In millions, except per share data)
|
||||||||||||||||||
|
Operating Statement Data:
|
|
|
|
|
|
||||||||||||||
|
Revenues
|
$
|
3,331.2
|
|
$
|
2,687.5
|
|
$
|
2,310.6
|
|
$
|
3,665.1
|
|
$
|
3,590.0
|
|
||||
|
Operating profit (loss)
|
$
|
174.1
|
|
$
|
140.3
|
|
$
|
59.1
|
|
$
|
(389.5
|
)
|
$
|
139.2
|
|
||||
|
Income (loss) from continuing operations
|
$
|
162.1
|
|
$
|
79.4
|
|
$
|
8.4
|
|
$
|
(439.7
|
)
|
$
|
89.7
|
|
||||
|
Discontinued operations, net of tax
(3)
|
—
|
|
—
|
|
22.6
|
|
2.3
|
|
0.6
|
|
|||||||||
|
Net income (loss)
|
$
|
162.1
|
|
$
|
79.4
|
|
$
|
31.0
|
|
$
|
(437.4
|
)
|
$
|
90.3
|
|
||||
|
Net (income) loss attributable to noncontrolling interest
|
—
|
|
0.1
|
|
0.1
|
|
(0.2
|
)
|
0.1
|
|
|||||||||
|
Net income (loss) attributable to stockholders
|
$
|
162.1
|
|
$
|
79.5
|
|
$
|
31.1
|
|
$
|
(437.6
|
)
|
$
|
90.4
|
|
||||
|
Amounts Attributable to Stockholders:
|
|
|
|
|
|
||||||||||||||
|
Income (loss) from continuing operations, net of tax
|
$
|
162.1
|
|
$
|
79.5
|
|
$
|
8.5
|
|
$
|
(439.9
|
)
|
$
|
89.8
|
|
||||
|
Discontinued operations, net of tax
(3)
|
—
|
|
—
|
|
22.6
|
|
2.3
|
|
0.6
|
|
|||||||||
|
Net income (loss) attributable to stockholders
|
$
|
162.1
|
|
$
|
79.5
|
|
$
|
31.1
|
|
$
|
(437.6
|
)
|
$
|
90.4
|
|
||||
|
Basic earnings (loss) per share attributable to stockholders:
|
|
|
|
|
|
||||||||||||||
|
Continuing operations
|
$
|
19.34
|
|
$
|
9.55
|
|
$
|
1.03
|
|
$
|
(53.12
|
)
|
$
|
10.87
|
|
||||
|
Discontinued operations
(3)
|
—
|
|
—
|
|
2.72
|
|
0.28
|
|
0.07
|
|
|||||||||
|
Basic earnings (loss) per share
|
$
|
19.34
|
|
$
|
9.55
|
|
$
|
3.75
|
|
$
|
(52.84
|
)
|
$
|
10.94
|
|
||||
|
Diluted earnings (loss) per share attributable to stockholders:
|
|
|
|
|
|
||||||||||||||
|
Continuing operations
|
$
|
19.28
|
|
$
|
9.53
|
|
$
|
1.03
|
|
$
|
(53.12
|
)
|
$
|
10.86
|
|
||||
|
Discontinued operations
(3)
|
—
|
|
—
|
|
2.72
|
|
0.28
|
|
0.07
|
|
|||||||||
|
Diluted earnings (loss) per share
|
$
|
19.28
|
|
$
|
9.53
|
|
$
|
3.75
|
|
$
|
(52.84
|
)
|
$
|
10.93
|
|
||||
|
(1)
|
During the fourth quarter of 2008, the Company's stock price significantly declined compared with previous periods and the Company's market value of equity was below its book value of tangible assets and the book value of equity. The Company performed an interim impairment test, which indicated that goodwill and certain other intangibles were impaired at December 31, 2008. Therefore, the Company recorded a non-cash impairment charge of $435.7 million during the fourth quarter of 2008.
|
|
(2)
|
In 2006, the Company initiated litigation in the Delaware Chancery Court against Applica Incorporated ("Applica") and individuals and entities affiliated with Applica's shareholder, Harbinger Capital Partners Master Fund, Ltd. The litigation alleged a number of contract and tort claims against the defendants related to the failed transaction with Applica, which had been previously announced. On February 14, 2011, the parties to this litigation entered into a settlement agreement. The settlement agreement provided for, among other things, the payment of $60 million to the Company and dismissal of the lawsuit with prejudice. The payment was received in February 2011.
|
Litigation costs related to the failed transaction with Applica were $2.8 million, $18.8 million, $1.1 million and $0.8 million in 2011, 2010, 2009 and 2008, respectively.
|
(3)
|
During 2009, NACoal completed the sale of certain assets of the Red River Mining Company (“Red River”). The results of operations of Red River are reflected as discontinued operations in the table above.
|
37
|
|
Year Ended December 31
|
||||||||||||||||||
|
|
2011
|
2010
|
2009
|
2008
(1)
|
2007
|
||||||||||||||
|
|
(In millions, except per share and employee data)
|
||||||||||||||||||
|
Balance Sheet Data at December 31:
|
|
|
|
|
|
||||||||||||||
|
Total assets
|
$
|
1,801.4
|
|
$
|
1,658.3
|
|
$
|
1,488.7
|
|
$
|
1,687.9
|
|
$
|
2,427.3
|
|
||||
|
Long-term debt
|
$
|
129.1
|
|
$
|
355.3
|
|
$
|
377.6
|
|
$
|
400.3
|
|
$
|
439.3
|
|
||||
|
Stockholders' equity
|
$
|
576.2
|
|
$
|
447.4
|
|
$
|
396.6
|
|
$
|
356.7
|
|
$
|
891.4
|
|
||||
|
Cash Flow Data:
|
|
|
|
|
|
||||||||||||||
|
Provided by operating activities
|
$
|
155.2
|
|
$
|
63.1
|
|
$
|
157.0
|
|
$
|
4.9
|
|
$
|
81.4
|
|
||||
|
Provided by (used for) investing activities
|
$
|
(32.7
|
)
|
$
|
(5.8
|
)
|
$
|
23.1
|
|
$
|
(71.4
|
)
|
$
|
(59.9
|
)
|
||||
|
Provided by (used for) financing activities
|
$
|
(42.0
|
)
|
$
|
(43.3
|
)
|
$
|
(64.1
|
)
|
$
|
(83.2
|
)
|
$
|
64.4
|
|
||||
|
Other Data:
|
|
|
|
|
|
||||||||||||||
|
Per share data:
|
|
|
|
|
|
||||||||||||||
|
Cash dividends
|
$
|
2.120
|
|
$
|
2.085
|
|
$
|
2.068
|
|
$
|
2.045
|
|
$
|
1.980
|
|
||||
|
Market value at December 31
|
$
|
89.22
|
|
$
|
108.37
|
|
$
|
49.80
|
|
$
|
37.41
|
|
$
|
99.69
|
|
||||
|
Stockholders' equity at December 31
|
$
|
68.81
|
|
$
|
53.69
|
|
$
|
47.82
|
|
$
|
43.05
|
|
$
|
107.80
|
|
||||
|
Actual shares outstanding at December 31
|
8.374
|
|
8.333
|
|
8.294
|
|
8.286
|
|
8.269
|
|
|||||||||
|
Basic weighted average shares outstanding
|
8.383
|
|
8.328
|
|
8.290
|
|
8.281
|
|
8.263
|
|
|||||||||
|
Diluted weighted average shares outstanding
|
8.408
|
|
8.344
|
|
8.296
|
|
8.281
|
|
8.272
|
|
|||||||||
|
Total employees at December 31
(2)
|
9,300
|
|
8,900
|
|
8,600
|
|
9,500
|
|
10,600
|
|
|||||||||
|
(1)
|
During the fourth quarter of 2008, the Company's stock price significantly declined compared with previous periods and the Company's market value of equity was below its book value of tangible assets and the book value of equity. The Company performed an interim impairment test, which indicated that goodwill and certain other intangibles were impaired at December 31, 2008. Therefore, the Company recorded a non-cash impairment charge of $435.7 million during the fourth quarter of 2008.
|
|
(2)
|
Includes employees of the unconsolidated mines and excludes employees of Red River.
|
38
|
Item 7.
|
MANAGEMENT'S DISCUSSION AND ANALYSIS OF FINANCIAL CONDITION AND RESULTS OF OPERATIONS
|
NACCO INDUSTRIES, INC. AND SUBSIDIARIES
(Tabular Amounts in Millions, Except Per Share and Percentage Data)
OVERVIEW
NACCO Industries, Inc. (the parent company or “NACCO”) and its wholly owned subsidiaries (collectively, the “Company”) operate in the following principal industries: lift trucks, small appliances, specialty retail and mining. Results of operations and financial condition are discussed separately by subsidiary, which corresponds with the industry groupings.
NMHG Holding Co. (“NMHG”) designs, engineers, manufactures, sells and services a comprehensive line of lift trucks and aftermarket parts marketed globally primarily under the Hyster
®
and Yale
®
brand names, mainly to independent Hyster
®
and Yale
®
retail dealerships. Lift trucks and component parts are manufactured in the United States, Northern Ireland, Mexico, The Netherlands, the Philippines, Italy, Japan, Vietnam, Brazil and China. Hamilton Beach Brands, Inc. (“HBB”) is a leading designer, marketer and distributor of small electric household appliances primarily in the United States, Canada, Mexico and Latin America, as well as commercial products for restaurants, bars and hotels. The Kitchen Collection, LLC (“KC”) is a national specialty retailer of kitchenware and gourmet foods operating under the Kitchen Collection
®
and Le Gourmet Chef
®
store names in outlet and traditional malls throughout the United States. The North American Coal Corporation and its affiliated coal companies (collectively, “NACoal”) mine and market coal primarily as fuel for power generation and provide selected value-added mining services for other natural resources companies primarily in the United States. Coal is delivered from NACoal's developed mines in Mississippi, North Dakota and Texas to adjacent or nearby power plants. Dragline mining services are provided for independently owned limerock quarries in Florida.
CRITICAL ACCOUNTING POLICIES AND ESTIMATES
The Company's discussion and analysis of its financial condition and results of operations are based upon the Company's consolidated financial statements, which have been prepared in accordance with U.S. generally accepted accounting principles. The preparation of these financial statements requires the Company to make estimates and judgments that affect the reported amounts of assets, liabilities, revenues and expenses, and related disclosure of contingent assets and liabilities (if any). On an ongoing basis, the Company evaluates its estimates based on historical experience, actuarial valuations and various other assumptions that are believed to be reasonable under the circumstances, the results of which form the basis for making judgments about the carrying values of assets and liabilities that are not readily apparent from other sources. Actual results may differ from those estimates.
The Company believes the following critical accounting policies affect its more significant judgments and estimates used in the preparation of its consolidated financial statements.
Revenue recognition:
Revenues are generally recognized when title transfers and risk of loss passes as customer orders are completed and shipped. For NMHG's National Account customers, revenue is recognized upon customer acceptance. National Account customers are large customers with centralized purchasing and geographically dispersed operations in multiple dealer territories. Under its mining contracts, the Company recognizes revenue as the coal or limerock is delivered. Reserves for discounts and returns are maintained for anticipated future claims. The accounting policies used to develop these product discounts and returns include:
Product discounts:
The Company records estimated reductions to revenues for customer programs and incentive offerings, including special pricing agreements, price competition, promotions and other volume-based incentives. At NMHG, lift truck sales revenue is recorded net of projected discounts. The estimated discount amount is based upon historical trends for each truck model. In addition to standard discounts, dealers can also request additional discounts that allow them to offer price concessions to customers. From time to time, NMHG offers special incentives to increase retail share or dealer stock and offers certain customers volume rebates if a specified cumulative level of purchases is obtained. At HBB, net sales represent gross sales less cooperative advertising, other volume-based incentives, estimated returns and allowances for defective products. At KC, retail markdowns are incorporated into KC's retail method of accounting for cost of sales. If market conditions were to decline or if competition was to increase, the Company may take actions to increase customer incentive offerings, possibly resulting in an incremental reduction of revenues at the time the incentive is offered. If the Company's estimates of customer programs and incentives were one percent higher than the levels offered during
2011
, the reserves for product discounts would increase and revenue would be reduced by $0.2 million. The Company's past results of operations have not been materially affected by a change in the estimate of product discounts and although there can be no assurances, the Company is not aware of any circumstances that would be reasonably likely to materially change its estimates in the future.
39
|
Item 7.
|
MANAGEMENT'S DISCUSSION AND ANALYSIS OF FINANCIAL CONDITION AND RESULTS OF OPERATIONS
|
NACCO INDUSTRIES, INC. AND SUBSIDIARIES
(Tabular Amounts in Millions, Except Per Share and Percentage Data)
Product returns:
Products generally are not sold with the right of return. However, based on the Company's historical experience, a portion of products sold are estimated to be returned due to reasons such as buyer remorse, duplicate gifts received, product failure and excess inventory stocked by the customer which, subject to certain terms and conditions, the Company will agree to accept. The Company records estimated reductions to revenues at the time of sale based on this historical experience and the limited right of return provided to certain customers. If future trends were to change significantly from those experienced in the past, incremental reductions to revenues may result based on this new experience. If the Company's estimate of average return rates for each type of product sold were to increase by one percent over historical levels, the reserves for product returns would increase and revenues would be reduced by $0.2 million. The Company's past results of operations have not been materially affected by a change in the estimate of product returns and although there can be no assurances, the Company is not aware of any circumstances that would be reasonably likely to materially change its estimates in the future.
Retirement benefit plans:
The Company maintains various defined benefit pension plans that provide benefits based on years of service and average compensation during certain periods. Pension benefits are frozen for all employees other than certain NACoal unconsolidated mines' employees and NMHG employees in the United Kingdom and The Netherlands. All other eligible employees of the Company, including employees whose pension benefits are frozen, receive retirement benefits under defined contribution retirement plans. The Company's policy is to periodically make contributions to fund the defined benefit pension plans within the range allowed by applicable regulations. The defined benefit pension plan assets consist primarily of publicly traded stocks and government and corporate bonds. There is no guarantee the actual return on the plans’ assets will equal the expected long-term rate of return on plan assets or that the plans will not incur investment losses.
The expected long-term rate of return on defined benefit plan assets reflects management's expectations of long-term rates of return on funds invested to provide for benefits included in the projected benefit obligations. The Company has established the expected long-term rate of return assumption for plan assets by considering historical rates of return over a period of time that is consistent with the long-term nature of the underlying obligations of these plans. The historical rates of return for each of the asset classes used by the Company to determine its estimated rate of return assumption were based upon the rates of return earned by investments in the equivalent benchmark market indices for each of the asset classes.
Expected returns for pension plans are based on a calculated market-related value of assets. Under this methodology, asset gains and losses resulting from actual returns that differ from the Company's expected returns are recognized in the market-related value of assets ratably over three years.
The Company also maintains health care plans which provide benefits to eligible retired employees. All health care plans of the Company have a cap on the Company's share of the costs. These plans have no assets. Under the Company's current policy, plan benefits are funded at the time they are due to participants. Effective January 1, 2010, NMHG eliminated its retiree life insurance plan for non-union retirees. Effective June 30, 2010, the parent company eliminated its subsidized retiree medical plan. Effective September 1, 2010, HBB eliminated its retiree life insurance plan. Effective December 31, 2011, NMHG eliminated all retiree life insurance plans and its subsidized retiree medical plan for employees who had not retired before such date. As of January 1, 2012, the Company will no longer maintain any retiree life insurance plans.
The basis for the selection of the discount rate for each plan is determined by matching the timing of the payment of the expected obligations under the defined benefit plans and health care plans against the corresponding yield of high-quality corporate bonds of equivalent maturities.
Changes to the estimate of any of these factors could result in a material change to the Company's pension obligation causing a related increase or decrease in reported net operating results in the period of change in the estimate. Because the
2011
assumptions are used to calculate
2012
pension expense amounts, a one percentage-point change in the expected long-term rate of return on plan assets would result in a change in pension expense for
2012
of approximately $2.2 million for the plans. A one percentage-point increase in the discount rate would have lowered the plans’
2012
expense by approximately $2.2 million; while a one percentage-point decrease in the discount rate would have raised the plans’
2012
expense by approximately $2.4 million. A one percentage-point increase in the discount rate would have lowered the plans’ projected benefit obligation as of the end of
2011
by approximately $33.2 million; while a one percentage-point decrease in the discount rate would have raised the plans’ projected benefit obligation as of the end of
2011
by approximately $39.8 million.
See Note 18 to the Consolidated Financial Statements in this Form 10-K for further discussion of the Company's retirement benefit plans.
40
|
Item 7.
|
MANAGEMENT'S DISCUSSION AND ANALYSIS OF FINANCIAL CONDITION AND RESULTS OF OPERATIONS
|
NACCO INDUSTRIES, INC. AND SUBSIDIARIES
(Tabular Amounts in Millions, Except Per Share and Percentage Data)
Product liabilities:
The Company provides for the estimated cost of personal and property damage relating to the Company's products based on a review of the Company's historical experience and consideration of any known trends. Reserves are recorded for estimates of the costs for known claims and estimates of the costs of incidents that have occurred but for which a claim has not yet been reported to the Company, up to the stop-loss insurance coverage. While the Company engages in extensive product quality reviews and customer education programs, the Company's product liability provision is affected by the number and magnitude of claims of alleged product-related injury and property damage and the cost to defend those claims. In addition, the Company's estimates regarding the magnitude of claims are affected by changes in assumptions regarding medical costs, inflation rates and trends in damages awarded by juries. Changes in the Company's assumptions regarding any one of these factors could result in a change in the estimate of the magnitude of claims. A one percent increase in the estimate of the number of claims or the magnitude of claims would increase the Company's product liability reserve and reduce operating profit by approximately $0.2 million. Although there can be no assurances, the Company is not aware of any circumstances that would be reasonably likely to materially change our estimates in the future.
Self-insurance liabilities:
The Company is generally self-insured for product liability, environmental liability, medical claims, certain workers’ compensation claims and certain closed mine liabilities. For product liability, catastrophic insurance coverage is retained for potentially significant individual claims. An estimated provision for claims reported and for claims incurred but not yet reported under the self-insurance programs is recorded and revised periodically based on industry trends, historical experience and management judgment. In addition, industry trends are considered within management's judgment for valuing claims. Changes in assumptions for such matters as legal judgments and settlements, inflation rates, medical costs and actual experience could cause estimates to change in the near term. Changes in any of these factors could materially change the Company's estimates for these self-insurance obligations causing a related increase or decrease in reported net operating results in the period of change in the estimate.
Product warranties:
The Company provides for the estimated cost of product warranties at the time revenues are recognized. While the Company engages in extensive product quality programs and processes, including actively monitoring and evaluating the quality of its component suppliers, the Company's warranty obligation is affected by product failure rates, labor costs and replacement component costs incurred in correcting a product failure. If actual product failure rates, labor costs or replacement component costs differ from the Company's estimates, which are based on historical failure rates and consideration of known trends, revisions to the estimate of the cost to correct product failures would be required. If the Company's estimate of the cost to correct product failures were to increase by one percent over
2011
levels, the reserves for product warranties would increase and additional expense of $0.5 million would be incurred. The Company's past results of operations have not been materially affected by a change in the estimate of product warranties and although there can be no assurances, the Company is not aware of any circumstances that would be reasonably likely to materially change its estimates in the future.
Deferred tax valuation allowances:
The Company records a valuation allowance to reduce its deferred tax assets to the amount that is more likely than not to be realized. A valuation allowance has been provided against certain deferred tax assets related to non-U.S. and U.S. state jurisdictions including net operating and capital loss carryforwards. Management believes the valuation allowances are adequate after considering future taxable income, allowable carryforward periods and ongoing prudent and feasible tax planning strategies. In the event the Company were to determine that it would be able to realize its deferred tax assets in the future in excess of its net recorded amount (including the valuation allowance), an adjustment to the valuation allowance would increase income in the period such determination was made. Conversely, should the Company determine that it would not be able to realize all or part of its net deferred tax asset in the future, an adjustment to the valuation allowance would be expensed in the period such determination was made. The Company expects that if the major markets for its products continue to experience economic recovery similar to 2011, the Company would expect to start to release valuation allowances in taxing jurisdictions when a three-year cumulative loss is no longer present and long-term forecasts are favorable.
See Note 17 to the Consolidated Financial Statements in this Form 10-K for further discussion of the Company's income taxes.
Inventory reserves:
The Company writes down its inventory to the lower of cost or market, which includes an estimate for obsolescence or excess inventory based upon assumptions about future demand and market conditions. If actual market conditions are less favorable than those projected by management, additional inventory write-downs may be required. Upon a subsequent sale or disposal of the impaired inventory, the corresponding reserve for impaired value is relieved to ensure that the cost basis of the inventory reflects any write-downs. An impairment in value of one percent of net inventories would result in additional expense of approximately $4.7 million.
41
|
Item 7.
|
MANAGEMENT'S DISCUSSION AND ANALYSIS OF FINANCIAL CONDITION AND RESULTS OF OPERATIONS
|
NACCO INDUSTRIES, INC. AND SUBSIDIARIES
(Tabular Amounts in Millions, Except Per Share and Percentage Data)
Allowances for doubtful accounts:
The Company maintains allowances for doubtful accounts for estimated losses resulting from the inability of its customers to make required payments. These allowances are based on both recent trends of certain customers estimated to be a greater credit risk as well as general trends of the entire customer pool. If the financial condition of the Company's customers were to deteriorate, resulting in an impairment of their ability to make payments, additional allowances may be required. An impairment in value of one percent of net accounts receivable would require an increase in the allowance for doubtful accounts and would result in additional expense of approximately $4.6 million.
CONSOLIDATED FINANCIAL SUMMARY
Selected consolidated results of the Company were as follows:
|
|
2011
|
2010
|
2009
|
||||||||
|
Consolidated results:
|
|
|
|
||||||||
|
Income from continuing operations attributable to stockholders
|
$
|
162.1
|
|
$
|
79.5
|
|
$
|
8.5
|
|
||
|
Discontinued operations, net of tax
(1)
|
—
|
|
—
|
|
22.6
|
|
|||||
|
Net income attributable to stockholders
|
$
|
162.1
|
|
$
|
79.5
|
|
$
|
31.1
|
|
||
|
Basic earnings per share:
|
|
|
|
||||||||
|
Income from continuing operations attributable to stockholders
|
$
|
19.34
|
|
$
|
9.55
|
|
$
|
1.03
|
|
||
|
Discontinued operations, net of tax
(1)
|
—
|
|
—
|
|
2.72
|
|
|||||
|
Basic earnings per share
|
$
|
19.34
|
|
$
|
9.55
|
|
$
|
3.75
|
|
||
|
Diluted earnings per share:
|
|
|
|
||||||||
|
Income from continuing operations attributable to stockholders
|
$
|
19.28
|
|
$
|
9.53
|
|
$
|
1.03
|
|
||
|
Discontinued operations, net of tax
(1)
|
—
|
|
—
|
|
2.72
|
|
|||||
|
Diluted earnings per share
|
$
|
19.28
|
|
$
|
9.53
|
|
$
|
3.75
|
|
||
|
(1)
|
During 2009, NACoal completed the sale of certain assets of the Red River Mining Company (“Red River”). The results of operations of Red River are reflected as discontinued operations.
|
The following table identifies the components of change for
2011
compared with
2010
by subsidiary:
|
|
Revenues
|
Operating
Profit
|
Net Income Attributable to Stockholders
|
||||||||
|
2010
|
$
|
2,687.5
|
|
$
|
140.3
|
|
$
|
79.5
|
|
||
|
Increase (decrease) in 2011
|
|
|
|
||||||||
|
NMHG
|
738.9
|
|
63.9
|
|
50.2
|
|
|||||
|
HBB
|
(22.7
|
)
|
(12.1
|
)
|
(6.0
|
)
|
|||||
|
KC (net of eliminations)
|
2.5
|
|
(3.4
|
)
|
(2.5
|
)
|
|||||
|
NACoal
|
(75.0
|
)
|
(18.1
|
)
|
(10.2
|
)
|
|||||
|
NACCO and Other
|
—
|
|
3.5
|
|
51.1
|
|
|||||
|
2011
|
$
|
3,331.2
|
|
$
|
174.1
|
|
$
|
162.1
|
|
||
CONSOLIDATED INCOME TAXES
The Company's income tax provision includes U.S. federal, state and local, and foreign income taxes. In determining the effective income tax rate, the Company analyzes various factors, including the Company's annual earnings, taxing jurisdictions in which the earnings will be generated, the impact of state and local income taxes, the Company's ability to use tax credits, net operating loss carryforwards and capital loss carryforwards, and available tax planning alternatives. Discrete items, including the effect of changes in tax laws, tax rates, certain circumstances with respect to valuation allowances or other unusual or non-recurring tax adjustments are reflected in the period in which they occur as an addition to, or reduction from, the income tax provision, rather than included in the effective income tax rate.
42
|
Item 7.
|
MANAGEMENT'S DISCUSSION AND ANALYSIS OF FINANCIAL CONDITION AND RESULTS OF OPERATIONS
|
NACCO INDUSTRIES, INC. AND SUBSIDIARIES
(Tabular Amounts in Millions, Except Per Share and Percentage Data)
The Company continually evaluates its deferred tax assets to determine if a valuation allowance is required. A valuation allowance is required where realization is determined to no longer meet the “more likely than not” standard. During 2008 and continuing into 2009, significant downturns were experienced in NMHG's major markets. The significant decrease in the operations, and certain actions taken by management to reduce NMHG's manufacturing capacity to more appropriate levels, resulted in a three-year cumulative loss for each of NMHG's Australian, European and U.S. operations. As a result, valuation allowances against deferred tax assets for these operations have been provided. Although NMHG projects earnings over the longer term for the operations, such longer-term forecasts cannot be utilized to support the future utilization of deferred tax assets when a three-year cumulative loss is present.
The establishment of a valuation allowance does not have an impact on cash, nor does such an allowance preclude the Company from using its loss carryforwards or other deferred tax assets in future periods. The tax net operating losses that comprise the Australian and the substantial portion of the European deferred tax assets do not expire under local law and the U.S. state taxing jurisdictions provide for a carryforward period of up to 20 years.
The Company expects that if the major markets for its products continue to experience economic recovery similar to 2011, the Company would expect to start to release valuation allowances in taxing jurisdictions when a three-year cumulative loss is no longer present and long-term forecasts are favorable.
A reconciliation of the Company's consolidated federal statutory and effective income tax is as follows for the years ended
December 31
:
|
|
2011
|
2010
|
2009
|
||||||||
|
Income before income taxes
|
$
|
213.8
|
|
$
|
96.8
|
|
$
|
28.9
|
|
||
|
Statutory taxes at 35%
|
$
|
74.8
|
|
$
|
33.9
|
|
$
|
10.1
|
|
||
|
Discrete items:
|
|
|
|
||||||||
|
NMHG settlements
|
(1.0
|
)
|
(5.0
|
)
|
0.1
|
|
|||||
|
NMHG sale of foreign investments
|
—
|
|
(2.4
|
)
|
—
|
|
|||||
|
NMHG change in tax law
|
—
|
|
(2.4
|
)
|
—
|
|
|||||
|
NMHG unremitted foreign earnings
|
—
|
|
1.3
|
|
10.1
|
|
|||||
|
NMHG basis difference in foreign stock
|
—
|
|
—
|
|
(11.9
|
)
|
|||||
|
NMHG valuation allowance
|
—
|
|
—
|
|
1.1
|
|
|||||
|
NACCO and Other settlements
|
(0.1
|
)
|
(1.2
|
)
|
—
|
|
|||||
|
Other
|
(2.0
|
)
|
1.7
|
|
(2.0
|
)
|
|||||
|
|
(3.1
|
)
|
(8.0
|
)
|
(2.6
|
)
|
|||||
|
Other permanent items:
|
|
|
|
||||||||
|
Valuation allowance
|
(9.5
|
)
|
9.1
|
|
16.4
|
|
|||||
|
NACoal percentage depletion
|
(6.7
|
)
|
(7.2
|
)
|
(6.5
|
)
|
|||||
|
Foreign tax rate differential
|
(8.7
|
)
|
(14.1
|
)
|
(3.1
|
)
|
|||||
|
Other
|
4.9
|
|
3.7
|
|
6.2
|
|
|||||
|
|
(20.0
|
)
|
(8.5
|
)
|
13.0
|
|
|||||
|
Income tax provision
|
$
|
51.7
|
|
$
|
17.4
|
|
$
|
20.5
|
|
||
|
Effective income tax rate
|
24.2
|
%
|
18.0
|
%
|
70.9
|
%
|
|||||
The effect of discrete items is as follows:
During 2011, the Company recognized a tax benefit related to the expiration of the statute of limitations on certain items.
During 2010, the Company recognized a tax benefit for the reduction in a required reserve for uncertain tax positions related to certain foreign tax law changes which became effective and reduced the statute of limitations for certain items. Additionally, the Company has effectively settled its U.S. federal tax audits for the 2005 and 2006 tax years resulting in a reduction in the reserve for uncertain tax positions at NMHG and NACCO and Other. The reductions in uncertain tax positions are also the
43
|
Item 7.
|
MANAGEMENT'S DISCUSSION AND ANALYSIS OF FINANCIAL CONDITION AND RESULTS OF OPERATIONS
|
NACCO INDUSTRIES, INC. AND SUBSIDIARIES
(Tabular Amounts in Millions, Except Per Share and Percentage Data)
result of the lapse of the applicable statutes of limitation in certain U.S. and non-U.S. taxing jurisdictions.
During 2010, NMHG sold investments in subsidiaries in Australia and Europe. Due to the difference between the book basis and tax basis of the investments in each subsidiary, the Company recognized tax benefits related to the sales during 2010.
The Company determined during 2009 that up to $75 million in foreign earnings, primarily with respect to its European business group, may be repatriated within the foreseeable future. As a result of additional earnings and changes in currency exchange rates, the Company increased its estimate of the foreign earnings to be repatriated within the foreseeable future by an additional $5 million in both 2011 and 2010. During 2010, the Company repatriated $28 million of such deferred earnings to the U.S. There were no repatriations of these deferred earnings in 2011. As a result of these determinations and actions, the Company has provided a cumulative deferred tax liability in the amount of $8.8 million with respect to the cumulative unremitted earnings of the Company as of
December 31, 2011
. The Company has continued to conclude that predominantly all remaining foreign earnings in excess of this amount will be indefinitely reinvested in its foreign operations and, therefore, the recording of deferred tax liabilities for such unremitted earnings is not required. It is impracticable to determine the total amount of unrecognized deferred taxes with respect to these permanently reinvested earnings; however, foreign tax credits would be available to partially reduce U.S. income taxes in the event of a distribution.
During 2009, NMHG recognized an $11.9 million tax benefit for the decline in value of its investment in foreign subsidiary stock.
During 2008 and 2009, NMHG's effective income tax rate was significantly affected by the determination that deferred tax assets related to its Australian and certain European operations and certain U.S. state income taxing jurisdictions no longer met the threshold for recognition and valuation allowances were recorded as discrete items as described above.
In addition to the effect of discrete items, the income tax provision is affected by permanent items, which are included in the effective income tax rate. In 2011, the effective income tax rate included amounts for the reversal of valuation allowances that were no longer required as a result of the utilization of net operating loss deferred tax assets, primarily at NMHG. In 2010 and 2009, the effective income tax rate included amounts for additional valuation allowances related to incremental deferred tax assets generated for which the realization was uncertain, primarily at NMHG. The effective income tax rate is also affected by the benefit of percentage depletion at NACoal and foreign income taxed at lower rates primarily at NMHG.
See Note 17 to the Consolidated Financial Statements in this Form 10-K for further discussion of the Company's income taxes.
44
|
Item 7.
|
MANAGEMENT'S DISCUSSION AND ANALYSIS OF FINANCIAL CONDITION AND RESULTS OF OPERATIONS
|
NACCO INDUSTRIES, INC. AND SUBSIDIARIES
(Tabular Amounts in Millions, Except Per Share and Percentage Data)
NACCO MATERIALS HANDLING GROUP
FINANCIAL REVIEW
The segment and geographic results of operations for NMHG were as follows for the year ended
December 31
:
|
|
2011
|
2010
|
2009
|
||||||||
|
Revenues
|
|
|
|
||||||||
|
Americas
|
$
|
1,570.7
|
|
$
|
1,140.7
|
|
$
|
853.4
|
|
||
|
Europe
|
751.7
|
|
476.6
|
|
390.1
|
|
|||||
|
Other
|
218.4
|
|
184.6
|
|
231.7
|
|
|||||
|
|
$
|
2,540.8
|
|
$
|
1,801.9
|
|
$
|
1,475.2
|
|
||
|
Operating profit (loss)
|
|
|
|
||||||||
|
Americas
|
$
|
86.8
|
|
$
|
48.5
|
|
$
|
23.5
|
|
||
|
Europe
|
21.9
|
|
2.7
|
|
(47.9
|
)
|
|||||
|
Other
|
1.3
|
|
(5.1
|
)
|
(6.8
|
)
|
|||||
|
|
$
|
110.0
|
|
$
|
46.1
|
|
$
|
(31.2
|
)
|
||
|
Interest expense
|
$
|
15.8
|
|
$
|
16.6
|
|
$
|
19.0
|
|
||
|
Other income
|
$
|
(7.3
|
)
|
$
|
(4.6
|
)
|
$
|
(3.4
|
)
|
||
|
Net income (loss) attributable to stockholders
|
$
|
82.6
|
|
$
|
32.4
|
|
$
|
(43.1
|
)
|
||
|
Effective income tax rate
|
18.6
|
%
|
5.3
|
%
|
7.7
|
%
|
|||||
See the discussion of the consolidated effective income tax rate in the Consolidated Income Taxes section of Management’s Discussion and Analysis of Financial Condition and Results of Operations in this Form 10-K.
2011
Compared with
2010
The following table identifies the components of change in revenues for
2011
compared with
2010
:
|
|
Revenues
|
||
|
2010
|
$
|
1,801.9
|
|
|
Increase (decrease) in 2011 from:
|
|
||
|
Unit volume and product mix
|
607.5
|
|
|
|
Foreign currency
|
63.3
|
|
|
|
Unit price
|
52.9
|
|
|
|
Other
|
29.0
|
|
|
|
Parts
|
26.6
|
|
|
|
Sale of certain operations
|
(40.4
|
)
|
|
|
2011
|
$
|
2,540.8
|
|
Revenues increased 41.0% to $2,540.8 million in 2011 compared with $1,801.9 million in 2010, primarily as a result of a significant increase in unit volume in all geographic markets, favorable foreign currency movements primarily as the euro and Australian dollar strengthened against the U.S. dollar, the favorable effect of unit price increases implemented in late 2010 and early 2011, mainly in the Americas and Europe, and an increase in parts volume, primarily in the Americas. The increase in revenue was slightly offset by the sale of certain retail and rental operations in Australia and Europe in 2010. Worldwide new unit shipments increased in 2011 to 79,671 units from shipments of 60,014 units in 2010.
45
|
Item 7.
|
MANAGEMENT'S DISCUSSION AND ANALYSIS OF FINANCIAL CONDITION AND RESULTS OF OPERATIONS
|
NACCO INDUSTRIES, INC. AND SUBSIDIARIES
(Tabular Amounts in Millions, Except Per Share and Percentage Data)
The following table identifies the components of change in operating profit for
2011
compared with
2010
:
|
|
Operating Profit
|
||
|
2010
|
$
|
46.1
|
|
|
Increase (decrease) in 2011 from:
|
|
||
|
Restructuring programs
|
(1.9
|
)
|
|
|
Loss on sale of certain operations
|
6.1
|
|
|
|
|
50.3
|
|
|
|
Gross profit
|
132.3
|
|
|
|
Other
|
0.8
|
|
|
|
Other selling, general and administrative expenses
|
(52.2
|
)
|
|
|
Foreign currency
|
(21.2
|
)
|
|
|
2011
|
$
|
110.0
|
|
NMHG recognized operating profit of $110.0 million in 2011 compared with $46.1 million in 2010. The increase was primarily due to improved gross profit as a result of higher sales volumes on units and parts, the favorable effect of price increases, which fully offset material cost increases, and lower manufacturing variances due to higher production levels in 2011. The increase in gross profit was partially offset by higher selling, general and administrative expenses, mainly due to higher employee-related expenses resulting from the full restoration in 2011 of compensation and benefits, which were only partially restored in 2010, and an unfavorable change in foreign currency primarily from the absence of deferred gains on foreign currency exchange contracts recognized in earnings during 2010 and the weakening of the U.S. dollar against the euro.
NMHG recognized net income attributable to stockholders of $82.6 million in 2011 compared with $32.4 million in 2010. The increase was primarily a result of the improvement in operating profit.
Backlog
NMHG’s worldwide backlog level was approximately 24,700 units at
December 31, 2011
compared with approximately 23,000 units at
December 31, 2010
and approximately 25,600 units at September 30, 2011.
2010
Compared with
2009
The following table identifies the components of change in revenues for
2010
compared with
2009
:
|
|
Revenues
|
||
|
2009
|
$
|
1,475.2
|
|
|
Increase (decrease) in 2010 from:
|
|
||
|
Unit volume and product mix
|
337.9
|
|
|
|
Parts
|
33.0
|
|
|
|
Foreign currency
|
10.8
|
|
|
|
Other
|
7.9
|
|
|
|
Sale of certain operations
|
(62.9
|
)
|
|
|
2010
|
$
|
1,801.9
|
|
Revenues increased 22.1% to $1,801.9 million in 2010 compared with $1,475.2 million in 2009, primarily as a result of an increase in units and parts volume in the Americas and Europe and favorable foreign currency movements due to the strengthening of the Brazilian Real and Australian dollar against the U.S. dollar. Worldwide new unit shipments increased in 2010 to 60,014 units from shipments of 41,597 units in 2009. The increase in revenue was partially offset by the sale of certain retail and rental operations in Australia and Europe during 2010 and in 2009.
46
|
Item 7.
|
MANAGEMENT'S DISCUSSION AND ANALYSIS OF FINANCIAL CONDITION AND RESULTS OF OPERATIONS
|
NACCO INDUSTRIES, INC. AND SUBSIDIARIES
(Tabular Amounts in Millions, Except Per Share and Percentage Data)
The following table identifies the components of change in operating profit (loss) for
2010
compared with
2009
:
|
|
Operating Profit (Loss)
|
||
|
2009
|
$
|
(31.2
|
)
|
|
Increase (decrease) in 2010 from:
|
|
||
|
Restructuring programs
|
9.3
|
|
|
|
Gain on sale of assets
|
(1.4
|
)
|
|
|
|
(23.3
|
)
|
|
|
Gross profit
|
83.2
|
|
|
|
Foreign currency
|
19.0
|
|
|
|
Other
|
3.8
|
|
|
|
Other selling, general and administrative expenses
|
(32.4
|
)
|
|
|
|
50.3
|
|
|
|
Loss on sale of certain operations
|
(6.1
|
)
|
|
|
Restructuring programs
|
1.9
|
|
|
|
2010
|
$
|
46.1
|
|
NMHG recognized operating profit of $46.1 million in 2010 compared with an operating loss of $31.2 million in 2009. The increase was primarily due to improved gross profit and a favorable foreign currency impact mainly in Europe. Gross profit improved primarily as a result of higher sales volumes and margins on units and parts and lower manufacturing variances due to higher production levels in 2010. In addition, a reversal of a restructuring charge in Europe in 2010 that had been previously recognized and the absence of restructuring charges taken in 2009 favorably affected operating profit. See Note 3 to the Consolidated Financial Statements in this Form 10-K for further discussion of the Company’s restructuring and related programs.
The increase was partially offset by higher selling, general and administrative expenses primarily as a result of higher employee-related expenses from the partial restoration of compensation and benefits, which were reduced in 2009, and a loss on the sale of certain operations in Australia and Europe during 2010.
NMHG recognized net income attributable to stockholders of $32.4 million in 2010 compared with a net loss attributable to stockholders of $43.1 million in 2009. The increase was primarily a result of the improvement in operating profit (loss).
47
|
Item 7.
|
MANAGEMENT'S DISCUSSION AND ANALYSIS OF FINANCIAL CONDITION AND RESULTS OF OPERATIONS
|
NACCO INDUSTRIES, INC. AND SUBSIDIARIES
(Tabular Amounts in Millions, Except Per Share and Percentage Data)
LIQUIDITY AND CAPITAL RESOURCES
Cash Flows
The following tables detail the change in cash flow for NMHG for the years ended
December 31
:
|
|
2011
|
2010
|
Change
|
||||||||
|
Operating activities:
|
|
|
|
||||||||
|
Net income
|
$
|
82.6
|
|
$
|
32.3
|
|
$
|
50.3
|
|
||
|
Depreciation and amortization
|
31.3
|
|
33.9
|
|
(2.6
|
)
|
|||||
|
Restructuring reversals
|
—
|
|
(1.9
|
)
|
1.9
|
|
|||||
|
Other
|
13.8
|
|
(23.4
|
)
|
37.2
|
|
|||||
|
Working capital changes, excluding the effects of business dispositions:
|
|
|
|||||||||
|
Accounts receivable
|
(59.3
|
)
|
(91.9
|
)
|
32.6
|
|
|||||
|
Inventories
|
(37.8
|
)
|
(83.1
|
)
|
45.3
|
|
|||||
|
Accounts payable and other liabilities
|
25.8
|
|
159.2
|
|
(133.4
|
)
|
|||||
|
Other
|
(1.8
|
)
|
22.4
|
|
(24.2
|
)
|
|||||
|
Net cash provided by operating activities
|
54.6
|
|
47.5
|
|
7.1
|
|
|||||
|
Investing activities:
|
|
|
|
||||||||
|
Expenditures for property, plant and equipment
|
(16.5
|
)
|
(12.1
|
)
|
(4.4
|
)
|
|||||
|
Proceeds from the sale of assets
|
0.5
|
|
0.6
|
|
(0.1
|
)
|
|||||
|
Proceeds from the sale of businesses
|
—
|
|
3.0
|
|
(3.0
|
)
|
|||||
|
Other
|
0.1
|
|
—
|
|
0.1
|
|
|||||
|
Net cash used for investing activities
|
(15.9
|
)
|
(8.5
|
)
|
(7.4
|
)
|
|||||
|
Cash flow before financing activities
|
$
|
38.7
|
|
$
|
39.0
|
|
$
|
(0.3
|
)
|
||
Net cash provided by operating activities increased $7.1 million in 2011 compared with 2010 primarily as a result of the improvement in net income and the change in other operating activities, partially offset by the change in working capital. The increase in other operating activities was mainly due to the non-cash effect of the release of deferred gains on foreign currency exchange contracts into earnings during 2010 and a change in deferred taxes. During 2010 and 2011, working capital was significantly affected as sales began to recover from the low levels experienced in 2009 and, as a result, accounts receivable, inventory and accounts payable increased each year. The other working capital change was primarily from a decrease in intercompany tax receivables mainly due to improved operating results.
Net cash used for investing activities increased primarily as a result of an increase in expenditures for property, plant and equipment in 2011 compared with 2010 and the absence of proceeds from the sale of certain retail and rental operations in Australia and Europe in 2010.
|
|
2011
|
2010
|
Change
|
||||||||
|
Financing Activities:
|
|
|
|
||||||||
|
Net reductions of long-term debt and revolving credit agreements
|
$
|
(9.3
|
)
|
$
|
(16.3
|
)
|
$
|
7.0
|
|
||
|
Cash dividends paid to NACCO
|
(10.0
|
)
|
(5.0
|
)
|
(5.0
|
)
|
|||||
|
Financing fees paid
|
—
|
|
(3.1
|
)
|
3.1
|
|
|||||
|
Other
|
(0.2
|
)
|
—
|
|
(0.2
|
)
|
|||||
|
Net cash used for financing activities
|
$
|
(19.5
|
)
|
$
|
(24.4
|
)
|
$
|
4.9
|
|
||
48
|
Item 7.
|
MANAGEMENT'S DISCUSSION AND ANALYSIS OF FINANCIAL CONDITION AND RESULTS OF OPERATIONS
|
NACCO INDUSTRIES, INC. AND SUBSIDIARIES
(Tabular Amounts in Millions, Except Per Share and Percentage Data)
The decrease in net cash used for financing activities during 2011 compared with 2010 was primarily due to a smaller net reduction of long-term debt and revolving credit agreements during 2011 and the absence of financing fees paid in 2010, partially offset by increased dividends paid to NACCO.
Financing Activities
NMHG's primary financing is provided by a $150.0 million secured floating-rate revolving credit facility (the “NMHG Facility”) and a term loan facility (the “NMHG Term Loan”). The obligations under the NMHG Facility are secured by a first lien on the cash and cash equivalents, accounts receivable and inventory of NMHG. The approximate book value of NMHG's assets held as collateral under the NMHG Facility was $675 million as of
December 31, 2011
.
The maximum availability under the NMHG Facility is governed by a borrowing base derived from advance rates against the inventory and accounts receivable of the borrowers, as defined in the NMHG Facility. Adjustments to reserves booked against these assets, including inventory reserves, will change the eligible borrowing base and thereby impact the liquidity provided by the NMHG Facility. A portion of the availability can be denominated in British pounds or euros. Borrowings bear interest at a floating rate which can be a base rate or LIBOR (London Interbank Offered Rate) plus a margin. The applicable margins, effective
December 31, 2011
, for domestic base rate loans and LIBOR loans were 2.00% and 3.25%, respectively. The applicable margin, effective
December 31, 2011
, for foreign overdraft loans and foreign LIBOR loans were 3.50% and 3.25%, respectively. The NMHG Facility also requires the payment of a fee of 0.75% per annum on the unused commitment.
At
December 31, 2011
, the excess availability under the NMHG Facility was $132.6 million, which reflects reductions of $10.0 million for an excess availability requirement and $7.4 million for letters of credit. If commitments or availability under these facilities are increased, availability under the NMHG Facility will be reduced.
There were no borrowings outstanding under the NMHG Facility at
December 31, 2011
. The domestic and foreign floating rates of interest applicable to the NMHG Facility on
December 31, 2011
were 5.25% and a range of 3.50% to 4.50%, respectively, including the applicable floating rate margin. The NMHG Facility expires in June 2014.
The NMHG Facility includes restrictive covenants, which, among other things, limit the payment of dividends to NACCO. Subject to achieving availability thresholds, dividends to NACCO are limited to the larger of $5.0 million or 50% of the preceding year's net income for NMHG. The NMHG Facility also requires NMHG to maintain a minimum excess availability during the term of the agreement and achieve a maximum leverage ratio and a minimum fixed charge coverage ratio, in certain circumstances, as defined in the NMHG Facility. At
December 31, 2011
, NMHG was in compliance with the covenants in the NMHG Facility.
During 2006, NACCO Materials Handling Group, Inc. (“NMHG Inc.”), a wholly owned subsidiary of NMHG, entered into the NMHG Term Loan that provided for term loans up to an aggregate principal amount of $225.0 million, which mature in 2013. The term loans require quarterly payments in an amount equal to 1% of the original principal per year for the first six years, with the remaining balance to be paid in four equal installments in the seventh year. At
December 31, 2011
, there was $212.6 million outstanding under the NMHG Term Loan.
Borrowings under the NMHG Term Loan are guaranteed by NMHG and substantially all of NMHG's domestic subsidiaries. The obligations of the guarantors under the NMHG Term Loan are secured by a first lien on all of the domestic machinery, equipment and real property owned by NMHG Inc. and each guarantor and a second lien on all of the collateral securing the obligations of NMHG under the NMHG Facility. The approximate book value of NMHG's assets held as collateral under the NMHG Term Loan was $760 million as of
December 31, 2011
, which includes the book value of the assets securing the NMHG Facility.
Outstanding borrowings under the NMHG Term Loan bear interest at a variable rate that, at NMHG Inc.'s option, will be either LIBOR or a floating rate, as defined in the NMHG Term Loan, plus an applicable margin. The applicable margin is subject to adjustment based on a leverage ratio. The weighted average interest rate on the amount outstanding under the NMHG Term Loan at
December 31, 2011
was 2.15%.
49
|
Item 7.
|
MANAGEMENT'S DISCUSSION AND ANALYSIS OF FINANCIAL CONDITION AND RESULTS OF OPERATIONS
|
NACCO INDUSTRIES, INC. AND SUBSIDIARIES
(Tabular Amounts in Millions, Except Per Share and Percentage Data)
The NMHG Term Loan includes restrictive covenants, which, among other things, limit the payment of dividends to NACCO. Subject to achieving availability thresholds, dividends to NACCO are limited to the larger of $5.0 million or 50% of the preceding year's net income for NMHG. The NMHG Term Loan also requires NMHG to meet certain financial tests, including, but not limited to, minimum excess availability, maximum leverage ratio and minimum fixed charge coverage ratio tests. At
December 31, 2011
, NMHG was in compliance with the covenants in the NMHG Term Loan.
In addition to the amount outstanding under the NMHG Term Loan, NMHG had borrowings of approximately $12.8 million at
December 31, 2011
under various foreign working capital facilities.
NMHG incurred fees and expenses of $3.1 million during 2010 related to the amended and restated NMHG Facility. These fees were deferred and are being amortized as interest expense over the term of the NMHG Facility. No similar fees were incurred in 2011 or 2009.
NMHG believes funds available from cash on hand at NMHG and the Company, the NMHG Facility, other available lines of credit and operating cash flows will provide sufficient liquidity to meet its operating needs and commitments during the next twelve months and until the expiration of the NMHG Facility in June 2014.
Contractual Obligations, Contingent Liabilities and Commitments
Following is a table summarizing the contractual obligations of NMHG as of
December 31, 2011
:
|
|
Payments Due by Period
|
||||||||||||||||||||||||||
|
Contractual Obligations
|
Total
|
2012
|
2013
|
2014
|
2015
|
2016
|
Thereafter
|
||||||||||||||||||||
|
NMHG Term Loan
|
$
|
212.6
|
|
$
|
159.6
|
|
$
|
53.0
|
|
$
|
—
|
|
$
|
—
|
|
$
|
—
|
|
$
|
—
|
|
||||||
|
Variable interest payments on Term Loan
|
3.4
|
|
3.3
|
|
0.1
|
|
—
|
|
—
|
|
—
|
|
—
|
|
|||||||||||||
|
Other debt
|
12.8
|
|
11.7
|
|
0.7
|
|
0.3
|
|
0.1
|
|
—
|
|
—
|
|
|||||||||||||
|
Variable interest payments on other debt
|
0.4
|
|
0.3
|
|
0.1
|
|
—
|
|
—
|
|
—
|
|
—
|
|
|||||||||||||
|
Capital lease obligations including principal and interest
|
0.8
|
|
0.2
|
|
0.2
|
|
0.2
|
|
0.2
|
|
—
|
|
—
|
|
|||||||||||||
|
Operating leases
|
29.1
|
|
11.8
|
|
8.5
|
|
4.7
|
|
2.4
|
|
1.1
|
|
0.6
|
|
|||||||||||||
|
Purchase and other obligations
|
453.4
|
|
442.6
|
|
—
|
|
3.9
|
|
4.5
|
|
—
|
|
2.4
|
|
|||||||||||||
|
Total contractual cash obligations
|
$
|
712.5
|
|
$
|
629.5
|
|
$
|
62.6
|
|
$
|
9.1
|
|
$
|
7.2
|
|
$
|
1.1
|
|
$
|
3.0
|
|
||||||
NMHG has a long-term liability of approximately $8.1 million for unrecognized tax benefits, including interest and penalties, as of
December 31, 2011
. At this time, the Company is unable to make a reasonable estimate of the timing of payments due to, among other factors, the uncertainty of the timing and outcome of its audits.
An event of default, as defined in the agreements governing the NMHG Facility, other revolving credit facilities, and in operating and capital lease agreements, could cause an acceleration of the payment schedule. No such event of default has occurred or is anticipated under these agreements. An event of default, as defined in the agreements governing the NMHG Term Loan could cause an acceleration of the payment schedule. No such event of default has occurred and NMHG anticipates refinancing the NMHG Term Loan by September 30, 2012.
NMHG’s interest payments are calculated based upon NMHG’s anticipated payment schedule and the
December 31, 2011
LIBOR rate and applicable margins, as defined in the NMHG Term Loan and its other debt. A 1/8% increase in the LIBOR rate would increase NMHG’s estimated total interest payments on the NMHG Term Loan by $0.2 million and its other debt by less than $0.1 million.
The purchase and other obligations are primarily for accounts payable, open purchase orders and accrued payroll and incentive compensation.
Pension and postretirement funding can vary significantly each year due to plan amendments, changes in the market value of plan assets, legislation and the Company’s funding decisions to contribute any excess above the minimum legislative funding requirements. As a result, pension and postretirement funding has not been included in the table above. Pension benefit
50
|
Item 7.
|
MANAGEMENT'S DISCUSSION AND ANALYSIS OF FINANCIAL CONDITION AND RESULTS OF OPERATIONS
|
NACCO INDUSTRIES, INC. AND SUBSIDIARIES
(Tabular Amounts in Millions, Except Per Share and Percentage Data)
payments are made from assets of the pension plans. NMHG expects to contribute approximately $4.6 million and $3.5 million to its U.S. and non-U.S. pension plans, respectively, in
2012
. NHMG expects to make payments related to its other postretirement plans of an additional amount of approximately $0.2 million per year in 2012 and 2013, $0.1 million per year in 2014 through 2016 and less than $0.1 million per year in 2017 through 2021. Benefit payments beyond that time cannot currently be estimated.
In addition, NMHG has recourse and repurchase obligations with a maximum undiscounted potential liability of $179.1 million at
December 31, 2011
. Recourse and repurchase obligations primarily represent contingent liabilities assumed by NMHG to support financing agreements made between NMHG’s customers and third-party finance companies for the customer’s purchase of lift trucks from NMHG. For these transactions, NMHG generally retains a perfected security interest in the lift truck, such that NMHG would take possession of the lift truck in the event NMHG would become liable under the terms of the recourse and repurchase obligations. Generally, these commitments are due upon demand in the event of default by the customer. The security interest is normally expected to equal or exceed the amount of the commitment. To the extent NMHG would be required to provide funding as a result of these commitments, NMHG believes the value of its perfected security interest and amounts available under existing credit facilities are adequate to meet these commitments in the foreseeable future.
The amount of the recourse or repurchase obligations increases and decreases over time as obligations under existing arrangements expire and new obligations arise in the ordinary course of business. Losses anticipated under the terms of the recourse or repurchase obligations were not significant at
December 31, 2011
and reserves have been provided for such losses in the Consolidated Financial Statements included elsewhere in this Form 10-K. See also “Related Party Transactions” below.
Capital Expenditures
The following table summarizes actual and planned capital expenditures:
|
Planned
|
Actual
|
Actual
|
|||||||||
|
|
2012
|
2011
|
2010
|
||||||||
|
NMHG
|
$
|
39.5
|
|
$
|
16.5
|
|
$
|
12.1
|
|
||
Planned expenditures in
2012
are primarily for improvements at NMHG's manufacturing locations, improvements to NMHG’s information technology infrastructure and product development. The principal sources of financing for these capital expenditures are expected to be internally generated funds and bank borrowings.
Capital Structure
NMHG’s capital structure is presented below:
|
December 31
|
|||||||||||
|
|
2011
|
2010
|
Change
|
||||||||
|
Cash and cash equivalents
|
$
|
184.9
|
|
$
|
169.5
|
|
$
|
15.4
|
|
||
|
Other net tangible assets
|
338.2
|
|
296.5
|
|
41.7
|
|
|||||
|
Net assets
|
523.1
|
|
466.0
|
|
57.1
|
|
|||||
|
Total debt
|
(226.0
|
)
|
(234.5
|
)
|
8.5
|
|
|||||
|
Total equity
|
$
|
297.1
|
|
$
|
231.5
|
|
$
|
65.6
|
|
||
|
Debt to total capitalization
|
43
|
%
|
50
|
%
|
(7
|
)%
|
|||||
The $41.7 million increase in other net tangible assets during 2011 was primarily attributable to higher accounts receivable from increased revenue and an increase in inventory as a result of higher demand. The increase was partially offset by a decrease in property, plant and equipment, an increase in other current liabilities primarily from employee-related accruals and an increase in accounts payable to fund higher levels of inventory.
Total equity increased $65.6 million in 2011 primarily as a result of $82.6 million of net income attributable to stockholders partially offset by a $12.0 million increase in accumulated other comprehensive loss and $5.0 million of dividends declared to NACCO during 2011.
51
|
Item 7.
|
MANAGEMENT'S DISCUSSION AND ANALYSIS OF FINANCIAL CONDITION AND RESULTS OF OPERATIONS
|
NACCO INDUSTRIES, INC. AND SUBSIDIARIES
(Tabular Amounts in Millions, Except Per Share and Percentage Data)
RELATED PARTY TRANSACTIONS
NMHG has a 20% ownership interest in NMHG Financial Services, Inc. (“NFS”), a joint venture with General Electric Capital Corporation (“GECC”), formed primarily for the purpose of providing financial services to independent Hyster
®
and Yale
®
lift truck dealers and National Account customers in the United States. NMHG’s ownership in NFS is accounted for using the equity method of accounting.
Generally, NMHG sells lift trucks through its independent dealer network or directly to customers. These dealers and customers may enter into a financing transaction with NFS or other unrelated third parties. NFS provides debt financing to dealers and lease financing to both dealers and customers. NFS’ total purchases of Hyster
®
and Yale
®
lift trucks from dealers, customers and directly from NMHG, such that NFS could provide lease financing to dealers and customers, for the years ended
December 31, 2011
,
2010
and
2009
were $337.3 million, $243.9 million and $266.7 million, respectively. Of these amounts, $38.7 million, $23.7 million and $38.0 million for the years ended
December 31, 2011
,
2010
and
2009
, respectively, were invoiced directly from NMHG to NFS so that the dealer or customer could obtain financing from NFS. Amounts receivable from NFS were $4.9 million and $3.2 million at
December 31, 2011
and
2010
, respectively.
Under the terms of the joint venture agreement with GECC, NMHG provides recourse for financing provided by NFS to NMHG dealers. Additionally, the credit quality of a customer or concentration issues within GECC may necessitate providing recourse or repurchase obligations for lift trucks purchased by customers and financed through NFS. At
December 31, 2011
, approximately $112.9 million of the Company’s recourse or repurchase obligations of $179.1 million related to transactions with NFS. NMHG has reserved for losses under the terms of the recourse or repurchase obligations in its consolidated financial statements. Historically, NMHG has not had significant losses with respect to these obligations. During
2011
,
2010
and
2009
, the net losses resulting from customer defaults did not have a material impact on NMHG’s results of operations or financial position.
In connection with the joint venture agreement, NMHG also provides a guarantee to GECC for 20% of NFS’ debt with GECC, such that NMHG would become liable under the terms of NFS’ debt agreements with GECC in the case of default by NFS. At
December 31, 2011
, loans from GECC to NFS totaled $684.7 million. Although NMHG’s contractual guarantee was $136.9 million, the loans by GECC to NFS are secured by NFS’ customer receivables, of which NMHG guarantees $112.9 million. Excluding the $112.9 million of NFS receivables guaranteed by NMHG from NFS’ loans to GECC, NMHG’s incremental obligation as a result of this guarantee to GECC is $114.4 million. NFS has not defaulted under the terms of this debt financing in the past and although there can be no assurances, NMHG is not aware of any circumstances that would cause NFS to default in future periods. However, NMHG is monitoring the effect of the economic environment on NFS and GECC.
In addition to providing financing to NMHG’s dealers, NFS provides operating lease financing to NMHG. Operating lease obligations primarily relate to specific sale-leaseback-sublease transactions for certain NMHG customers whereby NMHG sells lift trucks to NFS, NMHG leases these lift trucks back under an operating lease agreement and NMHG subleases those lift trucks to customers under an operating lease agreement. Total obligations to NFS under the operating lease agreements were $6.0 million and $7.3 million at
December 31, 2011
and
2010
, respectively. In addition, NMHG provides certain subsidies to its customers that are paid directly to NFS. Total subsidies were $1.4 million, $4.0 million and $5.4 million for
2011
,
2010
and
2009
, respectively.
NMHG provides certain services to NFS for which it receives compensation under the terms of the joint venture agreement. These services consist primarily of administrative functions and remarketing services. Total income recorded by NMHG related to these services was $7.3 million in
2011
, $5.0 million in
2010
and $7.6 million in
2009
.
NMHG has a 50% ownership interest in Sumitomo-NACCO Materials Handling Group, Ltd. (“SN”), a limited liability company that was formed in 1970 primarily to manufacture and distribute Sumitomo-Yale branded lift trucks in Japan and export Hyster
®
- and Yale
®
-branded lift trucks and related components and service parts outside of Japan. Sumitomo Heavy Industries, Ltd. owns the remaining 50% interest in SN. Each shareholder of SN is entitled to appoint directors representing 50% of the vote of SN’s board of directors. All matters related to policies and programs of operation, manufacturing and sales activities require mutual agreement between NMHG and Sumitomo Heavy Industries, Ltd. prior to a vote of SN’s board of directors. As a result, NMHG accounts for its ownership in SN using the equity method of accounting. NMHG purchases, under normal trade terms based on current market prices, products from SN for sale outside of Japan. In
2011
,
2010
and
2009
, purchases from SN were $105.5 million, $66.9 million and $44.7 million, respectively. Amounts payable to SN at
52
|
Item 7.
|
MANAGEMENT'S DISCUSSION AND ANALYSIS OF FINANCIAL CONDITION AND RESULTS OF OPERATIONS
|
NACCO INDUSTRIES, INC. AND SUBSIDIARIES
(Tabular Amounts in Millions, Except Per Share and Percentage Data)
December 31, 2011
and
2010
were $21.6 million and $30.7 million, respectively.
During
2010
and
2009
, NMHG recognized $1.1 million and $1.8 million, respectively, in expenses related to payments to SN for engineering design services. No expenses were recognized for these services in 2011. Additionally, NMHG recognized income of $1.6 million, $1.2 million and $0.4 million during
2011
,
2010
and
2009
, respectively, for payments from SN for use of technology developed by NMHG.
OUTLOOK
NMHG expects global lift truck markets to moderate in 2012, with volumes comparable to prior periods in the Americas and Asia-Pacific and modest declines in Europe, particularly Western Europe, and China. Nonetheless, NMHG anticipates a slight increase in unit booking and shipment levels in 2012 compared with 2011, primarily as a result of new product introductions and marketing programs. Backlog and parts volumes are also expected to remain relatively steady in 2012. NMHG will continue to monitor ongoing market conditions and adjust manufacturing levels as necessary.
Although commodity costs stabilized and decreased slightly at the end of 2011, these markets are highly volatile and commodity price increases, particularly for steel, are expected in 2012. Price increases already implemented and announced in the first quarter of 2012 are expected to offset a significant portion of these anticipated higher material costs over time. NMHG will also continue to monitor economic conditions and the resulting effects on costs to determine the need for future price increases.
NMHG's new electric-rider, warehouse, internal combustion engine and big truck product development programs are continuing to move forward. The new electric-rider lift truck program is bringing a full line of newly designed products to market. NMHG launched two new electric lift trucks in 2011 and expects to launch the final two models in this electric-rider lift truck program in the first half of 2012. In addition, NMHG successfully launched a new medium-duty internal combustion engine lift truck in Europe in the third quarter of 2011 to complement the product launched in the Americas in July 2010. In mid-2011, NMHG also introduced into certain Latin American markets a new range of UTILEV
®
brand forklift trucks, which are basic forklift trucks that meet the needs of lower-intensity users. This new internal combustion engine series of utility lift trucks is expected to be introduced into global markets in 2012. Finally, stricter diesel emission regulations go into effect in 2012 in certain global markets. NMHG has truck engine systems that meet the emission requirements of various regions of the world. In response to the stricter regulations, NMHG expects to launch a range of lift trucks in 2012 that will include engine systems that meet the new Tier 4 emissions requirements. All of these new products are expected to help increase customer satisfaction, improve revenues and enhance operating margins. In the context of these new product introductions, NMHG will continue to focus on improving distribution effectiveness and capitalizing on its product capabilities to gain additional market share.
Nevertheless, net income is expected to decline materially in 2012 compared with 2011 as a result of the absence of one-time items, including the elimination of certain post retirement benefits, which benefited 2011 results, adverse currency movements, an anticipated shift in sales mix to lower margin markets, as well as higher marketing and employee-related costs. The decrease in net income is expected to occur primarily in the first half of the year, with modest improvements in the second half of 2012 compared with the second half of 2011. Results are expected to be down in all major markets, except Brazil. Significant improvements in Brazil are expected to be offset by a decline in the North America results. Cash flow before financing activities for the full year 2012 is expected to be higher than 2011 despite a significant increase in capital expenditures in 2012 compared with 2011.
Longer term, NMHG is focused on improving margins on new lift truck units, especially in its internal combustion engine business, through the introduction of its new products. In addition, NMHG is strategically focused on gaining market share through these new products, which meet a broad range of market applications cost effectively, and through enhancements of its independent dealer network.
53
|
Item 7.
|
MANAGEMENT'S DISCUSSION AND ANALYSIS OF FINANCIAL CONDITION AND RESULTS OF OPERATIONS
|
NACCO INDUSTRIES, INC. AND SUBSIDIARIES
(Tabular Amounts in Millions, Except Per Share and Percentage Data)
HAMILTON BEACH BRANDS, INC.
HBB’s business is seasonal and a majority of revenues and operating profit typically occurs in the second half of the year when sales of small electric appliances to retailers and consumers increase significantly for the fall holiday-selling season.
FINANCIAL REVIEW
Operating Results
The results of operations for HBB were as follows for the year ended
December 31
:
|
|
2011
|
2010
|
2009
|
||||||||
|
Revenues
|
$
|
493.0
|
|
$
|
515.7
|
|
$
|
497.0
|
|
||
|
Operating profit
|
$
|
33.8
|
|
$
|
45.9
|
|
$
|
50.4
|
|
||
|
Interest expense
|
$
|
5.2
|
|
$
|
7.2
|
|
$
|
8.6
|
|
||
|
Other expense
|
$
|
0.8
|
|
$
|
0.3
|
|
$
|
0.3
|
|
||
|
Net income
|
$
|
18.4
|
|
$
|
24.4
|
|
$
|
26.1
|
|
||
|
Effective income tax rate
|
33.8
|
%
|
36.5
|
%
|
37.1
|
%
|
|||||
See the discussion of the consolidated effective income tax rate in the Consolidated Income Taxes section of Management’s Discussion and Analysis of Financial Condition and Results of Operations in this Form 10-K.
2011
Compared with
2010
The following table identifies the components of change in revenues for
2011
compared with
2010
:
|
|
Revenues
|
||
|
2010
|
$
|
515.7
|
|
|
Increase (decrease) in 2011 from:
|
|
||
|
Unit volume and product mix
|
(22.9
|
)
|
|
|
Average sales price
|
(1.5
|
)
|
|
|
Foreign currency
|
1.7
|
|
|
|
2011
|
$
|
493.0
|
|
Revenues decreased 4.4% to $493.0 million in 2011 compared with $515.7 million in 2010 primarily due to a decrease in sales volumes in the U.S. consumer retail market, mainly at HBB's mass market retail customers, and lower prices on comparable products sold. The decrease in revenues was partially offset by improved international and commercial sales and favorable foreign currency movements in 2011 compared with 2010.
The following table identifies the components of change in operating profit for
2011
compared with
2010
:
|
|
Operating Profit
|
||
|
2010
|
$
|
45.9
|
|
|
Increase (decrease) in 2011 from:
|
|
||
|
Gross profit
|
(15.9
|
)
|
|
|
Foreign currency
|
2.1
|
|
|
|
Other selling, general and administrative expenses
|
1.7
|
|
|
|
2011
|
$
|
33.8
|
|
HBB's operating profit decreased to $33.8 million in 2011 compared with $45.9 million in 2010. Operating profit declined primarily as a result of higher product costs, reduced sales volumes and higher transportation costs. In addition, operating
54
|
Item 7.
|
MANAGEMENT'S DISCUSSION AND ANALYSIS OF FINANCIAL CONDITION AND RESULTS OF OPERATIONS
|
NACCO INDUSTRIES, INC. AND SUBSIDIARIES
(Tabular Amounts in Millions, Except Per Share and Percentage Data)
profit decreased as a result of a $1.3 million charge during 2011 for the write-off of a capital lease asset no longer being leased and $0.9 million of costs related to moving the HBB distribution center into a larger facility during 2011. The decrease in operating profit was partially offset by favorable foreign currency movements and a decrease in other selling, general and administrative expenses mainly due to lower employee-related expenses.
HBB recognized net income of $18.4 million in 2011 compared with $24.4 million in 2010. The change was mainly due to the decrease in operating profit in 2011 partially offset by lower interest expense primarily as a result of $60.0 million of voluntary repayments under the HBB term loan agreement in 2011.
2010
Compared with
2009
The following table identifies the components of change in revenues for
2010
compared with
2009
:
|
|
Revenues
|
||
|
2009
|
$
|
497.0
|
|
|
Increase (decrease) in 2010 from:
|
|
||
|
Unit volume and product mix
|
26.2
|
|
|
|
Foreign currency
|
6.1
|
|
|
|
Average sales price
|
(13.6
|
)
|
|
|
2010
|
$
|
515.7
|
|
Revenues increased 3.8% to $515.7 million in 2010 compared with $497.0 million in 2009 primarily due to an increase in unit sales volumes in the U.S., Mexican and Latin American consumer retail markets reflecting higher demand than in 2009 and favorable foreign currency movements caused by a strengthening Canadian dollar and Mexican peso. The increase in revenues was partially offset by lower average selling prices of products to its retail customers.
The following table identifies the components of change in operating profit for
2010
compared with
2009
:
|
|
Operating Profit
|
||
|
2009
|
$
|
50.4
|
|
|
Increase (decrease) in 2010 from:
|
|
||
|
Other selling, general and administrative expenses
|
(8.3
|
)
|
|
|
Foreign currency
|
(0.3
|
)
|
|
|
Gross profit
|
4.1
|
|
|
|
2010
|
$
|
45.9
|
|
HBB's operating profit decreased to $45.9 million in 2010 compared with $50.4 million in 2009. Operating profit decreased as a result of higher selling, general and administrative expenses mainly due to higher employee-related expenses primarily as a result of the full restoration in 2010 of certain compensation and benefits that were reduced in 2009, an increase in management fees charged by the parent company in 2010 compared with 2009, and unfavorable foreign currency movements. See the discussion of “Management Fees” in the NACCO and Other section of Management's Discussion and Analysis of Financial Condition and Results of Operations in this Form 10-K. The decrease was partially offset by higher gross profit mainly due to higher unit sales volumes and lower product costs partially offset by lower average selling prices of products to its retail customers.
HBB recognized net income of $24.4 million in 2010 compared with $26.1 million in 2009. The change was mainly due to the decrease in operating profit in 2010 partially offset by lower interest expense.
55
|
Item 7.
|
MANAGEMENT'S DISCUSSION AND ANALYSIS OF FINANCIAL CONDITION AND RESULTS OF OPERATIONS
|
NACCO INDUSTRIES, INC. AND SUBSIDIARIES
(Tabular Amounts in Millions, Except Per Share and Percentage Data)
LIQUIDITY AND CAPITAL RESOURCES
Cash Flows
The following tables detail the change in cash flow for the years ended
December 31
:
|
|
2011
|
2010
|
Change
|
||||||||
|
Operating activities:
|
|
|
|
||||||||
|
Net income
|
$
|
18.4
|
|
$
|
24.4
|
|
$
|
(6.0
|
)
|
||
|
Depreciation and amortization
|
4.9
|
|
3.6
|
|
1.3
|
|
|||||
|
Other
|
1.7
|
|
(0.9
|
)
|
2.6
|
|
|||||
|
Working capital changes
|
(0.8
|
)
|
(12.1
|
)
|
11.3
|
|
|||||
|
Net cash provided by operating activities
|
24.2
|
|
15.0
|
|
9.2
|
|
|||||
|
Investing activities:
|
|
|
|
||||||||
|
Expenditures for property, plant and equipment
|
(3.7
|
)
|
(2.2
|
)
|
(1.5
|
)
|
|||||
|
Net cash used for investing activities
|
(3.7
|
)
|
(2.2
|
)
|
(1.5
|
)
|
|||||
|
Cash flow before financing activities
|
$
|
20.5
|
|
$
|
12.8
|
|
$
|
7.7
|
|
||
Net cash provided by operating activities increased $9.2 million in 2011 compared with 2010 primarily due to the change in working capital and other operating activities partially offset by the decline in net income in 2011 compared with 2010. The change in working capital was primarily the result of a decrease in inventory and accounts receivable in 2011 compared with an increase in 2010 mainly due to lower levels of inventory in 2011 from reduced sales volume. These items were partially offset by a decrease in accounts payable in 2011 compared with an increase in 2010 as a result of the lower levels of inventory in 2011. The change in other operating activities was primarily due to pension contributions made during 2010, partially offset by a change in deferred taxes.
|
|
2011
|
2010
|
Change
|
||||||||
|
Financing activities:
|
|
|
|
||||||||
|
Net reductions of long-term debt and revolving credit agreements
|
$
|
(60.6
|
)
|
$
|
(1.3
|
)
|
$
|
(59.3
|
)
|
||
|
Capital contribution from NACCO
|
4.0
|
|
—
|
|
4.0
|
|
|||||
|
Other
|
(0.2
|
)
|
$
|
—
|
|
(0.2
|
)
|
||||
|
Net cash used for financing activities
|
$
|
(56.8
|
)
|
$
|
(1.3
|
)
|
$
|
(55.5
|
)
|
||
The increase in net cash used for financing activities was primarily the result of $60.0 million of voluntary payments under the HBB term loan agreement in 2011.
Financing Activities
HBB has a $115.0 million senior secured floating-rate revolving credit facility (the “HBB Facility”) that expires July 2012. The obligations under the HBB Facility are secured by a first lien on the accounts receivable and inventory of HBB and a second lien on all of the other assets of HBB. The approximate book value of HBB's assets held as collateral for the first and second lien under the HBB Facility was $200 million as of
December 31, 2011
.
The HBB Facility is governed by a borrowing base derived from advance rates against the inventory and accounts receivable, as defined in the HBB Facility. Adjustments to reserves, including derivative reserves, will change the eligible borrowing base. A portion of the availability is denominated in Canadian dollars to provide funding to HBB's Canadian subsidiary. Borrowings bear interest at a floating rate, which can be either a base rate, LIBOR or bankers' acceptance rate, as defined in the HBB Facility, plus an applicable margin. The applicable margins, effective
December 31, 2011
, for base rate loans and LIBOR loans denominated in U.S. dollars were 0.00% and 1.00%, respectively. The applicable margins, effective
December 31, 2011
, for
56
|
Item 7.
|
MANAGEMENT'S DISCUSSION AND ANALYSIS OF FINANCIAL CONDITION AND RESULTS OF OPERATIONS
|
NACCO INDUSTRIES, INC. AND SUBSIDIARIES
(Tabular Amounts in Millions, Except Per Share and Percentage Data)
base rate and bankers' acceptance loans denominated in Canadian dollars were 0.50% and 1.00%, respectively. The HBB Facility also requires a fee of 0.20% per annum on the unused commitment. The margins and unused commitment fee are subject to quarterly adjustment based on average excess availability.
At
December 31, 2011
, the borrowing base under the HBB Facility was $88.2 million. There were no borrowings outstanding under the HBB Facility at
December 31, 2011
. The floating rate of interest applicable to the HBB Facility at
December 31, 2011
was 1.58% including the floating rate margin.
The HBB Facility includes restrictive covenants that, among other things, set limitations on additional indebtedness (other than indebtedness under the HBB Facility and HBB Term Loan (defined below)), investments, asset sales and the payment of dividends to NACCO. Subject to achieving availability thresholds, annual dividends to NACCO are limited to $5.0 million plus 50% of HBB's net income since the effective date of the amendment to the HBB Facility in 2007. The HBB Facility also requires HBB to meet minimum fixed charge ratio tests in certain circumstances. At
December 31, 2011
, HBB was in compliance with the covenants in the HBB Facility.
During 2007, HBB entered into a term loan agreement (the “HBB Term Loan”) that provided for term loans up to an aggregate principal amount of $125.0 million. Borrowings outstanding under the HBB Term Loan were $54.2 million at
December 31, 2011
, which reflect voluntary payments of $60.0 million made during 2011. The remaining balance is expected to be paid at maturity in May 2013. Prior to maturity, the term loans are subject to mandatory prepayments from the proceeds of the issuance of certain indebtedness, certain asset sales and 50% of excess cash flow, as defined in the HBB Term Loan. The obligations of HBB under the HBB Term Loan are secured by a second lien on accounts receivable and inventory and a first lien on all of the other assets of HBB. The approximate book value of HBB's assets held as collateral for the first and second lien under the HBB Term Loan was $200 million as of
December 31, 2011
.
The term loans bear interest at a floating rate that, at HBB's option, can be either a base rate or LIBOR, as defined in the HBB Term Loan, plus an applicable margin. The applicable margins, effective
December 31, 2011
, for base rate loans and LIBOR loans were 1.00% and 2.00%, respectively. The applicable margins are subject to quarterly adjustment based on a leverage ratio. The weighted average interest rate on the amount outstanding under the HBB Term Loan was 2.78% at
December 31, 2011
.
The HBB Term Loan contains restrictive covenants substantially similar to those in the HBB Facility that, among other things, limit the amount of dividends HBB may declare and pay and the incurrence of indebtedness (other than indebtedness under the HBB Facility). Dividends to NACCO are limited to $5.0 million plus 50% of HBB's net income since the closing date of the HBB Term Loan in 2007. The HBB Term Loan also requires HBB to meet certain financial tests, including, but not limited to, maximum total leverage ratio and minimum fixed charge coverage ratio tests. At
December 31, 2011
, HBB was in compliance with the covenants in the HBB Term Loan.
HBB believes funds available from cash on hand at HBB and the Company, the HBB Facility and operating cash flows will provide sufficient liquidity to meet its operating needs and commitments arising during the next twelve months.
Contractual Obligations, Contingent Liabilities and Commitments
Following is a table which summarizes the contractual obligations of HBB as of
December 31, 2011
:
|
|
Payments Due by Period
|
||||||||||||||||||||||||||
|
Contractual Obligations
|
Total
|
2012
|
2013
|
2014
|
2015
|
2016
|
Thereafter
|
||||||||||||||||||||
|
HBB Term Loan
|
$
|
54.2
|
|
$
|
—
|
|
$
|
54.2
|
|
$
|
—
|
|
$
|
—
|
|
$
|
—
|
|
$
|
—
|
|
||||||
|
Variable interest payments on HBB Term Loan
|
2.1
|
|
1.1
|
|
1.0
|
|
—
|
|
—
|
|
—
|
|
—
|
|
|||||||||||||
|
Purchase and other obligations
|
120.4
|
|
120.4
|
|
—
|
|
—
|
|
—
|
|
—
|
|
—
|
|
|||||||||||||
|
Operating leases
|
31.2
|
|
2.8
|
|
2.9
|
|
3.6
|
|
4.0
|
|
3.6
|
|
14.3
|
|
|||||||||||||
|
Total contractual cash obligations
|
$
|
207.9
|
|
$
|
124.3
|
|
$
|
58.1
|
|
$
|
3.6
|
|
$
|
4.0
|
|
$
|
3.6
|
|
$
|
14.3
|
|
||||||
HBB has a long-term liability of approximately $2.5 million for unrecognized tax benefits, including interest and penalties, as
57
|
Item 7.
|
MANAGEMENT'S DISCUSSION AND ANALYSIS OF FINANCIAL CONDITION AND RESULTS OF OPERATIONS
|
NACCO INDUSTRIES, INC. AND SUBSIDIARIES
(Tabular Amounts in Millions, Except Per Share and Percentage Data)
of
December 31, 2011
. At this time, the Company is unable to make a reasonable estimate of the timing of payments due to, among other factors, the uncertainty of the timing and outcome of its audits.
An event of default, as defined in the HBB Facility, the HBB Term Loan and in HBB’s operating and capital lease agreements, could cause an acceleration of the payment schedule. No such event of default has occurred under these agreements.
HBB’s interest payments are calculated based upon HBB’s anticipated payment schedule and the
December 31, 2011
LIBOR rate and applicable margins, as defined in the HBB Term Loan. A 1/8% increase in the LIBOR rate would increase HBB’s estimated total interest payments on HBB’s Term Loan by $0.1 million.
The purchase and other obligations are primarily for accounts payable, open purchase orders and accrued payroll and incentive compensation.
Pension funding can vary significantly each year due to plan amendments, changes in the market value of plan assets, legislation and the Company’s funding decisions to contribute any excess above the minimum legislative funding requirements. As a result, pension and postretirement funding has not been included in the table above. Pension benefit payments are made from assets of the pension plans. HBB expects to contribute $1.4 million to its U.S. pension plan in 2012. HBB does not expect to contribute to its non-U.S. pension plans in
2012
.
Capital Expenditures
Following is a table which summarizes actual and planned capital expenditures:
|
|
Planned
|
Actual
|
Actual
|
||||||||
|
2012
|
2011
|
2010
|
|||||||||
|
HBB
|
$
|
4.7
|
|
$
|
3.7
|
|
$
|
2.2
|
|
||
Planned expenditures for
2012
are primarily for tooling for new products. These expenditures are expected to be funded from internally generated funds and bank borrowings.
Capital Structure
HBB’s capital structure is presented below:
|
|
December 31
|
|
|||||||||
|
|
2011
|
2010
|
Change
|
||||||||
|
Cash and cash equivalents
|
$
|
9.3
|
|
$
|
45.6
|
|
$
|
(36.3
|
)
|
||
|
Other net tangible assets
|
79.9
|
|
83.4
|
|
(3.5
|
)
|
|||||
|
Net assets
|
89.2
|
|
129.0
|
|
(39.8
|
)
|
|||||
|
Total debt
|
(54.2
|
)
|
(115.1
|
)
|
60.9
|
|
|||||
|
Total equity (deficit)
|
$
|
35.0
|
|
$
|
13.9
|
|
$
|
21.1
|
|
||
|
Debt to total capitalization
|
61
|
%
|
89
|
%
|
(28
|
)%
|
|||||
Total debt decreased $60.9 million primarily due to voluntary payments of $60.0 million made on the HBB Term Loan during 2011.
Total equity increased due to HBB's net income of $18.4 million and a $4.0 million capital contribution from NACCO, partially offset by a $1.3 million increase in accumulated other comprehensive loss during 2011.
OUTLOOK
The middle-market portion of the small kitchen appliance market in which HBB participates weakened over the course of 2011 and is expected to remain weak in 2012. HBB's target consumer, the middle-market mass consumer, continues to struggle with financial concerns and high unemployment rates. As a result, sales volumes in this segment of the U.S. consumer market are expected to remain under pressure. International and commercial product markets are expected to remain strong, and this strength is expected to drive revenue growth in 2012.
58
|
Item 7.
|
MANAGEMENT'S DISCUSSION AND ANALYSIS OF FINANCIAL CONDITION AND RESULTS OF OPERATIONS
|
NACCO INDUSTRIES, INC. AND SUBSIDIARIES
(Tabular Amounts in Millions, Except Per Share and Percentage Data)
In addition, HBB continues to focus on strengthening its market position through product innovation, promotions, increased placements and branding programs, together with appropriate levels of advertising for the company's highly successful and innovative product lines, such as The Scoop
TM
, a single-serve coffee maker. HBB expects the new Melitta-branded beverage appliances, introduced in late 2010, as well as The Scoop
TM
and the Durathon
TM
iron product line, both introduced in late 2011, to continue to gain market position over time as broader distribution is attained. HBB is also continuing to introduce innovative products in several small appliance categories. These products, as well as other new product introductions in the pipeline for 2012, are expected to positively affect revenues and operating profit. However, as a result of the weak U.S. consumer market, HBB currently anticipates only a modest increase in 2012 revenues compared with 2011.
Overall, HBB expects 2012 net income to increase modestly compared with 2011. Nonetheless, product costs are expected to increase modestly in the first half of 2012 but then level out for the second half of the year, while transportation costs are expected to increase in the second half of 2012. HBB continues to monitor commodity costs closely and expects to adjust product prices and placements, as appropriate, if these costs increase more than anticipated. HBB anticipates that 2012 cash flow before financing activities will be modestly lower than in 2011 resulting from increased working capital to fund revenue growth.
Longer term, HBB will continue to work to improve revenues and profitability by remaining focused on developing consumer-driven innovative products, improving efficiencies, reducing costs, increasing pricing when needed, gaining placements and market share, and pursuing additional strategic growth opportunities, specifically in the stronger international markets.
THE KITCHEN COLLECTION, LLC
KC’s business is seasonal and a majority of revenues and operating profit typically occurs in the second half of the year when sales of small electric appliances to consumers increase significantly for the fall holiday-selling season.
FINANCIAL REVIEW
Operating Results
The results of operations for KC were as follows for the year ended
December 31
:
|
|
2011
|
2010
|
2009
|
||||||||
|
Revenues
|
$
|
221.2
|
|
$
|
219.6
|
|
$
|
213.9
|
|
||
|
Operating profit
|
$
|
2.5
|
|
$
|
5.9
|
|
$
|
6.7
|
|
||
|
Interest expense
|
$
|
0.5
|
|
$
|
0.3
|
|
$
|
0.4
|
|
||
|
Other expense
|
$
|
0.1
|
|
$
|
0.1
|
|
$
|
0.1
|
|
||
|
Net income
|
$
|
1.1
|
|
$
|
3.5
|
|
$
|
3.9
|
|
||
|
Effective income tax rate
|
42.1
|
%
|
36.4
|
%
|
37.1
|
%
|
|||||
See the discussion of the consolidated effective income tax rate in the Consolidated Income Taxes section of Management’s Discussion and Analysis of Financial Condition and Results of Operations in this Form 10-K.
59
|
Item 7.
|
MANAGEMENT'S DISCUSSION AND ANALYSIS OF FINANCIAL CONDITION AND RESULTS OF OPERATIONS
|
NACCO INDUSTRIES, INC. AND SUBSIDIARIES
(Tabular Amounts in Millions, Except Per Share and Percentage Data)
2011
Compared with
2010
The following table identifies the components of change in revenues for
2011
compared with
2010
:
|
|
Revenues
|
||
|
2010
|
$
|
219.6
|
|
|
Increase (decrease) in 2011 from:
|
|
||
|
New store sales
|
18.3
|
|
|
|
KC comparable store sales
|
1.0
|
|
|
|
Closed stores
|
(16.7
|
)
|
|
|
LGC comparable store sales
|
(1.0
|
)
|
|
|
2011
|
$
|
221.2
|
|
Revenues increased to $221.2 million in 2011 compared with $219.6 million in 2010, primarily as a result of opening new KC stores during the past twelve months and an increase in comparable store sales at KC. The increase in comparable store sales was mainly due to a higher average sales transaction value partially offset by a decline in store transactions and fewer customer visits. The increase in revenue was partially offset by the effect of closing unprofitable LGC and KC stores since December 31, 2010 and a decrease in comparable store sales at LGC. The decrease in comparable store sales at LGC was mainly attributable to fewer customer visits and a decline in store transactions, partially offset by a higher average sales transaction value.
At
December 31, 2011
, KC operated 276 stores compared with 268 stores at
December 31, 2010
. LGC operated 61 stores at
December 31, 2011
compared with 72 stores at
December 31, 2010
. The Kitchen Collection
®
and Le Gourmet Chef
®
store counts at December 31, 2010 included 34 stores and 6 stores, respectively, that were only open for the holiday-selling season. The company did not utilize the seasonal store format in 2011.
The following table identifies the components of change in operating profit for
2011
compared with
2010
:
|
|
Operating Profit
|
||
|
2010
|
$
|
5.9
|
|
|
Increase (decrease) in 2011 from:
|
|
||
|
KC comparable stores
|
(1.7
|
)
|
|
|
Selling, general and administrative expenses
|
(1.4
|
)
|
|
|
LGC comparable stores
|
(0.6
|
)
|
|
|
Closed stores
|
0.3
|
|
|
|
2011
|
$
|
2.5
|
|
KC recorded lower operating profit of $2.5 million in 2011 compared with $5.9 million in 2010. The decrease was primarily due to lower comparable store results, primarily at KC, as a result of a shift in sales to lower margin products and higher selling, general and administrative expenses primarily from $0.7 million of costs incurred in the first quarter of 2011 for the relocation of KC's two distribution centers into one larger facility. The increase in the operating loss was partially offset by the favorable effect of closing unprofitable LGC stores during 2011.
KC reported net income of $1.1 million in 2011 compared with $3.5 million in 2010 primarily due to the factors affecting the change in operating profit.
60
|
Item 7.
|
MANAGEMENT'S DISCUSSION AND ANALYSIS OF FINANCIAL CONDITION AND RESULTS OF OPERATIONS
|
NACCO INDUSTRIES, INC. AND SUBSIDIARIES
(Tabular Amounts in Millions, Except Per Share and Percentage Data)
2010
Compared with
2009
The following table identifies the components of change in revenues for
2010
compared with
2009
:
|
|
Revenues
|
||
|
2009
|
$
|
213.9
|
|
|
Increase (decrease) in 2010 from:
|
|
||
|
New store sales
|
11.9
|
|
|
|
KC comparable store sales
|
2.6
|
|
|
|
LGC comparable store sales
|
2.6
|
|
|
|
Other
|
0.4
|
|
|
|
Closed stores
|
(11.8
|
)
|
|
|
2010
|
$
|
219.6
|
|
Revenues increased 2.7% in 2010 to $219.6 million compared with $213.9 million in 2009, primarily as a result of opening new stores at KC during the past twelve months and an increase in comparable store sales at both KC and LGC. The increase in comparable store sales was mainly due to an increase in the average sales transaction value primarily as a result of improved product assortments and more effective merchandising, partially offset by fewer customer visits. The increase in revenues was partially offset by the effect of closing unprofitable stores, primarily at LGC.
The following table identifies the components of change in operating profit for
2010
compared with
2009
:
|
|
Operating Profit
|
||
|
2009
|
$
|
6.7
|
|
|
Increase (decrease) in 2010 from:
|
|
||
|
Selling, general and administrative expenses
|
(2.6
|
)
|
|
|
KC comparable stores
|
(0.8
|
)
|
|
|
LGC comparable stores
|
1.8
|
|
|
|
New stores
|
0.5
|
|
|
|
Closed stores
|
0.3
|
|
|
|
2010
|
$
|
5.9
|
|
KC recorded lower operating profit of $5.9 million in 2010 compared with $6.7 million in 2009 primarily due to an increase in selling, general and administrative expenses from higher employee-related costs and lower KC comparable store results. The decrease was partially offset by improved LGC results from an increase in sales at comparable stores and lower rent, as well as sales at new KC stores and the closing of unprofitable stores at LGC.
KC reported net income of $3.5 million in 2010 compared with $3.9 million in 2009 primarily due to the factors affecting the change in operating profit.
61
|
Item 7.
|
MANAGEMENT'S DISCUSSION AND ANALYSIS OF FINANCIAL CONDITION AND RESULTS OF OPERATIONS
|
NACCO INDUSTRIES, INC. AND SUBSIDIARIES
(Tabular Amounts in Millions, Except Per Share and Percentage Data)
LIQUIDITY AND CAPITAL RESOURCES
Cash Flows
The following tables detail the change in cash flow for the years ended
December 31
:
|
|
2011
|
2010
|
Change
|
||||||||
|
Operating activities:
|
|
|
|
||||||||
|
Net income
|
$
|
1.1
|
|
$
|
3.5
|
|
$
|
(2.4
|
)
|
||
|
Depreciation and amortization
|
3.1
|
|
3.5
|
|
(0.4
|
)
|
|||||
|
Other
|
—
|
|
0.7
|
|
(0.7
|
)
|
|||||
|
Working capital changes
|
0.7
|
|
(1.4
|
)
|
2.1
|
|
|||||
|
Net cash provided by operating activities
|
4.9
|
|
6.3
|
|
(1.4
|
)
|
|||||
|
Investing activities:
|
|
|
|
||||||||
|
Expenditures for property, plant and equipment
|
(2.3
|
)
|
(2.7
|
)
|
0.4
|
|
|||||
|
Net cash used for investing activities
|
(2.3
|
)
|
(2.7
|
)
|
0.4
|
|
|||||
|
Cash flow before financing activities
|
$
|
2.6
|
|
$
|
3.6
|
|
$
|
(1.0
|
)
|
||
Net cash provided by operating activities decreased $1.4 million during 2011 compared with 2010 primarily due to the decrease in net income and other operating activities, mainly due to a change in deferred taxes. The decrease was partially offset by the change in working capital primarily attributable to an increase in accounts payable from higher levels of inventory and the timing of purchases, somewhat reduced by a change in intercompany taxes.
|
|
2011
|
2010
|
Change
|
||||||||
|
Financing activities:
|
|
|
|
||||||||
|
Cash dividends paid to NACCO
|
$
|
(2.5
|
)
|
$
|
—
|
|
$
|
(2.5
|
)
|
||
|
Financing fees paid
|
—
|
|
(0.4
|
)
|
0.4
|
|
|||||
|
Net cash used for financing activities
|
$
|
(2.5
|
)
|
$
|
(0.4
|
)
|
$
|
(2.1
|
)
|
||
Net cash used for financing activities increased $2.1 million in 2011 compared with 2010 primarily as a result of dividends paid to NACCO in 2011.
Financing Activities
KC has a $30.0 million secured revolving line of credit that expires in April 2013 (the “KC Facility”). The KC Facility can be extended at KC's option for an additional year, subject to the lender's consent. The obligations under the KC Facility are secured by substantially all assets of KC. The approximate book value of KC's assets held as collateral under the KC Facility was $90 million as of
December 31, 2011
.
The availability is derived from a borrowing base formula using KC's eligible inventory and eligible credit card accounts receivable, as defined in the KC Facility. At
December 31, 2011
, the borrowing base was $27.0 million. There were no borrowings outstanding under the KC Facility at
December 31, 2011
.
Borrowings bear interest at a floating rate, which can be either a base rate or LIBOR, as defined in the KC Facility, plus an applicable margin. The applicable margins, effective
December 31, 2011
, for base rate and LIBOR loans were 2.00% and 3.00%, respectively. The floating rate of interest applicable to the KC Facility was 5.25% at
December 31, 2011
, including the floating rate margin. The KC Facility also requires a fee of 0.50% per annum on the unused commitment.
The KC Facility allows for the payment of dividends to NACCO, subject to certain restrictions based on availability and meeting a fixed charge coverage ratio as described in the KC Facility.
62
|
Item 7.
|
MANAGEMENT'S DISCUSSION AND ANALYSIS OF FINANCIAL CONDITION AND RESULTS OF OPERATIONS
|
NACCO INDUSTRIES, INC. AND SUBSIDIARIES
(Tabular Amounts in Millions, Except Per Share and Percentage Data)
KC believes funds available from cash on hand at KC and the Company, the KC Facility and operating cash flows will provide sufficient liquidity to meet its operating needs and commitments arising during the next twelve months and until the KC Facility expires in April 2013.
Contractual Obligations, Contingent Liabilities and Commitments
Following is a table which summarizes the contractual obligations of KC as of
December 31, 2011
:
|
|
Payments Due by Period
|
||||||||||||||||||||||||||
|
Contractual Obligations
|
Total
|
2012
|
2013
|
2014
|
2015
|
2016
|
Thereafter
|
||||||||||||||||||||
|
Purchase and other obligations
|
$
|
46.3
|
|
$
|
46.3
|
|
$
|
—
|
|
$
|
—
|
|
$
|
—
|
|
$
|
—
|
|
$
|
—
|
|
||||||
|
Operating leases
|
83.3
|
|
22.8
|
|
16.3
|
|
12.1
|
|
8.9
|
|
5.8
|
|
17.4
|
|
|||||||||||||
|
Total contractual cash obligations
|
$
|
129.6
|
|
$
|
69.1
|
|
$
|
16.3
|
|
$
|
12.1
|
|
$
|
8.9
|
|
$
|
5.8
|
|
$
|
17.4
|
|
||||||
An event of default, as defined in KC’s operating lease agreements, could cause an acceleration of the payment schedule. No such event of default has occurred under these agreements.
The purchase and other obligations are primarily for accounts payable, open purchase orders, accrued payroll and incentive compensation.
Capital Expenditures
Following is a table which summarizes actual and planned capital expenditures:
|
|
Planned
|
Actual
|
Actual
|
||||||||
|
2012
|
2011
|
2010
|
|||||||||
|
KC
|
$
|
3.7
|
|
$
|
2.3
|
|
$
|
2.7
|
|
||
Planned expenditures in
2012
for property, plant and equipment are primarily for store fixtures and equipment at new or existing stores and improvements to KC’s information technology infrastructure. These expenditures are expected to be funded from internally generated funds and bank borrowings.
Capital Structure
KC’s capital structure is presented below.
|
|
December 31
|
|
|||||||||
|
|
2011
|
2010
|
Change
|
||||||||
|
Cash and cash equivalents
|
$
|
11.8
|
|
$
|
11.7
|
|
$
|
0.1
|
|
||
|
Other net tangible assets
|
34.9
|
|
36.4
|
|
(1.5
|
)
|
|||||
|
Net assets
|
46.7
|
|
48.1
|
|
(1.4
|
)
|
|||||
|
Total debt
|
—
|
|
—
|
|
—
|
|
|||||
|
Total equity
|
$
|
46.7
|
|
$
|
48.1
|
|
$
|
(1.4
|
)
|
||
|
Debt to total capitalization
|
(a)
|
|
(a)
|
|
(a)
|
|
|||||
(a)
Debt to total capitalization is not meaningful.
OUTLOOK
The uncertain economy, high unemployment rates and fuel prices, along with other consumer financial concerns, are expected to continue to affect consumer sentiment and limit spending levels for KC's target customer, prolonging a challenging retail environment in 2012. However, KC expects to have an increased number of Kitchen Collection
®
stores in 2012. As a result, KC expects revenue in 2012 to increase compared with 2011.
63
|
Item 7.
|
MANAGEMENT'S DISCUSSION AND ANALYSIS OF FINANCIAL CONDITION AND RESULTS OF OPERATIONS
|
NACCO INDUSTRIES, INC. AND SUBSIDIARIES
(Tabular Amounts in Millions, Except Per Share and Percentage Data)
Overall, KC expects a modest increase in full year 2012 net income and cash flow before financing activities compared with 2011 primarily as a result of the increase in the number of Kitchen Collection
®
stores opened throughout 2011 and new stores expected to be opened in 2012. KC expects the momentum achieved by the new stores in the fourth quarter of 2011 to continue in 2012 and expects improvements in operating results at both store formats as the new stores opened in 2011 gain traction and additional new stores are opened in 2012. In addition, KC anticipates improvements in operating results as it continues its ongoing program of closing underperforming stores. Enhanced sales and margins are also expected as a result of further improvements in its store formats and layouts at both the Kitchen Collection
®
and Le Gourmet Chef
®
stores and as a result of further refinements of its promotional offers and merchandise mix in both store formats. The renegotiation of store leases and the combination of its two distribution centers into one larger, more efficient facility, as well as the absence of a number of costs incurred in 2011 not expected to recur in 2012, are also expected to contribute to improved results. Although KC anticipates increased product and transportation costs in 2012, it expects to offset these increased costs through price increases and other actions as needed.
Longer term, KC plans to focus on enhancing sales volume and profitability by refining its store formats, strengthening its merchandise mix, store displays and appearance, optimizing store selling space as well as evaluating and closing underperforming and loss-generating stores as lease contracts permit. KC also expects to drive profitability by achieving store growth in the Kitchen Collection
®
and Le Gourmet Chef
®
outlet and traditional mall store formats over the longer term while maintaining disciplined cost control. In the near term, KC expects to focus its growth in the number of stores on the Kitchen Collection
®
format. When adequate profit prospects are demonstrated for the Le Gourmet Chef
®
format, KC's expansion focus will shift to increasing the number of these stores as well.
THE NORTH AMERICAN COAL CORPORATION
NACoal mines and markets coal primarily as fuel for power generation and provides selected value-added mining services for other natural resources companies. Coal is surface mined from NACoal's developed mines in North Dakota, Texas and Mississippi. Total coal reserves approximate 2.3 billion tons with approximately 1.2 billion tons committed to customers pursuant to long-term contracts. NACoal has one consolidated mining operation: Mississippi Lignite Mining Company (“MLMC”). NACoal has nine unconsolidated operations: The Coteau Properties Company (“Coteau”), The Falkirk Mining Company (“Falkirk”), The Sabine Mining Company (“Sabine”), Demery Resources Company, LLC (“Demery”), Caddo Creek Resources Company, LLC (“Caddo Creek”), Camino Real Fuels, LLC (“Camino Real”), Liberty Fuels Company, LLC (“Liberty”), NoDak Energy Services, LLC (“NoDak”) and North American Coal Corporation India Private Limited (“NACC India”). Demery, Caddo Creek, Camino Real and Liberty are in the development stage and do not currently mine or deliver coal. NoDak was formed to operate and maintain a coal processing facility. NACC India was formed to provide technical advisory services to the third-party owners of a mine in India. NACoal also provides dragline mining services for independently owned limerock quarries in Florida. At the end of 2010, NACoal's contract at the San Miguel Lignite Mine (“San Miguel”) expired and its mining operations were transitioned to another company. During 2009, NACoal completed the sale of certain assets of Red River. The results of operations of Red River are reflected as discontinued operations.
The contracts with the unconsolidated operations' customers provide for reimbursement at a price based on actual costs plus an agreed pre-tax profit per ton of coal sold or actual costs plus a management fee. The unconsolidated operations each meet the definition of a variable interest entity and are accounted for using the equity method.
64
|
Item 7.
|
MANAGEMENT'S DISCUSSION AND ANALYSIS OF FINANCIAL CONDITION AND RESULTS OF OPERATIONS
|
NACCO INDUSTRIES, INC. AND SUBSIDIARIES
(Tabular Amounts in Millions, Except Per Share and Percentage Data)
FINANCIAL REVIEW
Tons delivered by NACoal’s operating mines were as follows for the year ended
December 31
:
|
|
2011
|
2010
|
2009
|
|||||
|
Coteau
|
13.5
|
|
14.6
|
|
15.1
|
|
||
|
Falkirk
|
7.5
|
|
7.6
|
|
8.1
|
|
||
|
Sabine
|
4.2
|
|
4.4
|
|
3.3
|
|
||
|
Unconsolidated mines
|
25.2
|
|
26.6
|
|
26.5
|
|
||
|
San Miguel
|
—
|
|
3.3
|
|
3.2
|
|
||
|
MLMC
|
2.7
|
|
3.6
|
|
3.7
|
|
||
|
Consolidated mines
|
2.7
|
|
6.9
|
|
6.9
|
|
||
|
Total lignite tons sold
|
27.9
|
|
33.5
|
|
33.4
|
|
||
The limerock dragline mining operations delivered 13.7 million, 17.9 million and 3.6 million cubic yards of limerock for the years ended
December 31, 2011
,
2010
and
2009
, respectively. The decrease in limerock yards delivered in 2011 compared with 2010 was primarily from lower customer requirements. The increase in limerock yards delivered in 2010 was primarily from customers replenishing inventory levels as a result of obtaining new mining permits in 2010 at all of the limerock dragline mining operations. These new permits were required due to an unfavorable legal ruling setting aside NACoal's customers' previous mining permits. Red River sold 0.7 million tons of coal in 2009.
Total coal reserves were as follows at
December 31
:
|
|
2011
|
2010
|
2009
|
|||||
|
|
(in billions of tons)
|
|||||||
|
Unconsolidated mines
|
1.0
|
|
1.0
|
|
1.1
|
|
||
|
Consolidated mines
|
1.3
|
|
1.1
|
|
1.1
|
|
||
|
Total coal reserves
|
2.3
|
|
2.1
|
|
2.2
|
|
||
Operating Results
The results of operations for NACoal were as follows for the year ended
December 31
:
|
|
2011
|
2010
|
2009
|
||||||||
|
Revenues
|
$
|
81.8
|
|
$
|
156.8
|
|
$
|
129.5
|
|
||
|
Operating profit
|
$
|
35.2
|
|
$
|
53.3
|
|
$
|
42.6
|
|
||
|
Interest expense
|
$
|
3.0
|
|
$
|
3.3
|
|
$
|
4.1
|
|
||
|
Other income
|
$
|
(1.7
|
)
|
$
|
(0.4
|
)
|
$
|
(0.9
|
)
|
||
|
Income from continuing operations
|
$
|
29.4
|
|
$
|
39.6
|
|
$
|
30.6
|
|
||
|
Discontinued operations
|
$
|
—
|
|
$
|
—
|
|
$
|
22.6
|
|
||
|
Net income
|
$
|
29.4
|
|
$
|
39.6
|
|
$
|
53.2
|
|
||
|
Effective income tax rate
|
13.3
|
%
|
21.4
|
%
|
22.3
|
%
|
|||||
See the discussion of the consolidated effective income tax rate in the Consolidated Income Taxes section of Management’s Discussion and Analysis of Financial Condition and Results of Operations in this Form 10-K.
65
|
Item 7.
|
MANAGEMENT'S DISCUSSION AND ANALYSIS OF FINANCIAL CONDITION AND RESULTS OF OPERATIONS
|
NACCO INDUSTRIES, INC. AND SUBSIDIARIES
(Tabular Amounts in Millions, Except Per Share and Percentage Data)
2011
Compared with
2010
The following table identifies the components of change in revenues for
2011
compared with
2010
:
|
|
Revenues
|
||
|
2010
|
$
|
156.8
|
|
|
Decrease in 2011 from:
|
|
||
|
San Miguel
|
(45.8
|
)
|
|
|
Consolidated mining operations
|
(16.9
|
)
|
|
|
Pre-development revenue
|
(7.6
|
)
|
|
|
Royalty and other income
|
(4.7
|
)
|
|
|
2011
|
$
|
81.8
|
|
Revenues decreased 47.8% in 2011 to $81.8 million from $156.8 million in 2010 mainly due to the expiration of NACoal's contract at San Miguel at the end of 2010. In addition, the decrease was the result of lower revenues at the consolidated mining operations, the absence of revenue recognized in 2010 related to the reimbursement from Mississippi Power Company for previously recognized costs for pre-development activities and lower royalty and other income. The decrease at the consolidated mining operations was primarily due to a decrease in tons delivered at MLMC as a result of unplanned customer power plant outages in 2011 and reduced customer requirements at the limerock dragline mining operations.
The following table identifies the components of change in operating profit for
2011
compared with
2010
.
|
|
Operating Profit
|
||
|
2010
|
$
|
53.3
|
|
|
Increase (decrease) in 2011 from:
|
|
||
|
Consolidated mining operations
|
(11.7
|
)
|
|
|
Pre-development revenue
|
(7.4
|
)
|
|
|
Royalty and other income
|
(1.1
|
)
|
|
|
Earnings of unconsolidated mines
|
2.1
|
|
|
|
2011
|
$
|
35.2
|
|
Operating profit decreased to $35.2 million in 2011 from $53.3 million in 2010, primarily as a result of a decrease in consolidated mining operating profit mainly from lower sales at MLMC, the absence of revenue recognized in 2010 related to the reimbursement from Mississippi Power Company and lower royalty and other income. The decrease in operating profit was partially offset by higher earnings at the unconsolidated mines due to income associated with the Liberty mine.
Net income decreased to $29.4 million in 2011 from $39.6 million in 2010 primarily due to the factors affecting operating profit.
66
|
Item 7.
|
MANAGEMENT'S DISCUSSION AND ANALYSIS OF FINANCIAL CONDITION AND RESULTS OF OPERATIONS
|
NACCO INDUSTRIES, INC. AND SUBSIDIARIES
(Tabular Amounts in Millions, Except Per Share and Percentage Data)
2010
Compared with
2009
The following table identifies the components of change in revenues for
2010
compared with
2009
:
|
|
Revenues
|
||
|
2009
|
$
|
129.5
|
|
|
Increase in 2010 from:
|
|
||
|
Pre-development revenue
|
7.6
|
|
|
|
Limerock dragline mining operations
|
7.4
|
|
|
|
Consolidated coal mining operations
|
6.8
|
|
|
|
Royalty and other income
|
5.5
|
|
|
|
2010
|
$
|
156.8
|
|
Revenues for 2010 increased 21.1% to $156.8 million from $129.5 million in 2009. Revenues increased mainly due to revenue recognized in the second quarter of 2010 related to the reimbursement from Mississippi Power Company for previously recognized costs for pre-development activities. In addition, revenues were favorably affected by increased deliveries at the limerock dragline mining operations, an increase in contractually reimbursable costs at San Miguel and an increase in royalty and other income. The increase at the limerock dragline mining operations was primarily the result of new mining permits issued to NACoal's customers at all of the limerock dragline mining operations where an unfavorable legal ruling set aside NACoal's customers' previous mining permits.
The following table identifies the components of change in operating profit for
2010
compared with
2009
.
|
|
Operating Profit
|
||
|
2009
|
$
|
42.6
|
|
|
Increase (decrease) in 2010 from:
|
|
||
|
Pre-development revenue
|
7.4
|
|
|
|
Consolidated coal and limerock mining operations
|
5.6
|
|
|
|
Earnings of unconsolidated mines
|
4.8
|
|
|
|
Royalty and other income
|
3.7
|
|
|
|
Lease bonus payments received in 2009
|
(7.1
|
)
|
|
|
Other selling, general and administrative expenses
|
(2.1
|
)
|
|
|
Gain on the sale of assets
|
(1.6
|
)
|
|
|
2010
|
$
|
53.3
|
|
Operating profit increased to $53.3 million in 2010 from $42.6 million in 2009, primarily as a result of revenue recognized in the second quarter of 2010 related to the reimbursement from Mississippi Power Company, an increase in consolidated coal and limerock mining operating profit mainly from improved results at the limerock mining operations and the absence of higher costs of sales in the prior year from reducing inventory levels at MLMC, an increase in the earnings of unconsolidated mines and higher royalty and other income. The increase in earnings from unconsolidated mines was mainly due to contractual price escalators and income associated with the new Liberty mine in Mississippi. The increase was partially offset by the absence of the receipt of bonus payments for the lease of certain oil and gas mineral rights controlled by NACoal to a third party in 2009 and higher selling, general and administrative expenses mainly due to increased NACCO management fees and higher costs for outside services in 2010 compared with 2009. See the discussion of “Management Fees” in the NACCO and Other section of Management's Discussion and Analysis of Financial Condition and Results of Operations in this Form 10-K. In addition, operating profit was unfavorably affected by the absence of a gain on the sale of assets recognized in 2009.
Net income decreased to $39.6 million in 2010 compared with $53.2 million in 2009 primarily from the absence of the gain on the sale of certain assets of Red River of $35.8 million ($22.3 million after taxes of $13.5 million) in 2009 partially offset by the factors affecting the improvement in operating profit.
67
|
Item 7.
|
MANAGEMENT'S DISCUSSION AND ANALYSIS OF FINANCIAL CONDITION AND RESULTS OF OPERATIONS
|
NACCO INDUSTRIES, INC. AND SUBSIDIARIES
(Tabular Amounts in Millions, Except Per Share and Percentage Data)
LIQUIDITY AND CAPITAL RESOURCES
Cash Flows
The following tables detail the change in cash flow for the years ended
December 31
:
|
|
2011
|
2010
|
Change
|
||||||||
|
Operating activities:
|
|
|
|
||||||||
|
Net income
|
$
|
29.4
|
|
$
|
39.6
|
|
$
|
(10.2
|
)
|
||
|
Depreciation, depletion and amortization
|
7.9
|
|
9.9
|
|
(2.0
|
)
|
|||||
|
Other
|
(0.9
|
)
|
(1.9
|
)
|
1.0
|
|
|||||
|
Working capital changes
|
(4.7
|
)
|
(21.7
|
)
|
17.0
|
|
|||||
|
Net cash provided by operating activities
|
31.7
|
|
25.9
|
|
5.8
|
|
|||||
|
Investing activities:
|
|
|
|
||||||||
|
Expenditures for property, plant and equipment
|
(14.1
|
)
|
(9.8
|
)
|
(4.3
|
)
|
|||||
|
Proceeds from the sale of assets
|
3.4
|
|
18.3
|
|
(14.9
|
)
|
|||||
|
Investments in other unconsolidated affiliates
|
—
|
|
(1.6
|
)
|
1.6
|
|
|||||
|
Net cash provided by (used for) investing activities
|
(10.7
|
)
|
6.9
|
|
(17.6
|
)
|
|||||
|
Cash flow before financing activities
|
$
|
21.0
|
|
$
|
32.8
|
|
$
|
(11.8
|
)
|
||
The increase in net cash provided by operating activities was primarily the result of the change in working capital partially offset by the decrease in net income in 2011 compared with 2010. The change in working capital was mainly the result of a decrease in accounts receivable in 2011 compared with an increase in 2010 primarily due to a reduction in amounts due from the unconsolidated mines and the expiration of NACoal's contract at San Miguel at the end of 2010, a smaller increase in inventory in 2011 compared with 2010 and a change in intercompany taxes. This change was partially offset by a decrease in accounts payable, primarily as a result of the expiration of the San Miguel contract at the end of 2010.
The change in net cash provided by (used for) investing activities was primarily due to lower proceeds from the sale of assets and an increase in expenditures for mine development and equipment in 2011 compared with 2010.
|
|
2011
|
2010
|
Change
|
||||||||
|
Financing activities:
|
|
|
|
||||||||
|
Net additions (reductions) of long-term debt and revolving credit agreements
|
$
|
49.0
|
|
$
|
(4.8
|
)
|
$
|
53.8
|
|
||
|
Cash dividends paid to NACCO
|
(72.9
|
)
|
(24.6
|
)
|
(48.3
|
)
|
|||||
|
Financing fees paid
|
(0.8
|
)
|
—
|
|
(0.8
|
)
|
|||||
|
Net cash used for financing activities
|
$
|
(24.7
|
)
|
$
|
(29.4
|
)
|
$
|
4.7
|
|
||
Net cash used for financing activities decreased during 2011 compared with 2010 primarily due to higher borrowings of revolving credit agreements in 2011 compared with 2010 partially offset by an increase in the amount of dividends paid to NACCO.
Financing Activities
NACoal has an unsecured revolving line of credit of up to $150.0 million (the “NACoal Facility”) that expires in December 2016. Borrowings outstanding under the NACoal Facility were $67.0 million at
December 31, 2011
. Therefore, at
December 31, 2011
, the excess availability under the NACoal Facility was $81.8 million, which reflects a reduction for outstanding letters of credit of $1.2 million.
The NACoal Facility has performance-based pricing, which sets interest rates based upon achieving various levels of debt to
68
|
Item 7.
|
MANAGEMENT'S DISCUSSION AND ANALYSIS OF FINANCIAL CONDITION AND RESULTS OF OPERATIONS
|
NACCO INDUSTRIES, INC. AND SUBSIDIARIES
(Tabular Amounts in Millions, Except Per Share and Percentage Data)
EBITDA ratios, as defined in the NACoal Facility. Borrowings bear interest at a floating rate plus a margin based on the level of debt to EBITDA ratio achieved, as defined in the NACoal Facility. The applicable margins, effective December 31, 2011, for base rate and LIBOR loans were 0.75% and 1.75%, respectively. The NACoal Facility also has a commitment fee which is also based upon achieving various levels of debt to EBITDA ratios. The commitment fee was 0.35% on the unused commitment at December 31, 2011. The floating rate of interest applicable to the NACoal Facility at
December 31, 2011
was 2.10% including the floating rate margin.
The NACoal Facility also contains restrictive covenants that require, among other things, NACoal to maintain certain debt to EBITDA and interest coverage ratios, and provides the ability to make loans, dividends and advances to NACCO, with some restrictions based on the debt to EBITDA ratio in conjunction with maintaining unused availability thresholds of borrowing capacity under the NACoal Facility. At
December 31, 2011
, NACoal was in compliance with these covenants.
During 2004 and 2005, NACoal issued unsecured notes totaling $45.0 million in a private placement (the “NACoal Notes”), which require annual principal payments of approximately $6.4 million that began in October 2008 and will mature on October 4, 2014. These unsecured notes bear interest at a weighted-average fixed rate of 6.08%, payable semi-annually on April 4 and October 4. The NACoal Notes are redeemable at any time at the option of NACoal, in whole or in part, at an amount equal to par plus accrued and unpaid interest plus a “make-whole premium,” if applicable. NACoal had $19.3 million of the private placement notes outstanding at
December 31, 2011
. The NACoal Notes contain certain covenants and restrictions that require, among other things, NACoal to maintain certain net worth, leverage and interest coverage ratios, and limit dividends to NACCO based upon NACoal's leverage ratio. At
December 31, 2011
, NACoal was in compliance with the covenants in the NACoal Notes.
NACoal has a demand note payable to Coteau which bears interest based on the applicable quarterly federal short-term interest rate as announced from time to time by the Internal Revenue Service. At
December 31, 2011
, the balance of the note was $4.8 million and the interest rate was 0.16%.
NACoal believes funds available from the NACoal Facility and operating cash flows will provide sufficient liquidity to finance its operating needs and commitments arising during the next twelve months and until the expiration of the NACoal Facility in December 2016.
Contractual Obligations, Contingent Liabilities and Commitments
Following is a table which summarizes the contractual obligations of NACoal as of
December 31, 2011
:
|
|
Payments Due by Period
|
||||||||||||||||||||||||||
|
Contractual Obligations
|
Total
|
2012
|
2013
|
2014
|
2015
|
2016
|
Thereafter
|
||||||||||||||||||||
|
NACoal Facility
|
$
|
67.0
|
|
$
|
67.0
|
|
$
|
—
|
|
$
|
—
|
|
$
|
—
|
|
$
|
—
|
|
$
|
—
|
|
||||||
|
Variable interest payments on NACoal Facility
|
1.2
|
|
1.2
|
|
—
|
|
—
|
|
—
|
|
—
|
|
—
|
|
|||||||||||||
|
NACoal Notes
|
19.3
|
|
6.4
|
|
6.5
|
|
6.4
|
|
—
|
|
—
|
|
—
|
|
|||||||||||||
|
Interest payments on NACoal Notes
|
2.2
|
|
1.1
|
|
0.7
|
|
0.4
|
|
—
|
|
—
|
|
—
|
|
|||||||||||||
|
Other debt
|
4.8
|
|
—
|
|
—
|
|
—
|
|
—
|
|
—
|
|
4.8
|
|
|||||||||||||
|
Capital lease obligations, including principal and interest
|
3.2
|
|
0.4
|
|
0.4
|
|
0.4
|
|
0.4
|
|
0.4
|
|
1.2
|
|
|||||||||||||
|
Operating leases
|
40.2
|
|
7.5
|
|
7.4
|
|
6.9
|
|
6.0
|
|
5.7
|
|
6.7
|
|
|||||||||||||
|
Purchase and other obligations
|
18.6
|
|
18.6
|
|
—
|
|
—
|
|
—
|
|
—
|
|
—
|
|
|||||||||||||
|
Total contractual cash obligations
|
$
|
156.5
|
|
$
|
102.2
|
|
$
|
15.0
|
|
$
|
14.1
|
|
$
|
6.4
|
|
$
|
6.1
|
|
$
|
12.7
|
|
||||||
NACoal has a long-term liability of approximately $0.7 million for unrecognized tax benefits, including interest and penalties, as of
December 31, 2011
. At this time, the Company is unable to make a reasonable estimate of the timing of payments due to, among other factors, the uncertainty of the timing and outcome of its audits.
An event of default, as defined in the NACoal Facility, NACoal Notes and NACoal’s lease agreements, could cause an acceleration of the payment schedule. No such event of default has occurred or is anticipated to occur.
69
|
Item 7.
|
MANAGEMENT'S DISCUSSION AND ANALYSIS OF FINANCIAL CONDITION AND RESULTS OF OPERATIONS
|
NACCO INDUSTRIES, INC. AND SUBSIDIARIES
(Tabular Amounts in Millions, Except Per Share and Percentage Data)
NACoal’s variable interest payments are calculated based upon NACoal’s anticipated payment schedule and the
December 31, 2011
base rate and applicable margins, as defined in the NACoal Facility. A 1/8% increase in the base rate would increase NACoal’s estimated total interest payments on the NACoal Facility by $0.1 million.
The purchase and other obligations are primarily for accounts payable, open purchase orders and accrued payroll and incentive compensation.
Pension and postretirement funding can vary significantly each year due to plan amendments, changes in the market value of plan assets, legislation and the Company’s funding decisions to contribute any excess above the minimum legislative funding requirements. As a result, pension and postretirement funding has not been included in the table above. NACoal expects to contribute $1.0 million to its pension plan in
2012
. NACoal maintains one supplemental retirement plan that pays monthly benefits to participants directly out of corporate funds and expects to pay benefits of approximately $0.7 million in
2012
and $0.4 million per year from
2013
through 2021. Benefit payments beyond that time cannot currently be estimated. All other pension benefit payments are made from assets of the pension plans. NACoal also expects to make payments related to its other postretirement plans of approximately $0.1 million in
2012
and $0.2 million per year from
2013
through 2021. Benefit payments beyond that time cannot currently be estimated.
Capital Expenditures
Following is a table which summarizes actual and planned capital expenditures:
|
Planned
|
Actual
|
Actual
|
|||||||||
|
|
2012
|
2011
|
2010
|
||||||||
|
NACoal
|
$
|
12.9
|
|
$
|
14.1
|
|
$
|
9.8
|
|
||
Planned expenditures for
2012
include mine equipment and development at existing mines. These expenditures are expected to be funded from internally generated funds and bank borrowings.
Capital Structure
NACoal’s capital structure is presented below:
|
|
December 31
|
|
|||||||||
|
|
2011
|
2010
|
Change
|
||||||||
|
Cash and cash equivalents
|
$
|
1.3
|
|
$
|
5.0
|
|
$
|
(3.7
|
)
|
||
|
Other net tangible assets
|
130.9
|
|
118.4
|
|
12.5
|
|
|||||
|
Coal supply agreement, net
|
57.9
|
|
60.0
|
|
(2.1
|
)
|
|||||
|
Net assets
|
190.1
|
|
183.4
|
|
6.7
|
|
|||||
|
Total debt
|
(94.0
|
)
|
(41.9
|
)
|
(52.1
|
)
|
|||||
|
Total equity
|
$
|
96.1
|
|
$
|
141.5
|
|
$
|
(45.4
|
)
|
||
|
Debt to total capitalization
|
49
|
%
|
23
|
%
|
26
|
%
|
|||||
The increase in other net tangible assets is due primarily to expenditures for property, plant and equipment, a decrease in accounts payable and other current liabilities primarily as a result of the expiration of the San Miguel contract at the end of 2010 and a change in deferred taxes. These items were partially offset by an increase in other long-term liabilities, primarily from higher pension obligations.
Total debt increased $52.1 million primarily due to additional borrowings made during 2011.
Total equity decreased primarily due to dividends paid to NACCO of $72.9 million and a $1.9 million decrease in accumulated other comprehensive loss, partially offset by net income of $29.4 million in 2011.
70
|
Item 7.
|
MANAGEMENT'S DISCUSSION AND ANALYSIS OF FINANCIAL CONDITION AND RESULTS OF OPERATIONS
|
NACCO INDUSTRIES, INC. AND SUBSIDIARIES
(Tabular Amounts in Millions, Except Per Share and Percentage Data)
OUTLOOK
NACoal expects improved operating performance at its coal mining operations in 2012. Tons delivered in 2012 are expected to be slightly higher than 2011 provided customers achieve currently planned power plant operating levels. Limerock deliveries are expected to decrease modestly in 2012 as customer requirements are expected to be lower as a result of the continued weakness in the southern Florida housing and construction markets. Royalty and other income in 2012 is expected to be moderately higher than 2011.
The new unconsolidated mines, which are in the development stage and will not be in full production for several years, are expected to continue to generate modest income in 2012. NACoal also has new project opportunities for which it expects to continue to incur additional expenses in 2012. In particular, NACoal continues to move forward to obtain a permit for its Otter Creek reserve in North Dakota in preparation for the expected construction of a new mine. The permit is anticipated to be issued in the first half of 2012.
Overall, NACoal expects full year 2012 net income to increase compared with 2011 net income mainly as a result of expected improvements in tons delivered at MLMC. However, higher selling, general and administrative expenses as a result of increased employee-related costs and development activities are expected to partially offset the improvements in net income. Cash flow before financing activities in 2012 is expected to be higher than 2011.
Over the longer term, NACoal expects to continue its efforts to develop new mining projects. NACoal is actively pursuing domestic opportunities for new coal mining projects, which include prospects for power generation, coal-to-liquids, coal gasification, coal drying and other clean coal technologies. Furthermore, NACoal is encouraged that new international value-added mining services projects for coal may become available. NACoal also continues to pursue additional non-coal mining opportunities.
NACCO AND OTHER
NACCO and Other includes the parent company operations and Bellaire Corporation ("Bellaire"), a non-operating subsidiary of NACCO. Although Bellaire’s operations are immaterial, it has long-term liabilities related to closed mines, primarily from former Eastern U.S. underground coal mining activities.
FINANCIAL REVIEW
Operating Results
The results of operations at NACCO and Other were as follows for the year ended
December 31
:
|
|
2011
|
2010
|
2009
|
||||||||
|
Revenues
|
$
|
—
|
|
$
|
—
|
|
$
|
—
|
|
||
|
Operating loss
|
$
|
(7.3
|
)
|
$
|
(10.8
|
)
|
$
|
(9.4
|
)
|
||
|
Other (income) expense
|
$
|
(56.1
|
)
|
$
|
20.7
|
|
$
|
2.0
|
|
||
|
Net income (loss)
|
$
|
30.7
|
|
$
|
(20.4
|
)
|
$
|
(9.0
|
)
|
||
2011
Compared with
2010
NACCO and Other recognized an operating loss of $7.3 million in 2011 compared with $10.8 million in 2010. The change was primarily due to a decrease in employee-related costs in 2011 compared with 2010.
The change in other (income) expense in 2011 compared with 2010 was primarily due to the settlement of the Applica litigation, as discussed in the Applica Transaction section below. NACCO and Other recognized net income of $30.7 million in 2011 compared with a net loss of $20.4 million in 2010 primarily due to the factors affecting the operating loss and other (income) expense.
71
|
Item 7.
|
MANAGEMENT'S DISCUSSION AND ANALYSIS OF FINANCIAL CONDITION AND RESULTS OF OPERATIONS
|
NACCO INDUSTRIES, INC. AND SUBSIDIARIES
(Tabular Amounts in Millions, Except Per Share and Percentage Data)
2010
Compared with
2009
NACCO and Other’s operating loss increased to $10.8 million in 2010 compared with $9.4 million in 2009. The increase was primarily due to higher employee-related expenses partially offset by an increase in management fees charged to the subsidiaries in 2010 and the absence of an impairment charge recognized in connection with the buy-out of a capital lease asset during 2009. The increase in employee-related expenses, which contributed to the related increase in management fees during 2010, was primarily due to the restoration of compensation and benefits, which were reduced in 2009.
The change in other (income) expense in 2010 compared with 2009 was primarily due to an increase in litigation expenses related to the failed Applica transaction, as discussed in the Applica Transaction section below. NACCO and Other recognized a higher net loss in 2010 compared with 2009 primarily due to the factors affecting the operating loss and other (income) expense.
Applica Transaction
In 2006, the Company initiated litigation in the Delaware Chancery Court against Applica Incorporated ("Applica") and individuals and entities affiliated with Applica's shareholder, Harbinger Capital Partners Master Fund, Ltd. The litigation alleged a number of contract and tort claims against the defendants related to the failed transaction with Applica, which had been previously announced. On February 14, 2011, the parties to this litigation entered into a settlement agreement. The settlement agreement provided for, among other things, the payment of $60 million to the Company and dismissal of the lawsuit with prejudice. The payment was received in February 2011.
Litigation costs related to the failed transaction with Applica were $2.8 million, $18.8 million and $1.1 million in 2011, 2010 and 2009, respectively.
Management Fees
The parent company charges management fees to its operating subsidiaries for services provided by the corporate headquarters. The management fees are based upon estimated parent company resources devoted to providing centralized services and stewardship activities and are allocated among all subsidiaries based upon the relative size and complexity of each subsidiary. To determine the amounts and allocation of management fees among the subsidiaries each year, the parent company reviews the time its employees devote to each operating subsidiary and the estimated costs for providing centralized services and stewardship activities in the next year. In addition, the parent company reviews the amount of management fees allocated to its operating subsidiaries each quarter to ensure the amount continues to be reasonable based on the actual costs incurred to date. The Company believes the allocation method is consistently applied and reasonable.
Following are the parent company management fees included in each subsidiary’s selling, general and administrative expenses for the year ended
December 31
:
|
|
2011
|
2010
|
2009
|
||||||||
|
NMHG
|
$
|
9.7
|
|
$
|
7.8
|
|
$
|
6.3
|
|
||
|
HBB
|
$
|
3.3
|
|
$
|
4.0
|
|
$
|
2.1
|
|
||
|
KC
|
$
|
0.1
|
|
$
|
0.1
|
|
$
|
0.1
|
|
||
|
NACoal
|
$
|
3.8
|
|
$
|
4.1
|
|
$
|
3.0
|
|
||
LIQUIDITY AND CAPITAL RESOURCES
Although NACCO’s subsidiaries have entered into substantial borrowing agreements, NACCO has not guaranteed any borrowings of its subsidiaries. The borrowing agreements at NMHG, HBB, KC and NACoal allow for the payment to NACCO of dividends and advances under certain circumstances. Dividends (to the extent permitted by its subsidiaries’ borrowing agreements), advances and management fees from its subsidiaries are the primary sources of cash for NACCO.
The Company believes funds available from cash on hand, its subsidiaries’ credit facilities and anticipated funds generated from its subsidiaries operations are sufficient to finance all of its subsidiaries scheduled principal repayments, operating needs and commitments arising during the next twelve months and until the expiration of its subsidiaries’ credit facilities.
72
|
Item 7.
|
MANAGEMENT'S DISCUSSION AND ANALYSIS OF FINANCIAL CONDITION AND RESULTS OF OPERATIONS
|
NACCO INDUSTRIES, INC. AND SUBSIDIARIES
(Tabular Amounts in Millions, Except Per Share and Percentage Data)
Contractual Obligations, Contingent Liabilities and Commitments
Following is a table which summarizes the contractual obligations of NACCO and Other as of
December 31, 2011
:
|
Contractual Obligations
|
Total
|
2012
|
2013
|
2014
|
2015
|
2016
|
Thereafter
|
||||||||||||||||||||
|
Operating leases
|
$
|
3.6
|
|
$
|
0.6
|
|
$
|
0.6
|
|
$
|
0.6
|
|
$
|
0.6
|
|
$
|
0.6
|
|
$
|
0.6
|
|
||||||
|
Purchase and other obligations
|
17.1
|
|
17.1
|
|
—
|
|
—
|
|
—
|
|
—
|
|
—
|
|
|||||||||||||
|
Total contractual cash obligations
|
$
|
20.7
|
|
$
|
17.7
|
|
$
|
0.6
|
|
$
|
0.6
|
|
$
|
0.6
|
|
$
|
0.6
|
|
$
|
0.6
|
|
||||||
Pension and postretirement funding can vary significantly each year due to plan amendments, changes in the market value of plan assets, legislation and the Company’s funding decisions to contribute any excess above the minimum legislative funding requirements. As a result, pension and postretirement funding has not been included in the table above. NACCO and Other maintains one supplemental retirement plan that pays monthly benefits to participants directly out of corporate funds. Annual benefit payments are expected to be less than $0.1 million per year over the next ten years. Benefit payments beyond that time cannot currently be estimated. All other pension benefit payments are made from assets of the pension plans. NACCO and Other expects to contribute $1.0 million to its pension plan during
2012
. NACCO and Other also expects to make payments related to its other postretirement plans of less than $0.1 million per year over the next ten years. Benefit payments beyond that time cannot currently be estimated.
The purchase and other obligations are primarily for accounts payable, open purchase orders, accrued payroll and incentive compensation.
Capital Structure
NACCO’s consolidated capital structure is presented below:
|
|
December 31
|
|
|||||||||
|
|
2011
|
2010
|
Change
|
||||||||
|
Cash and cash equivalents
|
$
|
338.6
|
|
$
|
261.9
|
|
$
|
76.7
|
|
||
|
Other net tangible assets
|
569.3
|
|
533.8
|
|
35.5
|
|
|||||
|
Coal supply agreement, net
|
57.9
|
|
60.0
|
|
(2.1
|
)
|
|||||
|
Net assets
|
965.8
|
|
855.7
|
|
110.1
|
|
|||||
|
Total debt
|
(374.2
|
)
|
(391.5
|
)
|
17.3
|
|
|||||
|
Closed mine obligations, net of tax
|
(14.6
|
)
|
(16.0
|
)
|
1.4
|
|
|||||
|
Total equity
|
$
|
577.0
|
|
$
|
448.2
|
|
$
|
128.8
|
|
||
|
Debt to total capitalization
|
39
|
%
|
47
|
%
|
(8
|
)%
|
|||||
RECENTLY ISSUED ACCOUNTING STANDARDS
In May 2011, the Financial Accounting Standards Board ("FASB") issued authoritative guidance on fair value measurement, which is effective for the Company on January 1, 2012. The guidance resulted in a consistent definition of fair value and common requirements for measurement of and disclosure about fair value between U.S. generally accepted accounting principles and International Financial Reporting Standards. The Company does not expect the adoption of the guidance to have a material effect on its financial position, results of operations, cash flows or related disclosures.
In June 2011, the FASB issued authoritative guidance on the presentation of comprehensive income, which is effective for the Company on January 1, 2012. The guidance provides an entity with the option to present the total of comprehensive income, the components of net income and the components of other comprehensive income either in a single continuous statement of comprehensive income or in two separate but consecutive statements. In both choices, an entity is required to present each component of net income along with total net income, each component of other comprehensive income along with a total for other comprehensive income and a total amount for comprehensive income. The guidance eliminates the option to present the components of other comprehensive income as part of the statement of changes in equity. In December 2011, the FASB issued additional authoritative guidance, which is also effective for the Company on January 1, 2012, deferring the adoption of
73
|
Item 7.
|
MANAGEMENT'S DISCUSSION AND ANALYSIS OF FINANCIAL CONDITION AND RESULTS OF OPERATIONS
|
NACCO INDUSTRIES, INC. AND SUBSIDIARIES
(Tabular Amounts in Millions, Except Per Share and Percentage Data)
certain provisions requiring the presentation of the effects of reclassifications out of accumulated other comprehensive income on the components of net income and other comprehensive income on the face of the financial statements. The Company does not expect the adoption of the guidance to have a material effect on its financial position, results of operations, cash flows or related disclosures.
In December 2011, the FASB issued authoritative guidance on the offsetting of assets and liabilities, which is effective for the Company on January 1, 2013. The guidance requires additional disclosures regarding offsetting arrangements of balance sheet derivatives to enable financial statement users to understand the effect of these arrangements on a company's financial position. The Company is currently evaluating the effect the adoption of the guidance will have on its disclosures.
EFFECTS OF FOREIGN CURRENCY
NMHG and HBB operate internationally and enter into transactions denominated in foreign currencies. As a result, the Company is subject to the variability that arises from exchange rate movements. The effects of foreign currency on operating results at NMHG and HBB are discussed above. The Company’s use of foreign currency derivative contracts is discussed in Item 7A, “Quantitative and Qualitative Disclosures about Market Risk,” of this Form 10-K.
ENVIRONMENTAL MATTERS
The Company’s current and previous manufacturing operations, like those of other companies engaged in similar businesses, involve the use, disposal and cleanup of substances regulated under environmental protection laws. The Company’s NACoal and Bellaire subsidiaries are affected by the regulations of agencies under which they operate, particularly the Federal Office of Surface Mining, the United States Environmental Protection Agency and associated state regulatory authorities. In addition, NACoal and Bellaire closely monitor proposed legislation concerning the Clean Air Act Amendments of 1990, reauthorization of the Resource Conservation and Recovery Act, the Clean Water Act, the Endangered Species Act and other regulatory actions.
Compliance with these increasingly stringent standards could result in higher expenditures for both capital improvements and operating costs. The Company’s policies stress environmental responsibility and compliance with these regulations. Based on current information, management does not expect compliance with these regulations to have a material adverse effect on the Company’s financial condition or results of operations. See Item 1 in Part I of this Form 10-K for further discussion of these matters.
FORWARD-LOOKING STATEMENTS
The statements contained in “Management’s Discussion and Analysis of Financial Condition and Results of Operations” and elsewhere throughout this Annual Report on Form 10-K that are not historical facts are “forward-looking statements” within the meaning of Section 27A of the Securities Act of 1933 and Section 21E of the Securities Exchange Act of 1934. These forward-looking statements are made subject to certain risks and uncertainties, which could cause actual results to differ materially from those presented in these forward-looking statements. Readers are cautioned not to place undue reliance on these forward-looking statements, which speak only as of the date hereof. The Company undertakes no obligation to publicly revise these forward-looking statements to reflect events or circumstances that arise after the date hereof. Such risks and uncertainties with respect to each subsidiary’s operations include, without limitation:
NMHG:
(1) reduction in demand for lift trucks and related aftermarket parts and service on a global basis, (2) the ability of NMHG's dealers, suppliers and end-users to obtain financing at reasonable rates, or at all, as a result of current economic and market conditions, (3) customer acceptance of pricing, (4) delays in delivery or increases in costs, including transportation costs, of raw materials or sourced products and labor or changes in or unavailability of quality suppliers, (5) exchange rate fluctuations, changes in foreign import tariffs and monetary policies and other changes in the regulatory climate in the foreign countries in which NMHG operates and/or sells products, (6) delays in manufacturing and delivery schedules, (7) bankruptcy of or loss of major dealers, retail customers or suppliers, (8) customer acceptance of, changes in the costs of, or delays in the development of new products, (9) introduction of new products by, or more favorable product pricing offered by, NMHG's competitors, (10) product liability or other litigation, warranty claims or returns of products, (11) the effectiveness of the cost reduction programs implemented globally, including the successful implementation of procurement and sourcing initiatives and (12) changes mandated by federal, state and other regulation, including health, safety or environmental legislation.
74
|
Item 7.
|
MANAGEMENT'S DISCUSSION AND ANALYSIS OF FINANCIAL CONDITION AND RESULTS OF OPERATIONS
|
NACCO INDUSTRIES, INC. AND SUBSIDIARIES
(Tabular Amounts in Millions, Except Per Share and Percentage Data)
HBB:
(1) changes in the sales prices, product mix or levels of consumer purchases of small electric appliances, (2) changes in consumer retail and credit markets, (3) bankruptcy of or loss of major retail customers or suppliers, (4) changes in costs, including transportation costs, of sourced products, (5) delays in delivery of sourced products, (6) changes in or unavailability of quality or cost effective suppliers, (7) exchange rate fluctuations, changes in the foreign import tariffs and monetary policies and other changes in the regulatory climate in the foreign countries in which HBB buys, operates and/or sells products, (8) product liability, regulatory actions or other litigation, warranty claims or returns of products, (9) customer acceptance of, changes in costs of, or delays in the development of new products, (10) increased competition, including consolidation within the industry and (11) changes mandated by federal, state and other regulation, including health, safety or environmental legislation.
KC:
(1) changes in gasoline prices, weather conditions, the level of consumer confidence and disposable income as a result of the uncertain economy, high unemployment rates or other events or conditions that may adversely affect the number of customers visiting Kitchen Collection
®
and Le Gourmet Chef
®
stores, (2) changes in the sales prices, product mix or levels of consumer purchases of kitchenware, small electric appliances and gourmet foods, (3) changes in costs, including transportation costs, of inventory, (4) delays in delivery or the unavailability of inventory, (5) customer acceptance of new products, (6) the anticipated impact of the opening of new stores, the ability to renegotiate existing leases and effectively and efficiently close unprofitable stores and (7) increased competition.
NACoal:
(1) changes in tax laws or regulatory requirements, including changes in power plant emission regulations and health, safety or environmental legislation, (2) changes in costs related to geological conditions, repairs and maintenance, new equipment and replacement parts, fuel or other similar items, (3) regulatory actions, changes in mining permit requirements or delays in obtaining mining permits that could affect deliveries to customers, (4) weather conditions, extended power plant outages or other events that would change the level of customers' coal or limerock requirements, which would have an adverse effect on results of operations, (5) weather or equipment problems that could affect deliveries to customers, (6) changes in the power industry that would affect demand for NACoal's reserves, (7) changes in the costs to reclaim current NACoal mining areas or NACCO and Other's closed mining operations, (8) costs to pursue and develop new mining opportunities and (9) the outcome of legal challenges to the regulatory approvals necessary to construct the Liberty Mine and the Ratcliffe Plant in Mississippi.
75
INTEREST RATE RISK
The Company's subsidiaries, NMHG, HBB, KC and NACoal, have entered into certain financing arrangements that require interest payments based on floating interest rates. As such, the Company's financial results are subject to changes in the market rate of interest. To reduce the exposure to changes in the market rate of interest, the Company has entered into interest rate swap agreements for a significant portion of its floating rate financing arrangements. The Company does not enter into interest rate swap agreements for trading purposes. Terms of the interest rate swap agreements require the subsidiaries to receive a variable interest rate and pay a fixed interest rate. See also Note 2 and Note 11 to the Consolidated Financial Statements in this Form 10-K.
In addition, NACoal has fixed rate debt arrangements. For purposes of risk analysis, the Company uses sensitivity analysis to measure the potential loss in fair value of financial instruments sensitive to changes in interest rates. The Company assumes that a loss in fair value is an increase to its liabilities. NACoal's fixed rate debt arrangements have a fair value based on Company estimates of $20.8 million at
December 31, 2011
. Assuming a hypothetical 10% decrease in the effective interest yield on this fixed rate debt, the fair value of this liability would increase by $0.1 million compared with the fair value of this liability at
December 31, 2011
. The fair value of the Company's interest rate swap agreements was a liability of $7.3 million at
December 31, 2011
. A hypothetical 10% decrease in interest rates would cause an increase in the fair value of interest rate swap agreements and the resulting fair value would be a liability of $7.4 million.
FOREIGN CURRENCY EXCHANGE RATE RISK
NMHG and HBB operate internationally and enter into transactions denominated in foreign currencies. As such, their financial results are subject to the variability that arises from exchange rate movements. NMHG and HBB use forward foreign currency exchange contracts to partially reduce risks related to transactions denominated in foreign currencies and not for trading purposes. These contracts generally mature within twelve months and require the companies to buy or sell euros, British pounds, Japanese yen, Canadian dollars, Swedish kroner, Australian dollars and Mexican pesos for the functional currency in which the applicable subsidiary operates at rates agreed to at the inception of the contracts. The fair value of these contracts was a net asset of $5.2 million at
December 31, 2011
. See also Notes 2 and Note 11 to the Consolidated Financial Statements in this Form 10-K.
For purposes of risk analysis, the Company uses sensitivity analysis to measure the potential loss in fair value of financial instruments sensitive to changes in foreign currency exchange rates. The Company assumes that a loss in fair value is either a decrease to its assets or an increase to its liabilities. Assuming a hypothetical 10% weakening of the U.S. dollar compared with other foreign currencies at
December 31, 2011
, the fair value of foreign currency-sensitive financial instruments, which primarily represents forward foreign currency exchange contracts, would be decreased by $1.0 million compared with its fair value at
December 31, 2011
. It is important to note that the change in fair value indicated in this sensitivity analysis would be somewhat offset by changes in the fair value of the underlying receivables and payables.
COMMODITY PRICE RISK
The Company uses certain commodities, including steel, lead, resins, linerboard and diesel fuel, in the normal course of its manufacturing, distribution and mining processes. As such, the cost of operations is subject to variability as the market for these commodities changes. The Company monitors this risk and, from time to time, enters into derivative contracts to hedge this risk. The Company does not currently have any such derivative contracts outstanding, nor does the Company have any significant purchase obligations to obtain fixed quantities of commodities in the future.
The information required by this Item 8 is set forth in the Financial Statements and Supplementary Data contained in Part IV of this Form 10-K and is hereby incorporated herein by reference to such information.
There were no disagreements with accountants on accounting and financial disclosure for the three-year period ended
December 31, 2011
.
76
Item 9A
.
CONTROLS AND PROCEDURES
Evaluation of disclosure controls and procedures:
An evaluation was carried out under the supervision and with the participation of the Company's management, including the principal executive officer and the principal financial officer, of the effectiveness of the Company's disclosure controls and procedures as of the end of the period covered by this report. Based on that evaluation, these officers have concluded that the Company's disclosure controls and procedures are effective.
Management's report on internal control over financial reporting:
Management is responsible for establishing and maintaining adequate internal control over financial reporting. Under the supervision and with the participation of management, including the principal executive officer and principal financial officer, the Company conducted an evaluation of the effectiveness of internal control over financial reporting based on the framework in Internal Control — Integrated Framework issued by the Committee of Sponsoring Organizations of the Treadway Commission. Based on this evaluation under the framework in Internal Control — Integrated Framework, management concluded that the Company's internal control over financial reporting was effective as of
December 31, 2011
. The Company's effectiveness of internal control over financial reporting as of
December 31, 2011
has been audited by Ernst & Young LLP, an independent registered public accounting firm, as stated in its report, which is included in Item 15 of this Form 10-K and incorporated herein by reference.
Changes in internal control:
During the fourth quarter of
2011
, there have been no changes in the Company's internal control over financial reporting that have materially affected, or are reasonably likely to materially affect, the Company's internal control over financial reporting.
Item 9B
.
OTHER INFORMATION
None
77
Information with respect to Directors of the Company will be set forth in the
2012
Proxy Statement under the subheadings “Business to be Transacted — 1. Election of Directors — Director Nominee Information,” which information is incorporated herein by reference.
Information with respect to the audit review committee and the audit review committee financial expert will be set forth in the
2012
Proxy Statement under the heading “Business to be Transacted — 1. Election of Directors — Directors’ Meetings and Committees,” which information is incorporated herein by reference.
Information with respect to compliance with Section 16(a) of the Securities Exchange Act of 1934 by the Company's Directors, executive officers and holders of more than ten percent of the Company's equity securities will be set forth in the
2012
Proxy Statement under the subheading “Business to be Transacted — 1. Election of Directors — Section 16(a) Beneficial Ownership Reporting Compliance,” which information is incorporated herein by reference.
Information regarding the executive officers of the Company is included in this Form 10-K as Item 4A of Part I as permitted by Instruction 3 to Item 401(b) of Regulation S-K.
The Company has adopted a code of ethics applicable to all Company personnel, including the principal executive officer, principal financial officer, principal accounting officer or controller, or other persons performing similar functions. The code of ethics, entitled the “Code of Corporate Conduct,” is posted on the Company's website at www.nacco.com under “Corporate Governance.” Amendments and waivers of the Company's Code of Corporate Conduct for directors or executive officers of the Company, if any, will be disclosed on the Company's website or on a current report on Form 8-K.
Information with respect to executive compensation will be set forth in the
2012
Proxy Statement under the subheadings “Business to be Transacted — 1. Election of Directors — Director Compensation” and “— Executive Compensation,” which information is incorporated herein by reference.
Information with respect to security ownership of certain beneficial owners and management will be set forth in the
2012
Proxy Statement under the heading “Beneficial Ownership of Class A Common and Class B Common,” which information is incorporated herein by reference.
Information with respect to compensation plans (including individual compensation arrangements) under which equity securities are authorized for issuance will be set forth in the
2012
Proxy Statement under the subheading “Business to be Transacted — 1. Election of Directors — Equity Compensation Plan Information," which information is incorporated herein by reference.
Information with respect to certain relationships and related transactions will be set forth in the
2012
Proxy Statement under the subheadings “Business to be Transacted — 1. Election of Directors — Directors’ Meetings and Committees” and “— Certain Business Relationships,” which information is incorporated herein by reference.
Information with respect to principal accountant fees and services will be set forth in the
2012
Proxy Statement under the heading “Business to be Transacted — 6. Confirmation of Appointment of Independent Registered Public Accounting Firm for the Current Fiscal Year,” which information is incorporated herein by reference.
78
(a) (1) and (2) The response to Item 15(a)(1) and (2) is set forth beginning at page F-1 of this Form 10-K.
(a) (3) Listing of Exhibits — See the exhibit index beginning at page X-1 of this Form 10-K.
(b) The response to Item 15(b) is set forth beginning at page X-1 of this Form 10-K.
(c) Financial Statement Schedules — The response to Item 15(c) is set forth beginning at page F-53 of this Form 10-K.
79
SIGNATURES
Pursuant to the requirements of Section 13 or 15(d) of the Securities Exchange Act of 1934, the registrant has duly caused this report to be signed on its behalf by the undersigned, thereunto duly authorized.
|
|
NACCO Industries, Inc.
|
|
||
|
|
By:
|
/s/ Kenneth C. Schilling
|
|
|
|
|
|
Kenneth C. Schilling
|
|
|
|
|
|
Vice President and Controller
(principal financial and accounting officer)
|
|
|
February 29, 2012
80
Pursuant to the requirements of the Securities Exchange Act of 1934, this report has been signed below by the following persons on behalf of the registrant and in the capacities and on the dates indicated.
|
/s/ Alfred M. Rankin, Jr.
|
|
Chairman, President and Chief Executive Officer (principal executive officer), Director
|
February 29, 2012
|
|
Alfred M. Rankin, Jr.
|
|
|
|
|
|
|
|
|
|
/s/ Kenneth C. Schilling
|
|
Vice President and Controller (principal financial and accounting officer)
|
February 29, 2012
|
|
Kenneth C. Schilling
|
|
|
|
|
* John P. Jumper
|
|
Director
|
February 29, 2012
|
|
John P. Jumper
|
|
|
|
|
|
|
|
|
|
* Dennis W. LaBarre
|
|
Director
|
February 29, 2012
|
|
Dennis W. LaBarre
|
|
|
|
|
|
|
|
|
|
* Richard de J. Osborne
|
|
Director
|
February 29, 2012
|
|
Richard de J. Osborne
|
|
|
|
|
|
|
|
|
|
* Michael E. Shannon
|
|
Director
|
February 29, 2012
|
|
Michael E. Shannon
|
|
|
|
|
|
|
|
|
|
* Britton T. Taplin
|
|
Director
|
February 29, 2012
|
|
Britton T. Taplin
|
|
|
|
|
|
|
|
|
|
* David F. Taplin
|
|
Director
|
February 29, 2012
|
|
David F. Taplin
|
|
|
|
|
|
|
|
|
|
* John F. Turben
|
|
Director
|
February 29, 2012
|
|
John F. Turben
|
|
|
|
|
|
|
|
|
|
* Eugene Wong
|
|
Director
|
February 29, 2012
|
|
Eugene Wong
|
|
|
|
* Kenneth C. Schilling, by signing his name hereto, does hereby sign this Form 10-K on behalf of each of the above named and designated directors of the Company pursuant to a Power of Attorney executed by such persons and filed with the Securities and Exchange Commission.
|
/s/ Kenneth C. Schilling
|
|
February 29, 2012
|
|
Kenneth C. Schilling, Attorney-in-Fact
|
|
|
81
ANNUAL REPORT ON FORM 10-K
FINANCIAL STATEMENTS AND SUPPLEMENTARY DATA
LIST OF FINANCIAL STATEMENTS AND FINANCIAL STATEMENT SCHEDULES
FINANCIAL STATEMENTS
FINANCIAL STATEMENT SCHEDULES
YEAR ENDED
DECEMBER 31, 2011
NACCO INDUSTRIES, INC.
CLEVELAND, OHIO
F-1
FORM 10-K
NACCO INDUSTRIES, INC. AND SUBSIDIARIES
LIST OF FINANCIAL STATEMENTS AND FINANCIAL STATEMENT SCHEDULES
The following consolidated financial statements of NACCO Industries, Inc. and Subsidiaries are incorporated by reference in Item 8:
The following consolidated financial statement schedules of NACCO Industries, Inc. and Subsidiaries are included in Item 15(c):
All other schedules for which provision is made in the applicable accounting regulation of the SEC are not required under the related instructions or are inapplicable, and therefore have been omitted.
F-2
Report of Independent Registered Public Accounting Firm
The Board of Directors and Stockholders of NACCO Industries, Inc.
We have audited the accompanying consolidated balance sheets of NACCO Industries, Inc. and Subsidiaries (collectively “the Company”) as of
December 31, 2011
and
2010
, and the related consolidated statements of operations, comprehensive income (loss), cash flows and equity for each of the three years in the period ended
December 31, 2011
. Our audits also included the financial statement schedules listed in the Index at Item 15(a). These financial statements and schedules are the responsibility of the Company's management. Our responsibility is to express an opinion on these financial statements and schedules based on our audits.
We conducted our audits in accordance with the standards of the Public Company Accounting Oversight Board (United States). Those standards require that we plan and perform the audit to obtain reasonable assurance about whether the financial statements are free of material misstatement. An audit includes examining, on a test basis, evidence supporting the amounts and disclosures in the financial statements. An audit also includes assessing the accounting principles used and significant estimates made by management, as well as evaluating the overall financial statement presentation. We believe that our audits provide a reasonable basis for our opinion.
In our opinion, the consolidated financial statements referred to above present fairly, in all material respects, the consolidated financial position of NACCO Industries, Inc. and Subsidiaries at
December 31, 2011
and
2010
, and the consolidated results of their operations and their cash flows for each of the three years in the period ended
December 31, 2011
, in conformity with U.S. generally accepted accounting principles. Also, in our opinion, the related financial statement schedules, when considered in relation to the basic financial statements taken as a whole, present fairly, in all material respects the information set forth therein.
We also have audited, in accordance with the standards of the Public Company Accounting Oversight Board (United States), NACCO Industries, Inc. and Subsidiaries’ internal control over financial reporting as of
December 31, 2011
, based on criteria established in Internal Control — Integrated Framework issued by the Committee of Sponsoring Organizations of the Treadway Commission and our report dated
February 29, 2012
expressed an unqualified opinion thereon.
|
/s/ Ernst & Young LLP
|
|||
|
Cleveland, Ohio
|
|||
|
February 29, 2012
|
|||
F-3
Report of Independent Registered Public Accounting Firm
The Board of Directors and Stockholders of NACCO Industries, Inc.
We have audited NACCO Industries, Inc. and Subsidiaries’ internal control over financial reporting as of
December 31, 2011
, based on criteria established in Internal Control — Integrated Framework issued by the Committee of Sponsoring Organizations of the Treadway Commission (the COSO criteria). NACCO Industries, Inc. and Subsidiaries' management is responsible for maintaining effective internal control over financial reporting, and for its assessment of the effectiveness of internal control over financial reporting included in the accompanying management's report on internal control over financial reporting in Item 9A of the Form 10-K. Our responsibility is to express an opinion on the company's internal control over financial reporting based on our audit.
We conducted our audit in accordance with the standards of the Public Company Accounting Oversight Board (United States). Those standards require that we plan and perform the audit to obtain reasonable assurance about whether effective internal control over financial reporting was maintained in all material respects. Our audit included obtaining an understanding of internal control over financial reporting, assessing the risk that a material weakness exists, testing and evaluating the design and operating effectiveness of internal control based on the assessed risk, and performing such other procedures as we considered necessary in the circumstances. We believe that our audit provides a reasonable basis for our opinion.
A company's internal control over financial reporting is a process designed to provide reasonable assurance regarding the reliability of financial reporting and the preparation of financial statements for external purposes in accordance with generally accepted accounting principles. A company's internal control over financial reporting includes those policies and procedures that (1) pertain to the maintenance of records that, in reasonable detail, accurately and fairly reflect the transactions and dispositions of the assets of the company; (2) provide reasonable assurance that transactions are recorded as necessary to permit preparation of financial statements in accordance with generally accepted accounting principles, and that receipts and expenditures of the company are being made only in accordance with authorizations of management and directors of the company; and (3) provide reasonable assurance regarding prevention or timely detection of unauthorized acquisition, use, or disposition of the company's assets that could have a material effect on the financial statements.
Because of its inherent limitations, internal control over financial reporting may not prevent or detect misstatements. Also, projections of any evaluation of effectiveness to future periods are subject to the risk that controls may become inadequate because of changes in conditions, or that the degree of compliance with the policies or procedures may deteriorate.
In our opinion, NACCO Industries, Inc. and Subsidiaries maintained, in all material respects, effective internal control over financial reporting as of
December 31, 2011
based on the COSO criteria.
We also have audited, in accordance with the standards of the Public Company Accounting Oversight Board (United States), the consolidated balance sheets of NACCO Industries, Inc. and Subsidiaries as of
December 31, 2011
and
2010
, and the related consolidated statements of operations, comprehensive income (loss), cash flows and equity for each of the three years in the period ended
December 31, 2011
of NACCO Industries, Inc. and Subsidiaries, and our report dated
February 29, 2012
expressed an unqualified opinion thereon.
|
/s/ Ernst & Young LLP
|
|||
|
Cleveland, Ohio
|
|||
|
February 29, 2012
|
|||
F-4
NACCO INDUSTRIES, INC. AND SUBSIDIARIES
|
|
Year Ended December 31
|
||||||||||
|
|
2011
|
2010
|
2009
|
||||||||
|
|
(In millions, except per share data)
|
||||||||||
|
Revenues
|
$
|
3,331.2
|
|
$
|
2,687.5
|
|
$
|
2,310.6
|
|
||
|
Cost of sales
|
2,738.1
|
|
2,161.3
|
|
1,902.5
|
|
|||||
|
Gross Profit
|
593.1
|
|
526.2
|
|
408.1
|
|
|||||
|
Earnings of unconsolidated mines
|
45.5
|
|
43.4
|
|
38.6
|
|
|||||
|
Operating Expenses
|
|
|
|
||||||||
|
Selling, general and administrative expenses
|
465.3
|
|
425.3
|
|
388.3
|
|
|||||
|
Restructuring charges (reversals)
|
—
|
|
(1.9
|
)
|
9.3
|
|
|||||
|
Loss on sale of businesses
|
—
|
|
4.0
|
|
—
|
|
|||||
|
(Gain) loss on sale of assets
|
(0.8
|
)
|
1.9
|
|
(10.0
|
)
|
|||||
|
|
464.5
|
|
429.3
|
|
387.6
|
|
|||||
|
Operating Profit
|
174.1
|
|
140.3
|
|
59.1
|
|
|||||
|
Other (income) expense
|
|
|
|
||||||||
|
Interest expense
|
24.5
|
|
27.4
|
|
32.2
|
|
|||||
|
(Income) loss from other unconsolidated affiliates
|
(7.4
|
)
|
(2.3
|
)
|
1.7
|
|
|||||
|
Applica settlement and litigation costs
|
(57.2
|
)
|
18.8
|
|
1.1
|
|
|||||
|
Other
|
0.4
|
|
(0.4
|
)
|
(4.8
|
)
|
|||||
|
|
(39.7
|
)
|
43.5
|
|
30.2
|
|
|||||
|
Income Before Income Taxes
|
213.8
|
|
96.8
|
|
28.9
|
|
|||||
|
Income tax provision
|
51.7
|
|
17.4
|
|
20.5
|
|
|||||
|
Income From Continuing Operations
|
162.1
|
|
79.4
|
|
8.4
|
|
|||||
|
Discontinued operations, net of $13.5 tax expense in 2009
|
—
|
|
—
|
|
22.6
|
|
|||||
|
Net Income
|
162.1
|
|
79.4
|
|
31.0
|
|
|||||
|
Ne
t loss a
ttributable to noncontrolling interest
|
—
|
|
0.1
|
|
0.1
|
|
|||||
|
Net Income Attributable to Stockholders
|
$
|
162.1
|
|
$
|
79.5
|
|
$
|
31.1
|
|
||
|
Amounts Attributable to Stockholders
|
|
|
|
||||||||
|
Income from continuing operations, net of tax
|
$
|
162.1
|
|
$
|
79.5
|
|
$
|
8.5
|
|
||
|
Discontinued operations, net of tax
|
—
|
|
—
|
|
22.6
|
|
|||||
|
Net Income Attributable to Stockholders
|
$
|
162.1
|
|
$
|
79.5
|
|
$
|
31.1
|
|
||
|
Comprehensive Income
|
$
|
146.5
|
|
$
|
61.6
|
|
$
|
55.3
|
|
||
|
Basic Earnings per Share Attributable to Stockholders:
|
|
|
|
||||||||
|
Continuing operations
|
$
|
19.34
|
|
$
|
9.55
|
|
$
|
1.03
|
|
||
|
Discontinued operations
|
—
|
|
—
|
|
2.72
|
|
|||||
|
Basic Earnings per Share
|
$
|
19.34
|
|
$
|
9.55
|
|
$
|
3.75
|
|
||
|
Diluted Earnings per Share Attributable to Stockholders:
|
|
|
|
||||||||
|
Continuing operations
|
$
|
19.28
|
|
$
|
9.53
|
|
$
|
1.03
|
|
||
|
Discontinued operations
|
—
|
|
—
|
|
2.72
|
|
|||||
|
Diluted Earnings per Share
|
$
|
19.28
|
|
$
|
9.53
|
|
$
|
3.75
|
|
||
See Notes to Consolidated Financial Statements.
F-5
NACCO INDUSTRIES, INC. AND SUBSIDIARIES
CONSOLIDATED STATEMENTS OF COMPREHENSIVE INCOME (LOSS)
|
|
Year Ended December 31
|
||||||||||
|
|
2011
|
2010
|
2009
|
||||||||
|
|
(In millions)
|
||||||||||
|
Net Income
|
$
|
162.1
|
|
$
|
79.4
|
|
$
|
31.0
|
|
||
|
Other comprehensive income (loss)
|
|
|
|
||||||||
|
Foreign currency translation adjustment
|
(14.9
|
)
|
(6.7
|
)
|
17.4
|
|
|||||
|
Current period cash flow hedging activity, net of $0.2 tax expense in 2011, $3.3 tax benefit in 2010 and $4.2 tax benefit in 2009
|
2.4
|
|
(3.7
|
)
|
8.7
|
|
|||||
|
Reclassification of hedging activities into earnings, net of $2.6 tax expense in 2011, $4.2 tax expense in 2010 and $2.1 tax expense in 2009
|
9.2
|
|
(8.8
|
)
|
3.9
|
|
|||||
|
Current period pension and postretirement plan adjustment, net of $7.3 tax benefit in 2011, $1.6 tax benefit in 2010, and $0.8 tax expense in 2009
|
(19.0
|
)
|
(3.8
|
)
|
(9.9
|
)
|
|||||
|
Reclassification of pension and postretirement into earnings, net of $1.8 tax expense in 2011, $1.3 tax expense in 2010 and $1.7 tax expense in 2009
|
6.7
|
|
5.1
|
|
4.1
|
|
|||||
|
Comprehensive Income
|
$
|
146.5
|
|
$
|
61.5
|
|
$
|
55.2
|
|
||
|
Other comprehensive income (loss) attributable to noncontrolling interest
|
|||||||||||
|
Net loss attributable to noncontrolling interest
|
—
|
|
0.1
|
|
0.1
|
|
|||||
|
Comprehensive Income Attributable to Stockholders
|
$
|
146.5
|
|
$
|
61.6
|
|
$
|
55.3
|
|
||
See Notes to Consolidated Financial Statements.
F-6
NACCO INDUSTRIES, INC. AND SUBSIDIARIES
|
|
December 31
|
||||||
|
|
2011
|
2010
|
|||||
|
|
(In millions, except share data)
|
||||||
|
ASSETS
|
|
|
|||||
|
Current Assets
|
|
|
|||||
|
Cash and cash equivalents
|
$
|
338.6
|
|
$
|
261.9
|
|
|
|
Accounts receivable, net of allowances of $21.4 in 2011 and $17.3 in 2010
|
464.5
|
|
425.9
|
|
|||
|
Inventories, net
|
470.3
|
|
447.4
|
|
|||
|
Deferred income taxes
|
30.7
|
|
21.9
|
|
|||
|
Prepaid expenses and other
|
39.6
|
|
33.4
|
|
|||
|
Assets held for sale
|
31.4
|
|
23.7
|
|
|||
|
Total Current Assets
|
1,375.1
|
|
1,214.2
|
|
|||
|
Property, Plant and Equipment, Net
|
254.3
|
|
270.4
|
|
|||
|
Coal Supply Agreement, Net
|
57.9
|
|
60.0
|
|
|||
|
Long-term Deferred Income Taxes
|
3.5
|
|
5.2
|
|
|||
|
Other Non-current Assets
|
110.6
|
|
108.5
|
|
|||
|
Total Assets
|
$
|
1,801.4
|
|
$
|
1,658.3
|
|
|
|
LIABILITIES AND EQUITY
|
|
|
|||||
|
Current Liabilities
|
|
|
|||||
|
Accounts payable
|
$
|
412.5
|
|
$
|
414.5
|
|
|
|
Revolving credit agreements — not guaranteed by the parent company
|
67.0
|
|
13.7
|
|
|||
|
Current maturities of long-term debt — not guaranteed by the parent company
|
178.1
|
|
22.5
|
|
|||
|
Accrued payroll
|
61.7
|
|
61.0
|
|
|||
|
Deferred revenue
|
11.2
|
|
11.2
|
|
|||
|
Other current liabilities
|
160.7
|
|
140.6
|
|
|||
|
Total Current Liabilities
|
891.2
|
|
663.5
|
|
|||
|
Long-term Debt — not guaranteed by the parent company
|
129.1
|
|
355.3
|
|
|||
|
Pension and other Postretirement Obligations
|
81.0
|
|
77.8
|
|
|||
|
Long-term Deferred Income Taxes
|
12.7
|
|
—
|
|
|||
|
Other Long-term Liabilities
|
110.4
|
|
113.5
|
|
|||
|
Total Liabilities
|
1,224.4
|
|
1,210.1
|
|
|||
|
Stockholders’ Equity
|
|
|
|||||
|
Common stock:
|
|
|
|||||
|
Class A, par value $1 per share, 6,778,346 shares outstanding (2010 - 6,737,199 shares outstanding)
|
6.8
|
|
6.8
|
|
|||
|
Class B, par value $1 per share, convertible into Class A on a one-for-one basis, 1,595,581 shares outstanding (2010 - 1,596,093 shares outstanding)
|
1.6
|
|
1.6
|
|
|||
|
Capital in excess of par value
|
22.7
|
|
22.6
|
|
|||
|
Retained earnings
|
619.7
|
|
475.4
|
|
|||
|
Accumulated other comprehensive income (loss):
|
|
|
|||||
|
Foreign currency translation adjustment
|
13.2
|
|
28.1
|
|
|||
|
Deferred gain (loss) on cash flow hedging
|
2.6
|
|
(9.0
|
)
|
|||
|
Pension and postretirement plan adjustment
|
(90.4
|
)
|
(78.1
|
)
|
|||
|
Total Stockholders’ Equity
|
576.2
|
|
447.4
|
|
|||
|
Noncontrolling Interest
|
0.8
|
|
0.8
|
|
|||
|
Total Equity
|
577.0
|
|
448.2
|
|
|||
|
Total Liabilities and Equity
|
$
|
1,801.4
|
|
$
|
1,658.3
|
|
|
See Notes to Consolidated Financial Statements.
F-7
NACCO INDUSTRIES, INC. AND SUBSIDIARIES
|
|
Year Ended December 31
|
||||||||||
|
|
2011
|
2010
|
2009
|
||||||||
|
|
(In millions)
|
||||||||||
|
Operating Activities
|
|
|
|
||||||||
|
Income from continuing operations
|
$
|
162.1
|
|
$
|
79.4
|
|
$
|
8.4
|
|
||
|
Discontinued operations
|
—
|
|
—
|
|
22.6
|
|
|||||
|
Net income
|
162.1
|
|
79.4
|
|
31.0
|
|
|||||
|
Adjustments to reconcile net income to net cash provided by operating activities:
|
|
|
|
||||||||
|
Depreciation, depletion and amortization
|
47.7
|
|
52.2
|
|
53.6
|
|
|||||
|
Amortization of deferred financing fees
|
2.7
|
|
2.5
|
|
2.2
|
|
|||||
|
Deferred income taxes
|
14.4
|
|
10.5
|
|
24.7
|
|
|||||
|
Restructuring charges (reversals)
|
—
|
|
(1.9
|
)
|
9.3
|
|
|||||
|
(Gain) loss on sale of assets
|
(0.8
|
)
|
1.9
|
|
(10.0
|
)
|
|||||
|
Loss on sale of businesses
|
—
|
|
4.0
|
|
—
|
|
|||||
|
Other non-current liabilities
|
(7.6
|
)
|
(29.7
|
)
|
(30.3
|
)
|
|||||
|
Other
|
10.3
|
|
(6.9
|
)
|
(7.0
|
)
|
|||||
|
Working capital changes, excluding the effect of business dispositions:
|
|
|
|
||||||||
|
Accounts receivable
|
(49.1
|
)
|
(110.4
|
)
|
126.8
|
|
|||||
|
Inventories
|
(33.4
|
)
|
(109.3
|
)
|
163.0
|
|
|||||
|
Other current assets
|
(2.7
|
)
|
(1.2
|
)
|
13.1
|
|
|||||
|
Accounts payable
|
4.3
|
|
145.0
|
|
(109.6
|
)
|
|||||
|
Other current liabilities
|
7.3
|
|
27.0
|
|
(78.8
|
)
|
|||||
|
Net cash provided by operating activities — continuing operations
|
155.2
|
|
63.1
|
|
188.0
|
|
|||||
|
Net cash used for operating activities — discontinued operations
|
—
|
|
—
|
|
(31.0
|
)
|
|||||
|
Net cash provided by operating activities
|
155.2
|
|
63.1
|
|
157.0
|
|
|||||
|
Investing Activities
|
|
|
|
||||||||
|
Expenditures for property, plant and equipment
|
(36.7
|
)
|
(26.3
|
)
|
(33.5
|
)
|
|||||
|
Proceeds from the sale of assets
|
3.9
|
|
18.9
|
|
20.7
|
|
|||||
|
Proceeds from the sale of businesses
|
—
|
|
3.0
|
|
—
|
|
|||||
|
Other
|
0.1
|
|
(1.4
|
)
|
(5.1
|
)
|
|||||
|
Net cash used for investing activities — continuing operations
|
(32.7
|
)
|
(5.8
|
)
|
(17.9
|
)
|
|||||
|
Net cash provided by investing activities — discontinued operations
|
—
|
|
—
|
|
41.0
|
|
|||||
|
Net cash provided by (used for) investing activities
|
(32.7
|
)
|
(5.8
|
)
|
23.1
|
|
|||||
|
Financing Activities
|
|
|
|
||||||||
|
Additions to long-term debt
|
16.6
|
|
17.0
|
|
13.0
|
|
|||||
|
Reductions of long-term debt
|
(90.8
|
)
|
(46.2
|
)
|
(61.5
|
)
|
|||||
|
Net additions to revolving credit agreements
|
53.3
|
|
6.8
|
|
2.6
|
|
|||||
|
Cash dividends paid
|
(17.8
|
)
|
(17.4
|
)
|
(17.1
|
)
|
|||||
|
Purchase of treasury shares
|
(2.1
|
)
|
—
|
|
—
|
|
|||||
|
Financing fees paid
|
(0.8
|
)
|
(3.5
|
)
|
(1.1
|
)
|
|||||
|
Other
|
(0.4
|
)
|
—
|
|
—
|
|
|||||
|
Net cash used for financing activities
|
(42.0
|
)
|
(43.3
|
)
|
(64.1
|
)
|
|||||
|
Effect of exchange rate changes on cash
|
(3.8
|
)
|
(8.3
|
)
|
2.0
|
|
|||||
|
Cash and Cash Equivalents
|
|
|
|
||||||||
|
Increase for the year
|
76.7
|
|
5.7
|
|
118.0
|
|
|||||
|
Balance at the beginning of the year
|
261.9
|
|
256.2
|
|
138.2
|
|
|||||
|
Balance at the end of the year
|
$
|
338.6
|
|
$
|
261.9
|
|
$
|
256.2
|
|
||
See Notes to Consolidated Financial Statements.
F-8
NACCO INDUSTRIES, INC. AND SUBSIDIARIES
CONSOLIDATED STATEMENTS OF EQUITY
|
|
Year Ended December 31
|
||||||||||
|
|
2011
|
2010
|
2009
|
||||||||
|
|
(In millions, except per share data)
|
||||||||||
|
Stockholders’ Equity:
|
|
|
|
||||||||
|
Class A Common Stock
|
|||||||||||
|
Beginning balance
|
$
|
6.8
|
|
$
|
6.7
|
|
$
|
6.7
|
|
||
|
Stock-based compensation
|
—
|
|
0.1
|
|
—
|
|
|||||
|
6.8
|
|
6.8
|
|
6.7
|
|
||||||
|
Class B Common Stock
|
1.6
|
|
1.6
|
|
1.6
|
|
|||||
|
Capital in Excess of Par Value
|
|
|
|
||||||||
|
Beginning balance
|
22.6
|
|
16.1
|
|
14.4
|
|
|||||
|
Stock-based compensation
|
1.7
|
|
6.4
|
|
1.8
|
|
|||||
|
Shares issued under stock compensation plans
|
0.5
|
|
0.5
|
|
0.3
|
|
|||||
|
Purchase of treasury shares
|
(2.1
|
)
|
—
|
|
—
|
|
|||||
|
Noncontrolling interest share of contributions to joint venture
|
—
|
|
(0.4
|
)
|
(0.4
|
)
|
|||||
|
|
22.7
|
|
22.6
|
|
16.1
|
|
|||||
|
Retained Earnings
|
|
|
|
||||||||
|
Beginning balance
|
475.4
|
|
413.3
|
|
399.3
|
|
|||||
|
Net income attributable to stockholders
|
162.1
|
|
79.5
|
|
31.1
|
|
|||||
|
Cash dividends on Class A and Class B common stock:
|
|
|
|
||||||||
|
2011: $2.1200 per share
|
(17.8
|
)
|
—
|
|
—
|
|
|||||
|
2010: $2.0850 per share
|
—
|
|
(17.4
|
)
|
—
|
|
|||||
|
2009: $2.0675 per share
|
—
|
|
—
|
|
(17.1
|
)
|
|||||
|
|
619.7
|
|
475.4
|
|
413.3
|
|
|||||
|
Accumulated Other Comprehensive Income (Loss)
|
|
|
|
||||||||
|
Beginning balance
|
(59.0
|
)
|
(41.1
|
)
|
(65.3
|
)
|
|||||
|
Foreign currency translation adjustment
|
(14.9
|
)
|
0.4
|
|
17.4
|
|
|||||
|
Sale of certain NMHG operations
|
—
|
|
(7.1
|
)
|
—
|
|
|||||
|
Current period cash flow hedging activity
|
2.4
|
|
(3.7
|
)
|
8.7
|
|
|||||
|
Reclassification of hedging activities into earnings
|
9.2
|
|
(8.8
|
)
|
3.9
|
|
|||||
|
Pension and postretirement plan adjustment
|
(19.0
|
)
|
(3.8
|
)
|
(9.9
|
)
|
|||||
|
Reclassification of pension and postretirement activities into earnings
|
6.7
|
|
5.1
|
|
4.1
|
|
|||||
|
|
(74.6
|
)
|
(59.0
|
)
|
(41.1
|
)
|
|||||
|
Total Stockholders’ Equity
|
576.2
|
|
447.4
|
|
396.6
|
|
|||||
|
Noncontrolling Interest
|
|
|
|
||||||||
|
Beginning balance
|
0.8
|
|
0.5
|
|
0.2
|
|
|||||
|
Net income
|
—
|
|
(0.1
|
)
|
(0.1
|
)
|
|||||
|
Noncontrolling interest share of contributions to joint venture
|
—
|
|
0.4
|
|
0.4
|
|
|||||
|
Total Noncontrolling Interest
|
0.8
|
|
0.8
|
|
0.5
|
|
|||||
|
Total Equity
|
$
|
577.0
|
|
$
|
448.2
|
|
$
|
397.1
|
|
||
See Notes to Consolidated Financial Statements.
F-9
NOTES TO CONSOLIDATED FINANCIAL STATEMENTS
NACCO INDUSTRIES, INC. AND SUBSIDIARIES
(Tabular Amounts in Millions, Except Per Share and Percentage Data)
The Consolidated Financial Statements include the accounts of NACCO Industries, Inc. (the parent company or “NACCO”) and its wholly owned subsidiaries (“NACCO Industries, Inc. and Subsidiaries” or the “Company”). Intercompany accounts and transactions are eliminated in consolidation. Also included is Shanghai Hyster Forklift Ltd., a 75% owned joint venture of NMHG Holding Co. (“NMHG”) in China. The Company's subsidiaries operate in the following principal industries: lift trucks, small appliances, specialty retail and mining. The Company manages its subsidiaries primarily by industry.
NMHG designs, engineers, manufactures, sells and services a comprehensive line of lift trucks and aftermarket parts marketed globally primarily under the Hyster
®
and Yale
®
brand names, mainly to independent Hyster
®
and Yale
®
retail dealerships. Lift trucks and component parts are manufactured in the United States, Northern Ireland, Mexico, The Netherlands, the Philippines, Italy, Japan, Vietnam, Brazil and China. The sale of service parts represents approximately 13%, 17% and 18% of total NMHG revenues as reported for
2011
,
2010
and
2009
, respectively. Hamilton Beach Brands, Inc. (“HBB”) is a leading designer, marketer and distributor of small electric household appliances, as well as commercial products for restaurants, bars and hotels. The Kitchen Collection, LLC (“KC”) is a national specialty retailer of kitchenware and gourmet foods operating under the Kitchen Collection
®
and Le Gourmet Chef
®
store names in outlet and traditional malls throughout the United States. The North American Coal Corporation and its affiliated coal companies (collectively, “NACoal”) mine and market coal primarily as fuel for power generation and provide selected value-added mining services for other natural resources companies.
Nine of NACoal's wholly owned subsidiaries each meet the definition of a variable interest entity: The Coteau Properties Company ("Coteau"); The Falkirk Mining Company ("Falkirk"); The Sabine Mining Company ("Sabine" and collectively with Coteau and Falkirk, the "project mining subsidiaries"); Demery Resources Company, LLC (“Demery”); Caddo Creek Resources Company, LLC (“Caddo Creek”); Camino Real Fuels, LLC (“Camino Real”); Liberty Fuels Company, LLC (“Liberty”); NoDak Energy Services, LLC ("NoDak"); and North American Coal Corporation India Private Limited ("NACC India"). The project mining subsidiaries were developed between 1974 and 1981 and operate lignite coal mines under long-term contracts with various utility customers. These project mining subsidiaries are capitalized primarily with debt financing, which the utility customers have arranged and guaranteed. The obligations of the project mining subsidiaries are without recourse to NACCO and NACoal. Demery, Caddo Creek, Camino Real, Liberty and NoDak were formed during 2008 and 2009. NACC India was formed during 2011. Demery, Caddo Creek, Camino Real and Liberty (collectively with the project mining subsidiaries, the "unconsolidated mines") were formed to develop, construct and operate surface mines under long-term contracts. NoDak was formed to operate and maintain a coal processing facility. NACC India was formed to provide technical advisory services to the third-party owners of a coal mine in India. The contracts with the unconsolidated operations' customers provide for reimbursement at a price based on actual costs plus an agreed pre-tax profit per ton of coal sold or actual costs plus a management fee. Although NACoal owns 100% of the equity and manages the daily operations of these entities, the Company has determined that the equity capital provided by NACoal is not sufficient to adequately finance the ongoing activities or absorb any expected losses without additional support from the customers. The customers have a controlling financial interest and have the power to direct the activities that most significantly affect the economic performance of the entities. As a result, NACoal is not the primary beneficiary and therefore does not consolidate these entities' financial position or results of operations. The taxes resulting from the earnings of the unconsolidated mines and NoDak are solely the responsibility of the Company. The pre-tax income from the seven unconsolidated mines is reported on the line “Earnings of unconsolidated mines” in the Consolidated Statements of Operations, with related taxes included in the provision for income taxes. The Company has included the pre-tax earnings of the unconsolidated mines above operating profit as they are an integral component of the Company's business and operating results. The pre-tax income from NoDak is reported on the line "Other" in the "Other (income) expense" section of the Consolidated Statement of Operations, with the related income taxes included in the provision for income taxes. The net income from NACC India is reported on the line "Other" in the "Other (income) expense" section of the Consolidated Statements of Operations. The unconsolidated mines are accounted for under the equity method. See Note 22 for further discussion.
Investments in Sumitomo-NACCO Materials Handling Company, Ltd. (“SN”), a 50% owned joint venture, and NMHG Financial Services, Inc. (“NFS”), a 20% owned joint venture, are also accounted for by the equity method. SN operates manufacturing facilities in Japan, the Philippines and Vietnam from which NMHG purchases certain components and internal combustion lift trucks. Sumitomo Heavy Industries, Ltd. owns the remaining 50% interest in SN. Each shareholder of SN is entitled to appoint directors representing 50% of the vote of SN's board of directors. All matters related to policies and programs of operation, manufacturing and sales activities require mutual agreement between NMHG and Sumitomo Heavy Industries, Ltd. prior to a vote of SN's board of directors. NFS is a joint venture with General Electric Capital Corporation
F-10
NOTES TO CONSOLIDATED FINANCIAL STATEMENTS
NACCO INDUSTRIES, INC. AND SUBSIDIARIES
(Tabular Amounts in Millions, Except Per Share and Percentage Data)
(“GECC”), formed primarily for the purpose of providing financial services to independent Hyster
®
and Yale
®
lift truck dealers and National Account customers in the United States. National Account customers are large customers with centralized purchasing and geographically dispersed operations in multiple dealer territories. See Note 22 for further discussion.
Use of Estimates:
The preparation of financial statements in conformity with U.S. generally accepted accounting principles requires management to make estimates and judgments. These estimates and judgments affect the reported amounts of assets and liabilities and the disclosure of contingent assets and liabilities (if any) at the date of the financial statements and the reported amounts of revenues and expenses during the reporting period. Actual results could differ from those estimates.
Cash and Cash Equivalents:
Cash and cash equivalents include cash in banks and highly liquid investments with original maturities of three months or less.
Accounts Receivable, Net of Allowances:
Allowances for doubtful accounts are maintained against accounts receivable for estimated losses resulting from the inability of customers to make required payments. These allowances are based on both recent trends of certain customers estimated to be a greater credit risk as well as general trends of the entire customer pool. Accounts are written off against the allowance when it becomes evident collection will not occur.
Inventories:
Inventories are stated at the lower of cost or market. Cost is determined under the last-in, first-out (“LIFO”) method primarily for manufactured inventories in the United States. The weighted average method is used for coal inventory. KC retail inventories are stated at the lower of cost or market using the retail inventory method. The first-in, first-out (“FIFO”) method is used with respect to all other inventories. Reserves are maintained for estimated obsolescence or excess inventory equal to the difference between the cost of inventory and the estimated market value based upon assumptions about future demand and market conditions. Upon a subsequent sale or disposal of the impaired inventory, the corresponding reserve for impaired value is relieved to ensure that the cost basis of the inventory reflects any write-downs.
Property, Plant and Equipment, Net:
Property, plant and equipment are recorded at cost. Depreciation, depletion and amortization are provided in amounts sufficient to amortize the cost of the assets, including assets recorded under capital leases, over their estimated useful lives using the straight-line method. Buildings are depreciated using a 20, 40 or 50-year life or, at NACoal, over the life of the mine, which is 30 years. Estimated lives for machinery and equipment range from three to 15 years and for building improvements from four to 40 years. The units-of-production method is used to amortize certain tooling for sourced products and certain coal-related assets based on estimated recoverable tonnages. Capital grants received for the acquisition of equipment are recorded as reductions of the related equipment cost and reduce future depreciation expense. Repairs and maintenance costs are generally expensed when incurred. Asset retirement costs associated with asset retirement obligations are capitalized with the carrying amount of the related long-lived asset and depreciated over the asset's estimated useful life.
Long-Lived Assets:
The Company periodically evaluates long-lived assets for impairment when changes in circumstances or the occurrence of certain events indicate the carrying amount of an asset may not be recoverable. Upon identification of indicators of impairment, the Company evaluates the carrying value of the asset by comparing the estimated future undiscounted cash flows generated from the use of the asset and its eventual disposition with the asset's net carrying value. If the carrying value of an asset is considered impaired, an impairment charge is recorded for the amount that the carrying value of the long-lived asset exceeds its fair value. Fair value is estimated as the price that would be received to sell an asset or paid to transfer a liability in an orderly transaction between market participants at the measurement date.
Coal Supply Agreement and Other Intangibles, Net:
The coal supply agreement represents a long-term supply agreement with NACoal's customer and is recorded based on the fair value at the date of acquisition. This intangible asset is being amortized based on units of production over the life of the agreement, which is 30 years. The Company reviews identified intangible assets for impairment when changes in circumstances or the occurrence of certain events indicate potential impairment.
Restructuring Reserves:
Restructuring reserves reflect estimates related to employee-related costs, lease termination costs and other exit costs. Lease termination costs include remaining payments due under existing lease agreements after the cease-use date, less estimated sublease income and any lease termination fees. Other costs include costs to move equipment and costs incurred to close a facility. Actual costs could differ from management estimates, resulting in additional expense or the reversal of previously recorded expenses.
F-11
NOTES TO CONSOLIDATED FINANCIAL STATEMENTS
NACCO INDUSTRIES, INC. AND SUBSIDIARIES
(Tabular Amounts in Millions, Except Per Share and Percentage Data)
Self-insurance Liabilities:
The Company is generally self-insured for product liability, environmental liability, medical, certain workers’ compensation claims and certain closed mine liabilities. For product liability, catastrophic insurance coverage is retained for potentially significant individual claims. An estimated provision for claims reported and for claims incurred but not yet reported under the self-insurance programs is recorded and revised periodically based on industry trends, historical experience and management judgment. In addition, industry trends are considered within management's judgment for valuing claims. Changes in assumptions for such matters as legal judgments and settlements, inflation rates, medical costs and actual experience could cause estimates to change in the near term.
Revenue Recognition:
Revenues are generally recognized when title transfers and risk of loss passes as customer orders are completed and shipped. For NMHG's National Account customers, revenue is recognized upon customer acceptance. Under its mining contracts, the Company recognizes revenue as the coal or limerock is delivered.
Products generally are not sold with the right of return. However, based on the Company's historical experience, a portion of products sold is estimated to be returned due to reasons such as buyer remorse, duplicate gifts received, product failure and excess inventory stocked by the customer, which, subject to certain terms and conditions, the Company will agree to accept. The Company records estimated reductions to revenues at the time of the sale based upon this historical experience and the limited right of return provided to the Company's customers.
The Company also records estimated reductions to revenues for customer programs and incentive offerings, including special pricing agreements, price competition, promotions and other volume-based incentives. At NMHG, lift truck sales revenue is recorded net of estimated discounts. The estimated discount amount is based upon historical trends for each lift truck model. In addition to standard discounts, dealers can also request additional discounts that allow them to offer price concessions to customers. From time to time, NMHG offers special incentives to increase retail share or dealer stock and offers certain
customers volume rebates if a specified cumulative level of purchases is obtained. At HBB, net sales represent gross sales less cooperative advertising, other volume-based incentives, estimated returns and allowances for defective products. At KC, retail markdowns are incorporated into KC's retail method of accounting for cost of sales. Additionally, the Company provides for the estimated cost of product warranties at the time revenues are recognized.
Advertising Costs:
Advertising costs, except for direct response advertising, are expensed as incurred. Total advertising expense was $23.8 million, $16.2 million and $15.6 million in
2011
,
2010
and
2009
, respectively. Included in these advertising costs are amounts related to cooperative advertising programs at HBB that are recorded as a reduction of sales in the Consolidated Statements of Operations as related revenues are recognized. Direct response advertising, which consists primarily of costs to produce television commercials for HBB products, is capitalized and amortized over the expected period of future benefits. No assets related to direct response advertising were capitalized at
December 31, 2011
or
2010
.
Product Development Costs:
Expenses associated with the development of new products and changes to existing products are charged to expense as incurred. These costs amounted to $68.7 million, $56.2 million and $50.4 million in
2011
,
2010
and
2009
, respectively.
Shipping and Handling Costs:
Shipping and handling costs billed to customers are recognized as revenue and shipping and handling costs incurred by the Company are included in cost of sales.
Taxes Collected from Customers and Remitted to Governmental Authorities:
The Company collects various taxes and fees as an agent in connection with the sale of products and remits these amounts to the respective taxing authorities. These taxes and fees have been presented on a net basis in the Consolidated Statements of Operations and are recorded as a liability until remitted to the respective taxing authority.
Stock Compensation:
The Company maintains long-term incentive programs at all of its subsidiaries. The parent company has stock compensation plans for a limited number of executives that allows the grant of shares of Class A common stock, subject to restrictions, as a means of retaining and rewarding them for long-term performance and to increase ownership in the Company. Shares awarded under the plans are fully vested and entitle the stockholder to all rights of common stock ownership except that shares may not be assigned, pledged or otherwise transferred during the restriction period. In general, the restriction period ends at the earliest of (i) five years after the participant's retirement date, (ii) ten years from the award date, or (iii) the participant's death or permanent disability. Pursuant to the plans, the Company issued 18,805 and 58,747 shares related to the years ended
December 31, 2011
and
2010
, respectively. After the issuance of these shares, there were 304,881 shares of Class A common stock available for issuance under these plans. Compensation expense related to these share awards was $1.7 million ($1.1 million net of tax), $6.5 million ($4.2 million net of tax) and $1.8 million ($1.2 million net of tax) for the years ended
December 31, 2011
,
2010
and
2009
, respectively. Compensation expense represents fair value based on the market price of the shares of Class A common stock at the grant date.
F-12
NOTES TO CONSOLIDATED FINANCIAL STATEMENTS
NACCO INDUSTRIES, INC. AND SUBSIDIARIES
(Tabular Amounts in Millions, Except Per Share and Percentage Data)
The Company also has a stock compensation plan for non-employee directors of the Company under which a portion of the non-employee directors’ annual retainer is paid in restricted shares of Class A common stock. For the year ended
December 31, 2011
, $49,500 of the non-employee directors’ annual retainer of $90,000 was paid in restricted shares of Class A common stock. For the year ended
December 31, 2010
, $29,250 of the non-employee directors’ annual retainer of $53,626 was paid in restricted shares of Class A common stock. For the year ended
December 31, 2009
, $27,000 of the non-employee directors’ annual retainer of $49,500 was paid in restricted shares of Class A common stock. Shares awarded under the plan are fully vested and entitle the stockholder to all rights of common stock ownership except that shares may not be assigned, pledged or otherwise transferred during the restriction period. In general, the restriction period ends at the earliest of (i) ten years from the award date, (ii) the date of the director's death or permanent disability, (iii) five years (or earlier with the approval of the Board of Directors) after the director's date of retirement from the Board of Directors, or (iv) the date of the participant's retirement from the Board of Directors and the director has reached 70 years of age. Pursuant to this plan, the Company issued 4,938, 3,039 and 6,066 shares related to the years ended
December 31, 2011
,
2010
and
2009
, respectively. In addition to the mandatory retainer fee received in restricted stock, directors may elect to receive shares of Class A common stock in lieu of cash for up to 100% of the balance of their annual retainer, meeting attendance fees, committee retainer and any committee chairman's fees. These voluntary shares are not subject to any restrictions. Total shares issued under voluntary elections were 1,356 in 2011, 944 in 2010, and 1,792 in 2009. After the issuance of these shares, there were 94,749 shares of Class A common stock available for issuance under this plan. Compensation expense related to these awards was $0.5 million ($0.3 million net of tax), $0.3 million ($0.2 million net of tax) and $0.3 million ($0.2 million net of tax) for the years ended
December 31, 2011
,
2010
and
2009
, respectively. Compensation expense represents fair value based on the market price of the shares of Class A common stock at the grant date.
Foreign Currency:
Assets and liabilities of foreign operations are translated into U.S. dollars at the fiscal year-end exchange rate. The related translation adjustments are recorded as a separate component of stockholders’ equity, except for NMHG's Mexican operations. The U.S. dollar is considered the functional currency for NMHG's Mexican operations and, therefore, the effect of translating assets and liabilities from the Mexican peso to the U.S. dollar is recorded in results of operations. Revenues and expenses of all foreign operations are translated using average monthly exchange rates prevailing during the year.
During 2010, NMHG sold certain of its operations in Australia and Europe, which resulted in the release of the accumulated foreign currency translation adjustment of $7.1 million.
Financial Instruments and Derivative Financial Instruments:
Financial instruments held by the Company include cash and cash equivalents, accounts receivable, accounts payable, revolving credit agreements, long-term debt, interest rate swap agreements and forward foreign currency exchange contracts. The Company does not hold or issue financial instruments or derivative financial instruments for trading purposes.
The Company uses forward foreign currency exchange contracts to partially reduce risks related to transactions denominated in foreign currencies. The Company offsets fair value amounts related to foreign currency exchange contracts executed with the same counterparty. These contracts hedge firm commitments and forecasted transactions relating to cash flows associated with sales and purchases denominated in currencies other than the subsidiaries’ functional currencies. Changes in the fair value of forward foreign currency exchange contracts that are effective as hedges are recorded in accumulated other comprehensive income (loss) (“OCI”). Deferred gains or losses are reclassified from OCI to the Consolidated Statement of Operations in the same period as the gains or losses from the underlying transactions are recorded and are generally recognized in cost of sales. The ineffective portion of derivatives that are classified as hedges is immediately recognized in earnings and generally recognized in cost of sales.
The Company uses interest rate swap agreements to partially reduce risks related to floating rate financing agreements that are subject to changes in the market rate of interest. Terms of the interest rate swap agreements require the Company to receive a variable interest rate and pay a fixed interest rate. The Company's interest rate swap agreements and its variable rate financings are predominately based upon the three-month and six-month LIBOR (London Interbank Offered Rate). Changes in the fair value of interest rate swap agreements that are effective as hedges are recorded in OCI. Deferred gains or losses are reclassified from OCI to the Consolidated Statement of Operations in the same period as the gains or losses from the underlying transactions are recorded and are generally recognized in interest expense. The ineffective portion of derivatives that are classified as hedges is immediately recognized in earnings and included on the line “Other” in the “Other income (expense)” section of the Consolidated Statements of Operations.
Interest rate swap agreements and forward foreign currency exchange contracts held by the Company have been designated as hedges of forecasted cash flows. The Company does not currently hold any nonderivative instruments designated as hedges or any derivatives designated as fair value hedges.
F-13
NOTES TO CONSOLIDATED FINANCIAL STATEMENTS
NACCO INDUSTRIES, INC. AND SUBSIDIARIES
(Tabular Amounts in Millions, Except Per Share and Percentage Data)
The Company periodically enters into foreign currency exchange contracts that do not meet the criteria for hedge accounting. These derivatives are used to reduce the Company's exposure to foreign currency risk related to forecasted purchase or sales transactions or forecasted intercompany cash payments or settlements. Gains and losses on these derivatives are included on the line “Other” in the “Other income (expense)” section of the Consolidated Statements of Operations.
Cash flows from hedging activities are reported in the Consolidated Statements of Cash Flows in the same classification as the hedged item, generally as a component of cash flows from operations.
See Note 11 for further discussion of derivative financial instruments.
Recently Issued Accounting Standards
Accounting Standards Adopted in
2011
:
On January 1, 2011, the Company adopted authoritative guidance issued by the Financial Accounting Standards Board ("FASB") on multiple-deliverable revenue arrangements. The guidance amends the criteria for separating consideration in multiple-deliverable arrangements. This guidance establishes a selling price hierarchy for determining the selling price of a deliverable, which is based on: (a) vendor-specific objective evidence; (b) third-party evidence; or (c) estimates. This guidance also eliminates the residual method of allocation and requires that arrangement consideration be allocated at the inception of the arrangement to all deliverables using the relative selling price method. In addition, this guidance significantly expands required disclosures related to a vendor's multiple-deliverable revenue arrangements. The adoption of the guidance did not have a material effect on the Company's financial position, results of operations, cash flows or related disclosures.
Accounting Standards Adopted in
2010
:
On January 1, 2010, the Company adopted authoritative guidance issued by the FASB for accounting for transfers of financial assets. The guidance requires more information about transfers of financial assets, including securitization transactions, and where entities have continuing exposure to the risks related to transferred financial assets. The guidance eliminates the concept of a “qualifying special-purpose entity” and changes the requirements for derecognizing financial assets. The guidance also requires enhanced disclosures to provide financial statement users with greater transparency about transfers of financial assets and a transferor's continuing involvement with transferred financial assets. The adoption of the guidance did not have a material effect on the Company's financial position, results of operations, cash flows or related disclosures.
On January 1, 2010, the Company adopted authoritative guidance issued by the FASB on the consolidation of variable interest entities. The guidance changes how a reporting entity determines when an entity that is insufficiently capitalized or is not controlled through voting (or similar rights) should be consolidated. The guidance requires an ongoing assessment of whether an entity is the primary beneficiary of a variable interest entity and eliminates the quantitative approach previously required for determining the primary beneficiary of a variable interest entity. The guidance also requires additional disclosures regarding a company's involvement with variable interest entities, any significant changes in risk exposure due to that involvement and how the company's involvement with a variable interest entity affects the company's financial statements. The adoption of the guidance did not have a material effect on the Company's financial position, results of operations, cash flows or related disclosures.
On December 31, 2010, the Company adopted authoritative guidance issued by the FASB on disclosures about the credit quality of financing receivables and the allowance for credit losses. The guidance requires additional disclosures that facilitate financial statement users' evaluation of: (a) the nature of credit risk inherent in the entity's portfolio of financing receivables; (b) how that risk is analyzed and assessed in arriving at the allowance for credit losses; and (c) the changes and reasons for those changes in the allowance for credit losses. In addition, the guidance amends current requirements to include additional disclosures about financing receivables, including: (a) credit quality indicators of financing receivables at the end of the reporting period by class of financing receivables; (b) the aging of past due financing receivables at the end of the reporting period by class of financing receivables; and (c) the nature and extent of troubled debt restructurings that occurred during the period by class of financing receivables and their effect on the allowance for credit losses. The adoption of the guidance did not have a material effect on the Company's financial position, results of operations, cash flows or related disclosures.
F-14
NOTES TO CONSOLIDATED FINANCIAL STATEMENTS
NACCO INDUSTRIES, INC. AND SUBSIDIARIES
(Tabular Amounts in Millions, Except Per Share and Percentage Data)
Accounting Standards Not Yet Adopted:
In May 2011, the FASB issued authoritative guidance on fair value measurement, which is effective for the Company on January 1, 2012. The guidance resulted in a consistent definition of fair value and common requirements for measurement of and disclosure about fair value between U.S. generally accepted accounting principles and International Financial Reporting Standards. The Company does not expect the adoption of the guidance to have a material effect on its financial position, results of operations, cash flows or related disclosures.
In June 2011, the FASB issued authoritative guidance on the presentation of comprehensive income, which is effective for the Company on January 1, 2012. The guidance provides an entity with the option to present the total of comprehensive income, the components of net income and the components of other comprehensive income either in a single continuous statement of comprehensive income or in two separate but consecutive statements. In both choices, an entity is required to present each component of net income along with total net income, each component of other comprehensive income along with a total for other comprehensive income and a total amount for comprehensive income. The guidance eliminates the option to present the components of other comprehensive income as part of the statement of changes in equity. In December 2011, the FASB issued additional authoritative guidance, which is also effective for the Company on January 1, 2012, deferring the adoption of certain provisions requiring the presentation of the effects of reclassifications out of accumulated other comprehensive income on the components of net income and other comprehensive income on the face of the financial statements. The Company does not expect the adoption of the guidance to have a material effect on its financial position, results of operations, cash flows or related disclosures.
In December 2011, the FASB issued authoritative guidance on the offsetting of assets and liabilities, which is effective for the Company on January 1, 2013. The guidance requires additional disclosures regarding offsetting arrangements of balance sheet derivatives to enable financial statement users to understand the effect of these arrangements on a company's financial position. The Company is currently evaluating the effect the adoption of the guidance will have on its disclosures.
Reclassifications:
Certain amounts in the prior periods’ Consolidated Financial Statements have been reclassified to conform to the current period's presentation.
During 2009, NMHG's management approved a plan to close its facility in Modena, Italy and consolidate its activities into NMHG's facility in Masate, Italy. These actions were taken to further reduce NMHG's manufacturing capacity to more appropriate levels. As a result, NMHG recognized a charge of approximately $5.6 million during 2009, which is classified in the Consolidated Statement of Operations on the line “Restructuring charges (reversals).” Of this amount, $5.3 million related to severance and $0.3 million related to lease impairment. During 2010, $1.9 million of the accrual was reversed as a result of a reduction in the expected amount to be paid to former employees due to the finalization of an agreement with the Italian government. Severance payments of $0.5 million were made during 2011.
Payments of $1.4 million and $0.3 million were made for severance and lease termination, respectively, during 2010. Severance payments of $0.3 million were made during 2009. Payments related to this restructuring program are expected to continue through 2012. No further charges related to this plan are expected.
During 2008 and 2009, based on the decline in economic conditions, NMHG's management reduced its number of employees worldwide. As a result, NMHG recognized a charge of approximately $6.3 million in 2008 and $3.4 million in 2009 related to severance, which is classified in the Consolidated Statement of Operations on the line “Restructuring charges (reversals).” In addition, $1.1 million of the accrual was reversed during 2009 as a result of a reduction in the expected amount paid to employees. Severance payments of $0.5 million, $1.5 million and $4.4 million were made during
2011
,
2010
and
2009
, respectively. Payments are expected to continue through 2012. No further charges related to this plan are expected.
During 2009, NMHG's management approved a plan for a reduction in the number of employees in Asia-Pacific due to the sale of certain assets of NMHG's fleet services business and wholly owned Hyster
®
retail dealerships in Australia. As a result, NMHG recognized a charge of approximately $2.7 million during 2009, which is classified in the Consolidated Statement of Operations on the line “Restructuring charges (reversals).” Of this amount, $2.1 million related to severance, $0.5 million related to lease termination costs and $0.1 million related to other costs of the restructuring. In addition, $0.8 million of the severance accrual was reversed during 2009 as a result of a reduction in the expected number of employees receiving severance payments. Payments of $0.1 million, $0.4 million and $0.1 million were made for severance, lease termination and other costs,
F-15
NOTES TO CONSOLIDATED FINANCIAL STATEMENTS
NACCO INDUSTRIES, INC. AND SUBSIDIARIES
(Tabular Amounts in Millions, Except Per Share and Percentage Data)
respectively, during 2010. Payments of $1.4 million were made for severance during 2009. No further charges or payments related to this plan are expected.
During 2007, NMHG's Board of Directors approved a plan to phase out production at its facility in Irvine, Scotland by early 2009, change the product mix at its Craigavon, Northern Ireland facility and increase production at its Berea, Kentucky and Sulligent, Alabama plants in the United States and at its Ramos Arizpe facility in Mexico. As a result, NMHG recognized a charge of approximately $5.5 million in 2007. Of this amount, $5.2 million related to severance and $0.3 million related to other costs of the restructuring. During 2008, NMHG recognized an additional charge of $3.2 million. Of this amount, $2.2 million related to severance and $1.0 million related to other costs of the restructuring. In addition, $0.4 million of the amount previously accrued for severance was reversed in 2008, as a result of a reduction in the estimate of employees eligible to receive severance payments. During 2009, $0.5 million of the amount previously accrued for severance was reversed, which is classified in the Consolidated Statement of Operations on the line “Restructuring charges (reversals),” as a result of lower than estimated severance benefits paid to fewer than estimated employees. Payments of $4.5 million were made for severance during 2009. No further charges or payments related to this plan are expected.
Following is the detail of the cash charges related to the NMHG programs:
|
|
Total charges
expected to be
incurred
|
Charges
incurred prior to
2009
|
Charges
incurred in
2009
|
|
Reversals incurred in
2010
|
|
|||||||||
|
NMHG Americas
|
|
|
|
||||||||||||
|
Severance
|
$
|
3.3
|
|
$
|
2.8
|
|
$
|
0.5
|
|
$
|
—
|
|
|||
|
Other
|
1.3
|
|
1.3
|
|
—
|
|
—
|
|
|||||||
|
|
4.6
|
|
4.1
|
|
0.5
|
|
—
|
|
|||||||
|
NMHG Europe
|
|
|
|
|
|
|
|
|
|||||||
|
Severance
|
14.1
|
|
9.8
|
|
6.2
|
|
(1.9
|
)
|
|||||||
|
Lease impairment
|
0.3
|
|
—
|
|
0.3
|
|
—
|
|
|||||||
|
14.4
|
|
9.8
|
|
6.5
|
|
(1.9
|
)
|
||||||||
|
NMHG Other
|
|||||||||||||||
|
Severance
|
2.4
|
|
0.7
|
|
1.7
|
|
—
|
|
|||||||
|
Lease impairment
|
0.5
|
|
—
|
|
0.5
|
|
—
|
|
|||||||
|
Other
|
0.1
|
|
—
|
|
0.1
|
|
—
|
|
|||||||
|
3.0
|
|
0.7
|
|
2.3
|
|
—
|
|
||||||||
|
Total charges (reversals)
|
$
|
22.0
|
|
$
|
14.6
|
|
$
|
9.3
|
|
$
|
(1.9
|
)
|
|||
Following is the activity related to the liability for the NMHG programs. Amounts for severance expected to be paid within one year are included on the line “Accrued Payroll” and amounts for severance expected to be paid after one year are included on the line “Other Long-term Liabilities” in the Consolidated Balance Sheets. Amounts for lease impairment and other are included in “Other current liabilities” in the Consolidated Balance Sheets.
|
|
Severance
|
Lease
Impairment
|
Other
|
Total
|
|||||||||||
|
Balance at January 1, 2010
|
$
|
7.9
|
|
$
|
0.8
|
|
$
|
0.1
|
|
$
|
8.8
|
|
|||
|
Reversal
|
(1.9
|
)
|
—
|
|
—
|
|
(1.9
|
)
|
|||||||
|
Payments
|
(3.0
|
)
|
(0.7
|
)
|
(0.1
|
)
|
(3.8
|
)
|
|||||||
|
Foreign currency effect
|
(0.6
|
)
|
(0.1
|
)
|
—
|
|
(0.7
|
)
|
|||||||
|
Balance at December 31, 2010
|
2.4
|
|
—
|
|
—
|
|
2.4
|
|
|||||||
|
Payments
|
(1.0
|
)
|
—
|
|
—
|
|
(1.0
|
)
|
|||||||
|
Balance at December 31, 2011
|
$
|
1.4
|
|
$
|
—
|
|
$
|
—
|
|
$
|
1.4
|
|
|||
F-16
NOTES TO CONSOLIDATED FINANCIAL STATEMENTS
NACCO INDUSTRIES, INC. AND SUBSIDIARIES
(Tabular Amounts in Millions, Except Per Share and Percentage Data)
On December 29, 2009, NACoal completed the sale of certain assets of the Red River Mining Company (“Red River”). The financial position, results of operations and cash flows of Red River are reflected as discontinued operations in the accompanying Consolidated Financial Statements. Discontinued operations include revenue of Red River of $17.8 million for 2009. In addition, discontinued operations include income before taxes of Red River of $0.3 million for 2009. As a result of the sale, the Company recognized a gain of $35.8 million ($22.3 million after taxes of $13.5 million) in 2009 which is included in the Consolidated Statement of Operations on the line “Discontinued operations.” In addition, the Company received $41.4 million of cash proceeds related to the sale.
NACoal
: During 2010, NACoal received and recorded $7.6 million, which is included on the line “Revenues” in the Consolidated Statement of Operations, related to the reimbursement from Mississippi Power Company for previously recognized costs for pre-development activities. NACoal also received $3.5 million related to Mississippi Power Company's purchase of capitalized assets for activities related to obtaining a mining permit, which approximated NACoal's book value.
During 2010 and 2011, NACoal entered into agreements to sell $31.4 million of assets, which consist primarily of two draglines. The sales of the assets are expected to occur in 2012. As a result, these assets have been classified as held-for-sale in the Consolidated Balance Sheets at December 31, 2011 and 2010.
During 2010, NACoal sold the majority of the assets of its investment in Great American Energy for cash proceeds of $11.2 million, which is included on the line "Proceeds from the sale of assets" in the Consolidated Statement of Cash Flows.
NACoal's contract at San Miguel Lignite Mine (“San Miguel”) expired at the end of 2010. NACoal did not incur significant costs or recognize any impairment of assets as a result of the transition of the operations related to this contract during the last six months of 2010.
During 2009, NACoal received bonus payments of $7.1 million for the lease of certain oil and gas mineral rights to a third party, which is included on the line “(Gain) loss on sale of assets” in the Consolidated Statement of Operations.
NACCO and Other:
In 2006, the Company initiated litigation in the Delaware Chancery Court against Applica Incorporated ("Applica") and individuals and entities affiliated with Applica's shareholder, Harbinger Capital Partners Master Fund, Ltd. The litigation alleged a number of contract and tort claims against the defendants related to the failed transaction with Applica, which had been previously announced. On February 14, 2011, the parties to this litigation entered into a settlement agreement. The settlement agreement provided for, among other things, the payment of $60 million to the Company and dismissal of the lawsuit with prejudice. The payment was received in February 2011.
Litigation costs related to the failed transaction with Applica were $2.8 million, $18.8 million and $1.1 million in 2011, 2010 and 2009, respectively.
F-17
NOTES TO CONSOLIDATED FINANCIAL STATEMENTS
NACCO INDUSTRIES, INC. AND SUBSIDIARIES
(Tabular Amounts in Millions, Except Per Share and Percentage Data)
Inventories are summarized as follows:
|
|
December 31
|
||||||
|
|
2011
|
2010
|
|||||
|
Manufactured inventories:
|
|
|
|
||||
|
Finished goods and service parts - NMHG
|
$
|
160.3
|
|
|
$
|
152.6
|
|
|
Raw materials and work in process - NMHG
|
198.8
|
|
|
171.8
|
|
||
|
Total manufactured inventories
|
359.1
|
|
|
324.4
|
|
||
|
Sourced inventories - HBB
|
75.6
|
|
84.7
|
|
|||
|
Retail inventories - KC
|
61.5
|
|
|
59.3
|
|
||
|
Total inventories at FIFO
|
496.2
|
|
|
468.4
|
|
||
|
Coal - NACoal
|
13.1
|
|
10.9
|
|
|||
|
Mining supplies - NACoal
|
11.1
|
|
11.4
|
|
|||
|
Total inventories at weighted average
|
24.2
|
|
|
22.3
|
|
||
|
NMHG LIFO reserve
|
(50.1
|
)
|
(43.3
|
)
|
|||
|
|
$
|
470.3
|
|
|
$
|
447.4
|
|
The cost of certain manufactured inventories at NMHG, including service parts, has been determined using the LIFO method. At
December 31, 2011
and
2010
, 35% and 33%, respectively, of total inventories were determined using the LIFO method.
Property, plant and equipment, net includes the following:
|
|
December 31
|
||||||
|
|
2011
|
2010
|
|||||
|
Coal lands and real estate:
|
|
|
|||||
|
NMHG
|
$
|
17.1
|
|
$
|
17.1
|
|
|
|
HBB
|
0.2
|
|
0.2
|
|
|||
|
NACoal
|
36.7
|
|
35.0
|
|
|||
|
|
54.0
|
|
52.3
|
|
|||
|
Plant and equipment:
|
|
|
|||||
|
NMHG
|
493.1
|
|
495.9
|
|
|||
|
HBB
|
41.0
|
|
45.0
|
|
|||
|
KC
|
29.1
|
|
27.3
|
|
|||
|
NACoal
|
99.7
|
|
95.6
|
|
|||
|
NACCO and Other
|
6.5
|
|
6.5
|
|
|||
|
|
669.4
|
|
670.3
|
|
|||
|
Property, plant and equipment, at cost
|
723.4
|
|
722.6
|
|
|||
|
Less allowances for depreciation, depletion and amortization
|
469.1
|
|
452.2
|
|
|||
|
|
$
|
254.3
|
|
$
|
270.4
|
|
|
Total depreciation, depletion and amortization expense on property, plant and equipment was $45.6 million, $48.7 million and $50.7 million during
2011
,
2010
, and
2009
, respectively.
Proven and probable coal reserves, excluding the unconsolidated mines, approximated 1.3 billion tons (unaudited) and 1.1 billion tons (unaudited) at
December 31, 2011
and
2010
, respectively. These tons are reported on an as received by the customer basis and are the equivalent of “demonstrated reserves” under the coal resource classification system of the U.S. Geological Survey. Generally, these reserves would be commercially mineable at year-end prices and cost levels, using current technology and mining practices.
F-18
NOTES TO CONSOLIDATED FINANCIAL STATEMENTS
NACCO INDUSTRIES, INC. AND SUBSIDIARIES
(Tabular Amounts in Millions, Except Per Share and Percentage Data)
Intangible assets other than goodwill, which are subject to amortization, consist of the following:
|
|
Gross Carrying
Amount
|
Accumulated
Amortization
|
Net
Balance
|
||||||||
|
Balance at December 31, 2011
|
|
|
|
||||||||
|
Coal supply agreement
|
$
|
84.2
|
|
$
|
(26.3
|
)
|
$
|
57.9
|
|
||
|
Balance at December 31, 2010
|
|
|
|
||||||||
|
Coal supply agreement
|
$
|
84.2
|
|
$
|
(24.2
|
)
|
$
|
60.0
|
|
||
During 2010, NACoal finalized an agreement with Mississippi Power Company to provide lignite coal from its Liberty Mine to the Ratcliffe power plant currently being built in Mississippi. Upon the execution of this agreement, the Company determined that its intangible asset at the Mississippi Lignite Mining Company was impaired. Accordingly, the Company recorded an impairment charge of $0.7 million for other intangible assets at NACoal during 2010.
Amortization expense for intangible assets was $2.1 million, $3.5 million and $2.9 million in
2011
,
2010
and
2009
, respectively. Amortization expense for 2010 includes an impairment charge of $0.7 million for other intangible assets at NACoal.
Expected annual amortization expense of other intangible assets for the next five years is as follows: $2.7 million in
2012
, $2.4 million in
2013
and $2.7 million in
2014
,
2015
and
2016
, respectively. The amortization period for the coal supply agreement is 30 years.
NACoal's asset retirement obligations are principally for costs to dismantle certain mining equipment as well as for costs to close its surface mines and reclaim the land it has disturbed as a result of its normal mining activities. The Company determined the amounts of these obligations based on estimates adjusted for inflation, projected to the estimated closure dates, and then discounted using a credit-adjusted risk-free interest rate. The accretion of the liability is being recognized over the estimated life of each individual asset retirement obligation and is recorded in the line “Cost of sales” in the accompanying Consolidated Statements of Operations. The associated asset is recorded in “Property, Plant and Equipment, net” in the accompanying Consolidated Balance Sheets.
Bellaire Corporation (“Bellaire”) is a non-operating subsidiary of the Company with legacy liabilities relating to closed mining operations, primarily former Eastern U.S. underground coal mining operations. These legacy liabilities include obligations for water treatment and other environmental remediation that arose as part of the normal course of closing these underground mining operations. The Company determined the amounts of these obligations based on estimates adjusted for inflation and then discounted using a credit-adjusted risk-free interest rate. The accretion of the liability is recognized over the estimated life of the asset retirement obligation and is recorded in the line “Other” in the accompanying Consolidated Statements of Operations. Since Bellaire's properties are no longer active operations, no associated asset has been capitalized.
In connection with Bellaire's normal permit renewal with the Pennsylvania Department of Environmental Protection ("DEP"), it was notified during 2004 that in order to obtain renewal of the permit it would be required to establish a mine water treatment trust (the "Trust"). On October 1, 2010, Bellaire executed a Post-Mining Treatment Trust Consent Order and Agreement (“Consent”) with the DEP which established the Trust to provide a financial assurance mechanism in order to assure the long-term treatment of post-mining discharges. Bellaire has agreed to initially fund the Trust with approximately $5.0 million. Bellaire funded $2.5 million during 2010 upon execution of the Consent and the remaining $2.5 million in 2011.
F-19
NOTES TO CONSOLIDATED FINANCIAL STATEMENTS
NACCO INDUSTRIES, INC. AND SUBSIDIARIES
(Tabular Amounts in Millions, Except Per Share and Percentage Data)
A reconciliation of the beginning and ending aggregate carrying amount of the asset retirement obligations are as follows:
|
|
NACoal
|
Bellaire
|
NACCO
Consolidated
|
||||||||
|
Balance at January 1, 2010
|
$
|
4.2
|
|
$
|
13.3
|
|
$
|
17.5
|
|
||
|
Liabilities incurred during the period
|
0.7
|
|
—
|
|
0.7
|
|
|||||
|
Liabilities settled during the period
|
—
|
|
(0.8
|
)
|
(0.8
|
)
|
|||||
|
Accretion expense
|
0.4
|
|
0.9
|
|
1.3
|
|
|||||
|
Revision of estimated cash flows
|
(0.2
|
)
|
0.5
|
|
0.3
|
|
|||||
|
Balance at December 31, 2010
|
5.1
|
|
13.9
|
|
19.0
|
|
|||||
|
Liabilities settled during the period
|
—
|
|
(0.8
|
)
|
(0.8
|
)
|
|||||
|
Accretion expense
|
0.4
|
|
0.9
|
|
1.3
|
|
|||||
|
Revision of estimated cash flows
|
—
|
|
(0.4
|
)
|
(0.4
|
)
|
|||||
|
Balance at December 31, 2011
|
$
|
5.5
|
|
$
|
13.6
|
|
$
|
19.1
|
|
||
F-20
NOTES TO CONSOLIDATED FINANCIAL STATEMENTS
NACCO INDUSTRIES, INC. AND SUBSIDIARIES
(Tabular Amounts in Millions, Except Per Share and Percentage Data)
Financing arrangements are obtained and maintained at the subsidiary level. NACCO has not guaranteed any borrowings of its subsidiaries.
The following table summarizes the Company's available and outstanding borrowings:
|
|
December 31
|
||||||
|
|
2011
|
2010
|
|||||
|
Total outstanding borrowings:
|
|
|
|||||
|
Revolving credit agreements:
|
|
|
|||||
|
NMHG
|
$
|
—
|
|
$
|
4.2
|
|
|
|
NACoal
|
67.0
|
|
9.5
|
|
|||
|
|
67.0
|
|
13.7
|
|
|||
|
Capital lease obligations and other term loans:
|
|
|
|||||
|
NMHG
|
226.0
|
|
230.3
|
|
|||
|
HBB
|
54.2
|
|
115.1
|
|
|||
|
NACoal
|
7.7
|
|
6.7
|
|
|||
|
|
287.9
|
|
352.1
|
|
|||
|
Private Placement Notes — NACoal
|
19.3
|
|
25.7
|
|
|||
|
Total debt outstanding
|
$
|
374.2
|
|
$
|
391.5
|
|
|
|
Current portion of borrowings outstanding:
|
|
|
|||||
|
NMHG
|
$
|
171.4
|
|
$
|
19.0
|
|
|
|
HBB
|
—
|
|
1.3
|
|
|||
|
NACoal
|
73.7
|
|
15.9
|
|
|||
|
|
$
|
245.1
|
|
$
|
36.2
|
|
|
|
Long-term portion of borrowings outstanding:
|
|
|
|||||
|
NMHG
|
$
|
54.6
|
|
$
|
215.5
|
|
|
|
HBB
|
54.2
|
|
113.8
|
|
|||
|
NACoal
|
20.3
|
|
26.0
|
|
|||
|
|
$
|
129.1
|
|
$
|
355.3
|
|
|
|
Total available borrowings, net of limitations, under revolving credit agreements:
|
|
|
|||||
|
NMHG
|
$
|
151.4
|
|
$
|
120.2
|
|
|
|
HBB
|
88.2
|
|
95.2
|
|
|||
|
KC
|
27.0
|
|
22.5
|
|
|||
|
NACoal
|
148.8
|
|
94.4
|
|
|||
|
|
$
|
415.4
|
|
$
|
332.3
|
|
|
|
Unused revolving credit agreements:
|
|
|
|||||
|
NMHG
|
$
|
151.4
|
|
$
|
116.0
|
|
|
|
HBB
|
88.2
|
|
95.2
|
|
|||
|
KC
|
27.0
|
|
22.5
|
|
|||
|
NACoal
|
81.8
|
|
84.9
|
|
|||
|
|
$
|
348.4
|
|
$
|
318.6
|
|
|
|
Weighted average stated interest rate on total borrowings:
|
|
|
|||||
|
NMHG
|
2.3
|
%
|
2.4
|
%
|
|||
|
HBB
|
2.8
|
%
|
2.3
|
%
|
|||
|
NACoal
|
2.8
|
%
|
5.0
|
%
|
|||
|
Weighted average effective interest rate on total borrowings (including interest rate swap agreements):
|
|||||||
|
NMHG
|
5.9
|
%
|
6.0
|
%
|
|||
|
HBB
|
5.7
|
%
|
4.8
|
%
|
|||
|
NACoal
|
2.8
|
%
|
5.0
|
%
|
|||
F-21
NOTES TO CONSOLIDATED FINANCIAL STATEMENTS
NACCO INDUSTRIES, INC. AND SUBSIDIARIES
(Tabular Amounts in Millions, Except Per Share and Percentage Data)
Annual maturities of total debt, excluding capital leases, are as follows:
|
2012
|
$
|
244.7
|
|
|
2013
|
114.4
|
|
|
|
2014
|
6.7
|
|
|
|
2015
|
0.1
|
|
|
|
2016
|
—
|
|
|
|
Thereafter
|
4.8
|
|
|
|
|
$
|
370.7
|
|
Interest paid on total debt was $22.7 million, $26.0 million and $31.1 million during
2011
,
2010
and
2009
, respectively. Interest capitalized was $0.2 million and $0.3 million in
2010
and
2009
, respectively. No interest was capitalized in 2011.
NMHG:
NMHG's primary financing is provided by a $150.0 million secured floating-rate revolving credit facility (the “NMHG Facility”) and a term loan facility (the “NMHG Term Loan”). The obligations under the NMHG Facility are secured by a first lien on the cash and cash equivalents, accounts receivable and inventory of NMHG. The approximate book value of NMHG's assets held as collateral under the NMHG Facility was $675 million as of
December 31, 2011
.
The maximum availability under the NMHG Facility is governed by a borrowing base derived from advance rates against the inventory and accounts receivable of the borrowers, as defined in the NMHG Facility. Adjustments to reserves booked against these assets, including inventory reserves, will change the eligible borrowing base and thereby impact the liquidity provided by the NMHG Facility. A portion of the availability can be denominated in British pounds or euros. Borrowings bear interest at a floating rate which can be a base rate or LIBOR (London Interbank Offered Rate) plus a margin. The applicable margins, effective
December 31, 2011
, for domestic base rate loans and LIBOR loans were 2.00% and 3.25%, respectively. The applicable margin, effective
December 31, 2011
, for foreign overdraft loans and foreign LIBOR loans were 3.50% and 3.25%, respectively. The NMHG Facility also requires the payment of a fee of 0.75% per annum on the unused commitment.
At
December 31, 2011
, the excess availability under the NMHG Facility was $132.6 million, which reflects reductions of $10.0 million for an excess availability requirement and $7.4 million for letters of credit. If commitments or availability under these facilities are increased, availability under the NMHG Facility will be reduced.
There were no borrowings outstanding under the NMHG Facility at
December 31, 2011
. The domestic and foreign floating rates of interest applicable to the NMHG Facility on
December 31, 2011
were 5.25% and a range of 3.50% to 4.50%, respectively, including the applicable floating rate margin. The NMHG Facility expires in June 2014.
The NMHG Facility includes restrictive covenants, which, among other things, limit the payment of dividends to NACCO. Subject to achieving availability thresholds, dividends to NACCO are limited to the larger of $5.0 million or 50% of the preceding year's net income for NMHG. The NMHG Facility also requires NMHG to maintain a minimum excess availability during the term of the agreement and achieve a maximum leverage ratio and a minimum fixed charge coverage ratio, in certain circumstances, as defined in the NMHG Facility. At
December 31, 2011
, NMHG was in compliance with the covenants in the NMHG Facility.
During 2006, NACCO Materials Handling Group, Inc. (“NMHG Inc.”), a wholly owned subsidiary of NMHG, entered into the NMHG Term Loan that provided for term loans up to an aggregate principal amount of $225.0 million, which mature in 2013. The term loans require quarterly payments in an amount equal to 1% of the original principal per year for the first six years, with the remaining balance to be paid in four equal installments in the seventh year. At
December 31, 2011
, there was $212.6 million outstanding under the NMHG Term Loan.
Borrowings under the NMHG Term Loan are guaranteed by NMHG and substantially all of NMHG's domestic subsidiaries. The obligations of the guarantors under the NMHG Term Loan are secured by a first lien on all of the domestic machinery, equipment and real property owned by NMHG Inc. and each guarantor and a second lien on all of the collateral securing the obligations of NMHG under the NMHG Facility. The approximate book value of NMHG's assets held as collateral under the NMHG Term Loan was $760 million as of
December 31, 2011
, which includes the book value of the assets securing the NMHG Facility.
F-22
NOTES TO CONSOLIDATED FINANCIAL STATEMENTS
NACCO INDUSTRIES, INC. AND SUBSIDIARIES
(Tabular Amounts in Millions, Except Per Share and Percentage Data)
Outstanding borrowings under the NMHG Term Loan bear interest at a variable rate that, at NMHG's option, will be either LIBOR or a floating rate, as defined in the NMHG Term Loan, plus an applicable margin. The applicable margin is subject to adjustment based on a leverage ratio. The weighted average interest rate on the amount outstanding under the NMHG Term Loan at
December 31, 2011
was 2.15%.
The NMHG Term Loan includes restrictive covenants, which, among other things, limit the payment of dividends to NACCO. Subject to achieving availability thresholds, dividends to NACCO are limited to the larger of $5.0 million or 50% of the preceding year's net income for NMHG. The NMHG Term Loan also requires NMHG to meet certain financial tests, including, but not limited to, minimum excess availability, maximum leverage ratio and minimum fixed charge coverage ratio tests. At
December 31, 2011
, NMHG was in compliance with the covenants in the NMHG Term Loan.
In addition to the amount outstanding under the NMHG Term Loan, NMHG had borrowings of approximately $12.8 million at
December 31, 2011
under various foreign working capital facilities.
NMHG incurred fees and expenses of $3.1 million during 2010 related to the amended and restated NMHG Facility. These fees were deferred and are being amortized as interest expense over the term of the NMHG Facility. No similar fees were incurred in 2011 or 2009.
HBB:
HBB has a $115.0 million senior secured floating-rate revolving credit facility (the “HBB Facility”) that expires July 2012. The obligations under the HBB Facility are secured by a first lien on the accounts receivable and inventory of HBB and a second lien on all of the other assets of HBB. The approximate book value of HBB's assets held as collateral for the first and second lien under the HBB Facility was $200 million as of
December 31, 2011
.
The HBB Facility is governed by a borrowing base derived from advance rates against the inventory and accounts receivable, as defined in the HBB Facility. Adjustments to reserves, including derivative reserves, will change the eligible borrowing base. A portion of the availability is denominated in Canadian dollars to provide funding to HBB's Canadian subsidiary. Borrowings bear interest at a floating rate, which can be either a base rate, LIBOR or bankers' acceptance rate, as defined in the HBB Facility, plus an applicable margin. The applicable margins, effective
December 31, 2011
, for base rate loans and LIBOR loans denominated in U.S. dollars were 0.00% and 1.00%, respectively. The applicable margins, effective
December 31, 2011
, for base rate and bankers' acceptance loans denominated in Canadian dollars were 0.50% and 1.00%, respectively. The HBB Facility also requires a fee of 0.20% per annum on the unused commitment. The margins and unused commitment fee are subject to quarterly adjustment based on average excess availability.
At
December 31, 2011
, the borrowing base under the HBB Facility was $88.2 million. There were no borrowings outstanding under the HBB Facility at
December 31, 2011
. The floating rate of interest applicable to the HBB Facility at
December 31, 2011
was 1.58% including the floating rate margin.
The HBB Facility includes restrictive covenants that, among other things, set limitations on additional indebtedness (other than indebtedness under the HBB Facility and HBB Term Loan (defined below)), investments, asset sales and the payment of dividends to NACCO. Subject to achieving availability thresholds, annual dividends to NACCO are limited to $5.0 million plus 50% of HBB's net income since the effective date of the amendment to the HBB Facility in 2007. The HBB Facility also requires HBB to meet minimum fixed charge ratio tests in certain circumstances. At
December 31, 2011
, HBB was in compliance with the covenants in the HBB Facility.
During 2007, HBB entered into a term loan agreement (the “HBB Term Loan”) that provided for term loans up to an aggregate principal amount of $125.0 million. Borrowings outstanding under the HBB Term Loan were $54.2 million at
December 31, 2011
, which reflect voluntary payments of $60.0 million made during 2011. The remaining balance is expected to be paid at maturity in May 2013. Prior to maturity, the term loans are subject to mandatory prepayments from the proceeds of the issuance of certain indebtedness, certain asset sales and 50% of excess cash flow, as defined in the HBB Term Loan. The obligations of HBB under the HBB Term Loan are secured by a second lien on accounts receivable and inventory and a first lien on all of the other assets of HBB. The approximate book value of HBB's assets held as collateral for the first and second lien under the HBB Term Loan was $200 million as of
December 31, 2011
.
The term loans bear interest at a floating rate that, at HBB's option, can be either a base rate or LIBOR, as defined in the HBB Term Loan, plus an applicable margin. The applicable margins, effective
December 31, 2011
, for base rate loans and LIBOR loans were 1.00% and 2.00%, respectively. The applicable margins are subject to quarterly adjustment based on a leverage
F-23
NOTES TO CONSOLIDATED FINANCIAL STATEMENTS
NACCO INDUSTRIES, INC. AND SUBSIDIARIES
(Tabular Amounts in Millions, Except Per Share and Percentage Data)
ratio. The weighted average interest rate on the amount outstanding under the HBB Term Loan was 2.78% at
December 31, 2011
.
The HBB Term Loan contains restrictive covenants substantially similar to those in the HBB Facility that, among other things, limit the amount of dividends HBB may declare and pay and the incurrence of indebtedness (other than indebtedness under the HBB Facility). Dividends to NACCO are limited to $5.0 million plus 50% of HBB's net income since the closing date of the HBB Term Loan in 2007. The HBB Term Loan also requires HBB to meet certain financial tests, including, but not limited to, maximum total leverage ratio and minimum fixed charge coverage ratio tests. At
December 31, 2011
, HBB was in compliance with the covenants in the HBB Term Loan.
KC:
KC has a $30.0 million secured revolving line of credit that expires in April 2013 (the “KC Facility”). The KC Facility can be extended at KC's option for an additional year, subject to the lender's consent. The obligations under the KC Facility are secured by substantially all assets of KC. The approximate book value of KC's assets held as collateral under the KC Facility was $90 million as of
December 31, 2011
.
The availability is derived from a borrowing base formula using KC's eligible inventory and eligible credit card accounts receivable, as defined in the KC Facility. At
December 31, 2011
, the borrowing base was $27.0 million. There were no borrowings outstanding under the KC Facility at
December 31, 2011
.
Borrowings bear interest at a floating rate, which can be either a base rate or LIBOR, as defined in the KC Facility, plus an applicable margin. The applicable margins, effective
December 31, 2011
, for base rate and LIBOR loans were 2.00% and 3.00%, respectively. The floating rate of interest applicable to the KC Facility was 5.25% at
December 31, 2011
, including the floating rate margin. The KC Facility also requires a fee of 0.50% per annum on the unused commitment.
The KC Facility allows for the payment of dividends to NACCO, subject to certain restrictions based on availability and meeting a fixed charge coverage ratio as described in the KC Facility.
KC incurred fees and expenses of $0.4 million during 2010, related to the amended and restated KC Facility. These fees were deferred and are being amortized as interest expense over the term of the KC Facility. No similar fees were incurred in 2011 or 2009.
NACoal:
NACoal has an unsecured revolving line of credit of up to $150.0 million (the “NACoal Facility”) that expires in December 2016. Borrowings outstanding under the NACoal Facility were $67.0 million at
December 31, 2011
. Therefore, at
December 31, 2011
, the excess availability under the NACoal Facility was $81.8 million, which reflects a reduction for outstanding letters of credit of $1.2 million.
The NACoal Facility has performance-based pricing, which sets interest rates based upon achieving various levels of debt to EBITDA ratios, as defined in the NACoal Facility. Borrowings bear interest at a floating rate plus a margin based on the level of debt to EBITDA ratio achieved, as defined in the NACoal Facility. The applicable margins, effective December 31, 2011, for base rate and LIBOR loans were 0.75% and 1.75%, respectively. The NACoal Facility also has a commitment fee which is also based upon achieving various levels of debt to EBITDA ratios. The commitment fee was 0.35% on the unused commitment at December 31, 2011. The floating rate of interest applicable to the NACoal Facility at
December 31, 2011
was 2.10% including the floating rate margin.
The NACoal Facility also contains restrictive covenants that require, among other things, NACoal to maintain certain debt to EBITDA and interest coverage ratios, and provides the ability to make loans, dividends and advances to NACCO, with some restrictions based on the debt to EBITDA ratio in conjunction with maintaining unused availability thresholds of borrowing capacity under the NACoal Facility. At
December 31, 2011
, NACoal was in compliance with these covenants.
During 2004 and 2005, NACoal issued unsecured notes totaling $45.0 million in a private placement (the “NACoal Notes”), which require annual principal payments of approximately $6.4 million that began in October 2008 and will mature on October 4, 2014. These unsecured notes bear interest at a weighted-average fixed rate of 6.08%, payable semi-annually on April 4 and October 4. The NACoal Notes are redeemable at any time at the option of NACoal, in whole or in part, at an amount equal to par plus accrued and unpaid interest plus a “make-whole premium,” if applicable. NACoal had $19.3 million of the private placement notes outstanding at
December 31, 2011
. The NACoal Notes contain certain covenants and restrictions that require, among other things, NACoal to maintain certain net worth, leverage and interest coverage ratios, and limit dividends to
F-24
NOTES TO CONSOLIDATED FINANCIAL STATEMENTS
NACCO INDUSTRIES, INC. AND SUBSIDIARIES
(Tabular Amounts in Millions, Except Per Share and Percentage Data)
NACCO based upon NACoal's leverage ratio. At
December 31, 2011
, NACoal was in compliance with the covenants in the NACoal Notes.
NACoal has a demand note payable to Coteau which bears interest based on the applicable quarterly federal short-term interest rate as announced from time to time by the Internal Revenue Service. At
December 31, 2011
, the balance of the note was $4.8 million and the interest rate was 0.16%.
NACoal incurred fees and expenses of approximately $0.8 million and $1.1 million in 2011 and 2009, respectively, related to the NACoal Facility. These fees were deferred and are being amortized as interest expense in the Consolidated Statements of Operations over the term of the NACoal Facility. No similar fees were incurred in 2010.
Financial Instruments
The carrying amounts of cash and cash equivalents, accounts receivable and accounts payable approximate fair value due to the short-term maturities of these instruments. The fair values of revolving credit agreements and long-term debt, excluding capital leases, were determined using current rates offered for similar obligations taking into account subsidiary credit risk, which is Level 2 as defined in the fair value hierarchy. At
December 31, 2011
, the fair value of revolving credit agreements and long-term debt, excluding capital leases, was $369.4 million compared with the book value of $370.7 million. At
December 31, 2010
, the fair value of revolving credit agreements and long-term debt, excluding capital leases, was $384.6 million compared with the book value of $391.2 million.
Financial instruments that potentially subject the Company to concentration of credit risk consist principally of accounts receivable and derivatives. The large number of customers comprising the Company's customer base and their dispersion across many different industries and geographies mitigates concentration of credit risk on accounts receivable. However, HBB maintains significant accounts receivable balances with several large retail customers. At
December 31, 2011
and
2010
, receivables from HBB's five largest customers represented 10.2% and 13.6%, respectively, of the Company's net accounts receivable. In addition, under its mining contracts, NACoal recognizes revenue and a related receivable as coal or limerock is delivered or predevelopment services are provided. These mining contracts provide for monthly settlements. NACoal's significant credit concentration is uncollateralized; however, historically minimal credit losses have been incurred. To further reduce credit risk associated with accounts receivable, the Company performs periodic credit evaluations of its customers, but does not generally require advance payments or collateral. The Company enters into derivative contracts with high-quality financial institutions and limits the amount of credit exposure to any one institution.
Derivative Financial Instruments
The Company measures its derivatives at fair value on a recurring basis using significant observable inputs, which is Level 2 as defined in the fair value hierarchy. The Company uses a present value technique that incorporates the LIBOR swap curve, foreign currency spot rates and foreign currency forward rates to value its derivatives, including its interest rate swap agreements and foreign currency exchange contracts, and also incorporates the effect of its subsidiary and counterparty credit risk into the valuation.
Foreign Currency Derivatives
: NMHG and HBB held forward foreign currency exchange contracts with total notional amounts of $285.1 million and $15.6 million, respectively, at
December 31, 2011
, primarily denominated in euros, British pounds, Japanese yen, Canadian dollars, Swedish kroner, Australian dollars and Mexican pesos. NMHG and HBB held forward foreign currency exchange contracts with total notional amounts of $338.1 million and $16.5 million, respectively, at
December 31, 2010
, primarily denominated in euros, British pounds, Japanese yen, Australian dollars, Brazilian Real, Canadian dollars, Swedish kroner and Mexican pesos. The fair value of these contracts approximated a net asset of $5.2 million at December 31, 2011 and a net liability of $2.4 million at December 31, 2010.
Forward foreign currency exchange contracts that qualify for hedge accounting are used to hedge transactions expected to occur within the next twelve months. The mark-to-market effect of forward foreign currency exchange contracts that are considered effective as hedges has been included in OCI. Based on market valuations at
December 31, 2011
, $6.2 million of the amount included in OCI is expected to be reclassified as income into the Consolidated Statement of Operations over the next twelve months, as the transactions occur.
F-25
NOTES TO CONSOLIDATED FINANCIAL STATEMENTS
NACCO INDUSTRIES, INC. AND SUBSIDIARIES
(Tabular Amounts in Millions, Except Per Share and Percentage Data)
During the year ended
December 31, 2009
, the Company settled $11.5 million, of its foreign currency exchange contracts ahead of their maturities which were classified in the Consolidated Statements of Cash Flows in operating activities on the line “Other.” During
2010
and
2009
, $14.0 million and $15.1 million, respectively, was recognized as a gain in the Consolidated Statements of Operations on the line “Cost of sales" as the forecasted transactions related to previously settled foreign currency exchange contracts occurred.
Interest Rate Derivatives
: The following table summarizes the notional amounts, related rates and remaining terms of interest rate swap agreements active at
December 31
:
|
|
Notional Amount
|
Average Fixed Rate
|
Remaining Term at
|
||||||||||||
|
|
2011
|
2010
|
2011
|
2010
|
December 31, 2011
|
||||||||||
|
NMHG
|
$
|
204.5
|
|
$
|
206.5
|
|
4.5
|
%
|
4.5
|
%
|
Various, extending to February 2013
|
||||
|
HBB
|
$
|
40.0
|
|
$
|
65.0
|
|
4.6
|
%
|
4.6
|
%
|
Various, extending to June 2012
|
||||
In addition to the interest rate swap agreements reflected in the table, at
December 31, 2011
, HBB holds certain contracts that begin in June 2012 and extend to June 2013. These contracts increase the notional amount to $65.0 million at
December 31, 2011
, but the amount outstanding at any one time will not exceed the balance of the HBB Term Loan. The fair value of all interest rate swap agreements was a net liability of $7.3 million and $16.3 million at
December 31, 2011
and
2010
, respectively. The mark-to-market effect of interest rate swap agreements that are considered effective as hedges has been included in OCI. Based on market valuations at
December 31, 2011
, $3.5 million of the amount included in OCI is expected to be reclassified as expense into the Consolidated Statement of Operations over the next twelve months, as cash flow payments are made in accordance with the interest rate swap agreements.
NMHG:
NMHG has interest rate swap agreements that hedge interest payments on the NMHG Term Loan. The interest rate swap agreements held by NMHG on
December 31, 2011
are expected to continue to be effective as hedges.
HBB:
HBB has interest rate swaps that hedge interest payments on the HBB Term Loan. The interest rate swap agreements held by HBB on
December 31, 2011
are expected to continue to be effective as hedges.
F-26
NOTES TO CONSOLIDATED FINANCIAL STATEMENTS
NACCO INDUSTRIES, INC. AND SUBSIDIARIES
(Tabular Amounts in Millions, Except Per Share and Percentage Data)
The following table summarizes the fair value of derivative instruments at
December 31
as recorded in the Consolidated Balance Sheets:
|
|
Asset Derivatives
|
Liability Derivatives
|
|||||||||||||||||
|
|
Balance sheet location
|
2011
|
2010
|
Balance sheet location
|
2011
|
2010
|
|||||||||||||
|
Derivatives designated as hedging instruments
|
|
|
|
|
|
|
|||||||||||||
|
Interest rate swap agreements
|
|
|
|
|
|
|
|||||||||||||
|
Current
|
Other current liabilities
|
$
|
—
|
|
$
|
—
|
|
Other current liabilities
|
$
|
5.5
|
|
$
|
4.7
|
|
|||||
|
Long-term
|
Other long-term liabilities
|
—
|
|
—
|
|
Other long-term liabilities
|
1.8
|
|
11.6
|
|
|||||||||
|
Foreign currency exchange contracts
|
|
|
|
|
|
|
|||||||||||||
|
Current
|
Prepaid expenses and other
|
8.1
|
|
1.3
|
|
Prepaid expenses and other
|
2.4
|
|
1.2
|
|
|||||||||
|
Other current liabilities
|
1.3
|
|
1.7
|
|
Other current liabilities
|
2.1
|
|
1.7
|
|
||||||||||
|
Total derivatives designated as hedging instruments
|
|
$
|
9.4
|
|
$
|
3.0
|
|
|
$
|
11.8
|
|
$
|
19.2
|
|
|||||
|
Derivatives not designated as hedging instruments
|
|
|
|
|
|
|
|||||||||||||
|
Interest rate swap agreements
|
|
|
|
|
|
|
|||||||||||||
|
Current
|
Other current liabilities
|
$
|
—
|
|
$
|
—
|
|
Other current liabilities
|
$
|
—
|
|
$
|
—
|
|
|||||
|
Long-term
|
Other non-current assets
|
—
|
|
—
|
|
Other long-term liabilities
|
—
|
|
—
|
|
|||||||||
|
Foreign currency exchange contracts
|
|
|
|
|
|
|
|||||||||||||
|
Current
|
Prepaid expenses and other
|
1.4
|
|
0.5
|
|
Prepaid expenses and other
|
0.8
|
|
0.3
|
|
|||||||||
|
Other current liabilities
|
0.2
|
|
0.6
|
|
Other current liabilities
|
0.5
|
|
3.3
|
|
||||||||||
|
Total derivatives not designated as hedging instruments
|
|
$
|
1.6
|
|
$
|
1.1
|
|
|
$
|
1.3
|
|
$
|
3.6
|
|
|||||
|
Total derivatives
|
|
$
|
11.0
|
|
$
|
4.1
|
|
|
$
|
13.1
|
|
$
|
22.8
|
|
|||||
The following table summarizes the pre-tax impact of derivative instruments for each year ended
December 31
as recorded in the Consolidated Statements of Operations:
|
Derivatives in Cash Flow Hedging Relationships
|
Amount of Gain or (Loss)
Recognized in OCI on
Derivative (Effective Portion)
|
Location of Gain or
(Loss) Reclassified
from OCI into
Income (Effective
Portion)
|
Amount of Gain or (Loss)
Reclassified from OCI
into Income (Effective Portion)
|
Location of Gain or
(Loss) Recognized
in Income on
Derivative
(Ineffective
Portion and Amount
Excluded from
Effectiveness
Testing)
|
Amount of Gain or (Loss) Recognized
in Income on Derivative
Portion and Amount Excluded from
Effectiveness Testing)
|
|||||||||||||||||||||||||||||||||||
|
2011
|
2010
|
2009
|
2011
|
2010
|
2009
|
2011
|
2010
|
2009
|
||||||||||||||||||||||||||||||||
|
Interest rate swap agreements
|
$
|
(1.5
|
)
|
$
|
(7.6
|
)
|
$
|
(5.5
|
)
|
Interest expense
|
$
|
(10.5
|
)
|
$
|
(12.0
|
)
|
$
|
(10.5
|
)
|
N/A
|
$
|
—
|
|
$
|
—
|
|
$
|
—
|
|
|||||||||||
|
|
|
|
|
|
|
|
|
|
|
|||||||||||||||||||||||||||||||
|
Foreign currency exchange contracts
|
4.2
|
|
0.6
|
|
10.5
|
|
Cost of sales
|
(1.3
|
)
|
16.5
|
|
5.0
|
|
N/A
|
—
|
|
—
|
|
—
|
|
||||||||||||||||||||
|
Total
|
$
|
2.7
|
|
$
|
(7.0
|
)
|
$
|
5.0
|
|
|
$
|
(11.8
|
)
|
$
|
4.5
|
|
$
|
(5.5
|
)
|
|
$
|
—
|
|
$
|
—
|
|
$
|
—
|
|
|||||||||||
|
|
Amount of Gain or (Loss)
Recognized in Income on Derivative
|
|||||||||||||
|
Derivatives Not Designated as Hedging Instruments
|
Location of Gain or (Loss) Recognized in Income on Derivative
|
2011
|
2010
|
2009
|
||||||||||
|
Interest rate swap agreements
|
Other
|
$
|
—
|
|
$
|
0.2
|
|
$
|
0.6
|
|
||||
|
Foreign currency exchange contracts
|
Cost of sales or Other
|
(1.5
|
)
|
(3.7
|
)
|
(10.4
|
)
|
|||||||
|
Total
|
|
$
|
(1.5
|
)
|
$
|
(3.5
|
)
|
$
|
(9.8
|
)
|
||||
F-27
NOTES TO CONSOLIDATED FINANCIAL STATEMENTS
NACCO INDUSTRIES, INC. AND SUBSIDIARIES
(Tabular Amounts in Millions, Except Per Share and Percentage Data)
The Company leases certain office, manufacturing and warehouse facilities, retail stores and machinery and equipment under noncancellable capital and operating leases that expire at various dates through 2022. Many leases include renewal and/or fair value purchase options.
Future minimum capital and operating lease payments at
December 31, 2011
are:
|
|
Capital
Leases
|
Operating
Leases
|
|||||
|
2012
|
$
|
0.6
|
|
$
|
45.5
|
|
|
|
2013
|
0.6
|
|
35.7
|
|
|||
|
2014
|
0.6
|
|
27.9
|
|
|||
|
2015
|
0.6
|
|
21.9
|
|
|||
|
2016
|
0.4
|
|
16.8
|
|
|||
|
Subsequent to 2016
|
1.2
|
|
39.6
|
|
|||
|
Total minimum lease payments
|
4.0
|
|
$
|
187.4
|
|
||
|
Amounts representing interest
|
0.5
|
|
|
||||
|
Present value of net minimum lease payments
|
3.5
|
|
|
||||
|
Current maturities
|
0.4
|
|
|
||||
|
Long-term capital lease obligation
|
$
|
3.1
|
|
|
|||
Rental expense for all operating leases was $56.5 million, $62.3 million and $92.9 million for
2011
,
2010
and
2009
, respectively. The Company also recognized $3.6 million, $8.5 million and $40.7 million for
2011
,
2010
and
2009
, respectively, in rental income on subleases of equipment under operating leases in which it was the lessee. These subleases were primarily related to lift trucks in which NMHG records revenues over the term of the lease in accordance with the rental agreements with its customers. The sublease rental income for these lift trucks is included in “Revenues” and the related rent expense is included in “Cost of sales” in the Consolidated Statements of Operations for each period. Aggregate future minimum rentals to be received under noncancellable subleases as of
December 31, 2011
are $8.8 million.
Assets recorded under capital leases are included in property, plant and equipment and consist of the following:
|
|
December 31
|
||||||
|
|
2011
|
2010
|
|||||
|
Plant and equipment
|
$
|
8.2
|
|
$
|
10.1
|
|
|
|
Less accumulated amortization
|
2.0
|
|
4.1
|
|
|||
|
|
$
|
6.2
|
|
$
|
6.0
|
|
|
Amortization of plant and equipment under capital leases is included in depreciation expense in each of the years ended
December 31, 2011
,
2010
and
2009
.
Capital lease obligations of $3.8 million, $0.5 million and $1.2 million were incurred in connection with lease agreements to acquire plant and equipment during
2011
,
2010
and
2009
, respectively.
Various legal and regulatory proceedings and claims have been or may be asserted against NACCO and certain subsidiaries relating to the conduct of their businesses, including product liability, environmental and other claims. These proceedings and claims are incidental to the ordinary course of business of the Company. Management believes that it has meritorious defenses and will vigorously defend the Company in these actions. Any costs that management estimates will be paid as a result of these claims are accrued when the liability is considered probable and the amount can be reasonably estimated. Although the ultimate disposition of these proceedings is not presently determinable, management believes, after consultation with its legal counsel, that the likelihood is remote that material costs will be incurred in excess of accruals already recognized.
F-28
NOTES TO CONSOLIDATED FINANCIAL STATEMENTS
NACCO INDUSTRIES, INC. AND SUBSIDIARIES
(Tabular Amounts in Millions, Except Per Share and Percentage Data)
Under various financing arrangements for certain customers, including independently owned retail dealerships, NMHG provides recourse or repurchase obligations such that NMHG would be obligated in the event of default by the customer. Terms of the third-party financing arrangements for which NMHG is providing recourse or repurchase obligations generally range from one to five years. Total amounts subject to recourse or repurchase obligations at
December 31, 2011
and
December 31, 2010
were $179.1 million and $193.3 million, respectively. As of
December 31, 2011
, losses anticipated under the terms of the recourse or repurchase obligations were not significant and reserves have been provided for such losses based on historical experience in the accompanying consolidated financial statements. NMHG generally retains a security interest in the related assets financed such that, in the event NMHG would become obligated under the terms of the recourse or repurchase obligations, NMHG would take title to the assets financed. The fair value of collateral held at
December 31, 2011
was approximately $201.2 million based on Company estimates. The Company estimates the fair value of the collateral using information regarding the original sales price, the current age of the equipment and general market conditions that influence the value of both new and used lift trucks. The Company also regularly monitors the external credit ratings of the entities for which it has provided recourse or repurchase obligations. As of
December 31, 2011
, the Company did not believe there was a significant risk of non-payment or non-performance of the obligations by these entities; however, there can be no assurance that the risk may not increase in the future. In addition, NMHG has an agreement with GECC to limit its exposure to losses at certain eligible dealers. Under this agreement, losses related to $44.3 million of recourse or repurchase obligations for these certain eligible dealers are limited to 7.5% of their original loan balance, or $9.6 million as of
December 31, 2011
. The $44.3 million is included in the $179.1 million of total amounts subject to recourse or repurchase obligations at
December 31, 2011
.
NMHG provides a standard warranty on its lift trucks, generally for six to twelve months or 1,000 to 2,000 hours. For certain components in some series of lift trucks, NMHG provides a standard warranty of two to three years or 4,000 to 6,000 hours. HBB provides a standard warranty to consumers for all of its products. The specific terms and conditions of those warranties vary depending upon the product brand. In general, if a product is returned under warranty, a refund is provided to the consumer by HBB's customer, the retailer. Generally, the retailer returns those products to HBB for a credit. The Company estimates the costs which may be incurred under its standard warranty programs and records a liability for such costs at the time product revenue is recognized.
In addition, NMHG sells extended warranty agreements which provide a warranty for an additional two to five years or up to 2,400 to 10,000 hours. The specific terms and conditions of those warranties vary depending upon the product sold and the country in which NMHG does business. Revenue received for the sale of extended warranty contracts is deferred and recognized in the same manner as the costs incurred to perform under the warranty contracts.
NMHG also maintains a quality enhancement program under which it provides for specifically identified field product improvements in its warranty obligation. Accruals under this program are determined based on estimates of the potential number of claims to be processed and the cost of processing those claims based on historical costs.
The Company periodically assesses the adequacy of its recorded warranty liabilities and adjusts the amounts as necessary. Factors that affect the Company's warranty liability include the number of units sold, historical and anticipated rates of warranty claims and the cost per claim.
Changes in the Company's current and long-term warranty obligations, including deferred revenue on extended warranty contracts, are as follows:
|
|
2011
|
2010
|
|||||
|
Balance at January 1
|
$
|
40.0
|
|
$
|
38.5
|
|
|
|
Warranties issued
|
42.6
|
|
37.2
|
|
|||
|
Settlements made
|
(34.1
|
)
|
(35.1
|
)
|
|||
|
Foreign currency effect
|
(0.5
|
)
|
(0.6
|
)
|
|||
|
Balance at December 31
|
$
|
48.0
|
|
$
|
40.0
|
|
|
F-29
NOTES TO CONSOLIDATED FINANCIAL STATEMENTS
NACCO INDUSTRIES, INC. AND SUBSIDIARIES
(Tabular Amounts in Millions, Except Per Share and Percentage Data)
NACCO Industries, Inc. Class A common stock is traded on the New York Stock Exchange under the ticker symbol “NC.” Because of transfer restrictions on Class B common stock, no trading market has developed, or is expected to develop, for the Company's Class B common stock. The Class B common stock is convertible into Class A common stock on a one-for-one basis at any time at the request of the holder. The Company's Class A common stock and Class B common stock have the same cash dividend rights per share. The Class A common stock has one vote per share and the Class B common stock has ten votes per share. The total number of authorized shares of Class A common stock and Class B common stock at
December 31, 2011
was 25,000,000 shares and 6,756,176 shares, respectively. Treasury shares of Class A common stock totaling 1,409,915 and 1,450,550 at
December 31, 2011
and
2010
, respectively, have been deducted from shares outstanding.
Stock Options
: The 1975 and 1981 stock option plans, as amended, provide for the granting to officers and other key employees of options to purchase Class A common stock and Class B common stock of the Company at a price not less than the market value of such stock at the date of grant. Options become exercisable over a four-year period and expire ten years from the date of the grant. During the three-year period ending
December 31, 2011
, there were 80,701 shares of Class A common stock and 80,100 shares of Class B common stock available for grant. However, no options were granted during the three-year period ending
December 31, 2011
and no options remain outstanding at the end of any of the years ended
December 31, 2011
,
2010
and
2009
. At present, the Company does not intend to issue additional stock options.
Stock Compensation:
See Note 2 for a discussion of the Company's restricted stock awards.
Earnings per Share:
For purposes of calculating earnings per share, no adjustments have been made to the reported amounts of net income attributable to stockholders. In addition, basic and diluted earnings per share for Class A common stock are the same as Class B common stock. The weighted average number of shares of Class A common stock and Class B common stock outstanding used to calculate basic and diluted earnings per share were as follows:
|
|
2011
|
2010
|
2009
|
||||||||
|
Basic weighted average shares outstanding
|
8.383
|
|
8.328
|
|
8.290
|
|
|||||
|
Dilutive effect of restricted stock awards
|
0.025
|
|
0.016
|
|
0.006
|
|
|||||
|
Diluted weighted average shares outstanding
|
8.408
|
|
8.344
|
|
8.296
|
|
|||||
|
Basic earnings per share
|
$
|
19.34
|
|
$
|
9.55
|
|
$
|
3.75
|
|
||
|
Diluted earnings per share
|
$
|
19.28
|
|
$
|
9.53
|
|
$
|
3.75
|
|
||
F-30
NOTES TO CONSOLIDATED FINANCIAL STATEMENTS
NACCO INDUSTRIES, INC. AND SUBSIDIARIES
(Tabular Amounts in Millions, Except Per Share and Percentage Data)
The components of income before income taxes and provision for income taxes for the years ended
December 31
are as follows:
|
|
2011
|
2010
|
2009
|
||||||||
|
Income (loss) before income taxes
|
|
|
|
||||||||
|
Domestic
|
$
|
141.6
|
|
$
|
35.4
|
|
$
|
49.1
|
|
||
|
Foreign
|
72.2
|
|
61.4
|
|
(20.2
|
)
|
|||||
|
|
$
|
213.8
|
|
$
|
96.8
|
|
$
|
28.9
|
|
||
|
Income tax provision
|
|
|
|
||||||||
|
Current tax provision (benefit):
|
|
|
|
||||||||
|
Federal
|
$
|
31.5
|
|
$
|
(2.9
|
)
|
$
|
(12.1
|
)
|
||
|
State
|
2.8
|
|
1.3
|
|
4.6
|
|
|||||
|
Foreign
|
8.8
|
|
10.5
|
|
3.0
|
|
|||||
|
Total current
|
43.1
|
|
8.9
|
|
(4.5
|
)
|
|||||
|
Deferred tax provision (benefit):
|
|
|
|
||||||||
|
Federal
|
10.4
|
|
7.7
|
|
23.9
|
|
|||||
|
State
|
0.3
|
|
0.5
|
|
(1.8
|
)
|
|||||
|
Foreign
|
(2.1
|
)
|
0.3
|
|
2.9
|
|
|||||
|
Total deferred
|
8.6
|
|
8.5
|
|
25.0
|
|
|||||
|
|
$
|
51.7
|
|
$
|
17.4
|
|
$
|
20.5
|
|
||
The Company made income tax payments of $33.6 million, $15.8 million and $8.5 million during
2011
,
2010
and
2009
, respectively. During the same periods, income tax refunds totaled $0.6 million, $4.4 million and $11.0 million, respectively.
A reconciliation of the federal statutory and effective income tax rate for the year ended
December 31
is as follows:
|
|
2011
|
2010
|
2009
|
||||||||
|
Income before income taxes
|
$
|
213.8
|
|
$
|
96.8
|
|
$
|
28.9
|
|
||
|
Statutory taxes at 35.0%
|
$
|
74.8
|
|
$
|
33.9
|
|
$
|
10.1
|
|
||
|
State income taxes
|
4.1
|
|
1.2
|
|
1.3
|
|
|||||
|
Non-deductible expenses
|
2.1
|
|
1.4
|
|
1.7
|
|
|||||
|
Unremitted foreign earnings
|
1.6
|
|
1.7
|
|
10.3
|
|
|||||
|
Foreign statutory rate differences
|
(10.0
|
)
|
(14.7
|
)
|
(3.1
|
)
|
|||||
|
Valuation allowance
|
(9.5
|
)
|
9.1
|
|
17.8
|
|
|||||
|
Percentage depletion
|
(6.9
|
)
|
(7.2
|
)
|
(6.5
|
)
|
|||||
|
Equity interest earnings
|
(1.9
|
)
|
(0.4
|
)
|
1.2
|
|
|||||
|
R&D and other federal credits
|
(0.9
|
)
|
(0.7
|
)
|
(0.9
|
)
|
|||||
|
Tax controversy resolution
|
—
|
|
(6.6
|
)
|
0.7
|
|
|||||
|
Basis difference in foreign stock
|
—
|
|
—
|
|
(11.9
|
)
|
|||||
|
Other
|
(1.7
|
)
|
(0.3
|
)
|
(0.2
|
)
|
|||||
|
Income tax provision
|
$
|
51.7
|
|
$
|
17.4
|
|
$
|
20.5
|
|
||
|
Effective income tax rate
|
24.2
|
%
|
18.0
|
%
|
70.9
|
%
|
|||||
As of
December 31, 2011
, the cumulative unremitted earnings of the Company's foreign subsidiaries are approximately $300 million. The Company determined during 2009 that up to $75 million in foreign earnings, primarily with respect to its European business group, may be repatriated within the foreseeable future. As a result of additional earnings and changes in currency exchange rates, the Company increased its estimate of the foreign earnings to be repatriated within the foreseeable future by an additional $5 million in both 2011 and 2010. During 2010, the Company repatriated $28 million of such deferred earnings to the U.S. There were no repatriations of these deferred earnings in 2011. As a result of these determinations and
F-31
NOTES TO CONSOLIDATED FINANCIAL STATEMENTS
NACCO INDUSTRIES, INC. AND SUBSIDIARIES
(Tabular Amounts in Millions, Except Per Share and Percentage Data)
actions, the Company has provided a cumulative deferred tax liability in the amount of $8.8 million with respect to the cumulative unremitted earnings of the Company as of
December 31, 2011
. The Company has continued to conclude that predominantly all remaining foreign earnings in excess of this amount will be indefinitely reinvested in its foreign operations and, therefore, the recording of deferred tax liabilities for such unremitted earnings is not required. It is impracticable to determine the total amount of unrecognized deferred taxes with respect to these permanently reinvested earnings; however, foreign tax credits would be available to partially reduce U.S. income taxes in the event of a distribution.
A detailed summary of the total deferred tax assets and liabilities in the Company's Consolidated Balance Sheets resulting from differences in the book and tax basis of assets and liabilities follows:
|
|
December 31
|
||||||
|
|
2011
|
2010
|
|||||
|
Deferred tax assets
|
|
|
|||||
|
Tax carryforwards
|
$
|
62.7
|
|
$
|
82.0
|
|
|
|
Accrued expenses and reserves
|
54.7
|
|
58.1
|
|
|||
|
Accrued pension benefits
|
24.9
|
|
24.1
|
|
|||
|
Other employee benefits
|
12.4
|
|
11.1
|
|
|||
|
Other
|
11.4
|
|
11.2
|
|
|||
|
Total deferred tax assets
|
166.1
|
|
186.5
|
|
|||
|
Less: Valuation allowance
|
65.5
|
|
76.9
|
|
|||
|
|
100.6
|
|
109.6
|
|
|||
|
Deferred tax liabilities
|
|
|
|||||
|
Depreciation and depletion
|
47.4
|
|
48.8
|
|
|||
|
Partnership investment - development costs
|
18.7
|
|
20.3
|
|
|||
|
Unremitted foreign earnings
|
8.8
|
|
9.8
|
|
|||
|
Inventories
|
4.2
|
|
3.6
|
|
|||
|
Total deferred tax liabilities
|
79.1
|
|
82.5
|
|
|||
|
Net deferred tax asset
|
$
|
21.5
|
|
$
|
27.1
|
|
|
The following table summarizes the tax carryforwards and associated carryforward periods and related valuation allowances where the Company has determined that realization is uncertain:
|
|
December 31, 2011
|
||||||||
|
|
Net deferred tax
asset
|
Valuation
allowance
|
Carryforwards
expire during:
|
||||||
|
Non-U.S. net operating loss
|
$
|
34.7
|
|
$
|
34.7
|
|
2012-Indefinite
|
||
|
State losses
|
12.1
|
|
9.8
|
|
2012-2031
|
||||
|
Alternative minimum tax credit
|
5.0
|
|
—
|
|
Indefinite
|
||||
|
Foreign tax credit
|
2.1
|
|
—
|
|
2019-2020
|
||||
|
Capital losses
|
8.8
|
|
8.8
|
|
2014-Indefinite
|
||||
|
Total
|
$
|
62.7
|
|
$
|
53.3
|
|
|||
F-32
NOTES TO CONSOLIDATED FINANCIAL STATEMENTS
NACCO INDUSTRIES, INC. AND SUBSIDIARIES
(Tabular Amounts in Millions, Except Per Share and Percentage Data)
|
|
December 31, 2010
|
||||||||
|
|
Net deferred tax
asset
|
Valuation
allowance
|
Carryforwards
expire during:
|
||||||
|
Non-U.S. net operating loss
|
$
|
40.9
|
|
$
|
40.9
|
|
2011-Indefinite
|
||
|
State losses
|
13.9
|
|
10.8
|
|
2011-2030
|
||||
|
Alternative minimum tax credit
|
8.6
|
|
—
|
|
Indefinite
|
||||
|
Foreign tax credit
|
6.6
|
|
—
|
|
2013-2019
|
||||
|
Capital losses
|
8.2
|
|
8.2
|
|
2011-Indefinite
|
||||
|
General business credit
|
3.8
|
|
—
|
|
2024-2030
|
||||
|
Total
|
$
|
82.0
|
|
$
|
59.9
|
|
|
||
The Company continually evaluates its deferred tax assets to determine if a valuation allowance is required. A valuation allowance is required where realization is determined to no longer meet the “more likely than not” standard. During 2008 and continuing into 2009, significant downturns were experienced in NMHG's major markets. The significant decrease in the operations, and certain actions taken by management to reduce NMHG's manufacturing capacity to more appropriate levels, resulted in a three-year cumulative loss for each of NMHG's Australian, European and U.S. operations. As a result, valuation allowances against deferred tax assets for these operations have been provided. Although NMHG projects earnings over the longer term for the operations, such longer-term forecasts cannot be utilized to support the future utilization of deferred tax assets when a three-year cumulative loss is present.
The establishment of a valuation allowance does not have an impact on cash, nor does such an allowance preclude the Company from using its loss carryforwards or other deferred tax assets in future periods. The tax net operating losses that comprise the Australian and the substantial portion of the European deferred tax assets do not expire under local law and the U.S. state taxing jurisdictions provide for a carryforward period of up to 20 years.
During
2011
and 2010, the net valuation allowance provided against certain deferred tax assets decreased by $11.4 million and increased by $10.4 million, respectively. The change in the total valuation allowance in 2011 included a net decrease in tax expense of $9.5 million and a decrease in the overall U.S. dollar value of valuation allowances previously recorded in foreign currencies and amounts recorded directly in equity of $1.9 million. The change in the total valuation allowance in 2010 included a net increase in tax expense of $9.1 million and an increase in the overall U.S. dollar value of valuation allowances previously recorded in foreign currencies and amounts recorded directly in equity of approximately $1.3 million.
Based upon the review of historical earnings and trends, forecasted earnings and the relevant expiration of carryforwards, the Company believes the valuation allowances provided are appropriate. At
December 31, 2011
, the Company had gross net operating loss carryforwards in non-U.S. jurisdictions of $126.4 million and U.S. state jurisdictions of $300.3 million. The Company expects that if the major markets for its products continue to experience economic recovery similar to 2011, the Company would expect to start to release valuation allowances in taxing jurisdictions when a three-year cumulative loss is no longer present and long-term forecasts are favorable.
The tax returns of the Company and certain of its subsidiaries are under routine examination by various taxing authorities. The Company has not been informed of any material assessment for which an accrual has not been previously provided and the Company would vigorously contest any material assessment. Management believes any potential adjustment would not materially affect the Company's financial condition or results of operations.
F-33
NOTES TO CONSOLIDATED FINANCIAL STATEMENTS
NACCO INDUSTRIES, INC. AND SUBSIDIARIES
(Tabular Amounts in Millions, Except Per Share and Percentage Data)
The following is a reconciliation of the Company's total gross unrecognized tax benefits, defined as the aggregate tax effect of differences between tax return positions and the benefits recognized in the financial statements for the years ended
December 31, 2011
and
2010
. Approximately $9.6 million and $10.0 million of these gross amounts as of
December 31, 2011
and
2010
, respectively, relate to permanent items that, if recognized, would impact the effective income tax rate. This amount differs from the gross unrecognized tax benefits presented in the table below due to the decrease in U.S. federal income taxes which would occur upon the recognition of the state tax benefits included herein.
|
|
2011
|
2010
|
|||||
|
Balance at January 1
|
$
|
11.2
|
|
$
|
16.6
|
|
|
|
Net additions for tax positions of prior years
|
0.1
|
|
—
|
|
|||
|
Additions based on tax positions related to the current year
|
1.1
|
|
1.6
|
|
|||
|
Reductions due to settlements with taxing authorities and the lapse of the applicable statute of limitations
|
(1.6
|
)
|
(6.6
|
)
|
|||
|
Other changes in unrecognized tax benefits including foreign currency translations adjustments
|
(0.1
|
)
|
(0.4
|
)
|
|||
|
Balance at December 31
|
$
|
10.7
|
|
$
|
11.2
|
|
|
The Company records interest and penalties on uncertain tax positions as a component of the income tax provision. The Company recognized net expense of $0.1 million, a net benefit of $1.9 million and a net benefit of $1.0 million in interest and penalties related to uncertain tax positions during 2011, 2010 and 2009, respectively. The total amount of interest and penalties accrued was $1.6 million as of both
December 31, 2011
and
2010
.
The Company expects the amount of unrecognized tax benefits will change within the next twelve months; however, the change in unrecognized tax benefits, which is reasonably possible within the next twelve months, is not expected to have a significant effect on the Company's financial position or results of operations.
In general, the Company operates in taxing jurisdictions that provide a statute of limitations period ranging from three to five years for the taxing authorities to review the applicable tax filings. The examination of the 2007 and 2008 U.S. federal tax returns was completed in May 2011; however, one unsettled issue is being pursued through the Internal Revenue Service Appeals process and is expected to be settled favorably during early 2012. The examination of the 2009 and 2010 U.S. federal tax years commenced in February 2012. The Company is currently under examination in various non-U.S. jurisdictions for which the statute of limitations has been extended. The Company believes these examinations are routine in nature and are not expected to result in any material tax assessments. The Company does not have any additional material taxing jurisdictions in which the statute of limitations has been extended beyond the applicable time frame allowed by law.
Defined Benefit Plans:
The Company maintains various defined benefit pension plans that provide benefits based on years of service and average compensation during certain periods. The Company's policy is to make contributions to fund these plans within the range allowed by applicable regulations. Plan assets consist primarily of publicly traded stocks and government and corporate bonds.
Pension benefits are frozen for all employees other than certain NACoal unconsolidated mines' employees and NMHG employees in the United Kingdom and the Netherlands. All other eligible employees of the Company, including employees whose pension benefits are frozen, receive retirement benefits under defined contribution retirement plans.
F-34
NOTES TO CONSOLIDATED FINANCIAL STATEMENTS
NACCO INDUSTRIES, INC. AND SUBSIDIARIES
(Tabular Amounts in Millions, Except Per Share and Percentage Data)
The assumptions used in accounting for the defined benefit plans were as follows for the years ended
December 31
:
|
|
2011
|
2010
|
2009
|
|||||
|
United States Plans
|
|
|
|
|||||
|
Weighted average discount rates
|
4.30% - 4.55%
|
|
5.10% - 5.30%
|
|
5.65% - 5.90%
|
|
||
|
Expected long-term rate of return on assets
|
8.25
|
%
|
8.50
|
%
|
8.50
|
%
|
||
|
Non-U.S. Plans
|
|
|||||||
|
Weighted average discount rates
|
4.25% - 5.00%
|
|
5.25% - 5.50%
|
|
5.70% - 6.00%
|
|
||
|
Rate of increase in compensation levels
|
2.50% - 3.50%
|
|
2.50% - 3.90%
|
|
2.50% - 4.00%
|
|
||
|
Expected long-term rate of return on assets
|
5.00% - 8.00%
|
|
5.50% - 8.25%
|
|
3.50% - 8.50%
|
|
||
Each year, the assumptions used to calculate the benefit obligation are used to calculate the net periodic pension expense for the following year.
Set forth below is a detail of the net periodic pension expense for the defined benefit plans for the years ended
December 31
:
|
|
2011
|
2010
|
2009
|
||||||||
|
United States Plans
|
|
|
|
||||||||
|
Service cost
|
$
|
—
|
|
$
|
—
|
|
$
|
0.3
|
|
||
|
Interest cost
|
7.4
|
|
7.9
|
|
8.4
|
|
|||||
|
Expected return on plan assets
|
(9.5
|
)
|
(8.5
|
)
|
(8.8
|
)
|
|||||
|
Amortization of actuarial loss
|
5.5
|
|
4.8
|
|
4.8
|
|
|||||
|
Amortization of prior service cost (credit)
|
(0.4
|
)
|
(0.4
|
)
|
0.1
|
|
|||||
|
Net periodic pension expense
|
$
|
3.0
|
|
$
|
3.8
|
|
$
|
4.8
|
|
||
|
Non-U.S. Plans
|
|
|
|
||||||||
|
Service cost
|
$
|
2.2
|
|
$
|
1.6
|
|
$
|
1.4
|
|
||
|
Interest cost
|
7.7
|
|
7.0
|
|
6.9
|
|
|||||
|
Expected return on plan assets
|
(9.4
|
)
|
(8.6
|
)
|
(8.3
|
)
|
|||||
|
Amortization of actuarial loss
|
3.7
|
|
2.9
|
|
1.6
|
|
|||||
|
Amortization of prior service credit
|
(0.2
|
)
|
(0.1
|
)
|
(0.1
|
)
|
|||||
|
Amortization of transition liability
|
0.2
|
|
0.2
|
|
0.1
|
|
|||||
|
Net periodic pension expense
|
$
|
4.2
|
|
$
|
3.0
|
|
$
|
1.6
|
|
||
F-35
NOTES TO CONSOLIDATED FINANCIAL STATEMENTS
NACCO INDUSTRIES, INC. AND SUBSIDIARIES
(Tabular Amounts in Millions, Except Per Share and Percentage Data)
Set forth below is a detail of other changes in plan assets and benefit obligations recognized in other comprehensive income (loss) for the year ended
December 31
:
|
|
2011
|
2010
|
2009
|
||||||||
|
United States Plans
|
|
|
|
||||||||
|
Current year actuarial loss
|
$
|
18.6
|
|
$
|
2.6
|
|
$
|
0.2
|
|
||
|
Amortization of actuarial loss
|
(5.5
|
)
|
(4.8
|
)
|
(4.8
|
)
|
|||||
|
Current year prior service credit
|
—
|
|
(0.2
|
)
|
(2.9
|
)
|
|||||
|
Amortization of prior service (credit) cost
|
0.4
|
|
0.4
|
|
(0.1
|
)
|
|||||
|
Total recognized in other comprehensive income (loss)
|
$
|
13.5
|
|
$
|
(2.0
|
)
|
$
|
(7.6
|
)
|
||
|
Non-U.S. Plans
|
|
|
|
||||||||
|
Current year actuarial loss
|
$
|
7.8
|
|
$
|
3.4
|
|
$
|
11.4
|
|
||
|
Amortization of actuarial loss
|
(3.7
|
)
|
(2.9
|
)
|
(1.6
|
)
|
|||||
|
Amortization of prior service credit
|
0.2
|
|
0.1
|
|
0.1
|
|
|||||
|
Amortization of transition liability
|
(0.2
|
)
|
(0.2
|
)
|
(0.1
|
)
|
|||||
|
Total recognized in other comprehensive income (loss)
|
$
|
4.1
|
|
$
|
0.4
|
|
$
|
9.8
|
|
||
F-36
NOTES TO CONSOLIDATED FINANCIAL STATEMENTS
NACCO INDUSTRIES, INC. AND SUBSIDIARIES
(Tabular Amounts in Millions, Except Per Share and Percentage Data)
The following table sets forth the changes in the benefit obligation and the plan assets during the year and the funded status of the defined benefit plans at
December 31
:
|
|
2011
|
2010
|
|||||||||||||
|
|
U.S.
Plans
|
Non-U.S.
Plans
|
U.S. Plans
|
Non-U.S.
Plans
|
|||||||||||
|
Change in benefit obligation
|
|
|
|
|
|||||||||||
|
Projected benefit obligation at beginning of year
|
$
|
146.0
|
|
$
|
139.9
|
|
$
|
140.8
|
|
$
|
132.6
|
|
|||
|
Service cost
|
—
|
|
2.2
|
|
—
|
|
1.6
|
|
|||||||
|
Interest cost
|
7.4
|
|
7.7
|
|
7.9
|
|
7.0
|
|
|||||||
|
Actuarial (gain) loss
|
11.6
|
|
(2.5
|
)
|
7.0
|
|
8.7
|
|
|||||||
|
Benefits paid
|
(10.0
|
)
|
(7.1
|
)
|
(9.5
|
)
|
(5.2
|
)
|
|||||||
|
Employee contributions
|
—
|
|
0.7
|
|
—
|
|
0.7
|
|
|||||||
|
Plan amendments
|
—
|
|
—
|
|
(0.2
|
)
|
—
|
|
|||||||
|
Foreign currency exchange rate changes
|
—
|
|
(0.7
|
)
|
—
|
|
(5.5
|
)
|
|||||||
|
Projected benefit obligation at end of year
|
$
|
155.0
|
|
$
|
140.2
|
|
$
|
146.0
|
|
$
|
139.9
|
|
|||
|
Accumulated benefit obligation at end of year
|
$
|
155.0
|
|
$
|
133.1
|
|
$
|
146.0
|
|
$
|
138.0
|
|
|||
|
Change in plan assets
|
|
|
|
|
|||||||||||
|
Fair value of plan assets at beginning of year
|
$
|
107.1
|
|
$
|
119.1
|
|
$
|
90.1
|
|
$
|
107.8
|
|
|||
|
Actual return on plan assets
|
2.4
|
|
(1.1
|
)
|
12.8
|
|
14.0
|
|
|||||||
|
Employer contributions
|
13.0
|
|
5.2
|
|
13.7
|
|
6.4
|
|
|||||||
|
Employee contributions
|
—
|
|
0.7
|
|
—
|
|
0.7
|
|
|||||||
|
Benefits paid
|
(10.0
|
)
|
(7.1
|
)
|
(9.5
|
)
|
(5.2
|
)
|
|||||||
|
Foreign currency exchange rate changes
|
—
|
|
(0.5
|
)
|
—
|
|
(4.6
|
)
|
|||||||
|
Fair value of plan assets at end of year
|
$
|
112.5
|
|
$
|
116.3
|
|
$
|
107.1
|
|
$
|
119.1
|
|
|||
|
Funded status at end of year
|
$
|
(42.5
|
)
|
$
|
(23.9
|
)
|
$
|
(38.9
|
)
|
$
|
(20.8
|
)
|
|||
|
Amounts recognized in the balance sheets consist of:
|
|
|
|
|
|||||||||||
|
Noncurrent assets
|
$
|
—
|
|
$
|
—
|
|
$
|
—
|
|
$
|
0.8
|
|
|||
|
Current liabilities
|
(0.7
|
)
|
—
|
|
(0.3
|
)
|
—
|
|
|||||||
|
Noncurrent liabilities
|
(41.8
|
)
|
(23.9
|
)
|
(38.6
|
)
|
(21.6
|
)
|
|||||||
|
|
$
|
(42.5
|
)
|
$
|
(23.9
|
)
|
$
|
(38.9
|
)
|
$
|
(20.8
|
)
|
|||
|
Components of accumulated other comprehensive income (loss) consist of:
|
|
|
|
|
|||||||||||
|
Actuarial loss
|
$
|
84.5
|
|
$
|
51.7
|
|
$
|
71.4
|
|
$
|
47.6
|
|
|||
|
Prior service credit
|
(2.0
|
)
|
(0.1
|
)
|
(2.4
|
)
|
(0.2
|
)
|
|||||||
|
Transition obligation
|
—
|
|
0.6
|
|
—
|
|
0.7
|
|
|||||||
|
Deferred taxes
|
(29.9
|
)
|
(1.5
|
)
|
(24.9
|
)
|
(1.1
|
)
|
|||||||
|
Change in statutory tax rate
|
(1.2
|
)
|
(10.6
|
)
|
(1.2
|
)
|
(10.6
|
)
|
|||||||
|
Foreign currency translation adjustment
|
—
|
|
(0.8
|
)
|
—
|
|
(0.8
|
)
|
|||||||
|
|
$
|
51.4
|
|
$
|
39.3
|
|
$
|
42.9
|
|
$
|
35.6
|
|
|||
The transition obligation, prior service credit and actuarial loss included in accumulated other comprehensive income (loss) expected to be recognized in net periodic benefit cost in
2012
are $0.1 million (less than $0.1 million net of tax), $0.3 million ($0.2 million net of tax) and $10.3 million ($6.7 million net of tax), respectively.
The projected benefit obligation included in the table above represents the actuarial present value of benefits attributable to employee service rendered to date, including the effects of estimated future pay increases. The accumulated benefit obligation also reflects the actuarial present value of benefits attributable to employee service rendered to date, but does not include the effects of estimated future pay increases.
F-37
NOTES TO CONSOLIDATED FINANCIAL STATEMENTS
NACCO INDUSTRIES, INC. AND SUBSIDIARIES
(Tabular Amounts in Millions, Except Per Share and Percentage Data)
The Company expects to contribute $8.0 million and $5.0 million to its U.S. and non-U.S. pension plans, respectively, in
2012
.
The Company maintains two supplemental defined benefit plans that pay monthly benefits to participants directly out of corporate funds. All other pension benefit payments are made from assets of the pension plans. Future pension benefit payments expected to be paid from assets of the pension plans are:
|
|
U.S. Plans
|
Non-U.S. Plans
|
|||||
|
2012
|
$
|
10.8
|
|
$
|
4.7
|
|
|
|
2013
|
10.5
|
|
4.9
|
|
|||
|
2014
|
10.6
|
|
5.6
|
|
|||
|
2015
|
10.7
|
|
6.6
|
|
|||
|
2016
|
10.8
|
|
6.6
|
|
|||
|
2017 - 2021
|
53.6
|
|
39.9
|
|
|||
|
|
$
|
107.0
|
|
$
|
68.3
|
|
|
The expected long-term rate of return on plan assets reflects management's expectations of long-term rates of return on funds invested to provide for benefits included in the projected benefit obligations. The Company has established the expected long-term rate of return assumption for plan assets by considering historical rates of return over a period of time that is consistent with the long-term nature of the underlying obligations of these plans. The historical rates of return for each of the asset classes used by the Company to determine its estimated rate of return assumption were based upon the rates of return earned by investments in the equivalent benchmark market indices for each of the asset classes.
Expected returns for pension plans are based on a calculated market-related value of assets. Under this methodology, asset gains and losses resulting from actual returns that differ from the Company's expected returns are recognized in the market-related value of assets ratably over three years.
The pension plans maintain an investment policy that, among other things, establishes a portfolio asset allocation methodology with percentage allocation bands for individual asset classes. The investment policy provides that investments are reallocated between asset classes as balances exceed or fall below the appropriate allocation bands.
The following is the actual allocation percentage and target allocation percentage for the U.S. pension plan assets at December 31:
|
|
2011
Actual
Allocation
|
2010
Actual
Allocation
|
Target Allocation
Range
|
||||
|
U.S. equity securities
|
52.6
|
%
|
52.8
|
%
|
41.0% - 62.0%
|
||
|
Non-U.S. equity securities
|
11.8
|
%
|
13.1
|
%
|
10.0% - 16.0%
|
||
|
Fixed income securities
|
34.6
|
%
|
33.6
|
%
|
30.0% - 40.0%
|
||
|
Money market
|
1.0
|
%
|
0.5
|
%
|
0.0% - 10.0%
|
||
The following is the actual allocation percentage and target allocation percentage for the NMHG U.K. pension plan assets at December 31:
|
|
2011
Actual Allocation |
2010
Actual Allocation |
Target Allocation
Range
|
||||
|
U.K. equity securities
|
34.9
|
%
|
34.5
|
%
|
33.5% - 36.5%
|
||
|
Non-U.K. equity securities
|
34.4
|
%
|
36.0
|
%
|
27.5% - 42.5%
|
||
|
Fixed income securities
|
30.7
|
%
|
29.5
|
%
|
25.5% - 34.5%
|
||
F-38
NOTES TO CONSOLIDATED FINANCIAL STATEMENTS
NACCO INDUSTRIES, INC. AND SUBSIDIARIES
(Tabular Amounts in Millions, Except Per Share and Percentage Data)
The following is the actual allocation percentage and target allocation percentage for the HBB Canadian pension plan assets at December 31:
|
|
2011
Actual Allocation |
2010
Actual Allocation |
Target Allocation
Range
|
||||
|
Canadian equity securities
|
33.0
|
%
|
36.0
|
%
|
28.0% - 38.0%
|
||
|
Non-Canadian equity securities
|
34.0
|
%
|
33.0
|
%
|
27.0% - 37.0%
|
||
|
Fixed income securities
|
33.0
|
%
|
31.0
|
%
|
25.0% - 45.0%
|
||
|
Cash and cash equivalents
|
—
|
%
|
—
|
%
|
0.0% - 5.0%
|
||
NMHG maintains a pension plan for certain employees in The Netherlands, which has purchased annuity contracts to meet its obligations.
The defined benefit pension plans do not have any direct ownership of NACCO common stock.
The fair value of each major category of U.S. plan assets for the Company's pension plans are valued using quoted market prices in active markets for identical assets, or Level 1 in the fair value hierarchy. The fair value of each major category of Non-U.S. plan assets for the Company's pension plans are valued using observable inputs, either directly or indirectly, other than quoted market prices in active markets for identical assets, or Level 2 in the fair value hierarchy. Following are the values as of
December 31
:
|
Level 1
|
Level 2
|
||||||||||||||
|
|
2011
|
2010
|
2011
|
2010
|
|||||||||||
|
U.S. equity securities
|
$
|
59.2
|
|
$
|
56.7
|
|
$
|
12.6
|
|
$
|
12.4
|
|
|||
|
U.K. equity securities
|
—
|
|
—
|
|
35.7
|
|
35.6
|
|
|||||||
|
Non-U.S., non-U.K. equity securities
|
13.3
|
|
14.0
|
|
25.7
|
|
28.1
|
|
|||||||
|
Fixed income securities
|
38.9
|
|
35.9
|
|
32.9
|
|
32.0
|
|
|||||||
|
Annuity contracts
|
—
|
|
—
|
|
9.4
|
|
11.0
|
|
|||||||
|
Money market
|
1.1
|
|
0.5
|
|
—
|
|
—
|
|
|||||||
|
Total
|
$
|
112.5
|
|
$
|
107.1
|
|
$
|
116.3
|
|
$
|
119.1
|
|
|||
Postretirement Health Care and Life Insurance:
The Company also maintains health care plans which provide benefits to eligible retired employees. All health care plans of the Company have a cap on the Company's share of the costs. These plans have no assets. Under the Company's current policy, plan benefits are funded at the time they are due to participants. Effective January 1, 2010, NMHG eliminated its retiree life insurance plan for non-union retirees. Effective June 30, 2010, the parent company eliminated its subsidized retiree medical plan. Effective September 1, 2010, HBB eliminated its retiree life insurance plan. Effective December 31, 2011, NMHG eliminated all retiree life insurance plans and its subsidized retiree medical plan for employees who have not retired before such date. As of January 1, 2012, the Company will no longer maintain any retiree life insurance plans.
The assumptions used in accounting for the postretirement benefit plans are set forth below for the years ended
December 31
:
|
|
2011
|
2010
|
2009
|
|||||
|
Weighted average discount rates
|
3.90
|
%
|
4.70
|
%
|
5.30
|
%
|
||
|
Health care cost trend rate assumed for next year
|
7.5
|
%
|
7.5
|
%
|
6.0
|
%
|
||
|
Rate to which the cost trend rate is assumed to decline (ultimate trend rate)
|
5.0
|
%
|
5.0
|
%
|
5.0
|
%
|
||
|
Year that the rate reaches the ultimate trend rate
|
2018
|
|
2018
|
|
2012
|
|
||
Each year, the assumptions used to calculate the benefit obligation are used to calculate the net periodic benefit cost for the following year.
F-39
NOTES TO CONSOLIDATED FINANCIAL STATEMENTS
NACCO INDUSTRIES, INC. AND SUBSIDIARIES
(Tabular Amounts in Millions, Except Per Share and Percentage Data)
Assumed health care cost trend rates can have a significant effect on the amounts reported for the health care plans. A one-percentage-point change in the assumed health care cost trend rates would have the following effects at
December 31, 2011
:
|
|
1-Percentage-Point
Increase
|
1-Percentage-Point
Decrease
|
|||||
|
Effect on total of service and interest cost
|
$
|
—
|
|
$
|
—
|
|
|
|
Effect on postretirement benefit obligation
|
$
|
0.2
|
|
$
|
(0.2
|
)
|
|
Set forth below is a detail of the net periodic benefit income for the postretirement health care and life insurance plans for the years ended
December 31
:
|
|
2011
|
2010
|
2009
|
||||||||
|
Service cost
|
$
|
0.1
|
|
$
|
0.2
|
|
$
|
0.2
|
|
||
|
Interest cost
|
0.3
|
|
0.4
|
|
0.6
|
|
|||||
|
Amortization of actuarial (gain) loss
|
0.2
|
|
(0.3
|
)
|
0.7
|
|
|||||
|
Amortization of prior service credit
|
(0.1
|
)
|
(0.3
|
)
|
(3.3
|
)
|
|||||
|
Plan amendments
|
(2.9
|
)
|
(0.9
|
)
|
—
|
|
|||||
|
Net periodic benefit income
|
$
|
(2.4
|
)
|
$
|
(0.9
|
)
|
$
|
(1.8
|
)
|
||
Set forth below is a detail of other changes in plan assets and benefit obligations recognized in other comprehensive income (loss) for the year ended
December 31
:
|
|
2011
|
2010
|
2009
|
||||||||
|
Current year actuarial (gain) loss
|
$
|
0.2
|
|
$
|
0.2
|
|
$
|
1.6
|
|
||
|
Amortization of actuarial gain (loss)
|
(0.2
|
)
|
0.3
|
|
(0.7
|
)
|
|||||
|
Current year prior service credit
|
(2.9
|
)
|
—
|
|
(3.1
|
)
|
|||||
|
Amortization of prior service credit
|
3.0
|
|
0.3
|
|
3.3
|
|
|||||
|
Total recognized in other comprehensive income (loss)
|
$
|
0.1
|
|
$
|
0.8
|
|
$
|
1.1
|
|
||
F-40
NOTES TO CONSOLIDATED FINANCIAL STATEMENTS
NACCO INDUSTRIES, INC. AND SUBSIDIARIES
(Tabular Amounts in Millions, Except Per Share and Percentage Data)
The following sets forth the changes in benefit obligations during the year and the funded status of the postretirement health care and life insurance plans at
December 31
:
|
|
2011
|
2010
|
|||||
|
Change in benefit obligation
|
|
|
|||||
|
Benefit obligation at beginning of year
|
$
|
7.1
|
|
$
|
8.3
|
|
|
|
Service cost
|
0.1
|
|
0.2
|
|
|||
|
Interest cost
|
0.3
|
|
0.4
|
|
|||
|
Actuarial gain
|
0.2
|
|
0.1
|
|
|||
|
Plan amendments
|
(2.9
|
)
|
(0.8
|
)
|
|||
|
Benefits paid
|
(0.6
|
)
|
(1.1
|
)
|
|||
|
Benefit obligation at end of year
|
$
|
4.2
|
|
$
|
7.1
|
|
|
|
Funded status at end of year
|
$
|
(4.2
|
)
|
$
|
(7.1
|
)
|
|
|
Amounts recognized in the balance sheets consist of:
|
|
|
|||||
|
Current liabilities
|
$
|
(0.5
|
)
|
$
|
(0.7
|
)
|
|
|
Noncurrent liabilities
|
(3.7
|
)
|
(6.4
|
)
|
|||
|
|
$
|
(4.2
|
)
|
$
|
(7.1
|
)
|
|
|
Components of accumulated other comprehensive income (loss) consist of:
|
|
|
|||||
|
Actuarial gain
|
$
|
0.2
|
|
$
|
0.2
|
|
|
|
Prior service credit
|
(0.7
|
)
|
(0.8
|
)
|
|||
|
Deferred taxes
|
0.2
|
|
0.2
|
|
|||
|
|
$
|
(0.3
|
)
|
$
|
(0.4
|
)
|
|
The prior service credit included in accumulated other comprehensive income (loss) expected to be recognized in net periodic benefit cost in
2012
is $0.2 million ($0.1 million net of tax). No transition obligation or actuarial loss is expected to be recognized in net periodic benefit cost in
2012
.
Future postretirement benefit payments expected to be paid are:
|
2012
|
$
|
0.4
|
|
|
2013
|
0.4
|
|
|
|
2014
|
0.4
|
|
|
|
2015
|
0.4
|
|
|
|
2016
|
0.3
|
|
|
|
2017 - 2021
|
1.6
|
|
|
|
|
$
|
3.5
|
|
Defined Contribution Plans:
NACCO and its subsidiaries have defined contribution (401(k)) plans for substantially all U.S. employees and similar plans for employees outside of the United States. For NACCO and those subsidiaries, other than HBB, the applicable company matches employee contributions based on plan provisions. In addition, NACCO and certain other subsidiaries have defined contribution retirement plans that generally provide for a stated minimum employer contribution. These plans also permit additional contributions whereby the applicable company's contribution to participants is determined annually based on a formula that includes the effect of actual compared with targeted operating results and the age and compensation of the participants. Total costs, including Company contributions, for these plans were $24.8 million, $12.7 million and $5.4 million in
2011
,
2010
and
2009
, respectively. During 2010 and 2009, the Company and certain subsidiaries of the Company suspended or reduced the company match of employee contributions and the employer contributions to its defined contribution retirement plans.
F-41
NOTES TO CONSOLIDATED FINANCIAL STATEMENTS
NACCO INDUSTRIES, INC. AND SUBSIDIARIES
(Tabular Amounts in Millions, Except Per Share and Percentage Data)
NACCO is a holding company with the following principal subsidiaries: NMHG, HBB, KC and NACoal. See Note 1 for a discussion of the Company's industries and product lines. NACCO's non-operating segment, NACCO and Other, includes the accounts of the parent company and Bellaire. NACCO's reportable segments include the following three management units: NMHG Americas, NMHG Europe and NMHG Other. NMHG Americas includes its operations in the United States, Canada, Mexico, Brazil and Latin America. NMHG Europe includes its operations in Europe, the Middle East and Africa. NMHG Other includes NMHG's corporate headquarters and its immaterial operating segments, which include operations in the Asia-Pacific region. Certain amounts are allocated to these geographic management units and are included in the segment results presented below, including product development costs, corporate headquarters expenses, information technology infrastructure costs and NACCO management fees. These allocations among geographic management units are determined by NMHG's corporate headquarters and not directly incurred by the geographic operations. In addition, other costs are incurred directly by these geographic management units based upon the location of the manufacturing plant or sales units, including manufacturing variances, product liability, warranty and sales discounts, which may not be associated with the geographic management unit of the ultimate end user sales location where revenues and margins are reported. Therefore, the reported results of each NMHG segment cannot be considered stand-alone entities as all NMHG reportable segments are inter-related and integrate into a single global NMHG business.
Financial information for each of NACCO's reportable segments is presented in the following table. The accounting policies of the reportable segments are described in Note 2. The line “Eliminations” in the revenues section eliminates revenues from HBB sales to KC. The amounts of these revenues are based on current market prices of similar third-party transactions. No other sales transactions occur among reportable segments. Other transactions among reportable segments are recognized based on current market prices of similar third-party transactions.
The parent company charges management fees to its operating subsidiaries for services provided by the corporate headquarters. The management fees are based upon estimated parent company resources devoted to providing centralized services and stewardship activities and are allocated among all subsidiaries based upon the relative size and complexity of each subsidiary. To determine the amounts and allocation of management fees among the subsidiaries each year, the parent company reviews the time its employees devoted to each operating subsidiary and the estimated costs for providing centralized services and stewardship activities in the next year. In addition, the parent company reviews the amount of management fees allocated to its operating subsidiaries each quarter to ensure the amount continues to be reasonable based on the actual costs incurred to date. The Company believes the allocation method is consistently applied and reasonable. Total
2011
,
2010
and
2009
fees were $16.9 million, $16.0 million and $11.5 million, respectively.
F-42
NOTES TO CONSOLIDATED FINANCIAL STATEMENTS
NACCO INDUSTRIES, INC. AND SUBSIDIARIES
(Tabular Amounts in Millions, Except Per Share and Percentage Data)
|
|
2011
|
2010
|
2009
|
||||||||
|
Revenues from external customers
|
|
|
|
||||||||
|
NMHG
|
|
|
|
||||||||
|
NMHG Americas
|
$
|
1,570.7
|
|
$
|
1,140.7
|
|
$
|
853.4
|
|
||
|
NMHG Europe
|
751.7
|
|
476.6
|
|
390.1
|
|
|||||
|
NMHG Other
|
218.4
|
|
184.6
|
|
231.7
|
|
|||||
|
|
2,540.8
|
|
1,801.9
|
|
1,475.2
|
|
|||||
|
HBB
|
493.0
|
|
515.7
|
|
497.0
|
|
|||||
|
KC
|
221.2
|
|
219.6
|
|
213.9
|
|
|||||
|
NACoal
|
81.8
|
|
156.8
|
|
129.5
|
|
|||||
|
NACCO and Other
|
—
|
|
—
|
|
—
|
|
|||||
|
Eliminations
|
(5.6
|
)
|
(6.5
|
)
|
(5.0
|
)
|
|||||
|
Total
|
$
|
3,331.2
|
|
$
|
2,687.5
|
|
$
|
2,310.6
|
|
||
|
Gross profit
|
|
|
|
||||||||
|
NMHG
|
|
|
|
||||||||
|
NMHG Americas
|
$
|
244.0
|
|
$
|
176.3
|
|
$
|
128.4
|
|
||
|
NMHG Europe
|
110.2
|
|
73.8
|
|
31.6
|
|
|||||
|
NMHG Other
|
29.3
|
|
29.7
|
|
24.7
|
|
|||||
|
|
383.5
|
|
279.8
|
|
184.7
|
|
|||||
|
HBB
|
97.2
|
|
111.1
|
|
107.4
|
|
|||||
|
KC
|
97.4
|
|
97.7
|
|
94.8
|
|
|||||
|
NACoal
|
15.3
|
|
37.9
|
|
21.3
|
|
|||||
|
NACCO and Other
|
(0.2
|
)
|
(0.2
|
)
|
(0.1
|
)
|
|||||
|
Eliminations
|
(0.1
|
)
|
(0.1
|
)
|
—
|
|
|||||
|
Total
|
$
|
593.1
|
|
$
|
526.2
|
|
$
|
408.1
|
|
||
|
Selling, general and administrative expenses
|
|
|
|
||||||||
|
NMHG
|
|
|
|
||||||||
|
NMHG Americas
|
$
|
157.0
|
|
$
|
127.8
|
|
$
|
104.8
|
|
||
|
NMHG Europe
|
88.3
|
|
72.8
|
|
73.3
|
|
|||||
|
NMHG Other
|
28.0
|
|
28.9
|
|
29.9
|
|
|||||
|
|
273.3
|
|
229.5
|
|
208.0
|
|
|||||
|
HBB
|
63.4
|
|
65.2
|
|
57.0
|
|
|||||
|
KC
|
94.9
|
|
91.8
|
|
88.1
|
|
|||||
|
NACoal
|
26.6
|
|
28.2
|
|
25.9
|
|
|||||
|
NACCO and Other
|
7.1
|
|
10.6
|
|
9.3
|
|
|||||
|
Total
|
$
|
465.3
|
|
$
|
425.3
|
|
$
|
388.3
|
|
||
F-43
NOTES TO CONSOLIDATED FINANCIAL STATEMENTS
NACCO INDUSTRIES, INC. AND SUBSIDIARIES
(Tabular Amounts in Millions, Except Per Share and Percentage Data)
|
|
2011
|
2010
|
2009
|
||||||||
|
Operating profit (loss)
|
|
|
|
||||||||
|
NMHG
|
|
|
|
||||||||
|
NMHG Americas
|
$
|
86.8
|
|
$
|
48.5
|
|
$
|
23.5
|
|
||
|
NMHG Europe
|
21.9
|
|
2.7
|
|
(47.9
|
)
|
|||||
|
NMHG Other
|
1.3
|
|
(5.1
|
)
|
(6.8
|
)
|
|||||
|
|
110.0
|
|
46.1
|
|
(31.2
|
)
|
|||||
|
HBB
|
33.8
|
|
45.9
|
|
50.4
|
|
|||||
|
KC
|
2.5
|
|
5.9
|
|
6.7
|
|
|||||
|
NACoal
|
35.2
|
|
53.3
|
|
42.6
|
|
|||||
|
NACCO and Other
|
(7.3
|
)
|
(10.8
|
)
|
(9.4
|
)
|
|||||
|
Eliminations
|
(0.1
|
)
|
(0.1
|
)
|
—
|
|
|||||
|
Total
|
$
|
174.1
|
|
$
|
140.3
|
|
$
|
59.1
|
|
||
|
Interest expense
|
|
|
|
||||||||
|
NMHG
|
|
|
|
||||||||
|
NMHG Americas
|
$
|
15.8
|
|
$
|
10.1
|
|
$
|
11.4
|
|
||
|
NMHG Europe
|
0.5
|
|
2.5
|
|
3.5
|
|
|||||
|
NMHG Other
|
(0.5
|
)
|
4.0
|
|
4.1
|
|
|||||
|
|
15.8
|
|
16.6
|
|
19.0
|
|
|||||
|
HBB
|
5.2
|
|
7.2
|
|
8.6
|
|
|||||
|
KC
|
0.5
|
|
0.3
|
|
0.4
|
|
|||||
|
NACoal
|
3.0
|
|
3.3
|
|
4.1
|
|
|||||
|
NACCO and Other
|
—
|
|
—
|
|
0.4
|
|
|||||
|
Eliminations
|
—
|
|
—
|
|
(0.3
|
)
|
|||||
|
Total
|
$
|
24.5
|
|
$
|
27.4
|
|
$
|
32.2
|
|
||
|
Interest income
|
|
|
|
||||||||
|
NMHG
|
|
|
|
||||||||
|
NMHG Americas
|
$
|
(1.0
|
)
|
$
|
(1.5
|
)
|
$
|
(1.7
|
)
|
||
|
NMHG Europe
|
(0.2
|
)
|
(0.2
|
)
|
(0.4
|
)
|
|||||
|
NMHG Other
|
(0.6
|
)
|
(0.6
|
)
|
(0.7
|
)
|
|||||
|
|
(1.8
|
)
|
(2.3
|
)
|
(2.8
|
)
|
|||||
|
HBB
|
—
|
|
—
|
|
(0.1
|
)
|
|||||
|
KC
|
—
|
|
—
|
|
—
|
|
|||||
|
NACoal
|
(0.3
|
)
|
(0.3
|
)
|
(0.3
|
)
|
|||||
|
NACCO and Other
|
—
|
|
—
|
|
(0.3
|
)
|
|||||
|
Eliminations
|
—
|
|
—
|
|
0.3
|
|
|||||
|
Total
|
$
|
(2.1
|
)
|
$
|
(2.6
|
)
|
$
|
(3.2
|
)
|
||
F-44
NOTES TO CONSOLIDATED FINANCIAL STATEMENTS
NACCO INDUSTRIES, INC. AND SUBSIDIARIES
(Tabular Amounts in Millions, Except Per Share and Percentage Data)
|
|
2011
|
2010
|
2009
|
||||||||
|
Other (income) expense
|
|
|
|
||||||||
|
NMHG
|
|
|
|
||||||||
|
NMHG Americas
|
$
|
(5.5
|
)
|
$
|
(3.0
|
)
|
$
|
(4.4
|
)
|
||
|
NMHG Europe
|
1.0
|
|
1.0
|
|
0.8
|
|
|||||
|
NMHG Other
|
(1.0
|
)
|
(0.3
|
)
|
3.0
|
|
|||||
|
|
(5.5
|
)
|
(2.3
|
)
|
(0.6
|
)
|
|||||
|
HBB
|
0.8
|
|
0.3
|
|
0.4
|
|
|||||
|
KC
|
0.1
|
|
0.1
|
|
0.1
|
|
|||||
|
NACoal
|
(1.4
|
)
|
(0.1
|
)
|
(0.6
|
)
|
|||||
|
NACCO and Other
|
(56.1
|
)
|
20.7
|
|
1.9
|
|
|||||
|
Total
|
$
|
(62.1
|
)
|
$
|
18.7
|
|
$
|
1.2
|
|
||
|
Income tax provision (benefit)
|
|
|
|
||||||||
|
NMHG
|
|
|
|
||||||||
|
NMHG Americas
|
$
|
13.1
|
|
$
|
16.3
|
|
$
|
6.9
|
|
||
|
NMHG Europe
|
—
|
|
(0.1
|
)
|
(9.4
|
)
|
|||||
|
NMHG Other
|
5.8
|
|
(14.4
|
)
|
(1.1
|
)
|
|||||
|
|
18.9
|
|
1.8
|
|
(3.6
|
)
|
|||||
|
HBB
|
9.4
|
|
14.0
|
|
15.4
|
|
|||||
|
KC
|
0.8
|
|
2.0
|
|
2.3
|
|
|||||
|
NACoal
|
4.5
|
|
10.8
|
|
8.8
|
|
|||||
|
NACCO and Other
|
18.1
|
|
(11.1
|
)
|
(2.4
|
)
|
|||||
|
Eliminations
|
—
|
|
(0.1
|
)
|
—
|
|
|||||
|
Total
|
$
|
51.7
|
|
$
|
17.4
|
|
$
|
20.5
|
|
||
|
Net income (loss) attributable to stockholders
|
|
|
|
||||||||
|
NMHG
|
|
|
|
||||||||
|
NMHG Americas
|
$
|
64.4
|
|
$
|
26.5
|
|
$
|
11.3
|
|
||
|
NMHG Europe
|
20.5
|
|
(0.3
|
)
|
(42.5
|
)
|
|||||
|
NMHG Other
|
(2.3
|
)
|
6.2
|
|
(11.9
|
)
|
|||||
|
|
82.6
|
|
32.4
|
|
(43.1
|
)
|
|||||
|
HBB
|
18.4
|
|
24.4
|
|
26.1
|
|
|||||
|
KC
|
1.1
|
|
3.5
|
|
3.9
|
|
|||||
|
NACoal
|
29.4
|
|
39.6
|
|
53.2
|
|
|||||
|
NACCO and Other
|
30.7
|
|
(20.4
|
)
|
(9.0
|
)
|
|||||
|
Eliminations
|
(0.1
|
)
|
—
|
|
—
|
|
|||||
|
Total
|
$
|
162.1
|
|
$
|
79.5
|
|
$
|
31.1
|
|
||
F-45
NOTES TO CONSOLIDATED FINANCIAL STATEMENTS
NACCO INDUSTRIES, INC. AND SUBSIDIARIES
(Tabular Amounts in Millions, Except Per Share and Percentage Data)
|
|
2011
|
2010
|
2009
|
||||||||
|
Total assets
|
|
|
|
||||||||
|
NMHG
|
|
|
|
||||||||
|
NMHG Americas
|
$
|
596.0
|
|
$
|
557.0
|
|
$
|
438.5
|
|
||
|
NMHG Europe
|
404.5
|
|
353.0
|
|
295.6
|
|
|||||
|
NMHG Other
|
116.5
|
|
131.2
|
|
180.0
|
|
|||||
|
|
1,117.0
|
|
1,041.2
|
|
914.1
|
|
|||||
|
HBB
|
201.5
|
|
251.7
|
|
217.8
|
|
|||||
|
KC
|
89.0
|
|
86.6
|
|
81.9
|
|
|||||
|
NACoal
|
278.5
|
|
269.2
|
|
266.6
|
|
|||||
|
NACCO and Other
|
169.5
|
|
71.8
|
|
105.1
|
|
|||||
|
Eliminations
|
(54.1
|
)
|
(62.2
|
)
|
(96.8
|
)
|
|||||
|
Total
|
$
|
1,801.4
|
|
$
|
1,658.3
|
|
$
|
1,488.7
|
|
||
|
Depreciation, depletion and amortization
|
|
|
|
||||||||
|
NMHG
|
|
|
|
||||||||
|
NMHG Americas
|
$
|
15.4
|
|
$
|
17.0
|
|
$
|
17.9
|
|
||
|
NMHG Europe
|
6.1
|
|
6.5
|
|
6.4
|
|
|||||
|
NMHG Other
|
9.8
|
|
10.4
|
|
11.9
|
|
|||||
|
|
31.3
|
|
33.9
|
|
36.2
|
|
|||||
|
HBB
|
4.9
|
|
3.6
|
|
3.7
|
|
|||||
|
KC
|
3.1
|
|
3.5
|
|
3.7
|
|
|||||
|
NACoal
|
7.9
|
|
9.9
|
|
9.0
|
|
|||||
|
NACCO and Other
|
0.5
|
|
1.3
|
|
1.0
|
|
|||||
|
Total
|
$
|
47.7
|
|
$
|
52.2
|
|
$
|
53.6
|
|
||
|
Capital expenditures
|
|
|
|
||||||||
|
NMHG
|
|
|
|
||||||||
|
NMHG Americas
|
$
|
7.3
|
|
$
|
5.1
|
|
$
|
1.2
|
|
||
|
NMHG Europe
|
3.9
|
|
3.5
|
|
3.3
|
|
|||||
|
NMHG Other
|
5.3
|
|
3.5
|
|
1.3
|
|
|||||
|
|
16.5
|
|
12.1
|
|
5.8
|
|
|||||
|
HBB
|
3.7
|
|
2.2
|
|
2.1
|
|
|||||
|
KC
|
2.3
|
|
2.7
|
|
1.0
|
|
|||||
|
NACoal
|
14.1
|
|
9.8
|
|
10.5
|
|
|||||
|
NACCO and Other
|
0.1
|
|
1.1
|
|
14.1
|
|
|||||
|
Eliminations
|
—
|
|
(1.6
|
)
|
—
|
|
|||||
|
Total
|
$
|
36.7
|
|
$
|
26.3
|
|
$
|
33.5
|
|
||
At
December 31, 2011
,
2010
, and 2009, NMHG Americas' total assets included $86.6 million, $90.4 million and $66.2 million, respectively, of cash. For the same periods, NMHG Europe had $88.2 million, $68.8 million and $80.2 million, respectively, of cash.
F-46
NOTES TO CONSOLIDATED FINANCIAL STATEMENTS
NACCO INDUSTRIES, INC. AND SUBSIDIARIES
(Tabular Amounts in Millions, Except Per Share and Percentage Data)
Data By Geographic Region
No single country outside of the United States comprised 10% or more of the Company's revenues from unaffiliated customers. The “Other” category below includes Canada, Mexico, South America and Asia-Pacific. In addition, no single customer comprised 10% or more of the Company's revenues from unaffiliated customers. However, HBB and NACoal each derive sales from a single customer that exceeds 10% of the respective segment's revenues. The loss of that operating segment's customer could be material to each respective operating segment.
|
|
United
States
|
Europe,
Africa and
Middle East
|
Other
|
Consolidated
|
|||||||||||
|
2011
|
|
|
|
|
|||||||||||
|
Revenues from unaffiliated customers, based on the customers’ location
|
$
|
1,797.6
|
|
$
|
758.0
|
|
$
|
775.6
|
|
$
|
3,331.2
|
|
|||
|
Long-lived assets
|
$
|
231.9
|
|
$
|
34.7
|
|
$
|
57.6
|
|
$
|
324.2
|
|
|||
|
2010
|
|
|
|
|
|||||||||||
|
Revenues from unaffiliated customers, based on the customers’ location
|
$
|
1,556.5
|
|
$
|
491.1
|
|
$
|
639.9
|
|
$
|
2,687.5
|
|
|||
|
Long-lived assets
|
$
|
227.1
|
|
$
|
40.8
|
|
$
|
66.5
|
|
$
|
334.4
|
|
|||
|
2009
|
|
|
|
|
|||||||||||
|
Revenues from unaffiliated customers, based on the customers’ location
|
$
|
1,415.5
|
|
$
|
410.6
|
|
$
|
484.5
|
|
$
|
2,310.6
|
|
|||
|
Long-lived assets
|
$
|
277.4
|
|
$
|
48.1
|
|
$
|
66.2
|
|
$
|
391.7
|
|
|||
F-47
NOTES TO CONSOLIDATED FINANCIAL STATEMENTS
NACCO INDUSTRIES, INC. AND SUBSIDIARIES
(Tabular Amounts in Millions, Except Per Share and Percentage Data)
A summary of the unaudited results of operations for the year ended
December 31
is as follows:
|
|
2011
|
||||||||||||||
|
|
First
Quarter
|
Second
Quarter
|
Third
Quarter
|
Fourth
Quarter
|
|||||||||||
|
Revenues
|
|
|
|
|
|||||||||||
|
NMHG
|
$
|
586.6
|
|
$
|
648.0
|
|
$
|
628.8
|
|
$
|
677.4
|
|
|||
|
HBB
|
100.6
|
|
104.3
|
|
126.7
|
|
161.4
|
|
|||||||
|
KC
|
40.9
|
|
40.0
|
|
48.9
|
|
91.4
|
|
|||||||
|
NACoal
|
17.9
|
|
19.4
|
|
21.0
|
|
23.5
|
|
|||||||
|
Eliminations
|
(0.5
|
)
|
(0.7
|
)
|
(2.0
|
)
|
(2.4
|
)
|
|||||||
|
|
$
|
745.5
|
|
$
|
811.0
|
|
$
|
823.4
|
|
$
|
951.3
|
|
|||
|
Gross profit
|
$
|
136.6
|
|
$
|
137.9
|
|
$
|
137.5
|
|
$
|
181.1
|
|
|||
|
Earnings of unconsolidated mines
|
$
|
12.1
|
|
$
|
9.5
|
|
$
|
11.1
|
|
$
|
12.8
|
|
|||
|
Operating profit (loss)
|
|
|
|
|
|||||||||||
|
NMHG
|
$
|
30.4
|
|
$
|
27.5
|
|
$
|
24.1
|
|
$
|
28.0
|
|
|||
|
HBB
|
3.3
|
|
3.6
|
|
7.9
|
|
19.0
|
|
|||||||
|
KC
|
(5.4
|
)
|
(4.3
|
)
|
(0.6
|
)
|
12.8
|
|
|||||||
|
NACoal
|
9.5
|
|
5.3
|
|
7.0
|
|
13.4
|
|
|||||||
|
NACCO and Other
|
(2.5
|
)
|
(1.1
|
)
|
(0.9
|
)
|
(2.8
|
)
|
|||||||
|
Eliminations
|
—
|
|
0.1
|
|
(0.1
|
)
|
(0.1
|
)
|
|||||||
|
|
$
|
35.3
|
|
$
|
31.1
|
|
$
|
37.4
|
|
$
|
70.3
|
|
|||
|
Net income
|
$
|
62.8
|
|
$
|
19.1
|
|
$
|
25.7
|
|
$
|
54.5
|
|
|||
|
Net income (loss) attributable to stockholders
|
|
|
|
|
|||||||||||
|
NMHG
|
$
|
22.3
|
|
$
|
19.2
|
|
$
|
17.5
|
|
$
|
23.6
|
|
|||
|
HBB
|
1.0
|
|
1.3
|
|
4.1
|
|
12.0
|
|
|||||||
|
KC
|
(3.3
|
)
|
(2.7
|
)
|
(0.5
|
)
|
7.6
|
|
|||||||
|
NACoal
|
7.1
|
|
4.6
|
|
5.8
|
|
11.9
|
|
|||||||
|
NACCO and Other
|
34.7
|
|
(1.0
|
)
|
(0.7
|
)
|
(2.3
|
)
|
|||||||
|
Eliminations
|
1.0
|
|
(2.2
|
)
|
(0.5
|
)
|
1.6
|
|
|||||||
|
|
$
|
62.8
|
|
$
|
19.2
|
|
$
|
25.7
|
|
$
|
54.4
|
|
|||
|
Basic earnings per share
|
$
|
7.51
|
|
$
|
2.29
|
|
$
|
3.06
|
|
$
|
6.48
|
|
|||
|
Diluted earnings per share
|
$
|
7.48
|
|
$
|
2.28
|
|
$
|
3.05
|
|
$
|
6.47
|
|
|||
During the first quarter of 2011, the Company entered into a settlement agreement for litigation against Applica and individuals and entities affiliated with Applica's shareholder, Harbinger Capital Partners Master Fund, Ltd. The settlement agreement provided for, among other things, the payment of $60 million to the Company and dismissal of the lawsuit with prejudice. The payment was received in February 2011.
The significant increase in operating results in the fourth quarter of
2011
compared with the prior quarters of
2011
is primarily due to the seasonal nature of HBB's and KC's businesses.
The reduction in operating results at NACoal during the first nine months of 2011 was primarily due to a decrease in tons delivered at MLMC as a result of unplanned customer power plant outages.
F-48
NOTES TO CONSOLIDATED FINANCIAL STATEMENTS
NACCO INDUSTRIES, INC. AND SUBSIDIARIES
(Tabular Amounts in Millions, Except Per Share and Percentage Data)
|
|
2010
|
||||||||||||||
|
|
First
Quarter
|
Second
Quarter
|
Third
Quarter
|
Fourth
Quarter
|
|||||||||||
|
Revenues
|
|
|
|
|
|||||||||||
|
NMHG
|
$
|
375.4
|
|
$
|
413.5
|
|
$
|
442.9
|
|
$
|
570.1
|
|
|||
|
HBB
|
102.6
|
|
103.3
|
|
133.3
|
|
176.5
|
|
|||||||
|
KC
|
42.8
|
|
40.9
|
|
47.5
|
|
88.4
|
|
|||||||
|
NACoal
|
37.6
|
|
42.3
|
|
42.4
|
|
34.5
|
|
|||||||
|
Eliminations
|
(0.8
|
)
|
(1.2
|
)
|
(1.2
|
)
|
(3.3
|
)
|
|||||||
|
|
$
|
557.6
|
|
$
|
598.8
|
|
$
|
664.9
|
|
$
|
866.2
|
|
|||
|
Gross profit
|
$
|
105.7
|
|
$
|
123.1
|
|
$
|
130.1
|
|
$
|
167.3
|
|
|||
|
Earnings of unconsolidated mines
|
$
|
10.5
|
|
$
|
9.5
|
|
$
|
11.3
|
|
$
|
12.1
|
|
|||
|
Operating profit (loss)
|
|
|
|
|
|||||||||||
|
NMHG
|
$
|
10.3
|
|
$
|
9.8
|
|
$
|
8.2
|
|
$
|
17.8
|
|
|||
|
HBB
|
7.4
|
|
7.8
|
|
10.9
|
|
19.8
|
|
|||||||
|
KC
|
(2.9
|
)
|
(2.9
|
)
|
0.1
|
|
11.6
|
|
|||||||
|
NACoal
|
11.0
|
|
15.7
|
|
15.0
|
|
11.6
|
|
|||||||
|
NACCO and Other
|
(1.7
|
)
|
(3.1
|
)
|
(2.0
|
)
|
(4.0
|
)
|
|||||||
|
Eliminations
|
0.1
|
|
—
|
|
(0.1
|
)
|
(0.1
|
)
|
|||||||
|
|
$
|
24.2
|
|
$
|
27.3
|
|
$
|
32.1
|
|
$
|
56.7
|
|
|||
|
Net income
|
$
|
11.6
|
|
$
|
16.0
|
|
$
|
13.3
|
|
$
|
38.5
|
|
|||
|
Net income (loss) attributable to stockholders
|
|
|
|
|
|
|
|
|
|||||||
|
NMHG
|
$
|
8.0
|
|
$
|
7.3
|
|
$
|
3.8
|
|
$
|
13.3
|
|
|||
|
HBB
|
3.4
|
|
3.8
|
|
5.6
|
|
11.6
|
|
|||||||
|
KC
|
(1.8
|
)
|
(1.8
|
)
|
(0.1
|
)
|
7.2
|
|
|||||||
|
NACoal
|
8.1
|
|
11.3
|
|
11.0
|
|
9.2
|
|
|||||||
|
NACCO and Other
|
(3.0
|
)
|
(5.3
|
)
|
(6.1
|
)
|
(6.0
|
)
|
|||||||
|
Eliminations
|
(3.0
|
)
|
0.6
|
|
(0.7
|
)
|
3.1
|
|
|||||||
|
|
$
|
11.7
|
|
$
|
15.9
|
|
$
|
13.5
|
|
$
|
38.4
|
|
|||
|
Basic earnings per share
|
$
|
1.41
|
|
$
|
1.91
|
|
$
|
1.62
|
|
$
|
4.61
|
|
|||
|
Diluted earnings per share
|
$
|
1.40
|
|
$
|
1.91
|
|
$
|
1.62
|
|
$
|
4.59
|
|
|||
The significant increase in operating results in the fourth quarter of
2010
compared with the prior quarters of
2010
is primarily due to the seasonal nature of HBB's and KC's businesses.
F-49
NOTES TO CONSOLIDATED FINANCIAL STATEMENTS
NACCO INDUSTRIES, INC. AND SUBSIDIARIES
(Tabular Amounts in Millions, Except Per Share and Percentage Data)
The condensed balance sheets of NACCO, the parent company, at
December 31
are as follows:
|
|
2011
|
2010
|
|||||
|
ASSETS
|
|
|
|||||
|
Cash and cash equivalents
|
$
|
130.7
|
|
$
|
29.6
|
|
|
|
Other current assets
|
6.3
|
|
0.2
|
|
|||
|
Current intercompany accounts receivable, net
|
—
|
|
0.5
|
|
|||
|
Investment in subsidiaries
|
|
|
|||||
|
NMHG
|
296.3
|
|
230.7
|
|
|||
|
HBB
|
35.0
|
|
13.9
|
|
|||
|
KC
|
46.7
|
|
48.1
|
|
|||
|
NACoal
|
96.1
|
|
141.5
|
|
|||
|
Other
|
16.6
|
|
16.8
|
|
|||
|
|
490.7
|
|
451.0
|
|
|||
|
Property, plant and equipment, net
|
1.9
|
|
2.2
|
|
|||
|
Other non-current assets
|
6.8
|
|
14.7
|
|
|||
|
Total Assets
|
$
|
636.4
|
|
$
|
498.2
|
|
|
|
LIABILITIES AND STOCKHOLDERS’ EQUITY
|
|
|
|||||
|
Current liabilities
|
$
|
15.7
|
|
$
|
12.4
|
|
|
|
Current intercompany accounts payable, net
|
9.3
|
|
—
|
|
|||
|
Note payable to Bellaire
|
22.4
|
|
25.2
|
|
|||
|
Other non-current liabilities
|
12.8
|
|
13.2
|
|
|||
|
Stockholders’ equity
|
576.2
|
|
447.4
|
|
|||
|
Total Liabilities and Stockholders’ Equity
|
$
|
636.4
|
|
$
|
498.2
|
|
|
The credit agreements at NMHG, HBB, KC and NACoal allow the transfer of assets to NACCO under certain circumstances. The amount of NACCO's investment in NMHG, HBB, KC and NACoal and NACCO and Other that was restricted at
December 31, 2011
totaled approximately $390.5 million. The amount of unrestricted cash available to NACCO included in “Investment in subsidiaries” was $51.7 million at
December 31, 2011
. Dividends, advances and management fees from its subsidiaries are the primary sources of cash for NACCO.
Nine of NACoal's wholly owned subsidiaries, Coteau, Falkirk, Sabine, Demery, Caddo Creek, Camino Real, Liberty, NoDak and NACC India each meet the definition of a variable interest entity. See Note 1 for a discussion of these entities. The taxes resulting from the earnings of the unconsolidated mines and NoDak are solely the responsibility of the Company. The pre-tax income from the seven unconsolidated mines is reported on the line “Earnings of unconsolidated mines” in the Consolidated Statements of Operations, with related taxes included in the provision for income taxes. The Company has included the pre-tax earnings of the unconsolidated mines above operating profit as they are an integral component of the Company's business and operating results. The pre-tax income from NoDak is reported on the line "Other" in the "Other (income) expense" section of the Consolidated Statement of Operations, with the related income taxes included in the provision for income taxes. The net income from NACC India is reported on the line "Other" in the "Other (income) expense" section of the Consolidated Statements of Operations. The investment in the unconsolidated mines and related tax asset was $22.0 million and $21.6 million at
December 31, 2011
and
2010
, respectively, and is included on the line “Other Non-current Assets” in the Consolidated Balance Sheets. The Company's maximum risk of loss relating to these entities is limited to its invested capital, which was $6.3 million, $5.0 million and $3.5 million at
December 31, 2011
,
2010
and
2009
, respectively.
F-50
NOTES TO CONSOLIDATED FINANCIAL STATEMENTS
NACCO INDUSTRIES, INC. AND SUBSIDIARIES
(Tabular Amounts in Millions, Except Per Share and Percentage Data)
Summarized financial information for the unconsolidated mines is as follows:
|
|
2011
|
2010
|
2009
|
||||||||
|
Statement of Operations
|
|
|
|
||||||||
|
Revenues
|
$
|
502.6
|
|
$
|
461.7
|
|
$
|
421.1
|
|
||
|
Gross profit
|
$
|
71.7
|
|
$
|
71.7
|
|
$
|
63.7
|
|
||
|
Income before income taxes
|
$
|
47.0
|
|
$
|
43.4
|
|
$
|
38.6
|
|
||
|
Income from continuing operations
|
$
|
36.5
|
|
$
|
33.1
|
|
$
|
29.8
|
|
||
|
Net income
|
$
|
36.5
|
|
$
|
33.1
|
|
$
|
29.8
|
|
||
|
Balance Sheet
|
|
||||||||||
|
Current assets
|
$
|
144.1
|
|
$
|
130.9
|
|
|
||||
|
Non-current assets
|
$
|
685.2
|
|
$
|
633.6
|
|
|
||||
|
Current liabilities
|
$
|
162.1
|
|
$
|
115.2
|
|
|
||||
|
Non-current liabilities
|
$
|
660.9
|
|
$
|
644.3
|
|
|
||||
NACoal received dividends of $35.2 million and $31.6 million from the unconsolidated mines in
2011
and
2010
, respectively.
In addition, NMHG maintains an interest in one variable interest entity, NFS. NFS is a joint venture with GECC formed primarily for the purpose of providing financial services to independent Hyster
®
and Yale
®
lift truck dealers and National Account customers in the United States. NMHG does not have a controlling financial interest or have the power to direct the activities that most significantly affect the economic performance of NFS. Therefore, the Company has concluded that NMHG is not the primary beneficiary and will continue to use the equity method to account for its 20% interest in NFS. NMHG does not consider its variable interest in NFS to be significant.
Generally, NMHG sells lift trucks through its independent dealer network or directly to customers. These dealers and customers may enter into a financing transaction with NFS or other unrelated third-parties. NFS provides debt financing to dealers and lease financing to both dealers and customers. NFS’ total purchases of Hyster
®
and Yale
®
lift trucks from dealers, customers and directly from NMHG, such that NFS could provide lease financing to dealers and customers, for the years ended
December 31, 2011
,
2010
and
2009
were $337.3 million, $243.9 million and $266.7 million, respectively. Of these amounts, $38.7 million, $23.7 million and $38.0 million for the years ended
December 31, 2011
,
2010
and
2009
, respectively, were invoiced directly from NMHG to NFS so that the dealer or customer could obtain operating lease financing from NFS. Amounts receivable from NFS were $4.9 million and $3.2 million at
December 31, 2011
and
2010
, respectively.
Under the terms of the joint venture agreement with GECC, NMHG provides recourse for financing provided by NFS to NMHG dealers. Additionally, the credit quality of a customer or concentration issues within GECC may necessitate providing recourse or repurchase obligations of the lift trucks purchased by customers and financed through NFS. At
December 31, 2011
, approximately $112.9 million of the Company's total recourse or repurchase obligations related to transactions with NFS. NMHG has reserved for losses under the terms of the recourse or repurchase obligations in its consolidated financial statements. Historically, NMHG has not had significant losses with respect to these obligations. During
2011
,
2010
and
2009
, the net losses resulting from customer defaults did not have a material impact on NMHG's results of operations or financial position.
In connection with the joint venture agreement, NMHG also provides a guarantee to GECC for 20% of NFS’ debt with GECC, such that NMHG would become liable under the terms of NFS’ debt agreements with GECC in the case of default by NFS. At
December 31, 2011
, loans from GECC to NFS totaled $684.7 million. Although NMHG's contractual guarantee was $136.9 million, the loans by GECC to NFS are secured by NFS’ customer receivables, of which NMHG guarantees $112.9 million. Excluding the $112.9 million of NFS receivables guaranteed by NMHG from NFS’ loans to GECC, NMHG's incremental obligation as a result of this guarantee to GECC is $114.4 million. NFS has not defaulted under the terms of this debt financing in the past and although there can be no assurances, NMHG is not aware of any circumstances that would cause NFS to default in future periods.
In addition to providing financing to NMHG's dealers, NFS provides operating lease financing to NMHG. Operating lease obligations primarily relate to specific sale-leaseback-sublease transactions for certain NMHG customers whereby NMHG sells lift trucks to NFS, NMHG leases these lift trucks back under an operating lease agreement and NMHG subleases those lift
F-51
NOTES TO CONSOLIDATED FINANCIAL STATEMENTS
NACCO INDUSTRIES, INC. AND SUBSIDIARIES
(Tabular Amounts in Millions, Except Per Share and Percentage Data)
trucks to customers under an operating lease agreement. Total obligations to NFS under the operating lease agreements were $6.0 million and $7.3 million at
December 31, 2011
and
2010
, respectively. In addition, NMHG provides certain subsidies to its customers that are paid directly to NFS. Total subsidies were $1.4 million, $4.0 million and $5.4 million for
2011
,
2010
and
2009
, respectively.
NMHG provides certain services to NFS for which it receives compensation under the terms of the joint venture agreement. These services consist primarily of administrative functions and remarketing services. Total income recorded by NMHG related to these services was $7.3 million in
2011
, $5.0 million in
2010
and $7.6 million in
2009
.
NMHG has a 50% ownership interest in SN, a limited liability company that was formed primarily to manufacture and distribute Sumitomo-Yale branded lift trucks in Japan and export Hyster
®
- and Yale
®
-branded lift trucks and related components and service parts outside of Japan. NMHG purchases products from SN under normal trade terms based on current market prices. In
2011
,
2010
and
2009
, purchases from SN were $105.5 million, $66.9 million and $44.7 million, respectively. Amounts payable to SN at
December 31, 2011
and
2010
were $21.6 million and $30.7 million, respectively.
During
2010
and
2009
, NMHG recognized $1.1 million and $1.8 million, respectively, in expenses related to payments to SN for engineering design services. These expenses were included in “Selling, general and administrative expenses” in the Consolidated Statement of Operations. No expenses were recognized for these services in 2011. Additionally, NMHG recognized income of $1.6 million, $1.2 million and $0.4 million for payments from SN for use of technology developed by NMHG that are included in “Revenues” in the Consolidated Statement of Operations for the years ended
December 31, 2011
,
2010
and
2009
, respectively.
Summarized financial information for both equity investments is as follows:
|
|
2011
|
2010
|
2009
|
||||||||
|
Statement of Operations
|
|
|
|
||||||||
|
Revenues
|
$
|
444.3
|
|
$
|
358.6
|
|
$
|
310.6
|
|
||
|
Gross profit
|
$
|
126.9
|
|
$
|
106.7
|
|
$
|
88.5
|
|
||
|
Income from continuing operations
|
$
|
23.7
|
|
$
|
7.1
|
|
$
|
1.5
|
|
||
|
Net income
|
$
|
23.7
|
|
$
|
7.1
|
|
$
|
1.5
|
|
||
|
Balance Sheet
|
|
||||||||||
|
Current assets
|
$
|
138.8
|
|
$
|
128.6
|
|
|
||||
|
Non-current assets
|
$
|
997.2
|
|
$
|
1,038.0
|
|
|
||||
|
Current liabilities
|
$
|
122.8
|
|
$
|
119.0
|
|
|
||||
|
Non-current liabilities
|
$
|
875.7
|
|
$
|
925.9
|
|
|
||||
The Company's percentage share of the net income or loss from its equity investments is reported on the line “(Income) loss from other unconsolidated affiliates” in the “Other (income) expense” portion of the Consolidated Statements of Operations.
At
December 31, 2011
and
2010
, NMHG's investment in NFS was $13.6 million and $12.1 million, respectively, and NMHG's investment in SN was $34.2 million and $30.3 million, respectively. NMHG received dividends of $2.3 million and $2.9 million from NFS in
2011
and
2010
, respectively. No dividends were received from SN in 2011 and 2010.
Legal services rendered by Jones Day approximated $4.9 million, $14.3 million and $2.7 million for the years ended
December 31, 2011
,
2010
and
2009
, respectively. The significant increase in services rendered during 2010 related to the Applica litigation discussed further in Note 5. A director of the Company is also a partner of this law firm.
F-52
SCHEDULE I—CONDENSED FINANCIAL INFORMATION OF THE PARENT
NACCO INDUSTRIES, INC. AND SUBSIDIARIES
PARENT COMPANY CONDENSED BALANCE SHEETS
|
|
December 31
|
||||||
|
|
2011
|
2010
|
|||||
|
|
(In millions)
|
||||||
|
ASSETS
|
|||||||
|
Cash and cash equivalents
|
$
|
130.7
|
|
$
|
29.6
|
|
|
|
Other current assets
|
6.3
|
|
0.2
|
|
|||
|
Current intercompany accounts receivable, net
|
—
|
|
0.5
|
|
|||
|
Investment in subsidiaries
|
|
|
|||||
|
NMHG
|
296.3
|
|
230.7
|
|
|||
|
HBB
|
35.0
|
|
13.9
|
|
|||
|
KC
|
46.7
|
|
48.1
|
|
|||
|
NACoal
|
96.1
|
|
141.5
|
|
|||
|
Other
|
16.6
|
|
16.8
|
|
|||
|
|
490.7
|
|
451.0
|
|
|||
|
Property, plant and equipment, net
|
1.9
|
|
2.2
|
|
|||
|
Other non-current assets
|
6.8
|
|
14.7
|
|
|||
|
Total Assets
|
$
|
636.4
|
|
$
|
498.2
|
|
|
|
LIABILITIES AND STOCKHOLDERS' EQUITY
|
|||||||
|
Current liabilities
|
$
|
15.7
|
|
$
|
12.4
|
|
|
|
Current intercompany accounts payable, net
|
9.3
|
|
—
|
|
|||
|
Note payable to Bellaire
|
22.4
|
|
25.2
|
|
|||
|
Other non-current liabilities
|
12.8
|
|
13.2
|
|
|||
|
Stockholders’ equity
|
576.2
|
|
447.4
|
|
|||
|
Total Liabilities and Stockholders’ Equity
|
$
|
636.4
|
|
$
|
498.2
|
|
|
See Notes to Parent Company Condensed Financial Statements.
F-53
SCHEDULE I—CONDENSED FINANCIAL INFORMATION OF THE PARENT
NACCO INDUSTRIES, INC. AND SUBSIDIARIES
PARENT COMPANY CONDENSED STATEMENTS OF OPERATIONS
|
|
Year Ended December 31
|
||||||||||
|
|
2011
|
2010
|
2009
|
||||||||
|
|
(In millions)
|
||||||||||
|
(Income) expense:
|
|
|
|
||||||||
|
Intercompany interest expense
|
$
|
1.7
|
|
$
|
1.9
|
|
$
|
1.6
|
|
||
|
Other, net
|
2.9
|
|
18.8
|
|
1.5
|
|
|||||
|
|
4.6
|
|
20.7
|
|
3.1
|
|
|||||
|
Administrative and general expenses
|
7.0
|
|
10.5
|
|
9.2
|
|
|||||
|
Loss before income taxes
|
(11.6
|
)
|
(31.2
|
)
|
(12.3
|
)
|
|||||
|
Income tax benefit
|
(3.0
|
)
|
(11.0
|
)
|
(2.7
|
)
|
|||||
|
Net loss before equity in earnings of subsidiaries
|
(8.6
|
)
|
(20.2
|
)
|
(9.6
|
)
|
|||||
|
Equity in earnings of subsidiaries
|
170.7
|
|
99.6
|
|
40.6
|
|
|||||
|
Net income
|
162.1
|
|
79.4
|
|
31.0
|
|
|||||
|
Net loss attributable to noncontrolling interest
|
—
|
|
0.1
|
|
0.1
|
|
|||||
|
Net income attributable to stockholders
|
$
|
162.1
|
|
$
|
79.5
|
|
$
|
31.1
|
|
||
See Notes to Parent Company Condensed Financial Statements.
F-54
SCHEDULE I—CONDENSED FINANCIAL INFORMATION OF THE PARENT
NACCO INDUSTRIES, INC. AND SUBSIDIARIES
PARENT COMPANY CONDENSED STATEMENTS OF CASH FLOWS
|
|
Year Ended December 31
|
||||||||||
|
|
2011
|
2010
|
2009
|
||||||||
|
|
(In millions)
|
||||||||||
|
Operating Activities
|
|
|
|
||||||||
|
Net income
|
$
|
162.1
|
|
$
|
79.4
|
|
$
|
31.0
|
|
||
|
Equity in earnings of subsidiaries
|
(170.7
|
)
|
(99.6
|
)
|
(40.6
|
)
|
|||||
|
Parent company only net loss
|
(8.6
|
)
|
(20.2
|
)
|
(9.6
|
)
|
|||||
|
Net changes related to operating activities
|
12.1
|
|
(9.1
|
)
|
(31.6
|
)
|
|||||
|
Net cash provided by (used for) operating activities
|
3.5
|
|
(29.3
|
)
|
(41.2
|
)
|
|||||
|
Investing Activities
|
|
|
|
||||||||
|
Expenditures for property, plant and equipment
|
(0.1
|
)
|
(1.1
|
)
|
(14.1
|
)
|
|||||
|
Net cash used for investing activities
|
(0.1
|
)
|
(1.1
|
)
|
(14.1
|
)
|
|||||
|
Financing Activities
|
|
|
|
||||||||
|
Dividends received from subsidiaries
|
124.4
|
|
29.6
|
|
15.5
|
|
|||||
|
Proceeds from the sale of assets
|
—
|
|
1.6
|
|
—
|
|
|||||
|
Intercompany notes
|
—
|
|
—
|
|
72.9
|
|
|||||
|
Notes payable to Bellaire
|
(2.8
|
)
|
(2.6
|
)
|
(0.4
|
)
|
|||||
|
Capital contributions to subsidiaries
|
(4.0
|
)
|
—
|
|
(38.0
|
)
|
|||||
|
Purchase of treasury shares
|
(2.1
|
)
|
—
|
|
—
|
|
|||||
|
Cash dividends paid
|
(17.8
|
)
|
(17.4
|
)
|
(17.1
|
)
|
|||||
|
Net cash provided by financing activities
|
97.7
|
|
11.2
|
|
32.9
|
|
|||||
|
Cash and cash equivalents
|
|
|
|
||||||||
|
Increase (decrease) for the period
|
101.1
|
|
(19.2
|
)
|
(22.4
|
)
|
|||||
|
Balance at the beginning of the period
|
29.6
|
|
48.8
|
|
71.2
|
|
|||||
|
Balance at the end of the period
|
$
|
130.7
|
|
$
|
29.6
|
|
$
|
48.8
|
|
||
See Notes to Parent Company Condensed Financial Statements.
F-55
SCHEDULE I—CONDENSED FINANCIAL INFORMATION OF THE PARENT
NACCO INDUSTRIES, INC. AND SUBSIDIARIES
NOTES TO PARENT COMPANY CONDENSED FINANCIAL STATEMENTS
FOR THE YEAR ENDED
DECEMBER 31, 2011
,
2010
AND
2009
The notes to Consolidated Financial Statements, incorporated in Item 15 of this Form 10-K, are hereby incorporated by reference into these Notes to Parent Company Condensed Financial Statements.
NOTE A — LONG-TERM OBLIGATIONS AND GUARANTEES
NACCO Industries, Inc. (the parent company or “NACCO”) is a holding company with subsidiaries that operate in four principal industries. It is NACCO's policy not to guarantee the debt of its subsidiaries.
NOTE B — UNRESTRICTED CASH
The amount of unrestricted cash available to NACCO, included in “Investment in subsidiaries,” was $51.7 million at
December 31, 2011
and was in addition to the $130.7 million of cash included in the Parent Company Condensed Balance Sheet at
December 31, 2011
.
F-56
SCHEDULE II—VALUATION AND QUALIFYING ACCOUNTS
NACCO INDUSTRIES, INC. AND SUBSIDIARIES
YEAR ENDED
DECEMBER 31, 2011
,
2010
AND
2009
|
|
|
Additions
|
|
|
||||||||||||||||||
|
Description
|
Balance at Beginning of Period
|
Charged to
Costs and
Expenses
|
Charged to
Other Accounts
— Describe (C)
|
Deductions
— Describe
|
Balance at
End of
Period (E)
|
|||||||||||||||||
|
(In millions)
|
||||||||||||||||||||||
|
2011
|
|
|
|
|
|
|
||||||||||||||||
|
Reserves deducted from asset accounts:
|
|
|
|
|
|
|
||||||||||||||||
|
Allowance for doubtful accounts (D)
|
$
|
11.2
|
|
$
|
5.7
|
|
$
|
(0.3
|
)
|
$
|
3.6
|
|
(A)
|
$
|
13.0
|
|
||||||
|
Allowance for discounts, adjustments and returns
|
11.1
|
|
15.1
|
|
0.9
|
|
13.8
|
|
(B)
|
13.3
|
|
|||||||||||
|
2010
|
|
|
|
|
|
|
||||||||||||||||
|
Reserves deducted from asset accounts:
|
|
|
|
|
|
|
||||||||||||||||
|
Allowance for doubtful accounts (D)
|
$
|
19.1
|
|
$
|
1.5
|
|
$
|
(0.3
|
)
|
$
|
9.1
|
|
(A)
|
$
|
11.2
|
|
||||||
|
Allowance for discounts, adjustments and returns
|
11.5
|
|
14.9
|
|
—
|
|
15.3
|
|
(B)
|
11.1
|
|
|||||||||||
|
2009
|
|
|
|
|
|
|
||||||||||||||||
|
Reserves deducted from asset accounts:
|
|
|
|
|
|
|
||||||||||||||||
|
Allowance for doubtful accounts (D)
|
$
|
15.7
|
|
$
|
3.9
|
|
$
|
0.8
|
|
$
|
1.3
|
|
(A)
|
$
|
19.1
|
|
||||||
|
Allowance for discounts, adjustments and returns
|
12.4
|
|
17.0
|
|
—
|
|
17.9
|
|
(B)
|
11.5
|
|
|||||||||||
|
(A)
|
Write-offs, net of recoveries.
|
|
(B)
|
Payments and customer deductions for product returns, discounts and allowances.
|
|
(C)
|
Subsidiary's foreign currency translation adjustments and other.
|
|
(D)
|
Includes allowance of receivables classified as long-term of $4.9 million, $5.0 million and $12.0 million in
2011
,
2010
and
2009
, respectively.
|
|
(E)
|
Balances which are not required to be presented and those which are immaterial have been omitted.
|
F-57
EXHIBIT INDEX
(3) Articles of Incorporation and By-laws.
|
3.1(i)
|
|
Restated Certificate of Incorporation of the Company is incorporated herein by reference to Exhibit 3(i) to the Company’s Annual Report on Form 10-K for the fiscal year ended December 31, 1992, Commission File Number 1-9172.
|
|
3.1(ii)
|
|
Amended and Restated By-laws of the Company are incorporated herein by reference to Exhibit 3.1 to the Company’s Quarterly Report on Form 10-Q, filed by the Company on August 7, 2008, Commission File Number 1-9172.
|
(4) Instruments defining the rights of security holders, including indentures.
|
4.1
|
|
The Company by this filing agrees, upon request, to file with the Securities and Exchange Commission the instruments defining the rights of holders of long-term debt of the Company and its subsidiaries where the total amount of securities authorized thereunder does not exceed 10% of the total assets of the Company and its subsidiaries on a consolidated basis.
|
|
4.2
|
|
The Mortgage and Security Agreement, dated April 8, 1976, between The Falkirk Mining Company (as Mortgagor) and Cooperative Power Association and United Power Association (collectively as Mortgagee) is incorporated herein by reference to Exhibit 4(ii) to the Company’s Annual Report on Form 10-K for the fiscal year ended December 31, 1992, Commission File Number 1-9172.
|
|
4.3
|
|
Amendment No. 1 to the Mortgage and Security Agreement, dated as of December 15, 1993, between Falkirk Mining Company (as Mortgagor) and Cooperative Power Association and United Power Association (collectively as Mortgagee) is incorporated herein by reference to Exhibit 4(iii) to the Company’s Annual Report on Form 10-K for the fiscal year ended December 31, 1997, Commission File Number 1-9172.
|
|
4.4
|
|
Stockholders’ Agreement, dated as of March 15, 1990, among the signatories thereto, the Company and Ameritrust Company National Association, as depository, is incorporated herein by reference to Exhibit 2 to the Schedule 13D filed on March 29, 1990 with respect to the Class B Common Stock, par value $1.00 per share, of NACCO Industries, Inc., Commission File Number 5-38001.
|
|
4.5
|
|
Amendment to Stockholders’ Agreement, dated as of April 6, 1990, among the signatories thereto, the Company and Ameritrust Company National Association, as depository, is incorporated herein by reference to Exhibit 4 to Amendment No. 1 to the Schedule 13D filed on April 11, 1990 with respect to the Class B Common Stock, par value $1.00 per share, of NACCO Industries, Inc., Commission File Number 5-38001.
|
|
4.6
|
|
Amendment to Stockholders’ Agreement, dated as of April 6, 1990, among the signatories thereto, the Company and Ameritrust Company National Association, as depository, is incorporated herein by reference to Exhibit 5 to Amendment No. 1 to the Schedule 13D filed on April 11, 1990 with respect to the Class B Common Stock, par value $1.00 per share, of NACCO Industries, Inc., Commission File Number 5-38001.
|
|
4.7
|
|
Amendment to Stockholders’ Agreement, dated as of November 17, 1990, among the signatories thereto, the Company, and Ameritrust Company National Association, as depository, is incorporated herein by reference to Amendment No. 2 to the Schedule 13D filed on March 18, 1991 with respect to the Class B Common Stock, par value $1.00 per share, of NACCO Industries, Inc., Commission File Number 5-38001.
|
|
4.8
|
|
Amendment to Stockholders’ Agreement, dated as of November 14, 1996, among the signatories thereto, the Company, the New Participating Stockholders (as defined therein) and Key Bank, N.A. (successor to Ameritrust Company National Association), as depository, is incorporated herein by reference to Exhibit No. 13 to Amendment No. 3 to the Schedule 13D filed on November 26, 1996, with respect to the Class B Common Stock, par value $1.00 per share, of NACCO Industries, Inc., Commission File Number 5-38001.
|
|
4.9
|
|
Amendment to Stockholders’ Agreement, dated as of November 14, 1996, among the signatories thereto, the Company, the New Participating Stockholders (as defined therein) and Key Bank, N.A. (successor to Ameritrust Company National Association), as depository, is incorporated herein by reference to Exhibit No. 14 to Amendment No. 3 to the Schedule 13D filed on November 26, 1996, with respect to the Class B Common Stock, par value $1.00 per share, of NACCO Industries, Inc., Commission File Number 5-38001.
|
|
4.10
|
|
Amendment to Stockholders’ Agreement, dated as of April 9, 1998, by and among KeyCorp Shareholder Services, Inc., the Company, the Participating Stockholders (as defined therein) and the New Participating Stockholders (as defined therein) is incorporated herein by reference to Exhibit No. 19 to Amendment No. 6 to the Schedule 13D filed on March 25, 1999, with respect to the Class B Common Stock, par value $1.00 per share, of NACCO Industries, Inc., Commission File Number 5-38001.
|
|
4.11
|
|
Amendment to Stockholders’ Agreement, dated as of December 26, 1998, by and among KeyCorp Shareholder Services, Inc., the Company, the Participating Stockholders (as defined therein) and the New Participating Stockholders (as defined therein) is incorporated herein by reference to Exhibit No. 20 to Amendment No. 6 to the Schedule 13D filed on March 25, 1999, with respect to the Class B Common Stock, par value $1.00 per share, of NACCO Industries, Inc., Commission File Number 5-38001.
|
X-1
|
4.12
|
|
Amendment to Stockholders’ Agreement, dated as of November 30, 1999, by and among First Chicago Trust Company of New York, the Company and the Participating Stockholders (as defined therein) is incorporated herein by reference to Exhibit No. 21 to Amendment No. 7 to the Schedule 13D filed on March 30, 2000, with respect to the Class B Common Stock, par value $1.00 per share, of NACCO Industries, Inc., Commission File Number 5-38001.
|
|
4.13
|
|
Amendment to Stockholders’ Agreement, dated as of November 30, 1999, by and among First Chicago Trust Company of New York, the Company and the Participating Stockholders (as defined therein) is incorporated herein by reference to Exhibit No. 22 to Amendment No. 7 to the Schedule 13D filed on March 30, 2000, with respect to the Class B Common Stock, par value $1.00 per share, of NACCO Industries, Inc., Commission File Number 5-38001.
|
|
4.14
|
|
Amendment to Stockholders’ Agreement, dated as of March 30, 2000, by and among First Chicago Trust Company of New York, the Company, the Participating Stockholders (as defined therein) and the New Participating Stockholders (as defined therein) is incorporated herein by reference to Exhibit No. 23 to Amendment No. 7 to the Schedule 13D filed on March 30, 2000, with respect to the Class B Common Stock, par value $1.00 per share, of NACCO Industries, Inc., Commission File Number 5-38001.
|
|
4.15
|
|
Amendment to Stockholders’ Agreement, dated as of October 31, 2000, by and among National City Bank (Cleveland), the Company, and the Participating Stockholders (as defined therein) is incorporated herein by reference to Exhibit No. 24 to Amendment No. 8 to the Schedule 13D filed on February 14, 2001, with respect to the Class B Common Stock, par value $1.00 per share, of NACCO Industries, Inc., Commission File Number 5-38001.
|
|
4.16
|
|
Amendment to Stockholders’ Agreement, dated as of October 31, 2000, by and among First Chicago Trust Company of New York, the Company, the Participating Stockholders (as defined therein) and the New Participating Stockholders (as defined therein) is incorporated herein by reference to Exhibit No. 25 Amendment No. 8 to the Schedule 13D filed on February 14, 2001, with respect to the Class B Common Stock, par value $1.00 per share, of NACCO Industries, Inc., Commission File Number 5-38001.
|
|
4.17
|
|
Amendment to Stockholders’ Agreement, dated as of February 14, 2001, by and among National City Bank (Cleveland), the Company, the Participating Stockholders (as defined therein) and the New Participating Stockholders (as defined therein) is incorporated herein by reference to Exhibit No. 26 to Amendment No. 8 to the Schedule 13D filed on February 14, 2001, with respect to the Class B Common Stock, par value $1.00 per share, of NACCO Industries, Inc., Commission File Number 5-38001.
|
|
4.18
|
|
Amendment to Stockholders’ Agreement, dated as of December 26, 2001, by and among National City Bank (Cleveland), the Company, the Participating Stockholders (as defined therein) and the New Participating Stockholder (as defined therein) is incorporated herein by reference to Exhibit No. 27 to Amendment No. 9 to the Schedule 13D filed on February 14, 2002, with respect to the Class B Common Stock, par value $1.00 per share, of NACCO Industries, Inc., Commission File Number 5-38001.
|
|
4.19
|
|
Amendment to Stockholders’ Agreement, dated as of February 11, 2002, by and among National City Bank (Cleveland), the Company, the Participating Stockholders (as defined therein) and the New Participating Stockholder (as defined therein) is incorporated herein by reference to Exhibit No. 28 to Amendment No. 9 to the Schedule 13D filed on February 14, 2002, with respect to the Class B Common Stock, par value $1.00 per share, of NACCO Industries, Inc., Commission File Number 5-38001.
|
|
4.20
|
|
Amendment to Stockholders’ Agreement, dated as of October 24, 2002, by and among National City Bank (Cleveland), the Company, the Participating Stockholders (as defined therein) and the New Participating Stockholder (as defined therein) is incorporated herein by reference to Exhibit No. 29 to Amendment No. 10 to the Schedule 13D filed on February 14, 2003, with respect to the Class B Common Stock, par value $1.00 per share, of NACCO Industries, Inc., Commission File Number 5-38001.
|
|
4.21
|
|
Amendment to Stockholders’ Agreement, dated as of December 30, 2002, by and among National City Bank (Cleveland), the Company, the Participating Stockholders (as defined therein) and the New Participating Stockholder (as defined therein) is incorporated herein by reference to Exhibit No. 30 to Amendment No. 10 to the Schedule 13D filed on February 14, 2003, with respect to the Class B Common Stock, par value $1.00 per share, of NACCO Industries, Inc., Commission File Number 5-38001.
|
|
4.22
|
|
Amendment to Stockholders’ Agreement, dated as of December 28, 2004, by and among National City Bank (Cleveland), the Company, the Participating Stockholders (as defined therein) and the New Participating Stockholders (as defined therein) is incorporated herein by reference to Exhibit 4.23 of the Registration Statement on Form S-4, filed by the Company on January 12, 2005, Commission File Number 333-121996.
|
|
4.23
|
|
Amendment to Stockholders’ Agreement, dated as of February 7, 2005, by and among National City Bank (Cleveland), the Company, the Participating Stockholders (as defined therein) and the New Participating Stockholder (as defined therein) is incorporated herein by reference to Exhibit 4.24 of the Pre-Effective Amendment No. 1 to the Registration Statement on Form S-4, filed by the Company on February 7, 2005, Commission File Number 333-121996.
|
|
4.24
|
|
Amendment to Stockholders’ Agreement, dated as of March 24, 2006, by and among National City Bank (Cleveland), the Company, the Participating Stockholders (as defined therein) and the New Participating Stockholder (as defined therein) is incorporated herein by reference to Exhibit No. 35 to Amendment No. 15 to the Schedule 13D filed on February 14, 2008, with respect to the Class B Common Stock, par value $1.00 per share, of NACCO Industries, Inc., Commission File Number 5-38001.
|
X-2
|
4.25
|
|
Amendment to Stockholders’ Agreement, dated as of September 19, 2007, by and among National City Bank (Cleveland), the Company, the Participating Stockholders (as defined therein) and the New Participating Stockholder (as defined therein) is incorporated herein by reference to Exhibit No. 34 to Amendment No. 15 to the Schedule 13D filed on February 14, 2008, with respect to the Class B Common Stock, par value $1.00 per share, of NACCO Industries, Inc., Commission File Number 5-38001.
|
|
4.26
|
|
Amendment to Stockholders’ Agreement, dated as of November 13, 2008, by and among National City Bank, the Company, the Participating Stockholders and the New Participating Stockholders is incorporated herein by reference to Exhibit No. 36 to Amendment No. 16 to the Schedule 13D filed on February 13, 2009, with respect to the Class B Common Stock, par value $1.00 per share, of NACCO Industries, Inc., Commission File Number 5-38001.
|
|
4.27
|
|
Amendment to Stockholders’ Agreement, dated as of November 26, 2008, by and among National City Bank, the Company, the Participating Stockholders and the New Participating Stockholders is incorporated herein by reference to Exhibit No. 37 to Amendment No. 16 to the Schedule 13D filed on February 13, 2009, with respect to the Class B Common Stock, par value $1.00 per share, of NACCO Industries, Inc., Commission File Number 5-38001.
|
|
4.28
|
|
Amendment to Stockholders’ Agreement, dated as of November 27, 2009, by and among National City Bank, the Company, the Participating Stockholders and the New Participating Stockholders is incorporated herein by reference to Exhibit No. 38 to Amendment No. 17 to the Schedule 13D filed on February 16, 2010, with respect to the Class B Common Stock, par value $1.00 per share, of NACCO Industries, Inc., Commission File Number 5-38001.
|
|
4.29
|
|
Amendment to Stockholders’ Agreement, dated as of February 8, 2011, by and among PNC Bank (as successor in interest to National City Bank), the Company, the Participating Stockholders and the New Participating Stockholder is incorporated herein by reference to Exhibit No. 39 to Amendment No. 19 to the Schedule 13D filed on February 14, 2012, with respect to the Class B Common Stock, par value $1.00 per share, of NACCO Industries, Inc., Commission File Number 5-38001.
|
(10) Material Contracts.
|
10.1*
|
|
The NACCO Industries, Inc. 1975 Stock Option Plan (as amended and restated as of July 17, 1986) is incorporated herein by reference to Exhibit 10(i) to the Company’s Annual Report on Form 10-K for the fiscal year ended December 31, 1991, Commission File Number 1-9172.
|
|
10.2*
|
|
Form of Incentive Stock Option Agreement for incentive stock options granted after 1986 under The NACCO Industries, Inc. 1975 Stock Option Plan (as amended and restated as of July 17, 1986) is incorporated herein by reference to Exhibit 10(iii) to the Company’s Annual Report on Form 10-K for the fiscal year ended December 31, 1991, Commission File Number 1-9172.
|
|
10.3*
|
|
Form of Non-Qualified Stock Option Agreement under The NACCO Industries, Inc., 1975 Stock Option Plan (as amended and restated as of July 17, 1986) is incorporated herein by reference to Exhibit 10(iv) to the Company’s Annual Report on Form 10-K for the fiscal year ended December 31, 1991, Commission File Number 1-9172.
|
|
10.4*
|
|
The NACCO Industries, Inc. 1981 Stock Option Plan (as amended and restated as of July 17, 1986) is incorporated herein by reference to Exhibit 10(v) to the Company’s Annual Report on Form 10-K for the fiscal year ended December 31, 1991, Commission File Number 1-9172.
|
|
10.5*
|
|
Form of Non-Qualified Stock Option Agreement under The NACCO Industries, Inc. 1981 Stock Option Plan (as amended and restated as of July 17, 1986) is incorporated herein by reference to Exhibit 10(vi) to the Company’s Annual Report on Form 10-K for the fiscal year ended December 31, 1991, Commission File Number 1-9172.
|
|
10.6*
|
|
Form of Incentive Stock Option Agreement for incentive stock options granted after 1986 under The NACCO Industries, Inc. 1981 Stock Option Plan (as amended and restated as of July 17, 1986) is incorporated herein by reference to Exhibit 10(viii) to the Company’s Annual Report on Form 10-K for the fiscal year ended December 31, 1991, Commission File Number 1-9172.
|
|
10.7*
|
|
Form of award agreement for the NACCO Industries, Inc. Supplemental Executive Long-Term Incentive Bonus Plan is incorporated herein by reference to Exhibit 10.5 to the Company’s Current Report on Form 8-K, filed by the Company on May 15, 2006, Commission File Number 1-9172.
|
|
10.8*
|
|
Form of award agreement for the NACCO Industries, Inc. Executive Long-Term Incentive Compensation Plan, effective December 12, 2006, is incorporated herein by reference to Exhibit 10.2 to the Company’s Current Report on Form 8-K, filed by the Company on December 19, 2006, Commission File Number 1-9172.
|
|
10.9*
|
|
NACCO Industries, Inc. Supplemental Executive Long-Term Incentive Bonus Plan (Amended and Restated Effective as of January 1, 2008) is incorporated herein by reference to Exhibit 10.45 to the Company’s Annual Report on Form 10-K for the fiscal year ended December 31, 2007, Commission File Number 1-9172.
|
X-3
|
10.10*
|
|
The Retirement Plan For Alfred M. Rankin, Jr. (As Amended and Restated as of December 1, 2007) is incorporated herein by reference to Exhibit 10.1 to the Company’s Current Report on Form 8-K, filed by the Company on December 19, 2007, Commission File Number 1-9172.
|
|
10.11*
|
|
The NACCO Industries, Inc. Unfunded Benefit Plan (As Amended and Restated Effective as of December 1, 2007) is incorporated herein by reference to Exhibit 10.2 to the Company’s Current Report on Form 8-K, filed by the Company on December 19, 2007, Commission File Number 1-9172.
|
|
10.12*
|
|
The NACCO Industries, Inc. Excess Retirement Plan (Effective January 1, 2008) is incorporated herein by reference to Exhibit 10.7 to the Company’s Current Report on Form 8-K, filed by the Company on December 19, 2007, Commission File Number 1-9172.
|
|
10.13*
|
|
Amendment No. 1 to the Retirement Benefit Plan for Alfred M. Rankin, Jr. (As Amended and Restated as of December 1, 2007) is incorporated herein by reference to Exhibit 10.1 to the Company’s Current Report on Form 8-K., filed by the Company on November 13, 2008, Commission File Number 1-9172.
|
|
10.14*
|
|
Amendment No. 1 to the NACCO Industries, Inc. Unfunded Benefit Plan (As Amended and Restated Effective as of December 1, 2007) is incorporated herein by reference to Exhibit 10.2 to the Company’s Current Report on Form 8-K, filed by the Company on November 13, 2008, Commission File Number 1-9172.
|
|
10.15*
|
|
Amendment No. 2 to the Retirement Benefit Plan for Alfred M. Rankin, Jr. (As Amended and Restated as of December 1, 2007) is incorporated herein by reference to Exhibit 10.24 to the Company's Annual Report on Form 10-K for the fiscal year ended December 31, 2009, Commission File Number 1-9172.
|
|
10.16*
|
|
Amendment No. 1 to the NACCO Industries, Inc. Excess Retirement Plan (Effective January 1, 2008) is incorporated herein by reference to Exhibit 10.25 to the Company's Annual Report on Form 10-K for the fiscal year ended December 31, 2009, Commission File Number 1-9172.
|
|
10.17*
|
|
Amendment No. 2 to the NACCO Industries, Inc. Unfunded Benefit Plan (As Amended and Restated Effective as of December 1, 2007) is incorporated herein by reference to Exhibit 10.26 to the Company's Annual Report on Form 10-K for the fiscal year ended December 31, 2009, Commission File Number 1-9172.
|
|
10.18*
|
|
NACCO Industries, Inc. Executive Long-Term Incentive Compensation Plan (As Amended and Restated Effective as of January 1, 2010) is incorporated herein by reference to Appendix A to NACCO's Definitive Proxy Statement, filed by the Company on March 26, 2010, Commission File Number 1-9172.
|
|
10.19*
|
|
NACCO Industries, Inc. Annual Incentive Compensation Plan (Effective January 1, 2010) is incorporated herein by reference to Appendix D to NACCO's Definitive Proxy Statement, filed by the Company on March 26, 2010, Commission File Number 1-9172.
|
|
10.20*
|
|
NACCO Industries, Inc. Non-Employee Directors' Equity Compensation Plan (Amended and Restated Effective May 11, 2011) is incorporated herein by reference to Appendix A to NACCO's Definitive Proxy Statement, filed by the Company on March 18, 2011, Commission File Number 1-9172.
|
|
10.21
|
|
Purchase and Sale Agreement, dated October 11, 2000, by and among Phillips Petroleum Company, Phillips Coal Company, The North American Coal Corporation, Oxbow Property Company L.L.C. and Red Hills Property Company L.L.C. is incorporated herein by reference to Exhibit 10(xxxvii) to the Company’s Annual Report on Form 10-K for the fiscal year ended December 31, 2000, Commission File Number 1-9172.
|
|
10.22
|
|
Credit Agreement, dated as of October 27, 2009, by and among The North American Coal Corporation, the Lenders party hereto and U.S. Bank National Association and Regions Bank, as Co-Syndication Agents, and PNC Bank, National Association, as Administrative Agent is incorporated herein by reference to Exhibit 10.1 to the Company’s Current Report on Form 8-K, filed by the Company on November 2, 2009, Commission File Number 1-9172.
|
|
10.23*
|
|
The North American Coal Corporation Deferred Compensation Plan For Management Employees (As Amended and Restated as of December 1, 2007) is incorporated herein by reference to Exhibit 10.6 to the Company’s Current Report on Form 8-K, filed by the Company on December 19, 2007, Commission File Number 1-9172.
|
|
10.24*
|
|
The North American Coal Corporation Excess Retirement Plan (Effective January 1, 2008) is incorporated herein by reference to Exhibit 10.11 to the Company’s Current Report on Form 8-K, filed by the Company on December 19, 2007, Commission File Number 1-9172.
|
|
10.25*
|
|
The North American Coal Corporation Supplemental Retirement Benefit Plan (As Amended and Restated as of January 1, 2008) is incorporated herein by reference to Exhibit 10.12 to the Company’s Current Report on Form 8-K, filed by the Company on December 19, 2007, Commission File Number 1-9172.
|
|
10.26*
|
|
The North American Coal Corporation Value Appreciation Plan For Years 2006 to 2015 (Amended and Restated Effective January 1, 2008) is incorporated herein by reference to Exhibit 10.17 to the Company’s Current Report on Form 8-K, filed by the Company on December 19, 2007, Commission File Number 1-9172.
|
|
10.27*
|
|
Amendment No. 1 to The North American Coal Corporation Deferred Compensation Plan For Management Employees (As Amended and Restated as of December 1, 2007) is incorporated herein by reference to Exhibit 10.5 to the Company’s Current Report on Form 8-K, filed by the Company on November 13, 2008, Commission File Number 1-9172.
|
|
10.28*
|
|
Amendment No. 1 to the North American Coal Corporation Value Appreciation Plan for Years 2006 to 2015 (Amended and Restated Effective January 1, 2008) is incorporated herein by reference to Exhibit 10.35 to the Company’s Annual Report on Form 10-K for the fiscal year ended December 31, 2008, Commission File Number 1-9172.
|
X-4
|
10.29
|
|
Purchase and Sale Agreement, dated April 29, 2009, by and among The North American Coal Corporation, Oxbow Property Company L.L.C., Red River Mining Company, Cleco Power LLC, Southwestern Electric Power Company, and Dolet Hills Lignite Company, LLC is incorporated herein by reference to Exhibit 10.1 to the Company’s Current Report on Form 8-K, filed by the Company on April 30, 2009, Commission File Number 1-9172.
|
|
10.30*
|
|
Amendment No. 2 to The North American Coal Corporation Value Appreciation Plan for Years 2006 to 2015 (Amended and Restated Effective January 1, 2008) is incorporated herein by reference to Exhibit 10.1 to the Company’s Quarterly Report on Form 10-Q, filed by the Company on November 4, 2009, Commission File Number 1-9172.
|
|
10.31*
|
|
Amendment No. 1 to The North America Coal Corporation Supplemental Retirement Benefit Plan (As Amended and Restated as of January 1, 2008) is incorporated herein by reference to Exhibit 10.41 to the Company's Annual Report on Form 10-K for the fiscal year ended December 31, 2009, Commission File Number 1-9172.
|
|
10.32*
|
|
Amendment No. 2 to the North American Coal Corporation Deferred Compensation Plan for Management Employees (As Amended and Restated as of December 1, 2007) is incorporated herein by reference to Exhibit 10.42 to the Company's Annual Report on Form 10-K for the fiscal year ended December 31, 2009, Commission File Number 1-9172.
|
|
10.33*
|
|
The North American Coal Corporation Annual Incentive Compensation Plan (Effective January 1, 2010), is incorporated herein by reference to Appendix E to NACCO's Definitive Proxy Statement, filed by the Company on March 26, 2010, Commission File Number 1-9172.
|
|
10.34*
|
|
Amendment No. 3 to The North American Coal Corporation Value Appreciation Plan for Years 2006 to 2015 (Amended and Restated Effective January 1, 2008) is incorporated herein by reference to Exhibit 10.1 to the Company’s Quarterly Report on Form 10-Q, filed by the Company on May 5, 2010, Commission File Number 1-9172.
|
|
10.35*
|
|
Amendment No. 4 to The North American Coal Corporation Value Appreciation Plan for Years 2006 to 2015 is incorporated herein by reference to Exhibit 10.1 to the Company’s Current Report on Form 8-K, filed by the Company on November 12, 2010, Commission File Number 1-9172.
|
|
10.36*
|
|
Amendment No. 2 to The North American Coal Corporation Supplemental Retirement Benefit Plan (As Amended and Restated as of January 1, 2008) is incorporated herein by reference to Exhibit 10.40 to the Company's Annual Report on Form 10-K for the fiscal year ended December 31, 2010, Commission File Number 1-9172.
|
|
10.37
|
Amended and Restated Credit Agreement by and among The North American Coal Corporation and the Lenders party thereto and PNC Capital Markets LLC, as Lead Arranger and Bookrunner, PNC Bank, National Association, as Administrative Agent, and KeyBank National Association and Regions Bank, as Co-Syndication Agents, and Union Bank, N.A. as documentation agent, dated as of December 13, 2011 is incorporated herein by reference to Exhibit 10.1 to the Company's Current Report on Form 8-K, filed by the Company on December 16, 2011, Commission File Number 1-9172.
|
|
|
10.38
|
|
Operating Agreement, dated July 31, 1979, among Eaton Corporation and Sumitomo Heavy Industries, Ltd. is incorporated herein by reference to Exhibit 10.2 to NMHG Holding Co.’s Registration Statement on Form S-4, dated May 28, 2002, Commission File Number 333-89248.
|
|
10.39
|
|
Amendment, dated as of January 1, 1994, to the Third Amendment and Restated Operating Agreement dated as of November 7, 1991, between NACCO Materials Handling Group and AT&T Commercial Finance Corporation is incorporated herein by reference to Exhibit 10(c) to the Hyster-Yale Quarterly Report on Form 10-Q for the quarter ended September 30, 1994, Commission File Number 33-28812.
|
|
10.40
|
|
Equity joint venture contract, dated November 27, 1997, between Shanghai Perfect Jinqiao United Development Company Ltd., People’s Republic of China, NACCO Materials Handling Group, Inc., USA, and Sumitomo-Yale Company Ltd., Japan is incorporated herein by reference to Exhibit 10.3 to NMHG Holding Co.’s Registration Statement on Form S-4, dated May 28, 2002, Commission File Number 333-89248.
|
|
10.41
|
|
Recourse and Indemnity Agreement, dated October 21, 1998, between General Electric Capital Corp., NMHG Financial Services, Inc. and NACCO Materials Handling Group, Inc. is incorporated herein by reference to Exhibit 10.4 to NMHG Holding Co.’s Registration Statement on Form S-4, dated May 28, 2002, Commission File Number 333-89248.
|
|
10.42
|
|
Restated and Amended Joint Venture and Shareholders Agreement, dated April 15, 1998, between General Electric Capital Corp. and NACCO Materials Handling Group, Inc. is incorporated herein by reference to Exhibit 10.5 to NMHG Holding Co.’s Registration Statement on Form S-4, dated May 28, 2002, Commission File Number 333-89248.
|
|
10.43
|
|
Amendment No. 1 to the Restated and Amended Joint Venture and Shareholders Agreement between General Electric Capital Corporation and NACCO Materials Handling Group, Inc., dated as of October 21, 1998 is incorporated herein by reference to Exhibit 10.6 to NMHG Holding Co.’s Registration Statement on Form S-4, dated May 28, 2002, Commission File Number 333-89248.
|
X-5
|
10.44
|
|
International Operating Agreement, dated April 15, 1998, between NACCO Materials Handling Group, Inc. and General Electric Capital Corp. (the “International Operating Agreement”) is incorporated herein by reference to Exhibit 10.7 to NMHG Holding Co.’s Registration Statement on Form S-4, dated May 28, 2002, Commission File Number 333-89248.
|
|
10.45
|
|
Amendment No. 1 to the International Operating Agreement, dated as of October 21, 1998 is incorporated herein by reference to Exhibit 10.8 to NMHG Holding Co.’s Registration Statement on Form S-4, dated May 28, 2002, Commission File Number 333-89248.
|
|
10.46
|
|
Amendment No. 2 to the International Operating Agreement, dated as of December 1, 1999, is incorporated herein by reference to Exhibit 10.9 to NMHG Holding Co.’s Registration Statement on Form S-4, dated May 28, 2002, Commission File Number 333-89248.
|
|
10.47
|
|
Amendment No. 3 to the International Operating Agreement, dated as of May 1, 2000, is incorporated herein by reference to Exhibit 10.10 to NMHG Holding Co.’s Registration Statement on Form S-4, dated May 28, 2002, Commission File Number 333-89248.
|
|
10.48
|
|
Letter agreement, dated November 22, 2000, between General Electric Capital Corporation and NACCO Materials Handling Group, Inc. amending the International Operating Agreement is incorporated herein by reference to Exhibit 10.11 to NMHG Holding Co.’s Registration Statement on Form S-4, dated May 28, 2002, Commission File Number 333-89248.
|
|
10.49
|
|
A$ Facility Agreement, dated November 22, 2000, between GE Capital Australia and National Fleet Network Pty Limited is incorporated herein by reference to Exhibit 10.12 to NMHG Holding Co.’s Registration Statement on Form S-4, dated May 28, 2002, Commission File Number 333-89248.
|
|
10.50
|
|
Loan Agreement, dated as of June 28, 1996, between NACCO Materials Handling Group, Inc. and NACCO Industries, Inc. is incorporated herein by reference to Exhibit 10.13 to NMHG Holding Co.’s Registration Statement on Form S-4, dated May 28, 2002, Commission File Number 333-89248.
|
|
10.51
|
|
Amendment No. 2, dated as of January 1, 2004, to the Restated and Amended Joint Venture and Shareholders Agreement between General Electric Capital Corporation and NACCO Materials Handling Group, Inc. is incorporated herein by reference to Exhibit 10.35 to NMHG Holding Co.’s Quarterly Report on Form 10-Q for the quarter ended March 31, 2004, Commission File Number 333-89248.
|
|
10.52
|
|
Letter Agreement, dated March 12, 2004, between General Electric Capital Corporation and NACCO Materials Handling Group, Inc. amending the International Operating Agreement is incorporated herein by reference to Exhibit 10.36 to NMHG Holding Co.’s Quarterly Report on Form 10-Q for the quarter ended March 31, 2004, Commission File Number 333-89248.
|
|
10.53
|
|
Letter Agreement, dated December 15, 2004, between General Electric Capital Corporation and NACCO Materials Handling Group, Inc. amending the International Operating Agreement is incorporated herein by reference to Exhibit 10.1 to NMHG Holding Co.’s Current Report on Form 8-K, filed on February 18, 2005, Commission File Number 333-89248.
|
|
10.54
|
|
Letter Agreement, dated February 14, 2005, between General Electric Capital Corporation and NACCO Materials Handling Group, Inc. amending the International Operating Agreement is incorporated herein by reference to Exhibit 10.2 to NMHG Holding Co.’s Current Report on Form 8-K, filed on February 18, 2005, Commission File Number 333-89248.
|
|
10.55
|
|
Letter Agreement, dated March 28, 2005, between NACCO Materials Handling Group, Inc. and General Electric Capital Corporation is incorporated herein by reference to Exhibit 10.1 to the Company’s Current Report on Form 8-K, filed by the Company on April 1, 2005, Commission File Number 1-9172.
|
|
10.56
|
|
Letter Agreement, dated May 31, 2005, between NACCO Materials Handling Group, Inc. and General Electric Capital Corporation is incorporated herein by reference to Exhibit 10.1 to the Company’s Current Report on Form 8-K, filed by the Company on June 6, 2005, Commission File Number 1-9172.
|
|
10.57
|
|
Amendment No. 5, dated September 29, 2005, to the International Operating Agreement between NACCO Materials Handling Group, Inc. and General Electric Capital Corporation is incorporated herein by reference to Exhibit 10.1 to NMHG Holding Co.’s Current Report on Form 8-K, filed on October 4, 2005, Commission File Number 333-89248.
|
|
10.58
|
|
Term Loan Agreement, dated March 22, 2006, by and among NACCO Materials Handling Group, Inc., as borrower, the financial institutions party thereto, Citicorp North America, Inc., as Administrative Agent, and Citigroup Global Markets Inc., as Sole Lead Arranger, Sole Bookrunner and Syndication Agent, is incorporated herein by reference to Exhibit 10.1 to NMHG Holding Co.’s Current Report on Form 8-K, filed on March 28, 2006, Commission File Number 333-89248.
|
|
10.59
|
|
Agreement for Services between NMHG Oregon, LLC and Reginald R. Eklund, Effective July 1, 2006 is incorporated herein by reference to Exhibit 10.1 to the Company’s Current Report on Form 8-K, filed by the Company on September 6, 2006, Commission File Number 1-9172.
|
|
10.60*
|
|
The NACCO Materials Handling Group, Inc. Long-Term Incentive Compensation Plan For the Period From January 1, 2000 Through December 31, 2007 (As Amended and Restated as of December 1, 2007), is incorporated herein by reference to Exhibit 10.14 to the Company’s Current Report on Form 8-K, filed by the Company on December 19, 2007, Commission File Number 1-9172.
|
X-6
|
10.61*
|
|
Amendment No. 1 to The NACCO Materials Handling Group, Inc. Long-Term Incentive Compensation Plan For the Period From January 1, 2000 Through December 31, 2007 (As Amended and Restated as of December 1, 2007), is incorporated herein by reference to Exhibit 10.1 to the Company’s Quarterly Report on Form 10-Q, filed by the Company on April 30, 2008, Commission File Number 1-9172.
|
|
10.62
|
|
Amendment No. 3, effective as of July 1, 2008, to the Restated and Amended Joint Venture and Shareholders Agreement, dated as of April 15, 1998, by and between NACCO Materials Handling Group, Inc. and General Electric Capital Corporation, is incorporated herein by reference to Exhibit 10.1 to the Company’s Current Report on Form 8-K, filed by the Company on August 1, 2008, Commission File Number 1-9172.
|
|
10.63
|
|
Amendment No. 7, effective as of July 1, 2008, to the International Operating Agreement, dated as of April 15, 1998, by and between NACCO Materials Handling Group, Inc. and General Electric Capital Corporation, is incorporated herein by reference to Exhibit 10.2 to the Company’s Current Report on Form 8-K, filed by the Company on August 1, 2008, Commission File Number 1-9172.
|
|
10.64
|
|
Amendment No. 2, effective as of July 1, 2008, to the Recourse and Indemnity Agreement, dated as of October 21, 1998, by and among NACCO Materials Handling Group, Inc., NMHG Financial Services, Inc. and General Electric Capital Corporation, is incorporated herein by reference to Exhibit 10.3 to the Company’s Current Report on Form 8-K, filed by the Company on August 1, 2008, Commission File Number 1-9172.
|
|
10.65
|
|
Letter Agreement executed October 15, 2008 by and between NACCO Materials Handling Group, Inc. and General Electric Capital Corporation is incorporated herein by reference to Exhibit 10.1 to the Company’s Current Report on Form 8-K, filed by the Company on October 20, 2008, Commission File Number 1-9172.
|
|
10.66*
|
|
NACCO Materials Handling Group, Inc. Excess Pension Plan for UK Transferees (As Amended and Restated Effective November 11, 2008) is incorporated herein by reference to Exhibit 10.81 to the Company’s Annual Report on Form 10-K for the fiscal year ended December 31, 2008, Commission File Number 1-9172.
|
|
10.67*
|
|
The NACCO Materials Handling Group, Inc. Unfunded Benefit Plan (As Amended and Restated April 24, 2009) is incorporated herein by reference to Exhibit 10.1 to the Company’s Quarterly Report on Form 10-Q, filed by the Company on May 5, 2009, Commission File Number 1-9172.
|
|
10.68*
|
|
Amendment No. 1 to the NACCO Materials Handling Group, Inc. Unfunded Benefit Plan (As Amended and Restated Effective April 24, 2009) is incorporated herein by reference to Exhibit 10.86 to the Company's Annual Report on Form 10-K for the fiscal year ended December 31, 2009, Commission File Number 1-9172.
|
|
10.69*
|
|
Amendment No. 2 to the NACCO Materials Handling Group, Inc. Long-Term Incentive Compensation Plan for the Period from January 1, 2000 through December 31, 2007 (As Amended and Restated as of December 1, 2007) is incorporated herein by reference to Exhibit 10.88 to the Company's Annual Report on Form 10-K for the fiscal year ended December 31, 2009, Commission File Number 1-9172.
|
|
10.70*
|
|
Amendment No. 3 to the NACCO Materials Handling Group, Inc. Long-Term Incentive Compensation Plan for the Period from January 1, 2000 through December 31, 2007 (As Amended and Restated as of December 1, 2007) is incorporated herein by reference to Exhibit 10.3 to the Company's Quarterly Report on Form 10-Q, filed by the Company on May 5, 2010, Commission File Number 1-9172.
|
|
10.71*
|
|
Amendment No. 2 to the NACCO Materials Handling Group, Inc. Unfunded Benefit Plan (As Amended and Restated Effective as of April 24, 2009) is incorporated herein by reference to Exhibit 10.5 to the Company's Quarterly Report on Form 10-Q, filed by the Company on May 5, 2010, Commission File Number 1-9172.
|
|
10.72*
|
|
The NACCO Materials Handling Group, Inc. 2010 Annual Incentive Compensation Plan is incorporated herein by reference to Exhibit 10.1 to the Company's Current Report on Form 8-K, filed by the Company on March 30, 2010, Commission File Number 1-9172.
|
|
10.73*
|
|
NACCO Materials Handling Group, Inc. Long-Term Incentive Compensation Plan (Effective January 1, 2010) is incorporated herein by reference to Appendix B to NACCO's Definitive Proxy Statement, filed by the Company on March 26, 2010, Commission File Number 1-9172.
|
|
10.74*
|
|
The NACCO Materials Handling Group, Inc. Excess Retirement Plan (Effective January 1, 2012) is incorporated herein by reference to Exhibit 10.1 to the Company’s Current Report on Form 8-K filed by the Company on November 16, 2011, Commission File Number 1-9172.
|
|
10.75*
|
|
The NACCO Materials Handling Group, Inc. 2011 Annual Incentive Compensation Plan is incorporated herein by reference to Exhibit 10.2 to the Company's Current Report on Form 8-K, filed by the Company on March 9, 2011, Commission File Number 1-9172.
|
|
10.76
|
|
Second Amended and Restated Credit Agreement, dated as of June 30, 2010, by and among NMHG Holding Co., NACCO Materials Handling Group, Inc., NACCO Materials Handling Limited, NACCO Materials Handling B.V., NMH International B.V., N.M.H. Holding B.V., the financial institutions from time to time party hereto as Lenders, the financial institutions from time to time party hereto as Issuing Banks, Bank of America, N.A., as Syndication Agent, Citicorp North America, Inc., as Administrative Agent, Citigroup Global Markets Inc. and Banc of America Securities LLC as Joint Lead Arrangers and as Joint Bookrunners, U.S. Bank National Association, as Senior Managing Agent and Wells Fargo Capital Finance, Inc., as Documentation Agent, is incorporated by reference to Exhibit No. 10.1 to the Company's Current Report on Form 8-K, filed by the Company on July 7, 2010, Commission File Number 1-9172.
|
X-7
|
10.77*
|
|
The Kitchen Collection, Inc. Excess Retirement Plan (Effective January 1, 2008), is incorporated herein by reference to Exhibit 10.10 to the Company’s Current Report on Form 8-K, filed by the Company on December 19, 2007, Commission File Number 1-9172.
|
|
10.78*
|
|
The Kitchen Collection, Inc. Long-Term Incentive Compensation Plan For the Period From January 1, 2003 Through December 31, 2007 (As Amended and Restated Effective as of December 1, 2007), is incorporated herein by reference to Exhibit 10.15 to the Company’s Current Report on Form 8-K, filed by the Company on December 19, 2007, Commission File Number 1-9172.
|
|
10.79*
|
|
Amendment No. 1 to The Kitchen Collection, Inc. Long-Term Incentive Compensation Plan For the Period From January 1, 2003 Through December 31, 2007 (As Amended and Restated Effective as of December 1, 2007), is incorporated herein by reference to Exhibit 10.2 to the Company’s Quarterly Report on Form 10-Q, filed by the Company on April 30, 2008, Commission File Number 1-9172.
|
|
10.80
|
|
Guaranty Agreement, dated as of December 17, 2002, executed by Hamilton Beach/Proctor-Silex, Inc. in favor of Wachovia National Association, as Administrative Agent, and ABN Amro Bank N.V., Canadian Branch, as Canadian Agent, and the Lenders, for the benefit of Proctor-Silex Canada, Inc. is incorporated herein by reference to Exhibit 10(xcvii) to the Company’s Annual Report on Form 10-K for the fiscal year ended December 31, 2002, Commission File Number 1-9172.
|
|
10.81
|
|
Pledge Agreement, dated as of December 17, 2002, by and among HB-PS Holding Company, Inc. and Wachovia National Association, as Administrative Agent (100% of stock of Hamilton Beach/Proctor-Silex, Inc.) is incorporated herein by reference to Exhibit 10(xcviii) to the Company’s Annual Report on Form 10-K for the fiscal year ended December 31, 2002, Commission File Number 1-9172.
|
|
10.82
|
|
Pledge Agreement, dated as of December 17, 2002, by and among Hamilton Beach/Proctor-Silex, Inc. and Wachovia National Association, as Administrative Agent (65% of stock of each of Proctor-Silex Canada, Inc., Grupo HB/PS, S.A. de C.V., Hamilton Beach/Proctor-Silex de Mexico, S.A. de C.V., and Proctor-Silex, S.A. de C.V. and 100% of Altoona Services, Inc.) is incorporated herein by reference to Exhibit 10(xcix) to the Company’s Annual Report on Form 10-K for the fiscal year ended December 31, 2002, Commission File Number 1-9172.
|
|
10.83
|
|
Credit Agreement, dated as of December 17, 2002, among Hamilton Beach/Proctor-Silex, Inc. and Proctor-Silex Canada, Inc., as Borrowers, each of the Financial Institutions initially a signatory, as Lenders, Wachovia National Association, as Administrative Agent, ABN Amro Bank N.V., Canadian Branch, as Canadian Agent, Key Bank, National Association, as Syndication Agent, Fleet Capital Corporation, as Documentation Agent, LaSalle Business Credit, Inc., as Documentation Agent, and National City Commercial Finance, Inc., as Documentation Agent is incorporated herein by reference to Exhibit 10(xciv) to the Company’s Annual Report on Form 10-K for the fiscal year ended December 31, 2002, Commission File Number 1-9172.
|
|
10.84
|
|
Security Agreement, dated as of December 17, 2002, between Hamilton Beach/Proctor-Silex, Inc. and Wachovia National Association, as Administrative Agent is incorporated herein by reference to Exhibit 10 (xcv) to the Company’s Annual Report on Form 10-K for the fiscal year ended December 31, 2002, Commission File Number 1-9172.
|
|
10.85
|
|
Security Agreement, dated as of December 17, 2002, between Proctor-Silex Canada, Inc., Wachovia National Association, as Administrative Agent, and ABN Amro Bank N.V., Canadian Branch, as Canadian Agent is incorporated herein by reference to Exhibit 10(xcvi) to the Company’s Annual Report on Form 10-K for the fiscal year ended December 31, 2002, Commission File Number 1-9172.
|
|
10.86
|
|
First Amendment, dated as of June 29, 2004, to the Credit Agreement, dated as of December 17, 2002, among Hamilton Beach/Proctor-Silex, Inc. and Proctor-Silex Canada, Inc., as Borrowers, each of the Financial Institutions initially a signatory, as Lenders, Wachovia National Association, as Administrative Agent, ABN Amro Bank N.V., Canadian Branch, as Canadian Agent, Key Bank, National Association, as Syndication Agent, Fleet Capital Corporation, as Documentation Agent, LaSalle Business Credit, Inc., as Documentation Agent, and National City Business Credit, Inc., as Documentation Agent is incorporated herein by reference to Exhibit 10(cxxxvi) to the Company’s Quarterly Report on Form 10-Q for the quarter ended June 30, 2004, Commission File Number 1-9172.
|
|
10.87
|
|
Second Amendment to Credit Agreement, dated as of June 23, 2005, among Hamilton Beach/Proctor-Silex, Inc., the Lenders named therein and Wachovia Bank, as Agent, is incorporated herein by reference to Exhibit 10.1 to the Company’s Current Report on Form 8-K, filed by the Company on June 24, 2005, Commission File Number 1-9172.
|
|
10.88
|
|
Third Amendment to Credit Agreement, dated as of May 17, 2006, among Hamilton Beach/Proctor-Silex, Inc., the Lenders named therein and Wachovia Bank, as Agent, is incorporated herein by reference to Exhibit 10.1 to the Company’s Current Report on Form 8-K, filed by the Company on June 26, 2006, Commission File Number 1-9172.
|
|
10.89
|
|
Fourth Amendment to Credit Agreement, dated as of May 31, 2007, among Hamilton Beach/Proctor-Silex, Inc., the Lenders named therein and UBS AG, Stamford Branch as Administrative Agent, KeyBank National Association as Documentation Agent and Wachovia Bank, National Association as Syndication Agent, is incorporated herein by reference to Exhibit 10.1 to the Company’s Current Report on Form 8-K, filed by the Company on June 4, 2007, Commission File Number 1-9172.
|
X-8
|
10.90
|
|
Term Loan Credit Agreement, dated as of May 31, 2007, among Hamilton Beach/Proctor-Silex, Inc., the Lenders named therein and UBS AG, Stamford Branch as Administrative Agent, KeyBank National Association as Documentation Agent and Wachovia Bank, National Association as Syndication Agent, is incorporated herein by reference to Exhibit 10.2 to the Company’s Current Report on Form 8-K, filed by the Company on June 4, 2007, Commission File Number 1-9172.
|
|
10.91
|
|
First Amendment to Term Loan Credit Agreement, dated as of July 6, 2007, among Hamilton Beach/Proctor-Silex, Inc., the Lenders named therein and UBS AG, Stamford Branch as Administrative Agent, is incorporated herein by reference to Exhibit 10.5 to the Company’s Quarterly Report on Form 10-Q, filed by the Company on August 6, 2007, Commission File Number 1-9172.
|
|
10.92*
|
|
The Hamilton Beach Brands, Inc. Excess Retirement Plan (Effective January 1, 2008), is incorporated herein by reference to Exhibit 10.8 to the Company’s Current Report on Form 8-K, filed by the Company on December 19, 2007, Commission File Number 1-9172.
|
|
10.93*
|
|
The Hamilton Beach Brands, Inc. Long-Term Incentive Compensation Plan For the Period From January 1, 2003 Through December 31, 2007 (As Amended and Restated as of December 1, 2007), is incorporated herein by reference to Exhibit 10.13 to the Company’s Current Report on Form 8-K, filed by the Company on December 19, 2007, Commission File Number 1-9172.
|
|
10.94*
|
|
Amendment No. 1 to The Hamilton Beach Brands, Inc. Long-Term Incentive Compensation Plan For the Period From January 1, 2003 Through December 31, 2007 (As Amended and Restated Effective as of December 1, 2007), is incorporated herein by reference to Exhibit 10.3 to the Company’s Quarterly Report on Form 10-Q, filed by the Company on April 30, 2008, Commission File Number 1-9172.
|
|
10.95*
|
|
Amendment No. 2 to the Hamilton Beach Brands, Inc. Long-Term Incentive Compensation Plan for the Period from January 1, 2003 through December 31, 2007 (As Amended and Restated Effective as of December 1, 2007) is incorporated herein by reference to Exhibit 10.117 to the Company's Annual Report on Form 10-K for the fiscal year ended December 31, 2009, Commission File Number 1-9172.
|
|
10.96*
|
|
The Hamilton Beach Brands, Inc. 2010 Annual Incentive Compensation Plan is incorporated herein by reference to Exhibit 10.2 to the Company's Quarterly Report on Form 10-Q, filed by the Company on May 5, 2010, Commission File Number 1-9172.
|
|
10.97*
|
|
The Hamilton Beach Brands, Inc. Long-Term Incentive Compensation Plan (Effective January 1, 2010) (is incorporated herein by reference to Appendix C to NACCO's Definitive Proxy Statement, filed by the Company on March 26, 2010, Commission File Number 1-9172.
|
|
10.98*
|
|
The Hamilton Beach Brands, Inc. 2011 Annual Incentive Compensation Plan is incorporated herein by reference to Exhibit 10.1 to the Company's Current Report on Form 8-K, filed by the Company on March 9, 2011, Commission File Number 1-9172.
|
(21) Subsidiaries. A list of the subsidiaries of the Company is attached hereto as Exhibit 21.
(23) Consents of experts and counsel.
|
23.1
|
Consents of experts and counsel.
|
|
(24) Powers of Attorney.
|
24.1
|
|
A copy of a power of attorney for John P. Jumper is attached hereto as Exhibit 24.1.
|
|
24.2
|
|
A copy of a power of attorney for Dennis W. LaBarre is attached hereto as Exhibit 24.2.
|
|
24.3
|
|
A copy of a power of attorney for Richard de J. Osborne is attached hereto as Exhibit 24.3.
|
|
24.4
|
|
A copy of a power of attorney for Michael E. Shannon is attached hereto as Exhibit 24.4.
|
|
24.5
|
|
A copy of a power of attorney for Britton T. Taplin is attached hereto as Exhibit 24.5.
|
|
24.6
|
|
A copy of a power of attorney for David F. Taplin is attached hereto as Exhibit 24.6.
|
|
24.7
|
|
A copy of a power of attorney for John F. Turben is attached hereto as Exhibit 24.7.
|
|
24.8
|
|
A copy of a power of attorney for Eugene Wong is attached hereto as Exhibit 24.8.
|
X-9
(31) Rule 13a-14(a)/15d-14(a) Certifications.
|
31(i)(1)
|
|
Certification of Alfred M. Rankin, Jr. pursuant to Rule 13a-14(a)/15d-14(a) of the Exchange Act is attached hereto as Exhibit 31(i)(1).
|
|
31(i)(2)
|
|
Certification of Kenneth C. Schilling pursuant to Rule 13a-14(a)/15d-14(a) of the Exchange Act is attached hereto as Exhibit 31(i)(2).
|
|
(32)
|
|
Certifications pursuant to 18 U.S.C. Section 1350, as adopted pursuant to Section 906 of the Sarbanes-Oxley Act of 2002, signed and dated by Alfred M. Rankin, Jr. and Kenneth C. Schilling
|
|
(95)
|
|
Mine Safety Disclosure Exhibit is attached hereto as Exhibit 95.
|
|
101.SCH
|
|
XBRL Taxonomy Extension Schema Document
|
|
101.CAL
|
|
XBRL Taxonomy Extension Calculation Linkbase Document
|
|
101.DEF
|
|
XBRL Taxonomy Extension Definition Linkbase Document
|
|
101.LAB
|
|
XBRL Taxonomy Extension Label Linkbase Document
|
|
101.PRE
|
|
XBRL Taxonomy Extension Presentation Linkbase Document
|
|
*
|
|
Management contract or compensation plan or arrangement required to be filed as an exhibit pursuant to Item15(b) of this Annual Report on Form 10-K.
|
X-10
TABLE OF CONTENTS
Part IItem 1. BusinessItem 1A. Risk FactorsItem 1B. Unresolved Staff CommentsItem 2. PropertiesItem 3. Legal ProceedingsItem 4. Mine Safety DisclosuresItem 4A. Executive Officers Of The RegistrantPart IIItem 5. Market For Registrant S Common Equity, Related Stockholder Matters and Issuer Purchases Of Equity SecuritiesItem 6. Selected Financial DataItem 7. Management's Discussion and Analysis Of Financial Condition and Results Of OperationsItem 7A. Quantitative and Qualitative Disclosures About Market RiskItem 8. Financial Statements and Supplementary DataItem 9. Changes in and Disagreements with Accountants on Accounting and Financial DisclosureItem 9A. Controls and ProceduresItem 9B. Other InformationPart IIIItem 10. Directors, Executive Officers and Corporate GovernanceItem 11. Executive CompensationItem 12. Security Ownership Of Certain Beneficial Owners and Management and Related Stockholder MattersItem 13. Certain Relationships and Related Transactions, and Director IndependenceItem 14. Principal Accountant Fees and ServicesPart IVItem 15. Exhibits and Financial Statement SchedulesItem 8, Item 15(a)(1) and (2), and Item 15(c)Item 15(a)(1) and (2)Note 1 Principles Of Consolidation and Nature Of OperationsNote 2 Significant Accounting PoliciesNote 3 Restructuring and Related ProgramsNote 4 DispositionsNote 5 Other TransactionsNote 6 InventoriesNote 7 Property, Plant and Equipment, NetNote 8 Intangible AssetsNote 9 Asset Retirement ObligationsNote 10 Current and Long-term FinancingNote 11 Financial Instruments and Derivative Financial InstrumentsNote 12 Leasing ArrangementsNote 13 ContingenciesNote 14 GuaranteesNote 15 Product WarrantiesNote 16 Common Stock and Earnings Per ShareNote 17 Income TaxesNote 18 Retirement Benefit PlansNote 19 Business SegmentsNote 20 Quarterly Results Of Operations (unaudited)Note 21 Parent Company Condensed Balance SheetsNote 22 Related Party Transactions