NATIONAL CINEMEDIA, INC.
10-Ks and 10-Qs
|
|
|
|
|
|
|
|
|
|
|
|
|
|
|
|
|
|
|
|
|
|
|
|
|
|
|
|
|
|
|
|
|
|
|
|
|
|
|
|
|
|
|
|
|
|
|
|
|
|
|
|
|
|
|
|
UNITED STATES
SECURITIES AND EXCHANGE COMMISSION
Washington, D.C. 20549
__________________________________________________________
FORM 10-K
__________________________________________________________
|
ý
|
ANNUAL REPORT PURSUANT TO SECTION 13 OR 15(d) OF THE SECURITIES EXCHANGE ACT OF 1934
|
For the fiscal year ended
December 26, 2019
or
|
¨
|
TRANSITION REPORT PURSUANT TO SECTION 13 OR 15(d) OF THE SECURITIES EXCHANGE ACT OF 1934
|
For the transition period from __________________ to __________________
Commission file number: 001-33296
__________________________________________________________
NATIONAL CINEMEDIA, INC.
(Exact name of registrant as specified in its charter)
__________________________________________________________
|
Delaware
|
|
20-5665602
|
|
(State or other jurisdiction of
incorporation or organization)
|
|
(I.R.S. Employer
Identification No.)
|
|
|
|
|
|
6300 S. Syracuse Way, Suite 300
|
|
|
|
Centennial, Colorado
|
|
80111
|
|
(Address of principal executive offices)
|
|
(Zip Code)
|
Registrant’s telephone number, including area code: (303) 792-3600
Securities registered pursuant to Section 12(b) of the Act:
|
Title of each class
|
Trading symbol
|
Name of each exchange on which registered
|
|
Common Stock, par value $0.01 per share
|
NCMI
|
The Nasdaq Stock Market LLC
|
Securities registered pursuant to Section 12(g) of the Act: None
Indicate by check mark if the registrant is a well-known seasoned issuer, as defined in Rule 405 of the Securities Act. Yes
¨
No
þ
Indicate by check mark if the registrant is not required to file reports pursuant to Section 13 or Section 15(d) of the Act. Yes
¨
No
þ
Indicate by check mark whether the registrant (1) has filed all reports required to be filed by Section 13 or 15(d) of the Securities Exchange Act of 1934 during the preceding 12 months (or for such shorter period that the registrant was required to file such reports), and (2) has been subject to such filing requirements for the past 90 days. Yes
þ
No
¨
Indicate by check mark whether the registrant has submitted electronically every Interactive Data File required to be submitted pursuant to Rule 405 of Regulation S-T (§232.405 of this chapter) during the preceding 12 months (or for such shorter period that the registrant was required to submit and post such files). Yes
þ
No
¨
Indicate by check mark whether the registrant is a large accelerated filer, an accelerated filer, a non-accelerated filer, a smaller reporting company, or an emerging growth company. See the definitions of “large accelerated filer,” “accelerated filer,” “smaller reporting company” and “emerging growth company” in Rule 12b-2 of the Exchange Act.
|
Large accelerated filer
|
¨
|
Smaller reporting company
|
¨
|
|
Non-accelerated filer
|
¨
|
Emerging growth company
|
¨
|
|
Accelerated filer
|
þ
|
|
|
If an emerging growth company, indicate by check mark if the registrant has elected not to use the extended transition method for complying with any new or revised financial accounting standards provided pursuant to Section 13(a) of the Exchange Act.
¨
Indicate by check mark whether the registrant is a shell company (as defined in Rule 12b-2 of the Act). Yes
¨
No
þ
Based on the closing sales price on June 27, 2019, the aggregate market value of the voting and non-voting common stock held by non-affiliates of the registrant was $328,535,741.
As of
February 18, 2020
, 79,751,489 shares of the registrant’s common stock (including unvested restricted stock), par value of $0.01 per share, were outstanding.
DOCUMENTS INCORPORATED BY REFERENCE
Certain portions of the registrant’s definitive proxy statement to be used in connection with its Annual Meeting of Stockholders and to be filed within 120 days of
December 26, 2019
are incorporated by reference into Part III, Items 10-14, of this report on Form 10-K.
TABLE OF CONTENTS
|
|
|
Page
|
|
|
PART I
|
|
|
|
|
|
|
Item 1.
|
||
|
|
|
|
|
Item 1A.
|
||
|
|
|
|
|
Item 1B.
|
||
|
|
|
|
|
Item 2.
|
||
|
|
|
|
|
Item 3.
|
||
|
|
|
|
|
Item 4.
|
||
|
|
|
|
|
|
PART II
|
|
|
|
|
|
|
Item 5.
|
||
|
|
|
|
|
Item 6.
|
||
|
|
|
|
|
Item 7.
|
||
|
|
|
|
|
Item 7A.
|
||
|
|
|
|
|
Item 8.
|
||
|
|
|
|
|
Item 9.
|
||
|
|
|
|
|
Item 9A.
|
||
|
|
|
|
|
Item 9B.
|
||
|
|
|
|
|
|
PART III
|
|
|
|
|
|
|
Item 10.
|
||
|
|
|
|
|
Item 11.
|
||
|
|
|
|
|
Item 12.
|
||
|
|
|
|
|
Item 13.
|
||
|
|
|
|
|
Item 14.
|
||
|
|
|
|
|
|
PART IV
|
|
|
|
|
|
|
Item 15.
|
||
|
|
|
|
|
Item 16.
|
||
Certain Definitions
In this document, unless the context otherwise requires:
|
•
|
“NCM, Inc.,” “the Company,” “we,” “us” or “our” refer to National CineMedia, Inc., a Delaware corporation, and its consolidated subsidiary National CineMedia, LLC.
|
|
•
|
“NCM LLC” refers to National CineMedia, LLC, a Delaware limited liability company, which commenced operations on April 1, 2005, and is the current operating company for our business, which NCM, Inc. acquired an interest in, and became a member and the sole manager of, upon completion of our initial public offering, or “IPO,” which closed on February 13, 2007.
|
|
•
|
“ESAs” refers to the amended and restated exhibitor services agreements entered into by NCM LLC with each of NCM LLC’s founding members upon completion of the IPO, which were further amended and restated on December 26, 2013 in connection with the sale of the Fathom Events business and, in the case of the ESAs with Cinemark and Regal, were further amended on September 17, 2019 (the “2019 ESA Amendments”) to extend the terms of the ESAs and modify the program distributed by NCM LLC through its DCN for exhibition in Cinemark and Regal theaters.
|
|
•
|
“AMC” refers to AMC Entertainment Inc. and its subsidiaries, National Cinema Network, Inc., or “NCN,” which contributed assets used in the operations of NCM LLC and formed NCM LLC in March 2005, AMC ShowPlace Theatres, Inc., AMC Starplex, LLC and American Multi-Cinema, Inc., which is a party to an ESA with NCM LLC.
|
|
•
|
“Cinemark” refers to Cinemark Holdings, Inc. and its subsidiaries, Cinemark Media, Inc., which joined NCM LLC in July 2005, and Cinemark USA, Inc., which is a party to an ESA with NCM LLC.
|
|
•
|
“Regal” refers to Cineworld Group plc, Regal Entertainment Group and its subsidiaries, Regal CineMedia Corporation, which contributed assets used in the operations of NCM LLC, Regal CineMedia Holdings, LLC, which formed NCM LLC in March 2005, and Regal Cinemas, Inc., which is a party to an ESA with NCM LLC.
|
|
•
|
“Founding members” refers to AMC, Cinemark and Regal.
|
|
•
|
“network affiliates” refers to certain third-party theater circuits with which NCM LLC has long-term network affiliate agreements.
|
|
•
|
“Adjusted OIBDA” refers to a non-GAAP financial measure which management defines as operating income before depreciation and amortization expense adjusted to also exclude amortization of intangibles recorded for network theater screen leases, non-cash share-based payment costs, merger-related administrative costs, CEO transition costs and early lease termination expense.
|
|
•
|
“Adjusted OIBDA margin” is a non-GAAP financial measure calculated by dividing Adjusted OIBDA by total revenue.
|
|
•
|
“LEN” refers to NCM LLC’s Lobby Entertainment Network.
|
|
•
|
“CPM” is a basis for which advertising is sold by the cost per thousand viewers.
|
|
•
|
“DCN” refers to NCM LLC’s Digital Content Network.
|
|
•
|
“TRA” refers to the tax receivable agreement entered into by NCM, Inc. and the founding members.
|
Market Information
Information regarding market share, market position and industry data pertaining to our business contained in this report consists of estimates based on data and reports compiled by industry professional organizations (including, but not limited to, Nielsen Media Research, Inc. (“Nielsen”), the Motion Picture Association of America, and the National Association of Theatre Owners) and analysts, and our knowledge of our revenues and markets. Designated Market Area® is a registered trademark of Nielsen. We take responsibility for compiling and extracting, but have not independently verified, market and industry data provided by third parties, or by industry or general publications, and take no further responsibility for such data. Similarly, while we believe our internal estimates are reliable, our estimates have not been verified by any independent sources, and we cannot assure you as to their accuracy.
Cautionary Statement Regarding Forward-Looking Statements
In addition to historical information, some of the information in this Form 10-K includes “forward-looking statements.” All statements other than statements of historical facts included in this Form 10-K, including, without limitation, certain statements under “Business,” “Risk Factors” and “Management’s Discussion and Analysis of Financial Condition and
3
Results of Operations,” may constitute forward-looking statements. In some cases, you can identify these “forward-looking statements” by the specific words, including but not limited to “may,” “will,” “can,” “should,” “expects,” “forecasts,” “projects,” “intends,” “plans,” “anticipates,” “believes,” “estimates,” “predicts,” “potential” or “continue” or the negative of those words and other comparable words. These forward-looking statements involve known and unknown risks and uncertainties, assumptions and other factors, including, but not limited to, the following:
|
•
|
potential significant declines in theater attendance;
|
|
•
|
changes in theater patron behavior could result in declines in viewership of the
Noovie
pre-show;
|
|
•
|
we may not realize the anticipated benefits of the 2019 ESA Amendments;
|
|
•
|
we may not be successful in increasing the number of theaters in which NCM LLC has the right to display Post-Showtime Inventory;
|
|
•
|
changes to relationships with NCM LLC's founding members;
|
|
•
|
our plans for developing additional revenue opportunities may not be implemented and may not be achieved;
|
|
•
|
competition within the overall advertising industry;
|
|
•
|
we may not maintain our technological advantage;
|
|
•
|
national, regional and local economic conditions;
|
|
•
|
we may not be able to grow our advertising revenue in line with the growth of our contractual costs;
|
|
•
|
the potential loss of any major content partner or advertising client;
|
|
•
|
potential inability to retain or replace our senior management;
|
|
•
|
founding member and network affiliate government regulation could slow growth;
|
|
•
|
failure to effectively manage or continue our growth;
|
|
•
|
potential failures or disruptions in our technology systems;
|
|
•
|
possible infringement of our technology on intellectual property rights owned by others;
|
|
•
|
the content we distribute and user information we collect and maintain through our in-theater, online or mobile services may expose us to liability;
|
|
•
|
changes in regulations relating to the Internet, privacy or other areas of our online or mobile services;
|
|
•
|
our revenue and Adjusted OIBDA fluctuate from quarter to quarter and may be unpredictable, which could increase the volatility of our stock price;
|
|
•
|
an ineffective system of internal controls over financial reporting could adversely affect our ability to accurately report our financial results and market confidence in our reported financial information;
|
|
•
|
we are a holding company with no operations of our own, and we depend on distributions and payments under the NCM LLC operating and management services agreements from NCM LLC to meet our ongoing obligations and to pay cash dividends on our common stock;
|
|
•
|
risks and uncertainties relating to our significant indebtedness and investments, including the availability and adequacy of cash flows to meet our debt service requirements and any other indebtedness that we may incur in the future;
|
|
•
|
NCM LLC’s other members or their affiliates may have interests that differ from those of us or our public stockholders and they may be able to influence our affairs, compete with us or benefit from corporate opportunities that might otherwise be available to us;
|
|
•
|
future issuance of membership units or preferred stock could dilute the interest of our common stockholders;
|
|
•
|
determination that NCM, Inc. or any of NCM LLC’s founding members is an investment company;
|
|
•
|
determination that any amount of our tax benefits under the TRA should not have been available;
|
|
•
|
the effect on our stock price from the substantial number of our shares eligible for sale;
|
|
•
|
the interests of our largest stockholder and NCM LLC’s other members may be different from or conflict with those of our other stockholders; and
|
4
|
•
|
other factors described under “Risk Factors” or elsewhere in this Annual Report on Form 10-K.
|
This list of factors that may affect future performance and the accuracy of forward-looking statements are illustrative and not exhaustive. Our actual results, performance or achievements could differ materially from those indicated in these statements as a result of additional factors as more fully discussed in the section titled “Risk Factors,” and elsewhere in this Annual Report on Form 10-K. Given these uncertainties, readers are cautioned not to place undue reliance on our forward-looking statements.
All subsequent written and oral forward-looking statements attributable to us or to persons acting on our behalf are expressly qualified in their entirety by these cautionary statements. We disclaim any intention or obligation to update publicly any forward-looking statements, whether as a result of new information, future events or otherwise, except as may be required under applicable securities laws.
5
PART I
|
Item 1.
|
Business
|
The Company
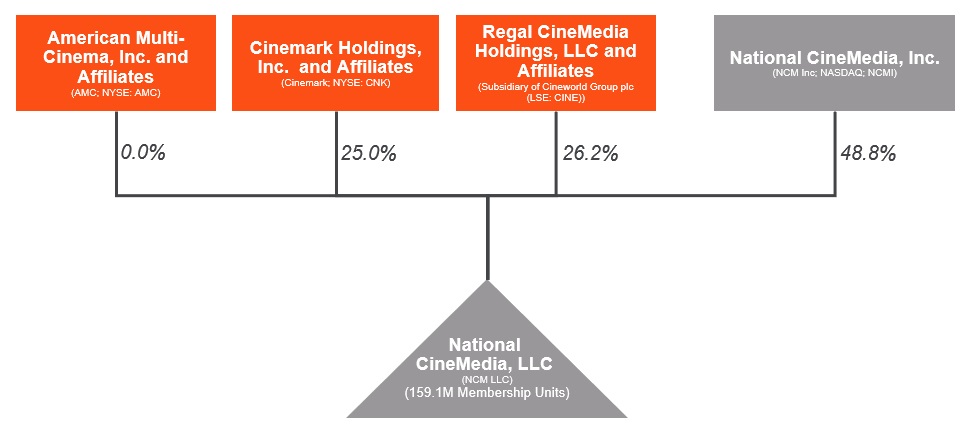
NCM, Inc., a Delaware corporation, was organized on October 5, 2006 and began operations on February 13, 2007 upon completion of its IPO. NCM, Inc. is a holding company that manages its consolidated subsidiary, NCM LLC. NCM, Inc. has no business operations or material assets other than its cash and ownership interest of approximately
48.8%
of the common membership units in NCM LLC as of
December 26, 2019
. NCM LLC’s other members, Cinemark and Regal, two of the three largest motion picture exhibition companies in the U.S., held the remaining
51.2%
of NCM LLC’s common membership units as of
December 26, 2019
. NCM, Inc.’s primary source of cash flow from operations is distributions from NCM LLC pursuant to the NCM LLC operating agreement. NCM, Inc. also receives management fees pursuant to a management services agreement with NCM LLC in exchange for providing specific management services to NCM LLC.
Our Business
We are America’s Movie Network. As the largest cinema advertising network in North America, we unite brands with the power of movies and engage movie fans anytime and anywhere. According to Nielsen, more than 700 million moviegoers annually attend theaters that are currently under contract to present NCM’s
Noovie
pre-show in 57 leading national and regional theater circuits including AMC, Cinemark and Regal and 54 network affiliate theaters. NCM’s cinema advertising network offers broad reach and unparalleled audience engagement with over 21,200 screens in over 1,700 theaters in 190 Designated Market Areas® (including all of the top 50).
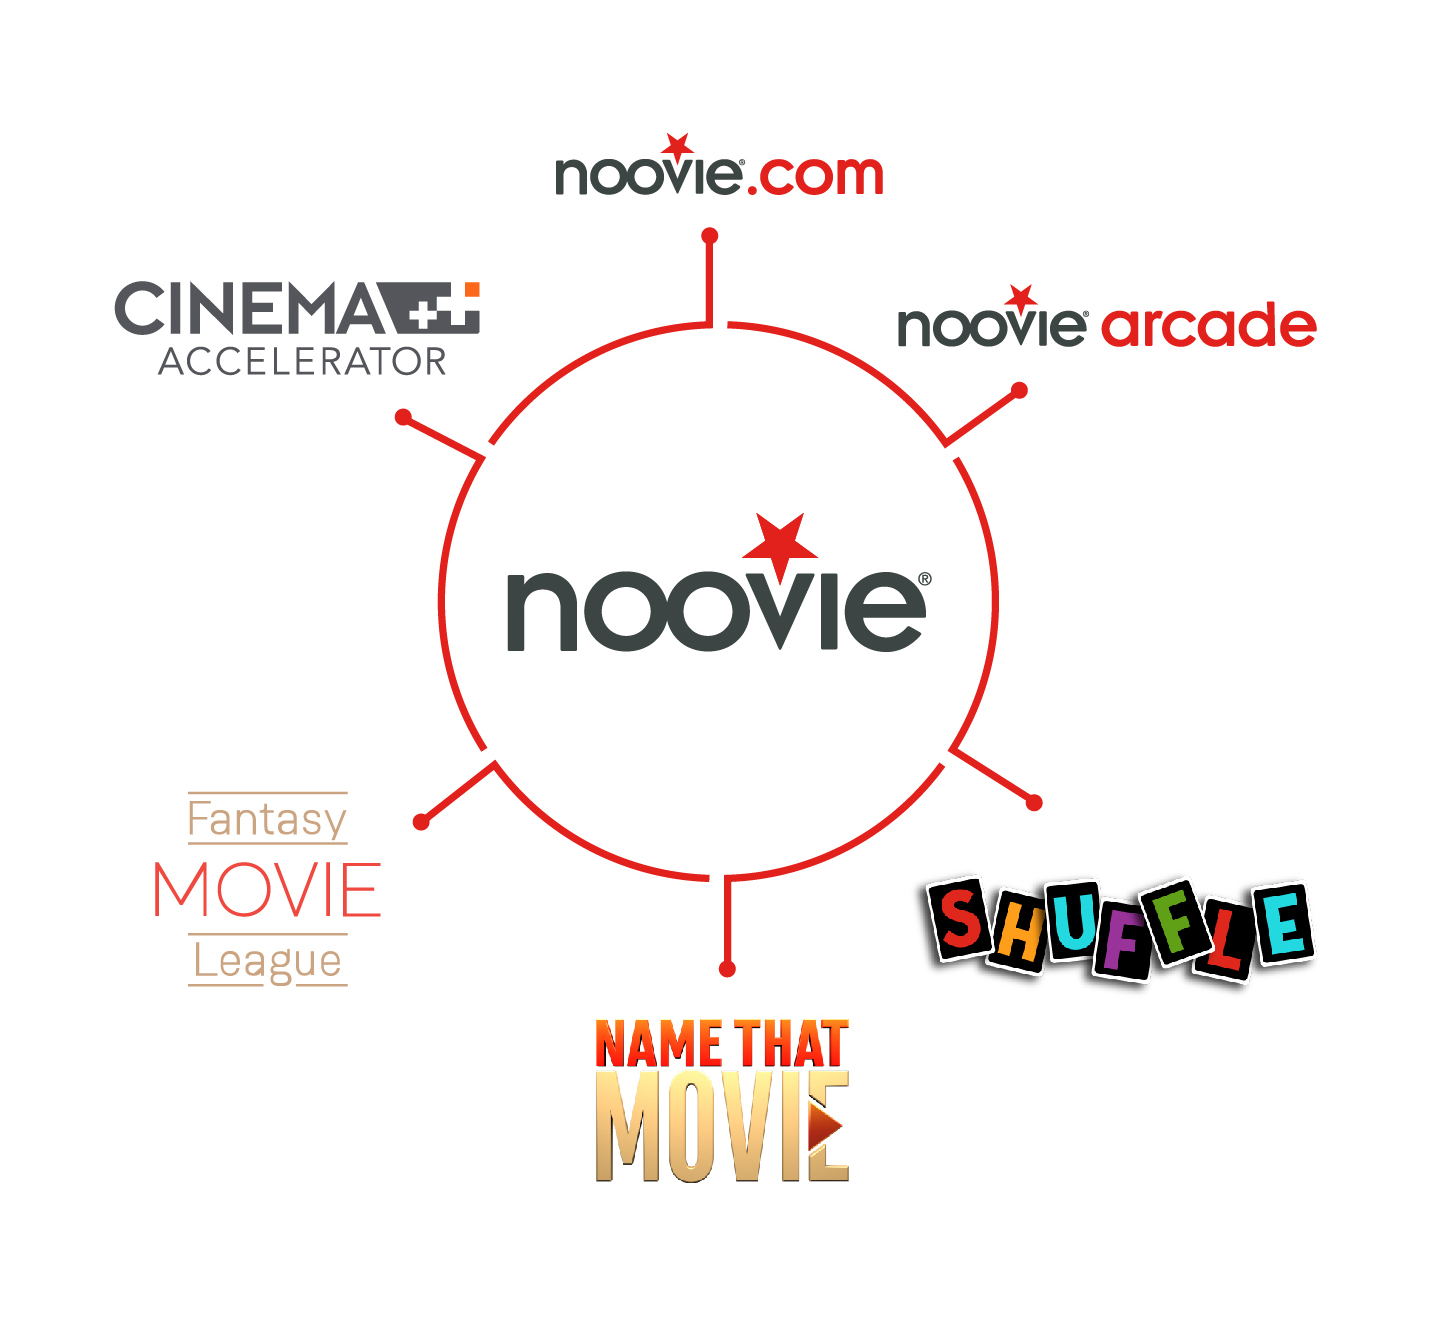
We currently derive revenue principally from the sale of advertising to national, regional and local businesses in
Noovie
, our cinema advertising and entertainment pre-show seen on movie screens across the U.S., as well as on our LEN, a series of strategically-placed screens located in movie theater lobbies, as well as other forms of advertising and promotions in theater lobbies. We also sell digital online and mobile advertising through our
Cinema Accelerator
product and across our suite of
Noovie
digital properties, including
Noovie.com, Noovie Shuffle, Name That Movie, Noovie Arcade,
and
Fantasy Movie League
, in order to reach entertainment audiences beyond the theater.
6
NCM LLC has long-term ESAs with the founding members and multi-year agreements with our network affiliates. In September 2019, NCM LLC entered into amendments to the ESAs with Cinemark and Regal (collectively, the “2019 ESA Amendments”). The 2019 ESA Amendments extended the contract life of the ESAs with Cinemark and Regal by four years resulting in a weighted average remaining term of the ESAs with the founding members (based on attendance) of approximately
19.8
years as of
December 26, 2019
. The network affiliate agreements expire at various dates between March 15, 2020 and July 22, 2031. The weighted average remaining term (based on attendance) of the ESAs and the network affiliate agreements together is
17.1
years as of
December 26, 2019
. The ESAs and network affiliate agreements grant NCM LLC exclusive rights in the founding member and network affiliate theaters to sell advertising, subject to limited exceptions.
We believe that the broad reach and digital delivery of our network provides an effective platform for national, regional and local advertisers to reach a large, young, engaged and affluent audience on a targeted and measurable basis.
Noovie
On-Screen Advertising
Noovie On-Screen
—Our on-screen
Noovie
pre-show provides an entertaining pre-movie experience for theater patrons while serving as an incremental revenue source for our theater circuit partners.
Noovie
gives movie audiences a reason to arrive early to discover what’s next in entertainment, and it consists of national, regional and local advertising, as well as long-form entertainment and advertising content provided to us under exclusive multi-year arrangements with leading media, entertainment, technology and other companies (“content partners”).
Beginning in November 2019 following the completion of the 2019 ESA Amendments, we now present two different formats of our
Noovie
pre-show depending on the theater circuit in which it runs. In Regal and Cinemark and certain affiliate theaters,
Noovie
now includes advertising inventory after the advertised showtime consisting of (1) the new lights down segment that runs for five minutes after the advertised showtime with trailer lighting and (2) the new 30- or 60-second Platinum Spot, as further described below ("Post-Showtime Inventory"). As of December 26, 2019, theaters presenting the new
Noovie
format with Post-Showtime Inventory made up approximately 54% of our network based upon attendance. Since December 26, 2019 we have added ten additional affiliates and including three to eight more that we expect to add in 2020, we expect approximately 57% to 59% of our network based upon 2019 attendance to present the new
Noovie
format during 2020. All other NCM network theater circuits, which make up the remaining 46% of our network based upon attendance as of December 26, 2019, present the Classic
Noovie
pre-show, which ends approximately at the advertised movie showtime when the movie trailers begin. The movie trailers that run before the feature film are not part of
Noovie
.
Because
Noovie
is customized by theater circuit, theater location/market, film rating, film genre and film title, we produce and distribute many different versions of
Noovie
each month. We rotate
Noovie
’s long-form content segments between theaters approximately every two weeks to ensure that frequent moviegoers are entertained by fresh content. This programming flexibility provides advertisers with the ability to target specific audience demographics and geographic locations and gives us the ability to ensure that the content and advertising are age-appropriate for the movie audience. During 2019, we launched NCM LuxeNet, which is a specialty cinema network to connect luxury brands with cultured, affluent movie audiences. NCM LuxeNet is a carefully curated network of premium movie theaters in the top 25 Designated Market Areas (“DMA
®
”) featuring contemporary lobbies, state-of-the-art auditoriums, luxury seating, expanded amenities including bars and dine-in options and a sophisticated movie slate ranging from the best independent and Oscar-nominated films to Hollywood’s biggest blockbusters.
All versions of
Noovie
are produced by our internal creative team, which is cost-effective and gives us significant flexibility. We also offer pre- and post-production advertising creative services to our clients (primarily local clients who may not have their own creative agency) for a fee.
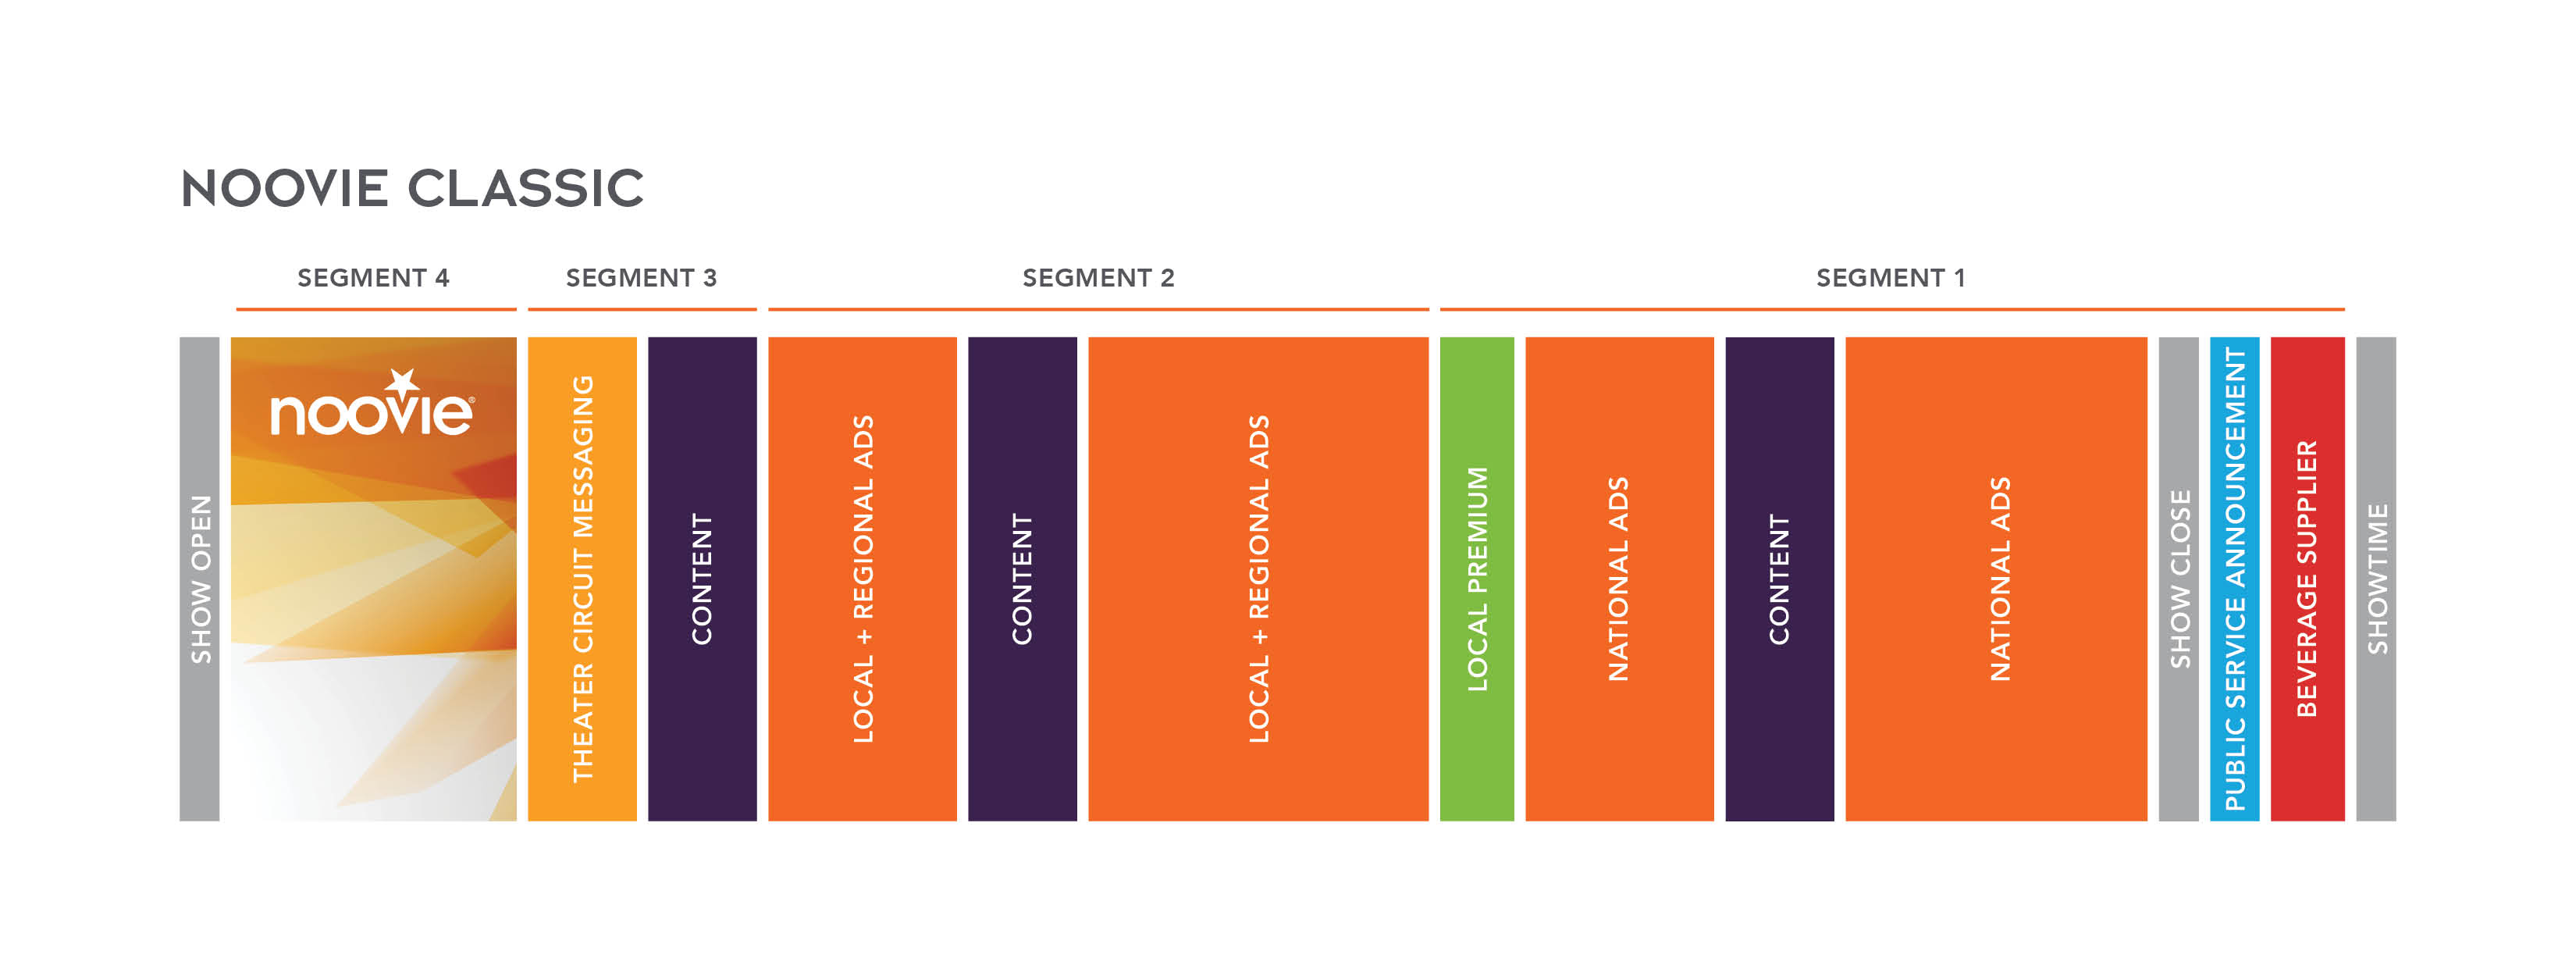
Classic Noovie Show Structure
—Classic
Noovie
is comprised of up to four segments, each approximately four to ten minutes in length. The Company revised the structure beginning November 1, 2019 and the structure below incorporates the changes made. The following graphic is for illustrative purposes and is not to exact scale.
7
|
•
|
Segment four is the first section of
Noovie
and contains the entertaining content that is a core element of
Noovie.
NCM programs an exclusive
Noovie
content pod at the beginning of the show that gives audiences a look at “what’s
Noovie”
, including movies (
Noovie Backlot
and
Noovie Genius
), music (
Noovie Soundcheck
), trivia (
Name That Movie
) and more.
|
|
•
|
Segment three features a long-form entertainment content segment from one of our content partners and advertising from local clients.
|
|
•
|
Segment two features primarily local and regional advertisements, which generally range between 15 to 90 seconds, as well as a long-form entertainment content segment from one of our content partners. This segment also typically includes a 45-second
Noovie Arcade
slot where audiences have the opportunity to play our featured interactive augmented reality (“AR”) game on the big screen using their mobile phones.
|
|
•
|
Segment one runs closest to the advertised showtime and features primarily national advertisements, which are generally 30 or 60 seconds, as well as a long-form entertainment content segment from one of our content partners. Segment one also includes an advertisement for the founding members’ beverage supplier and a public service announcement (“PSA”).
|
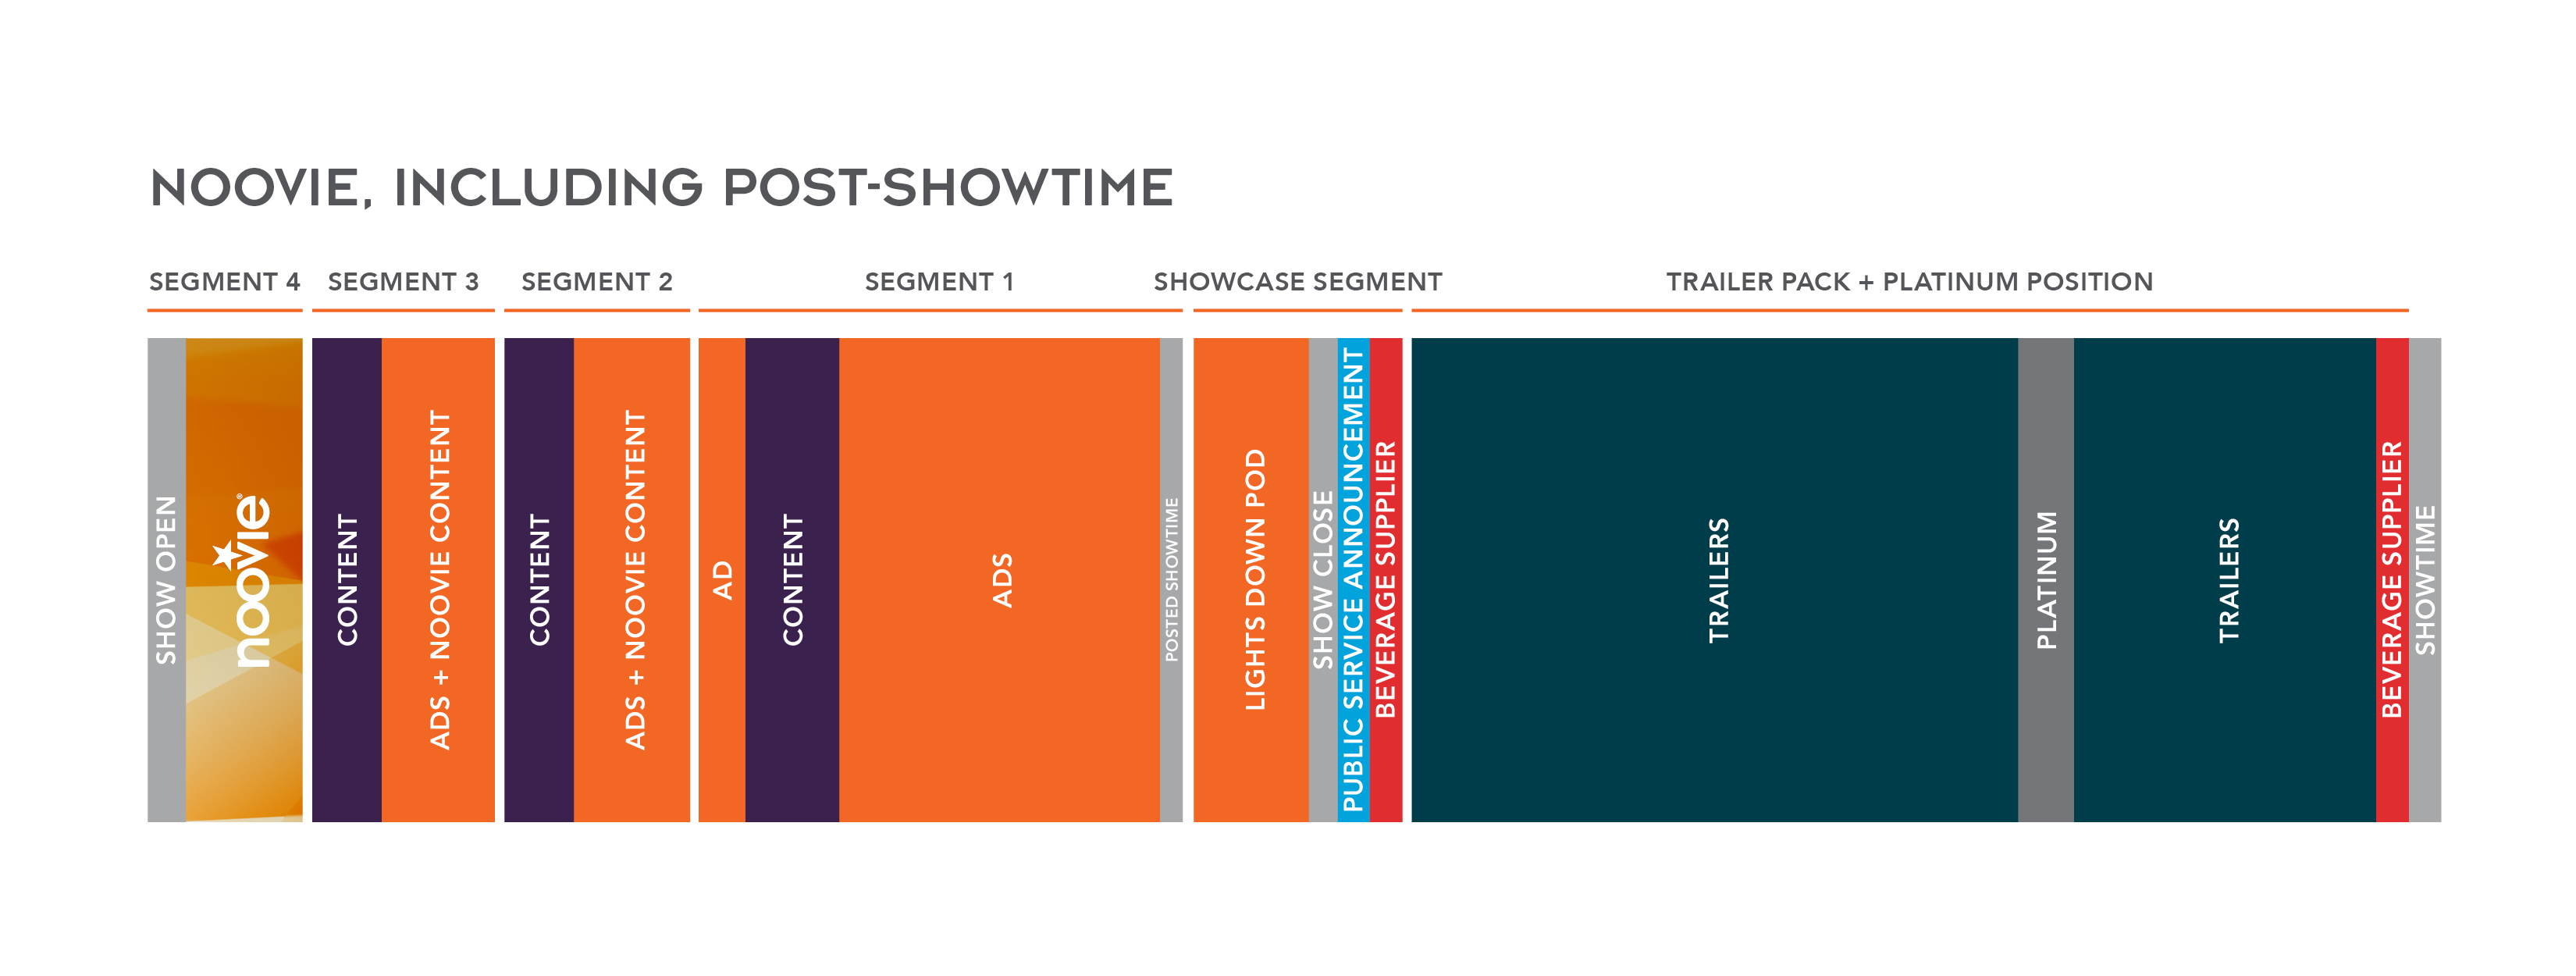
Noovie Show Structure Including Post-Showtime Inventory
—The
Noovie
with Post-Showtime Inventory
format is comprised of substantially the same segments included within the Classic
Noovie
pre-show
,
each approximately four to ten minutes in length, as well as the following two additional advertising segments after the advertised showtime. The total length of the
Noovie
pre-show including Post-Showtime Inventory is the same as the Classic
Noovie
pre-show as the amount of time displayed prior to the advertised showtime is reduced by the sum of five minutes plus the aggregate length of time of the Platinum Spot, if any. The following graphic is for illustrative purposes and is not to exact scale.
|
•
|
A post-showtime lights down
segment with trailer lighting beginning at the advertised showtime with approximately 5 minutes of national advertisements which generally range between 30 or 60 seconds, followed by a PSA and one or two 30 second advertisements for the founding members' beverage supplier; and
|
8
|
•
|
An additional single advertising unit that is either 30 or 60 seconds of the
Noovie
pre-show deeply embedded within the movie trailers at trailer level lighting and at full trailer volume, directly prior to the last one or two trailers preceding the feature film, which we refer to as the "Platinum Spot".
|
References to the
Noovie
pre-show relate to both the Classic
Noovie
and
Noovie
including Post Showtime Inventory formats, unless specified otherwise.
National, Regional and Local Advertising
—Our cinema advertising business has a diverse customer base, consisting of national, regional and local advertisers. National and regional on-screen advertising in
Noovie
is sold on a CPM basis to national and regional clients. We generally sell our national advertising units across our national network by film rating or groups of ratings, or by individual film or film genre grouping. This ability to target various groups of films offers national advertisers a way to target specific audience demographics at various price points and overall cost levels, which we believe expands the number of potential clients. Local advertising is sold on a per-screen, per-week basis.
Noovie
pre-show inventory is also available in the FreeWheel (formerly known as STRATA) and Mediaocean systems, media buying and selling software which allows advertising agencies to buy cinema advertising in the “National Spot TV” marketplace where advertising is purchased by national advertisers in several markets of their own selection. Being able to buy both TV and cinema locally in the National Spot TV marketplace makes it significantly easier for agencies to include cinema in the media mix for their clients and allows us to tap into the pool of advertising dollars budgeted for National Spot TV.
As with other premium video mediums like TV, we sell our
Noovie
pre-show inventory in both the upfront and scatter markets. Upfront is a term that describes the practice of buying advertising time “up front” on an annual basis for the upcoming year, purchasing inventory in advance and locking in the advertising rates (CPM’s). Consistent with the television industry upfront booking practices, a portion of our upfront commitments have cancellation options or options to reduce the amount that advertisers may purchase that could reduce what is ultimately spent by clients that have made upfront commitments. Scatter refers to the buying of advertising on a shorter-term basis closer to when the advertisements will run, which often results in a pricing premium compared to upfront rates. The mix between the upfront and scatter markets is based upon a number of advertising market factors, such as pricing, demand for advertising time and economic conditions. The demand in the scatter market impacts the pricing achieved for our remaining advertising inventory not sold upfront and can vary throughout the year.
From February 13, 2007 through
December 26, 2019
, 597 national advertisers across a wide variety of industries have advertised with us. During the year ended
December 26, 2019
, we derived 73% of our advertising revenue from national clients (including advertising agencies that represent our clients) and 21% of our advertising revenue from thousands of regional and local advertisers across the country (including advertising agencies that represent these clients).
Beverage Advertising.
We have a long-term agreement to exhibit the advertising of the founding members’ beverage concessionaires. Under the ESAs, up to 90 seconds of the
Noovie
program can be sold to the founding members to satisfy their on-screen advertising commitments under their beverage concessionaire agreements. Historically, the time sold to the founding member beverage supplier has been priced equal to the advertising CPM for the previous year charged by NCM LLC to unaffiliated third parties during segment one (closest to showtime) of the
Noovie
pre-show, limited to the highest advertising CPM being then-charged by NCM LLC pursuant to the ESAs. Beginning in 2020 and in accordance with the 2019 ESA Amendments, the price for the time sold to Cinemark and Regal’s beverage suppliers will instead increase 2% each year. The time sold to AMC’s beverage supplier will continue to be priced based upon the annual increase in CPMs as outlined above.
Each of the founding members has a relationship with a beverage concessionaire supplier under which they are obligated to provide on-screen advertising time as part of their agreement to purchase branded beverages sold in their theaters. During 2019, we sold 60 seconds to two of the founding members and 30 seconds to one of the founding members. During 2019, the beverage concessionaire revenue from the founding members’ beverage agreements was approximately 6% of our total revenue. In the instance of certain theaters that are acquired by the founding members but are not incorporated into our network because of an existing on-screen advertising agreement with an alternative provider, we remain entitled to these encumbered theater beverage payments under the terms of the ESA which are treated as a reduction to the intangible asset and not classified as revenue.
Content.
Beyond the
Noovie
-branded content at the beginning of the pre-show, the majority of our entertainment and advertising content segments are provided to us by content partners. Under the terms of the contracts, our content partners create original long-form entertainment content segments that are entertaining, informative or educational in nature exclusively for our
Noovie
pre-show and make commitments to buy a portion of our advertising inventory at a specified CPM over a one or two-year period with options to renew, exercisable at the content partner’s option. The original content produced by these content partners typically features behind-the-scenes looks at the “making-of” feature films, upcoming media programming, or technology products. In 2019, the content partner segments were approximately 90 seconds in length.
9
PSA.
In 2019, we had four agreements to exhibit a 40-second courtesy “silence your cell phone” PSA reminding moviegoers to silence their cell phones and refrain from texting during feature films which expired at the end of 2019. We signed an additional four new agreements for 2020.
Theater Circuit Messaging.
The
Noovie
program also includes time slots for the founding members and network affiliates to advertise various activities associated with the operations of the theaters, including concessions, online ticketing partners, gift card and loyalty programs, special events presented by the theater operator and vendors of services provided to theaters, so long as such promotion is incidental to the vendor’s service or products sold in the theater. This time is provided to the theater operator at no charge and generally includes 45 seconds within 15 minutes prior to the advertised showtime, 15 seconds of which will be placed within 12 minutes prior to the advertised showtime and the remainder placed elsewhere during the
Noovie
pre-show at our discretion.
Noovie
Digital Products
The
Noovie
pre-show includes the following onscreen digital products:
Noovie Shuffle.
During 2019, we launched
Noovie Shuffle
, a collection of card-based movie-trivia mini-games. New games and card decks are added to
Noovie Shuffle
on an ongoing basis to match the current film slate and keep
Noovie Shuffle
fresh and challenging for players. We are also working closely with movie studios to create custom games and card decks that highlight specific new movie releases.
Noovie Arcade.
Starting in 2018, movie audiences nationwide can play big screen interactive augmented reality (“AR”) games on their mobile phones by using
Noovie Arcade
, the revolutionary companion app for the
Noovie
pre-show.
Noovie Arcade
games and AR experiences have included the
Ball Park® Brand Hot Dog Derby
(our first-ever branded game), movie studio collaborations including
Ralph Breaks the Internet
and
It: Chapter Two
,
Escape from Waddleville®,
Cinevaders®
,
Emoji Escape
,
The Horror Experience
and
Hollywood Highway
.
Noovie Arcade
games can be sponsored by advertisers or customized by brands to create unique and engaging experiences for movie audiences.
Name That Movie.
During 2017, we entered into a licensing agreement authorizing the production of
Name That Movie
trivia segments for our
Noovie
pre-show, social media channels and digital properties in order to further entertain and engage moviegoers. We also offer the opportunity for our advertising clients to sponsor the
Name That Movie
segments and incorporate advertising into the game. In 2019, we developed and released
Name That Movie
iOS and Android mobile apps.
Digital Advertising
At its core,
Noovie
is NCM’s pre-show that audiences experience before the movie, but
Noovie
also stretches beyond the theater as an integrated digital ecosystem delivering entertaining content, purposeful commerce and interactive gaming opportunities. The
Noovie
pre-show serves as a “trailer” for the
Noovie
digital experience, driving movie audiences from the big screen to NCM’s digital properties and back again. We believe that by creating a compelling consumer experience for moviegoers, we can further enhance the marketability of our product offerings to our advertising clients. The
Noovie
digital products are designed to provide digital advertising inventory and capture exclusive first party data, and includes:
Gaming
—Our digital gaming products, including
Noovie
Arcade, Fantasy Movie League, Name That Movie
and
Noovie Shuffle,
can be played on their respective mobile apps. As of
December 26, 2019
, approximately 4.0 million movie goers have downloaded our mobile apps. These downloads and the acquisition of second party data have resulted in first and second party data sets of over 100 million as of December 26, 2019.
Noovie Arcade
can also be played on
Noovie.com
. During 2020, we plan to release a standalone
Noovie Shuffle
mobile app on iOS and Android, release a version of the game on
Noovie.com
in the summer of 2020 and integrate
Name That Movie
and
Noovie Shuffle
with
Noovie.com
.
Noovie.com
—NCM officially launched
Noovie.com
in 2019 as a search and discovery platform where audiences can discover new movies, watch the latest trailers, find theaters and showtimes and buy tickets.
Noovie.com
is a smart movie guide and a place fans turn to decide what to watch next, whether in theater or at home, as well as a community hub for fans to connect, discover and share their love of movies.
NCM advertisers also benefit as
Noovie.com
connects brands to valuable movie audiences around engaging and customized digital experiences.
Noovie.com
is a natural companion to the
Noovie
pre-show extending the brand, re-enforcing the on-screen offering and creating valuable cross-platform advertising opportunities.
Cinema Accelerator –
In addition to our ad-supported consumer-facing digital products, our
Cinema Accelerator
digital product expands
cinema advertising beyond the theater environment
to reach digitally-connected moviegoers before and after the movie experience, both online and on mobile devices.
Cinema Accelerator
identifies moviegoers through exclusive first and second party data sources including geo-location services and micro-event data for moviegoers that enter theaters in our network. Using the moviegoer as our filter, we can target specific demographics, genres or layer on other data to provide our clients with a match against their target audience. Digital ads are then distributed through multiple channels, including online
10
and mobile banners, online and mobile pre-roll video and social media newsfeeds through our owned and operated ad inventory as well as third party ad inventory to reach moviegoers wherever they may be seeking entertainment information and content.
We sell NCM’s digital products through a digital sales group that is embedded as part of our national and local sales organizations to enable collaborative, integrated selling. We believe that our new and upcoming digital products can be sold in combination with in-theater advertisements as integrated marketing packages as discussed in “Business—Our Strategy”. We plan to continue to invest in our digital platform in 2020 and beyond.
Lobby Advertising
Lobby Entertainment Network
—Our LEN is a network of video screens strategically located throughout the lobbies of all digitally equipped founding members’ theaters, as well as the majority of our network affiliates’ theaters. As of December 26, 2019, our LEN had 3,007 screens in 1,553
theaters in our network. The LEN screens are placed in high-traffic locations such as concession stands, box offices and other waiting areas. Programming on our LEN consists of an approximately 30-minute loop of branded entertainment content segments created specifically for the lobby with advertisements running between each segment. We have the scheduling flexibility to send different LEN programming to each theater through our DCN, and the same program is displayed simultaneously on all LEN screens within a given theater, which we believe provides the maximum impact for our advertisers. We sell national and local advertising on the LEN individually or bundled with on-screen or other lobby promotions.
The LEN programming includes up to two minutes for founding members’ advertisements to promote activities associated with the operation of the theaters, including concessions, online ticketing partners, gift card and loyalty programs, special events presented by the theater operator and vendors of services provided to theaters, so long as such promotion is incidental to the vendor’s service or products sold in the theater. Additionally, subject to certain limitations, the LEN programming includes up to two minutes (one minute of which we provide to the founding members at no cost and one minute of which the founding members may purchase) to promote certain non-exclusive cross-marketing relationships entered into by the theater operators for the purpose of increasing theater attendance, which we call “strategic programs.”
Under the terms of the ESAs, the founding members also have the right to install a second network of additional screens in their theater lobbies which would not display our LEN programming, but would be used to promote strategic programs or products sold in their theater concessions, bars and dining operations, online ticketing partner promotions, gift card and loyalty programs and special events presented by the founding member and vendors of services provided to theaters, so long as such promotion is incidental to the vendor’s service.
Lobby Promotions
We also sell a wide variety of advertising and promotional products in theater lobbies. These products can be sold individually or bundled with on-screen, LEN or digital advertising. Lobby promotions typically include:
|
•
|
advertising on concession items such as beverage cups, popcorn bags and kids’ trays;
|
|
•
|
coupons and promotional materials, which are customizable by film and are distributed to ticket buyers at the box office or as they exit the theater;
|
|
•
|
tabling displays, product demonstrations and sampling;
|
|
•
|
touch-screen display units and kiosks; and
|
|
•
|
signage throughout the lobbies, including posters, banners, counter cards, danglers, floor mats, standees and window clings.
|
Under the terms of the ESAs, the founding members may conduct a limited number of lobby promotions at no charge in connection with strategic programs that promote motion pictures; however, such activities will not reduce the lobby promotions inventory available to us.
Our ability to provide in-lobby marketing and promotional placements in conjunction with our cinema advertising products allows us to offer integrated marketing solutions to advertisers that provide multiple touchpoints with theater patrons throughout the movie-going experience, which we believe is a competitive advantage over other national media platforms.
Our Network
Noovie
On-screen is distributed across NCM LLC’s national theater network — the largest digital in-theater network in North America. Through the use of our proprietary DCN and Digital Content Software, we are able to schedule, deliver, play and reconcile advertising and entertainment content for
Noovie
and the LEN on a national, regional, local, theater and auditorium level.
The DCN is the combination of a satellite distribution network and a terrestrial management network. We also employ a variety of technologies that aid in distribution where satellite delivery is not available to provide uninterrupted service to our network of theaters. The DCN is controlled by our Customer Experience Center located in NCM’s headquarters in Centennial,
11
Colorado, which operates 12 hours a day, seven days a week to proactively monitor and manage our network. NCM's DCN dynamically controls the quality, placement, timing of playback and completeness of content within specific auditoriums, and it also allows us to monitor and initiate repairs to the equipment in our digital network of theaters.
Advertising and entertainment content for our
Noovie
pre-show and LEN is uploaded from our Customer Experience Center to our satellite distribution network and is delivered via multicast technology to the theaters in our network and received by our Alternative Content Engine. The Alternative Content Engine holds the content until displayed in specified theater auditoriums and lobbies according to contract terms. Each theater auditorium and lobby has a hardware and software architecture that controls the content to be shown. After playback of content, confirmation of playback is returned via satellite to our Customer Experience Center to be included in “post” reports provided to our advertising clients.
According to Nielsen Cinema Audience Reports for 2019, more than 700 million moviegoers annually attend theaters that are currently under contract to present the
Noovie
pre-show, including the founding members and over 54 leading national and regional theater network affiliates. A summary of the screens and theaters in our advertising network is set forth in the table below:
Our Network
(As of
December 26, 2019
)
|
|
Advertising Network
|
|||||||
|
|
Theaters
|
Total Screens
|
% of Total
|
|||||
|
Founding Members
|
1,267
|
|
16,880
|
|
79.6
|
%
|
||
|
Network Affiliates
|
467
|
|
4,328
|
|
20.4
|
%
|
||
|
Total
|
1,734
|
|
21,208
|
|
100.0
|
%
|
||
As of
December 26, 2019
, our
Noovie
pre-show was displayed on 100% of network movie screens using digital projectors, with approximately 98% of those screens receiving content through our DCN, representing approximately 98% of our total network attendance. As of
December 26, 2019
, 20,183, or 95%, of 21,208 total digital screens are equipped with more powerful digital cinema projectors, with the remainder comprised of LCD projectors. Those screens not connected to our DCN display national and regional advertisements on digital projectors with content delivered on USB drives that are shipped to the theaters via overnight delivery services.
Our Team
We had 531 employees as of
December 26, 2019
. Our employees are located in our Centennial, Colorado headquarters, in our advertising sales offices in New York, Los Angeles, Chicago and Detroit, our digital development offices in Los Angeles and New York and our software development office in Minneapolis. We also have many local advertising account executives and field maintenance technicians that work primarily from their homes throughout the U.S. None of our employees are covered by collective bargaining agreements. We believe that we have a good relationship with our employees.
Competition
Our advertising business competes in the estimated $226.2 billion U.S. advertising industry with many other forms of marketing media, including television, radio, print, internet, mobile and outdoor display advertising. While cinema advertising represents a small portion of the overall advertising industry today, we believe it is well-positioned to capitalize on the shift of advertising spending away from traditional media, in particular television where consumers can skip advertisements through DVRs and other technology, to newer and more targeted forms of media.
Our advertising business also competes with many other providers of cinema advertising, which vary substantially in size. As the largest cinema advertising network in the U.S., we believe that we are able to generate economies of scale, operating efficiencies and enhanced opportunities for our clients to reach an engaged movie audience on both a national and local level to allow us to better compete for premium video dollars in the larger advertising marketplace.
Competitive Strengths
We believe that several strengths position us well to compete in an increasingly fragmented media landscape. We believe that our cinema advertising network is an attractive option for advertisers on a national, regional and local level and delivers measurable results for our clients that are comparable, and preferred, to the television, online and mobile or other video advertising options that we compete against in the marketplace.
Extensive national market coverage
—Our contractual agreements with our founding members and network affiliates provide long-term exclusive access (subject to limited exceptions) to sell cinema advertising across the largest network of digitally-equipped theaters in the U.S. This allows us to offer advertisers the broad reach and national scale that they need to effectively reach their target audiences.
12
|
•
|
Our advertising network consisted of 21,208 screens (16,880 operated by the founding members) located in 1,734 theaters (1,267 operated by the founding members) in 47 states and the District of Columbia, including each of the top 25 and 50 DMAs®, and 190 DMAs® in total, as of December 26, 2019;
|
|
•
|
Over 700 million people attended theaters in our network in 2019 based on Nielsen estimates and 69%, 65% and 65% of the total theater attendance in theaters that present advertising in the top 10, 25 and 50 U.S. DMAs
®
, respectively and 61% of all DMAs
®
nationally, providing an attractive platform for national advertisers who want exposure in larger markets or on a national basis; and
|
|
•
|
The average screens per theater in our network during 2019 was 12.2 screens, 1.7 times the U.S. theater industry average and the aggregate annual attendance per screen of theaters included in our network during 2019 was 30,714, versus the U.S. theater industry average attendance per indoor screen of 28,209, using metrics reported by the National Association of Theatre Owners.
|
Scalable, state-of-the-art digital content distribution technology
—Our use of the combination of satellite and terrestrial network technology, combined with the design and functionality of our Digital Content Software and Customer Experience Center infrastructure, makes our network efficient and scalable and also allows us to target specific audiences and provide advertising scheduling flexibility and reporting. National, local and regional advertisers are generally able to run their ads in the
Noovie
pre-show less than 72 hours following the proposal which is comparable to the lead time of television advertising and which is a significant improvement over the cinema industry’s historical turn-around time frame, giving businesses that rely on time-sensitive promotional advertising strategies the opportunity to take advantage of the power of cinema. The Company plans to further decrease this lead time following the upgrade of our planning, proposal and inventory tracking system, as further discussed below.
This scalability of our distribution technology has allowed us to expand our cinema advertising network with minimal additional capital expenditures or personnel, and we expect to benefit from this scalability in the future as we add new theaters from the founding members, our existing network affiliate relationships and the addition of new network affiliates.
Access to a highly attractive, engaged audience
—We offer advertisers the ability to reach highly-coveted target demographics, including young, affluent and educated “Millennial” and “Gen Z” moviegoers. According to Nielsen Cinema Audience Reports for 2019, 53% of the NCM LLC audience were between the ages of 12-34, compared to 53% in 2018, with a median age of 28 in 2019. Further, 45% of our moviegoers have a household income greater than $100,000 (versus 34% of the general population), with a median moviegoer household income of $92,100 in 2019, and 42% have received a bachelor’s degree or higher (versus 31% of the general population) according to the 2019 Doublebase GfK MRI Study.
Because of the impact of cinema’s state-of-the-art immersive video and audio presentation, we also believe that movie audiences are highly engaged with the pre-show advertising and entertainment content that they view in our theater environment. According to Nielsen, cinema advertising has significantly higher recall rates than advertising shown on television, and cinema is one of the few advertising mediums where the ability to bypass marketing messages is limited. Recent attribution studies conducted for the Company by Foursquare, a location based services company, demonstrated that cinema advertising resulted in a 17% increase in store visits for a cellphone retailer, 20% increase in store visits to a quick service restaurant, and a 12% increase in store visits to a holiday retailer. Further, a recent attribution study conducted for the Company by Comscore and PlaceIQ, media management and analytics companies, demonstrated that cinema advertising resulted in a 12% increase in the intent to view a cable program.
World-class entertainment and innovative, branded pre-feature content
—The film content created by Hollywood studios is considered by many to be the finest entertainment content in the world, which creates a highly-desirable advertising environment for brands. We believe that our
Noovie
pre-feature program provides a high-quality entertainment experience for theater audiences and an effective marketing platform for advertisers. By partnering with leading media, entertainment, technology and other companies, we are able to provide better original content for our audience and
more impact for the advertiser. Because we offer local and national “pods” within our
Noovie
pre-show, we are consistent with the placement of ads on television networks, which allows us to be more easily integrated into traditional sight-sound-and-motion
media buys.
Prime movie audience data, measurability and targeting
—As with many other advertising mediums, we are measured by third-party research companies such as Nielsen Holdings PLC that provide us with the percentage of the total attendance that are in their seats during our
Noovie
pre-show. What differentiates us from other advertising mediums, however, is that we also receive monthly attendance information by film, by rating and by screen for all of the founding member theaters and monthly and by location for the theaters operated by our network affiliates, which allows us to report the actual audience size for each showing of a film where our
Noovie
pre-show played. We believe that the ability to provide detailed information to our clients gives us a distinct competitive advantage over traditional media platforms whose measurement is based only on extrapolations of a very small sample of the total audience.
13
In 2019, we continued to invest in the development of our cloud-based Data Management Platform which we believe will allow us to provide even more robust audience insights and analytics to our clients. To further enhance the connection between brands and movie audiences, we accumulate exclusive first and second party audience data from several sources within our Data Management Platform. This audience data is then leveraged for targeting of ad campaigns and can also serve to deliver closed-loop attribution reporting. We expect to continue to enhance the capabilities of the platform in 2020 by continuing to gather exclusive first-party and second-party data through our
Noovie
digital products, as well as additional second-party data sources and segments.
Integrated marketing and digital products
—Our ability to bundle our on-screen advertising opportunities with integrated lobby and digital marketing products allows us to offer advertisers multiple touchpoints to reach movie audiences before, during and after the film to execute true 360-degree marketing programs. We believe these multiple marketing impressions throughout the entire entertainment experience allow our advertisers to extend the exposure for their brands and products and create a more engaging relationship with movie audiences in every stage of their movie journey. Additionally, our digital products provide us with valuable, exclusive first party data which can be utilized by our advertising clients through our Cinema Accelerator product to better reach their target audience with higher degrees of accuracy and measure business outcomes more accurately.
Contractual theater circuit partner and advertiser relationships
—Our exclusive multi-year contractual relationships with our founding members and network affiliates allow us to offer advertisers a national network with the scale, flexibility and targeting to meet their marketing needs. Our exclusive multi-year contractual relationships with our content partners and PSA sponsors, as well as our agreements to satisfy the founding members’ on-screen marketing obligations to their beverage concessionaires, provide us with a significant upfront revenue commitment, accounting for approximately 23% of our total revenue for the year ended
December 26, 2019
. In addition, our participation in the annual advertising upfront marketplace has allowed us to secure significant annual upfront commitments from national advertisers looking to secure premium cinema inventory. These upfront commitments accounted for approximately 14% of our total revenue for the year ended December 26, 2019.
Strong operating margins with limited capital requirements
—Our annual operating income and Adjusted OIBDA margins have been consistently strong, ranging from approximately 33.1% to 38.7% and 46.5% to 51.5%, respectively, over the last five years. Refer to “Item 6. Selected Financial Data-Notes to the Selected Historical Financial and Operating Data” for a discussion of the calculation of Adjusted OIBDA margin, which is a non-GAAP financial measure, and a reconciliation of Adjusted OIBDA margin to operating income.
Our capital expenditures have ranged from approximately 2.9% to 3.5% of revenues over the last five years. For the year ended
December 26, 2019
, our capital expenditures and other investments were $15.3 million, of which $7.6 million was related to investments in our digital infrastructure and $2.0 million related to certain implementation and prepaid costs associated with Cloud Computing Arrangements related to the planned upgrade of our planning, proposal and inventory tracking system. We expect the level of investment in our digital products to decline over the next few years as our previous investments have built the foundation for our digital platform. We believe our expected level of Adjusted OIBDA and capital expenditures should provide us with the strategic and financial flexibility to pursue the further expansion of our national theater network, invest in our digital products and other growth opportunities, opportunistically repay NCM LLC’s debt and continue to make dividend payments to our stockholders. Further, due to the network equipment investments made in recent years by our founding members and network affiliates in new and acquired theaters, ESA provisions requiring founding members to make future investments for equipment replacements and the scalable nature of our Customer Experience Center and other infrastructure, we do not expect to need to make major capital investments to grow our operations as our network of theaters continues to expand. As we continue to move our technology to cloud based software as a service (SaaS) platforms, we will continue to reduce our annual capital expenditure spending. However, operating expenses associated with the SaaS licenses will continue to increase. Certain implementation costs of our SaaS platforms are capitalized during the implementation period and will be recognized within operating income over the term of the SaaS contract after the systems are fully implemented.
Our Strategy
We are continuing to pursue a growth strategy that we believe will create significant stockholder value making NCM a unique investment vehicle by delivering a substantial dividend driven by long term revenue and free cash flow growth. Our strategy includes the following five pillars of growth:
Increase the Quality and Value of Our Media Inventory
We intend to increase the quality and value of our media inventory. Achieving one of our key initiatives in this strategy, we introduced new inventory in our
Noovie
pre-show after the advertised showtime within Regal and Cinemark theaters in November 2019 following the completion of the 2019 ESA Amendments. This Post-Showtime Inventory consists of a total of five minutes between the lights down segment beginning just after the advertised movie showtime and including trailer lighting and the 30- or 60-second Platinum Spot deeply embedded within the movie trailers with trailer lighting and full trailer volume.
14
We believe this new inventory constitutes prized and impactful ad spots and expect these improvements to increase the value of the inventory that we can offer to our national clients. We believe our local and regional clients will also benefit from better inventory as their placement will now be closer to the advertised showtime. We also expect to introduce this new inventory at select network affiliate theaters in 2020 and plan to continue to work toward expanding the portion of our network including this new inventory. We believe this higher value inventory, combined with an entertaining and engaging pre-show program that is integrated with our
Noovie
digital ecosystem, provides a unique cross-platform premium video product that will stand out in the media marketplace. We also believe it will help mitigate the potential future impact of reserved seating on our business.
We are also actively continuing to work on new ways to reinvent our
Noovie
pre-show program to connect with today’s “Millennial” and “Gen Z” moviegoers to create an in-theater experience that will keep audiences coming back for more, as well as drive traffic to our digital properties.
Upgrade Our Planning, Proposal and Inventory Tracking System
We are in the process of upgrading our sales planning, proposal and inventory tracking systems to achieve the more seamless digital buying experience required by today’s media buyers and solve the speed-to-market friction issues associated with our cinema product. We expect this new system will make it easier and faster for advertisers to buy cinema with NCM and we expect full implementation will occur in 2021.
Invest in the Creation of Digital Entertainment Products and Digital Ad Inventory
We intend to continue to invest in the creation of compelling digital entertainment products that we believe will improve the entertainment value of our pre-show and produce incentives for movie-goers to go to theaters and get into their seats earlier. This will in turn create digital ad inventory and a unique cross platform media product focused exclusively on our movie audience throughout their moviegoing journey, both in-theater and on-line. For the year ended December 26, 2019, integrated on-screen and digital campaigns resulted in a 33% higher contract value compared to onscreen only contracts and is expected to be a key to future growth.
We plan to continue to expand our
Noovie
digital ecosystem and user base of movie fans with NCM owned-and-operated products like
Noovie.com, Noovie Arcade, Noovie Shuffle,
Fantasy Movie League
, and
Name That Movie
. These products create new ways for brands to engage with movie audiences beyond the big screen, reaching them anytime (before and after the movie), anywhere with new higher-margin digital ad inventory and creating valuable addressable first-party customer data. We expect to then monetize this data through advertising sales and sponsorships, as well as by leveraging our Cinema Accelerator product.
Build a Data-Driven Business
Along with growing our digital products, we plan to build a data-driven business that will allow us to meet the needs of today’s modern video advertising marketplace. We had 27.2 million and 106.5 million first and second party data sets as of December 27, 2018 and December 26, 2019, respectively. We are projecting to double that by the end of 2020. These valuable data sets consist of both our own NCM first-party data from our owned-and-operated digital products, as well as a variety of key second-party data addressable consumer records, including location-based data that allows us to track when our audiences go to the movie theater to see our
Noovie
pre-show and where they go in the days and weeks afterwards. This initiative will allow us to re-target audiences with digital advertising through our Cinema Accelerator product and more effectively evidence the value of cinema campaigns for our advertisers.
It is important that we accelerate the growth and scale of our theater audience data to a critical mass to be able to effectively use that audience data to deliver value to our clients. It is that scale that we believe will make our NCM digital capabilities increasingly attractive to advertisers, and especially to national brands who buy both our national and regional inventory.
Expand Our Affiliate Network by Primarily Focusing on Adding Key Affiliates and Screen Counts in Select Markets
Our relationships with our exhibitors are a key focus of our business. Our Affiliate Partnership team is dedicated to serving the needs of our founding member theater circuits and our 54 network affiliates nationwide as of December 26, 2019. We plan to continue to expand our affiliate network by primarily focusing on adding key affiliates and screen counts in select markets by strategically targeting priority exhibitors who are not currently part of our network and whose cinema advertising contracts we expect will be coming up for renewal in the next several years. This will allow us to increase our revenue by increasing the number of impressions we have available to sell to advertisers, extending our reach to additional markets to further improve our national footprint for brands looking to reach those audiences, and strengthening our reach in markets we are already in for greater saturation in those DMAs.
A key part of our affiliate strategy going forward is the intention to increase the number of affiliate theaters in our network showing the improved
Noovie
pre-show format featuring the premium Post-Showtime Inventory. While adoption across our affiliate network is expected to take some time, ten network affiliates have agreed to participate in the new format,
15
and we expect to have approximately thirteen to eighteen of our network affiliates running our Post-Showtime Inventory in 2020, which account for an additional 3% to 4% of our total network.
Under the terms of the ESAs and common unit adjustment agreement with the founding members and our network affiliate agreements, all new theaters built or acquired (subject to existing advertising sales agreements) by the founding members or network affiliates will become part of our network. Including our founding members and network affiliates, our net screens have increased in nine of our last ten fiscal years. We believe this expansion continues to improve our geographic coverage and enhances our ability to compete with other national advertising mediums, which allows our exhibitor clients to maximize the advertising value of their audiences.
Intellectual Property Rights
We have been granted a perpetual, royalty-free license from the founding members to use certain proprietary software for the delivery of digital advertising and other content through our DCN to screens in the U.S. We have made improvements to this software since the IPO date and we own those improvements exclusively, except for improvements that were developed jointly by us and the founding members.
We have secured U.S. trademark registrations for NCM, National CineMedia and
Noovie
. We also have U.S. trademark registrations pending for “
What's Noovie?
”. It is our practice to defend our trademarks and other intellectual property rights, including the associated goodwill, from infringement by others. We are aware that other persons or entities may use names and marks containing variations of our registered trademarks and other marks and trade names. Potentially, claims alleging infringement of intellectual property rights, such as trademark infringement, could be brought against us by the users of those other names and marks. If any such infringement claim were to prove successful in preventing us from either using or prohibiting a competitor’s use of our registered trademarks or other marks or trade names, our ability to build brand identity could be negatively impacted.
Government Regulation
Currently, we are not subject to regulations specific to the sale and distribution of cinema advertising. We are subject to federal, state and local laws that govern businesses generally such as wage and hour and worker compensation laws as well as federal and state privacy, information security and consumer protection-related laws and regulations.
Available Information
We maintain a website at
www.ncm.com
, on which we will post free of charge our annual reports on Form 10-K, quarterly reports on Form 10-Q, current reports on Form 8-K, and any amendments to these reports under the heading “Investor Relations” located at the bottom of the home page after we electronically file such material with, or furnish it to, the Securities and Exchange Commission (the “SEC”). We also regularly post information about the Company on the Investor Relations page. We do not incorporate the information on our website into this document and you should not consider any information on, or that can be accessed through, our website as part of this document. The SEC also maintains a website that contains our reports and other information at
www.sec.gov
.
|
Item 1A.
|
Risk Factors
|
Ownership of the common stock and other securities of the Company involves certain risks. Holders of the Company’s securities and prospective investors should consider carefully the following material risks and other information in this document, including our historical financial statements and related notes included herein. The material risks and uncertainties described in this document are not the only ones facing us. If any of the risks and uncertainties described in this document actually occur, our business, financial condition and results of operations could be adversely affected in a material way. This could cause the trading price of our common stock to decline, perhaps significantly, and you may lose part or all of your investment.
Risks Related to Our Business and Industry
Significant declines in theater attendance could reduce the attractiveness of cinema advertising and could reduce our revenue
Our business is affected by the level of attendance at the founding members’ theaters and to a lesser extent our network affiliates, who operate in a highly competitive industry and whose attendance is reliant on the presence of motion pictures that attract audiences. Over the last 10 years, theater attendance has fluctuated from year to year but on average has remained relatively flat. The value of our advertising business could be adversely affected by a decline in theater attendance or even the perception by media buyers that our network is no longer relevant to their marketing plan due to the decreases in attendance and geographic coverage. Factors that could reduce attendance at our network theaters include the following:
16
|
•
|
if NCM LLC’s network theater circuits cannot compete with other out-of-home entertainment due to an increase in the use of alternative film delivery methods (and the shortening of the “release window” between the release of major motion pictures to the alternative delivery methods), including network, video streaming and downloads via the Internet;
|
|
•
|
theater circuits in NCM LLC’s network continue to renovate auditoriums in certain of their theaters to install new larger, more comfortable seating, which reduces the number of seats in a theater auditorium. This renovation has been viewed favorably by patrons and many theater circuits have noted an intent to continue such renovations;
|
|
•
|
changes in theater operating policies, including the number and length of trailers for upcoming films that are played prior to the start of the feature film, which if the length of trailers increases, may result in most or all of the
Noovie
pre-show starting further out from the actual start of the feature film;
|
|
•
|
any reduction in consumer confidence or disposable income in general that reduces the demand for motion pictures or adversely affects the motion picture production industry;
|
|
•
|
the success of first-run motion pictures, which depends upon the production and marketing efforts of the major studios and the attractiveness and value proposition of the movies to consumers compared to other forms of entertainment;
|
|
•
|
if the theaters in our network fail to maintain their theaters and provide amenities that consumers prefer;
|
|
•
|
if studios begin to reduce the number of feature films produced for theater exhibition and their investments in those films or reduce the investments made to market those films;
|
|
•
|
if future theater attendance declines significantly over an extended time period, one or more of the founding members or network affiliates may face financial difficulties and could be forced to sell or close theaters or reduce the number of screens it builds or upgrades or increase ticket prices; and
|
|
•
|
NCM LLC’s network theater circuits also may not successfully compete for licenses to exhibit quality films and are not assured a consistent supply of motion pictures if they do not have long-term arrangements with major film distributors.
|
Any of these circumstances could reduce our revenue because our national and regional advertising revenue, and local advertising to a lesser extent, depends on the number of theater patrons who attend movies. Additionally, if attendance declines significantly, the Company will be required to provide additional advertising time (makegoods) to national advertisers to reach agreed-on audience delivery thresholds. Certain of these circumstances can also lead to volatility within our utilization. We have also experienced volatility in our utilization over the years, with annual national inventory utilization ranging from 113.5% to 128.3% from 2015 through 2019. We experience even more substantial volatility quarter-to-quarter.
Changes in theater patron behavior could result in declines in the viewership of our Noovie
pre-show which could reduce the attractiveness of cinema advertising and our revenues.
The value of our national and regional on-screen advertising and to a lesser extent our local advertising is based on the number of theater patrons that are in their seats and thus have the opportunity to view the
Noovie
pre-show. Trends in patron behavior that could reduce viewership of our
Noovie
pre-show include the following:
|
•
|
theater patrons are increasingly purchasing tickets ahead of time via on-line ticketing mediums and when available reserving a seat in the theater (offered in approximately 84.9% of our network as of
December 26, 2019
), which could affect how early patrons arrive to the theater and reduce the number of patrons that are in a theater seat to view most or all of the
Noovie
pre-show; and
|
|
•
|
changes in theater patron amenities, including, online ticketing, bars and entertainment within exhibitor lobbies causing increased dwell time of patrons.
|
National advertising sales and rates are dependent on the methodology used to measure audience impressions. If a change is made to this methodology that reflects fewer audience impressions available during the pre-show, this could adversely affect the Company’s revenue and results of operations.
We may not realize the anticipated benefits of the 2019 ESA Amendments.
On September 17, 2019, NCM LLC entered into the 2019 ESA Amendments with affiliates of each of Cinemark and Regal. Among other things, the 2019 ESA Amendments provide that, beginning November 1, 2019, NCM LLC is entitled to display up to five minutes of the
Noovie
pre-show after the scheduled showtime of a feature film and a Platinum Spot that is either 30 or 60 seconds of the
Noovie
pre-show in the trailer position directly prior to the “attached” trailers preceding the feature film.
We expect the 2019 ESA Amendments to result in an increase in average CPM, revenues and Adjusted OIBDA, however we may not realize any or all such benefits. Potential difficulties and uncertainties that may impair the full realization of the anticipated benefits include, among others:
17
|
•
|
the behavior of theater patrons may change in response to the display of a portion of the
Noovie
pre-show after the advertised showtime, or in response to the combination of advertising and trailers before the start of the feature film, resulting in a reduction to the number of patrons that are in a theater seat to view most or all of the
Noovie
pre-show;
|
|
•
|
exhibitors may encounter issues in displaying a portion of the
Noovie
pre-show after the advertised showtime because of technical issues, access issues with their content providers, or other issues that may arise in the future;
|
|
•
|
potential advertisers may not view the Post-Showtime Inventory as attractive due to inability to run across our entire network or view it as a premium advertising opportunity and the average CPMs for the
Noovie
pre-show may not increase as much as anticipated, or at all;
|
|
•
|
NCM LLC may not satisfy the minimum average CPM which is required by the 2019 ESA Amendments for it to have the right to display the Platinum Spot for more than one concurrent advertiser;
|
|
•
|
the extended length of time between the advertised showtime and the beginning of the feature film may decrease the average CPM for that portion of the
Noovie
pre-show appearing before the advertised showtime, which may partially or fully offset any increase in average CPM for the Post-Showtime Inventory; and
|
|
•
|
the increased theater access fees payable to Cinemark and Regal in connection with the Post-Showtime Inventory and revenue share applicable to the Platinum Spot may exceed the increase, if any, in revenue resulting from the 2019 ESA Amendments.
|
The anticipated benefits we expect to receive as a result of the 2019 ESA Amendments are subject to factors that we do not and cannot control. Failure to realize the anticipated benefits could result in decreases in revenue and Adjusted OIBDA and diversion of management’s time and energy, and could adversely affect our business, financial condition and operating results.
We may not be successful in increasing the number of theaters in which NCM LLC has the right to display Post-Showtime Inventory.
As a result of the 2019 ESA Amendments, NCM LLC is entitled to display up to five minutes of the
Noovie
pre-show after the scheduled showtime of a feature film and a Platinum Spot that is either 30 or 60 seconds of the
Noovie
pre-show in the trailer position directly prior to the “attached” trailers preceding the feature film. However, at this time NCM LLC is only displaying Post-Showtime Inventory in Cinemark and Regal operated theaters, which constituted approximately 54.0% of the attendance in our network as of
December 26, 2019
. We have entered into agreements to provide similar access to inventory as the 2019 ESA Amendments with ten of our other current network affiliates, and we expect that the inventory will begin to be displayed in these network affiliates theaters throughout 2020.
While we intend to seek to enter into agreements that provide similar access to inventory as the 2019 ESA Amendments with more of our current network affiliates and other potential network affiliates, there can be no assurance that we will be successful in increasing either the number of theaters of current network affiliates or potential network affiliates in which NCM LLC has the right to display advertising, including Post-Showtime Inventory. AMC, which constituted approximately 28.9% of the attendance in our network as of
December 26, 2019
, has announced that it has no plans to introduce commercial advertising close to the start of a feature film’s commencement. In addition, any agreements with other network affiliates or new network affiliates may be on terms less favorable to us than the current network affiliate agreements and the 2019 ESA Amendments. If we are unable to expand the number of theaters displaying our advertising, including the Post-Showtime Inventory, we will be limited to only experiencing the benefit of our advertising in our current theaters and our post-showtime advertising, if any, in Cinemark, Regal and participating affiliate theaters.
Changes in the ESAs with, or lack of support by, the founding members could adversely affect our revenue, growth and profitability.
The ESAs with the founding members are critical to our business. The ESA with AMC has an initial term of 30 years and the ESAs with each of Cinemark and Regal (as amended by the 2019 ESA Amendments) have a term of 34 years, each such term beginning February 13, 2007. Each ESA provides NCM LLC with a five-year right of first refusal for the services that it provides to the founding members, which begins one year prior to the end of the term of each respective ESA. The founding members’ theaters represent approximately 79.6% of the screens and approximately 82.9% of the attendance in our network as of December 26, 2019. If any one of the ESAs was terminated, not renewed at its expiration or found to be unenforceable, it would have a material adverse effect on our revenue, profitability and financial condition.
The ESAs require the continuing cooperation, investment and support of the founding members, the absence of which could adversely affect us. Pursuant to the ESAs, the founding members must make investments to replace digital network equipment within their theaters and equip newly constructed theaters with digital network equipment. If the founding members do not have adequate financial resources or operational strength, and if they do not replace equipment or equip new theaters to maintain the level of operating functionality that we have today, or if such equipment becomes obsolete, we may have to make additional capital expenditures or our advertising revenue and operating margins may decline. In addition, the ESAs give the
18
founding members the right to object to certain content in our
Noovie
pre-show, including content that competes with us or the applicable founding member. If the founding members do not agree with our decisions on what content, strategic program or partnerships are permitted under the ESAs, we may lose clients and the resulting revenue, which would harm our business. On October 24, 2019, AMC redeemed 197,118 membership units, which were issued to AMC in March 2019 in accordance with the terms of the common unit adjustment agreement with the founding members, in exchange for shares of our common stock. AMC is eligible to be issued additional shares pursuant to the terms of the common unit adjustment agreement. We are uncertain how AMC’s lack of ownership interest in NCM LLC may affect its cooperation with us under its ESA or otherwise going forward.
Our plans for developing additional digital revenue opportunities may not be implemented and may not be achieved.
We have invested significant resources in pursuing potential opportunities for revenue growth, which we describe in this annual report on Form 10-K under “Business-Our strategy.” We had 27.2 million and 106.5 million first- and second-party data sets as of December 27, 2018 and December 26, 2019, respectively. These valuable data sets consist of both our own NCM first-party data from our owned-and-operated digital products, and a variety of key second-party data addressable consumer records, including location-based data that allows us to track when our audiences go to the movie theater to see our
Noovie
pre-show and where they go in the days and weeks afterwards. Our ability to increase our first- and second-party data sets requires us to invest in third-party relationships and develop innovative digital properties that will increase the number of users of our online and mobile advertising network and mobile apps. Our ability to collect and leverage first and second party movie audience data remains at an early stage, is under increasing competitive pressure and may not deliver the future benefits that we are expecting. It is important that we achieve a critical mass of audience data to make our digital offering more attractive to advertisers, including national brands who buy both our national and regional advertising inventory. If we are unable to execute on products relevant to the marketplace or integrate these digital marketing products with our core on-screen and theater lobby products, and if these offerings do not continue to provide relevant data or to grow in importance to advertising clients and agencies, they may not provide a way to help expand our cinema advertising business as it matures and begins to compete with new or improved advertising platforms including online and mobile video services. As such, there can be no assurance that we will recoup our investments made pursuing additional revenue opportunities.
The markets for advertising are competitive and we may be unable to compete successfully.
The market for advertising is very competitive. Cinema advertising is a small component of video advertising in the U.S. and thus, we must compete with established, larger and better known national and local media platforms such as cable, broadcast and satellite television networks and other video media platforms including those distributed on the internet and mobile networks. In addition to these video advertising platforms, we compete for advertising directly with several additional media platforms, including radio, various local print media and billboards, and online and mobile advertising. We also compete with several other local and national cinema advertising companies. We expect all of these competitors to devote significant effort to maintaining and growing their business at our expense. We also expect existing competitors and new entrants to the advertising business, most notably the online and mobile advertising companies and video media platforms distributed on the internet and mobile networks, to constantly revise and improve their business models to meet expectations of advertising clients. In addition, the pricing and volume of advertising may be affected by shifts in spending toward online and mobile offerings from more traditional media, or toward new ways of purchasing advertising, such as through automated purchasing, dynamic advertising insertion, third parties selling local advertising posts and advertising exchanges, some or all of which may not be as advantageous to the Company as current advertising methods. Expenditures by advertisers tend to be cyclical, reflecting overall economic conditions, as well as budgeting and buying patterns. A decline in the economic prospects of advertisers, industries, such as retail or consumer products, or the economy in general could alter current or prospective advertisers’ spending priorities. If we cannot respond effectively to changes in the media marketplace, changes in the advertising market, new entrants or advances by our existing competitors, our business may be adversely affected.
Additionally, the mix of film ratings of the available motion pictures, such as a higher proportion of G and PG rated films, could cause advertisers to reduce their spending with us as the theater patrons for these films may not represent those advertisers’ target markets.
Advertising demand also impacts the price (CPM) we are able to charge our clients. Due to increased competition from other national video networks, including online and mobile advertising platforms, television networks and other out-of-home video, combined with seasonal marketplace supply and demand characteristics, we have experienced volatility in our pricing (CPMs) over the years, with annual national CPM increases (decreases) ranging from (4.2%) to 9.7% from 2015 to 2019.
19
If we do not continue to upgrade our technology, our business could fail to grow and revenue and operating margins could decline.
Failure to successfully or cost-effectively implement upgrades to our in-theater advertising network and proposal and inventory control, audience targeting and other management systems could limit our ability to offer our clients innovative unique, integrated and targeted marketing products, which could limit our future revenue growth. New advertising platforms such as online and mobile networks, and traditional mediums including television networks are beginning to use new digital technology to reach a broader audience with more targeted marketing products, and failure by us to upgrade our technology could hurt our ability to compete with those companies. Under the ESAs, the founding members are required to provide technology that is consistent with that in place at the signing of the ESA. We may request that the founding members upgrade the equipment or software installed in their theaters, but we must negotiate with the founding members as to the terms of such upgrade, including cost sharing terms, if any. If we are not able to come to an agreement on a future upgrade request, we may elect to pay for the upgrades requested which could result in our incurring significant capital expenditures, which could adversely affect our results.
We also have many internally developed systems which support our operations due to the unique nature of our business model. The failure to continue to develop or the failure of the system to meet our needs may require us to make significant additional investments in our infrastructure or seek alternative technology which may impact our costs and prevent our growth. In order to address this risk, we expect to implement a new licensed sales planning, proposal and inventory tracking system in 2021 which will replace many of our internally developed systems and house the end to end sales process from proposal to inventory delivery. We expect that the system will achieve a more seamless digital buying experience required by today's media buyers and solve the speed-to-market friction issues associated with our cinema product. The system will also interface with our accounting system thus driving client invoicing and revenue recognition. Given the pervasive impact of this new system on the Company's processes, the failure or delay in implementation of the system or problems with the integration with our other systems and software could cause operational difficulties and slow or prevent the growth of our business in the future. In addition, the failure or delay in implementation of such upgrades or problems with the integration of our systems and software could slow or prevent the growth of our business. Also, as we continue to move our technology to cloud based SaaS platforms, we will continue to reduce our annual capital expenditure spending. However, operating expenses associated with the SaaS licenses will increase and the costs of implementing this system and the related ongoing service costs may exceed our current estimates. Certain implementation costs of our SaaS platforms are capitalized during the implementation period and expensed to operating income over the term of the SaaS contract.
Economic uncertainty or deterioration in economic conditions may adversely impact our business, operating results or financial condition.
The financial markets have experienced extreme disruption and volatility at times. A decline in consumer spending in the U.S. may lead to decreased demand for our services or delay in payments by our advertising clients. As a result, our results of operations and financial condition could be adversely affected. These challenging economic conditions also may result in:
|
•
|
increased competition for fewer advertising and entertainment programming dollars;
|
|
•
|
pricing pressure that may adversely affect revenue and gross margin;
|
|
•
|
declining attendance and thus a decline in the impressions available for our pre-show;
|
|
•
|
reduced credit availability and/or access to capital markets;
|
|
•
|
difficulty forecasting, budgeting and planning due to limited visibility into the spending plans of current or prospective clients; or
|
|
•
|
client financial difficulty and increased risk of uncollectible accounts.
|
Our Adjusted OIBDA is derived from high margin advertising revenue. The reduction in spending by or loss of a national or group of local advertisers or failure to grow our advertising revenue in line with the growth of our contractual costs could have a meaningful adverse effect on our business.
We generate all of our operating income and Adjusted OIBDA from our high margin advertising business. Advertisers will not continue to do business with us if they believe our advertising medium is ineffective or overly expensive. In addition, large advertisers generally have set advertising budgets, most of which are focused on online and mobile networks and traditional media platforms like television. Reductions in the size of advertisers’ budgets due to local or national economic trends, a shift in spending to advertising mediums like the internet and mobile platforms or other factors could result in lower spending on cinema advertising. Advertisers are spending in the scatter market closer to the start date of their advertising campaign. A substantial portion of our advertising revenue relates to contracts with terms of a month or less, and clients have many video media choices and can adjust where ads are placed up until their airdates without the risk of securing desired impressions. We have been successful in increasing the dollar value of upfront advertising agreements, but as advertising spending shifts in the
20
scatter market closer to the start date of advertising campaigns, our ability to maintain high CPMs in the upfront markets may decrease. Because of the high incremental margins on our individual advertising contracts, if we are unable to remain competitive and provide value to our advertising clients, they may reduce their advertising purchases or stop placing advertisements with us. Even the loss of a small number of clients on large contracts would negatively affect our results.
In addition, the ESAs and certain of our network affiliate agreements include automatic annual cost or fee increases. The theater access fees under the ESAs are composed of a fixed payment per patron, increasing by 8% every five years, and a fixed payment per digital screen connected to the DCN, increases annually by 5%. The digital screen fees may exceed the traditional theater access fees in the future because of the higher rate of growth of the digital screen fees. In addition, pursuant to the 2019 ESA Amendments, we have agreed to pay a fixed payment per patron in consideration for NCM LLC’s access to certain on-screen advertising inventory after the advertised showtime of a feature film, which amount will increase by fixed amounts until November 1, 2022 and then increase by 8% every five years beginning November 1, 2027. If we are unable to grow our high margin advertising revenue at a rate at least equal to that of our contractual obligations, our margins and results would be negatively affected.
The loss of any major content partner or advertising client could significantly reduce our revenue.
We derive a significant portion of our revenue from our contracts with our content partners, PSAs and NCM LLC’s founding members’ agreements to purchase on-screen advertising for their beverage concessionaires. We are not direct parties to the agreements between the founding members’ and their beverage concessionaires but expect that each founding member will have an agreement with a beverage concessionaire to provide advertising for the foreseeable future. None of these companies individually accounted for over 10% of our total revenue during the year ended
December 26, 2019
. However, the agreements with the content partners, PSAs and beverage advertising with the founding members in aggregate accounted for approximately 23% and 26% of our total revenue during the years ended
December 26, 2019
and December 27, 2018, respectively. Because we derive a significant percentage of our total revenue from a relatively small number of large companies, the loss of one or more of them as a customer could decrease our revenue and adversely affect current and future operating results.
The ESAs allow the founding members to engage in activities that might compete with certain elements of our business, which could reduce our revenue and growth potential.
The ESAs contain certain limited exceptions to our exclusive right to use the founding members’ theaters for our advertising business. The founding members have the right to enter into a limited number of strategic cross-marketing relationships with third-party, unaffiliated businesses for the purpose of generating increased attendance or revenue (other than revenue from the sale of advertising). These strategic marketing relationships can include the use of one minute on the LEN per 30-minute cycle and certain types of lobby promotions and can be provided at no cost, but only for the purpose of promoting the products or services of those businesses while at the same time promoting the theater circuit or the movie-going experience. The use of LEN or lobby promotions by the founding members for these advertisements and programs could result in the founding members creating relationships with advertisers that could adversely affect our current LEN and lobby promotions advertising revenue and profitability, as well as the potential we have to grow that advertising revenue in the future. The LEN and lobby promotions represented approximately 4.7% of our total advertising revenue for the year ended
December 26, 2019
. The founding members do not have the right to use their movie screens (including the
Noovie
pre-show or otherwise) for promoting these cross-marketing relationships, and thus we will have the exclusive rights to advertise on the movie screens, except for limited advertising related to theater operations.
The founding members also have the right to install a second network of video monitors in the theater lobbies in excess of those required to be installed for the LEN, and the founding members have exercised this right to install a significant number of video monitors in their theater lobbies. This additional lobby video network, which we refer to as the founding members’ lobby network, may be used by the founding members to promote products or services related to operating the theaters, such as concessions, bars and dining operations, online ticketing partner promotions, gift card and loyalty programs, and special events. The presence of the founding members’ lobby network within the lobby areas could reduce the effectiveness of our LEN, thereby reducing our current LEN advertising revenue and profitability and adversely affecting future revenue potential associated with that marketing platform.
We depend upon our senior management and our business may be adversely affected if we cannot retain or replace them.
Our success depends in part upon the retention of our experienced senior management with specialized industry, sales and technical knowledge and/or industry relationships. In November 2018, our Chief Executive Officer stepped down and a new Chief Executive Officer was appointed in August 2019. Our Chief Financial Officer will retire following the later of March 12,
21
2020 or the filing of this annual report on Form 10-K. The Company has engaged a national search firm and is in the process of identifying a new Chief Financial Officer. If we are not able to find qualified internal or external replacements for critical members of our senior management team, the loss of these key employees could have a material adverse effect on our ability to effectively pursue our business strategy and our relationships with advertisers and content partners. We do not have key-man life insurance covering any of our employees.
If the non-competition provisions of the ESAs are deemed unenforceable, the founding members could compete against us and our business could be adversely affected.
With certain limited exceptions, each of the ESAs prohibits the applicable founding member from engaging in any of the business activities that we provide in the founding member’s theaters under the amended ESAs, and from owning interests in other entities that compete with us. These provisions are intended to prevent the founding members from harming our business by providing cinema advertising services directly to their theaters or by entering into agreements with third-party cinema advertising providers. However, under state and federal law, a court may determine that a non-competition covenant is unenforceable, in whole or in part, for reasons including, but not limited to, the court’s determination that the covenant:
|
•
|
is not necessary to protect a legitimate business interest of the party seeking enforcement;
|
|
•
|
unreasonably restrains the party against whom enforcement is sought; or
|
|
•
|
is contrary to the public interest.
|
Enforceability of a non-competition covenant is determined by a court based on all of the facts and circumstances of the specific case at the time enforcement is sought. For this reason, it is not possible for us to predict whether, or to what extent, a court would enforce the non-competition provisions contained in the ESAs. If a court were to determine that the non-competition provisions are unenforceable, the founding members could compete directly against us or enter into an agreement with another cinema advertising provider that competes against us. Any inability to enforce the non-competition provisions, in whole or in part, could cause our revenue to decline.
If one of the founding members declared bankruptcy, the ESA with that founding member may be rejected, renegotiated or deemed unenforceable.
Each of the founding members currently has a significant amount of indebtedness. In 2000 and 2001, several major motion picture exhibition companies filed for bankruptcy including United Artists, Edwards Theatres and Regal Cinemas (which are part of Regal), and General Cinemas and Loews Cineplex (which are part of AMC). The industry-wide construction of larger, more expensive megaplexes featuring stadium seating in the late 1990s that rendered existing, smaller, sloped-floor theaters under long-term leases obsolete and unprofitable, were significant contributing factors to these bankruptcies. If a bankruptcy case were commenced by or against a founding member, it is possible that all or part of the ESA with that founding member could be rejected by a trustee in the bankruptcy case pursuant to Section 365 or Section 1123 of the United States Bankruptcy Code, or by the founding member, and thus not be enforceable. Alternatively, the founding member could seek to renegotiate the ESA in a manner less favorable to us than the existing agreement. Should the founding member seek to sell or otherwise dispose of theaters or remove theaters from our network through bankruptcy or for other business reasons, if the acquirer did not agree to continue to allow us to sell advertising in the acquired theaters the number of theaters in our advertising networks would be reduced which in turn would reduce the number of advertising impressions available to us and thus could reduce our advertising revenue.
The founding members and our network affiliates are subject to substantial government regulation, which could slow their future growth of locations and screens and in turn slow our growth prospects.
The founding members and our network affiliates are subject to various federal, state and local laws, regulations and administrative practices affecting their movie theater business, including provisions regulating antitrust, health and sanitation standards, access for those with disabilities, environmental, and licensing. Some of these laws and regulations also apply directly to us and NCM LLC. Changes in existing laws or implementation of new laws, regulations and practices could have a significant impact on the founding members, our network affiliates’ and our respective businesses. For example, to the extent that antitrust laws, regulation and enforcement policy restrict the ability of the founding members or the network affiliates to acquire additional theaters, it may slow the future growth of those founding members or network affiliates and in turn the growth of our network.
We may be unable to effectively manage changes to our business strategy to continue the growth of our advertising inventory and network.
If we do not effectively implement the changes within our strategy, we may not be able to continue our historical growth. To effectively execute on our strategy to expand our digital offerings and continue to grow our inventory, we will need to
22
develop additional products. These enhancements and improvements could require an additional allocation of financial and management resources and acquisition of talent. High turnover, loss of specialized talent or insufficient capital could also place significant demands on management, the success of the organization, and our strategic outlook.
The amount of inventory we have to sell is limited by the length of the
Noovie
pre-show. In order to maintain in-theater growth we will need to expand the number of theaters and screens in our network. Considering our current market share, we may not be able to continue to expand our network which could negatively affect our ability to add new advertising clients. If we are unable to maintain the size of our network, or grow our network, our revenue and operating results could be adversely impacted.
Our business relies heavily on our technology systems, and any failures or disruptions may materially and adversely affect our operations.
In order to conduct our business, we rely on information technology networks and systems, some of which are managed by third parties, to process, transmit and store electronic information and manage and support a variety of business processes and activities. The temporary or permanent loss of our computer equipment, audience data or software systems through cyber and other security threats, termination of a material technology license or contract, operating malfunction, software virus, human error, natural disaster, power loss, terrorist attacks or other catastrophic events could disrupt our operations and cause a material adverse impact. These problems may arise in both internally developed systems and the systems of third-party service providers. We devote significant resources to maintaining a disaster recovery location separate from our operations, network security and other measures to protect our network from unauthorized access and misuse. However, depending on the nature and scope of a disruption, if our technology systems were to fail and we were unable to recover in a timely way through our disaster recovery site, we would be unable to fulfill critical business functions, which could lead to a loss of clients and could harm our reputation. Technological breakdown could also interfere with our ability to comply with financial reporting and other regulatory requirements.
Our business, services, or technology may infringe on intellectual property rights owned by others, which may interfere with our ability to provide services or expose us to increased liability or expense.
Intellectual property rights of our business include the copyrights, trademarks, trade secrets and patents of our in-theater, online, and mobile services, including the websites we operate at ncm.com and
Noovie.com
, our digital gaming products including
Noovie Arcade
,
Fantasy Movie League
,
Name That Movie
and
Noovie Shuffle
, and the features and functionality, content, and software we make available through those websites and apps. We rely on our own intellectual property rights as well as intellectual property rights obtained from third parties to conduct our business and provide our in-theater, online, and mobile services. We may discover that our business or the technology we use to provide our in-theater, online, or mobile services infringes patent, copyright, or other intellectual property rights owned by others. In addition, our competitors or others may claim rights in patents, copyrights, or other intellectual property rights that will prevent, limit or interfere with our ability to provide our in-theater, online, or mobile services either in the U.S. or in international markets. Further, the laws of certain foreign countries may not protect our intellectual property rights to the same extent as do the laws of the U.S.
The content we distribute through our in-theater, online or mobile services may expose us to liability.
Our in-theater, online, and mobile services facilitate the distribution of content. This content includes advertising-related content, as well as movie, television, music, gaming and other media content, much of which is obtained from third parties. Our websites and social media channels also include features enabling users to upload or add their own content to the websites and modify certain content on the websites. As a distributor of content, we face potential liability for negligence, copyright, patent or trademark infringement, or other claims based on the content that we distribute. We or entities that we license content from may not be adequately insured or indemnified to cover claims of these types or liability that may be imposed on us.
The user information we collect and maintain through our online and mobile services may expose us to liability.
In order to take advantage of some of the online and mobile services we provide, users may, now or in the future, be required to establish an account on one of our websites. As a result, we may collect and maintain personal information about those users. We also may, now or in the future, collect and maintain information about users who view certain advertising displayed through our online and mobile services and users who enter the theaters in our network. The collection and use of this information is governed by applicable privacy, information security and consumer protection-related laws and regulations. These laws continue to evolve and may be inconsistent from one jurisdiction to another. Compliance with all such laws and regulations may increase our operating costs and adversely impact our ability to interact with users of our online and mobile services. Our collection and use of information, including personal information, regarding users of our online and mobile services could result in legal liability. For example, the failure, or perceived failure, to comply with applicable privacy
23
information security or consumer protection-related laws or regulations or our posted privacy policies could result in actions against us by governmental entities or others. If an actual or perceived breach of our data occurs, the market perception of the effectiveness of our security measures could be harmed, and we could lose users of these services and the associated benefits from gathering such user data.
Changes in regulations relating to the Internet or other areas of our online or mobile services may result in the need to alter our business practices or incur greater operating expenses.
A number of regulations, including those referenced below, may impact our business as a result of our online or mobile services. The Digital Millennium Copyright Act has provisions that limit, but do not necessarily eliminate, liability for posting, or linking to third-party websites that include materials that infringe copyrights or other rights. Portions of the Communications Decency Act are intended to provide statutory protections to online service providers who distribute third-party content. The Child Online Protection Act and the Children’s Online Privacy Protection Act restrict the distribution of materials considered harmful to children and impose additional restrictions on the ability of online services to collect information from minors. The California Consumer Protection Act and other privacy laws give residents of certain states additional rights with regards to their personal information. The costs of compliance with these regulations, and other regulations relating to our online and mobile services or other areas of our business, may be significant. The manner in which these and other regulations may be interpreted or enforced may subject us to potential liability, which in turn could have an adverse effect on our business, results of operations, or financial condition. Changes to these and other regulations may impose additional burdens on us or otherwise adversely affect our business and financial results because of, for example, increased costs relating to legal compliance, defense against adverse claims or damages, or the reduction or elimination of features, functionality or content from our online or mobile services. Likewise, any failure on our part to comply with these and other regulations may subject us to additional liabilities.
Our revenue and Adjusted OIBDA fluctuate from quarter to quarter and may be unpredictable, which could increase the volatility of our stock price.
A weak advertising market or the shift in spending of a major client from one quarter to another, the performance of films released in a given quarter, a disruption in the release schedule of films or changes in the television scatter market could significantly affect quarter-to-quarter results or even affect results for the entire fiscal year. In addition, our revenue and operating results are seasonal in nature, coinciding with the timing of marketing expenditures by our advertising clients and, to a lesser extent, the attendance patterns within the film exhibition industry. Advertising expenditures tend be higher during the second, third, and fourth fiscal quarters. Because our results may vary from quarter to quarter and may be unpredictable, our financial results for one quarter cannot necessarily be compared to another quarter or the same quarter in prior years and may not be indicative of our financial performance in subsequent quarters. These variations in our financial results could contribute to volatility in our stock price.
If we fail to maintain an effective system of internal control over financial reporting, we may not be able to accurately report our financial results or prevent fraud, and as a result, stockholders could lose confidence in our financial and other public reporting, which would harm our business and the trading price of our common stock.
Effective internal controls over financial reporting are necessary for us to provide reliable financial reports and, together with adequate disclosure controls and procedures, are designed to prevent fraud. Any failure to implement required controls, or difficulties encountered in implementing new or improved controls, could cause us to fail to meet our reporting obligations. In addition, any testing by us conducted in connection with Section 404 of the Sarbanes-Oxley Act, or the subsequent testing by our independent registered public accounting firm, may reveal deficiencies in our internal controls over financial reporting that are deemed to be material weaknesses or that may require prospective or retroactive changes to our financial statements or identify other areas for further attention or improvement. Inferior internal controls could also cause investors to lose confidence in our reported financial information, which could have a negative effect on the trading price of our common stock.
Risks Related to Our Corporate Structure
We are a holding company with no operations of our own, and we depend on distributions and payments under the NCM LLC operating and management services agreements from NCM LLC to meet our ongoing obligations and to pay cash dividends on our common stock.
We are a holding company with no operations of our own and have no independent ability to generate cash flow other than interest income on cash balances. Consequently, our ability to obtain operating funds primarily depends upon distributions from NCM LLC. The distribution of cash flows and other transfers of funds by NCM LLC to us are subject to statutory and contractual restrictions based upon NCM LLC’s financial performance, including NCM LLC’s compliance with the covenants
24
in its senior secured credit facility and indentures, and the NCM LLC operating agreement. The NCM LLC senior secured credit facility and indentures limit NCM LLC’s ability to distribute cash to its members, including us, based upon certain leverage tests, with exceptions for, among other things, payment of our income taxes and a management fee to NCM, Inc. pursuant to the terms of the management services agreement (incorporated in the ESA). Refer to the information provided under Note 10 to the audited Condensed Consolidated Financial Statements included elsewhere in this document for leverage discussion. The declaration of future dividends on our common stock will be at the discretion of our Board of Directors and will depend upon many factors, including NCM LLC’s results of operations, financial condition, earnings, capital requirements, limitations in NCM LLC’s debt agreements and legal requirements. In the event NCM LLC fails to comply with these covenants and is unable to distribute cash to us quarterly, once NCM, Inc. cash balances and investments are extinguished, we will be unable to pay dividends to our stockholders or pay other expenses outside the ordinary course of business.
Pursuant to the management services agreement between us and NCM LLC, NCM LLC makes payments to us to fund our day-to-day operating expenses, such as payroll. However, if NCM LLC has insufficient cash flow to make the payments pursuant to the management services agreement, we may be unable to cover these expenses.
As a member of NCM LLC, we incur income taxes on our proportionate share of any net taxable income of NCM LLC. We have structured the NCM LLC senior secured credit facility and indentures to allow NCM LLC to distribute cash to its members (including us and NCM LLC’s other members) in amounts sufficient to cover their tax liabilities and management fees, if any. To the extent that NCM LLC has insufficient cash flow to make such payments, it could have a material adverse effect on our business, financial condition, results of operations or prospects.
NCM LLC’s substantial debt obligations could impair our financial condition or prevent us from achieving our business goals.
NCM LLC is party to substantial debt obligations. The senior secured credit facility and indentures contain restrictive covenants that limit NCM LLC’s ability to take specified actions and prescribe minimum financial maintenance requirements that NCM LLC must meet. Because NCM LLC is our only operating subsidiary, complying with these restrictions may prevent NCM LLC from taking actions that we believe would help us to grow our business. For example, NCM LLC may be unable to make acquisitions, investments or capital expenditures as a result of such covenants. Moreover, if NCM LLC violates those restrictive covenants or fails to meet the minimum financial requirements, it would be in default, which could, in turn, result in defaults under other obligations of NCM LLC. Any such defaults could materially impair our financial condition and liquidity. For further information, refer to Note 10 to the audited Condensed Consolidated Financial Statements included elsewhere in this document.
If NCM LLC is unable to meet its debt service obligations, it could be forced to restructure or refinance the obligations, seek additional equity financing or sell assets. NCM LLC may be unable to restructure or refinance these obligations, obtain additional equity financing, sell assets on satisfactory terms or at all or make cash distributions. In addition, NCM LLC’s indebtedness could have other negative consequences for us, including without limitation:
|
•
|
limiting NCM LLC’s ability to obtain financing in the future;
|
|
•
|
requiring much of NCM LLC's cash flow to be dedicated to interest obligations and making it unavailable for other purposes, including payments to its members (including NCM, Inc.);
|
|
•
|
limiting NCM LLC’s liquidity and operational flexibility in changing economic, business and competitive conditions which could require NCM LLC to consider deferring planned capital expenditures, reducing discretionary spending, selling assets, restructuring existing debt or deferring acquisitions or other strategic opportunities; and
|
|
•
|
making NCM LLC more vulnerable to an increase in interest rates, a downturn in operating performance or decline in general economic conditions.
|
Despite NCM LLC’s current levels of debt, it, or NCM, Inc. may still incur substantially more debt, including secured debt, which would increase the risks associated with NCM LLC’s level of debt
The agreements relating to NCM LLC’s debt, including the Notes due 2026 and Notes due 2028 and the senior secured credit facility, limit but do not prohibit NCM LLC’s ability to incur additional debt, and do not place any restrictions on NCM, Inc.’s ability to incur debt. Accordingly, NCM, Inc. or NCM LLC could incur additional debt in the future, including additional debt under the senior secured credit facility, additional senior or senior subordinated notes and additional secured debt. If new debt is added to current debt levels, the related risks that we now face, including those described above under “NCM LLC’s substantial debt obligations could impair our financial condition or prevent us from achieving our business goals,” could intensify.
25
NCM LLC’s other founding members or their affiliates may have interests that differ from those of our public stockholders and they may be able to influence our affairs.
So long as either Cinemark or Regal owns at least 5% of NCM LLC’s issued and outstanding common membership units, if the two directors appointed by Cinemark or the two directors appointed by Regal to our Board of Directors (except that if either Cinemark or Regal has only appointed one director, and such director qualifies as an “independent director” under the applicable rules of the Nasdaq Stock Market LLC, then such director) vote against any of the corporate actions listed below, we and NCM LLC will be prohibited from taking any such actions:
|
•
|
assign, transfer, sell or pledge all or a portion of the membership units of NCM LLC beneficially owned by NCM, Inc.;
|
|
•
|
acquire, dispose, lease or license assets with an aggregate value exceeding 20% of the fair market value of the business of NCM LLC operating as a going concern;
|
|
•
|
merge, reorganize, recapitalize, reclassify, consolidate, dissolve, liquidate or enter into a similar transaction;
|
|
•
|
incur any funded indebtedness or repay, before due, any funded indebtedness with a fixed term in an aggregate amount in excess of $15.0 million per year;
|
|
•
|
issue, grant or sell shares of NCM, Inc. common stock, preferred stock or rights with respect to common or preferred stock, or NCM LLC membership units or rights with respect to membership units, except under specified circumstances;
|
|
•
|
amend, modify, restate or repeal any provision of NCM, Inc.’s certificate of incorporation or bylaws or the NCM LLC operating agreement;
|
|
•
|
enter into, modify or terminate certain material contracts not in the ordinary course of business as defined under applicable securities laws;
|
|
•
|
except as specifically set forth in the NCM LLC operating agreement, declare, set aside or pay any redemption of, or dividends with respect to membership interests;
|
|
•
|
amend any material terms or provisions (as defined in the Nasdaq rules) of NCM, Inc.’s equity incentive plan or enter into any new equity incentive compensation plan;
|
|
•
|
make any change in the current business purpose of NCM, Inc. to serve solely as the manager of NCM LLC or any change in the current business purpose of NCM LLC to provide the services as set forth in the ESAs; and
|
|
•
|
approve any actions relating to NCM LLC that could reasonably be expected to have a material adverse tax effect on NCM LLC’s founding members.
|
Pursuant to a director designation agreement, so long as Cinemark or Regal owns at least 5% of NCM LLC’s issued and outstanding common membership units, such NCM LLC founding member will have the right to designate a total of two nominees to our Board of Directors who will be voted upon by our stockholders. One such designee by each of Cinemark and Regal must meet the independence requirements of the stock exchange on which our common stock is listed. If, at any time, Cinemark or Regal owns less than 5% of NCM LLC’s then issued and outstanding common membership units, then such NCM LLC founding member shall cease to have any rights of designation. AMC no longer has seats on our Board of Directors or the right to nominate any person to serve on our Board of Directors.
If any director designee to our Board of Directors designated by Cinemark or Regal is not appointed to our Board of Directors, nominated by us or elected by our stockholders, as applicable, then Cinemark and Regal (so long as such they each continue to own at least 5% of NCM LLC’s issued and outstanding common membership units) will be entitled to approve specified actions of NCM LLC.
For purposes of calculating the 5% ownership threshold for the director veto rights and director designation agreement provisions discussed above, shares of our common stock held by a founding member and received upon redemption of NCM LLC common membership units will be counted toward the threshold. Common membership units issued to NCM, Inc. in connection with the redemption of common membership units by an NCM LLC founding member will be excluded, so long as such NCM LLC founding member continues to hold the common stock acquired through such redemption or such NCM LLC founding member has disposed of such shares of common stock to another NCM LLC founding member. Shares of our common stock otherwise acquired by NCM LLC’s founding members will also be excluded, unless such shares of common stock were transferred by one founding member to another and were originally received by the transferring NCM LLC founding member upon redemption of NCM LLC common membership units.
Under these circumstances, our corporate governance documents allow NCM LLC’s other members and their affiliates to exercise a greater degree of influence in the operation of our business and that of NCM LLC and the management of our affairs and those of NCM LLC than is typically available to stockholders of a publicly-traded company. Even if NCM LLC’s other members or their affiliates own a minority economic interest (but not less than 5%) in NCM LLC, they may be able to continue exerting such degree of influence over us and NCM LLC.
26
Different interests among the founding members or between the founding members and us could prevent us from achieving our business goals.
For the foreseeable future, we expect that our Board of Directors will include directors and certain executive officers of Cinemark and Regal and other directors who may have commercial or other relationships with Cinemark and Regal. The majority of NCM LLC’s outstanding membership interests also are owned by Cinemark and Regal. Such members compete with each other in the operation of their respective businesses and could have individual business interests that may conflict. Their differing interests could make it difficult for us to pursue strategic initiatives that require consensus among NCM LLC’s current members. In addition, to the extent the founding members sell some or all their NCM LLC membership units, such as was the case for AMC during 2017, 2018 and 2019, the founding members could have increasingly different interests because they no longer mutually benefit from an increase in NCM LLC’s revenues or the value of the NCM, Inc. common stock into which the NCM LLC membership units are convertible.
In addition, the structural relationship we have with NCM LLC’s founding members could create conflicts of interest among NCM LLC’s founding members, or between NCM LLC’s founding members and us, in a number of areas relating to our past and ongoing relationships. These conflicts of interests could also increase upon the sale of NCM LLC membership units by a founding member because the founding member would have little incentive to agree to changes that may result in higher revenue for NCM LLC or a higher price for our common stock. There is not any formal dispute resolution procedure in place to resolve conflicts between us and an NCM LLC founding member or between NCM LLC founding members. We may not be able to resolve any potential conflicts between us and an NCM LLC founding member and, even if we do, the resolution may be less favorable to us than if we were negotiating with an unaffiliated party.
The corporate opportunity provisions in our certificate of incorporation could enable NCM LLC’s members to benefit from corporate opportunities that might otherwise be available to us.
Our certificate of incorporation contains provisions related to corporate opportunities that may be of interest to NCM LLC’s other members and us. It provides that if a corporate opportunity is offered to us, NCM LLC or one or more of the officers, directors or stockholders (both direct and indirect) of NCM, Inc. or a member of NCM LLC that relates to the provision of services to motion picture theaters, use of theaters for any purpose, sale of advertising and promotional services in and around theaters and any other business related to the motion picture theater business (except services as provided in the ESAs as from time to time amended and except as may be offered to one of our officers in his capacity as an officer), no such person shall be liable to us or any of our stockholders (or any affiliate thereof) for breach of any fiduciary or other duty by reason of the fact that such person pursues or acquires such business opportunity, directs such business opportunity to another person or fails to present such business opportunity, or information regarding such business opportunity, to us. This provision may apply even if the business opportunity is one that we might reasonably be deemed to have pursued or had the ability or desire to pursue if granted the opportunity to do so.
In addition, our certificate of incorporation and the NCM LLC operating agreement expressly provide that NCM LLC’s founding members may have other business interests and may engage in any other businesses not specifically prohibited by the terms of the certificate of incorporation, including the exclusivity provisions of the ESAs. The parent companies of NCM LLC’s founding members could develop new media platforms that could compete for advertising dollars with our services. Further, we may also compete with NCM LLC’s founding members or their affiliates in the area of employee recruiting and retention. These potential conflicts of interest could have a material adverse effect on our business, financial condition, results of operations or prospects if attractive corporate opportunities are allocated by NCM LLC’s founding members to themselves or their other affiliates or we lose key personnel to them.
The agreements between us and NCM LLC’s founding members were made in the context of an affiliated relationship and may contain different terms than comparable agreements with unaffiliated third parties.
The ESAs and the other contractual agreements that we have with NCM LLC’s founding members were originally negotiated in the context of an affiliated relationship in which representatives of NCM LLC’s founding members and their affiliates comprised our entire Board of Directors. As a result, the financial provisions and the other terms of these agreements, such as covenants, contractual obligations on our part and on the part of NCM LLC’s founding members and termination and default provisions may be less favorable to us than terms that we might have obtained in negotiations with unaffiliated third parties in similar circumstances.
27
Our certificate of incorporation and bylaws contain anti-takeover protections that may discourage or prevent strategic transactions, including a takeover of our Company, even if such a transaction would be beneficial to our stockholders.
Provisions contained in our certificate of incorporation and bylaws, the NCM LLC operating agreement, and provisions of the Delaware General Corporation Law (“DGCL”), could delay or prevent a third party from entering into a strategic transaction with us, even if such a transaction would benefit our stockholders. For example, our certificate of incorporation and bylaws:
|
•
|
provide veto rights to the directors designated by Cinemark and Regal over certain actions specified in our certificate of incorporation;
|
|
•
|
authorize the issuance of “blank check” preferred stock that could be issued by our Board of Directors to increase the number of outstanding shares, making a takeover more difficult and expensive;
|
|
•
|
prohibit stockholder action by written consent; and
|
|
•
|
do not permit cumulative voting in the election of directors, which would otherwise allow less than a majority of stockholders to elect director candidates.
|
NCM LLC’s operating agreement also provides that NCM LLC’s other members will be able to exercise a greater degree of influence over the operations of NCM LLC, which may discourage other nominations to our Board of Directors, if any director nominee designated by NCM LLC’s other members is not elected by our stockholders. In addition, we entered into a letter agreement with Standard General L.P., our largest stockholder, on June 1, 2018, that contains customary standstill provisions that may discourage a third party from seeking to enter into a strategic transaction with us.
These restrictions could keep us from pursuing relationships with strategic partners and from raising additional capital, which could impede our ability to expand our business and strengthen our competitive position. These restrictions could also limit stockholder value by impeding a sale of us or NCM LLC. Further, these restrictions could restrict or limit certain investors from owning our stock.
Any future issuance of membership units by NCM LLC and subsequent redemption of such units for common stock could dilute the voting power of our existing common stockholders and adversely affect the market value of our common stock.
The common unit adjustment agreement and the ESAs provide that NCM LLC will issue common membership units to account for changes in the number of theater screens NCM LLC’s founding members operate and which are made part of our advertising network. Historically, in most years each of NCM LLC’s founding members has increased the number of screens it operates. If this trend continues, NCM LLC may issue additional common membership units to NCM LLC’s founding members to reflect their increase in net screen count. Each common membership unit may be redeemed in exchange for, at our option, shares of our common stock on a one-for-one basis or a cash payment equal to the market price of one share of our common stock. If a significant number of common membership units were issued to NCM LLC’s founding members, NCM LLC’s founding members elected to redeem such units, and we elected to issue common stock rather than cash upon redemption, the voting power of our common stockholders could be diluted. Other than the maximum number of authorized shares of common stock in our certificate of incorporation, there is no limit on the number of shares of our common stock that we may issue upon redemption of an NCM LLC founding member’s common membership units in NCM LLC. For further information, refer to Note 5 to the audited Condensed Consolidated Financial Statements included elsewhere in this document.
Our future issuance of preferred stock could dilute the voting power of our common stockholders and adversely affect the market value of our common stock.
The future issuance of shares of preferred stock with voting rights may adversely affect the voting power of the holders of our other classes of voting stock, either by diluting the voting power of our other classes of voting stock if they vote together as a single class, or by giving the holders of any such preferred stock the right to block an action on which they have a separate class vote even if the action were approved by the holders of our other classes of voting stock.
The future issuance of shares of preferred stock with dividend or conversion rights, liquidation preferences or other economic terms favorable to the holders of preferred stock could adversely affect the market price for our common stock by making an investment in the common stock less attractive. For example, investors in the common stock may not wish to purchase common stock at a price above the conversion price of a series of convertible preferred stock because the holders of the preferred stock would effectively be entitled to purchase common stock at the lower conversion price causing economic dilution to the holders of common stock.
28
If we or NCM LLC’s founding members are determined to be an investment company, we would become subject to burdensome regulatory requirements and our business activities could be restricted.
We do not believe that we are an “investment company” under the Investment Company Act of 1940, as amended. As sole manager of NCM LLC, we control NCM LLC, and our interest in NCM LLC is not an “investment security” as that term is used in the Investment Company Act of 1940. If we were to stop participating in the management of NCM LLC, our interest in NCM LLC could be deemed an “investment security” for purposes of the Investment Company Act of 1940. Generally, a company is an “investment company” if it owns investment securities having a value exceeding 40% of the value of its total assets (excluding U.S. government securities and cash items). Our sole material asset is our equity interest in NCM LLC. A determination that such asset was an investment security could result in our being considered an investment company under the Investment Company Act of 1940. As a result, we would become subject to registration and other burdensome requirements of the Investment Company Act. In addition, the requirements of the Investment Company Act of 1940 could restrict our business activities, including our ability to issue securities.
We and NCM LLC intend to conduct our operations so that we are not deemed an investment company under the Investment Company Act. However, if anything were to occur that would cause us to be deemed an investment company, we would become subject to restrictions imposed by the Investment Company Act of 1940. These restrictions, including limitations on our capital structure and our ability to enter into transactions with our affiliates, could make it impractical for us to continue our business as currently conducted and could have a material adverse effect on our financial performance and operations.
We also rely on representations of NCM LLC’s founding members that they are not investment companies under the Investment Company Act. If any NCM LLC founding member were deemed an investment company, the restrictions placed upon that NCM LLC founding member might inhibit its ability to fulfill its obligations under its ESA or restrict NCM LLC’s ability to borrow funds.
Our TRA with NCM LLC’s founding members is expected to reduce the amount of overall cash flow that would otherwise be available to us and will increase our potential exposure to the financial condition of NCM LLC’s founding members.
Our initial public offering and related transactions have the effect of reducing the amounts NCM, Inc. would otherwise pay in the future to various tax authorities as a result of an increase in its proportionate share of tax basis in NCM LLC’s tangible and intangible assets. We have agreed in our TRA with NCM LLC’s founding members to pay to NCM LLC’s founding members 90% of the amount by which NCM, Inc.’s tax payments to various tax authorities are reduced as a result of the increase in tax basis. After paying these reduced amounts to tax authorities, if it is determined as a result of an income tax audit or examination that any amount of NCM, Inc.’s claimed tax benefits should not have been available, NCM, Inc. may be required to pay additional taxes and possibly penalties and interest to one or more tax authorities. If this were to occur and if one or more of NCM LLC’s founding members was insolvent or bankrupt or otherwise unable to make payment under its indemnification obligation under the TRA, then NCM, Inc.’s financial condition could be negatively impacted.
The substantial number of shares that are eligible for sale could cause the market price for our common stock to decline or make it difficult for us to sell equity securities in the future.
We cannot predict the effect, if any, that market sales of shares of common stock by Regal, Cinemark, or Standard General will have on the market price of our common stock from time to time. Sales of substantial amounts of shares of our common stock in the public market, or the perception that those sales will occur, could cause the market price of our common stock to decline or make future offerings of our equity securities more difficult. If we are unable to sell equity securities at times and prices that we deem appropriate, we may be unable to fund growth. Cinemark and Regal may receive up to 81,508,369 shares of common stock as of
December 26, 2019
upon redemption of their outstanding common membership units of NCM LLC. The resale of these shares of common stock has been registered as required by the terms of the registration rights agreement between NCM, Inc. and the founding members. Standard General also owns 15,808,390 shares that it may sell at any time. Additionally, once options and restricted stock held by our employees become vested and/or exercisable, as applicable, to the extent that they are not held by one of our affiliates, the shares acquired upon vesting or exercise are freely tradable. Refer to Note 11 to the audited Consolidated Financial Statements included in our annual report on Form 10-K.
The interests of our largest stockholder and NCM LLC’s other members may be different from or conflict with those of our other stockholders.
Standard General beneficially owns 15,808,390 shares of our common stock, and as of
December 26, 2019
, Cinemark and Regal held NCM LLC membership interests that are convertible into another 81,508,369 shares of our common stock. As a
29
result, each of Regal, Cinemark and Standard General is in a position to influence or control to some degree the outcome of matters requiring stockholder approval, including the adoption of amendments to our certificate of incorporation or bylaws and the approval of mergers and other significant corporate transactions. Their influence or control of our Company and NCM LLC may have the effect of delaying or promoting a change of control of our Company and may adversely affect the voting and other rights of other stockholders. In addition, each of Regal, Cinemark and Standard General has the right to designate directors to our Board. These directors have the authority, subject to applicable rules and regulations, to issue additional stock, implement stock repurchase programs, declare dividends and make other decisions.
It is possible that the interests of Regal, Cinemark and Standard General may in some circumstances conflict with our interests and the interests of our other stockholders. For example, Cinemark and Regal may have different tax positions from us, especially in light of the TRA we entered into with founding members that provides for the payment by us to the founding members of 90% of the amount of any tax benefits that we actually realize, or in some cases are deemed to realize. This could influence their decisions regarding whether and when we should dispose of assets, and whether and when we or NCM LLC should incur indebtedness. As another example, Standard General is in the business of making investments in companies and may hold, and may from time to time in the future acquire, interests in or provide advice to businesses that directly or indirectly compete with us.
|
Item 1B.
|
Unresolved Staff Comments
|
None.
|
Item 2.
|
Properties
|
The Company's headquarters are located in Centennial, Colorado. As of
December 26, 2019
the Company also leases advertising sales offices in New York, Los Angeles, Chicago, and Detroit; digital development offices in Los Angeles and New York, and a software development office in Minneapolis. We own no material real property. We believe that all of our present facilities are adequate for our current needs and that additional space is available for future expansion on acceptable terms.
|
Item 3.
|
Legal Proceedings
|
We are sometimes involved in legal proceedings arising in the ordinary course of business. We are not aware of any other litigation currently pending that would have a material adverse effect on our operating results or financial condition.
|
Item 4.
|
Mine Safety Disclosures
|
Not applicable.
Information about our Executive Officers
Shown below are the names, ages as of the filing date of this Form 10-K, and current positions of our executive officers. There are no family relationships between any of the persons listed below, or between any of such persons and any of the directors of the Company or any persons nominated or chosen by the Company to become a director or executive officer of the Company.
|
Name
|
Age
|
Position
|
||
|
Thomas F. Lesinski
|
60
|
Chief Executive Officer
|
||
|
Clifford E. Marks
|
58
|
Company President
|
||
|
Katherine L. Scherping
|
60
|
Chief Financial Officer
|
||
|
Sarah Kinnick Hilty
|
49
|
Executive Vice President, General Counsel and Secretary
|
||
|
Scott D. Felenstein
|
51
|
Executive Vice President and Chief Revenue Officer
|
||
Thomas F. Lesinski.
Mr. Lesinski was appointed Chief Executive Officer of NCM, Inc. in August 2019. Prior to his current position, Mr. Lesinski served as the Non-Employee Chairman of NCM, Inc. since August 2018 and as a member of the Board of Directors of NCM, Inc. since 2014. In addition to his roles on the Board of Directors of NCM, Inc., Mr. Lesinski also served as the Chief Executive Officer of Sonar Entertainment, an independent entertainment studio, from January 2016 to August 2019. Mr. Lesinski served as the founder and CEO of Energi Entertainment, a multi-media content production company, from August 2014 until December 2015. From 2013 to 2014, Mr. Lesinski was President of Digital Content and Distribution at Legendary Entertainment, a leading media company dedicated to owning, producing and delivering content to mainstream audiences with a targeted focus on the powerful fandom demographic. Prior to that role, from 2006 to 2013,
30
Mr. Lesinski served as President, Digital Entertainment at Paramount Pictures, a global producer and distributor of filmed entertainment. Mr. Lesinski also served as President of Worldwide Home Entertainment at Paramount Pictures for three years, prior to which, he spent ten years in various leadership positions at Warner Bros. Entertainment and was a Managing Director for an advertising agency.
Clifford E. Marks
. Mr. Marks was appointed President in May 2016. Mr. Marks served as the Interim Chief Executive Officer of NCM, Inc., in addition to his role of President, from November 2018 to August 2019. Prior to his current position, Mr. Marks served as President of Sales and Marketing of NCM, Inc. since February 2007 and held those same positions with NCM LLC since March 2005. He has been an advertising, marketing and sales professional for 25 years. Mr. Marks also served as president of sales and marketing with Regal Entertainment Group’s media subsidiary, Regal CineMedia Corporation, from May 2002 to May 2005. Before joining Regal CineMedia, Mr. Marks was a senior vice president at ESPN/ABC Sports where he oversaw its advertising sales organization from 1998 to May 2002.
Katherine L. Scherping.
Ms. Scherping was appointed Chief Financial Officer in August 2016 and plans to retire in March 2020. Prior to joining NCM, Inc., Ms. Scherping served as Chief Financial Officer of QCE LLC and subsidiaries (d/b/a Quiznos) from December 2013 to July 2016 and as interim President and Chief Executive Officer from June 2016 to July 2016. From October 2011 through July 2016, Ms. Scherping was a guest faculty member at Deloitte University, providing leadership training to partners and other executives. From June 2005 to July 2011, she served as Chief Financial Officer of Red Robin Gourmet Burgers, Inc.
Sarah Kinnick Hilty.
Ms. Hilty was appointed Senior Vice President, General Counsel and Secretary in February 2018 and named Executive Vice President, General Counsel and Secretary in January 2020. Prior to joining NCM, Inc., Ms. Hilty served as Deputy General Counsel - Corporate of CH2M HILL Companies, Ltd. from 2006 to 2018 leading a team responsible for legal corporate enterprise matters including mergers, acquisitions, and divestitures; securities compliance; treasury and finance activities, real estate, and board and subsidiary governance. Prior to working at CH2M HILL Companies, Ltd., Ms. Hilty was a partner at Hogan & Hartson LLP.
Scott D. Felenstein.
Mr. Felenstein was appointed Executive Vice President and Chief Revenue Officer in April 2017. Prior to joining NCM, Inc., Mr. Felenstein served as Executive Vice President, National Advertising Sales for Discovery Communications, Inc. since 2013 and Senior Vice President, National Advertising Sales for Discovery Communications, Inc. since 2000. Prior to working at Discovery Communications, Inc., Mr. Felenstein served on the digital ad sales team at Excite@Home and worked as an account
executive at CBS Sports.
PART II
|
Item 5.
|
Market for Registrant’s Common Equity, Related Stockholder Matters and Issuer Purchases of Equity Securities
|
Market Information
Our common stock, $0.01 par value, is traded on The Nasdaq Global Market under the symbol “NCMI”. There were 190 stockholders of record as of February 14, 2020
(does not include beneficial holders of shares held in “street name”).
Dividend Policy
We intend to distribute substantially all of our free cash flow (distributions from NCM LLC less income taxes and payments under the tax receivable agreement with the founding members) in the form of dividends to our stockholders. The declaration, payment, timing and amount of any future dividends payable will be at the sole discretion of our Board of Directors who will take into account general economic and advertising market business conditions, our financial condition, our available cash, our current and anticipated cash needs, including opportunities to reinvest in the business and any other factors that the Board of Directors considers relevant. The Company intends to pay a regular quarterly dividend for the foreseeable future at the discretion of the Board of Directors consistent with the Company’s intention to distribute substantially all its free cash flow to stockholders through its quarterly dividend. Under Delaware law, dividends may be payable only out of surplus, which is our total assets minus total liabilities less the par value of our common stock, or, if we have no surplus, out of our net profits for the fiscal year in which the dividend is declared and/or the preceding fiscal year. For tax purposes, our dividends paid in 2018 and 2019 were treated as a return of capital to stockholders.
Unregistered Sales of Equity Securities and Use of Proceeds
NCM, Inc.’s Amended and Restated Certificate of Incorporation and the Third Amended and Restated Limited Liability Company Operating Agreement, as amended, of NCM LLC provide a redemption right to the NCM LLC members to exchange common membership units of NCM LLC for shares of NCM, Inc.’s common stock on a one-for-one basis, or at NCM, Inc.’s option, a cash payment equal to the market price of one share of NCM, Inc.’s common stock.
31
On October 10, 2019, NCM LLC received a Notice of Redemption from AMC, relating to the redemption and exchange of 197,118 units for 197,118 shares of NCM, Inc. common stock. In connection with delivering the Notice of Redemption, AMC surrendered common membership units to NCM LLC for cancellation and NCM, Inc. contributed shares of its common stock to NCM LLC in exchange for an amount of newly issued common units equal to the number of units surrendered by AMC. NCM LLC distributed the shares of NCM, Inc.’s common stock to AMC to complete the redemption on October 24, 2019. The issuance of shares in this redemption was exempt from registration as the transaction by NCM, Inc. did not involve a public offering.
Issuer Purchases of Equity Securities
The table below provides information about shares delivered to the Company from restricted stock held by Company employees upon vesting for the purpose of funding the recipient’s tax withholding obligations.
|
Period
|
(a)
Total Number
of Shares
Purchased
|
(b)
Average Price
Paid Per Share
|
(c)
Total Number
of Shares
Purchased as
Part of Publicly
Announced
Plans or
Programs
|
(d)
Maximum
Number (or
Approximate
Dollar Value)
of Shares that
may yet be
Purchased under
the Plans or
Programs
|
||||||||
|
September 26, 2019 through October 24, 2019
|
1,038
|
|
$
|
8.53
|
|
—
|
|
N/A
|
||||
|
October 25, 2019 through November 28, 2019
|
653
|
|
$
|
8.45
|
|
—
|
|
N/A
|
||||
|
November 29, 2019 through December 26, 2019
|
733
|
|
$
|
6.71
|
|
—
|
|
N/A
|
||||
|
Item 6.
|
Selected Financial Data
|
Selected Historical Financial and Operating Data
The following table sets forth our historical selected financial and operating data for the periods indicated. The selected financial and operating data should be read in conjunction with the other information contained in this document, including “Business,” “Management’s Discussion and Analysis of Financial Condition and Results of Operations”, the audited historical Consolidated Financial Statements and the notes thereto included elsewhere in this document, and historical audited Consolidated Financial Statements, which have not been included in this document.
The results of operations data for the years ended
December 26, 2019
,
December 27, 2018
and
December 28, 2017
and the balance sheet data as of
December 26, 2019
and
December 27, 2018
are derived from the audited Consolidated Financial Statements of NCM, Inc. included elsewhere in this document. The results of operations data for the years ended
December 29, 2016
and
December 31, 2015
and the balance sheet data as of
December 28, 2017
,
December 29, 2016
and
December 31, 2015
are derived from the audited Consolidated Financial Statements of NCM, Inc. that are not included in this document.
32
|
Results of Operations Data
|
Years Ended
|
||||||||||||||||||
|
($ in millions, except per share data)
|
Dec. 26,
2019 |
Dec. 27,
2018 |
Dec. 28,
2017 |
Dec. 29,
2016 |
Dec. 31,
2015 |
||||||||||||||
|
Revenue
|
$
|
444.8
|
|
$
|
441.4
|
|
$
|
426.1
|
|
$
|
447.6
|
|
$
|
446.5
|
|
||||
|
OPERATING EXPENSES:
|
|||||||||||||||||||
|
Advertising operating costs
|
38.3
|
|
37.4
|
|
32.4
|
|
30.0
|
|
30.8
|
|
|||||||||
|
Network costs
|
13.5
|
|
13.3
|
|
15.8
|
|
17.1
|
|
17.8
|
|
|||||||||
|
Theater access fees and revenue share—founding members
|
82.7
|
|
81.7
|
|
76.5
|
|
75.1
|
|
72.5
|
|
|||||||||
|
Selling and marketing costs
|
64.9
|
|
66.5
|
|
72.0
|
|
72.8
|
|
72.3
|
|
|||||||||
|
Merger termination fee and related merger costs
|
—
|
|
—
|
|
—
|
|
—
|
|
34.3
|
|
|||||||||
|
Administrative and other costs
|
43.8
|
|
48.3
|
|
37.9
|
|
43.8
|
|
38.6
|
|
|||||||||
|
Depreciation expense
|
13.6
|
|
12.6
|
|
11.0
|
|
8.8
|
|
9.6
|
|
|||||||||
|
Amortization expense
(1)
|
—
|
|
27.3
|
|
26.6
|
|
27.0
|
|
22.6
|
|
|||||||||
|
Amortization of intangibles recorded for network theater screen leases
(1)
|
26.7
|
|
—
|
|
—
|
|
—
|
|
—
|
|
|||||||||
|
Total
|
283.5
|
|
287.1
|
|
272.2
|
|
274.6
|
|
298.5
|
|
|||||||||
|
OPERATING INCOME
|
161.3
|
|
154.3
|
|
153.9
|
|
173.0
|
|
148.0
|
|
|||||||||
|
NON-OPERATING EXPENSES (INCOME)
|
62.2
|
|
50.6
|
|
(140.9
|
)
|
64.1
|
|
47.9
|
|
|||||||||
|
INCOME BEFORE INCOME TAXES
|
99.1
|
|
103.7
|
|
294.8
|
|
108.9
|
|
100.1
|
|
|||||||||
|
Provision for income taxes
|
12.4
|
|
23.5
|
|
180.3
|
|
14.4
|
|
27.9
|
|
|||||||||
|
CONSOLIDATED NET INCOME
|
86.7
|
|
80.2
|
|
114.5
|
|
94.5
|
|
72.2
|
|
|||||||||
|
Less: Net income attributable to noncontrolling
interests
|
50.6
|
|
50.4
|
|
56.2
|
|
61.6
|
|
48.3
|
|
|||||||||
|
NET INCOME ATTRIBUTABLE TO NCM, Inc.
|
$
|
36.1
|
|
$
|
29.8
|
|
$
|
58.3
|
|
$
|
32.9
|
|
$
|
23.9
|
|
||||
|
EARNINGS PER NCM, INC. COMMON SHARE:
|
|||||||||||||||||||
|
Basic
|
$
|
0.47
|
|
$
|
0.39
|
|
$
|
0.89
|
|
$
|
0.55
|
|
$
|
0.41
|
|
||||
|
Diluted
|
$
|
0.46
|
|
$
|
0.37
|
|
$
|
0.48
|
|
$
|
0.54
|
|
$
|
0.35
|
|
||||
|
|
As of
|
||||||||||||||||||
|
Balance Sheet Data (in millions)
|
Dec. 26,
2019 |
Dec. 27,
2018 |
Dec. 28,
2017 |
Dec. 29,
2016 |
Dec. 31,
2015 |
||||||||||||||
|
Cash, cash equivalents and marketable securities
(2)
|
$
|
80.9
|
|
$
|
75.6
|
|
$
|
59.5
|
|
$
|
68.7
|
|
$
|
85.4
|
|
||||
|
Receivables, net
|
170.8
|
|
149.9
|
|
160.6
|
|
160.5
|
|
148.9
|
|
|||||||||
|
Property and equipment, net
|
33.2
|
|
33.6
|
|
30.7
|
|
29.6
|
|
25.1
|
|
|||||||||
|
Total assets
(3)
|
1,130.0
|
|
1,141.8
|
|
1,173.1
|
|
1,215.5
|
|
1,238.2
|
|
|||||||||
|
Borrowings, gross
|
935.6
|
|
931.4
|
|
932.0
|
|
935.0
|
|
936.0
|
|
|||||||||
|
Payable to founding members under tax receivable
agreement
|
198.0
|
|
211.1
|
|
232.2
|
|
419.1
|
|
439.3
|
|
|||||||||
|
Equity/(deficit)
|
(121.2
|
)
|
(89.2
|
)
|
(74.8
|
)
|
(232.2
|
)
|
(229.9
|
)
|
|||||||||
|
Total liabilities and equity
(3)
|
1,130.0
|
|
1,141.8
|
|
1,173.1
|
|
1,215.5
|
|
1,238.2
|
|
|||||||||
33
|
Other Financial and Operating Data
|
Years Ended
|
||||||||||||||||||
|
(in millions, except cash dividend declared per common share and screen data)
|
Dec. 26,
2019 |
Dec. 27,
2018 |
Dec. 28,
2017 |
Dec. 29,
2016 |
Dec. 31,
2015 |
||||||||||||||
|
Adjusted OIBDA
(4)
|
$
|
207.5
|
|
$
|
205.4
|
|
$
|
205.1
|
|
$
|
230.7
|
|
$
|
229.9
|
|
||||
|
Adjusted OIBDA margin
(4)
|
46.7
|
%
|
46.5
|
%
|
48.1
|
%
|
51.5
|
%
|
51.5
|
%
|
|||||||||
|
Capital expenditures
|
$
|
15.3
|
|
$
|
15.4
|
|
$
|
12.3
|
|
$
|
13.3
|
|
$
|
13.0
|
|
||||
|
Cash dividend declared per common share
|
$
|
0.68
|
|
$
|
0.68
|
|
$
|
0.88
|
|
$
|
0.88
|
|
$
|
0.88
|
|
||||
|
Founding member screens at period end
(5) (9)
|
16,880
|
|
16,768
|
|
16,808
|
|
17,022
|
|
16,981
|
|
|||||||||
|
Total screens at period end
(6) (9)
|
21,208
|
|
21,172
|
|
20,850
|
|
20,548
|
|
20,361
|
|
|||||||||
|
DCN screens at period end
(7) (9)
|
20,770
|
|
20,741
|
|
20,419
|
|
20,080
|
|
19,760
|
|
|||||||||
|
Total attendance for period
(8) (9)
|
651.4
|
|
705.1
|
|
655.8
|
|
688.8
|
|
694.7
|
|
|||||||||
Notes to the Selected Historical Financial and Operating Data
|
(1)
|
Following the adoption of ASC 842, as discussed within Note 1 to the audited Consolidated Financial Statements included elsewhere in this document, amortization of the ESA and affiliate intangible balances is considered a form of lease expense and has been reclassified to this account as of the adoption date, December 28, 2018. The Company adopted ASC 842 prospectively and thus, prior period balances remain within amortization expense.
|
|
(2)
|
Includes short-term and long-term marketable securities.
|
|
(3)
|
During the first quarter of 2016, the Company adopted Accounting Standards Update 2015-03, Interest – Imputation of Interest (Subtopic 835-30): Simplifying the Presentation of Debt Issuance Costs (“ASU 2015-03”) and Accounting Standards Update 2015-15, Interest – Imputation of Interest (“ASU 2015-15”), on a retrospective basis, which provide guidance for simplifying the presentation of debt issuance costs. In connection with the adoption of ASU 2015-03 and ASU 2015-15, the Company reclassified net deferred financing costs related to NCM LLC’s term loans, secured and unsecured notes in the Consolidated Balance Sheet as a direct deduction from the carrying amount of those borrowings, while net deferred financing costs related to the revolving credit facility remained an asset in the Consolidated Balance Sheet. The amounts presented above for total assets and total liabilities and equity reflect this reclassification as of
December 26, 2019
,
December 27, 2018
,
December 28, 2017
and
December 29, 2016
. Amounts presented as of
December 31, 2015
do not reflect the reclassification. If adjusted, the reclassification for ASU 2015-03 and ASU 2015-15 would reduce both total assets and total liabilities and equity shown above by $12.7 million as of
December 31, 2015
.
|
|
(4)
|
Adjusted OIBDA and Adjusted OIBDA margin are not financial measures calculated in accordance with GAAP in the United States. Adjusted OIBDA represents operating income before depreciation and amortization expense adjusted to also exclude amortization of intangibles recorded for network theater screen leases, non-cash share based compensation costs, the merger termination fee and related merger costs, early lease termination expense and Chief Executive Officer transition costs. Adjusted OIBDA margin is calculated by dividing Adjusted OIBDA by total revenue. Our management uses these non-GAAP financial measures to evaluate operating performance, to forecast future results and as a basis for compensation. The Company believes these are important supplemental measures of operating performance because they eliminate items that have less bearing on its operating performance and highlight trends in its core business that may not otherwise be apparent when relying solely on GAAP financial measures. The Company believes the presentation of these measures is relevant and useful for investors because it enables them to view performance in a manner similar to the method used by the Company’s management, helps improve their ability to understand the Company’s operating performance and makes it easier to compare the Company’s results with other companies that may have different depreciation and amortization policies, amounts of amortization of intangibles recorded for network theater screen leases, non-cash share based compensation programs, levels of mergers and acquisitions, CEO turnover, early lease termination expense, interest rates, debt levels or income tax rates. A limitation of these measures, however, is that they exclude depreciation and amortization, which represent a proxy for the periodic costs of certain capitalized tangible and intangible assets used in generating revenues in the Company’s business. In addition, Adjusted OIBDA has the limitation of not reflecting the effect of the Company’s amortization of intangibles recorded for network theater screen leases, share-based payment costs, costs associated with the terminated merger with Screenvision, LLC (“Screenvision”), costs associated with the resignation of the Company’s former Chief Executive Officers, or early lease termination expense. Adjusted OIBDA should not be regarded as an alternative to operating income, net income or as indicators of operating performance, nor should they be considered in isolation of, or as substitutes for financial measures prepared in accordance with GAAP. The Company believes that operating income is the most directly comparable GAAP financial measure to Adjusted OIBDA. Because not all companies use identical calculations, these non-GAAP presentations may not be comparable to other similarly titled measures of other companies, or calculations in the Company’s debt agreement.
|
34
Adjusted OIBDA does not reflect integration and other encumbered theater payments as they are recorded as a reduction to intangible assets. Integration payments and other encumbered theater payments received are added to Adjusted OIBDA to determine our compliance with financial covenants under our senior secured credit facility and included in available cash distributions to NCM LLC’s founding members. During the years ended
December 26, 2019
,
December 27, 2018
,
December 28, 2017
,
December 29, 2016
and
December 31, 2015
, the Company recorded integration and other encumbered theater payments of $22.3 million, $21.4 million, $20.9 million, $2.6 million and $2.7 million, respectively, from NCM LLC’s founding members.
|
(5)
|
Represents the total number of screens within NCM LLC’s advertising network operated by NCM LLC’s founding members.
|
|
(6)
|
Represents the total screens within NCM LLC’s advertising network.
|
|
(7)
|
Represents the total number of screens that are connected to the DCN.
|
|
(8)
|
Represents the total attendance within NCM LLC’s advertising network as provided by our founding members and affiliate partners.
|
|
(9)
|
Excludes screens and attendance associated with certain AMC Rave, AMC Carmike Cinemas, Inc. (“Carmike”) and Cinemark Rave theaters for all periods presented. Refer to Note 5 to the audited Consolidated Financial Statements included elsewhere in this document.
|
The following table reconciles operating income to Adjusted OIBDA for the periods presented (dollars in millions):
|
|
Years Ended
|
||||||||||||||||||
|
|
Dec. 26,
2019 |
Dec. 27,
2018 |
Dec. 28,
2017 |
Dec. 29,
2016 |
Dec. 31,
2015 |
||||||||||||||
|
Operating income
|
$
|
161.3
|
|
$
|
154.3
|
|
$
|
153.9
|
|
$
|
173.0
|
|
$
|
148.0
|
|
||||
|
Depreciation expense
|
13.6
|
|
12.6
|
|
11.0
|
|
8.8
|
|
9.6
|
|
|||||||||
|
Amortization expense
(1)
|
—
|
|
27.3
|
|
26.6
|
|
27.0
|
|
22.6
|
|
|||||||||
|
Amortization of intangibles recorded for network theater screen leases
(1)
|
26.7
|
|
—
|
|
—
|
|
—
|
|
—
|
|
|||||||||
|
Share-based compensation costs
(2)
|
5.5
|
|
7.8
|
|
11.2
|
|
18.3
|
|
14.8
|
|
|||||||||
|
Merger-related administrative costs
(3)
|
—
|
|
—
|
|
—
|
|
—
|
|
34.3
|
|
|||||||||
|
CEO transition costs
|
0.4
|
|
3.4
|
|
0.6
|
|
3.6
|
|
0.6
|
|
|||||||||
|
Early lease termination expense
(4)
|
—
|
|
—
|
|
1.8
|
|
—
|
|
—
|
|
|||||||||
|
Adjusted OIBDA
|
$
|
207.5
|
|
$
|
205.4
|
|
$
|
205.1
|
|
$
|
230.7
|
|
$
|
229.9
|
|
||||
|
Total revenue
|
$
|
444.8
|
|
$
|
441.4
|
|
$
|
426.1
|
|
$
|
447.6
|
|
$
|
446.5
|
|
||||
|
Adjusted OIBDA margin
|
46.7
|
%
|
46.5
|
%
|
48.1
|
%
|
51.5
|
%
|
51.5
|
%
|
|||||||||
|
(1)
|
Following the adoption of ASC 842, as discussed within Note 1 to the audited Consolidated Financial Statements included elsewhere in this document, amortization of the ESA and affiliate intangible balances is considered a form of lease expense and has been reclassified to this account as of the adoption date, December 28, 2018. The Company adopted ASC 842 prospectively and thus, prior period balances remain within amortization expense.
|
|
(2)
|
Share-based payments costs are included in network operations, selling and marketing and administrative expense in the accompanying audited Consolidated Financial Statements.
|
|
(3)
|
Merger termination fee and related merger costs primarily include the merger termination payment and legal, accounting, advisory and other professional fees associated with the terminated merger with Screenvision.
|
|
(4)
|
Early lease termination expense represents an expense recorded upon the early termination of the lease of our corporate headquarters because the early termination payment made by the Company was reimbursed by the landlord of the new building.
|
35
|
Item 7.
|
Management’s Discussion and Analysis of Financial Condition and Results of Operations
|
As discussed in Part 1, some of the information in this Annual Report on Form 10-K includes “forward-looking statements” within the meaning of Section 27A of the Securities Act of 1933, as amended, and Section 21E of the Securities Exchange Act of 1934 (the “Exchange Act”), as amended. All statements other than statements of historical facts included in this Form 10-K, including, without limitation, certain statements under “Management’s Discussion and Analysis of Financial Condition and Results of Operations”, may constitute forward-looking statements. In some cases, you can identify these “forward-looking statements” by the specific words, including but not limited to “may,” “should,” “expects,” “plans,” “anticipates,” “believes,” “estimates,” “predicts,” “potential” or “continue” or the negative of those words and other comparable words. These forward-looking statements involve risks and uncertainties. The following discussion and analysis should be read in conjunction with our historical financial statements and the related notes thereto included elsewhere in this document. In the following discussion and analysis, the term net income refers to net income attributable to NCM, Inc.
This section of this Form 10-K generally discusses fiscal 2019 and fiscal 2018 items and year-to-year comparisons between fiscal 2019 and fiscal 2018. Discussions of fiscal 2017 items and year-to-year comparisons between fiscal 2018 and fiscal 2017 that are not included in this Form 10-K can be found in “Management’s Discussion and Analysis of Financial Condition and Results of Operations” in Part II, Item 7 of the Company’s Annual Report on Form 10-K for the fiscal year ended December 27, 2018.
Overview
We are America’s Movie Network. As the largest cinema advertising network in North America, we unite brands with the power of movies and engage movie fans anytime and anywhere. We currently derive revenue principally from the sale of advertising to national, regional and local businesses in
Noovie
, our cinema advertising and entertainment pre-show seen on movie screens across the U.S., as well as on our LEN, a series of strategically-placed screens located in movie theater lobbies, and other forms of advertising and promotions in theater lobbies. We also sell digital online and mobile advertising through our
Cinema Accelerator
product and across our suite of
Noovie
digital properties, including
Noovie.com, Noovie Shuffle, Name That Movie, Noovie Arcade,
and
Fantasy Movie League
, in order to reach entertainment audiences beyond the theater.
As of
December 26, 2019
, approximately 4.0 million moviegoers have downloaded our mobile apps. These downloads and the acquisition of second party data have resulted in first and second party data sets of over 106 million as of December 26, 2019. We have long-term ESAs (approximately
19.8
weighted average years based on attendance remaining as of
December 26, 2019
) with the founding members and multi-year agreements with network affiliates, which expire at various dates between
March 15, 2020
and
July 22, 2031
. The weighted average remaining term (based on attendance) of the ESAs and the network affiliate agreements is
17.1
years as of
December 26, 2019
. The ESAs and network affiliate agreements grant NCM LLC exclusive rights in their theaters to sell advertising, subject to limited exceptions. Our
Noovie
pre-show and LEN programming are distributed predominantly via satellite through our proprietary DCN. Approximately
98%
of the aggregate founding member and network affiliate theater attendance is generated by theaters connected to our DCN (the remaining screens receive advertisements on USB drives) and 100% of the
Noovie
pre-show is projected on digital projectors (
95%
digital cinema projectors and
5%
LCD projectors).
Management focuses on several measurements that we believe provide us with the necessary ratios and key performance indicators to manage our business, determine how we are performing versus our internal goals and targets, and against the performance of our competitors and other benchmarks in the marketplace in which we operate. We focus on many operating metrics including changes in revenue, Adjusted OIBDA and Adjusted OIBDA margin, as defined and discussed in “Notes to the Selected Historical Financial and Operating Data” above, as some of our primary measurement metrics. In addition, we monitor our monthly advertising performance measurements, including advertising inventory utilization, national and regional advertising pricing (CPM), local advertising rate per screen per week, national and local and regional and total advertising revenue per attendee. We also monitor free cash flow, the dividend coverage ratio, financial leverage ratio (net debt divided by Adjusted OIBDA plus integration payments and other encumbered theater payments), cash balances and revolving credit facility availability to ensure financial debt covenant compliance and that there is adequate cash availability to fund our working capital needs and debt obligations and current and future dividends declared by our Board of Directors.
Summary Historical and Operating Data
You should read this information in conjunction with the other information contained in this document, and our audited historical financial statements and the notes thereto included elsewhere in this document.
Our Operating Data
—The following table presents operating data and Adjusted OIBDA (dollars in millions, except share and margin data). Refer to “Item 6. Selected Financial Data—Notes to the Selected Historical Financial and Operating Data” for a discussion of the calculation of Adjusted OIBDA and reconciliation to operating income.
36
|
|
Years Ended
|
% Change
|
||||||||
|
($ in millions)
|
Dec. 26,
2019 |
Dec. 27,
2018 |
2018 to 2019
|
|||||||
|
Revenue
|
$
|
444.8
|
|
$
|
441.4
|
|
0.8
|
%
|
||
|
Operating expenses:
|
||||||||||
|
Advertising
|
177.8
|
|
181.3
|
|
(1.9
|
)%
|
||||
|
Network, administrative and unallocated costs
|
105.7
|
|
105.8
|
|
(0.1
|
)%
|
||||
|
Total operating expenses
|
283.5
|
|
287.1
|
|
(1.3
|
)%
|
||||
|
Operating income
|
161.3
|
|
154.3
|
|
4.5
|
%
|
||||
|
Non-operating expenses
|
62.2
|
|
50.6
|
|
22.9
|
%
|
||||
|
Income tax expense
|
12.4
|
|
23.5
|
|
(47.2
|
)%
|
||||
|
Net income attributable to noncontrolling interests
|
50.6
|
|
50.4
|
|
0.4
|
%
|
||||
|
Net income attributable to NCM, Inc.
|
$
|
36.1
|
|
$
|
29.8
|
|
21.1
|
%
|
||
|
Net income per NCM, Inc. basic share
|
$
|
0.47
|
|
$
|
0.39
|
|
20.5
|
%
|
||
|
Net income per NCM, Inc. diluted share
|
$
|
0.46
|
|
$
|
0.37
|
|
24.3
|
%
|
||
|
Adjusted OIBDA
|
$
|
207.5
|
|
$
|
205.4
|
|
1.0
|
%
|
||
|
Adjusted OIBDA margin
|
46.7
|
%
|
46.5
|
%
|
0.2
|
%
|
||||
|
Total theater attendance (in millions)
(1)
|
651.4
|
|
705.1
|
|
(7.6
|
)%
|
||||
|
(1)
|
Represents the total attendance within NCM LLC’s advertising network, excluding screens and attendance associated with certain AMC Rave, AMC Carmike and Cinemark Rave theaters that are currently part of another cinema advertising network for all periods presented. Refer to Note 5 to the audited Consolidated Financial Statements included elsewhere in this document.
|
Our Network
—The net screens added to our network by the founding members and network affiliates during
2019
were as follows.
|
|
Number of screens
|
|||||||
|
|
Founding Members
|
Network Affiliates
|
Total
|
|||||
|
Balance as of December 27, 2018
|
16,768
|
|
4,404
|
|
21,172
|
|
||
|
Lost affiliates, net of new affiliates
(1)
|
—
|
|
(246
|
)
|
(246
|
)
|
||
|
Openings, net of closures
|
112
|
|
170
|
|
282
|
|
||
|
Balance as of December 26, 2019
|
16,880
|
|
4,328
|
|
21,208
|
|
||
|
(1)
|
Represents the loss of three of our affiliates that did not renew their contracts resulting in a reduction of 250 affiliate screens to our network, offset by the addition of one new affiliate which added 4 new screens to our network during the year ended December 26, 2019.
|
We believe that adding screens and attendees to our network will provide our advertising clients with a better marketing product with increased reach and improved geographic coverage. We also believe that the continued growth of our market coverage could strengthen our selling proposition and competitive positioning against other national, regional and local video advertising platforms, including television, online and mobile video platforms and other out of home video advertising platforms.
Basis of Presentation
Prior to the completion of the IPO, NCM LLC was wholly-owned by its founding members. In connection with the offering, NCM, Inc. purchased newly issued common membership units from NCM LLC and common membership units from NCM LLC’s founding members and became a member of and the sole manager of NCM LLC. We entered into several
37
agreements to effect the reorganization and the financing transaction and certain amendments were made to the existing ESAs to govern the relationships among NCM LLC and NCM LLC’s founding members after the completion of these transactions.
The results of operations data discussed herein were derived from the audited Consolidated Financial Statements and accounting records of NCM, Inc. and should be read in conjunction with the notes thereto.
We have a 52-week or 53-week fiscal year ending on the first Thursday after December 25. Fiscal years
2017
,
2018
and
2019
contained 52 weeks. Our 2020 fiscal year will contain 53 weeks. Throughout this document, we refer to our fiscal years as set forth below:
|
|
|
Reference in
|
|
Fiscal Year Ended
|
|
this Document
|
|
December 26, 2019
|
|
2019
|
|
December 27, 2018
|
|
2018
|
|
December 28, 2017
|
|
2017
|
Results of Operations
Fiscal Years
2019
and
2018
Revenue
. Total revenue increased
$
3.4
million, or
0.8%
, from $
441.4
million for
2018
to $
444.8
million for
2019
. The following is a summary of revenue by category (in millions):
|
|
Fiscal Year
|
$ Change
|
% Change
|
|||||||||||
|
|
2019
|
2018
|
2018 to 2019
|
2018 to 2019
|
||||||||||
|
National advertising revenue
|
$
|
324.2
|
|
$
|
312.0
|
|
$
|
12.2
|
|
3.9
|
%
|
|||
|
Local advertising revenue
|
66.9
|
|
70.7
|
|
(3.8
|
)
|
(5.4
|
)%
|
||||||
|
Regional advertising revenue
|
24.7
|
|
27.3
|
|
(2.6
|
)
|
(9.5
|
)%
|
||||||
|
Founding member advertising revenue from beverage
concessionaire agreements
|
29.0
|
|
31.4
|
|
(2.4
|
)
|
(7.6
|
)%
|
||||||
|
Total revenue
|
$
|
444.8
|
|
$
|
441.4
|
|
$
|
3.4
|
|
0.8
|
%
|
|||
The following table shows data on revenue per attendee for
2019
and
2018
:
|
|
Fiscal Year
|
% Change
|
||||||||
|
|
2019
|
2018
|
2018 to 2019
|
|||||||
|
National advertising revenue per attendee
|
$
|
0.498
|
|
$
|
0.442
|
|
12.5
|
%
|
||
|
Local advertising revenue per attendee
|
$
|
0.103
|
|
$
|
0.100
|
|
2.4
|
%
|
||
|
Regional advertising revenue per attendee
|
$
|
0.038
|
|
$
|
0.039
|
|
(2.1
|
)%
|
||
|
Total advertising revenue (excluding founding member
beverage revenue) per attendee
|
$
|
0.638
|
|
$
|
0.581
|
|
9.8
|
%
|
||
|
Total advertising revenue per attendee
|
$
|
0.683
|
|
$
|
0.626
|
|
9.1
|
%
|
||
|
Total theater attendance (in millions)
(1)
|
651.4
|
|
705.1
|
|
(7.6
|
)%
|
||||
|
(1)
|
Represents the total attendance within NCM LLC’s advertising network, excluding screens and attendance associated with certain AMC Rave, AMC Carmike and Cinemark Rave theaters for certain periods presented. Refer to Note 5 to the audited Consolidated Financial Statements included elsewhere in this document.
|
National advertising revenue.
The $12.2 million, or 3.9%, increase in national advertising revenue (excluding beverage revenue from the founding members) was due primarily to a $16.2 million increase in Platinum Spot and branded content segment revenue in 2019, as compared to 2018. The increase was also due to an increase in national advertising utilization from 113.5% in 2018 to 125.9% in 2019, despite a 7.6% decrease in network attendance. Inventory utilization is calculated as utilized impressions divided by total advertising impressions, which is based on eleven 30-second salable national advertising units in our
Noovie
pre-show, which can be expanded, should market demand
38
dictate. These increases were partially offset by a 3.2% decrease in national advertising CPMs (excluding beverage and Platinum Spot CPMs) driven by a change in the mix of customers with a higher proportion of upfront clients and less scatter market clients in 2019, as compared to 2018. The scatter market represents inventory not included within an upfront or content partner commitment sold closer to the advertisement air date for typically higher CPMs.
Local advertising revenue.
The $3.8 million, or 5.4%, decrease in local advertising revenue was primarily due to a 10.5% decrease in the volume of contracts. This decrease was partially offset by an increase in local digital sales revenue driven primarily by an increase in the average digital contract value in 2019, compared to 2018.
Regional advertising revenue.
The $2.6 million, or 9.5%, decrease in regional advertising revenue was primarily due to the shift of a handful of larger clients from regional advertising to national advertising and a reduction in spend of a few large customers in 2019, compared to 2018. These decreases were partially offset by a significant increase in the volume of contracts and an increase in regional digital sales revenue in 2019, compared to 2018.
Founding member beverage revenue.
The $2.4 million, or 7.6%, decrease in national advertising revenue from founding members' beverage concessionaire agreements was primarily due to a 7.1% decrease in founding member attendance, partially offset by a 0.7% increase in beverage revenue CPMs in 2019, compared to 2018. The 2019 beverage revenue CPM is based on the change in CPM during segment one of our pre-show from 2017 to 2018, which increased 0.7%.
Operating expenses.
Total operating expenses decreased $
3.6
million, or
1.3%
, from $
287.1
million for
2018
to $
283.5
million for
2019
. The following table shows the changes in
operating expense for 2019 and 2018 (in millions):
|
|
Fiscal Year
|
$ Change
|
% Change
|
|||||||||||
|
|
2019
|
2018
|
2018 to 2019
|
2018 to 2019
|
||||||||||
|
Advertising operating costs
|
$
|
38.3
|
|
$
|
37.4
|
|
$
|
0.9
|
|
2.4
|
%
|
|||
|
Network costs
|
13.5
|
|
13.3
|
|
0.2
|
|
1.5
|
%
|
||||||
|
Theater access fees and revenue share—founding members
|
82.7
|
|
81.7
|
|
1.0
|
|
1.2
|
%
|
||||||
|
Selling and marketing costs
|
64.9
|
|
66.5
|
|
(1.6
|
)
|
(2.4
|
)%
|
||||||
|
Administrative and other costs
|
43.8
|
|
48.3
|
|
(4.5
|
)
|
(9.3
|
)%
|
||||||
|
Depreciation expense
|
13.6
|
|
12.6
|
|
1.0
|
|
7.9
|
%
|
||||||
|
Amortization expense
|
—
|
|
27.3
|
|
(27.3
|
)
|
(100.0
|
)%
|
||||||
|
Amortization of intangibles recorded for network theater screen leases
|
26.7
|
|
—
|
|
26.7
|
|
100.0
|
%
|
||||||
|
Total operating expenses
|
$
|
283.5
|
|
$
|
287.1
|
|
$
|
(3.6
|
)
|
(1.3
|
)%
|
|||
Advertising operating costs
.
Advertising operating costs increased $0.9 million, or 2.4%, from $37.4 million in 2018 to $38.3 million in 2019. The increase was due to a $0.4 million increase in production costs associated with content produced for national advertisers and a $0.3 million increase in personnel related expenses related to a slight increase in headcount in advertising operations
.
Network costs.
Network costs increased $0.2 million, or 1.5%, from $13.3 million in 2018 to $13.5 million in 2019.
Theater access fees and revenue share—founding members.
Theater access fees and revenue share increased $1.0 million, or 1.2%, from $81.7 million in 2018 to $82.7 million in 2019. The increase was due to $2.5 million of payments to Cinemark and Regal as compensation for post-showtime and Platinum Spot advertising in accordance with the 2019 ESA Amendments and a $1.9 million increase in the expense associated with the founding member digital screens that are connected to the DCN (nearly 100% of our screens as of December 26, 2019), including higher quality digital cinema projectors and related equipment, due to the annual 5% rate increase specified in the ESAs. These increases were partially offset by a $3.4 million decrease in the expense associated with founding member attendance from a 7.1% decrease in attendance at founding members’ theaters.
Selling and marketing costs.
Selling and marketing costs decreased $1.6 million, or 2.4%, from $66.5 million in 2018 to $64.9 million in 2019. This decrease was primarily related to a $2.9 million decrease in non-cash barter expense related to a decrease in the volume of barter arrangements in 2019, compared to 2018, and a $2.8 million decrease in personnel related expenses. The decrease in personnel related expenses was driven by lower salaries and commissions due to a reduction in the local sales force in late 2018 and lower non-cash share-based compensation expense due to a decrease in the volume of awards granted in 2019, compared to 2018. These decreases were partially offset by 1) a $2.0 million non-cash impairment charge realized in 2019, compared to a $0.4 million impairment charge realized in 2018 related to
39
investments obtained in prior years in exchange for advertising services, 2) a $1.4 million increase in
Cinema Accelerator
expense
due in part to the increase in digital advertising sales and 3) a $1.1 million increase in Company advertising expense associated with promotions of our digital products on online and social media platforms in 2019, compared to 2018.
Administrative and other costs.
Administrative and other costs decreased $4.5 million, or 9.3%, from $48.3 million in the year ended 2018 to $43.8 million in the year ended 2019. Administrative and other costs decreased primarily due to 1) a $3.0 million decrease in CEO transition fees related to costs incurred in 2018 following the resignation of our former CEO, as well as costs related to the search to identify a permanent CEO, 2) a $1.9 million decrease in legal and professional services largely due to the absence of legal and professional fees incurred during the second quarter of 2018 related to the negotiation of the settlement agreement with a large shareholder, 3) a $1.6 million decrease in personnel related expenses primarily due to a $0.9 million decrease in compensation expense due to the absence of a CEO during a portion of 2019 and a $0.4 million increase in capitalized personnel costs driven by the nature of the work being performed by our information technology department in 2019, compared to 2018 and 4) a $0.3 million decrease in moving expenses incurred in 2018 associated with the move of our corporate headquarters. These decreases were partially offset by a $0.9 million increase in personnel related costs for our digital service offerings and a $0.5 million increase in consulting services.
Depreciation expense.
Depreciation expense increased $1.0 million, or 7.9%, from $12.6 million in 2018 to $13.6 million in 2019 primarily due to new fixed assets placed into service.
Amortization expense and Amortization of intangibles recorded for network theater screen leases.
Amortization of the ESA and affiliate intangibles was $26.7 million in 2019 down from $27.3 million in 2018. Following the adoption of ASC 842, as discussed within Note 1 to the audited Condensed Consolidated Financial Statements included elsewhere in this document, amortization of the ESA and affiliate intangible balances is considered a form of lease expense and has been reclassified from amortization expense to amortization of intangibles recorded for network theater screen leases as of the adoption date, December 28, 2018. The Company adopted ASC 842 prospectively and thus, prior period balances remain within amortization expense. The $0.6 million decrease was due to the four year extension of the contractual life of the intangible assets for Cinemark and Regal following the 2019 ESA Amendments during the third quarter of 2019.
Non-operating expense.
Total non-operating expenses increased $
11.6
million, or
22.9%
, from $
50.6
million in
2018
to $
62.2
million in
2019
. The following table shows the changes in non-operating expense for
2019
and
2018
(in millions)
|
|
Fiscal Year
|
$ Change
|
% Change
|
|||||||||||
|
|
2019
|
2018
|
2018 to 2019
|
2018 to 2019
|
||||||||||
|
Interest on borrowings
|
$
|
58.0
|
|
$
|
55.4
|
|
$
|
2.6
|
|
4.7
|
%
|
|||
|
Interest income
|
(2.1
|
)
|
(1.5
|
)
|
(0.6
|
)
|
40.0
|
%
|
||||||
|
Loss on early retirement of debt, net
|
5.6
|
|
0.7
|
|
4.9
|
|
NM
|
|
||||||
|
Loss (gain) on re-measurement of the payable to
founding members under the tax receivable
agreement
|
1.1
|
|
(3.8
|
)
|
4.9
|
|
NM
|
|
||||||
|
Other non-operating income
|
(0.4
|
)
|
(0.2
|
)
|
(0.2
|
)
|
(100.0
|
)%
|
||||||
|
Total non-operating expense
|
$
|
62.2
|
|
$
|
50.6
|
|
$
|
11.6
|
|
22.9
|
%
|
|||
NM = Not meaningful.
The increase in non-operating expense was due primarily to 1) a $1.1 million loss on the re-measurement of the payable to founding members under the tax receivable agreement for 2019 as compared to a $3.8 million gain on the re-measurement of the payable for 2018 due to a change in the deferred tax rate related to a change in state tax law regarding sales sourcing during 2018, 2) a $4.9 million increase in the loss on early retirement of our debt due to the $4.0 million premium paid to redeem our Notes due 2022 as well as the write off of the $1.9 million of associated debt issuance costs following the extinguishment of the notes in the fourth quarter of 2019, and 3) a $2.6 million increase in interest on borrowings due to a one month overlap between the issuance of the Notes due 2028 and the redemption of the Notes due 2022 where the Company incurred interest on both notes, a 0.1% increase in the weighted average interest rate for 2019, as compared to 2018, and an increase in the average debt outstanding on the Company's revolver during 2019 as compared to 2018.
Income tax expense.
Income tax expense decreased $11.1 million from
$23.5 million
for 2018 to
$12.4 million
for 2019. The decrease in income tax expense was primarily due to a decrease in deferred tax expense for the year ended December 26,
40
2019, compared to the year ended December 27, 2018 related to the Company's re-measurement of its deferred tax assets as a result of a 2018 state tax law change. The remaining decrease was primarily due to lower income before income taxes for the year ended December 26, 2019, compared to the year ended December 27, 2018.
Net income.
Net income increased $6.3 million from $29.8 million in 2018 to $36.1 million in 2019. The increase was due to an $11.1 million decrease in income tax expense and a $7.0 million increase in operating income related to higher revenue and lower operating expense, partially offset by an $11.6 million increase in non-operating expenses.
Known Trends and Uncertainties
Beverage Revenue
—Under the ESAs, up to 90 seconds of the
Noovie
pre-show program can be sold to the founding members to satisfy their on-screen advertising commitments under their beverage concessionaire agreements. For the years ended 2019 and 2018, two of the founding members purchased 60 seconds of on-screen advertising time and one founding member purchased 30 seconds to satisfy their obligations under their beverage concessionaire agreements. The founding members’ current long-term contracts with their beverage suppliers require the 30 or 60 seconds of beverage advertising, although such commitments could change in the future. Per the ESA with AMC, the time sold to the founding member beverage supplier is priced equal to the advertising CPM for the previous year charged by NCM LLC to unaffiliated third parties during segment one (closest to showtime) of the
Noovie
pre-show, limited to the highest advertising CPM being then-charged by NCM LLC, which in 2019 decreased 0.3%. Thus, the CPM on our beverage concessionaire revenue related to AMC in 2020 will decrease by 0.3% compared to 2019. Beginning in 2020 and in accordance with the 2019 ESA Amendments, the price for the time sold to Cinemark and Regal's beverage suppliers will instead increase at a fixed rate of 2.0% each year.
Theater Access Fees
—In consideration for NCM LLC’s access to the founding members’ theater attendees for on-screen advertising and use of lobbies and other space within the founding members’ theaters for the LEN and lobby promotions, the founding members receive a monthly theater access fee under the ESAs. The theater access fee is composed of a fixed payment per patron and a fixed payment per digital screen (connected to the DCN). The payment per theater patron increases by 8% every five years, with the next increase occurring in fiscal year 2022. Pursuant to the ESAs, the payment per digital screen increases annually by 5%. Pursuant to the 2019 ESA Amendments, Cinemark and Regal each receive an additional monthly theater access fee beginning November 1, 2019 in consideration for NCM LLC's access to certain on-screen advertising inventory after the advertised showtime of a feature film. These fees are also based upon a fixed payment per patron beginning at $0.025 per patron on November 1, 2019, (ii) $0.0375 per patron beginning on November 1, 2020, (iii) $0.05 per patron beginning on November 1, 2021, (iv) $0.052 per patron beginning on November 1, 2022 and (v) increasing 8% every five years beginning November 1, 2027.
Platinum Spot
—In consideration for the utilization of the theaters post-showtime for Platinum Spots, Cinemark and Regal are entitled to receive 25% of all revenue generated for the actual display of Platinum Spots in their applicable theaters, subject to a specified minimum. If NCM LLC runs advertising in more than one concurrent advertisers’ Platinum Spot for any portion of the network over a period of time, NCM LLC will be required to satisfy a minimum average CPM for that period of time.
Financial Condition and Liquidity
Liquidity
Our cash balances can fluctuate due to the seasonality of our business and related timing of collections of accounts receivable balances and operating expenditure payments, as well as, available cash payments (as defined in the NCM LLC Operating Agreement) to Cinemark and Regal, interest or principal payments on our term loan and the Notes due 2026 and Notes due 2028, income tax payments, TRA payments to the founding members and the amount of quarterly dividends to NCM, Inc.’s common stockholders.
A summary of our financial liquidity is as follows (in millions)
|
|
Years Ended
|
$ Change
|
|||||||||
|
|
December 26, 2019
|
December 27, 2018
|
2018 to
2019 |
||||||||
|
Cash, cash equivalents and marketable securities
(1)
|
$
|
80.9
|
|
$
|
75.6
|
|
$
|
5.3
|
|
||
|
Revolver availability
(2)
|
132.4
|
|
143.2
|
|
(10.8
|
)
|
|||||
|
Total liquidity
|
$
|
213.3
|
|
$
|
218.8
|
|
$
|
(5.5
|
)
|
||
|
(1)
|
Included in cash and cash equivalents as of
December 26, 2019
and
December 27, 2018
there was $11.4 million and $7.2 million, respectively, of cash held by NCM LLC which is not available to satisfy NCM, Inc.'s dividend payments and other NCM, Inc. obligations.
|
41
|
(2)
|
The revolving credit facility portion of NCM LLC’s total borrowings is available, subject to certain conditions, for general corporate purposes of NCM LLC in the ordinary course of business and for other transactions permitted under the senior secured credit facility, and a portion is available for letters of credit. NCM LLC’s total capacity under the revolving credit facility was $175.0 million less $3.6 million of outstanding letters of credit or $171.4 million as of
December 26, 2019
and $175.0 million less $4.8 million of outstanding letters of credit or $170.2 million, as of December 27, 2018.
|
We have generated and used cash as follows (in millions):
|
|
Years Ended
|
||||||
|
|
2019
|
2018
|
|||||
|
Operating cash flow
|
$
|
143.6
|
|
$
|
150.3
|
|
|
|
Investing cash flow
|
$
|
1.6
|
|
$
|
(16.1
|
)
|
|
|
Financing cash flow
|
$
|
(130.7
|
)
|
$
|
(123.0
|
)
|
|
Cash Flows – Fiscal Years
2019
and
2018
Operating Activities.
The $6.7 million decrease in cash provided by operating activities for 2019, compared to 2018 was due primarily to 1) a decrease in the change in accounts receivable of $31.6 million related to timing of collections in 2019, compared to 2018, 2) a $6.3 million decrease in deferred income tax expense net of the increase in the loss on re-measurement of the payable to founding members under the TRA due to a change in the deferred tax rate related to a change in state tax law regarding sales sourcing during 2018 and 3) a $2.3 million decrease in non-cash share-based compensation expense related to a decrease in the projected vesting of performance based awards and a lower volume of awards as of 2019, compared to 2018. These decreases were partially offset by 1) a $21.7 million increase in cash provided by operating activities due to the reclassification in the current period of founding member integration and other encumbered theater payments from cash flows from financing activities upon adoption of ASC 842, as further discussed within Note 1 to the audited Consolidated Financial Statements included elsewhere in this document, 2) a $6.5 million increase in consolidated net income and 3) a $4.9 million increase in the loss on early retirement of our debt due to the extinguishment of the Notes due 2022 in 2019.
Investing Activities.
The $17.7 million increase in cash provided by investing activities for 2019, compared to 2018 was due primarily to a decrease in purchases of marketable securities, net of proceeds, of $14.6 million and a $2.8 million increase in the proceeds from the notes receivable from the founding members in 2019, compared to 2018.
Financing Activities.
The $7.7 million increase in cash used in financing activities during 2019, compared to 2018, was due primarily to a $22.7 million decrease in cash inflows from financing activities due to the reclassification in the current period of founding member integration and other encumbered theater payments to cash flows from operating activities upon adoption of ASC 842, as further discussed within Note 1 to the audited Consolidated Financial Statements included elsewhere in this document. This increase in cash used was partially offset by a $10.2 million decrease in distributions to founding members, period over period, a decrease of $2.3 million in the payment of debt issuance costs, a $1.1 million decrease in restricted stock tax withholdings, and a $0.8 million decrease in dividend payments in 2019, as compared to 2018.
Sources of Capital and Capital Requirements
NCM, Inc.’s primary source of liquidity and capital resources is the quarterly available cash distributions from NCM LLC as well as its existing cash balances and marketable securities, which as of
December 26, 2019
were $69.5 million (excluding $11.4 million of cash held by NCM LLC). NCM LLC’s primary sources of liquidity and capital resources are its cash provided by operating activities, availability under its revolving credit facility and cash on hand. Refer to Note 10 to the audited Consolidated Financial Statements included elsewhere in this document and “Financings” below for a detailed discussion of the debt transactions in 2018 and 2019 and the debt outstanding as of
December 26, 2019
.
Management believes that future funds generated from NCM LLC’s operations and cash on hand and availability under the revolving credit facility should be sufficient to fund working capital requirements, NCM LLC’s debt service requirements, and capital expenditures, through the next twelve months. Cash flows generated by NCM LLC’s distributions to NCM, Inc. and the founding members can be impacted by the seasonality of advertising sales, interest on borrowings under our revolving credit agreement and to a lesser extent theater attendance. NCM LLC is required pursuant to the terms of the NCM LLC Operating Agreement to distribute its available cash, as defined in the operating agreement, quarterly to its members (Regal, Cinemark and NCM, Inc.). The available cash distribution to the members of NCM LLC for 2019 was approximately $148.9 million, of which approximately $72.5 million was distributed to NCM, Inc. NCM, Inc. expects to use cash received from future available cash distributions and its cash balances to fund payments associated with the TRA with the founding members and current and future dividends as declared by the Board of Directors, including a dividend declared on February 20, 2020 of $0.19 per share (approximately $14.8 million) on each share of the Company’s common stock (not including outstanding restricted stock) to stockholders of record on March 3, 2020 to be paid on March 17, 2020. The Company will also consider
42
opportunistically using cash received for partial repayments of NCM LLC's outstanding debt balance, while ensuring the Company's financial flexibility is maintained. Distributions from NCM LLC and NCM, Inc. cash balances should be sufficient to fund payments associated with the TRA with the founding members, income taxes and its regular dividend for the foreseeable future at the discretion of the Board of Directors. The declaration, payment, timing and amount of any future dividends payable will be at the sole discretion of the Board of Directors who will take into account general economic and advertising market business conditions, the Company’s financial condition, available cash, current and anticipated cash needs, including opportunities to reinvest in the business and any other factors that the Board of Directors considers relevant. The Company intends to pay a regular quarterly dividend for the foreseeable future at the discretion of the Board of Directors consistent with the Company’s intention to distribute substantially all its free cash flow to stockholders through its quarterly dividend.
Capital Expenditures
Capital expenditures of NCM LLC include digital applications being developed primarily by our programmers and outside consultants, capitalized software development or upgrades for our Digital Content Software and advertising proposal and inventory management, audience targeting and data management systems, equipment required for our Customer Experience Center and content production and post-production facilities, office leasehold improvements, desktop equipment for use by our employees, and in certain cases, the costs necessary to digitize all or a portion of a network affiliate’s theaters when they are added to our network. Capital expenditures in 2019 were $15.3 million (including $7.6 million associated with digital product development; $2.0 million associated with certain implementation and prepaid costs associated with Cloud Computing Arrangements related to the planned upgrade of our planning, proposal and inventory tracking system; and $0.8 million associated with network affiliate additions) compared to $15.4 million (including $6.9 million associated with digital product development; $1.9 million in leasehold improvements at our new corporate headquarters, of which $1.1 million was reimbursed by the landlord for a net cash expenditure of $0.8 million; and $0.9 million associated with network affiliate additions) for the 2018 period. The capital expenditures have typically been satisfied through cash flow from operations. All capital expenditures related to the DCN within the founding members’ theaters have been made by the founding members under the ESAs. We expect they will continue to be made by the founding members in accordance with the ESAs.
We expect to make approximately $14.0 million to $16.0 million of capital expenditures in fiscal 2020, including approximately $7.0 million for digital product development. We expect these digital products to allow us to capture exclusive first party data on our movie audiences and build our own foundational capabilities for digital ad buying, selling and serving. We also expect approximately $2.4 million of capital expenditures related to upgrades to our Digital Content Software distribution and content management software and our other internal management systems, including our proposal, inventory and data management systems, reporting systems, network equipment related to currently contracted network affiliate theaters, server and storage upgrades and software licensing. Our capital expenditures may increase as we add additional network affiliates. We expect that additional expenditures, if any, would be funded in part by additional cash flows associated with those new network affiliates. The commitments associated with our operating lease requirements are included in “Contractual and Other Obligations” below.
Financings
On October 8, 2019, NCM LLC completed a private offering of $400.0 million aggregate principal amount of 5.875% senior secured notes due 2028. The 2028 Notes will mature on April 15, 2028. Interest on the 2028 Notes accrues at a rate of 5.875% per annum and is payable semi-annually in arrears on April 15 and October 15 of each year, commencing on April 15, 2020. NCM LLC will pay interest to those persons who were holders of record at the close of business on the April 1 and October 1 immediately preceding the interest payment date. At any time prior to April 15, 2023, NCM LLC may redeem all or any portion of the 2028 Notes at a redemption price equal to 100% of the principal amount plus a make-whole premium, plus accrued and unpaid interest, if any, to the redemption date. On or after April 15, 2023, NCM LLC may redeem all or any portion of the 2028 Notes at specified redemption prices, plus accrued and unpaid interest, if any, to the redemption date. In addition, at any time prior to April 15, 2023, NCM LLC may on any one or more occasions redeem up to 35% of the original aggregate principal amount of the 2028 Notes from the net proceeds of certain equity offerings at a redemption price equal to 105.875% of the principal amount of the 2028 Notes redeemed, plus accrued and unpaid interest, if any, to the redemption date, provided that at least 65% of the original aggregate principal amount of the 2028 Notes remains outstanding after each such redemption and the redemption occurs within 90 days after the closing of such applicable equity offering.
On November 7, 2019, NCM LLC redeemed the entire $400.0 million aggregate principal amount of NCM LLC’s existing Notes due 2022. The redemption price for the Notes due 2022 was 101.000% of the principal amount thereof plus accrued and unpaid interest thereon, to but not including the redemption date.
In June 2018, we entered into a credit agreement to replace NCM LLC's previous senior secured credit facility. Consistent with the structure of the previous facility, the new credit agreement consists of a term loan facility and a revolving credit facility for $270.0 million and $175.0 million, respectively. The new agreement extended the maturity dates by 5.5 years
43
to June 20, 2025 for the term loan facility and 3.5 years to June 20, 2023 for the revolving credit facility. The interest rate under the term loan facility is either the LIBOR index plus 3.00% or the base rate plus 2.00% and the rate under the revolving credit facility is either the LIBOR index plus an applicable margin ranging from 1.75%-2.25% or the base rate plus an applicable margin ranging from 0.75%-1.25%. The applicable margin for the revolving credit facility is determined quarterly and is subject to adjustment based upon a consolidated net senior secured leverage ratio for NCM LLC. As of
December 26, 2019
, NCM LLC’s senior secured credit facility consisted of a $175.0 million revolving credit facility and a
$266.6
million term loan, following NCM LLC's required principal amortization payments of $3.4 million which reduced the outstanding balance to
$266.6
million from $270.0 million.
NCM LLC repurchased and canceled a total of $5.0 million and $15.0 million of the Notes due 2026 during 2019 and 2018, respectively, reducing the principal amount to $230.0 million as of
December 26, 2019
. These repurchases were treated as partial debt extinguishments and resulted in the realization of a non-operating gain, net of written off debt issuance costs, of $0.3 million and $0.6 million during the years ended
December 26, 2019
and December 27, 2018, respectively. These re-purchases are expected to result in interest savings to maturity of approximately $8.9 million.
The senior secured credit facility contains a number of covenants and various financial ratio requirements, including, (i) a consolidated net total leverage ratio covenant of 6.25 times for each quarterly period and (ii) with respect to the revolving credit facility, maintaining a consolidated net senior secured leverage ratio of equal to or less than 4.50 times on a quarterly basis for each quarterly period in which a balance is outstanding on the revolving credit facility. In addition, NCM LLC is permitted to make quarterly dividend payments and other restricted payments with its available cash as long as NCM LLC’s consolidated net senior secured leverage ratio (after giving effect to any such payment) is below 5.50 times and no default or event of default has occurred and continues to occur under the senior secured credit facility. As of
December 26, 2019
, NCM LLC’s consolidated net senior secured leverage ratio was 3.0 times (versus the dividend payment restriction of 5.50 times and the covenant of 4.50 times) and NCM LLC's consolidated net total leverage ratio was 4.0 times (versus the covenant of 6.25 times).
There are no borrower distribution restrictions as long as NCM LLC’s consolidated net senior secured leverage ratio is below 5.5 times and NCM LLC is in compliance with its debt covenants. If there are limitations on the restricted payments, NCM LLC may not declare or pay any dividends, make any payments on account of NCM LLC, set aside assets for the retirement or other acquisition of capital stock of the borrower or any subsidiary, or make any other distribution for obligations of NCM LLC. When these restrictions are effective, NCM LLC may still pay the services fee and reimbursable costs pursuant to terms of the management agreement. NCM, Inc. can also make payments pursuant to the TRA in the amount, and at the time necessary to satisfy the contractual obligations with respect to the actual cash tax benefits payable to NCM LLC’s founding members.
As a result of the issuance of the Notes due 2028 and redemption of the Notes due 2022, we extended the average maturities of our debt and as of
December 26, 2019
, the weighted average remaining maturity was 6.9 years. As of
December 26, 2019
, approximately 67% of our total borrowings bear interest at fixed rates. The remaining 33% of our borrowings bear interest at variable rates and as such, our net income and earnings per share could fluctuate with market interest rate fluctuations that could increase or decrease the interest paid on our borrowings.
Critical Accounting Policies
The significant accounting policies of the Company are described in Note 1 to the audited Consolidated Financial Statements included elsewhere in this document. Certain accounting policies involve significant judgments, assumptions and estimates by management that have a material impact on the carrying value of certain assets and liabilities, which management considers critical accounting policies. The judgments, assumptions and estimates used by management are based on historical experience, knowledge of the accounts and other factors, which are believed to be reasonable under the circumstances and are evaluated on an ongoing basis. Because of the nature of the judgments and assumptions made by management, actual results could differ from these judgments and estimates, which could have a material impact on the carrying values of assets and liabilities and the results of operations of the Company.
Allowance for Doubtful Accounts
Nature of Estimates Required.
The allowance for doubtful accounts represents management’s estimate of probable credit losses inherent in its trade receivables, which represent a significant asset on the balance sheet. Estimating the amount of the allowance for doubtful accounts requires significant judgment and the use of estimates related to the amount and timing of estimated losses based on historical loss experience, consideration of current economic trends and conditions and debtor-specific factors, all of which may be susceptible to significant change. Amounts deemed uncollectible within the account receivable balance are charged against the allowance, while recoveries of amounts previously charged are credited to the allowance. A provision for bad debt is charged to operations based on management’s periodic evaluation of the factors
44
previously mentioned, as well as, other pertinent factors. To the extent actual outcomes differ from management estimates, additional provision for bad debt could be required that could adversely affect earnings or financial position in future periods.
Sensitivity Analysis.
As of
December 26, 2019
, our allowance for doubtful accounts was $6.2 million, or 3.5% of the gross accounts receivable balance. A 10% difference in the allowance for doubtful accounts as of
December 26, 2019
would have affected net income attributable to NCM, Inc. by approximately $0.6 million.
Share-Based Compensation
Nature of Estimates Required.
NCM, Inc.’s 2016 Equity Incentive Plan and its 2007 Equity Incentive Plan, as amended (the “Equity Incentive Plans”) are treated as equity plans under the provisions of Accounting Standards Codification ASC 718 –
Compensation – Stock Compensation,
and the determination of fair value of options, restricted stock and restricted stock units for accounting purposes requires that management make estimates and judgments. Stock options are granted using the Black-Scholes option pricing model to estimate the fair value of stock option grants, which was affected by our stock price and a number of assumptions, including expected term, expected volatility, risk-free interest rate and expected dividends.
The fair value of restricted stock and restricted stock units is based on the closing market price of our common stock on the date of grant. Restricted stock vest upon the achievement of Company three-year cumulative performance measures and service conditions or only service conditions whereby they vest ratably over three years. Restricted stock units vest after the completion of a service period of thirteen months. Compensation expense equal to the fair value of each restricted stock award or restricted stock unit is recognized ratably over this requisite service period. For the restricted stock awards including performance vesting conditions, compensation expense is based on management’s projections and the probability of achievement of those targets, which requires considerable judgment. We record a cumulative adjustment to share-based compensation expense in periods that we change our estimate of the number of shares expected to vest. Additionally, we ultimately adjust the expense recognized to reflect the actual vested shares following the resolution of the performance conditions. Further, we estimate a forfeiture rate to reflect the potential separation of employees.
Assumptions and Approach Used.
In determining the value of stock options, we estimated an expected term based upon historical actuals and company peer actuals and adjusted it by the cost of equity in order to incorporate the impact of the market condition, expected dividend yield based upon our expectation of the dividend that would be paid out on the underlying shares during the expected term of the option. Expected volatility is based on our historical stock prices using a mathematical formula to measure the standard deviation of the change in the natural logarithm of our underlying stock price over a period of time commensurate with the expected term. The risk-free interest rate is derived from the zero coupon rate on U.S. Treasury instruments with a term commensurate with the award’s expected term.
For restricted stock with vesting contingent on the achievement of Company performance conditions, the amount of compensation expense is estimated based on the expected achievement of the performance condition. This requires us to make estimates of the likelihood of the achievement of Company performance conditions, which is highly judgmental. We base our judgments as to the expected achievement of Company performance conditions based on the financial projections of the Company that are used by management for business purposes, which represent our best estimate of expected Company performance. We evaluate the assumptions used to value stock-based awards on a quarterly basis. If factors change and we employ different assumptions, stock-based compensation expense may differ significantly from what we have recorded in the past. If there are any modifications or cancellations of stock-based awards, we may be required to accelerate, increase or decrease any remaining, unrecognized stock-based compensation expense. To the extent that we grant additional stock-based awards, compensation expense will increase in relation to the fair value of the additional grants. Compensation expense may be significantly impacted in the future to the extent our estimates differ from actual results. Further, we estimate a forfeiture rate of restricted stock based upon historical forfeitures. If future forfeitures differ significantly from our past experience our compensation expense may be significantly impacted.
Income Taxes
Nature of Estimates Required.
We account for income taxes in accordance with ASC 740 –
Income Taxes,
which requires an asset and liability approach to financial accounting and reporting for income taxes. Accordingly, deferred tax assets and liabilities arise from the differences between the tax basis of an asset or liability and its reported amount in the audited Consolidated Financial Statements. Deferred tax amounts are determined using the tax rates expected to be in effect when the taxes will actually be paid or refunds received, as provided under currently enacted tax law. Valuation allowances are to be established when necessary to reduce deferred tax assets to the amount expected to be realized. We recognized a deferred tax asset associated with the basis difference in our investment in NCM LLC. However, a portion of the total basis difference will only reverse upon the sale of our interest in NCM LLC, which we expect would result in a capital loss. Therefore, as of
December 26, 2019
we have a valuation allowance in the amount of $80.6 million against the deferred tax asset to which this portion relates. We have incurred taxable losses in recent years due primarily to amortization of intangible assets recorded on our tax returns resulting from an election by NCM LLC made under Internal Revenue Code § 754 of the Internal Revenue Code to step-up the Company’s outside basis in its share of NCM LLC’s inside basis of assets under IRC §743(b). No
45
valuation allowance is deemed necessary for these deferred tax assets as we expect future taxable income (as amortization of these items will cease) and we expect to be able to utilize our net operating loss carryforwards prior to their expiration. Further, we have and continue to expect to generate pre-tax book income. On December 22, 2017, the U.S. government enacted the Tax Act. This legislation led to adjustments to our net deferred tax assets and payable to founding members under the TRA primarily due to the reduction in the U.S. federal corporate tax rate. Further due to our expectation of future taxable income we have not recorded any impact of the Net Business Interest Expense Limitation IRC § 163(j) on our payable to founding members under the TRA.
In addition, due to the basis differences resulting from our IPO-related transactions (including the TRA with the founding members) and subsequent adjustments pursuant to the common unit adjustment agreement, we are required to make cash payments under the TRA to the founding members in amounts equal to 90% of our actual tax benefit realized from the tax amortization of the basis difference for certain deferred assets noted above. The requirements of the TRA, as amended, are highly technical and complex and involve management’s judgment, including judgments to determine hypothetical tax outcomes exclusive of the IPO date transaction and agreements. If we were to fail to meet certain of the requirements of the TRA, we could be subject to additional payments to taxing authorities or to the founding members. We recognize the tax benefit from an uncertain tax position only when it is more likely than not, based on the technical merits of the position, that the tax position will be sustained upon examination, including the resolution of any related appeals or litigation. The tax benefits recognized in the audited Consolidated Financial Statements from such a position are measured as the largest benefit that has a greater than fifty percent likelihood of being realized upon ultimate resolution.
For fiscal 2019, our provision for income taxes was $12.4
million. Changes in management’s estimates and assumptions regarding the enacted tax rate applied to deferred tax assets and liabilities, the ability to realize the value of deferred tax assets, or the timing of the reversal of tax basis differences and judgments used to determine hypothetical tax outcomes exclusive of the IPO date transaction and agreements could impact the provision for income taxes and change the effective tax rate.
Recent Accounting Pronouncements
For a discussion of the recent accounting pronouncements relevant to our business operations, refer to the information provided under Note 1 to the audited Consolidated Financial Statements included elsewhere in this document.
Related-Party Transactions
For a discussion of the related-party transactions, refer to the information provided under Note 9 to the audited Consolidated Financial Statements included elsewhere in this document.
Off-Balance Sheet Arrangements
Our operating lease obligations, which primarily include office leases, are not reflected on our balance sheet. Refer to “—Contractual and Other Obligations” for further detail. We do not believe these arrangements are material to our current or future financial condition, results of operations, liquidity, capital resources or capital expenditures.
Contractual and Other Obligations
Our contractual obligations as of
December 26, 2019
were as follows:
|
|
Payments Due by Period (in millions)
|
||||||||||||||||||
|
|
Within
1 fiscal year |
1-3
fiscal years |
3-5
fiscal years |
Thereafter
|
Total
|
||||||||||||||
|
Borrowings
(1)
|
$
|
2.7
|
|
$
|
5.4
|
|
$
|
44.4
|
|
$
|
883.1
|
|
$
|
935.6
|
|
||||
|
Cash interest on borrowings
(2)
|
50.2
|
|
99.2
|
|
98.6
|
|
118.4
|
|
366.4
|
|
|||||||||
|
Office leases
|
3.7
|
|
7.6
|
|
7.7
|
|
18.8
|
|
37.8
|
|
|||||||||
|
Payable to founding members under TRA
(3)
|
14.2
|
|
28.5
|
|
29.4
|
|
125.9
|
|
198.0
|
|
|||||||||
|
Total contractual cash obligations
|
$
|
70.8
|
|
$
|
140.7
|
|
$
|
180.1
|
|
$
|
1,146.2
|
|
$
|
1,537.8
|
|
||||
|
(1)
|
We have a $175.0 million variable rate revolving credit facility of which $39.0 million was outstanding as of
December 26, 2019
and $3.6 million is restricted due to outstanding letters of credit. Debt service requirements under this agreement depend on the amounts borrowed and the level of the base interest rate, in addition to a commitment fee on the unused portion of the revolving credit facility. Refer to further discussion of the secured credit facility under “—Financial Condition and Liquidity-Financings” above.
|
|
(2)
|
The amounts of future cash interest payments in the table above are based on the amount outstanding on the Senior Secured Notes due 2028, Senior Unsecured Notes due 2026, term loans and revolving credit facility, as well as,
|
46
estimated rates of interest over the term of the variable rate revolving credit facility and term loan. The Senior Secured Notes due 2028 are at a fixed rate of 5.875%. The Senior Unsecured Notes due 2026 are at a fixed rate of 5.750%. In addition, we have variable rate term loans and a revolving credit facility. Debt service requirements under this agreement depend on the amounts borrowed and the level of the base interest rate, in addition to a commitment fee on the unused portion of the revolving credit facility. Refer to further discussion of the secured credit facility under “—Financial Condition and Liquidity-Financings” above.
|
(3)
|
The TRA entered into at the completion of our IPO provides for the payment by us to the founding members of 90% of the amount of cash savings, if any, in U.S. federal, state and local income tax or franchise tax that we actually realize as a result of certain increases in our proportionate share of tax basis in NCM LLC’s tangible and intangible assets. The payments to NCM LLC’s founding members are based, in part, on actual annual income and as such, will vary based on our operating results. The value in the table represents the estimated amounts payable under the TRA as of
December 26, 2019
.
|
The ESAs require payments based on a combination of founding member attendance, the number of digital screens of each founding member and the number of higher quality digital cinema systems of each NCM LLC founding member. The amount relating to the attendance factor will vary from quarter to quarter and year to year as theater attendance varies, while the amount relating to the digital screens and digital cinema systems will also vary quarter to quarter and year to year as screens are converted to digital screens and other screens are added or removed through acquisition, divestiture or closure activities of the founding members. The payments made to the founding members also will vary due to the escalation of the rates paid for each factor pursuant to the amended and restated ESAs. The rate per attendee increases 8% every five years, with the next such increase taking effect for fiscal year 2022, while the rate per digital screen and digital cinema system screen increase 5% annually. Following the 2019 ESA Amendments, Cinemark and Regal also receive an additional monthly theater access fee beginning November 1, 2019 in consideration for NCM LLC's access to certain on-screen advertising inventory after the advertised showtime of a feature film. These fees are also based upon a fixed payment per patron beginning at $0.025 per patron on November 1, 2019, (ii) $0.0375 per patron beginning on November 1, 2020, (iii) $0.05 per patron beginning on November 1, 2021, (iv) $0.052 per patron beginning on November 1, 2022 and (v) increase 8% every five years beginning November 1, 2027. The theater access fee paid in the aggregate to all founding members cannot be less than
12%
of NCM LLC’s aggregate advertising revenue (as defined in the ESA), or it will be adjusted upward to reach this minimum payment. Payments to affiliates vary based on revenue attributed to the affiliate for the period and thus will vary from quarter to quarter and year to year as advertising revenue varies. If a network affiliate achieves the attendance set forth in their respective agreement, the Company has guaranteed minimum revenue for the network affiliate per attendee if such amount paid under the revenue share arrangement is less than its guaranteed amount. The table above does not include amounts payable under the ESAs or to affiliates as they are based on variable factors, which are not capable of precise estimation. Refer to Note 13 to the audited Consolidated Financial Statements included elsewhere in this document for the maximum guarantee amount under the affiliate agreements.
Seasonality
Our revenue and operating results are seasonal in nature, coinciding with the timing of marketing expenditures by our advertising clients and to a lesser extent the attendance patterns within the film exhibition industry. Both advertising expenditures and theater attendance tend to be higher during the second, third, and fourth fiscal quarters. Advertising revenue is primarily correlated with new product releases, advertising client marketing priorities and economic cycles and to a lesser extent theater attendance levels. Seasonal demand during the summer is driven by the absence of alternative attractive advertising mediums and during the winter holiday season due to high client demand across all advertising mediums. The actual quarterly results for each quarter could differ materially depending on these factors or other risks and uncertainties. Based on our historical experience, our first quarter typically has less revenue than the other quarters of a given year due primarily to lower advertising client demand and increased inventory availability in competitive advertising mediums. Accordingly, there can be no assurances that seasonal variations will not materially affect our results of operations in the future.
The following table reflects the quarterly percentage of total revenue for the fiscal years ended 2017, 2018 and 2019:
|
First
Quarter
|
Second
Quarter
|
Third
Quarter
|
Fourth
Quarter
|
||||||||
|
FY 2017
|
16.9
|
%
|
22.8
|
%
|
27.3
|
%
|
33.0
|
%
|
|||
|
FY 2018
|
18.2
|
%
|
25.8
|
%
|
24.9
|
%
|
31.1
|
%
|
|||
|
FY 2019
|
17.3
|
%
|
24.8
|
%
|
24.8
|
%
|
33.1
|
%
|
|||
|
Item 7A.
|
Quantitative and Qualitative Disclosures About Market Risk
|
47
The primary market risk to which we are exposed is interest rate risk. The Notes due 2026 and the Notes due 2028 bear interest at fixed rates, and therefore are not subject to market risk. As of
December 26, 2019
, the interest rate risk that we are exposed to is related to our $175.0 million revolving credit facility and our $266.6 million term loan. A 100 basis point fluctuation in market interest rates underlying our term loan and revolving credit facility would have the effect of increasing or decreasing our cash interest expense by approximately $3.1 million for an annual period on the $39.0 million and $266.6 million outstanding as of
December 26, 2019
on our revolving credit facility and term loan, respectively.
48
|
Item 8.
|
Financial Statements and Supplementary Data
|
INDEX TO FINANCIAL STATEMENTS
|
|
Page
|
|
National CineMedia, Inc. and Subsidiary
|
|
|
|
|
|
|
|
|
|
|
|
|
|
|
|
|
|
|
|
49
REPORT OF INDEPENDENT REGISTERED PUBLIC ACCOUNTING FIRM
To the Stockholders and the Board of Directors of
National CineMedia, Inc.
Opinion on the Financial Statements
We have audited the accompanying consolidated balance sheets of National CineMedia, Inc. and subsidiary (the "Company") as of December 26, 2019 and December 27, 2018, the related consolidated statements of income, comprehensive income, equity(deficit), and cash flows for each of the three years in the period ended December 26, 2019 and the related notes (collectively referred to as the "financial statements"). In our opinion, the financial statements present fairly, in all material respects, the financial position of the Company as of December 26, 2019 and December 27, 2018, the results of its operations and its cash flows for each of the three years in the period ended December 26, 2019 in conformity with accounting principles generally accepted in the United States of America.
We have also audited, in accordance with the standards of the Public Company Accounting Oversight Board (United States) (PCAOB), the Company's internal control over financial reporting as of December 26, 2019, based on criteria established in
Internal Control - Integrated Framework (2013)
issued by the Committee of Sponsoring Organizations of the Treadway Commission and our report dated February 20, 2020, expressed an unqualified opinion on the Company's internal control over financial reporting.
Change in Accounting Principle
As discussed in Note 1 to the financial statements, the Company changed its method of accounting for leases effective December 28, 2018 due to adoption of Accounting Standards Codification Topic 842 -
Leases.
Basis for Opinion
These financial statements are the responsibility of the Company's management. Our responsibility is to express an opinion on the Company's financial statements based on our audits. We are a public accounting firm registered with the PCAOB and are required to be independent with respect to the Company in accordance with the U.S. federal securities laws and the applicable rules and regulations of the Securities and Exchange Commission and the PCAOB.
We conducted our audits in accordance with the standards of the PCAOB. Those standards require that we plan and perform the audit to obtain reasonable assurance about whether the financial statements are free of material misstatement, whether due to error or fraud. Our audits included performing procedures to assess the risks of material misstatement of the financial statements, whether due to error or fraud, and performing procedures that respond to those risks. Such procedures included examining, on a test basis, evidence regarding the amounts and disclosures in the financial statements. Our audits also included evaluating the accounting principles used and significant estimates made by management, as well as evaluating the overall presentation of the financial statements. We believe that our audits provide a reasonable basis for our opinion.
/s/ Deloitte & Touche LLP
Denver, Colorado
February 20, 2020
We have served as the Company’s auditor since 2006.
50
NATIONAL CINEMEDIA, INC. AND SUBSIDIARY
CONSOLIDATED BALANCE SHEETS
(In millions, except share and per share data)
|
|
December 26, 2019
|
December 27, 2018
|
|||||
|
ASSETS
|
|||||||
|
CURRENT ASSETS:
|
|||||||
|
Cash and cash equivalents
|
$
|
55.9
|
|
$
|
41.4
|
|
|
|
Short-term marketable securities
|
17.5
|
|
24.0
|
|
|||
|
Receivables, net of allowance of $6.2 and $6.0, respectively
|
170.8
|
|
149.9
|
|
|||
|
Income tax receivable
|
—
|
|
0.3
|
|
|||
|
Amounts due from founding members, net
|
6.6
|
|
|
5.8
|
|
||
|
Current portion of notes receivable - founding members (related parties of $0.0 and $4.2, respectively)
|
—
|
|
5.6
|
|
|||
|
Prepaid expenses and other current assets
|
3.5
|
|
3.9
|
|
|||
|
Total current assets
|
254.3
|
|
230.9
|
|
|||
|
NON-CURRENT ASSETS:
|
|||||||
|
Property and equipment, net of accumulated depreciation of $70.7 and $62.5, respectively
|
33.2
|
|
33.6
|
|
|||
|
Intangible assets, net of accumulated amortization of $198.9 and $172.7, respectively
|
643.7
|
|
684.5
|
|
|||
|
Deferred tax assets, net of valuation allowance of $81.6 and $80.1, respectively
|
162.1
|
|
173.9
|
|
|||
|
Other investments
|
1.0
|
|
3.0
|
|
|||
|
Long-term marketable securities
|
7.5
|
|
10.2
|
|
|||
|
Debt issuance costs, net
|
3.9
|
|
5.0
|
|
|||
|
Other assets
|
24.3
|
|
0.7
|
|
|||
|
Total non-current assets
|
875.7
|
|
910.9
|
|
|||
|
TOTAL ASSETS
|
$
|
1,130.0
|
|
$
|
1,141.8
|
|
|
|
LIABILITIES AND EQUITY/(DEFICIT)
|
|||||||
|
CURRENT LIABILITIES:
|
|||||||
|
Amounts due to founding members, net
|
$
|
36.8
|
|
$
|
30.0
|
|
|
|
Payable to founding members under the TRA (related party payables of $10.3 and $11.2, respectively)
|
14.2
|
|
15.5
|
|
|||
|
Accrued expenses
|
22.1
|
|
21.7
|
|
|||
|
Accrued payroll and related expenses
|
13.8
|
|
15.3
|
|
|||
|
Accounts payable
|
20.7
|
|
18.0
|
|
|||
|
Deferred revenue
|
7.6
|
|
7.3
|
|
|||
|
Short-term debt
|
2.7
|
|
2.7
|
|
|||
|
Other current liabilities
|
1.6
|
|
—
|
|
|||
|
Total current liabilities
|
119.5
|
|
110.5
|
|
|||
|
NON-CURRENT LIABILITIES:
|
|||||||
|
Long-term debt, net of debt issuance costs of $9.0 and $7.8, respectively
|
923.9
|
|
920.9
|
|
|||
|
Payable to founding members under the TRA (related party payables of $133.5 and $141.1, respectively)
|
183.8
|
|
195.6
|
|
|||
|
Other liabilities
|
24.0
|
|
4.0
|
|
|||
|
Total non-current liabilities
|
1,131.7
|
|
1,120.5
|
|
|||
|
Total liabilities
|
1,251.2
|
|
1,231.0
|
|
|||
|
COMMITMENTS AND CONTINGENCIES (NOTE 13)
|
|
|
|
|
|||
|
EQUITY/(DEFICIT):
|
|||||||
|
NCM, Inc. Stockholders’ Equity/(Deficit):
|
|||||||
|
Preferred stock, $0.01 par value; 10,000,000 shares authorized, none issued and outstanding, respectively
|
—
|
|
—
|
|
|||
|
Common stock, $0.01 par value; 175,000,000 shares authorized, 77,568,986 and 76,976,398 issued and
outstanding, respectively
|
0.8
|
|
0.8
|
|
|||
|
Additional paid in capital (deficit)
|
(209.2
|
)
|
(215.2
|
)
|
|||
|
Retained earnings (distributions in excess of earnings)
|
(171.1
|
)
|
(153.6
|
)
|
|||
|
Total NCM, Inc. stockholders’ equity/(deficit)
|
(379.5
|
)
|
(368.0
|
)
|
|||
|
Noncontrolling interests
|
258.3
|
|
278.8
|
|
|||
|
Total equity/(deficit)
|
(121.2
|
)
|
(89.2
|
)
|
|||
|
TOTAL LIABILITIES AND EQUITY/DEFICIT
|
$
|
1,130.0
|
|
$
|
1,141.8
|
|
|
Refer to accompanying notes to Consolidated Financial Statements.
51
NATIONAL CINEMEDIA, INC. AND SUBSIDIARY
CONSOLIDATED STATEMENTS OF INCOME
(In millions, except share and per share data)
|
|
Years Ended
|
||||||||||
|
|
December 26, 2019
|
December 27, 2018
|
December 28, 2017
|
||||||||
|
Revenue (including revenue from related parties of $23.0, $28.4
and $29.9, respectively)
|
$
|
444.8
|
|
$
|
441.4
|
|
$
|
426.1
|
|
||
|
OPERATING EXPENSES:
|
|||||||||||
|
Advertising operating costs
|
38.3
|
|
37.4
|
|
32.4
|
|
|||||
|
Network costs
|
13.5
|
|
13.3
|
|
15.8
|
|
|||||
|
Theater access fees and revenue share to founding members
(including fees to related parties of $56.6, $69.0 and $76.5,
respectively)
|
82.7
|
|
81.7
|
|
76.5
|
|
|||||
|
Selling and marketing costs
|
64.9
|
|
66.5
|
|
72.0
|
|
|||||
|
Administrative and other costs
|
43.8
|
|
48.3
|
|
37.9
|
|
|||||
|
Depreciation expense
|
13.6
|
|
12.6
|
|
11.0
|
|
|||||
|
Amortization expense
|
—
|
|
27.3
|
|
26.6
|
|
|||||
|
Amortization of intangibles recorded for network theater screen leases
|
26.7
|
|
—
|
|
—
|
|
|||||
|
Total
|
283.5
|
|
287.1
|
|
272.2
|
|
|||||
|
OPERATING INCOME
|
161.3
|
|
154.3
|
|
153.9
|
|
|||||
|
NON-OPERATING EXPENSES:
|
|||||||||||
|
Interest on borrowings
|
58.0
|
|
55.4
|
|
52.8
|
|
|||||
|
Interest income
|
(2.1
|
)
|
(1.5
|
)
|
(1.2
|
)
|
|||||
|
Loss on early retirement of debt, net
|
5.6
|
|
0.7
|
|
—
|
|
|||||
|
Loss (gain) on re-measurement of the payable to founding
members under the TRA
|
1.1
|
|
(3.8
|
)
|
(192.2
|
)
|
|||||
|
Other non-operating income
|
(0.4
|
)
|
(0.2
|
)
|
(0.3
|
)
|
|||||
|
Total
|
62.2
|
|
50.6
|
|
(140.9
|
)
|
|||||
|
INCOME BEFORE INCOME TAXES
|
99.1
|
|
103.7
|
|
294.8
|
|
|||||
|
Income tax expense
|
12.4
|
|
23.5
|
|
180.3
|
|
|||||
|
CONSOLIDATED NET INCOME
|
86.7
|
|
80.2
|
|
114.5
|
|
|||||
|
Less: Net income attributable to noncontrolling interests
|
50.6
|
|
50.4
|
|
56.2
|
|
|||||
|
NET INCOME ATTRIBUTABLE TO NCM, INC.
|
36.1
|
|
29.8
|
|
58.3
|
|
|||||
|
COMPREHENSIVE INCOME ATTRIBUTABLE TO NCM, INC.
|
$
|
36.1
|
|
$
|
29.8
|
|
$
|
58.3
|
|
||
|
NET INCOME PER NCM, INC. COMMON SHARE:
|
|||||||||||
|
Basic
|
$
|
0.47
|
|
$
|
0.39
|
|
$
|
0.89
|
|
||
|
Diluted
|
$
|
0.46
|
|
$
|
0.37
|
|
$
|
0.48
|
|
||
|
WEIGHTED AVERAGE SHARES OUTSTANDING:
|
|||||||||||
|
Basic
|
77,345,577
|
|
76,859,087
|
|
65,226,817
|
|
|||||
|
Diluted
|
77,782,567
|
|
157,403,910
|
|
151,067,270
|
|
|||||
Refer to accompanying notes to Consolidated Financial Statements.
52
NATIONAL CINEMEDIA, INC. AND SUBSIDIARY
CONSOLIDATED STATEMENTS OF EQUITY/ (DEFICIT)
(In millions, except share and per share data)
|
NCM, Inc.
|
||||||||||||||||||||||
|
Common Stock
|
Additional
Paid in Capital (Deficit) |
Retained
Earnings (Distribution in Excess of Earnings) |
Noncontrolling
Interest |
|||||||||||||||||||
|
Consolidated
|
Shares
|
Amount
|
||||||||||||||||||||
|
Balance—December 29, 2016
|
$
|
(232.2
|
)
|
59,874,412
|
|
$
|
0.6
|
|
$
|
(343.5
|
)
|
$
|
(130.8
|
)
|
$
|
241.5
|
|
|||||
|
Distributions to founding members
|
(85.0
|
)
|
—
|
|
—
|
|
—
|
|
—
|
|
(85.0
|
)
|
||||||||||
|
NCM LLC equity issued for purchase of
intangible asset |
201.8
|
|
—
|
|
—
|
|
78.8
|
|
—
|
|
123.0
|
|
||||||||||
|
Income tax and other impacts of NCM LLC
ownership changes |
(23.6
|
)
|
—
|
|
—
|
|
28.6
|
|
—
|
|
(52.2
|
)
|
||||||||||
|
Issuance of shares to founding members
|
84.9
|
|
15,600,000
|
|
0.2
|
|
84.7
|
|
—
|
|
—
|
|
||||||||||
|
NCM, Inc. investment in NCM LLC
|
(84.9
|
)
|
—
|
|
—
|
|
(84.9
|
)
|
—
|
|
—
|
|
||||||||||
|
Comprehensive income, net of tax
|
114.5
|
|
—
|
|
—
|
|
—
|
|
58.3
|
|
56.2
|
|
||||||||||
|
Share-based compensation issued
|
(4.1
|
)
|
767,810
|
|
—
|
|
(4.1
|
)
|
—
|
|
—
|
|
||||||||||
|
Share-based compensation expense/capitalized
|
11.5
|
|
—
|
|
—
|
|
7.3
|
|
—
|
|
4.2
|
|
||||||||||
|
Cash dividends declared $0.88 per share
|
(57.7
|
)
|
—
|
|
—
|
|
—
|
|
(57.7
|
)
|
—
|
|
||||||||||
|
Balance—December 28, 2017
|
$
|
(74.8
|
)
|
76,242,222
|
|
$
|
0.8
|
|
$
|
(233.1
|
)
|
$
|
(130.2
|
)
|
$
|
287.7
|
|
|||||
|
Cumulative-effect adjustment for adoption of 2014-09
|
(0.2
|
)
|
—
|
|
—
|
|
—
|
|
(0.2
|
)
|
—
|
|
||||||||||
|
Distributions to founding members
|
(72.3
|
)
|
—
|
|
—
|
|
—
|
|
—
|
|
(72.3
|
)
|
||||||||||
|
NCM LLC equity issued for purchase of
intangible asset |
15.9
|
|
—
|
|
—
|
|
7.7
|
|
—
|
|
8.2
|
|
||||||||||
|
Income tax and other impacts of NCM LLC
ownership changes |
9.5
|
|
—
|
|
—
|
|
7.0
|
|
—
|
|
2.5
|
|
||||||||||
|
Comprehensive income, net of tax
|
80.2
|
|
—
|
|
—
|
|
—
|
|
29.8
|
|
50.4
|
|
||||||||||
|
Share-based compensation issued
|
(2.4
|
)
|
734,176
|
|
—
|
|
(2.4
|
)
|
—
|
|
—
|
|
||||||||||
|
Share-based compensation expense/capitalized
|
7.9
|
|
—
|
|
—
|
|
5.6
|
|
—
|
|
2.3
|
|
||||||||||
|
Cash dividends declared $0.68 per share
|
(53.0
|
)
|
—
|
|
—
|
|
—
|
|
(53.0
|
)
|
—
|
|
||||||||||
|
Balance—December 27, 2018
|
$
|
(89.2
|
)
|
76,976,398
|
|
$
|
0.8
|
|
$
|
(215.2
|
)
|
$
|
(153.6
|
)
|
$
|
278.8
|
|
|||||
|
Distributions to founding members
|
(76.4
|
)
|
—
|
|
—
|
|
—
|
|
—
|
|
(76.4
|
)
|
||||||||||
|
NCM LLC equity issued for purchase of
intangible asset |
7.6
|
|
—
|
|
—
|
|
3.7
|
|
—
|
|
3.9
|
|
||||||||||
|
Income tax and other impacts of NCM LLC
ownership changes |
(0.7
|
)
|
—
|
|
—
|
|
(0.7
|
)
|
—
|
|
—
|
|
||||||||||
|
Issuance of shares to founding members
|
1.7
|
|
197,118
|
|
—
|
|
1.7
|
|
—
|
|
—
|
|
||||||||||
|
NCM, Inc. investment in NCM LLC
|
(1.7
|
)
|
—
|
|
—
|
|
(1.7
|
)
|
—
|
|
—
|
|
||||||||||
|
Comprehensive income, net of tax
|
86.7
|
|
—
|
|
—
|
|
—
|
|
36.1
|
|
50.6
|
|
||||||||||
|
Share-based compensation issued
|
(1.3
|
)
|
395,470
|
|
—
|
|
(1.3
|
)
|
—
|
|
—
|
|
||||||||||
|
Share-based compensation expense/capitalized
|
5.7
|
|
—
|
|
—
|
|
4.3
|
|
—
|
|
1.4
|
|
||||||||||
|
Cash dividends declared $0.68 per share
|
(53.6
|
)
|
—
|
|
—
|
|
—
|
|
(53.6
|
)
|
—
|
|
||||||||||
|
Balance—December 26, 2019
|
$
|
(121.2
|
)
|
77,568,986
|
|
$
|
0.8
|
|
$
|
(209.2
|
)
|
$
|
(171.1
|
)
|
$
|
258.3
|
|
|||||
Refer to accompanying notes to Consolidated Financial Statements.
53
NATIONAL CINEMEDIA, INC. AND SUBSIDIARY
CONSOLIDATED STATEMENTS OF CASH FLOWS
(In millions)
|
|
Years Ended
|
||||||||||
|
|
December 26, 2019
|
December 27, 2018
|
December 28, 2017
|
||||||||
|
CASH FLOWS FROM OPERATING ACTIVITIES:
|
|||||||||||
|
Consolidated net income
|
$
|
86.7
|
|
$
|
80.2
|
|
$
|
114.5
|
|
||
|
Adjustments to reconcile consolidated net income to net cash provided by operating activities:
|
|||||||||||
|
Deferred income tax expense
|
12.1
|
|
23.3
|
|
181.9
|
|
|||||
|
Depreciation expense
|
13.6
|
|
12.6
|
|
11.0
|
|
|||||
|
Amortization expense
|
—
|
|
27.3
|
|
26.6
|
|
|||||
|
Amortization of intangibles recorded for network theater screens
|
26.7
|
|
—
|
|
—
|
|
|||||
|
Non-cash share-based compensation
|
5.5
|
|
7.8
|
|
11.2
|
|
|||||
|
Impairment on investment
|
2.0
|
|
0.4
|
|
3.1
|
|
|||||
|
Reversal of income tax reserve
|
—
|
|
(0.4
|
)
|
(1.7
|
)
|
|||||
|
Amortization of debt issuance costs
|
2.6
|
|
2.6
|
|
2.6
|
|
|||||
|
Loss on early retirement of debt, net
|
5.6
|
|
0.7
|
|
—
|
|
|||||
|
Non-cash loss (gain) on re-measurement of the payable to founding members under the TRA
|
1.1
|
|
(3.8
|
)
|
(192.2
|
)
|
|||||
|
Other
|
(1.0
|
)
|
(0.5
|
)
|
(0.3
|
)
|
|||||
|
Founding member integration and encumbered theater payments (including
payments from related parties of $0.8 in 2019) |
21.7
|
|
—
|
|
—
|
|
|||||
|
Payment to founding members under the TRA
|
(15.1
|
)
|
(18.4
|
)
|
(18.8
|
)
|
|||||
|
Other cash flows from operating activities, net
|
(0.4
|
)
|
1.2
|
|
0.3
|
|
|||||
|
Changes in operating assets and liabilities:
|
|||||||||||
|
Receivables, net
|
(20.9
|
)
|
10.7
|
|
(0.1
|
)
|
|||||
|
Accounts payable and accrued expenses
|
3.6
|
|
4.8
|
|
1.7
|
|
|||||
|
Amounts due to founding members, net
|
2.1
|
|
(0.1
|
)
|
0.3
|
|
|||||
|
Deferred revenue
|
0.3
|
|
0.2
|
|
(3.1
|
)
|
|||||
|
Other, net
|
(2.6
|
)
|
1.7
|
|
1.9
|
|
|||||
|
Net cash provided by operating activities
|
143.6
|
|
150.3
|
|
138.9
|
|
|||||
|
CASH FLOWS FROM INVESTING ACTIVITIES:
|
|||||||||||
|
Purchases of property and equipment
|
(14.0
|
)
|
(14.2
|
)
|
(11.6
|
)
|
|||||
|
Purchases of marketable securities
|
(24.5
|
)
|
(36.8
|
)
|
(34.4
|
)
|
|||||
|
Proceeds from sale and maturities of marketable securities
|
34.5
|
|
32.2
|
|
50.9
|
|
|||||
|
Purchases of intangible assets from network affiliates
|
—
|
|
(0.1
|
)
|
(2.1
|
)
|
|||||
|
Proceeds from notes receivable - founding members (including payments from related
parties of $4.2, $1.4 and $5.6, respectively)
|
5.6
|
|
2.8
|
|
5.6
|
|
|||||
|
Other, net
|
—
|
|
—
|
|
0.1
|
|
|||||
|
Net cash provided by (used in) investing activities
|
1.6
|
|
(16.1
|
)
|
8.5
|
|
|||||
|
CASH FLOWS FROM FINANCING ACTIVITIES:
|
|||||||||||
|
Payment of dividends
|
(53.6
|
)
|
(54.4
|
)
|
(58.7
|
)
|
|||||
|
Proceeds from revolving credit facility
|
169.0
|
|
193.2
|
|
80.0
|
|
|||||
|
Repayments of revolving credit facility
|
(157.0
|
)
|
(178.2
|
)
|
(83.0
|
)
|
|||||
|
Proceeds from term loan facility
|
—
|
|
270.0
|
|
—
|
|
|||||
|
Repayments of term loan facility
|
(2.7
|
)
|
(270.7
|
)
|
—
|
|
|||||
|
Repayment of Senior Notes due 2022 and 2026
|
(408.6
|
)
|
(14.2
|
)
|
—
|
|
|||||
|
Proceeds from issuance of Senior Notes due 2028
|
400.0
|
|
—
|
|
—
|
|
|||||
|
Payment of debt issuance costs
|
(4.6
|
)
|
(6.9
|
)
|
—
|
|
|||||
|
Founding member integration and encumbered theater payments (including payments from
related parties of $17.2 and $12.9 for 2018 and 2017, respectively)
|
—
|
|
22.7
|
|
12.9
|
|
|||||
|
Distributions to founding members
|
(71.9
|
)
|
(82.1
|
)
|
(87.3
|
)
|
|||||
|
Proceeds from stock option exercises
|
—
|
|
—
|
|
0.6
|
|
|||||
|
Repurchase of stock for restricted stock tax withholding
|
(1.3
|
)
|
(2.4
|
)
|
(4.7
|
)
|
|||||
|
Net cash used in financing activities
|
(130.7
|
)
|
(123.0
|
)
|
(140.2
|
)
|
|||||
|
CHANGE IN CASH, CASH EQUIVALENTS AND RESTRICTED CASH
|
14.5
|
|
11.2
|
|
7.2
|
|
|||||
|
Cash, cash equivalents, and restricted cash at beginning of period
|
41.4
|
|
30.2
|
|
23.0
|
|
|||||
|
Cash, cash equivalents, and restricted cash at end of period
|
$
|
55.9
|
|
$
|
41.4
|
|
$
|
30.2
|
|
||
Refer to accompanying notes to Consolidated Financial Statements.
54
NATIONAL CINEMEDIA, INC. AND SUBSIDIARY
CONSOLIDATED STATEMENTS OF CASH FLOWS (CONTINUED)
(In millions)
|
|
Years Ended
|
||||||||||
|
|
December 26, 2019
|
December 27, 2018
|
December 28, 2017
|
||||||||
|
Supplemental disclosure of non-cash financing and investing activity:
|
|
|
|
|
|
|
|||||
|
Purchase of an intangible asset with NCM LLC equity
|
$
|
7.6
|
|
$
|
15.9
|
|
$
|
201.8
|
|
||
|
Accrued distributions to founding members
|
$
|
32.4
|
|
$
|
27.9
|
|
$
|
37.6
|
|
||
|
Accrued integration and other encumbered theater payments
from founding members (including accrued payments due from
related parties of $0.1, $0.4 and $0.0, respectively)
|
$
|
8.4
|
|
$
|
7.8
|
|
$
|
9.0
|
|
||
|
Purchase of subsidiary equity with NCM, Inc. equity
|
$
|
1.7
|
|
$
|
—
|
|
$
|
84.9
|
|
||
|
Accrued purchases of property and equipment
|
$
|
0.4
|
|
$
|
1.1
|
|
$
|
0.4
|
|
||
|
Increase (decrease) in dividend equivalent accrual not requiring cash
in the period
|
$
|
0.1
|
|
$
|
(1.4
|
)
|
$
|
(1.0
|
)
|
||
|
Supplemental disclosure of cash flow information:
|
|||||||||||
|
Cash paid for interest
|
$
|
54.3
|
|
$
|
54.1
|
|
$
|
49.9
|
|
||
|
Cash paid for income taxes, net of refunds
|
$
|
0.1
|
|
$
|
0.3
|
|
$
|
(1.7
|
)
|
||
Refer to accompanying notes to Consolidated Financial Statements.
55
NATIONAL CINEMEDIA, INC. AND SUBSIDIARY
NOTES TO CONSOLIDATED FINANCIAL STATEMENTS
|
1.
|
BASIS OF PRESENTATION AND SUMMARY OF SIGNIFICANT ACCOUNTING POLICIES
|
NCM, Inc. was incorporated in Delaware as a holding company with the sole purpose of becoming a member and sole manager of NCM LLC, a limited liability company owned by NCM, Inc., Cinemark and Regal. The terms “NCM”, “the Company” or “we” shall, unless the context otherwise requires, be deemed to include the consolidated entity.
The Company operates the largest cinema advertising network reaching movie audiences in North America, allowing NCM LLC to sell advertising under long-term ESAs with the founding members and certain third-party network affiliates, under long-term network affiliate agreements. On September 17, 2019, NCM LLC entered into the 2019 ESA Amendments. The 2019 ESA Amendments extended the contract life of the ESAs with Cinemark and Regal by four years resulting in a weighted average remaining term of the ESAs with the founding members (based on attendance) of approximately
19.8 years
as of
December 26, 2019
. The network affiliate agreements expire at various dates between
March 15, 2020
and
July 22, 2031
. The weighted average remaining term (based on attendance) of the ESAs and the network affiliate agreements together is
17.1 years
as of
December 26, 2019
.
As of
December 26, 2019
, NCM LLC had
159,077,355
common membership units outstanding, of which
77,568,986
(
48.8%
) were owned by NCM, Inc.,
41,770,669
(
26.2%
) were owned by Regal,
39,737,700
(
25.0%
) were owned by Cinemark and
0
(
0.0%
) were owned by AMC. The membership units held by the founding members are exchangeable into NCM, Inc. common stock on a
one
-for-one basis.
Basis of Presentation
The Company has prepared its Consolidated Financial Statements and related notes of NCM, Inc. in accordance with accounting principles generally accepted in the United States of America (“GAAP”) and the rules and regulations of the Securities and Exchange Commission (“SEC”). Certain reclassifications have been made to the prior years’ financial statements to conform to the current presentation (refer to Consolidated Statements of Income and Consolidated Statement of Cash Flows, whereby the Company presented depreciation expense and amortization expense as two separate lines).
In the opinion of management, all adjustments necessary to present fairly in all material respects the financial position, results of operations and cash flows for all periods presented have been made. The Company’s business is seasonal and for this and other reasons operating results for interim periods may not be indicative of the Company’s full year results or future performance. As a result of the various related-party agreements discussed in Note 9—
Related Party Transactions
, the operating results as presented are not necessarily indicative of the results that might have occurred if all agreements were with non-related third parties.
Advertising is the principal business activity of the Company and is the Company’s only reportable segment under the requirements of ASC 280 –
Segment Reporting.
Estimates
—The preparation of the financial statements in conformity with GAAP requires management to make estimates and assumptions that affect the reported amounts of assets and liabilities and disclosure of contingent assets and liabilities at the date of the financial statements and the reported amounts of revenues and expenses during the reporting period. Significant estimates include those related to the reserve for uncollectible accounts receivable, share-based compensation and income taxes. Actual results could differ from those estimates.
Significant Accounting Policies
Accounting Period
—The Company has a 52-week or 53-week fiscal year ending on the first Thursday after December 25. Fiscal years
2017
,
2018
and
2019
contained 52 weeks. Throughout this document, the fiscal years are referred to as set forth below:
|
Fiscal Year Ended
|
|
Reference in
this Document
|
|
December 26, 2019
|
|
2019
|
|
December 27, 2018
|
|
2018
|
|
December 28, 2017
|
|
2017
|
Revenue Recognition
—The Company derives revenue principally from the sale of advertising to national, regional and local businesses in
Noovie
, our cinema advertising and entertainment pre-show seen on movie screens across the U.S., as well as on our LEN, a series of strategically-placed screens located in movie theater lobbies, as well as other forms of advertising and promotions in theater lobbies. We also sell digital online and mobile advertising through our
Cinema Accelerator
product and across our suite of
Noovie
digital properties, including
Noovie.com, Noovie Shuffle, Name That Movie, Noovie Arcade,
and
Fantasy Movie League
, in order to reach entertainment audiences beyond the theater. The Company also has a long-term
56
NATIONAL CINEMEDIA, INC. AND SUBSIDIARY
NOTES TO CONSOLIDATED FINANCIAL STATEMENTS
agreement to exhibit the advertising of the founding members’ beverage suppliers. The Company considers the terms of each arrangement to determine the appropriate accounting treatment as more fully discussed in Note 2—
Revenue from Contracts with Customers
.
Operating Costs
—Advertising fulfillment-related operating costs primarily include personnel and other costs related to advertising fulfillment, payments due to unaffiliated theater circuits under the network affiliate agreements, and to a lesser extent, production costs of non-digital advertising.
Payments to the founding members of a theater access fee is comprised of a payment per theater attendee, a payment for post-showtime advertising, a payment per digital screen and a payment per digital cinema projector equipped in the theaters, all of which escalate over time, and payment for revenue share of the Platinum Spot. Refer to Item 7—“Management’s Discussion and Analysis of Financial Condition and Results of Operations” included elsewhere in this document.
Network costs include personnel, satellite bandwidth, repairs, and other costs of maintaining and operating the digital network and preparing advertising and other content for transmission across the digital network.
Advertising Costs
—Advertising-related costs incurred promoting the Company's digital products are included within “Selling and marketing costs” on the audited Consolidated Statements of Income. The Company recognized advertising costs of $
1.2
million, $
0.1
million, and $
0.0
million for the years ended
December 26, 2019
,
December 27, 2018
and
December 28, 2017
, respectively. These costs are expensed when incurred.
Cash and Cash Equivalents
—All highly liquid debt instruments and investments purchased with an original maturity of three months or less are classified as cash equivalents and are considered available-for-sale securities. There are cash balances in a bank in excess of the federally insured limits or in the form of a money market demand account with a major financial institution.
Marketable Securities
—The Company’s marketable securities are classified as available-for-sale and are reported at fair value. The fair value of substantially all securities is determined by quoted market information and pricing models using inputs based upon market information, including contractual terms, market prices and yield curves. The estimated fair value of securities for which there are no quoted market prices is based on similar types of securities that are traded in the market.
Concentration of Credit Risk and Significant Customers
—Bad debts are provided for using the allowance for doubtful accounts method based on historical experience and management’s evaluation of outstanding receivables at the end of the period. Receivables are written off when management determines amounts are uncollectible. Trade accounts receivable are uncollateralized and represent a large number of geographically dispersed debtors. The collectability risk with respect to national and regional advertising is reduced by transacting with founding members or large, national advertising agencies who have strong reputations in the advertising industry and clients with stable financial positions. The Company has smaller contracts with thousands of local clients that are not individually significant. As of
December 26, 2019
and
December 27, 2018
, there were
no
advertising agency groups or individual customers through which the Company sources national advertising revenue representing more than 10% of the Company’s outstanding gross receivable balance. During the years ended
December 26, 2019
,
December 27, 2018
and
December 28, 2017
, there were
no
customers that accounted for more than 10% of revenue.
Receivables consisted of the following (in millions):
|
|
As of
|
||||||
|
|
December 26, 2019
|
December 27, 2018
|
|||||
|
Trade accounts
|
$
|
176.0
|
|
$
|
154.0
|
|
|
|
Other
|
1.0
|
|
1.9
|
|
|||
|
Less: Allowance for doubtful accounts
|
(6.2
|
)
|
(6.0
|
)
|
|||
|
Total
|
$
|
170.8
|
|
$
|
149.9
|
|
|
Long-lived Assets
—Property and equipment is stated at cost, net of accumulated depreciation or amortization. Generally, the equipment associated with the digital network of the founding member theaters is owned by the founding members, while the equipment associated with network affiliate theaters is owned by the Company. Major renewals and improvements are capitalized, while replacements, maintenance, and repairs that do not improve or extend the lives of the respective assets are expensed as incurred. The Company records depreciation using the straight-line method over the following estimated useful lives:
|
Equipment
|
4-10 years
|
|
Computer hardware and software
|
3-5 years
|
|
Leasehold improvements
|
Lesser of lease term or asset life
|
57
NATIONAL CINEMEDIA, INC. AND SUBSIDIARY
NOTES TO CONSOLIDATED FINANCIAL STATEMENTS
Software and website development costs developed or obtained for internal use are accounted for in accordance with ASC 350—
Internal Use Software
and ASC 350–
Website Development Costs
. The subtopics require the capitalization of certain costs incurred in developing or obtaining software for internal use. Software costs related primarily to the Company’s inventory management systems, digital products, digital network distribution system (DCS), enterprise resource planning system and website development costs, which are included in equipment, and are depreciated over
three
to
five years
. As of
December 26, 2019
and
December 27, 2018
, the Company had a net book value of
$14.1 million
and
$17.4 million
, respectively, of capitalized software and website development costs. Depreciation expense related to software and website development was approximately
$8.4 million
,
$6.7 million
and
$6.0 million
for the years ended
December 26, 2019
,
December 27, 2018
and
December 28, 2017
, respectively. The subtopics also require the capitalization of certain implementation costs related to qualifying Cloud Computing Arrangements (“CCAs”) upon adoption of ASU 2018-15—
Intangibles - Goodwill and Other - Customer’s Accounting for Implementation Costs Incurred in a Cloud Computing Arrangement That Is a Service Contract
as of September 28, 2018. As of
December 26, 2019
and
December 27, 2018
the Company had a gross and net book value of
$0.6 million
and
$0.0 million
of capitalized implementation costs for CCAs, respectively. These costs primarily relate to the Company's expected new hosted planning, proposal and inventory tracking system. These costs will be amortized to “Administrative and other costs” within the audited Consolidated Statements of Income over the life of the hosting arrangement beginning at implementation. For the years ended
December 26, 2019
,
December 27, 2018
and
December 28, 2017
, the Company recorded
$3.6 million
,
$1.7 million
and
$3.6 million
in research and development expense, respectively.
The Company assesses impairment of long-lived assets pursuant with ASC 360 –
Property, Plant and Equipment.
This includes determining if certain triggering events have occurred that could affect the value of an asset. The Company recorded losses of
$0.2 million
,
$0.5 million
and
$0.1 million
related to the write-off of property, plant and equipment during the years ended
December 26, 2019
,
December 27, 2018
and
December 28, 2017
, respectively. These balances have been included within “Depreciation expense” within the respective audited Consolidated Statements of Income given the immaterial nature of the balances.
Intangible Assets
—Intangible assets consist of contractual rights to provide its services within the theaters
of the founding members and network affiliates and are stated at cost, net of accumulated amortization. The Company records amortization using the straight-line method over the contractual life of the intangibles, corresponding to the term of the ESAs or
the term of the contract with the network affiliate. Intangible assets are tested for impairment at least annually during the fourth quarter or whenever events or changes in circumstances indicate the carrying value may not be fully recoverable. In its impairment testing, the Company estimates the fair value of its ESAs or network affiliate agreements by determining the estimated future cash flows associated with the ESAs or network affiliate agreements. If after determining that gross cash flows are insufficient to recover the asset, the estimated fair value is less than the carrying value, the intangible asset is written down to its estimated fair value. Significant judgment is involved in estimating long-term cash flow forecasts. The Company recorded $
0.1
million, $
0.0
million and $
0.0
million, respectively, in impairment charges related to intangible assets during the years ended
December 26, 2019
,
December 27, 2018
and
December 28, 2017
. These losses have been included within “Depreciation expense” within the respective audited Consolidated Statements of Income given the immaterial nature of the activity.
The Company has elected to capitalize extension costs on its intangible assets and thus capitalized the legal and professional costs incurred in conjunction with the 2019 ESA Amendments. During the years ended
December 26, 2019
,
December 27, 2018
and
December 28, 2017
, the Company capitalized $
1.3 million
, $
0.0
million and $
0.0
million, respectively within the intangible asset balance related to extension costs.
Amounts Due to/from Founding Members
—Amounts due to/from founding members include amounts due for the theater access fees and revenue share, offset by a receivable for advertising time purchased by the founding members on behalf of their beverage concessionaire, plus any amounts outstanding under other contractually obligated payments. Payments to or received from the founding members against outstanding balances are made monthly. Available cash distributions are made quarterly.
Income Taxes
—Income taxes are accounted for under the asset and liability method, which requires recognition of deferred tax assets and liabilities for the expected future tax consequences of events that have been included in the financial statements. Under this method, deferred tax assets and liabilities are determined based on the differences between the financial statements and tax basis of assets and liabilities using enacted tax rates in effect for the year in which differences are expected to be recovered or settled pursuant to the provisions of ASC 740 –
Income Taxes
. The effect of a change in tax rates on deferred tax assets and liabilities is recognized in income in the period that includes the enactment date.
The Company records a valuation allowance if it is deemed more likely than not that all or a portion of its deferred income tax assets will not be realized, which will be assessed on an on-going basis. In addition, income tax rules and regulations are subject to interpretation and the application of those rules and regulations require judgment by the Company and may be challenged by the taxation authorities. The Company follows ASC 740-10-25, which requires the use of a two-step
58
NATIONAL CINEMEDIA, INC. AND SUBSIDIARY
NOTES TO CONSOLIDATED FINANCIAL STATEMENTS
approach for recognizing and measuring tax benefits taken or expected to be taken in a tax return and disclosures regarding uncertainties in income tax positions. Only tax positions that meet the more likely than not recognition threshold are recognized.
The Company recognizes the tax benefits from uncertain tax positions only when it is more likely than not, based on the technical merits of the position, the tax position will be sustained upon examination, including the resolution of any related appeals or litigation. The tax benefits recognized in the Consolidated Financial Statements from such a position are measured as the largest benefit that has a greater than fifty percent likelihood of being realized upon ultimate resolution. The Company recognizes interest and penalties related to uncertain tax positions in income tax expense.
Debt Issuance Costs
—In relation to the issuance of outstanding debt discussed in Note 10—
Borrowings
, there is a balance of
$12.9 million
and
$12.8 million
in deferred financing costs as of
December 26, 2019
and
December 27, 2018
, respectively. The debt issuance costs are being amortized on a straight-line basis over the terms of the underlying obligations and are included in interest on borrowings, which approximates the effective interest method. Debt issuance costs are written-off in the event that the underlying debt is extinguished through partial or full repayment of the obligation.
The changes in debt issuance costs are as follows (in millions):
|
|
Years Ended
|
||||||||||
|
|
December 26, 2019
|
December 27, 2018
|
December 28, 2017
|
||||||||
|
Beginning balance
|
$
|
12.8
|
|
$
|
10.0
|
|
$
|
12.6
|
|
||
|
Debt issuance costs
|
4.6
|
|
6.4
|
|
—
|
|
|||||
|
Amortization of debt issuance costs
|
(2.6
|
)
|
(2.6
|
)
|
(2.6
|
)
|
|||||
|
Write-off of debt issuance costs
|
(1.9
|
)
|
(1.0
|
)
|
—
|
|
|||||
|
Ending balance
|
$
|
12.9
|
|
$
|
12.8
|
|
$
|
10.0
|
|
||
Share-Based Compensation
—During 2019, the Company issued stock options, restricted stock and restricted stock units. Restricted stock and restricted stock units vest upon the achievement of Company
three
-year cumulative performance measures and service conditions or only service conditions. The Company recognizes share-based compensation net of an estimated forfeiture rate. Compensation expense of restricted stock that vests upon the achievement of Company performance measures is based
on management’s financial projections and the probability of achieving the projections, which require considerable judgment. A cumulative adjustment is recorded to share-based compensation expense in periods that management changes its estimate of the number of shares expected to vest. Ultimately, the Company adjusts the expense recognized to reflect the actual vested shares following the resolution of the performance conditions. Dividends are accrued when declared on unvested restricted stock that is expected to vest and are only paid with respect to shares that actually vest.
Compensation cost of stock options is based on the estimated grant date fair value using the Black-Scholes option pricing model, which requires that the Company make estimates of various factors. Under the fair value recognition provisions of ASC 718 Compensation – Stock Compensation, the Company recognizes share-based compensation net of an estimated forfeiture rate, and therefore only recognizes compensation cost for those shares expected to vest over the requisite service period of the award. Refer to Note 11—
Share-Based Compensation
for more information.
Fair Value Measurements
—Fair value is the price that would be received from selling an asset or paid to transfer a liability in an orderly transaction between market participants at the measurement date. Fair value is estimated by applying the following hierarchy, which prioritizes the inputs used to measure fair value into three levels and bases the categorization within the hierarchy upon the lowest level of input that is available and significant to the fair value measurement:
Level 1
– Quoted prices in active markets for identical assets or liabilities.
Level 2
– Observable inputs other than quoted prices in active markets for identical assets and liabilities, quoted prices for identical or similar assets or liabilities in inactive markets, or other inputs that are observable or can be corroborated by observable market data for substantially the full term of the assets or liabilities.
Level 3
– Inputs that are generally unobservable and typically reflect management’s estimate of assumptions that market participants would use in pricing the asset or liability.
Consolidation
—NCM, Inc. consolidates the accounts of NCM LLC under the provisions of ASC 810,
Consolidation
(“ASC 810”). Under Accounting Standards Update 2015-2, Consolidation (Topic 810): Amendments to the Consolidation Analysis (“ASU 2015-2”), a limited partnership is a variable interest entity unless a simple majority or lower threshold of all limited partners unrelated to the general partner have kick-out or participating rights. The non-managing members of NCM LLC do not have dissolution rights or removal rights. NCM, Inc. has evaluated the provisions of the NCM LLC membership agreement and has concluded that the various rights of the non-managing members are not substantive participating rights
59
NATIONAL CINEMEDIA, INC. AND SUBSIDIARY
NOTES TO CONSOLIDATED FINANCIAL STATEMENTS
under ASC 810, as they do not limit NCM, Inc.’s ability to make decisions in the ordinary course of business. As such, the Company concluded that NCM LLC is a variable interest entity and determined that NCM, Inc. should consolidate the accounts of NCM LLC pursuant to ASU 2015-2 because 1) it has the power to direct the activities of NCM LLC in its role as managing member and 2) NCM, Inc. has the obligation to absorb losses of, or the right to receive benefits from, NCM LLC that could potentially be significant provided its
48.8%
ownership in NCM LLC. Prior to the prospective adoption of ASU 2015-2 in the first quarter of 2016, the Company reached the same conclusion under previous guidance in ASC 810 to consolidate NCM LLC.
The following table presents the changes in NCM, Inc.’s equity resulting from net income attributable to NCM, Inc. and transfers to or from noncontrolling interests (in millions):
|
|
Years Ended
|
||||||||||
|
|
December 26, 2019
|
December 27, 2018
|
December 28, 2017
|
||||||||
|
Net income attributable to NCM, Inc.
|
$
|
36.1
|
|
$
|
29.8
|
|
$
|
58.3
|
|
||
|
NCM LLC equity issued for purchase of intangible asset
|
3.7
|
|
7.7
|
|
78.8
|
|
|||||
|
Income tax and other impacts of NCM LLC ownership
changes
|
(0.7
|
)
|
7.0
|
|
28.6
|
|
|||||
|
NCM, Inc. investment in NCM LLC
|
(1.7
|
)
|
—
|
|
(84.9
|
)
|
|||||
|
Issuance of shares to founding members
|
1.7
|
|
—
|
|
84.7
|
|
|||||
|
Change from net income attributable to NCM, Inc.
and transfers from noncontrolling interests
|
$
|
39.1
|
|
$
|
44.5
|
|
$
|
165.5
|
|
||
Recently Adopted Accounting Pronouncements
During the first quarter of 2019, the Company adopted Accounting Standards Update 2016-2 and subsequent amendments,
Leases (Topic 842)
(together “ASC 842”) utilizing the Comparatives Under 840 option where only the current period financial statements and related disclosures are presented in accordance with the new standard. As of the adoption date of December 28, 2018 the Company recognized the following on the audited Condensed Consolidated Balance Sheets: a right-of-use (“ROU”) asset of $
21.7
million within “Other assets”, a short-term lease liability of $
1.4
million within “Other current liabilities”, a long-term lease liability of $
24.5
million within “Other liabilities” and reversed the related deferred rent liability balance of $
4.2
million for all leases with terms longer than twelve months related to its building operating leases. The Company elected to utilize the following practical expedients: (i) not being required to separate lease and non-lease components when accounting for the lease for all asset classes; and (ii) not accounting for short-term leases under the new standard. The Company also determined that the ESAs and affiliate agreements are considered leases under ASC 842. However, the identification of the asset and determination of the period of control is dependent upon the scheduling of the showtimes by the exhibitors. As the schedules are typically not determined until one week in advance of the showtime, on average, the leases are considered short term in nature, specifically less than one month. As such, no ROU assets or lease liabilities were recognized for these agreements. The issuance of NCM LLC membership units to the founding members in accordance with NCM LLC’s Common Unit Adjustment Agreement and upfront cash payments to affiliates for the contractual rights to provide services within their theaters will continue to be classified as intangible assets. However, the amortization of these intangible assets is now considered lease expense and has been reclassified within the current period from “Depreciation and amortization expense” to “Amortization of intangibles recorded for network theater screen leases” on the audited Consolidated Statement of Income. Additionally, these upfront cash payments to affiliates and receipt of integration payments from the founding members, as defined within Note 5—
Intangible Assets
, will be considered cash flows from operating activities on the audited Consolidated Statement of Cash Flows when incurred as they are related to operating leases and will be reclassified from cash flows from investing and financing activities, respectively. The Company has also incorporated additional disclosures in Note 13—
Commitments and Contingencies
to comply with ASC 842.
During the first quarter of 2019, the Company adopted Accounting Standards Update 2018-7,
Compensation – Stock Compensation (Topic 718): Improvements to Nonemployee Share-Based Payment Accounting
(“ASU 2018-7”), which amends Topic 718 to include share-based payment transactions for acquiring goods and services from nonemployees. The adoption of ASU 2018-7 had an immaterial impact on the audited Condensed Consolidated Financial statements or notes thereto.
During the fourth quarter of 2018, the Company adopted a final rule issued by the SEC amending certain disclosure requirements deemed by the SEC to be redundant, duplicative, overlapping, outdated or superseded. The rule also added requirements to disclose (1) the changes in each caption of stockholders’ equity and non-controlling interests for the current and comparative year-to-date periods, with subtotals for each interim period and (2) the amount of dividends per share for each class of shares. The Company's adoption of the guidance resulted in changes to the presentation of the audited Consolidated Statement of Equity as a quarter to date equity rollforward is now also required for the current and comparable period. The
60
NATIONAL CINEMEDIA, INC. AND SUBSIDIARY
NOTES TO CONSOLIDATED FINANCIAL STATEMENTS
Company implemented the amended disclosure requirements in the first quarter of 2019. The codification was updated to reflect the aforementioned SEC changes within Accounting Standards Update 2019-7, Codification Updates to SEC Sections ("ASU 2019-7") issued and effective during the third quarter of 2019.
Recently Issued Accounting Pronouncements
In June 2016, the FASB issued Accounting Standards Update 2016-13,
Financial Instruments – Credit Losses (Topic 326), Measurement of Credit Losses on Financial Statements
(“ASU 2016-13”), which requires a financial asset (or group of financial assets) measured at amortized cost basis to be presented at the net amount expected to be collected. The allowance for credit losses is a valuation account that is deducted from the amortized cost basis of the financial asset(s) to present the net carrying value at the amount expected to be collected on the financial asset. ASU 2016-13 is effective for fiscal years beginning after December 15, 2019, including interim periods within those fiscal years, with early adoption permitted and is to be adopted on a modified retrospective basis. Upon the adoption of ASU 2016-13 on December 27, 2019, the Company expects to record a cumulative-effect adjustment related to the change in methodology surrounding the historical losses utilized in the calculation of the allowance for credit losses related to trade and unbilled accounts receivable. The Company is still evaluating the amount of adjustment. The Company will incorporate additional disclosures in its notes to its Consolidated Financial Statements to comply with ASU 2016-13 effective in the first quarter of 2020. The Company has designed and implemented changes to certain processes and internal controls related to its adoption of ASU 2016-13.
In August 2018, the FASB issued Accounting Standards Update 2018-13, Fair Value Measurement (Topic 820):
Disclosure Framework - Changes to the Disclosure Requirements for Fair Value Measurement
(“ASU 2018-13”), which modifies the disclosure requirements on fair value measurements. ASU 2018-13 is effective for fiscal years beginning after December 15, 2019, including interim periods within those fiscal years, with partial early adoption permitted for eliminated disclosures. The method of adoption varies by the disclosure. Upon the adoption of ASU 2018-13 on December 27, 2019, the Company expects no changes to the Company's fair value disclosures as none of the changes within ASU 2018-13 were applicable to the Company.
In December 2019, the FASB issued Accounting Standards Update 2019-12, Income Taxes (Topic 740):
Simplifying the Accounting for Income Taxes
(“ASU 2019-12”), which removes the following exceptions for the Company to analyze in a given period; the exception to the incremental approach for intraperiod tax allocation; the exception to accounting for basis differences when there are ownership changes in foreign investments; and the exception in interim periods income tax accounting for year-to-date losses that exceed anticipated losses. ASU 2019-12 is effective for fiscal years beginning after December 15, 2020, including interim periods within those fiscal years, with early adoption permitted. The Company is currently evaluating the impact that adopting this guidance will have on the audited Consolidated Financial Statements or notes thereto.
The Company has considered all other recently issued accounting pronouncements and does not believe the adoption of such pronouncements will have a material impact on its audited Consolidated Financial Statements or notes thereto.
|
2.
|
REVENUE FROM CONTRACTS WITH CUSTOMERS
|
Revenue Recognition
The Company derives revenue principally from the sale of advertising to national, regional and local businesses in
Noovie
, our cinema advertising and entertainment pre-show seen on movie screens across the U.S., as well as on our LEN, a series of strategically-placed screens located in movie theater lobbies, as well as other forms of advertising and promotions in theater lobbies. We also sell digital online and mobile advertising through our
Cinema Accelerator
product and across our suite of
Noovie
digital properties, including
Noovie.com, Noovie Shuffle, Name That Movie, Noovie Arcade,
and
Fantasy Movie League
, in order to reach entertainment audiences beyond the theater. The Company also has a long-term agreement to exhibit the advertising of the founding members’ beverage suppliers.
National and regional advertising, including advertising under the beverage concessionaire and PSA agreements, are sold on a CPM basis. The Company recognizes national and regional advertising over time as impressions (or theater attendees) are delivered. National advertising is also sold to content partners. The content partners provide the Company with original entertainment content segments, typically
90
seconds in length, that are entertaining, informative, or educational in nature in the
Noovie
pre-show and they make commitments to buy a portion of the Company’s advertising inventory at a specified CPM. The Company recognizes revenue for the content segments ratably over time as the content segments air. Local advertising is sold on a per-screen, per-week basis and to a lesser extent on a CPM basis. The Company recognizes local on-screen advertising revenue over the period in which the advertising airs as dictated by the underlying sales contracts. When sold separately, LEN advertising and lobby promotions are sold based on length and breadth of the promotion. The Company recognizes revenue derived from lobby network and promotions over time when the advertising is displayed in theater lobbies.
61
NATIONAL CINEMEDIA, INC. AND SUBSIDIARY
NOTES TO CONSOLIDATED FINANCIAL STATEMENTS
The Company sells online and mobile advertising on a CPM basis. The Company recognizes revenue from branded entertainment websites and mobile applications over time as the online or mobile impressions are served.
Customer contracts often include multiple advertising services to reach the moviegoer at multiple points during a theater experience. The Company considers each of these advertising services to represent distinct performance obligations of the contract and allocates a portion of the transaction price to each service based upon the standalone selling price of the service, when available. When standalone selling prices are not available or not applicable given the nature of the customer, the Company allocates the transaction price based upon all information that is reasonably available and maximizes the use of observable inputs. Methods utilized include the adjusted market and expected cost-plus margin approaches.
The Company enters into barter transactions that exchange advertising program time for products and services used principally for selling and marketing activities. The Company records barter transactions at the estimated fair value of the products and services received. Revenue for advertising barter transactions are recognized when advertising is provided, and products and services received are charged to expense when used. Revenue from barter transactions for the years ended
December 26, 2019
,
December 27, 2018
and
December 28, 2017
was
$1.8 million
,
$5.9 million
and
$0.8 million
, respectively. Expense recorded from barter transactions for the years ended
December 26, 2019
,
December 27, 2018
and
December 28, 2017
was
$2.1 million
,
$5.0 million
and
$1.4 million
, respectively. This expense is included within “Selling and marketing costs” on the respective audited Consolidated Statements of Income.
The Company makes contractual guarantees to deliver a specified number of impressions to view the customers’ advertising. If the contracted number of impressions are not delivered, the Company will run additional advertising to deliver the contracted impressions at a later date. The deferred portion of the revenue associated with undelivered impressions is referred to as a make-good provision. In rare cases, the Company will make a cash refund of the portion of the contract related to the undelivered impressions. Given the limited history of cash settlements of the make-good provision, the Company recognizes revenue on the guaranteed contracts as the impressions are delivered and no reserve for variable consideration is recorded. The Company defers the revenue associated with the make-good until the advertising airs to the theater attendance specified in the advertising contract. The make-good provision is recorded within “Accrued expenses” on the audited Consolidated Balance Sheets. As of
December 26, 2019
and
December 27, 2018
, the Company had a make-good provision of $
8.7
million and $
8.0
million, respectively.
The Company recognizes revenue as the performance obligation for the advertising services is satisfied. Invoices are generated following the processing of each revenue contract and payment is due from the customer within
30
days of the invoice date. Customers select to pay the invoice in full at the start of a contract or through equal monthly installments over the course of the contract. The Company records deferred revenue when cash payments are received, or invoices are issued, in advance of revenue being earned. Deferred revenue is classified as a current liability as it is expected to be earned within the next twelve months.
The Company does not have any contracts with terms in excess of one year that are noncancelable as of December 26, 2019. Agreements with a duration less than one year are not included within this disclosure as the Company elected to use the practical expedient in ASC 606-10-50-14 for those contracts. In addition, other of the Company’s contracts longer than one year that are cancelable are not included within this disclosure.
Disaggregation of Revenue
The Company disaggregates revenue based upon the type of customer: national; local and regional; and beverage concessionaire. This method of disaggregation is in alignment with how revenue is reviewed by management and discussed with and historically disclosed to investors.
The following table summarizes revenue from contracts with customers for the years ended
December 26, 2019
,
December 27, 2018
and
December 28, 2017
:
|
Years ended
|
|||||||||||
|
December 26, 2019
|
December 27, 2018
|
December 28, 2017
|
|||||||||
|
National advertising revenue
|
$
|
324.2
|
|
$
|
312.0
|
|
$
|
296.3
|
|
||
|
Local advertising revenue
(1)
|
66.9
|
|
70.7
|
|
88.8
|
|
|||||
|
Regional advertising revenue
(1)
|
24.7
|
|
27.3
|
|
11.1
|
|
|||||
|
Founding member advertising revenue from beverage concessionaire agreements
|
29.0
|
|
31.4
|
|
29.9
|
|
|||||
|
Total revenue
|
$
|
444.8
|
|
$
|
441.4
|
|
$
|
426.1
|
|
||
62
NATIONAL CINEMEDIA, INC. AND SUBSIDIARY
NOTES TO CONSOLIDATED FINANCIAL STATEMENTS
|
(1)
|
The Company redesigned the local and regional sales teams at the end of 2017, resulting in a reallocation of sales team members and customers from the local team in 2017 to the regional team in 2018 which resulted in the large increase in regional advertising revenue and corresponding decrease in local advertising revenue from 2017 to 2018.
|
Deferred Revenue and Unbilled Accounts Receivable
The changes in deferred revenue for the year ended
December 26, 2019
were as follows (in millions):
|
Year ended
|
|||
|
December 26, 2019
|
|||
|
Balance at beginning of year
|
$
|
(7.3
|
)
|
|
Performance obligations satisfied
|
7.3
|
|
|
|
New contract liabilities
|
(7.6
|
)
|
|
|
Balance at end of year
|
$
|
(7.6
|
)
|
Unbilled accounts receivable is classified as a current asset as it is expected to be billed within the next twelve months. As of
December 26, 2019
and
December 27, 2018
, the Company had
$8.0 million
and
$6.0 million
, respectively, in unbilled accounts receivable, included within the accounts receivable balance.
Practical Expedients and Exemptions
The Company expenses sales commissions when incurred as the amortization period would have been one year or less. These costs are recorded within “Selling and marketing costs” in the audited Consolidated Statement of Income.
The Company does not disclose the value of unsatisfied performance obligations for contracts with an original expected length of one year or less.
|
3.
|
EARNINGS PER SHARE
|
Basic earnings per share is computed on the basis of the weighted average number of common shares outstanding. Diluted earnings per share is computed on the basis of the weighted average number of common shares outstanding plus the effect of potentially dilutive common stock options, restricted stock, and exchangeable NCM LLC common units using the treasury stock method. The components of basic and diluted earnings per NCM, Inc. share are as follows:
|
|
Years Ended
|
||||||||||
|
|
December 26, 2019
|
December 27, 2018
|
December 28, 2017
|
||||||||
|
Net income attributable to NCM, Inc. (in millions)
|
$
|
36.1
|
|
$
|
29.8
|
|
$
|
58.3
|
|
||
|
Net income attributable to NCM, Inc. following
conversion of dilutive membership units (net of
estimated taxes of $0.0, $22.2 and $42.5) (in millions)
|
$
|
36.1
|
|
$
|
58.0
|
|
$
|
72.0
|
|
||
|
Weighted average shares outstanding:
|
|||||||||||
|
Basic
|
77,345,577
|
|
76,859,087
|
|
65,226,817
|
|
|||||
|
Add: Dilutive effect of stock options, restricted
stock, and exchangeable NCM LLC common
membership units
|
436,990
|
|
80,544,823
|
|
85,840,453
|
|
|||||
|
Diluted
|
77,782,567
|
|
157,403,910
|
|
151,067,270
|
|
|||||
|
Earnings per NCM, Inc. share:
|
|||||||||||
|
Basic
|
$
|
0.47
|
|
$
|
0.39
|
|
$
|
0.89
|
|
||
|
Diluted
|
$
|
0.46
|
|
$
|
0.37
|
|
$
|
0.48
|
|
||
The effect of the
81,450,384
exchangeable NCM LLC common membership units held by the founding members for the year ended
December 26, 2019
was excluded from the calculation of diluted weighted average shares and earnings per NCM, Inc. share as it was antidilutive in that period. However, the diluted weighted average shares outstanding assumes the conversion of all founding member common units to NCM, Inc. shares for the years ended
December 27, 2018
and
December 28, 2017
because such effect was dilutive. Upon the conversion of all common units, all of consolidated NCM LLC net income would be attributable to NCM, Inc. and thus has been utilized as the numerator of the diluted EPS calculation. Consolidated NCM LLC net income has been tax effected utilizing NCM, Inc.’s effective tax rates of
44.1%
and
75.6%
for the years ended
December 27, 2018
and
December 28, 2017
, respectively. NCM LLC common membership units do not
63
NATIONAL CINEMEDIA, INC. AND SUBSIDIARY
NOTES TO CONSOLIDATED FINANCIAL STATEMENTS
participate in dividends paid on NCM, Inc.’s common shares. In addition, there were
2,568,418
,
2,141,535
and
2,583,196
stock options and non-vested (restricted) shares for the years ended
December 26, 2019
,
December 27, 2018
and
December 28, 2017
, respectively, excluded from the calculation as they were antidilutive, primarily because exercise prices associated with those shares were above the average market value. The Company’s non-vested (restricted) shares do not meet the definition of a participating security as the dividends will not be paid if the shares do not vest.
|
4.
|
PROPERTY AND EQUIPMENT
|
The following is a summary of property and equipment, at cost less accumulated depreciation (in millions):
|
|
As of
|
||||||
|
|
December 26, 2019
|
December 27, 2018
|
|||||
|
Equipment, computer hardware and software
|
$
|
93.5
|
|
$
|
90.8
|
|
|
|
Leasehold improvements
|
2.4
|
|
2.4
|
|
|||
|
Less: Accumulated depreciation
|
(70.7
|
)
|
(62.5
|
)
|
|||
|
Subtotal
|
25.2
|
|
30.7
|
|
|||
|
Construction in progress
|
8.0
|
|
2.9
|
|
|||
|
Total property and equipment
|
$
|
33.2
|
|
$
|
33.6
|
|
|
|
5.
|
INTANGIBLE ASSETS
|
The Company’s intangible assets consist of contractual rights to provide its services within the theaters of the founding members and network affiliates. The Company records amortization using the straight-line method over the contractual life of the intangibles, corresponding to the term of the ESAs or the term of the contract with the network affiliate. The Company’s intangible assets with the founding members are recorded at the fair market value of NCM, Inc.’s publicly traded stock as of the date on which the common membership units were issued. The NCM LLC common membership units are fully convertible into NCM, Inc.’s common stock. The Company also records intangible assets for upfront fees paid to network affiliates upon commencement of a network affiliate agreement. Pursuant to ASC 350-10—
Intangibles—Goodwill and Other,
the Company’s intangible assets have a finite useful life and the Company amortizes the assets over the remaining useful life corresponding with the ESAs or the term of the contract with the network affiliate. The Company extended the useful life of the intangible asset for Cinemark and Regal following the extension of the ESA term in conjunction with the 2019 ESA Amendments. There was no impact to the Payable to founding members under tax receivable agreement as the useful life of the intangible assets were not deemed to be extended for tax purposes and there were no changes made to the tax receivable agreements.
Common Unit Adjustments—
In accordance with NCM LLC’s Common Unit Adjustment Agreement with its founding members, on an annual basis NCM LLC determines the amount of common membership units to be issued to or returned by the founding members based on theater additions or dispositions during the previous year. In addition, NCM LLC’s Common Unit Adjustment Agreement requires that a Common Unit Adjustment occur for a specific founding member if its acquisition or disposition of theaters, in a single transaction or cumulatively since the most recent Common Unit Adjustment, results in an attendance increase or decrease in excess of two percent of the annual total attendance at the prior adjustment date.
Integration Payments and Other Encumbered Theater Payments—
If an existing on-screen advertising agreement with an alternative provider is in place with respect to any acquired theaters, the founding members may elect to receive common membership units related to those encumbered theaters in connection with the Common Unit Adjustment. If the founding members make this election, then they are required to make payments on a quarterly basis in arrears in accordance with certain run-out provisions pursuant to the ESAs (“integration payments”). Because the Carmike and Rave theaters are subject to an existing on-screen advertising agreement with an alternative provider, AMC and Cinemark will make integration payments to NCM LLC. The integration payments will continue until the earlier of (i) the date the theaters are transferred to NCM LLC’s network or (ii) the expiration of the ESA. Integration payments are calculated based upon the advertising cash flow that the Company would have generated if it had exclusive access to sell advertising in the theaters with pre-existing advertising agreements. The ESA additionally entitles NCM LLC to payments related to the founding members’ on-screen advertising commitments under their beverage concessionaire agreements for encumbered theaters (“encumbered theater payments”). These payments are also accounted for as a reduction to the intangible asset. If common membership units are issued to a founding member for newly acquired theaters that are subject to an existing on-screen advertising agreement with an alternative provider, the amortization of the intangible asset commences after the existing agreement expires and NCM LLC can utilize the theaters for all of its services.
64
NATIONAL CINEMEDIA, INC. AND SUBSIDIARY
NOTES TO CONSOLIDATED FINANCIAL STATEMENTS
The following is a summary of the Company’s intangible asset’s activity (in millions) during
2019
and
2018
:
|
|
As of
December 27,
2018
|
Additions
(1)
|
Disposals
(2)
|
Amortization
|
Integration
and other encumbered theater payments
(4)
|
As of
December 26,
2019
|
|||||||||||||||||
|
Gross carrying amount
|
$
|
857.2
|
|
$
|
8.9
|
|
$
|
(1.2
|
)
|
$
|
—
|
|
$
|
(22.3
|
)
|
$
|
842.6
|
|
|||||
|
Accumulated amortization
|
(172.7
|
)
|
—
|
|
0.5
|
|
(26.7
|
)
|
—
|
|
(198.9
|
)
|
|||||||||||
|
Total intangible assets, net
|
$
|
684.5
|
|
$
|
8.9
|
|
$
|
(0.7
|
)
|
$
|
(26.7
|
)
|
$
|
(22.3
|
)
|
$
|
643.7
|
|
|||||
|
|
As of
December 28, 2017
|
Additions
(3)
|
Amortization
|
Integration and other encumbered theater payments
(4)
|
As of
December 27, 2018
|
||||||||||||||
|
Gross carrying amount
|
$
|
862.6
|
|
$
|
16.0
|
|
$
|
—
|
|
$
|
(21.4
|
)
|
$
|
857.2
|
|
||||
|
Accumulated amortization
|
(145.4
|
)
|
—
|
|
(27.3
|
)
|
—
|
|
(172.7
|
)
|
|||||||||
|
Total intangible assets, net
|
$
|
717.2
|
|
$
|
16.0
|
|
$
|
(27.3
|
)
|
$
|
(21.4
|
)
|
$
|
684.5
|
|
||||
|
(1)
|
During the first quarter of 2019, NCM LLC issued
1,044,665
common membership units to its founding members for the rights to exclusive access to the theater screens and attendees added, net of dispositions by the founding members to NCM LLC’s network during the 2018 fiscal year and NCM LLC recorded a net intangible asset of
$7.6
million during the first quarter of 2019 as a result of the Common Unit Adjustment.
|
During the third quarter of 2019, the Company capitalized
$1.3 million
of legal and professional costs incurred in conjunction with the 2019 ESA Amendments which extended the useful life of the intangible asset for Cinemark and Regal.
|
(2)
|
During the second quarter of 2019, AMC purchased one of the Company's affiliates and the Company wrote off the related intangible asset balance and accumulated amortization. A portion of the net book balance was reimbursed by AMC. The acquired theaters will be included within the Common Unit Adjustment calculation for AMC in March of 2020.
|
During the fourth quarter of 2019, one of the Company's affiliates closed. As such, the Company wrote off the related intangible asset balance and accumulated amortization.
|
(3)
|
During the first quarter of 2018, NCM LLC issued
2,821,710
(
3,736,860
issued, net of
915,150
returned) common membership units to its founding members for the rights to exclusive access to net new theater screens and attendees added by the founding members to NCM LLC’s network during 2017 and NCM LLC recorded a net intangible asset of
$15.9
million in the first quarter of 2018 as a result of these Common Unit Adjustments.
|
During 2018, the Company purchased intangible assets for
$0.1
million associated with network affiliate agreements.
|
(4)
|
Carmike and Rave Cinemas had pre-existing advertising agreements for some of the theaters it owned prior to their acquisitions by AMC and Cinemark. As a result, AMC and Cinemark will make integration and other encumbered theater payments over the remaining term of those agreements. During the years ended
December 26, 2019
and
December 27, 2018
, NCM LLC recorded a reduction to net intangible assets of
$22.3 million
and
$21.4 million
, respectively, related to integration and other encumbered theater payments due from AMC and Cinemark. During the year ended
December 26, 2019
and
December 27, 2018
, AMC and Cinemark paid a total of
$21.7 million
and
$22.7 million
, respectively, related to integration and other encumbered theater payments.
|
As of
December 26, 2019
and
December 27, 2018
, the Company’s intangible assets related to the founding members, net of accumulated amortization, was
$620.5 million
and
$657.5 million
, respectively, with weighted average remaining lives of
20.0 years
and
18.2 years
, respectively.
As of
December 26, 2019
and
December 27, 2018
, the Company’s intangible assets related to the network affiliates, net of accumulated amortization, was
$23.1 million
and
$26.9 million
, respectively, with weighted average remaining lives of
5.4 years
and
10.0 years
, respectively.
65
NATIONAL CINEMEDIA, INC. AND SUBSIDIARY
NOTES TO CONSOLIDATED FINANCIAL STATEMENTS
As of
December 26, 2019
and
December 27, 2018
, the Company’s intangible assets related to acquired software, net of accumulated amortization, was
$0.1 million
and
$0.1 million
, respectively, with weighted average remaining lives of
0.5 years
and
1.5 years
, respectively.
The estimated aggregate amortization expense for each of the five succeeding years is as follows (in millions):
|
Year
|
Amortization
|
|||
|
2020
|
$
|
24.1
|
|
|
|
2021
|
24.0
|
|
||
|
2022
|
23.7
|
|
||
|
2023
|
23.3
|
|
||
|
2024
|
23.3
|
|
||
|
6.
|
ACCRUED EXPENSES
|
The following is a summary of the Company’s accrued expenses (in millions):
|
|
As of
|
||||||
|
|
December 26, 2019
|
December 27, 2018
|
|||||
|
Make-good reserve
|
$
|
8.7
|
|
$
|
8.0
|
|
|
|
Accrued interest
|
11.4
|
|
10.3
|
|
|||
|
Deferred rent
|
—
|
|
0.2
|
|
|||
|
Other accrued expenses
|
2.0
|
|
3.2
|
|
|||
|
Total accrued expenses
|
$
|
22.1
|
|
$
|
21.7
|
|
|
|
7.
|
INCOME TAXES
|
The Company is subject to taxation in the U.S. and various states. The Company’s tax returns for the calendar years
2016
through
2018
remain open to examination by the IRS in their entirety. With respect to state taxing jurisdictions, the Company’s tax returns for calendar years ended
2015
through
2018
are eligible for examination by various state revenue services.
Tax Receivable Agreement
—On the IPO date, NCM, Inc. and the founding members entered into a TRA. Under the terms of this agreement, NCM, Inc. will make cash payments to the founding members in amounts equal to
90%
of NCM, Inc.’s actual tax benefit realized from the tax amortization of the intangible assets described below. For purposes of the TRA, cash savings in income and franchise tax will be computed by comparing NCM, Inc.’s actual income and franchise tax liability to the amount of such taxes that NCM, Inc. would have been required to pay had there been no increase in NCM, Inc.’s proportionate share of tax basis in NCM LLC’s tangible and intangible assets and had the TRA not been entered into. The TRA applies to NCM, Inc.’s taxable years up to and including the 30t
h
anniversary date of the offering. The Company paid the founding members
$14.8 million
in
2019
for the 2018 tax year,
$18.4 million
in
2018
for the 2017 tax year and
$18.8 million
in
2017
for the 2016 tax year.
NCM, Inc. recorded a long-term payable to founding members related to the TRA. Changes in the tax rate each period led to a re-measurement of the payable resulting in an increase of
$1.1 million
during the year ended December 26, 2019 and decreases of
$3.8 million
and
$192.2 million
during the years ended
December 27, 2018
and
December 28, 2017
, respectively. The decrease of
$192.2 million
during the year ended December 28, 2017 was related to Tax Reform, as described further below.
66
NATIONAL CINEMEDIA, INC. AND SUBSIDIARY
NOTES TO CONSOLIDATED FINANCIAL STATEMENTS
Provision for Income Taxes
—The Company has provided total income taxes, as follows (in millions)
|
|
Years Ended
|
||||||||||
|
|
December 26, 2019
|
December 27, 2018
|
December 28, 2017
|
||||||||
|
Current:
|
|||||||||||
|
Federal
|
$
|
—
|
|
$
|
(0.3
|
)
|
$
|
(1.6
|
)
|
||
|
State
|
0.3
|
|
0.5
|
|
—
|
|
|||||
|
Total current income tax (benefit)/expense
|
0.3
|
|
0.2
|
|
(1.6
|
)
|
|||||
|
Deferred:
|
|||||||||||
|
Federal
|
10.0
|
|
13.2
|
|
142.1
|
|
|||||
|
State
|
2.1
|
|
10.1
|
|
39.8
|
|
|||||
|
Total deferred income tax expense
|
12.1
|
|
23.3
|
|
181.9
|
|
|||||
|
Total income tax provision on Consolidated
Statements of Income
|
$
|
12.4
|
|
$
|
23.5
|
|
$
|
180.3
|
|
||
A reconciliation of the provision for income taxes as reported and the amount computed by multiplying income before taxes, less noncontrolling interest, by the U.S. federal statutory rate of
21.0%
as of
December 26, 2019
and
December 27, 2018
and
35.0%
as of
December 28, 2017
was (in millions):
|
|
Years Ended
|
||||||||||
|
|
December 26, 2019
|
December 27, 2018
|
December 28, 2017
|
||||||||
|
Provision calculated at federal statutory income
tax rate:
|
|||||||||||
|
Income before income taxes
|
$
|
20.8
|
|
$
|
21.8
|
|
$
|
102.6
|
|
||
|
Less: Noncontrolling interests
|
(10.6
|
)
|
(10.6
|
)
|
(19.7
|
)
|
|||||
|
Income attributable to NCM, Inc.
|
10.2
|
|
11.2
|
|
82.9
|
|
|||||
|
Current year change to enacted federal and
state rate
(1)
|
(0.7
|
)
|
6.5
|
|
92.2
|
|
|||||
|
State and local income taxes, net of federal
benefit
|
1.7
|
|
2.6
|
|
8.7
|
|
|||||
|
NCM LLC income taxes
|
0.2
|
|
0.4
|
|
0.2
|
|
|||||
|
Share-based compensation
|
0.3
|
|
1.1
|
|
0.8
|
|
|||||
|
Uncertain tax positions
(2)
|
—
|
|
(0.4
|
)
|
(1.7
|
)
|
|||||
|
Change in the valuation allowance
|
0.9
|
|
0.5
|
|
(4.2
|
)
|
|||||
|
NCM LLC membership unit issuance to
NCM, Inc.
|
0.2
|
|
0.2
|
|
0.5
|
|
|||||
|
Executive compensation
|
0.4
|
|
1.4
|
|
0.4
|
|
|||||
|
Other
|
(0.8
|
)
|
—
|
|
0.5
|
|
|||||
|
Total income tax provision
|
$
|
12.4
|
|
$
|
23.5
|
|
$
|
180.3
|
|
||
|
(1)
|
Refer to the discussion of the impact of the Tax Act within the ‘Tax Reform’ section below.
|
|
(2)
|
During the year ended December 31, 2015, the Company established a reserve for material, known tax exposures of
$4.9 million
, including accrued interest and penalties. The reserve related to tax exposures from prior periods (2010 through 2014). During the years ended
December 26, 2019
,
December 27, 2018
and
December 28, 2017
the Company reversed approximately
$0.0 million
of its reserve,
$0.4 million
of its reserve (
$0.3 million
of income tax benefits and
$0.1 million
of accrued interest and penalties) and
$1.7 million
(
$1.3 million
of income tax benefits and
$0.4 million
of accrued interest and penalties), respectively, because the statute of limitations expired.
|
67
NATIONAL CINEMEDIA, INC. AND SUBSIDIARY
NOTES TO CONSOLIDATED FINANCIAL STATEMENTS
Deferred Tax Assets
—Significant components of the Company’s deferred tax assets consisted of the following (in millions):
|
|
Years Ended
|
||||||
|
|
December 26, 2019
|
December 27, 2018
|
|||||
|
Deferred tax assets:
|
|||||||
|
Investment in consolidated subsidiary NCM
LLC
(1)
|
$
|
218.9
|
|
$
|
233.5
|
|
|
|
Share-based compensation
|
3.0
|
|
3.0
|
|
|||
|
Net operating losses
|
19.2
|
|
15.8
|
|
|||
|
Accrued bonus
|
0.4
|
|
0.5
|
|
|||
|
Other
|
2.2
|
|
1.2
|
|
|||
|
Total gross deferred tax assets
|
243.7
|
|
254.0
|
|
|||
|
Valuation allowance
(1)
|
(81.6
|
)
|
(80.1
|
)
|
|||
|
Total deferred tax assets, net of valuation allowance
|
$
|
162.1
|
|
$
|
173.9
|
|
|
|
(1)
|
The Company recognized a deferred tax asset in the amount of $
218.9
million and $
233.5
million as of 2019 and 2018, respectively, associated with the basis difference in our investment in NCM LLC. However, a portion of the total basis difference will only reverse upon a sale of the Company’s interest in NCM LLC, which the Company expects would result in a capital loss for which no offsetting capital gain is expected. Therefore, as of
December 26, 2019
and
December 27, 2018
the Company has a valuation allowance in the amount of $
80.6
million and $
80.1
million, respectively, against the deferred tax asset to which this portion relates. The change in this portion of the valuation allowance from
December 27, 2018
to
December 26, 2019
was primarily driven by outside basis differences which do not impact tax expense and thus are not reflected within the rate reconciliation presented above.
|
Tax Reform
—On December 22, 2017, the U.S. government enacted the Tax Act which makes broad and complex changes to the U.S. tax code that affected the Company’s fiscal year ending December 27, 2018, including, but not limited to, (1) reducing the U.S. federal corporate tax rate, (2) allowing full expensing of qualified property, (3) creating a new limitation on deductible interest expense; (4) changing rules related to uses and limitations of net operating loss carryforwards created in tax years beginning after December 31, 2017, and (5) limiting the amount of compensation that can be deducted for highly compensated officers by terminating the exclusion of performance-based compensation from the
$1 million
per employee, per year limitation. The decrease in the U.S. federal corporate tax rate decreased NCM, Inc.’s blended state and federal rate from
38.58%
during the year ended December 28, 2017 to
25.38%
during the year ended December 27, 2018.
The Company recorded a
$191.0 million
reduction to the ‘Payable to founding members under the TRA’ related to the reduction of the U.S. federal corporate tax rate. The reduction was recorded as a gain of
$191.0 million
within non-operating income within the Consolidated Statements of Income. Additionally, the Company revalued its deferred balances utilizing the lower blended state and federal rate resulting in a reduction of the net deferred tax asset of
$92.2 million
. The reduction of the net deferred tax asset was recorded as an increase in deferred tax expense. The payments to the founding members under the TRA during 2019, decreased $8.0 million due to the decrease in the U.S. federal corporate tax rate under the Tax Act.
Carryforwards
—As of
December 26, 2019
, the Company had gross federal net operating loss carryforwards of approximately
$72.2 million
, of which
$47.0 million
will expire between
2034
through
2037
and
$25.2 million
will be carried forward indefinitely. As of
December 26, 2019
, the Company had gross state net operating loss carryforwards of approximately
$79.7 million
, of which
$71.3 million
will expire between
2022
and
2039
and
$8.4 million
will be carried forward indefinitely. As of December 26 2019, the Company had gross capital loss carryforwards of approximately $0.1 million, which will expire in 2024. As of December 26, 2019, the Company had gross federal and state research and experimentation tax credit carryforwards of approximately
$1.5 million
, which expire at various dates between
2030
and
2039
.
|
8.
|
EQUITY
|
As of
December 26, 2019
, the Company has authorized capital stock of
175,000,000
shares of common stock, par value of
$0.01
per share, and
10,000,000
shares of preferred stock, par value of
$0.01
per share. There were
no
shares of preferred stock issued or outstanding as of
December 26, 2019
. There were
77,568,986
shares of common stock issued and outstanding as of
December 26, 2019
.
68
NATIONAL CINEMEDIA, INC. AND SUBSIDIARY
NOTES TO CONSOLIDATED FINANCIAL STATEMENTS
The holders of NCM, Inc. common stock are entitled to
one
vote per share on all matters submitted for action by the NCM, Inc. stockholders. Holders of common stock are entitled to share equally, share for share, in declared dividends.
The authorized but unissued shares of common stock and preferred stock are available for future issuance without stockholder approval. These additional shares may be used for a variety of corporate purposes, including share based compensation, future public offerings to raise additional capital, corporate acquisitions and exchange on a one-for-one basis under the founding members’ right to convert their NCM LLC membership units into Company common stock.
NCM LLC’s founding members received all proceeds from NCM, Inc.’s IPO and related issuances of debt, except for amounts needed to pay out-of-pocket costs of the financings and other expenses. The ESAs with the founding members were amended and restated in conjunction with the IPO under which NCM LLC became the exclusive provider of advertising services to the founding members for a
30
-year term. In conformity with accounting guidance of the SEC concerning monetary consideration paid to promoters, such as the founding members, in exchange for property conveyed by the promoters, the excess over predecessor cost was treated as a special distribution. Because the founding members had no cost basis in the ESAs, nearly all payments to the founding members with the proceeds of the IPO and related debt, have been accounted for as distributions. The distributions by NCM LLC to the founding members made at the date of the IPO resulted in a consolidated stockholders’ deficit. As a noncontrolling interest cannot be shown as an asset, the founding members’ interest in NCM LLC’s members equity is included in distributions in excess of paid in capital in the accompanying Consolidated Balance Sheets.
|
9.
|
RELATED PARTY TRANSACTIONS
|
Founding Member Transactions
—In connection with NCM, Inc.’s IPO, the Company entered into several agreements to define and regulate the relationships among NCM, Inc., NCM LLC and the founding members which are outlined below. As AMC owns less than 5% of NCM LLC as of
December 26, 2019
, AMC is no longer a related party. AMC remains a party to the ESA, Common Unit Adjustment Agreement, TRA and certain other original agreements, and AMC will continue to participate in the annual Common Unit Adjustment, receive TRA payments, receive theater access fee payments, and make payments under the beverage concessionaire agreements, among other things. AMC is not currently a member under the terms of the NCM LLC Operating Agreement and will not receive available cash distributions or allocation of earnings and losses in NCM LLC, unless it receives NCM LLC membership units pursuant to a Common Unit Adjustment. Further, AMC's ownership percentage does not impact future integration payments and other encumbered theater payments owed to NCM LLC by AMC. AMC is considered a related party through the date it fell below the 5% ownership threshold (July 5, 2018) and related party transactions with AMC through this period are included within the disclosures below (specifically the first six months of 2018 and all of 2017).
The material agreements with the founding members are as follows:
|
•
|
ESAs.
Under the ESAs, NCM LLC is the exclusive provider within the United States of advertising services in the founding members’ theaters (subject to pre-existing contractual obligations and other limited exceptions for the benefit of the founding members). The advertising services include the use of the DCN equipment required to deliver the on-screen advertising and other content included in the
Noovie
pre-show, use of the LEN and rights to sell and display certain lobby promotions. Further,
30
to
60 seconds
of advertising included in the
Noovie
pre-show is sold to the founding members to satisfy the founding members’ on-screen advertising commitments under their beverage concessionaire agreements. In consideration for access to the founding members’ theaters, theater patrons, the network equipment required to display on-screen and LEN video advertising and the use of theaters for lobby promotions, the founding members receive a monthly theater access fee. In conjunction with the 2019 ESA Amendments, NCM LLC also pays Cinemark and Regal incremental monthly theater access fees and, subject to NCM LLC's use of specified inventory, a revenue share in consideration for NCM LLC's access to certain on-screen advertising inventory after the advertised showtime of a feature film beginning November 1, 2019 and the underlying term of the ESAs were extended until 2041. The ESAs and 2019 ESA Amendments are considered leases with related parties under ASC 842.
|
|
•
|
Common Unit Adjustment Agreement.
The common unit adjustment agreement provides a mechanism for increasing or decreasing the membership units held by the founding members based on the acquisition or construction of new theaters or sale of theaters that are operated by each founding member and included in NCM LLC’s network.
|
|
•
|
Tax Receivable Agreement.
The TRA provides for the effective payment by NCM, Inc. to the founding members of
90%
of the amount of cash savings, if any, in U.S. federal, state and local income tax or franchise tax that is actually realized as a result of certain increases in NCM, Inc.’s proportionate share of tax basis in NCM LLC’s tangible and intangible assets resulting from the IPO and related transactions.
|
69
NATIONAL CINEMEDIA, INC. AND SUBSIDIARY
NOTES TO CONSOLIDATED FINANCIAL STATEMENTS
|
•
|
Software License Agreement.
At the date of the Company’s IPO, NCM LLC was granted a perpetual, royalty-free license from the founding members to use certain proprietary software that existed at the time for the delivery of digital advertising and other content through the DCN to screens in the U.S. NCM LLC has made improvements to this software since the IPO date and NCM LLC owns those improvements, except for improvements that were developed jointly by NCM LLC and the founding members, if any.
|
Following is a summary of the related party transactions between the Company and the founding members (in millions):
|
|
Years Ended
|
||||||||||
|
Included in the Consolidated Statements of Income:
(1)
|
December 26, 2019
|
December 27, 2018
|
December 28, 2017
|
||||||||
|
Revenue:
|
|||||||||||
|
Beverage concessionaire revenue (included in
advertising revenue)
(2)
|
$
|
23.0
|
|
$
|
28.4
|
|
$
|
29.9
|
|
||
|
Operating expenses:
|
|||||||||||
|
Theater access fee and revenue share
(3)
|
56.6
|
|
69.0
|
|
76.5
|
|
|||||
|
Purchase of movie tickets and concession products and
rental of theater space (included in selling and
marketing costs)
(4)
|
0.4
|
|
1.1
|
|
2.1
|
|
|||||
|
Purchase of movie tickets and concession products and
rental of theater space (included in advertising
operating costs)
|
0.1
|
|
0.1
|
|
0.1
|
|
|||||
|
Non-operating expenses:
|
|||||||||||
|
Interest income from notes receivable (included in
interest income)
(5)
|
0.2
|
|
0.3
|
|
0.6
|
|
|||||
|
(1)
|
AMC is no longer considered a related party as of July 5, 2018, as described further above. As such, the figures within the table above only include related party activity with AMC for the first six months of 2018 and the year ended December 28, 2017.
|
|
(2)
|
For the full years ended
December 26, 2019
,
December 27, 2018
and
December 28, 2017
, two of the founding members purchased
60 seconds
of on-screen advertising time and one founding member purchased
30 seconds
(with all three founding members having a right to purchase up to
90 seconds
) from NCM LLC to satisfy their obligations under their beverage concessionaire agreements at a
30
second equivalent CPM rate specified by the ESA.
|
|
(3)
|
Comprised of payments per theater attendee, payments per digital screen with respect to the founding member theaters included in the Company’s network, payments for access to higher quality digital cinema equipment and payments to Cinemark and Regal for their portion of the Platinum Spot revenue for the utilization of the theaters post-showtime in accordance with the 2019 ESA Amendments.
|
|
(4)
|
Used primarily for marketing to NCM LLC’s advertising clients.
|
|
(5)
|
Refer to the discussion of the Fathom Events sale under AC JV, LLC transactions below.
|
|
|
As of
|
||||||
|
Included in the Consolidated Balance Sheets:
|
December 26, 2019
|
December 27, 2018
|
|||||
|
Current portion of note receivable
(1) (2)
|
$
|
—
|
|
$
|
4.2
|
|
|
|
Interest receivable on notes receivable (included in other current assets)
(2)
|
—
|
|
0.1
|
|
|||
|
Common unit adjustments, net of amortization and integration payments (included in
intangible assets)
(3)
|
620.5
|
|
657.5
|
|
|||
|
Current payable to founding members under the TRA
(1) (4)
|
10.3
|
|
11.2
|
|
|||
|
Long-term payable to founding members under the TRA
(1) (4)
|
133.5
|
|
141.1
|
|
|||
|
|
|
(1)
|
AMC is no longer considered a related party as of July 5, 2018, as described further above. As such, the figures within the table above do not include AMC.
|
|
(2)
|
Refer to the discussion of the Fathom Events sale under AC JV, LLC transactions below.
|
|
(3)
|
Refer to Note 5—
Intangible Assets
for further information on common unit adjustments and integration payments.
|
70
NATIONAL CINEMEDIA, INC. AND SUBSIDIARY
NOTES TO CONSOLIDATED FINANCIAL STATEMENTS
|
(4)
|
The Company paid Cinemark and Regal
$3.7 million
and
$6.7 million
, respectively, in payments pursuant to the TRA during 2019 which was for the 2018 tax year. The Company paid AMC, Cinemark and Regal
$5.4 million
,
$4.6 million
and
$8.4 million
, respectively, in payments pursuant to the TRA during 2018 which was for the 2017 tax year. As AMC is no longer considered a related party as of July 5, 2018, the AMC TRA payment includes only related party activity with AMC for the six months ended June 28, 2018.
|
At the date of the Company’s IPO, NCM LLC was granted a perpetual, royalty-free license from the founding members to use certain proprietary software that existed at the time for the delivery of digital advertising and other content through the DCN to screens in the U.S. NCM LLC has made improvements to this software since the IPO date and NCM LLC owns those improvements, except for improvements that were developed jointly by NCM LLC and the founding members, if any.
Pursuant to the terms of the NCM LLC Operating Agreement in place since the completion of the IPO, NCM LLC is required to make mandatory distributions on a proportionate basis to its members of available cash, as defined in the NCM LLC Operating Agreement, on a quarterly basis in arrears. Mandatory distributions for the years ended
December 26, 2019
,
December 27, 2018
and
December 28, 2017
are as shown within the table below (in millions). The amount presented within the tables for the distribution paid to AMC for the year ended
December 27, 2018
represents only the distribution for the three months ended March 29, 2018 to AMC. AMC’s distribution for the three months ended June 28, 2018 was paid to Cinemark and Regal to accommodate agreements between AMC and each of Cinemark and Regal related to the sale. Further, there was no distribution shown to AMC for the year ended
December 26, 2019
or the last six months of 2018 as they were no longer a related party.
|
|
Years Ended
|
||||||||||
|
|
December 26, 2019
|
December 27, 2018
|
December 28, 2017
|
||||||||
|
AMC
|
$
|
—
|
|
$
|
2.2
|
|
$
|
27.1
|
|
||
|
Cinemark
|
37.2
|
|
34.3
|
|
29.1
|
|
|||||
|
Regal
|
39.1
|
|
35.8
|
|
28.8
|
|
|||||
|
Total founding members
|
76.3
|
|
72.3
|
|
85.0
|
|
|||||
|
NCM, Inc.
|
72.5
|
|
69.1
|
|
75.9
|
|
|||||
|
Total
|
$
|
148.8
|
|
$
|
141.4
|
|
$
|
160.9
|
|
||
The mandatory distributions of available cash by NCM LLC to its founding members for the quarter ended
December 26, 2019
of
$32.4 million
, is included in amounts due to founding members in the Consolidated Balance Sheets as of
December 26, 2019
and will be made in the first quarter of 2020. The distributions to NCM, Inc. are eliminated in consolidation.
Amounts due to founding members, net as of
December 26, 2019
were comprised of the following (in millions):
|
|
Cinemark
|
Regal
|
Total
|
||||||||
|
Theater access fees and revenue share, net of beverage revenues
and other encumbered theater payments
|
$
|
2.0
|
|
$
|
2.5
|
|
$
|
4.5
|
|
||
|
Distributions payable to founding members
|
15.8
|
|
16.6
|
|
32.4
|
|
|||||
|
Integration payments due from founding members
|
(0.1
|
)
|
—
|
|
(0.1
|
)
|
|||||
|
Total amounts due to founding members, net
|
$
|
17.7
|
|
$
|
19.1
|
|
$
|
36.8
|
|
||
Amounts due to founding members, net as of
December 27, 2018
were comprised of the following (in millions):
|
|
Cinemark
|
Regal
|
Total
|
||||||||
|
Theater access fees, net of beverage revenues
and other encumbered theater payments
|
$
|
1.0
|
|
$
|
1.5
|
|
$
|
2.5
|
|
||
|
Distributions payable to founding members
|
13.7
|
|
14.2
|
|
27.9
|
|
|||||
|
Integration payments due from founding members
|
(0.4
|
)
|
—
|
|
(0.4
|
)
|
|||||
|
Total amounts due to founding members, net
|
$
|
14.3
|
|
$
|
15.7
|
|
$
|
30.0
|
|
||
Common Unit Membership Redemption and AMC Mandatory Ownership Divestitures
— The NCM LLC Operating Agreement provides a redemption right of the founding members to exchange common membership units of NCM LLC for shares of the Company’s common stock on a
one
-for-one basis, or at the Company’s option, a cash payment based on the
three
-day variable weighted average closing price of NCM, Inc.’s common stock prior to the redemption date. During the year ended
71
NATIONAL CINEMEDIA, INC. AND SUBSIDIARY
NOTES TO CONSOLIDATED FINANCIAL STATEMENTS
December 28, 2017
, AMC exercised the redemption right of an aggregate
15.6 million
common membership units for a like number of shares of NCM, Inc.’s common stock. Pursuant to ASC 810-10-45, the Company accounted for the changes in its ownership interest in NCM LLC as equity transactions whereby, the issuance of shares of NCM, Inc. common stock were offset by the purchase of NCM LLC’s (a subsidiary’s) equity within the Consolidated Statement of Equity. Further,
no
gain or loss was recognized in the Consolidated Statements of Income. During the six months ended June 28, 2018 and the year ended
December 28, 2017
, AMC sold
1.0 million
and
14.8 million
shares of NCM, Inc., respectively. The Company did not receive any proceeds from the sale of its common stock by AMC. During the six months ended June 28, 2018 and the year ended
December 28, 2017
, AMC received cash dividends of approximately
$0.3 million
and
$0.1 million
, respectively, on its shares of NCM, Inc. common stock. AMC sold
21,477,480
NCM LLC membership units to Cinemark and Regal in July 2018.
Network Affiliate Transactions
—NCM LLC paid a network affiliate owned by a family member of a director on the Company's Board of Directors
$0.6 million
,
$0.5 million
, and
$0.5 million
in circuit share payments during the years ended
December 26, 2019
,
December 27, 2018
and
December 28, 2017
, respectively.
AC JV, LLC Transactions
—In December 2013, NCM LLC sold its Fathom Events business to a newly formed limited liability company (“AC JV, LLC”) owned
32%
by each of the founding members and
4%
by NCM LLC. In consideration for the sale, NCM LLC received a total of
$25.0 million
in promissory notes from its founding members (one-third or approximately
$8.3 million
from each founding member). The notes receivable bear interest at a fixed rate of
5.0%
per annum, compounded annually.
Interest and principal payments were due annually in six equal installments commencing on the first anniversary of the closing and ending on December 26, 2019.
NCM LLC’s investment in AC JV, LLC was
$0.9 million
and
$0.9 million
as of
December 26, 2019
and
December 27, 2018
, respectively. The Company accounts for its investment in AC JV, LLC under the equity method of accounting in accordance with ASC 323-30
, Investments—Equity Method and Joint Ventures
(“ASC 323-30”) because AC JV, LLC is a limited liability company with the characteristics of a limited partnership and ASC 323-30 requires the use of equity method accounting unless the Company’s interest is so minor that it would have virtually no influence over partnership operating and financial policies. Although NCM LLC does not have a representative on AC JV, LLC’s Board of Directors or any voting, consent or blocking rights with respect to the governance or operations of AC JV, LLC, the Company concluded that its interest was more than minor. During the years ended
December 26, 2019
,
December 27, 2018
and
December 28, 2017
, NCM LLC received cash distributions from AC JV, LLC of
$0.4 million
,
$0.2 million
and
$0.3 million
, respectively. NCM LLC recorded equity in earnings for AC JV, LLC of
$0.4 million
,
$0.2 million
and
$0.3 million
during the years ended
December 26, 2019
,
December 27, 2018
and
December 28, 2017
, respectively, which are included in “Other non-operating income” in the audited Consolidated Statements of Income.
|
10.
|
BORROWINGS
|
The following table summarizes NCM LLC’s total outstanding debt as of
December 26, 2019
and
December 27, 2018
and the significant terms of its borrowing arrangements:
|
|
Outstanding Balance as of
|
|
|
|||||||||
|
Borrowings ($ in millions)
|
December 26, 2019
|
December 27, 2018
|
Maturity Date
|
Interest Rate
|
||||||||
|
Senior secured notes due 2022
|
$
|
—
|
|
$
|
400.0
|
|
April 15, 2022
|
6.000%
|
||||
|
Revolving credit facility
|
39.0
|
|
27.0
|
|
June 20, 2023
|
(1)
|
||||||
|
Term loans
|
266.6
|
|
269.4
|
|
June 20, 2025
|
(1)
|
||||||
|
Senior unsecured notes due 2026
|
230.0
|
|
235.0
|
|
August 15, 2026
|
5.750%
|
||||||
|
Senior secured notes due 2028
|
400.0
|
|
—
|
|
April 15, 2028
|
5.875%
|
||||||
|
Total borrowings
|
935.6
|
|
931.4
|
|
|
|
||||||
|
Less: Debt issuance costs related to term loans and senior notes
|
(9.0
|
)
|
(7.8
|
)
|
|
|
||||||
|
Total borrowings, net
|
926.6
|
|
923.6
|
|
||||||||
|
Less: current portion of debt
|
(2.7
|
)
|
(2.7
|
)
|
||||||||
|
Carrying value of long-term debt
|
$
|
923.9
|
|
$
|
920.9
|
|
|
|
||||
|
(1)
|
The interest rates on the revolving credit facility and term loan are described below.
|
Senior Secured Credit Facility
—On June 20, 2018, NCM LLC entered into a credit agreement to replace NCM LLC's previous senior secured credit facility, dated as of February 13, 2007, as amended (the "previous facility"). Consistent with the
72
NATIONAL CINEMEDIA, INC. AND SUBSIDIARY
NOTES TO CONSOLIDATED FINANCIAL STATEMENTS
structure of the previous facility, the new agreement consists of a term loan facility and a revolving credit facility. As of
December 26, 2019
, NCM LLC’s new senior secured credit facility consisted of a
$175.0 million
revolving credit facility and a
$266.6 million
term loan. The obligations under the senior secured credit facility are secured by a lien on substantially all of the assets of NCM LLC. During the second quarter of 2018, the Company capitalized approximately
$6.5 million
of debt issuance costs related to the new revolving credit facility and the term loan. The Company also recognized
$1.2 million
in non-operating loss related to the write-off of capitalized debt issuance costs related to the previous facility and recognition of debt issuance costs that did not qualify for capitalization.
Revolving Credit Facility
—The revolving credit facility portion of NCM LLC’s total borrowings is available, subject to certain conditions, for general corporate purposes of NCM LLC in the ordinary course of business and for other transactions permitted under the senior secured credit facility, and a portion is available for letters of credit. As of
December 26, 2019
, NCM LLC’s total availability under the
$175.0 million
revolving credit facility was
$132.4
million, net of
$39.0 million
outstanding and
$3.6 million
letters of credit. The unused line fee is
0.50%
per annum which is consistent with the previous facility. Borrowings under the revolving credit facility bear interest at NCM LLC’s option of either the LIBOR index plus an applicable margin ranging from
1.75%
to
2.25%
or the base rate plus an applicable margin ranging from
0.75%
to
1.25%
. The margin changed to the aforementioned range from a fixed margin of LIBOR index plus
2.00%
or the base rate plus
1.00%
. The applicable margin for the revolving credit facility is determined quarterly and is subject to adjustment based upon a consolidated net senior secured leverage ratio for NCM LLC (the ratio of secured funded debt less unrestricted cash and cash equivalents of up to
$100.0 million
, divided by Adjusted EBITDA for debt purposes, defined as NCM LLC's net income before depreciation and amortization expense adjusted to also exclude non-cash share based compensation costs for NCM LLC plus integration payments received). The revolving credit facility will mature on June 20, 2023. The weighted-average interest rate on the outstanding balance on the revolving credit facility as of
December 26, 2019
was
4.37%
.
Term Loans
—The interest rate on the term loans is a rate chosen at NCM LLC’s option of either the LIBOR index plus
3.00%
or the base rate plus
2.00%
. The rate increased from LIBOR index plus
2.75%
or the base rate plus
1.75%
. The weighted-average interest rate on the term loans as of
December 26, 2019
was
4.75%
. The term loan amortizes at a rate equal to
1.00%
annually, to be paid in equal quarterly installments. As of
December 26, 2019
, NCM LLC has paid a principal of
$3.4 million
, reducing the outstanding balance to
$266.6
million. The term loan will mature on June 20, 2025.
The senior secured credit facility contains a number of covenants and financial ratio requirements, including (i) a consolidated net total leverage ratio covenant of
6.25
times for each for each quarterly period and (ii) with respect to the revolving credit facility, maintaining a consolidated net senior secured leverage ratio of equal to or less than
4.50
times on a quarterly basis for each quarterly period in which a balance is outstanding on the revolving credit facility. In addition, NCM LLC is permitted to make quarterly dividend payments and other restricted payments with its available cash as long as NCM LLC's consolidated net senior secured leverage ratio (after giving effect to any such payment) is below
5.50
times and no default or event of has occurred and continues to occur under the senior secured credit facility. As of
December 26, 2019
, the NCM LLC’s consolidated net senior secured leverage ratio was
3.00
times (versus the dividend payment restriction of
5.50
times and the covenant of
4.50
times) and NCM LLC's consolidated net total leverage ratio was
4.00
times (versus the covenant of
6.25
times).
Senior Secured Notes due 2022
—On April 27, 2012, NCM LLC completed a private placement of
$400.0 million
in aggregate principal amount of
6.00%
Senior Secured Notes (the “Notes due 2022”).
The Notes due 2022 pay interest semi-annually in arrears on April 15 and October 15 of each year, which commenced October 15, 2012.
The Notes due 2022 were issued at
100%
of the face amount thereof and are senior secured obligations of NCM LLC, rank the same as NCM LLC’s senior secured credit facility, subject to certain exceptions, and share in the same collateral that secures NCM LLC’s obligations under the senior secured credit facility. On November 7, 2019, NCM LLC redeemed the entire
$400.0 million
aggregate principal amount of NCM LLC’s existing Notes due 2022. The redemption price for the Notes due 2022 was
101.000%
of the principal amount thereof plus accrued and unpaid interest. As a result of the redemption, NCM LLC wrote-off approximately
$1.9 million
in unamortized debt issuance costs and paid a redemption premium of approximately
$4.0 million
, which are reflected in the loss on early retirement of debt, net on the Consolidated Statements of Income during the year ended December 26, 2019.
Senior Unsecured Notes due 2026
—On August 19, 2016, NCM LLC completed a private placement of
$250.0 million
in aggregate principal amount of
5.750%
Senior Unsecured Notes due 2026 (the “Notes due 2026”) for which the registered exchange offering was completed on November 8, 2016.
The Notes due 2026 pay interest semi-annually in arrears on February 15 and August 15 of each year, which commenced on February 15, 2017.
The Notes due 2026 were issued at
100%
of the face amount thereof and are the senior unsecured obligations of NCM LLC and will be effectively subordinated to all existing and future secured debt, including the Notes due 2028, its senior secured credit facility and any future asset backed loan facility. The Notes due 2026 will rank equally in right of payment with all of NCM LLC’s existing and future senior indebtedness, including the Notes due 2028, NCM LLC’s existing senior secured credit facility, any future asset backed loan facility, in each case, without giving effect to collateral arrangements. The Notes due 2026 will be effectively subordinated to all liabilities of
73
NATIONAL CINEMEDIA, INC. AND SUBSIDIARY
NOTES TO CONSOLIDATED FINANCIAL STATEMENTS
any subsidiaries that NCM LLC may form or acquire in the future, unless those subsidiaries become guarantors of the Notes due 2026. NCM LLC does not currently have any subsidiaries, and the Notes due 2026 will not be guaranteed by any subsidiaries that NCM LLC may form or acquire in the future except in very limited circumstances. During the years ended
December 26, 2019
and
December 27, 2018
, NCM LLC repurchased and canceled a total of
$5.0 million
and $
15.0
million of the Notes due 2026, respectively, reducing the principal amount to
$230.0 million
as of
December 26, 2019
. This repurchase was treated as a partial debt extinguishment and resulted in the realization of a non-operating gain, net of written off debt issuance costs, of
$0.3 million
and $
0.6
million during the years ended
December 26, 2019
and
December 27, 2018
, respectively.
NCM LLC may redeem all or any portion of the Notes due 2026 prior to August 15, 2021, at once or over time, at 100% of the principal amount plus the applicable make-whole premium, plus accrued and unpaid interest, if any, to the redemption date.
NCM LLC may redeem all or any portion of the Notes due 2026, at once or over time, on or after August 15, 2021 at specified redemption prices, plus accrued and unpaid interest, if any, to the redemption date.
In addition, at any time prior to August 15, 2019, NCM LLC may on any one or more occasions redeem up to 35% of the original aggregate principal amount of Notes due 2026 from the net proceeds of certain equity offerings at a redemption price equal to 105.750% of the principal amount of the Notes due 2026 redeemed, plus accrued and unpaid interest, if any to the redemption date.
Upon the occurrence of a Change of Control (as defined in the indenture), NCM LLC will be required to make an offer to each holder of the Notes due 2026 to repurchase all of such holder’s Notes due 2026 for a cash payment equal to
101.000%
of the aggregate principal amount of the Notes due 2026 repurchased, plus accrued and unpaid interest, if any, to the date of repurchase.
The indenture contains covenants that, among other things, restrict NCM LLC’s ability and the ability of its restricted subsidiaries, if any, to: (1) incur additional debt; (2) make distributions or make certain other restricted payments; (3) make investments; (4) incur liens; (5) sell assets or merge with or into other companies; and (6) enter into transactions with affiliates. All of these restrictive covenants are subject to a number of important exceptions and qualifications. In particular, NCM LLC has the ability to distribute all of its quarterly available cash as a restricted payment or as an investment, if it meets a minimum net senior secured leverage ratio. NCM LLC was in compliance with these non-maintenance covenants as of
December 26, 2019
.
Senior Secured Notes due 2028
—On October 8, 2019, NCM LLC completed a private offering of
$400.0 million
aggregate principal amount of
5.875%
Senior Secured Notes due 2028 (the “Notes due 2028”) to eligible purchasers. The Notes due 2028 will mature on April 15, 2028. Interest on the Notes due 2028 accrues at a rate of
5.875%
per annum and is payable semi-annually in arrears on April 15 and October 15 of each year, commencing on April 15, 2020.
NCM LLC may redeem all or any portion of the Notes due 2028 prior to April 15, 2023, at a redemption price equal to
100%
of the principal amount plus the applicable premium, plus accrued and unpaid interest, if any, to the redemption date. NCM LLC may redeem all or any portion of the Notes due 2028, on or after April 15, 2023, at specified redemption prices, plus accrued and unpaid interest, if any, to the redemption date. In addition, at any time prior to April 15, 2023, NCM LLC may on any one or more occasions redeem up to
35%
of the original aggregate principal amount of the Notes due 2028 from the net proceeds of certain equity offerings at a redemption price equal to
105.875%
of the principal amount of the Notes due 2028 redeemed, plus accrued and unpaid interest, if any, to the redemption date, provided that at least
65%
of the original aggregate principal amount of the Notes due 2028 remains outstanding after each such redemption and the redemption occurs within 90 days after the closing of such applicable equity offering.
The Indenture contains covenants that, among other things, restrict NCM LLC’s ability and the ability of its restricted subsidiaries, if any, to: (1) incur additional debt; (2) make distributions or make certain other restricted payments; (3) make certain investments; (4) incur certain liens; (5) sell assets or merge with or into other companies; and (6) enter into transactions with affiliates. All of these restrictive covenants are subject to a number of important exceptions and qualifications. In particular, NCM LLC may distribute all of its quarterly available cash as a restricted payment or as an investment, provided that NCM LLC satisfies a minimum net senior secured leverage ratio.
Future Maturities of Borrowings
– The scheduled annual maturities on the Senior Secured Credit Facility, Notes due 2026 and Notes due 2028 as of
December 26, 2019
are as follows (in millions):
|
Year
|
Amount
|
|||
|
2020
|
$
|
2.7
|
|
|
|
2021
|
2.7
|
|
||
|
2022
|
2.7
|
|
||
|
2023
|
41.7
|
|
||
|
2024
|
2.7
|
|
||
|
Thereafter
|
883.1
|
|
||
|
Total
|
$
|
935.6
|
|
|
74
NATIONAL CINEMEDIA, INC. AND SUBSIDIARY
NOTES TO CONSOLIDATED FINANCIAL STATEMENTS
|
11.
|
SHARE-BASED COMPENSATION
|
The NCM, Inc. 2016 Equity Incentive Plan (the “2016 Plan”) reserves
4,400,000
shares of common stock available for issuance or delivery under the 2016 Plan, of which
1,361,342
shares remain available for future grants as of
December 26, 2019
(assuming
100%
achievement of targets on performance-based restricted stock). The Company began issuing shares under the 2016 Plan in the second quarter of 2016, following its approval by NCM, Inc.’s stockholders. The 2016 Plan replaced NCM, Inc.’s 2007 Equity Incentive Plan (the “2007 Plan”), which was set to expire by its terms in February 2017. The shares of common stock that were available for issuance under the 2007 Plan are no longer available for issuance following the approval of the 2016 Plan. Any forfeitures of shares granted pursuant to the 2007 Plan will be cancelled and not available for future grant. The types of awards that may be granted under the 2016 Plan include stock options, stock appreciation rights, restricted stock, restricted stock units or other stock based awards. Certain option and share awards provide for accelerated vesting if there is a change in control, as defined in the 2007 Plan and the 2016 Plan. Upon vesting of the restricted stock awards or exercise of options, NCM LLC will issue common membership units to the Company equal to the number of shares of the Company’s common stock represented by such awards.
Compensation Cost
—The Company recognized
$5.5 million
,
$7.8 million
and
$11.2 million
for the years ended
December 26, 2019
,
December 27, 2018
and
December 28, 2017
, respectively, of share-based compensation expense within Network costs, Selling and marketing costs and Administrative and other costs in the Consolidated Statements of Income as shown in the table below (in millions):
|
|
Years Ended
|
||||||||||
|
|
December 26, 2019
|
December 27, 2018
|
December 28, 2017
|
||||||||
|
Share-based compensation costs included in network
costs
|
$
|
0.4
|
|
$
|
0.6
|
|
$
|
1.0
|
|
||
|
Share-based compensation costs included in selling
and marketing costs
|
1.4
|
|
2.5
|
|
4.1
|
|
|||||
|
Share-based compensation costs included in
administrative and other costs
|
3.7
|
|
4.7
|
|
6.1
|
|
|||||
|
Total share-based compensation costs
|
$
|
5.5
|
|
$
|
7.8
|
|
$
|
11.2
|
|
||
During the years ended
December 26, 2019
,
December 27, 2018
and
December 28, 2017
,
$0.2 million
,
$0.2 million
and
$0.3 million
was capitalized, respectively, in a corresponding manner to the capitalization of employee’s salaries for capitalized labor. The income tax benefit recognized in the income statement for share-based compensation was approximately
$0.7 million
,
$1.7 million
and
$3.0 million
for the years ended
December 26, 2019
,
December 27, 2018
and
December 28, 2017
, respectively. As of
December 26, 2019
, there was
$0.4 million
unrecognized compensation cost related to unvested options, which will be recognized over a remaining period of
2.6 years
.
As of
December 26, 2019
, unrecognized compensation cost related to restricted stock and restricted stock units was approximately
$4.8 million
, which will be recognized over a weighted average remaining period of
1.7 years
.
Stock Options
—The Company granted stock options during 2019 for the first time since 2012. The Stock options awarded in 2019 contained a market condition as the options were granted with an exercise price in excess of the closing market price of NCM, Inc. common stock on the date the Company’s Board of Directors approved the grant. Stock options awarded in 2012 and prior were granted with an exercise price equal to the closing market price of NCM, Inc. common stock on the date the Company’s Board of Directors approved the grant. All options have either
10
-year or
15
-year contractual terms. The fair value of each option award is estimated on the date of grant using the Black-Scholes option pricing valuation model that uses the assumptions noted in the table below. Expected volatilities are based on implied volatilities from traded options on the Company’s stock, historical volatility of the Company’s stock, and other factors. The Company uses historical data to estimate option exercise and employee termination within the valuation model. The expected term of options granted was developed based on historical and peer company data and represents the period of time that options granted are expected to be outstanding. The expected term of the options granted during 2019 was adjusted to include the Company's cost of equity in order to incorporate the impact of the option's market condition and simulate a lattice model. The risk-free rate for periods within the contractual life of the option is based on the U.S. Treasury yield curve in effect at the time of grant. The following assumptions were used in the valuation of the options for the year ended
December 26, 2019
. No options were granted during the years ended
December 27, 2018
and
December 28, 2017
.
75
NATIONAL CINEMEDIA, INC. AND SUBSIDIARY
NOTES TO CONSOLIDATED FINANCIAL STATEMENTS
|
Years Ended
|
||
|
|
December 26, 2019
|
|
|
Expected term (in years)
|
6.8
|
|
|
Risk free interest rate
|
1.8
|
%
|
|
Expected volatility
|
36.6
|
%
|
|
Dividend yield
|
8.9
|
%
|
The intrinsic value of options exercised during the year was
$0.0 million
,
$0.0 million
and
$0.1 million
for the years ended
December 26, 2019
,
December 27, 2018
and
December 28, 2017
, respectively. A summary of option award activity under the 2007 and 2016 Plans as of
December 26, 2019
, and changes during the year then ended are presented below:
|
|
Options
|
Weighted
Average
Exercise
Price
|
Weighted
Average
Remaining
Contractual
Life (in years)
|
Aggregate
Intrinsic
Value
(in millions)
|
||||||||
|
Outstanding as of December 28, 2018
|
1,950,750
|
|
$
|
16.45
|
|
2.0
|
$
|
—
|
|
|||
|
Granted
|
650,198
|
|
$
|
8.00
|
|
$
|
—
|
|
||||
|
Forfeited
|
(26,946
|
)
|
$
|
17.38
|
|
$
|
—
|
|
||||
|
Expired
|
(23,904
|
)
|
$
|
15.19
|
|
$
|
—
|
|
||||
|
Outstanding as of December 26, 2019
|
2,550,098
|
|
$
|
14.30
|
|
3.2
|
$
|
—
|
|
|||
|
Exercisable as of December 26, 2019
|
1,899,900
|
|
$
|
16.45
|
|
1.0
|
$
|
—
|
|
|||
|
Vested and expected to vest as of December 26, 2019
|
2,527,755
|
|
$
|
14.35
|
|
3.2
|
$
|
—
|
|
|||
Restricted Stock and Restricted Stock Units
—Under the non-vested stock program, common stock of the Company may be granted at no cost to officers, independent directors and employees, subject to requisite service and/or financial performance targets. As such restrictions lapse, the award vests in that proportion. The participants are entitled to dividend equivalents and to vote their respective shares (in the case of restricted stock), although the sale and transfer of such shares is prohibited and the shares are subject to forfeiture during the restricted period. Additionally, the accrued dividend equivalents are subject to forfeiture during the restricted period should the underlying shares not vest. As of
December 26, 2019
and
December 27, 2018
, accrued dividend equivalents totaled
$1.6 million
and
$1.6 million
, respectively and during the years ended
December 26, 2019
,
December 27, 2018
and
December 28, 2017
, the Company paid
$0.9 million
,
$2.1 million
and
$2.1 million
, respectively, for dividend equivalents upon vesting of the restricted stock and restricted stock units. The Company has issued time-based restricted stock to its employees which vests over a
three
-year period with one-third vesting on each anniversary of the date of grant and performance-based restricted stock which vests following a
three
-year measurement period to the extent that the Company achieves specified non-GAAP targets at the end of the measurement period. The Company also grants restricted stock units to its non-employee directors that vest after approximately
one year
. The grant date fair value of restricted stock and restricted stock units is based on the closing market price of NCM, Inc. common stock on the date of grant. An annual forfeiture rate of
2
-
6%
was estimated to reflect the potential separation of employees. The weighted average grant date fair value of non-vested stock was
$7.02
,
$6.65
and
$14.34
for the years ended
December 26, 2019
,
December 27, 2018
and
December 28, 2017
, respectively. The total fair value of awards vested was
$6.8 million
,
$15.5 million
and
$17.3 million
during the years ended
December 26, 2019
,
December 27, 2018
and
December 28, 2017
, respectively.
A summary of restricted stock award and restricted stock unit activity as of
December 26, 2019
, and changes during the year then ended are presented below:
|
|
Number of
Restricted
Shares and
Restricted
Stock Units
|
Weighted
Average
Grant-Date
Fair Value
|
||||
|
Non-vested balance as of December 28, 2018
|
1,825,983
|
|
$
|
11.31
|
|
|
|
Granted
|
823,728
|
|
$
|
7.02
|
|
|
|
Vested
(1)
|
(580,489
|
)
|
$
|
11.78
|
|
|
|
Forfeited
|
(282,004
|
)
|
$
|
14.48
|
|
|
|
Non-vested balance as of December 26, 2019
|
1,787,218
|
|
$
|
8.68
|
|
|
76
NATIONAL CINEMEDIA, INC. AND SUBSIDIARY
NOTES TO CONSOLIDATED FINANCIAL STATEMENTS
|
(1)
|
Includes
185,019
vested shares that were withheld to cover tax obligations and were subsequently canceled.
|
The above table reflects performance-based restricted stock granted at
100%
achievement of performance conditions and as such does not reflect the maximum or minimum number of shares of performance-based restricted stock contingently issuable. An additional
510,681
shares of restricted stock could be issued if the performance criteria maximums are met. As of
December 26, 2019
, the total number of restricted stock and restricted stock units that are ultimately expected to vest, after consideration of expected forfeitures and current projections of estimated vesting of performance-based restricted stock is
1,453,361
shares.
|
12.
|
EMPLOYEE BENEFIT PLANS
|
The Company sponsors the NCM 401(k) Profit Sharing Plan (the “Plan”) under Section 401(k) of the Internal Revenue Code of 1986, as amended, for the benefit of substantially all full-time employees. The Plan provides that participants may contribute up to
20%
of their compensation, subject to Internal Revenue Service limitations. Employee contributions are invested in various investment funds based upon election made by the employee. The Company made discretionary contributions of
$1.2 million
,
$1.2 million
and
$1.2 million
during the years ended
December 26, 2019
,
December 27, 2018
and
December 28, 2017
, respectively.
|
13.
|
COMMITMENTS AND CONTINGENCIES
|
Legal Actions
—The Company is subject to claims and legal actions in the ordinary course of business. The Company believes such claims will not have a material effect, individually and in aggregate, on its financial position, results of operations or cash flows.
Operating Commitments-Facilities
—The Company has entered into operating lease agreements for its corporate headquarters and other regional offices. The Company has right-of-use (“ROU”) assets of
$21.5 million
and short-term and long-term lease liabilities of
$1.6 million
and
$24.0 million
, respectively, on the balance sheet as of
December 26, 2019
for all material leases with terms longer than twelve months. These balances are included within “Other assets”, “Other current liabilities” and “Other liabilities”, respectively, on the audited Condensed Consolidated Balance Sheets. The Company has options on certain of these facilities to extend the lease or to terminate part or all of the leased space prior to the lease end date. Certain termination fees would be due upon exercise of the early termination options as outlined within the underlying agreements. None of these options were considered reasonably certain of exercise and thus have not been recognized as part of the ROU assets and lease liabilities. As of
December 26, 2019
, the Company had a weighted average remaining lease term of
10.1
years on these leases.
The Company has also entered into certain short-term leases with a term of less than one year. These leases are not included within the Company’s ROU assets or lease liabilities due to the Company’s election of the practical expedient in ASC 842-20-25-2 for short-term leases.
During the twelve months ended
December 26, 2019
, the Company recognized the following components of total lease cost (in millions). These costs are presented within “Selling and marketing costs” and “Administrative and other costs” within the audited Consolidated Statements of Income depending upon the nature of the use of the facility.
|
Year ended
|
|||
|
December 26, 2019
|
|||
|
Operating lease cost
|
$
|
3.2
|
|
|
Short-term lease cost
|
0.2
|
|
|
|
Variable lease cost
|
0.5
|
|
|
|
Total lease cost
|
$
|
3.9
|
|
The Company made lease payments for the year ended
December 26, 2019
of
$3.3 million
. These payments are included within cash flows from operating activities within the audited Consolidated Statement of Cash Flows. The minimum lease payments under noncancelable operating leases as of
December 26, 2019
were as follows (in millions):
77
NATIONAL CINEMEDIA, INC. AND SUBSIDIARY
NOTES TO CONSOLIDATED FINANCIAL STATEMENTS
|
Year
|
Minimum Lease Payments
|
|||
|
2020
|
$
|
3.5
|
|
|
|
2021
|
3.5
|
|
||
|
2022
|
3.7
|
|
||
|
2023
|
3.7
|
|
||
|
2024
|
3.7
|
|
||
|
Thereafter
|
18.6
|
|
||
|
Total
|
$
|
36.7
|
|
|
|
Less: Imputed interest on future lease payments
|
(11.1
|
)
|
||
|
Total lease liability as of December 26, 2019 per the Condensed Consolidated Balance Sheet
|
$
|
25.6
|
|
|
During the year ended December 28, 2017, the Company recorded a
$1.8 million
of expense for an early lease termination fee. The fee was reimbursed by the landlord of the Company’s new building, which is being treated as a lease incentive and amortized over the term of the new lease.
When measuring the ROU assets and lease liabilities recorded, the Company utilized its incremental borrowing rate in order to determine the present value of the lease payments as the leases do not provide an implicit rate. The Company used the rate of interest that it would have paid to borrow on a collateralized basis over a similar term for an amount equal to the lease payments in a similar economic environment. As of
December 26, 2019
, the Company’s weighted average annual discount rate used to establish the ROU assets and lease liabilities was
7.35%
.
Operating Commitments - ESAs and Affiliate Agreements
—The Company has entered into long-term ESAs with the founding members and multi-year agreements with certain network affiliates, or third-party theater circuits. The ESAs and network affiliate agreements grant NCM LLC exclusive rights in their theaters to sell advertising, subject to limited exceptions. The Company recognizes intangible assets upon issuance of membership units to the founding members in accordance with NCM LLC’s Common Unit Adjustment Agreement and upfront cash payments to the affiliates for the contractual rights to provide the Company’s services within their theaters as further discussed within Note 5—
Intangible Assets
. These ESAs and network affiliate agreements are considered leases under ASC 842 once the asset is identified and the period of control is determined upon the scheduling of the showtimes by the exhibitors, typically one week prior to the showtime. As such, the leases are considered short-term in nature, specifically less than one month. Within ASC 842, leases with terms of less than one month are exempt from the majority of the accounting and disclosure requirements, including disclosure of short-term lease expense. No ROU assets or lease liabilities were recognized for these agreements and no change to the balance sheet presentation of the intangible assets was necessary. However, the amortization of these intangible assets is considered lease expense and was therefore, reclassified in the current period from “Depreciation and amortization expense” to “Amortization of intangibles recorded for network theater screen leases” within the audited Condensed Consolidated Statement of Income.
In consideration for NCM LLC’s access to the founding members’ theater attendees for on-screen advertising and use of lobbies and other space within the founding members’ theaters for the LEN and lobby promotions, the founding members receive a monthly theater access fee under the ESAs. The theater access fee is composed of a fixed payment per patron, a fixed payment per digital screen (connected to the DCN) and a fee for access to higher quality digital cinema equipment. The payment per theater patron increases by
8%
every
five years
, with the next increase taking effect in fiscal year 2022. The payment per digital screen and for digital cinema equipment increases annually by
5%
. The theater access fee paid in the aggregate to all founding members cannot be less than
12%
of NCM LLC’s aggregate advertising revenue (as defined in the ESA), or it will be adjusted upward to reach this minimum payment. As of
December 26, 2019
and
December 27, 2018
, the Company had
no
liabilities recorded for the minimum payment, as the theater access fee was in excess of the minimum.
Following the 2019 ESA Amendments, Cinemark and Regal receive an additional monthly theater access fee beginning November 1, 2019 in consideration for NCM LLC's access to certain on-screen advertising inventory after the advertised showtime of a feature film. These fees are also based upon a fixed payment per patron beginning at (i)
$0.025
per patron on November 1, 2019, (ii)
$0.0375
per patron beginning on November 1, 2020, (iii)
$0.05
per patron beginning on November 1, 2021, (iv)
$0.052
per patron beginning on November 1, 2022 and (v) increase
8%
every five years beginning November 1, 2027. Additionally, following the 2019 ESA Amendments, beginning on November 1, 2019, NCM LLC is entitled to display an additional single unit that is either 30 or 60 seconds of the
Noovie
pre-show in the trailer position directly prior to the one or two trailers preceding the feature film (the “Platinum Spot”). In consideration for the utilization of the theaters for the Platinum Spots, Cinemark and Regal is entitled to receive
25%
of all revenue generated for the actual display of Platinum Spots in their applicable theaters, subject to a specified minimum. If NCM LLC runs advertising in more than one concurrent advertisers’ Platinum Spot for any portion of the network over a period of time, then NCM LLC will be required to satisfy a minimum average CPM for that period of time.
78
NATIONAL CINEMEDIA, INC. AND SUBSIDIARY
NOTES TO CONSOLIDATED FINANCIAL STATEMENTS
The network affiliates compensation is considered variable lease expense and varies by circuit depending upon the agreed upon terms of the network affiliate agreement. The majority of agreements are centered around a revenue share where an agreed upon percentage of the advertising revenue received from a theater’s attendance is paid to the circuit. As part of the network affiliate agreements entered into in the ordinary course of business under which the Company sells advertising for display in various network affiliate theater chains, the Company has agreed to certain minimum revenue guarantees on a per attendee basis. If a network affiliate achieves the attendance set forth in their respective agreement, the Company has guaranteed minimum revenue for the network affiliate per attendee if such amount paid under the revenue share arrangement is less than its guaranteed amount. As of
December 26, 2019
, the maximum potential amount of future payments the Company could be required to make pursuant to the minimum revenue guarantees is
$84.6 million
over the remaining terms of the network affiliate agreements. These minimum guarantees relate to various affiliate agreements ranging in term from
one
to
twenty
years, prior to any renewal periods of which some are at the option of the Company. During the year ended
December 26, 2019
,
December 27, 2018
and
December 28, 2017
the Company paid
$0.5 million
,
$0.7 million
and
$0.1 million
, respectively, related to these minimum guarantees. As of
December 26, 2019
and
December 27, 2018
, the Company had
$0.5 million
and
$0.1 million
in liabilities recorded for these obligations, as such guarantees are less than the expected share of revenue paid to the affiliate.
|
14.
|
FAIR VALUE MEASUREMENTS
|
Non-Recurring Measurements
—Certain assets are measured at fair value on a non-recurring basis. These assets are not measured at fair value on an ongoing basis but are subject to fair value adjustments in certain circumstances. These assets include long-lived assets, intangible assets, cost and equity method investments, notes receivable and borrowings.
Long-Lived Assets, Intangible Assets, Other Investments and Notes Receivable
—As described in Note 1—
Basis of Presentation and Summary of Significant Accounting Policies
, the Company regularly reviews long-lived assets (primarily property, plant and equipment), intangible assets, investments accounted for under the cost or equity method and notes receivable for impairment whenever events or changes in circumstances indicate that the carrying amounts of the assets may not be fully recoverable. When the estimated fair value is determined to be lower than the carrying value of the asset, an impairment charge is recorded to write the asset down to its estimated fair value.
Other investments consisted of the following (in millions):
|
|
As of
|
||||||
|
|
December 26, 2019
|
December 27, 2018
|
|||||
|
Investment in AC JV, LLC
(1)
|
$
|
0.9
|
|
$
|
0.9
|
|
|
|
Other investments
(2)
|
0.1
|
|
2.1
|
|
|||
|
Total
|
$
|
1.0
|
|
$
|
3.0
|
|
|
|
(1)
|
Refer to Note 9—
Related Party Transactions
.
|
|
(2)
|
The Company received equity securities in privately held companies as consideration for a portion of advertising contracts. The equity securities were accounted for under the cost method and represent an ownership of less than
20%
. The Company does not exert significant influence on these companies’ operating or financial activities.
|
During the years ended
December 26, 2019
,
December 27, 2018
and
December 28, 2017
, the Company recorded impairment charges of
$2.0 million
,
$0.4 million
and
$3.1 million
, respectively, on certain of its investments due to a significant deterioration in the business prospects of the investee or new information regarding the fair value of the investee, which brought the total remaining value of the respective impaired investments to
$0.0 million
as of
December 26, 2019
. As of
December 26, 2019
, no other observable price changes or impairments have been recorded as a result of the Company’s qualitative assessment of identified events or changes in the circumstances of the remaining investments. The investment in AC JV was initially valued using comparative market multiples. The other investments were recorded based upon the fair value of the services provided in exchange for the investment. Refer to Note 1—
Basis of Presentation and Summary of Significant Accounting Policies
for more details. As the inputs to the determination of fair value are based upon non-identical assets and use significant unobservable inputs, they have been classified as Level 3 in the fair value hierarchy.
As of
December 26, 2019
and
December 27, 2018
, the Company had notes receivable totaling
$0.0 million
and
$5.6 million
, respectively, from its founding members related to the sale of Fathom Events, as described in Note 9—
Related Party Transactions
. These notes were initially valued using comparative market multiples. The notes receivables were paid in full during 2019, reducing the balance to $0.0 million as of December 26, 2019. The notes were classified as Level 3 in the fair
79
NATIONAL CINEMEDIA, INC. AND SUBSIDIARY
NOTES TO CONSOLIDATED FINANCIAL STATEMENTS
value hierarchy as the inputs to the determination of fair value are based upon non-identical assets and use significant unobservable inputs.
Borrowings
—The carrying amount of the revolving credit facility is considered a reasonable estimate of fair value due to its floating-rate terms. The estimated fair values of the Company’s financial instruments where carrying values do not approximate fair value are as follows (in millions):
|
|
As of December 26, 2019
|
As of December 27, 2018
|
|||||||||||||
|
|
Carrying Value
|
Fair Value
(1)
|
Carrying Value
|
Fair Value
(1)
|
|||||||||||
|
Term Loans
|
$
|
266.6
|
|
$
|
266.9
|
|
$
|
269.4
|
|
$
|
261.2
|
|
|||
|
Senior Notes due 2022
|
—
|
|
—
|
|
400.0
|
|
401.8
|
|
|||||||
|
Senior Notes due 2026
|
230.0
|
|
226.2
|
|
235.0
|
|
211.0
|
|
|||||||
|
Senior Notes due 2028
|
400.0
|
|
426.7
|
|
—
|
|
—
|
|
|||||||
|
(1)
|
The Company has estimated the fair value on an average of at least two non-binding broker quotes and the Company’s analysis. If the Company were to measure the borrowings in the above table at fair value on the balance sheet they would be classified as Level 2.
|
Recurring Measurements
—The fair values of the Company’s assets and liabilities measured on a recurring basis pursuant to ASC 820-10
Fair Value Measurements and Disclosures
are as follows (in millions):
|
|
|
Fair Value Measurements at
Reporting Date Using
|
|||||||||||||
|
|
Fair Value As of
December 26, 2019
|
Quoted Prices in Active Markets for Identical Assets
(Level 1)
|
Significant Other Observable Inputs
(Level 2)
|
Significant Unobservable Inputs
(Level 3)
|
|||||||||||
|
ASSETS:
|
|
|
|
|
|||||||||||
|
Cash equivalents
(1)
|
$
|
28.8
|
|
$
|
16.8
|
|
$
|
12.0
|
|
$
|
—
|
|
|||
|
Short-term marketable securities
(2)
|
17.5
|
|
—
|
|
17.5
|
|
—
|
|
|||||||
|
Long-term marketable securities
(2)
|
7.5
|
|
—
|
|
7.5
|
|
—
|
|
|||||||
|
Total assets
|
$
|
53.8
|
|
$
|
16.8
|
|
$
|
37.0
|
|
$
|
—
|
|
|||
|
|
|
Fair Value Measurements at
Reporting Date Using
|
|||||||||||||
|
|
Fair Value As of
December 27, 2018
|
Quoted Prices in Active Markets for Identical Assets
(Level 1)
|
Significant Other Observable Inputs
(Level 2)
|
Significant Unobservable Inputs
(Level 3)
|
|||||||||||
|
ASSETS:
|
|
|
|
|
|||||||||||
|
Cash equivalents
(1)
|
$
|
18.2
|
|
$
|
11.2
|
|
$
|
7.0
|
|
$
|
—
|
|
|||
|
Short-term marketable securities
(2)
|
24.0
|
|
—
|
|
24.0
|
|
—
|
|
|||||||
|
Long-term marketable securities
(2)
|
10.2
|
|
—
|
|
10.2
|
|
—
|
|
|||||||
|
Total assets
|
$
|
52.4
|
|
$
|
11.2
|
|
$
|
41.2
|
|
$
|
—
|
|
|||
|
(1)
|
Cash Equivalents
—The Company’s cash equivalents are carried at estimated fair value. Cash equivalents consist of money market accounts which the Company has classified as Level 1 given the active market for these accounts and commercial paper with original maturities of three months or less, which are classified as Level 2 and are valued as described below.
|
|
(2)
|
Short-Term and Long-Term Marketable Securities
—The carrying amount and fair value of the marketable securities are equivalent since the Company accounts for these instruments at fair value. The Company’s government agency bonds, commercial paper and certificates of deposit are valued using third party broker quotes. The value of the Company’s government agency bonds and municipal bonds are derived from quoted market information. The inputs in the valuation are classified as Level 1 if there is an active market for these securities; however, if an active market does not
|
80
NATIONAL CINEMEDIA, INC. AND SUBSIDIARY
NOTES TO CONSOLIDATED FINANCIAL STATEMENTS
exist, the inputs are recorded at a lower level in the fair value hierarchy. The value of commercial paper and certificates of deposit is derived from pricing models using inputs based upon market information, including contractual terms, market prices and yield curves. The inputs to the valuation pricing models are observable in the market, and as such are generally classified as Level 2 in the fair value hierarchy. For the years ended
December 26, 2019
and
December 27, 2018
, there was an inconsequential amount of net realized gains (losses) recognized in interest income and an inconsequential amount of net unrealized holding gains (losses) included in other comprehensive income. Original cost of short term marketable securities is based on
the specific identification method. As of
December 26, 2019
and
December 27, 2018
, there was an inconsequential amount and
$0.2 million
, respectively, of gross unrealized losses related to individual securities of
$6.5 million
and
$11.8 million
, respectively, that had been in a continuous loss position for 12 months or longer. The Company has not recorded an impairment because it has the intention and ability to hold these securities to maturity.
The amortized cost basis, aggregate fair value and maturities of the marketable securities the Company held as of
December 26, 2019
and
December 27, 2018
are as follows:
|
|
As of December 26, 2019
|
||||||||
|
|
Amortized
Cost Basis
(in millions)
|
Aggregate
Fair Value
(in millions)
|
Maturities
(1)
(in years)
|
||||||
|
MARKETABLE SECURITIES:
|
|
|
|
|
|
||||
|
Short-term U.S. government agency bonds
|
$
|
3.5
|
|
$
|
3.5
|
|
0.4
|
||
|
Short-term certificates of deposit
|
0.9
|
|
0.9
|
|
0.8
|
||||
|
Short-term municipal bonds
|
1.2
|
|
1.2
|
|
0.5
|
||||
|
Short-term commercial paper:
|
|||||||||
|
Financial
|
8.0
|
|
7.9
|
|
0.3
|
||||
|
Industrial
|
4.0
|
|
4.0
|
|
0.2
|
||||
|
Total short-term marketable securities
|
17.6
|
|
17.5
|
|
|||||
|
Long-term municipal bonds
|
|
|
|
|
|
||||
|
Long-term U.S. government agency bonds
|
4.5
|
|
4.5
|
|
2.2
|
||||
|
Long-term certificates of deposit
|
3.0
|
|
3.0
|
|
3.6
|
||||
|
Total long-term marketable securities
|
7.5
|
|
7.5
|
|
|||||
|
Total marketable securities
|
$
|
25.1
|
|
$
|
25.0
|
|
|||
|
|
As of December 27, 2018
|
||||||||
|
|
Amortized
Cost Basis
(in millions)
|
Aggregate
Fair Value
(in millions)
|
Maturities
(1)
(in years)
|
||||||
|
MARKETABLE SECURITIES:
|
|
|
|
|
|
||||
|
Short-term U.S. government agency bonds
|
$
|
3.9
|
|
$
|
3.9
|
|
0.5
|
||
|
Short-term U.S. government treasury bonds
|
0.3
|
|
0.3
|
|
0.5
|
||||
|
Short-term certificates of deposit
|
3.6
|
|
3.6
|
|
0.6
|
||||
|
Short-term municipal bonds
|
0.5
|
|
0.5
|
|
0.1
|
||||
|
Short-term commercial paper:
|
|||||||||
|
Financial
|
3.8
|
|
3.8
|
|
0.1
|
||||
|
Industrial
|
12.0
|
|
11.9
|
|
0.1
|
||||
|
Total short-term marketable securities
|
24.1
|
|
24.0
|
|
|||||
|
Long-term municipal bonds
|
1.2
|
|
1.3
|
|
1.5
|
||||
|
Long-term U.S. government agency bonds
|
6.9
|
|
6.8
|
|
2.1
|
||||
|
Long-term certificates of deposit
|
2.4
|
|
2.1
|
|
2.9
|
||||
|
Total long-term marketable securities
|
10.5
|
|
10.2
|
|
|||||
|
Total marketable securities
|
$
|
34.6
|
|
$
|
34.2
|
|
|||
81
NATIONAL CINEMEDIA, INC. AND SUBSIDIARY
NOTES TO CONSOLIDATED FINANCIAL STATEMENTS
|
(1)
|
Maturities
— Securities available for sale include obligations with various contractual maturity dates some of which are greater than one year. The Company considers the securities to be liquid and convertible to cash within 30 days.
|
|
15.
|
VALUATION AND QUALIFYING ACCOUNTS
|
The Company’s allowance for doubtful accounts and the valuation allowance on deferred tax assets for the years ended
December 26, 2019
,
December 27, 2018
and
December 28, 2017
were as follows (in millions):
|
|
Years Ended
|
||||||||||
|
|
December 26, 2019
|
December 27, 2018
|
December 28, 2017
|
||||||||
|
ALLOWANCE FOR DOUBTFUL ACCOUNTS:
|
|||||||||||
|
Balance at beginning of period
|
$
|
6.0
|
|
$
|
6.0
|
|
$
|
6.3
|
|
||
|
Provision for bad debt
|
1.2
|
|
1.6
|
|
1.1
|
|
|||||
|
Write-offs, net
|
(1.0
|
)
|
(1.6
|
)
|
(1.4
|
)
|
|||||
|
Balance at end of period
|
$
|
6.2
|
|
$
|
6.0
|
|
$
|
6.0
|
|
||
|
|
Years Ended
|
||||||||||
|
|
December 26, 2019
|
December 27, 2018
|
December 28, 2017
|
||||||||
|
VALUATION ALLOWANCE ON DEFERRED TAX ASSETS:
|
|||||||||||
|
Balance at beginning of period
|
$
|
80.1
|
|
$
|
98.1
|
|
$
|
110.3
|
|
||
|
Valuation allowance added
(1)
|
1.5
|
|
—
|
|
—
|
|
|||||
|
Valuation allowance reversed
(2)
|
—
|
|
(18.0
|
)
|
(12.2
|
)
|
|||||
|
Balance at end of period
|
$
|
81.6
|
|
$
|
80.1
|
|
$
|
98.1
|
|
||
|
(1)
|
The increase within the valuation allowance during the year ended December 26, 2019 relates to the establishment of a valuation allowance for state NOLs and investment losses that the Company no longer expects to realize prior to expiration and timing differences between the recognition of available cash distributions for book and tax purposes.
|
|
(2)
|
The decreases within the valuation allowance during the years ended December 27, 2018 and December 28, 2017 relate to movement within the underlying residual portion of the Investment in NCM LLC deferred tax asset due primarily to timing differences between the recognition of available cash distributions for book and tax purposes.
|
|
16.
|
QUARTERLY FINANCIAL DATA (UNAUDITED)
|
The following represents selected information from the Company’s unaudited quarterly Consolidated Statements of Income for the years ended
December 26, 2019
and
December 27, 2018
(in millions, except per share data):
|
2019
|
First
Quarter
|
Second
Quarter
|
Third
Quarter
|
Fourth
Quarter
|
||||||||||||
|
Revenue
|
$
|
76.9
|
|
$
|
110.2
|
|
$
|
110.5
|
|
$
|
147.2
|
|
||||
|
Operating expenses
|
66.0
|
|
72.5
|
|
70.5
|
|
74.5
|
|
||||||||
|
Operating income
|
10.9
|
|
37.7
|
|
40.0
|
|
72.7
|
|
||||||||
|
Consolidated net (loss) income
|
(2.6
|
)
|
21.0
|
|
22.8
|
|
45.5
|
|
||||||||
|
Net (loss) income attributable to NCM, Inc.
|
(1.1
|
)
|
8.9
|
|
9.2
|
|
19.1
|
|
||||||||
|
(Loss) Earnings per NCM, Inc. share, basic
(1)
|
(0.01
|
)
|
0.11
|
|
0.12
|
|
0.25
|
|
||||||||
|
(Loss) Earnings per NCM, Inc. share, diluted
(1)
|
(0.01
|
)
|
0.11
|
|
0.12
|
|
0.24
|
|
||||||||
82
NATIONAL CINEMEDIA, INC. AND SUBSIDIARY
NOTES TO CONSOLIDATED FINANCIAL STATEMENTS
|
2018
|
First
Quarter
|
Second
Quarter
|
Third
Quarter
|
Fourth
Quarter
|
||||||||||||
|
Revenue
|
$
|
80.2
|
|
$
|
113.7
|
|
$
|
110.1
|
|
$
|
137.4
|
|
||||
|
Operating expenses
|
69.2
|
|
73.5
|
|
67.8
|
|
76.6
|
|
||||||||
|
Operating income
|
11.0
|
|
40.2
|
|
42.3
|
|
60.8
|
|
||||||||
|
Consolidated net (loss) income
|
(3.5
|
)
|
17.0
|
|
25.7
|
|
41.0
|
|
||||||||
|
Net (loss) income attributable to NCM, Inc.
|
(1.9
|
)
|
4.2
|
|
11.2
|
|
16.3
|
|
||||||||
|
(Loss) Earnings per NCM, Inc. share, basic
(1)
|
(0.03
|
)
|
0.05
|
|
0.15
|
|
0.21
|
|
||||||||
|
(Loss) Earnings per NCM, Inc. share, diluted
(1)
|
(0.03
|
)
|
0.05
|
|
0.14
|
|
0.21
|
|
||||||||
|
(1)
|
Earnings per share in each quarter is computed using the weighted-average number of common shares outstanding during that quarter while earnings per share for the full year is computed using the weighted average number of common shares outstanding during the year.
|
|
17.
|
SUBSEQUENT EVENT
|
On
February 20, 2020
, the Company declared a cash dividend of
$0.19
per share (approximately
$14.8 million
) on each share of the Company’s common stock (not including outstanding restricted stock which will accrue dividends until the shares vest) to stockholders of record on
March 3, 2020
to be paid on
March 17, 2020
.
|
Item 9.
|
Changes in and Disagreements with Accountants on Accounting and Financial Disclosure
|
Not applicable.
|
Item 9A.
|
Controls and Procedures
|
Evaluation of Disclosure Controls and Procedures.
The Company maintains disclosure controls and procedures as defined in Rules 13a-15(e) and 15d-15(e) of the Securities Exchange Act of 1934, as amended (the “Exchange Act”), that are designed to ensure that information required to be disclosed in the Company’s reports filed under the Exchange Act, is recorded, processed, summarized and reported within the time periods specified in the SEC’s rules and forms, and that such information is accumulated and communicated to management, including the Company’s Chief Executive Officer (principal executive officer) and Chief Financial Officer (principal financial officer), as appropriate, to allow timely decisions regarding required disclosure.
Management, with the participation of the Chief Executive Officer (CEO) and Chief Financial Officer (CFO), performed an evaluation of the effectiveness of the Company’s disclosure controls and procedures pursuant to Rule 13a-15(e) and 15d-15(e) of the Exchange Act as of
December 26, 2019
, the end of the period covered by this Annual Report on Form 10-K. Based on such evaluation, the CEO and the CFO concluded that the Company’s disclosure controls and procedures were effective.
Management’s Annual Report on Internal Control over Financial Reporting.
Management is responsible for establishing and maintaining adequate internal control over financial reporting as defined in Exchange Act Rules 13a-15(f) and 15d-15(f). Management evaluated the design and operating effectiveness of the Company’s internal control over financial reporting based on the framework in
Internal Control- Integrated Framework
(2013) issued by the Committee of Sponsoring Organizations of the Treadway Commission (COSO). Based on that evaluation, the Company's management concluded that the Company's internal control over financial reporting as of
December 26, 2019
was effective.
In designing and evaluating our disclosure controls and procedures, management recognizes that any control, no matter how well designed and operated, can provide only reasonable, not absolute, assurance of achieving the desired control objectives. Due to the inherent limitations in all control systems, no evaluation of controls can provide absolute assurance that misstatements due to error or fraud will not occur or that all control issues and instances of fraud, if any, within the Company have been detected.
Attestation Report of the Registered Public Accounting Firm. The effectiveness of our internal control over financial reporting as of
December 26, 2019
has been attested by the Company’s registered independent public accounting firm, Deloitte & Touche LLP, as stated in its report, which appears herein.
83
Changes in Internal Control over Financial Reporting.
There were no changes in our internal control over financial reporting that occurred during the quarter ended
December 26, 2019
that have materially affected, or are reasonably likely to materially affect, our internal control over financial reporting.
84
REPORT OF INDEPENDENT REGISTERED PUBLIC ACCOUNTING FIRM
To the Stockholders and the Board of Directors of
National CineMedia, Inc.
Opinion on Internal Control over Financial Reporting
We have audited the internal control over financial reporting of National CineMedia, Inc. and subsidiary (the “Company”) as of December 26, 2019, based on criteria established in
Internal Control - Integrated Framework (2013)
issued by the Committee of Sponsoring Organizations of the Treadway Commission (COSO). In our opinion, the Company maintained, in all material respects, effective internal control over financial reporting as of December 26, 2019, based on criteria established in
Internal Control - Integrated Framework (2013)
issued by COSO.
We have also audited, in accordance with the standards of the Public Company Accounting Oversight Board (United States) (PCAOB), the consolidated financial statements as of and for the year ended December 26, 2019, of the Company and our report dated February 20, 2020, expressed an unqualified opinion on those financial statements and included an explanatory paragraph regarding the Company's adoption of a new accounting standard.
Basis for Opinion
The Company’s management is responsible for maintaining effective internal control over financial reporting and for its assessment of the effectiveness of internal control over financial reporting, included in the accompanying
Management’s Annual Report on Internal Control over Financial Reporting
. Our responsibility is to express an opinion on the Company’s internal control over financial reporting based on our audit. We are a public accounting firm registered with the PCAOB and are required to be independent with respect to the Company in accordance with the U.S. federal securities laws and the applicable rules and regulations of the Securities and Exchange Commission and the PCAOB.
We conducted our audit in accordance with the standards of the PCAOB. Those standards require that we plan and perform the audit to obtain reasonable assurance about whether effective internal control over financial reporting was maintained in all material respects. Our audit included obtaining an understanding of internal control over financial reporting, assessing the risk that a material weakness exists, testing and evaluating the design and operating effectiveness of internal control based on the assessed risk, and performing such other procedures as we considered necessary in the circumstances. We believe that our audit provides a reasonable basis for our opinion.
Definition and Limitations of Internal Control over Financial Reporting
A company’s internal control over financial reporting is a process designed to provide reasonable assurance regarding the reliability of financial reporting and the preparation of financial statements for external purposes in accordance with generally accepted accounting principles. A company’s internal control over financial reporting includes those policies and procedures that (1) pertain to the maintenance of records that, in reasonable detail, accurately and fairly reflect the transactions and dispositions of the assets of the company; (2) provide reasonable assurance that transactions are recorded as necessary to permit preparation of financial statements in accordance with generally accepted accounting principles, and that receipts and expenditures of the company are being made only in accordance with authorizations of management and directors of the company; and (3) provide reasonable assurance regarding prevention or timely detection of unauthorized acquisition, use, or disposition of the company’s assets that could have a material effect on the financial statements.
Because of its inherent limitations, internal control over financial reporting may not prevent or detect misstatements. Also, projections of any evaluation of effectiveness to future periods are subject to the risk that controls may become inadequate because of changes in conditions, or that the degree of compliance with the policies or procedures may deteriorate.
/s/ Deloitte & Touche LLP
Denver, Colorado
February 20, 2020
85
|
Item 9B.
|
Other Information
|
None.
PART III
|
Item 10.
|
Directors, Executive Officers and Corporate Governance
|
The information required by this item with respect to our directors is incorporated herein by reference from the Company's 2020 Proxy Statement under the heading “Proposal 1- Election of Directors.”
The information required by this item regarding our executive officers is set forth in Part I of this Annual Report on Form 10-K under the heading “Information about our Executive Officers and is incorporated herein by this reference.”
Our Board adopted a Code of Business Conduct and Ethics that applies to all of our employees, including our Board of Directors, Chief Executive Officer and principal financial officer. The Code of Business Conduct and Ethics sets forth the Company’s conflict of interest policy, records retention policy, insider trading policy and policies for protection of the Company’s property, business opportunities and proprietary information. Our Code of Business Conduct and Ethics is available free of charge on our website at
ncm.com
under the tab “Investor Relations– Corporate Governance.” We intend to post on our website any amendments to, or waivers from our Code of Business Conduct and Ethics applicable to senior financial executives.
|
Item 11.
|
Executive Compensation
|
The information required by this item regarding compensation of executive officers and directors is incorporated herein by reference from the Proxy Statement under the headings “Compensation of Executive Officers,” “Compensation Committee Report”.
|
Item 12.
|
Security Ownership of Certain Beneficial Owners and Management and Related Stockholder Matters
|
For information with respect to the security ownership of directors, executive officers and holders of more than 5% of a class of our voting securities, refer to the Proxy Statement under the heading “Beneficial Ownership,” which information is incorporated herein by reference.
For Equity Incentive Plan information, refer to the Proxy Statement under the heading “Equity Compensation Plan”, which information is incorporated herein by reference.
|
Item 13.
|
Certain Relationships and Related Transactions, and Director Independence
|
For information with respect to certain relationships and related transactions, refer to the Proxy Statement under the heading “Certain Relationships and Related Party Transactions,” which information is incorporated herein by reference.
For information with respect to director independence, refer to the Proxy Statement under the heading “Proposal 1- Election of Directors,” which information is incorporated herein by reference.
|
Item 14.
|
Principal Accounting Fees and Services
|
The information required by this item with respect to principal accounting fees and services is incorporated herein by reference from the Proxy Statement under the heading “Fees Paid to Independent Auditors.”
86
PART IV
|
Item 15.
|
Exhibits, Financial Statement Schedules
|
(a) (1) and (a) (2) Financial statements and financial statement schedules
Refer to Index to Financial Statements on page 49.
(b) Exhibits
Refer to Exhibit Index, beginning on page 88.
(c) Financial Statement Schedules
Financial Statement Schedules not included herein have been omitted because they are either not required, not applicable, or the information is otherwise included herein.
87
INDEX TO EXHIBITS
|
|
|
|
Incorporation by Reference
|
|||
|
Exhibit
|
Ref.
|
Description
|
Form
|
SEC File No.
|
Exhibit
|
Filing
Date
|
|
3.1
|
8-K
|
001-33296
|
3.1
|
7/6/2018
|
||
|
3.2
|
10-Q
|
001-33296
|
3.1
|
11/4/2019
|
||
|
4.1
|
|
8-K
|
001-33296
|
4.1
|
8/19/2016
|
|
|
4.2
|
|
8-K
|
001-33296
|
4.1
|
8/19/2016
|
|
|
4.3
|
8-K
|
001-33296
|
4.1
|
10/8/2019
|
||
|
4.4
|
8-K
|
001-33296
|
4.1
|
10/8/2019
|
||
|
4.5
|
*
|
|||||
|
10.1
|
8-K
|
001-33296
|
10.1
|
2/16/2007
|
||
|
10.1.1
|
|
10-Q
|
001-33296
|
10.1.1
|
8/7/2009
|
|
|
10.1.2
|
|
8-K
|
001-33296
|
10.1
|
8/10/2010
|
|
|
10.1.3
|
|
8-K
|
001-33296
|
10.1.3
|
9/9/2013
|
|
|
10.1.4
|
10-K
|
001-33296
|
10.1.4
|
2/21/2019
|
||
88
|
|
|
|
Incorporation by Reference
|
|||
|
Exhibit
|
Ref.
|
Description
|
Form
|
SEC File No.
|
Exhibit
|
Filing
Date
|
|
10.2
|
|
10-K
|
001-33296
|
10.2.4
|
2/21/2014
|
|
|
10.2.1
|
8-K
|
001-33296
|
10.1
|
3/15/2017
|
||
|
10.3
|
10-K
|
001-33296
|
10.3.4
|
2/21/2014
|
||
|
10.3.1
|
8-K
|
001-33296
|
10.3
|
3/15/2017
|
||
|
10.3.2
|
8-K
|
001-33296
|
10.2
|
9/17/2019
|
||
|
10.4
|
10-K
|
001-33296
|
10.4.4
|
2/21/2014
|
||
|
10.4.1
|
8-K
|
001-33296
|
10.2
|
3/15/2017
|
||
|
10.4.2
|
8-K
|
001-33296
|
10.2
|
9/17/2019
|
||
|
10.5
|
8-K
|
001-33296
|
10.6
|
2/16/2007
|
||
|
10.6
|
8-K
|
001-33296
|
10.7
|
2/16/2007
|
||
89
|
|
|
|
Incorporation by Reference
|
|||
|
Exhibit
|
Ref.
|
Description
|
Form
|
SEC File No.
|
Exhibit
|
Filing
Date
|
|
10.6.1
|
8-K
|
001-33296
|
10.1
|
5/5/2008
|
||
|
10.7
|
|
8-K
|
001-33296
|
10.9
|
2/16/2007
|
|
|
10.8
|
|
8-K
|
001-33296
|
10.10
|
2/16/2007
|
|
|
10.9
|
|
8-K
|
001-33296
|
10.11
|
2/16/2007
|
|
|
10.10
|
|
8-K
|
001-33296
|
10.12
|
2/16/2007
|
|
|
10.11
|
8-K
|
001-33296
|
10.1
|
6/25/2018
|
||
|
10.12
|
8-K
|
001-33296
|
10.1
|
6/1/2018
|
||
|
10.13
|
10-Q
|
001-33296
|
10.3
|
11/4/2019
|
||
|
10.14
|
|
10-Q
|
001-33296
|
10.1
|
5/12/2015
|
|
|
10.15
|
8-K
|
001-33296
|
10.1
|
12/21/2018
|
||
|
10.16
|
8-K
|
001-33296
|
10.1
|
12/19/2019
|
||
|
10.17
|
8-K
|
001-33296
|
10.2
|
12/19/2019
|
||
|
10.18
|
10-K
|
001-33296
|
10.21
|
2/21/2019
|
||
90
|
|
|
|
Incorporation by Reference
|
|||
|
Exhibit
|
Ref.
|
Description
|
Form
|
SEC File No.
|
Exhibit
|
Filing
Date
|
|
10.19
|
10-K
|
001-33296
|
10.21
|
2/21/2019
|
||
|
10.20
|
|
8-K
|
001-33296
|
10.1
|
2/13/2007
|
|
|
10.21
|
|
10-Q
|
001-33296
|
10.3
|
8/7/2018
|
|
|
10.22
|
|
8-K
|
001-33296
|
10.2
|
5/2/2013
|
|
|
10.23
|
|
S-8
|
001-33296
|
4.1
|
4/29/2016
|
|
|
10.24
|
|
S-8
|
001-33296
|
4.4
|
2/13/2007
|
|
|
10.25
|
|
S-8
|
001-33296
|
4.6
|
2/13/2007
|
|
|
10.25.1
|
|
10-K
|
001-33296
|
10.22.1
|
3/6/2009
|
|
|
10.25.2
|
|
10-K
|
001-33296
|
10.22.2
|
3/9/2010
|
|
|
10.25.3
|
|
10-K
|
001-33296
|
10.22.3
|
2/25/2011
|
|
|
10.25.4
|
|
10-K
|
001-33296
|
10.22.4
|
2/24/2012
|
|
|
10.25.5
|
10-Q
|
001-33296
|
10.4
|
11/4/2019
|
||
|
10.26.2
|
|
10-K
|
001-33296
|
10.26.9
|
2/24/2017
|
|
|
10.26.3
|
|
10-K
|
001-33296
|
10.26.10
|
2/24/2017
|
|
|
10.26.4
|
(1)
|
10-K
|
333-176056
|
10.24.9
|
3/14/2018
|
|
|
10.26.5
|
(1)
|
10-K
|
333-176056
|
10.24.10
|
3/14/2018
|
|
|
10.26.6
|
10-K
|
333-176056
|
10.28.9
|
2/21/2019
|
||
|
10.26.7
|
10-K
|
333-176056
|
10.28.10
|
2/21/2019
|
||
|
10.26.8
|
*
|
|||||
|
10.26.9
|
*
|
|||||
|
10.27
|
|
10-K
|
001-33296
|
10.34
|
3/6/2009
|
|
|
10.27.1
|
|
S-8
|
001-33296
|
4.4
|
4/29/2016
|
|
|
10.27.2
|
10-K
|
001-33296
|
10.27.2
|
2/24/2017
|
||
|
21.1
|
*
|
|
|
|
|
|
|
23.1
|
*
|
|
|
|
|
|
91
|
|
|
|
Incorporation by Reference
|
|||
|
Exhibit
|
Ref.
|
Description
|
Form
|
SEC File No.
|
Exhibit
|
Filing
Date
|
|
24.1
|
*
|
|||||
|
31.1
|
*
|
|
|
|
|
|
|
31.2
|
*
|
|
|
|
|
|
|
32.1
|
**
|
|
|
|
|
|
|
32.2
|
**
|
|
|
|
|
|
|
101.INS
|
*
|
XBRL Instance Document.
|
|
|
|
|
|
101.SCH
|
*
|
XBRL Taxonomy Extension Schema Document.
|
|
|
|
|
|
101.CAL
|
*
|
XBRL Taxonomy Extension Calculation Linkbase Document.
|
|
|
|
|
|
101.DEF
|
*
|
XBRL Taxonomy Extension Definition Linkbase Document.
|
|
|
|
|
|
101.LAB
|
*
|
XBRL Taxonomy Extension Label Linkbase Document.
|
|
|
|
|
|
101.PRE
|
*
|
XBRL Taxonomy Extension Presentation Linkbase Document.
|
|
|
|
|
|
*
|
Filed herewith.
|
|
**
|
Furnished herewith.
|
|
+
|
Management contract.
|
(1)
Incorporated by reference to the exhibit listed from NCM LLC’s Annual Report on Form 10-K.
92
|
Item 16.
|
Form 10-K Summary
|
Not applicable.
SIGNATURES
Pursuant to the requirements of Section 13 or 15(d) of the Securities Exchange Act of 1934, the registrant has duly caused this report to be signed on its behalf by the undersigned, thereunto duly authorized.
|
|
|
|
NATIONAL CINEMEDIA, INC.
|
|
|
|
|
(Registrant)
|
|
|
|
|
|
|
Date:
|
February 20, 2020
|
|
/s/ Thomas F. Lesinski
|
|
|
|
|
Thomas F. Lesinski
|
|
|
|
|
Chief Executive Officer
|
|
|
|
|
(Principal Executive Officer)
|
93
Pursuant to the requirements of the Securities Exchange Act of 1934, this report has been signed below by the following persons on behalf of the registrant and in the capacities indicated on the 20th day of February, 2020.
|
Signature
|
|
Title
|
|
|
|
|
|
|
|
/s/ Thomas F. Lesinski
|
|
Chief Executive Officer
|
|
|
Thomas F. Lesinski
|
|
(Principal Executive Officer)
|
|
|
|
|
|
|
|
/s/ Katherine L. Scherping
|
|
Chief Financial Officer
|
|
|
Katherine L. Scherping
|
|
(Principal Financial and Accounting Officer)
|
|
|
|
|
|
|
|
*
|
|
Chairman
|
|
|
Mark B. Segall
|
|
||
|
|
|
|
|
|
*
|
|
Director
|
|
|
David E. Glazek
|
|
||
|
|
|
||
|
*
|
|
Director
|
|
|
Lawrence A. Goodman
|
|
||
|
|
|
||
|
*
|
|
Director
|
|
|
David R. Haas
|
|
||
|
*
|
|
Director
|
|
|
Kurt C. Hall
|
|
||
|
*
|
|
Director
|
|
|
Lee Roy Mitchell
|
|
||
|
|
|
||
|
*
|
|
Director
|
|
|
Donna Reisman
|
|
|
|
|
|
|
|
|
|
*
|
|
Director
|
|
|
Renana Teperberg
|
|
|
|
|
*By:
|
/s/ Sarah Kinnick Hilty
|
|
Attorney-in-fact
|
|
Sarah Kinnick Hilty
|
|
|
|
94
TABLE OF CONTENTS
Part IItem 1. BusinessItem 1A. Risk FactorsItem 1B. Unresolved Staff CommentsItem 2. PropertiesItem 3. Legal ProceedingsItem 4. Mine Safety DisclosuresPart IIItem 5. Market For Registrant S Common Equity, Related Stockholder Matters and Issuer Purchases Of Equity SecuritiesItem 6. Selected Financial DataItem 7. Management S Discussion and Analysis Of Financial Condition and Results Of OperationsItem 7A. Quantitative and Qualitative Disclosures About Market RiskItem 8. Financial Statements and Supplementary DataItem 9. Changes in and Disagreements with Accountants on Accounting and Financial DisclosureItem 9A. Controls and ProceduresItem 9B. Other InformationPart IIIItem 10. Directors, Executive Officers and Corporate GovernanceItem 11. Executive CompensationItem 12. Security Ownership Of Certain Beneficial Owners and Management and Related Stockholder MattersItem 13. Certain Relationships and Related Transactions, and Director IndependenceItem 14. Principal Accounting Fees and ServicesPart IVItem 15. Exhibits, Financial Statement SchedulesItem 16. Form 10-k Summary