NCR CORP
10-Ks and 10-Qs
|
|
|
|
|
|
|
|
|
|
|
|
|
|
|
|
|
|
|
|
|
|
|
|
|
|
|
|
|
|
|
|
|
|
|
|
|
|
|
|
|
|
|
|
|
|
|
|
|
|
|
|
|
|
|
|
UNITED STATES
SECURITIES AND EXCHANGE COMMISSION
Washington, D.C. 20549
________________________
FORM
10-K
________________________
|
þ
|
ANNUAL REPORT PURSUANT TO SECTION 13 OR 15(d) OF THE SECURITIES EXCHANGE ACT OF 1934
|
For the fiscal year ended
December 31, 2015
Commission File Number 001-00395
________________________

NCR CORPORATION
(Exact name of registrant as specified in its charter)
________________________
|
Maryland
|
|
31-0387920
|
|
(State or other jurisdiction of
incorporation or organization)
|
|
(I.R.S. Employer
Identification No.)
|
3097 Satellite Boulevard
Duluth, GA 30096
(Address of principal executive offices) (Zip Code)
Registrant’s telephone number, including area code: (937) 445-5000
Securities registered pursuant to Section 12(b) of the Act:
|
Title of each class
|
Name of each exchange on which registered
|
|
|
Common Stock, par value $0.01 per share
|
New York Stock Exchange
|
|
Securities registered pursuant to Section 12(g) of the Act: None
________________________
Indicate by check mark if the registrant is a well-known seasoned issuer, as defined in Rule 405 of the Securities Act. Yes
þ
No
o
Indicate by check mark if the registrant is not required to file reports pursuant to Section 13 or Section 15(d) of the Act. Yes
o
No
þ
Indicate by check mark whether the registrant (1) has filed all reports required to be filed by Section 13 or 15(d) of the Securities Exchange Act of 1934 during the preceding 12 months (or for such shorter period that the registrant was required to file such reports), and (2) has been subject to such filing requirements for the past 90 days. Yes
þ
No
o
Indicate by check mark whether the registrant has submitted electronically and posted on its corporate Web site, if any, every Interactive Data File required to be submitted and posted pursuant to Rule 405 of Regulation S-T (§232.405 of this chapter) during the preceding 12 months (or for such shorter period that the registrant was required to submit and post such files). Yes
þ
No
o
Indicate by check mark if disclosure of delinquent filers pursuant to Item 405 of Regulation S-K (§229.405) is not contained herein, and will not be contained, to the best of the registrant's knowledge, in definitive proxy or information statements incorporated by reference in Part III of this Form 10-K or any amendment to this Form 10-K.
o
Indicate by check mark whether the registrant is a large accelerated filer, an accelerated filer, a non-accelerated filer, or a smaller reporting company. See the definitions of “large accelerated filer,” “accelerated filer,” and “smaller reporting company” in Rule 12b-2 of the Exchange Act.
|
Large accelerated filer
|
þ
|
Accelerated filer
|
o
|
||
|
Non-accelerated filer
|
o
|
(Do not check if a smaller reporting company)
|
Smaller reporting company
|
o
|
|
Indicate by check mark whether the registrant is a shell company (as defined in Rule 12b-2 of the Exchange Act). Yes
o
No
þ
The aggregate market value of voting stock held by non-affiliates of the registrant as of
June 30, 2015
, was approximately
$5.1 billion
. As of
February 17, 2016
, there were approximately
133.1 million
shares of common stock issued and outstanding.
DOCUMENTS INCORPORATED BY REFERENCE
|
Part III:
|
Portions of the Registrant’s Definitive Proxy Statement for its Annual Meeting of Stockholders to be filed pursuant to Regulation 14A within 120 days after the Registrant’s fiscal year end of December 31, 2015 are incorporated by reference into Part III of this Report.
|
TABLE OF CONTENTS
|
Item
|
Description
|
Page
|
|
PART I
|
||
|
1.
|
||
|
1A.
|
||
|
1B.
|
||
|
2.
|
||
|
3.
|
||
|
4.
|
||
|
PART II
|
||
|
5.
|
||
|
6.
|
||
|
7.
|
||
|
7A.
|
||
|
8.
|
||
|
9.
|
||
|
9A.
|
||
|
9B.
|
||
|
PART III
|
||
|
10.
|
||
|
11.
|
||
|
12.
|
||
|
13.
|
||
|
14.
|
||
|
PART IV
|
||
|
15.
|
||
This Report contains trademarks, service marks and registered marks of NCR Corporation and its subsidiaries, and of other companies, as indicated.
FORWARD-LOOKING STATEMENTS
This Annual Report on Form 10-K contains forward-looking statements. Forward-looking statements use words such as “expect,” “anticipate,” “outlook,” “intend,” “believe,” “will,” “should,” “would,” “could” and words of similar meaning. Statements that describe or relate to our plans, goals, intentions, strategies or financial outlook, and statements that do not relate to historical or current fact, are examples of forward-looking statements. Forward-looking statements are based on our current beliefs, expectations and assumptions, which may not prove to be accurate, and involve a number of known and unknown risks and uncertainties, many of which are out of our control. Forward-looking statement are not guarantees of future performance, and there are a number of important factors that could cause actual outcomes and results to differ materially from the results contemplated by such forward-looking statements, including those listed in Item 1A "Risk Factors," and Item 7, "Management's Discussion and Analysis of Financial Condition and Results of Operations," of this Annual Report on Form 10-K. Any forward-looking statement speaks only as of the date on which it is made. We do not undertake any obligation to publicly update or revise any forward-looking statements, whether as a result of new information, future events or otherwise.
i
General
NCR Corporation and its subsidiaries (NCR or the Company, also referred to as “we”, “us” or “our”) provide technology solutions and services that help businesses connect, interact and transact with their customers.
Businesses
NCR Corporation is a leading global technology company that provides innovative products and services that enable businesses to connect, interact and transact with their customers and enhance their customer relationships by addressing consumer demand for convenience, value and individual service. Our portfolio of self-service and assisted-service solutions serve customers in the financial services, retail, hospitality, travel and telecommunications and technology industries. Our offerings include software and hardware solutions for automated teller machines (ATMs) and bank branches, retail and hospitality point of sale applications and devices, and self-service kiosks and software applications that can be used by consumers to enable them to interact with businesses from their computer or mobile device. We complement these product solutions by offering a complete portfolio of services to support both NCR and third party solutions. We also resell third-party networking products and provide related service offerings in the telecommunications and technology sectors.
Industries Served
NCR provides specific solutions for customers of varying sizes in a range of industries such as financial services, retail, hospitality, travel and telecommunications and technology. NCR’s solutions are built on a foundation of long-established industry knowledge and consulting expertise, value-added software and hardware technology, global customer support services, and a complete line of business consumables and specialty media products.
Company History
NCR was originally incorporated in 1884 and was a publicly traded company on the New York Stock Exchange prior to its merger with a wholly-owned subsidiary of AT&T Corp. (AT&T) on September 19, 1991. Subsequently, on December 31, 1996, AT&T distributed all of its interest in NCR to its stockholders. NCR common stock is listed on the New York Stock Exchange and trades under the symbol “NCR”.
On September 30, 2007, NCR completed the spin-off of its Teradata Data Warehousing business through the distribution of a tax-free stock dividend to NCR stockholders. NCR distributed one share of common stock of Teradata Corporation for each share of NCR common stock to NCR stockholders of record as of the close of business on September 14, 2007.
Significant Transactions
In May 2015, the Company completed the transfer of its UK London pension plan to an insurer. The transaction materially reduced pension liability, participants, and enterprise risk as part of our overall pension de-risking strategy. As a result of the transaction, the Company recorded a $427 million settlement loss.
On December 4, 2015, NCR completed the sale of $820 million of its Series A Convertible Preferred Stock to certain entities affiliated with Blackstone Capital Partners VI L.P. and Blackstone Tactical Opportunities L.L.C. (collectively, Blackstone). Proceeds from the sale were used, along with cash on hand and borrowings from our revolving facilities, to complete the repurchase, through a modified “Dutch auction” tender offer, of $1 billion of our common stock.
Operating Segments
We categorize our operations into four reportable segments: Financial Services, Retail Solutions, Hospitality, and Emerging Industries.
The information required by Item 1 with respect to our reportable segments and financial information regarding our geographic areas and those reportable segments can be found in Item 7 of Part II of this Report under “Revenue and Operating Income by Segment” as well as in Item 8 of Part II of this Report as part of
Note 14, “Segment Information and Concentrations”
of the Notes to Consolidated Financial Statements, and is incorporated herein by reference.
1
As of January 1, 2016, NCR began management of its business on a solution basis, changing from the previous model of management on a line of business basis. This change to our segment reporting for fiscal year 2016 and future periods is further described in
Note 1, “Description of Business and Significant Accounting Policies”
of the Notes to Consolidated Financial Statements in Item 8 of Part II of this Report.
Products and Services
We sell products and services that help businesses connect, interact and transact with their customers. Our product and service offerings fall into the following categories:
ATMs and Other Financial Products
We provide financial institutions, retailers and independent deployers with financial-oriented self-service technologies, such as ATMs, cash dispensers, software solutions, including the APTRA™ self-service ATM software application suite (providing ATM management systems), cash management and video banking software and customer-facing digital banking services, as well as professional services related to ATM security, software and bank branch optimization. ATM and other financial product solutions are designed to quickly and reliably process consumer transactions and incorporate advanced features such as automated check cashing and deposit, automated cash deposit, web-enablement and bill payment (including mobile bill payment). These solutions help enable businesses to reduce costs and generate new revenue streams while enhancing customer loyalty.
Point of Sale
We provide retail- and hospitality-oriented technologies such as point of sale terminals and point of sale software, bar-code scanners and other retail-oriented software and services to retailers, restaurants, food service companies and entertainment and sports venues worldwide. Combining our retail and hospitality industry expertise, software and hardware technologies, and professional services, our solutions are designed to enable cost reductions and improve operational efficiency while increasing customer satisfaction.
Self-Service Kiosks
We provide self-service kiosks and related operating software to the retail, hospitality and travel industries. Our versatile kiosk solutions can support numerous retail self-service functions, including self-checkout, wayfinding (locating products or navigating through large, complex buildings and campuses), digital signage, bill payment and gift registries. We provide self-check in/out kiosk solutions to airlines, hotels and casinos that allow guests to check in/out without assistance. These solutions create pleasant and convenient experiences for consumers and enable our customers to reduce costs. Our kiosks for the hospitality industry provide consumers the ability to order and pay at restaurants while enabling our customers to streamline order processing and reduce operating costs.
Check and Document Imaging
Our check and document imaging offerings provide end-to-end solutions for both traditional paper-based and image-based check and item processing. These solutions utilize advanced image recognition and workflow technologies to automate item processing, helping financial institutions increase efficiency and reduce operating costs. Consisting of hardware, software, professional and support services, our comprehensive check and document imaging solutions enable check- and item-based transactions to be digitally captured, processed and retained within a flexible, scalable environment.
Consumables
We develop, produce and market a complete line of printer consumables for various print technologies. These products include two-sided thermal paper (2ST
®
), paper rolls for receipts in ATMs and POS solutions, inkjet and laser printer supplies, thermal transfer and ink ribbons, labels, laser documents, business forms and specialty media items such as photo and presentation papers. Consumables are designed to optimize operations and improve transaction accuracy, while reducing overall costs.
Services
Services are an essential and integrated component of NCR’s complete solution offerings. We provide maintenance and support services for our product offerings and also provide other services including site assessment and preparation, staging, installation and implementation, systems management and complete managed services. We provide Predictive Services, a managed services offering, which is designed to predict and address information technology issues quickly before they happen.
2
We also offer a range of software and services such as cloud (or software-as-a-service) solutions, hosted services, and online, mobile and transactional services and applications such as bill pay. In addition, we are also focused on expanding the resale of third party networking products and related service offerings to a broader base of customers in the telecommunications and technology sectors and servicing third party computer hardware from select manufacturers who value and leverage our global service capability.
Target Markets and Distribution Channels
Our ATMs and other financial product solutions primarily serve the financial services industry with particular focus on retail banking, which includes traditional providers of consumer banking and financial services. These solutions also serve the retail markets through convenience banking products for retailers designed to complement their core businesses. Customers are located throughout the world in both developed and emerging markets. We have historically sold most of our ATMs and financial products and services through a direct sales channel, although a portion of revenue is derived through distributors and value-added resellers.
We provide self-service kiosk and POS solutions to the retail, hospitality and travel industries. Retail customers include department stores, specialty retailers, mass merchandisers, catalog stores, supermarkets, hypermarkets, grocery stores, drug stores, wholesalers, convenience stores, petroleum outlets and small businesses. Hospitality customers include retailers, restaurants and food service providers, and sports and entertainment venues (including stadiums, arenas and cinemas) and small businesses. Travel customers include airlines, airports, car rental companies, and hotel/lodging operators. Self-service kiosk and POS solutions are sold through a direct sales force and through relationships with value-added resellers, distributors, dealers and other indirect sales channels. We have focused our investments and resources on self-service technologies with expanded offerings to include self-ticketing and mobile check-in for the travel industry.
Our imaging solutions primarily serve the financial services industry globally, with the primary focus on banks. We have historically distributed most of our imaging products and services through a direct sales channel, although certain revenue is derived through sales by value-added resellers and distributors.
Our consumables products are sold to the financial services, retail and hospitality industries as well as to customers involved in transportation and manufacturing. These products are also sold through a direct sales force as well as through various channel partners including office product retailers, contract stationers, value-added resellers, original equipment manufacturers and, additionally, through telemarketing and the Internet.
We provide service and support for our products and solutions through service contracts with our customers. We have also established managed service contracts with key customers and continue to pursue additional managed service relationships. Longer term managed service arrangements can help improve the efficiency and performance of the customer’s business, and also increase the strategic and financial importance of its relationship with NCR. We also service competing technologies—for example, ToshibaTec retail technologies and Diebold ATMs. The primary sales channel for our services is our direct sales teams, which exist across all geographies where we operate around the world. Our services professionals provide these services directly to end customers.
Competition
In the financial services industry, we face a variety of competitors, including Diebold, Wincor Nixdorf GmbH & Co. (Wincor) and Hyosung, as well as many other regional firms, across all geographies. The primary factors of competition can vary, but typically include: value and quality of the solutions or products; total cost of ownership; industry knowledge of the vendor; the vendor’s ability to provide and support a total end-to-end solution; the vendor’s ability to integrate new and existing systems; fit of the vendor’s strategic vision with the customer’s strategic direction; and quality of the vendor’s support and consulting services.
We face a variety of competitors in the retail and hospitality industries across all geographies. We believe that key competitive factors can vary by geographic area but typically include: value and quality of the solutions or products; total cost of ownership; industry knowledge of the vendor; and knowledge, experience and quality of the vendor’s consulting, deployment and support services. Our competitors vary by market segment, product, service offering and geographic area, and include ToshibaTec, Wincor, Fujitsu, Hewlett-Packard, Dell, Honeywell, Oracle, Verifone and Datalogic, among others.
We face a diverse group of competitors in the travel industry. Competitors in the travel industry include IBM, SITA and IER, among others.
We face competition for services from other technology and service providers, as well as from independent service operators, in all geographies where we operate around the world. The primary services competitors are the companies identified in the descriptions of our other solutions as global technology providers are becoming more focused on services as a core business strategy. We also compete with a range of regional and local independent service operators across our various geographies.
3
Competition for printer consumables is significant and varies by geographic area and product group. The primary areas of competitive differentiation typically include: quality; logistics and supply chain management; and total cost of ownership. While price is always a factor, we focus on the customer’s total cost of ownership for our consumables products. Total cost of ownership takes into account not only the per-unit cost, but also service, usage, reporting and support costs. Our competitors include, among others, RiteMade Paper and Schades.
We face competition in the financial services industry for imaging solutions across all geographies where we operate around the world. The primary areas of competition can vary, but typically include: quality of the solutions or products; total cost of ownership; industry knowledge; the vendor’s ability to provide and support a total end-to-end solution; the vendor’s ability to integrate new and existing systems; fit of the vendor’s strategic vision with the customer’s strategic direction; and quality of the vendor’s support and consulting services. Our competitors vary by product, service offering and geographic area, and include Fidelity National Information Services and Unisys Corporation, among others.
Research and Development
We remain focused on designing and developing solutions and services that anticipate our customers’ changing technological needs as well as consumer preferences. Our expenses for research and development were
$230 million
in
2015
,
$263 million
in
2014
, and
$203 million
in
2013
. We anticipate that we will continue to have significant research and development expenditures in the future in order to provide a continuing flow of innovative, high-quality products and services and to help maintain and enhance our competitive position. Information regarding the accounting and costs included in research and development activities is included in
Note 1, “Description of Business and Significant Accounting Policies”
of the Notes to Consolidated Financial Statements in Item 8 of Part II of this Report and is incorporated herein by reference.
Patents and Trademarks
NCR seeks patent protection for its innovations, including improvements, associated with its products, services, and developments, where such protection is likely to provide value to NCR. NCR owns approximately 1,450 patents in the U.S. and numerous other patents in foreign countries. The foreign patents are generally counterparts of NCR’s U.S. patents. Many of the patents owned by NCR are licensed to others, and NCR is licensed under certain patents owned by others. NCR has active patent licensing programs. NCR also has numerous patent applications pending in the U.S. and in foreign countries. NCR’s portfolio of patents and patent applications, in the aggregate, is of significant value to NCR.
NCR has registered certain trademarks and service marks in the U.S. and in a number of foreign countries. NCR considers the “NCR” and NCR logo marks and many of its other trademarks and service marks to be valuable assets.
Seasonality
Our sales are historically seasonal, with lower revenue in the first quarter and higher revenue in the fourth quarter of each year. Such seasonality also causes our working capital cash flow requirements to vary from quarter to quarter depending on variability in the volume, timing and mix of product sales. In addition, revenue in the third month of each quarter is typically higher than in the first and second months. Information regarding seasonality and its potential impact on our business is included in Item 1A of this Report under the caption, “Operating Results Fluctuations,” and is incorporated herein by reference.
Manufacturing and Raw Materials
In most cases, there are a number of vendors providing the services and producing the parts and components that we utilize. However, there are some services and components that are purchased from single sources due to price, quality, technology or other reasons. For example, we depend on computer chips and microprocessors from Intel and operating systems from Microsoft. Certain parts and components used in the manufacturing of our ATMs and the delivery of many of our retail solutions are also supplied by single sources. In addition, there are a number of key suppliers for our businesses who provide us with critical products for our solutions.
At
December 31, 2015
, we manufactured our ATMs in facilities located in Columbus, Georgia, USA; Manaus, Brazil; Budapest, Hungary; Beijing, China; Puducherry, India and Chengalpattu, India. Our self-checkout solutions are manufactured in facilities located in Columbus, Georgia, USA and Budapest, Hungary. Our financial kiosk solutions are manufactured in facilities located in Beijing, China; Budapest, Hungary; Manaus, Brazil; Puducherry, India and Chengalpattu, India. Our POS/Display terminals are manufactured in facilities located in Columbus, Georgia, USA; Beijing, China; Budapest, Hungary; Salzburg, Austria; and Adelaide, Australia, and certain hand-held solutions are manufactured in Salzburg, Austria. NCR outsources the manufacturing in all geographic regions of its payment solutions, some POS/Display terminals, printers, bar code scanners and various other kiosks.
4
Further information regarding the potential impact of these relationships on our business operations, and regarding sources and availability of raw materials, is also included in Item 1A of this Report under the caption “Reliance on Third Parties,” and is incorporated herein by reference.
Product Backlog
Our backlog was approximately
$1.11 billion
and
$1.10 billion
at
December 31, 2015
and
2014
, respectively. The backlog includes orders confirmed for products scheduled to be shipped as well as certain professional and transaction services to be provided. Although we believe that the orders included in the backlog are firm, some orders may be canceled by the customer without penalty. Even when penalties for cancellation are provided for in a customer contract, we may elect to permit cancellation of orders without penalty where management believes it is in our best interests to do so. Further, we have a significant portion of revenue derived from our growing service-based business (including our cloud and hosted businesses) as well as the acquired Digital Insight Corporation and Retalix Ltd. businesses and our consumables business, for which backlog information is not measured. Therefore, we do not believe that our backlog, as of any particular date, is necessarily indicative of revenue for any future period.
Employees
On
December 31, 2015
, NCR had approximately
32,600
employees and contractors worldwide.
Environmental Matters
Compliance with federal, state, and local environmental regulations relating to the protection of the environment could have a material adverse impact on our capital expenditures, earnings or competitive position. While NCR does not currently expect to incur material capital expenditures related to compliance with such laws and regulations, and while we believe the amounts provided in our Consolidated Financial Statements are adequate in light of the probable and estimable liabilities in this area, there can be no assurances that environmental matters will not lead to a material adverse impact on our capital expenditures, earnings or competitive position. A detailed discussion of the current estimated impacts of compliance issues relating to environmental regulations, particularly the Fox River and Kalamazoo River matters, is reported in Item 8 of Part II of this Report as part of
Note 11, "Commitments and Contingencies,"
of the Notes to Consolidated Financial Statements and is incorporated herein by reference. Further information regarding the potential impact of compliance with federal, state, and local environmental regulations is also included in Item 1A of this Report under the caption “Environmental,” and is incorporated herein by reference.
Executive Officers of the Registrant
The Executive Officers of NCR (as of
February 26, 2016
) are as follows:
|
Name
|
Age
|
Position and Offices Held
|
||
|
William R. Nuti
|
52
|
Chairman of the Board, Chief Executive Officer and President
|
||
|
Michael B. Bayer
|
52
|
Senior Vice President and President, Retail Solutions Division
|
||
|
Robert P. Fishman
|
52
|
Senior Vice President and Chief Financial Officer
|
||
|
Edward R. Gallagher
|
62
|
Senior Vice President, General Counsel and Corporate Secretary
|
||
|
Andrew S. Heyman
|
52
|
Senior Vice President and President, Financial Services Division
|
||
|
Andrea L. Ledford
|
50
|
Senior Vice President, Corporate Services and Chief Human Resources Officer
|
||
|
Frederick ("Rick") Marquardt
|
57
|
Executive Vice President, Services, Enterprise Quality and T&T
|
||
5
Set forth below is a description of the background of each of the Executive Officers.
William R. Nuti, is NCR's Chairman of the Board, Chief Executive Officer and President. Mr. Nuti became Chairman of the Board on October 1, 2007. Before joining NCR in August 2005, Mr. Nuti served as President and Chief Executive Officer of Symbol Technologies, Inc., an information technology company. Prior to that, he was Chief Operating Officer of Symbol Technologies. Mr. Nuti joined Symbol Technologies in 2002 following a 10 plus year career at Cisco Systems, Inc. where he advanced to the dual role of Senior Vice President of the company's Worldwide Service Provider Operations and U.S. Theater Operations. Prior to his Cisco experience, Mr. Nuti held sales and management positions at IBM, Netrix Corporation and Network Equipment Technologies. Mr. Nuti is also a director of Coach, Inc., where he is a member of its Audit, Human Resources, and Governance & Nominating Committees, and United Continental Holdings, Inc. where he is a member of its Audit Committee. Mr. Nuti previously served as a director of Sprint Nextel Corporation. He is also a member of the Georgia Institute of Technology advisory board and a trustee of Long Island University. Mr. Nuti became a director of NCR on August 7, 2005.
Michael B. Bayer joined NCR as Senior Vice President and President, Retail Solutions Division in July 2014. Prior to joining NCR, Mr. Bayer has held leadership roles at companies such as Motorola, Symbol Technologies and Cisco Systems, and most recently as President of Global Growth Markets for Avaya, a global provider of business communications, and collaboration systems. Prior to this, Mr. Bayer served as Avaya's EMEA President, where he led the region's sales and operations and worked with customers to deliver Unified Communications, IP Telephony and Contact Center solutions across EMEA. Mr. Bayer holds a master's degree in electronics and telecommunications from Fachhochschule WiirzburgSchweinfurt in Germany.
Robert P. Fishman became Senior Vice President and Chief Financial Officer in March 2010. Prior to assuming this position, he was Interim Chief Financial Officer from October 2009 to March 2010. Prior to that position, he was Vice President and Corporate Controller from January 2007 to October 2009. From September 2005 to January 2007, Mr. Fishman was Assistant Controller and from January 2005 to September 2005, he was Director, Corporate Planning. Mr. Fishman joined NCR in 1993.
Edward R. Gallagher was named Senior Vice President, General Counsel and Secretary of NCR in October 2015, having served as Acting General Counsel since October 2014. His prior position with NCR was Law Vice President, Litigation & Employment Law, commencing in 2003; he has also served in other positions within the NCR Law Department, including Chief Counsel of the former Systemedia Division. Mr. Gallagher joined NCR in 1992. Prior to that, Mr. Gallagher was an attorney in private practice with McCutchen Doyle Brown & Enersen in San Francisco and Palmer & Dodge in Boston. Mr. Gallagher holds a law degree from Yale Law School, as well as a master’s degree from Yale University in political science and international relations. He has an undergraduate degree from the University of South Dakota.
Andrew S. Heyman joined NCR as part of the Radiant Systems, Inc. (Radiant) acquisition in August 2011, when he assumed the position of Senior Vice President and General Manager, Hospitality. Mr. Heyman served in that role until January 2013, when he became Senior Vice President and President, Financial Services. Mr. Heyman previously held a variety of key leadership positions at Radiant, including chief operating officer and president of the hospitality division across fifteen years with Radiant. Mr. Heyman served as a senior manager with Accenture (formerly Andersen Consulting) from 1987 to December 1995. Mr. Heyman holds an M.S. degree in computer information systems from Georgia State University and a B.B.A. in finance from the University of Georgia.
Andrea L. Ledford became Senior Vice President, Corporate Services and Chief Human Resources Officer in November 2013. Previously, Ms. Ledford was Senior Vice President and Chief Human Resources Officer, from June 2012 to November 2013, Senior Vice President, Human Resources, from June 2007 to June 2012, and Interim Senior Vice President, Human Resources from February 2007 to June 2007. Prior to assuming this position, she was Vice President, Human Resources, Asia/Pacific, and Europe, Middle East and Africa, from February 2006 to February 2007. Before joining NCR in February 2006, Ms. Ledford was EMEA Leader, Human Resources, at Symbol Technologies, Inc. from 2002 to February 2006 and held a variety of leadership roles at Cisco Systems, Inc. in EMEA, Asia/Pacific and Latin America.
Frederick ("Rick") Marquardt is NCR’s Executive Vice President, Services, Enterprise Quality and T&T, a role he assumed in January 2016. From April 2014 to January 2016, Mr. Marquardt served as Executive Vice President, Services, Hardware Solutions and Enterprise Quality. Mr. Marquardt joined NCR in 2006, and has held a variety of roles at the company including Senior Vice President of Integrated Supply Chain from September 2013 to April 2014, Senior Vice President of Global Operations, Vice President of Manufacturing for NCR, and Vice President of Global Operations for NCR's Financial Industry Business Unit (now the Financial Services division). Prior to joining NCR, Mr. Marquardt worked for Motorola Corporation, where he held several leadership positions in operations and manufacturing.
6
Available Information
NCR makes available through its website at http://investor.ncr.com, free of charge, its Annual Report on Form 10-K, Quarterly Reports on Form 10-Q, definitive proxy statements on Schedule 14A and Current Reports on Form 8-K, and all amendments to such reports and schedules, as soon as reasonably practicable after these reports are electronically filed or furnished to the U.S. Securities and Exchange Commission (SEC) pursuant to Section 13(a) or 15(d) of the Securities Exchange Act of 1934 (the Exchange Act). The SEC website (www.sec.gov) contains the reports, proxy statements and information statements, and other information regarding issuers that file or furnish electronically with the SEC. Also, the public may read and copy any materials that NCR files or furnishes with the SEC at the SEC’s Public Reference Room at 100 F Street, NE, Washington, DC 20549. Information on the operation of the Public Reference Room may be obtained by calling the SEC at 1-800-SEC-0330. NCR will furnish, without charge to a security holder upon written request, the Notice of Meeting and Proxy Statement for the
2016
Annual Meeting of Stockholders (the
2016
Proxy Statement), portions of which are incorporated herein by reference. NCR also will furnish its Code of Conduct at no cost and any other exhibit at cost. Document requests are available by calling or writing to:
NCR—Investor Relations
3097 Satellite Boulevard
Duluth, GA 30096
Phone: 800-255-5627
E-Mail: investor.relations@ncr.com
Website: http://investor.ncr.com
NCR's website, www.ncr.com, contains a significant amount of information about NCR, including financial and other information for investors. NCR encourages investors to visit its website regularly, as information may be updated and new information may be posted at any time. The contents of NCR's website are not incorporated by reference into this Form 10-K and shall not be deemed “filed” under the Exchange Act.
7
The risks and uncertainties described below could materially and adversely affect our business, financial condition, results of operations, could cause actual results to differ materially from our expectations and projections, and could cause the market value of our stock to decline. You should consider these risk factors when reading the rest of this Annual Report on Form 10-K, including “Management's Discussion and Analysis of Financial Condition and Results of Operations” and our financial statements and related notes included elsewhere in this document. These risk factors may not include all of the important factors that could affect our business or our industry or that could cause our future financial results to differ materially from historic or expected results or cause the market price of our common stock to fluctuate or decline.
Economic Pressures.
Our business may be negatively affected by domestic and global economic and credit conditions.
Our business is sensitive to the strength of domestic and global economic and credit conditions, particularly as they affect the financial services, retail and hospitality sectors of the economy in various parts of the world. Economic and credit conditions are influenced by a number of factors, including consumer confidence, unemployment levels, interest rates, commodity prices, political conditions and the effects of government actions to address economic slow-downs and sovereign debt issues, improve global credit markets and generally stimulate economic growth. Slower growth in China, Russia and other emerging markets, fluctuations in oil and commodity prices, market conditions and spending trends in the financial services industry, sovereign debt crises in the Eurozone and elsewhere, and the uneven global economic recovery, among other things, have created a challenging and unpredictable environment in which to market the products and services of our various businesses across our different geographies and industries.
A negative economic climate could create financial pressures that impact the ability or willingness of our customers to make capital expenditures, thereby affecting their decision to purchase or roll out our products or services or, especially with respect to smaller customers, to pay accounts receivable owed to NCR. Additionally, if customers respond to a negative economic climate by consolidation, such as has occurred in the financial services sector in the past and, more recently, in the retail sector, it could reduce our base of potential customers. Negative global economic conditions also may have a material effect on our customers’ ability to obtain financing for the purchase of our products and services from third party financing companies, which could adversely affect our operating results.
|
•
|
require us to dedicate a substantial portion of our cash flow to the payment of principal and interest, thereby reducing the funds available for operations and future business opportunities;
|
|
•
|
make it more difficult for us to satisfy our obligations with respect to our outstanding senior unsecured notes, including our change in control repurchase obligations;
|
|
•
|
limit our ability to borrow additional money if needed for other purposes, including working capital, capital expenditures, debt service requirements, acquisitions and general corporate or other purposes, on satisfactory terms or at all;
|
|
•
|
limit our ability to adjust to changing economic, business and competitive conditions;
|
|
•
|
place us at a competitive disadvantage with competitors who may have less indebtedness or greater access to financing;
|
|
•
|
make us more vulnerable to an increase in interest rates, a downturn in our operating performance or a decline in general economic conditions; and
|
|
•
|
make us more susceptible to adverse changes in credit ratings, which could impact our ability to obtain financing in the future and increase the cost of such financing.
|
If compliance with our debt obligations materially limits our financial or operating activities, or hinders our ability to adapt to changing industry conditions, we may lose market share, our revenue may decline and our operating results may be negatively affected.
8
The terms of the documents governing our indebtedness include financial and other covenants that could restrict or limit our financial and business operations.
Our senior secured credit facility and the indentures for our senior unsecured notes include restrictive covenants that, subject to certain exceptions and qualifications, restrict or limit our ability and the ability of our subsidiaries to, among other things:
|
•
|
incur additional indebtedness;
|
|
•
|
create liens on, sell or otherwise dispose of, our assets;
|
|
•
|
engage in certain fundamental corporate changes or changes to our business activities;
|
|
•
|
make certain material acquisitions;
|
|
•
|
engage in sale-leaseback or hedging transactions;
|
|
•
|
repurchase our common stock, pay dividends or make similar distributions on our capital stock;
|
|
•
|
repay certain indebtedness;
|
|
•
|
engage in certain affiliate transactions; and
|
|
•
|
enter into agreements that restrict our ability to create liens, pay dividends or make loan repayments.
|
The senior secured credit facility and the indentures also contain certain affirmative covenants, and the senior secured credit facility requires us to comply with financial coverage ratios regarding both our interest expense and our debt relative to our Consolidated EBITDA (as defined in the senior secured credit facility).
These covenants and restrictions could affect our ability to operate our business, and may limit our ability to react to market conditions or take advantage of potential business opportunities as they arise. Additionally, our ability to comply with these covenants may be affected by events beyond our control, including general economic and credit conditions and industry downturns.
In addition, under our trade receivables securitization facility, we are required, among other things, to maintain certain financial tests relating to the three month rolling average ratio of defaults, delinquencies, dilution and days sales outstanding of the receivables pool (as such ratios and tests are described in the agreement governing our trade receivables securitization facility).
If we fail to comply with these covenants and are unable to obtain a waiver or amendment from the applicable lenders, an event of default would result under these agreements and under other agreements containing related cross-default provisions.
|
•
|
Upon an event of default under the senior secured credit facility, the lenders could, among other things, declare outstanding amounts due and payable, refuse to lend additional amounts to us, or require us to deposit cash collateral in respect of outstanding letters of credit. If we were unable to repay or pay the amounts due, the lenders could, among other things, proceed against the collateral granted to them to secure such indebtedness, which includes certain of our domestic assets and the equity interests of certain of our domestic and foreign subsidiaries.
|
|
•
|
Upon an event of default under the indentures, the trustee or holders of our senior unsecured notes could declare all outstanding amounts immediately due and payable.
|
|
•
|
Upon an event of default under our trade receivables securitization facility, the lenders could, among other things, terminate the facility, declare all capital and other obligations to be immediately due and payable, replace us as servicer, take over receivables lock-box accounts and redirect the collections of domestic accounts receivable from those accounts, and exercise available rights against the domestic accounts receivable pledged by NCR Receivables, LLC.
|
9
Our cash flows may not be sufficient to service our indebtedness, and if we are unable to satisfy our obligations under our indebtedness, we may be required to seek other financing alternatives, which may not be successful.
Our ability to make timely payments of principal and interest on our debt obligations depends on our ability to generate positive cash flows from operations, which is subject to general economic conditions, competitive pressures and certain financial, business and other factors beyond our control. If our cash flows and capital resources are insufficient to make these payments, we may be required to seek additional financing sources, reduce or delay capital expenditures, sell assets or operations or refinance our indebtedness. These actions could have a material adverse effect on our business, financial condition and results of operations. In addition, we may not be able to take any of these actions, and, even if successful, these actions may not permit us to meet our scheduled debt service obligations. Our ability to restructure or refinance our outstanding indebtedness will depend on, among other things, the condition of the capital markets and our financial condition at such time. There can be no assurance that we will be able to restructure or refinance any of our indebtedness on commercially reasonable terms or at all. If we cannot make scheduled payments on our debt, we will be in default and the outstanding principal and interest on our debt could be declared to be due and payable, in which case we could be forced into bankruptcy or liquidation or required to substantially restructure or alter our business operations or debt obligations.
Despite our current levels of debt, we may still incur substantially more debt, including secured debt, and similar liabilities, which would increase the risks described herein.
The agreements relating to our debt limit but do not prohibit our ability to incur additional debt, and the amount of debt that we could incur could be substantial. In addition, certain types of liabilities are not considered “Indebtedness” under our senior secured credit facility or the indentures governing our senior unsecured notes, and the senior secured credit facility and indentures do not impose any limitation on the amount of liabilities incurred by the subsidiaries, if any, that might be designated as “unrestricted subsidiaries” (as defined in the indentures). Accordingly, we could incur significant additional debt or similar liabilities in the future, including additional debt under our senior secured credit facility, some of which could constitute secured debt. In addition, if we form or acquire any subsidiaries in the future, those subsidiaries also could incur debt or similar liabilities. If new debt or similar liabilities are added to our current debt levels, the related risks that we now face could increase.
Borrowings under our senior secured credit facility and trade receivables securitization facility bear interest at a variable rate, which subjects us to interest rate risk, which could cause our debt service obligations to increase significantly.
All of our borrowings under our senior secured credit facility and trade receivables securitization facility are at variable rates of interest and expose us to interest rate risk. If interest rates increase, our debt service obligations on this variable rate indebtedness would increase even though the amount borrowed remained the same. We are party to an interest rate swap agreement that fixes the interest rate, based on LIBOR, on a portion of our LIBOR-indexed floating rate borrowings under our senior secured credit facility through August 22, 2016, with a notional amount of
$380 million
as of
December 31, 2015
that amortizes to
$341 million
over the term of the agreement. Although we may enter into additional interest rate swaps to reduce interest rate volatility, we cannot provide assurances that we will be able to do so or that such swaps will be effective.
We may also enter into interest rate swaps in the future in connection with other of our variable rate borrowings. This would expose us to interest rate risk, which could increase our debt service obligations.
W
e may not be able to raise the funds necessary to finance a required repurchase of our senior unsecured notes or our Series A Convertible Preferred Stock.
Upon the occurrence of a change in control under the applicable indenture governing the applicable senior unsecured notes, holders of those notes may require us to repurchase their notes. On any date during the three months commencing on and immediately following March 16, 2024 and the three months commencing on and immediately following every third anniversary of such date, holders of our Series A Convertible Preferred Stock will have the right to require us to repurchase any or all of our outstanding Series A Convertible Preferred Stock. In addition, upon certain change of control events involving the Company, holders of Series A Convertible Preferred Stock can require us, subject to certain exceptions, to repurchase any or all of their Series A Convertible Preferred Stock.
It is possible that we would not have sufficient funds at the time that we are required to make any such purchase of notes or Series A Convertible Preferred Stock (or both). We cannot assure the holders of the senior unsecured notes and Series A Convertible Preferred Stock that we will have sufficient financial resources, or will be able to arrange financing, to pay the repurchase price in cash with respect to any such notes or Series A Convertible Preferred Stock that holders have requested to be repurchased upon a change in control or scheduled redemption. Our failure to repurchase the senior unsecured notes of a series when required would result in an event of default with respect to such notes which could, in turn, constitute a default under the terms of our other indebtedness, if any. If we are unable to repurchase all shares of Series A Convertible Preferred Stock that holders have requested to be purchased, then we are required to pay dividends on the shares not repurchased at a rate equal to 8.0% per annum, accruing daily from such date until the full purchase price, plus all accrued dividends, are paid in full in respect of such shares of Series A Convertible Preferred Stock.
10
In addition, a change in control may constitute an event of default under our senior secured credit facility and our trade receivables securitization facility that would permit the lenders to accelerate the maturity of the borrowings thereunder and would require us to make a similar change in control offer to holders of our existing senior unsecured notes.
Certain important corporate events, such as leveraged recapitalizations that would increase the level of our indebtedness, may not constitute a change in control under the indentures governing our secured notes or the terms of our Series A Convertible Preferred Stock.
A lowering or withdrawal of the ratings assigned to our debt securities by rating agencies may increase our future borrowing costs and reduce our access to capital.
Any rating assigned to our debt could be lowered or withdrawn entirely by a rating agency if, in that rating agency’s judgment, future circumstances relating to the basis of the rating, such as adverse changes, so warrant. Any future lowering of our ratings likely would make it more difficult or more expensive for us to obtain additional debt financing.
Business Model.
If we are unsuccessful in transforming our business model, our operating results could be negatively impacted.
In recent years, we have shifted our business model to focus increasingly on sales of higher margin software and cloud solutions, and professional, managed and other services. Our ability to successfully grow our software and services businesses depends on a number of different factors including, among others, market acceptance of our software and cloud solutions; integrating, developing and supporting software gained through acquisitions; enabling our sales force to use a consultative selling model that better incorporates our comprehensive and new solutions; enhancing our services capabilities and coverage to align with and support our new solutions; and managing professional services and other costs associated with large solution roll-outs. In addition, development of these businesses may require increased capital and research and development expenses and resource allocation, and while we will seek to have the right level of investment and the right level of resources focused on these opportunities, these costs may reduce our gross margins and the return on these investments may be lower, or may develop more slowly, than we expect. In addition, we continue to pursue initiatives to expand our customer base by increasing our use of indirect sales channels, and by developing, marketing and selling solutions aimed at the small- to medium-business market. It is not yet certain whether these initiatives will yield the anticipated benefits, or whether our solutions will be compelling and attractive to small- and medium-sized businesses. If we are not successful in growing our software and services businesses and expanding our customer base at the rate that we anticipate, we may not meet our growth and gross margin projections or expectations, and operating results could be negatively impacted.
Series A Convertible Preferred Stock.
The issuance of shares of our Series A Convertible Preferred Stock to Blackstone and certain of its permitted transferees reduces the relative voting power of holders of our common stock, would dilute the ownership of such holders and may adversely affect the market price of our common stock.
On December 4, 2015, we completed the sale of
820,000
shares of our Series A Convertible Preferred Stock to Blackstone and certain of its permitted transferees (the Blackstone Purchasers) pursuant to an Investment Agreement, dated November 11, 2015, between us and Blackstone (the Investment Agreement). As of
December 31, 2015
, these shares represented approximately
17%
of our outstanding common stock, on an as-converted basis. Holders of Series A Convertible Preferred Stock are entitled to a cumulative dividend at the rate of
5.5%
per annum, payable quarterly in arrears. The dividends are to be paid in-kind, through the issuance of additional shares of Series A Convertible Preferred Stock, for the first sixteen dividend payment dates, and thereafter in cash or in-kind at our option. If we fail to timely declare and pay a dividend, the dividend rate will increase to 8.0% per annum until such time as all accrued but unpaid dividends have been paid in full.
As holders of our Series A Convertible Preferred Stock are entitled to vote, on an as-converted basis, together with holders of our common stock on all matters submitted to a vote of the holders of our common stock, the issuance of the Series A Convertible Preferred Stock to the Blackstone Purchasers, and the subsequent issuance of additional shares of Series A Convertible Preferred Stock through the payment of dividends, effectively reduces the relative voting power of the holders of our common stock.
In addition, the conversion of the Series A Convertible Preferred Stock to common stock would dilute the ownership interest of existing holders of our common stock, and any sales in the public market of the common stock issuable upon conversion of the Series A Convertible Preferred Stock could adversely affect prevailing market prices of our common stock. We granted the Blackstone Purchasers customary registration rights in respect of their shares of Series A Convertible Preferred Stock, and any shares of common stock issued upon conversion of the Series A Convertible Preferred Stock. These registration rights would facilitate the resale of such securities into the public market, and any such resale would increase the number of shares of our common stock available for public trading. Sales by the Blackstone Purchasers of a substantial number of shares of our common stock in the public market, or the perception that such sales might occur, could have a material adverse effect on the price of our common stock.
11
The Blackstone Purchasers may exercise significant influence over us, including through their ability to designate and the ability of the Series A Convertible Preferred Stock holders to elect up to two members of our Board of Directors.
As of
December 31, 2015
, the outstanding shares of our Series A Convertible Preferred Stock represented approximately
17%
of our outstanding common stock, on an as-converted basis. In addition, the terms of the Investment Agreement and of the Series A Convertible Preferred Stock grant the Blackstone Purchasers consent rights, directly or through their ownership of the Series A Convertible Preferred Stock, with respect to certain actions by us, including:
|
•
|
amending our organizational documents in a manner that would have an adverse effect on the Series A Convertible Preferred Stock;
|
|
•
|
issuing securities that are senior to, or equal in priority with, the Series A Convertible Preferred Stock;
|
|
•
|
entering into material transactions with related parties, or repurchasing or redeeming shares of common stock from related parties, subject to certain exceptions; and
|
|
•
|
increasing or decreasing the maximum number of directors on our Board to more than eleven persons or to such number as would require the resignation of one of the directors nominated by Blackstone.
|
The Investment Agreement also imposes a number of affirmative and negative covenants on us. As a result, the Blackstone Purchasers have the ability to significantly influence the outcome of any matter submitted for the vote of the holders of our common stock. Blackstone and its affiliates are in the business of making or advising on investments in companies, including businesses that may directly or indirectly compete with certain portions of our business, and they may have interests that diverge from, or even conflict with, those of our other stockholders. They may also pursue acquisition opportunities that may be complementary to our business, and, as a result, those acquisition opportunities may not be available to us.
In addition, the terms of the Investment Agreement and of the Series A Convertible Preferred Stock grant the Blackstone Purchasers certain rights to designate directors to serve on our Board, which directors are elected by a separate class vote of the holders of the Series A Convertible Preferred Stock. For so long as the Blackstone Purchasers beneficially own shares of Series A Convertible Preferred Stock (and/or shares of common stock issued upon conversion of Series A Convertible Preferred Stock) that represent, on an as-converted basis, at least 50% of the Blackstone Purchasers' initial shares of Series A Convertible Preferred Stock on an as-converted basis, the Blackstone Purchasers have the right to designate two directors for election to our Board. For so long as the Blackstone Purchasers beneficially own shares of Series A Convertible Preferred Stock (and/or shares of common stock issued upon conversion of Series A Convertible Preferred Stock) that represent, on an as-converted basis, at least 25% but less than 50% of Blackstone’s initial shares of Series A Convertible Preferred Stock on an as-converted basis, the Blackstone Purchasers will have the right to designate one director for election to our Board.
The directors designated by the Blackstone Purchasers also are entitled to serve on committees of our Board, subject to applicable law and stock exchange rules. Notwithstanding the fact that all directors will be subject to fiduciary duties to us and to applicable law, the interests of the directors designated by the Blackstone Purchasers may differ from the interests of our security holders as a whole or of our other directors.
Our Series A Convertible Preferred Stock has rights, preferences and privileges that are not held by, and are preferential to, the rights of our common stockholders, which could adversely affect our liquidity and financial condition, and may result in the interests of the Blackstone Purchasers differing from those of our common stockholders.
As holders of Series A Convertible Preferred Stock, the Blackstone Purchasers have the right to receive a liquidation preference entitling them to be paid out of our assets available for distribution to stockholders before any payment may be made to holders of any other class or series of capital stock, an amount equal to the greater of (a) 100% of the liquidation preference thereof plus all accrued dividends or (b) the amount that such holder would have been entitled to receive upon our liquidation, dissolution and winding up if all outstanding shares of Series A Convertible Preferred Stock had been converted into common stock immediately prior to such liquidation, dissolution or winding up.
In addition, dividends on the Series A Convertible Preferred Stock accrue and are cumulative at the rate of
5.5%
per annum, payable quarterly in arrears. If we fail to timely declare and pay a dividend, the dividend rate will increase to
8.0%
per annum until such time as all accrued but unpaid dividends have been paid in full. The dividends are to be paid in‑kind, through the issuance of additional shares of Series A Convertible Preferred Stock, for the first sixteen dividend payment dates, and thereafter in cash or in-kind at our option.
12
The holders of our Series A Convertible Preferred Stock also have certain redemption rights or put rights, including the right to require us to repurchase all or any portion of the Series A Convertible Preferred Stock on any date during the three months commencing on and immediately following March 16, 2024 and the three months commencing on and immediately following every third anniversary of such date, at 100% of the liquidation preference thereof plus all accrued but unpaid dividends, and the right, subject to certain exceptions, to require us to repurchase all or any portion of the Series A Convertible Preferred Stock upon certain change of control events at the greater of (a) 100% of the liquidation preference thereof plus all accrued but unpaid dividends and (b) the consideration the holders would have received if they had converted their shares of Series A Convertible Preferred Stock into common stock immediately prior to the change of control event.
These dividend and share repurchase obligations could impact our liquidity and reduce the amount of cash flows available for working capital, capital expenditures, growth opportunities, acquisitions, and other general corporate purposes. Our obligations to the holders of Series A Convertible Preferred Stock could also limit our ability to obtain additional financing or increase our borrowing costs, which could have an adverse effect on our financial condition. The preferential rights could also result in divergent interests between the Blackstone Purchasers and holders of our common stock.
Operating Results Fluctuations.
Our revenue, operating results, and margins could fluctuate for a number of reasons, including those described below:
Foreign Currency.
Our revenue and operating income are subject to variability due to the effects of foreign currency fluctuations against the U.S. Dollar. Overall, we have exposure to approximately
50
functional currencies. We pay the majority of expenses attributable to our foreign operations in the functional currency of the country in which such operations are conducted, and in 2015 a significant portion of our revenue was generated in currencies other than the U.S. Dollar. As a result, significant currency fluctuations could adversely affect our results of operations, including sales and gross margins. For example, a decrease in the value of foreign currencies relative to the U.S. Dollar, such as occurred during 2015, could result in lower revenue and increased losses from currency exchange rates. We endeavor to mitigate the effects of currency fluctuations by our hedging strategy; however, the volatility of foreign currency exchange rates is dependent on many factors that cannot be forecasted with reliable accuracy and our forward contracts may not prove effective in reducing our exposures.
Manufacturing.
At
December 31, 2015
, we manufactured advanced ATMs in facilities located in Columbus, Georgia, USA; Manaus, Brazil; Budapest, Hungary; Beijing, China; Puducherry, India and Chengalpattu, India. Our self-checkout solutions are manufactured in facilities located in Columbus, Georgia, USA and Budapest, Hungary. Our financial kiosk solutions are manufactured in facilities located in Beijing, China; Budapest, Hungary; Manaus, Brazil; Puducherry, India and Chengalpattu, India. Our POS/Display terminals are manufactured in facilities located in Columbus, Georgia, USA; Beijing, China; Budapest, Hungary; Salzburg, Austria and Adelaide, Australia, and certain hand-held solutions are manufactured in Salzburg, Austria. If we develop or experience problems relating to product quality or on-time delivery to customers that we are unable to quickly manage and resolve, whether due to the geographical diversity of our manufacturing base or otherwise, we could experience business interruption that could negatively impact our business and operating results.
Seasonality.
Our sales are historically seasonal, with lower revenue in the first quarter and higher revenue in the fourth quarter of each year. Such seasonality also causes our working capital cash flow requirements to vary from quarter to quarter depending on the variability in the volume, timing and mix of product sales. In addition, revenue in the third month of each quarter is typically higher than in the first and second months, particularly as our business model shifts to include more software and cloud solutions. These factors, among other things, may adversely affect our ability to manage working capital, make our forecasting process more difficult and impact our ability to predict financial results accurately.
Cost/Expense Reductions.
Our success in achieving targeted cost and expense reductions through our continuous improvement and other similar programs depends on a number of factors, including our ability to achieve infrastructure rationalizations, drive lower component and product development costs, improve supply chain efficiencies and optimize the efficiency of our customer services and professional services consulting resources. If we do not successfully execute on our cost and expense reduction initiatives or if we experience delays in completing the implementation of these initiatives, our results of operations or financial condition could be adversely affected.
Contractual Obligations for Professional Services.
Our contracts for professional services consulting work may contemplate that services will be performed over multiple periods, especially in connection with large solution roll-outs. Our profitability under those contracts is largely a function of performing our contractual obligations within the estimated costs and time periods specified. If we exceed these estimated costs or cannot otherwise complete the contracted services within the specified periods, our profitability related to these contracts could be negatively impacted. In addition, if we are unable to maintain appropriate utilization rates for our consultants, we may not be able to sustain profitability on these contracts.
13
Acquisitions, Divestitures and Alliances.
As we selectively acquire and divest technologies, products and businesses and we begin to include or exclude, as the case may be, the financial results related to these transactions, our operating results could fluctuate materially, depending on the size, nature, structure and timing of the transactions.
Underfunded Pension Obligation.
At
December 31, 2015
, our obligation for benefits under our pension plans was
$3,314 million
and our pension plan assets totaled
$2,735 million
, which resulted in an underfunded pension obligation of
$579 million
. While we recently rebalanced our U.S. and international plan assets in order to reduce volatility and made several discretionary contributions to our pension plans, our remaining underfunded pension obligation continues to require ongoing cash contributions. Our underfunded pension obligation also may be affected by future transfers and settlements relating to our international pension plans. For example, in 2015 we completed the transfer of our U.K. London pension plan to an insurer. The pension plan was overfunded, and the transfer resulted in a settlement loss of $427 million in the second quarter of 2015, and an offsetting decrease to prepaid pension costs in our consolidated balance sheet.
In addition, certain of the plan assets remain subject to financial market risk, and our actuarial and other assumptions underlying our expected future benefit payments, long-term expected rate of return and future funding expectations for our plans depend on, among other things, interest rate levels and trends and capital market expectations. Further volatility in the performance of financial markets, changes in any of these actuarial assumptions (including those described in our “Critical Accounting Policies and Estimates” section of the “Management's Discussion and Analysis of Financial Condition and Results of Operations” included in Item 7 of Part II of this Report) or changes in regulations regarding funding requirements could require material increases to our expected cash contributions to our pension plans in future years.
See the “Effects of Pension, Postemployment and Postretirement Benefit Plans” and “Financial Condition, Liquidity And Capital Resources” sections of the “Management's Discussion and Analysis of Financial Condition and Results of Operations” included in Item 7 of Part II of this Report and
Note 10, “Employee Benefit Plans”
in the Notes to the Consolidated Financial Statements included in Item 8 of Part II of this Report for further information regarding the funded status of our pension plans and potential future cash contributions.
Stock-based Compensation.
Similar to other companies, we use stock awards as a form of compensation for certain employees and non-employee directors. All stock-based awards are required to be recognized in our financial statements based on their fair values. The amount recognized for stock compensation expense could vary depending on a number of assumptions or changes that may occur. For example, assumptions such as the risk-free rate, expected holding period and expected volatility that drive our valuation model could change. Other examples that could have an impact include changes in the mix and type of awards, changes in our compensation plans or tax rate, changes in our forfeiture rate, differences in actual results compared to management’s estimates for performance-based awards or an unusually high amount of expirations of stock awards.
Income Taxes.
We are subject to income taxes in the United States and a number of foreign jurisdictions. We recognize deferred tax assets and liabilities based on the differences between the financial statement carrying amounts and the tax basis of assets and liabilities. Our deferred tax assets, net of valuation allowances, totaled approximately
$868 million
and
$969 million
at
December 31, 2015
and
2014
, respectively. Significant judgment is required in determining our provision for income taxes. We regularly review our deferred tax assets for recoverability and establish a valuation allowance if it is more likely than not that some portion or all of a deferred tax asset will not be realized. If we are unable to generate sufficient future taxable income, if there is a material change in the actual effective tax rates or if there is a change to the time period within which the underlying temporary differences become taxable or deductible, then we could be required to increase our valuation allowance against our deferred tax assets, which could result in a material increase in our effective tax rate.
In addition, changes in tax laws or tax rulings could materially affect our financial position and results of operations. Certain changes to U.S. tax laws, including limitations on the ability to defer U.S. taxation on earnings outside of the United States until those earnings are repatriated to the United States, could affect the tax treatment of our foreign earnings. Additionally, in light of continuing global fiscal challenges, various levels of government and international organizations such as the Organization for Economic Co-operation and Development (OECD) and European Union (EU) are increasingly focused on tax reform and other legislative or regulatory action to increase tax revenue. These tax reform efforts are designed to ensure that corporate entities are taxed on a larger percentage of their earnings. Any such tax reform or other legislative or regulatory actions to increase tax revenue could increase our effective tax rate.
14
We are also subject to ongoing tax audits in various jurisdictions both in the U.S. and internationally, the outcomes of which could result in the assessment of additional taxes. Our effective tax rate in the future could be adversely affected by changes in the mix of earnings in countries with differing statutory tax rates, the changes in the valuation of deferred tax assets and liabilities, changes in tax laws and regulations, and management’s assessment in regards to repatriation of earnings.
Competition.
If we do not compete effectively within the technology industry, we will not be successful.
We operate in the intensely competitive information technology industry. This industry is characterized by rapidly changing technology, evolving industry standards, frequent new product introductions, price and cost reductions, and increasingly greater commoditization of products, making differentiation difficult. Our competitors include other large companies in the information technology industry, such as: IBM, Hewlett-Packard, Diebold, Wincor, Hyosung, ToshibaTec, Micros, Fujitsu and Unisys, some of which have more financial and technical resources, or more widespread distribution and market penetration for their platforms and service offerings, than we do. In addition, we compete with companies in specific industry segments, such as entry-level ATMs, point-of-sale devices and imaging solutions. Our future competitive performance and market position depend on a number of factors, including our ability to:
|
•
|
react to competitive product and pricing pressures;
|
|
•
|
penetrate and meet the changing competitive requirements and deliverables in developing and emerging markets, such as India, China, Brazil and Russia;
|
|
•
|
exploit opportunities in emerging vertical markets, such as travel and telecommunications and technology;
|
|
•
|
cross-sell additional products and services to our existing customer base;
|
|
•
|
rapidly and continually design, develop and market, or otherwise maintain and introduce innovative solutions and related products and services for our customers that are competitive in the marketplace;
|
|
•
|
react on a timely basis to shifts in market demands, including shifts toward the desire of banks and retailers to provide an omni-channel experience to their customers and the use of mobile devices in transactions and payments;
|
|
•
|
compete in reverse auctions for new and continuing business;
|
|
•
|
reduce costs without creating operating inefficiencies or impairing product or service quality;
|
|
•
|
maintain competitive operating margins;
|
|
•
|
improve product and service delivery quality; and
|
|
•
|
effectively market and sell all of our diverse solutions.
|
Our business and operating performance also could be impacted by external competitive pressures, such as consolidation, increasing price erosion and the entry of new competitors into our existing product and geographic markets. In addition, our customers sometimes finance our product sales through third party financing companies, and in the case of customer default, these financing companies may be forced to resell this equipment at discounted prices, competing with us and impacting our ability to sell incremental units. The impact of these product and pricing pressures could include lower customer satisfaction, decreased demand for our solutions, loss of market share and reduction of operating profits.
Introduction of New Solutions.
If we do not swiftly and successfully develop and introduce new solutions in the competitive, rapidly changing environment in which we do business, our business results will be impacted.
The development process for our solutions requires high levels of innovation from our product development teams and suppliers of the components embedded or incorporated in our solutions. In addition, certain of our solutions, including our cloud solutions, may require us to build or expand, and maintain, infrastructure (such as hosting centers) to support them. The development process also can be lengthy and costly, and requires us to commit a significant amount of resources to bring our business solutions to market. We may not be able to anticipate our customers’ needs and technological and industry trends accurately, or to complete development of new solutions efficiently. In addition, contract terms, market conditions or customer preferences may affect our ability to limit, sunset or end-of-life our older products in a timely or cost-effective fashion. If any of these risks materialize, we may be unable to introduce new solutions into the market on a timely basis, if at all, and our business and operating results could be impacted. Likewise, we sometimes make assurances to customers regarding the operability and specifications of new technologies, and our results could be impacted if we are unable to deliver such technologies, or if such technologies do not perform as planned. Once we have developed new solutions, if we cannot successfully market and sell those solutions, our business and operating results could be impacted.
15
Product Defects and Errors.
Defects, errors, installation difficulties or development delays could expose us to potential liability, harm our reputation and negatively impact our business.
Many of our products are sophisticated and complex, and despite testing and quality control, we cannot be certain that defects or errors will not be found in current versions or new versions of our products. If our products contain undetected defects or errors, or otherwise fail to meet our customers’ expectations, we could face the loss of customers, liability exposure and additional development costs. If defects or errors delay product installation or make it more difficult, we could experience delays in customer acceptance, or if our products require significant amounts of customer support, it could result in incremental costs to us. In addition, our customers may license and deploy our software in both standard and non-standard configurations in different environments with different computer platforms, system management software and equipment and networking configurations, which may increase the likelihood of technical difficulties. Our products may be integrated with other components or software, and, in the event that there are defects or errors, it may be difficult to determine the origin of such defects or errors. Additionally, damage to, or failure or unavailability of, any significant aspect of our cloud hosting facilities could interrupt the availability of our cloud offerings, which could cause disruption for our customers, and, in turn, their customers, and expose us to liability. If any of these risks materialize, they could result in additional costs and expenses, exposure to liability claims, diversion of technical and other resources to engage in remediation efforts, loss of customers or negative publicity, each of which could impact our business and operating results.
Data Privacy and Security.
Cybersecurity and data privacy issues could negatively impact our business.
We collect, use and store personal information of, or that is held by, our customers in connection with certain of our service offerings, including our various cloud and other hosted solutions. We also may have access to personal information of our customers’ customers in the course of servicing our products or third party products. Additionally, we collect, use and store personal information of our employees and the personnel of our business partners, such as resellers, suppliers and contractors, in the ordinary course of business. While we use commercially available security technologies to safeguard this personal data and implement access controls to limit the risk of unauthorized use or disclosure by employees and contractors, a breach of these security measures could result in unauthorized access to, or disclosure of, personal data, resulting in claims, costs and reputational harm that could materially and adversely affect our operating results. Further, a security breach could also affect the availability of certain of our hosted solutions, negatively impacting our customers and their customers, which could result in financial penalties and reputational harm that could materially and adversely affect our business. We may also detect, or may receive notice from third parties (including governmental agencies) regarding potential vulnerabilities in our information technology systems, our products, or third party products used in conjunction with our products. Even if these potential vulnerabilities do not result in a data breach, their existence can adversely affect customer confidence and our reputation in the marketplace. To the extent such vulnerabilities require remediation, such remedial measures could require significant resources and may not be implemented before such vulnerabilities are exploited. Additionally, we may be subject to the data security and data privacy laws of many jurisdictions, some of which may conflict with one another, and many of which are subject to frequent modification.
Multinational Operations.
Our multinational operations, including our expansion into new and emerging markets, expose us to business and legal risks.
For the years ended
December 31, 2015
and
2014
, the percentage of our revenue from outside of the United States was
54%
and
59%
, respectively, and we expect our percentage of revenue generated outside the United States to continue to be significant. In addition, we continue to seek to further penetrate existing international markets, and to identify opportunities to enter into or expand our presence in developing and emerging markets, including Brazil, Russia, China, India, Africa, and the Middle East, among others. While we believe that our geographic diversity may help to mitigate some risks associated with geographic concentrations of operations , our ability to manufacture and sell our solutions internationally, including in new and emerging markets, is subject to risks, which include, among others:
|
•
|
the impact of ongoing and future economic, credit and sovereign debt conditions on the stability of national and regional economies and industries within those economies;
|
|
•
|
political conditions and local regulations that could adversely affect demand for our solutions, our ability to access funds and resources, or our ability to sell products in these markets;
|
|
•
|
the impact of a downturn in the global economy, or in regional economies, on demand for our products;
|
|
•
|
currency exchange rate fluctuations that could result in lower demand for our products as well as generate currency translation losses;
|
|
•
|
changes to and compliance with a variety of laws and regulations that may increase our cost of doing business or otherwise prevent us from effectively competing internationally;
|
|
•
|
government uncertainty, including as a result of new, or changes to, laws and regulations;
|
|
•
|
the institution of, or changes to, trade protection measures, currency restrictions, or import or export licensing requirements;
|
|
•
|
the successful implementation and use of systems, procedures and controls to monitor our operations in foreign markets;
|
16
|
•
|
changing competitive requirements and deliverables in developing and emerging markets;
|
|
•
|
the financial viability and reliability of contracting partners and customers;
|
|
•
|
work stoppages and other labor conditions or issues;
|
|
•
|
disruptions in transportation and shipping infrastructure; and
|
|
•
|
the impact of civil unrest relating to war and terrorist activity on the economy or markets in general, or on our ability, or that of our suppliers, to meet commitments.
|
In addition, as a result of our revenue generated outside of the United States, the amount of cash and cash equivalents that is held by our foreign subsidiaries continues to be significant. If these cash and cash equivalents are distributed to the United States, whether in the form of dividends or otherwise, we may be subject to additional U.S. income taxes and foreign withholding taxes. Any such taxes would reduce the amount of such cash and cash equivalents that are available for our use.
Environmental.
Our historical and ongoing manufacturing activities subject us to environmental exposures.
Our facilities and operations are subject to a wide range of environmental protection laws, and we have investigatory and remedial activities underway at a number of facilities that we currently own or operate, or formerly owned or operated, to comply, or to determine compliance, with such laws. In addition, our products are subject to environmental laws in a number of jurisdictions. Given the uncertainties inherent in such activities, there can be no assurances that the costs required to comply with applicable environmental laws will not impact future operating results. We have also been identified as a potentially responsible party in connection with certain environmental matters, including the Fox River and Kalamazoo River matters, as further described in
Note 11, "Commitments and Contingencies"
of the Notes to Consolidated Financial Statements included in Item 8 of Part II of this Report; in “Environmental Matters” within Item 1 of Part I of this Report; and in “Environmental and Legal Contingencies” within the “Critical Accounting Policies and Estimates” section of the “Management’s Discussion and Analysis of Financial Condition and Results of Operations” included in Item 7 of Part II of this Report, and we incorporate such disclosures by reference and make them a part of this discussion of risk factors.
Acquisitions, Divestitures and Alliances.
If we do not successfully integrate acquisitions or effectively manage alliance activities, we may not drive future growth.
As part of our overall solutions strategy, we have made, and intend to continue to make, investments in companies, products, services and technologies, either through acquisitions, investments, joint ventures or strategic alliances. Acquisitions and alliance activities inherently involve risks. The risks we may encounter include those associated with:
|
•
|
assimilating and integrating different business operations, corporate cultures, personnel, infrastructures (such as data centers) and technologies or products acquired or licensed;
|
|
•
|
the potential for unknown liabilities within the acquired or combined business; and
|
|
•
|
the possibility of conflict with joint venture or alliance partners regarding strategic direction, prioritization of objectives and goals, governance matters or operations.
|
Further, we may make acquisitions and investments in order to acquire or obtain access to new technology or products that expand our offerings. There is risk that the new technology or products may not perform as anticipated and may not meet estimated growth projections or expectations, or investment recipients may not successfully execute their business plans. There is also risk that key employees of an acquired business may not remain with the acquired business as long as expected. In the event that these risks materialize, we may not be able to fully realize the benefit of our investments, and our operating results could be adversely affected. An acquisition or alliance, and the integration of an acquired business, may also disrupt our ongoing business or we may not be able to successfully incorporate acquired products, services or technologies into our solutions and maintain quality. Further, we may not achieve the projected synergies once we have integrated the business into our operations, which may lead to additional costs not anticipated at the time of acquisition.
17
Circumstances associated with divestitures could adversely affect our results of operations and financial condition.
On January 6, 2016, we entered into an agreement with affiliates of Atlas Holdings LLC to sell the assets of our Interactive Printer Solutions (IPS) business, and in June 2012 we completed the divestiture of our entertainment business to Redbox Automated Retail, LLC. We continue to evaluate the strategic fit of our other businesses and products and may decide to sell a business or product based on such an evaluation. Despite a decision to divest a business or product, we may encounter difficulty in finding buyers or executing alternative exit strategies at acceptable prices and terms and in a timely manner. In addition, prospective buyers may have difficulty obtaining financing. Divestitures, including the divestiture of the IPS business, could involve additional risks, including:
|
•
|
difficulties in the separation of operations, services, products and personnel;
|
|
•
|
the need to provide significant ongoing post-closing transition support to a buyer;
|
|
•
|
the diversion of management’s attention from other business concerns;
|
|
•
|
the retention of certain current or future liabilities in order to induce a buyer to complete a divestiture;
|
|
•
|
the obligation to indemnify or reimburse a buyer for certain past liabilities of a divested business;
|
|
•
|
the disruption of our business; and
|
|
•
|
the potential loss of key employees.
|
We may not be successful in managing these or any other significant risks that we may encounter in divesting a business or product, which could have a material adverse effect on our business.
Intellectual Property.
Our continuing ability to be a leading technology and services solutions provider could be negatively affected if we do not protect intellectual property that drives innovation.
It is critical to our continued development of leading technologies that we are able to protect and enhance our proprietary rights in our intellectual property through patent, copyright, trademark and trade secret laws. These efforts include protection of the products and the application, diagnostic and other software we develop. To the extent we are not successful in protecting our proprietary rights, our business could be adversely impacted. Also, many of our offerings rely on technologies developed by others, and if we are unable to continue to obtain licenses for such technologies, our business could be adversely impacted. From time to time, we receive notices from third parties regarding patent and other intellectual property claims. Whether such claims have merit, they may require significant resources to defend. If an infringement claim is successful and we are required to pay damages, or we are unable to license the infringed technology or to substitute similar non-infringing technology, our business could be adversely affected.
Work Environment.
Our restructuring plan and our continuous improvement, customer experience and cost reduction initiatives could negatively impact productivity and business results.
In July 2014 we commenced a multi-year restructuring plan, and, in addition, as part of our ongoing efforts to optimize our cost structure, from time to time, we shift and realign our internal organizational structure and resources. These activities could temporarily result in reduced productivity levels. If we are not able to timely execute on these initiatives, or if the costs to complete these initiatives is higher than anticipated, our results of operations or financial condition could be adversely affected. In addition to these initiatives, we have initiatives to grow revenue, drive innovation and improve the experience of our customers. We typically have many such initiatives underway. If we are not successful in implementing and managing these various initiatives and minimizing any resulting loss in productivity, we may not be able to achieve targeted cost savings or productivity gains, and our business and operating results could be negatively impacted.
In addition, we recently announced a plan to build a new world headquarters, and from time to time we may undertake similar projects with respect to our office, manufacturing or other facilities. Implementation of relocation plans such as these could result in business disruption due to a lack of business continuity, which, among other things, could have a negative impact on our productivity and business and operating results.
If we do not attract and retain quality employees, we may not be able to meet our business objectives.
Our employees are vital to our success, including the successful reinvention of the Company into a software and solutions driven business. Our ability to attract and retain highly skilled technical, sales, consulting and other key personnel, including key personnel of acquired businesses, is critical, as these key employees are difficult to replace. If we are unable to attract or retain highly qualified employees by offering competitive compensation, secure work environments and leadership opportunities now and in the future, our business and operating results could be negatively impacted.
18
Our ability to effectively manage our business could be negatively impacted if we do not invest in and maintain reliable technology infrastructure and information systems.
It is periodically necessary to add to, replace, upgrade or modify our technology infrastructure and internal information systems. If we are unable to expand, replace, upgrade or modify such systems in a timely and cost-effective manner, especially in light of demands on our information technology resources, our ability to capture and process financial transactions and therefore, our financial condition, results of operations, or ability to comply with legal and regulatory reporting obligations, may be impacted.
Reliance on Third Parties.
If third party suppliers upon which we rely are not able to fulfill our needs, our ability to bring our products to market in a timely fashion could be affected.
In most cases, there are a number of vendors providing the services and producing the parts and components that we utilize in or in connection with our products. However, there are some services and components that are licensed or purchased from single sources due to price, quality, technology, functionality or other reasons. For example, we depend on transaction processing services from Accenture, computer chips and microprocessors from Intel and operating systems from Microsoft. Certain parts and components used in the manufacturing of our ATMs and the delivery of many of our retail solutions are also supplied by single sources. In addition, there are a number of key suppliers for our businesses that provide us with critical products for our solutions. If we were unable to secure the necessary services, including contract manufacturing, parts, software, components or products from a particular vendor, and we had to find an alternative supplier, our new and existing product shipments and solution deliveries, or the provision of contracted services, could be delayed, impacting our business and operating results.
We have, from time to time, formed alliances with third parties that have complementary products, software, services and skills. These alliances represent many different types of relationships, such as outsourcing arrangements to manufacture hardware and subcontract agreements with third parties to perform services and provide products and software to our customers in connection with our solutions. For example, we rely on third parties for cash replenishment services for our ATM products. These alliances introduce risks that we cannot control, such as nonperformance by third parties and difficulties with or delays in integrating elements provided by third parties into our solutions. Lack of information technology infrastructure, shortages in business capitalization, and manual processes and data integrity issues of smaller suppliers can also create product time delays, inventory and invoicing problems, staging delays, as well as other operating issues. The failure of third parties to provide high-quality products or services that conform to required specifications or contractual arrangements could impair the delivery of our solutions on a timely basis, create exposure for non-compliance with our contractual commitments to our customers and impact our business and operating results. Also, some of these third parties have access to confidential NCR and customer data, the integrity and security of which are of significant importance to the Company.
Internal Controls.
If we do not maintain effective internal controls, accounting policies, practices, and information systems necessary to ensure reliable reporting of our results, our ability to comply with our legal obligations could be negatively affected.
Our internal controls, accounting policies and practices, and internal information systems enable us to capture and process transactions in a timely and accurate manner in compliance with applicable accounting standards, laws and regulations, taxation requirements and federal securities laws and regulations. Our internal controls and policies are being closely monitored by management as we continue to implement a worldwide Enterprise Resource Planning (ERP) system. While we believe these controls, policies, practices and systems are adequate to ensure data integrity, unanticipated and unauthorized actions of employees or contractors (both domestic and international), temporary lapses in internal controls due to shortfalls in transition planning and oversight, or resource constraints, could lead to improprieties and undetected errors that could impact our financial condition, results of operations, or compliance with legal obligations. Moreover, while management has concluded that the Company’s internal control over financial reporting was effective as of
December 31, 2015
(as set forth in “Management’s Report on Internal Control over Financial Reporting” included in Item 9A of Part II of this Report), due to their inherent limitations, such controls may not prevent or detect misstatements in our reported financial statements. Such limitations include, among other things, the potential for human error or circumvention of controls. Further, the Company’s internal control over financial reporting is subject to the risk that controls may become inadequate because of a failure to remediate control deficiencies, changes in conditions or a deterioration of the degree of compliance with established policies and procedures.
19
Contingencies.
We face uncertainties with regard to regulations, lawsuits and other related matters.
In the normal course of business, we are subject to proceedings, lawsuits, claims and other matters, including, for example, those that relate to the environment, health and safety, labor and employment, employee benefits, import/export compliance, intellectual property, data privacy and security, product liability, commercial disputes and regulatory compliance, among others. Because such matters are subject to many uncertainties, their outcomes are not predictable and we must make certain estimates and assumptions in our financial statements. While we believe that amounts provided in our Consolidated Financial Statements with respect to such matters are currently adequate in light of the probable and estimable liabilities, there can be no assurances that the amounts required to satisfy alleged liabilities from such matters will not impact future operating results. Additionally, we are subject to diverse and complex laws and regulations, including those relating to corporate governance, public disclosure and reporting, environmental safety and the discharge of materials into the environment, product safety, import and export compliance, data privacy and security, antitrust and competition, government contracting, anti-corruption, and labor and human resources, which are rapidly changing and subject to many possible changes in the future. Compliance with these laws and regulations, including changes in accounting standards, taxation requirements, and federal securities laws among others, may create a substantial burden on us, and substantially increase costs to our organization or could have an impact on our future operating results.
Additionally, doing business on a worldwide basis requires us and our subsidiaries to comply with the laws and regulations of the U.S. government and various international jurisdictions. For example, our international operations are subject to U.S. and foreign anti-corruption laws and regulations, such as the Foreign Corrupt Practices Act (FCPA), which generally prohibits U.S. companies or agents acting on behalf of such companies from making improper payments to foreign officials for the purpose of obtaining or keeping business. Our international operations are also subject to economic sanction programs administered by the U.S. Treasury Department’s Office of Foreign Assets Control (OFAC). If we are not in compliance with such laws and regulations, we may be subject to criminal and civil penalties, which may cause harm to our reputation and to our brand and could have an adverse effect on our business, financial condition and results of operations. See
Note 11, "Commitments and Contingencies"
of the Notes to Consolidated Financial Statements included in Item 8 of Part II of this Report for information regarding our FCPA and OFAC investigations, which disclosures are incorporated by reference and made a part of this discussion of risk factors.
None.
As of
December 31, 2015
, NCR operated
258
facilities consisting of approximately
6.5 million
square feet in
61
countries throughout the world. On a square footage basis,
23%
of these facilities are owned and
77%
are leased. Within the total facility portfolio, NCR operates
27
research and development and manufacturing facilities totaling
1.9 million
square feet,
58%
of which is leased. The remaining
4.6 million
square feet of space includes office, repair, and warehousing space and other miscellaneous sites, and is
85%
leased. NCR also owns
7
land parcels totaling
3.8 million
square feet in
2
countries.
NCR is headquartered in Duluth, Georgia, USA. Our address at our corporate headquarters is 3097 Satellite Boulevard, Duluth, Georgia, 30096, USA.
Information regarding legal proceedings is included in Item 8 of Part II of this Report as part of
Note 11, "Commitments and Contingencies,"
of the Notes to Consolidated Financial Statements and is incorporated herein by reference.
Not applicable.
20
|
Item 5.
|
MARKET FOR THE REGISTRANT'S COMMON EQUITY, RELATED STOCKHOLDER MATTERS AND ISSUER PURCHASES OF EQUITY SECURITIES
|
Market Information
NCR common stock is listed on the New York Stock Exchange (NYSE) and trades under the symbol “NCR”. There were approximately 99,070 holders of NCR common stock as of
February 17, 2016
. The following table presents the high and low per share prices for NCR common stock for each quarter of
2015
and
2014
as reported on the NYSE.
|
2015
|
2014
|
|||||||||||||||||
|
High
|
Low
|
High
|
Low
|
|||||||||||||||
|
1st quarter
|
$
|
30.86
|
|
$
|
24.83
|
|
1st quarter
|
$
|
37.73
|
|
$
|
31.71
|
|
|||||
|
2nd quarter
|
$
|
36.50
|
|
$
|
27.27
|
|
2nd quarter
|
$
|
37.18
|
|
$
|
28.64
|
|
|||||
|
3rd quarter
|
$
|
32.09
|
|
$
|
21.79
|
|
3rd quarter
|
$
|
35.76
|
|
$
|
30.14
|
|
|||||
|
4th quarter
|
$
|
27.80
|
|
$
|
22.52
|
|
4th quarter
|
$
|
33.80
|
|
$
|
22.83
|
|
|||||
Dividends
Historically NCR has not paid cash dividends and does not anticipate the payment of cash dividends on NCR common stock in the immediate future. The declaration of dividends is restricted under our senior secured credit facility and the terms of the indentures for our senior unsecured notes, and would be further subject to the discretion of NCR’s Board of Directors.
Stock Performance Graph
The following graph compares the relative investment performance of NCR stock, the Standard & Poor’s MidCap 400 Stock Index, Standard & Poor’s 500 Information Technology Sector and the Standard & Poor’s 500 Stock Index. This graph covers the five-year period from December 31, 2010 through
December 31, 2015
.
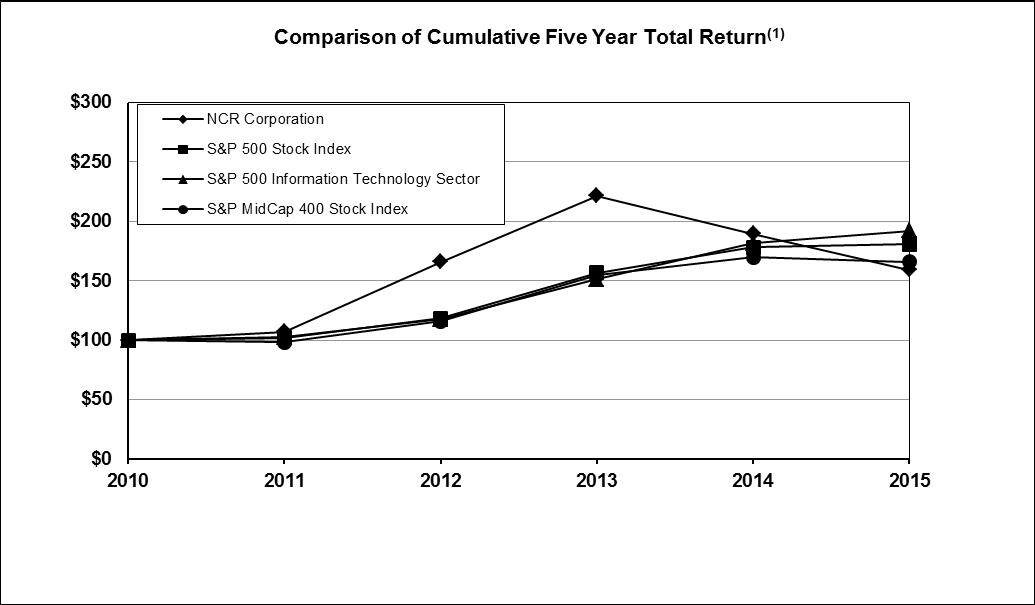
21
|
Company / Index
|
2011
|
2012
|
2013
|
2014
|
2015
|
|||||||||||||||
|
NCR Corporation
|
$
|
107
|
|
$
|
166
|
|
$
|
222
|
|
$
|
190
|
|
$
|
159
|
|
|||||
|
S&P 500 Stock Index
|
$
|
102
|
|
$
|
118
|
|
$
|
157
|
|
$
|
178
|
|
$
|
181
|
|
|||||
|
S&P 500 Information Technology Sector
|
$
|
102
|
|
$
|
118
|
|
$
|
151
|
|
$
|
181
|
|
$
|
192
|
|
|||||
|
S&P MidCap 400 Stock Index
|
$
|
98
|
|
$
|
116
|
|
$
|
155
|
|
$
|
170
|
|
$
|
166
|
|
|||||
|
(1)
|
In each case, assumes a $100 investment on December 31, 2010, and reinvestment of all dividends, if any.
|
Purchase of Company Common Stock
In April 1999, the Company’s Board of Directors authorized a share repurchase program that provided for the repurchase of up to
$250 million
of its common stock, with no expiration from the date of authorization. In October 2007 and July 2010, the Board authorized the repurchase of an additional
$250 million
and
$210 million
, respectively, under this share repurchase program. In November 2000, the Board approved a systematic share repurchase program, with no expiration from the date of authorization, to be funded by the proceeds from the purchase of shares under the Company’s Employee Stock Purchase Plan and the exercise of stock options, for the purpose of offsetting the dilutive effects of the employee stock purchase plan and outstanding options. As of
December 31, 2015
, approximately
$179 million
and
$147 million
remained available for further repurchases of the Company’s common stock under the 1999 and 2000 Board of Directors share repurchase programs, respectively.
In November 2015, the Company's Board of Directors authorized the repurchase of $1 billion of our common stock pursuant to a modified "Dutch auction" tender offer. In December 2015, we repurchased 37.4 million shares of our common stock pursuant to the tender offer for a total cash investment of $1 billion ($26.75 price per share).
The following table provides information relating to the Company’s repurchase of common stock for the three months ended
December 31, 2015
, as defined in Rule 10b-18(a)(3) under the Exchange Act:
|
Time Period
|
Total Number of
Shares Purchased
|
Average Price Paid
Per Share
|
Total Number of
Shares Purchased as
Part of Current
Programs
(1)
|
Maximum Dollar
Value of
Shares that May
Yet be Purchased
Under Programs
(1)
|
||||||||||
|
October 1 through October 31, 2015
|
—
|
|
—
|
|
—
|
|
$
|
323,546,020
|
|
|||||
|
November 1 through November 30, 2015
|
—
|
|
—
|
|
—
|
|
$
|
324,721,794
|
|
|||||
|
December 1 through December 31, 2015
|
37,383,126
|
|
$
|
26.75
|
|
37,383,126
|
|
$
|
325,816,903
|
|
||||
|
Fourth quarter total
|
37,383,126
|
|
$
|
26.75
|
|
37,383,126
|
|
|
||||||
(1)
The Company occasionally purchases vested restricted stock shares at the current market price to cover withholding taxes. For
the three months ended
December 31, 2015
,
219,557
shares of vested restricted stock were purchased at an average price of
$26.15
per share.
The Company's ability to repurchase its common stock is restricted under the Company's senior secured credit facility and terms of the indentures for the Company's senior unsecured notes. These agreements include certain prohibitions on share repurchases, including during the occurrence of an event of default. These agreements also establish limits on the amount that the Company is permitted to allocate to share repurchases and other restricted payments. The limitations are calculated using formulas based generally on 50% of the Company’s consolidated net income for the period beginning in the third quarter of 2012 through the end of the most recently ended fiscal quarter, subject to certain other adjustments and deductions, with certain prescribed minimums. These formulas are described in greater detail in the Company’s senior secured credit facility and the indentures for the Company’s senior unsecured notes, each of which is filed with the SEC.
22
|
In millions, except per share and employee and contractor amounts
|
||||||||||||||||||||
|
For the years ended December 31
|
2015
|
2014
|
2013
|
2012
|
2011
|
|||||||||||||||
|
Continuing Operations
(a,c)
|
||||||||||||||||||||
|
Revenue
|
$
|
6,373
|
|
$
|
6,591
|
|
$
|
6,123
|
|
$
|
5,730
|
|
$
|
5,291
|
|
|||||
|
Income (loss) from operations
|
$
|
135
|
|
$
|
353
|
|
$
|
666
|
|
$
|
748
|
|
$
|
(148
|
)
|
|||||
|
Interest expense
|
$
|
(173
|
)
|
$
|
(181
|
)
|
$
|
(103
|
)
|
$
|
(42
|
)
|
$
|
(13
|
)
|
|||||
|
Income tax expense (benefit)
|
$
|
55
|
|
$
|
(48
|
)
|
$
|
98
|
|
$
|
223
|
|
$
|
(66
|
)
|
|||||
|
(Loss) income from continuing operations attributable to NCR common stockholders
|
$
|
(154
|
)
|
$
|
181
|
|
$
|
452
|
|
$
|
475
|
|
$
|
(97
|
)
|
|||||
|
(Loss) income from discontinued operations, net of tax
|
$
|
(24
|
)
|
$
|
10
|
|
$
|
(9
|
)
|
$
|
6
|
|
$
|
(93
|
)
|
|||||
|
Basic (loss) earnings per common share attributable to NCR common stockholders:
|
||||||||||||||||||||
|
From continuing operations
(a,c)
|
$
|
(0.94
|
)
|
$
|
1.08
|
|
$
|
2.73
|
|
$
|
2.98
|
|
$
|
(0.61
|
)
|
|||||
|
From discontinued operations
|
$
|
(0.15
|
)
|
$
|
0.06
|
|
$
|
(0.05
|
)
|
$
|
0.04
|
|
$
|
(0.59
|
)
|
|||||
|
Total basic (loss) earnings per common share
|
$
|
(1.09
|
)
|
$
|
1.14
|
|
$
|
2.68
|
|
$
|
3.02
|
|
$
|
(1.20
|
)
|
|||||
|
Diluted (loss) earnings per common share attributable to NCR common stockholders:
|
||||||||||||||||||||
|
From continuing operations
(a,c)
|
$
|
(0.94
|
)
|
$
|
1.06
|
|
$
|
2.67
|
|
$
|
2.90
|
|
$
|
(0.61
|
)
|
|||||
|
From discontinued operations
|
$
|
(0.15
|
)
|
$
|
0.06
|
|
$
|
(0.05
|
)
|
$
|
0.04
|
|
$
|
(0.59
|
)
|
|||||
|
Total diluted (loss) earnings per common share
|
$
|
(1.09
|
)
|
$
|
1.12
|
|
$
|
2.62
|
|
$
|
2.94
|
|
$
|
(1.20
|
)
|
|||||
|
Cash dividends per share
|
$
|
—
|
|
$
|
—
|
|
$
|
—
|
|
$
|
—
|
|
$
|
—
|
|
|||||
|
As of December 31
|
||||||||||||||||||||
|
Total assets
|
$
|
7,635
|
|
$
|
8,566
|
|
$
|
8,061
|
|
$
|
6,341
|
|
$
|
5,591
|
|
|||||
|
Total debt
(b)
|
$
|
3,252
|
|
$
|
3,618
|
|
$
|
3,307
|
|
$
|
1,935
|
|
$
|
840
|
|
|||||
|
Series A convertible preferred stock
|
$
|
798
|
|
$
|
—
|
|
$
|
—
|
|
$
|
—
|
|
$
|
—
|
|
|||||
|
Total NCR stockholders' equity
|
$
|
720
|
|
$
|
1,871
|
|
$
|
1,769
|
|
$
|
1,252
|
|
$
|
718
|
|
|||||
|
Number of employees and contractors
|
32,600
|
|
30,200
|
|
29,300
|
|
25,700
|
|
23,500
|
|
||||||||||
|
(a)
|
Continuing operations excludes the costs and insurance recoveries relating to certain environmental obligations associated with discontinued operations, including the Fox River, Japan and Kalamazoo River matters, the closure of NCR's EFT payment processing business in Canada, and the results from our disposed healthcare solutions and Entertainment businesses.
|
|
(b)
|
In 2015, we adopted ASU 2015-03,
Interest - Imputation of Interest: Simplifying the Presentation of Debt Issuance Costs,
which requires debt issuance costs previously reported as a deferred charge within other assets to be presented as a direct reduction from the carrying amount of debt, consistent with debt discounts, applied retrospectively for all periods presented. Assets and long-term debt as of December 31, 2014, 2013, 2012 and 2011 was adjusted by approximately
$41 million
, $47 million, $28 million and $13 million, respectively, as a result of the adoption of this ASU.
|
|
(c)
|
The following income (expense) amounts, net of tax are included in income from continuing operations attributable to NCR for the years ended December 31:
|
23
|
In millions
|
2015
|
2014
|
2013
|
2012
|
2011
|
|||||||||||||||
|
Pension (expense) benefit
|
$
|
(448
|
)
|
$
|
(66
|
)
|
$
|
58
|
|
$
|
117
|
|
$
|
(398
|
)
|
|||||
|
Restructuring plan
|
(50
|
)
|
(116
|
)
|
—
|
|
—
|
|
—
|
|
||||||||||
|
Acquisition related amortization of intangibles
|
(85
|
)
|
(80
|
)
|
(48
|
)
|
(25
|
)
|
(8
|
)
|
||||||||||
|
Acquisition related costs
|
(8
|
)
|
(20
|
)
|
(36
|
)
|
(16
|
)
|
(28
|
)
|
||||||||||
|
Loss on pending sale of IPS business
|
(29
|
)
|
—
|
|
—
|
|
—
|
|
—
|
|
||||||||||
|
Reserve related to subcontract in MEA
|
(13
|
)
|
—
|
|
—
|
|
—
|
|
—
|
|
||||||||||
|
OFAC and FCPA investigations
|
—
|
|
(2
|
)
|
(2
|
)
|
(2
|
)
|
—
|
|
||||||||||
|
Japan valuation reserve release
|
—
|
|
—
|
|
15
|
|
—
|
|
—
|
|
||||||||||
|
Impairment charges
|
—
|
|
—
|
|
—
|
|
(7
|
)
|
—
|
|
||||||||||
|
Legal settlements and charges
|
—
|
|
—
|
|
—
|
|
—
|
|
2
|
|
||||||||||
|
Total
|
$
|
(633
|
)
|
$
|
(284
|
)
|
$
|
(13
|
)
|
$
|
67
|
|
$
|
(432
|
)
|
|||||
24
Index to Management Discussion and Analysis of Financial Condition and Results of Operations (MD&A)
25
|
Item 7.
|
MANAGEMENT'S DISCUSSION AND ANALYSIS OF FINANCIAL CONDITION AND RESULTS OF OPERATIONS (MD&A)
|
BUSINESS OVERVIEW
NCR Corporation is a leading global technology company that provides innovative products and services that enable businesses to connect, interact and transact with their customers and enhance their customer relationships by addressing consumer demand for convenience, value and individual service. Our portfolio of self-service and assisted-service solutions serve a wide range of customers in the financial services, retail, hospitality, travel, and telecommunications and technology industries. Our offerings include software and hardware solutions for automated teller machines (ATMs) and bank branches, retail and hospitality point of sale applications and devices, and self-service kiosks and software applications that can be used by consumers to enable them to interact with businesses from their computer or mobile device. We also complement these product solutions by offering a complete portfolio of services that support both NCR and third party solutions. We also resell third-party networking products and provide related service offerings in the telecommunications and technology sectors.
We have four operating segments: Financial Services, Retail Solutions, Hospitality and Emerging Industries. Each of our operating segments derives its revenue by selling products and services in each of the sales theaters in which NCR operates. As of January 1, 2016, NCR began management of its business on a solution basis, changing from the previous model of management on a line of business basis. This change to our segment reporting for fiscal year 2016 and future periods is further described in
Note 1, “Description of Business and Significant Accounting Policies”
of the Notes to Consolidated Financial Statements in Item 8 of Part II of this Report.
Our solutions are based on a foundation of long-established industry knowledge and consulting expertise, value-added software, hardware technology, global customer support services, and a complete line of business consumables and specialty media products.
NCR’s reputation is founded upon over 131 years of providing quality products, services and solutions to our customers. At the heart of our customer and other business relationships is a commitment to acting responsibly, ethically and with the highest level of integrity. This commitment is reflected in NCR’s Code of Conduct, which is available on the Corporate Governance page of our website.
2015
OVERVIEW
As more fully discussed in later sections of this MD&A, the following were significant themes and events for
2015
:
|
•
|
Revenue decreased approximately
3%
from the prior year period, including unfavorable foreign currency impacts of approximately
6%
|
|
•
|
Software-related revenue, which we measure by combining software license and maintenance revenue, cloud revenue and professional services revenue associated with software delivery, was
$1,747 million
and
$1,748 million
in
2015
and
2014
, respectively, including year-over-year unfavorable foreign currency impacts of approximately
4%
in
2015
|
|
•
|
Strategic investment of $820 million in Series A Convertible Preferred Stock by entities affiliated with Blackstone Capital Partners VI L.P. and Blackstone Tactical Opportunities L.L.C. (collectively, Blackstone); $1 billion share repurchase completed
|
|
•
|
UK London pension transaction materially reduced pension liability, participants, and enterprise risk as part of our overall pension de-risking strategy
|
OVERVIEW OF STRATEGIC INITIATIVES AND TRENDS
The rise of digital commerce, mobile engagement and other forces of change have dramatically altered how businesses and consumers interact and transact. In response, our customers are increasingly focused on providing a rich, integrated and personalized experience to consumers across commerce channels, including in-store, online and mobile. NCR understands the importance of this shift to an omnichannel experience. Our long-term strategy is built on being a global technology solutions company that uses software and value-added endpoints, coupled with higher-margin services and a focus on cloud and mobile, to help our customers deliver on the promise of an omnichannel experience.
To deliver on our strategy, we are focused on evolving our software business model, sales enablement, services transformation, investing in innovation and cultivating our culture and team.
26
|
•
|
Evolving our Business Model
- Shifting our business model to focus on growth of higher margin software and services revenue to grow our recurring revenue streams, and strengthen our long-term foundation.
|
|
•
|
Sales Enablement
- Developing a sales force enabled with a consultative selling model, supported by service teams and focused on delivery and customer interactions to leverage the innovative solutions we are bringing to market and gain share.
|
|
•
|
Services Transformation
- Enhancing our global service capability by improving our service positioning, increasing customer service attach rates for our products, improving profitability in our services business and aligning our services capability to support our solutions.
|
|
•
|
Investing in Innovation
- Optimizing our investments in areas with the greatest potential for profitable growth, such as cloud solutions and professional, managed and other services.
|
|
•
|
Cultivating our Culture and Team
- Organizing and recruiting with an eye toward the future, and investing in, training and developing our employees to accelerate the delivery of our innovative solutions and to focus on the needs of our customers and changes in consumer behavior.
|
We plan, in pursuing our strategy, to continue to manage our costs effectively, including through our restructuring program, to selectively pursue strategic acquisitions that promote growth and improve gross margin, and to selectively penetrate market adjacencies in single and emerging growth industry segments.
Potentially significant risks to the execution of our initiatives include domestic and global economic and credit conditions including, in particular, market conditions and spending trends in the financial services industry, fluctuations in oil and commodity prices and their effects on local, regional and global market conditions, and economic and market conditions in Russia and China; continued strengthening of the U.S. Dollar resulting in unfavorable foreign currency impacts; collectability difficulties in subcontracting relationships in Emerging Industries; competition that can drive further price erosion and the potential loss of market share; difficulties associated with the introduction of products in new self-service markets; market adoption of our products by customers; and management and servicing of our existing indebtedness. For further information on potential risks and uncertainties see Item 1A "Risk Factors."
RESULTS FROM OPERATIONS
The following table shows our results for
the years ended
December 31
:
|
In millions
|
2015
|
2014
|
2013
|
|||
|
Revenue
|
$6,373
|
$6,591
|
$6,123
|
|||
|
Gross margin
|
1,469
|
1,732
|
1,740
|
|||
|
Gross margin as a percentage of revenue
|
23.1%
|
26.3%
|
28.4%
|
|||
|
Operating expenses
|
||||||
|
Selling, general and administrative expenses
|
$1,042
|
$1,012
|
$871
|
|||
|
Research and development expenses
|
230
|
263
|
203
|
|||
|
Restructuring-related charges
|
62
|
104
|
—
|
|||
|
Income from operations
|
$135
|
$353
|
$666
|
|||
The following table shows our revenue and gross margins from products and services, respectively, for
the years ended
December 31
:
|
In millions
|
2015
|
2014
|
2013
|
|||
|
Product revenue
|
$2,711
|
$2,892
|
$2,912
|
|||
|
Cost of products
|
2,072
|
2,153
|
2,152
|
|||
|
Product gross margin
|
$639
|
$739
|
$760
|
|||
|
Product gross margin as a percentage of revenue
|
23.6%
|
25.6%
|
26.1%
|
|||
|
Services revenue
|
$3,662
|
$3,699
|
$3,211
|
|||
|
Cost of services
|
2,832
|
2,706
|
2,231
|
|||
|
Services gross margin
|
$830
|
$993
|
$980
|
|||
|
Services gross margin as a percentage of revenue
|
22.7%
|
26.8%
|
30.5%
|
|||
27
The following tables show our revenue by geographic theater for
the years ended
December 31
:
|
In millions
|
2015
|
% of Total
|
2014
|
% of Total
|
% Increase (Decrease)
|
% Increase (Decrease) Constant Currency
(1)
|
||
|
Americas
|
$3,499
|
55%
|
$3,357
|
51%
|
4%
|
7%
|
||
|
Europe, Middle East Africa (EMEA)
|
1,964
|
31%
|
2,184
|
33%
|
(10)%
|
1%
|
||
|
Asia Pacific (APJ)
|
910
|
14%
|
1,050
|
16%
|
(13)%
|
(5)%
|
||
|
Consolidated revenue
|
$6,373
|
100%
|
$6,591
|
100%
|
(3)%
|
3%
|
||
|
In millions
|
2014
|
% of Total
|
2013
|
% of Total
|
% Increase (Decrease)
|
% Increase (Decrease) Constant Currency
(1)
|
||
|
Americas
|
$3,357
|
51%
|
$3,030
|
50%
|
11%
|
12%
|
||
|
Europe, Middle East Africa (EMEA)
|
2,184
|
33%
|
2,060
|
33%
|
6%
|
8%
|
||
|
Asia Pacific (APJ)
|
1,050
|
16%
|
1,033
|
17%
|
2%
|
7%
|
||
|
Consolidated revenue
|
$6,591
|
100%
|
$6,123
|
100%
|
8%
|
10%
|
||
(1)
The tables above each include a presentation of period-over-period revenue growth or decline on a constant currency basis, which is a non-GAAP measure that excludes the effects of foreign currency fluctuations. We calculate this information by translating prior period revenue growth at current period monthly average exchange rates. We believe that examining period-over-period revenue growth or decline excluding foreign currency fluctuations is useful for assessing the underlying performance of our business, and our management uses revenue growth on a constant currency basis to evaluate period-over-period operating performance. This non-GAAP measure should not be considered a substitute for, or superior to, period-over-period revenue growth under accounting principles generally accepted in the United States of America (or GAAP).
2015
compared to
2014
results discussion
Revenue
Revenue decreased
3%
in
2015
from
2014
due to declines in our Financial Services and Retail Solutions operating segments partially offset by improvement in our Hospitality and Emerging Industries operating segments. Foreign currency fluctuations
unfavorably
impacted the revenue comparison by
6%
. For
the year ended
December 31, 2015
our product revenue
decreased
6%
and our services revenue
decreased
1%
compared to
the year ended
December 31, 2014
. The decrease in our product revenue was due to declines in the Financial Services and the Retail Solutions operating segments in the EMEA and APJ theaters and declines in the Hospitality operating segment in the Americas theater, partially offset by growth in the Retail Solutions operating segment in the Americas theater and growth in the Emerging Industries operating segment in the APJ theater. The decrease in our services revenue was attributable to decreases in transaction and annuity services, partially offset by an increase in our software maintenance and cloud services. Services revenue decreased in the Financial Services and Retail Solutions operating segments in the EMEA and APJ theaters and decreased in the Emerging Industries operating segment in the EMEA theater, partially offset by an increase in all operating segments in the Americas theater and an increase in the Emerging Industries operating segment in the APJ theater.
Gross Margin
Gross margin as a percentage of revenue was
23.1%
in
2015
compared to
26.3%
in
2014
. Product gross margin in
2015
decreased to
23.6%
compared to
25.6%
in
2014
.
Product gross margin in
2015
was negatively impacted by a $10 million increase in pension expense, offset by $4 million of lower charges for the write-down of inventory related to the restructuring plan. Excluding these items, product gross margin decreased due to a less favorable mix of revenue.
Services gross margin decreased to
22.7%
in
2015
compared to
26.8%
in
2014
. Services gross margin in
2015
was negatively impacted by a $226 million increase in pension expense offset by a reduction of $40 million for the write-down of inventory related to the restructuring plan. Excluding these items, services gross margin increased due to a favorable mix of revenue, including an increase in cloud revenue.
28
2014
compared to
2013
results discussion
Revenue
Revenue
increased
8%
in
2014
from
2013
due to improvement in our Financial Services, Hospitality, and Emerging Industries operating segments offset by declines in our Retail Solutions operating segment. Digital Insight generated
$349 million
of revenue from the date of acquisition, January 10, 2014, through December 31, 2014. Foreign currency fluctuations had a
2%
unfavorable impact on revenue for the year. For
the year ended
December 31, 2014
, our product revenue
decreased
1%
and services revenue
increased
15%
compared to the year ended
December 31, 2013
. The decrease in our product revenue was due to declines in the Retail Solutions and Hospitality operating segments in the Americas theater, a decline in the Emerging Industries operating segment in the EMEA theater, and a decline in the Financial Services and Retail Solutions operating segments in the APJ theater. These declines were partially offset by growth in the Financial Services, Retail Solutions, and Hospitality operating segments in the EMEA theater and growth in the Financial Services operating segment in the Americas theater. The increase in our services revenue was attributable to increases in all our services offerings, which include professional and installation services, maintenance services and cloud services. Services revenue increased in all operating segments in the EMEA and APJ theaters and increased in the Financial Services, Hospitality and Emerging Industries operating segments in the Americas theater. The increases were partially offset by a decrease in the Retail Solutions operating segment in the Americas theater.
Gross Margin
Gross margin as a percentage of revenue was
26.3%
in
2014
compared to
28.4%
in
2013
. Product gross margin in
2014
decreased slightly to
25.6%
compared to
26.1%
in
2013
. Product gross margin in
2014
was negatively impacted by a $5 million increase in pension expense, $3 million in higher acquisition-related amortization of intangibles and a $9 million charge for the write-down of inventory related to the restructuring plan. Excluding these items, product gross margin as a percentage of revenue remained relatively consistent.
Services gross margin decreased to
26.8%
in
2014
compared to
30.5%
in
2013
. Services gross margin in
2014
was negatively impacted by a $126 million increase in pension expense, $24 million in higher acquisition-related amortization of intangibles and a $47 million charge for the write-down of inventory related to the restructuring plan. Excluding these items, services gross margin increased due to a favorable mix of revenue, including an increase in cloud revenue.
Effects of Pension, Postemployment, and Postretirement Benefit Plans
NCR's income from continuing operations for
the years ended
December 31
was impacted by certain employee benefit plans as shown below:
|
In millions
|
2015
|
2014
|
2013
|
||
|
Pension expense (benefit)
|
$464
|
$152
|
$(78)
|
||
|
Postemployment expense
|
17
|
89
|
18
|
||
|
Postretirement benefit
|
(15)
|
(15)
|
(15)
|
||
|
Total expense (benefit)
|
$466
|
$226
|
$(75)
|
||
In
2015
, pension expense was
$464 million
compared to pension expense of
$152 million
in
2014
and a pension benefit of
$78 million
in
2013
. In
2015
, pension expense included a settlement loss of $427 million related to the completion of the transfer of NCR's UK London pension plan to an insurer in addition to actuarial losses of
$29 million
primarily attributable to lower than expected return on U.S. pension assets, partially offset by an increase in the discount rate. In
2015
, approximately 31% of the pension expense was included in selling, general and administrative and research and development expenses, with the remaining 69% included in cost of products and services. In
2014
, pension expense included actuarial losses of
$150 million
primarily attributable to the change in the U.S. mortality table. In
2013
, the pension benefit included actuarial gains of
$104 million
driven by increases in discount rates used to value the U.S. and certain international plans and
$15 million
associated with the termination of NCR's U.S. non-qualified pension plans. Additionally, the
2013
pension benefit included special termination benefit costs of
$26 million
related to U.S. employees who irrevocably accepted a voluntary early retirement offer during
2013
.
Postemployment expense (severance and disability medical) was
$17 million
in
2015
compared to
$89 million
in
2014
and
$18 million
in
2013
. In July 2014, the Company announced a restructuring plan to strategically reallocate resources and position the Company to focus on higher growth, higher margin opportunities and recorded a related charge of
$1 million
and
$73 million
in the years ended
December 31, 2015
and
2014
, respectively. During the first quarter of 2013, NCR amended its U.S. separation plan to eliminate the accumulation of postemployment benefits. This amendment resulted in a curtailment benefit of approximately $13 million.
29
Selling, General and Administrative Expenses
Selling, general and administrative expenses increased
$30 million
to
$1,042 million
in
2015
from
$1,012 million
in
2014
. As a percentage of revenue, these expenses were
16.4%
in
2015
and
15.4%
in
2014
. In
2015
, selling, general and administrative expenses included
$125 million
of pension expense,
$62 million
of acquisition-related amortization of intangibles, a
$20 million
reserve on a subcontracting arrangement in emerging industries in Middle East Africa,
$11 million
of acquisition-related costs, and
$1 million
of OFAC and FCPA related legal costs. In
2014
, selling, general and administrative expenses included
$48 million
of pension expense,
$27 million
of acquisition-related costs,
$56 million
of acquisition-related amortization of intangibles, and
$3 million
of OFAC and FCPA related legal costs. Excluding these items, selling, general and administrative expenses decreased as a percentage of revenue from 13.3% in
2014
to 12.9% in
2015
due to the continued cost reduction actions focused on limiting discretionary spending and the benefit of cost savings from the restructuring program initiated in the prior year.
Selling, general, and administrative expenses increased
$141 million
to
$1,012 million
in
2014
from
$871 million
in
2013
. As a percentage of revenue, these expenses were
15.4%
in
2014
and
14.2%
in
2013
. In
2014
, selling, general, and administrative expenses included
$48 million
of pension expense,
$27 million
of acquisition-related costs,
$56 million
of acquisition-related amortization of intangibles, and
$3 million
of OFAC and FCPA related legal costs. In
2013
, selling, general, and administrative expenses included
$22 million
of pension benefit,
$46 million
of acquisition-related costs,
$29 million
of amortization of acquisition-related intangible assets and
$3 million
of OFAC and FCPA related legal costs. Excluding these items, selling, general and administrative expenses remained consistent as a percentage of revenue at 13.3%.
Research and Development Expenses
Research and development expenses decreased
$33 million
to
$230 million
in
2015
from
$263 million
in
2014
. As a percentage of revenue, these costs were
3.6%
in
2015
and
4.0%
in
2014
. Research and development expenses included pension expense of
$18 million
in
2015
as compared to pension expense of
$19 million
in
2014
. After considering this item, research and development expenses decreased to 3.3% in
2015
from 3.7% in
2014
as a percentage of revenue due to the focus on cost reduction actions, including limits on discretionary spending, as we continue to focus on higher value offerings.
Research and development expenses increased
$60 million
to
$263 million
in
2014
from
$203 million
in
2013
. As a percentage of revenue, these costs were
4.0%
in 2014 and
3.3%
in
2013
. Research and development expenses included pension expense of
$19 million
in
2014
as compared to pension benefit of
$10 million
in
2013
. After considering this item, research and development expenses increased to 3.7% in
2014
from 3.5% in
2013
as a percentage of revenue and were in line with management expectations as we continue to invest in broadening our self-service solutions.
Restructuring-Related Charges
In
2015
, the Company recorded restructuring-related charges of
$62 million
related to the restructuring program announced in July 2014. The charges consisted of severance and other employee related costs of
$20 million
, other exit costs of
$13 million
and asset-related charges of
$29 million
.
In
2014
, the Company recorded restructuring-related charges of
$104 million
related to the restructuring program announced in July 2014. The charges consist of severance and other employee related costs of
$86 million
, other exit costs of
$5 million
and asset-related charges of
$13 million
.
Interest Expense
Interest expense was
$173 million
in
2015
compared to
$181 million
in
2014
and
$103 million
in
2013
. Interest expense in
2015
and
2014
was primarily related to the Company's senior unsecured notes and borrowings under the Company's senior secured credit facility. The increase in 2014 compared to 2013 is primarily related to a full year of interest expense related to the Company's
5.875%
and
6.375%
senior unsecured notes in 2014 compared to a partial year of interest expense in 2013.
30
Other Expense
Other (expense), net was
$57 million
in
2015
compared to
$35 million
in
2014
and
$9 million
in
2013
. Interest income was
$5 million
in
2015
, and
$6 million
in
2014
and
2013
. In
2015
, other (expense), net included $21 million related to losses from foreign currency fluctuations and foreign exchange contracts, $9 million in bank-related fees, and $34 million related to the loss on the pending sale of the IPS business. In
2014
, other (expense), net included $32 million related to losses from foreign currency fluctuations and foreign exchange contracts, $7 million in bank-related fees, and $3 million related to the impairment of an investment partially offset by a $4 million gain on the sale of available for sale securities. In
2013
, other (expense), net included $13 million related to losses from foreign currency contracts not designated as hedging instruments as well as from foreign currency fluctuations and $7 million in bank-related fees partially offset by income from the sale of certain patents and a $3 million gain on the sale of an investment.
Income Taxes
The effective tax rate was
(58)%
in
2015
,
(35)%
in
2014
, and
18%
in
2013
. During
2015
, there was no tax benefit recorded on the
$427 million
charge related to the settlement of the UK London pension plan due to a valuation allowance against deferred tax assets in the United Kingdom. Refer to
Note 10, “Employee Benefit Plans,”
for additional discussion on the settlement of the UK London pension plan. Additionally, we favorably settled examinations with Canada for tax years 2002 through 2006 that resulted in a tax benefit of
$10 million
in
2015
. During 2014, we favorably settled examinations with the Internal Revenue Service (IRS) for the 2009 and 2010 tax years that resulted in a tax benefit of
$13 million
. In addition, the 2014 tax rate was favorably impacted by a
$9 million
reduction in the U.S. valuation allowance and a favorable mix of earnings by country, primarily driven by actuarial pension losses due to a change in the U.S. mortality table. During 2013, we recorded a one-time benefit of approximately
$16 million
in connection with the American Taxpayer Relief Act of 2012 that was signed into law in January 2013 and the related retroactive tax relief for certain law provisions that expired in 2012. The 2013 tax rate was also favorably impacted by the release of a
$10 million
valuation allowance due to the implementation of a tax planning strategy to access certain deferred tax assets, a
$15 million
reduction in a valuation allowance related to a subsidiary in Japan, and a favorable mix of earnings by country, primarily related to lower pension benefit.
During 2014, the Internal Revenue Services (IRS) finalized an examination of our 2009 and 2010 income tax returns and commenced an examination of our 2011, 2012 and 2013 income tax returns, which is ongoing. While we are subject to numerous federal, state and foreign tax audits, we believe that appropriate reserves exist for issues that might arise from these audits. Should these audits be settled, the resulting tax effect could impact the tax provision and cash flows in future periods. During
2016
, the Company expects to resolve certain tax matters related to U.S. and foreign jurisdictions. These resolutions could have a material impact on the effective tax rate in
2016
.
Income (Loss) from Discontinued Operations
In
2015
, loss from discontinued operations was
$24 million
, net of tax, primarily related to updates in estimates and accruals for litigation expenses related to the Fox River reserve in addition to accruals for litigation expenses related to the Kalamazoo River environmental matter.
In
2014
, income from discontinued operations was
$10 million
, net of tax, primarily related to updates in estimates related to the Fox River reserve partially offset by accruals for litigation expenses related to the Kalamazoo River environmental matter.
In
2013
, loss from discontinued operations was
$9 million
, net of tax, solely related to environmental matters, which was due to changes in estimates related to the Fox River reserve in addition to accruals for litigation expenses related to the Kalamazoo River environmental matter, partially offset by recoveries from insurance carriers.
31
Revenue and Operating Income by Segment
As described in
Note 14, “Segment Information and Concentrations”
of the Notes to Consolidated Financial Statements, the Company manages and reports its businesses in the following segments:
|
•
|
Financial Services
- We offer solutions to enable customers in the financial services industry to reduce costs, generate new revenue streams and enhance customer loyalty. These solutions include a comprehensive line of ATM and payment processing hardware and software; cash management and video banking software and customer-facing digital banking services; and related installation, maintenance, and managed and professional services. We also offer a complete line of printer consumables.
|
|
•
|
Retail Solutions
- We offer solutions to customers in the retail industry designed to improve selling productivity and checkout processes as well as increase service levels. These solutions primarily include retail-oriented technologies, such as point of sale terminals and point of sale software; an omni-channel retail software platform with a comprehensive suite of retail software applications; innovative self-service kiosks, such as self-checkout; as well as bar-code scanners. We also offer installation, maintenance, managed and professional services and a complete line of printer consumables.
|
|
•
|
Hospitality
- We offer technology solutions to customers in the hospitality industry, serving businesses that range from a single store or restaurant to global chains and sports and entertainment venues. Our solutions include point of sale hardware and software solutions, installation, maintenance, managed and professional services and a complete line of printer consumables.
|
|
•
|
Emerging Industries
- We offer maintenance as well as managed and professional services for third-party computer hardware provided to select manufacturers, primarily in the telecommunications industry, who value and leverage our global service capability. Also included in the Emerging Industries segment are solutions designed to enhance the customer experience for the travel industry, such as self-service kiosks, and the small business market, such as an all-in-one point of sale solution. Additionally, we offer installation, maintenance, and managed and professional services.
|
Each of these segments derives its revenue by selling products and services in the sales theaters in which NCR operates. Segments are measured for profitability by the Company’s chief operating decision maker based on revenue and segment operating income. For purposes of discussing our operating results by segment, we exclude the impact of certain items (described below) from segment operating income, consistent with the manner by which management reviews each segment, evaluates performance, and reports our segment results under GAAP. This format is useful to investors because it allows analysis and comparability of operating trends. It also includes the same information that is used by NCR management to make decisions regarding the segments and to assess our financial performance.
The effect of pension expense (benefit) and other significant, non-recurring items on segment operating income have been excluded from the operating income for each reporting segment presented below. Our segment results are reconciled to total Company results reported under GAAP in
Note 14, “Segment Information and Concentrations”
of the Notes to Consolidated Financial Statements included in Item 8 of Part II of this Report.
In the segment discussions below, we have disclosed the impact of foreign currency fluctuations as it relates to our segment revenue due to its significance.
Financial Services Segment
The following table presents the Financial Services revenue and segment operating income for
the years ended
December 31
:
|
In millions
|
2015
|
2014
|
2013
|
||
|
Revenue
|
$3,319
|
$3,561
|
$3,115
|
||
|
Operating income
|
$518
|
$543
|
$356
|
||
|
Operating income as a percentage of revenue
|
15.6%
|
15.2%
|
11.4%
|
||
We completed the acquisition of Digital Insight Corporation (Digital Insight) on January 10, 2014. As a result, the revenue and operating income results for the Financial Services segment in 2014 include the impact of Digital Insight from January 10, 2014 through
December 31, 2014
. Digital Insight generated
$349 million
of revenue and
$104 million
of operating income in the year ended
December 31, 2014
.
32
Financial Services revenue
decreased
7%
in
2015
compared to
2014
and
increased
14%
in
2014
compared to
2013
. Revenue
decreased
in
2015
compared to
2014
primarily driven by a decline in product sales and services revenue in the EMEA and APJ theaters, partially offset by growth in services revenue in the Americas theater. Foreign currency fluctuations
negatively
impacted the year-over-year revenue comparison by
8%
. Revenue increased in
2014
compared to
2013
primarily driven by growth in product sales and services revenue in the Americas and EMEA theaters and services revenue growth in the APJ theater, and the contribution of the Digital Insight business noted above. The growth was slightly offset by declines in product sales in the APJ theater. Foreign currency fluctuations
negatively
impacted the year-over-year revenue comparison by
3%
.
Operating income was
$518 million
in
2015
,
$543 million
in
2014
and
$356 million
in
2013
. The
decrease
in operating income in
2015
compared to
2014
was driven by lower revenue in Russia and China. The increase in operating income in
2014
compared to
2013
was driven by a higher mix of software revenue and the contribution of the Digital Insight business noted above.
Retail Solutions Segment
The following table presents the Retail Solutions revenue and segment operating income for
the years ended
December 31
:
|
In millions
|
2015
|
2014
|
2013
|
||
|
Revenue
|
$2,001
|
$2,008
|
$2,034
|
||
|
Operating income
|
$156
|
$155
|
$205
|
||
|
Operating income as a percentage of revenue
|
7.8%
|
7.7%
|
10.1%
|
||
The Company completed the acquisition of Retalix Ltd. (Retalix) on February 6, 2013. As a result, the revenue and operating income results for the Retail Solutions segment in 2013 include the impact of Retalix from February 6, 2013 through December 31, 2013. Retalix generated revenue of $298 million and $53 million of operating income in the year ended December 31, 2013.
Retail Solutions revenue was essentially
flat
in
2015
compared to
2014
and
decreased
1%
in
2014
compared to
2013
. Revenue was essentially
flat
in
2015
compared to
2014
primarily driven by growth in product sales and services revenue in the Americas theater offset by declines in product and services revenue in the EMEA and APJ theaters. Foreign currency fluctuations
negatively
impacted the year-over-year revenue comparison by
5%
. The decrease in revenue in
2014
compared to
2013
was primarily driven by declines in product sales and services revenue in the Americas theater and a decline in product sales in the APJ theater, partially offset by growth in product sales and service revenue in the EMEA theater and growth in services revenue in the APJ theater. Foreign currency fluctuations
negatively
impacted the year-over-year revenue comparison by
1%
.
Operating income was
$156 million
in
2015
,
$155 million
in
2014
and
$205 million
in
2013
. The slight
increase
in operating income in
2015
compared to
2014
was primarily driven by a more favorable revenue mix and better expense management. The decrease in the Retail Solutions operating income in
2014
compared to
2013
was primarily driven by redirected information technology spending and delayed customer rollouts.
Hospitality Segment
The following table presents the Hospitality revenue and segment operating income for
the years ended
December 31
:
|
In millions
|
2015
|
2014
|
2013
|
||
|
Revenue
|
$686
|
$659
|
$626
|
||
|
Operating income
|
$115
|
$91
|
$100
|
||
|
Operating income as a percentage of revenue
|
16.8%
|
13.8%
|
16.0%
|
||
Hospitality revenue
increased
4%
in
2015
compared to
2014
and
increased
5%
in
2014
compared to
2013
. The
increase
in revenue in
2015
compared to
2014
was largely due to growth in services revenue in the Americas theater partially offset by a decline in product sales in the Americas theater. Foreign currency fluctuations
negatively
impacted the year-over-year revenue comparison by
3%
. The increase in revenue in
2014
compared to
2013
was due to growth in services revenue in all theaters and growth in product sales in the EMEA theater partially offset by a decline in product sales in the Americas theater. Foreign currency fluctuations
negatively
impacted the year-over-year revenue comparison by
1%
.
Operating income for Hospitality was
$115 million
in
2015
,
$91 million
in
2014
, and
$100 million
in
2013
. The increase in operating income in
2015
compared to
2014
was driven by a higher mix of software-related revenue, including cloud and professional services revenue. The decrease in the Hospitality operating income in
2014
compared to
2013
was driven by an unfavorable mix of revenue, with a large software transaction in 2013.
33
Emerging Industries Segment
The following table presents the Emerging Industries revenue and segment operating income for
the years ended
December 31
:
|
In millions
|
2015
|
2014
|
2013
|
||
|
Revenue
|
$367
|
$363
|
$348
|
||
|
Operating income
|
$41
|
$31
|
$56
|
||
|
Operating income as a percentage of revenue
|
11.2%
|
8.5%
|
16.1%
|
||
Emerging Industries revenue
increased
1%
in
2015
compared to
2014
and
increased
4%
in
2014
compared to
2013
. The increase in revenue in
2015
compared to
2014
was driven by higher services revenue in the Americas and APJ theaters and higher product sales in the APJ theater, offset by a decline in services revenue in the EMEA theater. Foreign currency fluctuations
negatively
impacted the year-over-year revenue comparison by
8%
. The increase in revenue in
2014
compared to
2013
was driven by higher services revenue in all theaters partially offset by a decline in product sales in the EMEA theater. Foreign currency fluctuations
negatively
impacted the year-over-year revenue comparison by
1%
.
Operating income was
$41 million
in
2015
,
$31 million
in
2014
, and
$56 million
in
2013
. The
increase
in the Emerging Industries operating income in
2015
compared to
2014
was due to higher services margins. The
decrease
in the Emerging Industries operating income in
2014
compared to
2013
was due to costs associated with managed services contracts and continued investment in the small business market.
FINANCIAL CONDITION, LIQUIDITY AND CAPITAL RESOURCES
In
the year ended
December 31, 2015
, cash provided by operating activities was
$681 million
and in
the year ended
December 31, 2014
, cash provided by operating activities was
$524 million
.
NCR’s management uses a non-GAAP measure called “free cash flow” to assess the financial performance of the Company. We define free cash flow as net cash provided by (used in) operating activities and cash provided by (used in) discontinued operations, less capital expenditures for property, plant and equipment, less additions to capitalized software plus discretionary pension contributions and settlements. Free cash flow does not have a definition under GAAP, and therefore NCR’s definition may differ from other companies’ definitions of this measure. We believe free cash flow information is useful for investors because it relates the operating cash flows from the Company’s continuing and discontinued operations to the capital that is spent to continue and improve business operations. In particular, free cash flow indicates the amount of cash available after capital expenditures for, among other things, investments in the Company’s existing businesses, strategic acquisitions and investments, repurchase of NCR stock and repayment of debt obligations. Free cash flow does not represent the residual cash flow available for discretionary expenditures, since there may be other non-discretionary expenditures that are not deducted from the measure. This non-GAAP measure should not be considered a substitute for, or superior to, cash flows from operating activities under GAAP. The table below reconciles net cash provided by (used in) operating activities, the most directly comparable GAAP measure, to NCR’s non-GAAP measure of free cash flow for the year ended December 31:
|
In millions
|
2015
|
2014
|
2013
|
||
|
Net cash provided by operating activities
|
$681
|
$524
|
$281
|
||
|
Expenditures for property, plant and equipment
|
(79)
|
(118)
|
(116)
|
||
|
Additions to capitalized software
|
(150)
|
(140)
|
(110)
|
||
|
Net cash used in discontinued operations
|
(43)
|
(1)
|
(52)
|
||
|
Pension discretionary contributions and settlements
|
—
|
48
|
204
|
||
|
Free cash flow (non-GAAP)
|
$409
|
$313
|
$207
|
||
In
2015
, net cash provided by operating activities
increased
$157 million
, net cash used in discontinued operations
increased
$42 million
, and there were
no
pension discretionary contributions and settlements in
2015
compared to
$48 million
in
2014
, all of which contributed to a net increase in free cash flow of
$96 million
in comparison to
2014
. Additionally, capital expenditures
decreased
$39 million
and capitalized software additions
increased
$10 million
due to continued investment in software solution enhancements. The cash used in discontinued operations in
2015
was higher than
2014
primarily due to a reduction in recoveries related to the Fox River environmental matter.
34
In
2014
, net cash provided by operating activities
increased
$243 million
, net cash used in discontinued operations
decreased
$51 million
, and pension discretionary contributions and settlements were
$48 million
in
2014
, down from
$204 million
in
2013
, all of which contributed to a net increase in free cash flow of
$106 million
in comparison to
2013
. Additionally, capital expenditures
increased
$2 million
and capitalized software additions
increased
$30 million
due to continued investment in the business and software solution enhancements. The cash used in discontinued operations in
2014
was lower than
2013
primarily due to recoveries related to the Fox River environmental matter.
Financing activities and certain other investing activities are not included in our calculation of free cash flow. Our other investing activities primarily include business acquisitions, divestitures and investments as well as proceeds from the sales of property, plant and equipment. During
the year ended
December 31, 2014
, we completed the acquisition of Digital Insight for $1,647 million, net of cash received. During
the year ended
December 31, 2013
, we completed the acquisition of Retalix for $664 million, net of cash received, and multiple other acquisitions that totaled $116 million, net of cash received.
Our financing activities primarily include proceeds from the issuance of preferred stock, employee stock plans, borrowings on term credit facilities and the issuance of unsecured notes, as well as payments made for share repurchases, repayments of term credit facilities and tax withholding on behalf of employees. During
the year ended
December 31, 2015
, we issued and sold shares of the Series A Convertible Preferred Stock for
$820 million
less
$26 million
of issuance costs and completed a share repurchase by modified "Dutch auction" tender offer for $1 billion plus $5 million of issuance costs. During
the years ended
December 31, 2015
,
2014
and
2013
, proceeds from employee stock plans were
$15 million
,
$13 million
and
$57 million
, respectively. During
the years ended
December 31, 2015
,
2014
and
2013
, payments made for tax withholding on behalf of employees totaled
$16 million
,
$28 million
and
$30 million
, respectively.
Long Term Borrowings
Our senior secured credit facility consisted of a term loan facility and a revolving credit facility. As of
December 31, 2015
, the term loan facility had an aggregate principal amount outstanding of
$956 million
. The revolving credit facility had an aggregate principal amount of
$850 million
, of which
$100 million
was outstanding as of
December 31, 2015
. The revolving credit facility also allows a portion of the availability to be used for outstanding letters of credit, and as of
December 31, 2015
, there were
$28 million
in outstanding letters of credit. As of
December 31, 2014
, the outstanding principal balances of the term loan facility and revolving facility was
$1.33 billion
and
zero
, respectively.
As of
December 31, 2015
and
2014
, we had outstanding
$700 million
in aggregate principal balance of
6.375%
senior unsecured notes due 2023,
$600 million
in aggregate principal balance of
5.00%
senior unsecured notes due 2022,
$500 million
in aggregate principal balance of
4.625%
senior unsecured notes due 2021 and
$400 million
in aggregate principal balance of
5.875%
senior unsecured notes due 2021.
In November 2014, we entered into a revolving trade receivables securitization facility, which provides the Company with up to
$200 million
in funding based on the availability of eligible receivables and other customary factors and conditions. As of
December 31, 2015
, the Company had
no
outstanding balance under the facility.
See
Note 7, "Debt Obligations,"
of the Notes to Consolidated Financial Statements included in Item 8 of Part II of this Report for further information on the senior secured credit facility, the senior unsecured notes and the trade receivables securitization facility.
Employee Benefit Plans
We expect to make pension, postemployment and postretirement plan contributions of approximately
$71 million
in
2016
. See
Note 10, “Employee Benefit Plans,”
of the Notes to the Consolidated Financial Statements included in Item 8 of Part II of this Report for additional discussion on our pension, postemployment and postretirement plans.
Restructuring Program
In July 2014, we announced a restructuring plan to strategically reallocate resources so that we can focus on higher-growth, higher-margin opportunities in the software-driven omni-channel industry. Refer to
Note 3, "Restructuring Plan,"
of the Notes to the Consolidated Financial Statements included in Item 8 of Part II of this Report for additional discussion on our restructuring plan. As a result of the restructuring plan, the Company recorded a total charge of
$74 million
and
$161 million
in the years ended
December 31, 2015
and
2014
, respectively. The Company expects to achieve annualized run-rate savings of approximately
$105 million
beginning in 2016. Our estimate of restructuring-related opportunities in connection with this restructuring plan for 2016 is approximately
$20 million
to
$25 million
.
Series A Convertible Preferred Stock
On December 4, 2015, NCR issued
820,000
shares of Series A Convertible Preferred Stock to certain entities affiliated with Blackstone Capital Partners VI L.P. and Blackstone Tactical Opportunities L.L.C. (collectively, Blackstone) for an aggregate purchase price of
$820 million
, or
$1,000
per share, pursuant to an Investment Agreement between the Company and Blackstone, dated November 11, 2015. In connection with the issuance of the Series A Convertible Preferred Stock, the Company incurred direct and incremental expenses of
$26 million
.
35
The Series A Convertible Preferred Stock ranks senior to the shares of the Company’s common stock, with respect to dividend rights and rights on the distribution of assets on any voluntary or involuntary liquidation, dissolution or winding up of the affairs of the Company. Holders of Series A Convertible Preferred Stock are entitled to a cumulative dividend at the rate of 5.5% per annum, payable quarterly in arrears and payable in-kind for the first sixteen dividend payments, after which, dividends will be payable in cash or in-kind at the option of the Company. If we fail to timely declare and pay a dividend, the dividend rate will increase to 8.0% per annum until such time as all accrued but unpaid dividends have been paid in full. As of December 31, 2015, the Company had accrued dividends of
$4 million
. There were no cash dividends declared in the year ended
December 31, 2015
.
The Series A Convertible Preferred Stock is convertible at the option of the holders at any time into shares of common stock at a conversion price of $30.00 per share and a conversion rate of 33.33 shares of common stock per share of Series A Convertible Preferred Stock. The conversion rate is subject to customary anti-dilution and other adjustments. As of
December 31, 2015
, the maximum number of common shares that could be required to be issued if converted is
27.4 million
shares, which represents approximately
17%
of our outstanding common stock as of
December 31, 2015
on an as-converted basis.
On any date during the three months commencing on and immediately following March 16, 2024 and the three months commencing on and immediately following every third anniversary of March 16, 2024, holders of Series A Convertible Preferred Stock have the right to require the Company to repurchase all or any portion of the Series A Convertible Preferred Stock at 100% of the liquidation preference thereof plus all accrued but unpaid dividends. Additionally, upon certain change of control events involving the Company, holders of Series A Convertible Preferred Stock can require the Company to repurchase, subject to certain exceptions, all or any portion of the Series A Convertible Preferred Stock and the Company has the right to redeem the Series A Convertible Preferred Stock.
Cash and Cash Equivalents Held by Foreign Subsidiaries
Cash and cash equivalents held by the Company's foreign subsidiaries were
$317 million
and
$458 million
at
December 31, 2015
and
2014
, respectively. Under current tax laws and regulations, if cash and cash equivalents and short-term investments held outside the U.S. are distributed to the U.S. in the form of dividends or otherwise, we may be subject to additional U.S. income taxes and foreign withholding taxes, which could be significant.
Summary
As of
December 31, 2015
, our cash and cash equivalents totaled
$328 million
and our total debt was
$3.25 billion
. Our borrowing capacity under our senior secured credit facility was
$722 million
and under our trade receivables securitization facility was
$200 million
at
December 31, 2015
. Our ability to generate positive cash flows from operations is dependent on general economic conditions, and the competitive environment in our industry, and is subject to the business and other risk factors described in Item 1A of Part I of this
2015
Annual Report on Form 10-K. If we are unable to generate sufficient cash flows from operations, or otherwise comply with the terms of our credit facilities, we may be required to seek additional financing alternatives.
We believe that we have sufficient liquidity based on our current cash position, cash flows from operations and existing financing to meet our expected pension, postemployment, and postretirement plan contributions, remediation payments related to the Fox River environmental matter, debt servicing obligations, payments under the restructuring plan, and our operating requirements for the next twelve months.
Contractual Obligations
In the normal course of business, we enter into various contractual obligations that impact, or could impact, the liquidity of our operations. The following table and discussion outlines our material obligations as of
December 31, 2015
on an undiscounted basis, with projected cash payments in the years shown:
|
In millions
|
Total Amounts
|
2016
|
2017 - 2018
|
2019 - 2020
|
2021 & Thereafter
|
All Other
|
||||||||||||
|
Debt obligations
|
$
|
3,286
|
|
$
|
13
|
|
$
|
1,065
|
|
$
|
906
|
|
$
|
1,302
|
|
$
|
—
|
|
|
Interest on debt obligations
|
925
|
|
156
|
|
287
|
|
247
|
|
235
|
|
—
|
|
||||||
|
Estimated environmental liability payments
|
60
|
|
41
|
|
—
|
|
—
|
|
19
|
|
—
|
|
||||||
|
Lease obligations
|
558
|
|
97
|
|
133
|
|
78
|
|
250
|
|
—
|
|
||||||
|
Purchase obligations
|
1,104
|
|
1,010
|
|
94
|
|
—
|
|
—
|
|
—
|
|
||||||
|
Uncertain tax positions
|
167
|
|
—
|
|
—
|
|
—
|
|
—
|
|
167
|
|
||||||
|
Total obligations
|
$
|
6,100
|
|
$
|
1,317
|
|
$
|
1,579
|
|
$
|
1,231
|
|
$
|
1,806
|
|
$
|
167
|
|
As of
December 31, 2015
, we had short and long-term debt totaling
$3.25 billion
, which includes debt issuance costs as a direct reduction from the carrying amount of debt.
36
For purposes of this table, we used interest rates as of
December 31, 2015
to estimate the future interest on debt obligations outstanding as of
December 31, 2015
and have assumed no voluntary prepayments of existing debt. See
Note 7, "Debt Obligations,"
of the Notes to Consolidated Financial Statements included in Item 8 of Part II of this Report for additional disclosure related to our debt obligations and the related interest rate terms. We have also incorporated the expected fixed payments based on our interest rate swap related to our term loan. See
Note 12, "Derivatives and Hedging Instruments,"
of the Notes to Consolidated Financial Statements included in Item 8 of Part II of this Report for additional disclosure related to our interest rate swap.
The estimated environmental liability payments included in the table of contractual obligations shown above are related to the Fox River environmental matter. The amounts shown are our expected payments, net of the payment obligations of its co-obligors; the amounts do not include an estimate for payments to be received from insurers or indemnification parties. For additional information, refer to
Note 11, "Commitments and Contingencies,"
included in Item 8 of Part II of this Report.
Our lease obligations are primarily for certain sales and manufacturing facilities in various domestic and international locations as well as leases related to equipment and vehicles. Our lease obligations also include amounts owed for our future world headquarters in Atlanta. Due to the early stages of construction, we have included assumptions regarding the total project cost and lease commencement. Purchase obligations represent committed purchase orders and other contractual commitments for goods or services. The purchase obligation amounts were determined through information in our procurement systems and payment schedules for significant contracts. Included in the amounts are committed payments in relation to the long-term service agreement with Accenture under which NCR’s transaction processing activities and functions are performed.
We have a
$167 million
liability related to our uncertain tax positions. Due to the nature of the underlying liabilities and the extended time often needed to resolve income tax uncertainties, we cannot make reliable estimates of the amount or timing of cash payments that may be required to settle these liabilities. For additional information, refer to
Note 8, "Income Taxes,"
of the Notes to Consolidated Financial Statements included in Item 8 of Part II of this Report.
Our U.S. and international employee benefit plans, which are described in
Note 10, “Employee Benefit Plans,”
of the Notes to Consolidated Financial Statements included in Item 8 of Part II of this Report, could require significant future cash payments. The funded status of NCR’s U.S. pension plan is an underfunded position of
$429 million
as of
December 31, 2015
compared to an underfunded position of
$387 million
as of
December 31, 2014
. The decline in our funded status is primarily attributable to lower than expected return on U.S. pension assets, partially offset by an increase in the discount rate. Our international retirement plans were in an underfunded status of
$150 million
as of
December 31, 2015
, as compared to an overfunded status of
$219 million
as of
December 31, 2014
. The change in funded status was primarily related to the completion of the transfer of our UK London pension plan to an insurer, which resulted in a settlement loss of $427 million. Contributions to international pension plans are expected to be approximately
$35 million
in
2016
.
We also have product warranties that may affect future cash flows. These items are not included in the table of obligations shown above, but are described in detail in
Note 11, "Commitments and Contingencies,"
of the Notes to Consolidated Financial Statements included in Item 8 of Part II of this Report.
Our senior secured credit facility and the indentures for our senior unsecured notes includes affirmative and negative covenants that restrict or limit our ability to, among other things, incur indebtedness; create liens on assets; engage in certain fundamental corporate changes or changes to our business activities; make investments; sell or otherwise dispose of assets; engage in sale-leaseback or hedging transactions; pay dividends or make similar distributions; repay other indebtedness; engage in certain affiliate transactions; or enter into agreements that restrict our ability to create liens, pay dividends or make loan repayments. Our senior secured credit facility also includes financial covenants that require us to maintain:
|
•
|
a consolidated leverage ratio on the last day of any fiscal quarter, not to exceed (i) in the case of any fiscal quarter ending after December 31, 2014 and on or prior to December 31, 2016, (a) the sum of (x)
4.25
and (y) an amount (not to exceed
0.50
) to reflect new debt used to reduce NCR's underfunded pension liabilities, to (b)
1.00
, (ii) in the case of any fiscal quarter ending after December 31, 2016 and on or prior to December 31, 2017,
4.00
to
1.00
, and (iii) in the case of any fiscal quarter ending after December 31, 2017,
3.75
to
1.00
; and
|
|
•
|
an interest coverage ratio on the last day of any fiscal quarter greater than or equal to
3.50
to
1.00
.
|
At
December 31, 2015
, the maximum consolidated leverage ratio under the senior secured credit facility was
4.35
to 1.00.
Off-Balance Sheet Arrangements
We have no significant contractual obligations not fully recorded on our Consolidated Balance Sheets or fully disclosed in the notes to our consolidated financial statements. We have no material off-balance sheet arrangements as defined by SEC Regulation S-K Item 303 (a) (4) (ii).
37
See
Note 11, "Commitments and Contingencies,"
in the Notes to Consolidated Financial Statements in Item 8 of Part II of this Report for additional information on guarantees associated with our business activities.
Disclosure Pursuant to Section 13(r)(1)(D)(iii) of the Securities Exchange Act.
Pursuant to Section 13(r)(1)(D)(iii) of the Securities Exchange Act of 1934, as amended (the Exchange Act), we note that, during the period
January 1, 2015
through
December 31, 2015
, the Company's branch in Syria maintained a bank account and guarantees at the Commercial Bank of Syria (CBS), which was designated as a Specially Designated National pursuant to Executive Order 13382 (EO 13382) on August 10, 2011. This bank account and the guarantees at CBS were maintained in the normal course of business prior to the listing of CBS pursuant to EO 13382. We note that the last known account balance as of
December 31, 2015
was approximately $3,455. The bank account did not generate interest from
January 1, 2015
through
December 31, 2015
, and the guarantees did not generate any revenue or profits for the Company. Pursuant to a license granted to the Company by OFAC on January 3, 2013 and subsequent licenses granted on April 29, 2013, July 12, 2013, February 28, 2014, November 12, 2014, and October 24, 2015, the Company has been winding down its operations in Syria. The Company’s current license expires on April 30, 2016. The Company has also received licenses from OFAC to close the CBS account and terminate any guarantees. The Company's application to renew these licenses, which was submitted to OFAC on May 18, 2015, remains pending. Following the termination of guarantees and the closure of the account, the Company does not intend to engage in any further business activities with CBS.
CRITICAL ACCOUNTING POLICIES AND ESTIMATES
Our consolidated financial statements are prepared in accordance with GAAP. In connection with the preparation of these financial statements, we are required to make assumptions, estimates and judgments that affect the reported amounts of assets, liabilities, revenue, expenses and the related disclosure of contingent liabilities. These assumptions, estimates and judgments are based on historical experience and are believed to be reasonable at the time. However, because future events and their effects cannot be determined with certainty, the determination of estimates requires the exercise of judgment. Our critical accounting policies are those that require assumptions to be made about matters that are highly uncertain. Different estimates could have a material impact on our financial results. Judgments and uncertainties affecting the application of these policies and estimates may result in materially different amounts being reported under different conditions or circumstances. Our management continually reviews these assumptions, estimates and judgments to ensure that our financial statements are presented fairly and are materially correct.
In many cases, the accounting treatment of a particular transaction is specifically dictated by GAAP and does not require significant management judgment in its application. There are also areas in which management’s judgment in selecting among available alternatives would not produce a materially different result. The significant accounting policies and estimates that we believe are the most critical to aid in fully understanding and evaluating our reported financial results are discussed in the paragraphs below. Our senior management has reviewed these critical accounting policies and related disclosures with our independent registered public accounting firm and the Audit Committee of our Board of Directors. See
Note 1, "Description of Business and Significant Accounting Policies"
of the Notes to Consolidated Financial Statements in Item 8 of Part II of this Report, which contains additional information regarding our accounting policies and other disclosures required by GAAP.
Revenue Recognition
NCR frequently enters into multiple-element arrangements with its customers including hardware, software, professional consulting services and maintenance support services. For arrangements involving multiple deliverables, when deliverables include software and non-software products and services, NCR evaluates and separates each deliverable to determine whether it represents a separate unit of accounting based on the following criteria: (a) the delivered item has value to the customer on a stand-alone basis; and (b) if the contract includes a general right of return relative to the delivered item, delivery or performance of the undelivered items is considered probable and substantially in the control of NCR.
38
Consideration is allocated to each unit of accounting based on the unit's relative selling prices. In such circumstances, the Company uses a hierarchy to determine the selling price to be used for allocating revenue to each deliverable: (i) vendor-specific objective evidence of selling price (VSOE), (ii) third-party evidence of selling price (TPE), and (iii) best estimate of selling price (BESP). VSOE generally exists only when the Company sells the deliverable separately and is the price actually charged by the Company for that deliverable. VSOE is established for our software maintenance and software-related professional services. We use TPE to establish selling prices for our installation and transaction services. The Company uses BESP to allocate revenue when we are unable to establish VSOE or TPE of selling price. BESP is used for hardware maintenance and elements such as products that are not consistently priced within a narrow range. . The Company determines BESP for a deliverable by considering multiple factors including product class, geography, average discount, and management's historical pricing practices. Amounts allocated to the delivered hardware and software elements are recognized at the time of sale provided the other conditions for revenue recognition have been met. Amounts allocated to the undelivered maintenance and other services elements are recognized as the services are provided or on a straight-line basis over the service period. In certain instances, customer acceptance is required prior to the passage of title and risk of loss of the delivered products. In such cases, revenue is not recognized until the customer acceptance is obtained. Delivery and acceptance generally occur in the same reporting period.
In situations where NCR's solutions contain software that is more than incidental, revenue related to the software and software-related elements is recognized in accordance with authoritative guidance on software revenue recognition. For the software and software-related elements of such transactions, revenue is allocated based on the relative fair value of each element, and fair value is determined by VSOE. If the Company cannot objectively determine the fair value of any undelivered element included in such multiple-element arrangements, the Company defers revenue until all elements are delivered and services have been performed, or until fair value can objectively be determined for any remaining undelivered elements. When the fair value of a delivered element has not been established, but fair value exists for the undelivered elements, the Company uses the residual method to recognize revenue. Under the residual method, the fair value of the undelivered elements is deferred and the remaining portion of the arrangement fee is allocated to the delivered elements and is recognized as revenue.
For certain of NCR’s long-term contracts, the Company utilizes a percentage-of-completion accounting method, which requires estimates of future revenue and costs over the full term of product and/or service delivery. Estimated losses, if any, on long-term projects are recognized as soon as such losses become known.
Revenue recognition for complex contractual arrangements, especially those with multiple elements, requires a significant level of judgment and is based upon a review of specific contracts, past experience, the selling price of undelivered elements when sold separately, creditworthiness of customers, international laws and other factors. Changes in judgments about these factors could impact the timing and amount of revenue recognized between periods.
Allowance for Doubtful Accounts
We evaluate the collectability of our accounts receivable based on a number of factors. We establish provisions for doubtful accounts using percentages of our accounts receivable balance as an overall proxy to reflect historical average credit losses and also use management judgment that may include elements that are uncertain, including specific provisions for known issues. The percentages are applied to aged accounts receivable balances. Aged accounts are determined based on the number of days the receivable is outstanding, measured from the date of the invoice, or from the date of revenue recognition. As the age of the receivable increases, the provision percentage also increases. This policy is applied consistently among all of our operating segments.
Based on the factors below, we periodically review customer account activity in order to assess the adequacy of the allowances provided for potential losses. Factors include economic conditions and judgments regarding collectability of account balances, each customer’s payment history and creditworthiness.
The allowance for doubtful accounts was
$47 million
as of
December 31, 2015
,
$19 million
as of
December 31, 2014
, and
$18 million
as of
December 31, 2013
. These allowances represent, as a percentage of gross receivables,
3.6%
in
2015
,
1.3%
in
2014
, and
1.3%
in
2013
.
Given our experience, the reserves for potential losses are considered adequate, but if one or more of our larger customers were to default on its obligations, we could be exposed to potentially significant losses in excess of the provisions established. We continually evaluate our reserves for doubtful accounts and economic deterioration could lead to the need to increase our allowances.
39
Inventory Valuation
Inventories are stated at the lower of cost or net realizable value, using the average cost method. Each quarter, we reassess raw materials, work-in-process, parts and finished equipment inventory costs to identify purchase or usage variances from standards, and valuation adjustments are made. Additionally, to properly provide for potential exposure due to slow-moving, excess, obsolete or unusable inventory, inventory values are reduced based on forecasted usage, orders, technological obsolescence and inventory aging. These factors are impacted by market conditions, technology changes and changes in strategic direction, and require estimates and management judgment that may include elements that are uncertain. On a quarterly basis, we review the current net realizable value of inventory and adjust for any inventory exposure due to age or excess of cost over net realizable value.
We have inventory in more than 40 countries around the world. We purchase inventory from third party suppliers and manufacture inventory at our plants. This inventory is transferred to our distribution and sales organizations at cost plus a mark-up. This mark-up is referred to as inter-company profit. Each quarter, we review our inventory levels and analyze our inter-company profit to determine the correct amount of inter-company profit to eliminate. Key assumptions are made to estimate product gross margins, the product mix of existing inventory balances and current period shipments. Over time, we refine these estimates as facts and circumstances change. If our estimates require refinement, our results could be impacted. The policies described are consistently applied across all of our operating segments.
Warranty Reserves
One of our key objectives is to provide superior quality products and services. To that end, we provide a standard manufacturer’s warranty typically extending up to 12 months, allowing our customers to seek repair of products under warranty at no additional cost. A corresponding estimated liability for potential warranty costs is also recorded at the time of the sale. We sometimes offer extended warranties in the form of product maintenance services to our customers for purchase. We defer the fair value of this revenue and recognize revenue over the life of the extended warranty period. Refer to
Note 1, "Description of Business and Significant Accounting Policies"
in the Notes to Consolidated Financial Statements in Item 8 of Part II of this Report for further information regarding our accounting for extended warranties.
Future warranty obligation costs are based upon historical factors such as labor rates, average repair time, travel time, number of service calls per machine and cost of replacement parts. When a sale is consummated, the total customer revenue is recognized and the associated warranty liability is recorded based upon the estimated cost to provide the service over the warranty period.
Total warranty costs were
$41 million
in
2015
,
$37 million
in
2014
, and
$39 million
in
2013
. Warranty costs as a percentage of total product revenue was
1.5%
in
2015
,
1.3%
in
2014
, and
1.3%
in
2013
. Historically, the principal factor used to estimate our warranty costs has been service calls per machine. Significant changes in this factor could result in actual warranty costs differing from accrued estimates. Although no near-term changes in our estimated warranty reserves are currently anticipated, in the unlikely event of a significant increase in warranty claims by one or more of our larger customers, costs to fulfill warranty obligations would be higher than provisioned, thereby impacting results.
Goodwill
Goodwill is tested at the reporting unit level for impairment on an annual basis during the fourth quarter or more frequently if certain events occur indicating that the carrying value of goodwill may be impaired. A significant amount of judgment is involved in determining if an indicator of impairment has occurred. Such indicators may include a decline in expected cash flows, a significant adverse change in legal factors or in the business climate, a decision to sell a business, unanticipated competition, or slower growth rates, among others.
In the evaluation of goodwill for impairment, we have the option to perform a qualitative assessment to determine whether further impairment testing is necessary or to perform a quantitative assessment by comparing the fair value of a reporting unit to its carrying amount, including goodwill. Under the qualitative assessment, an entity is not required to calculate the fair value of a reporting unit unless the entity determines that it is more likely than not that its fair value is less than its carrying amount. If under the quantitative assessment the fair value of a reporting unit is less than its carrying amount, then the amount of the impairment loss, if any, must be measured under step two of the impairment analysis. In step two of the analysis, we will record an impairment loss equal to the excess of the carrying value of the reporting unit’s goodwill over its implied fair value. Fair value of the reporting unit is estimated primarily using the income approach, which incorporates the use of discounted cash flow (DCF) analyses. A number of significant assumptions and estimates are involved in the application of the DCF model to forecast operating cash flows, including markets and market shares, sales volumes and prices, costs to produce, tax rates, capital spending, discount rate and working capital changes. Most of these assumptions vary among reporting units. The cash flow forecasts are generally based on approved strategic operating plans.
40
Valuation of Long-lived Assets and Amortizable Other Intangible Assets
We perform impairment tests for our long-lived assets if an event or circumstance indicates that the carrying amount of our long-lived assets may not be recoverable. In response to changes in industry and market conditions, we may also strategically realign our resources and consider restructuring, disposing of, or otherwise exiting businesses. Such activities could result in impairment of our long-lived assets or other intangible assets. We also are subject to the possibility of impairment of long-lived assets arising in the ordinary course of business. We consider the likelihood of impairment if certain events occur indicating that the carrying value of the long-lived assets may be impaired and we may recognize impairment if the carrying amount of a long-lived asset or intangible asset is not recoverable from its undiscounted cash flows. Impairment is measured as the difference between the carrying amount and the fair value of the asset. We use both the income approach and market approach to estimate fair value. Our estimates of fair value are subject to a high degree of judgment since they include a long-term forecast of future operations. Accordingly, any value ultimately derived from our long-lived assets may differ from our estimate of fair value.
Pension, Postretirement and Postemployment Benefits
We sponsor domestic and foreign defined benefit pension and postemployment plans as well as domestic postretirement plans. As a result, we have significant pension, postretirement and postemployment benefit costs, which are developed from actuarial valuations. Actuarial assumptions attempt to anticipate future events and are used in calculating the expense and liability relating to these plans. These factors include assumptions we make about interest rates, expected investment return on plan assets, rate of increase in healthcare costs, total and involuntary turnover rates, and rates of future compensation increases. In addition, our actuarial consultants advise us about subjective factors such as withdrawal rates and mortality rates to use in our valuations. We generally review and update these assumptions on an annual basis at the beginning of each fiscal year. We are required to consider current market conditions, including changes in interest rates, in making these assumptions. The actuarial assumptions that we use may differ materially from actual results due to changing market and economic conditions, higher or lower withdrawal rates, or longer or shorter life spans of participants. These differences may result in a significant impact to the amount of pension, postretirement or postemployment benefits expense we have recorded or may record. Postemployment and postretirement expense impacts all of our segments. Pension expense is excluded from our segment results as it is not included in the evaluation of segment performance. See
Note 14, "Segment Information and Concentrations,"
in the Notes to Consolidated Financial Statements in Item 8 of Part II of this Report for a reconciliation of our segment results to income from operations.
The key assumptions used in developing our
2015
expense were discount rates of
4.0%
for our U.S. pension plan and
3.1%
for our postretirement plan, and an expected return on assets assumption of
4.0%
for our U.S. pension plan in
2015
. The U.S. plan represented
65%
of the pension obligation and 100% of the postretirement medical plan obligation as of
December 31, 2015
.
Holding all other assumptions constant, a 0.25% change in the discount rate used for the U.S. plan would have increased or decreased
2015
ongoing pension expense by approximately $3 million and would have had an immaterial impact on
2015
postretirement expense. A 0.25% change in the expected rate of return on plan assets assumption for the U.S. pension plan would have increased or decreased
2015
ongoing pension expense by approximately $5 million. Our expected return on plan assets has historically been and will likely continue to be material to net income. We intend to use discount rates of
4.3%
and
3.3%
in determining the
2016
U.S. pension and postretirement expense, respectively, and an expected rate of return on assets assumption of
4.3%
for the U.S. pension plan.
We recognize additional changes in the fair value of plan assets and net actuarial gains or losses of our pension plans upon remeasurement, which occurs at least annually in the fourth quarter of each year. The remaining components of pension expense, primarily net service cost, interest cost, and the expected return on plan assets, are recorded on a quarterly basis as ongoing pension expense. While it is required that we review our actuarial assumptions each year at the measurement date, we generally do not change them between measurement dates. We use a measurement date of December 31 for all of our plans. Changes in assumptions or asset values may have a significant effect on the annual measurement of expense or income in the fourth quarter.
The most significant assumption used in developing our
2016
postemployment plan expense is the assumed rate of involuntary turnover of
4.8%
. The involuntary turnover rate is based on historical trends and projections of involuntary turnover in the future. A 0.25% change in the rate of involuntary turnover would have increased or decreased
2015
expense by approximately $1 million. The sensitivity of the assumptions described above is specific to each individual plan and not to our pension, postretirement and postemployment plans in the aggregate.
41
Environmental and Legal Contingencies
Each quarter, we review the status of each claim and legal proceeding and assess our potential financial exposure. If the potential loss from any claim or legal proceeding would be material and is considered probable and the amount can be reasonably estimated, we accrue a liability for the estimated loss. To the extent that the amount of such a probable loss is estimable only by reference to a range of equally likely outcomes, and no amount within the range appears to be a better estimate than any other amount, we accrue the amount at the low end of the range. Because of uncertainties related to these matters, the use of estimates, assumptions and judgments, and external factors beyond our control, accruals are based on the best information available at the time. As additional information becomes available, we reassess the potential liability related to our pending claims and litigation and may revise our estimates. Such revisions in the estimates of the potential liabilities could have a material impact on our results of operations and financial position. Except for the sharing agreement with Appleton Papers Inc. (API) with respect to a particular insurance settlement described in
Note 11, "Commitments and Contingencies,"
in the Notes to Consolidated Financial Statements in Item 8 of Part II of this Report with respect to the Fox River matter, when insurance carriers or third parties have agreed to pay any amounts related to costs, and we believe that it is probable that we can collect such amounts, those amounts are reflected as receivables in our Consolidated Balance Sheet.
The most significant legal contingency impacting our Company relates to the Fox River matter, which is further described in detail in
Note 11, "Commitments and Contingencies,"
in the Notes to Consolidated Financial Statements in Item 8 of Part II of this Report. NCR has been identified as a potentially responsible party (PRP) at the Fox River site in Wisconsin.
As described below and in
Note 11, "Commitments and Contingencies,"
while substantial progress has been made in the Fox River clean-up, the extent of our potential liability continues to be subject to significant uncertainties. These uncertainties include the total clean-up costs for each of the segments of the river; the extent to which clean-up and other costs will be allocated among NCR and other PRPs in the allocation litigation; and the solvency and willingness to pay of other PRPs, co-obligors or indemnitors.
Our net reserve for the Fox River matter as of
December 31, 2015
was approximately
$26 million
as further discussed in
Note 11, "Commitments and Contingencies."
The Company regularly re-evaluates the assumptions used in determining the appropriate reserve for the Fox River matter as additional information becomes available and, when warranted, makes appropriate adjustments.
Income Taxes
We recognize deferred tax assets and liabilities based on the differences between the financial statement carrying amounts and the tax basis of assets and liabilities. The deferred tax assets and liabilities are determined based on the enacted tax rates expected to apply in the periods in which the deferred tax assets or liabilities are anticipated to be settled or realized.
We regularly review our deferred tax assets for recoverability and establish a valuation allowance if it is more likely than not that some portion or all of a deferred tax asset will not be realized. The determination as to whether a deferred tax asset will be realized is made on a jurisdictional basis and is based on the evaluation of positive and negative evidence. This evidence includes historical taxable income, projected future taxable income, the expected timing of the reversal of existing temporary differences and the implementation of tax planning strategies. Projected future taxable income is based on our expected results and assumptions as to the jurisdiction in which the income will be earned. The expected timing of the reversals of existing temporary differences is based on current tax law and our tax methods of accounting.
If we are unable to generate sufficient future taxable income, or if there is a material change in the actual effective tax rates or the time period within which the underlying temporary differences become taxable or deductible, or if the tax laws change unfavorably, then we could be required to increase our valuation allowance against our deferred tax assets, resulting in an increase in our effective tax rate.
We had valuation allowances of
$346 million
as of
December 31, 2015
and
$294 million
as of
December 31, 2014
, related to certain deferred income tax assets, primarily tax loss carryforwards, in jurisdictions where there is uncertainty as to the ultimate realization of a benefit from those tax assets. At
December 31, 2015
, our net deferred tax assets in the U.S. totaled approximately
$456 million
. For the three year period ended December 31, 2015, we had a cumulative net loss from continuing operations before income taxes, which is generally considered a negative indicator of our ability to realize the benefits of those assets. We evaluated the realizability of the U.S. deferred tax assets by weighing positive and negative evidence, including our history of taxable income in the U.S., and the substantial length of time over which our deferred tax assets relating to net operating losses and employee pensions may be realized. Through this assessment, realization of the related benefits was determined to be more likely than not.
42
The Company recognizes the tax benefit from an uncertain tax position only if it is more likely than not that the tax position will be sustained on examination by the taxing authorities, based on the technical merits of the position. The tax benefits recognized in the consolidated financial statements from such a position are measured based on the largest benefit that has a greater than fifty percent likelihood of being realized upon settlement. Interest and penalties related to uncertain tax positions are recognized as part of the provision for income taxes and are accrued beginning in the period that such interest and penalties would be applicable under relevant tax law until such time that the related tax benefits are recognized.
The provision for income taxes may change period-to-period based on non-recurring events, such as the settlement of income tax audits and changes in tax laws, as well as recurring factors including the geographic mix of income before taxes, state and local taxes and the effects of various global income tax strategies. We maintain certain strategic management and operational activities in overseas subsidiaries and our foreign earnings are taxed at rates that are generally lower than in the United States. As of
December 31, 2015
, we did not provide for U.S. federal income taxes or foreign withholding taxes on approximately
$2.4 billion
of undistributed earnings of our foreign subsidiaries as such earnings are expected to be reinvested indefinitely unless it is determined that future repatriation would give rise to little or no net tax costs.
Refer to
Note 8, "Income Taxes,"
in the Notes to Consolidated Financial Statements in Item 8 of Part II of this Report for disclosures related to foreign and domestic pretax income, foreign and domestic income tax (benefit) expense and the effect foreign taxes have on our overall effective tax rate.
Stock-based Compensation
We measure compensation cost for stock awards at fair value and recognize compensation expense over the service period for which awards are expected to vest. We utilize the Black-Scholes option pricing model to estimate the fair value of options at the date of grant, which requires the input of highly subjective assumptions, including expected volatility and expected holding period. We estimate forfeitures for awards granted which are not expected to vest. The estimation of stock awards that will ultimately vest requires judgment, and to the extent that actual results or updated estimates differ from our current estimates, such amounts will be recorded as a cumulative adjustment in the period in which estimates are revised. We consider many factors when estimating expected forfeitures, including types of awards and historical experience. Actual results and future changes in estimates may differ from our current estimates.
In addition, we have performance-based awards that vest only if specific performance conditions are satisfied, typically at the end of a multi-year performance period, and the service requirement is fulfilled. The number of shares that will be earned can vary based on actual performance. No shares will vest if the objectives are not met, and in the event the objectives are exceeded, additional shares will vest up to a maximum amount. The cost of these awards is expensed over the service period based upon management’s estimates of achievement against the performance criteria. Because the actual number of shares to be awarded is not known until the end of the performance period, the actual compensation expense related to these awards could differ from our current expectations.
RECENTLY ISSUED ACCOUNTING PRONOUNCEMENTS
A discussion of recently issued accounting pronouncements is described in
Note 1, “Description of Business and Significant Accounting Policies”
of the Notes to Consolidated Financial Statements in Item 8 of Part II of this Report, and we incorporate by reference such discussion in this MD&A.
|
Item 7A.
|
QUANTITATIVE AND QUALITATIVE DISCLOSURES ABOUT MARKET RISK
|
Market Risk
We are exposed to market risks primarily from changes in foreign currency exchange rates and interest rates. It is our policy to manage our foreign exchange exposure and debt structure in order to manage capital costs, control financial risks and maintain financial flexibility over the long term. In managing market risks, we employ derivatives according to documented policies and procedures, including foreign currency contracts and interest rate swaps. We do not use derivatives for trading or speculative purposes.
43
Foreign Exchange Risk
Since a substantial portion of our operations and revenue occur outside the U.S., and in currencies other than the U.S. Dollar, our results can be significantly impacted by changes in foreign currency exchange rates. We have exposure to approximately 50 functional currencies and are exposed to foreign currency exchange risk with respect to our sales, profits and assets and liabilities denominated in currencies other than the U.S. Dollar. Although we use financial instruments to hedge certain foreign currency risks, we are not fully protected against foreign currency fluctuations and our reported results of operations could be affected by changes in foreign currency exchange rates. To manage our exposures and mitigate the impact of currency fluctuations on the operations of our foreign subsidiaries, we hedge our main transactional exposures through the use of foreign exchange forward and option contracts. These foreign exchange contracts are designated as highly effective cash flow hedges. This is primarily done through the hedging of foreign currency denominated inter-company inventory purchases by the marketing units. All of these transactions are forecasted. We also use derivatives not designated as hedging instruments consisting primarily of forward contracts to hedge foreign currency denominated balance sheet exposures. For these derivatives we recognize gains and losses in the same period as the remeasurement losses and gains of the related foreign currency-denominated exposures.
We utilize non-exchange traded financial instruments, such as foreign exchange forward and option contracts, that we purchase exclusively from highly rated financial institutions. We record these contracts on our balance sheet at fair market value based upon market price quotations from the financial institutions. We do not enter into non-exchange traded contracts that require the use of fair value estimation techniques, but if we did, they could have a material impact on our financial results.
For purposes of analyzing potential risk, we use sensitivity analysis to quantify potential impacts that market rate changes may have on the fair values of our hedge portfolio related to firmly committed or forecasted transactions. The sensitivity analysis represents the hypothetical changes in value of the hedge position and does not reflect the related gain or loss on the forecasted underlying transaction. A 10% appreciation or depreciation in the value of the U.S. Dollar against foreign currencies from the prevailing market rates would have resulted in a corresponding increase or decrease of
$6 million
as of
December 31, 2015
in the fair value of the hedge portfolio. The Company expects that any increase or decrease in the fair value of the portfolio would be substantially offset by increases or decreases in the underlying exposures being hedged.
The U.S. Dollar was significantly stronger in
2015
compared to
2014
based on comparable weighted averages for our functional currencies. This had an
unfavorable
impact of
6%
on
2015
revenue versus
2014
revenue. This excludes the effects of our hedging activities and, therefore, does not reflect the actual impact of fluctuations in exchange rates on our operating income.
Interest Rate Risk
We are subject to interest rate risk principally in relation to variable-rate debt. We use derivative financial instruments to manage exposure to fluctuations in interest rates in connection with our risk management policies. We have entered into an interest rate swap for a portion of the term loans under our senior secured credit facility. The interest rate swap effectively converts the designated portion of the term loans from a variable interest rate to a fixed interest rate instrument. As of
December 31, 2015
, approximately 79% of our borrowings were effectively on a fixed rate basis, and the net fair value of the interest rate swap was a liability of
$3 million
.
The potential gain in fair value of the swap from a hypothetical 100 basis point increase in interest rates would be approximately $2 million as of
December 31, 2015
. The increase in pre-tax interest expense from a hypothetical 100 basis point increase in variable interest rates (including the impact of the interest rate swap) would be approximately $9 million in
2015
.
Concentrations of Credit Risk
We are potentially subject to concentrations of credit risk on accounts receivable and financial instruments, such as hedging instruments and cash and cash equivalents. Credit risk includes the risk of nonperformance by counterparties. The maximum potential loss may exceed the amount recognized on the balance sheet. Exposure to credit risk is managed through credit approvals, credit limits, selecting major international financial institutions as counterparties to hedging transactions and monitoring procedures. Our business often involves large transactions with customers for which we do not require collateral. If one or more of those customers were to default in its obligations under applicable contractual arrangements, we could be exposed to potentially significant losses. Moreover, a prolonged downturn in the global economy could have an adverse impact on the ability of our customers to pay their obligations on a timely basis. We believe that the reserves for potential losses are adequate. As of
December 31, 2015
, we did not have any significant concentration of credit risk related to financial instruments.
44
Index to Financial Statements and Supplemental Data
|
Page
|
|
45
Report of Independent Registered Public Accounting Firm
To the Board of Directors and Stockholders of NCR Corporation:
In our opinion, the consolidated financial statements listed in the index appearing under Item 15(a)(1) present fairly, in all material respects, the financial position of NCR Corporation and its subsidiaries at December 31, 2015 and 2014, and the results of their operations and their cash flows for each of the three years in the period ended December 31, 2015
in conformity with accounting principles generally accepted in the United States of America. In addition, in our opinion, the financial statement schedule listed in the index appearing under Item 15(a)(2)
presents fairly, in all material respects, the information set forth therein when read in conjunction with the related consolidated financial statements. Also in our opinion, the Company maintained, in all material respects, effective internal control over financial reporting as of December 31, 2015, based on criteria established in
Internal Control - Integrated Framework (2013)
issued by the Committee of Sponsoring Organizations of the Treadway Commission (COSO). The Company's management is responsible for these financial statements and financial statement schedule, for maintaining effective internal control over financial reporting and for its assessment of the effectiveness of internal control over financial reporting, included in Management's Report on Internal Control over Financial Reporting appearing under Item 9A. Our responsibility is to express opinions on these financial statements, on the financial statement schedule, and on the Company's internal control over financial reporting based on our integrated audits. We conducted our audits in accordance with the standards of the Public Company Accounting Oversight Board (United States). Those standards require that we plan and perform the audits to obtain reasonable assurance about whether the financial statements are free of material misstatement and whether effective internal control over financial reporting was maintained in all material respects. Our audits of the financial statements included examining, on a test basis, evidence supporting the amounts and disclosures in the financial statements, assessing the accounting principles used and significant estimates made by management, and evaluating the overall financial statement presentation. Our audit of internal control over financial reporting included obtaining an understanding of internal control over financial reporting, assessing the risk that a material weakness exists, and testing and evaluating the design and operating effectiveness of internal control based on the assessed risk. Our audits also included performing such other procedures as we considered necessary in the circumstances. We believe that our audits provide a reasonable basis for our opinions.
As disclosed in Notes 1 and 8 to the consolidated financial statements, NCR Corporation changed the classification and presentation of deferred income taxes in 2015.
A company's internal control over financial reporting is a process designed to provide reasonable assurance regarding the reliability of financial reporting and the preparation of financial statements for external purposes in accordance with generally accepted accounting principles. A company's internal control over financial reporting includes those policies and procedures that (i) pertain to the maintenance of records that, in reasonable detail, accurately and fairly reflect the transactions and dispositions of the assets of the company; (ii) provide reasonable assurance that transactions are recorded as necessary to permit preparation of financial statements in accordance with generally accepted accounting principles, and that receipts and expenditures of the company are being made only in accordance with authorizations of management and directors of the company; and (iii) provide reasonable assurance regarding prevention or timely detection of unauthorized acquisition, use, or disposition of the company's assets that could have a material effect on the financial statements.
Because of its inherent limitations, internal control over financial reporting may not prevent or detect misstatements. Also, projections of any evaluation of effectiveness to future periods are subject to the risk that controls may become inadequate because of changes in conditions, or that the degree of compliance with the policies or procedures may deteriorate.
/s/ PricewaterhouseCoopers LLP
Atlanta, Georgia
February 26, 2016
46
NCR Corporation
|
For the years ended December 31, (in millions, except per share amounts)
|
2015
|
2014
|
2013
|
|||||||||
|
Product revenue
|
$
|
2,711
|
|
$
|
2,892
|
|
$
|
2,912
|
|
|||
|
Service revenue
|
3,662
|
|
3,699
|
|
3,211
|
|
||||||
|
Total revenue
|
6,373
|
|
6,591
|
|
6,123
|
|
||||||
|
Cost of products
|
2,072
|
|
2,153
|
|
2,152
|
|
||||||
|
Cost of services
|
2,832
|
|
2,706
|
|
2,231
|
|
||||||
|
Selling, general and administrative expenses
|
1,042
|
|
1,012
|
|
871
|
|
||||||
|
Research and development expenses
|
230
|
|
263
|
|
203
|
|
||||||
|
Restructuring-related charges
|
62
|
|
104
|
|
—
|
|
||||||
|
Total operating expenses
|
6,238
|
|
6,238
|
|
5,457
|
|
||||||
|
Income from operations
|
135
|
|
353
|
|
666
|
|
||||||
|
Interest expense
|
(173
|
)
|
(181
|
)
|
(103
|
)
|
||||||
|
Other (expense), net
|
(57
|
)
|
(35
|
)
|
(9
|
)
|
||||||
|
(Loss) income from continuing operations before income taxes
|
(95
|
)
|
137
|
|
554
|
|
||||||
|
Income tax expense (benefit)
|
55
|
|
(48
|
)
|
98
|
|
||||||
|
(Loss) income from continuing operations
|
(150
|
)
|
185
|
|
456
|
|
||||||
|
(Loss) income from discontinued operations, net of tax
|
(24
|
)
|
10
|
|
(9
|
)
|
||||||
|
Net (loss) income
|
(174
|
)
|
195
|
|
447
|
|
||||||
|
Net income attributable to noncontrolling interests
|
4
|
|
4
|
|
4
|
|
||||||
|
Net (loss) income attributable to NCR
|
$
|
(178
|
)
|
$
|
191
|
|
$
|
443
|
|
|||
|
Amounts attributable to NCR common stockholders:
|
|
|
||||||||||
|
(Loss) income from continuing operations
|
$
|
(154
|
)
|
$
|
181
|
|
$
|
452
|
|
|||
|
Series A convertible preferred stock dividends
|
(4
|
)
|
—
|
|
—
|
|
||||||
|
(Loss) income from continuing operations attributable to NCR common stockholders
|
(158
|
)
|
181
|
|
452
|
|
||||||
|
(Loss) income from discontinued operations, net of tax
|
(24
|
)
|
10
|
|
(9
|
)
|
||||||
|
Net (loss) income attributable to NCR common stockholders
|
$
|
(182
|
)
|
$
|
191
|
|
$
|
443
|
|
|||
|
(Loss) income per share attributable to NCR common stockholders:
|
||||||||||||
|
(Loss) income per common share from continuing operations
|
||||||||||||
|
Basic
|
$
|
(0.94
|
)
|
$
|
1.08
|
|
$
|
2.73
|
|
|||
|
Diluted
|
$
|
(0.94
|
)
|
$
|
1.06
|
|
$
|
2.67
|
|
|||
|
Net (loss) income per common share
|
|
|
||||||||||
|
Basic
|
$
|
(1.09
|
)
|
$
|
1.14
|
|
$
|
2.68
|
|
|||
|
Diluted
|
$
|
(1.09
|
)
|
$
|
1.12
|
|
$
|
2.62
|
|
|||
|
Weighted average common shares outstanding
|
||||||||||||
|
Basic
|
167.6
|
|
167.9
|
|
165.4
|
|
||||||
|
Diluted
|
167.6
|
|
171.2
|
|
169.3
|
|
||||||
The accompanying notes are an integral part of the Consolidated Financial Statements.
47
NCR Corporation
Consolidated Statements of Comprehensive Income
|
For the years ended December 31 (in millions)
|
2015
|
2014
|
2013
|
||||||||
|
Net (loss) income
|
$
|
(174
|
)
|
$
|
195
|
|
$
|
447
|
|
||
|
Other comprehensive income (loss):
|
|||||||||||
|
Currency translation adjustments
|
|||||||||||
|
Currency translation adjustments
|
(50
|
)
|
(76
|
)
|
(53
|
)
|
|||||
|
Derivatives
|
|||||||||||
|
Unrealized gain (loss) on derivatives
|
10
|
|
(1
|
)
|
2
|
|
|||||
|
(Gains) losses on derivatives arising during the period
|
(7
|
)
|
4
|
|
6
|
|
|||||
|
Less income tax expense
|
(1
|
)
|
(1
|
)
|
(3
|
)
|
|||||
|
Securities
|
|||||||||||
|
Unrealized gain on securities
|
—
|
|
—
|
|
3
|
|
|||||
|
Gains on securities arising during the period
|
—
|
|
(4
|
)
|
—
|
|
|||||
|
Less income tax benefit (expense)
|
—
|
|
1
|
|
(1
|
)
|
|||||
|
Employee benefit plans
|
|||||||||||
|
Prior service benefit (cost)
|
9
|
|
(16
|
)
|
(5
|
)
|
|||||
|
Amortization of prior service benefit
|
(21
|
)
|
(20
|
)
|
(30
|
)
|
|||||
|
Net gain arising during the period
|
43
|
|
8
|
|
82
|
|
|||||
|
Amortization of actuarial loss
|
2
|
|
—
|
|
8
|
|
|||||
|
Less income tax (expense) benefit
|
(2
|
)
|
4
|
|
(17
|
)
|
|||||
|
Other comprehensive loss
|
(17
|
)
|
(101
|
)
|
(8
|
)
|
|||||
|
Total comprehensive (loss) income
|
(191
|
)
|
94
|
|
439
|
|
|||||
|
Less comprehensive income attributable to noncontrolling interests:
|
|||||||||||
|
Net income
|
4
|
|
4
|
|
4
|
|
|||||
|
Currency translation adjustments
|
(3
|
)
|
(3
|
)
|
(7
|
)
|
|||||
|
Amounts attributable to noncontrolling interests
|
1
|
|
1
|
|
(3
|
)
|
|||||
|
Comprehensive (loss) income attributable to NCR common stockholders
|
$
|
(192
|
)
|
$
|
93
|
|
$
|
442
|
|
||
The accompanying notes are an integral part of the Consolidated Financial Statements.
48
NCR Corporation
|
As of December 31 (in millions except per share amounts)
|
2015
|
2014
|
||||
|
Assets
|
||||||
|
Current assets
|
||||||
|
Cash and cash equivalents
|
$
|
328
|
|
511
|
|
|
|
Accounts receivable, net
|
1,251
|
|
1,404
|
|
||
|
Inventories
|
643
|
|
669
|
|
||
|
Other current assets
|
327
|
|
504
|
|
||
|
Total current assets
|
2,549
|
|
3,088
|
|
||
|
Property, plant and equipment, net
|
322
|
|
396
|
|
||
|
Goodwill
|
2,733
|
|
2,760
|
|
||
|
Intangibles, net
|
798
|
|
926
|
|
||
|
Prepaid pension cost
|
130
|
|
551
|
|
||
|
Deferred income taxes
|
582
|
|
349
|
|
||
|
Other assets
|
521
|
|
496
|
|
||
|
Total assets
|
$
|
7,635
|
|
8,566
|
|
|
|
Liabilities and stockholders’ equity
|
||||||
|
Current liabilities
|
||||||
|
Short-term borrowings
|
$
|
13
|
|
187
|
|
|
|
Accounts payable
|
657
|
|
712
|
|
||
|
Payroll and benefits liabilities
|
189
|
|
196
|
|
||
|
Deferred service revenue and customer deposits
|
476
|
|
494
|
|
||
|
Other current liabilities
|
446
|
|
481
|
|
||
|
Total current liabilities
|
1,781
|
|
2,070
|
|
||
|
Long-term debt
|
3,239
|
|
3,431
|
|
||
|
Pension and indemnity plan liabilities
|
696
|
|
705
|
|
||
|
Postretirement and postemployment benefits liabilities
|
133
|
|
170
|
|
||
|
Income tax accruals
|
167
|
|
181
|
|
||
|
Other liabilities
|
79
|
|
111
|
|
||
|
Total liabilities
|
6,095
|
|
6,668
|
|
||
|
Commitments and Contingencies (Note 11)
|
|
|
||||
|
Redeemable noncontrolling interest
|
16
|
|
15
|
|
||
|
Series A convertible preferred stock: par value $0.01 per share, 3.0 shares authorized, 0.8 shares issued and outstanding as of December 31, 2015; no shares authorized or issued as of December 31, 2014; redemption amount and liquidation preference of $824 and $0 as of December 31, 2015 and December 31, 2014, respectively
|
798
|
|
—
|
|
||
|
Stockholders’ equity
|
||||||
|
NCR stockholders’ equity
|
||||||
|
Preferred stock: par value $0.01 per share, 100.0 shares authorized, no shares issued and outstanding as of December 31, 2015 and December 31, 2014
|
—
|
|
—
|
|
||
|
Common stock: par value $0.01 per share, 500.0 shares authorized, 133.0 and 168.6 shares issued and outstanding as of December 31, 2015 and December 31, 2014, respectively
|
1
|
|
2
|
|
||
|
Paid-in capital
|
—
|
|
442
|
|
||
|
Retained earnings
|
869
|
|
1,563
|
|
||
|
Accumulated other comprehensive loss
|
(150
|
)
|
(136
|
)
|
||
|
Total NCR stockholders’ equity
|
720
|
|
1,871
|
|
||
|
Noncontrolling interests in subsidiaries
|
6
|
|
12
|
|
||
|
Total stockholders’ equity
|
726
|
|
1,883
|
|
||
|
Total liabilities and stockholders’ equity
|
7,635
|
|
8,566
|
|
||
The accompanying notes are an integral part of the Consolidated Financial Statements.
49
NCR Corporation
|
For the years ended December 31 (in millions)
|
2015
|
2014
|
2013
|
||||||||
|
Operating activities
|
|||||||||||
|
Net (loss) income
|
$
|
(174
|
)
|
$
|
195
|
|
$
|
447
|
|
||
|
Adjustments to reconcile net (loss) income to net cash provided by operating activities:
|
|||||||||||
|
Loss (income) from discontinued operations
|
24
|
|
(10
|
)
|
9
|
|
|||||
|
Depreciation and amortization
|
308
|
|
284
|
|
208
|
|
|||||
|
Stock-based compensation expense
|
42
|
|
31
|
|
41
|
|
|||||
|
Deferred income taxes
|
24
|
|
(125
|
)
|
3
|
|
|||||
|
Gain on sale of property, plant and equipment and other assets
|
(2
|
)
|
(5
|
)
|
(14
|
)
|
|||||
|
Impairment of long-lived and other assets
|
63
|
|
16
|
|
—
|
|
|||||
|
Changes in assets and liabilities:
|
|||||||||||
|
Receivables
|
28
|
|
(104
|
)
|
(136
|
)
|
|||||
|
Inventories
|
(46
|
)
|
77
|
|
10
|
|
|||||
|
Current payables and accrued expenses
|
8
|
|
70
|
|
21
|
|
|||||
|
Deferred service revenue and customer deposits
|
19
|
|
1
|
|
36
|
|
|||||
|
Employee benefit plans
|
384
|
|
105
|
|
(397
|
)
|
|||||
|
Other assets and liabilities
|
3
|
|
(11
|
)
|
53
|
|
|||||
|
Net cash provided by operating activities
|
681
|
|
524
|
|
281
|
|
|||||
|
Investing activities
|
|||||||||||
|
Expenditures for property, plant and equipment
|
(79
|
)
|
(118
|
)
|
(116
|
)
|
|||||
|
Proceeds from sales of property, plant and equipment
|
19
|
|
1
|
|
10
|
|
|||||
|
Additions to capitalized software
|
(150
|
)
|
(140
|
)
|
(110
|
)
|
|||||
|
Business acquisitions, net
|
—
|
|
(1,647
|
)
|
(780
|
)
|
|||||
|
Changes in restricted cash
|
—
|
|
1,114
|
|
(1,114
|
)
|
|||||
|
Other investing activities, net
|
1
|
|
2
|
|
5
|
|
|||||
|
Net cash used in investing activities
|
(209
|
)
|
(788
|
)
|
(2,105
|
)
|
|||||
|
Financing activities
|
|||||||||||
|
Short term borrowings, net
|
8
|
|
—
|
|
(1
|
)
|
|||||
|
Payments on term credit facilities
|
(383
|
)
|
(37
|
)
|
(35
|
)
|
|||||
|
Borrowings on term credit facilities
|
—
|
|
250
|
|
329
|
|
|||||
|
Payments on revolving credit facilities
|
(1,694
|
)
|
(1,050
|
)
|
(1,009
|
)
|
|||||
|
Borrowings on revolving credit facilities
|
1,698
|
|
1,146
|
|
1,009
|
|
|||||
|
Proceeds from bond offerings
|
—
|
|
—
|
|
1,100
|
|
|||||
|
Debt issuance costs
|
—
|
|
(5
|
)
|
(36
|
)
|
|||||
|
Series A convertible preferred stock issuance, net of issuance costs of $26 million
|
794
|
|
—
|
|
—
|
|
|||||
|
Tender offer, including costs of $5 million
|
(1,005
|
)
|
—
|
|
—
|
|
|||||
|
Tax withholding payments on behalf of employees
|
(16
|
)
|
(28
|
)
|
(30
|
)
|
|||||
|
Proceeds from employee stock plans
|
15
|
|
13
|
|
57
|
|
|||||
|
Purchase of noncontrolling interest
|
—
|
|
—
|
|
(24
|
)
|
|||||
|
Other financing activities
|
—
|
|
(5
|
)
|
(3
|
)
|
|||||
|
Net cash (used in) provided by financing activities
|
(583
|
)
|
284
|
|
1,357
|
|
|||||
|
Cash flows from discontinued operations
|
|||||||||||
|
Net cash used in discontinued operations operating activities
|
(43
|
)
|
(1
|
)
|
(52
|
)
|
|||||
|
Effect of exchange rate changes on cash and cash equivalents
|
(29
|
)
|
(36
|
)
|
(22
|
)
|
|||||
|
Decrease in cash and cash equivalents
|
(183
|
)
|
(17
|
)
|
(541
|
)
|
|||||
|
Cash and cash equivalents at beginning of period
|
$
|
511
|
|
$
|
528
|
|
$
|
1,069
|
|
||
|
Cash and cash equivalents at end of period
|
$
|
328
|
|
$
|
511
|
|
$
|
528
|
|
||
|
Supplemental data
|
|||||||||||
|
Cash paid during the year for:
|
|||||||||||
|
Income taxes
|
$
|
60
|
|
$
|
75
|
|
$
|
70
|
|
||
|
Interest
|
$
|
163
|
|
$
|
170
|
|
$
|
71
|
|
||
The accompanying notes are an integral part of the Consolidated Financial Statements.
50
NCR Corporation
Consolidated Statements of Changes in Stockholders' Equity
|
NCR Stockholders
|
|||||||||||||||||||||||||||
|
Common Stock
|
Accumulated Other Comprehensive (Loss) Income
|
Non-Redeemable Noncontrolling Interests in Subsidiaries
|
|||||||||||||||||||||||||
|
in millions
|
Shares
|
Amount
|
Paid-in Capital
|
Retained Earnings
|
Total
|
||||||||||||||||||||||
|
December 31, 2012
|
163
|
|
$
|
2
|
|
$
|
358
|
|
$
|
929
|
|
$
|
(37
|
)
|
$
|
30
|
|
$
|
1,282
|
|
|||||||
|
Comprehensive income (loss):
|
|||||||||||||||||||||||||||
|
Net income (loss)
|
—
|
|
—
|
|
—
|
|
443
|
|
—
|
|
3
|
|
446
|
|
|||||||||||||
|
Other comprehensive (loss) income
|
—
|
|
—
|
|
—
|
|
—
|
|
(1
|
)
|
(5
|
)
|
(6
|
)
|
|||||||||||||
|
Total comprehensive (loss) income
|
—
|
|
—
|
|
—
|
|
443
|
|
(1
|
)
|
(2
|
)
|
440
|
|
|||||||||||||
|
Employee stock purchase and stock compensation plans
|
4
|
|
—
|
|
83
|
|
—
|
|
—
|
|
—
|
|
83
|
|
|||||||||||||
|
Purchase of non-controlling shares from minority interest
|
—
|
|
—
|
|
(8
|
)
|
—
|
|
—
|
|
(20
|
)
|
(28
|
)
|
|||||||||||||
|
Acquisition of noncontrolling interests
|
—
|
|
—
|
|
—
|
|
—
|
|
—
|
|
9
|
|
9
|
|
|||||||||||||
|
Dividend distribution to minority shareholder
|
—
|
|
—
|
|
—
|
|
—
|
|
—
|
|
(3
|
)
|
(3
|
)
|
|||||||||||||
|
December 31, 2013
|
167
|
|
$
|
2
|
|
$
|
433
|
|
$
|
1,372
|
|
$
|
(38
|
)
|
$
|
14
|
|
$
|
1,783
|
|
|||||||
|
Comprehensive income (loss):
|
|
|
|
|
|
|
|
||||||||||||||||||||
|
Net income (loss)
|
—
|
|
—
|
|
—
|
|
191
|
|
—
|
|
1
|
|
192
|
|
|||||||||||||
|
Other comprehensive (loss) income
|
—
|
|
—
|
|
—
|
|
—
|
|
(98
|
)
|
(1
|
)
|
(99
|
)
|
|||||||||||||
|
Total comprehensive income (loss)
|
—
|
|
—
|
|
—
|
|
191
|
|
(98
|
)
|
—
|
|
93
|
|
|||||||||||||
|
Employee stock purchase and stock compensation plans
|
2
|
|
—
|
|
9
|
|
—
|
|
—
|
|
—
|
|
9
|
|
|||||||||||||
|
Dividend distribution to minority shareholder
|
—
|
|
—
|
|
—
|
|
—
|
|
—
|
|
(2
|
)
|
(2
|
)
|
|||||||||||||
|
December 31, 2014
|
169
|
|
$
|
2
|
|
$
|
442
|
|
$
|
1,563
|
|
$
|
(136
|
)
|
$
|
12
|
|
$
|
1,883
|
|
|||||||
|
Comprehensive income (loss):
|
|
|
|
|
|
|
|
||||||||||||||||||||
|
Net income (loss)
|
—
|
|
—
|
|
—
|
|
(178
|
)
|
—
|
|
2
|
|
(176
|
)
|
|||||||||||||
|
Other comprehensive (loss) income
|
—
|
|
—
|
|
—
|
|
—
|
|
(14
|
)
|
(2
|
)
|
(16
|
)
|
|||||||||||||
|
Total comprehensive income (loss)
|
—
|
|
—
|
|
—
|
|
(178
|
)
|
(14
|
)
|
—
|
|
(192
|
)
|
|||||||||||||
|
Employee stock purchase and stock compensation plans
|
1
|
|
—
|
|
50
|
|
—
|
|
—
|
|
—
|
|
50
|
|
|||||||||||||
|
Repurchase of Company common stock
|
(37
|
)
|
(1
|
)
|
(492
|
)
|
(512
|
)
|
—
|
|
—
|
|
(1,005
|
)
|
|||||||||||||
|
Series A convertible preferred stock dividends
|
—
|
|
—
|
|
—
|
|
(4
|
)
|
—
|
|
—
|
|
(4
|
)
|
|||||||||||||
|
Sale of noncontrolling interest
|
—
|
|
—
|
|
—
|
|
—
|
|
—
|
|
(6
|
)
|
(6
|
)
|
|||||||||||||
|
December 31, 2015
|
133
|
|
$
|
1
|
|
$
|
—
|
|
$
|
869
|
|
$
|
(150
|
)
|
$
|
6
|
|
$
|
726
|
|
|||||||
The accompanying notes are an integral part of the Consolidated Financial Statements.
51
NCR Corporation
Notes to Consolidated Financial Statements
1. DESCRIPTION OF BUSINESS AND SIGNIFICANT ACCOUNTING POLICIES
Description of Business
NCR Corporation (NCR or the Company, also referred to as “we,” “us” or “our”) and its subsidiaries provide innovative products and services that are designed to enable NCR’s customers to connect, interact and transact with their customers and enhance their customer relationships by addressing consumer demand for convenience, value and individual service. NCR’s portfolio of self-service and assisted-service solutions serve a range of customers in the financial services, retail, hospitality, travel and telecommunications and technology industries and include software and hardware solutions for automated teller machines (ATMs) and bank branches, retail and hospitality point of sale applications and devices, and self-service kiosks and software applications that can be used by consumers to enable them to interact with businesses from their computer or mobile device. NCR complements these product solutions by offering a complete portfolio of services to support both NCR and third party solutions. NCR also resells third party networking products and provides related service offerings in the telecommunications and technology sector.
NCR’s solutions are built on a foundation of long-established industry knowledge and consulting expertise, value-added software and hardware technology, global customer support services, and a complete line of business consumables and specialty media products.
Evaluation of Subsequent Events
The Company evaluated subsequent events through the date that our Consolidated Financial Statements were issued. Except as described below, no matters were identified that required adjustment of the Consolidated Financial Statements or additional disclosure.
On January 1, 2016, NCR began management of its business on a solution basis, changing from the previous model of management on a line of business basis. In accordance with accounting principles generally accepted in the United States of America (GAAP), the Company expects to report its results for product segments beginning in the first quarter of 2016. The new model is intended to drive improved execution on our software-driven business model, while allowing other revenue streams to contribute and add value towards our end-to-end solutions.
On January 6, 2016, NCR announced the signing of a definitive agreement under which Atlas Holdings LLC has agreed to acquire the assets of NCR's Interactive Printer Solutions (IPS) business. The transaction has been approved by the NCR Board of Directors and is expected to close in 2016, subject to satisfaction of various customary closing conditions.
Use of Estimates
The preparation of financial statements in accordance with GAAP requires management to make estimates and judgments that affect the reported amounts of assets and liabilities, the disclosure of contingent assets and liabilities at the date of the financial statements, and revenue and expenses during the period reported. Actual results could differ from those estimates.
Out of Period Adjustments
During the third quarter of 2014, the Company recorded
$5 million
in income tax expense related to an error in the calculation of foreign income taxable in the U.S. for 2013. The Company determined the impact of this error was not material to the previously filed annual or interim financial statements and the effect of correcting this error was not material to the 2014 annual or interim financial statements.
During the fourth quarter of 2013, the Company recorded a
$15 million
income tax benefit related to the release of a valuation allowance on specific deferred tax assets in NCR’s subsidiary in Japan that should have been released in a prior period. The Company determined the impact of this error was not material to the annual or interim financial statements of previous periods and the effect of correcting this error was not material to the 2013 annual financial statements.
Basis of Consolidation
The consolidated financial statements include the accounts of NCR and its majority-owned subsidiaries. Long-term investments in affiliated companies in which NCR owns between 20% and 50%, and therefore, exercises significant influence, but which it does not control, are accounted for using the equity method. Investments in which NCR does not exercise significant influence (generally, when NCR has an investment of less than 20% and no significant influence, such as representation on the investee’s board of directors) are accounted for using the cost method. All significant inter-company transactions and accounts have been eliminated. In addition, the Company is required to determine whether it is the primary beneficiary of economic income or losses that may be generated by variable interest entities in which the Company has such an interest. In circumstances where the Company determined it is the primary beneficiary, consolidation of that entity would be required. For the periods presented, no variable interest entities have been consolidated.
52
Reclassifications
Certain prior-period amounts have been reclassified in the accompanying Consolidated Financial Statements and Notes thereto in order to conform to the current period presentation.
Revenue Recognition
The Company records revenue, net of taxes, when it is realized, or realizable, and earned. The Company considers these criteria met when persuasive evidence of an arrangement exists, the products or services have been provided to the customer, the sales price is fixed or determinable, and collectability is reasonably assured. For product sales, delivery is deemed to have occurred when the customer has assumed risk of loss of the goods sold and all performance obligations are complete. For services sales, revenue is recognized as the services are provided or ratably over the service period, or, if applicable, after customer acceptance of the services.
NCR frequently enters into multiple-element arrangements with its customers including hardware, software, professional consulting services, transaction services and maintenance support services. For arrangements involving multiple deliverables, when deliverables include software and non-software products and services, NCR evaluates and separates each deliverable to determine whether it represents a separate unit of accounting based on the following criteria: (a) whether the delivered item has value to the customer on a stand-alone basis; and (b) if the contract includes a general right of return relative to the delivered item, whether delivery or performance of the undelivered items is considered probable and substantially in the control of NCR.
Consideration is allocated to each unit of accounting based on the units' relative selling prices. In such circumstances, the Company uses a hierarchy to determine the selling price to be used for allocating revenue to each deliverable: (i) vendor-specific objective evidence of selling price (VSOE); (ii) third-party evidence of selling price (TPE); and (iii) best estimate of selling price (BESP). VSOE generally exists only when the Company sells the deliverable separately and is the price actually charged by the Company for that deliverable. VSOE is established for our software maintenance and software-related professional services. We use TPE to establish selling prices for our installation and transaction services. The Company uses BESP to allocate revenue when we are unable to establish VSOE or TPE of selling price. BESP is used for hardware maintenance and elements such as products that are not consistently priced within a narrow range. The Company determines BESP for a deliverable by considering multiple factors including product class, geography, average discount, and management's historical pricing practices. Amounts allocated to the delivered hardware and software elements are recognized at the time of sale, provided the other conditions for revenue recognition have been met. Amounts allocated to the undelivered maintenance and other services elements are recognized as the services are provided or on a straight-line basis over the service period. In certain instances, customer acceptance is required prior to the passage of title and risk of loss of the delivered products. In such cases, revenue is not recognized until the customer acceptance is obtained. Delivery and acceptance generally occur in the same reporting period.
In situations where NCR's solutions contain software that is more than incidental, revenue related to the software and software-related elements is recognized in accordance with authoritative guidance on software revenue recognition. For the software and software-related elements of such transactions, revenue is allocated based on the relative fair value of each element, and fair value is determined by VSOE. If the Company cannot objectively determine the fair value of any undelivered element included in such multiple-element arrangements, the Company defers revenue until all elements are delivered and services have been performed, or until fair value can objectively be determined for any remaining undelivered elements. When the fair value of a delivered element has not been established, but fair value evidence exists for the undelivered elements, the Company uses the residual method to recognize revenue. Under the residual method, the fair value of the undelivered elements is deferred and the remaining portion of the arrangement fee is allocated to the delivered elements and is recognized as revenue.
For certain of NCR’s long-term contracts, the Company utilizes a percentage-of-completion accounting method, which requires estimates of future revenue and costs over the full term of product and/or service delivery. Estimated losses, if any, on long-term projects are recognized as soon as such losses become known.
NCR's customers may request that delivery and passage of title and risk of loss occur on a bill and hold basis. For
the years ended
December 31, 2015
,
2014
, and
2013
, the revenue recognized from bill and hold transactions approximated less than
1%
of total revenue.
In addition to the standard product warranty, the Company periodically offers extended warranties to its customers in the form of product maintenance services. For contracts that are not separately priced but include product maintenance, the Company defers revenue at an amount based on the selling price, using objective and reliable evidence, and recognizes the deferred revenue over the service term. For separately priced product maintenance contracts, NCR defers the stated amount of the separately priced contract and recognizes the deferred revenue ratably over the service term.
53
Warranty and Sales Returns
Provisions for product warranties and sales returns and allowances are recorded in the period in which NCR becomes obligated to honor the related right, which generally is the period in which the related product revenue is recognized. The Company accrues warranty reserves based upon historical factors such as labor rates, average repair time, travel time, number of service calls per machine and cost of replacement parts. When a sale is consummated, a warranty reserve is recorded based upon the estimated cost to provide the service over the warranty period. The Company accrues sales returns and allowances using percentages of revenue to reflect the Company’s historical average of sales return claims.
Research and Development Costs
Research and development costs primarily include payroll and benefit-related costs, contractor fees, facilities costs, infrastructure costs, and administrative expenses directly related to research and development support and are expensed as incurred, except certain software development costs are capitalized after technological feasibility of the software is established.
Advertising
Advertising costs are recognized in selling, general and administrative expenses when incurred.
Shipping and Handling
Costs related to shipping and handling are included in cost of products in the Consolidated Statements of Operations.
Stock Compensation
Stock-based compensation represents the costs related to share-based awards granted to employees and non-employee directors. The Company’s outstanding stock-based compensation awards are classified as equity. The Company measures stock-based compensation cost at the grant date, based on the estimated fair value of the award and recognizes the cost over the requisite service period. See
Note 9 "Stock Compensation Plans"
for further information on NCR’s stock-based compensation plans.
Income Taxes
Income tax expense is provided based on income before income taxes. Deferred income taxes reflect the impact of temporary differences between assets and liabilities recognized for financial reporting purposes and such amounts recognized for tax purposes. These deferred taxes are determined based on the enacted tax rates expected to apply in the periods in which the deferred assets or liabilities are expected to be settled or realized. NCR records valuation allowances related to its deferred income tax assets when it is more likely than not that some portion or all of the deferred income tax assets will not be realized.
As of December 31, 2014, future income tax benefits and payables are presented as current and non-current. As of December 31, 2015, NCR has classified all deferred taxes as non-current based on an early adoption of Accounting Standards Update 2015-17,
Income Taxes: Balance Sheet Classification of Deferred Taxes
, applied prospectively. For both periods, future income tax benefits and payables within the same tax paying component of a particular jurisdiction are offset for presentation in the Consolidated Balance Sheets.
The Company recognizes the tax benefit from an uncertain tax position only if it is more likely than not that the tax position will be sustained on examination by the taxing authorities, based on the technical merits of the position. The tax benefits recognized in the consolidated financial statements from such a position are measured based on the largest benefit that has a greater than fifty percent likelihood of being sustained upon examination by authorities. Interest and penalties related to uncertain tax positions are recognized as part of the provision for income taxes and are accrued beginning in the period that such interest and penalties would be applicable under relevant tax law and until such time that the related tax benefits are recognized.
Earnings Per Share
Basic earnings per share (EPS) is calculated by dividing net income, less any dividends, accretion or decretion, redemption or induced conversion on our Series A Convertible Preferred Stock, by the weighted average number of shares outstanding during the reported period.
In computing diluted EPS, we adjust the numerator used in the basic EPS computation, subject to anti-dilution requirements, to add back the dividends (declared or cumulative undeclared) applicable to the Series A Convertible Preferred Stock. Such add-back would also include any adjustments to equity in the period to accrete the Series A Convertible Preferred Stock to its redemption price, or recorded upon a redemption or induced conversion. We adjust the denominator used in the basic EPS computation, subject to anti-dilution requirements, to include the dilution from potential shares resulting from the issuance of the Series A Convertible Preferred Stock, restricted stock units, and stock options. The Company includes the potential windfall or shortfall tax benefits as well as average unrecognized compensation expense as part of the assumed proceeds from exercises of stock options. The Company uses the tax law ordering approach to determine the potential utilization of windfall benefits.
54
The holders of Series A Convertible Preferred Stock and unvested restricted stock units do not have nonforfeitable rights to common stock dividends or common stock dividend equivalents and therefore do not qualify as participating securities. See
Note 9, "Stock Compensation Plans,"
for share information on NCR’s stock compensation plans.
The components of basic and diluted earnings per share attributable to NCR common stockholders are as follows for
the years ended
December 31
:
|
In millions, except per share amounts
|
2015
|
2014
|
2013
|
|||||||||
|
(Loss) income from continuing operations
|
$
|
(154
|
)
|
$
|
181
|
|
$
|
452
|
|
|||
|
(Loss) income from discontinued operations, net of tax
|
(24
|
)
|
10
|
|
(9
|
)
|
||||||
|
Net (loss) income attributable to NCR
|
(178
|
)
|
191
|
|
443
|
|
||||||
|
Dividends on convertible preferred stock
|
(4
|
)
|
—
|
|
—
|
|
||||||
|
Net (loss) income attributable to NCR common stockholders
|
$
|
(182
|
)
|
$
|
191
|
|
$
|
443
|
|
|||
|
Weighted average outstanding shares of common stock:
|
||||||||||||
|
Basic weighted average number of shares outstanding
|
167.6
|
|
167.9
|
|
165.4
|
|
||||||
|
Dilutive effect of employee stock options and restricted stock units
|
—
|
|
3.3
|
|
3.9
|
|
||||||
|
Diluted weighted average number of shares outstanding
|
167.6
|
|
171.2
|
|
169.3
|
|
||||||
|
Basic (loss) earnings per share:
|
||||||||||||
|
From continuing operations
|
$
|
(0.94
|
)
|
$
|
1.08
|
|
$
|
2.73
|
|
|||
|
From discontinued operations
|
(0.15
|
)
|
0.06
|
|
(0.05
|
)
|
||||||
|
Total basic (loss) earnings per share
|
$
|
(1.09
|
)
|
$
|
1.14
|
|
$
|
2.68
|
|
|||
|
Diluted (loss) earnings per share:
|
||||||||||||
|
From continuing operations
|
$
|
(0.94
|
)
|
$
|
1.06
|
|
$
|
2.67
|
|
|||
|
From discontinued operations
|
(0.15
|
)
|
0.06
|
|
(0.05
|
)
|
||||||
|
Total diluted (loss) earnings per share
|
$
|
(1.09
|
)
|
$
|
1.12
|
|
$
|
2.62
|
|
|||
For 2015, it is more dilutive to assume the Series A Convertible Preferred Stock is not converted to common stock and therefore weighted average outstanding shares of common stock are not adjusted by the as-if converted Series A Convertible Preferred Stock because the effect would be anti-dilutive. If the as-if converted Series A Convertible Preferred Stock had been dilutive, approximately
2.0 million
additional shares would have been included in the diluted weighted average number of shares outstanding for the year ended
December 31, 2015
.
For
2015
, due to the net loss attributable to NCR common stockholders, potential common shares that would cause dilution, such as the Series A Convertible Preferred Stock, restricted stock units and stock options, have been excluded from the diluted share count because their effect would have been anti-dilutive. For the year ended
December 31, 2015
, the fully diluted shares would have been
172.2 million
million shares.
For
2014
and
2013
there were
no
anti-dilutive awards.
Cash and Cash Equivalents
All short-term, highly liquid investments having original maturities to the Company of three months or less, including time deposits, are considered to be cash equivalents.
Allowance for Doubtful Accounts
NCR establishes provisions for doubtful accounts using percentages of accounts receivable balances to reflect historical average credit losses and specific provisions for known issues.
Inventories
Inventories are stated at the lower of cost or net realizable value, using the average cost method. Cost includes materials, labor and manufacturing overhead related to the purchase and production of inventories. Service parts are included in inventories and include reworkable and non-reworkable service parts. The Company regularly reviews inventory quantities on hand, future purchase commitments with suppliers and the estimated utility of inventory. If the review indicates a reduction in utility below carrying value, inventory is reduced to a new cost basis. Excess and obsolete write-offs are established based on forecasted usage, orders, technological obsolescence and inventory aging.
55
Capitalized Software
Certain direct development costs associated with internal-use software are capitalized within other assets and amortized over the estimated useful lives of the resulting software. NCR typically amortizes capitalized internal-use software on a straight-line basis over
four
to
seven
years beginning when the asset is substantially ready for use, as this is considered to approximate the usage pattern of the software. When it becomes probable that internal-use software being developed will not be completed or placed into service, the internal-use software is reported at the lower of the carrying amount or fair value.
Costs incurred for the development of software that will be sold, leased or otherwise marketed are capitalized when technological feasibility has been established. These costs are included within other assets and are amortized on a sum-of-the-years' digits or straight-line basis over the estimated useful lives ranging from
three
to
five
years, using the method that most closely approximates the sales pattern of the software. Amortization begins when the product is available for general release. Costs capitalized include direct labor and related overhead costs. Costs incurred prior to technological feasibility or after general release are expensed as incurred. NCR performs periodic reviews to ensure that unamortized program costs remain recoverable from future revenue. If future revenue does not support the unamortized program costs, the amount by which the unamortized capitalized cost of a software product exceeds the net realizable value is written off.
The following table identifies the activity relating to total capitalized software:
|
In millions
|
2015
|
2014
|
2013
|
||||||||
|
Beginning balance as of January 1
|
$
|
257
|
|
$
|
193
|
|
$
|
142
|
|
||
|
Capitalization
|
150
|
|
140
|
|
110
|
|
|||||
|
Amortization
|
(80
|
)
|
(69
|
)
|
(59
|
)
|
|||||
|
Impairment
|
(16
|
)
|
(7
|
)
|
—
|
|
|||||
|
Ending balance as of December 31
|
$
|
311
|
|
$
|
257
|
|
$
|
193
|
|
||
Goodwill and Other Intangible Assets
Goodwill represents the excess of purchase price over the fair value of the net tangible and identifiable intangible assets of businesses acquired. Goodwill is tested at the reporting unit level for impairment on an annual basis during the fourth quarter or more frequently if certain events occur indicating that the carrying value of goodwill may be impaired. A significant amount of judgment is involved in determining if an indicator of impairment has occurred. Such indicators may include a decline in expected cash flows, a significant adverse change in legal factors or in the business climate, a decision to sell a business, unanticipated competition, or slower growth rates, among others.
In the evaluation of goodwill for impairment, we have the option to perform a qualitative assessment to determine whether further impairment testing is necessary or to perform a quantitative assessment by comparing the fair value of a reporting unit to its carrying amount, including goodwill. Under the qualitative assessment, an entity is not required to calculate the fair value of a reporting unit unless the entity determines that it is more likely than not that its fair value is less than its carrying amount. If under the quantitative assessment the fair value of a reporting unit is less than its carrying amount, then the amount of the impairment loss, if any, must be measured under step two of the impairment analysis. In step two of the analysis, we will record an impairment loss equal to the excess of the carrying value of the reporting unit’s goodwill over its implied fair value should such a circumstance arise. Fair values of the reporting units are estimated primarily using the income approach, which incorporates the use of discounted cash flow (DCF) analyses. A number of significant assumptions and estimates are involved in the application of the DCF model to forecast operating cash flows, including markets and market shares, sales volumes and prices, costs to produce, tax rates, capital spending, discount rate and working capital changes. Most of these assumptions vary among reporting units. The cash flow forecasts are generally based on approved strategic operating plans.
During the fourth quarter of each year presented, we performed our annual impairment assessment of goodwill which did not indicate that an impairment existed. As of
December 31, 2015
, we determined that it was probable that we would dispose of our IPS business, which triggered an impairment assessment of the related assets which include long-lived assets and goodwill. Refer to
Note 6, "Goodwill and Other Long-Lived Assets"
in the Notes to the Consolidated Financial Statements for further discussion on the assessment.
Acquired intangible assets other than goodwill are amortized over their weighted average amortization period unless they are determined to be indefinite. Acquired intangible assets are carried at cost, less accumulated amortization. For intangible assets purchased in a business combination, the estimated fair values of the assets received are used to establish the carrying value. The fair value of acquired intangible assets is determined using common techniques, and the Company employs assumptions developed using the perspective of a market participant.
56
Property, Plant and Equipment
Property, plant and equipment and leasehold improvements are stated at cost less accumulated depreciation. Depreciation is computed over the estimated useful lives of the related assets primarily on a straight-line basis. Machinery and other equipment are depreciated over
3
to
20
years and buildings over
25
to
45
years. Leasehold improvements are depreciated over the life of the lease or the asset, whichever is shorter. Assets classified as held for sale are not depreciated. Upon retirement or disposition of property, plant and equipment, the related cost and accumulated depreciation or amortization are removed from the Company’s accounts, and a gain or loss is recorded. Depreciation expense related to property, plant and equipment was
$91 million
,
$83 million
, and
$68 million
for
the years ended
December 31, 2015
,
2014
, and
2013
, respectively.
Valuation of Long-Lived Assets
Long-lived assets such as property, plant and equipment and finite-lived intangible assets are reviewed for impairment when events or changes in circumstances indicate that the carrying amount of the assets may not be recoverable or in the period in which the held for sale criteria are met. For assets held and used, this analysis consists of comparing the asset’s carrying value to the expected future cash flows to be generated from the asset on an undiscounted basis. If the carrying amount of the asset is determined not to be recoverable, a write-down to fair value is recorded. Fair values are determined based on quoted market values, discounted cash flows, or external appraisals, as applicable. Long-lived assets are reviewed for impairment at the individual asset or the asset group level for which the lowest level of independent cash flows can be identified. Refer to
Note 6, "Goodwill and Other Long-Lived Assets"
in the Notes to the Consolidated Financial Statements for further discussion.
Pension, Postretirement and Postemployment Benefits
NCR has significant pension, postretirement and postemployment benefit costs, which are developed from actuarial valuations. Actuarial assumptions are established to anticipate future events and are used in calculating the expense and liabilities relating to these plans. These factors include assumptions the Company makes about interest rates, expected investment return on plan assets, rate of increase in healthcare costs, total and involuntary turnover rates, and rates of future compensation increases. In addition, NCR also uses subjective factors, such as withdrawal rates and mortality rates to develop the Company’s valuations. NCR generally reviews and updates these assumptions on an annual basis. NCR is required to consider current market conditions, including changes in interest rates, in making these assumptions. The actuarial assumptions that NCR uses may differ materially from actual results due to changing market and economic conditions, higher or lower withdrawal rates, or longer or shorter life spans of participants. These differences may result in a significant impact to the amount of pension, postretirement or postemployment benefits expense, and the related assets and liabilities, the Company has recorded or may record.
Environmental and Legal Contingencies
In the normal course of business, NCR is subject to various proceedings, lawsuits, claims and other matters, including, for example, those that relate to the environment and health and safety, labor and employment, employee benefits, import/export compliance, intellectual property, data privacy and security, product liability, commercial disputes and regulatory compliance, among others. Additionally, NCR is subject to diverse and complex laws, regulations, and standards including those relating to corporate governance, public disclosure and reporting, environmental safety and the discharge of materials into the environment, product safety, import and export compliance, data privacy and security, antitrust and competition, government contracting, anti-corruption, and labor and human resources, which are rapidly changing and subject to many possible changes in the future. Compliance with these laws and regulations, including changes in accounting standards, taxation requirements, and federal securities laws among others, may create a substantial burden on, and substantially increase the costs to NCR or could have an impact on NCR’s future operating results. NCR believes that the amounts provided in its Consolidated Financial Statements are adequate in light of the probable and estimable liabilities. However, there can be no assurances that the actual amounts required to satisfy alleged liabilities from various lawsuits, claims, legal proceedings and other matters, including the Fox River and Kalamazoo River environmental matters discussed in
Note 11, "Commitments and Contingencies,"
and to comply with applicable laws and regulations, will not exceed the amounts reflected in NCR’s Consolidated Financial Statements or will not have a material adverse effect on the Company’s consolidated results of operations, financial condition or cash flows. Any costs that may be incurred in excess of those amounts provided as of
December 31, 2015
cannot currently be reasonably determined or are not currently considered probable.
Legal fees and expenses related to loss contingencies are typically expensed as incurred, except for certain costs associated with NCR’s environmental remediation obligations. Costs and fees associated with litigating the extent and type of required remedial actions and the allocation of remediation costs among potentially responsible parties are typically included in the measurement of the environmental remediation liabilities.
Leases
The Company accounts for material escalation clauses, free or reduced rents and landlord incentives contained in operating type leases on a straight-line basis over the lease term, including any reasonably assured lease renewals. For leasehold improvements that are funded by the landlord, the Company records the incentive as deferred rent. The deferred rent is then amortized as reductions to lease expense over the lease term. For capital leases where NCR is the lessee, we record an amortizable debt and a related fixed asset in the Consolidated Balance Sheet.
57
Foreign Currency
For many NCR international operations, the local currency is designated as the functional currency. Accordingly, assets and liabilities are translated into U.S. Dollars at year-end exchange rates, and revenue and expenses are translated at average exchange rates prevailing during the year. Currency translation adjustments from local functional currency countries resulting from fluctuations in exchange rates are recorded in other comprehensive income. Where the U.S. Dollar is the functional currency, remeasurement adjustments are recorded in other (expense), net.
Derivative Instruments
In the normal course of business, NCR enters into various financial instruments, including derivative financial instruments. The Company accounts for derivatives as either assets or liabilities in the Consolidated Balance Sheets at fair value and recognizes the resulting gains or losses as adjustments to earnings or other comprehensive income. The Company formally documents all relationships between hedging instruments and hedged items, as well as the risk management objective and strategy for undertaking various hedge transactions. Hedging activities are transacted only with highly rated institutions, reducing exposure to credit risk in the event of nonperformance. Additionally, the Company completes assessments related to the risk of counterparty nonperformance on a regular basis.
The accounting for changes in fair value of a derivative instrument depends on whether it has been designated and qualifies as part of a hedging relationship, and further, on the type of hedging relationship. For those derivative instruments that are designated and qualify as hedging instruments, the Company has designated the hedging instrument, based on the exposure being hedged, as a fair value hedge, a cash flow hedge or a hedge of a net investment in a foreign operation. For derivative instruments designated as fair value hedges, the effective portion of the hedge is recorded as an offset to the change in the fair value of the hedged item, and the ineffective portion of the hedge, if any, is recorded in the Consolidated Statement of Operations. For derivative instruments designated as cash flow hedges and determined to be highly effective, the gains or losses are deferred in other comprehensive income and recognized in the determination of income as adjustments of carrying amounts when the underlying hedged transaction is realized, canceled or otherwise terminated. When hedging certain foreign currency transactions of a long-term investment nature (net investments in foreign operations) gains and losses are recorded in the currency translation adjustment component of accumulated other comprehensive loss. Gains and losses on foreign exchange contracts that are not used to hedge currency transactions of a long-term investment nature, or that are not designated as cash flow or fair value hedges, are recognized in other (expense), net as exchange rates change.
Fair Value of Assets and Liabilities
Fair value is defined as an exit price, representing an amount that would be received to sell an asset or the amount paid to transfer a liability in an orderly transaction between market participants at the measurement date. As such, fair value is a market-based measurement determined based on assumptions that market participants would use in pricing an asset or liability. As a basis for considering such assumptions, the guidance prioritizes the inputs used to measure fair value into the following three-tier fair value hierarchy:
|
•
|
Level 1: Unadjusted quoted prices in active markets for identical assets or liabilities
|
|
•
|
Level 2: Unadjusted quoted prices in active markets for similar assets or liabilities, unadjusted quoted prices for identical or similar assets or liabilities in markets that are not active or inputs, other than quoted prices in active markets, that are observable either directly or indirectly
|
|
•
|
Level 3: Unobservable inputs for which there is little or no market data
|
Assets and liabilities are classified based on the lowest level of input that is significant to the fair value measurements. The Company reviews the fair value hierarchy classification on a quarterly basis. Changes to the observability of valuation inputs may result in a reclassification of levels for certain securities within the fair value hierarchy.
NCR measures its financial assets and financial liabilities at fair value based on one or more of the following three valuation techniques:
|
•
|
Market approach: Prices and other relevant information generated by market transactions involving identical or comparable assets or liabilities.
|
|
•
|
Cost approach: Amount that would be required to replace the service capacity of an asset (replacement cost).
|
|
•
|
Income approach: Techniques to convert future amounts to a single present amount based upon market expectations (including present value techniques, option pricing and excess earnings models).
|
58
We regularly review our investments to determine whether a decline in fair value, if any, below the cost basis is other than temporary. If the decline in the fair value is determined to be other than temporary, the cost basis of the security is written down to fair value and the amount of the write-down is included in the Consolidated Statement of Operations. For qualifying investments in debt or equity securities, a temporary impairment charge would be recognized in other comprehensive income (loss).
Redeemable Noncontrolling Interests
In 2011, we sold a
49%
voting equity interest in NCR Brasil - Indústria de Equipamentos para Automação S.A., a subsidiary of the Company (NCR Manaus) to Scopus Tecnologia Ltda. (Scopus). In the event NCR Manaus does not meet a defined financial performance goal during the
five
year period ending in 2016, Scopus may elect to put its noncontrolling interest to us for its then-current fair value. Additionally, subsequent to October 4, 2016, Scopus may elect to sell its shares in NCR Manaus at the then-current fair value to a third party that is not a competitor of NCR. If Scopus is unable to locate a buyer after the first six months, Scopus may put its noncontrolling interest to us for its then-current fair value.
Related Party Transactions
In 2011, concurrent with the sale of a noncontrolling interest in NCR Manaus to Scopus, we entered into a Master Purchase Agreement (MPA) with Banco Bradesco SA (Bradesco), the parent of Scopus. Through the MPA, Bradesco agreed to purchase up to 30,000 ATMs from us over the 5 year term of the agreement. Pricing of the ATMs will adjust over the term of the MPA using certain formulas which are based on prevailing market pricing. We recognized
$59 million
,
$87 million
and
$124 million
in revenue related to Bradesco for
the years ended
December 31, 2015
,
2014
and
2013
, respectively, and we had
$11 million
and
$15 million
in receivables outstanding from Bradesco as of
December 31, 2015
and
2014
.
Recent Accounting Pronouncements
Adopted
In April 2014, the Financial Accounting Standards Board (FASB) issued changes to the criteria for determining which disposals are required to be presented as discontinued operations. The changes require a disposal of a component of an entity or a group of components of an entity to be reported in discontinued operations if the disposal represents a strategic shift that has, or will have, a major effect on an entity’s operations and financial results when any of the following occurs: (i) the component of an entity or group of components of an entity meets the criteria to be classified as held for sale, (ii) the component of an entity or group or components of an entity is disposed of by sale, or (iii) the component of an entity or group of components of an entity is disposed of other than by sale. The amendments apply on a prospective basis to disposals of components of an entity that occur within annual periods beginning on or after December 15, 2014 and interim periods within those years, with early adoption permitted. The implementation of the amended accounting guidance on January 1, 2015 did not have an impact on our consolidated financial statements.
In August 2014, the FASB issued new guidance related to disclosures relating to going concern, including management's responsibility to evaluate whether there is substantial doubt about an entity's ability to continue as a going concern and to provide related disclosures when conditions or events raise substantial doubt about an entity's ability to continue as a going concern. The new standard is effective for fiscal years, and interim periods within those fiscal years, beginning after December 15, 2016, with early adoption permitted. The impact of adopting this guidance on December 31, 2015 did not have an impact on our consolidated financial statements.
In April 2015, the FASB issued new guidance related to the presentation of debt issuance costs, which amends existing guidance to require the presentation of debt issuance costs in the balance sheet as a deduction from the carrying amount of the related debt liability, consistent with debt discounts, instead of a deferred charge asset. In August 2015, given the absence of authoritative guidance within the new guidance for debt issuance costs related to line-of-credit arrangements, the FASB indicated that the SEC staff would not object to an entity deferring and presenting debt issuance costs as an asset and subsequently amortizing the deferred debt issuance costs ratably over the term of the line-of-credit arrangement, regardless of whether there are any outstanding borrowings on the line-of-credit arrangement. The new standard, including the August 2015 update, is effective for fiscal years, and interim periods within those fiscal years, beginning after December 15, 2015, with early adoption permitted. Long-term debt and other assets as of December 31, 2015 and 2014 were adjusted by approximately
$34 million
and
$41 million
, respectively, as a result of the adoption of this guidance on December 31, 2015.
59
In April 2015, the FASB issued new guidance related to accounting for the fees paid in a cloud computing arrangement, which provides guidance to customers about whether a cloud computing arrangement includes a software license. If considered a software license, the arrangement should be accounted for as an acquisition of a software license. If not considered a software license, the arrangement should be accounted for as a service contract. The new standard is effective for fiscal years, and interim periods within those fiscal years, beginning after December 15, 2015, with early adoption permitted. The impact of adopting this guidance on December 31, 2015 did not have a material impact on our consolidated financial statements.
In July 2015, the FASB issued new guidance on simplifying the measurement of inventory. Inventory within the scope of this update is required to be measured at the lower of its cost or net realizable value, with net realizable value being the estimated selling price in the ordinary course of business, less reasonably predictable costs of completion, disposal, and transportation. The standards update is effective prospectively for fiscal years and interim periods beginning after December 15, 2016, with early adoption permitted. The impact of adopting this guidance on December 31, 2015 did not have a material impact on our consolidated financial statements.
In November 2015, the FASB issued new guidance that requires companies to classify all deferred tax assets and liabilities as noncurrent on the balance sheet instead of separately classifying deferred taxes into current and noncurrent amounts. The standard is effective for fiscal years and interim periods beginning after December 15, 2016, with early adoption permitted. Prospective adoption of the guidance on December 31, 2015 resulted in deferred income taxes of
$582 million
in noncurrent assets within the Consolidated Balance Sheet as of December 31, 2015, as compared to
$264 million
in current assets and
$349 million
in deferred income taxes in noncurrent assets within the Consolidated Balance Sheet as of December 31, 2014.
Issued
In May 2014, the FASB issued a new revenue recognition standard that will supersede current revenue recognition guidance. The core principle of the guidance is that an entity should recognize revenue to depict the transfer of promised goods or services to customers in an amount that reflects the consideration to which the entity expects to be entitled in exchange for those goods or services. The standard will be effective for the first interim period within annual periods beginning after December 15, 2017, with early adoption permitted for annual periods beginning after December 15, 2016, and can be adopted either retrospectively to each prior reporting period presented or as a cumulative effect adjustment as of the date of adoption. The Company is evaluating the impact that adopting this guidance will have on its consolidated financial statements.
In February 2016, the FASB issued a new leasing standard that will supersede current guidance related to accounting for leases. The guidance is intended to increase transparency and comparability among organizations by recognizing lease assets and lease liabilities on the balance sheet and disclosing key information about leasing arrangements. The standard will be effective for the first interim period within annual periods beginning after December 15, 2018, with early adoption permitted. The standard is required to be adopted using the modified retrospective approach. The Company is evaluating the impact that adopting this guidance will have on its consolidated financial statements.
2. SERIES A CONVERTIBLE PREFERRED STOCK
On December 4, 2015, NCR issued
820,000
shares of Series A Convertible Preferred Stock to certain entities affiliated with Blackstone Capital Partners VI L.P. and Blackstone Tactical Opportunities L.L.C. (collectively, Blackstone) for an aggregate purchase price of
$820 million
, or
$1,000
per share pursuant to an Investment Agreement between the Company and Blackstone, dated November 11, 2015. In connection with the issuance of the Series A Convertible Preferred Stock, the Company incurred direct and incremental expenses of
$26 million
, including financial advisory fees, closing costs, legal expenses and other offering-related expenses. These direct and incremental expenses originally reduced the Series A Convertible Preferred Stock, and will be accreted through retained earnings as a deemed dividend from the date of issuance through the first possible known redemption date, March 16, 2024. As of December 31, 2015, the Company had accrued dividends of
$4 million
associated with the Series A Convertible Preferred Stock. There were no cash dividends declared in the year ended
December 31, 2015
.
Dividend Rights
The Series A Convertible Preferred Stock ranks senior to the shares of the Company’s common stock, with respect to dividend rights and rights on the distribution of assets on any voluntary or involuntary liquidation, dissolution or winding up of the affairs of the Company. The Series A Convertible Preferred Stock has a liquidation preference of
$1,000
per share. Holders of Series A Convertible Preferred Stock are entitled to a cumulative dividend at the rate of
5.5%
per annum, payable quarterly in arrears. If the Company does not declare and pay a dividend, the dividend rate will increase to
8.0%
per annum until all accrued but unpaid dividends have been paid in full. Dividends are paid in-kind, through the issuance of additional shares of Series A
60
Convertible Preferred Stock, for the first sixteen dividend payment dates, after which dividends will be payable in cash or in-kind at the option of the Company.
Conversion Features
The Series A Convertible Preferred Stock is convertible at the option of the holders at any time into shares of common stock at a conversion price of
$30.00
per share and a conversion rate of
33.33
shares of common stock per share of Series A Convertible Preferred Stock. As of
December 31, 2015
, the maximum number of common shares that could be required to be issued if converted is
27.4 million
shares. The conversion rate is subject to the following customary anti-dilution and other adjustments:
|
•
|
the issuance of common stock as a dividend or the subdivision, combination, or reclassification of common stock into a greater or lesser number of shares of common stock;
|
|
•
|
the dividend, distribution or other issuance of rights, options or warrants to holders of Common Stock entitling them to subscribe for or purchase shares of common stock at a price per share that is less than the volume-weighted average price per share of common stock;
|
|
•
|
the completion of a tender offer or exchange offer of shares of common stock at a premium to the volume-weighted average price per share of common stock and certain other above-market purchases of common stock;
|
|
•
|
the issuance of a dividend or similar distribution in-kind, which can include shares of any class of capital stock, evidences of the Company's indebtedness, assets or other property or securities, to holders of common stock;
|
|
•
|
a transaction in which a subsidiary of the Company ceases to be a subsidiary of the Company as a result of the distribution of the equity interests of the subsidiary to the holders of the Company’s common stock; and
|
|
•
|
the payment of a cash dividend to the holders of common stock.
|
At any time after December 4, 2018, all outstanding shares of Series A Convertible Preferred Stock are convertible at the option of the Company if the volume-weighted average price of the common stock exceeds
$54.00
for at least 30 trading days in any period of 45 consecutive trading days. The
$54.00
may be adjusted pursuant to the anti-dilution provisions above.
The Series A Convertible Preferred Stock, and the associated dividends for the first sixteen payments, did not generate a beneficial conversion feature (BCF) upon issuance as the fair value of the Company's common stock was greater than the conversion price. The Company will determine and, if required, measure a BCF based on the fair value of our stock price on the date dividends are declared subsequent to the sixteenth dividend. If a BCF is recognized, a reduction to retained earnings and the Series A Convertible Preferred Stock will be recorded, and then subsequently accreted through the first redemption date.
Additionally, the Company determined that the nature of the Series A Convertible Preferred Stock was more akin to an equity instrument and that the economic characteristics and risks of the embedded conversion options were clearly and closely related to the Series A Convertible Preferred Stock. As such, the conversion options were not required to be bifurcated from the host under ASC 815,
Derivatives and Hedging.
Redemption Rights
On any date during the three months commencing on and immediately following March 16, 2024 and the three months commencing on and immediately following every third anniversary of March 16, 2024, holders of Series A Convertible Preferred Stock have the right to require the Company to repurchase all or any portion of the Series A Convertible Preferred Stock at 100% of the liquidation preference thereof plus all accrued but unpaid dividends. Upon certain change of control events involving the Company, holders of Series A Convertible Preferred Stock can require the Company to repurchase, subject to certain exceptions, all or any portion of the Series A Convertible Preferred Stock at the greater of (1) an amount in cash equal to 100% of the liquidation preference thereof plus all accrued but unpaid dividends and (2) the consideration the holders would have received if they had converted their shares of Series A Preferred Convertible Stock into common stock immediately prior to the change of control event.
The Company has the right, upon certain change of control events involving the Company, to redeem the Series A Convertible Preferred Stock at the greater of (1) an amount in cash equal to the sum of the liquidation preference of the Series A Convertible Preferred Stock, all accrued but unpaid dividends and the present value, discounted at a rate of 10%, of any remaining scheduled dividends through the fifth anniversary of the first dividend payment date, assuming the Company chose to pay such dividends in cash (the "make-whole provision") and (2) the consideration the holders would have received if they had converted their shares of Series A Convertible Preferred Stock into common stock immediately prior to the change of control event.
Since the redemption of the Series A Convertible Preferred Stock is contingently or optionally redeemable and therefore not certain to occur, the Series A Convertible Preferred Stock is not required to be classified as a liability under ASC 480,
Distinguishing
61
Liabilities from Equity
. As the Series A Convertible Preferred Stock is redeemable in certain circumstances at the option of the holder and is redeemable in certain circumstances upon the occurrence of an event that is not solely within our control, we have classified the Series A Convertible Preferred Stock in mezzanine equity on the Consolidated Balance Sheets.
As noted above, the Company determined that the nature of the Series A Convertible Preferred Stock was more akin to an equity instrument. However, the Company determined that the economic characteristics and risks of the embedded put options, call option and make-whole provision were not clearly and closely related to the Series A Convertible Preferred Stock. Therefore, the Company assessed the put and call options options further, and determined they did not meet the definition of a derivative under ASC 815,
Derivatives and Hedging.
Under the same analysis, the Company determined the make-whole provision did meet the definition of a derivative, but that the value of the derivative was minimal due to the expectations surrounding the scenarios under which the call option and make-whole provision would be exercised.
Voting Rights
Holders of Series A Convertible Preferred Stock are entitled to vote with the holders of the common stock on an as-converted basis. Holders of Series A Convertible Preferred Stock are entitled to a separate class vote with respect to certain designees for election to the Company's Board of Directors, amendments to the Company’s organizational documents that have an adverse effect on the Series A Convertible Preferred Stock and issuances by the Company of securities that are senior to, or equal in priority with, the Series A Convertible Preferred Stock.
Registration Rights
Holders of Series A Convertible Preferred Stock have certain customary registration rights with respect to the Series A Convertible Preferred Stock and the shares of common stock into which they are converted, pursuant to the terms of a registration rights agreement.
3. RESTRUCTURING PLAN
In July 2014, we announced a restructuring plan to strategically reallocate resources so that we can focus on higher-growth, higher-margin opportunities in the software-driven omni-channel industry. The program is centered on ensuring that our people and processes are aligned with our continued transformation and includes: rationalizing our product portfolio to eliminate overlap and redundancy; taking steps to end-of-life older commodity product lines that are costly to maintain and provide low margins; moving lower productivity services positions to our new centers of excellence due to the positive impact of services innovation; and reducing layers of management and organizing around divisions to improve decision-making, accountability and strategic execution.
As a result of the restructuring plan, the Company recorded total charges of
$74 million
and
$161 million
in the years ended
December 31, 2015
and
2014
, respectively. The Company expects to achieve annualized run-rate savings of approximately
$105 million
beginning in 2016. Our estimate of restructuring-related opportunities in connection with this restructuring plan for 2016 is approximately
$20 million
to
$25 million
.
62
Charges related to the restructuring plan for the years ended
December 31, 2015
and
2014
were:
|
For the twelve months ended December 31
|
|||||||
|
In millions
|
2015
|
2014
|
|||||
|
Severance and other employee-related costs
|
|||||||
|
ASC 712 charges included in restructuring-related charges
|
$
|
1
|
|
$
|
73
|
|
|
|
ASC 420 charges included in restructuring-related charges
|
19
|
|
13
|
|
|||
|
Inventory-related charges
|
|||||||
|
Charges included in cost of products
|
5
|
|
9
|
|
|||
|
Charges included in cost of services
|
7
|
|
47
|
|
|||
|
Asset-related charges
|
|||||||
|
External and internal use software impairment charges included in restructuring-related charges
|
16
|
|
7
|
|
|||
|
Impairment of long-lived assets included in restructuring-related charges
|
13
|
|
6
|
|
|||
|
Other than temporary impairment of an investment included in other (expense), net
|
—
|
|
3
|
|
|||
|
Other exit costs
|
|||||||
|
Other exit costs included in restructuring-related charges
|
13
|
|
5
|
|
|||
|
Net income attributable to noncontrolling interests
|
|||||||
|
Charges included in net income attributable to noncontrolling interests
|
—
|
|
(2
|
)
|
|||
|
Total restructuring-related charges
|
$
|
74
|
|
$
|
161
|
|
|
In
the year ended
December 31, 2015
, asset-related charges include the write-off of certain capitalized software for projects that have been abandoned as well as an impairment of long-lived assets that are no longer considered strategic and were sold. In
the year ended
December 31, 2014
, asset-related charges include the write-off of certain internal and external use capitalized software for projects where the Company has redirected resources to higher growth opportunities and abandoned certain projects. Additionally, the charges include an other than temporary impairment for an investment that was no longer considered strategic. See
Note 13, “Fair Value of Assets and Liabilities,”
for additional information.
The results by segment, as disclosed in
Note 14, "Segment Information and Concentrations,"
exclude the impact of these costs, which is consistent with the manner by which management assesses the performance and evaluates the results of each segment.
The following table summarizes the costs recorded in accordance with ASC 420,
Exit or Disposal Cost Obligations,
and ASC 712,
Employers’ Accounting for Postemployment Benefits,
and the remaining liabilities as of
December 31, 2015
and
2014
, which are included in the Consolidated Balance Sheet in other current liabilities.
|
In millions
|
2015
|
2014
|
|
|
Employee Severance and Other Exit Costs
|
|||
|
Beginning balance as of January 1
|
$60
|
$—
|
|
|
Cost recognized during the period
|
38
|
91
|
|
|
Change in estimated payments under ASC 712
|
(5)
|
—
|
|
|
Utilization
|
(71)
|
(29)
|
|
|
Foreign currency translation adjustments
|
(2)
|
(2)
|
|
|
Ending balance as of December 31
|
$20
|
$60
|
|
63
4. SUPPLEMENTAL FINANCIAL INFORMATION
The components of other (expense), net are summarized as follows for
the years ended
December 31
:
|
In millions
|
2015
|
2014
|
2013
|
|||||||||
|
Other (expense), net
|
||||||||||||
|
Interest income
|
$
|
5
|
|
$
|
6
|
|
$
|
6
|
|
|||
|
Foreign currency fluctuations and foreign exchange contracts
|
(21
|
)
|
(32
|
)
|
(13
|
)
|
||||||
|
Impairment of an investment
|
—
|
|
(3
|
)
|
—
|
|
||||||
|
Impairment on pending divestiture of the Interactive Printer Solutions business
|
(34
|
)
|
—
|
|
—
|
|
||||||
|
Gain on sale of available for sale securities
|
—
|
|
4
|
|
—
|
|
||||||
|
Other, net
|
(7
|
)
|
(10
|
)
|
(2
|
)
|
||||||
|
Total other (expense), net
|
$
|
(57
|
)
|
$
|
(35
|
)
|
$
|
(9
|
)
|
|||
The components of accounts receivable are summarized as follows:
|
In millions
|
December 31, 2015
|
December 31, 2014
|
|||||
|
Accounts receivable
|
|||||||
|
Trade
|
$
|
1,259
|
|
$
|
1,382
|
|
|
|
Other
|
39
|
|
41
|
|
|||
|
Accounts receivable, gross
|
1,298
|
|
1,423
|
|
|||
|
Less: allowance for doubtful accounts
|
(47
|
)
|
(19
|
)
|
|||
|
Total accounts receivable, net
|
$
|
1,251
|
|
$
|
1,404
|
|
|
The components of inventory are summarized as follows:
|
In millions
|
December 31, 2015
|
December 31, 2014
|
|||||
|
Inventories
|
|||||||
|
Work in process and raw materials
|
$
|
137
|
|
$
|
132
|
|
|
|
Finished goods
|
129
|
|
148
|
|
|||
|
Service parts
|
377
|
|
389
|
|
|||
|
Total inventories
|
$
|
643
|
|
$
|
669
|
|
|
The components of other current assets are summarized as follows:
|
In millions
|
December 31, 2015
|
December 31, 2014
|
|||||
|
Other current assets
|
|||||||
|
Current deferred tax assets (refer to Note 1, “Basis of Presentation and Summary of Significant Accounting Policies”)
|
$
|
—
|
|
$
|
264
|
|
|
|
Held for sale assets
|
89
|
|
—
|
|
|||
|
Other
|
238
|
|
240
|
|
|||
|
Total other current assets
|
$
|
327
|
|
$
|
504
|
|
|
64
The components of property, plant and equipment are summarized as follows:
|
In millions
|
December 31, 2015
|
December 31, 2014
|
|||||
|
Property, plant and equipment
|
|||||||
|
Land and improvements
|
$
|
7
|
|
$
|
32
|
|
|
|
Buildings and improvements
|
196
|
|
230
|
|
|||
|
Machinery and other equipment
|
597
|
|
715
|
|
|||
|
Property, plant and equipment, gross
|
800
|
|
977
|
|
|||
|
Less: accumulated depreciation
|
(478
|
)
|
(581
|
)
|
|||
|
Total property, plant and equipment, net
|
$
|
322
|
|
$
|
396
|
|
|
5. BUSINESS COMBINATIONS AND DIVESTITURES
2015 Pending Divestiture
As of
December 31, 2015
, we determined that it was probable that we would dispose of our IPS business, which triggered an impairment assessment of the related assets which include long-lived assets and goodwill. The assets related to the IPS business were valued using a market approach based on an independent third-party market price. The assessment resulted in charges to reduce the carrying values of goodwill and property, plant and equipment, net by
$16 million
and
$18 million
, respectively, for a total charge of
$34 million
recorded in other (expense), net in the Consolidated Statements of Operations. The remaining assets and liabilities of
$89 million
and
$39 million
, respectively, were classified as held for sale as of
December 31, 2015
and are included in other current assets and other current liabilities, respectively, in the Consolidated Balance Sheets. The transaction is anticipated to be completed within fiscal 2016. Refer to
Note 6, "Goodwill and Other Long-Lived Assets"
for additional discussion.
2014 Acquisitions
Acquisition of Digital Insight Corporation
On January 10, 2014, NCR completed its acquisition of Digital Insight Corporation, for which it paid an aggregate purchase price of
$1,648 million
, which includes
$5 million
that was withheld by the Company as a source of recovery for possible claims pursuant to the acquisition agreement and was paid to the sellers in the third quarter of 2014 pursuant to the terms of such agreement. The purchase price was paid from the net proceeds of the December 2013 offer and sale of NCR's 5.875% and 6.375% senior unsecured notes and borrowings under NCR's senior secured credit facility. As a result of the acquisition, Digital Insight became a wholly owned subsidiary of NCR.
Digital Insight is a leading U.S. based provider of cloud-based customer-facing digital banking software to domestic financial institutions. The acquisition is consistent with NCR's continued transformation to a software-driven, hardware-enabled business. Digital Insight complements and extends our existing capabilities in the banking industry to form a complete enterprise software platform across both physical and digital channels - mobile, online, branch, and ATM.
Recording of Assets Acquired and Liabilities Assumed
The fair value of consideration transferred to acquire Digital Insight was allocated to the identifiable assets acquired and liabilities assumed based upon their estimated fair market values as of the date of the acquisition as set forth below. This allocation was final as of December 31, 2014.
The allocation of the purchase price for Digital Insight was as follows:
|
In millions
|
Fair Value
|
|
Tangible assets acquired
|
$73
|
|
Acquired intangible assets other than goodwill
|
559
|
|
Acquired goodwill
|
1,243
|
|
Deferred tax liabilities
|
(190)
|
|
Liabilities assumed
|
(37)
|
|
Total purchase consideration
|
$1,648
|
65
Goodwill represents the future economic benefits arising from other assets acquired that could not be individually identified and separately recognized. The goodwill arising from the acquisition consists of the revenue synergies expected from combining the operations of NCR and Digital Insight. It is expected that none of the goodwill recognized in connection with the acquisition will be deductible for tax purposes. The goodwill arising from the acquisition has been allocated to our Financial Services segment. Refer to
Note 6, "Goodwill and Other Long-Lived Assets"
for the carrying amounts of goodwill by segment.
The intangible assets acquired in the acquisition include the following:
|
Estimated Fair Value
|
Weighted Average Amortization Period
(1)
|
||||
|
(In millions)
|
|
(years)
|
|||
|
Direct customer relationships
|
$
|
336
|
|
18
|
|
|
Technology - Software
|
121
|
|
5
|
||
|
Customer contracts
|
89
|
|
8
|
||
|
Tradenames
|
13
|
|
7
|
||
|
Total acquired intangible assets
|
$
|
559
|
|
13
|
|
|
(1)
|
Determination of the weighted average amortization period of the individual categories of intangible assets was based on the nature of the applicable intangible asset and the expected future cash flows to be derived from the intangible asset. Amortization of intangible assets with definite lives is recognized over the period of time the assets are expected to contribute to future cash flows.
|
The Company has incurred a total of
$15 million
of transaction expenses relating to the acquisition, of which
$8 million
and
$7 million
is included in selling, general and administrative expenses in the Company's Consolidated Statement of Operations for
the years ended
December 31, 2014
and
2013
, respectively. See
Note 14, “Segment Information and Concentrations”
for additional information regarding revenue and operating income related to Digital Insight for the year ended
December 31, 2014
.
Unaudited Pro forma Information
The following unaudited pro forma information presents the consolidated results of NCR and Digital Insight for
the years ended
December 31, 2014
and
2013
. The unaudited pro forma information is presented for illustrative purposes only. It is not necessarily indicative of the results of operations of future periods, or the results of operations that actually would have been realized had the entities been a single company during the periods presented or the results that the combined company will experience after the acquisition. The unaudited pro forma information does not give effect to the potential impact of current financial conditions, regulatory matters or any anticipated synergies, operating efficiencies or cost savings that may be associated with the acquisition. The unaudited pro forma information also does not include any integration costs or remaining future transaction costs that the companies may incur related to the acquisition as part of combining the operations of the companies.
The unaudited pro forma financial information for
the year ended
December 31, 2014
combines the results of NCR for
the year ended
December 31, 2014
, which include the results of Digital Insight subsequent to January 10, 2014 (the acquisition date) and the historical results for Digital Insight for the 10 days preceding the acquisition date. The unaudited financial information for
the year ended
December 31, 2013
combines the historical results for NCR for
the year ended
December 31, 2013
with the historical results for Digital Insight for
the twelve months ended
October 31, 2013, as, prior to the acquisition, Digital Insight had a July 31 fiscal year end.
The unaudited pro forma consolidated results of operations, assuming the acquisition had occurred on January 1, 2013, are as follows:
|
For the year ended December 31
|
||||||||
|
In millions
|
2014
|
2013
|
||||||
|
Revenue
|
$
|
6,599
|
|
$
|
6,450
|
|
||
|
Net income attributable to NCR
|
$
|
175
|
|
$
|
382
|
|
||
66
The unaudited pro forma results for
the year ended
December 31, 2014 include:
|
•
|
$8 million
, net of tax, in eliminated transaction costs as if those costs had been recognized in the prior-year period.
|
The unaudited pro forma results for
the year ended
December 31, 2013 include:
|
•
|
$15 million
, net of tax, in additional amortization expense for acquired intangible assets;
|
|
•
|
$53 million
, net of tax, in interest expense from NCR's 5.875% and 6.375% senior unsecured notes and incremental borrowings under NCR's senior secured credit facility, and;
|
|
•
|
$6 million
, net of tax, in transaction costs.
|
2013 Acquisitions
Acquisition of Retalix Ltd.
On February 6, 2013, NCR completed the acquisition of Retalix Ltd. (Retalix), for which it paid an aggregate cash purchase price of
$791 million
which includes
$3 million
to be recognized as compensation expense within selling, general and administrative expenses over a period of approximately three years from the acquisition date. The purchase price was paid from the net proceeds of the December 2012 offer and sale of NCR's 4.625% senior unsecured notes and borrowings under NCR's senior secured credit facility. As a result of the acquisition, Retalix became an indirect wholly owned subsidiary of NCR. Retalix is a leading global provider of innovative retail software. The acquisition is consistent with NCR's continued transformation to a hardware-enabled, software-driven business. Retalix's strength with blue-chip retailers is highly complementary and provides additional sales opportunities across the combined installed base.
Recording of Assets Acquired and Liabilities Assumed
The fair value of consideration transferred to acquire Retalix was allocated to the identifiable assets acquired and liabilities assumed based upon their estimated fair market values as of the date of the acquisition as set forth below. This allocation was final as of December 31, 2013.
The allocation of the purchase price for Retalix was as follows:
|
In millions
|
Fair Value
|
||
|
Cash and cash equivalents
|
$
|
127
|
|
|
Accounts receivable
|
107
|
|
|
|
Other tangible assets
|
56
|
|
|
|
Acquired goodwill
|
461
|
|
|
|
Acquired intangible assets other than goodwill
|
205
|
|
|
|
Deferred tax liabilities
|
(52
|
)
|
|
|
Liabilities assumed
|
(116
|
)
|
|
|
Total purchase consideration
|
$
|
788
|
|
Goodwill represents the future economic benefits arising from other assets acquired that could not be individually identified and separately recognized. The goodwill arising from the acquisition consists of the margin and cost synergies expected from combining the operations of NCR and Retalix. It is expected that approximately
$35 million
of the goodwill recognized in connection with the acquisition will be deductible for tax purposes. The goodwill arising from the acquisition has been allocated to the Retail Solutions segment. Refer to
Note 6, "Goodwill and Other Long-Lived Assets"
for the carrying amounts of goodwill by segment.
The intangible assets acquired in the acquisition include the following:
|
Estimated
Fair Value
|
Weighted Average Amortization Period
(1)
|
|||||
|
(In millions)
|
|
(years)
|
||||
|
Direct customer relationships
|
$
|
121
|
|
20
|
||
|
Technology - Software
|
74
|
|
5
|
|||
|
Trademarks
|
10
|
|
6
|
|||
|
Total acquired intangible assets
|
$
|
205
|
|
14
|
||
67
|
(1)
|
Determination of the weighted average amortization period of the individual categories of intangible assets was based on the nature of the applicable intangible asset and the expected future cash flows to be derived from the intangible asset. Amortization of intangible assets with definite lives is recognized over the period of time the assets are expected to contribute to future cash flows.
|
The Company incurred a total of
$9 million
of transaction expenses relating to the acquisition, of which
$6 million
is included in selling, general and administrative expenses in the Company's Consolidated Statement of Operations for
the year ended
December 31, 2013
. See
Note 14, “Segment Information and Concentrations”
for additional information regarding revenue and operating income related to Retalix for the year ended
December 31, 2013
.
Unaudited Pro forma Information
The following unaudited pro forma information presents the consolidated results of NCR and Retalix for
the year ended
December 31, 2013
. The unaudited pro forma information is presented for illustrative purposes only. It is not necessarily indicative of the results of operations of future periods, or the results of operations that actually would have been realized had the entities been a single company during the periods presented or the results that the combined company will experience after the acquisition. The unaudited pro forma information does not give effect to the potential impact of current financial conditions, regulatory matters or any anticipated synergies, operating efficiencies or cost savings that may be associated with the acquisition. The unaudited pro forma information also does not include any integration costs or remaining future transaction costs that the companies may incur related to the acquisition as part of combining the operations of the companies.
The unaudited pro forma consolidated results of operations, assuming the acquisition had occurred on January 1, 2012, are as follows:
|
For the year ended December 31, 2013
|
||||
|
In millions
|
||||
|
Revenue
|
$
|
6,156
|
|
|
|
Net income attributable to NCR
|
$
|
447
|
|
|
The unaudited pro forma results for
the year ended
December 31, 2013
include:
|
•
|
$13 million
in additional revenue associated with deferred revenue acquired, assuming the deferred revenue was acquired on January 1, 2012,
|
|
•
|
$2 million
, net of tax, in additional amortization expense for acquired intangible assets and
|
|
•
|
$5 million
, net of tax, in eliminated transaction costs as if those costs had been recognized in the prior-year period.
|
Acquisition of Alaric Systems Limited
On December 2, 2013, the Company acquired all of the outstanding share capital of Alaric Systems Limited (Alaric Systems) in exchange for approximately
$84 million
, plus related acquisition costs. Alaric Systems is a provider of secure transaction switching and fraud prevention software. Goodwill recognized related to this acquisition was
$55 million
, of which it is expected that
zero
will be deductible for tax purposes. The goodwill and their results from the date of acquisition have been reported within our Financial Services segment. As a result of the Alaric Systems acquisition, NCR recorded
$37 million
related to identifiable intangible assets consisting primarily of proprietary technology and customer relationships, which have a weighted-average amortization period of
8 years
. Supplemental pro forma information and actual revenue and earnings since the acquisition date have not been provided as this acquisition did not have a material impact on the Company's Consolidated Statements of Operations.
Other Acquisitions
During
the year ended
December 31, 2013
, the Company completed five additional acquisitions for aggregate purchase consideration of approximately
$38 million
, plus related acquisition costs. Approximately
$6 million
was withheld by the Company as a source of recovery for possible claims under the related acquisition agreements and was paid to the respective sellers pursuant to the terms of such agreements. Goodwill recognized related to these acquisitions was
$23 million
, of which it is expected that
$19 million
will be deductible for tax purposes. The goodwill arising from these acquisitions has been allocated to the Hospitality segment. As a result of these five additional acquisitions, NCR recorded
$14 million
related to identifiable intangible assets consisting primarily of customer relationships, which have a weighted-average amortization period of
3 years
. Supplemental pro forma information and actual revenue and earnings since the acquisition dates have not been provided as these acquisitions did not have a material impact, individually or in the aggregate, on the Company's Consolidated Statements of Operations.
68
6. GOODWILL AND OTHER LONG-LIVED ASSETS
Goodwill
The carrying amounts of goodwill by segment are included in the tables below. Foreign currency fluctuations are included within other adjustments
.
|
January 1, 2015
|
December 31, 2015
|
||||||||||||||||||||||||||||||||||
|
In millions
|
Goodwill
|
Accumulated Impairment Losses
|
Total
|
Additions
|
Impairment
|
Other
|
Goodwill
|
Accumulated Impairment Losses
|
Total
|
||||||||||||||||||||||||||
|
Financial Services
|
$
|
1,493
|
|
|
$
|
—
|
|
|
$
|
1,493
|
|
|
$
|
—
|
|
|
$
|
(4
|
)
|
|
$
|
(3
|
)
|
|
$
|
1,490
|
|
|
$
|
(4
|
)
|
|
$
|
1,486
|
|
|
Retail Solutions
|
581
|
|
|
(7
|
)
|
|
574
|
|
|
—
|
|
|
(1
|
)
|
|
—
|
|
|
581
|
|
|
(8
|
)
|
|
573
|
|
|||||||||
|
Hospitality
|
669
|
|
|
—
|
|
|
669
|
|
|
2
|
|
|
(11
|
)
|
|
(9
|
)
|
|
662
|
|
|
(11
|
)
|
|
651
|
|
|||||||||
|
Emerging Industries
|
24
|
|
|
—
|
|
|
24
|
|
|
—
|
|
|
—
|
|
|
(1
|
)
|
|
23
|
|
|
—
|
|
|
23
|
|
|||||||||
|
Total goodwill
|
$
|
2,767
|
|
|
$
|
(7
|
)
|
|
$
|
2,760
|
|
|
$
|
2
|
|
|
$
|
(16
|
)
|
|
$
|
(13
|
)
|
|
$
|
2,756
|
|
|
$
|
(23
|
)
|
|
$
|
2,733
|
|
|
January 1, 2014
|
December 31, 2014
|
||||||||||||||||||||||||||||||||||
|
In millions
|
Goodwill
|
Accumulated Impairment Losses
|
Total
|
Additions
|
Impairment
|
Other
|
Goodwill
|
Accumulated Impairment Losses
|
Total
|
||||||||||||||||||||||||||
|
Financial Services
|
$
|
255
|
|
$
|
—
|
|
$
|
255
|
|
$
|
1,243
|
|
$
|
—
|
|
$
|
(5
|
)
|
$
|
1,493
|
|
$
|
—
|
|
$
|
1,493
|
|
||||||||
|
Retail Solutions
|
581
|
|
(3
|
)
|
578
|
|
—
|
|
(4
|
)
|
—
|
|
581
|
|
(7
|
)
|
574
|
|
|||||||||||||||||
|
Hospitality
|
676
|
|
—
|
|
676
|
|
—
|
|
—
|
|
(7
|
)
|
669
|
|
—
|
|
669
|
|
|||||||||||||||||
|
Emerging Industries
|
25
|
|
—
|
|
25
|
|
—
|
|
—
|
|
(1
|
)
|
24
|
|
—
|
|
24
|
|
|||||||||||||||||
|
Total goodwill
|
$
|
1,537
|
|
$
|
(3
|
)
|
$
|
1,534
|
|
$
|
1,243
|
|
$
|
(4
|
)
|
$
|
(13
|
)
|
$
|
2,767
|
|
$
|
(7
|
)
|
$
|
2,760
|
|
||||||||
As of
December 31, 2015
, we determined that it was probable that we would dispose of our IPS business, which triggered an impairment assessment of the related assets which include long-lived assets and goodwill. We evaluated the carrying value of these assets compared to the fair value based on a market approach using an independent third-party market price and determined the goodwill associated with the Financial Services, Retail Solutions, and Hospitality reporting units was impaired. The impairment of
$16 million
was recorded within other (expense), net in the Consolidated Statements of Operations for the year ended
December 31, 2015
. Refer to
Note 5, "Business Combinations and Divestitures"
for further discussion.
Purchased Intangible Assets
NCR’s purchased intangible assets, reported in intangibles, net in the Consolidated Balance Sheets, were specifically identified when acquired, and are deemed to have finite lives. The gross carrying amount and accumulated amortization for NCR’s identifiable intangible assets were as set forth in the table below:
|
Amortization
Period
(in Years)
|
December 31, 2015
|
December 31, 2014
|
|||||||||||||||
|
In millions
|
Gross Carrying Amount
|
Accumulated Amortization
|
Gross Carrying Amount
|
Accumulated Amortization
|
|||||||||||||
|
Identifiable intangible assets
|
|||||||||||||||||
|
Reseller & customer relationships
|
1 - 20
|
$
|
659
|
|
$
|
(92
|
)
|
$
|
660
|
|
$
|
(63
|
)
|
||||
|
Intellectual property
|
2 - 8
|
392
|
|
(244
|
)
|
393
|
|
(181
|
)
|
||||||||
|
Customer contracts
|
8
|
89
|
|
(46
|
)
|
89
|
|
(22
|
)
|
||||||||
|
Tradenames
|
2 - 10
|
73
|
|
(33
|
)
|
74
|
|
(24
|
)
|
||||||||
|
Total identifiable intangible assets
|
$
|
1,213
|
|
$
|
(415
|
)
|
$
|
1,216
|
|
$
|
(290
|
)
|
|||||
69
The aggregate amortization expense (actual and estimated) for identifiable intangible assets for the following periods is:
|
For the year ended December 31, 2015
|
For the years ended December 31 (estimated)
|
|||||||||||||||||||||||
|
In millions
|
2016
|
2017
|
2018
|
2019
|
2020
|
|||||||||||||||||||
|
Amortization expense
|
$
|
125
|
|
$
|
125
|
|
$
|
116
|
|
$
|
85
|
|
$
|
75
|
|
$
|
57
|
|
||||||
7. DEBT OBLIGATIONS
The following table summarizes the Company's short-term borrowings and long-term debt:
|
December 31, 2015
|
December 31, 2014
|
|||||||||
|
In millions, except percentages
|
Amount
|
Weighted-Average Interest Rate
|
Amount
|
Weighted-Average Interest Rate
|
||||||
|
Short-Term Borrowings
|
||||||||||
|
Current portion of Senior Secured Credit Facility
(1)
|
$
|
—
|
|
$
|
85
|
|
2.91%
|
|||
|
Trade Receivables Securitization Facility
|
—
|
|
96
|
|
0.83%
|
|||||
|
Other
(2)
|
13
|
|
6.34%
|
6
|
|
7.31%
|
||||
|
Total short-term borrowings
|
$
|
13
|
|
$
|
187
|
|
||||
|
Long-Term Debt
|
||||||||||
|
Senior Secured Credit Facility:
|
||||||||||
|
Term loan facility due 2018
(1)
|
$
|
956
|
|
2.95%
|
$
|
1,246
|
|
2.91%
|
||
|
Revolving credit facility due 2018
(1)
|
100
|
|
2.61%
|
—
|
|
|||||
|
Senior notes:
|
|
|
||||||||
|
5.00% Senior Notes due 2022
|
600
|
|
600
|
|
||||||
|
4.625% Senior Notes due 2021
|
500
|
|
500
|
|
||||||
|
5.875% Senior Notes due 2021
|
400
|
|
400
|
|
||||||
|
6.375% Senior Notes due 2023
|
700
|
|
700
|
|
||||||
|
Deferred Financing Fees
(2)
|
(34
|
)
|
(41
|
)
|
||||||
|
Other
(3)
|
17
|
|
7.16%
|
26
|
|
7.23%
|
||||
|
Total long-term debt
|
$
|
3,239
|
|
$
|
3,431
|
|
||||
|
(1)
|
Interest rates are weighted average interest rates as of
December 31, 2015
and
2014
related to the Senior Secured Credit Facility, which incorporate the impact of the interest rate swap agreement described in
|
|
(2)
|
In 2015, we adopted ASU 2015-03,
Interest - Imputation of Interest: Simplifying the Presentation of Debt Issuance Costs,
which requires debt issuance costs previously reported as a deferred charge within other assets to be presented as a direct reduction from the carrying amount of debt, consistent with debt discounts, applied retrospectively for all periods presented. Long-term debt and other assets as of December 31, 2014 were adjusted by approximately
$41 million
as a result of the adoption of this ASU.
|
|
(3)
|
Interest rates are weighted average interest rates as of
December 31, 2015
and
2014
primarily related to various international credit facilities and a note payable in the U.S.
|
Senior Secured Credit Facility
The Company is party to a senior secured credit facility with JPMorgan Chase Bank, NA (JPMCB), as administrative agent, and a syndicate of lenders (as amended, the Senior Secured Credit Facility). The Senior Secured Credit Facility consists of a term loan facility and a revolving credit facility. As of
December 31, 2015
, the term loan facility had an aggregate principal amount outstanding of
$956 million
. The revolving credit facility had an aggregate principal amount of
$850 million
, of which
$100 million
was outstanding as of
December 31, 2015
. The revolving credit facility also allows a portion of the availability to be used for outstanding letters of credit, and as of
December 31, 2015
, there were
$28 million
in letters of credit outstanding.
The outstanding principal balance of the term loan facility is required to be repaid in equal quarterly installments in annual amounts. As a result of prepayments during the year, the repayment schedule now requires one quarterly installment of approximately
$34
70
million
on June 30, 2018, with the balance being due at maturity on July 25, 2018. Borrowings under the revolving portion of the credit facility are due July 25, 2018. Amounts outstanding under the Senior Secured Credit Facility bear interest, at the Company's option, at a base rate equal to the highest of (i) the federal funds rate plus
0.50%
, (ii) the administrative agent's “prime rate” and (iii) the one-month LIBOR rate plus
1.00%
(the Base Rate) or LIBOR, plus a margin ranging from
0.25%
to
1.25%
for Base Rate-based loans that are either term loans or revolving loans and ranging from
1.25%
to
2.25%
for LIBOR-based loans that are either term loans or revolving loans, depending on the Company's consolidated leverage ratio. The terms of the Senior Secured Credit Facility also require certain other fees and payments to be made by the Company, including a commitment fee on the undrawn portion of the revolving credit facility.
The Company's obligations under the Senior Secured Credit Facility are guaranteed by certain of its wholly-owned domestic subsidiaries. The Senior Secured Credit Facility and these guarantees are secured by a first priority lien and security interest in certain equity interests owned by the Company and the guarantor subsidiaries in certain of their respective domestic and foreign subsidiaries, and a perfected first priority lien and security interest in substantially all of the Company's U.S. assets and the assets of the guarantor subsidiaries, subject to certain exclusions. These security interests would be released if the Company achieves an “investment grade” rating, and will remain released so long as the Company maintains that rating.
The Senior Secured Credit Facility includes affirmative and negative covenants that restrict or limit the ability of the Company and its subsidiaries to, among other things, incur indebtedness; create liens on assets; engage in certain fundamental corporate changes or changes to the Company's business activities; make investments; sell or otherwise dispose of assets; engage in sale-leaseback or hedging transactions; repurchase stock, pay dividends or make similar distributions; repay other indebtedness; engage in certain affiliate transactions; or enter into agreements that restrict the Company's ability to create liens, pay dividends or make loan repayments. The Senior Secured Credit Facility also includes financial covenants that require the Company to maintain:
|
•
|
a consolidated leverage ratio on the last day of any fiscal quarter, not to exceed (i) in the case of any fiscal quarter ending after December 31, 2014 and on or prior to December 31, 2016, (a) the sum of (x)
4.25
and (y) an amount (not to exceed
0.50
) to reflect new debt used to reduce NCR's underfunded pension liabilities, to (b)
1.00
, (ii) in the case of any fiscal quarter ending after December 31, 2016 and on or prior to December 31, 2017,
4.00
to
1.00
, and (iii) in the case of any fiscal quarter ending after December 31, 2017,
3.75
to
1.00
; and
|
|
•
|
an interest coverage ratio on the last day of any fiscal quarter greater than or equal to
3.50
to
1.00
.
|
At
December 31, 2015
, the maximum consolidated leverage ratio under the Senior Secured Credit Facility was
4.35
to 1.00.
The Senior Secured Credit Facility also contains events of default, which are customary for similar financings. Upon the occurrence of an event of default, the lenders may, among other things, terminate the loan commitments, accelerate all loans and require cash collateral deposits in respect of outstanding letters of credit. If the Company is unable to pay or repay the amounts due, the lenders could, among other things, proceed against the collateral granted to them to secure such indebtedness.
The Company may request, at any time and from time to time, but the lenders are not obligated to fund, the establishment of one or more incremental term loans and/or revolving credit facilities (subject to the agreement of existing lenders or additional financial institutions to provide such term loans and/or revolving credit facilities) with commitments in an aggregate amount not to exceed the greater of (i)
$150 million
, and (ii) such amount as would not (a) prior to the date that the Company obtains an investment grade rating cause the leverage ratio under the Senior Secured Credit Facility, calculated on a pro forma basis including the incremental facility and assuming that it and the revolver are fully drawn, to exceed 2.50 to 1.00, and (b) on and after the date that the Company obtains an "investment grade" rating cause the leverage ratio under the Senior Secured Credit Facility, calculated on a pro forma basis including the incremental facility and assuming that it and the revolver are fully drawn, to exceed a ratio that is 0.50 less than the leverage ratio then applicable under the financial covenants of the Senior Secured Credit Facility, the proceeds of which can be used for working capital requirements and other general corporate purposes.
71
Senior Unsecured Notes
On September 17, 2012, the Company issued
$600 million
aggregate principal amount of
5.00%
senior unsecured notes due in 2022 (the 5.00% Notes). The 5.00% Notes were sold at
100%
of the principal amount and will mature on July 15, 2022. On December 18, 2012, the Company issued
$500 million
aggregate principal amount of
4.625%
senior unsecured notes due in 2021 (the 4.625% Notes). The 4.625% Notes were sold at
100%
of the principal amount and will mature on February 15, 2021. On December 19, 2013, the Company issued
$400 million
aggregate principal amount of
5.875%
senior unsecured notes due in 2021 (the 5.875% Notes) and
$700 million
aggregate principal amount of
6.375%
senior unsecured notes due in 2023 (the 6.375% Notes), the proceeds of which were used solely for the acquisition of Digital Insight. The
5.875%
Notes were sold at
100%
of the principal amount and will mature on December 15, 2021 and the
6.375%
Notes were sold at
100%
of the principal amount and will mature on December 15, 2023. The senior unsecured notes are guaranteed, fully and unconditionally, on an unsecured senior basis, by our 100% owned subsidiary, NCR International, Inc.
The Company has the option to redeem the 5.00% Notes, in whole or in part, at any time on or after July 15, 2017, at a redemption price of
102.5%
,
101.667%
,
100.833%
and
100%
during the 12-month periods commencing on July 15, 2017, 2018, 2019 and 2020 and thereafter, respectively, plus accrued and unpaid interest to the redemption date. Prior to July 15, 2017, the Company may redeem the 5.00% Notes, in whole or in part, at a redemption price equal to
100%
of the principal amount plus a make-whole premium and accrued and unpaid interest to the redemption date. Prior to July 15, 2015, we may redeem the 5.00% Notes in an aggregate principal amount not to exceed
35%
of the aggregate principal amount of the notes originally issued at a redemption price of
105%
plus accrued and unpaid interest to the redemption date, with the net cash proceeds from one or more qualified equity offerings under certain further requirements.
The Company has the option to redeem the 4.625% Notes, in whole or in part, at any time on or after February 15, 2017, at a redemption price of
102.313%
,
101.156%
and
100%
during the 12-month periods commencing on February 15, 2017, 2018 and 2019 and thereafter, respectively, plus accrued and unpaid interest to the redemption date. Prior to February 15, 2017, the Company may redeem the 4.625% Notes, in whole or in part, at a redemption price equal to
100%
of the principal amount plus a make-whole premium and accrued and unpaid interest to the redemption date. Prior to February 15, 2016, the Company may redeem the 4.625% Notes in an aggregate principal amount not to exceed
35%
of the aggregate principal amount of the notes originally issued at a redemption price of
104.625%
plus accrued and unpaid interest to the redemption date, with the net cash proceeds from one or more qualified equity offerings under certain further requirements.
The Company has the option to redeem the 5.875% Notes, in whole or in part, at any time on or after December 15, 2017, at a redemption price of
102.938%
,
101.469%
and
100%
during the 12-month periods commencing on December 15, 2017, 2018 and 2019 and thereafter, respectively, plus accrued and unpaid interest to the redemption date. Prior to December 15, 2017, the Company may redeem the 5.875% Notes, in whole or in part, at a redemption price equal to
100%
of the principal amount plus a make-whole premium and accrued and unpaid interest to the redemption date. Prior to December 15, 2016, the Company may redeem the 5.875% Notes in an aggregate principal amount not to exceed
35%
of the aggregate principal amount of the notes originally issued at a redemption price of
105.875%
plus accrued and unpaid interest to the redemption date, with the net cash proceeds from one or more qualified equity offerings under certain further requirements.
The Company has the option to redeem the 6.375% Notes, in whole or in part, at any time on or after December 15, 2018, at a redemption price of
103.188%
,
102.125%
,
101.063%
and
100%
during the 12-month periods commencing on December 15, 2018, 2019, 2020 and 2021 and thereafter, respectively, plus accrued and unpaid interest to the redemption date. Prior to December 15, 2018, the Company may redeem the 6.375% Notes, in whole or in part, at a redemption price equal to
100%
of the principal amount plus a make-whole premium and accrued and unpaid interest to the redemption date. Prior to December 15, 2016, the Company may redeem the 6.375% Notes in an aggregate principal amount not to exceed
35%
of the aggregate principal amount of the notes originally issued at a redemption price of
106.375%
plus accrued and unpaid interest to the redemption date, with the net cash proceeds from one or more qualified equity offerings under certain further requirements.
The terms of the indentures for these notes limit the ability of the Company and certain of its subsidiaries to, among other things, incur additional debt or issue redeemable preferred stock; pay dividends or make certain other restricted payments or investments; incur liens; sell assets; incur restrictions on the ability of the Company's subsidiaries to pay dividends to the Company; enter into affiliate transactions; engage in sale and leaseback transactions; and consolidate, merge, sell or otherwise dispose of all or substantially all of the Company's or such subsidiaries' assets. These covenants are subject to significant exceptions and qualifications. For example, if these notes are assigned an "investment grade" rating by Moody's or S&P and no default has occurred or is continuing, certain covenants will be terminated.
72
Trade Receivables Securitization Facility
In November 2014, the Company established a two-year revolving trade receivables securitization facility (the A/R Facility) with PNC Bank, National Association (PNC) as the administrative agent, and various lenders. The A/R Facility provides for up to
$200 million
in funding based on the availability of eligible receivables and other customary factors and conditions.
Under the A/R Facility, NCR sells and/or contributes certain of its U.S. trade receivables to a wholly-owned, bankruptcy-remote subsidiary as they are originated, and advances by the lenders to that subsidiary are secured by those trade receivables. The assets of this financing subsidiary are restricted as collateral for the payment of its obligations under the A/R Facility, and its assets and credit are not available to satisfy the debts and obligations owed to the creditors of the Company. The Company includes the assets, liabilities and results of operations of this financing subsidiary in its consolidated financial statements. The financing subsidiary owned
$368 million
and
$373 million
of outstanding accounts receivable as of
December 31, 2015
and
2014
, respectively, and these amounts are included in accounts receivable, net in the Company’s Consolidated Balance Sheets.
The financing subsidiary will pay annual commitment and other customary fees to the lenders, and advances by a lender under the A/R Facility will accrue interest (i) at a reserve-adjusted LIBOR rate or a base rate equal to the highest of (a) the applicable lender’s prime rate or (b) the federal funds rate plus
0.50%
, if the lender is a committed lender, or (ii) based on commercial paper interests rates if the lender is a commercial paper conduit lender. Advances may be prepaid at any time without premium or penalty.
The A/R Facility contains various customary affirmative and negative covenants and default and termination provisions which provide for the acceleration of the advances under the A/R Facility in circumstances including, but not limited to, failure to pay interest or principal when due, breach of representation, warranty or covenant, certain insolvency events or failure to maintain the security interest in the trade receivables, and defaults under other material indebtedness.
Debt Maturities
Maturities of long-term debt outstanding, in principal amounts, at
December 31, 2015
are summarized below:
|
For the years ended December 31
|
||||||||||||||||||||||||||||
|
In millions
|
Total
|
2016
|
2017
|
2018
|
2019
|
2020
|
Thereafter
|
|||||||||||||||||||||
|
Debt maturities
|
$
|
3,286
|
|
$
|
13
|
|
$
|
5
|
|
$
|
1,060
|
|
$
|
1
|
|
$
|
905
|
|
$
|
1,302
|
|
|||||||
Fair Value of Debt
The Company utilized Level 2 inputs, as defined in the fair value hierarchy, to measure the fair value of the long-term debt, which, as of
December 31, 2015
and
2014
was
$3.21 billion
and
$3.67 billion
, respectively. Management's fair value estimates were based on quoted prices for recent trades of NCR’s long-term debt, quoted prices for similar instruments, and inquiries with certain investment communities.
8. INCOME TAXES
For
the years ended
December 31
, (loss) income from continuing operations before income taxes consisted of the following:
|
In millions
|
2015
|
2014
|
2013
|
|||||||||
|
(Loss) income before income taxes
|
||||||||||||
|
United States
|
$
|
(24
|
)
|
$
|
(235
|
)
|
$
|
29
|
|
|||
|
Foreign
|
(71
|
)
|
372
|
|
525
|
|
||||||
|
Total (loss) income from continuing operations before income taxes
|
$
|
(95
|
)
|
$
|
137
|
|
$
|
554
|
|
|||
73
For
the years ended
December 31
, income tax expense (benefit) consisted of the following:
|
In millions
|
2015
|
2014
|
2013
|
|||||||||
|
Income tax expense (benefit)
|
||||||||||||
|
Current
|
||||||||||||
|
Federal
|
$
|
(7
|
)
|
$
|
(4
|
)
|
$
|
(13
|
)
|
|||
|
State
|
1
|
|
2
|
|
3
|
|
||||||
|
Foreign
|
37
|
|
79
|
|
105
|
|
||||||
|
Deferred
|
||||||||||||
|
Federal
|
23
|
|
(88
|
)
|
19
|
|
||||||
|
State
|
(6
|
)
|
(7
|
)
|
(4
|
)
|
||||||
|
Foreign
|
7
|
|
(30
|
)
|
(12
|
)
|
||||||
|
Total income tax expense (benefit)
|
$
|
55
|
|
$
|
(48
|
)
|
$
|
98
|
|
|||
The following table presents the principal components of the difference between the effective tax rate and the U.S. federal statutory income tax rate for
the years ended
December 31
:
|
In millions
|
2015
|
2014
|
2013
|
|||||||||
|
Income tax expense (benefit) at the U.S. federal tax rate of 35%
|
$
|
(33
|
)
|
$
|
48
|
|
$
|
194
|
|
|||
|
Foreign income tax differential
|
33
|
|
(72
|
)
|
(86
|
)
|
||||||
|
U.S. permanent book/tax differences
|
(5
|
)
|
(2
|
)
|
3
|
|
||||||
|
Tax audit settlements
|
(10
|
)
|
(15
|
)
|
—
|
|
||||||
|
Change in liability for unrecognized tax benefits
|
(7
|
)
|
—
|
|
29
|
|
||||||
|
Nondeductible transaction costs
|
(1
|
)
|
1
|
|
1
|
|
||||||
|
Goodwill impairment
|
5
|
|
—
|
|
—
|
|
||||||
|
U.S. valuation allowance
|
(3
|
)
|
(8
|
)
|
—
|
|
||||||
|
Valuation allowance releases
|
—
|
|
—
|
|
(25
|
)
|
||||||
|
Settlement of UK London pension plan
|
77
|
|
—
|
|
—
|
|
||||||
|
Tax extenders legislation
|
—
|
|
—
|
|
(16
|
)
|
||||||
|
Other, net
|
(1
|
)
|
—
|
|
(2
|
)
|
||||||
|
Total income tax expense (benefit)
|
$
|
55
|
|
$
|
(48
|
)
|
$
|
98
|
|
|||
NCR's tax provisions include a provision for income taxes in certain tax jurisdictions where its subsidiaries are profitable, but reflect only a portion of the tax benefits related to certain foreign subsidiaries' tax losses due to the uncertainty of the ultimate realization of future benefits from these losses. During
2015
, there was no tax benefit recorded on the
$427 million
charge related to the settlement of the UK London pension plan due to a valuation allowance against deferred tax assets in the United Kingdom. Refer to
Note 10, “Employee Benefit Plans,”
for additional discussion on the settlement of the UK London pension plan. Additionally, we favorably settled examinations with Canada for tax years 2002 through 2006 that resulted in a tax benefit of
$10 million
. During
2014
, we favorably settled examinations with the IRS for the 2009 and 2010 tax years that resulted in a tax benefit of
$13 million
. In addition, the 2014 tax rate was favorably impacted by a
$9 million
reduction in the U.S. valuation allowance and a favorable mix of earnings by country, primarily driven by actuarial pension losses due to a change in the U.S. mortality table. During
2013
, we recorded a one-time benefit of approximately
$16 million
in connection with the American Taxpayer Relief Act of 2012 that was signed into law in January 2013 and the related retroactive tax relief for certain law provisions that expired in 2012. The 2013 tax provision was also favorably impacted by the release of a
$10 million
valuation allowance due to the implementation of a tax planning strategy to access certain deferred tax assets, a
$15 million
reduction in a valuation allowance related to a subsidiary in Japan, and a favorable mix of earnings by country, primarily related to lower pension benefit.
74
Deferred income tax assets and liabilities included in the Consolidated Balance Sheets as of December 31 were as follows:
|
In millions
|
2015
|
2014
|
||||||
|
Deferred income tax assets
|
||||||||
|
Employee pensions and other benefits
|
$
|
276
|
|
$
|
207
|
|
||
|
Other balance sheet reserves and allowances
|
164
|
|
170
|
|
||||
|
Tax loss and credit carryforwards
|
628
|
|
739
|
|
||||
|
Capitalized research and development
|
97
|
|
107
|
|
||||
|
Property, plant and equipment
|
12
|
|
8
|
|
||||
|
Other
|
37
|
|
32
|
|
||||
|
Total deferred income tax assets
|
1,214
|
|
1,263
|
|
||||
|
Valuation allowance
|
(346
|
)
|
(294
|
)
|
||||
|
Net deferred income tax assets
|
868
|
|
969
|
|
||||
|
Deferred income tax liabilities
|
||||||||
|
Intangibles
|
270
|
|
302
|
|
||||
|
Taxable distribution
|
—
|
|
55
|
|
||||
|
Capitalized software
|
36
|
|
32
|
|
||||
|
Other
|
6
|
|
4
|
|
||||
|
Total deferred income tax liabilities
|
312
|
|
393
|
|
||||
|
Total net deferred income tax assets
|
$
|
556
|
|
$
|
576
|
|
||
NCR recorded valuation allowances related to certain deferred income tax assets due to the uncertainty of the ultimate realization of the future benefits from those assets. The valuation allowances cover deferred tax assets, primarily tax loss carryforwards, in tax jurisdictions where there is uncertainty as to the ultimate realization of a benefit from those tax losses. At
December 31, 2015
, our net deferred tax assets in the United States totaled approximately
$456 million
. For the three year period ended December 31, 2015, we had a cumulative net loss from continuing operations before income taxes, which is generally considered a negative indicator of our ability to realize the benefits of those assets. We evaluated the realizability of the U.S. deferred tax assets by weighing positive and negative evidence, including our history of taxable income in the U.S., and the substantial length of time over which our deferred tax assets relating to net operating losses and employee pensions may be realized. Through this assessment, realization of the related benefits was determined to be more likely than not. If we are unable to generate sufficient future taxable income in the time period within which the temporary differences underlying our deferred tax assets become deductible, or before the expiration of our loss and credit carryforwards, additional valuation allowance could be required.
As of
December 31, 2015
, NCR had U.S. federal and foreign tax attribute carryforwards of approximately
$1.3 billion
. The net operating loss carryforwards that are subject to expiration will expire in the years
2016
through 2035. This includes U.S. tax credit carryforwards of
$295 million
. The amount of tax deductions in excess of previously recorded windfall tax benefits associated with stock-based compensation included in U.S. federal tax credit carryforwards but not reflected in deferred tax assets for the year ended December 31, 2015 was
$38 million
. Upon realization of the U.S. federal tax credit carryforwards, the Company will recognize a windfall tax benefit as an increase to additional paid-in capital. Approximately
$21 million
of the credit carryforwards do not expire, and
$274 million
of the credit carryforwards expire in the years 2016 through 2035. As a result of recent stock ownership changes our U.S. tax attributes could be subject to limitations under Section 382 of the U.S. Internal Revenue Code of 1986, as amended, if further material stock ownership changes occur.
75
The aggregate changes in the balance of our gross unrecognized tax benefits were as follows for the years ended December 31:
|
In millions
|
2015
|
2014
|
2013
|
|||||||||
|
Gross unrecognized tax benefits - January 1
|
$
|
248
|
|
$
|
277
|
|
$
|
256
|
|
|||
|
Increases related to tax positions from prior years
|
17
|
|
34
|
|
33
|
|
||||||
|
Decreases related to tax positions from prior years
|
(37
|
)
|
(50
|
)
|
(33
|
)
|
||||||
|
Increases related to tax provisions taken during the current year
|
35
|
|
43
|
|
40
|
|
||||||
|
Settlements with tax authorities
|
(33
|
)
|
(14
|
)
|
(2
|
)
|
||||||
|
Lapses of statutes of limitation
|
(21
|
)
|
(42
|
)
|
(17
|
)
|
||||||
|
Total gross unrecognized tax benefits - December 31
|
$
|
209
|
|
$
|
248
|
|
$
|
277
|
|
|||
Of the total amount of gross unrecognized tax benefits as of
December 31, 2015
,
$109 million
would affect NCR’s effective tax rate if realized. The Company’s liability arising from uncertain tax positions is recorded in income tax accruals and other current liabilities in the Consolidated Balance Sheets.
We recognized interest and penalties associated with uncertain tax positions as part of the provision for income taxes in our Consolidated Statements of Operations of
$4 million
of benefit,
$1 million
of expense, and
$8 million
of expense for the years ended
December 31, 2015
,
2014
, and
2013
, respectively. The gross amount of interest and penalties accrued as of
December 31, 2015
and
2014
was
$46 million
and
$54 million
, respectively.
In the U.S., NCR files consolidated federal and state income tax returns where statutes of limitations generally range from three to five years. The Company resolved examinations for the tax years of 2009 and 2010 with the IRS in 2014, and U.S. federal tax years remain open from 2011 forward. In 2014, the IRS commenced an examination of our 2011, 2012, and 2013 income tax returns, which is ongoing. Years beginning on or after 2001 are still open to examination by certain foreign taxing authorities, including India, Korea, and other major taxing jurisdictions.
During
2016
, the Company expects to resolve certain tax matters related to U.S. and foreign jurisdictions. As of
December 31, 2015
, we estimate that it is reasonably possible that unrecognized tax benefits may decrease by
$10 million
to
$15 million
in the next 12 months due to the resolution of these tax matters.
NCR did not provide for U.S. federal income taxes or foreign withholding taxes in
2015
on approximately
$2.4 billion
of undistributed earnings of its foreign subsidiaries as such earnings are intended to be reinvested indefinitely unless it is determined that future repatriation would give rise to little or no net tax costs. Due to the complexities in the tax laws, the assumptions that we would have to make and the availability and calculation of associated foreign tax credits, it is not practicable to determine the amount of the related unrecognized deferred income tax liability associated with these undistributed earnings.
9. STOCK COMPENSATION PLANS
The Company recognizes all share-based payments, including grants of stock options, as compensation expense in its financial statements based on their fair value.
As of
December 31, 2015
, the Company’s stock-based compensation consisted of restricted stock units and stock options. The Company recorded stock-based compensation expense, the components of which are further described below, for
the years ended
December 31
as follows:
|
In millions
|
2015
|
2014
|
2013
|
||
|
Restricted stock units
|
$42
|
$31
|
$39
|
||
|
Stock options
|
—
|
—
|
2
|
||
|
Total stock-based compensation (pre-tax)
|
42
|
31
|
41
|
||
|
Tax benefit
|
(13)
|
(10)
|
(13)
|
||
|
Total stock-based compensation (net of tax)
|
$29
|
$21
|
$28
|
||
76
Approximately
16 million
shares remain authorized to be issued under the 2013 Stock Incentive Plan (SIP). Details of the Company's stock-based compensation plans are discussed below.
Restricted Stock Units
The SIP provides for the grant of several different forms of stock-based compensation, including restricted stock units. Restricted stock units can have service-based and/or performance-based vesting with performance goals being established by the Compensation and Human Resource Committee of the Company’s Board of Directors. Any grant of restricted stock units is generally subject to a vesting period of
12 months
to
44 months
, to the extent permitted by the SIP. Performance-based grants conditionally vest upon achievement of future performance goals based on performance criteria such as the Company’s achievement of specific return on capital and/or other financial metrics (as defined in the SIP) during the performance period. Performance-based grants must be earned, based on performance, before the actual number of shares to be awarded is known. The Compensation and Human Resource Committee considers the likelihood of meeting the performance criteria based upon estimates and other relevant data, and certifies performance based on its analysis of achievement against the performance criteria. A recipient of restricted stock units does not have the rights of a stockholder and is subject to restrictions on transferability and risk of forfeiture. Other terms and conditions applicable to any award of restricted stock units will be determined by the Compensation and Human Resource Committee and set forth in the agreement relating to that award.
The following table reports restricted stock unit activity during
the year ended
December 31, 2015
:
|
Shares in thousands
|
Number of Units
|
Weighted Average Grant-Date Fair Value per Unit
|
|||||
|
Unvested shares as of January 1
|
4,550
|
|
$
|
27.78
|
|
||
|
Shares granted
|
2,473
|
|
$
|
29.40
|
|
||
|
Shares vested
|
(1,556
|
)
|
$
|
22.27
|
|
||
|
Shares forfeited
|
(512
|
)
|
$
|
30.03
|
|
||
|
Unvested shares as of December 31
|
4,955
|
|
$
|
30.08
|
|
||
Stock-based compensation expense is recognized in the financial statements based upon fair value. The total fair value of units vested and distributed in the form of NCR common stock was
$44 million
in
2015
,
$66 million
in
2014
, and
$33 million
in
2013
. As of
December 31, 2015
, there was
$79 million
of unrecognized compensation cost related to unvested restricted stock unit grants. The unrecognized compensation cost is expected to be recognized over a remaining weighted-average period of
1.1
years. The weighted average grant date fair value for restricted stock unit awards granted in
2014
and
2013
was
$31.85
and
$25.64
, respectively.
The following table represents the composition of restricted stock unit grants in
2015
:
|
Shares in thousands
|
Number of Units
|
Weighted Average Grant-Date Fair Value
|
|||||
|
Service-based units
|
1,401
|
|
$
|
29.05
|
|
||
|
Performance-based units
|
1,072
|
|
$
|
29.86
|
|
||
|
Total restricted stock units
|
2,473
|
|
$
|
29.40
|
|
||
The
2015
performance-based restricted stock unit activity above includes
1.0 million
units related to the
2015
to
2016
performance period. The remaining performance-based restricted stock unit activity in
2015
relates to the achievement of performance goals in
2015
associated with performance-based restricted stock units granted in a prior period.
77
Stock Options
The SIP also provides for the grant of stock options to purchase shares of NCR common stock. The Compensation and Human Resource Committee of the Company's Board of Directors has discretion to determine the material terms and conditions of option awards under the SIP, provided that (i) the exercise price must be no less than the fair market value of NCR common stock (defined as the closing price) on the date of grant, (ii) the term must be no longer than
ten
years, and (iii) in no event shall the normal vesting schedule provide for vesting in less than
one
year. Other terms and conditions of an award of stock options will be determined by the Compensation and Human Resource Committee as set forth in the agreement relating to that award. The Compensation and Human Resource Committee has authority to administer the SIP, except that the Committee on Directors and Governance of the Company’s Board of Directors will administer the SIP with respect to non-employee members of the Board of Directors. New shares of the Company’s common stock are issued as a result of stock option exercises.
Stock-based compensation expense for options was computed using the Black-Scholes option-pricing model. During the years ended
December 31, 2015
,
2014
and
2013
, the Company did not grant any stock options.
The following table summarizes the Company’s stock option activity for
the year ended
December 31, 2015
:
|
Shares in thousands
|
Shares Under Option
|
Weighted Average Exercise Price per Share
|
Weighted Average Remaining Contractual Term (in years)
|
Aggregate Intrinsic Value
(in millions)
|
|||||||||
|
Outstanding as of January 1
|
1,480
|
|
$
|
17.86
|
|
||||||||
|
Exercised
|
(476
|
)
|
$
|
17.28
|
|
||||||||
|
Outstanding as of December 31
|
1,004
|
|
$
|
18.14
|
|
3.03
|
$
|
6
|
|
||||
|
Fully vested and expected to vest as of December 31
|
1,004
|
|
$
|
18.14
|
|
3.03
|
$
|
6
|
|
||||
|
Exercisable as of December 31
|
1,004
|
|
$
|
18.14
|
|
3.03
|
$
|
6
|
|
||||
The total intrinsic value of all options exercised was
$6 million
in
2015
,
$8 million
in
2014
, and
$37 million
in
2013
. Cash received from option exercises under all share-based payment arrangements was
$8 million
in
2015
,
$7 million
in
2014
, and
$51 million
in
2013
. The tax benefit realized from these exercises was
$2 million
in
2015
,
$2 million
in
2014
, and
$12 million
in
2013
.
Other Share-based Plans
The Employee Stock Purchase Plan (ESPP) enables eligible employees to purchase NCR’s common stock at a discount to the average of the highest and lowest sale prices on the last trading day of each month. The ESPP discount is 5% of the average market price. Accordingly, this plan is considered non-compensatory. Employees may authorize payroll deductions of up to 10% of eligible compensation for common stock purchases. Employees purchased approximately
0.3 million
shares in
2015
,
0.2 million
shares in
2014
, and
0.2 million
shares in
2013
, for approximately
$7 million
in
2015
, and
$6 million
in
2014
and
2013
. A total of
4 million
shares were originally authorized to be issued under the new ESPP and approximately
1.2 million
authorized shares remain unissued as of
December 31, 2015
.
10. EMPLOYEE BENEFIT PLANS
Pension, Postretirement and Postemployment Plans
NCR sponsors defined benefit pension plans. NCR’s U.S. pension plan no longer offers additional benefits and is closed to new participants. Internationally, the defined benefit plans are based primarily upon compensation and years of service. Certain international plans also no longer offer additional benefits and are closed to new participants. NCR’s funding policy is to contribute annually not less than the minimum required by applicable laws and regulations. Assets of NCR’s defined benefit plans are primarily invested in corporate and government debt securities, insurance products, common and commingled trusts, publicly traded common stocks, real estate investments, and cash or cash equivalents.
NCR recognizes the funded status of each applicable plan on the Consolidated Balance Sheets. Each overfunded plan is recognized as an asset and each underfunded plan is recognized as a liability. For pension plans, changes in the fair value of plan assets and net actuarial gains or losses are recognized upon remeasurement, which is at least annually in the fourth quarter of each year. For postretirement and postemployment plans, changes to the funded status are recognized as a component of other comprehensive loss in stockholders' equity.
78
NCR sponsors a U.S. postretirement benefit plan that no longer offers benefits to U.S. participants who had not reached a certain age and years of service with NCR. The plan provides medical care benefits to retirees and their eligible dependents. Non-U.S. employees are typically covered under government-sponsored programs, and NCR generally does not provide postretirement benefits other than pensions to non-U.S. retirees. NCR generally funds these benefits on a pay-as-you-go basis.
NCR offers various postemployment benefits to involuntarily terminated and certain inactive employees after employment but before retirement. These benefits are paid in accordance with NCR’s established postemployment benefit practices and policies. Postemployment benefits include mainly severance as well as continuation of healthcare benefits and life insurance coverage while on disability. NCR provides appropriate accruals for these postemployment benefits. These postemployment benefits are funded on a pay-as-you-go basis.
Pension Plans
Reconciliation of the beginning and ending balances of the benefit obligations for NCR's pension plans are as follows:
|
U.S. Pension Benefits
|
International Pension Benefits
|
Total Pension Benefits
|
||||||||||||||||||||||
|
In millions
|
2015
|
2014
|
2015
|
2014
|
2015
|
2014
|
||||||||||||||||||
|
Change in benefit obligation
|
||||||||||||||||||||||||
|
Benefit obligation as of January 1
|
$
|
2,271
|
|
$
|
2,931
|
|
$
|
2,106
|
|
$
|
2,214
|
|
$
|
4,377
|
|
$
|
5,145
|
|
||||||
|
Net service cost
|
—
|
|
—
|
|
12
|
|
12
|
|
12
|
|
12
|
|
||||||||||||
|
Interest cost
|
87
|
|
130
|
|
42
|
|
81
|
|
129
|
|
211
|
|
||||||||||||
|
Amendment
|
—
|
|
—
|
|
3
|
|
18
|
|
3
|
|
18
|
|
||||||||||||
|
Actuarial (gain) loss
|
(93
|
)
|
353
|
|
(17
|
)
|
332
|
|
(110
|
)
|
685
|
|
||||||||||||
|
Benefits paid
|
(110
|
)
|
(1,143
|
)
|
(1,364
|
)
|
(393
|
)
|
(1,474
|
)
|
(1,536
|
)
|
||||||||||||
|
Plan participant contributions
|
—
|
|
—
|
|
2
|
|
3
|
|
2
|
|
3
|
|
||||||||||||
|
Curtailment
|
—
|
|
—
|
|
(2
|
)
|
—
|
|
(2
|
)
|
—
|
|
||||||||||||
|
Settlement
|
—
|
|
—
|
|
425
|
|
(1
|
)
|
425
|
|
(1
|
)
|
||||||||||||
|
Currency translation adjustments
|
—
|
|
—
|
|
(48
|
)
|
(160
|
)
|
(48
|
)
|
(160
|
)
|
||||||||||||
|
Benefit obligation as of December 31
|
$
|
2,155
|
|
$
|
2,271
|
|
$
|
1,159
|
|
$
|
2,106
|
|
$
|
3,314
|
|
$
|
4,377
|
|
||||||
|
Accumulated benefit obligation as of December 31
|
$
|
2,155
|
|
$
|
2,271
|
|
$
|
1,148
|
|
$
|
2,070
|
|
$
|
3,303
|
|
$
|
4,341
|
|
||||||
A reconciliation of the beginning and ending balances of the fair value of the plan assets of NCR's pension plans are as follows:
|
U.S. Pension Benefits
|
International Pension Benefits
|
Total Pension Benefits
|
||||||||||||||||||||||
|
In millions
|
2015
|
2014
|
2015
|
2014
|
2015
|
2014
|
||||||||||||||||||
|
Change in plan assets
|
||||||||||||||||||||||||
|
Fair value of plan assets as of January 1
|
$
|
1,884
|
|
$
|
2,683
|
|
$
|
2,325
|
|
$
|
2,373
|
|
$
|
4,209
|
|
$
|
5,056
|
|
||||||
|
Actual return on plan assets
|
(48
|
)
|
326
|
|
38
|
|
433
|
|
(10
|
)
|
759
|
|
||||||||||||
|
Company contributions
|
—
|
|
18
|
|
33
|
|
69
|
|
33
|
|
87
|
|
||||||||||||
|
Benefits paid
|
(110
|
)
|
(1,143
|
)
|
(1,364
|
)
|
(393
|
)
|
(1,474
|
)
|
(1,536
|
)
|
||||||||||||
|
Currency translation adjustments
|
—
|
|
—
|
|
(25
|
)
|
(160
|
)
|
(25
|
)
|
(160
|
)
|
||||||||||||
|
Plan participant contributions
|
—
|
|
—
|
|
2
|
|
3
|
|
2
|
|
3
|
|
||||||||||||
|
Fair value of plan assets as of December 31
|
$
|
1,726
|
|
$
|
1,884
|
|
$
|
1,009
|
|
$
|
2,325
|
|
$
|
2,735
|
|
$
|
4,209
|
|
||||||
In November 2013, the trustees of the NCR Pension Plan (UK London) entered into an agreement with Pension Insurance Corporation (PIC) to purchase, as a plan asset, an insurance policy with PIC to facilitate the wind-up and buy-out of the pension plan. NCR Limited, a UK subsidiary of the Company, was the principal employer of the pension plan which had approximately 5,400 participants. During the second quarter of
2015
, the Company completed the transfer of the UK London pension plan to PIC by issuing individual insurance policies. As a result of the transfer, the Company recorded a settlement loss of
$427 million
in the Consolidated Statement of Operations as well as an offsetting decrease to prepaid pension costs in the Consolidated Balance Sheet.
79
During 2014, the Company offered a voluntary lump sum payment option to certain former employees who were participants of the Company's U.S. pension plan who had started monthly payments of their pension benefit. The voluntary lump sum payment offer was completed during the fourth quarter of 2014. In addition, during 2014, the Company entered into an agreement with an insurer, where the Company's U.S. qualified plan purchased a single premium group annuity contract from the insurer in order to secure benefits for approximately 4,500 former employees or their related beneficiaries who commenced monthly pension benefits under the plan before January 1, 1994. Additionally, during 2014, the Company transferred the pension plan obligations in Spain and the Netherlands to a third party through the completion of a buy-out of the pension plans.
The following table presents the funded status and the reconciliation of the funded status to amounts recognized in the Consolidated Balance Sheets and in accumulated other comprehensive loss as of
December 31
:
|
U.S. Pension Benefits
|
International Pension Benefits
|
Total Pension Benefits
|
||||||||||||||||||||||
|
In millions
|
2015
|
2014
|
2015
|
2014
|
2015
|
2014
|
||||||||||||||||||
|
Funded Status
|
$
|
(429
|
)
|
$
|
(387
|
)
|
$
|
(150
|
)
|
$
|
219
|
|
$
|
(579
|
)
|
$
|
(168
|
)
|
||||||
|
Amounts recognized in the Consolidated Balance Sheets
|
||||||||||||||||||||||||
|
Noncurrent assets
|
$
|
—
|
|
$
|
—
|
|
$
|
130
|
|
$
|
551
|
|
$
|
130
|
|
$
|
551
|
|
||||||
|
Current liabilities
|
—
|
|
—
|
|
(13
|
)
|
(14
|
)
|
(13
|
)
|
(14
|
)
|
||||||||||||
|
Noncurrent liabilities
|
(429
|
)
|
(387
|
)
|
(267
|
)
|
(318
|
)
|
(696
|
)
|
(705
|
)
|
||||||||||||
|
Net amounts recognized
|
$
|
(429
|
)
|
$
|
(387
|
)
|
$
|
(150
|
)
|
$
|
219
|
|
$
|
(579
|
)
|
$
|
(168
|
)
|
||||||
|
Amounts recognized in accumulated other comprehensive loss
|
||||||||||||||||||||||||
|
Prior service cost
|
—
|
|
—
|
|
19
|
|
17
|
|
19
|
|
17
|
|
||||||||||||
|
Total
|
$
|
—
|
|
$
|
—
|
|
$
|
19
|
|
$
|
17
|
|
$
|
19
|
|
$
|
17
|
|
||||||
For pension plans with accumulated benefit obligations in excess of plan assets, the projected benefit obligation, accumulated benefit obligation and fair value of assets were
$2,692 million
,
$2,682 million
, and
$2,013 million
, respectively, as of
December 31, 2015
, and
$2,935 million
,
$2,922 million
and
$2,244 million
, respectively, as of
December 31, 2014
.
The net periodic benefit (income) cost of the pension plans for
the years ended
December 31
was as follows:
|
In millions
|
U.S. Pension Benefits
|
International
Pension Benefits
|
Total Pension Benefits
|
||||||||||||||||||||||||||||||||
|
2015
|
2014
|
2013
|
2015
|
2014
|
2013
|
2015
|
2014
|
2013
|
|||||||||||||||||||||||||||
|
Net service cost
|
$
|
—
|
|
$
|
—
|
|
$
|
—
|
|
$
|
12
|
|
$
|
12
|
|
$
|
14
|
|
$
|
12
|
|
$
|
12
|
|
$
|
14
|
|
||||||||
|
Interest cost
|
87
|
|
130
|
|
124
|
|
42
|
|
81
|
|
79
|
|
129
|
|
211
|
|
203
|
|
|||||||||||||||||
|
Expected return on plan assets
|
(72
|
)
|
(118
|
)
|
(109
|
)
|
(60
|
)
|
(104
|
)
|
(99
|
)
|
(132
|
)
|
(222
|
)
|
(208
|
)
|
|||||||||||||||||
|
Amortization of prior service cost
|
—
|
|
—
|
|
—
|
|
1
|
|
2
|
|
6
|
|
1
|
|
2
|
|
6
|
|
|||||||||||||||||
|
Special termination benefit cost
|
—
|
|
—
|
|
26
|
|
—
|
|
—
|
|
—
|
|
—
|
|
—
|
|
26
|
|
|||||||||||||||||
|
Curtailment
|
—
|
|
—
|
|
—
|
|
(2
|
)
|
—
|
|
—
|
|
(2
|
)
|
—
|
|
—
|
|
|||||||||||||||||
|
Settlement
|
—
|
|
—
|
|
—
|
|
427
|
|
(1
|
)
|
—
|
|
427
|
|
(1
|
)
|
—
|
|
|||||||||||||||||
|
Actuarial (gain) loss
|
27
|
|
146
|
|
(43
|
)
|
2
|
|
4
|
|
(76
|
)
|
29
|
|
150
|
|
(119
|
)
|
|||||||||||||||||
|
Net periodic benefit (income) cost
|
$
|
42
|
|
$
|
158
|
|
$
|
(2
|
)
|
$
|
422
|
|
$
|
(6
|
)
|
$
|
(76
|
)
|
$
|
464
|
|
$
|
152
|
|
$
|
(78
|
)
|
||||||||
During 2015, the Company transferred the UK London pension plan obligations to PIC through the completion of a buy-out of the pension plan, resulting in a settlement of
$427 million
in 2015.
80
During 2014, the Company transferred the pension plan obligations in Spain and the Netherlands to a third party through the completion of a buy-out of the pension plans, resulting in an actuarial loss in 2014. During 2013, a select group of U.S. employees were offered the option to participate in a voluntary early retirement opportunity, which included incremental benefits for each employee who elected to participate, resulting in recognition of special termination benefit costs totaling
$26 million
. Additionally, during the year ended December 31, 2013, an actuarial gain of
$15 million
was recognized associated with the termination of NCR's U.S. non-qualified pension plans.
The weighted average rates and assumptions used to determine benefit obligations as of December 31 were as follows:
|
U.S. Pension Benefits
|
International Pension Benefits
|
Total Pension Benefits
|
||||||||||||||||
|
2015
|
2014
|
2015
|
2014
|
2015
|
2014
|
|||||||||||||
|
Discount rate
|
4.3
|
%
|
4.0
|
%
|
2.6
|
%
|
2.9
|
%
|
3.7
|
%
|
3.5
|
%
|
||||||
|
Rate of compensation increase
|
N/A
|
|
N/A
|
|
1.3
|
%
|
1.8
|
%
|
1.3
|
%
|
1.8
|
%
|
||||||
The weighted average rates and assumptions used to determine net periodic benefit cost for
the years ended
December 31
were as follows:
|
U.S. Pension Benefits
|
International
Pension Benefits
|
Total Pension Benefits
|
|||||||||||||||||||||||||
|
2015
|
2014
|
2013
|
2015
|
2014
|
2013
|
2015
|
2014
|
2013
|
|||||||||||||||||||
|
Discount rate
|
4.0
|
%
|
4.6
|
%
|
3.8
|
%
|
2.9
|
%
|
3.8
|
%
|
3.7
|
%
|
3.5
|
%
|
4.3
|
%
|
3.7
|
%
|
|||||||||
|
Expected return on plan assets
|
4.0
|
%
|
4.6
|
%
|
3.8
|
%
|
3.8
|
%
|
4.5
|
%
|
4.6
|
%
|
3.9
|
%
|
4.5
|
%
|
4.1
|
%
|
|||||||||
|
Rate of compensation increase
|
N/A
|
|
N/A
|
|
N/A
|
|
1.8
|
%
|
2.7
|
%
|
2.5
|
%
|
1.8
|
%
|
2.7
|
%
|
2.5
|
%
|
|||||||||
The discount rate used to determine
December 31, 2015
U.S. benefit obligations was derived by matching the plans’ expected future cash flows to the corresponding yields from the Aon Hewitt AA Bond Universe Curve. This yield curve has been constructed to represent the available yields on high-quality, fixed-income investments across a broad range of future maturities. International discount rates were determined by examining interest rate levels and trends within each country, particularly yields on high-quality, long-term corporate bonds, relative to our future expected cash flows. During 2014, the Society of Actuaries published updated mortality tables and an improvement scale for U.S. plans, which both reflect improved longevity. Based on evaluation of these new tables, we updated our mortality assumptions for our U.S. pension benefits as of
December 31, 2014
.
NCR employs a building block approach as its primary approach in determining the long-term expected rate of return assumptions for plan assets. Historical market returns are studied and long-term relationships between equities and fixed income are preserved consistent with the widely accepted capital market principle that assets with higher volatilities generate higher returns over the long run. Current market factors, such as inflation and interest rates are evaluated before long-term capital market assumptions are determined. The expected long-term portfolio return is established for each plan via a building block approach with proper rebalancing consideration. The result is then adjusted to reflect additional expected return from active management net of plan expenses. Historical plan returns, the expectations of other capital market participants, and peer data may be used to review and assess the results for reasonableness and appropriateness.
Plan Assets
The weighted average asset allocations as of
December 31, 2015
and
2014
by asset category are as follows:
|
U.S. Pension Fund
|
International Pension Fund
|
|||||||||||||||
|
Actual Allocation of Plan Assets as of December 31
|
Target Asset Allocation
|
Actual Allocation of Plan Assets as of December 31
|
Target Asset Allocation
|
|||||||||||||
|
2015
|
2014
|
2015
|
2014
|
|||||||||||||
|
Equity securities
|
—
|
%
|
—
|
%
|
0%
|
24
|
%
|
10
|
%
|
15 - 31%
|
||||||
|
Debt securities and insurance products
|
96
|
%
|
95
|
%
|
95 - 100%
|
50
|
%
|
77
|
%
|
45 - 58%
|
||||||
|
Real estate
|
1
|
%
|
2
|
%
|
0 - 2%
|
13
|
%
|
6
|
%
|
6 - 15%
|
||||||
|
Other
|
3
|
%
|
3
|
%
|
0 - 3%
|
13
|
%
|
7
|
%
|
10 - 20%
|
||||||
|
Total
|
100
|
%
|
100
|
%
|
100
|
%
|
100
|
%
|
||||||||
81
The fair value of plan assets as of
December 31, 2015
and
2014
by asset category is as follows:
|
U.S.
|
International
|
||||||||||||||||||||||||||||||||||
|
In millions
|
Notes
|
Fair Value as of December 31, 2015
|
Quoted Prices in Active Markets for Identical Assets (Level 1)
|
Significant Other Observable Inputs (Level 2)
|
Significant Unobservable Inputs
(Level 3)
|
Fair Value as of December 31, 2015
|
Quoted Prices in Active Markets for Identical Assets (Level 1)
|
Significant Other Observable Inputs (Level 2)
|
Significant Unobservable Inputs
(Level 3)
|
||||||||||||||||||||||||||
|
Assets
|
|||||||||||||||||||||||||||||||||||
|
Equity securities:
|
|||||||||||||||||||||||||||||||||||
|
Common stock
|
1
|
|
$
|
—
|
|
$
|
—
|
|
$
|
—
|
|
$
|
—
|
|
$
|
50
|
|
$
|
50
|
|
$
|
—
|
|
$
|
—
|
|
|||||||||
|
Fixed income securities:
|
|||||||||||||||||||||||||||||||||||
|
Government securities
|
2
|
|
222
|
|
—
|
|
222
|
|
—
|
|
13
|
|
—
|
|
13
|
|
—
|
|
|||||||||||||||||
|
Corporate debt
|
3
|
|
805
|
|
—
|
|
805
|
|
—
|
|
145
|
|
—
|
|
141
|
|
4
|
|
|||||||||||||||||
|
Other types of investments:
|
|||||||||||||||||||||||||||||||||||
|
Money market funds
|
4
|
|
35
|
|
—
|
|
35
|
|
—
|
|
13
|
|
—
|
|
13
|
|
—
|
|
|||||||||||||||||
|
Common and commingled trusts - Equities
|
4
|
|
—
|
|
—
|
|
—
|
|
—
|
|
184
|
|
—
|
|
184
|
|
—
|
|
|||||||||||||||||
|
Common and commingled trusts - Bonds
|
4
|
|
499
|
|
—
|
|
499
|
|
—
|
|
327
|
|
—
|
|
327
|
|
—
|
|
|||||||||||||||||
|
Common and commingled trusts - Short Term Investments
|
4
|
|
30
|
|
—
|
|
30
|
|
—
|
|
31
|
|
—
|
|
31
|
|
—
|
|
|||||||||||||||||
|
Common and commingled trusts - Balanced
|
4
|
|
—
|
|
—
|
|
—
|
|
—
|
|
116
|
|
—
|
|
116
|
|
—
|
|
|||||||||||||||||
|
Partnership/joint venture interests - Real estate
|
5
|
|
21
|
|
—
|
|
—
|
|
21
|
|
—
|
|
—
|
|
—
|
|
—
|
|
|||||||||||||||||
|
Partnership/joint venture interests - Other
|
5
|
|
41
|
|
—
|
|
—
|
|
41
|
|
—
|
|
—
|
|
—
|
|
—
|
|
|||||||||||||||||
|
Mutual funds
|
4
|
|
73
|
|
73
|
|
—
|
|
—
|
|
—
|
|
—
|
|
—
|
|
—
|
|
|||||||||||||||||
|
Insurance products
|
6
|
|
—
|
|
—
|
|
—
|
|
—
|
|
1
|
|
—
|
|
1
|
|
—
|
|
|||||||||||||||||
|
Real estate and other
|
5
|
|
—
|
|
—
|
|
—
|
|
—
|
|
129
|
|
—
|
|
—
|
|
129
|
|
|||||||||||||||||
|
Total
|
$
|
1,726
|
|
$
|
73
|
|
$
|
1,591
|
|
$
|
62
|
|
$
|
1,009
|
|
$
|
50
|
|
$
|
826
|
|
$
|
133
|
|
|||||||||||
82
|
U.S.
|
International
|
||||||||||||||||||||||||||||||||||
|
In millions
|
Notes
|
Fair Value as of December 31, 2014
|
Quoted Prices in Active Markets for Identical Assets (Level 1)
|
Significant Other Observable Inputs (Level 2)
|
Significant Unobservable Inputs
(Level 3)
|
Fair Value as of December 31, 2014
|
Quoted Prices in Active Markets for Identical Assets (Level 1)
|
Significant Other Observable Inputs (Level 2)
|
Significant Unobservable Inputs
(Level 3)
|
||||||||||||||||||||||||||
|
Assets
|
|||||||||||||||||||||||||||||||||||
|
Equity securities:
|
|||||||||||||||||||||||||||||||||||
|
Common stock
|
1
|
|
$
|
—
|
|
$
|
—
|
|
$
|
—
|
|
$
|
—
|
|
$
|
46
|
|
$
|
46
|
|
$
|
—
|
|
$
|
—
|
|
|||||||||
|
Fixed income securities:
|
|||||||||||||||||||||||||||||||||||
|
Government securities
|
2
|
|
215
|
|
—
|
|
215
|
|
—
|
|
131
|
|
—
|
|
131
|
|
—
|
|
|||||||||||||||||
|
Corporate debt
|
3
|
|
903
|
|
—
|
|
903
|
|
—
|
|
232
|
|
—
|
|
227
|
|
5
|
|
|||||||||||||||||
|
Other types of investments:
|
|||||||||||||||||||||||||||||||||||
|
Money market funds
|
4
|
|
47
|
|
—
|
|
47
|
|
—
|
|
29
|
|
—
|
|
29
|
|
—
|
|
|||||||||||||||||
|
Common and commingled trusts - Equities
|
4
|
|
—
|
|
—
|
|
—
|
|
—
|
|
148
|
|
—
|
|
148
|
|
—
|
|
|||||||||||||||||
|
Common and commingled trusts - Bonds
|
4
|
|
517
|
|
—
|
|
517
|
|
—
|
|
198
|
|
—
|
|
198
|
|
—
|
|
|||||||||||||||||
|
Common and commingled trusts - Short Term Investments
|
4
|
|
49
|
|
—
|
|
49
|
|
—
|
|
32
|
|
—
|
|
32
|
|
—
|
|
|||||||||||||||||
|
Common and commingled trusts - Balanced
|
4
|
|
—
|
|
—
|
|
—
|
|
—
|
|
124
|
|
—
|
|
124
|
|
—
|
|
|||||||||||||||||
|
Partnership/joint venture interests - Real estate
|
5
|
|
34
|
|
—
|
|
—
|
|
34
|
|
—
|
|
—
|
|
—
|
|
—
|
|
|||||||||||||||||
|
Partnership/joint venture interests - Other
|
5
|
|
40
|
|
—
|
|
—
|
|
40
|
|
25
|
|
—
|
|
—
|
|
25
|
|
|||||||||||||||||
|
Mutual funds
|
4
|
|
79
|
|
79
|
|
—
|
|
—
|
|
—
|
|
—
|
|
—
|
|
—
|
|
|||||||||||||||||
|
Insurance products
|
6
|
|
—
|
|
—
|
|
—
|
|
—
|
|
1,232
|
|
—
|
|
1
|
|
1,231
|
|
|||||||||||||||||
|
Real estate and other
|
5
|
|
—
|
|
—
|
|
—
|
|
—
|
|
128
|
|
—
|
|
—
|
|
128
|
|
|||||||||||||||||
|
Total
|
$
|
1,884
|
|
$
|
79
|
|
$
|
1,731
|
|
$
|
74
|
|
$
|
2,325
|
|
$
|
46
|
|
$
|
890
|
|
$
|
1,389
|
|
|||||||||||
83
Notes:
|
1.
|
Common stocks are valued based on quoted market prices at the closing price as reported on the active market on which the individual securities are traded.
|
|
2.
|
Government securities are valued based on yields currently available on comparable securities of issuers with similar credit ratings. When quoted prices are not available for identical or similar securities, the security is valued under a discounted cash flows approach that maximizes observable inputs, such as current yields on similar instruments but includes adjustments for certain risks that may not be observable, such as credit and liquidity risks.
|
|
3.
|
Corporate debt is valued primarily based on observable market quotations for similar bonds at the closing price reported on the active market on which the individual securities are traded. When such quoted prices are not available, the bonds are valued using a discounted cash flows approach using current yields on similar instruments of issuers with similar credit ratings.
|
|
4.
|
Common/collective trusts and registered investment companies (RICs) such as mutual funds are valued using a Net Asset Value (NAV) provided by the manager of each fund. The NAV is based on the underlying net assets owned by the fund, divided by the number of shares or units outstanding. The fair value of the underlying securities within the fund, which are generally traded on an active market, are valued at the closing price reported on the active market on which those individual securities are traded. For investments not traded on an active market, or for which a quoted price is not publicly available, a variety of unobservable valuation methodologies, including discounted cash flow, market multiple and cost valuation approaches, are employed by the fund manager or independent third party to value investments.
|
|
5.
|
Partnership/joint ventures and hedge funds are valued based on the fair value of the underlying securities within the fund, which include investments both traded on an active market and not traded on an active market. For those investments that are traded on an active market, the values are based on the closing price reported on the active market on which those individual securities are traded and in the case of hedge funds they are valued using a Net Asset Value (NAV) provided by the manager of each fund. For investments not traded on an active market, or for which a quoted price is not publicly available, a variety of unobservable valuation methodologies, including discounted cash flow, market multiples and cost valuation approaches, are employed by the fund manager to value investments.
|
|
6.
|
For insurance products, when quoted prices are not available for identical or similar investments, the insurance product is valued under a discounted cash flows approach that maximizes observable inputs, such as current yields on similar instruments but includes adjustments for certain risks that may not be observable, such as credit and liquidity risks.
|
The following table presents the reconciliation of the beginning and ending balances of those plan assets classified within Level 3 of the valuation hierarchy. When the determination is made to classify the plan assets within Level 3, the determination is based upon the significance of the unobservable inputs to the overall fair value measurement.
|
In millions
|
U.S. Pension Plans
|
International Pension Plans
|
||||||
|
Balance, December 31, 2013
|
$
|
83
|
|
$
|
187
|
|
||
|
Realized and unrealized gains and losses, net
|
10
|
|
(6
|
)
|
||||
|
Purchases, sales and settlements, net
|
(19
|
)
|
(24
|
)
|
||||
|
Transfers, net
|
—
|
|
1,232
|
|
||||
|
Balance, December 31, 2014
|
$
|
74
|
|
$
|
1,389
|
|
||
|
Realized and unrealized gains and losses, net
|
7
|
|
(59
|
)
|
||||
|
Purchases, sales and settlements, net
|
(19
|
)
|
(1,196
|
)
|
||||
|
Transfers, net
|
—
|
|
(1
|
)
|
||||
|
Balance, December 31, 2015
|
$
|
62
|
|
$
|
133
|
|
||
Investment Strategy
NCR has historically employed a total return investment approach, whereby a mix of fixed-income, equities and real estate investments are used to maximize the long-term return of plan assets subject to a prudent level of risk. The risk tolerance is established for each plan through a careful consideration of plan liabilities, plan funded status and corporate financial condition. To reduce volatility in the value of assets held by the U.S. pension plan, we have rebalanced the asset allocation to a portfolio of
96%
of fixed income assets as of
December 31, 2015
. Similar investment strategy changes are under consideration or being implemented in a number of NCR’s international plans.
The investment portfolios contain primarily fixed-income investments,which are diversified across U.S. and non-U.S. issuers, type of fixed-income security (i.e., government bonds, corporate bonds, mortgage-backed securities) and credit quality. The investment portfolios also contain a blend of equity investments, which are diversified across U.S. and non-U.S. stocks, small and large capitalization stocks, and growth and value stocks, primarily of non-U.S. issuers. Where applicable, real estate investments are made through real estate securities, partnership interests or direct investment and are diversified by property type and location.
84
Other assets, such as cash or private equity are used judiciously to improve portfolio diversification and enhance risk-adjusted portfolio returns. Derivatives may be used to adjust market exposures in an efficient and timely manner. Due to the timing of security purchases and sales, cash held by fund managers is classified in the same asset category as the related investment. Rebalancing algorithms are applied to keep the asset mix of the plans from deviating excessively from their targets. Investment risk is measured and monitored on an ongoing basis through regular performance reporting, investment manager reviews, actuarial liability measurements and periodic investment strategy reviews.
85
Postretirement Plans
Reconciliation of the beginning and ending balances of the benefit obligation for NCR's U.S. postretirement plan is as follows:
|
Postretirement Benefits
|
||||||||
|
In millions
|
2015
|
2014
|
||||||
|
Change in benefit obligation
|
||||||||
|
Benefit obligation as of January 1
|
$
|
26
|
|
$
|
27
|
|
||
|
Gross service cost
|
—
|
|
—
|
|
||||
|
Interest cost
|
1
|
|
1
|
|
||||
|
Actuarial loss
|
2
|
|
1
|
|
||||
|
Plan participant contributions
|
1
|
|
2
|
|
||||
|
Benefits paid
|
(3
|
)
|
(5
|
)
|
||||
|
Benefit obligation as of December 31
|
$
|
27
|
|
$
|
26
|
|
||
The following table presents the funded status and the reconciliation of the funded status to amounts recognized in the Consolidated Balance Sheets and in accumulated other comprehensive loss as of
December 31
:
|
Postretirement Benefits
|
||||||||
|
In millions
|
2015
|
2014
|
||||||
|
Benefit obligation
|
$
|
(27
|
)
|
$
|
(26
|
)
|
||
|
Amounts recognized in the Consolidated Balance Sheets
|
||||||||
|
Current liabilities
|
$
|
(4
|
)
|
$
|
(3
|
)
|
||
|
Noncurrent liabilities
|
(23
|
)
|
(23
|
)
|
||||
|
Net amounts recognized
|
$
|
(27
|
)
|
$
|
(26
|
)
|
||
|
Amounts recognized in accumulated other comprehensive loss
|
||||||||
|
Net actuarial loss
|
$
|
20
|
|
$
|
20
|
|
||
|
Prior service benefit
|
(33
|
)
|
(51
|
)
|
||||
|
Total
|
$
|
(13
|
)
|
$
|
(31
|
)
|
||
The net periodic benefit income of the postretirement plan for
the years ended
December 31
was:
|
In millions
|
Postretirement Benefits
|
|||||||||||
|
2015
|
2014
|
2013
|
||||||||||
|
Interest cost
|
$
|
1
|
|
$
|
1
|
|
$
|
1
|
|
|||
|
Net service cost
|
—
|
|
—
|
|
—
|
|
||||||
|
Amortization of:
|
|
|
|
|||||||||
|
Prior service benefit
|
(18
|
)
|
(18
|
)
|
(18
|
)
|
||||||
|
Actuarial loss
|
2
|
|
2
|
|
2
|
|
||||||
|
Net periodic benefit income
|
$
|
(15
|
)
|
$
|
(15
|
)
|
$
|
(15
|
)
|
|||
The assumptions utilized in accounting for postretirement benefit obligations as of
December 31
and for postretirement benefit income for
the years ended
December 31
were:
|
Postretirement Benefit Obligations
|
Postretirement Benefit Costs
|
||||||||||||||
|
2015
|
2014
|
2015
|
2014
|
2013
|
|||||||||||
|
Discount rate
|
3.3
|
%
|
3.1
|
%
|
3.1
|
%
|
3.4
|
%
|
2.6
|
%
|
|||||
86
Assumed healthcare cost trend rates as of
December 31
were:
|
2015
|
2014
|
|||||||||||
|
Pre-65 Coverage
|
Post-65 Coverage
|
Pre-65 Coverage
|
Post-65 Coverage
|
|||||||||
|
Healthcare cost trend rate assumed for next year
|
6.8
|
%
|
5.9
|
%
|
7.0
|
%
|
6.0
|
%
|
||||
|
Rate to which the cost trend rate is assumed to decline (the ultimate trend rate)
|
5.0
|
%
|
5.0
|
%
|
5.0
|
%
|
5.0
|
%
|
||||
|
Year that the rate reaches the ultimate rate
|
2024
|
|
2024
|
|
2024
|
|
2024
|
|
||||
In addition, a
one
percentage point change in assumed healthcare cost trend rates would have had an immaterial impact on the postretirement benefit income and obligation.
Postemployment Benefits
Reconciliation of the beginning and ending balances of the benefit obligation for NCR's postemployment plan was:
|
Postemployment Benefits
|
||||||||
|
In millions
|
2015
|
2014
|
||||||
|
Change in benefit obligation
|
||||||||
|
Benefit obligation as of January 1
|
$
|
227
|
|
$
|
176
|
|
||
|
Restructuring program cost
|
1
|
|
73
|
|
||||
|
Service cost
|
17
|
|
17
|
|
||||
|
Interest cost
|
3
|
|
5
|
|
||||
|
Amendments
|
(12
|
)
|
(1
|
)
|
||||
|
Benefits paid
|
(47
|
)
|
(31
|
)
|
||||
|
Foreign currency exchange
|
(12
|
)
|
(16
|
)
|
||||
|
Actuarial (gain) loss
|
(34
|
)
|
4
|
|
||||
|
Benefit obligation as of December 31
|
$
|
143
|
|
$
|
227
|
|
||
The following tables present the funded status and the reconciliation of the unfunded status to amounts recognized in the Consolidated Balance Sheets and in accumulated other comprehensive loss at
December 31
:
|
Postemployment Benefits
|
||||||||
|
In millions
|
2015
|
2014
|
||||||
|
Benefit obligation
|
$
|
(143
|
)
|
$
|
(227
|
)
|
||
|
Amounts recognized in the Consolidated Balance Sheets
|
||||||||
|
Current liabilities
|
$
|
(33
|
)
|
$
|
(80
|
)
|
||
|
Noncurrent liabilities
|
(110
|
)
|
(147
|
)
|
||||
|
Net amounts recognized
|
$
|
(143
|
)
|
$
|
(227
|
)
|
||
|
Amounts recognized in accumulated other comprehensive loss
|
||||||||
|
Net actuarial gain
|
$
|
(47
|
)
|
$
|
(3
|
)
|
||
|
Prior service benefit
|
(23
|
)
|
(15
|
)
|
||||
|
Total
|
$
|
(70
|
)
|
$
|
(18
|
)
|
||
87
The net periodic benefit cost of the postemployment plan for
the years ended
December 31
was:
|
In millions
|
Postemployment Benefits
|
||||||||||
|
2015
|
2014
|
2013
|
|||||||||
|
Service cost
|
$
|
17
|
|
$
|
17
|
|
$
|
24
|
|
||
|
Interest cost
|
3
|
|
5
|
|
6
|
|
|||||
|
Amortization of:
|
|
|
|
|
|
|
|||||
|
Prior service benefit
|
(4
|
)
|
(4
|
)
|
(4
|
)
|
|||||
|
Actuarial (gain) loss
|
—
|
|
(2
|
)
|
5
|
|
|||||
|
Curtailment gain
|
—
|
|
—
|
|
(13
|
)
|
|||||
|
Net benefit cost
|
$
|
16
|
|
$
|
16
|
|
$
|
18
|
|
||
|
Restructuring severance cost
|
1
|
|
73
|
|
—
|
|
|||||
|
Net periodic benefit cost
|
$
|
17
|
|
$
|
89
|
|
$
|
18
|
|
||
During
the years ended
December 31, 2015
and
2014
, restructuring charges for employee severance of
$1 million
and
$73 million
, respectively, were recognized associated with the restructuring plan. See
Note 3, "Restructuring Plan,"
for additional information.
During the first quarter of 2013, NCR amended its U.S. separation plan to eliminate the accumulation of postemployment benefits, resulting in a curtailment benefit of
$13 million
.
The weighted average assumptions utilized in accounting for postemployment benefit obligations as of
December 31
and for postemployment benefit costs for
the years ended
December 31
were:
|
Postemployment Benefit Obligations
|
Postemployment Benefit Costs
|
||||||||||||||
|
2015
|
2014
|
2015
|
2014
|
2013
|
|||||||||||
|
Discount rate
|
2.2
|
%
|
2.1
|
%
|
2.1
|
%
|
3.2
|
%
|
2.9
|
%
|
|||||
|
Salary increase rate
|
2.1
|
%
|
2.0
|
%
|
2.0
|
%
|
2.8
|
%
|
2.6
|
%
|
|||||
|
Involuntary turnover rate
|
4.8
|
%
|
4.8
|
%
|
4.8
|
%
|
4.8
|
%
|
5.5
|
%
|
|||||
Cash Flows Related to Employee Benefit Plans
Cash Contributions
NCR does not plan to contribute to the U.S. qualified pension plan in
2016
, and plans to contribute approximately
$35 million
to the international pension plans in
2016
. The Company also plans to make contributions of
$3 million
to the U.S. postretirement plan and
$33 million
to the postemployment plan in
2016
.
Estimated Future Benefit Payments
NCR expects to make the following benefit payments reflecting past and future service from its pension, postretirement and postemployment plans:
|
In millions
|
U.S. Pension Benefits
|
International Pension Benefits
|
Total Pension Benefits
|
Postretirement Benefits
|
Postemployment Benefits
|
|||||||||||||||
|
Year
|
||||||||||||||||||||
|
2016
|
$
|
122
|
|
$
|
54
|
|
$
|
176
|
|
$
|
3
|
|
$
|
33
|
|
|||||
|
2017
|
$
|
124
|
|
$
|
53
|
|
$
|
177
|
|
$
|
3
|
|
$
|
21
|
|
|||||
|
2018
|
$
|
127
|
|
$
|
53
|
|
$
|
180
|
|
$
|
3
|
|
$
|
19
|
|
|||||
|
2019
|
$
|
130
|
|
$
|
53
|
|
$
|
183
|
|
$
|
2
|
|
$
|
18
|
|
|||||
|
2020
|
$
|
133
|
|
$
|
51
|
|
$
|
184
|
|
$
|
2
|
|
$
|
17
|
|
|||||
|
2021 - 2025
|
$
|
687
|
|
$
|
260
|
|
$
|
947
|
|
$
|
7
|
|
$
|
68
|
|
|||||
Savings Plans
U.S. employees and many international employees participate in defined contribution savings plans. These plans generally provide either a specified percent of pay or a matching contribution on participating employees’ voluntary elections. NCR’s matching contributions typically are subject to a maximum percentage or level of compensation. Employee contributions can be made pre-tax, after-tax or a combination thereof. The expense under the U.S. plan was approximately
$23 million
in
2015
,
88
$20 million
in
2014
, and
$12 million
in
2013
. The expense under international and subsidiary savings plans was
$22 million
in
2015
,
$24 million
in
2014
, and
$22 million
in
2013
.
Amounts to be Recognized
The amounts in accumulated other comprehensive loss that are expected to be recognized as components of net periodic benefit cost (income) during
2016
are as follows:
|
In millions
|
U.S.
Pension Benefits
|
International Pension Benefits
|
Total
Pension Benefits
|
Postretirement Benefits
|
Postemployment Benefits
|
|||||||||||||||
|
Prior service cost (benefit)
|
$
|
—
|
|
$
|
1
|
|
$
|
1
|
|
$
|
(14
|
)
|
$
|
(5
|
)
|
|||||
|
Actuarial loss (gain)
|
$
|
—
|
|
$
|
—
|
|
$
|
—
|
|
$
|
2
|
|
$
|
(4
|
)
|
|||||
11. COMMITMENTS AND CONTINGENCIES
In the normal course of business, NCR is subject to various proceedings, lawsuits, claims and other matters, including, for example, those that relate to the environment and health and safety, labor and employment, employee benefits, import/export compliance, intellectual property, data privacy and security, product liability, commercial disputes and regulatory compliance, among others. Additionally, NCR is subject to diverse and complex laws and regulations, including those relating to corporate governance, public disclosure and reporting, environmental safety and the discharge of materials into the environment, product safety, import and export compliance, data privacy and security, antitrust and competition, government contracting, anti-corruption, and labor and human resources, which are rapidly changing and subject to many possible changes in the future. Compliance with these laws and regulations, including changes in accounting standards, taxation requirements, and federal securities laws among others, may create a substantial burden on, and substantially increase costs to NCR or could have an impact on NCR's future operating results. The Company has reflected all liabilities when a loss is considered probable and reasonably estimable in the Consolidated Financial Statements. We do not believe there is a reasonable possibility that losses exceeding amounts already recognized have been incurred, but there can be no assurances that the amounts required to satisfy alleged liabilities from such matters will not impact future operating results. Other than as stated below, the Company does not currently expect to incur material capital expenditures related to such matters. However, there can be no assurances that the actual amounts required to satisfy alleged liabilities from various lawsuits, claims, legal proceedings and other matters, including, but not limited to the Fox River and Kalamazoo River environmental matters and other matters discussed below, and to comply with applicable laws and regulations, will not exceed the amounts reflected in NCR’s Consolidated Financial Statements or will not have a material adverse effect on its consolidated results of operations, capital expenditures, competitive position, financial condition or cash flows.
In 2012, NCR received anonymous allegations from a purported whistleblower regarding certain aspects of the Company's business practices in China, the Middle East and Africa. The principal allegations received in 2012 related to the Company's compliance with the Foreign Corrupt Practices Act (FCPA) and federal regulations that prohibit U.S. persons from engaging in certain activities in Syria. As previously reported, the Company and its Board of Directors completed investigations with the assistance of experienced outside counsel and resolved a related shareholder derivative action.
With respect to the FCPA, the Company made a presentation to the staff of the Securities and Exchange Commission (SEC) and the U.S. Department of Justice (DOJ) providing the facts known to the Company related to the whistleblower's FCPA allegations, and advising the government that many of these allegations were unsubstantiated. With respect to the DOJ, the Company responded to its most recent requests for documents in 2014. On June 22, 2015, the SEC staff notified the Company that it did not intend to recommend an enforcement action against the Company with respect to these matters.
With respect to Syria, in 2012 NCR voluntarily notified the U.S. Treasury Department, Office of Foreign Assets Control (OFAC) of potential violations and ceased operations in Syria, which were commercially insignificant. The notification related to confusion stemming from the Company's failure to register in Syria the transfer of the Company's Syrian branch to a foreign subsidiary and to deregister the Company's legacy Syrian branch, which was a branch of NCR Corporation. The Company has applied for and received from OFAC various licenses that have permitted the Company to take measures required to wind down its past operations in Syria. The Company also submitted a detailed report to OFAC regarding this matter, including a description of the Company's comprehensive export control program and related remedial measures.The Company continues to cooperate with the authorities. There can be no assurance that the Company will not be subject to fines or other remedial measures as a result of OFAC's investigation.
89
In 2013 the Company, through its travel business, entered into a subcontract with a prime contractor with respect to certain information technology components of two airport construction projects in Oman. In 2015 the prime contractor’s contract with an Omani public agency was terminated for cause; the Company and the prime contractor (a joint venture) subsequently provided to each other notices of termination of the subcontract. The prime contractor subsequently filed liquidation proceedings in Oman. The Company had delivered and installed goods and services in the approximate amount of
$40 million
as of 2015 when the various contracts were terminated, which sum remains due and owing; under the terms of the subcontract, most of the payment obligations by the Omani public agency to the terminated prime contractor, and from the terminated prime contractor to the Company, had not at that time matured. The Company remains engaged in the construction projects, having been urged by the Omani public agency to enter into a new subcontract with a new prime contractor, which the Company did later in 2015. The Company has engaged in various means to obtain recoveries of the amounts owed to it, including work performed under a so-called “comfort letter” with the public agency for a portion of 2015, claims in the liquidation process and negotiations with the public agency; it has also identified various additional avenues to pursue against various parties, including without limitation the parent of one of the joint venture partners in the terminated prime contractor. Based on the status of negotiations and proceedings as of
December 31, 2015
, the Company created a reserve of
$20 million
with respect to those portions of the claim that it considered did not meet the Company’s standard for probable recovery.
In June 2014, one of the Company’s Brazilian subsidiaries, NCR Manaus, was notified of a Brazilian federal tax assessment of R$168 million, or approximately
$44 million
as of
December 31, 2015
, including penalties and interest regarding certain federal indirect taxes for 2010 through 2012. The assessment alleges improper importation of certain components into Brazil's free trade zone that would nullify related indirect tax incentives. We have not recorded an accrual for the assessment, as the Company believes it has a valid position regarding indirect taxes in Brazil and, as such, has filed an appeal. However, it is possible that the Company could be required to pay taxes, penalties and interest related to this matter, which could be material to the Company's Consolidated Financial Statements. The Company estimated the aggregate risk related to this matter to be
zero
to approximately
$54 million
as of
December 31, 2015
.
Environmental Matters
NCR's facilities and operations are subject to a wide range of environmental protection laws, and NCR has investigatory and remedial activities underway at a number of facilities that it currently owns or operates, or formerly owned or operated, to comply, or to determine compliance, with such laws. Also, NCR has been identified, either by a government agency or by a private party seeking contribution to site clean-up costs, as a potentially responsible party (PRP) at a number of sites pursuant to various state and federal laws, including the Federal Water Pollution Control Act, the Comprehensive Environmental Response, Compensation and Liability Act (CERCLA) and comparable state statutes. Other than the Fox River matter and the Kalamazoo River matter detailed below, we currently do not anticipate material expenses and liabilities from these environmental matters.
Fox River
NCR is one of
eight
entities that were formally notified by governmental and other entities, such as local Native American tribes, that they are PRPs for environmental claims (under CERCLA and other statutes) arising out of the presence of polychlorinated biphenyls (PCBs) in sediments in the lower Fox River and in the Bay of Green Bay in Wisconsin. The other Fox River PRPs that received notices are Appleton Papers Inc. (API; now known as Appvion, Inc.), P.H. Glatfelter Company ("Glatfelter"), Georgia-Pacific Consumer Products LP (GP, successor to Fort James Operating Company), WTM I Co. (formerly Wisconsin Tissue Mills, now owned by Canal Corporation, formerly known as Chesapeake Corporation), CBC Corporation (formerly Riverside Paper Corporation), U.S. Paper Mills Corp. (owned by Sonoco Products Company), and Menasha Corporation. NCR was identified as a PRP because of alleged PCB discharges from
two
carbonless copy paper manufacturing facilities it previously owned, which were located along the Fox River. NCR sold its facilities in 1978 to API. Some parties contend that NCR is also responsible for PCB discharges from paper mills owned by other companies because NCR carbonless copy paper "broke" was allegedly purchased by those other mills as a raw material.
The United States Environmental Protection Agency (USEPA) and Wisconsin Department of Natural Resources (together, the Governments) developed clean-up plans for the upper and lower parts of the Fox River and for portions of the Bay of Green Bay. On November 13, 2007, the Governments issued a unilateral administrative order (the 2007 Order) under CERCLA to the eight original PRPs, requiring them to perform remedial work under the Governments’ clean-up plan for the lower parts of the river (operable units 2 through 5). In April 2009, NCR and API formed a limited liability company (the LLC), which entered into an agreement with an environmental remediation contractor to perform the work at the Fox River site. In-water dredging and remediation under the clean-up plan commenced shortly thereafter.
90
NCR and API, along with B.A.T Industries p.l.c. (BAT), share among themselves a portion of the cost of the Fox River clean-up and natural resource damages (NRD) based upon a 1998 agreement (the Cost Sharing Agreement), a 2005 arbitration award (subsequently confirmed as a judgment), and a September 30, 2014 Funding Agreement (the Funding Agreement). The Cost Sharing Agreement and the arbitration resolved disputes that arose out of the Company's 1978 sale of its Fox River facilities to API. The Cost Sharing Agreement and arbitration award resulted in a
45%
share for NCR of the first
$75 million
of such costs (a threshold that was reached in 2008), and a
40%
share for amounts in excess of
$75 million
. The Funding Agreement, arose out of a 2012 to 2014 arbitration dispute between NCR and API, and provides for regular, ongoing funding of NCR incurred Fox River remediation costs via contributions, made to a new limited liability corporation created by the Funding Agreement, by BAT, API and, for 2014, API's indemnitor, Windward Prospects. The Funding Agreement creates an obligation on BAT and API to fund
50%
of NCR’s Fox River remediation costs from October 1, 2014 forward; the Funding Agreement also provides NCR opportunities to recoup, both indirectly from third parties and directly, the difference between BAT’s and API’s
60%
obligation under the Cost Sharing Agreement and arbitration award on the one hand and their
50%
payments under the Funding Agreement on the other, as well as the difference between the amount NCR received under the Funding Agreement and the amount owed to it under the Cost Sharing Agreement and arbitration award for the period from April 2012 through the end of September 2014.
Various litigation proceedings concerning the Fox River are pending, and, as the result of appellate decisions in September 2014, NCR’s potential liability for the Fox River matter, for purposes of calculating the Company’s Fox River reserve, is no longer considered to be
100%
of the remediation costs in the lower parts of the river. In a contribution action filed in 2008 seeking to determine allocable responsibility of several companies and governmental entities, a federal court in Wisconsin had issued rulings in 2009 and 2011 that effectively placed all remediation liability on NCR for
four
of the
five
“operable units” of the site. In another part of the same lawsuit, the Company prevailed in a 2012 trial on claims seeking to hold it liable under an “arranger” theory for the most upriver portion of the site, operable unit 1.
On September 25, 2014, the United States Court of Appeals for the Seventh Circuit issued its ruling on appeal. That ruling vacated the lower court’s contribution decisions that were adverse to NCR (i.e., it vacated “the decision to hold NCR responsible for all of the response costs at operable units 2 through 5 in contribution”), set aside an adverse judgment against the Company in the amount of
$76 million
, and affirmed the Company’s favorable verdict in the “arranger” liability trial with respect to operable unit 1. The case was remanded to the federal district court in Wisconsin for further proceedings, for potential consideration of additional factors noted by the appellate court, in which proceedings NCR will vigorously contest the amount of remediation costs allocable to it, and seek to recover from other parties portions of the costs it has previously paid. The case is scheduled for trial in January 2017.
In the quarter ended March 31, 2015, under a case management order applicable to the remanded case the federal district court allowed the filing of certain additional contractual and other claims, including claims against the Company, as well as certain claims by API against other parties (in light of the September 2014 appellate ruling that had restored those claims), which resulted in claims for potential indemnity by those other parties against the Company (under the Funding Agreement, to the extent the Company is liable for such claims, API must pay its recoveries into the limited liability corporation (LLC) created by the Funding Agreement, and the Company may then seek to obtain reimbursement under its terms). The Company also updated the amounts it is seeking in its affirmative claims against other parties. Additionally, in March 2015, notwithstanding the prior trial and appellate results that had been favorable to the Company, the court entered a ruling holding NCR liable for contamination in operable unit 1, an area upriver from the Company’s former facilities, on what the court considered to be new guidance created by the appellate court in its September 2014 decision. The Company believes the March 2015 decision incorrectly applied the appellate court ruling. While the Company's effort to obtain special appellate review in the form of a petition for mandamus was denied on May 1, 2015 by the appellate court, in a subsequent decision dated May 15, 2015 the district court indicated, in a ruling that addressed several issues, that NCR had no liability for operable unit 1, noting “NCR discharged no PCBs in OU1, and therefore has no divisible share of the clean-up costs for that area."
In 2010, the Governments filed a lawsuit (the Government enforcement action) in Wisconsin federal court against the companies named in the 2007 Order. After a 2012 trial, in May 2013 that court held, among other things, that harm at the site is not divisible, and it entered a declaratory judgment against seven defendants (including NCR), finding them jointly and severally liable to comply with the applicable provisions of the 2007 Order. The court also issued an injunction against
four
companies (including NCR), ordering them to comply with the applicable provisions of the 2007 Order; only NCR complied with the injunction. Several parties, including NCR, appealed from the judgment. In a companion opinion to the ruling described in the preceding paragraph, the United States Court of Appeals for the Seventh Circuit, also on September 25, 2014, vacated the injunction, and also vacated the declaratory judgment that had been entered against the Company. The appellate court also ruled that NCR’s defense based on divisibility of harm at the site, which the district court had rejected, must be reconsidered by the district court. The declaratory judgment in the Government enforcement action with respect to liability under the 2007 Order against another defendant, Glatfelter, which pursued its appeal on grounds different from those pursued by NCR, was affirmed.
91
The case was remanded to the federal district court in Wisconsin for further proceedings. In a ruling on May 15, 2015, the district court ruled in NCR’s favor and rejected the Governments’ efforts to reinstate the declaratory judgment against NCR. The court issued findings in favor of the Company’s divisibility defense, and held that NCR’s share of liability for operable unit 4 was
28%
(the Company had then already paid more than 28% of the remediation costs for that part of the river). Various parties asked the court to reconsider its ruling, and in October 2015 the court granted those motions, with the prospect that the Company could continue to face joint and several liability for remediation of the river, in conjunction with other PRPs, although the Company’s position remains that it has performed more than its fair share of remediation costs at the site; a judgment on that matter had not been entered as of December 31, 2015. The remaining claims in the Government enforcement action are expected to be litigated in 2016 and 2017. With respect to remaining remediation work, one other PRP, GP, had agreed by virtue of an earlier settlement with the Governments that it is “liable to the United States . . . for performance of all response actions that the [2007 Order] requires for” the lower portion of operable unit 4 and operable unit 5.
With respect to 2015 remediation, following negotiations with the Governments and GP the Company agreed in April 2015 to perform a portion of the work planned for 2015, and to fund approximately one-third of the cost of that work, with GP funding an equal amount. This agreement was formalized in a stipulation and proposed consent decree filed with the federal court; each party preserved its rights to recover its 2015 costs from the other in the contribution litigation. The Governments demanded that Glatfelter agree to perform or fund the remaining approximate one-third of the work. NCR and GP undertook the remediation efforts they agreed to perform in 2015. Glatfeleter performed portions but not all of the work the Governments sought to require of it. As of
December 31, 2015
, no arrangement for 2016 remediation had been reached.
With respect to the Company’s prior dispute with API, which was generally superseded by the Funding Agreement, the Company has continued to receive timely payments under the Funding Agreement.
NCR's eventual remediation liability, followed by long-term monitoring, will depend on a number of factors. In establishing the reserve, NCR attempts to estimate a range of reasonably possible outcomes for each of these factors, although each range is itself uncertain. NCR uses its best estimate within the range, if that is possible. Where there is a range of equally possible outcomes, and there is no amount within that range that is considered to be a better estimate than any other amount, NCR uses the low end of the range. In general, the most significant factors include: (1) the total remaining clean-up costs, including long-term monitoring following completion of the clean-up; (2) total NRD for the site; (3) the share of clean-up costs and NRD that NCR will bear; (4) NCR's transaction and litigation costs to defend itself in this matter; and (5) the share of NCR's payments that API and/or BAT will bear, as discussed above. With respect to NRD, in connection with a certain settlement entered into by other PRPs, in the year ended December 31, 2015 the Government asked the court to allow it to withdraw the NRD claims it had prosecuted on behalf of NRD trustees, including those NRD claims asserted against the Company (the Government had represented it would do so in the course of presenting the settlement to the court for approval).
Calculation of the Company's Fox River reserve is subject to several complexities, and it is possible there could be additional changes to some elements of the reserve over upcoming periods, although the Company is unable to predict or estimate such changes at this time. There can be no assurance that the clean-up and related expenditures and liabilities will not have a material effect on NCR's capital expenditures, earnings, financial condition, cash flows, or competitive position. As of
December 31, 2015
, the net reserve for the Fox River matter was approximately
$26 million
, compared to
$40 million
as of
December 31, 2014
. The change in the net reserve is due to payments for clean-up activities and litigation costs, as well as changes in estimates and accruals for litigation expenses. NCR contributes to the LLC in order to fund remediation activities and generally, by contract, has funded certain amounts of remediation expenses in advance. As of
December 31, 2015
and
2014
, approximately
zero
remained from this funding. NCR's reserve for the Fox River matter is reduced as the LLC makes payments to the remediation contractor and other vendors with respect to remediation activities.
Under a 1996 agreement, AT&T Corp. (AT&T) and Alcatel-Lucent are responsible severally (not jointly) for indemnifying NCR for certain portions of the amounts paid by NCR for the Fox River matter over a defined threshold and subject to certain offsets. (The agreement governs certain aspects of AT&T's divestiture of NCR and of what was then known as Lucent Technologies.) NCR's estimate of what AT&T and Alcatel-Lucent remain obligated to pay under the indemnity totaled approximately
$15 million
and
$30 million
as of
December 31, 2015
and
2014
, respectively, and is deducted in determining the net reserve discussed above.
In connection with the Fox River and other matters, through
December 31, 2015
, NCR has received a combined total of approximately
$173 million
in settlements reached with its principal insurance carriers. Portions of most of these settlements are payable to a law firm that litigated the claims on the Company's behalf. Some of the settlements cover not only the Fox River but also other environmental sites. Of the total amount collected to date,
$9 million
is subject to competing claims by API.
92
Kalamazoo River
In November 2010, USEPA issued a "general notice letter" to NCR with respect to the Allied Paper, Inc./Portage Creek/Kalamazoo River Superfund Site (Kalamazoo River site) in Michigan.
Three
other companies - International Paper, Mead Corporation, and Consumers Energy - also received general notice letters at or about the same time. USEPA asserts that the site is contaminated by various substances, primarily PCBs, as a result of discharges by various paper mills located along the river. USEPA does not claim that the Company made direct discharges into the Kalamazoo River, and NCR never had facilities at or near the Kalamazoo River site, but indicated that "NCR may be liable under Section 107 of CERCLA ... as an arranger, who by contract or agreement, arranged for the disposal, treatment and/or transportation of hazardous substances at the Site." USEPA stated that it "may issue special notice letters to [NCR] and other PRPs for future RI/FS [remedial investigation / feasibility studies] and RD/RA [remedial design / remedial action] negotiations."
In connection with the Kalamazoo River site, in December 2010 the Company, along with
two
other defendants, was sued in federal court by
three
GP affiliate corporations in a contribution and cost recovery action for alleged pollution. The suit, pending in Michigan, asks that the Company pay a "fair portion" of these companies’ costs. Various removal and remedial actions remain to be performed at the Kalamazoo River site, the costs for which have not been determined. The suit alleges that the Company is liable as an "arranger" under CERCLA. The initial phase of the case was tried in a Michigan federal court in February 2013; on September 26, 2013 the court issued a decision that held NCR was liable as an “arranger,” as of at least March 1969. (PCB-containing carbonless copy paper was produced from approximately 1954 to April 1971, and the majority of contamination had occurred prior to 1969). NCR has preserved its right to appeal the September 2013 decision.
The Court did not determine NCR’s share of the overall liability or how NCR’s liability relates to the liability of other liable or potentially liable parties at the site. Relative shares of liability are being litigated in a subsequent phase of the case; trial in that phase of the case commenced on September 24, 2015 and continued into December of 2015, with posttrial briefing scheduled for early 2016. Prior to trial, in response to a motion filed by the Company, the court dismissed several portions of GP’s claims as time-barred, with the result that the past costs being tried total to approximately
$50 million
. The court may or may not also rule on the allocation of future costs. If the Company is found liable for money damages or otherwise with respect to the Kalamazoo River site, it would have claims against BAT and API under the Cost Sharing Agreement, the arbitration award, the judgment and the Funding Agreement discussed above in connection with the Fox River matter (the Funding Agreement may provide partial reimbursement of such damages depending on the extent of certain recoveries, if any, against third parties under its terms). The Company would also have claims against AT&T and Alcatel-Lucent under the arrangement discussed above in connection with the Fox River matter. As of
December 31, 2015
and
2014
, the reserve for litigation expenses associated with the Kalamazoo matter was approximately
$18 million
and
$6 million
, respectively.
Environmental Remediation Estimates
It is difficult to estimate the future financial impact of environmental laws, including potential liabilities. NCR records environmental provisions when it is probable that a liability has been incurred and the amount or range of the liability is reasonably estimable. Provisions for estimated losses from environmental restoration and remediation are, depending on the site, based generally on internal and third-party environmental studies, estimates as to the number and participation level of other PRPs, the extent of contamination, estimated amounts for attorney and other fees, and the nature of required clean-up and restoration actions. Reserves are adjusted as further information develops or circumstances change. Management expects that the amounts reserved from time to time will be paid out over the period of investigation, negotiation, remediation and restoration for the applicable sites. The amounts provided for environmental matters in NCR's Consolidated Financial Statements are the estimated gross undiscounted amounts of such liabilities, without deductions for indemnity insurance, third-party indemnity claims or recoveries from other PRPs, except as qualified in the following sentences. Except for the sharing agreement with API described above with respect to a particular insurance settlement, in those cases where insurance carriers or third-party indemnitors have agreed to pay any amounts and management believes that collectibility of such amounts is probable, the amounts are recorded in the Consolidated Financial Statements. For the Fox River site, as described above, assets relating to the AT&T and Alcatel-Lucent indemnity and to the API/BAT obligations are recorded as payment is supported by contractual agreements, public filings and/or payment history.
Guarantees and Product Warranties
Guarantees associated with NCR’s business activities are reviewed for appropriateness and impact to the Company’s Consolidated Financial Statements. As of
December 31, 2015
and
2014
, NCR had no material obligations related to such guarantees, and therefore its Consolidated Financial Statements do not have any associated liability balance.
NCR provides its customers a standard manufacturer’s warranty and records, at the time of the sale, a corresponding estimated liability for potential warranty costs. Estimated future obligations due to warranty claims are based upon historical factors, such as labor rates, average repair time, travel time, number of service calls per machine and cost of replacement parts. When a sale is consummated, the total customer revenue is recognized, provided that all revenue recognition criteria are otherwise satisfied, and the associated warranty liability is recorded using pre-established warranty percentages for the respective product classes.
From time to time, product design or quality corrections are accomplished through modification programs. When identified, associated costs of labor and parts for such programs are estimated and accrued as part of the warranty reserve.
93
The Company recorded the activity related to the warranty reserve for the
the years ended
December 31
as follows:
|
In millions
|
2015
|
2014
|
2013
|
||||||||
|
Warranty reserve liability
|
|||||||||||
|
Beginning balance as of January 1
|
$
|
22
|
|
$
|
22
|
|
$
|
26
|
|
||
|
Accruals for warranties issued
|
41
|
|
37
|
|
39
|
|
|||||
|
Settlements (in cash or in kind)
|
(39)
|
|
(37)
|
|
(43)
|
|
|||||
|
Ending balance as of December 31
|
$
|
24
|
|
$
|
22
|
|
$
|
22
|
|
||
In addition, NCR provides its customers with certain indemnification rights. In general, NCR agrees to indemnify the customer if a third party asserts patent or other infringement on the part of its customers for its use of the Company’s products subject to certain conditions that are generally standard within the Company’s industries. On limited occasions the Company will undertake additional indemnification obligations for business reasons. From time to time, NCR also enters into agreements in connection with its acquisition and divestiture activities that include indemnification obligations by the Company. The fair value of these indemnification obligations is not readily determinable due to the conditional nature of the Company’s potential obligations and the specific facts and circumstances involved with each particular agreement. The Company has not recorded a liability in connection with these indemnifications, and no current indemnification instance is material to the Company’s financial position. Historically, payments made by the Company under these types of agreements have not had a material effect on the Company’s consolidated financial condition, results of operations or cash flows.
Purchase Commitments
The Company has purchase commitments for materials, supplies, services, and property, plant and equipment as part of the normal course of business. This includes a long-term service agreement with Accenture under which many of NCR's key transaction processing activities and functions are performed.
Leases
NCR conducts certain of its sales and manufacturing operations using leased facilities, and also operates certain equipment and vehicles under leases, the initial lease terms of which vary in length. Many of the leases contain renewal options and escalation clauses that are not material to the overall lease portfolio. Our lease obligations also include amounts owed for our future world headquarters in Atlanta. Due to the early stages of construction, we assumed lease commencement in early 2018 and included assumptions regarding the total project cost. Future minimum lease payments under non-cancelable operating leases as of
December 31, 2015
, for the following fiscal years were:
|
In millions
|
2016
|
2017
|
2018
|
2019
|
2020
|
|||||||||||||||
|
Minimum lease obligations
|
$
|
97
|
|
$
|
72
|
|
$
|
61
|
|
$
|
45
|
|
$
|
33
|
|
|||||
Total rental expense for operating leases was
$148 million
in
2015
,
$128 million
in
2014
, and
$118 million
in
2013
.
12. DERIVATIVES AND HEDGING INSTRUMENTS
NCR is exposed to risks associated with changes in foreign currency exchange rates and interest rates. NCR utilizes a variety of measures to monitor and manage these risks, including the use of derivative financial instruments. NCR has exposure to approximately
50
functional currencies. Since a substantial portion of our operations and revenue occur outside the U.S., and in currencies other than the U.S. Dollar, our results can be significantly impacted, both positively and negatively, by changes in foreign currency exchange rates.
Foreign Currency Exchange Risk
The accounting guidance for derivatives and hedging requires companies to recognize all derivative instruments as either assets or liabilities at fair value in the Consolidated Balance Sheets. The Company designates foreign exchange contracts as cash flow hedges of forecasted transactions when they are determined to be highly effective at inception.
Our risk management strategy includes hedging, on behalf of certain subsidiaries, a portion of our forecasted, non-functional currency denominated cash flows for a period of up to
15 months
. As a result, some of the impact of currency fluctuations on non-functional currency denominated transactions (and hence on subsidiary operating income, as stated in the functional currency), is mitigated in the near term. The amount we hedge and the duration of hedge contracts may vary significantly. In the longer term (greater than
15 months
), the subsidiaries are still subject to the effect of translating the functional currency results to U.S. Dollars. To manage our exposures and mitigate the impact of currency fluctuations on the operations of our foreign subsidiaries, we hedge our main transactional exposures through the use of foreign exchange forward and option contracts. This is primarily done through the hedging of foreign currency denominated inter-company inventory purchases by NCR’s marketing units and the foreign currency denominated inputs to our manufacturing units. The related foreign exchange contracts are designated as highly effective cash flow hedges. The gains or losses on these hedges are deferred in accumulated other comprehensive income (AOCI) and reclassified to income when the underlying hedged transaction is recorded in earnings. As of
December 31, 2015
, the balance
94
in AOCI related to foreign exchange derivative transactions was
zero
. The gains or losses from derivative contracts related to inventory purchases are recorded in cost of products when the inventory is sold to an unrelated third party.
We also utilize foreign exchange contracts to hedge our exposure of assets and liabilities denominated in non-functional currencies. We recognize the gains and losses on these types of hedges in earnings as exchange rates change. We do not enter into hedges for speculative purposes.
Interest Rate Risk
The Company is party to an interest rate swap agreement that fixes the interest rate on a portion of the Company's LIBOR indexed floating rate borrowings under its Senior Secured Credit Facility through August 22, 2016. The notional amount of the interest rate swap as of
December 31, 2015
was
$380 million
and amortizes to
$341 million
over the term. The Company designates the interest rate swap as a cash flow hedge of forecasted quarterly interest payments made on three-month LIBOR indexed borrowings under the Senior Secured Credit Facility. The interest rate swap was determined to be highly effective at inception.
Our risk management strategy includes hedging a portion of our forecasted interest payments. These transactions are forecasted and the related interest rate swap agreement is designated as a highly effective cash flow hedge. The gains or losses on this hedge are deferred in AOCI and reclassified to income when the underlying hedged transaction is recorded in earnings. As of
December 31, 2015
, the balance in AOCI related to the interest rate swap agreement was a loss of
$1 million
, net of tax.
The following tables provide information on the location and amounts of derivative fair values in the Consolidated Balance Sheets:
|
Fair Values of Derivative Instruments
|
|||||||||||
|
December 31, 2015
|
|||||||||||
|
In millions
|
Balance Sheet
Location
|
Notional
Amount
|
Fair
Value
|
Balance Sheet
Location
|
Notional
Amount
|
Fair
Value
|
|||||
|
Derivatives designated as hedging instruments
|
|||||||||||
|
Interest rate swap
|
Other current assets
|
$—
|
$—
|
Other current liabilities
|
$380
|
$3
|
|||||
|
Foreign exchange contracts
|
Other current assets
|
53
|
2
|
Other current liabilities
|
105
|
1
|
|||||
|
Total derivatives designated as hedging instruments
|
$2
|
$4
|
|||||||||
|
Derivatives not designated as hedging instruments
|
|||||||||||
|
Foreign exchange contracts
|
Other current assets
|
$191
|
$1
|
Other current liabilities
|
$204
|
$1
|
|||||
|
Total derivatives not designated as hedging instruments
|
1
|
1
|
|||||||||
|
Total derivatives
|
$3
|
$5
|
|||||||||
|
|
Fair Values of Derivative Instruments
|
||||||||||
|
|
December 31, 2014
|
||||||||||
|
In millions
|
Balance Sheet
Location
|
Notional
Amount
|
Fair
Value
|
Balance Sheet
Location
|
Notional
Amount
|
Fair
Value
|
|||||
|
Derivatives designated as hedging instruments
|
|||||||||||
|
Interest rate swap
|
Other current assets
|
$—
|
$—
|
Other current liabilities and other liabilities
(1)
|
$462
|
$6
|
|||||
|
Foreign exchange contracts
|
Other current assets
|
—
|
—
|
Other current liabilities
|
—
|
—
|
|||||
|
Total derivatives designated as hedging instruments
|
$—
|
$6
|
|||||||||
|
Derivatives not designated as hedging instruments
|
|||||||||||
|
Foreign exchange contracts
|
Other current assets
|
$186
|
$1
|
Other current liabilities
|
$330
|
$5
|
|||||
|
Total derivatives not designated as hedging instruments
|
1
|
5
|
|||||||||
|
Total derivatives
|
$1
|
$11
|
|||||||||
(1)
As of
December 31, 2014
, approximately
$4 million
was recorded in other current liabilities and
$2 million
was recorded in other liabilities related to the interest rate swap.
95
The effects of derivative instruments on the Consolidated Statement of Operations for
the years ended
December 31
were as follows:
|
in millions
|
Amount of Gain (Loss) Recognized in Other Comprehensive Income (OCI) on Derivative
(Effective Portion) |
Amount of Gain (Loss) Reclassified from AOCI into the Consolidated Statement of Operations
(Effective Portion) |
Amount of Gain (Loss) Recognized in the Consolidated Statement of Operations (Ineffective Portion and Amount Excluded from Effectiveness Testing)
|
||||||||||||||
|
Derivatives in Cash Flow Hedging Relationships
|
For the year ended December 31, 2015
|
For the year ended December 31, 2014
|
For the year ended December 31, 2013
|
Location of Gain (Loss) Reclassified from AOCI into the Consolidated Statement of Operations (Effective Portion)
|
For the year ended December 31, 2015
|
For the year ended December 31, 2014
|
For the year ended December 31, 2013
|
Location of
Gain (Loss)
Recognized in the Consolidated Statement of Operations (Ineffective Portion and Amount Excluded from Effectiveness Testing)
|
For the year ended December 31, 2015
|
For the year ended December 31, 2014
|
For the year ended December 31, 2013
|
||||||
|
Interest rate swap
|
$(2)
|
$(2)
|
—
|
Interest expense
|
$(5)
|
$(5)
|
$(7)
|
Interest expense
|
$—
|
$—
|
$—
|
||||||
|
Foreign exchange contracts
|
$12
|
$1
|
$2
|
Cost of products
|
$12
|
$1
|
$1
|
Other (expense), net
|
$—
|
$—
|
$—
|
||||||
|
In millions
|
|
Amount of Gain (Loss) Recognized in the
Consolidated Statement of Operations
|
|||||
|
Derivatives not Designated as Hedging Instruments
|
Location of Gain (Loss) Recognized in the Consolidated Statement of Operations
|
For the year ended December 31, 2015
|
For the year ended December 31, 2014
|
For the year ended December 31, 2013
|
|||
|
Foreign exchange contracts
|
Other (expense), net
|
$(5)
|
$11
|
$(19)
|
|||
Refer to
Note 13, “Fair Value of Assets and Liabilities,”
for further information on derivative assets and liabilities recorded at fair value on a recurring basis.
Concentration of Credit Risk
NCR is potentially subject to concentrations of credit risk on accounts receivable and financial instruments such as hedging instruments and cash and cash equivalents. Credit risk includes the risk of nonperformance by counterparties. The maximum potential loss may exceed the amount recognized on the Consolidated Balance Sheets. Exposure to credit risk is managed through credit approvals, credit limits, selecting major international financial institutions as counterparties to hedging transactions and monitoring procedures. NCR’s business often involves large transactions with customers, and if one or more of those customers were to default on its obligations under applicable contractual arrangements, the Company could be exposed to potentially significant losses. However, management believes that the reserves for potential losses are adequate. As of
December 31, 2015
and
2014
, NCR did not have any major concentration of credit risk related to financial instruments.
13. FAIR VALUE OF ASSETS AND LIABILITIES
Assets and Liabilities Measured at Fair Value on a Recurring Basis
Assets and liabilities recorded at fair value on a recurring basis as of
December 31, 2015
and
2014
are set forth as follows:
96
|
|
|
Fair Value Measurements at December 31, 2015 Using
|
|||||||||||||
|
In millions
|
December 31, 2015
|
Quoted Prices in
Active Markets for
Identical Assets
(Level 1)
|
Significant Other
Observable Inputs
(Level 2)
|
Significant
Unobservable Inputs
(Level 3)
|
|||||||||||
|
Assets:
|
|||||||||||||||
|
Deposits held in money market mutual funds
(1)
|
$
|
3
|
|
$
|
3
|
|
$
|
—
|
|
$
|
—
|
|
|||
|
Foreign exchange contracts
(2)
|
3
|
|
—
|
|
3
|
|
—
|
|
|||||||
|
Total
|
$
|
6
|
|
$
|
3
|
|
$
|
3
|
|
$
|
—
|
|
|||
|
Liabilities:
|
|||||||||||||||
|
Interest rate swap
(3)
|
$
|
3
|
|
$
|
—
|
|
$
|
3
|
|
$
|
—
|
|
|||
|
Foreign exchange contracts
(3)
|
2
|
|
—
|
|
2
|
|
—
|
|
|||||||
|
Total
|
$
|
5
|
|
$
|
—
|
|
$
|
5
|
|
$
|
—
|
|
|||
|
Fair Value Measurements at December 31, 2014 Using
|
|||||||||||||||
|
In millions
|
December 31, 2014
|
Quoted Prices in
Active Markets for
Identical Assets
(Level 1)
|
Significant Other
Observable Inputs
(Level 2)
|
Significant
Unobservable Inputs
(Level 3)
|
|||||||||||
|
Assets:
|
|||||||||||||||
|
Deposits held in money market mutual funds
(1)
|
$
|
82
|
|
$
|
82
|
|
$
|
—
|
|
$
|
—
|
|
|||
|
Foreign exchange contracts
(2)
|
1
|
|
—
|
|
1
|
|
—
|
|
|||||||
|
Total
|
$
|
83
|
|
$
|
82
|
|
$
|
1
|
|
$
|
—
|
|
|||
|
Liabilities:
|
|||||||||||||||
|
Interest rate swap
(3)
|
$
|
6
|
|
$
|
—
|
|
$
|
6
|
|
$
|
—
|
|
|||
|
Foreign exchange contracts
(3)
|
5
|
|
—
|
|
5
|
|
—
|
|
|||||||
|
Total
|
$
|
11
|
|
$
|
—
|
|
$
|
11
|
|
$
|
—
|
|
|||
_____________
(1)
Included in Cash and cash equivalents in the Consolidated Balance Sheet.
(2)
Included in Other current assets in the Consolidated Balance Sheet.
(3)
Included in Other current liabilities and Other liabilities in the Consolidated Balance Sheet.
Deposits Held in Money Market Mutual Funds
A portion of the Company’s excess cash is held in money market mutual funds which generate interest income based on prevailing market rates. Money market mutual fund holdings are measured at fair value using quoted market prices and are classified within Level 1 of the valuation hierarchy.
Interest rate swap
As a result of our Senior Secured Credit Facility, we are exposed to risk from changes in LIBOR, which may adversely affect our financial condition. To manage our exposure and mitigate the impact of changes in LIBOR on our financial results, we hedge a portion of our forecasted interest payments through the use of an interest rate swap agreement. The interest rate swap is valued using the income approach inclusive of nonperformance and counterparty risk considerations and is classified within Level 2 of the valuation hierarchy.
Foreign Exchange Contracts
As a result of our global operating activities, we are exposed to risks from changes in foreign currency exchange rates, which may adversely affect our financial condition. To manage our exposures and mitigate the impact of currency fluctuations on our financial results, we hedge our primary transactional exposures through the use of foreign exchange forward and option contracts. The foreign exchange contracts are valued using the market approach based on observable market transactions of forward rates and are classified within Level 2 of the valuation hierarchy.
97
Assets Measured at Fair Value on a Non-recurring Basis
Certain assets have been measured at fair value on a nonrecurring basis using significant unobservable inputs (Level 3). NCR measures certain assets, including intangible assets and cost and equity method investments, at fair value on a non-recurring basis. These assets are recognized at fair value when initially valued and when deemed to be impaired.
As of
December 31, 2015
, we determined that it was probable that we would dispose of our IPS business, which triggered an impairment assessment of the related assets which include long-lived assets and goodwill. The assets related to the IPS business were valued using a market approach based on an independent third-party market price. Refer to
Note 5, "Business Combinations and Divestitures,"
and
Note 6, "Goodwill and Other Long-Lived Assets"
for additional discussion.
Additionally, NCR reviews the carrying values of investments when events and circumstances warrant and considers all available evidence in evaluating when declines in fair value are other-than-temporary declines. NCR carries equity investments in privately-held companies at cost or at fair value when NCR recognizes an other-than-temporary impairment charge. During
the twelve months ended
December 31, 2014, we measured the fair value of an investment utilizing the income approach based on the use of discounted cash flows. The discounted cash flows are based on unobservable inputs, including assumptions of projected revenue, expenses, earnings, capital spending, as well as a discount rate determined by management's estimates of risk associated with the investment. As a result, for
the twelve months ended
December 31, 2014, we recorded an other-than-temporary impairment charge of
$3 million
in Other (expense) income, net in the Consolidated Statements of Operations based on Level 3 valuations. As of
December 31, 2014
, there was no remaining carrying value of the related investments. See
Note 3, "Restructuring Plan,"
for additional information on the charge recorded for
the year ended
December 31, 2014
.
No impairment charges or material non-recurring fair value adjustments were recorded during
the year ended
December 31, 2013
.
14. SEGMENT INFORMATION AND CONCENTRATIONS
Operating Segment Information
The Company manages and reports its businesses in the following
four
segments:
|
•
|
Financial Services
- We offer solutions to enable customers in the financial services industry to reduce costs, generate new revenue streams and enhance customer loyalty. These solutions include a comprehensive line of ATM and payment processing hardware and software; cash management and video banking software and customer-facing digital banking services; and related installation, maintenance, and managed and professional services. We also offer a complete line of printer consumables.
|
|
•
|
Retail Solutions
- We offer solutions to customers in the retail industry designed to improve selling productivity and checkout processes as well as increase service levels. These solutions primarily include retail-oriented technologies, such as point of sale terminals and point of sale software; an omni-channel retail software platform with a comprehensive suite of retail software applications; innovative self-service kiosks, such as self-checkout; as well as bar-code scanners. We also offer installation, maintenance, managed and professional services and a complete line of printer consumables.
|
|
•
|
Hospitality
- We offer technology solutions to customers in the hospitality industry, serving businesses that range from a single store or restaurant to global chains and sports and entertainment venues. Our solutions include point of sale hardware and software solutions, installation, maintenance, managed and professional services and a complete line of printer consumables.
|
|
•
|
Emerging Industries -
We offer maintenance as well as managed and professional services for third-party computer hardware provided to select manufacturers, primarily in the telecommunications industry, who value and leverage our global service capability. Also included in our Emerging Industries segment are solutions designed to enhance the customer experience for the travel industry, such as self-service kiosks, and the small business industry, such as an all-in-one point of sale solution. Additionally, we offer installation, maintenance, and managed and professional services.
|
These segments represent components of the Company for which separate financial information is available that is utilized on a regular basis by the chief operating decision maker in assessing segment performance and in allocating the Company's resources. Management evaluates the performance of the segments based on revenue and segment operating income. Assets are not allocated to segments, and thus are not included in the assessment of segment performance, and consequently, we do not disclose total assets by reportable segment.
The accounting policies used to determine the results of the operating segments are the same as those utilized for the consolidated financial statements as a whole. Intersegment sales and transfers are not material.
98
In recognition of the volatility of the effects of pension expense on our segment results, and to maintain operating focus on business performance, pension expense (benefit), as well as other significant, non-recurring items, are excluded from the segment operating results utilized by our chief operating decision maker in evaluating segment performance and are separately delineated to reconcile to income from operations.
The following table presents revenue and operating income by segment for
the years ended
December 31
:
|
In millions
|
2015
|
2014
|
2013
|
|||||||||
|
Revenue by segment
|
||||||||||||
|
Financial Services
(1)
|
$
|
3,319
|
|
$
|
3,561
|
|
$
|
3,115
|
|
|||
|
Retail Solutions
(2)
|
2,001
|
|
2,008
|
|
2,034
|
|
||||||
|
Hospitality
|
686
|
|
659
|
|
626
|
|
||||||
|
Emerging Industries
|
367
|
|
363
|
|
348
|
|
||||||
|
Consolidated revenue
|
6,373
|
|
6,591
|
|
6,123
|
|
||||||
|
Operating income by segment
|
||||||||||||
|
Financial Services
(1)
|
518
|
|
543
|
|
356
|
|
||||||
|
Retail Solutions
(2)
|
156
|
|
155
|
|
205
|
|
||||||
|
Hospitality
|
115
|
|
91
|
|
100
|
|
||||||
|
Emerging Industries
|
41
|
|
31
|
|
56
|
|
||||||
|
Subtotal - segment operating income
|
830
|
|
820
|
|
717
|
|
||||||
|
Pension expense (benefit)
|
464
|
|
152
|
|
(78
|
)
|
||||||
|
Other adjustments
(3)
|
231
|
|
315
|
|
129
|
|
||||||
|
Income from operations
|
$
|
135
|
|
$
|
353
|
|
$
|
666
|
|
|||
|
(1)
|
From the acquisition date of January 10, 2014 through December 31, 2014, Digital Insight contributed
$349 million
in revenue and
$104 million
in segment operating income to the Financial Services segment.
|
|
(2)
|
From the acquisition date of February 6, 2013 through December 31, 2013, Retalix contributed
$298 million
in revenue and
$53 million
in segment operating income to the Retail Solutions segment.
|
|
(3)
|
The following table presents the other adjustments for NCR for
the years ended
December 31
:
|
|
In millions
|
2015
|
2014
|
2013
|
|||||||||
|
Restructuring plan
|
$
|
74
|
|
$
|
160
|
|
$
|
—
|
|
|||
|
Acquisition-related amortization of intangible assets
|
125
|
|
119
|
|
65
|
|
||||||
|
Acquisition-related costs
|
11
|
|
27
|
|
46
|
|
||||||
|
Acquisition-related purchase price adjustments
|
—
|
|
6
|
|
15
|
|
||||||
|
OFAC and FCPA investigations
|
1
|
|
3
|
|
3
|
|
||||||
|
Reserve related to subcontract in MEA
|
20
|
|
—
|
|
—
|
|
||||||
|
Total other adjustments
|
$
|
231
|
|
$
|
315
|
|
$
|
129
|
|
|||
The following table presents revenue from products and services for NCR for
the years ended
December 31
:
|
In millions
|
2015
|
2014
|
2013
|
|||||||||
|
Product revenue
|
$
|
2,711
|
|
$
|
2,892
|
|
$
|
2,912
|
|
|||
|
Professional and installation services revenue
|
944
|
|
971
|
|
907
|
|
||||||
|
Recurring revenue, including maintenance and cloud revenue
|
2,718
|
|
2,728
|
|
2,304
|
|
||||||
|
Total revenue
|
$
|
6,373
|
|
$
|
6,591
|
|
$
|
6,123
|
|
|||
99
Revenue is attributed to the geographic area/country to which the product is delivered or in which the service is provided. The following table presents revenue by geographic area for NCR for
the years ended
December 31
:
|
In millions
|
2015
|
%
|
2014
|
%
|
2013
|
%
|
|||||||||||||||
|
Revenue by Geographic Area
|
|||||||||||||||||||||
|
United States
|
$
|
2,909
|
|
46
|
%
|
$
|
2,723
|
|
41
|
%
|
$
|
2,383
|
|
39
|
%
|
||||||
|
Americas (excluding United States)
|
590
|
|
9
|
%
|
634
|
|
10
|
%
|
647
|
|
11
|
%
|
|||||||||
|
Europe, Middle East Africa (EMEA)
|
1,964
|
|
31
|
%
|
2,184
|
|
33
|
%
|
2,060
|
|
33
|
%
|
|||||||||
|
Asia Pacific (APJ)
|
910
|
|
14
|
%
|
1,050
|
|
16
|
%
|
1,033
|
|
17
|
%
|
|||||||||
|
Consolidated revenue
|
$
|
6,373
|
|
100
|
%
|
$
|
6,591
|
|
100
|
%
|
$
|
6,123
|
|
100
|
%
|
||||||
The following table presents property, plant and equipment by geographic area as of
December 31
:
|
In millions
|
2015
|
2014
|
||||||
|
Property, plant and equipment, net
|
||||||||
|
United States
|
$
|
157
|
|
$
|
188
|
|
||
|
Americas (excluding United States)
|
29
|
|
26
|
|
||||
|
Europe, Middle East Africa (EMEA)
|
78
|
|
78
|
|
||||
|
Asia Pacific (APJ)
|
58
|
|
104
|
|
||||
|
Consolidated property, plant and equipment, net
|
$
|
322
|
|
$
|
396
|
|
||
Concentrations
No single customer accounts for more than 10% of NCR’s consolidated revenue. As of
December 31, 2015
, NCR is not aware of any significant concentration of business transacted with a particular customer that could, if suddenly eliminated, have a material adverse effect on NCR’s operations. NCR also lacks a concentration of available sources of labor, services, licenses or other rights that could, if suddenly eliminated, have a material adverse effect on its operations.
A number of NCR’s products, systems and solutions rely primarily on specific suppliers for microprocessors and other component products, manufactured assemblies, operating systems, commercial software and other central components. NCR also utilizes contract manufacturers in order to complete manufacturing activities. There can be no assurances that any sudden impact to the availability or cost of these technologies or services would not have a material adverse effect on NCR’s operations.
100
15. ACCUMULATED OTHER COMPREHENSIVE INCOME (LOSS) (AOCI)
Changes in AOCI by Component
The changes in AOCI or
the years ended
December 31
are as follows:
|
in millions
|
Currency Translation Adjustments
|
Changes in Employee Benefit Plans
|
Changes in Fair Value of Effective Cash Flow Hedges
|
Changes in Fair Value of Available for Sale Securities
|
Total
|
||||||||||||||
|
Balance at December 31, 2012
|
$
|
(6
|
)
|
$
|
(22
|
)
|
$
|
(10
|
)
|
$
|
1
|
|
$
|
(37
|
)
|
||||
|
Other comprehensive (loss) income before reclassifications
|
(46
|
)
|
50
|
|
1
|
|
2
|
|
7
|
|
|||||||||
|
Amounts reclassified from AOCI
|
—
|
|
(12
|
)
|
4
|
|
—
|
|
(8
|
)
|
|||||||||
|
Net current period other comprehensive (loss) income
|
(46
|
)
|
38
|
|
5
|
|
2
|
|
(1
|
)
|
|||||||||
|
Balance at December 31, 2013
|
$
|
(52
|
)
|
$
|
16
|
|
$
|
(5
|
)
|
$
|
3
|
|
$
|
(38
|
)
|
||||
|
Other comprehensive (loss) before reclassifications
|
(73
|
)
|
(12
|
)
|
(1
|
)
|
—
|
|
(86
|
)
|
|||||||||
|
Amounts reclassified from AOCI
|
—
|
|
(12
|
)
|
3
|
|
(3
|
)
|
(12
|
)
|
|||||||||
|
Net current period other comprehensive (loss) income
|
(73
|
)
|
(24
|
)
|
2
|
|
(3
|
)
|
(98
|
)
|
|||||||||
|
Balance at December 31, 2014
|
$
|
(125
|
)
|
$
|
(8
|
)
|
$
|
(3
|
)
|
$
|
—
|
|
$
|
(136
|
)
|
||||
|
Other comprehensive (loss) income before reclassifications
|
(47
|
)
|
43
|
|
8
|
|
—
|
|
4
|
|
|||||||||
|
Amounts reclassified from AOCI
|
—
|
|
(12
|
)
|
(6
|
)
|
—
|
|
(18
|
)
|
|||||||||
|
Net current period other comprehensive (loss) income
|
(47
|
)
|
31
|
|
2
|
|
—
|
|
(14
|
)
|
|||||||||
|
Balance at December 31, 2015
|
$
|
(172
|
)
|
$
|
23
|
|
$
|
(1
|
)
|
$
|
—
|
|
$
|
(150
|
)
|
||||
101
Reclassifications Out of AOCI
The reclassifications out of AOCI for
the years ended
December 31
are as follows:
|
For the year ended December 31, 2015
|
||||||||||||||||
|
Employee Benefit Plans
|
||||||||||||||||
|
in millions
|
Actuarial Losses Recognized
|
Amortization of Prior Service Benefit
|
Effective Cash Flow Hedges
|
Total
|
||||||||||||
|
Affected line in Consolidated Statement of Operations:
|
||||||||||||||||
|
Cost of products
|
$
|
—
|
|
$
|
(1
|
)
|
$
|
(12
|
)
|
$
|
(13
|
)
|
||||
|
Cost of services
|
1
|
|
(9
|
)
|
—
|
|
(8
|
)
|
||||||||
|
Selling, general and administrative expenses
|
1
|
|
(7
|
)
|
—
|
|
(6
|
)
|
||||||||
|
Research and development expenses
|
—
|
|
(4
|
)
|
—
|
|
(4
|
)
|
||||||||
|
Interest expense
|
—
|
|
—
|
|
5
|
|
5
|
|
||||||||
|
Total before tax
|
$
|
2
|
|
$
|
(21
|
)
|
$
|
(7
|
)
|
$
|
(26
|
)
|
||||
|
Tax expense
|
8
|
|
||||||||||||||
|
Total reclassifications, net of tax
|
$
|
(18
|
)
|
|||||||||||||
|
|
|
For the year ended December 31, 2014
|
||||||||||||||
|
|
Employee Benefit Plans
|
|
|
|
|
|
||||||||||
|
in millions
|
Amortization of Prior Service Benefit
|
Effective Cash Flow Hedges
|
Securities
|
|
Total
|
|||||||||||
|
Affected line in Consolidated Statement of Operations:
|
|
|
|
|
|
|||||||||||
|
|
Cost of services
|
$
|
(10
|
)
|
$
|
—
|
|
$
|
—
|
|
|
$
|
(10
|
)
|
||
|
|
Selling, general and administrative expenses
|
(6
|
)
|
—
|
|
—
|
|
|
(6
|
)
|
||||||
|
|
Research and development expenses
|
(4
|
)
|
—
|
|
—
|
|
|
(4
|
)
|
||||||
|
|
Interest expense
|
—
|
|
4
|
|
—
|
|
|
4
|
|
||||||
|
Other (expense), net
|
—
|
|
—
|
|
(4
|
)
|
(4
|
)
|
||||||||
|
|
Total before tax
|
$
|
(20
|
)
|
$
|
4
|
|
$
|
(4
|
)
|
|
$
|
(20
|
)
|
||
|
|
Tax expense
|
|
|
|
|
8
|
|
|||||||||
|
|
Total reclassifications, net of tax
|
|
|
|
|
$
|
(12
|
)
|
||||||||
|
For the year ended December 31, 2013
|
||||||||||||||||
|
Employee Benefit Plans
|
||||||||||||||||
|
in millions
|
Actuarial Losses Recognized
|
Amortization of Prior Service Benefit
|
Effective Cash Flow Hedges
|
Total
|
||||||||||||
|
Affected line in Consolidated Statement of Operations:
|
||||||||||||||||
|
Cost of products
|
$
|
—
|
|
$
|
(2
|
)
|
$
|
(1
|
)
|
$
|
(3
|
)
|
||||
|
Cost of services
|
5
|
|
(15
|
)
|
—
|
|
(10
|
)
|
||||||||
|
Selling, general and administrative expenses
|
2
|
|
(9
|
)
|
—
|
|
(7
|
)
|
||||||||
|
Research and development expenses
|
1
|
|
(4
|
)
|
—
|
|
(3
|
)
|
||||||||
|
Interest expense
|
—
|
|
—
|
|
7
|
|
7
|
|
||||||||
|
Total before tax
|
$
|
8
|
|
$
|
(30
|
)
|
$
|
6
|
|
$
|
(16
|
)
|
||||
|
Tax expense
|
8
|
|
||||||||||||||
|
Total reclassifications, net of tax
|
$
|
(8
|
)
|
|||||||||||||
102
16. CONDENSED CONSOLIDATING SUPPLEMENTAL GUARANTOR INFORMATION
The Company's 5.00% Notes, 4.625% Notes, 5.875% Notes and 6.375% Notes are guaranteed by the Company's subsidiary, NCR International, Inc. (Guarantor Subsidiary), which is 100% owned by the Company and has guaranteed fully and unconditionally the obligations to pay principal and interest for these senior unsecured notes. The guarantees are subject to release under certain circumstances as described below:
|
•
|
the designation of the Guarantor Subsidiary as an unrestricted subsidiary under the indenture governing the notes;
|
|
•
|
the release of the Guarantor Subsidiary from its guarantee under the Senior Secured Credit Facility;
|
|
•
|
the release or discharge of the indebtedness that required the guarantee of the notes by the Guarantor Subsidiary;
|
|
•
|
the permitted sale or other disposition of the Guarantor Subsidiary to a third party; and
|
|
•
|
the Company's exercise of its legal defeasance option of its covenant defeasance option under the indenture governing the notes.
|
Refer to
Note 7, "Debt Obligations,"
for additional information.
In connection with the previously completed exchange offers for the 5.00% Notes, 4.625% Notes, 5.875% Notes and 6.375% Notes, the Company is required to comply with Rule 3-10 of SEC Regulation S-X (Rule 3-10), and has therefore included the accompanying Condensed Consolidating Financial Statements in accordance with Rule 3-10(f) of SEC Regulation S-X.
The following supplemental information sets forth, on a consolidating basis, the condensed statements of operations and comprehensive income (loss), the condensed balance sheets and the condensed statements of cash flows for the parent issuer of these senior unsecured notes, for the Guarantor Subsidiary and for the Company and all of its consolidated subsidiaries (amounts in millions):
103
|
Consolidating Statements of Operations and Comprehensive Income (Loss)
|
|||||||||||||||||||
|
For the year ended December 31, 2015
|
|||||||||||||||||||
|
(in millions)
|
Parent Issuer
|
Guarantor Subsidiary
|
Non-Guarantor Subsidiaries
|
Eliminations
|
Consolidated
|
||||||||||||||
|
Product revenue
|
$
|
1,121
|
|
$
|
105
|
|
$
|
2,380
|
|
$
|
(895
|
)
|
$
|
2,711
|
|
||||
|
Service revenue
|
1,337
|
|
33
|
|
2,292
|
|
—
|
|
3,662
|
|
|||||||||
|
Total revenue
|
2,458
|
|
138
|
|
4,672
|
|
(895
|
)
|
6,373
|
|
|||||||||
|
Cost of products
|
855
|
|
43
|
|
2,069
|
|
(895
|
)
|
2,072
|
|
|||||||||
|
Cost of services
|
986
|
|
13
|
|
1,833
|
|
—
|
|
2,832
|
|
|||||||||
|
Selling, general and administrative expenses
|
474
|
|
4
|
|
564
|
|
—
|
|
1,042
|
|
|||||||||
|
Research and development expenses
|
90
|
|
—
|
|
140
|
|
—
|
|
230
|
|
|||||||||
|
Restructuring-related charges
|
28
|
|
—
|
|
34
|
|
—
|
|
62
|
|
|||||||||
|
Total operating expenses
|
2,433
|
|
60
|
|
4,640
|
|
(895
|
)
|
6,238
|
|
|||||||||
|
Income (loss) from operations
|
25
|
|
78
|
|
32
|
|
—
|
|
135
|
|
|||||||||
|
Interest expense
|
(168
|
)
|
—
|
|
(78
|
)
|
73
|
|
(173
|
)
|
|||||||||
|
Other (expense) income, net
|
21
|
|
4
|
|
(9
|
)
|
(73
|
)
|
(57
|
)
|
|||||||||
|
Income (loss) from continuing operations before income taxes
|
(122
|
)
|
82
|
|
(55
|
)
|
—
|
|
(95
|
)
|
|||||||||
|
Income tax expense (benefit)
|
(38
|
)
|
52
|
|
41
|
|
—
|
|
55
|
|
|||||||||
|
Income (loss) from continuing operations before earnings in subsidiaries
|
(84
|
)
|
30
|
|
(96
|
)
|
—
|
|
(150
|
)
|
|||||||||
|
Equity in earnings of consolidated subsidiaries
|
(69
|
)
|
(161
|
)
|
—
|
|
230
|
|
—
|
|
|||||||||
|
Income (loss) from continuing operations
|
(153
|
)
|
(131
|
)
|
(96
|
)
|
230
|
|
(150
|
)
|
|||||||||
|
Income (loss) from discontinued operations, net of tax
|
(25
|
)
|
—
|
|
1
|
|
—
|
|
(24
|
)
|
|||||||||
|
Net income (loss)
|
$
|
(178
|
)
|
$
|
(131
|
)
|
$
|
(95
|
)
|
$
|
230
|
|
$
|
(174
|
)
|
||||
|
Net income (loss) attributable to noncontrolling interests
|
—
|
|
—
|
|
4
|
|
—
|
|
4
|
|
|||||||||
|
Net income (loss) attributable to NCR
|
$
|
(178
|
)
|
$
|
(131
|
)
|
$
|
(99
|
)
|
$
|
230
|
|
$
|
(178
|
)
|
||||
|
Total comprehensive income (loss)
|
(192
|
)
|
(154
|
)
|
(110
|
)
|
265
|
|
(191
|
)
|
|||||||||
|
Less comprehensive income (loss) attributable to noncontrolling interests
|
—
|
|
—
|
|
1
|
|
—
|
|
1
|
|
|||||||||
|
Comprehensive income (loss) attributable to NCR common stockholders
|
$
|
(192
|
)
|
$
|
(154
|
)
|
$
|
(111
|
)
|
$
|
265
|
|
$
|
(192
|
)
|
||||
104
|
Consolidating Statements of Operations and Comprehensive Income (Loss)
|
|||||||||||||||||||
|
For the year ended December 31, 2014
|
|||||||||||||||||||
|
(in millions)
|
Parent Issuer
|
Guarantor Subsidiary
|
Non-Guarantor Subsidiaries
|
Eliminations
|
Consolidated
|
||||||||||||||
|
Product revenue
|
$
|
1,039
|
|
$
|
111
|
|
$
|
2,137
|
|
$
|
(395
|
)
|
$
|
2,892
|
|
||||
|
Service revenue
|
1,254
|
|
28
|
|
2,417
|
|
—
|
|
3,699
|
|
|||||||||
|
Total revenue
|
2,293
|
|
139
|
|
4,554
|
|
(395
|
)
|
6,591
|
|
|||||||||
|
Cost of products
|
828
|
|
41
|
|
1,679
|
|
(395
|
)
|
2,153
|
|
|||||||||
|
Cost of services
|
996
|
|
13
|
|
1,697
|
|
—
|
|
2,706
|
|
|||||||||
|
Selling, general and administrative expenses
|
483
|
|
2
|
|
527
|
|
—
|
|
1,012
|
|
|||||||||
|
Research and development expenses
|
148
|
|
—
|
|
115
|
|
—
|
|
263
|
|
|||||||||
|
Restructuring-related charges
|
32
|
|
1
|
|
71
|
|
—
|
|
104
|
|
|||||||||
|
Total operating expenses
|
2,487
|
|
57
|
|
4,089
|
|
(395
|
)
|
6,238
|
|
|||||||||
|
Income (loss) from operations
|
(194
|
)
|
82
|
|
465
|
|
—
|
|
353
|
|
|||||||||
|
Interest expense
|
(177
|
)
|
(1
|
)
|
(75
|
)
|
72
|
|
(181
|
)
|
|||||||||
|
Other (expense) income, net
|
38
|
|
(4
|
)
|
3
|
|
(72
|
)
|
(35
|
)
|
|||||||||
|
Income (loss) from continuing operations before income taxes
|
(333
|
)
|
77
|
|
393
|
|
—
|
|
137
|
|
|||||||||
|
Income tax expense (benefit)
|
(173
|
)
|
68
|
|
57
|
|
—
|
|
(48
|
)
|
|||||||||
|
Income (loss) from continuing operations before earnings in subsidiaries
|
(160
|
)
|
9
|
|
336
|
|
—
|
|
185
|
|
|||||||||
|
Equity in earnings of consolidated subsidiaries
|
341
|
|
392
|
|
—
|
|
(733
|
)
|
—
|
|
|||||||||
|
Income (loss) from continuing operations
|
181
|
|
401
|
|
336
|
|
(733
|
)
|
185
|
|
|||||||||
|
Income (loss) from discontinued operations, net of tax
|
10
|
|
—
|
|
—
|
|
—
|
|
10
|
|
|||||||||
|
Net income (loss)
|
$
|
191
|
|
$
|
401
|
|
$
|
336
|
|
$
|
(733
|
)
|
$
|
195
|
|
||||
|
Net income (loss) attributable to noncontrolling interests
|
—
|
|
—
|
|
4
|
|
—
|
|
4
|
|
|||||||||
|
Net income (loss) attributable to NCR
|
$
|
191
|
|
$
|
401
|
|
$
|
332
|
|
$
|
(733
|
)
|
$
|
191
|
|
||||
|
Total comprehensive income (loss)
|
93
|
|
319
|
|
229
|
|
(547
|
)
|
94
|
|
|||||||||
|
Less comprehensive income (loss) attributable to noncontrolling interests
|
—
|
|
—
|
|
1
|
|
—
|
|
1
|
|
|||||||||
|
Comprehensive income (loss) attributable to NCR common stockholders
|
$
|
93
|
|
$
|
319
|
|
$
|
228
|
|
$
|
(547
|
)
|
$
|
93
|
|
||||
105
|
Consolidating Statements of Operations and Comprehensive Income (Loss)
|
|||||||||||||||||||
|
For the year ended December 31, 2013
|
|||||||||||||||||||
|
(in millions)
|
Parent Issuer
|
Guarantor Subsidiary
|
Non-Guarantor Subsidiaries
|
Eliminations
|
Consolidated
|
||||||||||||||
|
Product revenue
|
$
|
1,107
|
|
$
|
85
|
|
$
|
1,977
|
|
$
|
(257
|
)
|
$
|
2,912
|
|
||||
|
Service revenue
|
1,232
|
|
24
|
|
1,955
|
|
—
|
|
3,211
|
|
|||||||||
|
Total revenue
|
2,339
|
|
109
|
|
3,932
|
|
(257
|
)
|
6,123
|
|
|||||||||
|
Cost of products
|
844
|
|
17
|
|
1,548
|
|
(257
|
)
|
2,152
|
|
|||||||||
|
Cost of services
|
880
|
|
9
|
|
1,342
|
|
—
|
|
2,231
|
|
|||||||||
|
Selling, general and administrative expenses
|
467
|
|
5
|
|
399
|
|
—
|
|
871
|
|
|||||||||
|
Research and development expenses
|
94
|
|
—
|
|
109
|
|
—
|
|
203
|
|
|||||||||
|
Total operating expenses
|
2,285
|
|
31
|
|
3,398
|
|
(257
|
)
|
5,457
|
|
|||||||||
|
Income (loss) from operations
|
54
|
|
78
|
|
534
|
|
—
|
|
666
|
|
|||||||||
|
Interest expense
|
(104
|
)
|
2
|
|
(6
|
)
|
5
|
|
(103
|
)
|
|||||||||
|
Other (expense) income, net
|
(12
|
)
|
(8
|
)
|
16
|
|
(5
|
)
|
(9
|
)
|
|||||||||
|
Income (loss) from continuing operations before income taxes
|
(62
|
)
|
72
|
|
544
|
|
—
|
|
554
|
|
|||||||||
|
Income tax expense (benefit)
|
(23
|
)
|
25
|
|
96
|
|
—
|
|
98
|
|
|||||||||
|
Income (loss) from continuing operations before earnings in subsidiaries
|
(39
|
)
|
47
|
|
448
|
|
—
|
|
456
|
|
|||||||||
|
Equity in earnings of consolidated subsidiaries
|
491
|
|
409
|
|
—
|
|
(900
|
)
|
—
|
|
|||||||||
|
Income (loss) from continuing operations
|
452
|
|
456
|
|
448
|
|
(900
|
)
|
456
|
|
|||||||||
|
Income (loss) from discontinued operations, net of tax
|
(9
|
)
|
—
|
|
—
|
|
—
|
|
(9
|
)
|
|||||||||
|
Net income (loss)
|
$
|
443
|
|
$
|
456
|
|
$
|
448
|
|
$
|
(900
|
)
|
$
|
447
|
|
||||
|
Net income (loss) attributable to noncontrolling interests
|
—
|
|
—
|
|
4
|
|
—
|
|
4
|
|
|||||||||
|
Net income (loss) attributable to NCR
|
$
|
443
|
|
$
|
456
|
|
$
|
444
|
|
$
|
(900
|
)
|
$
|
443
|
|
||||
|
Total comprehensive income (loss)
|
442
|
|
331
|
|
437
|
|
(771
|
)
|
439
|
|
|||||||||
|
Less comprehensive income (loss) attributable to noncontrolling interests
|
—
|
|
—
|
|
(3
|
)
|
—
|
|
(3
|
)
|
|||||||||
|
Comprehensive income (loss) attributable to NCR common stockholders
|
$
|
442
|
|
$
|
331
|
|
$
|
440
|
|
$
|
(771
|
)
|
$
|
442
|
|
||||
106
|
Consolidating Balance Sheet
|
|||||||||||||||||||
|
December 31, 2015
|
|||||||||||||||||||
|
(in millions)
|
Parent Issuer
|
Guarantor Subsidiary
|
Non-Guarantor Subsidiaries
|
Eliminations
|
Consolidated
|
||||||||||||||
|
Assets
|
|||||||||||||||||||
|
Current assets
|
|||||||||||||||||||
|
Cash and cash equivalents
|
$
|
12
|
|
$
|
20
|
|
$
|
296
|
|
$
|
—
|
|
$
|
328
|
|
||||
|
Accounts receivable, net
|
44
|
|
33
|
|
1,174
|
|
—
|
|
1,251
|
|
|||||||||
|
Inventories
|
233
|
|
6
|
|
404
|
|
—
|
|
643
|
|
|||||||||
|
Due from affiliates
|
654
|
|
1,325
|
|
300
|
|
(2,279
|
)
|
—
|
|
|||||||||
|
Other current assets
|
126
|
|
31
|
|
209
|
|
(39
|
)
|
327
|
|
|||||||||
|
Total current assets
|
1,069
|
|
1,415
|
|
2,383
|
|
(2,318
|
)
|
2,549
|
|
|||||||||
|
Property, plant and equipment, net
|
137
|
|
1
|
|
184
|
|
—
|
|
322
|
|
|||||||||
|
Goodwill
|
860
|
|
—
|
|
1,873
|
|
—
|
|
2,733
|
|
|||||||||
|
Intangibles, net
|
161
|
|
—
|
|
637
|
|
—
|
|
798
|
|
|||||||||
|
Prepaid pension cost
|
—
|
|
—
|
|
130
|
|
—
|
|
130
|
|
|||||||||
|
Deferred income taxes
|
486
|
|
152
|
|
84
|
|
(140
|
)
|
582
|
|
|||||||||
|
Investments in subsidiaries
|
3,349
|
|
1,449
|
|
—
|
|
(4,798
|
)
|
—
|
|
|||||||||
|
Due from affiliates
|
1,072
|
|
17
|
|
38
|
|
(1,127
|
)
|
—
|
|
|||||||||
|
Other assets
|
362
|
|
55
|
|
104
|
|
—
|
|
521
|
|
|||||||||
|
Total assets
|
$
|
7,496
|
|
$
|
3,089
|
|
$
|
5,433
|
|
$
|
(8,383
|
)
|
$
|
7,635
|
|
||||
|
Liabilities and stockholders’ equity
|
|||||||||||||||||||
|
Current liabilities
|
|||||||||||||||||||
|
Short-term borrowings
|
$
|
4
|
|
$
|
—
|
|
$
|
9
|
|
$
|
—
|
|
$
|
13
|
|
||||
|
Accounts payable
|
280
|
|
—
|
|
377
|
|
—
|
|
657
|
|
|||||||||
|
Payroll and benefits liabilities
|
93
|
|
1
|
|
95
|
|
—
|
|
189
|
|
|||||||||
|
Deferred service revenue and customer deposits
|
154
|
|
24
|
|
298
|
|
—
|
|
476
|
|
|||||||||
|
Due to affiliates
|
1,499
|
|
137
|
|
643
|
|
(2,279
|
)
|
—
|
|
|||||||||
|
Other current liabilities
|
205
|
|
3
|
|
277
|
|
(39
|
)
|
446
|
|
|||||||||
|
Total current liabilities
|
2,235
|
|
165
|
|
1,699
|
|
(2,318
|
)
|
1,781
|
|
|||||||||
|
Long-term debt
|
3,229
|
|
—
|
|
10
|
|
—
|
|
3,239
|
|
|||||||||
|
Pension and indemnity plan liabilities
|
433
|
|
—
|
|
263
|
|
—
|
|
696
|
|
|||||||||
|
Postretirement and postemployment benefits liabilities
|
27
|
|
3
|
|
103
|
|
—
|
|
133
|
|
|||||||||
|
Income tax accruals
|
4
|
|
13
|
|
150
|
|
—
|
|
167
|
|
|||||||||
|
Due to affiliates
|
18
|
|
37
|
|
1,072
|
|
(1,127
|
)
|
—
|
|
|||||||||
|
Other liabilities
|
32
|
|
—
|
|
187
|
|
(140
|
)
|
79
|
|
|||||||||
|
Total liabilities
|
5,978
|
|
218
|
|
3,484
|
|
(3,585
|
)
|
6,095
|
|
|||||||||
|
Redeemable noncontrolling interest
|
—
|
|
—
|
|
16
|
|
—
|
|
16
|
|
|||||||||
|
Series A convertible preferred stock
|
798
|
|
—
|
|
—
|
|
—
|
|
798
|
|
|||||||||
|
Stockholders’ equity
|
|
|
|
|
|
|
|
|
|
|
|||||||||
|
Total NCR stockholders’ equity
|
720
|
|
2,871
|
|
1,927
|
|
(4,798
|
)
|
720
|
|
|||||||||
|
Noncontrolling interests in subsidiaries
|
—
|
|
—
|
|
6
|
|
—
|
|
6
|
|
|||||||||
|
Total stockholders’ equity
|
720
|
|
2,871
|
|
1,933
|
|
(4,798
|
)
|
726
|
|
|||||||||
|
Total liabilities and stockholders’ equity
|
$
|
7,496
|
|
$
|
3,089
|
|
$
|
5,433
|
|
$
|
(8,383
|
)
|
$
|
7,635
|
|
||||
107
|
Consolidating Balance Sheet
|
|||||||||||||||||||
|
December 31, 2014
|
|||||||||||||||||||
|
(in millions)
|
Parent Issuer
|
Guarantor Subsidiary
|
Non-Guarantor Subsidiaries
|
Eliminations
|
Consolidated
|
||||||||||||||
|
Assets
|
|||||||||||||||||||
|
Current assets
|
|||||||||||||||||||
|
Cash and cash equivalents
|
$
|
40
|
|
$
|
9
|
|
$
|
462
|
|
$
|
—
|
|
$
|
511
|
|
||||
|
Accounts receivable, net
|
69
|
|
19
|
|
1,316
|
|
—
|
|
1,404
|
|
|||||||||
|
Inventories
|
242
|
|
6
|
|
421
|
|
—
|
|
669
|
|
|||||||||
|
Due from affiliates
|
626
|
|
1,228
|
|
476
|
|
(2,330
|
)
|
—
|
|
|||||||||
|
Other current assets
|
294
|
|
28
|
|
280
|
|
(98
|
)
|
504
|
|
|||||||||
|
Total current assets
|
1,271
|
|
1,290
|
|
2,955
|
|
(2,428
|
)
|
3,088
|
|
|||||||||
|
Property, plant and equipment, net
|
161
|
|
1
|
|
234
|
|
—
|
|
396
|
|
|||||||||
|
Goodwill
|
878
|
|
—
|
|
1,882
|
|
—
|
|
2,760
|
|
|||||||||
|
Intangibles, net
|
196
|
|
—
|
|
730
|
|
—
|
|
926
|
|
|||||||||
|
Prepaid pension cost
|
—
|
|
—
|
|
551
|
|
—
|
|
551
|
|
|||||||||
|
Deferred income taxes
|
363
|
|
128
|
|
43
|
|
(185
|
)
|
349
|
|
|||||||||
|
Investments in subsidiaries
|
3,519
|
|
1,771
|
|
—
|
|
(5,290
|
)
|
—
|
|
|||||||||
|
Due from affiliates
|
1,127
|
|
20
|
|
41
|
|
(1,188
|
)
|
—
|
|
|||||||||
|
Other assets
|
334
|
|
49
|
|
113
|
|
—
|
|
496
|
|
|||||||||
|
Total assets
|
$
|
7,849
|
|
$
|
3,259
|
|
$
|
6,549
|
|
$
|
(9,091
|
)
|
$
|
8,566
|
|
||||
|
Liabilities and stockholders’ equity
|
|||||||||||||||||||
|
Current liabilities
|
|||||||||||||||||||
|
Short-term borrowings
|
$
|
85
|
|
$
|
—
|
|
$
|
102
|
|
$
|
—
|
|
$
|
187
|
|
||||
|
Accounts payable
|
248
|
|
—
|
|
464
|
|
—
|
|
712
|
|
|||||||||
|
Payroll and benefits liabilities
|
85
|
|
—
|
|
111
|
|
—
|
|
196
|
|
|||||||||
|
Deferred service revenue and customer deposits
|
149
|
|
21
|
|
324
|
|
—
|
|
494
|
|
|||||||||
|
Due to affiliates
|
1,318
|
|
124
|
|
888
|
|
(2,330
|
)
|
—
|
|
|||||||||
|
Other current liabilities
|
192
|
|
10
|
|
377
|
|
(98
|
)
|
481
|
|
|||||||||
|
Total current liabilities
|
2,077
|
|
155
|
|
2,266
|
|
(2,428
|
)
|
2,070
|
|
|||||||||
|
Long-term debt
|
3,413
|
|
—
|
|
18
|
|
—
|
|
3,431
|
|
|||||||||
|
Pension and indemnity plan liabilities
|
391
|
|
—
|
|
314
|
|
—
|
|
705
|
|
|||||||||
|
Postretirement and postemployment benefits liabilities
|
25
|
|
—
|
|
145
|
|
—
|
|
170
|
|
|||||||||
|
Income tax accruals
|
3
|
|
10
|
|
168
|
|
—
|
|
181
|
|
|||||||||
|
Due to affiliates
|
17
|
|
41
|
|
1,130
|
|
(1,188
|
)
|
—
|
|
|||||||||
|
Other liabilities
|
52
|
|
—
|
|
244
|
|
(185
|
)
|
111
|
|
|||||||||
|
Total liabilities
|
5,978
|
|
206
|
|
4,285
|
|
(3,801
|
)
|
6,668
|
|
|||||||||
|
Redeemable noncontrolling interest
|
—
|
|
—
|
|
15
|
|
—
|
|
15
|
|
|||||||||
|
Stockholders’ equity
|
|
|
|
|
|
||||||||||||||
|
Total NCR stockholders’ equity
|
1,871
|
|
3,053
|
|
2,237
|
|
(5,290
|
)
|
1,871
|
|
|||||||||
|
Noncontrolling interests in subsidiaries
|
—
|
|
—
|
|
12
|
|
—
|
|
12
|
|
|||||||||
|
Total stockholders’ equity
|
1,871
|
|
3,053
|
|
2,249
|
|
(5,290
|
)
|
1,883
|
|
|||||||||
|
Total liabilities and stockholders’ equity
|
$
|
7,849
|
|
$
|
3,259
|
|
$
|
6,549
|
|
$
|
(9,091
|
)
|
$
|
8,566
|
|
||||
108
|
Consolidating Statement of Cash Flows
|
|||||||||||||||||||
|
For the year ended December 31, 2015
|
|||||||||||||||||||
|
(in millions)
|
Parent Issuer
|
Guarantor Subsidiary
|
Non-Guarantor Subsidiaries
|
Eliminations
|
Consolidated
|
||||||||||||||
|
Net cash provided by (used in) operating activities
|
$
|
348
|
|
$
|
(335
|
)
|
$
|
748
|
|
$
|
(80
|
)
|
$
|
681
|
|
||||
|
Investing activities
|
|||||||||||||||||||
|
Expenditures for property, plant and equipment
|
(22
|
)
|
—
|
|
(57
|
)
|
—
|
|
(79
|
)
|
|||||||||
|
Proceeds from the sale of property, plant and equipment
|
—
|
|
—
|
|
19
|
|
—
|
|
19
|
|
|||||||||
|
Additions to capitalized software
|
(91
|
)
|
—
|
|
(59
|
)
|
—
|
|
(150
|
)
|
|||||||||
|
Proceeds from (payments of) intercompany notes
|
272
|
|
347
|
|
—
|
|
(619
|
)
|
—
|
|
|||||||||
|
Investments in equity affiliates
|
(1
|
)
|
|
|
|
|
1
|
|
—
|
|
|||||||||
|
Other investing activities, net
|
(6
|
)
|
—
|
|
7
|
|
—
|
|
1
|
|
|||||||||
|
Net cash provided by (used in) investing activities
|
152
|
|
347
|
|
(90
|
)
|
(618
|
)
|
(209
|
)
|
|||||||||
|
Financing activities
|
|||||||||||||||||||
|
Short term borrowings, net
|
3
|
|
—
|
|
5
|
|
—
|
|
8
|
|
|||||||||
|
Payments on term credit facilities
|
(376
|
)
|
—
|
|
(7
|
)
|
—
|
|
(383
|
)
|
|||||||||
|
Payments on revolving credit facilities
|
(729
|
)
|
—
|
|
(965
|
)
|
—
|
|
(1,694
|
)
|
|||||||||
|
Borrowings on revolving credit facilities
|
829
|
|
—
|
|
869
|
|
—
|
|
1,698
|
|
|||||||||
|
Tax withholding payments on behalf of employees
|
(16
|
)
|
—
|
|
—
|
|
—
|
|
(16
|
)
|
|||||||||
|
Proceeds from employee stock plans
|
15
|
|
—
|
|
—
|
|
—
|
|
15
|
|
|||||||||
|
Dividend distribution to consolidated subsidiaries
|
—
|
|
—
|
|
(80
|
)
|
80
|
|
—
|
|
|||||||||
|
Series A convertible preferred stock issuance
|
794
|
|
—
|
|
—
|
|
—
|
|
794
|
|
|||||||||
|
Tender offer share repurchase
|
(1,005
|
)
|
—
|
|
—
|
|
—
|
|
(1,005
|
)
|
|||||||||
|
Equity contribution
|
—
|
|
—
|
|
1
|
|
(1
|
)
|
—
|
|
|||||||||
|
Borrowings (repayments) of intercompany notes
|
—
|
|
—
|
|
(619
|
)
|
619
|
|
—
|
|
|||||||||
|
Net cash provided by (used in) financing activities
|
(485
|
)
|
—
|
|
(796
|
)
|
698
|
|
(583
|
)
|
|||||||||
|
Cash flows from discontinued operations
|
|||||||||||||||||||
|
Net cash used in discontinued operations operating activities
|
(43
|
)
|
—
|
|
—
|
|
—
|
|
(43
|
)
|
|||||||||
|
Effect of exchange rate changes on cash and cash equivalents
|
—
|
|
(1
|
)
|
(28
|
)
|
—
|
|
(29
|
)
|
|||||||||
|
(Decrease) increase in cash and cash equivalents
|
(28
|
)
|
11
|
|
(166
|
)
|
—
|
|
(183
|
)
|
|||||||||
|
Cash and cash equivalents at beginning of period
|
40
|
|
9
|
|
462
|
|
—
|
|
511
|
|
|||||||||
|
Cash and cash equivalents at end of period
|
$
|
12
|
|
$
|
20
|
|
$
|
296
|
|
$
|
—
|
|
$
|
328
|
|
||||
109
|
Consolidating Statement of Cash Flows
|
|||||||||||||||||||
|
For the year ended December 31, 2014
|
|||||||||||||||||||
|
(in millions)
|
Parent Issuer
|
Guarantor Subsidiary
|
Non-Guarantor Subsidiaries
|
Eliminations
|
Consolidated
|
||||||||||||||
|
Net cash provided by (used in) operating activities
|
$
|
401
|
|
$
|
(108
|
)
|
$
|
331
|
|
$
|
(100
|
)
|
$
|
524
|
|
||||
|
Investing activities
|
|||||||||||||||||||
|
Expenditures for property, plant and equipment
|
(51
|
)
|
—
|
|
(67
|
)
|
—
|
|
(118
|
)
|
|||||||||
|
Proceeds from sales of property, plant and equipment
|
—
|
|
—
|
|
1
|
|
—
|
|
1
|
|
|||||||||
|
Additions to capitalized software
|
(82
|
)
|
—
|
|
(58
|
)
|
—
|
|
(140
|
)
|
|||||||||
|
Business acquisitions, net
|
(1,647
|
)
|
—
|
|
—
|
|
—
|
|
(1,647
|
)
|
|||||||||
|
Changes in restricted cash
|
1,114
|
|
—
|
|
—
|
|
—
|
|
1,114
|
|
|||||||||
|
Proceeds from (payments of) intercompany notes
|
42
|
|
106
|
|
—
|
|
(148
|
)
|
—
|
|
|||||||||
|
Investments in equity affiliates
|
(2
|
)
|
—
|
|
—
|
|
2
|
|
—
|
|
|||||||||
|
Other investing activities, net
|
(5
|
)
|
—
|
|
7
|
|
—
|
|
2
|
|
|||||||||
|
Net cash provided by (used in) investing activities
|
(631
|
)
|
106
|
|
(117
|
)
|
(146
|
)
|
(788
|
)
|
|||||||||
|
Financing activities
|
|||||||||||||||||||
|
Payments on term credit facilities
|
(34
|
)
|
—
|
|
(3
|
)
|
—
|
|
(37
|
)
|
|||||||||
|
Borrowings on term credit facilities
|
250
|
|
—
|
|
—
|
|
—
|
|
250
|
|
|||||||||
|
Payments on revolving credit facilities
|
(946
|
)
|
—
|
|
(104
|
)
|
—
|
|
(1,050
|
)
|
|||||||||
|
Borrowings on revolving credit facilities
|
946
|
|
—
|
|
200
|
|
—
|
|
1,146
|
|
|||||||||
|
Debt issuance costs
|
(4
|
)
|
—
|
|
(1
|
)
|
—
|
|
(5
|
)
|
|||||||||
|
Tax withholding payments on behalf of employees
|
(28
|
)
|
—
|
|
—
|
|
—
|
|
(28
|
)
|
|||||||||
|
Proceeds from employee stock plans
|
13
|
|
—
|
|
—
|
|
—
|
|
13
|
|
|||||||||
|
Other financing activities
|
(1
|
)
|
—
|
|
(4
|
)
|
—
|
|
(5
|
)
|
|||||||||
|
Dividend distribution to consolidated subsidiaries
|
—
|
|
—
|
|
(100
|
)
|
100
|
|
—
|
|
|||||||||
|
Equity contribution
|
—
|
|
—
|
|
2
|
|
(2
|
)
|
—
|
|
|||||||||
|
Borrowings (repayments) of intercompany notes
|
—
|
|
—
|
|
(148
|
)
|
148
|
|
—
|
|
|||||||||
|
Net cash provided by (used in) financing activities
|
196
|
|
—
|
|
(158
|
)
|
246
|
|
284
|
|
|||||||||
|
Cash flows from discontinued operations
|
|||||||||||||||||||
|
Net cash used in discontinued operations operating activities
|
(1
|
)
|
—
|
|
—
|
|
—
|
|
(1
|
)
|
|||||||||
|
Effect of exchange rate changes on cash and cash equivalents
|
—
|
|
—
|
|
(36
|
)
|
—
|
|
(36
|
)
|
|||||||||
|
Increase (decrease) in cash and cash equivalents
|
(35
|
)
|
(2
|
)
|
20
|
|
—
|
|
(17
|
)
|
|||||||||
|
Cash and cash equivalents at beginning of period
|
75
|
|
11
|
|
442
|
|
—
|
|
528
|
|
|||||||||
|
Cash and cash equivalents at end of period
|
$
|
40
|
|
$
|
9
|
|
$
|
462
|
|
$
|
—
|
|
$
|
511
|
|
||||
110
|
Consolidating Statement of Cash Flows
|
|||||||||||||||||||
|
For the year ended December 31, 2013
|
|||||||||||||||||||
|
(in millions)
|
Parent Issuer
|
Guarantor Subsidiary
|
Non-Guarantor Subsidiaries
|
Eliminations
|
Consolidated
|
||||||||||||||
|
Net cash provided by (used in) operating activities
|
$
|
(7
|
)
|
$
|
15
|
|
$
|
312
|
|
$
|
(39
|
)
|
$
|
281
|
|
||||
|
Investing activities
|
|||||||||||||||||||
|
Expenditures for property, plant and equipment
|
(35
|
)
|
(6
|
)
|
(75
|
)
|
—
|
|
(116
|
)
|
|||||||||
|
Proceeds from sales of property, plant and equipment
|
2
|
|
—
|
|
8
|
|
—
|
|
10
|
|
|||||||||
|
Additions to capitalized software
|
(81
|
)
|
—
|
|
(29
|
)
|
—
|
|
(110
|
)
|
|||||||||
|
Business acquisitions, net
|
(207
|
)
|
—
|
|
(756
|
)
|
183
|
|
(780
|
)
|
|||||||||
|
Dispositions
|
—
|
|
—
|
|
183
|
|
(183
|
)
|
—
|
|
|||||||||
|
Changes in restricted cash
|
(1,114
|
)
|
—
|
|
—
|
|
—
|
|
(1,114
|
)
|
|||||||||
|
Proceeds from (payments of) intercompany notes
|
(54
|
)
|
—
|
|
—
|
|
54
|
|
—
|
|
|||||||||
|
Investments in equity affiliates
|
(308
|
)
|
(33
|
)
|
—
|
|
341
|
|
—
|
|
|||||||||
|
Other investing activities, net
|
5
|
|
—
|
|
—
|
|
—
|
|
5
|
|
|||||||||
|
Net cash provided by (used in) investing activities
|
(1,792
|
)
|
(39
|
)
|
(669
|
)
|
395
|
|
(2,105
|
)
|
|||||||||
|
Financing activities
|
|||||||||||||||||||
|
Short term borrowings, net
|
—
|
|
—
|
|
(1
|
)
|
—
|
|
(1
|
)
|
|||||||||
|
Payments on revolving credit facilities
|
(35
|
)
|
—
|
|
—
|
|
—
|
|
(35
|
)
|
|||||||||
|
Borrowings on term credit facilities
|
300
|
|
—
|
|
29
|
|
—
|
|
329
|
|
|||||||||
|
Payments on revolving credit facilities
|
(1,009
|
)
|
—
|
|
—
|
|
—
|
|
(1,009
|
)
|
|||||||||
|
Borrowings on revolving credit facilities
|
1,009
|
|
—
|
|
—
|
|
—
|
|
1,009
|
|
|||||||||
|
Proceeds from bond offering
|
1,100
|
|
—
|
|
—
|
|
—
|
|
1,100
|
|
|||||||||
|
Debt issuance costs
|
(36
|
)
|
—
|
|
—
|
|
—
|
|
(36
|
)
|
|||||||||
|
Tax withholding payments on behalf of employees
|
(30
|
)
|
—
|
|
—
|
|
—
|
|
(30
|
)
|
|||||||||
|
Proceeds from employee stock plans
|
57
|
|
—
|
|
—
|
|
—
|
|
57
|
|
|||||||||
|
Other financing activities
|
—
|
|
—
|
|
(3
|
)
|
—
|
|
(3
|
)
|
|||||||||
|
Dividend distribution to consolidated subsidiaries
|
—
|
|
—
|
|
(39
|
)
|
39
|
|
—
|
|
|||||||||
|
Equity contribution
|
—
|
|
30
|
|
311
|
|
(341
|
)
|
—
|
|
|||||||||
|
Borrowings (repayments) of intercompany notes
|
—
|
|
—
|
|
54
|
|
(54
|
)
|
—
|
|
|||||||||
|
Purchase of non-controlling interest
|
—
|
|
—
|
|
(24
|
)
|
—
|
|
(24
|
)
|
|||||||||
|
Net cash provided by (used in) financing activities
|
1,356
|
|
30
|
|
327
|
|
(356
|
)
|
1,357
|
|
|||||||||
|
Cash flows from discontinued operations
|
|||||||||||||||||||
|
Net cash used in discontinued operations operating activities
|
(52
|
)
|
—
|
|
—
|
|
—
|
|
(52
|
)
|
|||||||||
|
Effect of exchange rate changes on cash and cash equivalents
|
(1
|
)
|
(1
|
)
|
(20
|
)
|
—
|
|
(22
|
)
|
|||||||||
|
Increase (decrease) in cash and cash equivalents
|
(496
|
)
|
5
|
|
(50
|
)
|
—
|
|
(541
|
)
|
|||||||||
|
Cash and cash equivalents at beginning of period
|
571
|
|
6
|
|
492
|
|
—
|
|
1,069
|
|
|||||||||
|
Cash and cash equivalents at end of period
|
$
|
75
|
|
$
|
11
|
|
$
|
442
|
|
$
|
—
|
|
$
|
528
|
|
||||
111
17. QUARTERLY INFORMATION (unaudited)
|
In millions, except per share amounts
|
First
|
Second
|
Third
|
Fourth
|
||||||||||||
|
2015
|
||||||||||||||||
|
Total revenue
|
$
|
1,476
|
|
$
|
1,604
|
|
$
|
1,613
|
|
$
|
1,680
|
|
||||
|
Gross margin
|
390
|
|
146
|
|
457
|
|
476
|
|
||||||||
|
Operating income (loss)
|
95
|
|
(266
|
)
|
168
|
|
138
|
|
||||||||
|
Income (loss) from continuing operations (attributable to NCR)
|
40
|
|
(344
|
)
|
102
|
|
44
|
|
||||||||
|
(Loss) from discontinued operations, net of tax
|
—
|
|
—
|
|
(4
|
)
|
(20
|
)
|
||||||||
|
Net income (loss) attributable to NCR
|
$
|
40
|
|
$
|
(344
|
)
|
$
|
98
|
|
$
|
24
|
|
||||
|
Income (loss) per share attributable to NCR common stockholders:
|
||||||||||||||||
|
Income (loss) per common share from continuing operations
|
||||||||||||||||
|
Basic
|
$
|
0.24
|
|
$
|
(2.03
|
)
|
$
|
0.60
|
|
$
|
0.27
|
|
||||
|
Diluted
|
$
|
0.23
|
|
$
|
(2.03
|
)
|
$
|
0.59
|
|
$
|
0.27
|
|
||||
|
Net income per common share:
|
||||||||||||||||
|
Basic
|
$
|
0.24
|
|
$
|
(2.03
|
)
|
$
|
0.58
|
|
$
|
0.15
|
|
||||
|
Diluted
|
$
|
0.23
|
|
$
|
(2.03
|
)
|
$
|
0.57
|
|
$
|
0.15
|
|
||||
|
2014
|
||||||||||||||||
|
Total revenue
|
$
|
1,518
|
|
$
|
1,658
|
|
$
|
1,647
|
|
$
|
1,768
|
|
||||
|
Gross margin
|
416
|
|
480
|
|
404
|
|
432
|
|
||||||||
|
Operating income
|
108
|
|
169
|
|
41
|
|
35
|
|
||||||||
|
Income from continuing operations (attributable to NCR)
|
53
|
|
90
|
|
—
|
|
38
|
|
||||||||
|
Income (loss) from discontinued operations, net of tax
|
—
|
|
—
|
|
15
|
|
(5
|
)
|
||||||||
|
Net income attributable to NCR
|
$
|
53
|
|
$
|
90
|
|
$
|
15
|
|
$
|
33
|
|
||||
|
Income per share attributable to NCR common stockholders:
|
||||||||||||||||
|
Income per common share from continuing operations
|
||||||||||||||||
|
Basic
|
$
|
0.32
|
|
$
|
0.54
|
|
$
|
—
|
|
$
|
0.23
|
|
||||
|
Diluted
|
$
|
0.31
|
|
$
|
0.53
|
|
$
|
—
|
|
$
|
0.22
|
|
||||
|
Net income per common share:
|
||||||||||||||||
|
Basic
|
$
|
0.32
|
|
$
|
0.54
|
|
$
|
0.09
|
|
$
|
0.20
|
|
||||
|
Diluted
|
$
|
0.31
|
|
$
|
0.53
|
|
$
|
0.09
|
|
$
|
0.19
|
|
||||
Operating income for the quarter ended
December 31, 2015
was impacted by actuarial losses related to the remeasurement of our pension plan assets and liabilities. The actuarial losses included in pension expense recognized in the quarter ended
December 31, 2015
decreased operating income by
$29 million
, net income attributable to NCR by
$17 million
, basic earnings per share by
$0.10
, and diluted earnings per share by
$0.10
.
Operating income for the quarter ended
December 31, 2014
was impacted by actuarial losses related to the remeasurement of our pension plan assets and liabilities. The actuarial losses included in pension expense recognized in the quarter ended
December 31, 2014
decreased operating income by
$150 million
, net income attributable to NCR by
$74 million
, basic earnings per share by
$0.44
, and diluted earnings per share by
$0.43
.
Net income per share in each quarter is computed using the weighted-average number of shares outstanding during that quarter while net income per share for the full year is computed using the weighted-average number of shares outstanding during the year. Thus, the sum of the four quarters’ net income per share will not necessarily equal the full-year net income per share.
112
None.
|
Item 9A.
|
CONTROLS AND PROCEDURES
|
Evaluation of Disclosure Controls and Procedures
NCR has established disclosure controls and procedures (as defined in Rules 13a-15(e) and 15d-15(e) of the Securities Exchange Act of 1934 (the Exchange Act)) to ensure that information required to be disclosed by NCR in the reports that it files or submits under the Exchange Act is recorded, processed, summarized and reported within the time periods specified in the SEC’s rules and forms. Disclosure controls and procedures include, without limitation, controls and procedures designed to ensure that information required to be disclosed by NCR in the reports that it files or submits under the Exchange Act is accumulated and communicated to NCR’s management, including its Chief Executive and Chief Financial Officers, as appropriate to allow timely decisions regarding required disclosure. Based on their evaluation as of the end of the period covered by this Report, conducted under their supervision and with the participation of management, the Company’s Chief Executive and Chief Financial Officers have concluded that NCR’s disclosure controls and procedures are effective to meet such objectives and that NCR’s disclosure controls and procedures adequately alert them on a timely basis to material information relating to the Company (including its consolidated subsidiaries) required to be included in NCR’s Exchange Act filings.
Changes in Internal Control over Financial Reporting
There have been no changes in our internal control over financial reporting that occurred during the last fiscal quarter that have materially affected, or are reasonably likely to materially affect, our internal control over financial reporting.
Management’s Report on Internal Control over Financial Reporting
Management is responsible for establishing and maintaining effective internal control over financial reporting as defined in Rules 13a-15(f) and 15d-15(f) under the Exchange Act. The Company’s internal control over financial reporting is a process designed to provide reasonable assurance regarding the reliability of financial reporting and the preparation of financial statements for external purposes in accordance with generally accepted accounting principles. A company’s internal control over financial reporting includes those policies and procedures that (i) pertain to the maintenance of records that, in reasonable detail, accurately and fairly reflect the transactions and dispositions of the assets of the company; (ii) provide reasonable assurance that transactions are recorded as necessary to permit preparation of financial statements in accordance with generally accepted accounting principles, and that receipts and expenditures of the company are being made only in accordance with authorizations of management and directors of the company; and (iii) provide reasonable assurance regarding prevention or timely detection of unauthorized acquisition, use, or disposition of the company’s assets that could have a material effect on the financial statements.
Because of its inherent limitations due to, for example, the potential for human error or circumvention of controls, internal control over financial reporting may not prevent or detect misstatements. Also, projections of any evaluation of effectiveness to future periods are subject to the risk that controls may become inadequate because of changes in conditions, or that the degree of compliance with the policies or procedures may deteriorate.
The Company’s management assessed the effectiveness of the Company’s internal control over financial reporting as of
December 31, 2015
. In making this assessment, we used the criteria set forth by the Committee of Sponsoring Organizations of the Treadway Commission (COSO) in the 2013 Internal Control-Integrated Framework. Based on our assessment, we determined that, as of
December 31, 2015
, the Company’s internal control over financial reporting was effective based on those criteria.
PricewaterhouseCoopers LLP, our independent registered public accounting firm, has audited the effectiveness of the Company’s internal control over financial reporting as of
December 31, 2015
as stated in their report which appears in Item 8 of this Report.
On February 24, 2016, Deanna W. Oppenheimer resigned from her positions as a member of the Company’s Board of Directors and as a member of the Audit Committee of the Board, effective as of the completion of the Company’s 2016 Annual Meeting of Stockholders.
113
|
Item 10.
|
DIRECTORS, EXECUTIVE OFFICERS AND CORPORATE GOVERANCE
|
Except as set forth in the following paragraphs of this Item 10, the information required by this Item 10 will be set forth under the headings “Election of Directors,” “Section 16(a) Beneficial Ownership Reporting Compliance,” and “Committees of the Board” in the Definitive Proxy Statement for our
2016
Annual Meeting of Stockholders to be filed with the SEC within 120 days after the end of our fiscal
2015
year, and is incorporated herein by reference. The information required by this Item 10 regarding our executive officers is set forth under the heading “Executive Officers of the Registrant” in Part I of this Form 10-K and is incorporated herein by reference.
We have not materially changed the procedures by which stockholders may recommend nominees to the Company’s Board of Directors.
We have a Code of Conduct that sets the standard for ethics and compliance for all of our directors and employees, including our chief executive officer, our chief financial officer and our chief accounting officer. Our Code of Conduct is available on the Corporate Governance page at our website at http://www.ncr.com/company/corporate-governance/code-of-conduct under the heading “Code of Conduct.” We intend to disclose any amendments to or waivers of the Code of Conduct with respect to any director as well as our principal executive officer, principal financial officer, and principal accounting officer, on the Corporate Governance page of our website promptly following the date of such amendment or waiver.
|
Item 11.
|
EXECUTIVE COMPENSATION
|
The information required by this Item 11 will be set forth under the headings “Executive Compensation - Compensation Discussion & Analysis,” “Compensation and Human Resource Committee,” and “Board Compensation and Human Resource Committee Report on Executive Compensation” in the Definitive Proxy Statement for our
2016
Annual Meeting of Stockholders to be filed with the SEC within 120 days after the end of our fiscal
2015
year, and is incorporated herein by reference.
|
Item 12.
|
SECURITY OWNERSHIPS OF CERTAIN BENEFICIAL OWNERS AND MANAGEMENT AND RELATED STOCKHOLDER MATTERS
|
The information required by this Item 12 will be set forth under the headings “NCR Stock Ownership” and “Equity Compensation Plan Information” in the Definitive Proxy Statement for our
2016
Annual Meeting of Stockholders to be filed with the SEC within 120 days after the end of our fiscal
2015
year, and is incorporated herein by reference.
|
Item 13.
|
CERTAIN RELATIONSHIPS AND RELATED TRANSACTIONS AND DIRECTOR INDEPENDENCE
|
The information required by this Item 13 will be set forth under the headings “Related Person Transactions” and “Corporate Governance” in the Definitive Proxy Statement for our
2016
Annual Meeting of Stockholders to be filed with the SEC within 120 days after the end of our fiscal
2015
year, and is incorporated herein by reference.
The information required by this Item 14 will be set forth under the heading “Fees Paid to Independent Registered Public Accounting Firm” in the Definitive Proxy Statement for our
2016
Annual Meeting of Stockholders to be filed with the SEC within 120 days after the end of our fiscal
2015
year, and is incorporated herein by reference.
114
|
Item 15.
|
EXHIBITS AND FINANCIAL STATEMENT SCHEDULE
|
(a)(1)
Financial Statements
: The following is an index of the consolidated financial statements of the Company and the Report of Independent Registered Public Accounting Firm filed as part of this Form 10-K:
|
Page of Form 10-K
|
|
(2)
Financial Statement Schedule
: Financial Statement Schedule II—Valuation and Qualifying Accounts is included in this Form 10-K. All other schedules are not required under the related instructions or are not applicable.
(3)
Exhibits
: See Index of Exhibits below for a listing of all exhibits to this Form 10-K. The management contracts and compensatory plans or arrangements required to be filed as an exhibit to this Form 10-K are identified in the Index of Exhibits by an asterisk (*).
(b) The following is an index of all exhibits to this Form 10-K. Exhibits identified in parentheses in the index below, on file with the SEC, are incorporated herein by reference as exhibits hereto.
|
2.1
|
Separation and Distribution Agreement, dated as of August 27, 2007, between NCR Corporation and Teradata Corporation (Exhibit 10.1 to the Current Report on Form 8-K of Teradata Corporation dated September 6, 2007).
|
|
|
2.2
|
Asset Purchase Agreement, dated as of February 3, 2012, by and between Redbox Automated Retail, LLC and NCR Corporation (Exhibit 2.2 to the NCR Corporation Annual Report on Form 10-K for the year ended December 31, 2012.
|
|
|
2.3
|
First Amendment to Asset Purchase Agreement, dated as of June 22, 2012, by and between Redbox Automated Retail, LLC and NCR Corporation (Exhibit 2.3 to the NCR Corporation Quarterly Report on Form 10-Q for the quarter ended June 30, 2012).
|
|
|
2.4
|
Agreement and Plan of Merger, dated as of December 2, 2013, by and among NCR Corporation, Delivery Acquisition Corporation, Fandango Holdings Corporation and Thoma Bravo, LLC as the Stockholder Representative (Exhibit 2.1 to the Current Report on Form 8-K of NCR Corporation dated December 2, 2013 (the “December 2, 2013 Form 8-K”)).
|
|
|
2.5
|
Commitment Letter, dated as of December 2, 2013, by and among NCR Corporation, JPMorgan Chase Bank, N.A., J.P. Morgan Securities LLC, Bank of America, N.A., Merrill Lynch, Pierce, Fenner & Smith Incorporated, Royal Bank of Canada, RBC Capital Markets, SunTrust Bank, SunTrust Robinson Humphrey, Inc., WF Investment Holdings, LLC and Wells Fargo Securities, LLC (Exhibit 2.2 to the December 2, 2013 Form 8-K).
|
|
|
2.6
|
Share Purchase Agreement, dated as of December 2, 2013, by and among NCR Limited and the holders of the outstanding share capital of Alaric Systems Limited (Exhibit 2.3 to the December 2, 2013 Form 8-K).
|
|
|
3.1
|
Articles of Amendment and Restatement of NCR Corporation, as amended effective May 14, 1999 (Exhibit 3.1 to the NCR Corporation Quarterly Report on Form 10-Q for the quarter ended June 30, 1999).
|
|
115
|
3.2
|
Bylaws of NCR Corporation, as amended and restated on January 26, 2011 (Exhibit 3(ii) to the Current Report on Form 8-K of NCR Corporation dated January 31, 2011).
|
|
|
3.3
|
Articles Supplementary Classifying Series A Convertible Preferred Stock (Exhibit 3.1 to the Current Report on Form 8-K of NCR Corporation dated December 2, 2015 (the “December 2, 2015 Form 8-K”).
|
|
|
4.1
|
Common Stock Certificate of NCR Corporation (Exhibit 4.1 to the NCR Corporation Annual Report on Form 10-K for the year ended December 31, 1999).
|
|
|
4.2
|
Indenture, dated September 17, 2012, among NCR Corporation, as issuer, NCR International Inc. and Radiant Systems Inc. as subsidiary guarantors and U.S. Bank National Association, as trustee (Exhibit 4.01 to the Current Report on Form 8-K of NCR Corporation dated September 17, 2012).
|
|
|
4.3
|
Indenture, dated December 18, 2012, among NCR Corporation, as issuer, NCR International Inc. and Radiant Systems Inc. as subsidiary guarantors and U.S. Bank National Association, as trustee (Exhibit 4.01 to the Current Report on Form 8-K of NCR Corporation dated December 18, 2012).
|
|
|
4.4
|
Indenture, dated December 19, 2013, between NCR Escrow Corp. and U.S. Bank National Association relating to the $400 million aggregate principal amount of 5.875% senior notes due 2021 (the “5.875% Notes”) (Exhibit 4.1 to the Current Report on Form 8-K of NCR Corporation dated December 19, 2013 (the “December 19, 2013 Form 8-K”)).
|
|
|
4.4.1
|
First Supplemental Indenture relating to the 5.875% Notes, dated January 10, 2014, among NCR Corporation, NCR International, Inc. and U.S. Bank National Association, as trustee (Exhibit 4.1 to the Current Report of NCR Corporation dated January 10, 2014 (the “January 10, 2014 Form 8-K”)).
|
|
|
4.5
|
Indenture, dated December 19, 2013, between NCR Escrow Corp. and U.S. Bank National Association relating to the $700 million aggregate principal amount of 6.375% senior notes due 2023 (the “6.375% Notes”) (Exhibit 4.2 to the December 19, 2013 Form 8-K).
|
|
|
4.5.1
|
First Supplemental Indenture relating to the 6.375% Notes, dated January 10, 2014, among NCR Corporation, NCR International, Inc. and U.S. Bank National Association, as trustee (Exhibit 4.2 to the January 10, 2014 Form 8-K).
|
|
|
10.1
|
Separation and Distribution Agreement, dated as of February 1, 1996, and amended and restated as of March 29, 1996, by and among NCR Corporation, AT&T Corp. and Lucent Technologies Inc. (Exhibit 10.1 to Amendment No. 3 to the Lucent Technologies Inc. Registration Statement on Form S-1 (No. 333-00703) (the “Lucent Registration Statement Amendment No. 3”)).
|
|
|
10.2
|
Employee Benefits Agreement, dated as of November 20, 1996, by and between AT&T Corp. and NCR Corporation (Exhibit 10.2 to the NCR Corporation Annual Report on Form 10-K for the year ended December 31, 1996 (the “1996 Annual Report”)).
|
|
|
10.3
|
Patent License Agreement, effective as of March 29, 1996, by and among AT&T Corp., NCR Corporation, and Lucent Technologies Inc. (Exhibit 10.7 to Amendment No. 4 to the Lucent Technologies Inc. Registration Statement on Form S-1 (No. 333-0073) (the “Lucent Registration Statement Amendment No. 4”)).
|
|
|
10.4
|
Amended and Restated Technology License Agreement, effective as of March 29, 1996, by and among AT&T Corp., NCR Corporation, and Lucent Technologies Inc. (Exhibit 10.8 to the Lucent Registration Statement Amendment No. 4).
|
|
|
10.5
|
Tax Sharing Agreement, dated as of February 1, 1996, and amended and restated as of March 29, 1996, by and among AT&T Corp., NCR Corporation, and Lucent Technologies Inc. (Exhibit 10.6 to the Lucent Registration Statement Amendment No. 3).
|
|
|
10.6
|
Tax Sharing Agreement, dated as of September 21, 2007, between NCR Corporation and Teradata Corporation (Exhibit 10.1 to the Current Report on Form 8-K of NCR Corporation dated September 21, 2007).
|
|
116
|
10.7
|
NCR Management Stock Plan (Exhibit 10.8 to the 1996 Annual Report). *
|
|
|
10.7.1
|
First Amendment to the NCR Management Stock Plan dated April 30, 2003 (Exhibit 10.4 to the NCR Corporation Quarterly Report on Form 10-Q for the quarter ended March 31, 2003). *
|
|
|
10.7.2
|
Amendment to NCR Management Stock Plan effective as of December 31, 2008 (Exhibit 10.17.2 to the NCR Corporation Annual Report on Form 10-K for the year ended December 31, 2008 (the “2008 Annual Report”)). *
|
|
|
10.7.3
|
Form of Stock Option Agreement under the NCR Management Stock Plan (Exhibit 10.6.3 to the NCR Corporation Annual Report on Form 10-K for the year ended December 31, 2005 (the “2005 Annual Report”)). *
|
|
|
10.7.4
|
Form of Restricted Stock Agreement under the NCR Management Stock Plan (Exhibit 10.6.4 to the 2005 Annual Report). *
|
|
|
10.8
|
NCR Corporation 2011 Amended and Restated Stock Incentive Plan (formerly the NCR 2006 Stock Incentive Plan, as amended and restated effective as of December 31, 2008) (the “2011 Stock Incentive Plan”) (Exhibit 10.1 to the Current Report on Form 8-K of NCR Corporation dated April 27, 2011). *
|
|
|
10.8.1
|
Form of 2009 Stock Option Agreement under the NCR Corporation 2011 Stock Incentive Plan (Exhibit 10.5 to the Current Report on Form 8-K of NCR Corporation dated December 12, 2008). *
|
|
|
10.8.2
|
Form of 2010 Stock Option Agreement under the 2011 Stock Incentive Plan (Exhibit 10.2 to the NCR Corporation Quarterly Report on Form 10-Q for the quarter ended March 31, 2010 (the "First Quarter 2010 Quarterly Report")).*
|
|
|
10.8.3
|
Form of 2011 Stock Option Agreement under the 2011 Stock Incentive Plan (Exhibit 10.1 to the NCR Corporation Quarterly Report on Form 10-Q for the quarter ended March 31, 2011). *
|
|
|
10.9
|
Amended and Restated NCR Management Incentive Plan (Exhibit 10.1 to the Current Report on Form 8-K of NCR Corporation dated April 27, 2011). *
|
|
|
10.10
|
NCR Director Compensation Program effective April 21, 2009 (Exhibit 10.7 to the NCR Corporation Quarterly Report on Form 10-Q for the quarter ended March 31, 2009 (the “First Quarter 2009 Form 10-Q”)). *
|
|
|
10.10.1
|
2009 Director Option Grant Statement under the NCR Director Compensation Program (Exhibit 10.8 to the First Quarter 2009 Form 10-Q). *
|
|
|
10.10.2
|
2009 Director Restricted Stock Unit Grant Statement under the NCR Director Compensation Program (Exhibit 10.9 to the First Quarter 2009 Form 10-Q). *
|
|
|
10.11
|
Amended and Restated NCR Change in Control Severance Plan effective December 31, 2008 (Exhibit 10.24.2 to the 2008 Annual Report). *
|
|
|
10.11.1
|
First Amendment to the Amended and Restated NCR Change in Control Severance Plan (Exhibit 10.6 to the NCR Corporation Quarterly Report on Form 10-Q for the quarter ended September 30, 2011). *
|
|
|
10.12
|
Employment Agreement with William Nuti, dated July 29, 2005 (Exhibit 10.1 to the Current Report on Form 8-K of NCR Corporation dated July 27, 2005). *
|
|
|
10.12.1
|
Letter Agreement, dated July 26, 2006, with William Nuti (Exhibit 10.4 to the Current Report on Form 8-K of NCR Corporation dated July 25, 2006). *
|
|
|
10.12.2
|
Second Amendment, effective as of December 12, 2008, to Letter Agreement with William Nuti dated July 29, 2005, as amended July 26, 2006 (Exhibit 10.30.2 to the 2008 Annual Report). *
|
|
117
|
10.12.3
|
Letter Agreement, dated March 11, 2015, between NCR Corporation and William Nuti (Exhibit 10.5 to the NCR Corporation Quarterly Report on Form 10-Q for the quarter ended March 31, 2015 (the “First Quarter 2015 Quarterly Report”)).*
|
|
|
10.13
|
NCR Director Compensation Program Effective April 27, 2010 (Exhibit 10.1 to the NCR Corporation Quarterly Report on Form 10-Q for the quarter ended June 30, 2010 (the “Second Quarter 2010 Quarterly Report”)). *
|
|
|
10.13.1
|
Form of 2010 Director Option Grant Statement (Exhibit 10.2 to the Second Quarter 2010 Quarterly Report). *
|
|
|
10.13.2
|
Form of 2010 Director Restricted Stock Unit Grant Statement (Exhibit 10.3 to the Second Quarter 2010 Quarterly Report). *
|
|
|
10.14
|
Letter Agreement with Robert Fishman dated March 17, 2010 (Exhibit 10.7 to the First Quarter 2010 Quarterly Report). *
|
|
|
10.15
|
Letter Agreement with Peter Dorsman dated April 4, 2006 (Exhibit 10.1 to the NCR Corporation Quarterly Report on Form 10-Q for the quarter ended September 30, 2010). *
|
|
|
10.16
|
NCR Corporation 2011 Economic Profit Plan (Exhibit 10.3 to the Current Report on Form 8-K of NCR Corporation dated April 27, 2011). *
|
|
|
10.16.1
|
First Amendment to NCR Corporation 2011 Economic Profit Plan (Exhibit 10.29.1 to the NCR Corporation Annual Report on Form 10-K for the year ended December 31, 2011). *
|
|
|
10.16.2
|
Second Amendment to NCR Corporation 2011 Economic Profit Plan, dated January 25, 2012 (Exhibit 10.1 to the First Quarter 2012 Quarterly Report).
|
|
|
10.16.3
|
Third Amendment to NCR Corporation 2011 Economic Profit Plan (Exhibit 10.1 to the Current Report on Form 8-K of NCR Corporation dated October 1, 2013). *
|
|
|
10.16.4
|
Fourth Amendment to NCR Corporation 2011 Economic Profit Plan (Exhibit 10.18.4 to the NCR Corporation Annual Report on Form 10-K for the year ended December 31, 2014 (the “2014 Annual Report”)). *
|
|
|
10.16.5
|
Amended and Restated NCR Corporation Economic Profit Plan (Exhibit 10.2 to the NCR Corporation Quarterly Report on Form 10-Q for the quarter ended March 31, 2015 (the “Second Quarter 2015 Quarterly Report)).*
|
|
|
10.17
|
Equity Subscription Agreement, dated July 26, 2011, among NCR Corporation, Scopus Industrial S.A., Scopus Tecnologia Ltda. and NCR Brasil - Indústria de Equipamentos Para Automação Ltda., including Schedule I - The form of Shareholders' Agreement (Exhibit 10.1 to the Current Report on Form 8-K of NCR Corporation dated July 26, 2011).
|
|
|
10.18
|
Credit Agreement, dated as of August 22, 2011, by and among NCR Corporation, the Lenders party thereto and JPMorgan Chase Bank, N.A., as Administrative Agent (Exhibit 10.1 to the Current Report on Form 8-K of NCR Corporation dated August 22, 2011 (the “August 22, 2011 Form 8-K”)).
|
|
|
10.19
|
Guarantee and Pledge Agreement, dated as of August 22, 2011, by and among NCR Corporation, the subsidiaries of NCR Corporation identified therein and JPMorgan Chase Bank, N.A., as Administrative Agent (Exhibit 10.1 to the August 22, 2011 Form 8-K).
|
|
|
10.20
|
Incremental Facility Agreement, dated as of August 22, 2012, by and among NCR Corporation, the Lenders party thereto, and JPMorgan Chase Bank, N.A., as Administrative Agent (Exhibit 10.1 to the NCR Corporation Quarterly Report on Form 10-Q for the quarter ended September 30, 2012 (the “Third Quarter 2012 Quarterly Report”)).
|
|
|
10.21
|
Reaffirmation Agreement, dated as of August 22, 2012, by and among NCR Corporation, the subsidiaries of NCR Corporation identified therein, and JPMorgan Chase Bank, N.A., as Administrative Agent (Exhibit 10.2 to the Third Quarter 2012 Quarterly Report).
|
|
118
|
10.22
|
Second Amendment, dated as of August 22, 2012, by and among NCR Corporation, the Lenders party thereto, and JPMorgan Chase Bank, N.A., as Administrative Agent, relating to the Credit Agreement, dated as of August 22, 2011 and amended as of December 21, 2011, by and among NCR Corporation, the Lenders party thereto, and JPMorgan Chase Bank, N.A., as Administrative Agent (Exhibit 10.3 to the Third Quarter 2012 Quarterly Report).
|
|
|
10.23
|
Voting and Support Agreement, dated as of November 28, 2012, by and among NCR Corporation, Moon S.P.V. (Subsidiary) Ltd. and each of Boaz Dotan, Eli Gelman, Nehemia Lemelbaum, Avinoam Naor and Mario Segal (Exhibit 10.1 to the Current Report on Form 8-K of NCR Corporation dated November 28, 2012).
|
|
|
10.24
|
NCR Corporation 2013 Stock Incentive Plan (the “2013 Stock Incentive Plan”) (Appendix A to the NCR Corporation Proxy Statement on Schedule 14A for the NCR Corporation 2013 Annual Meeting of Stockholders). *
|
|
|
10.24.1
|
Form of 2013 Time-Based Restricted Stock Unit Agreement under the 2011 Stock Incentive and the 2013 Stock Incentive Plan (Exhibit 10.2 to the NCR Corporation Quarterly Report on Form 10-Q for the quarter ended March 31, 2013 (the “First Quarter 2013 Quarterly Report”)). *
|
|
|
10.24.2
|
Form of 2013 Performance-Based Restricted Stock Unit Agreement under the 2011 Stock Incentive Plan and the 2013 Stock Incentive Plan (Exhibit 10.3 to the First Quarter 2013 Quarterly Report). *
|
|
|
10.24.3
|
Form of 2014 Performance Based Restricted Stock Unit Award Agreement under the 2013 Stock Incentive Plan (Exhibit 10.1 to the Quarterly Report on Form 10-Q of NCR Corporation for the quarter ended March 31, 2014 (the "First Quarter 2014 Quarterly Report"). *
|
|
|
10.24.4
|
Form of 2014 Time Based Restricted Stock Unit Award Agreement under the 2013 Stock Incentive Plan (Exhibit 10.2 to the First Quarter 2014 Quarterly Report). *
|
|
|
10.24.5
|
Form of 2014 Single-Metric Performance Based Restricted Stock Unit Award Agreement under the 2013 Stock Incentive Plan (Exhibit 10.3 to the First Quarter 2014 Quarterly Report). *
|
|
|
10.24.6
|
Form of 2015 Performance Based Restricted Stock Unit Award Agreement under the 2013 Stock Incentive Plan (Exhibit 10.1 to the First Quarter 2015 Quarterly Report).*
|
|
|
10.24.7
|
Form of 2015 Time Based Restricted Stock Unit Award Agreement under the 2013 Stock Incentive Plan (Exhibit 10.2 to the First Quarter 2015 Quarterly Report).*
|
|
|
10.24.8
|
Form of 2015 Single-Metric Performance-Based Restricted Stock Unit Award Agreement under the 2013 Stock Incentive Plan (Exhibit 10.3 to the First Quarter 2015 Quarterly Report).*
|
|
|
10.24.9
|
Form of 2015 Stock Option Award Agreement under the 2013 Stock Incentive Plan (Exhibit 10.4 to the First Quarter 2015 Quarterly Report).*
|
|
|
10.25
|
Third Amendment, dated as of February 5, 2013, by and among NCR Corporation, the Lenders party thereto, and JPMorgan Chase Bank, N.A., as Administrative Agent, relating to the Credit Agreement, dated as of August 22, 2011, as amended and restated as of August 22, 2012, by and among NCR Corporation, the Lenders party thereto and JPMorgan Chase Bank, N.A., as Administrative Agent (Exhibit 10.1 to the First Quarter 2013 Quarterly Report).
|
|
|
10.26
|
Credit Agreement, dated as of August 22, 2011, as amended and restated as of July 25, 2013, by and among NCR Corporation, the Lenders party thereto and JPMorgan Chase Bank, N.A., as Administrative Agent (Exhibit 10.1 to the NCR Corporation Quarterly Report on Form 10-Q for the quarter ended September 30, 2013 (the “Third Quarter 2013 Quarterly Report”)).
|
|
|
10.27
|
Reaffirmation Agreement, dated as of July 25, 2013, by and among NCR Corporation, the subsidiaries of NCR Corporation identified therein, and JPMorgan Chase Bank, N.A., as Administrative Agent (Exhibit 10.2 to the Third Quarter 2013 Quarterly Report).
|
|
119
|
10.28
|
Agreement between NCR and the Trustees of the NCR Pension Plan (UK), dated November 14, 2013 (Exhibit 10.1 to the Current Report on Form 8-K of NCR Corporation dated November 14, 2013).
|
|
|
10.29
|
First Amendment, dated as of December 4, 2013, to the Credit Agreement, dated as of August 22, 2011, as amended and restated as of July 25, 2013, among NCR Corporation, the lenders party thereto and JPMorgan Chase Bank, N.A., as the administrative agent (Exhibit 10.1 to the Current Report on Form 8-K of NCR Corporation dated December 5, 2013 (the “December 5, 2013 Form 8-K”)).
|
|
|
10.30
|
Incremental Facility Agreement, dated as of December 4, 2013, among NCR Corporation, the lenders party thereto and JPMorgan Chase Bank, N.A., as the administrative agent (Exhibit 10.2 to the December 5, 2013 Form 8-K).
|
|
|
10.31
|
Registration Rights Agreement relating to the 5.875% Notes, dated December 19, 2013, among NCR Corporation; NCR International, Inc., and Radiant Systems, Inc., as subsidiary guarantors; and J.P. Morgan Securities LLC, as representative of the initial purchasers (Exhibit 10.1 to the December 19, 2013 Form 8-K).
|
|
|
10.32
|
Registration Rights Agreement relating to the 6.375% Notes, dated December 19, 2013, among NCR Corporation; NCR International, Inc., and Radiant Systems, Inc., as subsidiary guarantors; and J.P. Morgan Securities LLC, as representative of the initial purchasers (Exhibit 10.2 to the December 19, 2013 Form 8-K).
|
|
|
10.33
|
Receivables Financing Agreement, dated as of November 21, 2014, by and among NCR Receivables LLC, as borrower, NCR Corporation, as servicer, PNC Bank, National Association, as administrative agent, and PNC Bank, National Association, The Bank of Tokyo-Mitsubishi UFJ, Ltd., New York Branch, Victory Receivables Corporation and the other lender parties from time to time party thereto (Exhibit 10.1 to the Current Report on Form 8-K of NCR Corporation dated November 21, 2014 (the “November 21, 2014 Form 8-K”)).
|
|
|
10.34
|
Purchase and Sale Agreement, dated as of November 21, 2014, among NCR Receivables LLC, as buyer, and NCR Corporation and the other originator parties from time to time party thereto (Exhibit 10.2 to the November 21, 2014 Form 8-K).
|
|
|
10.35
|
NCR Executive Severance Plan (Exhibit 10.38 to the 2015 Annual Report). *
|
|
|
10.35.1
|
Amended and Restated NCR Executive Severance Plan (Exhibit 10.1 to the Second Quarter 2015 Quarterly Report).*
|
|
|
10.36
|
Letter Agreement with Andrew S. Heyman dated July 11, 2011 (Exhibit (d)(7) to the Schedule TO of Ranger Acquisition Corporation and NCR Corporation filed July 25, 2011 (the “Schedule TO”)). *
|
|
|
10.36.1
|
Retention Agreement with Andrew S. Heyman dated July 11, 2011 (Exhibit (d)(6) to the Schedule TO). *
|
|
|
10.37
|
Employment Letter of Frederick Marquardt dated April 4, 2014 (as amended May 1, 2014). *
|
|
|
10.38
|
Employment Contract, dated June 23, 2014, between NCR GmbH and Michael Bayer (Exhibit 10.41 to the 2014 Annual Report). *
|
|
|
10.38.1
|
Letter regarding additional terms of employment of Michael Bayer, dated June 23, 2014 (Exhibit 10.41.1 to the 2014 Annual Report). *
|
|
|
10.38.2
|
Employment Transfer Letter (revised) of Michael Bayer, dated July 30, 2015 (Exhibit 10.4 to the Second Quarter 2015 Quarterly Report).*
|
|
|
10.39
|
NCR Director Compensation Program effective April 23, 2013, as amended effective February 24, 2014 (Exhibit 10.42 to the 2014 Annual Report). *
|
|
|
10.39.1
|
2014 Director Restricted Stock Unit Grant Statement under the NCR Director Compensation Program (Exhibit 10.42.1 to the 2014 Annual Report). *
|
|
120
|
10.39.2
|
2015 Director Restricted Stock Unit Grant Statement under the NCR Director Compensation Program (Exhibit 10.3 to the Second Quarter 2015 Quarterly Report).*
|
|
|
10.40
|
Agreement by and among NCR Corporation, Marcato Capital Management LP, Marcato, L.P., Marcato II, L.P., Marcato International Master Fund, Ltd. and Richard T. McGuire III, dated November 10, 2014 (Exhibit 99.1 to the Current Report on Form 8-K of NCR Corporation dated November 10, 2014 (the “November 10, 2014 Form 8-K”)).
|
|
|
10.41
|
Confidentiality Agreement by and among NCR Corporation, Marcato Capital Management LP, Marcato, L.P., Marcato II, L.P., Marcato International Master Fund, Ltd. and Richard T. McGuire III, dated November 10, 2014 (Exhibit 99.2 to the November 10, 2014 Form 8-K).
|
|
|
10.42
|
Extension Agreement by and among NCR Corporation, Marcato Capital Management LP, Marcato, L.P., Marcato II, L.P., Marcato International Master Fund, Ltd. and Richard T. McGuire, dated November 3, 2015 (Exhibit 99.1 to the Current Report on Form 8-K of NCR Corporation dated November 3, 2015).
|
|
|
10.43
|
Investment Agreement dated as of November 11, 2015, by and between NCR Corporation and the affiliates of Blackstone Capital Partners VI, L.P. and Blackstone Tactical Opportunities L.L.C. named therein (Exhibit 10.1 to the Current Report on Form 8-K of NCR Corporation dated November 11, 2015).
|
|
|
10.44
|
Third Amendment dated as of November 20, 2015, to the Credit Agreement dated as of August 22, 2011, as amended and restated as of July 25, 2013, as amended by the First Amendment, dated as of December 4, 2013, and the Second Amendment, dated as of July 29, 2014, among NCR Corporation, the lenders party thereto and JPMorgan Chase Bank, N.A., as the administrative agent (Exhibit 10.1 to the Current Report on Form 8-K of NCR Corporation dated November 20, 2015).
|
|
|
10.45
|
Registration Rights Agreement, dated as of December 4, 2015, by and between NCR Corporation and the affiliates of Blackstone Capital Partners VI, L.P. and Blackstone Tactical Opportunities L.L.C. named therein (Exhibit 10.1 to the December 2, 2015 Form 8-K).
|
|
|
12.1
|
Statement Regarding Computation of Ratio of Earnings to Fixed Charges and Preferred Stock Dividends.
|
|
|
21
|
Subsidiaries of NCR Corporation.
|
|
|
23.1
|
Consent of Independent Registered Public Accounting Firm.
|
|
|
31.1
|
Certification pursuant to Rule 13a-14(a) and Rule 15d-14(a) of the Securities Exchange Act of 1934.
|
|
|
31.2
|
Certification pursuant to Rule 13a-14(a) and Rule 15d-14(a) of the Securities Exchange Act of 1934.
|
|
|
32
|
Certification pursuant to 18 U.S.C. Section 1350 as adopted pursuant to Section 906 of the Sarbanes-Oxley Act of 2002.
|
|
|
99.1
|
Tax Opinion of Wachtell, Lipton, Rosen & Katz in connection with the Spin off of Teradata, dated August 27, 2007 (Exhibit 99.2 to the Current Report on Form 8-K of NCR Corporation dated September 30, 2007).
|
|
|
101
|
Financials in XBRL Format.
|
|
* Management contracts or compensatory plans/arrangements
121
NCR Corporation
SCHEDULE II--VALUATION AND QUALIFYING ACCOUNTS
(In millions)
|
Column A
|
Column B
|
Column C
|
Column D
|
Column E
|
||||||||||||||||
|
Additions
|
||||||||||||||||||||
|
Description
|
Balance at Beginning of Period
|
Charged to Costs & Expenses
|
Charged to Other Accounts
|
Deductions
|
Balance at End of Period
|
|||||||||||||||
|
Year Ended December 31, 2015
|
||||||||||||||||||||
|
Allowance for doubtful accounts
|
$
|
19
|
|
$
|
32
|
|
$
|
—
|
|
$
|
4
|
|
$
|
47
|
|
|||||
|
Deferred tax asset valuation allowance
|
$
|
294
|
|
$
|
—
|
|
$
|
52
|
|
$
|
—
|
|
$
|
346
|
|
|||||
|
Year Ended December 31, 2014
|
||||||||||||||||||||
|
Allowance for doubtful accounts
|
$
|
18
|
|
$
|
10
|
|
$
|
—
|
|
$
|
9
|
|
$
|
19
|
|
|||||
|
Deferred tax asset valuation allowance
|
$
|
364
|
|
$
|
—
|
|
$
|
—
|
|
$
|
70
|
|
$
|
294
|
|
|||||
|
Year Ended December 31, 2013
|
||||||||||||||||||||
|
Allowance for doubtful accounts
|
$
|
16
|
|
$
|
2
|
|
$
|
—
|
|
$
|
—
|
|
$
|
18
|
|
|||||
|
Deferred tax asset valuation allowance
|
$
|
399
|
|
$
|
—
|
|
$
|
—
|
|
$
|
35
|
|
$
|
364
|
|
|||||
122
SIGNATURES
Pursuant to the requirements of Section 13 or 15 (d) of the Securities Exchange Act of 1934, the registrant has duly caused this report to be signed on its behalf by the undersigned, thereunto duly authorized.
|
NCR CORPORATION
|
||||
|
Date:
|
February 26, 2016
|
By:
|
|
/s/ Robert Fishman
|
|
|
Robert Fishman
Senior Vice President and Chief Financial Officer
|
|||
Pursuant to the requirements of the Securities Exchange Act of 1934, this report has been signed below by the following persons on behalf of the registrant and in the capacities and on the date indicated.
|
Signature
|
Title
|
|
|
/s/ William R. Nuti
|
Chairman of the Board of Directors,
|
|
|
William R. Nuti
|
Chief Executive Officer and President
|
|
|
/s/ Robert P. Fishman
|
Senior Vice President and Chief Financial Officer
|
|
|
Robert P. Fishman
|
(Principal Financial and Accounting Officer)
|
|
|
/s/ Gregory R. Blank
|
Director
|
|
|
Gregory R. Blank
|
||
|
/s/ Edward P. Boykin
|
Director
|
|
|
Edward P. Boykin
|
||
|
/s/ Chinh E. Chu
|
Director
|
|
|
Chinh E. Chu
|
||
|
/s/ Richard L. Clemmer
|
Director
|
|
|
Richard L. Clemmer
|
||
|
/s/ Gary Daichendt
|
Director
|
|
|
Gary Daichendt
|
||
|
/s/ Robert P. DeRodes
|
Director
|
|
|
Robert P. DeRodes
|
||
|
/s/ Kurt P. Kuehn
|
Director
|
|
|
Kurt P. Kuehn
|
||
|
/s/ Linda Fayne Levinson
|
Director
|
|
|
Linda Fayne Levinson
|
||
|
/s/ Deanna W. Oppenheimer
|
Director
|
|
|
Deanna W. Oppenheimer
|
||
|
Date:
|
February 26, 2016
|
|
123
TABLE OF CONTENTS
Part IItem 1. BusinessNote 14, Segment Information and ConcentrationsNote 1, Description Of Business and Significant Accounting PoliciesNote 11, "commitments and Contingencies,"Item 1A. Risk FactorsNote 10, Employee Benefit PlansNote 11, "commitments and Contingencies"Item 1B. Unresolved Staff CommentsItem 2. PropertiesItem 3. Legal ProceedingsItem 4. Mine Safety DisclosuresPart IIItem 5. Market For The Registrant's Common Equity, Related Stockholder Matters and Issuer Purchases Of Equity SecuritiesItem 6. Selected Financial DataItem 7. Management's Discussion and Analysis Of Financial Condition and Results Of Operations (md&a)Note 10, Employee Benefit Plans,Note 7, "debt Obligations,"Note 3, "restructuring Plan,"Note 12, "derivatives and Hedging Instruments,"Note 8, "income Taxes,"Note 1, "description Of Business and Significant Accounting Policies"Note 14, "segment Information and Concentrations,"Note 11, "commitments and Contingencies."Item 7A. Quantitative and Qualitative Disclosures About Market RiskItem 8. Financial Statements and Supplemental DataNote 9 "stock Compensation Plans"Note 9, "stock Compensation Plans,"Note 6, "goodwill and Other Long-lived Assets"Note 13, Fair Value Of Assets and Liabilities,Note 5, "business Combinations and Divestitures"Note 12, "derivatives and Hedging Instruments."Note 5, "business Combinations and Divestitures,"Item 9. Changes in and Disagreements with Accountants on Accounting and Financial DisclosureItem 9A. Controls and ProceduresItem 9B. Other InformationPart IIIItem 10. Directors, Executive Officers and Corporate GoveranceItem 11. Executive CompensationItem 12. Security Ownerships Of Certain Beneficial Owners and Management and Related Stockholder MattersItem 13. Certain Relationships and Related Transactions and Director IndependenceItem 14. Principal Accountant Fees and ServicesPart IVItem 15. Exhibits and Financial Statement Schedule