NASDAQ, INC.
10-Ks and 10-Qs
|
|
|
|
|
|
|
|
|
|
|
|
|
|
|
|
|
|
|
|
|
|
|
|
|
|
|
|
|
|
|
|
|
|
|
|
|
|
|
|
|
|
|
|
|
|
|
|
|
|
|
|
|
|
|
|
UNITED STATES
SECURITIES AND EXCHANGE COMMISSION
Washington, D.C. 20549
_______________________________
FORM
10-Q
|
☒
|
QUARTERLY REPORT PURSUANT TO SECTION 13 OR 15(d) OF THE SECURITIES EXCHANGE ACT OF 1934
|
|
For the quarterly period ended March 31, 2019
|
|
|
OR
|
|
|
☐
|
TRANSITION REPORT PURSUANT TO SECTION 13 OR 15(d) OF THE SECURITIES EXCHANGE
ACT OF 1934
|
|
For the transition period from ________ to ________
|
|
Commission file number: 000-32651
___________________________________
Nasdaq, Inc.
(Exact name of registrant as specified in its charter)
|
Delaware
(State or Other Jurisdiction of Incorporation or Organization)
|
52-1165937
(I.R.S. Employer Identification No.)
|
|
|
|
|
151 W. 42nd Street, New York, New York
(Address of Principal Executive Offices)
|
10036
(Zip Code)
|
Registrant’s telephone number, including area code:
+1 212 401 8700
No changes
(Former name, former address and former fiscal year, if changed since last report)
_____________________________________
Indicate by check mark whether the registrant (1) has filed all reports required to be filed by Section 13 or 15(d) of the Securities Exchange Act of 1934 during the preceding 12 months (or for such shorter period that the registrant was required to file such reports), and (2) has been subject to such filing requirements for the past 90 days. Yes ☒ No ☐
Indicate by check mark whether the registrant has submitted electronically every Interactive Data File required to be submitted pursuant to Rule 405 of Regulation S-T (§232.405 of this chapter) during the preceding 12 months (or for such shorter period that the registrant was required to submit such files). Yes ☒ No ☐
Indicate by check mark whether the registrant is a large accelerated filer, an accelerated filer, a non-accelerated filer, a smaller reporting company, or an emerging growth company. See the definitions of “large accelerated filer,” “accelerated filer,” “smaller reporting company” and “emerging growth company” in Rule 12b-2 of the Exchange Act.
|
Large accelerated filer
|
☒
|
Accelerated filer
|
☐
|
|
Non-accelerated filer
|
☐
|
Smaller reporting company
|
☐
|
|
Emerging growth company
|
☐
|
||
If an emerging growth company, indicate by check mark if the registrant has elected not to use the extended transition period for complying with any new or revised financial accounting standards provided pursuant to Section 13(a) of the Exchange Act. ☐
Indicate by check mark whether the registrant is a shell company (as defined in Rule 12b-2 of the Exchange Act). Yes ☐ No ☒
Indicate the number of shares outstanding of each of the issuer’s classes of common stock, as of the latest practicable date.
|
Class
|
Outstanding at April 23, 2019
|
|
|
Common Stock, $.01 par value per share
|
165,704,510 shares
|
|
Nasdaq, Inc.
|
Page
|
||
|
Part I. FINANCIAL INFORMATION
|
||
|
|
|
|
|
Item 1.
|
||
|
|
|
|
|
|
|
|
|
|
|
|
|
Item 2.
|
||
|
Item 3.
|
||
|
Item 4.
|
||
|
Part II. OTHER INFORMATION
|
||
|
|
|
|
|
Item 1.
|
||
|
|
|
|
|
Item 1A.
|
||
|
|
|
|
|
Item 2.
|
||
|
|
||
|
Item 3.
|
||
|
|
|
|
|
Item 4.
|
||
|
|
|
|
|
Item 5.
|
||
|
|
|
|
|
Item 6.
|
||
i
About This Form 10-Q
Throughout this Form 10-Q, unless otherwise specified:
|
•
|
“Nasdaq,” “we,” “us” and “our” refer to Nasdaq, Inc.
|
|
•
|
“Nasdaq Baltic” refers to collectively, Nasdaq Tallinn AS, Nasdaq Riga, AS, and AB Nasdaq Vilnius.
|
|
•
|
“Nasdaq BX” refers to the cash equity exchange operated by Nasdaq BX, Inc.
|
|
•
|
“Nasdaq BX Options” refers to the options exchange operated by Nasdaq BX, Inc.
|
|
•
|
“Nasdaq Clearing” refers to the clearing operations conducted by Nasdaq Clearing AB.
|
|
•
|
“Nasdaq GEMX” refers to the options exchange operated by Nasdaq GEMX, LLC.
|
|
•
|
“Nasdaq ISE” refers to the options exchange operated by Nasdaq ISE, LLC.
|
|
•
|
“Nasdaq MRX” refers to the options exchange operated by Nasdaq MRX, LLC.
|
|
•
|
“Nasdaq Nordic” refers to collectively, Nasdaq Clearing AB, Nasdaq Stockholm AB, Nasdaq Copenhagen A/S, Nasdaq Helsinki Ltd, and Nasdaq Iceland hf.
|
|
•
|
“Nasdaq PHLX” refers to the options exchange operated by Nasdaq PHLX LLC.
|
|
•
|
“Nasdaq PSX” refers to the cash equity exchange operated by Nasdaq PHLX LLC.
|
•
“The Nasdaq Options Market” refers to the options exchange operated by The Nasdaq Stock Market LLC.
|
•
|
“The Nasdaq Stock Market” refers to the cash equity exchange operated by The Nasdaq Stock Market LLC.
|
* * * * * *
Nasdaq also provides as a tool for the reader the following list of abbreviations and acronyms that are used throughout this Quarterly Report on Form 10-Q.
401(k) Plan: Voluntary Defined Contribution Savings Plan
2016 Credit Facility: $400 million senior unsecured term loan facility which matures on November 25, 2019
2017 Credit Facility: $1 billion senior unsecured revolving credit facility which matures on April 25, 2022
2019 Notes: $500 million aggregate principal amount of senior unsecured floating rate notes due March 22, 2019
2020 Notes: $600 million aggregate principal amount of 5.55% senior unsecured notes due January 15, 2020
2021 Notes: €600 million aggregate principal amount of 3.875% senior unsecured notes due June 7, 2021
2023 Notes: €600 million aggregate principal amount of 1.75% senior unsecured notes due May 19, 2023
2024 Notes: $500 million aggregate principal amount of 4.25% senior unsecured notes due June 1, 2024
2026 Notes: $500 million aggregate principal amount of 3.85% senior unsecured notes due June 30, 2026
2029 Notes: €600 million aggregate principal amount of 1.75% senior unsecured notes due March 28, 2029
ASU: Accounting Standards Update
BWise: BWise Beheer B.V. and its subsidiaries
CCP: Central Counterparty
EMIR: European Market Infrastructure Regulation
Equity Plan: Nasdaq Equity Incentive Plan
ESPP: Nasdaq Employee Stock Purchase Plan
ETF: Exchange Traded Fund
ETP: Exchange Traded Product
eVestment: eVestment, Inc. and its subsidiaries
Exchange Act: Securities Exchange Act of 1934, as amended
FASB: Financial Accounting Standards Board
FICC: Fixed Income and Commodities Trading and Clearing
FINRA: Financial Industry Regulatory Authority
IPO: Initial Public Offering
ISE: U.S. Exchange Holdings, Inc. and its subsidiaries
LIBOR: London Interbank Offered Rate
NFX: Nasdaq Futures, Inc.
NPM: The NASDAQ Private Market, LLC
NSCC: National Securities Clearing Corporation
ii
OCC: The Options Clearing Corporation
OTC: Over-the-Counter
PSU: Performance Share Unit
SEC: U.S. Securities and Exchange Commission
SERP: Supplemental Executive Retirement Plan
SFSA: Swedish Financial Supervisory Authority
S&P: Standard & Poor’s
S&P 500: S&P 500 Stock Index
TSR: Total Shareholder Return
U.S. GAAP: U.S. Generally Accepted Accounting Principles
* * * * *
NASDAQ, the NASDAQ logos, and other brand, service or product names or marks referred to in this report are trademarks or services marks, registered or otherwise, of Nasdaq, Inc. and/or its subsidiaries. FINRA and TRADE REPORTING FACILITY are registered trademarks of FINRA.
* * * * * *
This Quarterly Report on Form 10-Q includes market share and industry data that we obtained from industry publications and surveys, reports of governmental agencies and internal company surveys. Industry publications and surveys generally state that the information they contain has been obtained from sources believed to be reliable, but we cannot assure you that this information is accurate or complete. We have not independently verified any of the data from third-party sources nor have we ascertained the underlying economic assumptions relied upon therein. Statements as to our market position are based on the most currently available market data. For market comparison purposes, The Nasdaq Stock Market data in this Quarterly Report on Form 10-Q for IPOs is based on data generated internally by us, which includes best efforts underwritings; therefore, the data may not be comparable to other publicly-available IPO data. Data in this Quarterly Report on Form 10-Q for new listings of equity securities on The Nasdaq Stock Market is based on data generated internally by us, which includes best efforts underwritings, issuers that switched from other listing venues, closed-end funds and ETPs. Data in this Quarterly Report on Form 10-Q for IPOs and new listings of equity securities on the Nasdaq Nordic and Nasdaq Baltic exchanges and Nasdaq First North also is based on data generated internally by us. IPOs and new listings data is presented as of period end. While we are not aware of any misstatements regarding industry data presented herein, our estimates involve risks and uncertainties and are subject to change based on various factors. We refer you to the “Risk Factors” section in this Quarterly Report on Form 10-Q for the quarter ended March 31, 2019, and the “Risk Factors” in our Annual Report on Form 10-K for the fiscal year ended December 31, 2018 that was filed with the SEC on February 22, 2019.
* * * * * *
Nasdaq intends to use its website, ir.nasdaq.com, as a means for disclosing material non-public information and for complying with SEC Regulation FD and other disclosure obligations.
iii
Forward-Looking Statements
The SEC encourages companies to disclose forward-looking information so that investors can better understand a company’s future prospects and make informed investment decisions. This Quarterly Report on Form 10-Q contains these types of statements. Words such as “may,” “will,” “could,” “should,” “anticipates,” “envisions,” “estimates,” “expects,” “projects,” “intends,” “plans,” “believes” and words or terms of similar substance used in connection with any discussion of future expectations as to industry and regulatory developments or business initiatives and strategies, future operating results or financial performance, and other future developments identify forward-looking statements. These include, among others, statements relating to:
|
•
|
our strategy, growth forecasts and 2019 outlook;
|
|
•
|
the integration of acquired businesses, including accounting decisions relating thereto;
|
|
•
|
the scope, nature or impact of acquisitions, divestitures, investments, joint ventures or other transactional activities;
|
|
•
|
the effective dates for, and expected benefits of, ongoing initiatives, including transactional activities and other strategic, restructuring, technology, de-leveraging and capital return initiatives;
|
|
•
|
our products, order backlog and services;
|
|
•
|
the impact of pricing changes;
|
|
•
|
tax matters;
|
|
•
|
the cost and availability of liquidity and capital; and
|
|
•
|
any litigation, or any regulatory or government investigation or action, to which we are or could become a party or which may affect us.
|
Forward-looking statements involve risks and uncertainties. Factors that could cause actual results to differ materially from those contemplated by the forward-looking statements include, among others, the following:
|
•
|
our operating results may be lower than expected;
|
|
•
|
our ability to successfully integrate acquired businesses or divest sold businesses or assets, including the fact that any integration or transition may be more difficult, time consuming or costly than expected, and we may be unable to realize synergies from business combinations, acquisitions, divestitures or other transactional activities;
|
|
•
|
loss of significant trading and clearing volumes or values, fees, market share, listed companies, market data products customers or other customers;
|
|
•
|
our ability to keep up with rapid technological advances and adequately address cybersecurity risks;
|
|
•
|
economic, political and market conditions and fluctuations, including interest rate and foreign currency risk, inherent in U.S. and international operations;
|
|
•
|
the performance and reliability of our technology and technology of third parties on which we rely;
|
|
•
|
any significant error in our operational processes;
|
|
•
|
our ability to continue to generate cash and manage our indebtedness; and
|
|
•
|
adverse changes that may occur in the litigation or regulatory areas, or in the securities markets generally.
|
Most of these factors are difficult to predict accurately and are generally beyond our control. You should consider the uncertainty and any risk related to forward-looking statements that we make. These risk factors are discussed under the caption “Part II. Item 1A. Risk Factors,” in this Quarterly Report on Form 10-Q for the quarter ended March 31, 2019 and more fully described in the “Risk Factors,
”
section in our Annual Report on Form 10-K for the fiscal year ended December 31, 2018 that was filed with the SEC on February 22, 2019. You are cautioned not to place undue reliance on these forward-looking statements, which speak only as of the date of this report. You should carefully read this entire Quarterly Report on Form 10-Q, including “Part I. Item 2. Management’s Discussion and Analysis of Financial Condition and Results of Operations,” and the condensed consolidated financial statements and the related notes. Except as required by the federal securities laws, we undertake no obligation to update any forward-looking statement, release publicly any revisions to any forward-looking statements or report the occurrence of unanticipated events. For any forward-looking statements contained in any document, we claim the protection of the safe harbor for forward-looking statements contained in the Private Securities Litigation Reform Act of 1995.
1
PART I - FINANCIAL INFORMATION
Item 1. Financial Statements.
Nasdaq, Inc.
Condensed Consolidated Balance Sheets
(in millions, except share and par value amounts)
|
March 31, 2019
|
December 31, 2018
|
||||||
|
(unaudited)
|
|||||||
|
Assets
|
|||||||
|
Current assets:
|
|||||||
|
Cash and cash equivalents
|
$
|
472
|
|
$
|
545
|
|
|
|
Restricted cash
|
67
|
|
41
|
|
|||
|
Financial investments, at fair value
|
220
|
|
268
|
|
|||
|
Receivables, net
|
447
|
|
384
|
|
|||
|
Default funds and margin deposits
|
3,274
|
|
4,742
|
|
|||
|
Other current assets
|
256
|
|
390
|
|
|||
|
Total current assets
|
4,736
|
|
6,370
|
|
|||
|
Property and equipment, net
|
370
|
|
376
|
|
|||
|
Goodwill
|
6,380
|
|
6,363
|
|
|||
|
Intangible assets, net
|
2,329
|
|
2,300
|
|
|||
|
Operating lease assets
|
378
|
|
—
|
|
|||
|
Other non-current assets
|
310
|
|
291
|
|
|||
|
Total assets
|
$
|
14,503
|
|
$
|
15,700
|
|
|
|
Liabilities
|
|||||||
|
Current liabilities:
|
|||||||
|
Accounts payable and accrued expenses
|
$
|
218
|
|
$
|
198
|
|
|
|
Section 31 fees payable to SEC
|
69
|
|
109
|
|
|||
|
Accrued personnel costs
|
118
|
|
199
|
|
|||
|
Deferred revenue
|
402
|
|
194
|
|
|||
|
Other current liabilities
|
321
|
|
253
|
|
|||
|
Default funds and margin deposits
|
3,274
|
|
4,742
|
|
|||
|
Short-term debt
|
1,239
|
|
875
|
|
|||
|
Total current liabilities
|
5,641
|
|
6,570
|
|
|||
|
Long-term debt
|
2,328
|
|
2,956
|
|
|||
|
Deferred tax liabilities, net
|
503
|
|
501
|
|
|||
|
Operating lease liabilities
|
357
|
|
—
|
|
|||
|
Other non-current liabilities
|
180
|
|
224
|
|
|||
|
Total liabilities
|
9,009
|
|
10,251
|
|
|||
|
Commitments and contingencies
|
|
|
|||||
|
Equity
|
|||||||
|
Nasdaq stockholders’ equity:
|
|||||||
|
Common stock, $0.01 par value, 300,000,000 shares authorized, shares issued: 171,592,982 at March 31, 2019 and 170,709,425 at December 31, 2018; shares outstanding: 165,701,483 at March 31, 2019 and 165,165,104 at December 31, 2018
|
2
|
|
2
|
|
|||
|
Additional paid-in capital
|
2,732
|
|
2,716
|
|
|||
|
Common stock in treasury, at cost: 5,891,499 shares at March 31, 2019 and 5,544,321 shares at December 31, 2018
|
(327
|
)
|
(297
|
)
|
|||
|
Accumulated other comprehensive loss
|
(1,645
|
)
|
(1,530
|
)
|
|||
|
Retained earnings
|
4,732
|
|
4,558
|
|
|||
|
Total Nasdaq stockholders’ equity
|
5,494
|
|
5,449
|
|
|||
|
Total liabilities and equity
|
$
|
14,503
|
|
$
|
15,700
|
|
|
See accompanying notes to condensed consolidated financial statements.
2
Nasdaq,
Inc.
Condensed Consolidated Statements of Income
(Unaudited)
(in millions, except per share amounts)
|
|
Three Months Ended March 31,
|
|||||||
|
|
2019
|
2018
|
||||||
|
Revenues:
|
|
|
||||||
|
Market Services
|
$
|
638
|
|
$
|
735
|
|
||
|
Corporate Services
|
131
|
|
132
|
|
||||
|
Information Services
|
193
|
|
174
|
|
||||
|
Market Technology
|
77
|
|
60
|
|
||||
|
Other revenues
|
—
|
|
50
|
|
||||
|
Total revenues
|
1,039
|
|
1,151
|
|
||||
|
Transaction-based expenses:
|
|
|
||||||
|
Transaction rebates
|
(331
|
)
|
(348
|
)
|
||||
|
Brokerage, clearance and exchange fees
|
(74
|
)
|
(137
|
)
|
||||
|
Revenues less transaction-based expenses
|
634
|
|
666
|
|
||||
|
Operating expenses:
|
|
|
||||||
|
Compensation and benefits
|
175
|
|
197
|
|
||||
|
Professional and contract services
|
37
|
|
37
|
|
||||
|
Computer operations and data communications
|
33
|
|
32
|
|
||||
|
Occupancy
|
24
|
|
25
|
|
||||
|
General, administrative and other
|
16
|
|
22
|
|
||||
|
Marketing and advertising
|
10
|
|
9
|
|
||||
|
Depreciation and amortization
|
48
|
|
53
|
|
||||
|
Regulatory
|
7
|
|
8
|
|
||||
|
Merger and strategic initiatives
|
9
|
|
10
|
|
||||
|
Total operating expenses
|
359
|
|
393
|
|
||||
|
Operating income
|
275
|
|
273
|
|
||||
|
Interest income
|
3
|
|
2
|
|
||||
|
Interest expense
|
(37
|
)
|
(38
|
)
|
||||
|
Net gain on divestiture of business
|
27
|
|
—
|
|
||||
|
Net income from unconsolidated investees
|
45
|
|
2
|
|
||||
|
Income before income taxes
|
313
|
|
239
|
|
||||
|
Income tax provision
|
66
|
|
62
|
|
||||
|
Net income attributable to Nasdaq
|
$
|
247
|
|
$
|
177
|
|
||
|
Per share information:
|
|
|
||||||
|
Basic earnings per share
|
$
|
1.49
|
|
$
|
1.06
|
|
||
|
Diluted earnings per share
|
$
|
1.48
|
|
$
|
1.05
|
|
||
|
Cash dividends declared per common share
|
$
|
0.44
|
|
$
|
0.82
|
|
||
See accompanying notes to condensed consolidated financial statements.
3
Nasdaq,
Inc.
Condensed Consolidated Statements of Comprehensive Income (Loss)
(Unaudited)
(in millions)
|
|
Three Months Ended March 31,
|
|||||||
|
|
2019
|
2018
|
||||||
|
Net income
|
$
|
247
|
|
$
|
177
|
|
||
|
Other comprehensive loss:
|
|
|
||||||
|
Foreign currency translation losses
|
(106
|
)
|
(76
|
)
|
||||
|
Income tax expense
(1)
|
(9
|
)
|
(115
|
)
|
||||
|
Foreign currency translation, net
|
(115
|
)
|
(191
|
)
|
||||
|
Employee benefit plan income tax expense
(1)
|
—
|
|
(7
|
)
|
||||
|
Total other comprehensive loss, net of tax
|
(115
|
)
|
(198
|
)
|
||||
|
Comprehensive income (loss) attributable to Nasdaq
|
$
|
132
|
|
$
|
(21
|
)
|
||
____________
|
(1)
|
Includes a reclassification of the stranded tax effects, for the three months ended March 31, 2018, related to the Tax Cuts and Jobs Act. See “Tax Cuts and Jobs Act,” of Note 17, “Income Taxes,” for further discussion.
|
See accompanying notes to condensed consolidated financial statements.
4
Nasdaq, Inc.
Condensed Consolidated Statements of Changes in Equity
(Unaudited)
(in millions, except share amounts)
|
Number of Common Shares Outstanding
|
Common Stock at Par Value
|
Additional Paid-in Capital
|
Common Stock In Treasury, at Cost
|
Accumulated Other Comprehensive Loss
|
Retained Earnings
|
Total Equity
|
||||||||||||||||||||
|
Balance at December 31, 2018
|
165,165,104
|
|
$
|
2
|
|
$
|
2,716
|
|
$
|
(297
|
)
|
$
|
(1,530
|
)
|
$
|
4,558
|
|
$
|
5,449
|
|
||||||
|
Net income
|
—
|
|
—
|
|
—
|
|
—
|
|
—
|
|
247
|
|
247
|
|
||||||||||||
|
Other comprehensive loss
|
—
|
|
—
|
|
—
|
|
—
|
|
(115
|
)
|
—
|
|
(115
|
)
|
||||||||||||
|
Cash dividends declared per common share
|
—
|
|
—
|
|
—
|
|
—
|
|
—
|
|
(73
|
)
|
(73
|
)
|
||||||||||||
|
Share-based compensation
|
874,404
|
|
—
|
|
16
|
|
—
|
|
—
|
|
—
|
|
16
|
|
||||||||||||
|
Stock option exercises, net
|
8,666
|
|
—
|
|
—
|
|
—
|
|
—
|
|
—
|
|
—
|
|
||||||||||||
|
Restricted stock and performance-based shares withheld for taxes
|
(346,691
|
)
|
—
|
|
—
|
|
(30
|
)
|
—
|
|
—
|
|
(30
|
)
|
||||||||||||
|
Balance at March 31, 2019
|
165,701,483
|
|
$
|
2
|
|
$
|
2,732
|
|
$
|
(327
|
)
|
$
|
(1,645
|
)
|
$
|
4,732
|
|
$
|
5,494
|
|
||||||
|
Number of Common Shares Outstanding
|
Common Stock at Par Value
|
Additional Paid-in Capital
|
Common Stock In Treasury, at Cost
|
Accumulated Other Comprehensive Loss
|
Retained Earnings
|
Total Equity
|
||||||||||||||||||||
|
Balance at December 31, 2017
|
167,441,030
|
|
$
|
2
|
|
$
|
3,024
|
|
$
|
(247
|
)
|
$
|
(862
|
)
|
$
|
3,963
|
|
$
|
5,880
|
|
||||||
|
Net income
|
—
|
|
—
|
|
—
|
|
—
|
|
—
|
|
177
|
|
177
|
|
||||||||||||
|
Other comprehensive loss
(1)
|
—
|
|
—
|
|
—
|
|
—
|
|
(198
|
)
|
142
|
|
(56
|
)
|
||||||||||||
|
Cash dividends declared per common share
|
—
|
|
—
|
|
—
|
|
—
|
|
—
|
|
(136
|
)
|
(136
|
)
|
||||||||||||
|
Share repurchase program
|
(1,258,946
|
)
|
—
|
|
(99
|
)
|
—
|
|
—
|
|
—
|
|
(99
|
)
|
||||||||||||
|
Share-based compensation
|
1,250,013
|
|
—
|
|
15
|
|
—
|
|
—
|
|
—
|
|
15
|
|
||||||||||||
|
Stock option exercises, net
|
34,195
|
|
—
|
|
1
|
|
—
|
|
—
|
|
—
|
|
1
|
|
||||||||||||
|
Restricted stock and performance-based shares withheld for taxes
|
(519,700
|
)
|
—
|
|
—
|
|
(42
|
)
|
—
|
|
—
|
|
(42
|
)
|
||||||||||||
|
Other employee stock activity
|
—
|
|
—
|
|
(15
|
)
|
—
|
|
—
|
|
—
|
|
(15
|
)
|
||||||||||||
|
Balance at March 31, 2018
|
166,946,592
|
|
$
|
2
|
|
$
|
2,926
|
|
$
|
(289
|
)
|
$
|
(1,060
|
)
|
$
|
4,146
|
|
$
|
5,725
|
|
||||||
____________
(1)
Includes a reclassification of the stranded tax effects, for the three months ended March 31, 2018, related to the Tax Cuts and Jobs Act. See “Tax Cuts and Jobs Act,” of Note 17, “Income Taxes,” for further discussion.
See accompanying notes to condensed consolidated financial statements.
5
Nasdaq, Inc.
Condensed Consolidated Statements of Cash Flows
(Unaudited)
(in millions)
|
Three Months Ended March 31,
|
|||||||
|
2019
|
2018
|
||||||
|
Cash flows from operating activities:
|
|||||||
|
Net income
|
$
|
247
|
|
$
|
177
|
|
|
|
Adjustments to reconcile net income to net cash provided by operating activities:
|
|||||||
|
Depreciation and amortization
|
48
|
|
53
|
|
|||
|
Share-based compensation
|
16
|
|
15
|
|
|||
|
Deferred income taxes
|
(16
|
)
|
(9
|
)
|
|||
|
Net gain on divestiture of business
|
(27
|
)
|
—
|
|
|||
|
Net income from unconsolidated investees
|
(45
|
)
|
(2
|
)
|
|||
|
Other reconciling items included in net income
|
—
|
|
3
|
|
|||
|
Net change in operating assets and liabilities, net of effects of divestiture and acquisitions:
|
|||||||
|
Receivables, net
|
(50
|
)
|
(127
|
)
|
|||
|
Other assets
|
(288
|
)
|
68
|
|
|||
|
Accounts payable and accrued expenses
|
34
|
|
65
|
|
|||
|
Section 31 fees payable to SEC
|
(40
|
)
|
—
|
|
|||
|
Accrued personnel costs
|
(79
|
)
|
(59
|
)
|
|||
|
Deferred revenue
|
186
|
|
208
|
|
|||
|
Other liabilities
|
351
|
|
(17
|
)
|
|||
|
Net cash provided by operating activities
|
337
|
|
375
|
|
|||
|
Cash flows from investing activities:
|
|||||||
|
Purchases of securities
|
(101
|
)
|
(73
|
)
|
|||
|
Proceeds from sales and redemptions of securities
|
138
|
|
81
|
|
|||
|
Proceeds from divestiture of business
|
108
|
|
—
|
|
|||
|
Acquisition of business, net of cash and cash equivalents acquired
|
(193
|
)
|
—
|
|
|||
|
Purchases of property and equipment
|
(20
|
)
|
(16
|
)
|
|||
|
Other investing activities
|
(6
|
)
|
—
|
|
|||
|
Net cash used in investing activities
|
(74
|
)
|
(8
|
)
|
|||
|
Cash flows from financing activities:
|
|||||||
|
Proceeds from (repayments of) commercial paper, net
|
265
|
|
(18
|
)
|
|||
|
Repayments of long-term debt
|
(515
|
)
|
(115
|
)
|
|||
|
Proceeds from long-term debt issuances
|
15
|
|
—
|
|
|||
|
Repurchases of common stock
|
—
|
|
(99
|
)
|
|||
|
Dividends paid
|
(73
|
)
|
(63
|
)
|
|||
|
Payments related to employee shares withheld for taxes
|
(30
|
)
|
(42
|
)
|
|||
|
Proceeds of customer funds
|
36
|
|
—
|
|
|||
|
Net cash used in financing activities
|
(302
|
)
|
(337
|
)
|
|||
|
Effect of exchange rate changes on cash and cash equivalents and restricted cash
|
(8
|
)
|
—
|
|
|||
|
Net increase (decrease) in cash and cash equivalents and restricted cash
|
(47
|
)
|
30
|
|
|||
|
Cash and cash equivalents and restricted cash at beginning of period
|
586
|
|
399
|
|
|||
|
Cash and cash equivalents and restricted cash at end of period
|
$
|
539
|
|
$
|
429
|
|
|
|
Supplemental Disclosure Cash Flow Information
|
|||||||
|
Cash paid for:
|
|||||||
|
Interest
|
$
|
23
|
|
$
|
33
|
|
|
|
Income taxes, net of refund
|
$
|
22
|
|
$
|
27
|
|
|
See accompanying notes to condensed consolidated financial statements.
6
Nasdaq, Inc.
Notes to Condensed Consolidated Financial Statements (Unaudited)
1. Organization and Nature of Operations
Nasdaq, Inc. is a leading provider of trading, clearing, marketplace technology, regulatory, securities listing, information and public and private company services. Our global offerings are diverse and include trading and clearing across multiple asset classes, trade management services, market data products, financial indexes, investment data and analytics, capital formation solutions, corporate solutions, and market technology products and services. Our technology powers markets across the globe, supporting equity derivative trading, clearing and settlement, cash equity trading, fixed income trading, trading surveillance and many other functions.
We manage, operate and provide our products and services in
four
business segments: Market Services, Corporate Services, Information Services and Market Technology.
Market Services
Our Market Services segment includes our Equity Derivative Trading and Clearing, Cash Equity Trading, FICC and Trade Management Services businesses. We operate multiple exchanges and other marketplace facilities across several asset classes, including derivatives, commodities, cash equity, debt, structured products and ETPs. In addition, in some countries where we operate exchanges, we also provide broker services, clearing, settlement and central depository services. Our transaction-based platforms provide market participants with the ability to access, process, display and integrate orders and quotes. The platforms allow the routing and execution of buy and sell orders as well as the reporting of transactions, providing fee-based revenues.
In the U.S., we operate
six
electronic options exchanges and
three
cash equity exchanges. The Nasdaq Stock Market, the largest of our cash equities exchanges, is the largest single venue of liquidity for trading U.S.-listed cash equities. We also operate an electronic platform for trading of U.S. Treasuries and NFX, a U.S. based designated contract market which lists cash-settled energy derivatives based on key energy benchmarks including oil, natural gas and U.S. power. In addition, we also operate a Canadian exchange for the trading of certain Canadian-listed securities.
In Europe, we operate exchanges in Stockholm (Sweden), Copenhagen (Denmark), Helsinki (Finland), and Reykjavik (Iceland), as well as the clearing operations of Nasdaq Clearing, as Nasdaq Nordic. We also operate exchanges in Tallinn (Estonia), Riga (Latvia) and Vilnius (Lithuania) as Nasdaq Baltic. Collectively, Nasdaq Nordic and Nasdaq Baltic offer trading in cash equities, depository receipts, warrants, convertibles, rights, fund units and ETFs, as well as trading and clearing of derivatives and clearing of resale and repurchase agreements.
Nasdaq Commodities is the brand name for Nasdaq’s European commodity-related products and services. Nasdaq Commodities’ offerings include derivatives in oil, power, natural gas and carbon emission markets, seafood, electricity certificates and clearing services. These products are listed on
two
of Nasdaq’s derivatives exchanges, Nasdaq Oslo ASA and NFX.
Through our Trade Management Services business, we provide market participants with a wide variety of alternatives for connecting to and accessing our markets via a number of different protocols used for quoting, order entry, trade reporting, and connectivity to various data feeds. We also provide data center services, including co-location to market participants, whereby we offer firms cabinet space and power to house their own servers and other equipment within our data centers. Our broker services operations offer technology and customized securities administration solutions to financial participants in the Nordic market.
In March 2019, we entered into an agreement to sell Nordic Fund Market, an electronic mutual fund service which is a smaller part of our Broker Services business.
Corporate Services
Our Corporate Services segment includes our Corporate Solutions and Listing Services businesses.
Our Corporate Solutions business serves corporate clients, including companies listed on our exchanges and private companies. We help organizations enhance their ability to understand and expand their global shareholder base, and improve corporate governance through our suite of advanced technology, analytics, and consultative services. In March 2019, we sold our BWise enterprise governance, risk and compliance software platform and in April 2018, we sold our Public Relations Solutions and Digital Media Services businesses. See Note 5, “Acquisitions and Divestitures,” for further discussion. As of March 2019, our Corporate Solutions business includes our Investor Relations Intelligence and Governance Solutions businesses.
As of December 31, 2018, BWise was classified as held for sale. See Note 6, “Assets and Liabilities Held for Sale,” for further discussion.
For segment reporting purposes, we have included the revenues and expenses of the Public Relations Solutions and Digital Media Services businesses in corporate items, which were part of the Corporate Solutions business, within our Corporate Services segment, prior to the date of sale. For discussion of business segments, see Note 19, “Business Segments.”
Our Listing Services business includes our U.S. and European Listing Services businesses. We operate a variety of listing platforms around the world to provide multiple global capital raising solutions for private and public companies. Our main listing markets are The Nasdaq Stock Market and the Nasdaq Nordic and Nasdaq Baltic exchanges. Through Nasdaq First North, our Nordic and Baltic operations also offer alternative marketplaces for smaller companies and growth companies. Our Listing Services business also includes NPM, which
7
provides liquidity solutions for private companies and private funds.
In December 2018, we launched a Corporate Bond exchange for the listing and trading of corporate bonds. The new exchange operates pursuant to The Nasdaq Stock Market exchange license and is powered by the Nasdaq Financial Framework.
As of
March 31, 2019
, there were
3,059
total listings on The Nasdaq Stock Market, including
388
ETPs. The combined market capitalization was approximately
$12.9 trillion
. In Europe, the Nasdaq Nordic and Nasdaq Baltic exchanges, together with Nasdaq First North, were home to
1,018
listed companies with a combined market capitalization of approximately
$1.4 trillion
.
Information Services
Our Information Services segment includes our Market Data, Index and Investment Data & Analytics businesses.
Our Market Data business sells and distributes historical and real-time quote and trade information to the sell-side, the buy-side, retail online brokers, proprietary trading shops, other venues, internet portals and data distributors. Our market data products enhance transparency of market activity within our exchanges and provide critical information to professional and non-professional investors globally.
Our Index business develops and licenses Nasdaq-branded indexes, associated derivatives, and financial products and also provides custom calculation services for third-party clients. As of
March 31, 2019
, we had
346
ETPs licensed to Nasdaq’s indexes which had
$196 billion
in assets under management.
Our Investment Data & Analytics business is a leading content and analytics cloud-based solutions provider used by asset managers, investment consultants and asset owners to help facilitate better investment decisions.
Market Technology
Our Market Technology segment is a leading global technology solutions provider and partner to exchanges, clearing organizations, central securities depositories, regulators, banks, brokers, buy-side firms and corporate businesses. Our Market Technology business is the sales channel for our complete global offering to other marketplaces.
Market Technology provides technology solutions for trading, clearing, settlement, surveillance and information dissemination to markets with wide-ranging requirements, from the leading markets in the U.S., Europe and Asia to emerging markets in the Middle East, Latin America, and Africa. Our marketplace solutions can handle a wide array of assets, including cash equities, equity derivatives, currencies, various interest-bearing securities, commodities and energy products, and are currently powering more than
100
marketplaces in
50
countries. Market Technology also provides market surveillance services to broker-dealer firms worldwide, as well as risk management solutions.
2. Summary of Significant Accounting Policies
Basis of Presentation and Principles of Consolidation
The condensed consolidated financial statements are prepared in accordance with U.S. GAAP and include the accounts of Nasdaq, its wholly-owned subsidiaries and other entities in which Nasdaq has a controlling financial interest. When we do not have a controlling interest in an entity but exercise significant influence over the entity’s operating and financial policies, such investment is accounted for under the equity method of accounting. We recognize our share of earnings or losses of an equity method investee based on our ownership percentage. See “Equity Method Investments,” of Note 8, “Investments,” for further discussion of our equity method investments.
The accompanying condensed consolidated financial statements reflect all adjustments which are, in the opinion of management, necessary for a fair statement of the results. These adjustments are of a normal recurring nature. All significant intercompany accounts and transactions have been eliminated in consolidation.
As permitted under U.S. GAAP, certain footnotes or other financial information can be condensed or omitted in the interim condensed consolidated financial statements. The information included in this Quarterly Report on Form 10-Q should be read in conjunction with the condensed consolidated financial statements and accompanying notes included in Nasdaq’s Annual Report on Form 10-K for the fiscal year ended December 31, 2018.
On January 1, 2019, we adopted ASU 2016-02, “Leases,” or ASU 2016-02. See Note 3, “Significant Accounting Policies Update,” for further discussion.
Certain prior year amounts have been reclassified to conform to the current year presentation.
The preparation of condensed consolidated financial statements in conformity with U.S. GAAP requires management to make estimates and assumptions that affect the reported amounts and the disclosure of contingent amounts in the condensed consolidated financial statements and accompanying notes. Actual results could differ from those estimates.
Subsequent Events
We have evaluated subsequent events through the issuance date of this Quarterly Report on Form 10-Q.
Recent Accounting Pronouncements
|
Accounting Standard
|
Description
|
Effective Date
|
Effect on the Financial Statements or Other Significant Matters
|
|
Goodwill
In January 2017, the FASB issued ASU 2017-04, “Simplifying the Test for Goodwill Impairment.”
|
This ASU simplifies how an entity is required to test goodwill for impairment and removes the second step of the goodwill impairment test, which required a hypothetical purchase price allocation if the fair value of a reporting unit is less than its carrying amount. Goodwill impairment will now be measured using the difference between the carrying amount and the fair value of the reporting unit and the loss recognized should not exceed the total amount of goodwill allocated to that reporting unit. The amendments in this ASU should be applied on a prospective basis.
|
January 1, 2020, with early adoption permitted for interim or annual goodwill impairment tests performed on testing dates after January 1, 2017.
|
We will adopt this standard on January 1, 2020. We do not anticipate a material impact on our consolidated financial statements at the time of adoption of this new standard as the carrying amounts of our reporting units have been less than their corresponding fair values in recent years. However, changes in future projections, market conditions and other factors may cause a change in the excess of fair value of our reporting units over their corresponding carrying amounts.
|
|
Financial Instruments - Credit Losses
In June 2016, the FASB issued ASU 2016-13, “Measurement of Credit Losses on Financial Instruments.”
|
This ASU changes the impairment model for certain financial instruments. The new model is a forward looking expected loss model and will apply to financial assets subject to credit losses and measured at amortized cost and certain off-balance sheet credit exposures. This includes loans, held-to-maturity debt securities, loan commitments, financial guarantees and net investments in leases, as well as trade receivables. For available-for-sale debt securities with unrealized losses, credit losses will be measured in a manner similar to today, except that the losses will be recognized as allowances rather than reductions in the amortized cost of the securities.
|
January 1, 2020, with early adoption permitted as of January 1, 2019.
|
We will adopt this standard on January 1, 2020 and will recognize a cumulative-effect adjustment to retained earnings as of the effective date to align our credit loss methodology with the new standard. We are currently assessing the impact that this standard will have on our consolidated financial statements.
|
8
3. Significant Accounting Policies Update
Our significant accounting policies are detailed in Note 2, “Summary of Significant Accounting Policies,” in our Annual Report on Form 10-K for the year ended December 31, 2018 that was filed with the SEC on February 22, 2019. A significant change to our accounting policies as a result of adopting
ASU 2016-02 is discussed below.
We adopted ASU 2016-02 on January 1, 2019, and elected the
optional transition method to initially apply the standard at the January 1, 2019 adoption date. As a result, we applied the new lease standard prospectively to our leases existing or commencing on or after January 1, 2019. Comparative periods presented were not restated upon adoption. Similarly, new disclosures under the standard were made for periods beginning January 1, 2019, and not for prior comparative periods. Prior periods will continue to be reported under guidance in effect prior to January 1, 2019. In addition, w
e elected the package of practical expedients permitted under the transition guidance within the standard, which among other things, allowed us to not reassess contracts to determine if they contain leases, lease classification and initial direct costs. The standard did not impact our statements of income and had no impact on our cash flows.
We have operating leases which are primarily real estate leases for our U.S. and European headquarters and for general office space. These leases have varying lease terms ranging from
3
months to
17
years. We determine if an arrangement is a lease at inception. Operating leases are included in operating lease assets, other current liabilities, and operating lease liabilities in our condensed consolidated balance sheets as of
March 31, 2019
. As of
March 31, 2019
, we do not have any finance leases.
Operating lease assets represent our right to use an underlying asset for the lease term and lease liabilities represent our obligation to make lease payments arising from the lease. Operating lease assets and liabilities are recognized at commencement date based on the present value of lease payments over the lease term. Since our leases do not provide an implicit rate, we use our incremental borrowing rate based on the information available at commencement date in determining the present value of lease payments. The operating lease asset also includes any lease payments made and excludes lease incentives. Our lease terms include options to extend or terminate the lease when we are reasonably certain that we will exercise that option. Lease expense for lease payments is recognized on a straight-line basis over the lease term. Certain of our lease agreements include rental payments adjusted periodically for inflation based on an index or rate. These payments are included in the initial measurement of the operating lease liability and operating lease asset. However, rental payments which are based on a change in an index or a rate are considered variable lease payments and are expensed as incurred.
We have lease agreements with lease and non-lease components, which are accounted for as a single performance obligation
to the extent that the timing and pattern of transfer are similar for the lease and non-lease components and the lease component qualifies as an operating lease
. We do not recognize lease liabilities and operating lease assets for leases with a term of 12 months or less. We recognize these lease payments on a straight-line basis over the lease term.
Our lease agreements do not contain any material residual value guarantees or material restrictions or covenants.
We sublease certain real estate to third parties. Our sublease portfolio consists of operating leases.
The following table provides supplemental balance sheet information related to Nasdaq's operating leases:
|
Leases
|
Balance Sheet Classification
|
March 31, 2019
|
||||
|
(in millions)
|
||||||
|
Assets:
|
||||||
|
Operating lease assets
|
Operating lease assets
|
$
|
378
|
|
||
|
Liabilities:
|
||||||
|
Current lease liabilities
|
Other current liabilities
|
$
|
61
|
|
||
|
Non-current lease liabilities
|
Operating lease liabilities
|
357
|
|
|||
|
Total lease liabilities
|
$
|
418
|
|
|||
The following table summarizes Nasdaq's lease cost:
|
Three Months Ended March 31, 2019
|
||||
|
(in millions)
|
||||
|
Operating lease cost
(1)
|
$
|
20
|
|
|
|
Variable lease cost
|
5
|
|
||
|
Sublease income
|
(1
|
)
|
||
|
Total lease cost
|
$
|
24
|
|
|
____________
|
(1)
|
Includes short-term lease cost, which was immaterial.
|
9
The following table reconciles the undiscounted cash flows for each of the first five years and total of the remaining years to the operating lease liabilities recorded in our condensed consolidated balance sheet.
|
March 31, 2019
|
||||
|
(in millions)
|
||||
|
2019
(1)
|
$
|
60
|
|
|
|
2020
|
76
|
|
||
|
2021
|
66
|
|
||
|
2022
|
44
|
|
||
|
2023
|
39
|
|
||
|
Thereafter
|
260
|
|
||
|
Total lease payments
|
545
|
|
||
|
Less: interest
(2)
|
(127
|
)
|
||
|
Present value of lease liabilities
(3)
|
$
|
418
|
|
|
____________
|
(1)
|
Represents the estimated lease payments to be made for the remaining nine months of 2019.
|
|
(2)
|
Calculated using the interest rate for each lease.
|
|
(3)
|
Includes the current portion of
$61 million
.
|
Total lease payments in the above table exclude
$128 million
of legally binding minimum lease payments for leases signed but not yet commenced related to expansion of our world headquarters. These leases will commence in 2020 with a lease term of
16
years.
The following table provides information related to Nasdaq's lease term and discount rate:
|
March 31, 2019
|
|||
|
Weighted-average remaining lease term (in years)
|
10.4
|
|
|
|
Weighted-average discount rate
|
4.6
|
%
|
|
The following table provides supplemental cash flow information related to Nasdaq's operating leases:
|
Three Months Ended March 31, 2019
|
||||
|
(in millions)
|
||||
|
Cash paid for amounts included in the measurement of operating lease liabilities
|
$
|
18
|
|
|
|
Lease assets obtained in exchange for new operating lease liabilities
|
$
|
16
|
|
|
10
4. Revenue From Contracts With Customers
Disaggregation of Revenue
The following tables summarize the disaggregation of revenue by major product and service and by segment for the three months ended
March 31, 2019
and
2018
:
|
Three Months Ended March 31, 2019
|
|||||||||||||||||||
|
|
Market Services
|
Corporate Services
|
Information Services
|
Market Technology
|
Consolidated
|
||||||||||||||
|
|
(in millions)
|
||||||||||||||||||
|
Transaction-based trading and clearing, net
|
$
|
160
|
|
$
|
—
|
|
$
|
—
|
|
$
|
—
|
|
$
|
160
|
|
||||
|
Trade management services
|
73
|
|
—
|
|
—
|
|
—
|
|
73
|
|
|||||||||
|
Corporate solutions
|
—
|
|
60
|
|
—
|
|
—
|
|
60
|
|
|||||||||
|
Listing services
|
—
|
|
71
|
|
—
|
|
—
|
|
71
|
|
|||||||||
|
Market data products
|
—
|
|
—
|
|
100
|
|
—
|
|
100
|
|
|||||||||
|
Index
|
—
|
|
—
|
|
54
|
|
—
|
|
54
|
|
|||||||||
|
Investment data & analytics
|
—
|
|
—
|
|
39
|
|
—
|
|
39
|
|
|||||||||
|
Market technology
|
—
|
|
—
|
|
—
|
|
77
|
|
77
|
|
|||||||||
|
Revenues less transaction-based expenses
|
$
|
233
|
|
$
|
131
|
|
$
|
193
|
|
$
|
77
|
|
$
|
634
|
|
||||
|
Three Months Ended March 31, 2018
|
|||||||||||||||||||||||
|
|
Market Services
|
Corporate Services
|
Information Services
|
Market Technology
|
Other Revenues
|
Consolidated
|
|||||||||||||||||
|
|
(in millions)
|
||||||||||||||||||||||
|
Transaction-based trading and clearing, net
|
$
|
175
|
|
$
|
—
|
|
$
|
—
|
|
$
|
—
|
|
$
|
—
|
|
$
|
175
|
|
|||||
|
Trade management services
|
75
|
|
—
|
|
—
|
|
—
|
|
—
|
|
75
|
|
|||||||||||
|
Corporate solutions
|
—
|
|
60
|
|
—
|
|
—
|
|
—
|
|
60
|
|
|||||||||||
|
Listing services
|
—
|
|
72
|
|
—
|
|
—
|
|
—
|
|
72
|
|
|||||||||||
|
Market data products
|
—
|
|
—
|
|
100
|
|
—
|
|
—
|
|
100
|
|
|||||||||||
|
Index
|
—
|
|
—
|
|
50
|
|
—
|
|
—
|
|
50
|
|
|||||||||||
|
Investment data & analytics
|
—
|
|
—
|
|
24
|
|
—
|
|
—
|
|
24
|
|
|||||||||||
|
Market technology
|
—
|
|
—
|
|
—
|
|
60
|
|
—
|
|
60
|
|
|||||||||||
|
Other revenues
|
—
|
|
—
|
|
—
|
|
—
|
|
50
|
|
50
|
|
|||||||||||
|
Revenues less transaction-based expenses
|
$
|
250
|
|
$
|
132
|
|
$
|
174
|
|
$
|
60
|
|
$
|
50
|
|
$
|
666
|
|
|||||
For the three months ended
March 31, 2019
, approximately
65.0%
of Market Services revenues were recognized at a point in time and
35.0%
were recognized over time. For the three months ended
March 31, 2018
, approximately
66.0%
of Market Services revenues were recognized at a point in time and
34.0%
were recognized over time. Substantially all revenues from the Corporate Services, Information Services and Market Technology segments were recognized over time for the three months ended
March 31, 2019
and 2018.
* * * * * *
Contract Balances
Substantially all of our revenues are considered to be revenues from contracts with customers. The related accounts receivable balances are recorded in our Condensed Consolidated Balance Sheets as receivables which are net of allowance for doubtful accounts of
$11 million
as of
March 31, 2019
and
$13 million
as of
December 31, 2018
. The changes in the balance between periods were immaterial. We do not have obligations for warranties, returns or refunds to customers.
For the majority of our contracts with customers, except for our market technology and listings services contracts, our
performance obligations are short-term in nature and there is no significant variable consideration.
We do not have revenues recognized from performance obligations that were satisfied in prior periods. We have elected not to provide disclosures about transaction price allocated to unsatisfied performance obligations if contract durations are less than one year. Excluding our market technology contracts, for contract durations that are one-year or greater, materially all of the transaction price allocated to unsatisfied performance obligations is included in deferred revenue. For our market technology contracts, the portion of transaction price allocated to unsatisfied performance obligations is shown in the table
11
below. Deferred revenue primarily represents our contract liabilities related to our fees for annual and initial listings, market technology, corporate solutions and information services contracts. Deferred revenue is the only significant contract asset or liability as of
March 31, 2019
. See Note 9,
“Deferred Revenue,” for our discussion on deferred revenue balances, activity, and expected timing of recognition.
* * * * * *
Transaction Price Allocated to Remaining Performance Obligations
As stated above, for contract durations that are one-year or greater, we do not have a material portion of transaction price allocated to unsatisfied performance obligations that are not included in deferred revenue other than for our market technology contracts.
For our market technology contracts, t
he following table summarizes the amount of the transaction price allocated to performance obligations that are unsatisfied as of
March 31, 2019
:
|
(in millions)
|
|||
|
2019
(1)
|
$
|
231
|
|
|
2020
|
257
|
|
|
|
2021
|
125
|
|
|
|
2022
|
82
|
|
|
|
2023
|
43
|
|
|
|
2024 and thereafter
|
82
|
|
|
|
Total
|
$
|
820
|
|
____________
|
(1)
|
Represents performance obligations to be recognized over the remaining nine months of 2019.
|
Market technology deferred revenue, as discussed in Note 9, “Deferred Revenue,” to the condensed consolidated financial statements, represents consideration received that is yet to be recognized as revenue for unsatisfied performance obligations.
5. Acquisitions and Divestitures
2019 Divestiture and Acquisition
We completed the following divestiture and acquisition in 2019. Financial results of each transaction are included in our condensed consolidated financial statements from the date of each divestiture or acquisition.
2019 Divestiture
In March 2019, we sold our BWise enterprise governance, risk and compliance software platform which was part of our Corporate Solutions business within our Corporate Services segment to SAI Global and recognized a pre-tax gain on the sale of
$27 million
, net of disposal costs (
$20 million
after tax). The pre-tax gain is included in net gain on divestiture of business in the Condensed Consolidated Statements of Income for the three months ended March 31, 2019.
As of December 31, 2018, the assets and liabilities of BWise were held for sale. See Note 6, “Assets and Liabilities Held For Sale,” for further discussion.
2019 Acquisition
|
Purchase Consideration
|
Total Net Assets Acquired
|
Total Net Deferred Tax Liability
|
Acquired
Intangible Assets |
Goodwill
|
|||||||||||||||
|
(in millions)
|
|||||||||||||||||||
|
Cinnober
|
$
|
219
|
|
$
|
22
|
|
$
|
(19
|
)
|
$
|
79
|
|
$
|
137
|
|
||||
In January 2019, we acquired Cinnober, a major Swedish financial technology provider to brokers, exchanges and clearinghouses worldwide for $219 million. Cinnober is part of our Market Technology segment.
Nasdaq used cash on hand to fund this acquisition.
The amounts in the table above represent the preliminary allocation of purchase price as of March 31, 2019 and are subject to revision during the remainder of the measurement period, a period not to exceed 12 months from the acquisition date.
Adjustments to the provisional values, which may include tax and other estimates, during the measurement period will be recorded in the reporting period in which the adjustment amounts are determined. Changes to amounts recorded as assets and liabilities may result in a corresponding adjustment to goodwill.
See “Intangible Assets” below for further discussion of intangible assets acquired in the Cinnober acquisition.
12
2018 Acquisition and Divestiture
We completed an acquisition during the year ended December 31, 2018 and a divestiture in April 2018. Financial results of each transaction are included in our condensed consolidated financial statements from the date of the acquisition or divestiture.
2018 Acquisition
Acquisition of Quandl
In November 2018, we acquired Quandl, Inc., a leading provider of alternative and core financial data. Quandl is part of our Information Services segment.
Nasdaq used issuances of commercial paper to fund this acquisition.
2018 Divestiture
In April 2018, we sold our Public Relations Solutions and Digital Media Services businesses which were part of our Corporate Solutions business to West Corporation. A pre-tax gain of
$41 million
, net of disposal costs (
$19 million
after tax) was included in the Condensed Consolidated Statements of Income in the second quarter of 2018. A post-closing working capital adjustment of
$8 million
(
$5 million
after tax) was included in the Condensed Consolidated Statements of Income in the third quarter of 2018 bringing the net gain on the sale to
$33 million
, (
$14 million
after tax) for the nine months ended September 30, 2018.
Through a multi-year partnership with West, Nasdaq will continue to provide eligible Nasdaq-listed clients with access to public relations, webcasting and webhosting products and services as part of the terms of the transaction.
As part of the terms of the transaction, we are providing transition services to West, such as technology, finance and facilities related services until mid-2019, and the compensation received for such transition services is being reflected as a reduction to the underlying expenses incurred by Nasdaq to provide such transition services.
Intangible Assets
The following table presents the details of the customer relationships intangible asset at the date of acquisition for Cinnober which was the significant acquired intangible asset for this acquisition. All acquired intangible assets with finite lives are amortized using the straight-line method.
|
March 31, 2019
|
|||
|
($ in millions)
|
|||
|
Customer relationships
|
$
|
67
|
|
|
Discount rate used
|
9.5
|
%
|
|
|
Estimated average useful life
|
13 years
|
|
|
Customer Relationships
Customer relationships represent the non-contractual and contractual relationships with customers.
Methodology
Customer relationships were valued using the income approach, specifically an excess earnings method. The excess earnings method examines the economic returns contributed by the identified tangible and intangible assets of a company, and then isolates the excess return that is attributable to the intangible asset being valued.
Discount Rate
The discount rates used reflect the amount of risk associated with the hypothetical cash flows for the customer relationships relative to the overall business. In developing a discount rate for the customer relationships, we estimated a weighted-average cost of capital for the overall business and we employed this rate when discounting the cash flows. The resulting discounted cash flows were then tax-effected at the applicable statutory rate.
For our acquisition of Cinnober, a discounted tax amortization benefit was added to the fair value of the assets under the assumption that the customer relationships would be amortized for tax purposes over a period of
5 years
.
Estimated Useful Life
We estimate the useful life based on the historical behavior of the customers and a parallel analysis of the customers using the excess earnings method.
6. Assets and Liabilities Held For Sale
In December 31, 2018, we decided to sell BWise, our enterprise governance, risk and compliance software platform and this business was recorded as held for sale. BWise was part of our Corporate Solutions business within our Corporate Services segment.
We determined that we met all of the criteria to classify the assets and liabilities of BWise as held for sale. The disposal of BWise did not represent a strategic shift that would have a major effect on our operations and financial results and was, therefore, not classified as discontinued operations. As a result of this classification, the assets and liabilities of this business were recorded at the lower of their carrying amount or fair value less costs to sell.
In February 2019, we entered into an agreement to sell BWise and in March 2019, we completed the sale and recognized a pre-tax gain on the sale of
$27 million
, net of disposal costs (
$20 million
after tax). See “2019 Divestiture,” of Note 5, “Acquisitions and Divestitures,” for further discussion.
Based on the sales price in the agreement, no impairment charge was recorded at the time of the sale as the carrying amount of the net assets was less than the sales price in the agreement less costs to sell.
13
Major Classes of Assets and Liabilities Held For Sale
The carrying amounts of the major classes of assets and liabilities that were classified as held for sale at December 31, 2018 were as follows:
|
December 31, 2018
|
|||
|
(in millions)
|
|||
|
Receivables, net
|
$
|
13
|
|
|
Property and equipment, net
|
10
|
|
|
|
Goodwill
(1)
|
47
|
|
|
|
Intangible assets, net
(2)
|
16
|
|
|
|
Other assets
|
3
|
|
|
|
Total assets held for sale
(3)
|
$
|
89
|
|
|
Deferred tax liabilities
|
$
|
4
|
|
|
Deferred revenue
|
12
|
|
|
|
Other current liabilities
|
4
|
|
|
|
Total liabilities held for sale
(4)
|
$
|
20
|
|
|
(1)
|
The assignment of goodwill was based on the relative fair value of the disposal group and the portion of the remaining reporting unit.
|
(2)
Primarily represents customer relationships.
(3)
Included in other current assets in the Condensed Consolidated Balance Sheets as of December 31, 2018.
(4)
Included in other current liabilities in the Condensed Consolidated Balance Sheets as of December 31, 2018.
* * * * * *
7. Goodwill and
Acquired
Intangible Assets
Goodwill
The following table presents the changes in goodwill by business segment during the three months ended
March 31, 2019
:
|
Market
Services
|
Corporate Services
|
Information Services
|
Market Technology
|
Total
|
|||||||||||||||
|
(in millions)
|
|||||||||||||||||||
|
Balance at December 31, 2018
|
$
|
3,430
|
|
$
|
455
|
|
$
|
2,333
|
|
$
|
145
|
|
$
|
6,363
|
|
||||
|
Goodwill acquired
|
—
|
|
—
|
|
—
|
|
137
|
|
137
|
|
|||||||||
|
Foreign currency translation adjustment
|
(62
|
)
|
(4
|
)
|
(44
|
)
|
(10
|
)
|
(120
|
)
|
|||||||||
|
Balance at March 31, 2019
|
$
|
3,368
|
|
$
|
451
|
|
$
|
2,289
|
|
$
|
272
|
|
$
|
6,380
|
|
||||
The goodwill acquired for Market Technology shown above relates to our acquisition of Cinnober. See “2019 Acquisition,” of Note 5, “Acquisitions and Divestitures,” for further discussion.
Goodwill represents the excess of purchase price over the value assigned to the net assets, including identifiable intangible assets, of a business acquired. Goodwill is allocated to our reporting units based on the assignment of the fair values of each reporting unit of the acquired company. We test goodwill for impairment at the reporting unit level annually, or in interim
periods if certain events occur indicating that the carrying amount may be impaired, such as changes in the business climate, poor indicators of operating performance or the sale or disposition of a significant portion of a reporting unit. There was
no
impairment of goodwill for the three months ended
March 31, 2019
and
2018
; however, events such as extended economic weakness or unexpected significant declines in operating results of a reporting unit may result in goodwill impairment charges in the future.
14
Acquired
Intangible Assets
The following table presents details of our total acquired intangible assets, both finite- and indefinite-lived:
|
March 31, 2019
|
December 31, 2018
|
||||||||||||||||||||||||||
|
Gross Amount
|
Accumulated Amortization
|
Net Amount
|
Weighted-Average Useful Life (in Years)
|
Gross Amount
|
Accumulated Amortization
|
Net Amount
|
Weighted-Average Useful Life (in Years)
|
||||||||||||||||||||
|
(in millions)
|
(in millions)
|
||||||||||||||||||||||||||
|
Finite-Lived Intangible Assets
|
|
|
|
|
|
|
|
|
|||||||||||||||||||
|
Technology
|
$
|
65
|
|
$
|
(16
|
)
|
$
|
49
|
|
9
|
$
|
54
|
|
$
|
(15
|
)
|
$
|
39
|
|
9
|
|||||||
|
Customer relationships
|
1,599
|
|
(460
|
)
|
1,139
|
|
18
|
1,532
|
|
(456
|
)
|
1,076
|
|
18
|
|||||||||||||
|
Other
|
18
|
|
(3
|
)
|
15
|
|
8
|
17
|
|
(2
|
)
|
15
|
|
8
|
|||||||||||||
|
Foreign currency translation adjustment
|
(160
|
)
|
51
|
|
(109
|
)
|
(149
|
)
|
64
|
|
(85
|
)
|
|||||||||||||||
|
Total finite-lived intangible assets
|
$
|
1,522
|
|
$
|
(428
|
)
|
$
|
1,094
|
|
$
|
1,454
|
|
$
|
(409
|
)
|
$
|
1,045
|
|
|||||||||
|
Indefinite-Lived Intangible Assets
|
|
|
|
|
|
|
|||||||||||||||||||||
|
Exchange and clearing registrations
|
$
|
1,257
|
|
$
|
—
|
|
$
|
1,257
|
|
$
|
1,257
|
|
$
|
—
|
|
$
|
1,257
|
|
|||||||||
|
Trade names
|
122
|
|
—
|
|
122
|
|
122
|
|
—
|
|
122
|
|
|||||||||||||||
|
Licenses
|
52
|
|
—
|
|
52
|
|
52
|
|
—
|
|
52
|
|
|||||||||||||||
|
Foreign currency translation adjustment
|
(196
|
)
|
—
|
|
(196
|
)
|
(176
|
)
|
—
|
|
(176
|
)
|
|||||||||||||||
|
Total indefinite-lived intangible assets
|
$
|
1,235
|
|
$
|
—
|
|
$
|
1,235
|
|
$
|
1,255
|
|
$
|
—
|
|
$
|
1,255
|
|
|||||||||
|
Total intangible assets
|
$
|
2,757
|
|
$
|
(428
|
)
|
$
|
2,329
|
|
$
|
2,709
|
|
$
|
(409
|
)
|
$
|
2,300
|
|
|||||||||
Amortization expense for acquired finite-lived intangible assets was
$26 million
for the three months ended
March 31, 2019
and
$28 million
for the three months ended
March 31, 2018
. Amortization expense decreased in
2019
primarily due to certain assets becoming fully amortized in the fourth quarter of 2018, partially offset by additional amortization expense associated with acquired intangible assets in 2019. These amounts are included in depreciation and amortization expense in the Condensed Consolidated Statements of Income.
The estimated future amortization expense (excluding the impact of foreign currency translation adjustments of
$109 million
as of
March 31, 2019
) of acquired finite-lived intangible assets as of
March 31, 2019
is as follows:
|
(in millions)
|
|||
|
2019
(1)
|
$
|
80
|
|
|
2020
|
104
|
|
|
|
2021
|
103
|
|
|
|
2022
|
100
|
|
|
|
2023
|
98
|
|
|
|
2024 and thereafter
|
718
|
|
|
|
Total
|
$
|
1,203
|
|
|
(1)
|
Represents the estimated amortization to be recognized for the remaining nine months of 2019.
|
8. Investments
The following table presents the details of our investments:
|
March 31,
2019 |
December 31,
2018 |
||||||
|
(in millions)
|
|||||||
|
Trading securities
|
$
|
220
|
|
$
|
259
|
|
|
|
Available-for-sale investment securities
|
—
|
|
9
|
|
|||
|
Financial investments, at fair value
|
$
|
220
|
|
$
|
268
|
|
|
|
Equity method investments
|
$
|
136
|
|
$
|
135
|
|
|
|
Equity securities
|
$
|
61
|
|
$
|
44
|
|
|
Financial Investments, at Fair Value
Trading Securities
Trading securities, which are included in financial investments, at fair value in the Condensed Consolidated Balance Sheets, are primarily comprised of highly rated European government debt securities, of which
$194 million
as of
March 31, 2019
and
$166 million
as of
December 31, 2018
, are assets primarily
15
utilized to meet regulatory capital requirements, mainly for our clearing operations at Nasdaq Clearing.
Available-for-Sale Investment Securities
As of December 31, 2018, available-for-sale investment securities, which are included in financial investments, at fair value in the Condensed Consolidated Balance Sheets, were primarily comprised of commercial paper. As of March 31, 2019 and December 31, 2018, the cumulative unrealized gains and losses on these securities were immaterial.
Equity Method Investments
As of
March 31, 2019
and
December 31, 2018
, our equity method investments primarily included our equity interest in OCC.
The carrying amounts of our equity method investments are included in other non-current assets in the Condensed Consolidated Balance Sheets.
Net income recognized from our equity interest in the earnings and losses of these equity method investments was
$45 million
for the three months ended
March 31, 2019
and
$2 million
for the three months ended
March 31, 2018
.
The change for the three months ended March 31, 2019 compared with the same period in 2018 is due to an increase in income recognized from our investment in OCC. Following the disapproval of the OCC capital plan in February 2019, described below, OCC suspended customer rebates and dividends to owners, including the unpaid dividend on 2018 results which Nasdaq expected to receive in March 2019. In 2018, we recorded
$16 million
of income relating to our share of OCC’s net income. We were not able to determine the impact of the disapproval of the OCC capital plan on OCC's 2018 net income until March 2019, when OCC's 2018 financial statements were made available to us. As a result, in March 2019, we recognized an additional
$36 million
of income relating to our share of OCC's net income for the year ended December 31, 2018. In March 2019, we also recognized our share of OCC's first quarter 2019 net income of
$9 million
.
OCC
Capital Plan
In March 2015, OCC implemented a capital plan under which the options exchanges that are OCC’s stockholders contributed
$150 million
of new equity capital to OCC, committed to make future replenishment capital contributions under certain circumstances, and received commitments regarding future dividend payments and related matters. Nasdaq PHLX and ISE each contributed
$30 million
of new equity capital under the OCC capital plan. OCC adopted specific policies with respect to fees, customer refunds and stockholder dividends, which envisioned an annual dividend equal to the portion of OCC’s after-tax income that exceeded OCC’s capital requirements after payment of refunds to OCC’s clearing members (such refunds were generally
50%
of the portion of OCC’s pre-tax income that exceeded OCC’s capital requirements). In 2018, 2017 and 2016, OCC disbursed annual dividends under the capital plan and Nasdaq, as the beneficial owner of shares held by Nasdaq PHLX and ISE, received
$13 million
in 2018,
$10 million
in 2017 and
$4 million
in 2016. The dividend recorded by Nasdaq in 2016 did not include the dividend due to ISE because our acquisition of ISE was completed in June 2016, after that year’s dividend had been paid.
In February 2016, after the SEC approved the rule change establishing the OCC capital plan, certain industry participants appealed that approval in the U.S. Court of Appeals. In February 2019, on remand from the Court of Appeals, the SEC disapproved the OCC rule change that established the capital plan. OCC began a phased return of capital contributed under the capital plan, and we received
$44 million
in February 2019, with the remainder to be repaid at a later date. As a result of the SEC's disapproval of the rule change, we are also released from any future capital replenishment obligations under the 2015 capital plan.
Equity Securities
The carrying amounts of our equity securities are included in other non-current assets in the Condensed Consolidated Balance Sheets. We elected the measurement alternative for primarily all of our equity securities as they do not have a readily determinable fair value. Under the measurement alternative, these securities are measured at cost, less any impairment, plus or minus changes resulting from observable price changes in orderly transactions for the identical or a similar investment of the same issuer. For the three months ended March 31, 2019, no impairment charges were recorded on our equity securities and there were no upward or downward adjustments recorded. As of
March 31, 2019
and December 31, 2018, our equity securities primarily represent various strategic investments made through our corporate venture program.
9. Deferred Revenue
Deferred revenue represents consideration received that is yet to be recognized as revenue. The changes in our deferred revenue during the three months ended
March 31, 2019
are reflected in the following table:
|
|
Initial Listing Revenues
|
Annual Listings Revenues
|
Market Technology Revenues
|
Corporate Solutions
Revenues
|
Information Services Revenues
|
Other
(1)
|
Total
|
||||||||||||||||||||
|
|
(in millions)
|
||||||||||||||||||||||||||
|
Balance at December 31, 2018
|
$
|
66
|
|
$
|
4
|
|
$
|
75
|
|
$
|
36
|
|
$
|
80
|
|
$
|
20
|
|
$
|
281
|
|
||||||
|
Additions
|
8
|
|
229
|
|
55
|
|
42
|
|
56
|
|
9
|
|
399
|
|
|||||||||||||
|
Revenue recognized
|
(8
|
)
|
(56
|
)
|
(49
|
)
|
(38
|
)
|
(40
|
)
|
(7
|
)
|
(198
|
)
|
|||||||||||||
|
Translation adjustment
|
(1
|
)
|
—
|
|
(3
|
)
|
—
|
|
—
|
|
—
|
|
(4
|
)
|
|||||||||||||
|
Balance at March 31, 2019
|
$
|
65
|
|
$
|
177
|
|
$
|
78
|
|
$
|
40
|
|
$
|
96
|
|
$
|
22
|
|
$
|
478
|
|
||||||
____________
|
(1)
|
Primarily includes deferred revenue from U.S. listing of additional shares fees which will continue to run-off as a result of the implementation of our all-inclusive annual fee. Listing of additional shares fees are included in our Listing Services business. The additions primarily pertain to our Market Services business.
|
As of
March 31, 2019
, we estimate that our deferred revenue will be recognized in the following years:
|
|
Initial Listing Revenues
|
Annual Listings Revenues
|
Market Technology Revenues
|
Corporate Solutions Revenues
|
Information Services Revenues
|
Other
(1)
|
Total
|
||||||||||||||||||||
|
|
(in millions)
|
||||||||||||||||||||||||||
|
Fiscal year ended:
|
|
|
|
||||||||||||||||||||||||
|
2019
(2)
|
$
|
19
|
|
$
|
177
|
|
$
|
49
|
|
$
|
37
|
|
$
|
87
|
|
$
|
12
|
|
$
|
381
|
|
||||||
|
2020
|
20
|
|
—
|
|
22
|
|
3
|
|
9
|
|
7
|
|
61
|
|
|||||||||||||
|
2021
|
11
|
|
—
|
|
7
|
|
—
|
|
—
|
|
3
|
|
21
|
|
|||||||||||||
|
2022
|
8
|
|
—
|
|
—
|
|
—
|
|
—
|
|
—
|
|
8
|
|
|||||||||||||
|
2023
|
5
|
|
—
|
|
—
|
|
—
|
|
—
|
|
—
|
|
5
|
|
|||||||||||||
|
2024 and thereafter
|
2
|
|
—
|
|
—
|
|
—
|
|
—
|
|
—
|
|
2
|
|
|||||||||||||
|
Total
|
$
|
65
|
|
$
|
177
|
|
$
|
78
|
|
$
|
40
|
|
$
|
96
|
|
$
|
22
|
|
$
|
478
|
|
||||||
____________
|
(1)
|
Other primarily includes revenues from listing of additional shares fees which are included in our Listing Services business.
|
|
(2)
|
Represents the estimated amortization to be recognized for the remaining nine months of 2019.
|
The timing of recognition of our deferred market technology revenues is primarily dependent upon the completion of customization and any significant modifications made pursuant to existing market technology contracts. As such, as it relates to market technology revenues, the timing represents our best estimate.
16
10. Debt Obligations
The following table presents the changes in the carrying amount of our debt obligations during the three months ended
March 31, 2019
:
|
December 31, 2018
|
Additions
|
Payments, Accretion
and Other
|
March 31, 2019
|
||||||||||||
|
Short-term debt:
|
(in millions)
|
||||||||||||||
|
Commercial paper
|
$
|
275
|
|
$
|
692
|
|
$
|
(427
|
)
|
$
|
540
|
|
|||
|
Senior unsecured floating rate notes repaid on March 22, 2019
|
500
|
|
—
|
|
(500
|
)
|
—
|
|
|||||||
|
5.55% senior unsecured notes due January 15, 2020
(1)
|
599
|
|
—
|
|
—
|
|
599
|
|
|||||||
|
$400 million senior unsecured term loan facility due November 25, 2019 (average interest rate of 4.00% for the period January 1, 2019 through March 31, 2019)
|
100
|
|
—
|
|
—
|
|
100
|
|
|||||||
|
Total short-term debt
|
1,474
|
|
692
|
|
(927
|
)
|
1,239
|
|
|||||||
|
Long-term debt:
|
|||||||||||||||
|
3.875% senior unsecured notes due June 7, 2021
|
686
|
|
—
|
|
(15
|
)
|
671
|
|
|||||||
|
4.25% senior unsecured notes due June 1, 2024
|
497
|
|
—
|
|
—
|
|
497
|
|
|||||||
|
1.75% senior unsecured notes due May 19, 2023
|
682
|
|
—
|
|
(15
|
)
|
667
|
|
|||||||
|
3.85% senior unsecured notes due June 30, 2026
|
496
|
|
—
|
|
—
|
|
496
|
|
|||||||
|
$1 billion revolving credit commitment due April 25, 2022 (average interest rate of 5.60% for the period January 1, 2019 through March 31, 2019)
|
(4
|
)
|
15
|
|
(14
|
)
|
(3
|
)
|
|||||||
|
Total long-term debt
|
2,357
|
|
15
|
|
(44
|
)
|
2,328
|
|
|||||||
|
Total debt obligations
|
$
|
3,831
|
|
$
|
707
|
|
$
|
(971
|
)
|
$
|
3,567
|
|
|||
____________
|
(1)
|
Balance was reclassified to short-term debt as of March 31, 2019.
|
Commercial Paper Program
Our U.S. dollar commercial paper program is supported by our 2017 Credit Facility which provides liquidity support for the repayment of commercial paper issued through the commercial paper program. See “2017 Credit Facility” below for further discussion of our 2017 Credit Facility. The effective interest rate of commercial paper issuances fluctuates as short term interest rates and demand fluctuate. The fluctuation of these rates due to market conditions may impact our interest expense.
As of
March 31, 2019
, commercial paper notes in the table above reflect the aggregate principal amount, less the unamortized discount which is being accreted through interest expense over the life of the applicable notes. The original maturities of these notes range from
3 days
to
19 days
and the weighted-average maturity is
2 days
. The weighted-average effective interest rate is
2.78%
per annum.
Senior Unsecured Notes
Our senior unsecured notes were all issued at a discount. As a result of the discount, the proceeds received from each issuance were less than the aggregate principal amount. As of
March 31, 2019
, the amounts in the table above reflect the aggregate principal amount, less the unamortized debt discount and the unamortized debt issuance costs which are being accreted through interest expense over the life of the applicable notes. Our senior unsecured notes are general unsecured obligations of ours and rank equally with all of our existing and future
unsubordinated obligations and they are not guaranteed by any of our subsidiaries. The senior unsecured notes were issued under indentures that, among other things, limit our ability to consolidate, merge or sell all or substantially all of our assets, create liens, and enter into sale and leaseback transactions.
With the exception of the 2020 Notes, upon a change of control triggering event (as defined in the various note indentures), the terms require us to repurchase all or part of each holder’s notes for cash equal to
101%
of the aggregate principal amount purchased plus accrued and unpaid interest, if any.
Senior Unsecured Floating Rate Notes
In March 2019, we used net proceeds from the sale of commercial paper and cash on hand to redeem all of our 2019 Notes.
Nasdaq issued the 2019 Notes in September 2017. The 2019 Notes paid interest quarterly in arrears at a rate equal to the three-month U.S. dollar LIBOR as determined at the beginning of each quarterly period plus
0.39%
per annum until March 22, 2019.
5.55%
Senior Unsecured Notes Due 2020
In April 2019, we sent a redemption notice to the trustee to redeem all
$600 million
aggregate principal amount outstanding of our 2020 Notes, at a cash redemption price to be calculated as provided in the indenture governing the 2020 Notes, plus accrued and unpaid interest, if any, to the
17
redemption date of May 1, 2019. Upon completion of the redemption, no 2020 Notes will remain outstanding.
Payment of the redemption price will be made on or after the redemption date only upon presentation and surrender of the 2020 Notes to the trustee. Interest on the 2020 Notes called for redemption will cease to accrue from and after the redemption date.
Nasdaq issued the 2020 Notes in January 2010. The 2020 Notes paid interest semiannually at a rate of
5.55%
% per annum.
Nasdaq will primarily use the net proceeds from the sale of the 2029 Notes to redeem the 2020 Notes. For further discussion of the 2029 Notes, see “
1.75%
Senior Unsecured Notes Due 2029” below.
3.875%
Senior Unsecured Notes Due 2021
In June 2013, Nasdaq issued the 2021 Notes. The 2021 Notes pay interest annually at a rate of
3.875%
per annum until
June 7, 2021
and such rate may vary with Nasdaq’s debt rating up to a rate not to exceed
5.875%
.
The 2021 Notes have been designated as a hedge of our net investment in certain foreign subsidiaries to mitigate the foreign exchange risk associated with certain investments in these subsidiaries. The
decrease
in the carrying amount of
$15 million
noted in the “Payments, Accretion and Other” column in the table above primarily reflects the translation of the 2021 Notes into U.S. dollars and is recorded in accumulated other comprehensive loss within stockholders’ equity in the Condensed Consolidated Balance Sheets as of
March 31, 2019
.
4.25%
Senior Unsecured Notes Due 2024
In May 2014, Nasdaq issued the 2024 Notes. The 2024 Notes pay interest semiannually at a rate of
4.25%
per annum until
June 1, 2024
and such rate may vary with Nasdaq’s debt rating up to a rate not to exceed
6.25%
.
1.75%
Senior Unsecured Notes Due 2023
In May 2016, Nasdaq issued the 2023 Notes. The 2023 Notes pay interest annually at a rate of
1.75%
per annum until May 19, 2023 and such rate may vary with Nasdaq’s debt rating up to a rate not to exceed
3.75%
.
The 2023 Notes have been designated as a hedge of our net investment in certain foreign subsidiaries to mitigate the foreign exchange rate risk associated with certain investments in these subsidiaries. The decrease in the carrying amount of
$15 million
noted in the “Payments, Accretion and Other” column in the table above reflects the translation of the 2023 Notes into U.S. dollars and is recorded in accumulated other comprehensive loss within stockholders’ equity in the Condensed Consolidated Balance Sheets as of
March 31, 2019
.
3.85%
Senior Unsecured Notes Due 2026
In June 2016, Nasdaq issued the 2026 Notes. The 2026 Notes pay interest semiannually at a rate of
3.85%
per annum until June 30, 2026 and such rate may vary with Nasdaq’s debt rating up to a rate not to exceed
5.85%
.
1.75%
Senior Unsecured Notes Due 2029
In April 2019, Nasdaq issued
€600 million
aggregate principal amount of
1.75%
senior notes due 2029, or the 2029 Notes, at a discount. As a result of the discount, the proceeds received from the issuance were less than the aggregate principal amount.
The 2029 Notes are unsecured, pay interest annually in arrears, beginning on March 28, 2020 and may be redeemed by Nasdaq at any time, subject to a make-whole amount. The proceeds from the 2029 Notes, approximately
$669 million
after deducting the underwriting discount and expenses of this offering, will primarily be used to redeem the 2020 Notes. For further discussion of the 2020 Notes, see “
5.55%
Senior Unsecured Notes Due 2020” above.
The 2029 Notes have been designated as a hedge of our net investment in certain foreign subsidiaries to mitigate the foreign exchange risk associated with certain investments in these subsidiaries.
Credit Facilities
As of
March 31, 2019
, the amounts in the table above reflect the aggregate principal amount, less the unamortized debt issuance costs which are being accreted through interest expense over the life of the applicable credit facility. Nasdaq is permitted to repay borrowings under our credit facilities at any time in whole or in part, without penalty.
Our credit facilities contain financial and operating covenants. Financial covenants include a minimum interest expense coverage ratio and a maximum leverage ratio. Operating covenants include, among other things, limitations on Nasdaq’s ability to incur additional indebtedness, grant liens on assets, dispose of assets and pay dividends. Our credit facilities allow us to pay cash dividends on our common stock. The facilities also contain customary affirmative covenants, including access to financial statements, notice of defaults and certain other material events, maintenance of properties and insurance, and events of default, including cross-defaults to our material indebtedness.
2017 Credit Facility
In April 2017, Nasdaq entered into the 2017 Credit Facility. The 2017 Credit Facility consists of a
$1 billion
five
-year revolving credit facility (with sublimits for non-dollar borrowings, swingline borrowings and letters of credit), which replaced a former credit facility. Nasdaq intends to use funds available under the 2017 Credit Facility for general corporate purposes and to provide liquidity support for the repayment of commercial paper issued through the commercial paper program.
18
As of
March 31, 2019
,
no
amounts were outstanding on the 2017 Credit Facility. The
$3 million
balance represents unamortized debt issuance costs. Of the
$1 billion
that is available for borrowing,
$541 million
provides liquidity support for the commercial paper program and for a letter of credit. As such, as of
March 31, 2019
, the total remaining amount available under the 2017 Credit Facility was
$459 million
. See “Commercial Paper Program” above for further discussion of our commercial paper program.
Under our 2017 Credit Facility, borrowings under the revolving credit facility and swingline borrowings bear interest on the principal amount outstanding at a variable interest rate based on either the LIBOR or the base rate (as defined in the credit agreement) (or other applicable rate with respect to non-dollar borrowings), plus an applicable margin that varies with Nasdaq’s debt rating. We are charged commitment fees of
0.125%
to
0.4%
, depending on our credit rating, whether or not amounts have been borrowed. These commitment fees are included in interest expense and were not material for the three months ended
March 31, 2019
and 2018.
The 2017 Credit Facility includes an option for Nasdaq to increase the available aggregate amount by up to
$500 million
, subject to the consent of the lenders funding the increase and certain other conditions.
2016 Credit Facility
In March 2016, Nasdaq entered into the 2016 Credit Facility. Under our 2016 Credit Facility, borrowings bear interest on the principal amount outstanding at a variable interest rate based on either the LIBOR or the base rate (or other applicable rate with respect to non-dollar borrowings), plus an applicable margin that varies with Nasdaq’s debt rating.
As of
March 31, 2019
, the amount outstanding of
$100 million
is due upon maturity at November 25, 2019, which we expect to repay with cash on hand and proceeds from issuances of commercial paper or borrowings from our revolving credit commitment under our 2017 Credit Facility.
Other Credit Facilities
We also have credit facilities related to our Nasdaq Clearing operations in order to provide further liquidity. Credit facilities, which are available in multiple currencies, totaled
$210 million
as of
March 31, 2019
and
$220 million
as of
December 31, 2018
in available liquidity, none of which was utilized.
Debt Covenants
As of
March 31, 2019
, we were in compliance with the covenants of all of our debt obligations.
11. Retirement
Plans
Defined Contribution Savings Plan
We sponsor a 401(k) Plan for U.S. employees. Employees are immediately eligible to make contributions to the plan and are also eligible for an employer contribution match at an amount equal to
100.0%
of the first
6.0%
of eligible employee contributions. Savings plan expense included in compensation and benefits expense in the Condensed Consolidated Statements of Income was
$3 million
for the three months ended
March 31, 2019
and
$4 million
for three months ended
March 31, 2018
.
Pension and Supplemental Executive Retirement Plans
We maintain non-contributory, defined-benefit pension plans, non-qualified SERPs for certain senior executives and other post-retirement benefit plans for eligible employees in the U.S., collectively referred to as the Nasdaq Benefit Plans. Our pension plans and SERPs are frozen. Future service and salary for all participants do not count toward an accrual of benefits under the pension plans and SERPs. Most employees outside the U.S. are covered by local retirement plans or by applicable social laws. Benefits under social laws are generally expensed in the periods in which the costs are incurred. The total expense for these plans is included in compensation and benefits expense in the Condensed Consolidated Statements of Income and was
$5 million
the three months ended
March 31, 2019
and
$6 million
for three months ended
March 31, 2018
.
12. Share-Based Compensation
We have a share-based compensation program for employees and non-employee directors. Share-based awards granted under this program include stock options, restricted stock (consisting of restricted stock units), and PSUs. For accounting purposes, we consider PSUs to be a form of restricted stock.
Summary of Share-Based Compensation Expense
The following table shows the total share-based compensation expense resulting from equity awards and the
15.0%
discount for the ESPP for the three months ended
March 31, 2019
and
2018
in the Condensed Consolidated Statements of Income:
|
|
Three Months Ended March 31,
|
|||||||
|
|
2019
|
2018
|
||||||
|
|
(in millions)
|
|||||||
|
Share-based compensation expense before income taxes
|
$
|
16
|
|
$
|
15
|
|
||
|
Income tax benefit
|
(4
|
)
|
(4
|
)
|
||||
|
Share-based compensation expense after income taxes
|
$
|
12
|
|
$
|
11
|
|
||
Common Shares Available Under Our Equity Plan
As of
March 31, 2019
, we had approximately
11.3 million
shares of common stock authorized for future issuance under our Equity Plan.
Restricted Stock
We grant restricted stock to most active employees. The grant date fair value of restricted stock awards is based on the closing stock price at the date of grant less the present value of future cash dividends. Restricted stock awards granted generally vest
25.0%
on the second anniversary of the grant date,
25.0%
on the third anniversary of the grant date, and
50.0%
on the fourth anniversary of the grant date.
19
Summary of Restricted Stock Activity
The following table summarizes our restricted stock activity for the three months ended
March 31, 2019
:
|
Restricted Stock
|
||||||
|
|
Number of Awards
|
Weighted-Average Grant Date Fair Value
|
||||
|
Unvested balances at January 1, 2019
|
1,583,375
|
|
$
|
68.62
|
|
|
|
Granted
|
250
|
|
$
|
77.54
|
|
|
|
Vested
|
(435,765
|
)
|
$
|
57.07
|
|
|
|
Forfeited
|
(65,798
|
)
|
$
|
70.35
|
|
|
|
Unvested balances at March 31, 2019
|
1,082,062
|
|
$
|
73.12
|
|
|
The awards granted in the above table do not include the all-employee grant which occurred on April 1, 2019.
As of
March 31, 2019
,
$45 million
of total unrecognized compensation cost related to restricted stock is expected to be recognized over a weighted-average period of
1.7 years
.
PSUs
PSUs are based on performance measures that impact the amount of shares that each recipient will receive upon vesting. We have
two
performance-based long-term PSU programs for certain officers, a
one
-year performance-based program and a
three
-year cumulative performance-based program that focuses on TSR.
One
-Year PSU Program
The grant date fair value of PSUs under the
one
-year performance-based program is based on the closing stock price at the date of grant less the present value of future cash dividends. Under this program, an eligible employee receives a target grant of PSUs, but may receive from
0.0%
to
150.0%
of the target amount granted, depending on the achievement of performance measures. These awards vest ratably on an annual basis over a
three
-year period commencing with the end of the
one
-year performance period. Compensation cost is recognized over the performance period and the
three
-year vesting period based on the probability that such performance measures will be achieved, taking into account an estimated forfeiture rate.
During 2018, certain grants of PSUs with a
one
-year performance period exceeded the applicable performance parameters. As a result, an additional
51,914
units above target were considered granted in the first quarter of 2019 and are included in the below table.
Three
-Year PSU Program
Under the
three
-year performance-based program, each eligible individual receives PSUs, subject to market conditions, with a
three
-year cumulative performance period that vest at the end of the performance period. Compensation cost is recognized over the
three
-year vesting period, taking into account an estimated forfeiture rate, regardless of whether the market condition is satisfied, provided that the requisite service period
has been completed. Performance will be determined by comparing Nasdaq’s TSR to
two
peer groups, each weighted
50.0%
. The first peer group consists of exchange companies, and the second peer group consists of all companies in the S&P 500. Nasdaq’s relative performance ranking against each of these groups will determine the final number of shares delivered to each individual under the program. The payout under this program will be between
0.0%
and
200.0%
of the number of PSUs granted and will be determined by Nasdaq’s overall performance against both peer groups. However, if Nasdaq’s TSR is negative for the
three
-year performance period, regardless of TSR ranking, the payout will not exceed
100.0%
of the number of PSUs granted. We estimate the fair value of PSUs granted under the
three
-year PSU program using the Monte Carlo simulation model, as these awards contain a market condition.
Certain grants of PSUs that were issued in 2016 with a
three
-year performance period exceeded the applicable performance parameters. As a result, an additional
99,622
units above target were considered granted in the first quarter of 2019 and are included in the below table.
The following weighted-average assumptions were used to determine the weighted-average fair values of the PSU awards granted under the
three
-year PSU program for the three months ended March 31, 2018:
|
Three Months Ended March 31, 2018
|
||||
|
Weighted-average risk free interest rate
(1)
|
2.36
|
%
|
||
|
Expected volatility
(2)
|
18.7
|
%
|
||
|
Weighted-average grant date share price
|
$
|
86.22
|
|
|
|
Weighted-average fair value at grant date
|
$
|
116.79
|
|
|
____________
|
(1)
|
The risk-free interest rate for periods within the expected life of the award is based on the U.S. Treasury yield curve in effect at the time of grant.
|
|
(2)
|
We use historic volatility for PSU awards issued under the
three
-year PSU program, as implied volatility data could not be obtained for all the companies in the peer groups used for relative performance measurement within the program.
|
In addition, the annual dividend assumption utilized in the Monte Carlo simulation model is based on Nasdaq’s dividend yield at the date of grant.
20
Summary of PSU Activity
The following table summarizes our PSU activity for the three months ended
March 31, 2019
:
|
PSUs
|
|||||||||||||
|
One-Year Program
|
Three-Year Program
|
||||||||||||
|
|
Number of Awards
|
|
Weighted-Average Grant Date Fair Value
|
Number of Awards
|
Weighted-Average Grant Date Fair Value
|
||||||||
|
Unvested balances at January 1, 2019
|
314,231
|
|
$
|
74.01
|
|
837,750
|
|
$
|
96.57
|
|
|||
|
Granted
(1)
|
51,914
|
|
$
|
82.08
|
|
99,622
|
|
$
|
93.25
|
|
|||
|
Vested
|
(6,888
|
)
|
$
|
64.93
|
|
(431,751
|
)
|
$
|
93.25
|
|
|||
|
Forfeited
|
(13,984
|
)
|
$
|
74.54
|
|
(6,101
|
)
|
$
|
103.29
|
|
|||
|
Unvested balances at March 31, 2019
|
345,273
|
|
$
|
75.38
|
|
499,520
|
|
$
|
98.70
|
|
|||
____________
|
(1)
|
Only includes certain additional awards granted based on overachievement of performance parameters as the all-employee grant occurred on April 1, 2019.
|
As of
March 31, 2019
,
$11 million
of total unrecognized compensation cost related to the
one
-year PSU program is expected to be recognized over a weighted-average period of
1.5 years
. For the
three
-year PSU program,
$23 million
of total unrecognized compensation cost is expected to be recognized over a weighted-average period of
1.3 years
.
Stock Options
In January 2017, our CEO received
268,817
performance-based non-qualified stock options which will vest annually over a
three
-year period, with each vesting contingent upon the achievement of annual performance parameters. On January 29, 2019, Nasdaq's management compensation committee and board of directors determined that the performance goal for 2018 was met, resulting in the settlement of the second one-third of the grant. There were
no
stock option awards granted during the three months ended
March 31, 2019
.
The weighted-average grant date fair value for the 2017 grant was
$66.68
. We estimated the fair value of this stock option award using the Black-Scholes valuation model using the following assumptions:
|
Expected life (in years)
|
6
|
|
|
Weighted-average risk free interest rate
|
2.1
|
%
|
|
Expected volatility
|
25.6
|
%
|
|
Dividend yield
|
1.92
|
%
|
Our computation of expected life was based on an estimate of the average length of time between option grant and exercise. The interest rate for periods within the expected life of the award was based on the U.S. Treasury yield curve in effect at the time of grant. Our computation of expected volatility was an estimate
of the future upward/downward fluctuations in the underlying share price. We used Nasdaq's historical volatility for the trailing
6
-year period as of the grant date. Our computation of dividend yield was based on annualized dividends expressed as a percentage of share price.
Summary of Stock Option Activity
A summary of stock option activity for the three months ended
March 31, 2019
is as follows:
|
|
Number of Stock Options
|
Weighted-Average Exercise Price
|
Weighted-Average Remaining Contractual Term (in years)
|
Aggregate Intrinsic Value (in millions)
|
||||||||
|
Outstanding at January 1, 2019
|
448,966
|
|
$
|
49.11
|
|
5.51
|
$
|
15
|
|
|||
|
Exercised
|
(8,666
|
)
|
23.81
|
|
||||||||
|
Outstanding at March 31, 2019
|
440,300
|
|
$
|
49.61
|
|
5.33
|
$
|
17
|
|
|||
|
Exercisable at March 31, 2019
|
350,694
|
|
$
|
45.25
|
|
4.71
|
$
|
15
|
|
|||
The net cash proceeds from the exercise of
8,666
stock options for the three months ended
March 31, 2019
was immaterial. We received net cash proceeds of
$1 million
from the exercise of
34,195
stock options for the three months ended
March 31, 2018
.
The aggregate intrinsic value in the above table represents the total pre-tax intrinsic value (i.e., the difference between our closing stock price on March 29, 2019 of
$87.49
and the exercise price, times the number of shares) based on stock options with an exercise price less than Nasdaq’s closing price of
$87.49
as of March 29, 2019, which would have been received by the option holders had the option holders exercised their stock options on that date. This amount can change based on the fair market value of our common stock. The total number of in-the-money stock options exercisable as of
March 31, 2019
was
0.4 million
and the weighted-average exercise price was
$45.25
. As of
March 31, 2018
,
0.4 million
outstanding stock options were exercisable and the weighted-average exercise price was
$34.28
.
The total pre-tax intrinsic value of stock options exercised was
$1 million
for the three months ended
March 31, 2019
and
$2 million
for the three months ended
March 31, 2018
.
ESPP
We have an ESPP under which approximately
1.9 million
shares of our common stock have been reserved for future issuance as of
March 31, 2019
. Under our ESPP, employees may purchase shares having a value not exceeding
10.0%
of their annual compensation, subject to applicable annual Internal Revenue Service limitations. We record compensation expense related to the
15.0%
discount that is given to our employees which
21
totaled
$1 million
for both the three months ended
March 31, 2019
and 2018.
13.
Nasdaq
Stockholders’ Equity
Common Stock
As of
March 31, 2019
,
300,000,000
shares of our common stock were authorized,
171,592,982
shares were issued and
165,701,483
shares were outstanding. The holders of common stock are entitled to
one
vote per share, except that our certificate of incorporation limits the ability of any person to vote in excess of
5.0%
of the then-outstanding shares of Nasdaq common stock.
Common Stock in Treasury, at Cost
We account for the purchase of treasury stock under the cost method with the shares of stock repurchased reflected as a reduction to Nasdaq stockholders’ equity and included in common stock in treasury, at cost in the Condensed Consolidated Balance Sheets. Shares repurchased under our share repurchase program are currently retired and canceled. When treasury shares are reissued, they are recorded at the average cost of the treasury shares acquired. We held
5,891,499
shares of common stock in treasury as of
March 31, 2019
and
5,544,321
shares as of December 31, 2018, most of which are related to shares of our common stock repurchased for the settlement of employee tax withholding obligations arising from the vesting of restricted stock and PSUs.
Share Repurchase Program
In January 2018, our board of directors authorized an additional
$500 million
for the share repurchase program bringing the total capacity to
$726 million
.
These purchases may be made from time to time at prevailing market prices in open market purchases, privately-negotiated transactions, block purchase techniques or otherwise, as
determined by our management. The purchases are primarily funded from existing cash balances. The share repurchase program may be suspended, modified or discontinued at any time. The share repurchase program has no defined expiration date.
There was no share repurchase activity during the three months ended March 31, 2019. The following is a summary of our share repurchase activity, reported based on settlement date, for the three months ended March 31, 2018:
|
Three Months Ended March 31, 2018
|
||||
|
Number of shares of common stock repurchased
|
1,258,946
|
|
||
|
Average price paid per share
|
$
|
78.75
|
|
|
|
Total purchase price (in millions)
|
$
|
99
|
|
|
As discussed above in “Common Stock in Treasury, at Cost,” shares repurchased under our share repurchase program are currently retired and cancelled. As of
March 31, 2019
, the remaining amount authorized for share repurchases under the program was
$332 million
.
Other Repurchases of Common Stock
During the first three months of
2019
, we repurchased
346,691
shares of our common stock in settlement of employee tax withholding obligations arising from the vesting of restricted stock and PSUs.
Preferred Stock
Our certificate of incorporation authorizes the issuance of
30,000,000
shares of preferred stock, par value
$0.01
per share, issuable from time to time in one or more series. As of
March 31, 2019
and December 31, 2018,
no
shares of preferred stock were issued or outstanding.
* * * * * *
Cash Dividends on Common Stock
During the first three months of 2019, our board of directors declared the following cash dividends:
|
Declaration Date
|
Dividend Per
Common Share
|
Record Date
|
Total Amount Paid
|
Payment Date
|
||||||||
|
|
|
|
(in millions)
|
|
||||||||
|
January 29, 2019
|
$
|
0.44
|
|
March 15, 2019
|
$
|
73
|
|
March 29, 2019
|
||||
The total amount paid of
$73 million
was recorded in retained earnings in the Condensed Consolidated Balance Sheets at
March 31, 2019
.
In April 2019, the board of directors approved a regular quarterly cash dividend of
$0.47
per share on our outstanding common stock, which reflects a
7.0%
increase from our prior quarterly cash dividend of
$0.44
. The dividend is payable on June 28, 2019 to shareholders of record at the close of business on June 14, 2019. The estimated amount of this dividend is
$78 million
. Future declarations of quarterly dividends and the establishment of future record and payment dates are subject to approval by the board of directors.
Our board of directors maintains a dividend policy with the intention to provide stockholders with regular and growing dividends over the long term as earnings and cash flow grow.
22
14. Earnings Per Share
The following table sets forth the computation of basic and diluted earnings per share:
|
|
Three Months Ended March 31,
|
|||||||
|
|
2019
|
2018
|
||||||
|
Numerator:
|
(in millions, except share and per share amounts)
|
|||||||
|
Net income attributable to common shareholders
|
$
|
247
|
|
$
|
177
|
|
||
|
Denominator:
|
|
|
||||||
|
Weighted-average common shares outstanding for basic earnings per share
|
165,343,968
|
|
166,921,542
|
|
||||
|
Weighted-average effect of dilutive securities:
|
|
|
||||||
|
Employee equity awards
(1)
|
1,682,787
|
|
2,070,997
|
|
||||
|
Weighted-average common shares outstanding for diluted earnings per share
|
167,026,755
|
|
168,992,539
|
|
||||
|
Basic and diluted earnings per share:
|
|
|
||||||
|
Basic earnings per share
|
$
|
1.49
|
|
$
|
1.06
|
|
||
|
Diluted earnings per share
|
$
|
1.48
|
|
$
|
1.05
|
|
||
____________
|
(1)
|
PSUs, which are considered contingently issuable, are included in the computation of dilutive earnings per share on a weighted average basis when management determines the related performance criteria are met.
|
Securities that were not included in the computation of diluted earnings per share because their effect was antidilutive were immaterial for the three months ended
March 31, 2019
and 2018.
15. Fair Value of Financial Instruments
The following tables present our financial assets and financial liabilities that are measured at fair value on a recurring basis as of
March 31, 2019
and
December 31, 2018
.
|
|
March 31, 2019
|
||||||||||||||
|
|
Total
|
Level 1
|
Level 2
|
Level 3
|
|||||||||||
|
Assets at Fair Value
|
(in millions)
|
||||||||||||||
|
Financial investments, at fair value
|
$
|
220
|
|
$
|
162
|
|
$
|
58
|
|
$
|
—
|
|
|||
|
Default fund and margin deposit investments
|
1,604
|
|
180
|
|
1,424
|
|
—
|
|
|||||||
|
Total Assets at Fair Value
|
$
|
1,824
|
|
$
|
342
|
|
$
|
1,482
|
|
$
|
—
|
|
|||
|
Liabilities at Fair Value
|
|||||||||||||||
|
Other financial instruments
|
$
|
99
|
|
$
|
—
|
|
$
|
99
|
|
$
|
—
|
|
|||
|
Total Liabilities at Fair Value
|
$
|
99
|
|
$
|
—
|
|
$
|
99
|
|
$
|
—
|
|
|||
|
|
December 31, 2018
|
||||||||||||||
|
|
Total
|
Level 1
|
Level 2
|
Level 3
|
|||||||||||
|
Assets at Fair Value
|
(in millions)
|
||||||||||||||
|
Financial investments, at fair value
|
$
|
268
|
|
$
|
133
|
|
$
|
135
|
|
$
|
—
|
|
|||
|
Default fund and margin deposit investments
|
1,649
|
|
327
|
|
1,322
|
|
—
|
|
|||||||
|
Total Assets at Fair Value
|
$
|
1,917
|
|
$
|
460
|
|
$
|
1,457
|
|
$
|
—
|
|
|||
|
Liabilities at Fair Value
|
|||||||||||||||
|
Other financial instruments
|
$
|
112
|
|
$
|
—
|
|
$
|
112
|
|
$
|
—
|
|
|||
|
Total Liabilities at Fair Value
|
$
|
112
|
|
$
|
—
|
|
$
|
112
|
|
$
|
—
|
|
|||
As of
March 31, 2019
and
December 31, 2018
, Level 1 financial investments, at fair value were primarily comprised of trading securities, mainly highly rated European government debt securities. As of
March 31, 2019
and
December 31, 2018
, Level 2 financial investments, at fair value were primarily comprised of trading securities, mainly corporate bonds and European mortgage bonds. Of the Level 1 and Level 2 financial investments, at fair value,
$194 million
as of
March 31, 2019
and
$166 million
as of
December 31, 2018
are assets primarily utilized to meet regulatory capital requirements, mainly for our clearing operations at Nasdaq Clearing.
Our Level 1 default fund and margin deposit investments were primarily comprised of highly rated European and U.S. government debt securities. Level 2 default fund and margin deposit investments were primarily comprised of central bank certificates and reverse repurchase agreements, as of
March 31, 2019
and December 31, 2018.
23
Our Level 2 other financial instruments include a liability associated with Nasdaq Clearing's requirement to fulfill the settlement of certain contracts of a defaulted member. The fair value of this guarantee was
$99 million
as of
March 31, 2019
and
$112 million
as of
December 31, 2018
and is included in other current liabilities in the Condensed Consolidated Balance Sheets. Collateral of
$99 million
as of
March 31, 2019
and
$112 million
as of
December 31, 2018
was recorded in other current assets which offsets this liability. See Note 16, “Clearing Operations,” for further discussion of default fund contributions and margin deposits.
Financial Instruments Not Measured at Fair Value on a Recurring Basis
Some of our financial instruments are not measured at fair value on a recurring basis but are recorded at amounts that approximate fair value due to their liquid or short-term nature. Such financial assets and financial liabilities include: cash and cash equivalents, restricted cash, receivables, net, certain other current assets, accounts payable and accrued expenses, Section 31 fees payable to SEC, accrued personnel costs, commercial paper and certain other current liabilities.
Our investment in OCC is accounted for under the equity method of accounting. We have elected the measurement alternative for the majority of our equity securities, which primarily represent various strategic investments made through our corporate venture program. See “Equity Method Investments,” and “Equity Securities,” of Note 8, “Investments,” for further discussion.
We also consider our debt obligations to be financial instruments. The fair value of our debt obligations, utilizing discounted cash flow analyses for our floating rate debt and prevailing market rates for our fixed rate debt, was
$3.7 billion
as of
March 31, 2019
and
$3.9 billion
as of
December 31, 2018
. The discounted cash flow analyses are based on borrowing rates currently available to us for debt with similar terms and maturities. The fair value of our commercial paper approximates the carrying value since the rates of interest on this short-term debt approximate market rates as of
March 31, 2019
. Our commercial paper and our fixed rate and floating rate debt are categorized as Level 2 in the fair value hierarchy.
For further discussion of our debt obligations, see Note 10, “Debt Obligations.”
Non-Financial Assets Measured at Fair Value on a Non-Recurring Basis
Our non-financial assets, which include goodwill, intangible assets, and other long-lived assets, are not required to be carried at fair value on a recurring basis. Fair value measures of non-financial assets are primarily used in the impairment analysis of these assets. Any resulting asset impairment would require that the non-financial asset be recorded at its fair value. Nasdaq uses Level 3 inputs to measure the fair value of the above assets on a non-recurring basis. As of
March 31, 2019
and
December 31, 2018
, there were
no
non-financial assets measured at fair value on a non-recurring basis.
16. Clearing Operations
Nasdaq
Clearing
Nasdaq Clearing is authorized and supervised under EMIR as a multi-asset clearinghouse by the SFSA. Such authorization is effective for all member states of the European Union and certain other non-member states that are part of the European Economic Area, including Norway. The clearinghouse acts as the CCP for exchange and OTC trades in equity derivatives, fixed income derivatives, resale and repurchase contracts, power derivatives, emission allowance derivatives, fuel oil derivatives, and seafood derivatives.
Through our clearing operations in the financial markets, which include the resale and repurchase market, the commodities markets, and the seafood market, Nasdaq Clearing is the legal counterparty for, and guarantees the fulfillment of, each contract cleared. These contracts are not used by Nasdaq Clearing for the purpose of trading on its own behalf. As the legal counterparty of each transaction, Nasdaq Clearing bears the counterparty risk between the purchaser and seller in the contract. In its guarantor role, Nasdaq Clearing has precisely equal and offsetting claims to and from clearing members on opposite sides of each contract, standing as the CCP on every contract cleared. In accordance with the rules and regulations of Nasdaq Clearing, default fund and margin collateral requirements are calculated for each clearing member’s positions in accounts with the CCP. See “Default Fund Contributions and Margin Deposits” below for further discussion of Nasdaq Clearing’s default fund and margin requirements.
Nasdaq Clearing maintains
four
member sponsored default funds: one related to financial markets, one related to commodities markets, one related to the seafood market, and a mutualized fund. Under this structure, Nasdaq Clearing and its clearing members must contribute to the total regulatory capital related to the clearing operations of Nasdaq Clearing. This structure applies an initial separation of default fund contributions for the financial, commodities and seafood markets in order to create a buffer for each market’s counterparty risks. Simultaneously, a mutualized default fund provides capital efficiencies to Nasdaq Clearing’s members with regard to total regulatory capital required. See “Default Fund Contributions” below for further discussion of Nasdaq Clearing’s default fund. Power of assessment and a liability waterfall also have been implemented. See “Power of Assessment” and “Liability Waterfall” below for further discussion. These requirements align risk between Nasdaq Clearing and its clearing members.
Nasdaq Commodities Clearing Default
In September 2018, a member of the Nasdaq Clearing commodities market defaulted due to inability to post sufficient collateral to cover increased margin requirements for the positions of the relevant member, which had experienced losses due to sharp adverse movements in the Nordic - German power market spread. Nasdaq Clearing followed default procedures and offset the future market risk on the defaulting member’s
24
positions. The default resulted in a loss of
$133 million
. In accordance with the liability waterfall, the first
$8 million
of the loss was allocated to Nasdaq Clearing’s junior capital and the remainder was allocated on a pro-rata basis to the commodities clearing members’ default funds. In September 2018, these funds were replenished
.
In December 2018, we initiated a capital relief program. The capital relief program was a voluntary program open to each commodities default fund participant; each such participant who agreed to the capital relief program received a proportion of the funds made available under the capital relief program as reflected by their proportionate share of the aggregate of the clearing members' default fund replenishments. As of March 31, 2019, we have disbursed substantially all of the
$23 million
offered through the program.
As a result of the default, a liability of
$99 million
as of
March 31, 2019
and
$112 million
as of
December 31, 2018
was recorded in other current liabilities. Collateral of
$99 million
as of
March 31, 2019
and
$112 million
as of
December 31, 2018
was recorded in other current assets in the Condensed Consolidated Balance Sheets in order to allow Nasdaq Clearing to fulfill the settlement of certain contracts of the defaulted member arising from the default management process. We have established mitigating positions. The collateral and liability were previously included in default funds and margin deposits.
Default Fund Contributions and Margin Deposits
As of
March 31, 2019
, clearing member default fund contributions and margin deposits were as follows:
|
|
March 31, 2019
|
||||||||||
|
|
Cash Contributions
|
Non-Cash Contributions
|
Total Contributions
|
||||||||
|
|
(in millions)
|
||||||||||
|
Default fund contributions
|
$
|
475
|
|
$
|
78
|
|
$
|
553
|
|
||
|
Margin deposits
|
2,799
|
|
3,541
|
|
6,340
|
|
|||||
|
Total
|
$
|
3,274
|
|
$
|
3,619
|
|
$
|
6,893
|
|
||
In accordance with its investment policy, of the total cash contributions of
$3,274 million
, Nasdaq Clearing has invested
$1,249 million
in highly rated European and U.S. government debt securities or central bank certificates with maturity dates primarily
90
days or less and
$355 million
in reverse repurchase agreements secured with highly rated government securities with maturity dates that range from
1 day
to
11 days
. The carrying value of these securities approximates their fair value due to the short-term nature of the instruments and reverse repurchase agreements. The remainder of this balance was held in cash in demand deposit accounts at central banks and large, highly rated financial institutions. Of the total default fund contributions of
$553 million
, Nasdaq Clearing can utilize
$464 million
as capital resources in the event of a counterparty default. The remaining balance of
$89 million
pertains to member posted surplus balances.
In the investment activity related to default fund and margin contributions, we are exposed to counterparty risk related to reverse repurchase agreement transactions, which reflect the risk that the counterparty might become insolvent and, thus, fail to meet its obligations to Nasdaq Clearing. We mitigate this risk by only engaging in transactions with high credit quality reverse repurchase agreement counterparties and by limiting the acceptable collateral under the reverse repurchase agreement to high quality issuers, primarily government securities and other securities explicitly guaranteed by a government. The value of the underlying security is monitored during the lifetime of the contract and in the event the market value of the underlying security falls below the reverse repurchase amount our clearinghouse may require additional collateral or a reset of the contract.
Default Fund Contributions
Required contributions to the default funds are proportional to the exposures of each clearing member. When a clearing member is active in more than one market, contributions must be made to all markets’ default funds in which the member is active. Clearing members’ eligible contributions may include cash and non-cash contributions. Cash contributions received are held in cash or invested by Nasdaq Clearing, in accordance with its investment policy, either in highly rated government debt securities, time deposits, central bank certificates or reverse repurchase agreements with highly rated government debt securities as collateral. Nasdaq Clearing maintains and manages all cash deposits related to margin collateral. All risks and rewards of collateral ownership, including interest, belong to Nasdaq Clearing. Clearing members’ cash contributions are included in default funds and margin deposits in the Condensed Consolidated Balance Sheets as both a current asset and a current liability. Non-cash contributions include highly rated government debt securities that must meet specific criteria approved by Nasdaq Clearing. Non-cash contributions are pledged assets that are not recorded in the Consolidated Balance Sheets as Nasdaq Clearing does not take legal ownership of these assets and the risks and rewards remain with the clearing members. These balances may fluctuate over time due to changes in the amount of deposits required and whether members choose to provide cash or non-cash contributions. Assets pledged are held at a nominee account in Nasdaq Clearing’s name for the benefit of the clearing members and are immediately accessible by Nasdaq Clearing in the event of a default. In addition to clearing members’ required contributions to the liability waterfall, Nasdaq Clearing is also required to contribute capital to the liability waterfall and overall regulatory capital as specified under its clearinghouse rules. As of
March 31, 2019
, Nasdaq Clearing committed capital totaling
$151 million
to the liability waterfall and overall regulatory capital, in the form of government debt securities, which are recorded as financial investments, at fair value in the Condensed Consolidated Balance Sheets. The combined regulatory capital of the clearing members and Nasdaq Clearing is intended to secure the obligations of a clearing member exceeding such member’s own margin and default fund deposits
25
and may be used to cover losses sustained by a clearing member in the event of a default.
Margin Deposits
Nasdaq Clearing requires all clearing members to provide collateral, which may consist of cash and non-cash contributions, to guarantee performance on the clearing members’ open positions, or initial margin. In addition, clearing members must also provide collateral to cover the daily margin call if needed. See “Default Fund Contributions” above for further discussion of cash and non-cash contributions.
Similar to default fund contributions, Nasdaq Clearing maintains and manages all cash deposits related to margin collateral. All risks and rewards of collateral ownership, including interest, belong to Nasdaq Clearing and are recorded in revenues. These cash deposits are recorded in default funds and margin deposits in the Condensed Consolidated Balance Sheets as both a current asset and a current liability. Pledged margin collateral is not recorded in our Condensed Consolidated Balance Sheets as all risks and rewards of collateral ownership, including interest, belong to the counterparty. Assets pledged are held at a nominee account in Nasdaq Clearing’s name for the benefit of the clearing members and are immediately accessible by Nasdaq Clearing in the event of a default.
Nasdaq Clearing marks to market all outstanding contracts and requires payment from clearing members whose positions have lost value. The mark-to-market process helps identify any clearing members that may not be able to satisfy their financial obligations in a timely manner allowing Nasdaq Clearing the ability to mitigate the risk of a clearing member defaulting due to exceptionally large losses. In the event of a default, Nasdaq Clearing can access the defaulting member’s margin and default fund deposits to cover the defaulting member’s losses.
Regulatory Capital and Risk Management Calculations
Nasdaq Clearing manages risk through a comprehensive counterparty risk management framework, which is comprised of policies, procedures, standards and financial resources. The level of regulatory capital is determined in accordance with Nasdaq Clearing’s regulatory capital policy, as approved by the SFSA. Regulatory capital calculations are continuously updated through a proprietary capital-at-risk calculation model that establishes the appropriate level of capital.
As mentioned above, Nasdaq Clearing is the legal counterparty for each contract cleared and thereby guarantees the fulfillment of each contract. Nasdaq Clearing accounts for this guarantee as a performance guarantee. We determine the fair value of the performance guarantee by considering daily settlement of contracts and other margining and default fund requirements, the risk management program, historical evidence of default payments, and the estimated probability of potential default payouts. The calculation is determined using proprietary risk management software that simulates gains and losses based on historical market prices, extreme but plausible market scenarios, volatility and other factors present at that point in time for those particular unsettled contracts. Based on this
analysis, excluding any liability related to the Nasdaq commodities clearing default (see discussion above), the estimated liability was nominal and
no
liability was recorded as of
March 31, 2019
.
Power of Assessment
To further strengthen the contingent financial resources of the clearinghouse, Nasdaq Clearing has power of assessment that provides the ability to collect additional funds from its clearing members to cover a defaulting member’s remaining obligations up to the limits established under the terms of the clearinghouse rules. The power of assessment corresponds to
100.0%
of the clearing member’s aggregate contribution to the financial, commodities and seafood markets’ default funds.
Liability Waterfall
The liability waterfall is the priority order in which the capital resources would be utilized in the event of a default where the defaulting clearing member’s collateral would not be sufficient to cover the cost to settle its portfolio. If a default occurs and the defaulting clearing member’s collateral, including cash deposits and pledged assets, is depleted, then capital is utilized in the following amount and order:
|
•
|
junior capital contributed by Nasdaq Clearing, which totaled
$33 million
as of
March 31, 2019
;
|
|
•
|
a loss sharing pool related only to the financial market that is contributed to by clearing members and only applies if the defaulting member’s portfolio includes interest rate swap products;
|
|
•
|
specific market default fund where the loss occurred (i.e., the financial, commodities, or seafood market), which includes capital contributions of the clearing members on a pro-rata basis;
|
|
•
|
senior capital contributed to each specific market by Nasdaq Clearing, calculated in accordance with clearinghouse rules, which totaled
$22 million
as of
March 31, 2019
; and
|
|
•
|
mutualized default fund, which includes capital contributions of the clearing members on a pro-rata basis.
|
If additional funds are needed after utilization of the liability waterfall, then Nasdaq Clearing will utilize its power of assessment and additional capital contributions will be required by non-defaulting members up to the limits established under the terms of the clearinghouse rules.
In addition to the capital held to withstand counterparty defaults described above, Nasdaq Clearing also has committed capital of
$96 million
to ensure that it can handle an orderly wind-down of its operation, and that it is adequately protected against investment, operational, legal, and business risks.
26
Market Value of Derivative Contracts Outstanding
The following table includes the market value of derivative contracts outstanding prior to netting:
|
|
March 31, 2019
|
||
|
|
(in millions)
|
||
|
Commodity and seafood options, futures and forwards
(1)(2)(3)
|
$
|
577
|
|
|
Fixed-income options and futures
(1)(2)
|
674
|
|
|
|
Stock options and futures
(1)(2)
|
151
|
|
|
|
Index options and futures
(1)(2)
|
73
|
|
|
|
Total
|
$
|
1,475
|
|
____________
|
(1)
|
We determined the fair value of our option contracts using standard valuation models that were based on market-based observable inputs including implied volatility, interest rates and the spot price of the underlying instrument.
|
|
(2)
|
We determined the fair value of our futures contracts based upon quoted market prices and average quoted market yields.
|
|
(3)
|
We determined the fair value of our forward contracts using standard valuation models that were based on market-based observable inputs including LIBOR rates and the spot price of the underlying instrument.
|
Derivative Contracts Cleared
The following table includes the total number of derivative contracts cleared through Nasdaq Clearing for the three months ended
March 31, 2019
and
2018
:
|
|
March 31, 2019
|
March 31, 2018
|
|||
|
Commodity and seafood options, futures and forwards
(1)
|
146,249
|
|
570,057
|
|
|
|
Fixed-income options and futures
|
5,404,135
|
|
6,047,859
|
|
|
|
Stock options and futures
|
6,854,813
|
|
5,738,212
|
|
|
|
Index options and futures
|
11,743,268
|
|
13,360,119
|
|
|
|
Total
|
24,148,465
|
|
25,716,247
|
|
|
____________
|
(1)
|
The total volume in cleared power related to commodity contracts was
250
Terawatt hours (TWh) for the three months ended
March 31, 2019
and
272
TWh for the three months ended
March 31, 2018
.
|
The outstanding contract value of resale and repurchase agreements was
$5.5 billion
as of
March 31, 2019
and
$3.3 billion
as of
March 31, 2018
. The total number of contracts cleared was
1,885,698
for the three months ended
March 31, 2019
and was
2,280,212
for the three months ended
March 31, 2018
.
27
17. Income Taxes
Income Tax Provision
The following table shows our income tax provision and effective tax rate:
|
|
Three Months Ended March 31,
|
Percentage Change
|
||||||||
|
|
2019
|
2018
|
||||||||
|
(in millions)
|
||||||||||
|
Income tax provision
|
$
|
66
|
|
$
|
62
|
|
6.5
|
%
|
||
|
Effective tax rate
|
21.1
|
%
|
25.9
|
%
|
||||||
The lower effective tax rate in the first quarter of 2019 is primarily due to a tax benefit from a dividends received deduction related to capital distributions from the OCC and the reversal of a previously accrued tax penalty in Finland, partially offset by a net tax benefit recorded in 2018 related to Swedish interest expense.
The effective tax rate may vary from period to period depending on, among other factors, the geographic and business mix of earnings and losses. These same and other factors, including history of pre-tax earnings and losses, are taken into account in assessing the ability to realize deferred tax assets.
Tax Audits
Nasdaq and its eligible subsidiaries file a consolidated U.S. federal income tax return and applicable state and local income tax returns and non-U.S. income tax returns. Federal income tax returns for the years 2008 through 2016 are currently under examination by the Internal Revenue Services and we are subject to examination by the Internal Revenue Service for the year 2017. Several state tax returns are currently under examination by the respective tax authorities for the years 2007 through 2016 and we are subject to examination for the year 2017. Non-U.S. tax returns are subject to examination by the respective tax authorities for the years 2009 through 2017. Although the results of such examinations may have an impact on our unrecognized tax benefits, we do not anticipate that such impact will be material to our consolidated financial position or results of operations. In addition, we do not anticipate that the amount of unrecognized tax benefits as of March 31, 2019 will decrease in the next twelve months as we do not expect to settle any material tax audits.
The Swedish Tax Agency has disallowed certain interest expense deductions for the years 2013 - 2016. We appealed to the Lower Administrative Court for the years 2013 - 2015. In the first quarter of 2018, the Lower Administrative Court denied our appeal. We have appealed to the Administrative Court of Appeal. Through March 31, 2018, we had recorded tax benefits of
$56 million
associated with this matter. We continue to pay all assessments from the Swedish Tax Agency while this matter is pending and have paid
$40 million
through March 31, 2019. In the second quarter of 2018, the Administrative Court of Appeal decided similar cases against other taxpayers. Although we continue to assert the validity of these interest expense deductions, the decisions of the court lead us to conclude that we can no longer assert that we are more than likely to be
successful in our appeal. As such, in 2018, we recorded tax expense of
$41 million
, or
$0.24
per diluted share, which is net of any related U.S. tax benefits and reflects the impact of foreign currency translation. We expect to record future quarterly net tax expense of
$1 million
related to this matter.
We are subject to examination by federal, state and local, and foreign tax authorities. We regularly assess the likelihood of additional assessments by each jurisdiction and have established tax reserves that we believe are adequate in relation to the potential for additional assessments. We believe that the resolution of tax matters will not have a material effect on our financial condition but may be material to our operating results for a particular period and the effective tax rate for that period.
Tax Cuts and Jobs Act
On January 1, 2018, we adopted ASU 2018-02, “Reclassification of Certain Tax Effects from Accumulated Other Comprehensive Income (Topic 220).” As a result of the adoption of this standard, we recorded a reclassification of
$142 million
for stranded tax effects related to the Tax Cuts and Jobs Act from accumulated other comprehensive loss to retained earnings within stockholders’ equity in the Condensed Consolidated Balance Sheets as of
March 31, 2018
. Of the
$142 million
of stranded tax effects,
$135 million
relates to the effect on net foreign currency translation gains and losses and
$7 million
relates to the effect on employee benefit plan adjustment gains and losses. These provisional amounts were finalized in the fourth quarter of 2018.
18. Commitments, Contingencies and Guarantees
Guarantees Issued and Credit Facilities Available
In addition to the default fund contributions and margin collateral pledged by clearing members discussed in Note 16, “Clearing Operations,” we have obtained financial guarantees and credit facilities which are guaranteed by us through counter indemnities, to provide further liquidity related to our clearing businesses. Financial guarantees issued to us totaled
$11 million
as of
March 31, 2019
and
$12 million
as of
December 31, 2018
. As discussed in “Other Credit Facilities,” of Note 10, “Debt Obligations,” clearing-related credit facilities, which are available in multiple currencies, totaled
$210 million
as of
March 31, 2019
and
$220 million
as of
December 31, 2018
, in available liquidity, none of which was utilized.
Execution Access is an introducing broker which operates the trading platform for our Fixed Income business to trade in U.S. Treasury securities. Execution Access has a clearing arrangement with Industrial and Commercial Bank of China Financial Services LLC, or ICBC. As of
March 31, 2019
, we have contributed
$15 million
of clearing deposits to ICBC in connection with this clearing arrangement. These deposits are recorded in other current assets in our Condensed Consolidated Balance Sheets. Some of the trading activity in Execution Access is cleared by ICBC through the Fixed Income Clearing Corporation, with ICBC acting as agent. Execution Access assumes the counterparty risk of clients that do not clear through the Fixed Income Clearing Corporation. Counterparty risk of clients exists for Execution Access between the trade date and
28
the settlement date of the individual transactions, which is at least one business day (or more, if specified by the U.S. Treasury issuance calendar). Counterparties that do not clear through the Fixed Income Clearing Corporation are subject to a credit due diligence process and may be required to post collateral, provide principal letters, or provide other forms of credit enhancement to Execution Access for the purpose of mitigating counterparty risk. Daily position trading limits are also enforced for such counterparties.
We believe that the potential for us to be required to make payments under these arrangements is mitigated through the pledged collateral and our risk management policies. Accordingly, no contingent liability is recorded in the Condensed Consolidated Balance Sheets for these arrangements. However, no guarantee can be provided that these arrangements will at all times be sufficient.
Other Guarantees
Through our clearing operations in the financial markets, Nasdaq Clearing is the legal counterparty for, and guarantees the performance of, its clearing members. See Note 16, “Clearing Operations,” for further discussion of Nasdaq Clearing performance guarantees.
We have provided a guarantee related to lease obligations for The Nasdaq Entrepreneurial Center, Inc., which is a not-for-profit organization designed to convene, connect and engage aspiring and current entrepreneurs. This entity is not included in the condensed consolidated financial statements of Nasdaq.
We believe that the potential for us to be required to make payments under these arrangements is unlikely. Accordingly, no contingent liability is recorded in the Condensed Consolidated Balance Sheets for the above guarantees.
Non-Cash Contingent Consideration
As part of the purchase price consideration of a prior acquisition, we have agreed to future annual issuances of
992,247
shares of Nasdaq common stock which approximated certain tax benefits associated with the transaction. Such contingent future issuances of Nasdaq common stock will be paid ratably through 2027 if Nasdaq’s total gross revenues equal or exceed
$25 million
in each such year. The contingent future issuances of Nasdaq common stock are subject to anti-dilution protections and acceleration upon certain events.
Escrow Agreements
In connection with prior acquisitions, we entered into escrow agreements to secure the payment of post-closing adjustments and to ensure other closing conditions. As of
March 31, 2019
, these escrow agreements provide for future payment of
$12 million
which is included in other current liabilities in the Condensed Consolidated Balance Sheets.
Routing Brokerage Activities
One of our broker-dealer subsidiaries, Nasdaq Execution Services, provides a guarantee to securities clearinghouses and exchanges under its standard membership agreements, which require members to guarantee the performance of other
members. If a member becomes unable to satisfy its obligations to a clearinghouse or exchange, other members would be required to meet its shortfalls. To mitigate these performance risks, the exchanges and clearinghouses often require members to post collateral, as well as meet certain minimum financial standards. Nasdaq Execution Services’ maximum potential liability under these arrangements cannot be quantified. However, we believe that the potential for Nasdaq Execution Services to be required to make payments under these arrangements is unlikely. Accordingly, no contingent liability is recorded in the Condensed Consolidated Balance Sheets for these arrangements.
Offer for Oslo Børs VPS
In February 2019, we, through our indirect wholly-owned subsidiary Nasdaq AB, made a public offer, or the Offer, to acquire all of the issued shares of Oslo Børs VPS Holding ASA, or Oslo Børs VPS. On March 4, 2019, we increased the Offer price from NOK
152
per share to NOK
158
per share, plus an interest payment of
6%
per annum on the increased Offer price, pro-rated per day from January 29, 2019 until the conditions of the Offer have been fulfilled or waived. The Offer price values the entire issued share capital of Oslo Børs VPS at NOK
6,795 million
, or approximately
$795 million
. Oslo Børs VPS’ board of directors has unanimously recommended that its shareholders accept the Offer.
The Offer is subject to the fulfillment or waiver of certain customary conditions, including but not limited to acceptances from at least two-thirds of the shares of Oslo Børs VPS or such higher percentage as may be necessary to comply with any regulatory requirement, certain regulatory clearances, limited confirmatory due diligence and completion of the Offer by the date which is the later of: (i) March 4, 2020 and (ii) the date which is sixty (60) days after the Euronext offer lapses, closes or is withdrawn.
In April 2019, we purchased approximately
2%
of the shares in Oslo Børs VPS at NOK
158
per share, equal to our Offer price. As a result, over
37%
of Oslo Børs VPS shares are either owned by Nasdaq or are subject to pre-commitments to accept the Offer.
Legal and Regulatory Matters
Litigation
As previously disclosed, we are named as one of many defendants in City of Providence v. BATS Global Markets, Inc., et al., 14 Civ. 2811 (S.D.N.Y.), which was filed on April 18, 2014 in the United States District Court for the Southern District of New York. The district court appointed lead counsel, who filed an amended complaint on September 2, 2014. The amended complaint names as defendants
seven
national exchanges, as well as Barclays PLC, which operated a private alternative trading system. On behalf of a putative class of securities traders, the plaintiffs allege that the defendants engaged in a scheme to manipulate the markets through high-frequency trading; the amended complaint asserts claims against us under Section 10(b) of the Exchange Act and Rule 10b-5, as well as under Section 6(b) of the Exchange Act. The
29
plaintiffs seek injunctive and monetary relief of an unspecified amount. We filed a motion to dismiss the amended complaint on November 3, 2014. In response, the plaintiffs filed a second amended complaint on November 24, 2014, which names the same defendants and alleges essentially the same violations. We then filed a motion to dismiss the second amended complaint on January 23, 2015. On August 26, 2015, the district court entered an order dismissing the second amended complaint in its entirety with prejudice, concluding that most of the plaintiffs’ theories were foreclosed by absolute immunity and in any event that the plaintiffs failed to state any claim. The plaintiffs appealed the judgment of dismissal to the United States Court of Appeals for the Second Circuit. On December 19, 2017, the Second Circuit issued an opinion vacating the district court’s judgment of dismissal and remanding to the district court for further proceedings. The exchanges filed a petition before the Second Circuit seeking panel or en banc rehearing on January 31, 2018, which the Second Circuit denied on March 13, 2018. On May 18, 2018, the exchanges filed a motion to dismiss the amended complaint, raising issues not addressed in the proceedings to date. Given the preliminary nature of the proceedings, we are unable to estimate what, if any, liability may result from this litigation. However, we believe that the claims are without merit and will continue to litigate vigorously.
Nasdaq Commodities Clearing Default
During September 2018, a clearing member of Nasdaq Clearing's commodities market was declared in default. Consistent with our regulatory obligations, we notified all relevant regulators and are cooperating fully with information requests. We are unable to predict the outcome or exact timing of this matter. See “Nasdaq Commodities Clearing Default,” of Note 16, “Clearing Operations,” for further information on this event.
SEC Decisions
In recent years, certain industry groups have challenged the level of fees that U.S. exchanges charge for market data and connectivity. We have defeated two challenges in federal appeals court pertaining to market data and an additional challenge at the administrative level within the SEC. However, in October 2018, the SEC reversed that administrative decision
and found that Nasdaq had not met a burden of demonstrating that certain challenged fees were fair and reasonable; we estimate that this decision will reduce our revenues by approximately
$1 million
. Nasdaq has appealed this decision to the U.S. Court of Appeals for the District of Columbia Circuit. In addition, the SEC remanded a series of additional challenges to market data and connectivity fees back to Nasdaq for further consideration. Nasdaq has also appealed this decision to the U.S. Court of Appeals for the District of Columbia Circuit. We are unable to predict the outcome or the timing of the ultimate resolution of these matters.
Other Matters
Except as disclosed above and in prior reports filed under the Exchange Act, we are not currently a party to any litigation or proceeding that we believe could have a material adverse effect on our business, consolidated financial condition, or operating results. However, from time to time, we have been threatened with, or named as a defendant in, lawsuits or involved in regulatory proceedings.
In the normal course of business, Nasdaq discusses matters with its regulators raised during regulatory examinations or otherwise subject to their inquiries. Management believes that censures, fines, penalties or other sanctions that could result from any ongoing examinations or inquiries will not have a material impact on its consolidated financial position or results of operations. However, we are unable to predict the outcome or the timing of the ultimate resolution of these matters, or the potential fines, penalties or injunctive or other equitable relief, if any, that may result from these matters.
Tax Audits
We are engaged in ongoing discussions and audits with taxing authorities on various tax matters, the resolutions of which are uncertain. Currently, there are matters that may lead to assessments, some of which may not be resolved for several years. Based on currently available information, we believe we have adequately provided for any assessments that could result from those proceedings where it is more likely than not that we will be assessed. We review our positions on these matters as they progress. See “Tax Audits,” of Note 17, “Income Taxes,” for further discussion.
* * * * * *
19. Business Segments
We manage, operate and provide our products and services in
four
business segments: Market Services, Corporate Services, Information Services and Market Technology. See Note 1, “Organization and Nature of Operations,” for further discussion of our reportable segments.
Our management allocates resources, assesses performance and manages these businesses as
four
separate segments. We evaluate the performance of our segments based on several factors, of which the primary financial measure is operating income. Results of individual businesses are presented based on our management accounting practices and structure.
30
The following table presents certain information regarding our business segments for the three months ended
March 31, 2019
and
2018
:
|
|
Market Services
|
Corporate Services
|
Information Services
|
Market Technology
|
Corporate Items
|
Consolidated
|
|||||||||||||||||
|
|
(in millions)
|
||||||||||||||||||||||
|
Three Months Ended March 31, 2019
|
|
|
|
|
|
|
|||||||||||||||||
|
Total revenues
|
$
|
638
|
|
$
|
131
|
|
$
|
193
|
|
$
|
77
|
|
$
|
—
|
|
$
|
1,039
|
|
|||||
|
Transaction-based expenses
|
(405
|
)
|
—
|
|
—
|
|
—
|
|
—
|
|
(405
|
)
|
|||||||||||
|
Revenues less transaction-based expenses
|
233
|
|
131
|
|
193
|
|
77
|
|
—
|
|
634
|
|
|||||||||||
|
Operating income (loss)
|
$
|
135
|
|
$
|
46
|
|
$
|
124
|
|
$
|
7
|
|
$
|
(37
|
)
|
$
|
275
|
|
|||||
|
Three Months Ended March 31, 2018
|
|
|
|
|
|
|
|||||||||||||||||
|
Total revenues
|
$
|
735
|
|
$
|
132
|
|
$
|
174
|
|
$
|
60
|
|
$
|
50
|
|
$
|
1,151
|
|
|||||
|
Transaction-based expenses
|
(485
|
)
|
—
|
|
—
|
|
—
|
|
—
|
|
(485
|
)
|
|||||||||||
|
Revenues less transaction-based expenses
|
250
|
|
132
|
|
174
|
|
60
|
|
50
|
|
666
|
|
|||||||||||
|
Operating income (loss)
|
$
|
147
|
|
$
|
43
|
|
$
|
113
|
|
$
|
2
|
|
$
|
(32
|
)
|
$
|
273
|
|
|||||
Certain amounts are allocated to corporate items in our management reports as we believe they do not contribute to a meaningful evaluation of a particular segment's ongoing operating performance. These items include the following:
Amortization expense of acquired intangible assets:
We amortize intangible assets acquired in connection with various acquisitions. Intangible asset amortization expense can vary from period to period due to episodic acquisitions completed, rather than from our ongoing business operations. As such, if intangible asset amortization is included in performance measures, it is more difficult to assess the day-to-day operating performance of the segments, and the relative operating performance of the segments between periods. Management does not consider intangible asset amortization expense for the purpose of evaluating the performance of our segments or their managers or when making decisions to allocate resources. Therefore, we believe performance measures excluding intangible asset amortization expense provide management with a more useful representation of our segments' ongoing activity in each period.
Merger and strategic initiatives expense:
We have pursued various strategic initiatives and completed acquisitions and divestitures in recent years which have resulted in expenses which would not have otherwise been incurred. These expenses generally include integration costs, as well as legal, due diligence and other third party transaction costs. The frequency and the amount of such expenses vary significantly based on the size, timing and complexity of the transaction.
2018 Divestiture:
We have included in corporate items the revenues and expenses of the Public Relations Solutions and Digital Media Services businesses which were part of the Corporate Solutions business within our Corporate Services segment as these businesses were sold in April 2018. See “2018 Divestiture,” of Note 5, “Acquisitions and Divestitures,” for further discussion.
Accordingly, we do not allocate these costs for purposes of disclosing segment results because they do not contribute to a meaningful evaluation of a particular segment’s ongoing operating performance.
* * * * * *
A summary of our corporate items is as follows:
|
Three Months Ended March 31,
|
||||||||
|
2019
|
2018
|
|||||||
|
(in millions)
|
||||||||
|
Revenues - divested businesses
|
$
|
—
|
|
$
|
50
|
|
||
|
Expenses:
|
||||||||
|
Amortization expense of acquired intangible assets
|
26
|
|
28
|
|
||||
|
Merger and strategic initiatives expense
|
9
|
|
10
|
|
||||
|
Expenses - divested businesses
|
—
|
|
42
|
|
||||
|
Other
|
2
|
|
2
|
|
||||
|
Total expenses
|
37
|
|
82
|
|
||||
|
Operating loss
|
$
|
(37
|
)
|
$
|
(32
|
)
|
||
31
Item 2. Management’s Discussion and Analysis of Financial Condition and Results of
Operations
The following discussion and analysis of the financial condition and results of operations of Nasdaq should be read in conjunction with our condensed consolidated financial statements and related notes included in this Form 10-Q.
Overview
We are a leading provider of trading, clearing, marketplace technology, regulatory, securities listing, information and public and private company services. Our global offerings are diverse and include trading and clearing across multiple asset classes, trade management services, market data products, financial indexes, investment data and analytics, capital formation solutions, corporate solutions, and market technology products and services. Our technology powers markets across the globe, supporting equity derivative trading, clearing and settlement, cash equity trading, fixed income trading, trading surveillance and many other functions. We manage, operate and provide our products and services in four business segments: Market Services, Corporate Services, Information Services and Market Technology.
2019 Developments
|
•
|
In April, the board of directors approved a regular quarterly cash dividend of $0.47 per share on our outstanding common stock which reflects a 7.0% increase from our prior quarterly cash dividend of $0.44;
|
|
•
|
In April 2019, we issued the 2029 Notes. The net proceeds will primarily be used to redeem all of our 2020 Notes;
|
|
•
|
In March 2019, we sold our BWise enterprise governance, risk and compliance software platform which was part of our Corporate Solutions business within our Corporate Services segment to SAI Global;
|
|
•
|
In March 2019, we entered into an agreement to sell Nordic Fund Market, an electronic mutual fund service which is a smaller part of our Broker Services business; and
|
|
•
|
In January 2019, we acquired Cinnober, a major Swedish financial technology provider to brokers, exchanges and clearinghouses worldwide. Cinnober is part of our Market Technology segment.
|
32
Nasdaq’s Operating Results
Key Drivers
The following table includes key drivers for our Market Services, Corporate Services, Information Services and Market Technology segments. In evaluating the performance of our business, our senior management closely evaluates these key drivers.
|
Three Months Ended March 31,
|
||||||||
|
|
2019
|
2018
|
||||||
|
Market Services
|
|
|
||||||
|
Equity Derivative Trading and Clearing
|
|
|
||||||
|
U.S. equity options
|
|
|
||||||
|
Total industry average daily volume (in millions)
|
17.3
|
|
19.6
|
|
||||
|
Nasdaq PHLX matched market share
|
16.0
|
%
|
16.0
|
%
|
||||
|
The Nasdaq Options Market matched market share
|
9.2
|
%
|
10.1
|
%
|
||||
|
Nasdaq BX Options matched market share
|
0.3
|
%
|
0.5
|
%
|
||||
|
Nasdaq ISE Options matched market share
|
8.6
|
%
|
8.4
|
%
|
||||
|
Nasdaq GEMX Options matched market share
|
4.1
|
%
|
4.6
|
%
|
||||
|
Nasdaq MRX Options matched market share
|
0.2
|
%
|
0.1
|
%
|
||||
|
Total matched market share executed on Nasdaq’s exchanges
|
38.4
|
%
|
39.7
|
%
|
||||
|
Nasdaq Nordic and Nasdaq Baltic options and futures
|
|
|
||||||
|
Total average daily volume of options and futures contracts
(1)
|
353,454
|
|
354,744
|
|
||||
|
Cash Equity Trading
|
|
|
||||||
|
Total U.S.-listed securities
|
|
|
||||||
|
Total industry average daily share volume (in billions)
|
7.52
|
|
7.62
|
|
||||
|
Matched share volume (in billions)
|
90.6
|
|
88.6
|
|
||||
|
The Nasdaq Stock Market matched market share
|
16.8
|
%
|
14.9
|
%
|
||||
|
Nasdaq BX matched market share
|
2.2
|
%
|
3.3
|
%
|
||||
|
Nasdaq PSX matched market share
|
0.7
|
%
|
0.9
|
%
|
||||
|
Total matched market share executed on Nasdaq’s exchanges
|
19.7
|
%
|
19.1
|
%
|
||||
|
Market share reported to the FINRA/Nasdaq Trade Reporting Facility
|
29.9
|
%
|
33.6
|
%
|
||||
|
Total market share
(2)
|
49.6
|
%
|
52.7
|
%
|
||||
|
Nasdaq Nordic and Nasdaq Baltic securities
|
|
|
||||||
|
Average daily number of equity trades executed on Nasdaq’s exchanges
|
574,195
|
|
651,405
|
|
||||
|
Total average daily value of shares traded (in billions)
|
$
|
5.1
|
|
$
|
6.0
|
|
||
|
Total market share executed on Nasdaq’s exchanges
|
66.8
|
%
|
69.6
|
%
|
||||
|
FICC
|
|
|
||||||
|
Fixed Income
|
|
|
||||||
|
U.S. fixed income notional trading volume (in billions)
|
$
|
2,715
|
|
$
|
5,156
|
|
||
|
Total average daily volume of Nasdaq Nordic and Nasdaq Baltic fixed income contracts
|
116,262
|
|
132,330
|
|
||||
|
Commodities
|
|
|
||||||
|
Power contracts cleared (TWh)
(3)
|
250
|
|
272
|
|
||||
|
Corporate Services
|
|
|
||||||
|
Initial public offerings
|
|
|
||||||
|
The Nasdaq Stock Market
|
37
|
|
37
|
|
||||
|
Exchanges that comprise Nasdaq Nordic and Nasdaq Baltic
|
4
|
|
13
|
|
||||
|
Total new listings
|
|
|
||||||
|
The Nasdaq Stock Market
(4)
|
59
|
|
62
|
|
||||
|
Exchanges that comprise Nasdaq Nordic and Nasdaq Baltic
(5)
|
9
|
|
15
|
|
||||
|
Number of listed companies
|
|
|
||||||
|
The Nasdaq Stock Market
(6)
|
3,059
|
|
2,969
|
|
||||
|
Exchanges that comprise Nasdaq Nordic and Nasdaq Baltic
(7)
|
1,018
|
|
986
|
|
||||
|
Information Services
|
|
|
||||||
|
Number of licensed ETPs
|
346
|
|
328
|
|
||||
|
ETP assets under management tracking Nasdaq indexes (in billions)
|
$
|
196
|
|
$
|
173
|
|
||
|
Market Technology
|
|
|
||||||
|
Order intake (in millions)
(8)
|
$
|
54
|
|
$
|
45
|
|
||
|
Total order value (in millions)
(9)
|
$
|
820
|
|
$
|
704
|
|
||
33
____________
|
(1)
|
Includes Finnish option contracts traded on Eurex.
|
|
(2)
|
Includes transactions executed on The Nasdaq Stock Market’s, Nasdaq BX’s and Nasdaq PSX’s systems plus trades reported through the FINRA/Nasdaq Trade Reporting Facility.
|
|
(3)
|
Transactions executed on Nasdaq Commodities or OTC and reported for clearing to Nasdaq Commodities measured by Terawatt hours (TWh).
|
|
(4)
|
New listings include IPOs, including those completed on a best efforts basis, issuers that switched from other listing venues, closed-end funds and separately listed ETPs.
|
|
(5)
|
New listings include IPOs and represent companies listed on the Nasdaq Nordic and Nasdaq Baltic exchanges and companies on the alternative markets of Nasdaq First North.
|
|
(6)
|
Number of total listings on The Nasdaq Stock Market at period end, including
388
ETPs as of
March 31, 2019
and
376
as of
March 31, 2018
.
|
|
(7)
|
Represents companies listed on the Nasdaq Nordic and Nasdaq Baltic exchanges and companies on the alternative markets of Nasdaq First North at period end.
|
|
(8)
|
Total contract value of orders signed during the period.
|
|
(9)
|
Represents total contract value of signed orders that are yet to be recognized as revenue. Market technology deferred revenue, as discussed in Note 9, “Deferred Revenue,” to the condensed consolidated financial statements, represents consideration received that is yet to be recognized as revenue for these signed orders.
|
* * * * * *
Financial Summary
The following table summarizes our financial performance for the three months ended
March 31, 2019
as compared to the same period in 2018. The comparability of our results of operations between reported periods is impacted by our acquisition of Cinnober in January 2019, the divestiture of the Public Relations Solutions and Digital Media Services businesses in April 2018, and an increase in net income from unconsolidated investees. See Note 5, “Acquisitions and Divestitures,” and “Equity Method Investments,” of Note 8, “Investments,” to the condensed consolidated financial statements for further discussion of these transactions. For a detailed discussion of our results of operations, see “Segment Operating Results” below.
|
|
Three Months Ended March 31,
|
Percentage Change
|
|||||||||
|
|
2019
|
2018
|
|||||||||
|
|
(in millions, except per share amounts)
|
|
|||||||||
|
Revenues less transaction-based expenses
|
$
|
634
|
|
$
|
666
|
|
(4.8
|
)%
|
|||
|
Operating expenses
|
359
|
|
393
|
|
(8.7
|
)%
|
|||||
|
Operating income
|
275
|
|
273
|
|
0.7
|
%
|
|||||
|
Interest expense
|
(37
|
)
|
(38
|
)
|
(2.6
|
)%
|
|||||
|
Net gain on divestiture of business
|
27
|
|
—
|
|
N/M
|
|
|||||
|
Net income from unconsolidated investees
|
45
|
|
2
|
|
2,150.0
|
%
|
|||||
|
Income before income taxes
|
313
|
|
239
|
|
31.0
|
%
|
|||||
|
Income tax provision
|
66
|
|
62
|
|
6.5
|
%
|
|||||
|
Net income attributable to Nasdaq
|
$
|
247
|
|
$
|
177
|
|
39.5
|
%
|
|||
|
Diluted earnings per share
|
$
|
1.48
|
|
$
|
1.05
|
|
41.0
|
%
|
|||
|
Cash dividends declared per common share
|
$
|
0.44
|
|
$
|
0.82
|
|
(46.3
|
)%
|
|||
_______
N/M - Not meaningful.
In countries with currencies other than the U.S. dollar, revenues and expenses are translated using monthly average exchange rates. Impacts on our revenues less transaction-based expenses and operating income associated with fluctuations in foreign currency are discussed in more detail under “Item 3. Quantitative and Qualitative Disclosures about Market Risk.”
34
Segment Operating Results
The following table shows our revenues by segment, transaction-based expenses for our Market Services segment and total revenues less transaction-based expenses:
|
|
Three Months Ended March 31,
|
Percentage Change
|
|||||||||
|
|
2019
|
2018
|
|||||||||
|
|
(in millions)
|
|
|||||||||
|
Market Services
|
$
|
638
|
|
$
|
735
|
|
(13.2
|
)%
|
|||
|
Transaction-based expenses
|
(405
|
)
|
(485
|
)
|
(16.5
|
)%
|
|||||
|
Market Services revenues less transaction-based expenses
|
233
|
|
250
|
|
(6.8
|
)%
|
|||||
|
Corporate Services
|
131
|
|
132
|
|
(0.8
|
)%
|
|||||
|
Information Services
|
193
|
|
174
|
|
10.9
|
%
|
|||||
|
Market Technology
|
77
|
|
60
|
|
28.3
|
%
|
|||||
|
Other revenues
(1)
|
—
|
|
50
|
|
(100.0
|
)%
|
|||||
|
Total revenues less transaction-based expenses
|
$
|
634
|
|
$
|
666
|
|
(4.8
|
)%
|
|||
____________
|
(1)
|
Includes the revenues from the Public Relations Solutions and Digital Media Services businesses which were sold in April 2018. Prior to the sale date, these revenues were included in our Corporate Solutions business. See “2018 Divestiture,” of Note 5, “Acquisitions and Divestitures,” to the condensed consolidated financial statements for further discussion.
|
The following charts show our Market Services, Corporate Services, Information Services and Market Technology segments as a percentage of our total revenues less transaction-based expenses of
$634 million
for the three months ended March 31, 2019 and
$666 million
for the three months ended March 31, 2018:
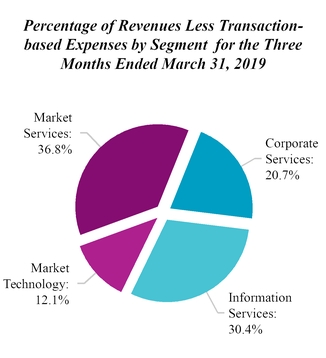
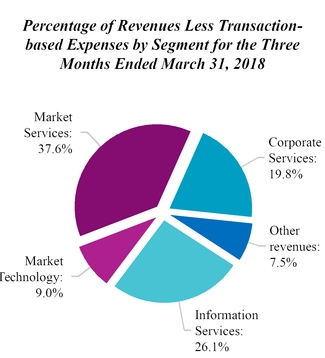
35
MARKET SERVICES
The following table shows total revenues, transaction-based expenses, and total revenues less transaction-based expenses from our Market Services segment:
|
|
Three Months Ended March 31,
|
Percentage Change
|
|||||||||
|
|
2019
|
2018
|
|||||||||
|
|
(in millions)
|
|
|||||||||
|
Market Services Revenues:
|
|
|
|
||||||||
|
Equity Derivative Trading and Clearing Revenues
(1)
|
$
|
193
|
|
$
|
231
|
|
(16.5
|
)%
|
|||
|
Transaction-based expenses:
|
|
|
|
|
|||||||
|
Transaction rebates
|
(113
|
)
|
(137
|
)
|
(17.5
|
)%
|
|||||
|
Brokerage, clearance and exchange fees
(1)
|
(8
|
)
|
(16
|
)
|
(50.0
|
)%
|
|||||
|
Equity derivative trading and clearing revenues less transaction-based expenses
|
72
|
|
78
|
|
(7.7
|
)%
|
|||||
|
Cash Equity Trading Revenues
(2)
|
352
|
|
402
|
|
(12.4
|
)%
|
|||||
|
Transaction-based expenses:
|
|
|
|
|
|||||||
|
Transaction rebates
|
(217
|
)
|
(208
|
)
|
4.3
|
%
|
|||||
|
Brokerage, clearance and exchange fees
(2)
|
(66
|
)
|
(120
|
)
|
(45.0
|
)%
|
|||||
|
Cash equity trading revenues less transaction-based expenses
|
69
|
|
74
|
|
(6.8
|
)%
|
|||||
|
FICC Revenues
|
20
|
|
27
|
|
(25.9
|
)%
|
|||||
|
Transaction-based expenses:
|
|
|
|
||||||||
|
Transaction rebates
|
(1
|
)
|
(3
|
)
|
(66.7
|
)%
|
|||||
|
Brokerage, clearance and exchange fees
|
—
|
|
(1
|
)
|
(100.0
|
)%
|
|||||
|
FICC revenues less transaction-based expenses
|
19
|
|
23
|
|
(17.4
|
)%
|
|||||
|
Trade Management Services Revenues
|
73
|
|
75
|
|
(2.7
|
)%
|
|||||
|
Total Market Services revenues less transaction-based expenses
|
$
|
233
|
|
$
|
250
|
|
(6.8
|
)%
|
|||
____________
|
(1)
|
Includes Section 31 fees of $7 million in the first quarter of 2019 and $14 million in the first quarter of 2018. Section 31 fees are recorded as equity derivative trading and clearing revenues with a corresponding amount recorded in transaction-based expenses.
|
|
(2)
|
Includes Section 31 fees of $62 million in the first quarter of 2019 and $115 million in the first quarter of 2018. Section 31 fees are recorded as cash equity trading revenues with a corresponding amount recorded in transaction-based expenses.
|
Equity Derivative Trading and Clearing Revenues
Equity derivative trading and clearing revenues and equity derivative trading and clearing revenues less transaction-based expenses decreased in the first quarter of 2019 compared with the same period in 2018. The decrease in equity derivative trading and clearing revenues was primarily due to lower U.S. industry trading volumes and lower Section 31 pass-through fee revenue. The decrease in equity derivative trading and clearing revenues less transaction-based expenses was primarily due to lower U.S. industry trading volumes and a lower European net capture rate.
Section 31 fees are recorded as equity derivative trading and clearing revenues with a corresponding amount recorded as transaction-based expenses. In the U.S., we are assessed these fees from the SEC and pass them through to our customers in the form of incremental fees. Pass-through fees can increase or decrease due to rate changes by the SEC, our percentage of the overall industry volumes processed on our systems, and differences in actual dollar value of shares traded. Since the amount recorded in revenues is equal to the amount recorded as transaction-based expenses, there is no impact on our revenues less transaction-based expenses. Section 31 fees decreased in the first quarter of 2019 compared with the same period in 2018 primarily due to lower average SEC fee rates.
Transaction rebates, in which we credit a portion of the per share execution charge to the market participant, decreased in the first quarter of 2019 compared with the same period in 2018 primarily due to lower U.S. industry trading volumes, a decrease in our overall U.S. matched market share executed on Nasdaq's exchanges and a decrease in the U.S. rebate capture rate.
Brokerage, clearance and exchange fees decreased in the first quarter of 2019 compared with the same period in 2018 primarily due to lower Section 31 pass-through fees, as discussed above.
36
Cash Equity Trading Revenues
Cash equity trading revenues and cash equity trading revenues less transaction-based expenses decreased in first quarter of 2019 compared with the same period in 2018. The decrease in cash equity trading revenues was primarily due to lower Section 31 pass-through fee revenue due to lower average SEC fee rates. The decrease in cash equity trading revenues less transaction-based expenses was primarily due to lower European industry trading volumes. Further impacting the decreases in cash equity trading revenues and cash equity trading revenues less transaction-based expenses was an unfavorable impact from foreign exchange of $3 million.
Similar to equity derivative trading and clearing, in the U.S. we record Section 31 fees as cash equity trading revenues with a corresponding amount recorded as transaction-based expenses. We are assessed these fees from the SEC and pass them through to our customers in the form of incremental fees. Since the amount recorded as revenues is equal to the amount recorded as transaction-based expenses, there is no impact on our revenues less transaction-based expenses. Section 31 fees decreased in the first quarter of 2019 compared with the same period in 2018 primarily due to lower dollar value traded on Nasdaq’s exchanges and lower average SEC fee rates.
Transaction rebates increased in the first quarter of 2019 compared with the same period in 2018. For The Nasdaq Stock Market, Nasdaq PSX and Nasdaq Canada, we credit a portion of the per share execution charge to the market participant that provides the liquidity, and for Nasdaq BX, we credit a portion of the per share execution charge to the market participant that takes the liquidity. The increase in 2019 was primarily due to an increase in our overall U.S. matched market share executed on Nasdaq’s exchanges, partially offset by lower U.S. industry trading volumes.
Brokerage, clearance and exchange fees decreased in the first quarter of 2019 compared with the same period in 2018. The decrease was primarily due to lower Section 31 pass-through fees, as discussed above.
FICC Revenues
FICC revenues and FICC revenues less transaction-based expenses decreased in the first quarter of 2019 compared with the same period in 2018 primarily due to a decline in revenues related to U.S. fixed income and an unfavorable impact from foreign exchange of $2 million.
Trade Management Services Revenues
Trade management services revenues decreased in the first quarter of 2019 compared with the same period in 2018 primarily due to a decrease in broker services revenues and an unfavorable impact from foreign exchange of $1 million.
CORPORATE SERVICES
The following table shows revenues from our Corporate Services segment:
|
|
Three Months Ended March 31,
|
Percentage Change
|
||||||||
|
|
2019
|
2018
|
||||||||
|
|
(in millions)
|
|
||||||||
|
Corporate Services:
|
||||||||||
|
Corporate Solutions
|
$
|
60
|
|
$
|
60
|
|
—
|
%
|
||
|
Listing Services
|
71
|
|
72
|
|
(1.4
|
)%
|
||||
|
Total Corporate Services
|
$
|
131
|
|
$
|
132
|
|
(0.8
|
)%
|
||
Corporate Solutions
Revenues
Corporate solutions revenues were flat in the first quarter of 2019 compared with the same period 2018 as an increase in governance solutions (formerly board & leadership) revenues was offset by an unfavorable impact from foreign exchange of $1 million.
Listing Services
Revenues
Listing services revenues decreased slightly in the first quarter of 2019 compared with the same period in 2018 primarily due to the run-off of fees earned from U.S. listing of additional shares and an unfavorable impact from foreign exchange of $2 million, partially offset by higher annual listing fees due to an increase in the number of listed companies.
INFORMATION SERVICES
The following table shows revenues from our Information Services segment:
|
|
Three Months Ended March 31,
|
Percentage Change
|
|||||||||
|
|
2019
|
2018
|
|||||||||
|
|
(in millions)
|
|
|||||||||
|
Information Services:
|
|||||||||||
|
Market Data
|
$
|
100
|
|
$
|
100
|
|
—
|
%
|
|||
|
Index
|
54
|
|
50
|
|
8.0
|
%
|
|||||
|
Investment Data & Analytics
|
39
|
|
24
|
|
62.5
|
%
|
|||||
|
Total Information Services
|
$
|
193
|
|
$
|
174
|
|
10.9
|
%
|
|||
Market Data Revenues
Market data revenues were flat in the first quarter of 2019 compared with the same period in 2018 as an increase in U.S. tape plan revenues from under-reported data usage was offset by an unfavorable impact from foreign exchange of $2 million.
Index Revenues
Index revenues increased in the first quarter of 2019 compared with the same period in 2018 primarily due to higher licensing revenues from futures trading linked to the Nasdaq 100 Index, higher average assets under management in ETPs linked to Nasdaq indexes and higher index data revenues.
Investment Data & Analytics Revenues
Investment data & analytics revenues increased in the first quarter of 2019 compared with the same period in 2018 primarily due to an increase in eVestment revenues resulting from an $11 million purchase price adjustment on deferred revenue included in the first quarter of 2018 and organic growth.
37
MARKET TECHNOLOGY
The following table shows revenues from our Market Technology segment:
|
|
Three Months Ended March 31,
|
Percentage Change
|
|||||||||
|
|
2019
|
2018
|
|||||||||
|
|
(in millions)
|
|
|||||||||
|
Market Technology
|
$
|
77
|
|
$
|
60
|
|
28.3
|
%
|
|||
Market Technology Revenues
Market technology revenues increased in the first quarter of 2019 compared with the same period in 2018 primarily due to
an increase in the size and number of software delivery projects, an increase in software as a service surveillance revenues, and our acquisition of Cinnober, partially offset by an unfavorable impact from foreign exchange of $3 million.
OTHER REVENUES
Other revenues include the revenues from the Public Relations Solutions and Digital Media Services businesses which were sold in April 2018. Prior to the sale date, these revenues were included in our Corporate Solutions business. See “2018 Divestiture,” of Note 5, “Acquisitions and Divestitures,” to the condensed consolidated financial statements for further discussion.
* * * * * *
Expenses
Operating Expenses
The following table shows our operating expenses:
|
|
Three Months Ended March 31,
|
Percentage Change
|
|||||||||
|
|
2019
|
2018
|
|||||||||
|
|
(in millions)
|
||||||||||
|
Compensation and benefits
|
$
|
175
|
|
$
|
197
|
|
(11.2
|
)%
|
|||
|
Professional and contract services
|
37
|
|
37
|
|
—
|
%
|
|||||
|
Computer operations and data communications
|
33
|
|
32
|
|
3.1
|
%
|
|||||
|
Occupancy
|
24
|
|
25
|
|
(4.0
|
)%
|
|||||
|
General, administrative and other
|
16
|
|
22
|
|
(27.3
|
)%
|
|||||
|
Marketing and advertising
|
10
|
|
9
|
|
11.1
|
%
|
|||||
|
Depreciation and amortization
|
48
|
|
53
|
|
(9.4
|
)%
|
|||||
|
Regulatory
|
7
|
|
8
|
|
(12.5
|
)%
|
|||||
|
Merger and strategic initiatives
|
9
|
|
10
|
|
(10.0
|
)%
|
|||||
|
Total operating expenses
|
$
|
359
|
|
$
|
393
|
|
(8.7
|
)%
|
|||
The decrease in compensation and benefits expense in the first three months of 2019 was primarily due to lower compensation costs resulting from the sale of the Public Relations Solutions and Digital Media Services businesses and lower performance incentives, partially offset by the acquisition of Cinnober. The decrease also included a favorable impact from foreign exchange of $7 million.
Headcount decreased to
4,281
employees as of
March 31, 2019
from
4,758
as of
March 31, 2018
primarily due to the sale of the Public Relations Solutions and Digital Media Services businesses, partially offset by our 2019 and 2018 acquisitions.
Professional and contract services expense was flat in the first quarter of 2019 primarily due to the sale of the Public Relations Solutions and Digital Media Services businesses offset by certain litigation and consulting costs.
Computer operations and data communications expense increased slightly in the first quarter of 2019 primarily due to higher market data feed costs and additional costs associated with our 2019 and 2018 acquisitions, partially offset by lower costs resulting from the sale of the Public Relations Solutions and Digital Media Services businesses.
Occupancy expense decreased slightly in the first quarter of 2019 as lower costs due to the sale of Public Relations Solutions and Digital Media Services businesses were partially offset by increases associated with additional facility and rent costs resulting from expansion of our new world headquarters and our 2019 and 2018 acquisitions.
The decrease in general, administrative and other expense in the first quarter of 2019 was primarily due to unrealized gains on foreign currency contracts used as economic hedges as well as the sale of the Public Relations Solutions and Digital Media Services businesses.
Marketing and advertising expense increased slightly in the first quarter of 2019 primarily due to an increase in advertising spend.
Depreciation and amortization expense decreased in the first quarter of 2019 primarily due to a decrease in amortization expense recorded on intangible assets which became fully amortized, partially offset by additional amortization expense associated with acquired intangible assets.
38
Merger and strategic initiatives expense decreased slightly in the first quarter of 2019 compared with the same period in 2018. We have pursued various strategic initiatives and completed acquisitions and divestitures in recent years which have resulted in expenses which would not have otherwise been incurred. These expenses generally include integration costs, as well as legal, due diligence and other third party transaction costs and will vary based on the size and frequency of the activities described above.
* * * * * *
Non-operating Income and Expenses
The following table shows our non-operating income and expenses:
|
|
Three Months Ended March 31,
|
Percentage Change
|
|||||||||
|
|
2019
|
2018
|
|||||||||
|
|
(in millions)
|
|
|||||||||
|
Interest income
|
$
|
3
|
|
$
|
2
|
|
50.0
|
%
|
|||
|
Interest expense
|
(37
|
)
|
(38
|
)
|
(2.6
|
)%
|
|||||
|
Net interest expense
|
(34
|
)
|
(36
|
)
|
(5.6
|
)%
|
|||||
|
Net gain on divestiture of business
|
27
|
|
—
|
|
N/M
|
|
|||||
|
Net income from unconsolidated investees
|
45
|
|
2
|
|
2,150.0
|
%
|
|||||
|
Total non-operating income (expenses)
|
$
|
38
|
|
$
|
(34
|
)
|
(211.8
|
)%
|
|||
_______
N/M - Not meaningful.
Interest Income
Interest income increased in the first quarter of 2019 compared with the same period in 2018 primarily due to an increase in prevailing market rates.
Interest Expense
The following table shows our interest expense:
|
|
Three Months Ended March 31,
|
Percentage Change
|
|||||||||
|
|
2019
|
2018
|
|||||||||
|
|
(in millions)
|
|
|||||||||
|
Interest expense on debt
|
$
|
35
|
|
$
|
35
|
|
—
|
%
|
|||
|
Accretion of debt issuance costs and debt discount
|
2
|
|
2
|
|
—
|
%
|
|||||
|
Other bank and investment-related fees
|
—
|
|
1
|
|
(100.0
|
)%
|
|||||
|
Interest expense
|
$
|
37
|
|
$
|
38
|
|
(2.6
|
)%
|
|||
Net Gain on Divestiture of Business
In March 2019,
we sold our BWise enterprise governance, risk and compliance software platform which was part of our Corporate Solutions business within our Corporate Services segment to SAI Global and recognized a pre-tax gain on the sale of
$27 million
, net of disposal costs (
$20 million
after tax).
See “2019 Divestiture,” of Note 5, “Acquisitions and Divestitures,” to the condensed consolidated financial statements for further discussion
.
Net Income from Unconsolidated Investees
Net income from unconsolidated investees increased in the first quarter of 2019 compared with the same period in 2018 primarily due to income recognized from our equity method investment in OCC. See “Equity Method Investments,” of Note 8, “Investments,” to the condensed consolidated financial statements for further discussion.
Tax Matters
The following table shows our income tax provision and effective tax rate:
|
Three Months Ended March 31,
|
Percentage Change
|
||||||||||
|
2019
|
2018
|
||||||||||
|
($ in millions)
|
|||||||||||
|
Income tax provision
|
$
|
66
|
|
$
|
62
|
|
6.5
|
%
|
|||
|
Effective tax rate
|
21.1
|
%
|
25.9
|
%
|
|
|
|||||
The lower effective tax rate in first quarter of 2019 is primarily due to a tax benefit from a dividends received deduction related to capital distributions from the OCC and the reversal of a previously accrued tax penalty in Finland, partially offset by a net tax benefit recorded in 2018 related to Swedish interest expense. For further discussion of our tax matters, see Note 17, “Income Taxes,” to the condensed consolidated financial statements.
Non-GAAP Financial Measures
In addition to disclosing results determined in accordance with U.S. GAAP, we also have provided non-GAAP net income attributable to Nasdaq and non-GAAP diluted earnings per share. Management uses this non-GAAP information internally, along with U.S. GAAP information, in evaluating our performance and in making financial and operational decisions. We believe our presentation of these measures provides investors with greater transparency and supplemental data relating to our financial condition and results of operations. In addition, we believe the presentation of these measures is useful to investors for period-to-period comparisons of our ongoing operating performance.
These measures are not in accordance with, or an alternative to, U.S. GAAP, and may be different from non-GAAP measures used by other companies. Investors should not rely on any single financial measure when evaluating our business. We recommend investors review the U.S. GAAP financial measures included in this Quarterly Report on Form 10-Q, including our condensed consolidated financial statements and the notes thereto. When viewed in conjunction with our U.S. GAAP results and the accompanying reconciliation, we believe these non-GAAP measures provide greater transparency and a more complete understanding of factors affecting our business than U.S. GAAP measures alone.
We understand that analysts and investors regularly rely on non-GAAP financial measures, such as non-GAAP net income attributable to Nasdaq and non-GAAP diluted earnings per share, to assess operating performance. We use non-GAAP net income attributable to Nasdaq and non-GAAP diluted earnings per share because they highlight trends more clearly in our business that may not otherwise be apparent when relying solely on U.S. GAAP financial measures, since these measures eliminate from our results specific financial items that have less bearing on our ongoing operating performance. Non-GAAP net income attributable to Nasdaq for the periods presented below is calculated by adjusting for the following items:
Amortization expense of acquired intangible assets:
We amortize intangible assets acquired in connection with various acquisitions. Intangible asset amortization expense can vary from period to period due to episodic acquisitions completed, rather than from our ongoing business operations. As such, if intangible asset amortization is included in performance measures, it is more difficult to assess the day-to-day operating performance of the businesses, the relative operating performance of the businesses between periods, and the earnings power of Nasdaq. Performance measures excluding intangible asset amortization therefore provide investors with a more useful representation of our businesses’ ongoing activity in each period.
Merger and strategic initiatives expense:
We have pursued various strategic initiatives and completed acquisitions and divestitures in recent years which have resulted in expenses which would not have otherwise been incurred. These expenses generally include integration costs, as well as legal, due diligence and other third party transaction costs. The frequency and the amount of such expenses vary significantly based on the size, timing and complexity of the transaction. Accordingly, we exclude these costs for purposes of calculating non-GAAP measures which provide a more meaningful analysis of Nasdaq’s ongoing operating performance or comparisons in Nasdaq’s performance between periods.
Net Income from Unconsolidated Investee:
See “OCC Capital Plan,” of Note 8, “Investments,” for further discussion. Our income on this investment will vary significantly compared to prior years due to the disapproval of the OCC's capital plan. Accordingly, we will exclude this income from current and prior periods for purposes of calculating non-GAAP measures which provide a more meaningful analysis of Nasdaq’s ongoing operating performance or comparisons in Nasdaq’s performance between periods.
Other significant items:
We have excluded certain other charges or gains, including certain tax items, that are the result of other non-comparable events to measure operating performance. We believe the exclusion of such amounts allows management and investors to better understand the ongoing financial results of Nasdaq.
For the three months ended
March 31, 2019
, other significant items primarily included a pre-tax gain of
$27 million
, net of disposal costs, on the sale of our BWise enterprise governance, risk and compliance software platform.
Significant tax items:
The non-GAAP adjustment to the income tax provision includes the tax impact of each non-GAAP adjustment and for the three months ended March 31, 2019 also includes a tax benefit of $10 million related to capital distributions from the OCC. See “OCC Capital Plan,” of Note 8, “Investments,” for further discussion, and:
|
•
|
Excess tax benefits related to employee share-based compensation reflects the recognition of income tax effects of share-based awards when awards vest or are settled. This item is subject to volatility and will vary based on the timing of the vesting of employee share-based compensation arrangements and fluctuation in our stock price.
|
|
•
|
The impact of enacted U.S. tax legislation is related to the Tax Cuts and Jobs Act which was enacted on December 22, 2017. For the three months ended
March 31, 2018
, we recorded an increase to tax expense of $5 million, which reflected the reduced federal tax benefit associated with state unrecognized tax benefits.
|
39
The following table represents reconciliations between U.S. GAAP net income attributable to Nasdaq and diluted earnings per share and non-GAAP net income attributable to Nasdaq and diluted earnings per share:
|
|
Three Months Ended March 31, 2019
|
Three Months Ended March 31, 2018
|
||||||||||||||
|
|
Net Income
|
Diluted Earnings Per Share
|
Net Income
|
Diluted Earnings Per Share
|
||||||||||||
|
|
(in millions, except share and per share amounts)
|
(in millions, except share and per share amounts)
|
||||||||||||||
|
U.S. GAAP net income attributable to Nasdaq and diluted earnings per share
|
$
|
247
|
|
$
|
1.48
|
|
$
|
177
|
|
$
|
1.05
|
|
||||
|
Non-GAAP adjustments:
|
||||||||||||||||
|
Amortization expense of acquired intangible assets
|
26
|
|
0.16
|
|
28
|
|
0.17
|
|
||||||||
|
Merger and strategic initiatives expense
|
9
|
|
0.05
|
|
10
|
|
0.06
|
|
||||||||
|
Net gain on divestiture of business
|
(27
|
)
|
(0.16
|
)
|
—
|
|
—
|
|
||||||||
|
Net income from unconsolidated investee
|
(45
|
)
|
(0.27
|
)
|
(2
|
)
|
(0.01
|
)
|
||||||||
|
Other
|
2
|
|
0.01
|
|
2
|
|
0.01
|
|
||||||||
|
Total non-GAAP adjustments
|
(35
|
)
|
(0.21
|
)
|
38
|
|
0.23
|
|
||||||||
|
Adjustment to the income tax provision to reflect non-GAAP adjustments and other tax items
|
(4
|
)
|
(0.03
|
)
|
(8
|
)
|
(0.06
|
)
|
||||||||
|
Impact of enacted U.S. tax legislation
|
—
|
|
—
|
|
5
|
|
0.03
|
|
||||||||
|
Excess tax benefits related to employee share-based compensation
|
(4
|
)
|
(0.02
|
)
|
(5
|
)
|
(0.03
|
)
|
||||||||
|
Total non-GAAP tax adjustments
|
(8
|
)
|
(0.05
|
)
|
(8
|
)
|
(0.06
|
)
|
||||||||
|
Total non-GAAP adjustments, net of tax
|
(43
|
)
|
(0.26
|
)
|
30
|
|
0.17
|
|
||||||||
|
Non-GAAP net income attributable to Nasdaq and diluted earnings per share
|
$
|
204
|
|
$
|
1.22
|
|
$
|
207
|
|
$
|
1.22
|
|
||||
|
Weighted-average common shares outstanding for diluted earnings per share
|
167,026,755
|
|
168,992,539
|
|
||||||||||||
* * * * * *
Liquidity and Capital Resources
Historically, we have funded our operating activities and met our commitments through cash generated by operations, augmented by the periodic issuance of our common stock and debt. Currently, our cost and availability of funding remain healthy.
In March 2019, we used net proceeds from the sale of commercial paper and cash on hand to redeem all of our 2019 Notes. In April 2019, we issued the 2029 Notes. See “1.75% Senior Unsecured Notes Due 2029,” of Note 10, “Debt Obligations,” to the condensed consolidated financial statements for further discussion of the 2029 Notes.
In April 2017, we entered into the 2017 Credit Facility which replaced a former credit facility. We also entered into a commercial paper program which enables us to borrow efficiently at reasonable short-term interest rates and is supported by our 2017 Credit Facility. See “Commercial Paper Program,” and “2017 Credit Facility,” of Note 10, “Debt Obligations,” to the condensed consolidated financial statements for further discussion.
As of
March 31, 2019
, no amounts were outstanding on the 2017 Credit Facility. The
$3 million
balance represents unamortized debt issuance costs. Of the $1 billion that is available for borrowing,
$541 million
provides liquidity support for the commercial paper program and for a letter of credit. As such, as of
March 31, 2019
, the total remaining amount available under the 2017 Credit Facility was
$459 million
.
As part of the purchase price consideration of a prior acquisition, Nasdaq has contingent future obligations to issue 992,247 shares of Nasdaq common stock. See “Non-Cash Contingent Consideration,” of Note 18, “Commitments, Contingencies and Guarantees,” to the condensed consolidated financial statements for further discussion.
In the near term, we expect that our operations and the availability under our revolving credit commitment and commercial paper program will provide sufficient cash to fund our operating expenses, capital expenditures, debt repayments, any share repurchases, and any dividends.
The value of various assets and liabilities, including cash and cash equivalents, receivables, accounts payable and accrued expenses, the current portion of long-term debt and commercial paper can fluctuate from month to month. Working capital (calculated as current assets less current liabilities) was $
(905) million
as of
March 31, 2019
, compared with $
(200) million
as
40
of
December 31, 2018
, a decrease of $
705 million
.
Current asset balance changes
decreased
working capital by
$1,634 million
, with decreases in default funds and margin deposits, other current assets, cash and cash equivalents, and financial investments, at fair value, partially offset by increases in receivables, net and restricted cash. Current liability balance changes
increased
working capital by
$929 million
, due to decreases in default funds and margin deposits, accrued personnel costs, and Section 31 fees payable to the SEC, partially offset by increases in short-term debt, deferred revenue, other current liabilities, and accounts payable and accrued expenses.
Principal factors that could affect the availability of our internally-generated funds include:
|
•
|
deterioration of our revenues in any of our business segments;
|
|
•
|
changes in regulatory and working capital requirements; and
|
|
•
|
an increase in our expenses.
|
Principal factors that could affect our ability to obtain cash from external sources include:
|
•
|
operating covenants contained in our credit facilities that limit our total borrowing capacity;
|
|
•
|
increases in interest rates under our credit facilities;
|
|
•
|
credit rating downgrades, which could limit our access to additional debt;
|
|
•
|
a decrease in the market price of our common stock; and
|
|
•
|
volatility or disruption in the public debt and equity markets.
|
The following sections discuss the effects of changes in our financial assets, debt obligations, regulatory capital requirements, and cash flows on our liquidity and capital resources.
Financial Assets
The following table summarizes our financial assets:
|
|
March 31, 2019
|
December 31, 2018
|
||||||
|
|
(in millions)
|
|||||||
|
Cash and cash equivalents
|
$
|
472
|
|
$
|
545
|
|
||
|
Restricted cash
|
67
|
|
41
|
|
||||
|
Financial investments, at fair value
|
220
|
|
268
|
|
||||
|
Total financial assets
|
$
|
759
|
|
$
|
854
|
|
||
Cash and Cash Equivalents and Restricted Cash
Cash and cash equivalents includes all non-restricted cash in banks and highly liquid investments with original maturities of 90 days or less at the time of purchase. The balance retained in cash and cash equivalents is a function of anticipated or possible short-term cash needs, prevailing interest rates, our investment policy, and alternative investment choices. As of
March 31, 2019
, our cash and cash equivalents of
$472 million
were primarily invested in bank deposits, money market funds and commercial paper. In the long-term, we may use both internally generated funds and external sources to satisfy our debt obligations and other long-term liabilities. Cash and cash equivalents as of
March 31, 2019
decreased
$73 million
from
December 31, 2018
, primarily due to:
|
•
|
repayments of long-term debt;
|
|
•
|
cash paid for an acquisition, net of cash and cash equivalents acquired; and
|
|
•
|
cash dividends paid on our common stock, partially offset by;
|
|
•
|
net cash provided by operating activities;
|
|
•
|
proceeds from commercial paper, net; and
|
|
•
|
proceeds from the divestiture of a business.
|
See “Cash Flow Analysis” below for further discussion.
Restricted cash is restricted from withdrawal due to a contractual or regulatory requirements or is not available for general use. Restricted cash was
$67 million
as of
March 31, 2019
and
$41 million
as of
December 31, 2018
, an
increase
of
$26 million
. The
increase
primarily relates to an increase in customer funds held in connection with privately negotiated securities transactions. Restricted cash is classified as restricted cash in the Condensed Consolidated Balance Sheets.
Repatriation of Cash
Our cash and cash equivalents held outside of the U.S. in various foreign subsidiaries totaled $298 million as of
March 31, 2019
and $367 million as of
December 31, 2018
. The remaining balance held in the U.S. totaled $174 million as of
March 31, 2019
and $178 million as of
December 31, 2018
.
Unremitted earnings of subsidiaries outside of the U.S. are used to finance our international operations and are considered to be indefinitely reinvested.
Share Repurchase Program
See “Share Repurchase Program,” of Note 13, “Nasdaq Stockholders’ Equity,” to the condensed consolidated financial statements for further discussion of our share repurchase program.
Cash Dividends on Common Stock
The following table shows quarterly cash dividends paid per common share on our outstanding common stock:
|
2019
|
2018
|
||||||
|
First quarter
|
$
|
0.44
|
|
$
|
0.38
|
|
|
See “Cash Dividends on Common Stock,” of Note 13, “Nasdaq Stockholders’ Equity,” to the condensed consolidated financial statements for further discussion of the dividends.
Financial Investments, at Fair Value
Our financial investments, at fair value totaled
$220 million
as of
March 31, 2019
and
$268 million
as of
December 31, 2018
and are primarily comprised of trading securities, mainly highly rated European government debt securities. Of these securities,
41
$194 million
as of
March 31, 2019
and
$166 million
as of
December 31, 2018
are assets primarily utilized to meet regulatory capital requirements, mainly for our clearing operations at Nasdaq Clearing. See Note 8, “Investments,” to the condensed consolidated financial statements for further discussion of our trading investment securities.
* * * * * *
Debt Obligations
The following table summarizes our debt obligations by contractual maturity:
|
|
Maturity Date
|
March 31, 2019
|
December 31, 2018
|
|||||||
|
|
|
(in millions)
|
||||||||
|
Short-term debt:
|
||||||||||
|
Commercial paper
|
Weighted-average maturity of 2 days
|
$
|
540
|
|
$
|
275
|
|
|||
|
Senior unsecured floating rate notes
|
Repaid March 2019
|
—
|
|
500
|
|
|||||
|
5.55% senior unsecured notes
(1)
|
January 2020
|
599
|
|
599
|
|
|||||
|
$400 million senior unsecured term loan facility
|
November 2019
|
100
|
|
100
|
|
|||||
|
Total short-term debt
|
1,239
|
|
1,474
|
|
||||||
|
Long-term debt:
|
||||||||||
|
3.875% senior unsecured notes
|
June 2021
|
671
|
|
686
|
|
|||||
|
$1 billion revolving credit commitment
|
April 2022
|
(3
|
)
|
(4
|
)
|
|||||
|
1.75% senior unsecured notes
|
May 2023
|
667
|
|
682
|
|
|||||
|
4.25% senior unsecured notes
|
June 2024
|
497
|
|
497
|
|
|||||
|
3.85% senior unsecured notes
|
June 2026
|
496
|
|
496
|
|
|||||
|
Total long-term debt
|
|
2,328
|
|
2,357
|
|
|||||
|
Total debt obligations
|
$
|
3,567
|
|
$
|
3,831
|
|
||||
____________
|
(1)
|
Balance was reclassified to short-term debt as of March 31, 2019.
|
In addition to the $1 billion revolving credit commitment, we also have other credit facilities primarily related to our Nasdaq Clearing operations in order to provide further liquidity. Other credit facilities, which are available in multiple currencies, totaled
$210 million
as of
March 31, 2019
and
$220 million
as of
December 31, 2018
, in available liquidity, none of which was utilized.
As of
March 31, 2019
, we were in compliance with the covenants of all of our debt obligations.
See Note 10, “Debt Obligations,” to the condensed consolidated financial statements for further discussion of our debt obligations.
* * * * * *
Regulatory Capital Requirements
Clearing Operations Regulatory Capital Requirements
We are required to maintain minimum levels of regulatory capital for the clearing operations of Nasdaq Clearing. The level of regulatory capital required to be maintained is dependent upon many factors, including market conditions and creditworthiness of the counterparty. As of
March 31, 2019
, our required regulatory capital of
$151 million
is comprised of highly rated European government debt securities that are included in financial investments, at fair value in the Condensed Consolidated Balance Sheets.
Broker-Dealer Net Capital Requirements
Our broker-dealer subsidiaries, Nasdaq Execution Services, Execution Access, NPM Securities, SMTX, and Nasdaq Capital Markets Advisory, are subject to regulatory requirements intended to ensure their general financial soundness and liquidity. These requirements obligate these subsidiaries to comply with minimum net capital requirements. As of March 31, 2019, the combined required minimum net capital totaled
$1 million
and the combined excess capital totaled $52 million. The required minimum net capital is included in restricted cash in the Condensed Consolidated Balance Sheets.
Nordic and Baltic Exchange Regulatory Capital Requirements
The entities that operate trading venues in the Nordic and Baltic countries are each subject to local regulations and are required to maintain regulatory capital intended to ensure their general financial soundness and liquidity. As of
March 31, 2019
, our required regulatory capital of
$33 million
is primarily invested in European mortgage bonds that are included in financial investments, at fair value and restricted cash in the Condensed Consolidated Balance Sheets.
Other Capital Requirements
We operate several other businesses which are subject to local regulation and are required to maintain certain levels of
42
regulatory capital. As of
March 31, 2019
, other required regulatory capital was
$16 million
and was primarily included in restricted cash and financial investments, at fair value in the Condensed Consolidated Balance Sheets.
* * * * * *
Cash Flow Analysis
The following table summarizes the changes in cash flows:
|
|
Three Months Ended March 31,
|
Percentage Change
|
|||||||||
|
|
2019
|
2018
|
|||||||||
|
Net cash provided by (used in):
|
(in millions)
|
|
|||||||||
|
Operating activities
|
$
|
337
|
|
$
|
375
|
|
(10.1
|
)%
|
|||
|
Investing activities
|
(74
|
)
|
(8
|
)
|
825.0
|
%
|
|||||
|
Financing activities
|
(302
|
)
|
(337
|
)
|
(10.4
|
)%
|
|||||
|
Effect of exchange rate changes on cash and cash equivalents and restricted cash
|
(8
|
)
|
—
|
|
N/M
|
|
|||||
|
Net increase in cash and cash equivalents and restricted cash
|
(47
|
)
|
30
|
|
(256.7
|
)%
|
|||||
|
Cash and cash equivalents and restricted cash at beginning of period
|
586
|
|
399
|
|
46.9
|
%
|
|||||
|
Cash and cash equivalents and restricted cash at end of period
|
$
|
539
|
|
$
|
429
|
|
25.6
|
%
|
|||
Net Cash Provided by Operating Activities
Net cash provided by operating activities
decreased
$38 million
for the three months ended
March 31, 2019
compared with the same period in 2018. The decrease was primarily driven by relatively flat operating income due to a decrease in our equity derivative trading and clearing, cash equity trading, and FICC businesses due to lower industry trading volumes, higher performance incentive payments made in the three months ended March 31, 2019 for the 2018 performance period as compared to the same period in 2018 for the 2017 performance period, and the sale of our Public Relations Solutions and Digital Media Services businesses in April 2018.
Net Cash Used in Investing Activities
Net cash used in investing activities
increased
$66 million
for the three months ended
March 31, 2019
compared with the same period in 2018. The increase was primarily due to cash used for an acquisition of a business, net of cash and cash equivalents acquired, partially offset by an increase in cash received from a divestiture of a business and an increase in cash received from the sales of securities, net.
Net Cash Used in Financing Activities
Net cash used in financing activities
decreased
$35 million
for the three months ended
March 31, 2019
compared with the same period in 2018. The decrease was primarily due to an increase in proceeds from commercial paper, net, a decrease in repurchases of common stock, an increase in proceeds of customer funds, an increase in proceeds from long-term debt issuances and a decrease in payments related to employee shares withheld for taxes, partially offset by an increase in repayments of long term debt and an increase in dividends paid.
See Note 5, “Acquisitions and Divestitures,” to the condensed consolidated financial statements for further discussion of our divestiture and acquisitions.
See Note 10, “Debt Obligations,” to the condensed consolidated financial statements for further discussion of our debt obligations.
See “Share Repurchase Program,” and “Cash Dividends on Common Stock,” of Note 13, “Nasdaq Stockholders’ Equity,” to the condensed consolidated financial statements for further discussion of our share repurchase program and cash dividends paid on our common stock.
Contractual Obligations and Contingent Commitments
In the first quarter of 2019, there were no significant changes to our contractual obligations and commercial commitments from those disclosed in “Part I. Item 7. “Management’s Discussion and Analysis of Financial Condition and Results of Operations” in our Annual Report on Form 10-K for the fiscal year ended December 31, 2018 as filed with the SEC on February 22, 2019.
Off-Balance Sheet Arrangements
For discussion of off-balance sheet arrangements see:
|
•
|
Note 16, “Clearing Operations,” to the condensed consolidated financial statements for further discussion of our non-cash default fund contributions and margin deposits received for clearing operations; and
|
|
•
|
Note 18, “Commitments, Contingencies and Guarantees,” to the condensed consolidated financial statements for further discussion of:
|
|
•
|
Guarantees issued and credit facilities available;
|
|
•
|
Other guarantees;
|
|
•
|
Non-cash contingent consideration;
|
43
|
•
|
Escrow agreements;
|
|
•
|
Routing brokerage activities;
|
|
•
|
Offer for Oslo Børs VPS;
|
|
•
|
Legal and regulatory matters; and
|
|
•
|
Tax audits.
|
Item 3. Quantitative and Qualitative Disclosures About Market Risk
Market risk represents the potential for losses that may result from changes in the market value of a financial instrument due to changes in market conditions. As a result of our operating, investing and financing activities, we are exposed to market risks such as interest rate risk and foreign currency exchange rate risk. We are also exposed to credit risk as a result of our normal business activities.
We have implemented policies and procedures to measure, manage, monitor and report risk exposures, which are reviewed regularly by management and the board of directors. We identify risk exposures and monitor and manage such risks on a daily basis.
We perform sensitivity analyses to determine the effects of market risk exposures. We may use derivative instruments solely to hedge financial risks related to our financial positions or risks that are incurred during the normal course of business. We do not use derivative instruments for speculative purposes.
Interest Rate Risk
We are subject to the risk of fluctuating interest rates in the normal course of business. Our exposure to market risk for
changes in interest rates relates primarily to our financial investments and debt obligations which are discussed below.
Financial Investments
As of
March 31, 2019
, our investment portfolio was primarily comprised of trading securities, mainly highly rated European government debt securities, which pay a fixed rate of interest. These securities are subject to interest rate risk and will decrease in value if market interest rates increase. If market interest rates were to increase immediately and uniformly by 100 basis points from levels as of
March 31, 2019
, the fair value of this portfolio would have declined by
$4 million
.
Debt Obligations
As of
March 31, 2019
, substantially all of our debt obligations are fixed-rate obligations. While changes in interest rates will have no impact on the interest we pay on fixed-rate obligations, we are exposed to changes in interest rates as a result of the borrowings under our 2017 Credit Facility and 2016 Credit Facility, and amounts outstanding from the sale of commercial paper under our commercial paper program, all of which have variable interest rates. As of
March 31, 2019
, we had principal amounts outstanding of
$100 million
under the 2016 Credit Facility and $540 million of commercial paper. A hypothetical 100 basis points increase in interest rates on our outstanding 2016 Credit Facility and our outstanding commercial paper would increase annual interest expense by approximately
$6 million
based on borrowings as of
March 31, 2019
.
* * * * * *
Foreign Currency Exchange Rate Risk
As a leading global exchange group, we are subject to foreign currency transaction risk. Our primary exposure to foreign currency denominated revenues less transaction-based expenses and operating income for the three months ended
March 31, 2019
is presented in the following table:
|
|
Euro
|
Swedish Krona
|
Other Foreign Currencies
|
U.S. Dollar
|
Total
|
|||||||||||||||
|
|
(in millions, except currency rate)
|
|||||||||||||||||||
|
Three Months Ended March 31, 2019
|
|
|
|
|
|
|||||||||||||||
|
Average foreign currency rate to the U.S. dollar
|
1.1356
|
|
0.1090
|
|
#
|
|
N/A
|
|
N/A
|
|
||||||||||
|
Percentage of revenues less transaction-based expenses
|
8.2
|
%
|
8.1
|
%
|
5.0
|
%
|
78.7
|
%
|
100.0
|
%
|
||||||||||
|
Percentage of operating income
|
12.9
|
%
|
(1.3
|
)%
|
(7.0
|
)%
|
95.4
|
%
|
100.0
|
%
|
||||||||||
|
Impact of a 10% adverse currency fluctuation on revenues less transaction-based expenses
|
$
|
(5
|
)
|
$
|
(5
|
)
|
$
|
(3
|
)
|
$
|
—
|
|
$
|
(13
|
)
|
|||||
|
Impact of a 10% adverse currency fluctuation on operating income
|
$
|
(4
|
)
|
$
|
—
|
|
$
|
(2
|
)
|
$
|
—
|
|
$
|
(6
|
)
|
|||||
____________
|
#
|
Represents multiple foreign currency rates.
|
|
N/A
|
Not applicable.
|
* * * * * *
Our investments in foreign subsidiaries are exposed to volatility in currency exchange rates through translation of the foreign
subsidiaries’ net assets or equity to U.S. dollars. Substantially all of our foreign subsidiaries operate in functional currencies other than the U.S. dollar. Fluctuations in currency exchange
44
rates may create volatility in our results of operations as we are required to translate the balance sheets and operational results of these foreign currency denominated subsidiaries into U.S. dollars for consolidated reporting. The translation of foreign subsidiaries’ non-U.S. dollar balance sheets into U.S. dollars for consolidated reporting results in a cumulative translation adjustment which is recorded in accumulated other comprehensive loss within stockholders’ equity in the Condensed Consolidated Balance Sheets.
Our primary exposure to net assets in foreign currencies as of
March 31, 2019
is presented in the following table:
|
|
Net Assets
|
Impact of a 10% Adverse Currency Fluctuation
|
||||||
|
|
(in millions)
|
|||||||
|
Swedish Krona
(1)
|
$
|
3,411
|
|
$
|
(341
|
)
|
||
|
Norwegian Krone
|
174
|
|
(17
|
)
|
||||
|
Canadian Dollar
|
123
|
|
(12
|
)
|
||||
|
British Pound
|
216
|
|
(22
|
)
|
||||
|
Euro
|
26
|
|
(3
|
)
|
||||
|
Australian Dollar
|
105
|
|
(10
|
)
|
||||
____________
|
(1)
|
Includes goodwill of
$2,426 million
and intangible assets, net of
$617 million
.
|
Credit Risk
Credit risk is the potential loss due to the default or deterioration in credit quality of customers or counterparties. We are exposed to credit risk from third parties, including customers, counterparties and clearing agents. These parties may default on their obligations to us due to bankruptcy, lack of liquidity, operational failure or other reasons. We limit our exposure to credit risk by evaluating the counterparties with which we make investments and execute agreements. The financial investment portfolio objective is to invest in securities to preserve principal while maximizing yields, without significantly increasing risk. Credit risk associated with investments is minimized substantially by ensuring that these financial assets are placed with governments which have investment grade ratings, well-capitalized financial institutions and other creditworthy counterparties.
Our subsidiary, Nasdaq Execution Services, may be exposed to credit risk, due to the default of trading counterparties, in connection with the routing services it provides for our trading customers. System trades in cash equities routed to other market centers for members of our cash equity exchanges are routed by Nasdaq Execution Services for clearing to the NSCC. In this function, Nasdaq Execution Services is to be neutral by the end of the trading day, but may be exposed to intraday risk if a trade extends beyond the trading day and into the next day, thereby leaving Nasdaq Execution Services susceptible to counterparty risk in the period between accepting the trade and routing it to the clearinghouse. In this interim period, Nasdaq Execution Services is not novating like a clearing broker but instead is subject to the short-term risk of counterparty failure before the clearinghouse enters the transaction. Once the clearinghouse
officially accepts the trade for novation, Nasdaq Execution Services is legally removed from trade execution risk. However, Nasdaq has membership obligations to NSCC independent of Nasdaq Execution Services’ arrangements.
Pursuant to the rules of the NSCC and Nasdaq Execution Services’ clearing agreement, Nasdaq Execution Services is liable for any losses incurred due to a counterparty or a clearing agent’s failure to satisfy its contractual obligations, either by making payment or delivering securities. Adverse movements in the prices of securities that are subject to these transactions can increase our credit risk. However, we believe that the risk of material loss is limited, as Nasdaq Execution Services’ customers are not permitted to trade on margin and NSCC rules limit counterparty risk on self-cleared transactions by establishing credit limits and capital deposit requirements for all brokers that clear with NSCC. Historically, Nasdaq Execution Services has never incurred a liability due to a customer’s failure to satisfy its contractual obligations as counterparty to a system trade. Credit difficulties or insolvency, or the perceived possibility of credit difficulties or insolvency, of one or more larger or visible market participants could also result in market-wide credit difficulties or other market disruptions.
Execution Access is an introducing broker which operates the trading platform for our Fixed Income business to trade in U.S. Treasury securities. Execution Access has a clearing arrangement with Industrial and Commercial Bank of China Financial Services LLC, or ICBC. As of
March 31, 2019
, we have contributed
$15 million
of clearing deposits to ICBC in connection with this clearing arrangement. These deposits are recorded in other current assets in our Consolidated Balance Sheets. Some of the trading activity in Execution Access is cleared by ICBC through the Fixed Income Clearing Corporation, with ICBC acting as agent. Execution Access assumes the counterparty risk of clients that do not clear through the Fixed Income Clearing Corporation. Counterparty risk of clients exists for Execution Access between the trade date and settlement date of the individual transactions, which is at least one business day (or more, if specified by the U.S. Treasury issuance calendar). Counterparties that do not clear through the Fixed Income Clearing Corporation are subject to a credit due diligence process and may be required to post collateral, provide principal letters, or provide other forms of credit enhancement to Execution Access for the purpose of mitigating counterparty risk. Daily position trading limits are also enforced for such counterparties.
We have credit risk related to transaction and subscription-based revenues that are billed to customers on a monthly or quarterly basis, in arrears. Our potential exposure to credit losses on these transactions is represented by the receivable balances in our Condensed Consolidated Balance Sheets. We review and evaluate changes in the status of our counterparties’ creditworthiness. Credit losses such as those described above could adversely affect our consolidated financial position and results of operations.
We also are exposed to credit risk through our clearing operations with Nasdaq Clearing. See Note 16, “Clearing
45
Operations,” to the condensed consolidated financial statements for further discussion. Our clearinghouse holds material amounts of clearing member cash deposits which are held or invested primarily to provide security of capital while minimizing credit, market and liquidity risks. While we seek to achieve a reasonable rate of return, we are primarily concerned with preservation of capital and managing the risks associated with these deposits. As the clearinghouse may pass on interest revenues (minus costs) to the members, this could include negative or reduced yield due to market conditions. The following is a summary of the risks associated with these deposits and how these risks are mitigated.
|
•
|
Credit Risk.
When the clearinghouse has the ability to hold cash collateral at a central bank, the clearinghouse utilizes its access to the central bank system to minimize credit risk exposures. When funds are not held at a central bank, we seek to substantially mitigate credit risk by ensuring that investments are primarily placed in highly rated government and supranational debt instruments.
|
|
•
|
Liquidity Risk.
Liquidity risk is the risk a clearinghouse may not be able to meet its payment obligations in the right currency, in the right place and the right time. To mitigate this risk, the clearinghouse monitors liquidity requirements closely and maintains funds and assets in a manner which
|
minimizes the risk of loss or delay in the access by the clearinghouse to such funds and assets. For example, holding funds with a central bank where possible or investing in highly liquid government or supranational debt instruments serves to reduce liquidity risks.
|
•
|
Interest Rate Risk.
Interest rate risk is the risk that interest rates rise causing the value of purchased securities to decline. If we were required to sell securities prior to maturity, and interest rates had risen, the sale of the securities might be made at a loss relative to the latest market price. Our clearinghouse seeks to manage this risk by making short term investments of members' cash deposits. In addition, the clearinghouse investment guidelines allow for direct purchases or repurchase agreements of high quality sovereign debt (for example, European government and U.S. Treasury securities), central bank certificates and supranational debt instruments with short dated maturities.
|
|
•
|
Security Issuer Risk.
Security issuer risk is the risk that an issuer of a security defaults on its payment when the security matures. This risk is mitigated by limiting allowable investments and collateral under reverse repurchase agreements to high quality sovereign, government agency or supranational debt instruments.
|
* * * * * *
Item 4. Controls and
Procedures
(a)
Disclosure controls and procedures.
Nasdaq’s management, with the participation of Nasdaq’s President and Chief Executive Officer, and Executive Vice President, Accounting and Corporate Strategy and Chief Financial Officer, has evaluated the effectiveness of Nasdaq’s disclosure controls and procedures (as defined in Rule 13a-15(e) and Rule 15d-15(e) under the Exchange Act) as of the end of the period covered by this report. Based upon that evaluation, Nasdaq’s President and Chief Executive Officer and Executive Vice President, Accounting and Corporate Strategy and Chief Financial Officer, have concluded that, as of the end of such period, Nasdaq’s disclosure controls and procedures are effective.
(b)
Internal control over financial reporting
. There have been no changes in Nasdaq’s internal control over financial reporting (as defined in Rule 13a-15(f) and Rule 15d-15(f) under the Exchange Act) that occurred during the quarter ended
March 31, 2019
that have materially affected, or are reasonably likely to materially affect, Nasdaq’s internal control over financial reporting.
PART II - OTHER INFORMATION
Item 1. Legal
Proceedings
See “Legal and Regulatory Matters - Litigation,” of Note 18, “Commitments, Contingencies and Guarantees,” to the condensed consolidated financial statements, which is incorporated herein by reference.
Item 1A. Risk Factors
In addition to the other information set forth in this Quarterly Report on Form 10-Q, you should carefully consider the factors discussed under “Risk Factors” in our Annual Report on Form 10-K for the fiscal year ended December 31, 2018 as filed with the SEC on February 22, 2019. These risks could materially and adversely affect our business, financial condition and results of operations. The risks and uncertainties in our Form 10-K and Form 10-Q are not the only ones facing us. Additional risks and uncertainties not presently known to us or that we currently believe to be immaterial may also adversely affect our business
.
Item 2. Unregistered Sales of Equity Securities and Use of Proceeds
Issuer Purchases of Equity Securities
Share Repurchase Program
See “Share Repurchase Program,” of Note 13, “Nasdaq Stockholders’ Equity,” to the condensed consolidated financial statements for further discussion of our share repurchase program.
46
Employee Transactions
During the fiscal quarter ended
March 31, 2019
, we purchased shares from employees in connection with the settlement of employee tax withholding obligations arising from the vesting of restricted stock and PSUs. The table below represents repurchases made by or on behalf of us or any “affiliated purchaser” of our common stock during the fiscal quarter ended
March 31, 2019
:
|
Period
|
(a) Total Number of Shares Purchased
|
(b) Average Price Paid Per Share
|
(c) Total Number of Shares Purchased as Part of Publicly Announced Plans or Programs
|
(d) Maximum Dollar Value of Shares that May Yet Be Purchased Under the Plans or Programs (in million)
|
||||||||||
|
January 2019
|
|
|
|
|||||||||||
|
Share repurchase program
|
—
|
|
$
|
—
|
|
—
|
|
$
|
322
|
|
||||
|
Employee transactions
|
186,831
|
|
$
|
84.60
|
|
N/A
|
|
N/A
|
|
|||||
|
February 2019
|
|
|
|
|
|
|
|
|
||||||
|
Share repurchase program
|
—
|
|
$
|
—
|
|
—
|
|
$
|
322
|
|
||||
|
Employee transactions
|
3,025
|
|
$
|
87.37
|
|
N/A
|
|
N/A
|
|
|||||
|
March 2019
|
|
|
|
|
|
|
|
|
||||||
|
Share repurchase program
|
—
|
|
$
|
—
|
|
—
|
|
$
|
322
|
|
||||
|
Employee transactions
|
156,835
|
|
$
|
91.97
|
|
N/A
|
|
N/A
|
|
|||||
|
Total Quarter Ended March 31, 2019
|
|
|
|
|
|
|
|
|
||||||
|
Share repurchase program
|
—
|
|
$
|
—
|
|
—
|
|
$
|
322
|
|
||||
|
Employee transactions
|
346,691
|
|
$
|
87.96
|
|
N/A
|
|
N/A
|
|
|||||
Item 4. Mine Safety Disclosures
Not applicable.
Item 5. Other
Information
None.
Item 6. Exhibits
|
Exhibit Number
|
|
|
|
|
||
|
Transaction Agreement, dated as of January 29, 2019, between Oslo Børs VPS Holding ASA and Nasdaq AB.
|
||
|
Certification of President and Chief Executive Officer pursuant to Section 302 of the Sarbanes-Oxley Act of 2002 (“Sarbanes-Oxley”).
|
||
|
Certification of Executive Vice President, Accounting and Corporate Strategy and Chief Financial Officer pursuant to Section 302 of Sarbanes-Oxley.
|
||
|
Certifications Pursuant to 18 U.S.C. Section 1350, as adopted pursuant to Section 906 of Sarbanes-Oxley.
|
||
|
101.INS
|
XBRL Instance Document.*
|
|
|
101.SCH
|
XBRL Taxonomy Extension Schema.
|
|
|
101.CAL
|
XBRL Taxonomy Extension Calculation Linkbase.
|
|
|
101.DEF
|
Taxonomy Extension Definition Linkbase.
|
|
|
101.LAB
|
XBRL Taxonomy Extension Label Linkbase.
|
|
|
101.PRE
|
XBRL Taxonomy Extension Presentation Linkbase.
|
|
_______
|
*
|
The following materials from the Nasdaq, Inc. Quarterly Report on Form 10-Q for the three months ended March 31, 2019,
|
47
formatted in XBRL (eXtensible Business Reporting Language): (i) Condensed Consolidated Balance Sheets as of March 31, 2019 and December 31, 2018; (ii) Condensed Consolidated Statements of Income for the three months ended March 31, 2019 and 2018; (iii) Condensed Consolidated Statements of Comprehensive Income (Loss) for the three months ended March 31, 2019 and 2018; (iv) Condensed Consolidated Statements of Changes in Equity for the three months ended March 31, 2019 and 2018; (v) Condensed Consolidated Statements of Cash Flows for the three months ended March 31, 2019 and 2018; and (vi) notes to condensed consolidated financial statements.
48
SIGNATURES
Pursuant to the requirements of the Securities Exchange Act of 1934, the registrant has duly caused this report to be signed on
its behalf by the undersigned, thereunto duly authorized.
|
|
Nasdaq, Inc.
|
|
||
|
|
(Registrant)
|
|
||
|
Date:
|
May 1, 2019
|
By:
|
/s/ Adena T. Friedman
|
|
|
|
Name:
|
Adena T. Friedman
|
||
|
|
Title:
|
President and Chief Executive Officer
|
||
|
Date:
|
May 1, 2019
|
By:
|
/s/ Michael Ptasznik
|
|
|
|
Name:
|
Michael Ptasznik
|
||
|
|
Title:
|
Executive Vice President, Accounting and Corporate Strategy and Chief Financial Officer
|
||
49
TABLE OF CONTENTS
Part I - Financial InformationItem 1. Financial StatementsItem 2. Management S Discussion and Analysis Of Financial Condition and Results Of OperationsItem 2. Management S Discussion and Analysis Of Financial Condition and Results OfItem 3. Quantitative and Qualitative Disclosures About Market RiskItem 4. Controls and ProceduresItem 4. Controls andPart II - Other InformationItem 1. Legal ProceedingsItem 1. LegalItem 1A. Risk FactorsItem 2. Unregistered Sales Of Equity Securities and Use Of ProceedsItem 3. Defaults Upon Senior SecuritiesnoneItem 3. Defaults Upon Senior SecuritiesItem 4. Mine Safety DisclosuresItem 5. Other InformationItem 5. OtherItem 6. Exhibits