ENDRA LIFE SCIENCES INC.
10-Ks and 10-Qs
|
|
|
|
|
|
|
|
|
|
|
|
|
|
|
|
|
|
|
|
|
|
|
|
|
|
|
|
|
|
|
|
|
|
|
|
|
|
|
|
|
|
|
|
|
|
|
|
|
|
|
|
|
|
|
|
|
|
|
|
|
|
|
|
|
|
|
|
|
|
|
|
|
|
|
|
|
|
|
|
|
|
|
|
|
|
|
|
|
|
|
|
|
|
|
|
|
|
|
|
|
|
|
|
|
|
|
|
|
|
|
|
|
|
|
|
|
|
|
|
|
|
|
|
|
|
|
|
|
|
|
|
|
|
|
|
|
|
|
|
|
|
|
|
|
|
|
|
|
|
|
UNITED STATES
SECURITIES AND EXCHANGE COMMISSION
WASHINGTON, D.C. 20549
FORM 10-K
(Mark
One)
|
☒
|
ANNUAL
REPORT PURSUANT TO SECTION 13 OR 15(d) OF THE SECURITIES EXCHANGE
ACT OF 1934
|
For the
Fiscal Year Ended
December
31, 2017
|
☐
|
TRANSITION
REPORT PURSUANT TO SECTION 13 OR 15(d) OF THE SECURITIES EXCHANGE
ACT OF 1934
|
For the
transition period from __________________ to
__________________
Commission
file number:
001-37969
|
ENDRA Life Sciences Inc.
|
||
|
(Exact Name of
Registrant as Specified in Its Charter)
|
||
|
Delaware
|
|
26-0579295
|
|
(State or Other
Jurisdiction of Incorporation or Organization)
|
|
(I.R.S. Employer
Identification No.)
|
|
|
|
|
|
3600 Green Court, Suite 350, Ann
Arbor, MI
|
|
48105-1570
|
|
(Address of
Principal Executive Offices)
|
|
(Zip
Code)
|
(734) 335-0468
(Registrant’s
telephone number, including area code)
Securities
registered pursuant to Section 12(b) of the Act:
|
Title of each class
|
Name of each exchange on which registered
|
|
Common
Stock, par value $0.0001 per share
|
The
NASDAQ Stock Market LLC
|
|
Warrants,
each to purchase one share of Common Stock
|
The
NASDAQ Stock Market LLC
|
Securities
registered pursuant to Section 12 (g) of the Act: None
Indicate by check
mark if the registrant is a well-known seasoned issuer, as defined
in Rule 405 of the Securities Act.
Yes
☐ No ☒
Indicate by check
mark if the registrant is not required to file reports pursuant to
Section 13 or Section 15(d) of the Act. Yes ☐ No
☒
Indicate by check
mark whether the registrant (1) has filed all reports required to
be filed by Section 13 or 15(d) of the Securities Exchange Act of
1934 during the preceding 12 months (or for such shorter period
that the registrant was required to file such reports), and (2) has
been subject to such filing requirements for the past 90 days. Yes
☒ No ☐
Indicate by check
mark whether the registrant has submitted electronically and posted
on its corporate Web site, if any, every Interactive Data File
required to be submitted and posted pursuant to Rule 405 of
Regulation S-T during the preceding 12 months (or for
such shorter period that the registrant was required to submit and
post such files). Yes ☒ No ☐
Indicate by check
mark if disclosure of delinquent filers pursuant to Item 405 of
Regulation S-K is not contained herein, and will not be contained,
to the best of registrant's knowledge, in definitive proxy or
information statements incorporated by reference in Part III of
this Form 10-K or any amendment to this Form 10-K. ☐
Indicate by check
mark whether the registrant is a large accelerated filer, an
accelerated filer, a non-accelerated filer, a smaller reporting
company or an emerging growth company. See definitions of "large
accelerated filer,” “accelerated filer” and
“smaller reporting company” in Rule 12b-2 of the
Exchange Act. (Check one):
|
Large
accelerated filer ☐
|
Accelerated
filer ☐
|
|
Non-accelerated
filer ☐ (Do not check if a smaller reporting
company)
|
Smaller
reporting company ☒
|
|
Emerging
growth company ☒
|
|
If
an emerging growth company, indicate by check mark if the
registrant has elected not to use the extended transition period
for complying with any new or revised financial accounting
standards provided pursuant to Section 13(a) of the Exchange Act.
☐
Indicate by check
mark whether the registrant is a shell company (as defined in Rule
12b-2 of the Act): Yes ☐ No ☒
The
aggregate market value of voting and non-voting common equity held
by non-affiliates of the registrant, as of June 30, 2017, was
approximately $14,831,809 based on the closing sales price of the
common stock on such date as reported on the NASDAQ Capital
Market.
As of
March 20, 2018, there were 3,923,027 shares of the
registrant’s common stock outstanding.
DOCUMENTS
INCORPORATED BY REFERENCE
None.
ENDRA LIFE SCIENCES INC.
TABLE OF CONTENTS
|
PART
I
|
|
|
Item 1. Business
|
3
|
|
Item
1A. Risk Factors
|
18
|
|
Item
1B. Unresolved Staff Comments
|
39
|
|
Item
2. Properties
|
39
|
|
Item 3. Legal
Proceedings
|
39
|
|
Item
4. Mine Safety Disclosures
|
39
|
|
PART
II
|
|
|
Item
5. Market for Registrant’s Common Equity, Related
Stockholder Matters and Issuer Purchases of Equity
Securities
|
40
|
|
Item
6. Selected Financial Data
|
40
|
|
Item
7. Management's Discussion and Analysis of Financial
Condition and Results of Operations
|
41
|
|
Item
7A. Quantitative and Qualitative Disclosures About
Market Risk.
|
45
|
|
Item 8. Financial
Statements and Supplementary Data.
|
46
|
|
Item 9. Changes
in and Disagreements with Accountants on Accounting and Financial
Disclosure.
|
47
|
|
Item 9A. Controls
and Procedures.
|
48
|
|
Item 9B. Other
Information.
|
48
|
|
PART
III
|
48
|
|
Item 10. Directors,
Executive Officers and Corporate Governance.
|
49
|
|
Item
11. Executive Compensation
|
53
|
|
Item 12. Security
Ownership of Certain Beneficial Owners and Management and Related
Stockholders Matters.
|
56
|
|
Item
13. Certain Relationships and Related Transactions, and
Director Independence
|
57
|
|
Item 14. Principal
Accountant Fees and Services
|
58
|
|
PART
IV
|
|
|
Item 15. Exhibits,
Financial Statements and Schedules
|
59
|
|
Item
16. Form 10-K Summary
|
60
|
CAUTIONARY NOTE REGARDING FORWARD-LOOKING STATEMENTS
This
Annual Report on Form 10-K (this “Annual Report”)
contains “forward-looking statements” within the
meaning of Section 27A of the Securities Act of 1933, as amended,
and Section 21E of the Securities Exchange Act of 1934, as amended,
that are intended to be covered by the “safe harbor”
created by those sections. Forward-looking statements, which are
based on certain assumptions and describe our future plans,
strategies and expectations, can generally be identified by the use
of forward-looking terms such as “believe,”
“expect,” “may,” “will,”
“should,” “would,” “could,”
“seek,” “intend,” “plan,”
“goal,” “project,” “estimate,”
“anticipate,” “strategy”,
“future”, “likely” or other comparable
terms and references to future periods. All statements other than
statements of historical facts included in this Annual Report
regarding our strategies, prospects, financial condition,
operations, costs, plans and objectives are forward-looking
statements. Examples of forward-looking statements include, among
others, statements we make regarding: expectations for revenues,
cash flows and financial performance, the anticipated results of
our development efforts and the timing for receipt of required
regulatory approvals and product launches.
Forward-looking
statements are neither historical facts nor assurances of future
performance. Instead, they are based only on our current beliefs,
expectations and assumptions regarding the future of our business,
future plans and strategies, projections, anticipated events and
trends, the economy and other future conditions. Because
forward-looking statements relate to the future, they are subject
to inherent uncertainties, risks and changes in circumstances that
are difficult to predict and many of which are outside of our
control. Our actual results and financial condition may differ
materially from those indicated in the forward-looking statements.
Therefore, you should not rely on any of these forward-looking
statements. Important factors that could cause our actual results
and financial condition to differ materially from those indicated
in the forward-looking statements include, among others, the
following:
●
our limited
commercial experience, limited cash and history of
losses;
●
our ability to
obtain adequate financing to fund our business operations in the
future;
●
our ability to
achieve profitability;
●
our ability to
develop a commercially feasible application based on our
Thermo-Acoustic Enhanced Ultrasound (“TAEUS”)
technology;
●
market acceptance
of our technology;
●
results of our
human studies, which may be negative or inconclusive;
●
our ability to find
and maintain development partners;
●
our reliance on
collaborations and strategic alliances and licensing
arrangements;
●
the amount and
nature of competition in our industry;
●
our ability to
protect our intellectual property;
●
potential changes
in the healthcare industry or third-party reimbursement
practices;
●
delays and changes
in regulatory requirements, policy and guidelines including
potential delays in submitting required regulatory applications for
CE mark certification or FDA approval;
●
our ability to
obtain CE mark certification and secure required Food and Drug
Administration (“FDA”) and other governmental approvals
for our TAEUS applications;
●
our ability to
comply with regulation by various federal, state, local and foreign
governmental agencies and to maintain necessary regulatory
clearances or approvals; and
●
the other risks and
uncertainties described in the Risk Factors and in
Management’s Discussion and Analysis of Financial Condition
and Results of Operations sections of this Annual
Report.
Any
forward-looking statement made by us in this report is based only
on information currently available to us and speaks only as of the
date on which it is made. We undertake no obligation to publicly
update any forward-looking statement, whether written or oral, that
may be made from time to time, whether as a result of new
information, future developments or otherwise.
2
As used
in this Annual Report, unless the context otherwise requires, the
terms “ENDRA,” “we,” “us,”
“our,” and the “Company” refer to ENDRA
Life Sciences Inc., a Delaware corporation.
Overview
We have
commercialized an enhanced ultrasound technology for the
pre-clinical research market and are leveraging that expertise to
develop technology for increasing the capabilities of clinical
diagnostic ultrasound to broaden patient access to the safe
diagnosis and treatment of a number of significant medical
conditions in circumstances where expensive X-ray computed
tomography, or CT, and magnetic resonance imaging, or MRI,
technology is unavailable or impractical.
Since
2010, we have marketed and sold our Nexus 128 system, which
combines light-based thermoacoustics and ultrasound, to address the
imaging needs of researchers studying disease models in
pre-clinical applications. Building on our expertise in
thermoacoustics, we have developed a next-generation technology
platform — Thermo Acoustic Enhanced Ultrasound, or TAEUS,
which is intended to enhance the capability of clinical ultrasound
technology and support the diagnosis and treatment of a number of
significant medical conditions that require the use of expensive CT
or MRI imaging or where imaging is not practical using existing
technology. We believe that our TAEUS technology, which can be used
with existing ultrasound equipment and incorporated into
next-generation ultrasound systems, has the potential to make
advanced imaging available in certain applications to a wider range
of patients on a more cost-effective basis than is possible using
existing CT and MRI technology. We expect to continue to sell our
Nexus 128 system to maintain a base level of revenue, but believe
the market potential for our clinical systems is much
higher.
Diagnostic Imaging Technologies
Diagnostic
imaging technologies such as CT, MRI and ultrasound allow
physicians to look inside a person’s body to guide treatment
or gather information about medical conditions such as broken
bones, cancers, signs of heart disease or internal
bleeding. The type of imaging technology a physician uses
depends on a patient’s symptoms and the part of the body
being examined. CT technology is well suited for viewing bone
injuries, diagnosing lung and chest problems, and detecting
cancers. MRI technology excels at examining soft tissue in ligament
and tendon injuries, spinal cord injuries, and brain tumors. CT
scans can take as little as 5 minutes, while an MRI scan can take
up to 30 minutes.
Unfortunately,
while CT and MRI systems are versatile and create high quality
images, they are also expensive and not always accessible to
patients. A CT system costs approximately $1 million and an MRI
system can cost up to $3 million. CT and MRI systems are large and
can weigh several tons, typically requiring significant
modifications to existing healthcare facilities to safely handle
the load. Because of their size and weight, CT and MRI systems are
usually fixed-in-place at major medical facilities. As a result,
they are less accessible to primary care and rural clinics,
economically developing markets, and patient bedsides. As of 2013,
there were only approximately 64,000 CT systems and 32,000 MRI
systems in the world, approximately 50% of which were located in
the U.S. and Japan.
While
CT and MRI systems create high quality images, their use is not
always practical. For example, the diagnosis and treatment of the
estimated 1.4 billion patients suffering from Non-Alcoholic Fatty
Liver Disease, or NAFLD, requires ongoing surveillance of the
patients’ livers to assess the progression of the disease and
the efficacy of treatment. However, the use of CT and MRI systems
to perform that surveillance is impractical for a number of
reasons, including the high cost of the scan, the limited
availability of CT and MRI systems and the required use of contrast
agents, including those containing radioactive substances that can
cause allergic reactions and reduced kidney functions. Patient
exposure to the ionizing radiation generated by a CT system must be
limited for safety reasons. Similarly, because of the strong
magnetic field created by an MRI machine, patients with metal joint
replacements or cardiac pacemakers cannot be imaged with an MRI
system.
3
Because
of CT and MRI’s limited availability and practical
limitations, a patient who would otherwise be a candidate for CT or
MRI scanning must often rely on less effective or less practical
methods. For example, MRI scans are not typically used to measure
tissue temperature during thermoablative (temperature based)
surgery. Instead, physicians use printed manufacturer guidelines to
time the thermal surgery or insert surgical temperature probes in
an attempt to guide treatment. As a result, the treatment is often
imprecise or comes with additional risks, such as
infection.
These
limitations have led to a decrease in the number of CT scans.
According to the American College of Radiology, the overall number
of CT scans performed in the United States under Medicare Part B
fell approximately 8% from 2009 to 2014. The decline in CT scans
has been accompanied by increased use of alternative scanning
technologies. The American College of Radiology reported that the
overall number of ultrasound scans performed in the United States
under Medicare Part B increased approximately 6% from 2009 to 2014.
During the same period MRI usage increased by 5%, but remains
significantly below the use of ultrasound technology, even in the
United States.
Ultrasound Technology
An
ultrasound machine transmits sound waves, which bounce off tissues,
organs and blood in the body. The ultrasound machine captures these
echoes and uses them to create an image. Ultrasound technology
excels at imaging the structure of internal organs, muscles and
bone surfaces. Due to its utility, cost-effectiveness and safety
profile, ultrasound imaging is frequently used in a
physician’s examination room or at a patient’s bedside
as a first-line diagnostic tool, which has resulted in an overall
increase in the number of ultrasound scans performed.
Ultrasound
systems are more broadly available to patients than either CT or
MRI systems. There are an estimated 925,000 ultrasound systems
globally in use today. Ultrasound systems are relatively
inexpensive compared to CT and MRI systems, with smaller portable
ultrasound systems costing as little as $10,000 and
new cart-based ultrasound systems costing between $75,000 and
$200,000. Ultrasound systems are also more mobile than CT and MRI
systems and many are designed to be moved by an operator from room
to room, or closer to patients. Ultrasound technology does not
present the same safety concerns as CT and MRI technology, since
ultrasound does not emit ionizing radiation and ultrasound contrast
agents are considered to be generally safe.
However,
ultrasound’s imaging capabilities are more limited compared
to CT and MRI technology. For example, ultrasound systems cannot
measure tissue temperature during thermal ablation surgery, or
quantify fat to diagnose early stage liver disease -- instances
where CT and MRI systems are used.
Ultrasound Market
Sales
of ultrasound diagnostic equipment were approximately $4.4 billion
globally in 2017 and are expected to grow at approximately 4.4%
annually. There are an estimated 925,000 installed systems
generating over 400 million annual diagnostic ultrasound procedures
globally. Additionally, an estimated 30,000 to 50,000 new and
replacement systems are sold into the market each year. These
numbers include both portable and cart-based ultrasound systems,
and cover all types of diagnostic ultrasound procedures, including
systems intended for cardiology, prenatal and abdominal use. We do
not intend to address low-cost, portable ultrasound systems and
systems focused on applications, such as prenatal care, where we
believe our TAEUS technology will not substantially impact patient
care. Accordingly, we define our addressable market for one or more
of our TAEUS applications at approximately 338,000 cart-based
ultrasound systems currently in use throughout the
world.
We
believe that demand for ultrasound systems is driven primarily by
the following factors:
●
Population
growth and age demographics that increase the demand for diagnostic
screening for cancer, cardiology, and prenatal
applications.
●
Economic
development broadening investment in healthcare in previously
underserved markets such as China and Latin America, where
ultrasound technology has significant appeal due to its price point
and flexibility at point-of-care.
●
Expanding
ultrasound applications and improving image quality that drive
demand for new ultrasound technologies, such as software
enhancements, bi-axial probes, and dedicated single application
systems.
●
Positive
insurance reimbursement rate trends for ultrasound diagnostics due
to the technology’s safety and
cost-effectiveness.
Unmet Need
We
believe that the limited availability of high-utility and
cost-effective imaging technology represents a significant unmet
medical need. We believe that expanding the capability of
ultrasound technology to perform more of the imaging tasks
presently available only on expensive CT and MRI systems will
satisfy this unmet need.
Our Solutions
Our
Thermo-Acoustic Enhanced Ultrasound, or TAEUS, technology, as well
as our commercially available Nexus 128 system, use a pulsed energy
source – near-infrared light and radio-frequency, or RF,
respectively – to generate ultrasonic waves in tissue. These
waves are then detected with ultrasound equipment and used to
create high-contrast images using our proprietary algorithms.
Unlike conventional ultrasound, which creates images based on the
scattering properties of tissue, thermoacoustic imaging provides
tissue absorption maps of the pulsed energy, similar to those
generated by CT scans. Ultrasound is only utilized to transmit the
absorption signal to the imaging system outside of the
body.
4
Our TAEUS Technology Platform for Clinical
Applications
To
increase the utility of our thermoacoustic technology, in 2013 we
began to develop our TAEUS technology platform. Unlike the
near-infrared light pulses used in our Nexus 128 system (discussed
below), our TAEUS technology uses RF pulses to stimulate tissues,
using a small fraction of the energy transmitted into the body
during an MRI scan. Using RF energy enables our TAEUS technology to
penetrate deep into tissue, enabling the imaging of human anatomy
at depths equivalent to those of conventional ultrasound. The RF
pulses are absorbed by tissue and converted into ultrasound
signals, which are detected by an external ultrasound receiver and
a digital acquisition system that is part of the TAEUS system. The
detected ultrasound is processed into images using our proprietary
algorithms and displayed to complement conventional gray-scale
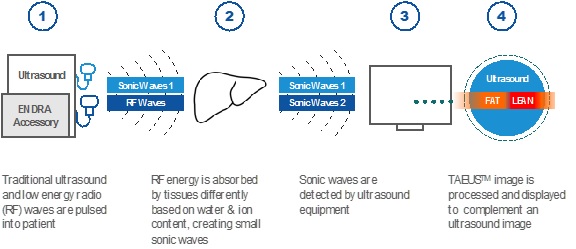
ultrasound images. The TAEUS imaging process is illustrated
below:
Our
RF-based thermoacoustics are not adversely affected by blood-filled
organs, enabling our TAEUS technology to be used in clinical liver
applications, among others.
After
approval, our TAEUS technology can be added as an accessory to
existing ultrasound systems, helping to improve clinical
decision-making on the front lines of patient care, without
requiring new clinical workflows or large capital investments. We
are also developing TAEUS for incorporation into new ultrasound
systems, primarily through our collaboration with GE Healthcare,
described more fully below.
We
believe that our TAEUS technology has the potential to add a number
of new capabilities to conventional ultrasound and thereby enhance
the utility of both existing and new ultrasound systems and extend
the use of ultrasound technology to circumstances that either
require the use of expensive CT or MRI imaging systems or where
imaging is not practical using existing technology. To
demonstrate the capabilities of our TAEUS platform, we have
conducted various internal ex-vivo laboratory experiments and have
also conducted limited internal in-vivo large animal studies. In
our ex-vivo and in-vivo testing, we have demonstrated that the
TAEUS platform has the following capabilities and potential
clinical applications:
5
●
Tissue Composition:
Our TAEUS technology enables ultrasound to distinguish fat from
lean tissue. This capability would enable the use of TAEUS-enhanced
ultrasound for the early identification, staging and monitoring of
NAFLD, a precursor to non-alcoholic steatohepatitis
(“NASH”), liver fibrosis, cirrhosis and liver
cancer.
●
Temperature
Monitoring: Our TAEUS technology enables traditional ultrasound to
visualize changes in tissue temperature, in real time. This
capability would enable the use of TAEUS-enhanced ultrasound to
guide thermoablative therapy, which uses heat or cold to remove
tissue, such as in the treatment of cardiac atrial fibrillation, or
removal of cancerous liver and kidney lesions, with greater
accuracy.
●
Vascular Imaging:
Our TAEUS technology enables ultrasound to view blood vessels from
any angle, using only a saline solution contrasting agent, unlike
Doppler ultrasound, which requires precise viewing angles. This
capability would enable the use of TAEUS-enhanced ultrasound to
easily identify arterial plaque or malformed vessels.
●
Tissue Perfusion:
Our TAEUS technology enables ultrasound to image blood flow at the
capillary level in a region, organ or tissue. This capability could
be used to assist physicians in characterizing microvasculature
fluid flows symptomatic of damaged tissue, such as internal
bleeding from trauma, or diseased tissue, such as certain
cancers.
In
addition, to further test the capability of our TAEUS platform to
distinguish tissue composition in conjunction with an NAFLD
application, we have engaged the Centre for Imaging Technology
Commercialization (“CIMTEC”), a contract research
organization, to initiate human studies.
Because
of the large number of traditional ultrasound systems currently in
global use, we are first developing our TAEUS technology for sale
as an aftermarket accessory that works with existing ultrasound
systems. Because our TAEUS technology is designed to enhance the
utility of, not replace, conventional ultrasound, we believe
healthcare providers will be able to increase the utilization of,
and generate new revenue from, their existing ultrasound systems
once we obtain required regulatory approval for specific
applications. Based on our design work and our understanding
of the ultrasound accessory market, we intend to price
our initial NAFLD TAEUS application at a price
point approximating $40,000 to $50,000, which should enable
purchasers to recoup their investment in less than one year by
performing a relatively small number of additional ultrasound
procedures. We further believe that clinicians will be attracted to
our technology because it will enable them to perform more
procedures with existing ultrasound equipment, thereby retaining
more imaging patients in their clinics rather than referring
patients out to a regional medical center for a CT or MRI
scan.
ENDRA’s
first clinical product will be designed to interface with a
conventional ultrasound scanner, utilizing the scanner’s
B-mode imaging to guide the selected region for assessment of liver
fat content. The following sub-systems will comprise ENDRA’s
first generation product.
Radio Frequency (RF) Source and Computer:
The RF
source consists of a low power waveform generator and an amplifier.
Together, these components provide the characteristic pulses
required to excite thermoacoustic signals in tissue. The computer
provides processing capability to both utilize the conventional
ultrasound data for navigation to the measurement site of interest,
and the calculations required to convert digitized thermoacoustic
signals to measurements of fat in liver tissue. The entire
sub-system will reside in a single enclosure, on wheels, and sit
adjacent to the ultrasound imaging system.
Specialized Transducer:
A
single channel ‘receive only’ ultrasound transducer is
specifically designed and optimized for thermoacoustic imaging. The
transducer sub-system will detect thermoacoustic signals excited by
the RF source within the liver. The transducer assembly includes
electronics for signal amplification, digitization, and signal
processing. The specialized transducer will attach to the
conventional ultrasound probe used for liver imaging.
6
RF Applicator:
The RF
applicator transmits pulses of energy, provided by the RF source,
into tissue. The applicator is positioned in proximity to the
target region for measurement.
A
second generation product is expected to provide two dimensional
imaging with a transducer composed of multiple receive elements.
The RF source and applicator will be similar to those in the first
generation product but the multi-element transducer will allow for
multiple applications including: reading tissue composition,
temperature, vascular flow, tissue perfusion, and other potential
applications. Ultimately, we expect our technology will be
incorporated into conventional ultrasound systems and our business
model will transition from producing stand-alone systems to
licensing our technology, IP and specialized components to
ultrasound OEMs. Existing ultrasound equipment already includes
power supplies, computation, high speed electronics, and ultrasound
transducers, which may be leveraged by our thermoacoustic imaging
applications. The RF source and applicator are the principal
hardware components that will be added to OEM ultrasound systems
for the OEM fully integrated form of our product.
We are
following a model that mirrors the approach used by companies in
the past to introduce new ultrasound imaging capabilities to
existing conventional ultrasound scanners. Color Doppler,
elastography, 3-D imaging, and high channel count systems were all
introduced by new companies (not already involved in conventional
ultrasound imaging). Historically, ultrasound imaging has grown
through the introduction of unique technology and capabilities that
expanded the applications and use of clinical ultrasound in a form
that often added separate hardware to existing ultrasound systems.
Ultimately, as these new technologies gained acceptance in the
marketplace they were incorporated into OEM-designed and built
systems that were sold by the leading ultrasound imaging
vendors.
Sales
of ultrasound diagnostic equipment were approximately $4.4 billion
globally in 2017 and are expected to grow at approximately 4.4%
annually. There are an estimated 925,000 installed systems
generating over 400 million annual diagnostic ultrasound procedures
globally. Additionally, an estimated 30,000 to 50,000 new and
replacement systems are sold into the market each year. These
numbers include both portable and cart-based ultrasound systems,
and cover all types of diagnostic ultrasound procedures, including
systems intended for cardiology, prenatal and abdominal use. We do
not intend to address low-cost, portable ultrasound systems and
systems focused on applications, such as prenatal care, where we
believe our TAEUS technology will not substantially impact patient
care. Accordingly, we define our addressable market for one or more
of our TAEUS applications at approximately 338,000 cart-based
ultrasound systems currently in use throughout the
world.
7
Potential Clinical Applications for our TAEUS
Technology
Early Diagnosis and Monitoring of Non-Alcoholic Fatty Liver
Disease, or NAFLD
Our
first TAEUS platform application will focus on quantifying fat in
the liver and stage progression of NAFLD which, untreated, can
progress to Non-Alcoholic Steato-Hepatitis, or NASH, cirrhosis and
liver cancer. In 2011, over 1.4 billion people were affected by
NAFLD/NASH. The World Gastroenterology Organisation considers
NAFLD/NASH a global pandemic affecting rich and poor countries
alike. Obesity, hepatitis, and diabetes are leading contributors to
the development of NAFLD.
Untreated,
an estimated 30% of NAFLD cases progress to NASH, a condition in
which liver fat causes inflammation and decreased liver function,
resulting in fatigue, weight loss, muscle pain and abdominal
pain.
Approximately
25% of NASH cases progress to liver fibrosis, in which liver
inflammation causes scar tissue which eventually prevents the liver
from functioning properly. The scar tissue blocks the flow of blood
through the liver and slows the processing of nutrients, hormones,
drugs, and naturally produced toxins. It also slows the production
of proteins and other substances made by the liver. Once a patient
develops cirrhosis of the liver, the only life-saving therapy is a
liver transplant. Additionally, cirrhosis patients may develop
liver cancer. In 2015, the World Health Organization estimated that
liver cancer kills 745,000 people annually. Because of the
increased incidence of obesity, hepatitis and diabetes throughout
the world, NAFLD has become the most common chronic liver disease
and an important cause of cirrhosis and liver cancer
worldwide.
Despite
the increased incidence of NAFLD and its role in the development of
NASH, cirrhosis and liver cancer, we believe that no low-cost,
accurate and safe method exists for measuring fat in the liver.
Current liver enzyme blood tests are indicative, but cannot
reliably confirm early stage NAFLD or NASH, and liver enzyme levels
are normal in a large percentage of patients with NAFLD. Existing
ultrasound technology can only measure fat qualitatively in the
liver at moderate to severe levels, typically greater than 30%
liver fat, and ultrasound has low accuracy when used on obese
patients. While early stage NAFLD and NASH can be confirmed by an
MRI scan, an MRI scan is expensive, and MRI systems are not widely
available or practical for many patients. A surgical biopsy can be
used to confirm NAFLD and NASH, but is also expensive, involves a
painful procedure and exposes patients to the risk of infection.
Furthermore, MRIs and surgical biopsies are impractical for
repeated screening and monitoring of liver disease. We believe
these limitations negatively impact the diagnosis and treatment of
patients with NAFLD.
Patients
diagnosed with NAFLD and related liver diseases are typically
treated with therapies such as statins, insulin sensitizers and
other compounds and are encouraged to adopt lifestyle changes to
improve their overall health.
A
significant number of pharmaceutical compounds targeting liver
disease are in development by companies such as Bristol-Myers
Squibb Company, Intercept Pharmaceuticals, Inc., Gilead Sciences,
Inc., Genfit SA, Conatus Pharmaceuticals Inc., Allergan plc and
Immuron Limited.
8
Billions
of dollars are spent annually on the diagnosis and treatment of
NAFLD and related liver diseases. In the United States alone, the
median Medicare inpatient charge per NAFLD patient is estimated to
be $36,000
and the total
annual direct medical costs for NAFLD are estimated to be $103
billion. Identification and staging of NAFLD is central to
determining the course of treatment.
In
addition, patients receiving treatment for NAFLD-spectrum liver
diseases must continue to be monitored to assess disease
progression and the efficacy of treatment. Because of the high cost
and limited global availability, CT and MRI technology is not
typically used for this function.
We
believe our TAEUS technology will enable primary care physicians,
radiologists and hepatologists to diagnose NAFLD earlier and
monitor patients with NAFLD-spectrum liver diseases more accurately
and cost-effectively than is possible with existing
technology.
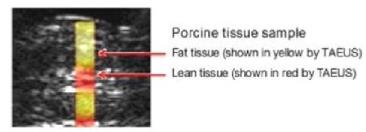
Image below: Depiction of ex-vivo TAEUS tissue composition analysis
overlaid on traditional ultrasound image. First version of TAEUS is
expected to assess fat in liver only.
Temperature Monitoring of Thermoablative Surgery
We also
intend to develop a TAEUS platform application to guide thermal
ablation surgery, such as in the treatment of cardiac atrial
fibrillation, chronic pain and lesions of the liver, thyroid,
kidneys and other soft tissues. We plan to target clinical users of
thermoablative technology, including interventional radiologists,
cardiologists, gynecologists and surgical oncologists.
Thermoablation
involves the use of heat or cold to remove malfunctioning or
diseased tissue in surgical oncology, cardiology, neurology,
gynecology, and urology applications. Thermoablative technologies
include RF, microwave, laser and cryogenic ablation. The worldwide
market for RF surgical ablation procedures alone was estimated in
2015 to be $3.7 billion per annum, generating over 5 million annual
RF ablation procedures and growing at approximately 18% annually.
We believe that the growth of this market is driven primarily by
the aging global population requiring more cardiac and cancer
procedures, as well as the relative ease-of-use and low cost of
thermoablative technologies when compared to open
surgery.
However,
RF and other thermoablative surgery technologies pose risks,
including under-treatment of diseased tissue and unintended thermal
damage to areas outside the treatment area. For example, it has
been reported that patients receiving RF ablation of liver tumors
have experienced thermal injury to the diaphragm, gallbladder, bile
ducts and gastrointestinal tract, some of which have resulted in
patient deaths.
Clinicians
must rely on printed manufacturer guidelines to
plan procedures using thermal ablation technologies or,
when available, monitor tissue temperature changes in real-time
with MRI imaging or surgical temperature probes. We believe these
existing methods either lack real-time precision or are impractical
due to cost, poor availability and other factors.
9
We
believe that the ability to visualize changes in tissue temperature
in real time could potentially enhance the effectiveness and safety
of thermoablation therapies and that our TAEUS technology platform
combined with traditional ultrasound has the potential to guide
thermoablation surgery more cost-effectively and more accurately
than existing methods.
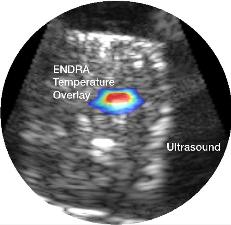
Image below: Depiction of ex-vivo TAEUS tissue temperature analysis
overlaid on traditional ultrasound image.
Vascular Imaging
We
believe that our TAEUS technology can be used to image blood
vessels and distinguish them from the surrounding tissue. In
addition to our NAFLD and thermoablation applications, we intend to
develop a cardiovascular application based on our TAEUS technology
that, with the use of a standard saline contrast agent, can enable
existing ultrasound systems to perform a number of cardiovascular
diagnostic functions, such as identifying arterial plaque or
blocked or malformed vessels, as well as safely guiding biopsies
away from vital vasculature.
Conventional
ultrasound imaging systems use Doppler imaging in a variety of
vascular applications. Doppler ultrasound, which images the
velocity of blood, is effective in larger vessels and regions where
blood velocity is high. However, Doppler ultrasound is not
sufficiently sensitive for use in very small vessels or in vascular
imaging applications where blood velocities are very low. For these
applications, contrast enhanced CT and MRI angiography is used
which requires the patient to be injected with a contrast agent,
iodinated compounds and gadolinium, respectively. Contrast-enhanced
CT and MRI scans both require referral for examination after
initial screening with ultrasound and carry risks associated with
their respective contrast agents. We believe that our TAEUS
platform application has the potential to offer the advantages of
CT and MR contrast enhanced imaging at the point of care using only
a safe electrolyte solution as the contrast agent.
Tissue Perfusion or “Leakiness”
We
believe that our TAEUS technology can be used to image tissue
perfusion, or the absorption of fluids into an organ or tissue. We
intend to develop an application for our TAEUS platform that would
enable ultrasound detection of microvasculature fluid flows
symptomatic of tissue compromised by trauma or
disease.
When a
person’s body is affected by disease or trauma, blood and
other fluids may leak from damaged tissues in subtle ways.
Traditional ultrasound cannot effectively image these disruptions
in microvascular permeability, but we believe ultrasound combined
with our TAEUS technology can.
10
We
believe that using our TAEUS technology physicians will be able to
quickly and clearly see tissue compromised by disease, such as
cancer, or trauma, especially with the use of a standard saline
contrast agent, when CT or MRI is not readily
available.
Collaboration
with GE Healthcare
On
April 22, 2016, we entered into a Collaborative Research Agreement
with General Electric Company, acting through its GE Healthcare
business unit and the GE Global Research Center, or GE Healthcare.
Under the terms of the agreement, GE Healthcare has agreed to
assist us in our efforts to commercialize our TAEUS technology for
use in a fatty liver application by, among other things, providing
equipment and technical advice, and facilitating introductions to
GE Healthcare clinical ultrasound customers. In return for this
assistance, we have agreed to afford GE Healthcare certain rights
of first offer with respect to manufacturing and licensing rights
for the target application. More specifically, we have agreed that,
prior to commercially releasing our TAEUS technology for a fatty
liver application, we will offer to negotiate an exclusive
ultrasound manufacturer relationship with GE Healthcare for a
period of at least one year of commercial sales. The commercial
sales would involve, within our sole discretion, either our company
commercially selling GE Healthcare ultrasound systems as the
exclusive ultrasound system with their TAEUS fatty liver
application embedded, or GE Healthcare being the exclusive
ultrasound manufacturer to sell ultrasound systems with the TAEUS
fatty liver application technology embedded.
The
agreement with GE Healthcare does not prevent us from selling our
TAEUS fatty liver application technology to distributors or
directly to non-manufacturer purchasers.
Additionally,
the agreement provides that prior to offering to license any of our
TAEUS fatty liver application intellectual property to a third
party, we will first offer to negotiate to license our TAEUS fatty
liver application intellectual property to GE
Healthcare.
Finally,
we agreed that prior to selling any equity interests in our company
to a healthcare device manufacturer, we will first offer to
negotiate in good faith to sell such equity interests to GE
Healthcare.
The
term of the agreement has been extended to January 2020, but the
agreement is subject to termination by either party upon not less
than 60 days’ notice.
Our Nexus 128 System for Laboratory
Research
Since
2010 we have marketed our Nexus 128 system to address the imaging
needs of researchers studying disease models in pre-clinical
applications. The Nexus 128 uses near-infrared light combined
with ultrasound to generate 3D images of tumors in laboratory mice.
We believe the Nexus 128 is the only commercially available fully
3D thermoacoustic imaging system.
Sales
of the Nexus 128 system were approximately $500,000 in 2016 and
$287,000 in 2017. Our Nexus 128 system is used in a number of
leading global academic research centers, including Stanford
University, The University of Michigan, Shanghai Jiao Tong
University, and Purdue University.
While
our Nexus 128 system is suited for small animal research, the
near-infrared light energy used in our Nexus 128 system only
penetrates tissues up to 3cm, limiting its utility beyond
shallow-depth human dermatological or breast applications.
Additionally, blood-filled organs, such as the liver, absorb most
of the near-infrared light, making it difficult to generate an
accurate image.
11
Intellectual
Property
We rely
on a combination of patent, copyright, trademark and trade secret
laws and other agreements with employees and third parties to
establish and protect our proprietary intellectual property rights.
We require our officers, employees and consultants to enter into
standard agreements containing provisions requiring confidentiality
of proprietary information and assignment to us of all inventions
made during the course of their employment or consulting
relationship. We also enter into nondisclosure agreements with our
commercial counterparties and limit access to, and distribution of,
our proprietary information.
We are
committed to developing and protecting our intellectual property
and, where appropriate, filing patent applications to protect our
technology. Our issued and pending patents claims are directed at
the following areas related to our technology:
●
Methods to induce
and enhance thermoacoustic signal generation;
●
System
configurations, devices and novel hardware for transmission of RF
pulses into tissue and detection of acoustic signals;
●
Methods for
integrating our devices with existing conventional ultrasound
systems; and
●
Methods and
algorithms for signal processing, image formation and
analysis.
We
currently maintain a patent portfolio consisting of two US and two
foreign issued patents, nine patent applications pending in the
United States and ten patent applications pending in foreign
jurisdictions. These patents and patent applications cover
certain innovations relating to contrast-enhanced imaging as well
as several aspects of fat imaging and fat quantitation in the liver
and other tissues.
In
addition, we have in-licensed four U.S. patents, three foreign
patents. These patents protect a number of key design
attributes that are specific to our Nexus 128 product.
Each of
our patents generally has a term of 20 years from its respective
priority filing date. Among our issued patents, the first
patents are set to expire in 2018 and the last patents expire in
2031.
Sales
and Marketing
We
currently do not have a sales and marketing team dedicated to our
TAEUS clinical applications. In parallel to securing all necessary
government marketing approvals, we intend to hire a small internal
marketing team to engage and support channel partners and clinical
customers. As we have done with our Nexus 128 system, we intend to
partner with several geographically-focused independent clinical
ultrasound equipment distributors to market and sell our TAEUS
applications. We believe that these distributors have existing
customer relationships, a strong knowledge of diagnostic imaging
technology and the capabilities to support the installation,
customer training and post-sale service of capital equipment and
software.
We also
intend to work with original equipment manufacturers, or OEMs, of
ultrasound and thermal ablation equipment to sell our TAEUS
applications alongside their own new systems and into their
existing installed base systems. We believe that these OEMs will
find our applications attractive as they will enable them to
generate additional revenue from their installed systems – as
they currently do with aftermarket accessory portfolios. We believe
our relationship with GE Healthcare will facilitate this
strategy.
Based
on our design work and our understanding of the ultrasound
accessory market, we intend to price our initial NAFLD TAEUS
application at a price point approximating one-half of the price of
a new cart-based ultrasound system, which should enable purchasers
to recoup their investment in less than one year by performing a
relatively small number of additional ultrasound
procedures.
12
Some of
our TAEUS offerings are expected to be implemented via a hardware
platform that can run multiple individual software applications
that we will offer TAEUS users for a one-time licensing fee,
enabling users to perform more procedures with their existing
ultrasound equipment and retaining more patients in their clinics
rather than referring them out to a regional imaging medical center
for a CT or MRI scan.
We also
intend to license our TAEUS technology to OEMs, such as GE
Healthcare, for incorporation in their new ultrasound
systems.
We
currently market our Nexus 128 pre-clinical system domestically in
North America through a small internal marketing team and a network
of distributors in the United Kingdom, the European Union,
Australia, China and Korea. We use our corporate website, sales
materials and key industry meetings to drive customer awareness,
interest and trial of our products.
Engineering, Design and Manufacturing
Development of TAEUS Device
We have
contracted with StarFish Product Engineering, Inc.
(“StarFish”), a medical device contract manufacturing
company, to commence the productization of our NAFLD TAEUS
application. In particular, we have retained StarFish to develop
ENDRA’s current prototype TAEUS device into a clinical
product meeting CE regulatory requirements required for commercial
launch. We expect to further engage StarFish to support our
application for a CE mark that will enable us to sell the
application in the European Union as a Class IIa medical device
once a final design for our TAEUS device has been developed and
tested, and to lead the preparation of documentation for regulatory
approval submission both in the European Union and in the United
States. In order to foster collaboration, our Chief Technology
Officer regularly visits StarFish’s facilities to monitor the
TAEUS application manufacturing process.
Additionally,
we have also engaged CriTech Research, Inc.
(“CriTech”), a firm specializing in medical device
software, to develop the software that will support the operation
of our TAEUS device.
We
believe that our contract manufacturers will either supply
necessary components internally or obtain them from third-party
sources. At this time, we do not know whether any components are or
will be single sourced.
Regulatory Approval Pathway
Each of
our TAEUS platform applications will require regulatory approvals
before we are able to sell or license the application. Based on
certain factors, such as the installed base of ultrasound systems,
availability of other imaging technologies, such as CT and MRI,
economic strength and applicable regulatory requirements, we intend
to seek initial approval of our applications for sale in the
European Union, followed by the United States and
China.
The
first TAEUS application we intend to commercialize is our NAFLD
TAEUS application. Our initial target market for this application
is the European Union. We believe that our NAFLD TAEUS application
will qualify for sale in the European Union as a Class IIa medical
device. As a result, we will be required to obtain a CE mark for
our NAFLD TAEUS application before we can sell the application in
the European Union. To this end, we have contracted with medical
device contract engineering firms to perform the commercial product
engineering for our NAFLD TAEUS application. Existing regulations
would not require us to conduct a clinical trial to obtain a CE
mark for this application. Nonetheless, for commercial reasons and
to support our CE mark application we have contracted the Centre
for Imaging Technology Commercialization, a medical imaging
research group, to conduct human studies to demonstrate our NAFLD
TAEUS application’s ability to distinguish fat from lean
tissue.
13
In
2012, the European Commission proposed a new regulatory scheme
that, if implemented, will impose significant additional
obligations on medical device companies. Expected changes include
stricter requirements for clinical evidence and pre-market
assessment of safety and performance, new classifications to
indicate risk levels, requirements for third party testing by
government accredited groups for some types of medical devices, and
tightened and streamlined quality management system assessment
procedures. It is anticipated that this new regulatory scheme may
be implemented prior to receipt of the CE mark for our NAFLD TAEUS
application, but we believe that applicable transition rules should
allow us to avoid their application in that case. However, such new
rules could impose additional requirements, such as a requirement
to conduct clinical trials, on future CE mark applications we
make.
After
the process of obtaining a CE mark for our NAFLD TAEUS application
is complete and if we are able to raise additional capital, we
intend to prepare for submission to the U.S. Food and Drug
Administration, or the FDA, an application under the Food, Drug and
Cosmetic Act, or the FD&C Act, to sell our NAFLD TAEUS
application in the U.S. We anticipate that the application, as well
as those for our other TAEUS applications, will be submitted for
approval under Section 510(k) of the FD&C Act. We expect that
our initial FDA clearance will allow us to sell the NAFLD TAEUS
application in the U.S. with general imaging claims. However, we
will need to obtain additional FDA clearances to be able to make
diagnostic claims for fatty tissue content determination.
Accordingly, to support our commercialization efforts we expect
that, following receipt of our initial FDA clearance, we will
submit one or more additional applications to the FDA, each of
which will need to include additional clinical trial data, so that
following receipt of the necessary clearances we may make those
diagnostic claims.
Nexus 128 Product
We
assemble our Nexus 128 products from components provided to us by
third-party component suppliers and manufacturers. While many of
the components are off-the-shelf
components available from multiple suppliers, our
proprietary receiver array is specially manufactured to our
specifications by one manufacturer. To date, we have not
experienced any component shortages. We do not have any long-term
supply or manufacturing agreements related to our Nexus 128
products and components are obtained on a purchase order basis when
required.
Regulation
European Union
The
primary regulatory environment in Europe is the European Union,
which consists of 28 member states encompassing most of the major
countries in Europe. We believe that in the European Union
applications incorporating our TAEUS technology will be regulated
as Class IIa medical devices by the European Medicines Agency, or
EMA, and the European Union Commission. As described above, we
expect our applications will receive a CE mark from an appropriate
Competent Authority as a result of successful review of one or more
submissions prepared by our contract engineering and
manufacturer(s), so that such applications can be marketed and
distributed within the European Economic Area. Each of our
applications will be required to be recertified each year for CE
marking, which recertification may require an annual audit. The
audit procedure, which will include on-site visits at our facility,
and the contract manufacturer’s(s’) facility(ies), will
require us to provide the contract manufacturer(s) with information
and documentation concerning our quality management system and all
applicable documents, policies, procedures, manuals, and other
information.
In the
European Union, the manufacturer of medical devices is subject to
current Good Manufacturing Practice, or cGMP, as set forth in the
relevant laws and guidelines of the European Union and its member
states. Compliance with cGMP is generally assessed by a Notified
Body accredited by a Competent Authority. For a Class IIa device,
typically, quality system evaluation is performed by the Notified
Body, which also recommends to the relevant Competent Authority for
the European community whether a device will receive a CE mark. The
Notified Body may conduct inspections of relevant facilities, and
review manufacturing procedures, operating systems and personnel
qualifications. In addition to obtaining approval for each
application, in many cases each device manufacturing facility must
be audited on a periodic basis by the Notified Body. Further
inspections may occur over the life of the
application.
14
FDA Regulation
Each of
our products must be approved or cleared by the FDA before it is
marketed in the United States. Before and after approval or
clearance in the United States, our applications are subject to
extensive regulation by the FDA under the FD&C Act
and/or the Public Health Service Act, as well as by other
regulatory bodies. The FDA regulations govern, among other things,
the development, testing, manufacturing, labeling, safety, storage,
record-keeping, market clearance or approval, advertising and
promotion, import and export, marketing and sales, and distribution
of medical devices and pharmaceutical products.
FDA Approval or Clearance of Medical Devices
In the
United States, medical devices are subject to varying degrees of
regulatory control and are classified in one of three classes
depending on the extent of controls the FDA determines are
necessary to reasonably ensure their safety and
efficacy:
●
Class I: general
controls, such as labeling and adherence to quality system
regulations;
●
Class II: special
controls, premarket notification (510(k)), specific controls such
as performance standards, patient registries and post-market
surveillance and additional controls such as labeling and adherence
to quality system regulations; and
●
Class III: special
controls and approval of a premarket approval, or PMA,
application.
We
expect all of our products to be classified as Class II medical
devices and require FDA authorization prior to marketing by means
of a 510(k) clearance.
To
request marketing authorization by means of a 510(k) clearance, we
must submit a premarket notification demonstrating that the
proposed device is substantially equivalent to another legally
marketed medical device, has the same intended use, and is as safe
and effective as a legally marketed device and does not raise
different questions of safety and effectiveness than a legally
marketed device. 510(k) submissions generally include, among other
things, a description of the device and its manufacturing, device
labeling, medical devices to which the device is substantially
equivalent, safety and biocompatibility information and the results
of performance testing. In some cases, a 510(k) submission must
include data from human clinical studies. Marketing may commence
only when the FDA issues a clearance letter finding substantial
equivalence. The typical duration to receive a 510(k) approval is
approximately nine to twelve months from the date of the initial
510(k) submission, although there is no guarantee that the timing
will not be longer.
In the
past, the 510(k) pathway for product marketing has required only
proof of substantial equivalence in technology for a given
indication with a previously cleared device. Recently, there has
been a trend of the FDA requiring additional clinical work to prove
efficacy in addition to technological equivalence and basic safety.
Whether clinical data is provided or not, the FDA may decide to
reject the substantial equivalence argument we present. If that
happens, the device is automatically designated as a Class III
device. The device sponsor must then fulfill more rigorous PMA
requirements, or can request a risk-based classification
determination for the device in accordance with the “de
novo” process, which may determine that the new device is of
low to moderate risk and that it can be appropriately be regulated
as a Class I or II device. If a de novo request is granted, the
device may be legally marketed and a new classification is
established. If the device is classified as Class II, the device
may serve as a predicate for future 510(k) submissions. If the
device is not approved through de novo review, then it must go
through the standard PMA process for Class III
devices.
15
After a
device receives 510(k) clearance, any product modification that
could significantly affect the safety or effectiveness of the
product, or that would constitute a significant change in intended
use, requires a new 510(k) clearance or, if the device would no
longer be substantially equivalent, a PMA. If the FDA determines
that the product does not qualify for 510(k) clearance, then a
company must submit, and the FDA must approve, a PMA before
marketing can begin.
A PMA
application must provide a demonstration of safety and
effectiveness, which generally requires extensive pre-clinical and
clinical trial data. Information about the device and its
components, device design, manufacturing and labeling, among other
information, must also be included in the PMA. As part of the PMA
review, the FDA will inspect the manufacturer’s facilities
for compliance with quality system regulation requirements, which
govern testing, control, documentation and other aspects of quality
assurance with respect to manufacturing. If the FDA determines the
application or manufacturing facilities are not acceptable, the FDA
may outline the deficiencies in the submission and often will
request additional testing or information. Notwithstanding the
submission of any requested additional information, the FDA
ultimately may decide that the application does not satisfy the
regulatory criteria for approval. During the review period, a FDA
advisory committee, typically a panel of clinicians and
statisticians, is likely to be convened to review the application
and recommend to the FDA whether, or upon what conditions, the
device should be approved. The FDA is not bound by the advisory
panel decision. While the FDA often follows the panel’s
recommendation, there have been instances in which the FDA has not.
The FDA must find the information to be satisfactory in order to
approve the PMA. The PMA approval can include post-approval
conditions, including, among other things, restrictions on
labeling, promotion, sale and distribution, or requirements to do
additional clinical studies after approval. Even after approval of
a PMA, a new PMA or PMA supplement is required to authorize certain
modifications to the device, its labeling or its manufacturing
process. Supplements to a PMA often require the submission of the
same type of information required for an original PMA, except that
the supplement is generally limited to that information needed to
support the proposed change from the product covered by the
original PMA. The typical duration to receive PMA approval is
approximately two years from the date of submission of the initial
PMA application, although there is no guarantee that the timing
will not be longer.
Clinical Trials of Medical Devices
One or
more clinical trials are generally required to support a PMA
application and more recently are becoming necessary to support a
510(k) submission. Clinical studies of unapproved or uncleared
medical devices or devices being studied for uses for which they
are not approved or cleared (investigational devices) must be
conducted in compliance with FDA requirements. If an
investigational device could pose a significant risk to patients,
the sponsor company must submit an investigational device exemption
application to the FDA prior to initiation of the clinical study.
An investigational device exemption application must be supported
by appropriate data, such as animal and laboratory test results,
showing that it is safe to test the device on humans and that the
testing protocol is scientifically sound. The investigational
device exemption will automatically become effective 30 days after
receipt by the FDA unless the FDA notifies the company that the
investigation may not begin. Clinical studies of investigational
devices may not begin until an institutional review board has
approved the study.
During
the study, the sponsor must comply with the FDA’s
investigational device exemption requirements. These requirements
include investigator selection, trial monitoring, adverse event
reporting, and record keeping. The investigators must obtain
patient informed consent, rigorously follow the investigational
plan and study protocol, control the disposition of investigational
devices, and comply with reporting and record keeping requirements.
The sponsor, the FDA, or the institutional review board at each
institution at which a clinical trial is being conducted may
suspend a clinical trial at any time for various reasons, including
a belief that the subjects are being exposed to an unacceptable
risk. During the approval or clearance process, the FDA typically
inspects the records relating to the conduct of one or more
investigational sites participating in the study supporting the
application.
16
Post-Approval Regulation of Medical Devices
After a
device is cleared or approved for marketing, numerous and pervasive
regulatory requirements continue to apply. These
include:
●
the FDA quality
systems regulation, which governs, among other things, how
manufacturers design, test, manufacture, exercise quality control
over, and document manufacturing of their products;
●
labeling and claims
regulations, which prohibit the promotion of products for
unapproved or “off-label” uses and impose other
restrictions on labeling; and
●
the Medical Device
Reporting regulation, which requires reporting to the FDA of
certain adverse experiences associated with use of the
product.
Good Manufacturing Practices Requirements
Manufacturers
of medical devices are required to comply with the good
manufacturing practices set forth in the quality system regulation
promulgated under Section 520 of the FD&C Act.
Current good manufacturing practices regulations require, among
other things, quality control and quality assurance as well as the
corresponding maintenance of records and documentation. The
manufacturing facility for an approved product must be registered
with the FDA and meet current good manufacturing practices
requirements to the satisfaction of the FDA pursuant to a pre-PMA
approval inspection before the facility can be used. Manufacturers,
including third party contract manufacturers, are also subject to
periodic inspections by the FDA and other authorities to assess
compliance with applicable regulations. Failure to comply with
statutory and regulatory requirements subjects a manufacturer to
possible legal or regulatory action, including the seizure or
recall of products, injunctions, consent decrees placing
significant restrictions on or suspending manufacturing operations,
and civil and criminal penalties. Adverse experiences with the
product must be reported to the FDA and could result in the
imposition of marketing restrictions through labeling changes or in
product withdrawal. Product approvals may be withdrawn if
compliance with regulatory requirements is not maintained or if
problems concerning safety or efficacy of the product occur
following the approval.
China Regulation
China’s
regulatory approval framework includes nationwide approval based on
a showing that the device for which approval is sought has been
previously approved in the country of origin. Alternatively, we
understand it is also possible to receive approval at the
provincial level or to work exclusively with hospitals that do not
require such nationwide or provincial approval. We intend to
explore these potential paths to regulatory compliance in
China.
Other Regulations
We will
become subject to regulations and product registration requirements
in many foreign countries in which we may sell our products,
including in the areas of product standards, packaging
requirements, labeling requirements, import and export restrictions
and tariff regulations, duties and tax requirements. The time
required to obtain clearance required by foreign countries may be
longer or shorter than that required for EMA or FDA clearance, and
requirements for licensing a product in a foreign country may
differ significantly from EMA and FDA requirements.
Competition
While
we believe that we are the only company developing RF-based
thermoacoustic ultrasound products, we will face direct and
indirect competition from a number of competitors, many of whom
have greater financial, sales and marketing and other resources
than we do.
Manufacturers
of CT and MRI systems include multi-national corporations such as
Royal Philips, Siemens AG and Hitachi, Ltd., many of whom also
manufacture and sell ultrasound equipment. In the NAFLD diagnosis
market we will compete with makers of surgical biopsy tools, such
as Cook Medical and Sterylab S.r.l. In the thermal ablation market,
we will compete with manufacturers of surgical temperature probes,
such as Medtronic plc and St. Jude Medical, Inc.
17
Research and
Development
Our
research and development expenses were $1,931,075 and $495,377 for
the years ended December 31, 2017 and 2016,
respectively.
Employees
As of
December 31, 2017, we had 13 employees, all of whom are employed on
a full-time basis. 6 full-time employees were engaged in research
and development activities, 3 full-time employees were engaged in
administrative activities, 2 full-time employees were engaged in
product assembly and 2 employees were engaged in marketing
activities. None of our employees are covered by a collective
bargaining agreement, and we believe our relationship with our
employees is good.
We also
employ technical advisors, on an as-needed basis, to supplement
existing staff. We believe that these technical advisors provide us
with necessary expertise in clinical ultrasound applications,
ultrasound technology, and intellectual property.
Investing in our common stock involves a high degree of risk. You
should carefully consider the following risks and all other
information contained in this Annual Report, including our
financial statements and the related notes, before investing in our
common stock. The risks and uncertainties described below are not
the only ones we face, but include the most significant factors
currently known by us that make investing in our securities
speculative or risky. Additional risks and uncertainties that we
are unaware of, or that we currently believe are not material, also
may become important factors that affect us. If any of the
following risks materialize, our business, financial condition and
results of operations could be materially harmed. In that case, the
trading price of our common stock could decline, and you may lose
some or all of your investment.
Risks Related to Our Business
We have a history of operating losses, we may never achieve or
maintain profitability, and we will need to raise significant
additional capital if we are going to continue as a going
concern.
We have limited commercial experience upon which investors may
evaluate our prospects. We have only generated limited revenues to
date and have a history of losses from operations. As of December
31, 2017, we had an accumulated deficit of approximately $17.9
million. Our independent registered public accounting firm, in its
report on our financial statements for the year ended
December 31, 2017, has raised substantial doubt about our
ability to continue as a going concern.
We will require additional capital in the near term to continue as
a going concern to proceed with the commercialization of our
planned TAEUS applications and to meet our growth and profitability
targets. We believe that cash on hand at December 31, 2017 and
other potential sources of cash, including revenues we may generate
from sales of our Nexus 128 system, will be sufficient to fund our
current operations into the third quarter of 2018. If we do not
raise additional capital in the next several months we will need to
significantly slow or pause our development activities until we
raise additional funds.
We have expended and expect to continue to expend significant
resources on hiring of personnel, payroll and benefits, continued
scientific and potential product research and development,
potential product testing and pre-clinical and clinical
investigations, expenses associated with the development of
relationships with strategic partners, intellectual property
development and prosecution, marketing and promotion, capital
expenditures, working capital, and general and administrative
expenses. We also expect to incur costs and expenses related to
consulting, laboratory development, and the hiring of scientists
and other operational personnel.
18
We may not be able to secure financing on favorable terms, or at
all, to meet our future capital needs and our failure to obtain
financing when needed could force us to delay, reduce or eliminate
our product development programs and commercialization
efforts.
We will need to raise additional capital in order to finance the
full commercialization of our first TAEUS application in the
European Union and to complete the development of any other TAEUS
application through public or private equity offerings, debt
financings, corporate collaboration and licensing arrangements or
other financing alternatives.
To date, we have financed our operations primarily through the net
proceeds from the issuance of securities, including our initial
public offering, as well as sales of our Nexus 128 system. We do
not know when or if our operations will generate sufficient cash to
fund our ongoing operations. Therefore, we will require additional
capital in order to: (i) continue to conduct research and
development activities; (ii) conduct clinical studies; (iii) fund
the costs of seeking regulatory approval of TAEUS applications;
(iv) expand our sales and marketing infrastructure; (v) acquire
complementary business technology or products; and (vi) respond to
business opportunities, challenges, increased regulatory
obligations or unforeseen circumstances. Our future funding
requirements will depend on many factors, including, but not
limited to:
●
the
costs, timing and outcomes of regulatory reviews associated with
our future products, including TAEUS applications;
●
the
costs and expenses of expanding our sales and marketing
infrastructure;
●
the
costs and timing of developing variations of our TAEUS applications
and, if necessary, obtaining regulatory clearance of such
variations;
●
the
degree of success we experience in commercializing our products,
particularly our TAEUS applications;
●
the
extent to which our TAEUS applications are adopted by hospitals for
use by primary care physicians, hepatologists, radiologists and
oncologists for diagnosis of fatty liver disease and the thermal
ablation of lesions;
●
the
number and types of future products we develop and
commercialize;
●
the
costs of preparing, filing and prosecuting patent applications and
maintaining, enforcing and defending intellectual property-related
claims;
●
the
extent and scope of our general and administrative
expenses;
●
the
progress, timing, scope and costs of our clinical trials, including
the ability to timely enroll patients in our planned and potential
future clinical trials;
●
the
outcome, timing and cost of regulatory approvals, including the
potential that the FDA or comparable regulatory authorities may
require that we perform more studies than those that we currently
expect;
●
the
amount of sales and other revenues from technologies and products
that we may commercialize, if any, including the selling prices for
such potential products and the availability of adequate
third-party reimbursement;
●
selling
and marketing costs associated with our potential products,
including the cost and timing of expanding our marketing and sales
capabilities;
19
●
the
terms and timing of any potential future collaborations, licensing
or other arrangements that we may establish;
●
cash
requirements of any future acquisitions and/or the development of
other products;
●
the
costs of operating as a public company;
●
the
cost and timing of completion of commercial-scale, outsourced
manufacturing activities; and
●
the
time and cost necessary to respond to technological and market
developments.
We may raise funds in equity or debt financings or enter into
credit facilities in order to access funds for our capital needs.
Any debt financing obtained by us in the future would cause us to
incur debt service expenses and could include restrictive covenants
relating to our capital raising activities and other financial and
operational matters, which may make it more difficult for us to
obtain additional capital and pursue business opportunities. If we
raise additional funds through issuances of equity or convertible
debt securities, our existing stockholders could suffer significant
dilution in their percentage ownership of our Company, and any new
equity securities we issue could have rights, preferences and
privileges senior to those of holders of our common stock. In
addition, if we raise additional funds through collaborations,
strategic alliances or marketing, distribution or licensing
arrangements with third parties, we may have to relinquish valuable
rights to our technologies, future revenue streams or products or
to grant licenses on terms that may not be favorable to us and our
collaborators and strategic partners may not perform as
expected.
General market conditions or the market price of our common stock
may not support capital raising transactions such as a public or
private offering of our common stock or other securities. If we are
unable to obtain adequate financing or financing on terms
satisfactory to us when we require it, we may terminate or delay
the development of one or more of our products, or delay
establishment of sales and marketing capabilities or other
activities necessary to commercialize our products, or materially
curtail or reduce our operations. We could be forced to sell or
dispose of our rights or assets. Any inability to raise adequate
funds on commercially reasonable terms could have a material
adverse effect on our business, results of operation and financial
condition, including the possibility that a lack of funds could
cause our business to fail and liquidate with little or no return
to investors.
Our efforts may never result in the successful development of
commercial applications
based on
our TAEUS technology.
Due to the limited tissue penetration capability of light-based
thermoacoustic technology, we believe that there is a limited
clinical market for our current Nexus 128 product, which is focused
on laboratory specimen analysis. As a result, we are currently
focused on the development of products based on our TAEUS
technology.
Our TAEUS technology is still in development and we do not have any
applications for our TAEUS technology approved for sale.
Applications for our TAEUS technology may never be approved, become
commercially viable or generate significant revenue. Our ability to
generate significant revenues and, ultimately, achieve
profitability will depend on whether we can obtain additional
capital when we need it, complete the development of our
technology, receive required regulatory approvals for our TAEUS
applications and find customers who will purchase our future
products or strategic partners that will incorporate our technology
into their products. Even if we develop commercially viable
applications for our TAEUS technology, which may include licensing,
we may never recover our research and development expenses and we
may never be able to produce material revenues or operate on a
profitable basis.
Our research and development efforts remain subject to all of the
risks associated with the development of new products based on
emerging technologies, including, without limitation, unanticipated
technical or other problems, the inability to develop a product
that may be sold at an acceptable price point and the possible
insufficiency of funds needed in order to complete development of
these products. Technical problems may result in delays and cause
us to incur additional expenses that would increase our losses. If
we cannot complete, or if we experience significant delays in
developing applications based on, our TAEUS technology,
particularly after incurring significant expenditures, our business
may fail.
20
Our success is substantially dependent on the success of
applications for our TAEUS platform.
To date we have generated only limited sales of our existing Nexus
128 product and our ability to generate meaningful revenues in the
future will depend on the successful development and
commercialization of our TAEUS platform applications. The
commercial success of our TAEUS platform applications and our
ability to generate revenues will depend on many factors, including
the following:
●
our
successful development of applications for our TAEUS technology,
such as those we intend to pursue for the diagnosis of Non-Alcohol
Fatty Liver Disease (“NAFLD”) and the monitoring of
thermal ablation surgery, and the acceptance in the marketplace by
physicians and patients of such applications;
●
the
successful design and manufacturing of a device or devices which
enable the use of our TAEUS technology by physicians on their
patients;
●
receipt
of necessary regulatory approvals;
●
sufficient
coverage or reimbursement by third-party payors;
●
our
ability to successfully market our products;
●
our
ability to demonstrate that our TAEUS applications have
advantages over competing products and procedures;
●
the
amount and nature of competition from competing or alternative
imaging products; and
●
our
ability to establish and maintain commercial manufacturing,
distribution and sales force capabilities.
Our TAEUS platform applications may not achieve adequate market
acceptance by the physicians, patients, third-party payors and
others in the medical community.
Even if any of our TAEUS applications receives regulatory approval,
it may nonetheless fail to gain sufficient market acceptance by
physicians, patients, third-party payors and others in the medical
community. If our TAEUS applications do not achieve an adequate
level of acceptance, we may not generate significant product
revenues or any profits from sales. The degree of market acceptance
of products based on our TAEUS platform will depend on a number of
factors, including:
●
potential
or perceived advantages or disadvantages compared to alternative
products;
●
pricing
relative to competitive products and availability of third-party
coverage or reimbursement;
●
the
timing of bringing our product to market as compared to possible
other new entrants to the market;
●
our
ability to effectively raise market awareness and explain product
benefits and whether we have resources sufficient to do
so;
●
relative
convenience, dependability and ease of administration;
and
●
willingness
of the target patient population to try new products and of
physicians to utilize such products.
21
Our revenues will be adversely affected if, due to these or other
factors, the products we are able to commercialize do not gain
significant market acceptance.
We may not remain commercially viable if there is an inadequate
level of reimbursement by governmental programs and other
third-party payors.
Medical imaging products are purchased principally by hospitals,
physicians and other healthcare providers around the world that
typically bill various third-party payors, including governmental
programs (
e.g.
, Medicare and Medicaid in the United States),
private insurance plans and managed care programs, for the services
provided to their patients.
Third-party payors and governments may approve or deny coverage for
certain technologies and associated procedures based on
independently determined assessment criteria. Reimbursement
decisions by payors for these services are based on a wide range of
methodologies that may reflect the services’ assessed
resource costs, clinical outcomes and economic value. These
reimbursement methodologies and decisions confer different, and
sometimes conflicting, levels of financial risk and incentives to
healthcare providers and patients, and these methodologies and
decisions are subject to frequent refinements. Third-party payors
are also increasingly adjusting reimbursement rates, often
downwards, indirectly challenging the prices charged for medical
products and services. There can be no assurance that our products
will be covered by third-party payors, that adequate reimbursement
will be available or, even if payment is available, that
third-party payors’ coverage policies will not adversely
affect our ability to sell our products profitably.
We have limited data regarding the efficacy of our TAEUS platform
applications. If any of our applications that receive regulatory
approval do not perform in accordance with our expectations, we are
unlikely to successfully commercialize our
applications.
Since our success depends in large part on the medical and
third-party payors community’s acceptance of our TAEUS
applications, even if we receive regulatory approval for our
applications, we believe that we will need to obtain additional
clinical data from users of our applications to persuade medical
professions to use our applications. We may also be required to
conduct post-approval clinical testing to obtain such additional
data. Clinical testing is expensive, can take a significant amount
of time to complete and can have uncertain outcomes. We have not
yet received the results of clinical studies relating to our TAUES
applications, including human studies to be conducted by the Centre
for Imaging Technology Commercialization (“CIMTEC”)
pursuant to a service agreement, and there can be no assurance that
the results of any such studies will be positive. Negative results
of these clinical studies could have a material, adverse impact on
our business.
Our limited commercial experience makes it difficult to evaluate
our business, predict our future results or forecast our financial
performance and growth.
We were incorporated in 2007 and began commercializing our initial
pre-clinical Nexus 128 product in 2010. No application based on our
TAEUS technology has been approved for commercialization. This
limited commercial experience makes it difficult to evaluate our
business, predict our future results or forecast our financial
performance and growth. If our assumptions regarding the risks and
uncertainties we face, which we use to plan our business, are
incorrect or change due to circumstances in our business or our
markets, or if we do not address these risks successfully, our
operating and financial results could differ materially from our
expectations and our business could suffer.
We have formed, and may in the future form or seek, strategic
alliances and collaborations or enter into licensing arrangements,
and we may not realize the benefits of such alliances,
collaborations or licensing arrangements.
On April 22, 2016, we entered into a Collaborative Research
Agreement with GE Healthcare under which GE Healthcare has agreed
to support our efforts to commercialize our TAEUS technology for
use in an NAFLD application by, among other things, providing
equipment and technical advice, and facilitating introductions to
GE Healthcare clinical ultrasound customers. This agreement does
not commit GE Healthcare to a long-term relationship and it may
disengage with us at any time. This agreement has a term lasting
until January 22, 2020 and is subject to termination by either
party upon not less than 60 days’ notice. See the section of
this Annual Report titled “Collaboration with GE
Healthcare” under “Item 1. Business” for further
description of this agreement.
22
We intend in the future to form or seek additional strategic
alliances, create joint ventures or collaborations or enter into
licensing arrangements with third parties that we believe will
complement or augment our development and commercialization efforts
with respect to our technologies and applications.
Any of these relationships may require us to incur non-recurring
and other charges, increase our near- and long-term expenditures,
issue securities that dilute our existing stockholders, restrict
our ability to collaborate with other third parties or otherwise
disrupt our management and business. In addition, we face
significant competition in seeking appropriate strategic partners
and the negotiation process is time-consuming and complex. If we
license technologies or applications, we may not be able to realize
the intended benefit of such transactions. Further, strategic
alliances and collaborations are subject to numerous risks, which
may include the following:
●
collaborators
have significant discretion in determining the efforts and
resources that they will apply to a collaboration;
●
collaborators
may not pursue development and commercialization of our
technologies and applications or may elect not to continue or renew
development or commercialization programs based on clinical trial
results, changes in their strategic focus due to the acquisition of
competitive products, availability of funding, or other external
factors, such as a business combination that diverts resources or
creates competing priorities;
●
collaborators
may delay clinical trials, provide insufficient funding for a
clinical trial, stop a clinical trial, abandon the development of
an application, repeat or conduct new clinical trials, or require a
new formulation of an application for clinical
testing;
●
collaborators
could independently develop, or develop with third parties,
products that compete directly or indirectly with our applications
and technologies;
●
a
collaborator with marketing and distribution rights to one or more
applications may not commit sufficient resources to their marketing
and distribution;
●
collaborators
may not properly maintain or defend our intellectual property
rights or may use our intellectual property or proprietary
information in a way that gives rise to actual or threatened
litigation that could jeopardize or invalidate our intellectual
property or proprietary information or expose us to potential
liability;
●
disputes
may arise between us and a collaborator that cause the delay or
termination of the research, development or commercialization of
our technologies and applications, or that result in costly
litigation or arbitration that diverts management attention and
resources;
●
collaborations
may be terminated and, if terminated, may result in a need for
additional capital to pursue further development or
commercialization of the applicable applications or technologies;
and
●
collaborators
may own or co-own intellectual property covering our products that
results from our collaborating with them, and in such cases, we
would not have the exclusive right to commercialize such
intellectual property.
As a result, if we enter into collaboration agreements and
strategic partnerships or license our applications or technologies,
we may not be able to realize the benefit of such transactions if
we are unable to successfully integrate them with our existing
operations and company culture, which could delay our timelines or
otherwise adversely affect our business. We also cannot be certain
that, following a strategic transaction or license, we will achieve
the revenue or specific net income that justifies such transaction.
Any delays in entering into new strategic partnership agreements
related to our applications could delay the development and
commercialization of our technologies and applications in certain
geographies or for certain applications, which would harm our
business prospects, financial condition and results of
operations.
23
We have limited resources and will depend on third parties to
design and manufacture, and seek regulatory approval of, our TAEUS
applications. If any third party fails to successfully design,
manufacture or obtain regulatory approval of TAEUS applications,
our business will be materially harmed.
We do not currently have, nor do we plan to acquire, the
infrastructure or capability to design or manufacture our TAEUS
applications. To support our design and manufacturing efforts, we
have contracted StarFish Product Engineering, Inc., a medical
device contract manufacturing company, and CriTech Research, Inc.,
a firm specializing in medical device software development, rather
than design or manufacture our TAEUS applications ourselves. We
have limited control over the efforts and resources that these and
any other third-party original equipment manufacturers
(“OEMs”) will devote to developing and manufacturing
our TAEUS applications and their capabilities to serve our needs,
including quality control, quality assurance and qualified
personnel. In addition, we currently expect to depend on OEMs to
acquire CE marks for the device or devices that they develop and
manufacture which are necessary to permit marketing of those
devices in the European Union followed by corresponding FDA
approval.
An OEM may not be able to successfully design and manufacture the
products it develops based on our TAEUS technology, may not devote
sufficient time and resources to support these efforts or may fail
in gaining the required regulatory approvals of our TAEUS
applications. The failure by an OEM to perform in accordance with
our expectations would substantially harm the value of our TAEUS
technology, brand and business.
We will need to develop marketing and distribution capabilities
both internally and through our relationships with third parties in
order to sell any of our TAEUS products receiving regulatory
approval. If we experience problems in developing these
capabilities, our ability to sell our products could be
limited.
We have limited experience selling our products and will need to
develop marketing, sales and distribution capabilities in order to
sell any of our TAEUS applications that receive the necessary
regulatory approval. We have limited experience managing a sales
force and customer support operations and may be unable to attract,
retain and manage the collaborative manufacturing and distribution
arrangements or the specialized workforce necessary to successfully
commercialize our products. In addition, our sales and marketing
organization must effectively explain the uses and benefits of our
products as compared to alternatives in order to promote market
acceptance and demand for our products. Developing these functions
is time consuming and expensive and our efforts may not be
successful.
We intend to partner with others to assist us with some or all of
these functions. However, we may be unable to find appropriate
third parties with which to enter into these arrangements and any
such third parties may not perform as expected.
Furthermore, third-party distributors that are in the business of
selling other medical products may not devote a sufficient level of
resources and support required to generate awareness of our TAEUS
applications and grow or maintain product sales. If these
distributors are unwilling or unable to market and sell our
products, or if they do not perform to our expectations, we could
experience delayed or reduced market acceptance and sales of our
products. In addition, disagreements with our distributors or
non-performance by these third parties could lead to costly and
time-consuming litigation or arbitration and disrupt distribution
channels for a period of time and require us to re-establish a
distribution channel.
If we are unable to manage the growth of our business, our future
revenues and operating results may be harmed.
Because of our small size, growth in accordance with our business
plan, if achieved, will place a significant strain on our
financial, technical, operational and management resources. As we
expand our activities, there will be additional demands on these
resources. The failure to continually upgrade our technical,
administrative, operating and financial control systems or the
occurrence of unexpected expansion difficulties, including issues
relating to our research and development activities and retention
of experienced scientists, managers and technicians, could have a
material adverse effect on our business, financial condition and
results of operations and our ability to timely execute our
business plan. If we are unable to implement these actions in a
timely manner, our results may be adversely affected.
Competition in the medical imaging market is intense and we may be
unable to successfully compete.
In general, competition in the medical imaging market is very
significant and characterized by extensive research and development
and rapid technological change. Competitors in this market include
very large companies with significantly greater resources than we
have. To successfully compete in this market we will need to
develop TAEUS applications that offer significant advantages over
alternative imaging products and procedures for such
applications.
24
While we believe the technology behind our TAEUS platform is unique
in the industry, developments by other medical imaging companies of
new or improved products, processes or technologies may make our
products or proposed products obsolete or less competitive.
Alternative medical imaging devices may be more accepted or
cost-effective than our products. Competition from these companies
for employees with experience in the medical imaging industry could
result in higher turnover of our employees. If we are unable to
respond to these competitive pressures, we could experience delayed
or reduced market acceptance of our products, higher expenses and
lower revenue. If we are unable to compete effectively with current
or new entrants to these markets, we will be unable to generate
sufficient revenue to maintain our business.
Changes in the healthcare industry could result in a reduction in
the size of the market for our products or may require us to
decrease the selling price for our products, either of which could
have a negative impact on our financial performance.
Trends toward managed care, healthcare cost containment, and other
changes in government and private sector initiatives in Europe, the
United States and China are placing increased emphasis on lowering
the cost of medical services, which could adversely affect the
demand for or the prices of our products. For example:
●
major
third-party payors of hospital and non-hospital based healthcare
services could revise their payment methodologies and impose
stricter standards for reimbursement of imaging procedures charges
and/or a lower or more bundled reimbursement;
●
there
has been a consolidation among healthcare facilities and purchasers
of medical devices who prefer to limit the number of suppliers from
whom they purchase medical products, and these entities may decide
to stop purchasing our products or demand discounts on our
prices;
●
there
is economic pressure to contain healthcare costs in markets
throughout the world; and
●
there
are proposed and existing laws and regulations in international and
domestic markets regulating pricing and profitability of companies
in the healthcare industry.
These trends could lead to pressure to reduce prices for our
products and could cause a decrease in the demand for our products
in any given market that could adversely affect our revenue and
profitability, which could harm our business.
We intend to market our TAEUS applications, if approved, globally,
in which case we will be subject to the risks of doing business
outside of the United States.
Because we intend to market our TAEUS applications, if approved,
globally, our business may be subject to risks associated with
doing business globally. Accordingly, our business and financial
results in the future could be adversely affected due to a variety
of factors, including:
●
changes
in a specific country’s or region’s political and
cultural climate or economic condition;
●
unexpected
changes in laws and regulatory requirements in local
jurisdictions;
●
difficulty
of effective enforcement of contractual provisions in local
jurisdictions;
●
inadequate
intellectual property protection in certain countries;
●
trade-protection
measures, import or export licensing requirements such as Export
Administration Regulations promulgated by the United States
Department of Commerce and fines, penalties or suspension or
revocation of export privileges;
●
effects
of applicable local tax structures and potentially adverse tax
consequences; and
●
significant
adverse changes in currency exchange rates.
25
We depend on our senior management team and the loss of one or more
key employees or an inability to attract and retain highly skilled
employees could harm our business.
Our success largely depends upon the continued services of our
executive management team and key employees. The loss of one or
more of our executive officers or key employees could harm us and
directly impact our financial results. Our employees may terminate
their employment with us at any time. Our executive management team
has significant experience and knowledge of medical devices and
ultrasound systems, and the loss of any team member could impair
our ability to design, identify, and develop new intellectual
property and new scientific or product ideas. Additionally, if we
lose the services of any of these persons, we would likely be
forced to expend significant time and money in the pursuit of
replacements, which may result in a delay in the implementation of
our business plan and plan of operations. We can give no assurance
that we could find satisfactory replacements for these individuals
on terms that would not be unduly expensive or burdensome to
us.
To execute our growth plan, we must attract and retain highly
qualified personnel. Competition for skilled personnel is intense,
especially for engineers with high levels of experience in
designing and developing medical devices. In addition, we will need
to identify and hire sales executives and competition for
commercial and marketing talent is significant. We may experience
difficulty in hiring and retaining employees with appropriate
qualifications. Many of the companies with which we compete for
experienced personnel have greater resources than we have. In
addition, we invest significant time and expense in training our
employees, which increases their value to competitors who may seek
to recruit them. If we fail to attract new personnel or fail to
retain and motivate our current personnel, our business and future
growth prospects would be harmed.
Our employees, independent contractors, consultants, commercial
partners and vendors may engage in misconduct or other improper
activities, including noncompliance with regulatory standards and
requirements.
We are exposed to the risk of fraud, misconduct or other illegal
activity by our employees, independent contractors, consultants,
commercial partners and vendors. Misconduct by these parties could
include intentional, reckless and negligent conduct that fails to:
comply with the U.S. Food, Drug and Cosmetics Act, or the FD&C
Act, and similar laws of other countries, and rules and regulations
of the U.S. Food and Drug Administration, or the FDA, and other
similar foreign regulatory bodies; provide true, complete and
accurate information to the FDA and other similar foreign
regulatory bodies; comply with manufacturing standards we
establish; comply with healthcare fraud and abuse laws in the
United States and similar foreign fraudulent misconduct laws; or
report financial information or data accurately or to disclose
unauthorized activities to us. If we obtain European, Chinese or
FDA approval of any of our products and begin commercializing those
products in Europe, China or the United States, respectively, our
potential exposure under such laws will increase significantly, and
our costs associated with compliance with such laws are also likely
to increase. In particular, the promotion, sales and marketing of
healthcare items and services, as well as certain business
arrangements in the healthcare industry, are subject to extensive
laws designed to prevent fraud, kickbacks, self-dealing and other
abusive practices. These laws and regulations may restrict or
prohibit a wide range of pricing, discounting, marketing and
promotion, structuring and commissions, certain customer incentive
programs and other business arrangements generally. It is not
always possible to identify and deter misconduct by employees and
other parties, and the precautions we take to detect and prevent
this activity may not be effective in controlling unknown or
unmanaged risks or losses or in protecting us from governmental
investigations or other actions or lawsuits stemming from a failure
to comply with these laws or regulations. If any such actions are
instituted against us, and we are not successful in defending
ourselves or asserting our rights, those actions could have a
significant impact on our business, including the imposition of
significant fines or other sanctions.
26
Misdiagnosis, warranty and other claims, as well as product field
actions and regulatory proceedings, initiated against us could
increase our costs, delay or reduce our sales and damage our
reputation, adversely affecting our financial
condition.
Our business exposes us to the risk of malpractice, warranty or
product liability claims inherent in the sale and support of
medical device products, including those based on claims that the
use or failure of one of our products resulted in a misdiagnosis or
harm to a patient. Such claims may cause financial loss, damage our
reputation by raising questions about our products’ safety
and efficacy, adversely affect regulatory approvals and interfere
with our efforts to market our products. Although to date we have
not been involved in any medical malpractice or product liability
litigation, we may incur significant liability if such litigation
were to occur. We may also face adverse publicity resulting from
product field actions or regulatory proceedings brought against us.
Claims could also be asserted under state consumer protection acts.
If we cannot successfully defend ourselves against product
liability or related claims, we may incur substantial liabilities
or be required to limit distribution of our products. Even a
successful defense would require significant financial and
management resources. Regardless of the merits or eventual outcome,
liability claims may result in:
●
decreased
demand for our products;
●
injury
to our reputation and negative media attention;
●
initiation
of investigations by regulators;
●
costs
to defend the related litigation;
●
a
diversion of management’s time and our
resources;
●
substantial
monetary awards to trial participants or
patients;
●
product
recalls, withdrawals or labeling, marketing or promotional
restrictions;
●
loss
of revenue;
●
exhaustion
of any available insurance and our capital
resources;
●
the
inability to commercialize a product at all or for particular
applications; and
●
a
decline in the price of our securities.
Although we currently maintain liability insurance in amounts we
believe are commercially reasonable, any liability we incur may
exceed our insurance coverage. Our insurance policies may also have
various exclusions, and we may be subject to a claim for which we
have no coverage. Liability insurance is expensive and may cease to
be available on acceptable terms, if at all. A malpractice,
warranty, product liability or other claim or product field action
not covered by our insurance or exceeding our coverage could
significantly impair our financial condition. In addition, a
product field action or a liability claim against us could
significantly harm our reputation and make it more difficult to
obtain the funding and commercial relationships necessary to
maintain our business.
Our internal computer systems, or those used by third-party
manufacturers or other contractors or consultants, may fail or
suffer security breaches.
Despite the implementation of security measures, our internal
computer systems and those of our future manufacturers and other
contractors and consultants are vulnerable to damage from computer
viruses and unauthorized access. Although to our knowledge we have
not experienced any such material system failure or security breach
to date, if such an event were to occur and cause interruptions in
our operations, it could result in a material disruption of our
research and development programs and our business operations. To
the extent that any disruption or security breach were to result in
a loss of, or damage to, our data or applications, or inappropriate
disclosure of confidential or proprietary information, we could
incur liability and the further development and commercialization
of our products could be delayed.
27
The United Kingdom’s vote to leave the European Union will
have uncertain effects and could adversely affect us.
On June 23, 2016, the United Kingdom held a referendum in which a
majority of voters voted to exit the European Union
(“EU”), commonly referred to as “Brexit”,
and on March 29, 2017, notified the EU that it intended to exit as
provided in Article 50 of the Treaty of Lisbon. The terms of the
withdrawal are subject to a negotiation period that could last at
least two years from the withdrawal notification date. This will be
either accompanied or followed by additional negotiations
concerning future terms of the United Kingdom’s relationship
with the EU including, among other things, the terms of trade
between the United Kingdom and the EU. The effects of Brexit will
depend on any agreements the United Kingdom makes to retain access
to EU markets either during a transitional period or more
permanently. Brexit could adversely affect European and worldwide
economic and market conditions and could contribute to instability
in global financial and foreign exchange markets, including
volatility in the value of the Sterling and Euro. In addition,
Brexit could lead to legal uncertainty and potentially divergent
national laws and regulations as the United Kingdom determines
which EU laws to replace or replicate. In addition, Brexit may lead
other EU member countries to consider referendums regarding their
EU membership. Any of these effects of Brexit, and others we cannot
anticipate, could adversely affect our business, results of
operations, financial condition and cash flows.
Risks Related to Intellectual Property and Other Legal
Matters
If we are unable to protect our intellectual property, which
entails significant expense and resources, then our financial
condition, results of operations and the value of our technology
and products could be adversely affected.
Much of our value arises out of our proprietary technology and
intellectual property for the design, manufacture and use of
medical imaging systems, including development of our TAEUS
applications. We rely on patent, copyright, trade secret and
trademark laws to protect our proprietary technology and limit the
ability of others to compete with us using the same or similar
technology. Third parties may infringe or misappropriate our
intellectual property, which could harm our business.
We currently maintain a patent portfolio consisting of two US and
two foreign issued patents, nine patent applications pending in the
United States and ten patent applications pending in foreign
jurisdictions relating to our technology. In addition, we currently
license four US patents and three pending patent applications in
the United States and foreign jurisdictions. We or our licensor may
fail to maintain these patents, may determine not to pursue
litigation against entities that are infringing upon these patents,
or may pursue such enforcement less aggressively than we ordinarily
would.
Expenses related to a patent portfolio include periodic maintenance
fees, renewal fees, annuity fees, various other governmental fees
on patents and/or applications due in several stages over the
lifetime of patents and/or applications, as well as the cost
associated with complying with numerous procedural provisions
during the patent application process. We may or may not choose to
pursue or maintain protection for particular inventions. In
addition, there are situations in which a failure to make certain
payments or noncompliance with certain requirements in the patent
process can result in abandonment or lapse of a patent or patent
application, resulting in partial or complete loss of patent rights
in the relevant jurisdiction.
Policing unauthorized use of our proprietary rights can be
difficult, expensive and time-consuming, and we might be unable to
determine the extent of this unauthorized use
Policing unauthorized use of our intellectual property is
difficult, costly and time-intensive. We may fail to stop or
prevent misappropriation of our technology, particularly in
countries where the laws may not protect our proprietary rights to
the same extent as do the laws of the United States. Proceedings to
enforce our patent and other intellectual property rights in
non-U.S. jurisdictions could result in substantial costs and divert
our efforts and attention from other aspects of our business. If we
cannot prevent other companies from using our proprietary
technology or if our patents are found invalid or otherwise
unenforceable, we may be unable to compete effectively against
other manufacturers of ultrasound systems, which could decrease our
market share. In addition, the breach of a patent licensing
agreement by us may result in termination of a patent
license.
We may not be able to prevent the unauthorized disclosure or use of
our technical knowledge or other trade secrets by consultants,
vendors or former or current employees, despite the existence
generally of confidentiality agreements and other contractual
restrictions. Monitoring unauthorized use and disclosure of our
intellectual property is difficult, and we do not know whether the
steps we have taken to protect our intellectual property will be
adequate.
28
If we are unable to protect the confidentiality of our proprietary
information and know-how, the value of our technology and products
could be adversely affected.
In addition to our patent activities, we rely upon, among other
things, unpatented proprietary technology, processes, trade secrets
and know-how. Any involuntary disclosure to or misappropriation by
third parties of our confidential or proprietary information could
enable competitors to duplicate or surpass our technological
achievements, potentially eroding our competitive position in our
market. We seek to protect confidential or proprietary information
in part by confidentiality agreements with our employees,
consultants and third parties. While we require all of our
employees, consultants, advisors and any third parties who have
access to our proprietary know-how, information and technology to
enter into confidentiality agreements, we cannot be certain that
this know-how, information and technology will not be disclosed or
that competitors will not otherwise gain access to our trade
secrets or independently develop substantially equivalent
information and techniques. These agreements may be terminated or
breached, and we may not have adequate remedies for any such
termination or breach. Furthermore, these agreements may not
provide meaningful protection for our trade secrets and know-how in
the event of unauthorized use or disclosure. To the extent that any
of our staff was previously employed by other pharmaceutical,
medical technology or biotechnology companies, those employers may
allege violations of trade secrets and other similar claims in
relation to their former employee’s therapeutic development
activities for us.
We may in the future be a party to intellectual property litigation
or administrative proceedings that could be costly and could
interfere with our ability to sell our TAEUS
applications.
The medical device industry has been characterized by extensive
litigation regarding patents, trademarks, trade secrets, and other
intellectual property rights, and companies in the industry have
used intellectual property litigation to gain a competitive
advantage. It is possible that U.S. and foreign patents and pending
patent applications or trademarks controlled by third parties may
be alleged to cover our products, or that we may be accused of
misappropriating third parties’ trade secrets. Other medical
imaging market participants, many of which have substantially
greater resources and have made substantial investments in patent
portfolios, trade secrets, trademarks, and competing technologies,
may have applied for or obtained or may in the future apply for or
obtain, patents or trademarks that will prevent, limit or otherwise
interfere with our ability to make, use, sell and/or export our
products or to use product names. We may become a party to patent
or trademark infringement or trade secret claims and litigation as
a result of these and other third party intellectual property
rights being asserted against us. The defense and prosecution of
these matters are both costly and time consuming. Vendors from whom
we purchase hardware or software may not indemnify us in the event
that such hardware or software is accused of infringing a third
party’s patent or trademark or of misappropriating a third
party’s trade secret.
Further, if such patents, trademarks, or trade secrets are
successfully asserted against us, this may harm our business and
result in injunctions preventing us from selling our products,
license fees, damages and the payment of attorney fees and court
costs. In addition, if we are found to willfully infringe
third-party patents or trademarks or to have misappropriated trade
secrets, we could be required to pay treble damages in addition to
other penalties. Although patent, trademark, trade secret, and
other intellectual property disputes in the medical device area
have often been settled through licensing or similar arrangements,
costs associated with such arrangements may be substantial and
could include ongoing royalties. We may be unable to obtain
necessary licenses on satisfactory terms, if at all. If we do not
obtain necessary licenses, we may not be able to redesign our TAEUS
applications to avoid infringement.
Similarly, interference or derivation proceedings provoked by third
parties or brought by the U.S. Patent and Trademark Office, or
USPTO, may be necessary to determine the priority of inventions or
other matters of inventorship with respect to our patents or patent
applications. We may also become involved in other proceedings,
such as re-examination, inter partes review, or opposition
proceedings, before the USPTO or other jurisdictional body relating
to our intellectual property rights or the intellectual property
rights of others. Adverse determinations in a judicial or
administrative proceeding or failure to obtain necessary licenses
could prevent us from manufacturing and selling our TAEUS
applications or using product names, which would have a significant
adverse impact on our business.
Additionally, we may need to commence proceedings against others to
enforce our patents or trademarks, to protect our trade secrets or
know-how, or to determine the enforceability, scope and validity of
the proprietary rights of others. These proceedings would result in
substantial expense to us and significant diversion of effort by
our technical and management personnel. We may not prevail in any
lawsuits that we initiate and the damages or other remedies
awarded, if any, may not be commercially meaningful. We may not be
able to stop a competitor from marketing and selling products that
are the same or similar to our products or from using product names
that are the same or similar to our product names, and our business
may be harmed as a result.
29
Intellectual property rights may not provide adequate protection,
which may permit third parties to compete against us more
effectively.
In order to remain competitive, we must develop and maintain
protection of the proprietary aspects of our technologies. We rely
on a combination of patents, copyrights, trademarks, trade secret
laws and confidentiality and invention assignment agreements to
protect our intellectual property rights. Any patents issued to us
may be challenged by third parties as being invalid, or third
parties may independently develop similar or competing technology
that avoids our patents. Should such challenges be successful,
competitors might be able to market products and use manufacturing
processes that are substantially similar to ours. Consequently, we
may be unable to prevent our proprietary technology from being
exploited abroad, which could affect our ability to expand to
international markets or require costly efforts to protect our
technology. To the extent our intellectual property protection is
incomplete, we are exposed to a greater risk of direct competition.
In addition, competitors could purchase our products and attempt to
replicate some or all of the competitive advantages we derive from
our development efforts or design around our protected technology.
Our failure to secure, protect and enforce our intellectual
property rights could substantially harm the value of our TAEUS
platform, brand and business.
Risks Related to Government Regulation
Failure to comply with laws and regulations could harm our
business.
Our business is or in the future may be subject to regulation by
various federal, state, local and foreign governmental agencies,
including agencies responsible for monitoring and enforcing
employment and labor laws, workplace safety, environmental laws,
consumer protection laws, anti-bribery laws, import/export
controls, securities laws and tax laws and regulations. In certain
jurisdictions, these regulatory requirements may be more stringent
than those in the United States. Noncompliance with applicable
regulations or requirements could subject us to investigations,
sanctions, mandatory recalls, enforcement actions, adverse
publicity, disgorgement of profits, fines, damages, civil and
criminal penalties or injunctions and administrative actions. If
any governmental sanctions, fines or penalties are imposed, or if
we do not prevail in any possible civil or criminal litigation, our
business, operating results and financial condition could be
harmed. In addition, responding to any action will likely result in
a significant diversion of management's attention and our resources
and substantial costs. Enforcement actions and sanctions could
further harm our business, operating results and financial
condition.
If we fail to obtain and maintain necessary regulatory clearances
or approvals for our TAEUS applications, or if clearances or
approvals for future applications and indications are delayed or
not issued, our commercial operations will be harmed.
The medical devices that we manufacture and market are subject to
regulation by numerous worldwide regulatory bodies, including the
FDA and comparable international regulatory agencies. These
agencies require manufacturers of medical devices to comply with
applicable laws and regulations governing development, testing,
manufacturing, labeling, marketing and distribution of medical
devices. Devices are generally subject to varying levels of
regulatory control, based on the risk level of the device.
Governmental regulations specific to medical devices are
wide-ranging and govern, among other things:
●
product
design, development and manufacture;
●
laboratory,
pre-clinical and clinical testing, labeling, packaging storage and
distribution;
●
premarketing
clearance or approval;
●
record
keeping;
●
product
marketing, promotion and advertising, sales and distribution;
and
●
post-marketing
surveillance, including reporting of deaths or serious injuries and
recalls and correction and removals.
30
In the European Union, we will be required to comply with
applicable medical device directives (including the Medical Devices
Directive and the Active Implantable Medical Devices Directive) and
obtain CE mark certification in order to market medical devices.
The CE mark is applied following approval from an independent
notified body or declaration of conformity. It is an international
symbol of adherence to quality assurance standards and compliance
with applicable European Medical Devices Directives. We believe
that our TAEUS applications will qualify for sale in the European
Union as Class IIa medical devices. Existing regulations do not
require clinical trials to obtain CE marks for Class IIa medical
devices. However, in 2012 the European Commission proposed a new
regulatory scheme that, if implemented, will impose significant
additional obligations on medical device companies. Expected
changes include stricter requirements for clinical evidence and
pre-market assessment of safety and performance, new
classifications to indicate risk levels, requirements for third
party testing by government accredited groups for some types of
medical devices, and tightened and streamlined quality management
system assessment procedures. It is anticipated that this new
regulatory scheme may be implemented prior to receipt of the CE
mark for our NAFLD TAEUS application but we believe that applicable
transition rules should allow us to avoid their application in that
case. However, such new rules could impose additional requirements,
such as a requirement to conduct clinical trials, on future CE mark
applications we make.
We are also required to comply with the regulations of each other
country where we commercialize products, such as the requirement
that we obtain approval from the FDA and the China Food and Drug
Administration before we can launch new products in the United
States and China, respectively.
International sales of medical devices manufactured in the United
States that are not approved by the FDA for use in the United
States, or that are banned or deviate from lawful performance
standards, are subject to FDA export requirements. Exported devices
are subject to the regulatory requirements of each country to which
the device is exported. Frequently, regulatory approval may first
be obtained in a foreign country prior to application in the United
States due to differing regulatory requirements; however, other
countries, such as China for example, require approval in the
country of origin first.
Before a new medical device or a new intended use for an existing
product can be marketed in the United States, a company must first
submit and receive either 510(k) clearance or premarketing
approval, or PMA, from the FDA, unless an exemption applies. The
typical duration to receive a 510(k) approval is approximately nine
to twelve months from the date of the initial 510(k) submission and
the typical duration to receive a PMA approval is approximately two
years from the date of submission of the initial PMA application,
although there is no guarantee that the timing will not be
longer.
We expect all of our products to be classified as Class II medical
devices that may be approved by means of a 510(k) clearance. In the
past, the 510(k) pathway for product marketing has required only
proof of substantial equivalence in technology for a given
indication with a previously cleared device. Recently, there has
been a trend of the FDA requiring additional clinical work to prove
efficacy in addition to technological equivalence and basic safety.
Whether clinical data is provided or not, the FDA may decide to
reject the substantial equivalence argument we present. If that
happens, the device is automatically designated as a Class III
device. The device sponsor must then fulfill more rigorous PMA
requirements, or can request a risk-based classification
determination for the device in accordance with the “de
novo” process, which may determine that the new device is of
low to moderate risk and that it can be appropriately regulated as
a Class I or II device. Thus, although at this time we do not
anticipate that we will be required to do so, it is possible that
one or more of our other products may require approval through the
510(K) de novo process or by means of a PMA.
31
We may not be able to obtain the necessary clearances or approvals
or may be unduly delayed in doing so, which could harm our
business. Furthermore, even if we are granted regulatory clearances
or approvals, they may include significant limitations on the
indicated uses for the product, which may limit the market for the
product. Therefore, even if we believe we have successfully
developed our TAEUS technology, we may not be permitted to market
TAEUS applications in the United States if we do not obtain FDA
regulatory clearance to market such applications. Delays in
obtaining clearance or approval could increase our costs and harm
our revenues and growth.
In addition, we are required to timely file various reports with
the FDA, including reports required by the medical device reporting
regulations that require us to report to certain regulatory
authorities if our devices may have caused or contributed to a
death or serious injury or malfunctioned in a way that would likely
cause or contribute to a death or serious injury if the malfunction
were to recur. If these reports are not filed timely, regulators
may impose sanctions and sales of our products may suffer, and we
may be subject to product liability or regulatory enforcement
actions, all of which could harm our business.
If we initiate a correction or removal for one of our devices to
reduce a risk to health posed by the device, we would be required
to submit a publically available Correction and Removal report to
the FDA and, in many cases, similar reports to other regulatory
agencies. This report could be classified by the FDA as a device
recall which could lead to increased scrutiny by the FDA, other
international regulatory agencies and our customers regarding the
quality and safety of our devices. Furthermore, the submission of
these reports has been and could be used by competitors against us
in competitive situations and cause customers to delay purchase
decisions or cancel orders and would harm our
reputation.
The FDA and the Federal Trade Commission, or FTC, also regulate the
advertising and promotion of our products to ensure that the claims
we make are consistent with our regulatory clearances, that there
are adequate and reasonable data to substantiate the claims and
that our promotional labeling and advertising is neither false nor
misleading in any respect. If the FDA or FTC determines that any of
our advertising or promotional claims are misleading, not
substantiated or not permissible, we may be subject to enforcement
actions, including warning letters, and we may be required to
revise our promotional claims and make other corrections or
restitutions.
The FDA and state authorities have broad enforcement powers. Our
failure to comply with applicable regulatory requirements could
result in enforcement action by the FDA or state agencies, which
may include any of the following sanctions:
●
adverse
publicity, warning letters, fines, injunctions, consent decrees and
civil penalties;
●
repair,
replacement, refunds, recall or seizure of our
products;
●
operating
restrictions, partial suspension or total shutdown of
production;
●
refusing
our requests for 510(k) clearance or premarket approval of new
products, new intended uses or modifications to existing
products;
●
withdrawing
510(k) clearance or premarket approvals that have already been
granted; and
●
criminal
prosecution.
If any of these events were to occur, our business and financial
condition would be harmed.
Our TAEUS applications may require recertification or new
regulatory clearances or premarket approvals and we may be required
to recall or cease marketing our TAEUS applications until such
recertification or clearances are obtained.
Most countries outside of the United States require that product
approvals be recertified on a regular basis, generally every five
years. The recertification process requires that we evaluate any
device changes and any new regulations or standards relevant to the
device and, where needed, conduct appropriate testing to document
continued compliance. Where recertification applications are
required, they must be approved in order to continue selling our
products in those countries.
In the United States, material modifications to the intended use or
technological characteristics of our TAEUS applications will
require new 510(k) clearances or premarket approvals or require us
to recall or cease marketing the modified devices until these
clearances or approvals are obtained. Based on FDA published
guidelines, the FDA requires device manufacturers to initially make
and document a determination of whether or not a modification
requires a new approval, supplement or clearance; however, the FDA
can review a manufacturer’s decision. Any modification to an
FDA-cleared device that would significantly affect its safety or
efficacy or that would constitute a major change in its intended
use would require a new 510(k) clearance or possibly a premarket
approval.
32
We may not be able to obtain recertification or additional 510(k)
clearances or premarket approvals for our applications or for
modifications to, or additional indications for, our TAEUS
technology in a timely fashion, or at all. Delays in obtaining
required future governmental approvals would harm our ability to
introduce new or enhanced products in a timely manner, which in
turn would harm our future growth. If foreign regulatory
authorities or the FDA require additional approvals, we may be
required to recall and to stop selling or marketing our TAEUS
applications, which could harm our operating results and require us
to redesign our applications. In these circumstances, we may be
subject to significant enforcement actions.
If any OEMs fail to comply with the FDA’s Quality System
Regulations or other regulatory bodies’ equivalent
regulations, manufacturing operations could be delayed or shut down
and the development of our TAEUS platform could
suffer.
The manufacturing processes of OEMs are required to comply with the
FDA’s Quality System Regulations and other regulatory
bodies’ equivalent regulations, which cover the procedures
and documentation of the design, testing, production, control,
quality assurance, labeling, packaging, storage and shipping of our
TAEUS applications. They may also be subject to similar state
requirements and licenses and engage in extensive recordkeeping and
reporting and make available their manufacturing facilities and
records for periodic unannounced inspections by governmental
agencies, including the FDA, state authorities and comparable
agencies in other countries. If any OEM fails such an inspection,
our operations could be disrupted and our manufacturing
interrupted. Failure to take adequate corrective action in response
to an adverse inspection could result in, among other things, a
shut-down of our manufacturing operations, significant fines,
suspension of marketing clearances and approvals, seizures or
recalls of our products, operating restrictions and criminal
prosecutions, any of which would cause our business to suffer.
Furthermore, these OEMs may be engaged with other companies to
supply and/or manufacture materials or products for such companies,
which would expose our OEMs to regulatory risks for the production
of such materials and products. As a result, failure to meet the
regulatory requirements for the production of those materials and
products may also affect the regulatory clearance of a third-party
manufacturers’ facility. If the FDA or a foreign regulatory
agency does not approve these facilities for the manufacture of our
products, or if it withdraws its approval in the future, we may
need to find alternative manufacturing facilities, which would
impede or delay our ability to develop, obtain regulatory approval
for or market our products, if approved. Additionally, our key
component suppliers may not currently be or may not continue to be
in compliance with applicable regulatory requirements, which may
result in manufacturing delays for our product and cause our
results of operations to suffer.
Our TAEUS applications may in the future be subject to product
recalls that could harm our reputation.
Governmental authorities in Europe, the United States and China
have the authority to require the recall of commercialized products
in the event of material regulatory deficiencies or defects in
design or manufacture. A government-mandated or voluntary recall by
us could occur as a result of component failures, manufacturing
errors or design or labeling defects. Recalls of our TAEUS
applications would divert managerial attention, be expensive, harm
our reputation with customers and harm our financial condition and
results of operations. A recall announcement would negatively
affect the price of our securities.
Healthcare reform measures could hinder or prevent our planned
products' commercial success.
There have been, and we expect there will continue to be, a number
of legislative and regulatory changes to the healthcare system in
ways that could harm our future revenues and profitability and the
future revenues and profitability of our potential customers. In
the European Union, although there have not been any recent
amendments to the relevant regulatory legislation, there are
ongoing discussions regarding amending the current regulatory
framework for medical devices. Moreover, because the Medical
Devices Directive requires only minimum harmonization in the
European Union, member countries may alter their enforcement of the
directives or amend their national regulatory rules. We cannot
predict what healthcare initiatives, if any, will be implemented by
the European Union or E.U. member countries, or the effect any
future legislation or regulation will have on
us.
33
In the United States, federal and state lawmakers regularly propose
and, at times, enact legislation that would result in significant
changes to the healthcare system, some of which are intended to
contain or reduce the costs of medical products and services. For
example, one of the most significant healthcare reform measures in
decades, the Patient Protection and Affordable Care Act, as amended
by the Health Care and Education Affordability Reconciliation Act,
or Affordable Care Act, was enacted in 2010. The Affordable Care
Act contains a number of provisions, including those governing
enrollment in federal healthcare programs, reimbursement changes
and fraud and abuse measures, all of which will impact existing
government healthcare programs and will result in the development
of new programs. The Affordable Care Act, among other things,
imposes an excise tax of 2.3% on the sale of most medical devices,
including ours, and any failure to pay this amount could result in
the imposition of an injunction on the sale of our products, fines
and penalties.
It remains unclear whether changes will be made to the Affordable
Care Act, or whether it will be repealed or materially modified. We
cannot assure you that the Affordable Care Act, as currently
enacted or as amended or discontinued in the future, will not harm
our business and financial results and we cannot predict how future
federal or state legislative or administrative changes relating to
healthcare reform will affect our business.
There likely will continue to be legislative and regulatory
proposals at the federal and state levels directed at containing or
lowering the cost of healthcare. We cannot predict the initiatives
that may be adopted in the future or their full impact. The
continuing efforts of the government, insurance companies, managed
care organizations and other payors of healthcare services to
contain or reduce costs of healthcare may harm:
●
our
ability to set a price that we believe is fair for our
products;
●
our
ability to generate revenues and achieve or maintain profitability;
and
●
the
availability of capital.
If we fail to comply with healthcare regulations, we could face
substantial penalties and our business, operations and financial
condition could be adversely affected.
Even though we do not and will not control referrals of healthcare
services or bill directly to Medicare, Medicaid or other third
party payors, certain federal and state healthcare laws and
regulations pertaining to fraud and abuse and patients’
rights are and will be applicable to our business. We could be
subject to healthcare fraud and abuse and patient privacy
regulation by both the federal government and the states in which
we conduct our business. Other jurisdictions such as the European
Union have similar laws. The regulations that will affect how we
operate include:
●
the
federal healthcare program Anti-Kickback Statute, which prohibits,
among other things, any person from knowingly and willfully
offering, soliciting, receiving or providing remuneration, directly
or indirectly, in exchange for or to induce either the referral of
an individual for, or the purchase, order or recommendation of, any
good or service for which payment may be made under federal
healthcare programs, such as the Medicare and Medicaid
programs;
●
the
federal False Claims Act, which prohibits, among other things,
individuals or entities from knowingly presenting, or causing to be
presented, false claims, or knowingly using false statements, to
obtain payment from the federal government;
●
federal
criminal laws that prohibit executing a scheme to defraud any
healthcare benefit program or making false statements relating to
healthcare matters;
●
the
federal Physician Payment Sunshine Act, created under the
Affordable Care Act, and its implementing regulations, which
require manufacturers of drugs, medical devices, biologicals and
medical supplies for which payment is available under Medicare,
Medicaid, or the Children’s Health Insurance Program to
report annually to the U.S. Department of Health and Human
Services, or HHS, information related to payments or other
transfers of value made to physicians and teaching hospitals, as
well as ownership and investment interests held by physicians and
their immediate family members;
34
●
HIPAA,
as amended by the Health Information Technology for Economic and
Clinical Health Act, which governs the conduct of certain
electronic healthcare transactions and protects the security and
privacy of protected health information; and
●
state
law equivalents of each of the above federal laws, such as
anti-kickback and false claims laws which may apply to items or
services reimbursed by any third-party payor, including commercial
insurers.
The Affordable Care Act, among other things, amends the intent
requirement of the Federal Anti-Kickback Statute and criminal
healthcare fraud statutes. A person or entity no longer needs to
have actual knowledge of this statute or specific intent to violate
it. In addition, the Affordable Care Act provides that the
government may assert that a claim including items or services
resulting from a violation of the Federal Anti-Kickback Statute
constitutes a false or fraudulent claim for purposes of the False
Claims Act.
Efforts to ensure that our business arrangements will comply with
applicable healthcare laws may involve substantial costs. It is
possible that governmental and enforcement authorities will
conclude that our business practices do not comply with current or
future statutes, regulations or case law interpreting applicable
fraud and abuse or other healthcare laws and regulations. If any
such actions are instituted against us, and we are not successful
in defending ourselves or asserting our rights, those actions could
have a significant impact on our business, including the imposition
of civil, criminal and administrative penalties, damages,
disgorgement, monetary fines, possible exclusion from participation
in Medicare, Medicaid and other federal and similar foreign
healthcare programs, contractual damages, reputational harm,
diminished profits and future earnings, and curtailment of our
operations, any of which could harm our ability to operate our
business and our results of operations.
Compliance with environmental laws and regulations could be
expensive. Failure to comply with environmental laws and
regulations could subject us to significant liability.
Our research and development and manufacturing operations may
involve the use of hazardous substances and are subject to a
variety of federal, state, local and foreign environmental laws and
regulations relating to the storage, use, discharge, disposal,
remediation of, and human exposure to, hazardous substances and the
sale, labeling, collection, recycling, treatment and disposal of
products containing hazardous substances. In addition, our research
and development and manufacturing operations produce biological
waste materials, such as human and animal tissue, and waste
solvents, such as isopropyl alcohol. These operations are permitted
by regulatory authorities, and the resultant waste materials are
disposed of in material compliance with environmental laws and
regulations. Liability under environmental laws and regulations can
be joint and several and without regard to fault or negligence.
Compliance with environmental laws and regulations may be expensive
and non-compliance could result in substantial liabilities, fines
and penalties, personal injury and third part property damage
claims and substantial investigation and remediation costs.
Environmental laws and regulations could become more stringent over
time, imposing greater compliance costs and increasing risks and
penalties associated with violations. We cannot assure you that
violations of these laws and regulations will not occur in the
future or have not occurred in the past as a result of human error,
accidents, equipment failure or other causes. The expense
associated with environmental regulation and remediation could harm
our financial condition and operating results.
Risks Related to Owning Our Securities, Our Financial Results and
Our Need for Financing
Our quarterly and annual results may fluctuate significantly, may
not fully reflect the underlying performance of our business and
may result in volatility in the price of our
securities.
Our operating results will be affected by numerous factors such
as:
●
variations
in the level of expenses related to our proposed
products;
●
status
of our product development efforts;
●
execution
of collaborative, licensing or other arrangements, and the timing
of payments received or made under those arrangements;
35
●
intellectual
property prosecution and any infringement lawsuits to which we may
become a party;
●
regulatory
developments affecting our products or those of our
competitors;
●
our
ability to obtain and maintain FDA clearance and approval from
foreign regulatory authorities for our products, which have not yet
been approved for marketing;
●
market
acceptance of our TAEUS applications;
●
the
availability of reimbursement for our
TAEUS applications;
●
our
ability to attract new customers and grow our business with
existing customers;
●
the
timing and success of new product and feature introductions by us
or our competitors or any other change in the competitive dynamics
of our industry, including consolidation among competitors,
customers or strategic partners;
●
the
amount and timing of costs and expenses related to the maintenance
and expansion of our business and operations;
●
changes
in our pricing policies or those of our competitors;
●
general
economic, industry and market conditions;
●
the
hiring, training and retention of key employees, including our
ability to expand our sales team;
●
litigation
or other claims against us;
●
our
ability to obtain additional financing; and
●
advances
and trends in new technologies and industry standards.
Any or all of these factors could adversely affect our cash
position requiring us to raise additional capital which may be on
unfavorable terms and result in substantial dilution. Additionally,
the risks surrounding our business, as well as the limited market
for our common stock, have resulted, and will likely continue to
result, in volatility in the price of our common stock and
warrants. Since shares of our common stock and warrants to purchase
our common stock were first listed on the Nasdaq Capital Market on
June 28, 2017 through December 31, 2017, the intra-day trading
prices have fluctuated from a low of $2.15 to a high of $5.88 with
respect to shares of our common stock and from a low of $0.28 to a
high of $2.00 with respect to our warrants and may continue to
fluctuate significantly in the future.
We may be subject to securities litigation, which is expensive and
could divert management attention.
In the past, companies that have experienced volatility in the
market price of their securities have been subject to an increased
incidence of securities class action litigation. We may be the
target of this type of litigation in the future. Securities
litigation against us could result in substantial costs and divert
our management’s attention from other business concerns,
which could seriously harm our business.
There is a limited
market for our common stock
.
Although our common stock is traded on the Nasdaq Capital Market,
the volume of trading has historically been limited. Our average
daily trading volume of our shares from June 28, 2017, when our
common stock began trading publicly, to December 31, 2017 was
approximately 14,954 shares. Thinly traded stock can be more
volatile than stock trading in a more active public market. While
we have made efforts to increase trading in our stock, we cannot
predict the extent to which an active public market for our common
stock will develop or be sustained. Therefore, a holder of our
common stock who wishes to sell his or her shares may not be able
to do so immediately or at an acceptable price.
36
If securities or industry analysts do not publish research reports
about our business, or if they issue an adverse opinion about our
business, the price of our securities and trading volume could
decline.
The trading market for our securities is influenced by the research
and reports that industry or securities analysts publish about us
or our business. We do not currently have and may never obtain
research coverage by securities and industry analysts. If no or few
analysts commence research coverage of us, or one or more of the
analysts who cover us issues an adverse opinion about our company,
the price of our securities would likely decline. If one or more of
these analysts ceases research coverage of us or fails to regularly
publish reports on us, we could lose visibility in the financial
markets, which in turn could cause the price of our securities or
trading volume to decline.
If we are unable to implement and maintain effective internal
control over financial reporting, investors may lose confidence in
the accuracy and completeness of our financial reports and the
market price of our securities may decrease.
As a public company, we are required to maintain internal control
over financial reporting and to report any material weaknesses in
such internal controls. Section 404 of the Sarbanes-Oxley Act
of 2002, or the Sarbanes-Oxley Act, requires that we evaluate and
determine the effectiveness of our internal control over financial
reporting and, beginning with our annual report for the year ending
December 31, 2018, provide a management report on our internal
control over financial reporting.
Currently, we have material weaknesses in our internal control over
financial reporting and, as a result, we may not detect errors on a
timely basis and our financial statements may be materially
misstated. Specifically, we have insufficient personnel resources
within the accounting function to segregate the duties over
financial transaction processing and reporting. We are in the
process of improving our internal control over financial reporting,
which process is time-consuming, costly and complicated. However,
we are a small organization with limited management resources. In
addition to serving as our Chief Financial Officer, David Wells
provides financial consulting services to several other companies.
These other consulting services could prevent Mr. Wells from
dedicating sufficient time and attention to us, which could limit
our ability to maintain effective internal controls over financial
reporting.
Until such time as we are no longer an “emerging growth
company” or a smaller reporting company, our auditors will
not be required to attest as to our internal control over financial
reporting. If we continue to identify material weaknesses in our
internal control over financial reporting, if we are unable to
comply with the requirements of Section 404 in a timely
manner, if we are unable to assert that our internal control over
financial reporting is effective or, if required, if our
independent registered public accounting firm is unable to attest
that our internal control over financial reporting is effective,
investors may lose confidence in the accuracy and completeness of
our financial reports and the market price of our common stock
could decrease. We could also become subject to stockholder or
other third-party litigation as well as investigations by the stock
exchange on which our securities are listed, the Securities and
Exchange Commission (the “SEC”) or other regulatory
authorities, which could require additional financial and
management resources and could result in fines, trading suspensions
or other remedies.
Our disclosure controls and procedures may not prevent or detect
all errors or acts of fraud.
We are subject to the periodic reporting requirements of the
Exchange Act. Our disclosure controls and procedures are designed
to reasonably assure that information required to be disclosed by
us in reports we file or submit under the Exchange Act is
accumulated and communicated to management, and recorded,
processed, summarized and reported within the time periods
specified by the rules and forms of the SEC. We believe that any
disclosure controls and procedures or internal controls and
procedures, no matter how well conceived and operated, can provide
only reasonable, not absolute, assurance that the objectives of the
control system are met.
These inherent limitations include the realities that judgments in
decision-making can be faulty, and that breakdowns can occur
because of simple error or mistake. Additionally, controls can be
circumvented by the individual acts of some persons, by collusion
of two or more people or by an unauthorized override of the
controls. Accordingly, because of the inherent limitations in our
control system, misstatements due to error or fraud may occur and
not be detected.
37
We are an “emerging growth company” under the JOBS Act
and we cannot be certain if the reduced disclosure requirements
applicable to emerging growth companies will make our securities
less attractive to investors.
We are an “emerging growth company,” as defined in the
Jumpstart Our Business Startups Act of 2012, or the JOBS Act, and
we may take advantage of certain exemptions from various reporting
requirements applicable to other public companies that are not
“emerging growth companies” including, but not limited
to, not being required to comply with the auditor attestation
requirements of Section 404 of the Sarbanes-Oxley Act, reduced
disclosure obligations regarding executive compensation in our
periodic reports and proxy statements, and exemptions from the
requirements of holding a nonbinding advisory vote on executive
compensation and stockholder approval of any golden parachute
payments not previously approved. We cannot predict if
investors will find our securities less attractive because we may
rely on these exemptions. If some investors find our
securities less attractive as a result, there may be a less active
trading market for our securities and the price of our securities
may be more volatile.
We will remain an “emerging growth company” for up to
five years after the date of our initial public offering, although
we will lose that status sooner if our annual revenues exceed $1
billion, if we issue more than $1 billion in non-convertible debt
in a three year period, or if the market value of our common stock
that is held by non-affiliates exceeds $700 million as of any June
30.
We have not paid dividends in the past and have no immediate plans
to pay dividends.
We plan to reinvest all of our earnings, to the extent we have
earnings, in order to further develop our technology and potential
products and to cover operating costs. We do not plan to
pay any cash dividends with respect to our securities in the
foreseeable future. We cannot assure you that we will,
at any time, generate sufficient surplus cash that would be
available for distribution to the holders of our common stock as a
dividend.
Concentration of ownership among our existing executive officers,
directors and significant stockholders may prevent new investors
from influencing significant corporate decisions.
All decisions with respect to the management of the Company are
made by our board of directors and our officers, who beneficially
own approximately 12.7% of our common stock, as calculated in
accordance with Rule 13d-3 promulgated under the Securities
Exchange Act of 1934, as amended (the “Exchange
Act”).
In
addition, Longboard Capital Advisors, LLC beneficially owns 15.7%
of our common stock, as calculated in accordance with Rule 13d-3
promulgated under the Exchange Act. As a result, this stockholder
is able to exercise a substantial level of control over all matters
requiring stockholder approval, including the election of directors
and approval of significant corporate transactions.
This control could have the effect of delaying or preventing a
change of control of the Company or changes in management, which in
turn could have a material adverse effect on the market price of
the Company’s common stock or prevent stockholders from
realizing a premium over the market price for their
shares.
We incur significant costs as a result of being a public company
that reports to the SEC and our management is required to devote
substantial time to meet compliance obligations.
As a public company listed in the United States, we incur
significant legal, accounting and other expenses. We are
subject to reporting requirements of the Exchange Act and the
Sarbanes-Oxley Act, as well as rules subsequently implemented by
the SEC and Nasdaq that impose significant requirements on public
companies, including requiring the establishment and maintenance of
effective disclosure and financial controls and corporate
governance practices. In addition, there are significant
corporate governance and executive compensation-related provisions
in the Dodd-Frank Act Wall Street Reform and Protection Act that
contribute to our legal and financial compliance costs, make some
activities more difficult, time-consuming or costly and also place
undue strain on our personnel, systems and
resources. Our management and other personnel need to
devote a substantial amount of time to these compliance
initiatives. Furthermore, these rules and regulations
may make it more difficult and more expensive for us to obtain
director and officer liability insurance, and we may be required to
accept reduced policy limits and coverage or incur substantially
higher costs to obtain the same or similar coverage. As
a result, it may be more difficult for us to attract and retain
qualified people to serve on our board of directors, our board
committees or as executive officers.
A significant portion of our total outstanding shares of common
stock is restricted from immediate resale but may be sold into the
market in the near future. This could cause the market price of our
securities to drop significantly, even if our business is doing
well.
38
Sales of a substantial number of shares of our common stock in the
public market could occur in the future. These sales, or the
perception in the market that the holders of a large number of
securities intend to sell shares, could reduce the market price of
our common stock. We currently have outstanding 3,923,027 shares of
common stock. Of these outstanding shares, approximately
1,971,521 are restricted under securities laws or as a result of
lock-up agreements but will be able to be resold in the near
future.
Future sales and issuances of our common stock or rights to
purchase common stock, including pursuant to our equity incentive
plan, could result in dilution of the percentage ownership of our
stockholders and could cause the price of our securities to
fall.
We expect that significant capital will be needed in the future to
continue our planned operations. To the extent we raise capital by
issuing common stock, convertible securities or other equity
securities, our stockholders may experience substantial dilution,
and new investors could gain rights superior to our existing
stockholders.
Our charter documents and Delaware law may inhibit a takeover that
stockholders consider favorable.
Certain provisions of our Fourth Amended and Restated Certificate
of Incorporation (our “Certificate of Incorporation”)
and Amended and Restated Bylaws (our “Bylaws”) and
applicable provisions of Delaware law may delay or discourage
transactions involving an actual or potential change in control or
change in our management, including transactions in which
stockholders might otherwise receive a premium for their shares, or
transactions that our stockholders might otherwise deem to be in
their best interests. The provisions in our Certificate
of Incorporation and Bylaws:
●
authorize
our board of directors to issue preferred stock without stockholder
approval and to designate the rights, preferences and privileges of
each class; if issued, such preferred stock would increase the
number of outstanding shares of our capital stock and could include
terms that may deter an acquisition of us;
●
limit
who may call stockholder meetings;
●
do
not provide for cumulative voting rights;
●
provide
that all vacancies in our board of directors may be filled by the
affirmative vote of a majority of directors then in office, even if
less than a quorum;
●
provide
that stockholders must comply with advance notice procedures with
respect to stockholder proposals and the nomination of candidates
for director;
●
provide
that stockholders may only amend our Certificate of Incorporation
upon a supermajority vote of stockholders; and
●
provide
that the Court of Chancery of the State of Delaware will be the
exclusive forum for certain legal claims.
In addition, section 203 of the Delaware General Corporation Law
limits our ability to engage in any business combination with a
person who beneficially owns 15% or more of our outstanding voting
stock unless certain conditions are satisfied. This
restriction lasts for a period of three years following any such
person’s share acquisition. These provisions may
have the effect of entrenching our management team and may deprive
stockholders of the opportunity to sell their shares to potential
acquirers at a premium over prevailing prices. This
potential inability to obtain a control premium could reduce the
price of our common stock.
Not
applicable.
Our
principal office is located at 3600 Green Court, Suite 350, Ann
Arbor, Michigan 48105-1570. We currently lease approximately 3,950
square feet of office and light industrial/research space under a
lease that is due to expire in 2024. The rent is approximately
$7,798 per month, subject to moderate annual
increases.
We also
maintain an office in London, Ontario, Canada, consisting of two
walled offices under a lease that is terminable by either party
with 60 days written notice. The rent is approximately $843 per
month, subject to moderate annual increases.
We
believe that, with respect to both of our facilities, equivalent
suitable space is available at similar rents.
We are
not currently a party to any pending legal proceedings that we
believe will have a material adverse effect on our business or
financial conditions. We may, however, be subject to various claims
and legal actions arising in the ordinary course of business from
time to time.
Not
applicable.
39
Market Information
Our
common stock and warrants have been listed on the Nasdaq Capital
Market under the symbols “NDRA” and
“NDRAW,” respectively, since June 28, 2017 upon the
separation of units sold in our initial public offering. Prior to
that date, our common stock and warrants traded together as a unit.
Our units began trading on the NASDAQ Capital Market under the
symbol “NDRAU” on May 9, 2017. Each of our publicly
traded warrants is exercisable for a share of our common stock at a
price of $6.25 per share and expires on May 12, 2020.
The
following table presents, for the periods indicated, the high and
low sales prices for our common stock and warrants
|
|
Common Stock
|
Warrants
|
||
|
|
High
|
Low
|
High
|
Low
|
|
Year Ended December 31, 2017
|
|
|
|
|
|
Fourth
Quarter
|
$
5.88
|
$
2.15
|
$
2.00
|
$
0.36
|
|
Third
Quarter
|
$
4.00
|
$
2.59
|
$
0.89
|
$
0.26
|
|
Second
Quarter (from June 28, 2017)
|
$
4.50
|
$
3.80
|
$
1.05
|
$
0.62
|
During
the period from May 9, 2017 (when our units first traded on the
Nasdaq Capital Market) through June 27, 2017, the high sales price
for our units was $5.50 and the low sales price was
$4.01.
As of March 15,
2018, there were
1,239
h
olders of record of our common stock and
259
holders of record of our
warrants.
Dividend Policy
We have
never paid cash dividends on our securities and we do not
anticipate paying any cash dividends on our shares of common stock
in the foreseeable future. We intend to retain any future earnings
for reinvestment in our business. Any future determination to pay
cash dividends will be at the discretion of our board of directors,
and will be dependent upon our financial condition, results of
operations, capital requirements and such other factors as our
board of directors deems relevant.
Recent Sales of Unregistered
Securities
On
November 28, 2017, we issued to a designee of Rick Rutkowski, as
compensation for consulting services, a warrant exercisable for
20,000 shares of our common stock at an exercise price of $4.49 per
share, which warrant expires on November 28, 2020.
In
connection with the issuances of the foregoing securities, the
Company relied on the exemption from registration provided by
Section 4(a)(2) of the Securities Act of 1933, as amended, for
transactions not involving a public offering.
Use of Proceeds from Registered Securities
On May
8, 2017, our Registration Statement on Form S-1, as amended (File
No. 333-193522), was declared effective by the SEC and, on May 8,
2017, our Registration Statement on Form S-1 (File No. 333-217788)
became effective upon filing with the SEC. Each such Registration
Statement was filed in connection with our initial public offering,
pursuant to which we sold 1,932,000 units, each consisting of one
share of our common stock and a warrant to purchase one share of
our common stock, at a price to the public of $5.00 per unit, which
amount includes the full exercise of the underwriters’ option
to purchase additional units. Each warrant is exercisable for a
share of our common stock at a price of $6.25 per share. The
offering closed on May 12, 2017 and the underwriters exercised
their overallotment option as of May 22, 2017, as a result of which
we raised net proceeds of approximately $8.6 million after
deducting approximately $773,000 in underwriting discounts,
commissions and expenses and approximately $297,000 in offering
expenses payable by us. National Securities Corporation and
Dougherty & Company LLC were the underwriters for the offering.
No payments were made by us to directors, officers or persons
owning ten percent or more of our common stock or to their
associates, or to our affiliates, other than payments in the
ordinary course of business to officers for salaries and to
non-employee directors as compensation for board or board committee
service.
The
common stock and warrants comprising each unit separated and began
trading separately on June 28, 2017. At such time, our units were
cancelled and ceased to be listed on the Nasdaq Capital
Market.
There
has been no material change in the planned use of proceeds from our
initial public offering as described in the final prospectus filed
with the SEC pursuant to Rule 424(b) under the Securities Act on
May 10, 2017.
Not
required for smaller reporting companies.
40
The following discussion of our financial condition and results of
operations should be read in conjunction with the financial
statements and the related notes thereto included elsewhere in this
Annual Report. This discussion and analysis contains
forward-looking statements that are based on our management’s
current beliefs and assumptions, which statements are subject to
substantial risks and uncertainties. Our actual results may differ
materially from those expressed or implied by these forward-looking
statements as a result of many factors, including those discussed
in “Risk Factors” in Item 1A of this Annual Report.
Please also see “Cautionary Note Regarding Forward Looking
Statements” at the beginning of this Annual
Report.
Overview
We have
commercialized an enhanced ultrasound technology for the
pre-clinical research market and are leveraging that expertise to
develop technology for increasing the capabilities of clinical
diagnostic ultrasound, to broaden patient access to the safe
diagnosis and treatment of a number of significant medical
conditions in circumstances where expensive X-ray computed
tomography (“CT”) and magnetic resonance imaging
(“MRI”) technology is unavailable or
impractical.
Since
2010, we have marketed and sold our Nexus 128 system, which
combines light-based thermoacoustics and ultrasound, to address the
imaging needs of researchers studying disease models in
pre-clinical applications. Sales of the Nexus 128 system were
approximately $500,000 in 2016 and $287,000 in 2017. Our Nexus 128
system is used in a number of leading global academic research
centers, including Stanford University, The University of Michigan,
Shanghai Jiao Tong University, and Purdue University. We expect to
continue to sell our Nexus 128 system to maintain a base level of
revenue, but believe the market potential for our clinical systems
is much higher.
Building
on our expertise in thermoacoustics, we developed a next-generation
technology platform — Thermo Acoustic Enhanced Ultrasound, or
TAEUS — which is intended to enhance the capability of
clinical ultrasound technology and support the diagnosis and
treatment of a number of significant medical conditions that
currently require the use of expensive CT or MRI imaging or where
imaging is not practical using existing technology.
Unlike
the near-infrared light pulses used in our Nexus 128 system, our
TAEUS technology uses radio frequency (“RF”) pulses to
stimulate tissues, using a small fraction of the energy transmitted
into the body during an MRI scan. The use of RF energy allows our
TAEUS technology to penetrate deep into tissue, enabling the
imaging of human anatomy at depths equivalent to those of
conventional ultrasound. The RF pulses are absorbed by tissue and
converted into ultrasound signals, which are detected by an
external ultrasound receiver and a digital acquisition system that
is part of the TAEUS system. The detected ultrasound is processed
into images using our proprietary algorithms and displayed to
complement conventional gray-scale ultrasound images.
We
expect that the first-generation TAEUS application will be a
standalone ultrasound accessory designed to cost-effectively
quantify fat in the liver and stage progression of non-alcoholic
fatty liver disease, or (“NAFLD”), which can only be
achieved today with impractical surgical biopsies or MRI scans.
Subsequent TAEUS offerings are expected to be implemented via a
second generation hardware platform that can run multiple clinical
software applications that we will offer TAEUS users for a one-time
licensing fee – adding ongoing customer value to the TAEUS
platform and a growing software revenue stream for our
Company.
Each of
our TAEUS platform applications will require regulatory approvals
before we are able to sell or license the application. Based on
certain factors, such as the installed base of ultrasound systems,
availability of other imaging technologies, such as CT and MRI,
economic strength and applicable regulatory requirements, we intend
to seek initial approval of our applications for sale in the
European Union, followed by the United States and
China.
In
April 2016, we entered into a Collaborative Research Agreement with
General Electric Company, acting through its GE Healthcare business
unit and the GE Global Research Center (collectively, “GE
Healthcare”). Under the terms of the agreement, GE Healthcare
has agreed to assist us in our efforts to commercialize our TAEUS
technology for use in a fatty liver application by, among other
things, providing equipment and technical advice, and facilitating
introductions to GE Healthcare clinical ultrasound customers. In
return for this assistance, we have agreed to afford GE Healthcare
certain rights of first offer with respect to manufacturing and
licensing rights for the target application. More specifically, we
have agreed that, prior to commercially releasing our NAFLD TAEUS
application, we will offer to negotiate an exclusive ultrasound
manufacturer relationship with GE Healthcare for a period of at
least one year of commercial sales. The commercial sales would
involve, within our sole discretion, either our Company
commercially selling GE Healthcare ultrasound systems as the
exclusive ultrasound system with our TAEUS fatty liver application
embedded, or GE Healthcare being the exclusive ultrasound
manufacturer to sell ultrasound systems with our TAEUS fatty liver
application embedded. The agreement is subject to termination by
either party upon not less than 60 days’ notice. On
January 30, 2018, we and GE Healthcare entered into an amendment to
our agreement, extending its term by 21 months to January 22,
2020.
41
On
November 2, 2017 we announced that we have partnered with StarFish
Medical (“StarFish”), a medical device development and
contract manufacturing company, and CriTech Research Inc.
(“CriTech”), a U.S. firm specializing in medical device
software development, to commence productization of our TAEUS
device targeting NAFLD. The agreements call for StarFish and
CriTech to provide us with the specialized engineering resources
necessary to translate our current prototype TAEUS device into a
clinical product meeting CE regulatory requirements required for
commercial launch in the European Union followed by FDA submission
for the U.S. market.
In
November 2017, we also contracted the Centre for Imaging Technology
Commercialization (CIMTEC) to initiate human studies with our TAEUS
device.
Financial Operations Overview
Revenue
To date
our revenue has been generated by the placement and sale of our
Nexus 128 system for use in pre-clinical applications.
Cost of Goods Sold
Our
cost of goods sold is related to our direct costs associated with
the development and shipment of our thermoacoustic imaging systems
placed in pre-clinical settings.
Research and Development Expenses
Our
research and development expenses primarily include wages, fees and
equipment for the development of our TAEUS technology platform and
our proposed applications. Additionally, we incur certain costs
associated with the protection of our products and inventions
through a combination of patents, licenses, applications and
disclosures.
Sales and Marketing Expenses
Sales
and marketing expenses consist primarily of advertising, marketing
and consulting expenses and headcount. Currently, our marketing
efforts for our pre-clinical business are through distributors in
China, the European Union, Australia, Korea and the United Kingdom,
our website, and attendance of key industry meetings. In connection
with the commercialization of our TAEUS applications, we expect to
build a small sales and marketing team to train and support global
ultrasound distributors, as well as execute traditional marketing
activities such as promotional materials, electronic media and
participation in industry conferences.
General and Administrative Expenses
General
and administrative expenses consist primarily of salaries and
related expenses for our management and personnel, and professional
fees, such as accounting, consulting and legal.
Critical Accounting Policies and Estimates
Use of Estimates
The
preparation of the financial statements in conformity with
accounting principles generally accepted in the United States
requires management to make estimates and assumptions that affect
the reported amounts of assets and liabilities, and disclosure of
contingent liabilities at the date of the financial statements and
the reported amounts of expenses during the reporting period.
Actual results could differ from those estimates.
Management
makes estimates that affect certain accounts including deferred
income tax assets, accrued expenses, fair value of equity
instruments and reserves for any other commitments or
contingencies. Any adjustments applied to estimates are recognized
in the period in which such adjustments are
determined.
42
Share-based Compensation
Our
2016 Omnibus Incentive Plan permits the grant of share options and
shares to our employees, consultants and non-employee members of
our board of directors for up to 1,345,074 shares of common stock.
We record share-based compensation in accordance with the
provisions of the Share-based Compensation Topic of the FASB
Codification. The guidance requires the use of option-pricing
models that require the input of highly subjective assumptions,
including the option’s expected life and the price volatility
of the underlying stock. The fair value of each option grant is
estimated on the date of grant using the Black-Scholes option
valuation model which uses certain assumptions related to risk-free
interest rates, expected volatility, expected life of the common
stock options, and future dividends, and the resulting charge is
expensed using the straight-line attribution method over the
vesting period.
Stock
compensation expense recognized during the period is based on the
value of share-based awards that were expected to vest during the
period adjusted for estimated forfeitures. The estimated fair value
of grants of stock options and warrants to non-employees is charged
to expense, if applicable, in the financial
statements.
Recent Accounting Pronouncements
See
Note 2 of the financial statements for a discussion of recently
issued accounting standards.
Results of Operations
Years Ended December 31, 2017 and 2016
Revenues
We had
revenue of $351,622 for the year ended December 31, 2017, as
compared to $515,582 for the year ended December 31, 2016, a
decrease of $163,960, or 32%. The revenue was a result of the sale
of one of our Nexus 128 laboratory imaging systems and product
service fees generated from our installed base of Nexus 128
laboratory imaging systems. The decrease in 2017 over 2016 was due
to our limited resources during the first half of 2017 and our
decision to focus those resources on developing our TAEUS
applications.
Cost of Goods Sold
Cost of
goods sold was $172,782 and $235,878 for the years ended December
31, 2017 and 2016, respectively, a decrease of $63,096, or 27%.
Cost of goods sold was a result of direct costs associated with the
sale of one of our Nexus 128 laboratory imaging systems, and
product service materials required for the service of our installed
base of Nexus 128 laboratory imaging systems. Gross margin was
approximately 51% and 54% for the years ended December 31, 2017 and
2016, respectively. Cost of goods sold decreased as a result of a
decrease in units sold. The decrease in gross margin resulted from
an increase in the cost of certain parts used to assemble the
systems sold.
Research and Development
Research
and development expenses were $1,931,075 for the year ended
December 31, 2017, as compared to $495,377 for the year ended
December 31, 2016, an increase of $1,435,698, or 290%. The costs
include primarily wages, fees and equipment for the development of
our TAEUS product line. Research and development expenses increased
from the same period for the prior year due primarily to increased
efforts to develop TAEUS applications with proceeds from our May
2017 initial public offering (the “IPO”).
Sales and Marketing
Sales
and marketing expenses were $122,604 for the year ended December
31, 2017, as compared to $34,130 for the year ended December 31,
2016, an increase of $88,474, or 259%. The increase was primarily
due to the hiring of a full-time sales representative for our Nexus
128 product line. Currently our marketing efforts for our
pre-clinical business are through distributors in China, the
European Union, Australia and the United Kingdom, our website and
attendance of key industry meetings. Our future clinical business
will involve hiring and training additional staff to support our
sales efforts. As we seek to complete the development and
commercialization of our TAEUS applications, we intend to build a
small sales and marketing team to train and support global
ultrasound distributors, as well as execute traditional marketing
activities such as promotional materials, electronic media and
participation in industry conferences.
43
General and Administrative
Our
general and administrative expenses for the year ended December 31,
2017 were $2,751,219, an increase of $1,209,264, or 78%, compared
to $1,541,956 for the year ended December 31, 2016. General and
administrative expenses increased due to an increase in headcount
and one-time expenses related to the IPO. Our wage and related
expenses for the year ended December 31, 2017 were $1,286,326,
compared to $705,556 for the year ended December 31, 2016. Wage and
related expenses in the year ended December 31, 2017 included
$704,008 of stock compensation expense related to the issuance and
vesting of options, compared to $193,420 of stock compensation
expense for the same period in 2016. Our professional fees for the
year ended December 31, 2017 were $1,092,706, compared to $602,877
for the year ended December 31, 2016. We expect that our general
and administrative expenses will increase significantly as a result
of our becoming a public company.
Net Loss
As a
result of the foregoing, for the year ended December 31, 2017, we
recorded a net loss of $5,376,962 compared to a net loss of
$2,775,368 for the year ended December 31, 2016.
Liquidity and Capital Resources
To date we have generated only limited revenues from sales of our
Nexus 128 system. We have funded our operations to date through
private and public sales of our securities. As of December 31,
2017, we had approximately $5.6 million in cash. In May 2017, we
completed the IPO, raising net proceeds of approximately $8.6
million after deducting offering expenses of approximately $0.8
million in underwriting discounts, commissions and expenses and
approximately $0.3 million in offering expenses payable by the
Company.
We
believe that cash on hand at December 31, 2017 and other potential
sources of cash, including revenues we generate from sales of our
Nexus 128 system, will be sufficient to fund our current operations
into the third quarter of 2018. If we do not raise additional
capital in the next several months we will need to significantly
slow or pause our business activities until such time as we are
able to raise additional capital. We are currently exploring
potential financing options that may be available to us, including
additional sales of our common stock. However, we have no
commitments to obtain any additional funds, and there can be no
assurance such funds will be available on acceptable terms or at
all. If we are unable to obtain additional financing in a timely
fashion and on terms acceptable to us, our financial condition and
results of operations may be materially adversely affected and we
may not be able to continue operations or execute our stated
commercialization plan.
The financial statements included in this Annual Report have been
prepared assuming we will continue as a going concern, which
contemplates the realization of assets and the settlement of
liabilities and commitments in the normal course of business. As
reflected in the accompanying financial statements, during the year
ended December 31, 2017, we incurred net losses of approximately
$5.4 million, and used cash in operations of approximately $3.3
million. These and other factors raise substantial doubt about our
ability to continue as a going concern for one year from the
issuance of the financial statements. The financial statements do
not include any adjustments that might be necessary should we be
unable to continue as a going concern.
Operating Activities
During
the year ended December 31, 2017, we used $3,300,914 of cash in
operating activities primarily as a result of our net loss of
$5,376,962, offset by amortization of discount of convertible debt
of $711,472, share-based compensation of $1,002,957, $61,481 in
depreciation and amortization expenses, $1,480 in imputed interest
and net changes in operating assets and liabilities of
$298,659.
During
the year ended December 31, 2016, we used $1,315,623 of cash in
operating activities primarily as a result of our net loss of
$2,775,369, offset in part by net changes in operating assets and
liabilities of $254,981, $64,936 in depreciation and amortization
expense, $230,326 in non-cash stock compensation expense, $899,976
for the amortization of discount of convertible debt, imputed
interest of $3,704, and $5,823 for additional warrants issued
during the warrant exchange program, pursuant to which we issued
warrants to participating warrant holders in exchange for such
participants’ exercising their then-held
warrants.
44
Investing Activities
During
the year ended December 31, 2017, we used $7,862 in investing
activities related to purchase of equipment. There were no
investing activities for the year ended December 31,
2016.
Financing Activities
During
the year ended December 31, 2017, financing activities provided
$8,590,700 in proceeds from the IPO and $225,000 in proceeds from
convertible notes. We used $50,000 in repayments of notes
payable.
During
the year ended December 31, 2016, financing activities provided
$1,441,448, including $5,000 from common stock issued for cash,
$50,000 in proceeds from notes payable, $132,000 in proceeds from
the issuance of convertible notes, related party, and $1,254,448 in
proceeds from the issuance of convertible notes.
Funding Requirements
We have
not completed development of our TAEUS technology platform
applications. We expect to continue to incur significant expenses
for the foreseeable future. We anticipate that our expenses will
increase substantially as we:
●
advance
the engineering design and development of our NAFLD TAEUS
application;
●
prepare
applications required for marketing approval of our NAFLD TAEUS
application in the European Union and the United
States;
●
seek to
hire a small internal marketing team to engage and support channel
partners and clinical customers for our NAFLD TAEUS
application;
●
commence marketing
of our NAFLD TAEUS application;
●
advance
development of our other TAEUS applications; and
●
add
operational, financial and management information systems and
personnel, including personnel to support our product development,
planned commercialization efforts and our operation as a public
company.
It is
possible that we will not achieve the progress that we expect
because the actual costs and timing of completing the development
and regulatory approvals for a new medical device are difficult to
predict and are subject to substantial risks and delays. We have no
committed external sources of funds. We do not expect that our
existing cash will be sufficient for us to complete the
commercialization of our NAFLD TAEUS application or to complete the
development of any other TAEUS application and we will need to
raise substantial additional capital for those purposes. As a
result, we will need to finance our future cash needs through
public or private equity offerings, debt financings, corporate
collaboration and licensing arrangements or other financing
alternatives. Our forecast of the period of time through which our
financial resources will be adequate to support our operations is a
forward-looking statement and involves risks and uncertainties, and
actual results could vary as a result of a number of factors,
including the factors discussed in the section of this Annual
Report entitled “Risk Factors” and elsewhere in this
Annual Report. We have based this estimate on assumptions that may
prove to be wrong, and we could utilize our available capital
resources sooner than we currently expect.
Until
we can generate a sufficient amount of revenue from our TAEUS
platform applications, if ever, we expect to finance future cash
needs through public or private equity offerings, debt financings
or corporate collaborations and licensing arrangements. Additional
funds may not be available when we need them on terms that are
acceptable to us, or at all. If adequate funds are not available,
we may be required to delay, reduce the scope of or eliminate one
or more of our research or development programs or our
commercialization efforts. To the extent that we raise additional
funds by issuing equity securities, our stockholders may experience
additional dilution, and debt financing, if available, may involve
restrictive covenants. To the extent that we raise additional funds
through collaborations and licensing arrangements, it may be
necessary to relinquish some rights to our technologies or
applications or grant licenses on terms that may not be favorable
to us. We may seek to access the public or private capital markets
whenever conditions are favorable, even if we do not have an
immediate need for additional capital at that time.
Off-Balance Sheet Transactions
At
December 31, 2017, the Company did not have any transactions,
obligations or relationships that could be considered off-balance
sheet arrangements.
Not
applicable.
45
Index to Financial Statements
ENDRA Life
Sciences Inc.
December 31, 2017
|
|
Page
|
|
|
|
|
Report
of Independent Registered Public Accounting Firm
|
F-1
|
|
|
|
|
Consolidated
Balance Sheets as of December 31, 2017 and 2016
|
F-2
|
|
|
|
|
Consolidated
Statements of Operations for the years ended December 31, 2017 and
2016
|
F-3
|
|
|
|
|
Consolidated
Statements of Changes in Stockholders’ Equity (Deficit) for
the years ended December 31, 2017 and 2016
|
F-4
|
|
|
|
|
Consolidated
Statements of Cash Flows for the years ended December 31, 2017 and
2016
|
F-5
|
|
|
|
|
Notes
to Consolidated Financial Statements for the years ended December
31, 2017 and 2016
|
F-6
|
46
Report of Independent Registered Public Accounting
Firm
To the
Board of Directors and Stockholders of
ENDRA Life Sciences Inc. and Subsidiary
Opinion on the Financial Statements
We have
audited the accompanying consolidated balance sheets of ENDRA Life
Sciences Inc. and Subsidiary (the Company) as of December 31, 2017
and 2016, and the related consolidated statements of operations,
stockholders’ equity (deficit), and cash flows for each of
the years in the two-year period ended December 31, 2017, and the
related notes (collectively referred to as the consolidated
financial statements). In our opinion, the consolidated financial
statements present fairly, in all material respects, the financial
position of the Company as of December 31, 2017 and 2016, and the
consolidated results of its operations and its cash flows for the
years ended December 31, 2017 and 2016, in conformity with
accounting principles generally accepted in the United States of
America.
The Company's Ability to Continue as a Going
Concern
The
accompanying consolidated financial statements have been prepared
assuming that the Company will continue as a going concern. As
discussed in Note 2 to the financial statements, the Company has an
accumulated deficit, recurring losses, and expects continuing
future losses, and has stated that substantial doubt exists about
the Company’s ability to continue as a going concern.
Management's evaluation of the events and conditions and
management’s plans regarding these matters are also described
in Note 2. The consolidated financial statements do not include any
adjustments that might result from the outcome of this
uncertainty.
Basis for Opinion
These
consolidated financial statements are the responsibility of the
Company’s management. Our responsibility is to express an
opinion on the Company’s consolidated financial statements
based on our audits. We are a public accounting firm registered
with the Public Company Accounting Oversight Board (United States)
(PCAOB) and are required to be independent with respect to the
Company in accordance with the U.S. federal securities laws and the
applicable rules and regulations of the Securities and Exchange
Commission and the PCAOB.
We
conducted our audits in accordance with the standards of the PCAOB.
Those standards require that we plan and perform the audit to
obtain reasonable assurance about whether the financial statements
are free of material misstatement, whether due to error or fraud.
The Company is not required to have, nor were we engaged to
perform, an audit of its internal control over financial reporting.
As part of our audits, we are required to obtain an understanding
of internal control over financial reporting, but not for the
purpose of expressing an opinion on the effectiveness of the
Company’s internal control over financial reporting.
Accordingly, we express no such opinion.
Our
audits included performing procedures to assess the risks of
material misstatement of the financial statements, whether due to
error or fraud, and performing procedures that respond to those
risks. Such procedures included examining, on a test basis,
evidence regarding the amounts and disclosures in the financial
statements. Our audits also included evaluating the accounting
principles used and significant estimates made by management, as
well as evaluating the overall presentation of the financial
statements. We believe that our audits provide a reasonable basis
for our opinion.
|
/s/
RBSM LLP
|
|
|
|
|
|
We have
served as the Company’s auditor since 2015.
|
|
|
|
|
|
Henderson,
NV
|
|
|
|
|
|
March
20, 2018
|
|
F-1
ENDRA Life
Sciences Inc.
|
|
December
31,
|
December
31,
|
|
Assets
|
2017
|
2016
|
|
Assets
|
|
|
|
Cash
|
$
5,601,878
|
$
144,953
|
|
Accounts
receivable
|
6,850
|
-
|
|
Prepaid
expenses
|
67,496
|
-
|
|
Inventory
|
191,680
|
40,105
|
|
Other current
assets
|
14,249
|
10,535
|
|
Total Current
Assets
|
5,882,153
|
195,593
|
|
Other
Assets
|
|
|
|
Fixed assets,
net
|
241,549
|
295,168
|
|
Total
Assets
|
$
6,123,702
|
$
490,761
|
|
|
|
|
|
Liabilities
and Stockholders’ Equity (Deficit)
|
|
|
|
Current
Liabilities:
|
|
|
|
Accounts payable
and accrued liabilities
|
$
848,214
|
$
434,552
|
|
Notes
payable
|
-
|
50,000
|
|
Convertible notes
payable, related party, net of discount
|
-
|
99,804
|
|
Convertible notes
payable, net of discount
|
-
|
800,172
|
|
Total Current
Liabilities
|
848,214
|
1,384,528
|
|
Total
Liabilities
|
848,214
|
1,384,528
|
|
|
|
|
|
Stockholders’
Equity (Deficit)
|
|
|
|
Preferred stock,
$0.0001 par value; 10,000,000 shares authorized; no shares issued
or outstanding
|
-
|
-
|
|
Common stock,
$0.0001 par value; 50,000,000 shares authorized; 3,923,027 and
723,335 shares issued and outstanding
|
392
|
72
|
|
Stock
payable
|
-
|
81,000
|
|
Additional paid in
capital
|
23,170,531
|
11,543,634
|
|
Accumulated
deficit
|
(17,895,435
)
|
(12,518,473
)
|
|
Total
Stockholders’ Equity (Deficit)
|
5,275,488
|
(893,767
)
|
|
Total
Liabilities and Stockholders’ Equity (Deficit)
|
$
6,123,702
|
$
490,761
|
The
accompanying notes are an integral part of these consolidated
financial statements.
F-2
ENDRA
Life Sciences
Inc.
|
|
Year Ended
|
Year Ended
|
|
|
December 31,
|
December 31,
|
|
|
2017
|
2016
|
|
Revenue
|
$
351,622
|
$
515,582
|
|
|
|
|
|
Cost
of Goods Sold
|
172,782
|
235,878
|
|
|
|
|
|
Gross Profit
|
$
178,840
|
$
279,704
|
|
|
|
|
|
Operating Expenses
|
|
|
|
Research
and development
|
1,931,075
|
495,377
|
|
Sales
and marketing
|
122,604
|
34,130
|
|
General
and administrative
|
2,751,219
|
1,541,955
|
|
Total
operating expenses
|
4,804,898
|
2,071,461
|
|
|
|
|
|
Operating
loss
|
(4,626,058
)
|
(1,791,758
)
|
|
|
|
|
|
Other Expenses
|
|
|
|
Loss
on warrant exercise
|
-
|
(5,823
)
|
|
Other
income (expense)
|
(750,904
)
|
(977,787
)
|
|
Total
other expenses
|
(750,904
)
|
(983,610
)
|
|
|
|
|
|
Loss
from operations before income taxes
|
(5,376,962
)
|
(2,775,368
)
|
|
|
|
|
|
Provision
for income taxes
|
-
|
-
|
|
|
|
|
|
Net Loss
|
$
(5,376,962
)
|
$
(2,775,368
)
|
|
|
|
|
|
Net
loss per share – basic and diluted
|
$
(1.95
)
|
$
(3.84
)
|
|
|
|
|
|
Weighted average common shares – basic and
diluted
|
2,756,956
|
723,283
|
The
accompanying notes are an integral part of these consolidated
financial statements.
F-3
ENDRA
Life
Sciences
Inc.
Consolidated
Statements of Stockholders’ Equity
(Deficit)
|
|
Common stock
|
|
|
|
|
|
|
|
Shares
|
Amount
|
Additional Paid in Capital
|
Stock Payable
|
Accumulated
Deficit
|
Total Stockholders' Equity/(Deficit)
|
|
Balance as of December 31, 2016
|
723,335
|
$
72
|
$
11,543,634
|
$
81,000
|
$
(12,518,473
)
|
$
(893,767
)
|
|
IPO
shares
|
1,680,000
|
168
|
7,431,332
|
-
|
-
|
7,431,500
|
|
Overallotment
for IPO
|
252,000
|
25
|
1,159,175
|
-
|
-
|
1,159,200
|
|
Note
conversion
|
1,232,859
|
123
|
1,950,956
|
-
|
-
|
1,951,079
|
|
Common
stock issued for services
|
34,833
|
4
|
103,734
|
(81,000
)
|
-
|
22,738
|
|
Warrants
issued for services
|
-
|
-
|
32,709
|
-
|
-
|
32,709
|
|
Fair
value of vested stock options
|
-
|
-
|
947,511
|
-
|
-
|
947,511
|
|
Imputed
interest on promissory notes
|
-
|
-
|
1,480
|
-
|
-
|
1,480
|
|
Net
loss
|
-
|
-
|
-
|
-
|
(5,376,962
)
|
(5,376,962
)
|
|
Balance as of December 31, 2017
|
3,923,027
|
$
392
|
$
23,170,531
|
$
-
|
$
(17,895,435
)
|
$
5,275,488
|
The
accompanying notes are an integral part of these
consolidated
financial
statements.
F-4
ENDRA
Life
Sciences
Inc.
|
|
Year Ended
|
Year Ended
|
|
|
December 31,
|
December 31,
|
|
|
2017
|
2016
|
|
Cash
Flows from Operating Activities
|
|
|
|
Net
loss
|
$
(5,376,962
)
|
$
(2,775,369
)
|
|
Adjustments to
reconcile net loss to net cash used in operating
activities:
|
|
|
|
Depreciation and
amortization
|
61,481
|
64,936
|
|
Common stock,
options and warrants issued for services
|
1,002,957
|
230,326
|
|
Addition warrants
issued during exchange
|
-
|
5,823
|
|
Interest on
discount of convertible debt
|
711,472
|
899,976
|
|
Imputed interest on
promissory notes
|
1,480
|
3,704
|
|
Changes in
operating assets and liabilities:
|
|
|
|
Increase in
accounts receivable
|
(6,850
)
|
-
|
|
Increase in prepaid
expenses
|
(67,497
)
|
-
|
|
Increase (decrease)
in inventory
|
(151,574
)
|
58,899
|
|
Increase in other
asset
|
(3,714
)
|
(2,049
)
|
|
Increase in
accounts payable and accrued liabilities
|
528,294
|
198,131
|
|
Net cash used in
operating activities
|
(3,300,914
)
|
(1,315,623
)
|
|
|
|
|
|
Cash
Flows from Investing Activities:
|
|
|
|
Purchases of fixed
assets
|
(7,862
)
|
-
|
|
Net cash used in
investing activities
|
(7,862
)
|
-
|
|
|
|
|
|
Cash
Flows from Financing Activities
|
|
|
|
Proceeds from
issuance of common stock, net
|
8,590,700
|
5,000
|
|
Proceeds from notes
payable
|
-
|
50,000
|
|
Repayment of notes
payable
|
(50,000
)
|
132,000
|
|
Proceeds from
convertible notes
|
225,000
|
1,254,448
|
|
Net cash provided
by financing activities
|
8,765,700
|
1,441,448
|
|
|
|
|
|
Net Increase in
cash
|
5,456,924
|
125,825
|
|
|
|
|
|
Cash, beginning of
period
|
144,953
|
19,128
|
|
|
|
|
|
Cash,
end of period
|
$
5,601,878
|
$
144,953
|
|
|
|
|
|
Supplemental
disclosures:
|
|
|
|
Interest
paid
|
$
-
|
$
-
|
|
Income
tax paid
|
$
-
|
$
-
|
|
|
|
|
|
Supplemental
disclosures of non-cash Items:
|
|
|
|
Discount on
convertible notes
|
$
225,000
|
$
-
|
|
Common shares to be
issued for accrued salaries - related parties
|
$
-
|
$
60,910
|
|
Conversion of
convertible notes and accrued interest
|
$
1,726,079
|
$
-
|
The
accompanying notes are an integral part of these
consolidated financial
statements.
F-5
ENDRA Life Sciences Inc.
Notes to Consolidated Financial Statements
For the years ended December 31, 2017 and 2016
ENDRA
Life Sciences Inc. (“ENDRA” or the
“Company”) is developing a medical imaging technology
based on the thermoacoustic effect that improves the sensitivity
and specificity of clinical ultrasound.
On May
8, 2017, the Company effected a 1-for-3.5 reverse stock split (the
“Reverse Split”) of the Company’s common stock,
with no reduction in authorized capital stock. In the Reverse
Split, every 3.5 outstanding shares of common stock became one (1)
share of common stock. See Note 6 below.
All
common stock and stock incentive plan information in these
financial statements reflect the Reverse Split.
ENDRA
was incorporated on July 18, 2007 as a Delaware
corporation.
ENDRA
Life Sciences Canada Inc. was organized under the laws of Ontario,
Canada on July 6, 2017, and is wholly owned by the
Company.
Use of Estimates
The
preparation of the financial statements in conformity with
accounting principles generally accepted in the United States
requires management to make estimates and assumptions that affect
the reported amounts of assets and liabilities, and disclosure of
contingent liabilities at the date of the financial statements and
the reported amounts of expenses during the reporting period.
Actual results could differ from those estimates.
Management
makes estimates that affect certain accounts including deferred
income tax assets, accrued expenses, fair value of equity
instruments and reserves for any other commitments or
contingencies. Any adjustments applied to estimates are recognized
in the period in which such adjustments are
determined.
Principles of Consolidation
The Company’s consolidated financial statements include all
accounts of the Company and its consolidated subsidiary and/or
entities as of reporting period ending date(s) and for the
reporting period(s) then ended. All inter-company balances and
transactions have been eliminated.
Basis of Presentation
The accompanying consolidated financial statements and related
notes have been prepared pursuant to the rules and regulations of
the Securities and Exchange Commission (the
“SEC”).
Cash and Cash Equivalents
The Company considers all cash on hand and in banks, including
accounts in book overdraft positions, certificates of deposit and
other highly-liquid investments with maturities of one year or
less, when purchased, to be cash and cash equivalents. As of
December 31, 2017 and December 31, 2016, the Company had no cash
equivalents. The Company maintains its cash in bank deposit
accounts which, at times, may exceed federally insured
limits.
Inventory
The
Company’s inventory is stated at the lower of cost or
estimated realizable value, with cost primarily determined on a
weighted-average cost basis on the first-in, first-out
(“FIFO”) method. The Company periodically determines
whether a reserve should be taken for devaluation or obsolescence
of inventory. As of December 31, 2017 and December 31, 2016, no
such reserve was taken.
F-6
Capitalization of Fixed Assets
The Company capitalizes expenditures related to property and
equipment, subject to a minimum rule, that have a useful life
greater than one year for: (1) assets purchased; (2) existing
assets that are replaced, improved or the useful lives have been
extended; or (3) all land, regardless of cost. Acquisitions of new
assets, additions, replacements and improvements (other than land)
costing less than the minimum rule in addition to maintenance and
repair costs, including any planned major maintenance activities,
are expensed as incurred.
Capitalization of Intangible Assets
The Company records the purchase of intangible assets not purchased
in a business combination in accordance with the ASC Topic
350.
Revenue Recognition
The
Company recognizes revenue in accordance with the requirements of
ASC 605-10-599, which directs that it should recognize revenue when
(1) persuasive evidence of an arrangement exists (contracts); (2)
delivery has occurred; (3) the seller’s price is fixed or
determinable (per the customer’s contract); and (4)
collectability is reasonably assured (based upon our credit
policy). For products sold to end-users revenue is recognized when
title has passed to the customer and collectability is reasonably
assured; and no further efforts are required. Future revenue from
anticipated new products will follow this same policy.
Income Taxes
The
Company utilizes ASC 740, “Income Taxes,” which
requires the recognition of deferred tax assets and liabilities for
the expected future tax consequences of events that have been
included in the financial statements or tax returns. Under this
method, deferred tax assets and liabilities are determined based on
the difference between the tax basis of assets and liabilities and
their financial reporting amounts based on enacted tax laws and
statutory tax rates applicable to the periods in which the
differences are expected to affect taxable income. A valuation
allowance is recorded when it is “more likely-than-not”
that a deferred tax asset will not be realized.
The
Company generated a deferred tax asset through net operating loss
carry-forwards. However, a valuation allowance of 100% has been
established due to the uncertainty of the Company’s
realization of the net operating loss carry forward prior to its
expiration.
Research and Development Costs
The
Company follows ASC 730-10, “Research and Development”.
Research and development costs are charged to the statement of
operations as incurred. During the years ended December 31, 2017
and December 31, 2016, the Company incurred $1,931,075 and $495,677
of expenses related to research and development costs,
respectively.
Net Earnings (Loss) Per Common Share
The
Company computes earnings per share under ASC Subtopic 260-10,
Earnings Per Share (“ASC 260-10”). Basic earnings
(loss) per share is computed by dividing the net income (loss)
attributable to the common stockholders (the numerator) by the
weighted average number of shares of common stock outstanding (the
denominator) during the reporting periods. Diluted loss per
share is computed by increasing the denominator by the weighted
average number of additional shares that could have been
outstanding from securities convertible into common stock (using
the “treasury stock” method), unless their effect on
net loss per share is anti-dilutive. There were 3,208,262 and
1,346,441 potentially dilutive shares, which include outstanding
common stock options, warrants, and convertible notes, as of
December 31, 2017 and December 31, 2016, respectively.
The
potential shares, which are excluded from the determination of
basic and diluted net loss per share as their effect is
anti-dilutive, are as follows:
|
|
December 31,
2017
|
December 31,
2016
|
|
Options
to purchase common stock
|
940,121
|
151,881
|
|
Warrants
to purchase common stock
|
2,268,141
|
152,812
|
|
Convertible
notes
|
-
|
1,041,748
|
|
Potential
equivalent shares excluded
|
3,208,262
|
1,346,441
|
F-7
Fair Value Measurements
Disclosures about fair value of financial instruments require
disclosure of the fair value information, whether or not recognized
in our balance sheet, where it is practicable to estimate that
value. As of December 31, 2017 and December 31, 2016, the amounts
reported for cash, accrued liabilities and accrued interest
approximated fair value because of their short
maturities.
In accordance with ASC Topic 820, “Fair Value Measurements
and Disclosures,” the Company measures certain financial
instruments at fair value on a recurring basis. ASC Topic 820
defines fair value, established a framework for measuring fair
value in accordance with accounting principles generally accepted
in the United States, and expands disclosures about fair value
measurements.
Fair value is defined as the price that would be received to sell
an asset or paid to transfer a liability in an orderly transaction
between market participants at the measurement date. ASC Topic 820
established a three-tier fair value hierarchy, which prioritizes
the inputs used in measuring fair value. The hierarchy gives the
highest priority to unadjusted quoted prices in active markets for
identical assets or liabilities (Level 1 measurements) and the
lowest priority to unobservable inputs (Level 3 measurements).
These tiers include:
|
|
●
|
Level
1, defined as observable inputs such as quoted prices for identical
instruments in active markets;
|
|
|
|
|
|
|
●
|
Level
2, defined as inputs other than quoted prices in active markets
that are either directly or indirectly observable such as quoted
prices for similar instruments in active markets or quoted prices
for identical or similar instruments in markets that are not
active; and
|
|
|
|
|
|
|
●
|
Level
3, defined as unobservable inputs in which little or no market data
exists, therefore requiring an entity to develop its own
assumptions, such as valuations derived from valuation techniques
in which one or more significant inputs or significant value
drivers are unobservable.
|
Financial
assets are considered Level 3 when their fair values are determined
using pricing models, discounted cash flow methodologies or similar
techniques and at least one significant model assumption or input
is unobservable.
The
carrying amounts of the Company’s financial assets and
liabilities, including cash, prepaid expenses, accounts payable,
accrued expenses, and other current liabilities, approximate their
fair values because of the short maturity of these instruments. The
fair value of notes payable and convertible notes approximates
their fair values since the current interest rates and terms on
these obligations are the same as prevailing market
rates.
Share-based Compensation
The
Company’s 2016 Omnibus Incentive Plan permits the grant of
stock options and other share-based award to its employees,
consultants and non-employee members of the board of directors
covering up to 1,345,074 shares of common stock, of which
approximately 500,000 remain available to be granted. The Company
records share-based compensation in accordance with the provisions
of the Share-based Compensation Topic of the FASB Codification. The
guidance requires the use of option-pricing models that require the
input of highly subjective assumptions, including the
option’s expected life and the price volatility of the
underlying stock. The fair value of each option grant is estimated
on the date of grant using the Black-Scholes option valuation
model, and the resulting charge is expensed using the straight-line
attribution method over the vesting period. The Company has elected
to use the calculated value method to account for the options it
issued in 2017 (prior to commencement on June 28, 2017 of public
trading in the Company’s common stock) and in 2016. Under the
Share-based Compensation Topic of the FASB Codification, a
nonpublic entity that is unable to estimate the expected volatility
of the price of its underlying share may measure awards based on a
“calculated value,” which substitutes the volatility of
appropriate public companies (representative of the company’s
size and industry) as a bench mark for the volatility of the
entity’s own share price. Prior to June 28, 2017, there was
no active market for the Company’s common shares. The Company
has used the historical closing values of these companies to
estimate volatility, which was calculated to be 90%.
Stock
compensation expense recognized during the period is based on the
value of share-based awards that were expected to vest during the
period adjusted for estimated forfeitures. The estimated fair value
of grants of stock options and warrants to non-employees of the
Company is charged to expense, if applicable, in the financial
statements. These options vest in the same manner as the employee
options granted under the stock incentive plan as described
above.
F-8
Beneficial Conversion Feature
If the
conversion feature of conventional convertible debt provides for a
rate of conversion that is below market value, this feature is
characterized as a beneficial conversion feature
(“BCF”). A BCF is recorded by the Company as a debt
discount pursuant to ASC Topic 470-20 “Debt with Conversion
and Other Options.” In those circumstances, the convertible
debt is recorded net of the discount related to the BCF and the
Company amortizes the discount to interest expense over the life of
the debt using the effective interest method.
Debt Discount
The
Company determines if the convertible debenture should be accounted
for as liability or equity under ASC 480, Liabilities —
Distinguishing Liabilities from Equity. ASC 480 applies to certain
contracts involving a company’s own equity, and requires that
issuers classify the following freestanding financial instruments
as liabilities: mandatorily redeemable financial instruments,
obligations that require or may require repurchase of the
issuer’s equity shares by transferring assets (e.g., written
put options and forward purchase contracts), and certain
obligations where at inception the monetary value of the obligation
is based solely or predominantly on:
●
A
fixed monetary amount known at inception (for example, a payable
settleable with a variable number of the issuer’s equity
shares with an issuance date fair value equal to a fixed dollar
amount);
●
Variations
in something other than the fair value of the issuer’s equity
shares (for example, a financial instrument indexed to the S&P
500 and settleable with a variable number of the issuer’s
equity shares); or
●
Variations
inversely related to changes in the fair value of the
issuer’s equity shares (for example, a written put that could
be net share settled).
If the
entity determined the instrument meets the guidance under ASC 480,
the instrument is accounted for as a liability with a respective
debt discount. The Company records debt discounts in connection
with raising funds through the issuance of promissory notes (see
Note 5). These costs are amortized to noncash interest expense over
the life of the debt. If a conversion of the underlying debt
occurs, a proportionate share of the unamortized amounts is
immediately expensed.
Going Concern
The
Company’s financial statements are prepared using accounting
principles generally accepted in the United States (“U.S.
GAAP”) applicable to a going concern, which contemplates the
realization of assets and liquidation of liabilities in the normal
course of business. The Company has limited commercial experience
and had a cumulative net loss from inception to December 31, 2017
of $17,895,435. The Company had working capital of $5,033,939 as of
December 31, 2017. The Company has not yet established an ongoing
source of revenue sufficient to cover its operating costs and to
allow it to continue as a going concern. The accompanying financial
statements for the period ended December 31, 2017 have been
prepared assuming the Company will continue as a going concern. The
Company’s cash resources will likely be insufficient to meet
its anticipated needs during the next twelve months. The Company
will require additional financing to fund its future planned
operations, including research and development and
commercialization of its products.
The
ability of the Company to continue as a going concern is dependent
on the Company obtaining adequate capital to fund operating losses
until it establishes a revenue stream and becomes profitable.
Management’s plans to continue as a going concern include
raising additional capital through sales of equity securities and
borrowing. However, management cannot provide any assurances that
the Company will be successful in accomplishing any of its plans.
If the Company is not able to obtain the necessary additional
financing on a timely basis, the Company will be forced to delay or
scale down some or all of its development activities or perhaps
even cease the operation of its business. The ability of the
Company to continue as a going concern is dependent upon its
ability to successfully secure other sources of financing and
attain profitable operations. There is substantial doubt about the
ability of the Company to continue as a going concern within one
year after the date that the financial statements are issued. The
accompanying financial statements do not include any adjustments
that might be necessary if the Company is unable to continue as a
going concern.
F-9
Recent Accounting Pronouncements
In May
2014, the Financial Accounting Standards Board (“FASB”)
issued Accounting Standards Update (“ASU”) No. 2014-09,
Revenue from Contracts with Customers. ASU 2014-09 is a
comprehensive revenue recognition standard that will supersede
nearly all existing revenue recognition guidance under current U.S.
GAAP and replace it with a principle based approach for determining
revenue recognition. Under ASU 2014-09, revenue is recognized when
a customer obtains control of promised goods or services and is
recognized in an amount that reflects the consideration which the
entity expects to receive in exchange for those goods or services.
In addition, the standard requires disclosure of the nature,
amount, timing, and uncertainty of revenue and cash flows arising
from contracts with customers. The FASB has recently issued ASU
2016-08, ASU 2016-10, ASU 2016-11, ASU 2016-12,and ASU 2016-20, all
of which clarify certain implementation guidance within ASU
2014-09. ASU 2014-09 is effective for interim and annual periods
beginning after December 15, 2017. Early adoption is permitted only
in annual reporting periods beginning after December 15, 2016,
including interim periods therein. The standard can be adopted
either retrospectively to each prior reporting period presented
(full retrospective method), or retrospectively with the cumulative
effect of initially applying the guidance recognized at the date of
initial application (the cumulative catch-up transition method).
The Company has reviewed ASU 2014-09 and has determined that its
adoption will have no impact on its financial position, results of
operations or cash flows. The Company plans to adopt the provisions
of this statement in the first quarter of fiscal 2018.
In May
2017, the FASB issued ASU No. 2017-09, Compensation – Stock
Compensation (Topic 718) Scope of Modification Accounting
(“ASU 2017-09”). The amendments in ASU 2017-09 provide
guidance about which changes to the terms or conditions of a
share-based payment award require an entity to apply modification
accounting in Topic 718. The adoption of ASU 2017-09, which will
become effective for annual periods beginning after December 15,
2017 and for interim periods within those annual periods, is not
expected to have any impact on the Company’s financial
statement presentation or disclosures.
In
February 2016, the FASB issued ASU No. 2016-02, Leases. ASU 2016-02
requires a lessee to record a right of use asset and a
corresponding lease liability on the balance sheet for all leases
with terms longer than 12 months. ASU 2016-02 is effective for all
interim and annual reporting periods beginning after December 15,
2018. Early adoption is permitted. A modified retrospective
transition approach is required for lessees for capital and
operating leases existing at, or entered into after, the beginning
of the earliest period presented in the financial statements. The
Company is currently evaluating the expected impact that the
standard could have on its financial statements and related
disclosures.
Other
recent accounting pronouncements issued by the FASB, including its
Emerging Issues Task Force, the American Institute of Certified
Public Accountants, and the Securities and Exchange Commission did
not or are not believed by management to have a material impact on
the Company’s present or future financial
statements.
As of
December 31, 2017 and 2016, inventory consisted of raw materials to
be used in the assembly of a Nexus 128 system. As of December 31,
2017 and 2016 the Company had no orders pending for the sale of a
Nexus 128 system.
As of
December 31, 2017 and December 31, 2016, fixed assets consisted of
the following:
|
|
December
31,
2017
|
December
31,
2016
|
|
Computer equipment
and fixtures
|
$
579,179
|
$
571,318
|
|
Accumulated
depreciation
|
(337,630
)
|
(276,150
)
|
|
Fixed assets,
net
|
$
241,549
|
$
295,168
|
Depreciation
expense for the years ended December 31, 2017 and 2016 was $61,481
and $64,936, respectively.
F-10
As of
December 31, 2017 and December 31, 2016, current liabilities
consisted of the following:
|
|
December 31,
2017
|
December 31,
2016
|
|
Accounts
payable
|
$
780,261
|
$
227,744
|
|
Accrued
payroll
|
40,578
|
105,258
|
|
Accrued
employee benefits
|
27,375
|
29,552
|
|
Accrued
interest
|
-
|
71,998
|
|
Notes
payable
|
-
|
50,000
|
|
Convertible
notes, related party, net of discount
|
-
|
99,804
|
|
Convertible
notes, net of discount
|
-
|
800,172
|
|
Total
|
$
848,214
|
$
1,384,528
|
On
January 28, 2016, the Company entered into promissory notes with
three investors for a total amount of $50,000. The notes
matured one year from the issue date, accrued no interest and were
payable at maturity. Prior to the maturity date, the Company and
the promissory note holders agreed to extend the maturity date of
all three notes to July 31, 2017, on the same terms as previously
agreed. The Company accounted for imputed interest of
$1,480
for the year ended December 31,
2017, which was calculated at a rate of 8% per annum, consistent
with other notes issued by the Company. During the year ended
December 31, 2017, the promissory notes were repaid in full to all
holders.
During
2016, the Company entered into convertible promissory notes with
approximately 60 investors for a total principal amount of
$1,386,448, $132,000 of which were purchased by related parties
(the “2016 Notes”). On March 15, 2017, the Company
extended the 2016 Notes offering by $250,000. The extension was
made available only to existing noteholders and obtained
subscriptions for $225,000. Pursuant to the terms of the 2016
Notes, noteholders holding a majority of the outstanding principal
amount of the 2016 Notes elected to convert the principal and
accrued interest on all outstanding 2016 Notes into shares of the
Company’s common stock at a conversion price of $1.40 per
share immediately prior to the Company’s initial public
offering. 1,232,859 shares of the Company’s common stock were
issued upon such conversion (see Note 6). In connection with the
issuance of the 2016 Notes, the Company recorded a debt discount at
an initial aggregate value of $1,611,448, of which $711,472 and
$899,976 was amortized during the years ended December 31, 2017 and
2016, respectively, resulting in a debt discount balance of $0 as
of December 31, 2017. The Company had interest expenses of $42,633
and $71,988 for the years ended December 31, 2017 and 2016,
respectively.
At
December 31, 2017, the authorized capital of the Company consisted
of 60,000,000 shares of capital stock, consisting of 50,000,000
shares of common stock with a par value of $0.0001 per share, and
10,000,000 shares of preferred stock with a par value of
$0.0001 per share. As of December 31, 2017, there were
3,923,027 shares of common stock issued and outstanding and no
preferred stock outstanding.
Reverse Stock Split
On May
8, 2017, the Company filed a certificate of amendment (the
“Certificate of Amendment”) to its certificate of
incorporation with the Secretary of State of the State of Delaware
to effect the Reverse Split of the Company’s common stock,
with no reduction in authorized capital stock. Pursuant to the
terms of the Certificate of Amendment, the Reverse Split became
effective at 11:59 p.m. Eastern Time on May 8, 2017. In the Reverse
Split, every 3.5 outstanding shares of common stock became one
share of common stock. No fractional shares were issued in
connection with the Reverse Split. Subject to the terms of the
Certificate of Amendment, stockholders who were otherwise entitled
to receive a fractional share of common stock received one whole
share of common stock.
The
Reverse Split was previously approved by holders of a majority of
the Company’s issued and outstanding common stock. All common
stock and stock incentive plan information in these consolidated
financial statements has been restated to reflect this
split.
F-11
Initial Public Offering of Units
The
Company’s Registration Statement on Form S-1, as amended
(Reg. No. 333-214724), was declared effective by the Securities and
Exchange Commission (the “SEC”) on May 8, 2017, and the
Company’s Registration Statement on Form S-1 (Reg. No.
333-217788), which was filed on May 8, 2017 with the SEC pursuant
to Rule 462(b) of the Securities Act of 1933, as amended (the
“Securities Act”), became effective upon filing. These
registration statements registered the securities offered in the
Company’s initial public offering (the “IPO”). In
the IPO, the Company sold 1,932,000 units at a price to the public
of $5.00 per unit, including the full exercise of the
underwriters’ option to purchase additional units. Each unit
consisted of one share of the Company’s common stock and a
warrant to purchase a share of the Company’s common stock at
an exercise price of $6.25 per share. The warrants terminate on May
12, 2022.
The IPO
closed on May 12, 2017 and the underwriters exercised their
overallotment option as of May 22, 2017, as a result of which the
Company raised through the IPO net proceeds of approximately $8.6
million after deducting approximately $773,000 in underwriting
discounts, commissions and expenses and approximately $297,000 in
offering expenses payable by the Company. National Securities
Corporation and Dougherty & Company LLC were the underwriters
of the IPO. No payments were made by the Company to its directors
or officers or persons owning ten percent or more of its common
stock or to their associates, or to the Company’s affiliates,
other than payments in the ordinary course of business to officers
for salaries and to non-employee directors as compensation for
board or board committee service.
The
shares of common stock and warrants initially traded together on
the Nasdaq Capital Market as units under the symbol
“NDRAU”.
Effective
at 12:01 a.m. on June 28, 2017, each of the Company’s units
issued in the IPO separated into one share of the Company’s
common stock and a warrant to purchase a share of the
Company’s common stock. Following separation, the common
stock and warrants included in the units commenced trading on The
Nasdaq Capital Market separately under the symbols
“NDRA” and “NDRAW,” respectively, and
trading of the units under the symbol “NDRAU” was
suspended.
Conversion of Convertible Notes
In
connection with the funding of the IPO, on May 12, 2017, the
principal and interest due under the Company’s convertible
notes, in an aggregate amount of $1,726,079, was converted into
1,232,859 shares of the Company’s common stock. The
purchasers of the convertible notes are subject to lock-up
requirements with respect to the conversion shares for periods that
expire on May 9, 2018.
Common Stock Issued for Services
During
the year ended December 31, 2017, the Company issued 18,833 shares
of common stock for services valued at $94,165 to a firm owned by
David R. Wells, the Company’s Chief Financial
Officer.
During
the year ended December 31, 2017, the Company issued 16,000 shares
of common stock for services valued at $57,440, $9,573 of which was
expensed as of December 31, 2017, based on the duration of the
contract.
The certificates for
these shares were issued in January 2018.
Stock
options are awarded to the Company’s employees, consultants
and non-employee members of the board of directors under the 2016
Omnibus Incentive Plan and are generally granted with an exercise
price equal to the market price of the Company’s common stock
at the date of grant. The fair value of these stock options granted
by the Company during the year ended December 31, 2017 was
determined to be $3,250,110 using the Black-Scholes-Merton
option-pricing model based on the following assumptions: (i)
volatility rate of 90%, (ii) discount rate of 0%, (iii) zero
expected dividend yield, and (iv) expected life of 4 to 8 years. A
summary of option activity under the Company’s stock options
as of December 31, 2017, and changes during the year then ended is
presented below:
F-12
|
|
Number of
Options
|
Weighted
Average
Exercise
Price
|
Weighted
Average
Remaining
Contractual
Term (Years)
|
|
Balance outstanding
at December 31, 2016
|
151,890
|
$
9.99
|
2.47
|
|
Granted
|
803,216
|
4.91
|
7.27
|
|
Exercised
|
-
|
-
|
-
|
|
Forfeited
|
-
|
-
|
-
|
|
Cancelled or
expired
|
(14,985
)
|
10.02
|
-
|
|
Balance outstanding
at December 31, 2017
|
940,121
|
$
5.65
|
6.46
|
|
Exercisable at
December 31, 2017
|
206,308
|
$
7.98
|
3.74
|
During
the year ended December 31, 2017, in connection with the closing of
the IPO, the Company issued to the underwriters and their designees
warrants to purchase an aggregate of 154,560 shares of the
Company’s common stock (the “Underwriters’
Warrants”) at an exercise price of $6.25 per share with an
expiration date of May 8, 2022. The Underwriters’ Warrants
become exercisable on November 8, 2017.
During
the year ended December 31, 2017, the Company granted warrants to
purchase 10,000 shares of common stock with an exercise price of
$5.50 per share for services. The warrants vest in six monthly
installments beginning on June 12, 2017. The fair value of these
warrants was determined to be $27,779 using the
Black-Scholes-Merton option-pricing model based on the following
assumptions: (i) volatility rate of 90%, (ii) discount rate of 0%,
(iii) zero expected dividend yield, and (iv) expected life of 3
years. During the year ended December 31, 2017, $27,779 was
expensed.
During
the year ended December 31, 2017, the Company granted warrants to
purchase 20,000 shares of common stock with an exercise price of
$4.49 per share for services. The warrants vest in six monthly
installments beginning on December 28, 2017. The fair value of
these warrants was determined to be $29,565 using the
Black-Scholes-Merton option-pricing model based on the following
assumptions: (i) volatility rate of 70%, (ii) discount rate of 0%,
(iii) zero expected dividend yield, and (iv) expected life of 3
years. During the year ended December 31, 2017, $4,928 was
expensed.
The
following table summarizes all stock warrant activity of the
Company for the year ended December 31, 2017:
|
|
Number of
Warrants
|
Weighted
Average
Exercise
Price
|
Weighted
Average
Remaining
Contractual
Term (Years)
|
|
Balance outstanding
at December 31, 2016
|
152,828
|
$
5.41
|
3.30
|
|
Granted
|
2,116,563
|
6.23
|
4.34
|
|
Exercised
|
-
|
-
|
-
|
|
Forfeited
|
-
|
-
|
-
|
|
Expired
|
(1,250
)
|
10.02
|
-
|
|
Balance outstanding
at December 31, 2017
|
2,268,141
|
$
7.09
|
4.21
|
|
Exercisable at
December 31, 2017
|
2,251,475
|
$
7.10
|
4.22
|
The U.S. tax reform bill that
Congress voted to approve Dec. 20, 2017, also known as the
“Tax Cuts and Jobs Act”, made sweeping modifications to
the Internal Revenue Code, including a much lower corporate tax
rate, changes to credits and deductions, and a move to a
territorial system for corporations that have overseas
earnings.
The
act replaced the prior-law graduated corporate tax rate, which
taxed income over $10 million at 35%, with a flat rate of
21%.
Deferred
income taxes reflect the net tax effects of temporary differences
between the carrying amounts of assets and liabilities for
financial reporting purposes and the amounts used for income tax
purposes. Significant components of the Company’s deferred
tax assets as of December 31, 2017 and 2016 are summarized
below.
|
|
2017
|
2016
|
|
Net
operating loss carryforward
|
$
(4,288,410
)
|
$
(3,881,317
)
|
|
Stock
based compensation
|
-
|
1,980
|
|
Fair
value of options
|
268,792
|
78,311
|
|
Total
deferred tax assets
|
(4,019,618
)
|
3,801,026
|
|
Valuation
allowance
|
4,019,618
|
3,801,026
|
|
Net
deferred tax asset
|
-
|
-
|
F-13
In
assessing the potential realization of deferred tax assets,
management considers whether it is more likely than not that some
portion or all of the deferred tax assets will be realized. The
ultimate realization of deferred tax assets is dependent upon the
Company attaining future taxable income during the periods in which
those temporary differences become deductible. As of December 31,
2017 and 2016, management was unable to determine if it is more
likely than not that the Company’s deferred tax assets will
be realized, and has therefore recorded an appropriate valuation
allowance against deferred tax assets at such dates.
For U.S. purposes, the Company has not completed its evaluation of
NOL utilization limitations under Internal Revenue Code, as amended
(the “Code”) Section 382, change of ownership rules. If
the Company has had a change in ownership, the NOL’s would be
limited as to the amount that could be utilized each year, based on
the Code, as amended.
No
federal tax provision has been provided for the years ended
December 31, 2017 and 2016 due to the losses incurred during such
periods. Reconciled below is the difference between the income tax
rate computed by applying the U.S. federal statutory rate and the
effective tax rate for the years ended December 31, 2017 and
2016.
|
|
2017
|
2016
|
|
U.S.
federal statutory income tax
|
-34.00
%
|
-34.00
%
|
|
State
tax, net of federal tax benefit
|
-5.80
%
|
-5.80
%
|
|
Stock
based compensation
|
0.00
%
|
0.00
%
|
|
Change
in valuation allowance
|
39.80
%
|
39.80
%
|
|
Effective
tax rate
|
0.00
%
|
0.00
%
|
At
December 31, 2017, the Company has available net operating loss
carryforwards for federal and state income tax purposes of
approximately $13.8 million and $10.2 million, respectively, which,
if not utilized earlier, expire through 2037.
Office Lease
Effective
January 1, 2015, the Company entered into an office lease agreement
with Green Court, LLC, a Michigan limited liability company, for
approximately 3,657 rentable square feet of space, for the initial
monthly rent of $5,986, which commenced on January 1, 2015 for an
initial term of 60 months and was revised on October 10, 2017 to
increase the space to 3,950 square feet and the monthly rent to
$7,798. Under the terms of the lease the Company has an option on
the same space for an additional 60-month term. Future minimum
payments under this lease are as follows:
|
2018
|
77,348
|
|
2019
|
79,269
|
|
Total
|
$
156,617
|
For the
years ended December 31, 2017 and 2016, the Company incurred rent
expenses of $52,527 and $55,687, respectively.
Employment and Consulting Agreements
Francois Michelon
. Effective May 12, 2017, the
Company entered into an amended and restated employment agreement
with Francois Michelon, our Chief Executive Officer and Chairman of
the board of directors. The term of the employment agreement runs
through December 31, 2019. The employment agreement provides for an
annual base salary of $325,000. Under the employment agreement, Mr.
Michelon is eligible for an annual cash bonus based upon
achievement of performance-based objectives established by the
board of directors. Pursuant to Mr. Michelon’s employment
agreement, upon the closing of our initial public offering he was
granted options to purchase 307,310 shares of common stock. The
options have an exercise price of $5.00 per share of common stock
and vest in three equal annual installments beginning on May 12,
2018. Upon termination without cause, any portion of Mr.
Michelon’s options scheduled to vest within 12 months will
automatically vest, and upon termination without cause within 12
months following a change of control, the entire unvested portion
of the option will automatically vest. Upon termination for any
other reason, the entire unvested portion of the option will
terminate.
If Mr.
Michelon’s employment is terminated by the Company without
cause, Mr. Michelon will be entitled to receive 12 months’
continuation of his current base salary and a lump sum payment
equal to 12 months of continued healthcare coverage (or 24
months’ continuation of his current base salary and a lump
sum payment equal to 24 months of continued healthcare coverage if
such termination occurs within one year following a change in
control).
Under
his employment agreement, Mr. Michelon is eligible to receive
benefits that are substantially similar to those of the
Company’s other senior executive officers.
F-14
Michael Thornton
. Effective May 12, 2017, the
Company entered into an amended and restated employment agreement
with Michael Thornton, our Chief Technology Officer. The term of
the employment agreement runs through December 31, 2019. The
employment agreement provides for an annual base salary of
$245,000. Under the employment agreement, Mr. Thornton is eligible
for an annual cash bonus based upon achievement of
performance-based objectives established by the board of directors.
Pursuant to Mr. Thornton’s employment agreement, upon the
closing of our initial public offering he was granted options to
purchase 313,338 shares of common stock. The options have an
exercise price of $5.00 per share of common stock and vest in three
equal annual installments beginning on May 12, 2018. Upon
termination without cause, any portion of Mr. Thornton’s
option scheduled to vest within 12 months will automatically vest,
and upon termination without cause within 12 months following a
change of control, the entire unvested portion of the option will
automatically vest. Upon termination for any other reason, the
entire unvested portion of the option will terminate.
If Mr.
Thornton’s employment is terminated by the Company without
cause, Mr. Thornton will be entitled to receive 12 months’
continuation of his current base salary and a lump sum payment
equal to 12 months of continued healthcare coverage (or 24
months’ continuation of his current base salary and a lump
sum payment equal to 24 months of continued healthcare coverage if
such termination occurs within one year following a change in
control).
Under
his employment agreement, Mr. Thornton is eligible to receive
benefits that are substantially similar to those of the
Company’s other senior executive officers.
David R. Wells
. On May 12, 2017, the Company entered into a
consulting agreement with StoryCorp Consulting
(“StoryCorp”), pursuant to which David Wells provides
services to the Company as its Chief Financial Officer. Pursuant to
the consulting agreement, the Company pays to StoryCorp a monthly
fee of $9,000. Additionally, pursuant to the consulting agreement,
the Company granted to Mr. Wells a stock option to purchase 15,000
shares of common stock in connection with the closing of our
initial public offering, having an exercise price per share equal
to $5.00 and vesting in twelve equal quarterly installments, and,
for so long as the consulting agreement is in place, will grant to
Mr. Wells a stock option to purchase the same number of shares of
common stock with the same terms on each annual anniversary of the
date of the consulting agreement.
Litigation
From time to time the Company may become a party to litigation in
the normal course of business. Management believes that there are
no current legal matters that would have a material effect on the
Company’s financial position or results of
operations.
Subsequent
to December 31, 2017, the Company granted warrants to purchase
20,000 shares of common stock with an exercise price of $5.50 per
share for services.
Subsequent
to December 31, 2017, the Company awarded stock options to purchase
38,790 shares of common stock with an exercise price of $4.95 per
share to its consultants and non-employee members of the board of
directors.
F-15
None.
Evaluation of Disclosure Controls and Procedures
As of
the end of the period covered by this report, management performed,
with the participation of our principal executive and principal
financial officers, an evaluation of the effectiveness of our
disclosure controls and procedures as defined in Rules 13a-15(e)
and 15d-15(e) of the Exchange Act. Our disclosure controls and
procedures are designed to ensure that information required to be
disclosed in the reports we file or submit under the Exchange Act
is recorded, processed, summarized, and reported within the time
periods specified in the SEC’s forms, and that such
information is accumulated and communicated to our management,
including our principal executive officer and principal financial
officer, to allow timely decisions regarding required disclosures.
Based on the evaluation, our principal executive and principal
financial officers concluded that, as of December 31, 2017, our
disclosure controls and procedures were not effective due to a
material weakness in internal control over financial
reporting.
A
material weakness is a deficiency, or a combination of
deficiencies, in internal control over financial reporting, such
that there is a reasonable possibility that a material misstatement
of our annual or interim financial statements will not be prevented
or detected on a timely basis. We identified the following material
weakness as of December 31, 2017: insufficient personnel resources
within the accounting function to segregate the duties over
financial transaction processing and reporting.
To
remediate our internal control weakness, management intends to
implement the following measures:
●
Add sufficient
accounting personnel or outside consultants to properly segregate
duties and to effect a timely, accurate preparation of the
financial statements.
●
Upon the hiring of
additional accounting personnel or outside consultants, develop and
maintain adequate written accounting policies and
procedures.
The
additional hiring is contingent upon our efforts to obtain
additional funding and the results of our operations. Management
expects to secure funds in the coming fiscal year but provides no
assurances that it will be able to do so.
Management’s Report on Internal Control Over Financial
Reporting
This
Annual Report does not include a report of management’s
assessment regarding internal control over financial reporting or
an attestation report of the Company’s registered public
accounting firm due to a transition period established by rules of
the SEC for newly public companies.
Not
applicable.
47
The
following table sets forth the names and ages of all of our
executive officers and directors. Our officers are appointed
by, and serve at the pleasure of, the board of
directors.
|
Name
|
|
Age
|
|
Position
|
|
Francois
Michelon
|
|
52
|
|
Chief
Executive Officer and Chairman
|
|
Michael
Thornton
|
|
49
|
|
Chief
Technology Officer
|
|
David
Wells
|
|
55
|
|
Chief
Financial Officer
|
|
Anthony
DiGiandomenico
|
|
51
|
|
Director
|
|
Dr.
Sanjiv Sam Gambhir
|
|
55
|
|
Director
|
|
Michael
Harsh
|
|
63
|
|
Director
|
|
Alexander
Tokman
|
|
56
|
|
Director
|
Biographical
information with respect to our executive officers and directors is
provided below. There are no family relationships
between any of our executive officers or directors.
Francois Michelon − Chief Executive Officer and
Chairman
Francois
Michelon joined ENDRA as Chief Executive Officer and Chairman of
our board of directors in 2015. He has 20 years of healthcare
technology experience in general management, operations, strategy
and marketing across the diagnostic imaging, surgical instrument
and dental sectors.
From
2012 to 2014, Mr. Michelon served as Vice President of Global
Marketing for the 3i division of Biomet, Inc. (now Zimmer Biomet
Holdings, Inc.), a provider of oral reconstruction technologies,
where he was responsible for the upstream and downstream
development of the division’s global portfolio. From 2004 to
2011, Mr. Michelon served as Group Director of Global Services and
Visualization for Smith & Nephew plc’s Advanced Surgical
Devices division, where he led in the B2B service and capital
equipment sectors, and had responsibility over the financial
performance of these as well. From 1997 to 2004, Mr. Michelon
worked at GE Healthcare in a variety of global upstream and
downstream marketing roles.
Mr.
Michelon received an MBA from Carnegie-Mellon University and a BA
in Economics from the University of Chicago. He has also earned his
Six Sigma Black Belt certification. Mr. Michelon’s extensive
industry and executive experience and his intimate understanding of
our business as our Chief Executive Officer, position him well to
serve as a member of our board of directors.
Michael Thornton − Chief Technology Officer
Prior
to joining ENDRA as Chief Technology Officer in 2007, Michael
Thornton was a founder and President of Enhanced Vision Systems
Corp., or EVS, a developer and supplier of medical imaging
equipment to the pharmaceutical, biotech, and academic
sectors.
In
2002, EVS was acquired by General Electric Company and was
integrated into the Functional and Molecular Imaging business unit
of GE Medical Systems (now GE Healthcare, a subsidiary of General
Electric Company). Following the acquisition of EVS by GE Medical
Systems, Mr. Thornton held a number of positions at GE Healthcare,
including Sales Manager, Global Product Manager, and Site Leader.
He was a member of the leadership team that expanded the
pre-clinical imaging business to include: computed tomography,
optical, and positron emission tomography imaging technologies,
with global market reach. He is also a founder of Volumetrics
Medical Corp., a developer and manufacturer of quality assurance
devices for diagnostic imaging.
Prior
to founding EVS, Mr. Thornton developed medical imaging related
technologies at the Robarts Research Institute (London, Ontario,
Canada) for which he obtained an MSc in Electrical Engineering from
the University of Western Ontario. Mr. Thornton also holds a BASc
in Electrical Engineering from the University of Toronto and is a
member of the American Association of Physicists in
Medicine.
48
David Wells − Chief Financial Officer
David
Wells became our Chief Financial Officer on an interim basis in
2014 and on a continuing basis in 2017. He possesses over 30
years of experience in finance, operations and administrative
positions. While mainly focused on technology companies, Mr. Wells
has also worked in the water treatment, supply-chain management,
manufacturing and professional services industries.
Mr.
Wells is the founder of Wells Compliance Group, a technology-based
services firm supporting the financial reporting needs of publicly
traded companies and privately held firms whose investor or
shareholder base requires timely GAAP-compliant financial
reporting. Through StoryCorp Consulting (d/b/a/ Wells Compliance
Group), Mr. Wells consults with several emerging growth companies
and has served as the principal financial officer of Mount Tam
Biotechnologies, Inc., a biopharmaceutical company (August 2015 to
April 2016), Content Checked Holdings, Inc., a technology company
(April 2015 to November 2016), and Loton, Corp., a media company
(February 2016 to present). From 2009 to 2013, he was the
President, CFO and a Director of Sionix Corporation, a publicly
traded water treatment company.
Mr.
Wells holds an MBA from Pepperdine University and a BS in Finance
and Entrepreneurship from Seattle Pacific University.
Anthony DiGiandomenico − Director
Anthony
DiGiandomenico joined our board of directors in 2013. A co-founder
of MDB Capital Group LLC, Mr. DiGiandomenico focuses on corporate
finance and capital formation for growth-oriented companies. He has
participated in all areas of corporate finance including private
capital, public offerings, PIPEs, business consulting and strategic
planning, and mergers and acquisitions.
Mr.
DiGiandomenico has also worked on a wide range of transactions for
growth-oriented companies in biotechnology, nutritional
supplements, manufacturing and entertainment industries. Prior to
forming MDB Capital Group LLC in 1997, Mr. DiGiandomenico served as
President and CEO of the Digian Company, a real estate development
company. Currently, Mr. DiGiandomenico serves on the board of
directors of Cue Biopharma, Inc.
Mr.
DiGiandomenico holds an MBA from the Haas School of Business at the
University of California, Berkeley and a BS in Finance from the
University of Colorado. Mr. DiGiandomenico’s financial
expertise, general business acumen and significant executive
leadership experience position him well to make valuable
contributions to our board of directors.
Dr. Sanjiv Sam Gambhir − Director
Dr.
Sanjiv Sam Gambhir joined our board of directors in 2008. He is the
Virginia & D.K. Ludwig Professor of Cancer Research and the
Chair of Radiology at Stanford University School of Medicine. He
also heads the Canary Center at Stanford for Cancer Early Detection
and directs the Molecular Imaging Program at Stanford
(MIPS).
He
received an MD/PhD from the UCLA Medical Scientist Training
Program. He has many publications in the field and numerous patents
pending or granted. He has developed and clinically translated
several multimodality molecular imaging strategies including
imaging of gene and cell therapies. He has also pioneered imaging
areas such as Bioluminescence Resonance Energy Transfer (BRET),
split-reporter technology, Raman imaging in vivo, Molecular
Photoacoustic imaging, PET reporter genes, and novel in vitro and
in vivo strategies for the early detection of cancer.
Dr.
Gambhir serves on numerous academic advisory boards for
universities around the world and also served as a member of the
Board of Scientific Advisors of the National Cancer Institute from
2004 to 2012. He has also founded or co-founded several startups in
the diagnostics space. Among his many awards are the George Von
Hevesy Prize and the Paul C. Aebersold Award for outstanding
achievement in basic nuclear medicine science from the Society of
Nuclear Medicine, Outstanding Researcher Award from the
Radiological Society of Northern America, the Distinguished
Clinical Scientist Award from the Doris Duke Charitable Foundation,
the Holst Medal, the Tesla Medal, and the Hounsfield Medal from
Imperial College, London. He was elected to the Institute of
Medicine of the U.S. National Academies in 2008. Dr.
Gambhir’s unique and extensive scientific and technical
expertise positions him well to serve on our board of
directors.
49
Michael Harsh − Director
Michael
Harsh joined our board of directors in 2015. He has 39 years’
experience in healthcare technology, focused on diagnostic imaging.
Mr. Harsh was most recently GE Healthcare’s Vice President
and Chief Technology Officer, leading its global science and
technology organization and research and development teams in
diagnostics, healthcare IT and life sciences.
In
2004, Mr. Harsh was named Global Technology Leader – Imaging
Technologies Lab at the GE Global Research Center, where he
led the research for imaging technologies across the company as
well as the research associated with computer visualization/image
analysis and superconducting systems. He led the Engineering
division for GE Industrial and Enterprise Solutions from 2006
to 2009. Mr. Harsh was named an officer of General Electric Company
in November 2006. Mr. Harsh is the co-founder of Terapede
Systems, a digital x-ray detector startup, a member of the boards
of directors of FloDesign Sonics, Imagion Biosystems, and EmOpti as
well as a member the Radiological Society of North America
("RSNA"), Research & Education Foundation Board of Trustees. He
is also a McKinsey Senior Advisor and a consultant in the medical
device industry.
Mr.
Harsh is a graduate of Marquette University, where he earned a
bachelor’s degree in Electrical Engineering. He holds
numerous U.S. patents in the field of medical imaging and
instrumentation. In 2008, Mr. Harsh was elected to the American
Institute for Medical and Biological Engineering College of
Fellows for his significant contributions to the medical and
biological engineering field. Mr. Harsh’s extensive industry,
executive and board experience position him well to serve on our
board of directors.
Alexander Tokman − Director
Alexander
Tokman joined our board of directors in 2008. He has served as
President, Chief Executive Officer, and a director of Microvision,
Inc., a publicly traded laser beam scanning projection and imaging
company, since January 2006.
Previously,
Mr. Tokman completed a 10+ year tenure as an executive with GE
Healthcare, where he led several global businesses, most recently
as a General Manager of its Global Molecular Imaging and
Radiopharmacy multi-technology business unit from 2003 to
2005.
Between
1995 and 2003, Mr. Tokman served in various leadership roles at GE
Healthcare, where he led the definition and successful
commercialization of several product segments, including PET/CT,
which generated over $500 million of revenue within the first three
years of its launch.
Mr.
Tokman is a certified Six Sigma and Design for Six Sigma (DFSS)
Black Belt and Master Black Belt and as one of General Electric
Company’s Six Sigma pioneers, he drove the quality culture
change across GE Healthcare in the late 1990s. From 1989 to 1995,
Mr. Tokman served as development programs lead and a head of
Industry and Regional Development at Tracor Applied Sciences. Mr.
Tokman has both an MS and BS in Electrical Engineering from the
University of Massachusetts, Dartmouth. Mr. Tokman’s industry
expertise and significant executive leadership and director
experience position him well to make valuable contributions to our
board of directors.
Director Independence
Our
board of directors has determined that Anthony DiGiandomenico, Dr.
Sanjiv Sam Gambhir, Michael Harsh and Alexander Tokman
are “independent
directors” as such term is defined by Nasdaq Marketplace Rule
5605(a)(2). We have established an Audit Committee, a
Compensation Committee and a Nominating and Corporate Governance
Committee. Each of Mr. DiGiandomenico, Mr. Harsh and Mr.
Tokman serve as members of the Audit Committee and Compensation
Committee. Mr. Gambhir, Mr. Harsh and Mr. Tokman serve as members
of the Nominating and Corporate Governance Committee. Our board of
directors has determined that Mr. DiGiandomenico is an audit
committee financial expert, as defined under the applicable rules
of the SEC, and that all members of the Audit Committee are
“independent” within the meaning of the applicable
Nasdaq listing standards and the independence standards of Rule
10A-3 of the Exchange Act. Each of the members of the Audit
Committee meets the requirements for financial literacy under the
applicable rules and regulations of the SEC and The Nasdaq Stock
Market.
Scientific Advisory Board
Our
Scientific Advisory Board members work with our management team in
the planning, development and execution of scientific and business
strategies. It reviews, and advises management on our progress in
research and clinical development as well as new scientific
perspectives.
50
Jonathan Rubin, MD, PhD − Scientific Advisor
Dr.
Jonathan Rubin is the Martel Collegiate Professor of Radiology and
Section Head for Ultrasound and Abdominal Interventional Radiology
at the University of Michigan Medical School.
Dr.
Rubin has over 200 peer-reviewed publications, over 125 invited
presentations, and 10 patents. In 2005 he was awarded the
University of Michigan Medical School Innovation Award. In 2007 he
won the American Institute of Ultrasound in Medicine Joseph H.
Holmes Clinical Pioneer Award. In 2011 he received the Society of
Radiologists in Ultrasound Lawrence Mack Lifetime Achievement
Award.
Dr.
Rubin received a BA in Chemistry from the University of Utah. He
received an MD from the University of Chicago Pritzker School of
Medicine and a PhD in Biophysics and Theoretical Biology from the
University of Chicago. From 1979 to 1984, Dr. Rubin was the
director of the Section of Body Computed Tomography and Ultrasound
Imaging in the Department of Radiology at the University of
Chicago.
Dr. Jing Gao, MD
− Scientific Advisor
Dr.
Jing Gao is currently the Director of Ultrasound in Education
and Research at Rocky Vista University-Southern Utah and the
Adjunct Research Assistant Professor of Radiology at Weill
Cornell Medicine in New York, NY. Dr. Gao brings over 30 years of
clinical and research experience in abdominal ultrasound, in both
the United States and China.
Dr. Gao
completed her medical education at Changchun and Dalian Medical
Colleges in China. Besides her post at Cornell, Dr. Gao is Deputy
President and guest professor at the Dalian University
International Institute of Medical Imaging in China. She is
also a guest professor at Capital Medical University and Chongqing
Medical University in China.
Her
numerous honors and professional affiliations include being named
one of China’s Top 100 Ultrasound Physicians by the Chinese
Association of Medical Imaging Technology. She is a Fellow
of the Chinese Association of Ultrasound in Medicine and
Biology, a Fellow of the American Institute of Ultrasound in
Medicine and an Editorial Board Member of Clinical Imaging
and Ultrasound in Medicine and
Biology (Elsevier).
Dr. Gao
has numerous peer reviewed publications in the areas of liver,
spleen, kidney, and skeletal muscle diseases and
quantitative ultrasound imaging.
Section 16(a) Beneficial Ownership Reporting
Compliance
Section 16(a)
of the Exchange Act requires our directors, executive officers and
persons who own more than ten percent of a registered class of our
equity securities to file reports of ownership and changes in
ownership with the SEC. Such persons are required by SEC
regulations to furnish us with copies of all such filings. Based
solely on our review of copies of such filings, we believe that all
reporting persons complied on a timely basis with all
Section 16(a) filing requirements during the year ended
December 31, 2017, except that: (i) each of directors and
executive officers failed to timely file a Form 3 upon the
effectiveness of the registration of our common stock under Section
12(b) of the Exchange Act, (ii) Alexander Tokman filed one late
Form 4 with respect to the granting of stock options, (iii) Anthony
DiGiandomenico filed one late Form 4 with respect to the conversion
of a convertible promissory note into common stock and the granting
of stock options, and (iv) Sanjiv Gambhir filed one late Form 4
with respect to the granting of stock options.
Code of Business Conduct and Ethics
We have
in place a Code of Business Conduct and Ethics (the “Code of
Ethics”) that applies to all of our directors, officers and
employees. The Code of Ethics is designed to deter wrongdoing and
to promote:
●
honest and ethical
conduct, including the ethical handling of actual or apparent
conflicts of interest between personal and professional
relationships;
●
full, fair,
accurate, timely and understandable disclosure in reports and
documents that we file with, or submit to, the SEC and in other
public communications that we make;
●
compliance with
applicable governmental laws, rules and
regulations;
●
the prompt internal
reporting of violations of the Code of Ethics to an appropriate
person identified in the Code of Ethics; and
●
accountability for
adherence to the Code of Ethics.
A
current copy of the Code of Ethics is available at
www.endrainc.com. A copy may also be obtained, free of charge, from
us upon a request directed to ENDRA Life Sciences, Inc., 3600 Green
Court, Suite 350, Ann Arbor, Michigan 48105, attention: Investor
Relations. We intend to disclose any amendments to or waivers of a
provision of the Code of Ethics required to be disclosed by
applicable SEC rules by posting such information on our website
available at www.endrainc.com and/or in our public filings with the
SEC.
51
Our
compensation philosophy is to offer our executive officers
compensation and benefits that are competitive and meet our goals
of attracting, retaining and motivating highly skilled management,
which is necessary to achieve our financial and strategic
objectives and create long-term value for our stockholders. We
believe the levels of compensation we provide should be
competitive, reasonable and appropriate for our business needs and
circumstances. Our board of directors uses benchmark compensation
studies in determining compensation elements and levels. The
principal elements of our executive compensation program have to
date included base salary, annual bonus opportunity and long-term
equity compensation in the form of stock options. We believe
successful long-term Company performance is more critical to
enhancing stockholder value than short-term results. For this
reason and to conserve cash and better align the interests of
management and our stockholders, we emphasize long-term
performance-based equity compensation over base annual
salaries.
The
following table sets forth information concerning the compensation
earned by the individual that served as our principal executive
officer during 2017 and our two most highly compensated executive
officers other than the individual who served as our principal
executive officer during 2017 (collectively, the “named
executive officers”):
2017 Summary Compensation Table
|
Name &
Position
|
|
Fiscal
Year
|
Salary
($)
|
Bonus
($)
|
Stock
Awards
($)(1)
|
All
Other
Compensation
($)
|
Total
($)
|
|
Francois
Michelon
|
|
2017
|
347,452
(2)
|
-
|
-
|
-
|
347,452
|
|
Chief Executive Officer
|
|
2016
|
262,152
|
-
|
-
|
-
|
262,152
|
|
Michael
Thornton
|
|
2017
|
272,086
(3)
|
-
|
-
|
-
|
272,086
|
|
Chief Technology Officer
|
|
2016
|
218,056
|
-
|
-
|
-
|
218,056
|
|
David R. Wells
(4)
|
|
2017
|
92,000
|
-
|
94,165
|
-
|
186,165
|
|
Chief Financial Officer
|
|
2016
|
60,000
|
-
|
-
|
-
|
60,000
|
(1)
The amounts shown
in this column indicate the grant date fair value of option awards
granted in the subject year computed in accordance with FASB ASC
Topic 718. For additional information regarding the assumptions
made in calculating these amounts, see notes 2 and 7 to our audited
financial statements included herein.
(2)
Includes a payment
for salary accrued during 2016 of $53,819
.
(3)
Includes a payment
for salary accrued during 2016 of $51,438.
(4)
Represents fees
earned by StoryCorp Consulting (d/b/a Wells Compliance Group).
Pursuant to the consulting agreement described below, we issued
18,833 shares of our common stock valued at $94,165 in
2017.
Outstanding Equity Awards at 2017 Fiscal Year End
The
following table provides information regarding equity awards held
by the named executive officers as of December 31,
2017.
52
|
|
Option
Awards
|
||||
|
Name
|
Number of
Securities Underlying Unexercised Options (#)
Exercisable
|
|
Number of
Securities Underlying Unexercised Options (#)
Unexercisable
|
Option
Exercise Price ($)
|
Option
Expiration Date
|
|
Francois
Michelon
|
23,665
|
(1
)
|
11,833
|
10.01
|
7/1/20
|
|
Chief Executive Officer
|
-
|
(2
)
|
307,310
|
5.00
|
5/12/25
|
|
|
-
|
(2
)
|
31,960
|
4.55
|
5/12/25
|
|
|
|
|
|
|
|
|
Michael
Thornton
|
29,471
|
|
-
|
10.01
|
11/1/18
|
|
Chief Technology Officer
|
-
|
(2
)
|
313,338
|
5.00
|
5/12/25
|
|
|
-
|
(2
)
|
31,960
|
4.55
|
5/12/25
|
|
|
|
|
|
|
|
|
David
Wells
|
2,500
|
(3
)
|
12,500
|
5.00
|
5/12/21
|
|
Chief Financial Officer
|
7,000
|
|
-
|
5.00
|
5/12/22
|
(1)
These options vest in three equal annual installments beginning on
July 1, 2016.
(2)
These options vest in three equal annual installments beginning on
May 12, 2018.
(3)
These options vest in twelve equal quarterly installments beginning
on August 12, 2017.
Employment Agreements and Change of Control Agreements
Employment Agreements
The
following is a summary of the employment arrangements with our
executive officers as currently in effect.
Francois Michelon
. Effective May 12, 2017, the
Company entered into an amended and restated employment agreement
with Francois Michelon, our Chief Executive Officer and Chairman of
our board of directors. The term of the employment agreement runs
through December 31, 2019. The employment agreement provides for an
annual base salary of $325,000. Under the employment agreement, Mr.
Michelon is eligible for an annual cash bonus based upon
achievement of performance-based objectives established by our
board of directors. Pursuant to Mr. Michelon’s employment
agreement, upon the closing of our initial public offering he was
granted options to purchase 307,310 shares of common stock. The
options have an exercise price of $5.00 per share of common stock
and vest in three equal annual installments beginning on May 12,
2018. Upon termination without cause, any portion of Mr.
Michelon’s options scheduled to vest within 12 months will
automatically vest, and upon termination without cause within 12
months following a change of control, the entire unvested portion
of the option will automatically vest. Upon termination for any
other reason, the entire unvested portion of the option will
terminate.
If Mr.
Michelon’s employment is terminated by the Company without
cause, Mr. Michelon will be entitled to receive 12 months’
continuation of his current base salary and a lump sum payment
equal to 12 months of continued healthcare coverage (or 24
months’ continuation of his current base salary and a lump
sum payment equal to 24 months of continued healthcare coverage if
such termination occurs within one year following a change in
control).
Under
his employment agreement, Mr. Michelon is eligible to receive
benefits that are substantially similar to those of the
Company’s other senior executive officers.
Michael Thornton
. Effective May 12, 2017, the
Company entered into an amended and restated employment agreement
with Michael Thornton, our Chief Technology Officer. The term of
the employment agreement runs through December 31, 2019. The
employment agreement provides for an annual base salary of
$245,000. Under the employment agreement, Mr. Thornton is eligible
for an annual cash bonus based upon achievement of
performance-based objectives established by our board of directors.
Pursuant to Mr. Thornton’s employment agreement, upon the
closing of our initial public offering he was granted options to
purchase 313,338 shares of common stock. The options have an
exercise price of $5.00 per share of common stock and vest in three
equal annual installments beginning on May 12, 2018. Upon
termination without cause, any portion of Mr. Thornton’s
option scheduled to vest within 12 months will automatically vest,
and upon termination without cause within 12 months following a
change of control, the entire unvested portion of the option will
automatically vest. Upon termination for any other reason, the
entire unvested portion of the option will terminate.
53
If Mr.
Thornton’s employment is terminated by the Company without
cause, Mr. Thornton will be entitled to receive 12 months’
continuation of his current base salary and a lump sum payment
equal to 12 months of continued healthcare coverage (or 24
months’ continuation of his current base salary and a lump
sum payment equal to 24 months of continued healthcare coverage if
such termination occurs within one year following a change in
control).
Under
his employment agreement, Mr. Thornton is eligible to receive
benefits that are substantially similar to those of the
Company’s other senior executive officers.
David R. Wells
. On May 12, 2017, the Company entered into a
consulting agreement with StoryCorp Consulting
(“StoryCorp”), pursuant to which David Wells provides
services to the Company as its Chief Financial Officer. Pursuant to
the consulting agreement, the Company pays to StoryCorp a monthly
fee of $9,000. Additionally, pursuant to the consulting agreement,
the Company granted to Mr. Wells a stock option to purchase 15,000
shares of common stock in connection with the closing of our
initial public offering, having an exercise price per share equal
to $5.00 and vesting in twelve equal quarterly installments, and,
for so long as the consulting agreement is in place, will grant to
Mr. Wells a stock option to purchase the same number of shares of
common stock with the same terms on each annual anniversary of the
date of the consulting agreement.
Director Compensation
Effective
on May 12, 2017 the Company adopted a non-employee director
compensation policy pursuant to which our non-employee directors
receive on an annual basis a $36,000 retainer paid in cash and an
annual equity award with a value of $30,000. The equity award
consists of a stock option grant made on the first trading day
following December 31 of each year covering a number of shares of
common stock equal to $30,000 divided by the closing price of its
common stock on such date which vests in full on the one year
anniversary of grant; provided, the grants for 2017 were made
on May 12, 2017 upon the closing of the Company’s initial
public offering and each covered 6,000 shares of common
stock.
The
following table sets forth information with respect to compensation
earned by or awarded to each of our non-employee directors who
served on our board of directors during the fiscal year ended
December 31, 2017:
|
Name
|
Paid in Cash
($)
|
Option Awards
($)(1)
|
All Other
Compensation ($)
|
Total
($)
|
|
Anthony
DiGiandomenico
|
14,129
|
48,696
|
-
|
62,825
|
|
Dr. Sanjiv Sam
Gambhir
|
14,129
|
48,696
|
-
|
62,825
|
|
Michael
Harsh
|
14,129
|
48,696
|
-
|
62,825
|
|
Alexander
Tokman
|
14,129
|
48,696
|
-
|
62,825
|
(1)
The amounts shown
in this column indicate the grant date fair value of option awards
granted in the subject year computed in accordance with FASB ASC
Topic 718. For additional information regarding the assumptions
made in calculating these amounts, see note 7 to our audited
financial statements included herein. The following table shows the
number of shares subject to outstanding option awards held by each
non-employee director as of December 31, 2017:
|
Name
|
Shares subject
to
Outstanding
Stock
Option Awards
(#)
|
|
Anthony
DiGiandomenico
|
23,157
|
|
Dr. Sanjiv
Sam Gambhir
|
34,893
|
|
Michael
Harsh
|
23,432
|
|
Alexander
Tokman
|
27,231
|
54
2016 Omnibus Incentive Plan
In
September 2016, our board of directors and stockholders approved
the 2016 Omnibus Incentive Plan, which permits the grant of stock
options and shares to our employees, consultants and non-employee
members of our board of directors for up to 1,345,074 shares of
common stock.
We have
set forth in the following table certain information regarding our
common stock beneficially owned by (i) each stockholder we know to
be the beneficial owner of 5% or more of our outstanding common
stock, (ii) each of our directors and named executive officers, and
(iii) all executive officers and directors as a group. Generally, a
person is deemed to be a “beneficial owner” of a
security if that person has or shares the power to dispose or to
direct the disposition of such security. A person is also deemed to
be a beneficial owner of any securities of which the person has the
right to acquire beneficial ownership within 60 days pursuant to
options, warrants, conversion privileges or similar rights. Unless
otherwise indicated, ownership information is as of March 15, 2018,
and is based on 3,923,027 shares of common stock outstanding on
that date.
|
Name of
Beneficial Owner(1)
|
Number of
Shares Beneficially Owned
|
Percentage
Owned
(%)
|
|
Francois
Michelon
|
163,299
(2)
|
4.0
%
|
|
Michael
Thornton
|
205,558
(3)
|
5.1
%
|
|
David R.
Wells
|
30,833
(4)
|
*
|
|
Dr. Sanjiv Sam
Gambhir
|
28,832
(5)
|
*
|
|
Michael
Harsh
|
17,371
(6)
|
*
|
|
Alexander
Tokman
|
21,170
(7)
|
*
|
|
Anthony
DiGiandomenico
|
76,720
(8)
|
1.9
%
|
|
All
directors and named executive officers as a group (7
individuals)
|
546,780
|
12.7
%
|
|
|
|
|
|
5% or More Shareholders
|
|
|
|
Longboard Capital
Advisors, LLC
|
652,463
(9)
|
15.7
%
|
(1)
The
address of each officer and director is 3600 Green Court, Suite
350, Ann Arbor, MI 48105-1570.
(2)
Consists
of 26,544 shares of common stock and 136,755 shares of common stock
issuable upon the exercise of options that are presently
exercisable.
(3)
Consists
of 59,998 shares of common stock, 144,570 shares of common stock
issuable upon the exercise of options that are presently
exercisable and 999 shares of common stock issuable upon the
exercise of restricted warrants.
(4)
Consists
of 18,833 shares of common stock and 12,000 shares of common stock
issuable upon the exercise of options that are presently
exercisable.
(5)
Consists
of 28,832 shares of common stock issuable upon the exercise of
options that are presently exercisable.
(6)
Consists
of 17,371 shares of common stock issuable upon the exercise of
options that are presently exercisable.
55
(7)
Consists
of 21,170 shares of common stock issuable upon the exercise of
options that are presently exercisable.
(8)
Consists
of 58,625 shares of common stock, 17,096 shares of common stock
issuable upon the exercise of options that are presently
exercisable and 999 shares of common stock issuable upon the
exercise of restricted warrants.
(9)
Based
solely on the Schedule 13G filed on July 13, 2017 by Longboard
Capital Advisors, LLC (“Longboard”) and Brett Conrad.
According to the filing, shares consist of 429,437 shares of common
stock and 223,026 shares of common stock issuable upon the exercise
of warrants owned by Longboard. Mr. Conrad is the managing member
of Longboard and has the power to make voting and investment
decisions regarding the shares of common stock and warrants held by
Longboard. The address for this investor is 1312 Cedar Street,
Santa Monica, CA 90405.
Equity Compensation Plan Table
The
following table presents information on the Company’s equity
compensation plans as of December 31, 2017. All outstanding awards
relate to our common stock.
|
Plan Category
|
Number of
Securities to Be Issued upon Exercise of Outstanding Options,
Warrants and Rights
(a)
|
Weighted-Average
Exercise Price of Outstanding Options, Warrants and
Rights
(b)
|
Number of
Securities Remaining Available for Future Issuance under Equity
Compensation Plans (Excluding Securities Reflected in Column
(a))
(c)
|
|
Equity
compensation plans approved by security holders
|
940,121
(1)
|
$
5.65
|
404,953
(2)
|
|
Equity
compensation plans not approved by security holders
|
—
|
—
|
—
|
|
Total
|
940,121
|
$
5.65
|
404,953
|
(1)
Consists of
outstanding stock options exercisable for 940,121 shares of common
stock issued under our 2016 Omnibus Incentive Plan, which amended
and restated our Second Amended and Restated 2013 Stock Incentive
Plan.
(2)
Consists of 404,953
shares of common stock available for future issuance under our 2016
Omnibus Incentive Plan.
Policy for Review of Related Person Transactions
In
December 2016, our board of directors adopted a written policy with
regard to related person transactions, which sets forth our
procedures and standards for the review, approval or ratification
of any transaction required to be reported in our filings with the
SEC or in which one of our executive officers or directors has a
direct or indirect material financial interest, with limited
exceptions. Our policy is that the Corporate Governance and
Nominating Committee shall review the material facts of all related
person transactions (as defined in the related person transaction
approval policy) and either approve or disapprove of the entry into
any related person transaction. In the event that obtaining the
advance approval of the Corporate Governance and Nominating
Committee is not feasible, the Corporate Governance and Nominating
Committee shall consider the related person transaction and, if the
Corporate Governance and Nominating Committee determines it to be
appropriate, may ratify the related person transaction. In
determining whether to approve or ratify a related person
transaction, the Corporate Governance and Nominating Committee will
take into account, among other factors it deems appropriate,
whether the related person transaction is on terms comparable to
those available from an unaffiliated third-party under the same or
similar circumstances and the extent of the related person's
interest in the transaction.
Related Person Transactions
SEC
regulations define the related person transactions that require
disclosure to include any transaction, arrangement or relationship
in which the amount involved exceeds the lesser of $120,000 or one
percent of the average of the Company’s total assets at year
end for the last two completed fiscal years in which we were or are
to be a participant and in which a related person had or will have
a direct or indirect material interest. A related person is: (i) an
executive officer, director or director nominee of the Company,
(ii) a beneficial owner of more than 5% of our common stock, (iii)
an immediate family member of an executive officer, director or
director nominee or beneficial owner of more than 5% of our common
stock, or (iv) any entity that is owned or controlled by any of the
foregoing persons or in which any of the foregoing persons has a
substantial ownership interest or control.
For the
period from January 1, 2016 through December 31, 2017 (the
“Reporting Period”), described below are certain
transactions or series of transactions between us and certain
related persons.
On
January 28, 2016, we issued convertible promissory notes to Sanjiv
Gambhir (the “Gambhir Note”), Michael Harsh (the
“Harsh Note”) and Alexander Tokman (the “Tokman
Note”), each a member of our board of directors. The Gambhir
Note and the Tokman Note are each in the principal sum of $20,000
and the Harsh Note is in the principal sum of $10,000. None of the
notes accrue interest and all three are payable upon the earlier of
(1) completion by the Company of an equity financing of $4.0
million or more and (2) the one-year anniversary of the issuance
date. All outstanding amounts due under the Harsh Note, Tokman Note
and Gambhir Note were paid in full on May 15, 2017.
56
From
April 2016 through March 2017, we issued convertible promissory
notes to the following related persons: (i) Francois Michelon, our
Chief Executive Officer, in the principal sum of $35,000, (ii)
Michael Thornton, our Chief Technology Officer, in the principal
sum of $52,000, (iii) Anthony DiGiandomenico, a director of the
Company, in the principal sum of $25,000, (iv) a trust beneficially
owned by Robert C. Clifford, a beneficial owner of more than 5% of
our common stock at the time of the transaction, in the principal
sum of $19,474, (v) a trust beneficially owned by Daniel Landry, a
beneficial owner of more than 5% of our common stock at the time of
the transaction, in the principal sum of $25,000, (vi) Benjamin L.
Padnos, a beneficial owner of more than 5% of our common stock at
the time of the transaction, in the principal sums of $35,000,
$54,500 and $100,000, (vii) Cynthia Padnos, an immediate family
member of a beneficial owner of more than 5% of our common stock at
the time of the transaction, in the principal sum of $12,096,
(viii) Daniel Padnos, an immediate family member of a beneficial
owner of more than 5% of our common stock at the time of the
transaction, in the principal sums of $7,258 and
$25,000, (ix) Jeffrey S. Padnos and Margaret M. Padnos
(including trusts which they beneficially own), joint beneficial
owners of more than 5% of our common stock at the time of the
transaction, in the principal sums of $25,000 and $96,811, (x)
Jonathan Padnos, an immediate family member of a beneficial owner
of more than 5% of our common stock at the time of the transaction,
in the principal sums of $17,258 and $25,000, (xi) Sivan Padnos
Caspi, an immediate family member of a beneficial owner of more
than 5% of our common stock at the time of the transaction, in the
principal sum of $7,258, (xii) Michael Thornton, our Chief
Technology Officer, in the principal sum of $20,000, and (xiii)
Conal Thornton, the father of Michael Thornton, our Chief
Technology Officer, in the principal sum of $20,000. Each such note
accrued interest at the rate of 8% per annum and was secured by all
assets of the Company. Upon the election of noteholders holding a
majority of the outstanding principal amount of the convertible
promissory notes, all outstanding convertible promissory notes were
convertible into shares of the Company's common stock, in each case
at a conversion price of $1.40 per share. Pursuant to such terms,
the noteholders elected to convert all of the outstanding principal
and accrued interest on the convertible promissory notes into an
aggregate of 1,232,859 shares of common stock of the Company on May
12, 2017, immediately prior to the completion of our initial public
offering.
Director Independence
We have
listed our common stock and warrants on the Nasdaq Capital Market,
therefore, our determination of the independence of directors is
made using the definition of “independent” contained in
the listing standards of the Nasdaq Stock Market. On the basis of
information solicited from each director, our board of directors
has determined that each of Anthony DiGiandomenico, Dr. Sanjiv Sam
Gambhir, Michael Harsh and Alexander Tokman is independent within
the meaning of such rules.
RBSM
LLP (“RBSM”) audited our financial statements for the
year ended December 31, 2017. The following table sets forth the
aggregate fees billed or expected to be billed by RBSM for audit
and non-audit services in 2017 and 2016, including
“out-of-pocket” expenses incurred in rendering these
services. The nature of the services provided for each category is
described following the table.
|
Fees
|
2017
|
2016
|
|
Audit Fees
(1)
|
$
118,500
|
$
50,000
|
|
Audit Related
Fees
|
-
|
-
|
|
Tax
Fees
|
5,000
|
-
|
|
Total
|
$
123,500
|
$
50,000
|
__________
(1)
Audit fees include
fees for professional services rendered for the audit of our annual
statements, quarterly reviews, consents and assistance with and
review of documents filed with the SEC.
Pre-Approval Policies and Procedures
The
Audit Committee of our board of directors has adopted a policy that
requires that all services to be provided by the Company’s
independent public accounting firm, including audit services and
permitted non-audit services, to be pre-approved by the Audit
Committee. All audit and permitted non-audit services provided by
RBSM during 2017 were pre-approved by the Audit
Committee.
57
(a) List of
documents filed as part of this report:
1.
Financial
Statements (see “Financial Statements and Supplementary
Data” at Item 8 and incorporated herein by
reference)
2.
Financial Statement
Schedules (Schedules to the Financial Statements have been omitted
because the information required to be set forth therein is not
applicable or is shown in the accompanying Financial Statements or
notes thereto)
3.
Exhibits
The
following is a list of exhibits filed as part of this Annual
Report:
|
|
|
Incorporated by Reference
|
|||
|
Exhibit Number
|
Exhibit Description
|
Filed Herewith
|
Form
|
Exhibit
|
Filing Date
|
|
|
8-K
|
3.2
|
05/12/17
|
||
|
|
S-1
|
3.4
|
11/21/16
|
||
|
|
S-1
|
4.1
|
11/21/16
|
||
|
|
S-1
|
4.2
|
11/21/16
|
||
|
|
S-1
|
4.3
|
11/21/16
|
||
|
|
S-1
|
4.8
|
11/21/16
|
||
|
|
S-1
|
10.4
|
12/06/16
|
||
|
|
S-1
|
10.5
|
12/06/16
|
||
|
|
S-1
|
10.6
|
12/06/16
|
||
|
|
S-1
|
10.7
|
01/20/17
|
||
58
|
|
S-1
|
10.8
|
11/21/16
|
||
|
|
8-K
|
10.1
|
05/12/17
|
||
|
|
8-K
|
10.2
|
05/12/17
|
||
|
|
8-K
|
10.3
|
05/12/17
|
||
|
|
S-1
|
10.17
|
11/21/16
|
||
|
|
S-1
|
10.21
|
05/03/17
|
||
|
|
8-K
|
10.1
|
01/30/18
|
||
|
|
S-1
|
10.18
|
11/21/16
|
||
|
|
S-1
|
10.19
|
11/21/16
|
||
|
|
S-1
|
10.20
|
11/21/16
|
||
|
X
|
|
|
|
||
|
X
|
|
|
|
||
|
X
|
|
|
|
||
|
X
|
|
|
|
||
|
X
|
|
|
|
||
|
X
|
|
|
|
||
|
X
|
|
|
|
||
|
X
|
|
|
|
||
|
101.INS
|
XBRL
Instance Document
|
X
|
|
|
|
|
101.SCH
|
XBRL
Taxonomy Schema
|
X
|
|
|
|
|
101.CAL
|
XBRL
Taxonomy Extension Calculation Linkbase
|
X
|
|
|
|
|
101.DEF
|
XBRL
Taxonomy Extension Definition Linkbase
|
X
|
|
|
|
|
101.LAB
|
XBRL
Taxonomy Extension Label Linkbase
|
X
|
|
|
|
|
101.PRE
|
XBRL
Taxonomy Extension Presentation Linkbase
|
X
|
|
|
|
*
Indicates management compensatory plan, contract or
arrangement.
None.
59
SIGNATURES
Pursuant
to the requirements of Section 13 or 15(d) of the Securities
Exchange Act of 1934, the registrant has duly caused this report to
be signed on its behalf by the undersigned, thereunto duly
authorized.
|
|
ENDRA Life Sciences
Inc.
|
|
|
|
|
|
|
|
|
Dated: March 20,
2018
|
By:
|
/s/
Francois
Michelon
|
|
|
|
|
Francois
Michelon
|
|
|
|
|
Chief
Executive Officer and Director
(Principal
Executive Officer)
|
|
P
OWER OF
ATTORNEY AND SIGNATURES
We, the
undersigned officers and directors of ENDRA Life Sciences Inc.,
hereby severally constitute and appoint Francois Michelon our true
and lawful attorney, with full power to him to sign for us and in
our names in the capacities indicated below, any amendments to this
Annual Report on Form 10-K, and generally to do all things in
our names and on our behalf in such capacities to enable ENDRA Life
Sciences Inc. to comply with the provisions of the Securities
Exchange Act of 1934, as amended, and all the requirements of the
Securities Exchange Commission.
Pursuant
to the requirements of the Securities Exchange Act of 1934, this
report has been signed below by the following persons on behalf of
the registrant and in the capacities and on the dates
indicated.
|
Signatures
|
|
Title
|
|
Date
|
|
|
|
|
|
|
|
/s/ Francois Michelon
|
|
Chief Executive Officer and Director (Principal Executive
Officer)
|
|
March
20
, 2018
|
|
Francois Michelon
|
|
|
|
|
|
|
|
|
|
|
|
/s/ David R. Wells
|
|
Chief Financial Officer (Principal Financial and Accounting
Officer)
|
|
March
20
, 2018
|
|
David R. Wells
|
|
|
|
|
|
|
|
|
|
|
|
/s/ Anthony DiGiandomenico
|
|
Director
|
|
March
20
, 2018
|
|
Anthony DiGiandomenico
|
|
|
|
|
|
|
|
|
|
|
|
/s/ Sanjiv Gambhir, M.D., Ph.D.
|
|
Director
|
|
March
20
, 2018
|
|
Sanjiv Gambhir, M.D., Ph.D.
|
|
|
|
|
|
|
|
|
|
|
|
/s/ Michael Harsh
|
|
Director
|
|
March
20
, 2018
|
|
Michael Harsh
|
|
|
|
|
|
|
|
|
|
|
|
/s/ Alexander Tokman
|
|
Director
|
|
March
20
, 2018
|
|
Alexander Tokman
|
|
|
|
|
|
|
|
|
|
|
60
TABLE OF CONTENTS
Part IItem 1. BusinessItem 1A. Risk FactorsItem 1B. Unresolved Staff CommentsItem 2. PropertiesItem 3. Legal ProceedingsItem 4. Mine Safety DisclosuresPart IIItem 5. Market For Registrant S Common Equity, Related Stockholder Matters and Issuer Purchases Of Equity SecuritiesItem 6. Selected Financial DataItem 7. Management S Discussion and Analysis Of Financial Condition and Results Of OperationsItem 7A. Quantitative and Qualitative Disclosures About Market RiskItem 8. Financial Statements and Supplementary DataNote 1 Nature Of The BusinessNote 2 Summary Of Significant Accounting PoliciesNote 3 InventoryNote 4 Fixed AssetsNote 5 Current LiabilitiesNote 6 Capital StockNote 7 Stock Options and WarrantsNote 8 Income TaxesNote 9 Commitments & ContingenciesNote 10 Subsequent EventsItem 9. Changes in and Disagreements with Accountants on Accounting and Financial DisclosureItem 9A. Controls and ProceduresItem 9B. Other InformationPart IIIItem 10. Directors, Executive Officers and Corporate GovernanceItem 11. Executive CompensationItem 12. Security Ownership Of Certain Beneficial Owners and Management and Related Stockholders MattersItem 13. Certain Relationships and Related Transactions, and Director IndependenceItem 14. Principal Accountant Fees and ServicesPart IVItem 15. Exhibits, Financial Statements and SchedulesItem 16. Form 10-k Summary